Attached files
| file | filename |
|---|---|
| EX-32.1 - EX-32.1 - BLACKLINE, INC. | bl-ex321_354.htm |
| EX-31.2 - EX-31.2 - BLACKLINE, INC. | bl-ex312_355.htm |
| EX-31.1 - EX-31.1 - BLACKLINE, INC. | bl-ex311_357.htm |
| EX-23 - EX-23 - BLACKLINE, INC. | bl-ex23_356.htm |
UNITED STATES
SECURITIES AND EXCHANGE COMMISSION
Washington, D.C. 20549
FORM 10-K
(Mark One)
|
☒ |
ANNUAL REPORT PURSUANT TO SECTION 13 OR 15(d) OF THE SECURITIES EXCHANGE ACT OF 1934 |
For the fiscal year ended December 31, 2016
OR
|
☐ |
TRANSITION REPORT PURSUANT TO SECTION 13 OR 15(d) OF THE SECURITIES EXCHANGE ACT OF 1934 |
For the transition period from to
Commission file number: 001-37924
BlackLine, Inc.
(Exact name of registrant as specified in its charter)
|
Delaware |
|
46-3354276 |
|
(State or other jurisdiction of incorporation or organization) |
|
(I.R.S. Employer Identification Number) |
21300 Victory Boulevard, 12th Floor
Woodland Hills, CA 91367
(Address of principal executive offices, including zip code)
(818) 223-9008
(Registrant’s telephone number, including area code)
Securities registered pursuant to Section 12(b) of the Act:
|
Title of each class |
|
Name of each exchange on which registered |
|
Common Stock, par value $0.01 per share |
|
The NASDAQ Stock Market LLC |
|
|
|
|
|
|
|
(NASDAQ Global Select Market) |
Securities registered pursuant to Section 12(g) of the Act:
None
Indicate by check mark if the registrant is a well-known seasoned issuer, as defined in Rule 405 of the Securities Act. Yes ☐ No ☒
Indicate by check mark if the registrant is not required to file reports pursuant to Section 13 or Section 15(d) of the Securities Exchange Act of 1934 (the “Exchange Act”). Yes ☐ No ☒
Indicate by check mark whether the registrant: (1) has filed all reports required to be filed by Section 13 or 15(d) of the Exchange Act during the preceding 12 months (or for such shorter period that the registrant was required to file such reports), and (2) has been subject to such filing requirements for the past 90 days. Yes ☒ No ☐
Indicate by check mark whether the registrant has submitted electronically and posted on its corporate Web site, if any, every Interactive Data File required to be submitted and posted pursuant to Rule 405 of Regulation S-T (§232.405 of this chapter) during the preceding 12 months (or for such shorter period that the registrant was required to submit and post such files). Yes ☒ No ☐
Indicate by a check mark if disclosure of delinquent filers pursuant to Item 405 of Regulation S-K (§229.405 of this chapter) is not contained herein, and will not be contained, to the best of registrant’s knowledge, in definitive proxy or information statements incorporated by reference in Part III of this Form 10-K or any amendment to this Form 10-K. ☒
Indicate by check mark whether the registrant is a large accelerated filer, an accelerated filer, a non-accelerated filer, or a smaller reporting company. See the definitions of “large accelerated filer,” “accelerated filer” and “smaller reporting company” in Rule 12b-2 of the Exchange Act. (Check one):
|
Large accelerated filer |
☐ |
Accelerated filer |
☐ |
|
Non-accelerated filer |
☒(Do not check if a smaller reporting company) |
Smaller reporting company |
☐ |
Indicate by check mark whether the registrant is a shell company (as defined in Rule 12b-2 of the Exchange Act). Yes ☐ No ☒
The aggregate market value of the registrant’s common stock held by non-affiliates of the registrant, based on the closing price of a share of the registrant’s common stock on October 28, 2016 as reported by the NASDAQ Global Select Market on such date was approximately $261.3 million. The registrant has elected to use October 28, 2016, which was the initial trading date of the registrant’s common stock on the NASDAQ Global Select Market because on June 30, 2016 (the last business day of the registrant’s most recently completed second fiscal quarter), the registrant was a privately-held company. Shares of the registrant’s common stock held by each executive officer, director and holder of 5% or more of the outstanding common stock have been excluded in that such persons may be deemed to be affiliates. This calculation does not reflect a determination that certain persons are affiliates of the registrant for any other purpose.
As of March 3, 2017, 51,283,364 shares of the registrant’s common stock, $0.01 par value, were outstanding.
DOCUMENTS INCORPORATED BY REFERENCE
Portions of the information called for by Part III of this Annual Report on Form 10-K where indicated are hereby incorporated by reference from the Definitive Proxy Statement for the registrant’s Annual Meeting of Stockholders to be held in 2017, which will be filed with the Securities and Exchange Commission not later than 120 days after the end of the registrant’s fiscal year ended December 31, 2016.
2016 ANNUAL REPORT ON FORM 10-K
TABLE OF CONTENTS
|
|
Page No. |
|
|
PART I |
||
|
Item 1. |
3 |
|
|
Item 1A. |
16 |
|
|
Item 1B. |
40 |
|
|
Item 2. |
40 |
|
|
Item 3. |
40 |
|
|
Item 4. |
40 |
|
|
PART II |
||
|
Item 5. |
41 |
|
|
Item 6. |
43 |
|
|
Item 7. |
Management’s Discussion and Analysis of Financial Condition and Results of Operations |
46 |
|
Item 7A. |
65 |
|
|
Item 8. |
66 |
|
|
Item 9. |
Changes in and Disagreements with Accountants on Accounting and Financial Disclosure |
97 |
|
Item 9A. |
97 |
|
|
Item 9B. |
98 |
|
|
PART III |
||
|
Item 10. |
98 |
|
|
Item 11. |
98 |
|
|
Item 12. |
Security Ownership of Certain Beneficial Owners and Management and Related Stockholder Matters |
98 |
|
Item 13. |
Certain Relationships and Related Transactions, and Director Independence |
98 |
|
Item 14. |
99 |
|
|
PART IV |
||
|
Item 15. |
100 |
|
|
Item 16. |
100 |
|
|
|
101 |
|
2
SPECIAL NOTE REGARDING FORWARD-LOOKING STATEMENTS
This Annual Report on Form 10-K contains forward-looking statements within the meaning of Section 27A of the Securities Act of 1933, as amended, and Section 21E of the Securities Exchange Act of 1934, as amended, which statements involve substantial risks and uncertainties. In some cases, you can identify forward-looking statements by terminology such as “may,” “will,” “should,” “could,” “expect,” “plan,” anticipate,” “believe,” “estimate,” “predict,” “intend,” “potential,” “would,” “continue,” “ongoing” or the negative of these terms or other comparable terminology. All statements other than statements of historical fact are statements that could be deemed forward-looking statements, including, but not limited to, statements regarding future financial and operational performance; statements concerning growth strategies including extension of distribution channels and strategic relationships, product innovation, international expansion, customer growth and expansion, expectations for hiring new talent and expanding our sales organization; our ability to accurately forecast revenue and appropriately plan expenses and investments; the demand for and benefits from the use of our current and future solutions; market acceptance of our solutions; and changes in the competitive environment in our industry and the markets in which we operate. These statements are based upon our historical performance and our current plans, estimates and expectations and are not a representation that such plans, estimates, or expectations will be achieved. Forward-looking statements are based on information available at the time those statements are made and/or management’s good faith beliefs and assumptions as of that time with respect to future events, and are subject to risks and uncertainties. If any of these risks or uncertainties materialize or if any assumptions prove incorrect, actual performance or results may differ materially from those expressed in or suggested by the forward looking statements. Readers are cautioned that these forward-looking statements are only predictions and are subject to risks, uncertainties, and assumptions that are difficult to predict, including those identified below, under Item 1A. “Risk Factors” and elsewhere herein. Forward-looking statements should not be read as a guarantee of future performance or results, and you should not place undue reliance on such statements. Furthermore, we undertake no obligation to revise or update any forward-looking statements for any reason.
Unless the context otherwise requires, the terms “BlackLine, Inc.,” “the Company,” “we,” “us” and “our” in this Annual Report on Form 10-K refer to the consolidated operations of BlackLine, Inc. and its consolidated subsidiaries as a whole, references to “Silver Lake Sumeru” refers to either or both of Silver Lake Sumeru Fund, L.P. and Silver Lake Technology Investors Sumeru, L.P., and references to “Iconiq” refer to any or all of Iconiq Strategic Partners, L.P., ICONIQ Strategic Partners-B, L.P. and Iconiq Strategic Partners Co-Invest, L.P., BL Series. We refer to Silver Lake Sumeru, Iconiq, Therese Tucker and Mario Spanicciati collectively as our Principal Stockholders.
Overview
We have created a comprehensive cloud-based software platform designed to transform and modernize accounting and finance operations for organizations of all types and sizes. Our secure, scalable platform supports critical accounting processes such as the financial close, account reconciliation, intercompany accounting, and controls assurance. By introducing software to automate these processes and to enable them to function continuously, we empower our customers to improve the integrity of their financial reporting, achieve efficiencies and enhance real-time visibility into their operations.
Critical accounting and finance processes underlie the integrity of an organization’s financial reports. The lack of effective accounting and finance tools can result in inefficient and cumbersome processes and, in some cases, accounting errors, restatements and write-offs, as well as material weaknesses and significant deficiencies. Traditional enterprise resource planning, or ERP, systems do not generally provide effective solutions for processes handled outside of an organization’s general ledger, such as balance sheet account reconciliation, intercompany transaction accounting and the broader financial close process. Many organizations also use multiple ERPs and other financial systems without a platform to efficiently integrate them. As a result, to manage these tasks, organizations rely on spreadsheets and other error-prone and labor-intensive processes that are unsuited for the increasing regulatory complexity and transaction volumes encountered by many modern businesses. We believe that we are creating a new category of powerful cloud-based software that is capable of automating and streamlining accounting and finance operations, in a manner that complements and supports traditional ERP systems. We believe our customers benefit from cost savings through improvements in process management and staff productivity, in addition to managing a faster financial close.
3
Our mission is to transform how accounting and finance departments operate. Our approach modernizes what historically has been done through batch processing and manual controls typically applied only during the month, quarter or year-end financial close, and delivers dynamic workflows embedded within a real-time, highly automated framework, a process we refer to as “continuous accounting.” It also enables up-to-date analytics, provides industry-benchmarked metrics and is designed to help customers run more efficiently while achieving greater accuracy, control and transparency. We believe the need for our software has been driven by growing business and information technology complexities, transaction volumes and expanding regulatory requirements. Our software integrates with, and obtains data from, more than 30 different ERP systems, including NetSuite, Oracle, SAP, and Workday, as well as many other financial systems and applications such as bank accounts, sub-ledgers and in-house databases.
We believe that we have a leading position in the enhanced financial controls and automation market because we were one of the first companies to bring software with this functionality to market and we have a limited number of competitors. The May 2016 Gartner Report, “Magic Quadrant for Financial Corporate Performance Management Solutions,” or the “Gartner Report,” identified us as a Leader in the newly-created Magic Quadrant for Financial Corporate Performance Management Solutions for our completeness of vision and ability to execute. According to a study we commissioned with Frost & Sullivan, in 2015 there were more than 46,000 corporate organizations in North America and more than 165,000 worldwide that are in our addressable market with revenues greater than $50 million. According to Frost & Sullivan, these companies employ over 13 million accounting and finance personnel, with over 5.5 million in North America alone, all of whom could be potential users of our software platform. Based on its assessment of the number of corporate organizations, accounting and finance personnel globally and certain assumptions regarding pricing of our products, Frost & Sullivan estimates that our total addressable market in 2015 was $7.2 billion in North America and $9.4 billion in Europe, Asia Pacific and Latin America, and is expected to grow to a global total addressable market of $19.7 billion by 2018.
We sell our software solutions primarily through our direct sales force, which leverages our relationships with technology vendors, professional services firms and business process outsourcers, to expand our sales process and market reach. Our distribution strategy is based on a “land-and-expand” model and is designed to capitalize on the ease of use and implementation. Our customers include large public and private organizations and small and medium-size businesses across a variety of industries, including healthcare, technology, telecommunications, financial services, consumer retail, and industrial equipment and services. As of December 31, 2016, we had more than 1,700 customers with over 166,000 users in over 130 countries exclusive of the Runbook Acquisition. Additionally, we continue to build strategic relationships with technology vendors, professional services firms, business process outsourcers, and resellers.
We are a holding company and conduct our operations through our wholly-owned subsidiary, BlackLine Systems, Inc. BlackLine Systems, Inc. funded its business with investments from Therese Tucker, our founder and Chief Executive Officer, and cash flows from operations until September 3, 2013, when we acquired BlackLine Systems, Inc. and Silver Lake Sumeru and Iconiq acquired a controlling interest in us, which we refer to as the “2013 Acquisition.” We refer to Silver Lake Sumeru and Iconiq collectively as our “Investors.” The 2013 Acquisition was accounted for as a business combination under accounting principles generally accepted in the United States of America, or GAAP, and resulted in a change in accounting basis as of the date of the 2013 Acquisition.
On August 31, 2016, we acquired Runbook Company B.V., a Netherlands-based provider of licensed financial close automation software and integration for SAP customers, or Runbook, which we refer to as the “Runbook Acquisition.” The primary purpose of the Runbook Acquisition was to enhance our position as a leading provider of software solutions to automate the financial close process for SAP customers and secondarily it supports our European expansion strategy.
We have experienced significant revenue growth and adoption of our platform in recent periods. For the years ended December 31, 2016 and 2015, we had revenues of $123.1 million and $83.6 million, respectively, and we incurred net losses of $39.2 million and $24.7 million, respectively. See “Financial Statements and Supplementary Data” and “Management’s Discussion and Analysis of Financial Condition and Results of Operations” for a discussion of our financial performance.
4
Accounting is a Universal Mission-Critical Function
Organizations need reliable financial information to plan and execute business initiatives, measure operational progress and satisfy regulatory and financial obligations. For each period-end, enterprise accounting functions typically record, process, reconcile, consolidate, and report financial transactions that are consolidated into useable financial information. These activities typically support other core business functions such as payroll, treasury, procure-to-pay, and order-to-cash processes. Traditionally, many accounting processes, such as balance sheet account reconciliation, intercompany transaction accounting and the broader financial close calendar, are managed and tracked with spreadsheets that are manually reconciled on a periodic basis, and which are often labor-intensive, inefficient and error-prone. The risks of employing traditional methods include lapses in regulatory compliance, damage to brand and public image, and negative impacts on financial health and transparency.
Modern Business is Increasingly Complex
Organizations of all sizes are operating in an increasingly global, complex and fast-moving business environment that presents significant challenges to the performance of the accounting and finance functions. Accountants must process and verify transactions that occur both within and across international borders, involve multiple currencies and require compliance with varying legal, regulatory and tax frameworks. This transactional complexity is exacerbated by other factors typical of global business, such as distance, language barriers and differing time zones. In addition, modern enterprises generate massive amounts of transaction data. It is common for organizations to have thousands of different accounts—potentially comprising billions of records—and to use numerous different financial and operational systems to store that data. Furthermore, companies employ increasingly sophisticated corporate structures that often require accountants to reconcile accounts across various business units and geographies. We believe that the complexity of modern corporate structures and transactions, combined with mounting transaction volumes and a fragmented information technology landscape, creates a significant need for increased automation, efficiency and visibility in accounting and finance.
The Risk of Regulatory Non-Compliance is Significant
Public accounting follows a variety of rules and standards for the processing, recognition and reporting of transactions. These standards, such as generally accepted accounting principles, or GAAP, and International Financial Reporting Standards, or IFRS, are highly specific, apply differently across industries and geographies and, in some cases, provide conflicting guidance. More specific frameworks such as the Sarbanes-Oxley Act of 2002 govern internal controls, disclosure management and audit conduct. Some highly-regulated industries, including financial services, gaming and insurance, have additional specific regulatory requirements. In addition, accounting standards periodically change, such as the revenue recognition accounting standard issued by the Financial Accounting Standards Board, or the FASB in 2014, which must be adopted by public companies by next year and will require an overhaul of many public accounting systems and practices. The resulting tangle of stringent, changing and sometimes conflicting regulations typically requires that organizations maintain more than one set of records, invest heavily in implementing and monitoring internal controls, and undergo expensive and time-consuming audits.
Incorrect financial information can have severe repercussions. A single restatement can cost millions of dollars in forensic accounting and audit fees, lead to significant remediation expenses, generate investor lawsuits, and seriously damage an enterprise’s reputation. A material weakness can also trigger noncompliance with debt covenants and damage an organization’s credit-worthiness. The Securities and Exchange Commission, or SEC, has also proposed new rules that will require companies to “claw back” incentive-based executive compensation as a result of an accounting restatement. According to the Center for Audit Quality, from 2003 to 2012, 10,479 accounting restatements were reported by SEC reporting companies, including 4,246 restatements requiring reissuance of the affected financial statements, and there was a demonstrated negative near-term effect on the public market price of securities of many companies making such restatements.
5
Companies Lack Real-Time, Actionable Data from Their Accounting Departments
As complexity, transaction volume and regulatory scrutiny increase, management teams often find themselves without clear and immediate insight into their accounting and finance processes and results. In most cases, the accounting department’s work is done within desktop applications or with the use of spreadsheets, leaving management with an incomplete view of their progress in closing, consolidating and reporting each period. By the time data is manually compiled, it is often days or weeks out-of-date, limiting the ability to effectively track and analyze fluctuations and trends, detailed metrics on individual and team performance, and transaction risk profiles in a timely manner.
Such lack of visibility limits the ability of accounting managers to influence ongoing accounting operations. Instead, they are often relegated to conducting quality control measures after a process is completed. Important decisions may be made by less experienced employees and costly errors, such as unreconciled balances or unapproved fund transfers, may go undetected. In addition, the discipline of accounting frequently lacks established metrics by which to gauge performance.
Accounting Professionals Face Compressed Deadlines and a Heightened Expectation of Accuracy
Many organizations, and public companies in particular, have adopted a practice of reporting financial information by a fixed date following their quarter close. Given limited resources, an accelerated timetable can put immense pressure on a company’s accounting function. Accounting professionals are expected not only to address business and regulatory challenges but also to achieve completeness and accuracy of operating results to ensure financial integrity. Given these challenges and deadlines, accountants are often forced to leave certain accounts and transactions unreconciled, which can dramatically increase risk and create situations of concern for controllers, chief financial officers and audit committee members.
Traditional Accounting Processes and Tools are Inefficient
The processes and software solutions traditionally employed by accountants, such as general ledgers and ERP systems, do not provide effective solutions for critical, non-general ledger accounting and finance processes such as balance sheet account reconciliation, intercompany transaction accounting and the overall management of the entire financial close process. Most core accounting and finance systems are designed as batch transaction repositories without the ability to consume and process continuous streams of data. In addition, most organizations use multiple ERPs and many other financial systems across their IT environments. Traditionally available accounting tools are inflexible, expensive to configure and maintain, and do not scale easily. As a result, we are addressing a clear need for new scalable accounting and finance tools that can consume data from a variety of sources, process it quickly with embedded business logic, provide a collaborative workspace for accountants, and then store information within a data warehouse or ERP system. Furthermore, accounting processes themselves have not evolved over time and instead remain focused on producing financial information only after period-end, ignoring the growing demand for a more streamlined, continuous approach to accounting.
The BlackLine Solution
We provide a powerful cloud-based software platform designed to automate and streamline accounting and finance operations. The key elements of our solutions include:
Comprehensive Platform
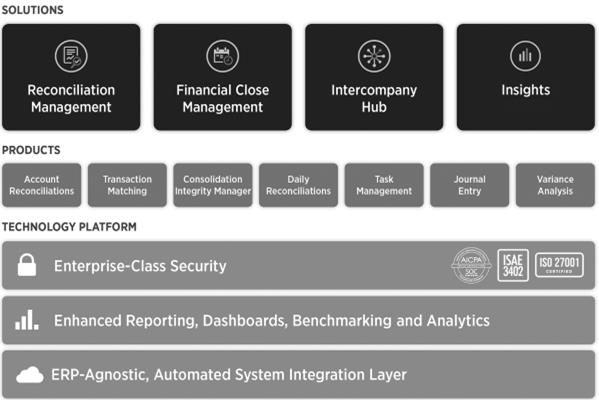
We offer an integrated suite of applications that delivers a broad range of capabilities that would otherwise require the purchase and use of multiple products to support critical accounting processes such as the financial close, account reconciliations, intercompany accounting, and controls assurance. Our platform consists of seven core cloud-based products, including Account Reconciliation, Task Management, Transaction Matching, Journal Entry, Variance Analysis, Consolidation Integrity Manager, and Daily Reconciliation. Customers typically purchase these products in packages that we refer to as solutions, but they have the option to purchase these products individually. Current solutions include our Reconciliation Management and Financial Close Management, Intercompany Hub, and Insights. The technology underpinning our platform includes a comprehensive base of accounting-specific business logic and rules engines, which enable our customers to implement continuous accounting.
6
Our platform provides simple, secure and automated tools and integrations to transfer data to and from a range of enterprise-wide processes and systems, including ERPs, financial systems and in-house databases, and other custom applications and data. Our platform integrates with over 30 ERP systems, including NetSuite, Oracle, SAP, and Workday. In addition, for companies with multiple systems and complex needs, we can connect with any number of general ledger systems simultaneously, resolving many of the issues associated with consolidating data across systems.
Independence
Our platform is not dependent on any single operating system and works with most major ERP systems our customers may use. Our cross-system functionality allows us to reach a broader group of customers. We are also able to focus on and innovate for the needs of the customers irrespective of updates or changes in their existing systems. We believe this independence provides us with a competitive advantage in the industry over traditional methods.
Ease of Use
Our platform is designed by accountants, for accountants, to be intuitive and easy to use. We strive to enable any user to rapidly implement our platform to manage their accounting and finance activities, from the simplest to the most sophisticated tasks. Our user-friendly interface provides clear visualization of accounting and finance data, enables user collaboration and streamlines business processes.
Innovation
Our ability to develop innovative products has been a key driver of our success and organic growth. Through a history and culture of thought leadership, we have created a new category of powerful software that automates and streamlines antiquated, manual accounting processes to better meet our clients’ diverse and rapidly changing needs, and we continue to focus on providing advanced solutions to time and labor intensive accounting practices. Examples of recent innovations include the launches of our Intercompany Hub solution, which is designed to manage all intercompany transactions through one centralized, cloud-based system, and the launch of our Insights solution, which provides real-time performance measures and a benchmarking dashboard.
Security
The robust security features embedded in our platform are designed to meet or exceed both industry standards and the stringent security requirements of our customers. We engage independent security auditors to assess the effectiveness of our comprehensive information security program consisting of risk-driven policies and procedures.
Key Benefits
Our platform is designed to provide the following benefits to our customers:
Flexibility and scalability
Our unified cloud platform is designed for modern business environments and has broad applicability across large and small organizations in almost any industry. The platform supports complex corporate structures, provides integration across all core financial systems, manages multiple currencies and languages, and scales to support high transaction volumes.
Embedded controls and workflow
Our platform was designed for the complex global regulatory environment. Our platform embeds key controls within standardized, repeatable and well-documented workflows, which are designed to result in substantially reduced risk of non-compliance or negative audit findings, greater tolerance for regulatory complexity and increased confidence in financial reports.
7
We provide users with real-time visibility into the status, progress and quality of their accounting processes. With configurable dashboards, user-defined reporting and the ability to drill down to individual reconciliations, journals and tasks, users can track open items, identify bottlenecks within a process or intervene to prevent mistakes.
Automation and efficiency
Our platform can ingest data from a variety of sources, including ERP systems and other data repositories, and apply powerful, rules-driven automation to reconciliations, journals and transactions. This streamlines accounting processes, minimizes manual data entry and improves individual productivity to help ensure that accounting processes are completed on time. As a result, this automation allows users to focus on value-added activities instead of process management.
Continuous processing
Our platform helps organizations embed quality control, compliance and financial integrity into their day-to-day processes rather than rely on the traditional process of validating financial information at the end of each period. Activities such as account reconciliation and variance analysis can be performed in real-time, thus reducing the risk of errors and creating a more agile accounting environment.
Our Growth Strategy
We intend to continue investing in a number of growth initiatives to provide our customers with advanced solutions and to address and expand our market opportunity. Our principal growth strategies include the following:
Continue to Innovate and Expand Our Platform
Our ability to develop new, market-leading applications and functionalities is integral to our success. We intend to continue extending the functionality and range of our applications to bring new and improved solutions to accounting and finance. Examples of recent innovations include the launch of our Intercompany Hub solution, which is designed to manage all intercompany transactions through one centralized, cloud-based system and the launch of our Insights solution, which provides real-time performance measures and a benchmarking dashboard.
Enhance Our Leadership Position in the Enterprise Market and Mid-Market Customer Base
We believe we have a leading position in the enhanced financial controls and automation market with both enterprise market and mid-market customers, and we were recognized as a Leader by the Gartner Report in the newly-created Magic Quadrant for Financial Corporate Performance Management Solutions for our completeness of vision and ability to execute. We had more than 1,700 customers across a variety of industries and geographies as of December 31, 2016 exclusive of the Runbook Acquisition. Our customers include some of the largest multi-national enterprises, as well as leading medium and small businesses around the world. We intend to leverage our brand, history of innovation and customer focus to maintain and grow our leadership position with enterprise market customers. We believe that mid-market businesses are particularly underserved and that our platform can help these businesses modernize their accounting and finance processes efficiently and effectively. We have made recent investments to grow our mid-market sales team and plan to continue leveraging our network of resellers to grow our mid-market business globally.
Increase Customer Spend through Expanded Usage and Adoption of Additional Products
We believe there is a significant opportunity to increase sales of our products within our existing customer base. We pursue a land-and-expand sales model to increase the use of our platform by selling additional solutions and features and increasing the number of users within our customers’ organizations. Our pricing model is designed to allow us to capture additional revenue as our customers’ usage of our platform grows, providing us with an opportunity to increase the lifetime value of our customer relationships.
8
Expand Our International Operations and Customer Footprint
We believe that we have a significant opportunity to expand the use of our cloud-based products outside the United States. We derived approximately 16% and 14% of our revenues from sales outside the United States in the years ended December 31, 2016 and 2015, respectively, and we believe there are substantial opportunities to increase sales to customers outside of the U.S. In August 2016, we acquired Runbook primarily to enhance our position as a leading provider of software solutions to automate the financial close process for SAP customers and secondarily it supports our European expansion strategy. We currently have users in over 130 countries, and our platform supports applicable international accounting standards, as well as 16 languages and all currencies specified by the International Organization for Standardization, or ISO currencies. We have an established presence in Australia, Canada, England, France, Germany, Netherlands, and Singapore, and we intend to invest in further expanding our footprint in these and other regions.
Extend Our Customer Relationships and Distribution Channels
We have established strong relationships with key industry participants to supplement marketing and delivery of our applications. These relationships include agreements with technology vendors such as SAP and NetSuite, professional services firms such as Deloitte and KPMG, and business process outsourcers, or BPOs, such as Cognizant, Genpact and IBM.
These relationships enable us to effectively market our solutions by offering a complementary suite of services to our customers. In particular, we offer our customers an integrated SAP-endorsed business solution through our relationship with SAP. We intend to continue to strengthen and expand our existing relationships, seek new relationships and further expand our distribution channels to help us expand into new markets and increase our presence in existing markets.
Customers
Our customers include multinational corporations, large domestic enterprises and mid-market companies across a broad array of industries. These businesses include publicly-listed entities and privately-owned enterprises, as well as non-profit entities. As of December 31, 2016, we had over 166,000 individual users in over 130 countries across more than 1,700 customers exclusive of the Runbook Acquisition. We define a customer as an entity with an active subscription agreement as of the measurement date. In situations where an organization has multiple subsidiaries or divisions, each entity that is invoiced as a separate entity is treated as a separate customer. However, where an existing customer requests its invoice be divided for the sole purpose of restructuring its internal billing arrangement without any incremental increase in revenue, such customer continues to be treated as a single customer. For the years ended December 31, 2016, 2015 and 2014, sales to enterprise customers represented 85%, 86% and 90% of our revenues, respectively, while sales to mid-market customers represented 15%, 14% and 10% of our revenues, respectively.
Our customers operate in complex, diverse and often global information technology ecosystems with numerous general ledgers, sub-ledgers, treasury systems, and ERP systems from different vendors, including NetSuite, Oracle, SAP, and Workday. Our platform is designed for and used by employees across the organization, including end users such as internal accounting employees, controllers and chief accounting officers, as well as chief financial officers and other senior executives and external auditors.
We believe our customers benefit from improvements in process management and staff productivity, in addition to a faster financial close. Cost savings are achieved from the reconciliations of accounts, across approval and review roles, in process administration, and in audit, storage and paper expenses.
9
The following is a sample of our current customers across some of the industries we serve. The customers below vary in size of their respective business and the amount of revenue we derive from them.
|
Consumer/Retail |
|
Healthcare |
|
Financial Services |
|
|
|
|
|
|
|
Costco Wholesale Corporation Kraft Heinz Foods Company Mondelez The Coca-Cola Company Under Armour |
|
Alliance Healthcare Services American Dental Partners, Inc. Brooks Rehabilitation DaVita HealthCare Partners Inc. Shire Pharmaceuticals Zeltiq Aesthetic |
|
CSAA Insurance Exchange Russell Investment Group RSA Insurance Group plc SunTrust Bank Xoom Corporation |
|
|
|
|
||
|
Technology |
|
Industrial/Energy |
|
Services |
|
|
|
|
|
|
|
Adaptive Insights Autodesk GoDaddy.com Rackspace Zendesk, Inc. |
|
British Gas Trading Limited Greif Inc. Hubbell Incorporated Kimberly-Clark Global Sales, LLC
|
|
Brink’s Company Kempinski Hotels Orange Lake Resorts SiriusXM Radio Inc. |
Products and Services
Our platform consists of seven core cloud-based products, including Transaction Matching, Account Reconciliations, Consolidation Integrity Manager, Journal Entry, Variance Analysis, Task Management, and Daily Reconciliations. Customers typically purchase these in packages that we refer to as solutions, but they have the option to purchase these products individually. Current solutions include our Reconciliation Management, Financial Close Management, Intercompany Hub, and Insights.
10
The process of verifying and validating transactions, balances and consolidated financial results is referred to as account reconciliation. Our Reconciliation Management solution provides a framework for the reconciliation process, allowing users to build integrity checks and automation into the entire end-to-end work flow. The solution includes:
|
|
• |
Account Reconciliations provides a centralized workspace from which users can collaborate to complete account reconciliations. Features include standardized templates, workflows for review and approval, linkage to policies and procedures, and integrated storage of supporting documentation. The product automates otherwise manual activities in the reconciliation process, significantly reducing time and effort and increasing productivity. It also enhances internal controls by facilitating the appropriate segregation of duties, simplifying reconciliation audits and adding transparency and visibility to the reconciliation process. |
|
|
• |
Transaction Matching analyzes and reconciles high volumes of individual transactions from different sources of data based upon user-configured logic. Our rules engine automatically identifies exceptions, errors, missing data, and variances within massive data sets. The matching engine processes millions of records per minute, can be used with any type of data and allows customers to reconcile transactions in real-time. |
|
|
• |
Consolidation Integrity Manager manages the automated system-to-system tie-out process that occurs during the consolidation phase of the financial close. Companies with multiple ERPs utilize a consolidation system to produce their consolidated financial results. Because these systems contain and produce information that changes continually and requires constant adjustments, a final tie-out that is typically handled manually in a spreadsheet is necessary prior to publishing results. This product automates the tie-out process, aggregating balances from dozens or hundreds of different systems and allowing users to identify exceptions and create adjustments quickly. |
|
|
• |
Daily Reconciliations narrows the scope of a reconciliation to a single day’s transactions or balance detail. Users can then perform their analysis in minutes per day, rather than attempting to review an entire month’s worth of activity in a limited time during the period-end close. Some industries, such as banking, require that organizations track the creation and certification of daily reconciliations. Daily reconciliations are a prime example of continuous accounting in action. |
Financial Close Management
The collection of processes by which organizations reconcile, consolidate and report on their financial information at the end of each period is referred to as the financial close. Our Financial Close Management solution allows customers to manage the key steps within the close, applying automation where possible, and ensure that tasks are properly completed and reviewed. This solution includes the components of the Reconciliation Management solution, as well as the following products:
|
|
• |
Task Management enables users to create and manage processes and task lists. The product provides automatic and recurring task scheduling, includes configurable workflow and provides a management console for accounting and finance projects. Though most commonly used with the financial close, users can create task lists and projects for hundreds of different use cases ranging from external audits to environmental impact surveys. |
|
|
• |
Journal Entry allows users to manually or automatically generate, review and post manual journal entries. Journals can be automatically allocated across multiple business units and calculated based on complex, client-defined logic. More importantly, the addition of validation and approval checkpoints helps ensure the integrity of information passed to other financial applications. Customers can use the Journal Entry product to pass information to hundreds of different ERPs and subsystems in a configurable, easily consumable format. |
|
|
• |
Variance Analysis provides “always-on” monitoring and automatically identifies anomalous fluctuations in balance sheet and income statement account balances. Once an account in flux is identified, users are automatically alerted so they can research and determine the source of the fluctuation. |
11
Intercompany transactions occur when entities within a corporate parent organization transact with each other. These transactions are some of the most complex and frequent sources of uncertainty for the accounting function. Our Intercompany Hub solution, which was made generally available in November 2015, manages the entire intercompany transaction lifecycle within our platform and we believe it is the only widely available end-to-end intercompany solution. This solution includes the following features:
|
|
• |
Intercompany Workflow replaces informal, ad-hoc intercompany requests and approvals with a simple, structured workflow approval process. The application stores permissions by entity and transaction type, ensuring that both the initiator and the approver of the intercompany transaction are authorized to conduct business. |
|
|
• |
Intercompany Processing records an organization’s intercompany transactions once they reach an appropriate completion level and posts them to the appropriate systems from a single source. The product automatically incorporates local taxes, exchange rates, invoicing requirements, and customer-specific transfer pricing so that the resulting journal entries will net, which reduces the possibility of intercompany differences and eliminates the need to perform a manual reconciliation. |
|
|
• |
Netting and Settlement automatically generate a real-time, aggregated settlement matrix, which shows the balance of transactions across an entire organization. Users can filter the information by transaction type, currency or business relationship, easing the process of netting transactions and helping them make informed, strategic decisions. |
Insights
Our platform provides us with detailed information about the accounting and finance function for most of our cloud-based customers. Insights, which was made generally available in November 2015, aggregates and analyzes that information and can help clients assess productivity, risk and timeliness. We also provide a series of key performance indicators and allow clients to compare metrics across their own operating entities, set goals and gauge their performance over time. Insights provides benchmarking, scores for a variety of industries, company sizes, and geographies. These benchmarks are drawn from actual client usage of the application, rather than survey data, which provides valuable context for users.
Services
Customer service is essential to our success. We offer the following services for our customers:
|
|
• |
Implementation. With a focus on configuration over customization, our implementation approach favors rapid and efficient deployments led by accounting experts, rather than technical resources. A typical project will focus on mapping our application to a customer’s current or ideal process, coaching them on best practices, and helping organizations become self-sufficient, instead of dependent on additional professional services. For clients that elect to work with a business process outsourcer or other company for implementation services, our implementation team provides ongoing support in order to ensure that the implementation or finance transformation projects are completed successfully. We generally provide this service for a fixed fee. |
|
|
• |
Support. We provide live customer support 24/7/365 from our offices in Los Angeles, Sydney and London. All customers have access to support resources by phone, email or through our portal, free of charge. |
|
|
• |
Customer Success. Our customer success managers, many of whom are former users, provide customers with best practices and help create a roadmap for expanded usage of our platform. We believe that this service, which is made available to all customers, is central to our retention and upsell efforts. |
|
|
• |
Training. We offer a variety of live and web-based training options, but most customers elect to consume their training through our e-learning environment, BlackLine U. Courses cover platform functionality, as well as the underlying concepts that make reconciliation, the financial close and other accounting and finance activities necessary. |
12
We sell our solutions through our direct sales force. Our enterprise field sales team focuses on selling our solutions to large, global enterprises with annual revenues above $500 million. Our mid-market sales team focuses on selling our solutions to mid-market businesses with annual revenues between $50 million and $500 million. We also have an account management team dedicated to our existing customer base that generates sales by focusing on contract renewals, expanding the current number of users within an organization and up-selling additional products.
Our direct sales force leverages our relationships with technology vendors such as SAP and NetSuite, professional services firms such as Deloitte and KPMG and business process outsourcers such as Cognizant, Genpact and IBM, to influence and drive customer growth. In particular, we offer our customers an integrated SAP-endorsed business solution in connection with our relationship with SAP. We also utilize a reseller channel that includes software vendors throughout the world and offer training in our solutions so that our reach is further extended.
Our marketing efforts are focused on creating sales leads, establishing and extending our brand proposition, generating product awareness, and cultivating our community of users. We generate sales leads primarily through word-of-mouth, search engine marketing, outbound lead generation, and our network of business process outsourcers, business services organizations and resellers. We leverage online and offline marketing channels on a global basis and organize customer roundtables and user conferences and release white papers, case studies, blogs, and digital programs and seminars. We have further extended our brand awareness through sponsorships with leading industry organizations such as the American Institute of Certified Public Accountants, or AICPA, the Institute of Management Accountants, or IMA, the Financial Executives International, or FEI, the Institute of Chartered Accountants in England and Wales, or ICAEW, and the Association of Chartered Certified Accountants, or ACCA.
Technology, Operations and Development
Technology
Our platform has been designed to deliver a consistent, scalable, high-performing, and secure experience for our customers. Our platform is enabled by rules engines, flexible templates, role-based workflows, and accounting-specific business logic. We deliver our hosted solution on a single code base and via a multi-tenant architecture with unique database instances for each customer. All SaaS customers run the current version of our platform and access it through a web browser. We utilize industry-leading hardware and software components to deliver on the following objectives:
|
|
• |
Scalability and Performance. Our platform supports a high, sustained level of client activity and a large, globally distributed client base while remaining high-performing and reliable. Our infrastructure incorporates load balancing technology and can scale quickly to absorb spikes in usage. We also monitor application performance and intervene, as necessary, to prevent degradation. Finally, our platform incorporates technologies to manage volume within the solutions. These include a near real-time data warehouse, a high-volume transaction processing engine and a custom-built user interface. |
|
|
• |
Reliability. During 2016, we had no unscheduled downtime and 99.92% total availability, including scheduled maintenance. Client data is mirrored between primary and alternate data centers, providing effective redundancy and disaster recovery. |
|
|
• |
Flexibility. Our application architecture is modular, which allows us to quickly release new products or expand existing feature-sets by combining and configuring existing components. Our development has always been both rapid and responsive, which allows us to support a wide array of clients and bring new products to market while maintaining a consistent user interface and single, cohesive code base. |
Security
Due to the sensitive nature of the data we store for our clients, we place a heavy emphasis on security. Our infrastructure and software products are designed to meet and exceed rigorous security standards and to assure customers that we are taking appropriate measure to protect their data.
We maintain a comprehensive information security management system that extends companywide and integrates into our core technology and business processes. This system includes deployment of a variety of detective, preventive and deterrent controls that include technical and administrative safeguards. The controls are regularly tested, both internally and by third-party audits and penetration tests. We are certified for compliance with the ISO 27001 framework,
13
and we regularly undergo SSAE16, ISAE 3402 and SOC audits. We believe that we are in compliance with regulatory requirements and that we employ security best practices. A dedicated team of security professionals orchestrate our information security program. Our information security controls and practices include strong encryption for data at rest and in transit and extensive monitoring with comprehensive security incident detection and response process.
Operations
We host our platform and solutions for our customers in data centers located in North America (Culpeper, Virginia and Las Vegas, Nevada) and Europe (Amsterdam, Netherlands and London, United Kingdom). We contract with Verizon (Virginia and Netherlands), SuperNap (Nevada) and VMware (UK) for use of these data center facilities. These facilities provide extensive physical security, including manned security 365 days a year, 24 hours a day, seven days a week, with video surveillance, redundant power and environmental controls, and technical controls, including biometric access. Network equipment, servers and applications are managed by our employees, and we staff a network operations center, or NOC, to monitor performance 365 days a year, 24 hours a day. We regularly conduct risk and security assessments of these facilities and review their SSAE16, SOC and/or ISO 27001 attestations and certifications to ensure that our datacenter providers have adequate controls to maintain availability and security of our services.
Development
Our research and development organization focuses on developing new software solutions and enhancing existing products, conducting software and quality assurance testing and improving our core technology. Our research and development organization is located primarily in our Los Angeles, California headquarters, where we are committed to recruiting, hiring and retaining top technical talent. We invest substantial resources in research and development to drive core technology innovation and to bring new products to market.
Our research and development expenses were $21.1 million, $18.2 million and $9.7 million for the years ended December 31, 2016, 2015 and 2014, respectively. Our research and development expenses as a percentage of revenue were 17.2%, 21.8% and 18.8% for the years ended December 31, 2016, 2015 and 2014, respectively.
Competition
The market for accounting and financial software and services is competitive, rapidly evolving and requires deep understanding of the industry standards, accounting rules and global financial regulations.
We compete with vendors of financial automation software such as Trintech, and we also compete with components of Oracle’s Hyperion software.
We believe the principal competitive factors in our market include the following:
|
|
• |
level of customer satisfaction; |
|
|
• |
ease of deployment and use of applications; |
|
|
• |
ability to integrate with multiple legacy enterprise infrastructures and third-party applications; |
|
|
• |
domain expertise on accounting best practices; |
|
|
• |
ability to innovate and respond to customer needs rapidly; |
|
|
• |
capability for configurability, integration and scalability of applications; |
|
|
• |
cloud-based delivery model; |
|
|
• |
advanced security and reliability features; |
|
|
• |
brand recognition and historical operating performance; and |
|
|
• |
price and total cost of ownership. |
We believe we are positioned favorably against our competitors based on these factors. However, certain of our competitors may have greater name recognition, longer operating histories, more established customer and marketing relationships, larger marketing budgets, and significantly greater resources.
14
Intellectual Property and Proprietary Rights
Our intellectual property and proprietary rights are important to our business. We currently have one pending patent application. We primarily rely on copyright, trade secret and trademark laws, trade secret protection, and confidentiality or license agreements with our employees, customers, partners, and others to protect our intellectual property rights. Though we rely in part upon these legal and contractual protections, we believe that factors such as the skills and ingenuity of our employees and the functionality and frequent enhancements to our solutions are larger contributors to our success in the marketplace.
Despite our efforts to preserve and protect our intellectual property and proprietary rights, unauthorized third parties may attempt to copy, reverse engineer or otherwise obtain portions of our software. Competitors may attempt to develop similar products that could compete in the same market as our products. Unauthorized disclosure of our confidential information by our employees or third parties could occur. Laws of other jurisdictions may not protect our intellectual property and proprietary rights from unauthorized use or disclosure in the same manner as the United States. The risk of unauthorized use of our proprietary and intellectual property rights may increase as our company continues to expand outside of the United States.
Third-party infringement claims are also possible in our industry, especially as software functionality and features expand, evolve and overlap with other industry segments.
Information about Segment and Geographic Revenue
Information about segment and geographic revenue is set forth in Notes 2 and 15 of the “Financial Statements and Supplementary Data—Notes to Consolidated Financial Statements” under Part II, Item 8 of this Annual Report on Form 10-K.
Employees and Culture
We believe our employees and culture are fundamental to our success. Therese Tucker, our founder and Chief Executive Officer, has led our company since its inception in 2001 and has built and maintained a culture committed to empowering our employees and communities around us. Our motto “Think. Create. Serve.” expresses our core values as a company dedicated to innovation and creativity, collaboration and action and service to each other and our customers.
We seek to hire talented employees and are focused on their long-term development and training. We work to foster a collaborative, performance-driven working environment where integrity, open and honest communication and accountability are embraced and cultivated. By mixing these important features with an element of fun, we seek to maintain a satisfying workplace for our employees. We are proud of our recognition as a best place to work in the Los Angeles area in 2013, 2014, 2015, and 2016.
Many of our employees have previously worked for our customers. We believe this uniquely positions us to build compelling and effective products while also enhancing the user experience for our customers. Our desire to build a platform that creates value for all stakeholders in the accounting and financial process informs our decisions regarding product design and development.
We also believe in making a positive impact on our communities. Each year during our annual Users Conference, we join with our customers to perform a day of community service — in 2016, through a joint event with LA Mission, our employees, interested clients and partners volunteered their time to distribute food to local needy residents. In 2014 and 2015, through joint events with Windy City Habitat for Humanity and Atlanta-based Habitat for Humanity, we helped to rebuild homes in the cities of Chicago and Atlanta.
As of December 31, 2016, we employed 597 people globally. None of our employees are represented by a labor union or covered by a collective bargaining agreement. We have not experienced any work stoppages, and we consider our relations with our employees to be good.
15
We were incorporated in Delaware in May 2001. Our principal executive offices are located at 21300 Victory Blvd., 12th Floor, Woodland Hills, California 91367, and our telephone number is (818) 223-9008. On September 3, 2013, we acquired BlackLine Systems, Inc., an S-Corporation, and Silver Lake Sumeru and Iconiq acquired a controlling interest in us, which we refer to as the “2013 Acquisition”. We completed our initial public offering in November 2016, and our common stock is listed on the NASDAQ Global Select Market under the symbol “BL.”
The names “BlackLine,” “BlackLine Systems,” “Intercompany Hub,” and our logo are our trademarks. This Annual Report on Form 10-K also contains trademarks and trade names of other businesses that are the property of their respective holders. We have omitted the ® and ™ designations, as applicable, for the trademarks we name in this Annual Report on Form 10-K.
We are an “emerging growth company,” as defined in the Jumpstart Our Business Startups Act of 2012, and, as such, we have elected to comply with certain reduced public company reporting requirements. We will remain an “emerging growth company” until the earliest of (i) the last day of the fiscal year following the fifth anniversary of the completion of our initial public offering, (ii) the last day of the first fiscal year in which our annual gross revenue is $1 billion or more, (iii) the date on which we have, during the previous rolling three-year period, issued more than $1 billion in non-convertible debt securities or (iv) the date on which we are deemed to be a “large accelerated filer” as defined in the Exchange Act. We refer to the Jumpstart Our Business Startups Act of 2012 herein as the “JOBS Act,” and references herein to “emerging growth company” are intended to have the meaning associated with it in the JOBS Act.
Available Information
Our website is located at www.blackline.com, and our investor relations website is located at http://investors.blackline.com/. We have used, and intend to continue to use, our Investor Relations website as a means of disclosing material non-public information and for complying with our disclosure obligations under Regulation FD. Copies of our Annual Reports on Form 10-K, Quarterly Reports on Form 10-Q, Current Reports on Form 8-K, and amendments to these reports filed or furnished pursuant to Section 13(a) or 15(d) of the Securities Exchange Act of 1934, as amended, or the Exchange Act, are available, free of charge, on our investor relations website as soon as reasonably practicable after we file such material electronically with or furnish it to the Securities and Exchange Commission, or the SEC. The SEC also maintains a website that contains our SEC filings. The address of the site is www.sec.gov. Further, a copy of this Annual Report on Form 10-K is located at the SEC’s Public Reference Room at 100 F Street, NE, Washington, D.C. 20549. Information on the operation of the Public Reference Room can be obtained by calling the SEC at 1-800-SEC-0330.
Investing in our common stock involves a high degree of risk. You should carefully consider the risks and uncertainties described below, together with all of the other information in this Annual Report on Form 10-K, including “Management’s Discussion and Analysis of Financial Condition and Results of Operations” and our financial statements and related notes, before making a decision to invest in our common stock. The risks and uncertainties described below are not the only ones we face. Additional risk and uncertainties not presently known to us or that we presently deem less significant may also impair our business operations. If any of the events or circumstances described in the following risk factors actually occurs, our business, operating results, financial condition, cash flows, and prospects could be materially and adversely affected. In that event, the market price of our common stock could decline, and you could lose part or all of your investment.
Risks Related to Our Business and Industry
If we are unable to attract new customers and expand sales to existing customers, our business growth could be slower than we expect and our business may be harmed.
Our future growth depends in part upon increasing our customer base. Our ability to achieve significant growth in revenues in the future will depend, in large part, upon the effectiveness of our sales and marketing efforts, both domestically and internationally. We may have difficulty attracting a potential client that has already invested substantial personnel and financial resources to integrate on-premise software into its business, as such organizations may be reluctant or unwilling to invest in a new product. If we fail to attract new customers or maintain and expand those customer relationships, our revenues will grow more slowly than expected and our business will be harmed.
16
Our future growth also depends upon our ability to add users and sell additional products to our existing customers. It is important for the future growth of our business that our existing customers make additional significant purchases of our products and add additional users to our platform. Our business also depends on retaining existing customers. If we do not retain customers, our customers do not purchase additional products or we do not add additional users to our platform, our revenues may grow more slowly than expected, may not grow at all or may decline. Additionally, increasing incremental sales to our current customer base may require additional sales efforts that are targeted at senior management. There can be no assurance that our efforts would result in increased sales to existing customers or additional revenues.
Our business and growth depend substantially on customers renewing their subscription agreements with us and any decline in our customer renewals could adversely affect our future operating results.
Our initial subscription period for the majority of our customers is one to three years. In order for us to continue to increase our revenue, it is important that our existing customers renew their subscription agreements when the initial contract term expires. Although our agreements typically include automatic renewal language, our customers may cancel their agreements at the expiration of the initial term. In addition, our customers may renew for fewer users, renew for shorter contract lengths or renew for fewer products or solutions. Our customers’ renewal rates may decline or fluctuate as a result of a variety of factors, including their satisfaction or dissatisfaction with our software or professional services, our pricing or pricing structure, the pricing or capabilities of products or services offered by our competitors, the effects of economic conditions, or reductions in our customers’ spending levels. As the markets for our existing solutions mature, or as current and future competitors introduce new products or services that compete with ours, we may experience pricing pressure and be unable to renew our agreements with existing customers or attract new customers at prices that are profitable to us. If this were to occur, it is possible that we would have to change our pricing model, offer price incentives or reduce our prices. If our customers do not renew their agreements with us or renew on terms less favorable to us, our revenues may decline.
We have a history of losses in recent periods and we may not be able to generate sufficient revenue to achieve or sustain profitability.
We have incurred net losses in recent periods, including $39.2 million and $24.7 million for the years ended December 31, 2016 and 2015, respectively. We had an accumulated deficit of $87.3 million at December 31, 2016. We may not be able to generate sufficient revenue to achieve and sustain profitability. We also expect our costs to increase in future periods as we continue to expend substantial resources on:
|
|
• |
development of our cloud-based platform, including investments in research and development, product innovation to expand the features and functionality of our software solutions and improvements to the scalability and security of our platform; |
|
|
• |
sales and marketing, including expansion of our direct sales force and our relationships with technology vendors, professional services firms, business process outsourcers, and resellers; |
|
|
• |
additional international expansion in an effort to increase our customer base and sales; and |
|
|
• |
general administration, including legal, accounting and other expenses related to being a public company. |
These investments may not result in increased revenue or growth of our business. If we fail to continue to grow our revenue, we may not achieve or sustain profitability.
We have experienced rapid growth and organizational change in recent periods and if we fail to manage our growth effectively, we may be unable to execute our business plan.
We increased our number of full-time employees from 183 as of December 31, 2013 to 597 as of December 31, 2016 as we have experienced growth in number of customers and expanded our operations. Our growth has placed, and may continue to place, a significant strain on our managerial, administrative, operational, financial, and other resources. We intend to further expand our headcount and operations both domestically and internationally, with no assurance that our business or revenue will continue to grow. Continuing to create a global organization and managing a geographically dispersed workforce will require substantial management effort, the allocation of valuable management resources and significant additional investment in our infrastructure. We will be required to continually improve our operational, financial and management controls and our reporting procedures, and we may not be able to do so effectively, which could negatively affect our results of operations and overall business. In addition, we may be unable to manage our expenses
17
effectively in the future, which may negatively impact our gross margins or operating expenses in any particular quarter. Moreover, if we fail to manage our anticipated growth and change in a manner that preserves the key aspects of our corporate culture, the quality of our software solutions may suffer, which could negatively affect our brand and reputation and harm our ability to retain and attract customers.
Our quarterly results may fluctuate, and if we fail to meet the expectations of analysts or investors, our stock price and the value of your investment could decline substantially.
Our quarterly financial results may fluctuate as a result of a variety of factors, many of which are outside of our control. If our quarterly financial results fall below the expectations of investors or any securities analysts who may follow our stock, the price of our common stock could decline substantially. Some of the important factors that may cause our revenue, operating results and cash flows to fluctuate from quarter to quarter include:
|
|
• |
our ability to attract new customers and retain and increase sales to existing customers; |
|
|
• |
the number of new employees added; |
|
|
• |
the rate of expansion and productivity of our sales force; |
|
|
• |
changes in our or our competitors’ pricing policies; |
|
|
• |
the amount and timing of operating costs and capital expenditures related to the operations and expansion of our business; |
|
|
• |
new products, features or functionalities introduced by us and our competitors; |
|
|
• |
significant security breaches, technical difficulties or interruptions to our platform; |
|
|
• |
the timing of customer payments and payment defaults by customers; |
|
|
• |
general economic conditions that may adversely affect either our customers’ ability or willingness to purchase additional products or services, delay a prospective customer’s purchasing decision or affect customer retention; |
|
|
• |
changes in foreign currency exchange rates; |
|
|
• |
the impact of new accounting pronouncements; and |
|
|
• |
the timing and the amount of grants or vesting of equity awards to employees. |
Many of these factors are outside of our control, and the occurrence of one or more of them might cause our revenue, operating results and cash flows to vary widely. As such, we believe that quarter-to-quarter comparisons of our revenue, operating results and cash flows may not be meaningful and should not be relied upon as an indication of future performance.
If we are not able to provide successful enhancements, new features or modifications to our software solutions, our business could be adversely affected.
If we are unable to provide enhancements and new features for our existing solutions or new solutions that achieve market acceptance or that keep pace with rapid technological developments, our business could be adversely affected. The success of enhancements, new products and solutions depends on several factors, including timely completion, introduction and market acceptance. We must continue to meet changing expectations and requirements of our customers and, because our platform is designed to operate on a variety of systems, we will need to continuously modify and enhance our solutions to keep pace with changes in internet-related hardware and other software, communication, browser and database technologies. Our platform is also designed to integrate with ERP systems such as NetSuite, Oracle, SAP, and Workday, and will require modifications and enhancements as these systems change over time. Any failure of our solutions to operate effectively with future platforms and technologies could reduce the demand for our solutions or result in customer dissatisfaction. Furthermore, uncertainties about the timing and nature of new solutions or technologies, or modifications to existing solutions or technologies, could increase our research and development expenses. If we are not successful in developing modifications and enhancements to our solutions or if we fail to bring them to market in a timely fashion, our solutions may become less marketable, less competitive or obsolete, our revenue growth may be significantly impaired, and our business could be adversely affected.
18
We derive substantially all of our revenues from a limited number of software solutions, and our future growth is dependent on their success.
We currently derive and expect to continue to derive substantially all of our revenues from our Financial Close Management and Reconciliation Management solutions. As such, the continued growth in market demand for these solutions is critical to our continued success. We have recently introduced two new software solutions, Intercompany Hub and Insights, but cannot be certain that they will generate significant revenues. In addition, those solutions are designed to be used with our Financial Close Management and Reconciliation Management solutions and will not be sold independently. Accordingly, our business and financial results will be substantially dependent on a limited number of solutions.
If our relationships with technology vendors and business process outsourcers are not successful, our business and growth will be harmed.
We depend on, and anticipate that we will continue to depend on, various strategic relationships in order to sustain and grow our business. We have established strong relationships with technology vendors such as SAP and NetSuite to market our solutions to users of their ERP solutions, and professional services firms such as Deloitte and KPMG, and business process outsourcers such as Cognizant, Genpact and IBM to supplement delivery and implementation of our applications. We believe these relationships enable us to effectively market our solutions by offering a complementary suite of services. In particular, we have a strategic relationship with SAP to market our solution to users of SAP’s ERP solutions. Our solution is an SAP-endorsed business solution that integrates with SAP’s ERP solutions. Under our agreement with SAP, which we entered into in 2013, we pay SAP a fee based on a percentage of revenues from our new customers that use an SAP ERP system. We continue to pay SAP a fee for these customers over the term of their subscription agreements. For the year ended December 31, 2016, revenues from our customers that use an SAP ERP solution accounted for $20.7 million, or approximately 17%, of our total revenues. For the year ended December 31, 2015, revenues from our customers under this agreement accounted for $9.4 million, or approximately 11%, of our total revenues. If we are unsuccessful in maintaining our relationship with SAP, or if we are unsuccessful in supporting or expanding our relationships with other companies, our business would be adversely affected.
Identifying, negotiating and documenting relationships with other companies require significant time and resources. Our agreements with technology vendors are typically limited in duration, non-exclusive, cancellable upon notice, and do not prohibit the counterparties from working with our competitors or from offering competing services. For example, our agreement with SAP can be terminated by either party upon six months’ notice, and there is no assurance that our relationship with SAP will continue. If we are no longer an SAP-endorsed business solution, our business could be adversely affected. Our competitors may be effective in providing incentives to third parties to favor their products or services or to prevent or reduce subscriptions to our platform. If we are unsuccessful in establishing or maintaining our relationships, our ability to compete in the marketplace or to grow our revenue could be impaired and our operating results would suffer. Even if we are successful, we cannot assure you that these relationships will result in improved operating results.
If our security controls are breached or unauthorized, or inadvertent access to customer, employee or other confidential data is otherwise obtained, our software solutions may be perceived as insecure, we may lose existing customers or fail to attract new customers, our business may be harmed, and we may incur significant liabilities.
Use of our platform involves the storage, transmission and processing of our customers’ proprietary data, including highly confidential financial information regarding their business and personal or identifying information regarding their customers or employees. Our platform is at risk for breaches as a result of third-party action, employee, vendor or contractor error, malfeasance, or other factors. If any unauthorized or inadvertent access to, or a security breach of, our platform occurs, or is believed to occur, such an event could result in the loss of data, loss of business, severe reputational damage adversely affecting customer or investor confidence, regulatory investigations and orders, litigation, indemnity obligations, damages for contract breach, or penalties for violation of applicable laws or regulations. Security breaches could also result in significant costs for remediation that may include liability for stolen assets or information and repair of system damage that may have been caused, incentives offered to customers or other business partners in an effort to maintain business relationships after a breach, and other liabilities.
19
We incur significant expenses to prevent security breaches, including deploying additional personnel and protection technologies, training employees and engaging third-party experts and contractors. If a high profile security breach occurs with respect to another SaaS provider, our clients and potential clients may lose trust in the security of our platform or in the SaaS business model generally, which could adversely impact our ability to retain existing clients or attract new ones. Even in the absence of any security breach, customer concerns about security, privacy or data protection may deter them from using our platform for activities that involve personal or other sensitive information. Our errors and omissions insurance policies covering certain security and privacy damages and claim expenses may not be sufficient to compensate for all potential liability. Although we maintain cyber liability insurance, we cannot be certain that our coverage will be adequate for liabilities actually incurred or that insurance will continue to be available to us on economically reasonable terms, or at all.
Because the techniques used to obtain unauthorized access or to sabotage systems change frequently and generally are not identified until they are launched against a target, we may be unable to anticipate these techniques or to implement adequate preventative measures. We may also experience security breaches that may remain undetected for an extended period. From time to time, we experience cyber security events, including directed “phishing” attacks against our employees, web attacks and other information technology incidents that are typical for a SaaS company of our size. These threats continue to evolve and are difficult to predict due to advances in computer capabilities, new discoveries in the field of cryptography and new and sophisticated methods used by criminals, including phishing, social engineering or other illicit acts. There can be no assurances that our defensive measures will prevent cyber attacks, and any incidents could damage our brand and reputation and negatively impact our business.
Because data security is a critical competitive factor in our industry, we make numerous statements in our privacy policy and customer agreements, through our certifications to privacy standards and in our marketing materials, providing assurances about the security of our platform including detailed descriptions of security measures we employ. Should any of these statements be untrue or become untrue, even through circumstances beyond our reasonable control, we may face claims of misrepresentation or deceptiveness by the U.S. Federal Trade Commission, state and foreign regulators and private litigants. Our errors and omissions insurance coverage covering security and privacy damages and claim expenses may not be sufficient to compensate for all liabilities.
Interruptions or performance problems associated with our software solutions, platform and technology may adversely affect our business and operating results.
Our continued growth depends in part on the ability of our existing and potential customers to access our platform at any time. Our platform is proprietary, and we rely on the expertise of members of our engineering, operations and software development teams for its continued performance. We have experienced, and may in the future experience, disruptions, outages and other performance problems due to a variety of factors, including infrastructure changes, introductions of new functionality, human or software errors, capacity constraints due to an overwhelming number of users accessing our platform simultaneously, denial of service attacks, or other security related incidents. In some instances, we may not be able to identify the cause or causes of these performance problems within an acceptable period of time. Because of the seasonal nature of financial close activities, increasing complexity of our platform and expanding user population, it may become difficult to accurately predict and timely address performance and capacity needs during peak load times. If our platform is unavailable or if our users are unable to access it within a reasonable amount of time or at all, our business would be harmed. In addition, our infrastructure does not currently include the real-time mirroring of data. Therefore, in the event of any of the factors described above, or other failures of our infrastructure, customer data may be permanently lost. Our customer agreements typically include performance guarantees and service level standards that obligate us to provide credits in the event of a significant disruption in our platform. To the extent that we do not effectively address capacity constraints, upgrade our systems and continually develop our technology and network architecture to accommodate actual and anticipated changes in technology, our business and operating results may be adversely affected.
If our software contains serious errors or defects, we may lose revenue and market acceptance and may incur costs to defend or settle product liability claims.
Complex software such as ours often contains errors or defects, particularly when first introduced or when new versions or enhancements are released. Despite internal and third-party testing and testing by our customers, our current and future software may contain serious defects, which could result in lost revenue or a delay in market acceptance.
20
Since our customers use our platform for critical business functions, such as assisting in the financial close or account reconciliation process, errors, defects or other performance problems could result in damage to our customers. They could seek significant compensation from us for the losses they suffer. Although our customer agreements typically contain provisions designed to limit our exposure to product liability claims, existing or future laws or unfavorable judicial decisions could negate these limitations. Even if not successful, a product liability claim brought against us would likely be time-consuming and costly and could seriously damage our reputation in the marketplace, making it harder for us to sell our products.
We depend on our executive officers and other key employees, and the loss of one or more of these employees or an inability to attract and retain highly-skilled employees could adversely affect our business.
Our success depends largely upon the continued services of our executive officers and other key employees. We rely on our leadership team in the areas of research and development, operations, security, marketing, sales, and general and administrative functions. In particular, our founder and Chief Executive Officer provides our strategic direction and has built and maintained what we believe is an attractive workplace culture. Any failure to preserve our culture could negatively affect our ability to recruit and retain personnel. From time to time, there may be changes in our executive management team resulting from the hiring or departure of executives, which could disrupt our business. Key members of our current management and finance teams have only been working together for a relatively short period of time. If we are not successful in integrating these key employees into our organization, such failure could disrupt our business operations. We do not have employment agreements with our executive officers or other key personnel that require them to continue to work for us for any specified period and, therefore, they could terminate their employment with us at any time. The loss of one or more of our executive officers or key employees, especially our founder and Chief Executive Officer, could have an adverse effect on our business.
In addition, to execute our growth plan, we must attract and retain highly-qualified personnel. Competition for personnel is intense, especially for engineers experienced in designing and developing software applications and experienced sales professionals. We have, from time to time, experienced, and we expect to continue to experience, difficulty in hiring and retaining employees with appropriate qualifications. Many of the companies with which we compete for experienced personnel have greater resources than we have. If we hire employees from competitors or other companies, their former employers may attempt to assert that these employees or we have breached their legal obligations, resulting in a diversion of our time and resources. Likewise, if competitors hire our employees, we may divert time and resources to deterring any breach by our former employees or their new employers of their legal obligations. Given the competitive nature of our industry, we have both received and asserted such claims in the past. In addition, job candidates and existing employees often consider the value of the equity awards they receive in connection with their employment. If the perceived value of our equity awards declines, it may adversely affect our ability to recruit and retain highly-skilled employees. If we fail to attract new personnel or fail to retain and motivate our current personnel, our business and future growth prospects could be adversely affected.
If our industry does not continue to develop as we anticipate or if potential customers do not continue to adopt our platform, our sales would not grow as quickly as expected, or at all, and our business and operating results and financial condition would be adversely affected.
We operate in a rapidly evolving industry focused on modernizing financial and accounting operations. Our solutions are relatively new and have been developed to respond to an increasingly global and complex business environment with more rigorous regulatory standards. If organizations do not increasingly allocate their budgets to financial automation software as we expect or if we do not succeed in convincing potential customers that our platform should be an integral part of their overall approach to their accounting processes, our sales may not grow as quickly as anticipated, or at all. Our business is substantially dependent on enterprises recognizing that accounting errors and inefficiencies are pervasive and are not effectively addressed by legacy solutions. Future deterioration in general economic conditions may also cause our customers to cut their overall information technology spending, and such cuts may disproportionately affect software solutions like ours to the extent customers view our solutions as discretionary. If our revenue does not increase for any of these reasons, or any other reason, our business, financial condition and operating results may be materially adversely affected.
21
The market in which we participate is intensely competitive, and if we do not compete effectively, our operating results could be harmed.
The market for accounting and financial software and services is highly competitive and rapidly evolving. Our competitors vary in size and in the breadth and scope of the products and services they offer. We often compete with other vendors of financial automation software such as Trintech. We also compete with large, well-established, enterprise application software vendors, such as Oracle, whose Hyperion software contains components that compete with our platform. In the future, a competitor offering ERP software could include a free service similar to ours as part of its standard offerings or may offer a free standalone version of a service similar to ours. Further, other established software vendors not currently focused on accounting and finance software and services may expand their services to compete with us.
Our competitors may have greater name recognition, longer operating histories, more established customer and marketing relationships, larger marketing budgets and significantly greater resources than we do. They may be able to respond more quickly and effectively than we can to new or changing opportunities, technologies, standards, or customer requirements. In addition, some of our competitors have partnered with, or have acquired, and may in the future partner with or acquire, other competitors to offer services, leveraging their collective competitive positions, which makes, or would make, it more difficult to compete with them.
With the introduction of new technologies, the evolution of our platform and new market entrants, we expect competition to intensify in the future. Increased competition generally could result in reduced sales, reduced margins, losses, or the failure of our platform to achieve or maintain more widespread market acceptance, any of which could harm our business.
Our financial results may fluctuate due to our long and variable sales cycle.
Our sales cycle generally varies in duration between four to nine months and, in some cases, even longer depending on the size of the potential customer. The sales cycle for our global enterprise customers is generally longer than that of our mid-market customers. Factors that may influence the length and variability of our sales cycle include:
|
|
• |
the need to educate potential customers about the uses and benefits of our software solutions; |
|
|
• |
the need to educate potential customers on the differences between traditional, on-premise software and SaaS solutions; |
|
|
• |
the relatively long duration of the commitment customers make in their agreements with us; |
|
|
• |
the discretionary nature and timing of potential customers’ purchasing and budget cycles and decisions; |
|
|
• |
the competitive nature of potential customers’ evaluation and purchasing processes; |
|
|
• |
announcements or planned introductions of new products by us or our competitors; and |
|
|
• |
lengthy purchasing approval processes of potential customers. |
We may incur higher costs and longer sales cycles as a result of large enterprises representing an increased portion of our revenue. In this market, the decision to subscribe to our solutions may require the approval of more technical and information security personnel and management levels within a potential customer’s organization, and if so, these types of sales require us to invest more time educating these potential customers. In addition, larger organizations may demand more features and integration services and have increased purchasing power and leverage in negotiating contractual arrangements with us, which may contain restrictive terms favorable to the larger organization. As a result of these factors, these sales opportunities may require us to devote greater research and development, sales, product support, and professional services resources to individual customers, resulting in increased costs and reduced profitability, and would likely lengthen our typical sales cycle, which could strain our resources.
In addition, more sales are closed in the last month of a quarter than other times. If we are unable to close sufficient transactions in a particular period, or if a significant amount of transactions are delayed until a subsequent period, our operating results for that period, and for any future periods in which revenue from such transaction would otherwise have been recognized, may be adversely affected.
22
We recognize subscription revenue over the term of our customer contracts and, consequently, downturns or upturns in new sales may not be immediately reflected in our operating results and may be difficult to discern.
We recognize subscription revenue from our platform ratably over the terms of our customers’ agreements, most of which have one-year terms but an increasing number of which have up to three-year terms. As a result, most of the revenue we report in each quarter is derived from the recognition of deferred revenue relating to subscriptions entered into during previous quarters. Consequently, a decline in new or renewed subscriptions in any single quarter may have a small impact on our revenue results for that quarter. However, such a decline will negatively affect our revenue in future quarters. Accordingly, the effect of significant downturns in sales and market acceptance of our platform, and potential changes in our pricing policies or rate of expansion or retention, may not be fully reflected in our results of operations until future periods. We may also be unable to reduce our cost structure in line with a significant deterioration in sales. In addition, a significant majority of our costs are expensed as incurred, while revenue is recognized over the life of the agreement with our customer. As a result, increased growth in the number of our customers could continue to result in our recognition of more costs than revenue in the earlier periods of the terms of our agreements. Our subscription model also makes it difficult for us to rapidly increase our revenue through additional sales in any period, as revenue from new customers must be recognized over the applicable subscription term.
We previously identified material weaknesses in our internal control over financial reporting. Although we believe these material weaknesses have since been remediated, we may identify additional material weaknesses in the future or otherwise fail to maintain an effective system of internal control over financial reporting in the future and may not be able to accurately or timely report our financial condition or results of operations, which may adversely affect investor confidence in us and the price of our common stock.
As a public company, we are required to maintain internal control over financial reporting and to report any material weaknesses in such internal controls. Section 404 of the Sarbanes-Oxley Act of 2002, or the Sarbanes-Oxley Act, requires that we evaluate and determine the effectiveness of our internal control over financial reporting and, beginning with our Annual Report on Form 10-K for the year ending December 31, 2017, provide a management report on internal control over financial reporting. A material weakness is a deficiency or combination of deficiencies, in internal control over financial reporting such that there is a reasonable possibility that a material misstatement of our financial statements will not be prevented or detected on a timely basis.
During 2015, we identified material weaknesses in our internal control over financial reporting. We identified a material weakness related to an insufficient complement of resources with an appropriate level of accounting knowledge, experience and training commensurate with our corporate structure and financial reporting requirements. This lack of an effective control environment contributed to material weaknesses from the lack of controls over the selection of certain accounting policies and procedures and segregation of duties. Specifically, we did not have policies and controls designed to address the accounting for unusual or complex transactions, or the initial selection of, and the ongoing monitoring of changes in, accounting policies. Further, we did not maintain sufficiently designed segregation of duties including controls over journal entries such that there was a reasonable possibility that a material misstatement would not be prevented or detected on a timely basis.
These material weaknesses contributed to the restatement and revision of the previously-issued 2013 financial statements and audit adjustments in the 2014 financial statements principally related to, but not limited to, the following areas: capitalization of internal use software costs, accounting for and valuation of warrants issued with our debt facility, cut-off of transactions at the 2013 Acquisition date, accounting for the new basis of accounting arising from the 2013 Acquisition, including the valuation of the fair value deferred revenue assumed at the 2013 Acquisition date, forecasting of contingent consideration and the determination of the useful lives of intangible assets.
In response to the identified material weaknesses, we took a number of actions to improve our internal control over financial reporting during the year ended December 31, 2016:
|
|
• |
We hired additional personnel in our accounting and finance department with extensive knowledge in accounting and financial reporting; |
|
|
• |
We developed and implemented a financial reporting risk assessment and formalization of accounting policies and procedures; |
|
|
• |
We created additional internal reporting procedures, including those designed to enhance our review processes; |
|
|
• |
We increased segregation of duties, including controls over journal entries; |
23
|
|
• |
We prepared memoranda addressing accounting considerations of significant new transactions, which was reviewed by the principal accounting officer. |
Our management believes that these and other actions taken during the year ended December 31, 2016 have been fully implemented and are operating effectively. As a result, we have concluded that our remediation efforts have been successful, and that the previously-identified material weaknesses in our internal controls have been remediated. However, we cannot assure you that the measures we have taken to date, and are continuing to implement, or any measures we may take in the future, will be sufficient to identify or prevent future material weaknesses. If other material weaknesses or other deficiencies occur, our ability to accurately and timely report our financial position could be impaired, which could possibly result in a material misstatement of our financial statements that would not be prevented or detected on a timely basis.
The process of designing and implementing internal control over financial reporting required to comply with Section 404 of the Sarbanes-Oxley Act will be time consuming, costly and complicated. If, during the evaluation and testing process, we identify one or more other material weaknesses in our internal control over financial reporting, our management will be unable to assert that our internal control over financial reporting is effective. Even if our management concludes that our internal control over financial reporting is effective, our independent registered public accounting firm may conclude that there are material weaknesses with respect to our internal controls or the level at which our internal controls are documented, designed, implemented, or reviewed. If we are unable to assert that our internal control over financial reporting is effective, or when required in the future, if our independent registered public accounting firm is unable to express an opinion as to the effectiveness of our internal control over financial reporting, investors may lose confidence in the accuracy and completeness of our financial reports, the market price of our common stock could be adversely affected, and we could become subject to litigation or investigations by the stock exchange on which our securities are listed, the SEC, or other regulatory authorities, which could require additional financial and management resources.
We rely on a limited number of data centers to deliver our cloud-based software solutions and any disruption of service at these centers could harm our business.
We manage our software solutions and serve most of our customers using a cloud-based infrastructure that is operated by a limited number of third-party data center facilities in North America and Europe. We do not control the operation of these facilities. Any changes in third-party service levels at our data centers or any disruptions or delays from errors, defects, hacking incidents, security breaches, computer viruses or other intentional bad acts or performance problems could harm our reputation, damage our customers’ businesses and adversely affect our business and operating results. Our data centers are also vulnerable to damage or interruption from earthquakes, hurricanes, floods, fires, war, terrorist attacks, power losses, hardware failures, systems failures, telecommunications failures, and similar events. If our data centers were compromised or unavailable or our users were unable to access our solutions for any reason, our business and operations would be materially and adversely affected.
Our customers have experienced minor disruptions and outages in accessing our solutions in the past, and may in the future experience, disruptions, outages and other performance problems. Although we expend considerable effort to ensure that our platform performance is capable of handling existing and increased traffic levels, the ability of our cloud-based solutions to effectively manage any increased capacity requirements depends on our third-party providers. Our third-party data center providers may not be able to meet such performance requirements, especially to cover peak levels or spikes in traffic and, as a result, our customers may experience delays in accessing our solutions or encounter slower performance in our solutions, which could significantly harm the operations of these facilities. Interruptions in our services might reduce our revenue, cause us to issue credits to customers, subject us to potential liability, and cause customers to terminate their subscriptions or harm our renewal rates.
If we do not accurately predict our infrastructure capacity requirements, our customers could experience service shortfalls. The provisioning of additional cloud hosting capacity and data center infrastructure requires lead time. As we continue to add data centers, restructure our data management plans and increase capacity in existing and future data centers, we may move or transfer our data and our customers’ data. For example, in early 2016, we began hosting customers at a data facility located in Las Vegas, Nevada. Despite precautions taken during such processes and procedures, any unsuccessful data transfers may impair the delivery of our service, and we may experience costs or
24
downtime in connection with the transfer of data to other facilities which may lead to, among other things, customer dissatisfaction and non-renewals. The owners of our data center facilities have no obligation to renew their agreements with us on commercially reasonable terms, or at all. If we are unable to renew these agreements on commercially reasonable terms, we may be required to transfer to new data center facilities, and we may incur significant costs and possible service interruption in connection with doing so.
Failure to effectively expand our sales capabilities could harm our ability to increase our customer base.
Increasing our customer base and sales will depend, to a significant extent, on our ability to effectively expand our sales and marketing operations and activities. We are substantially dependent on our direct sales force to obtain new customers. From January 1, 2014 to December 31, 2016, our sales and marketing teams increased from 68 to 281 employees. We plan to continue to expand our direct sales force both domestically and internationally. We believe that there is significant competition for experienced sales professionals with the sales skills and technical knowledge that we require. Our ability to achieve significant revenue growth in the future will depend, in part, on our success in recruiting, training and retaining a sufficient number of experienced sales professionals. New hires require significant training and time before they achieve full productivity, particularly in new sales segments and territories. Our recent hires and planned hires may not become as productive as quickly as we expect, and we may be unable to hire or retain sufficient numbers of qualified individuals in the future in the markets where we do business. Our business will be harmed if our sales expansion efforts do not generate a significant increase in revenue.
If we are unable to develop and maintain successful relationships with resellers, our business, operating results and financial condition could be adversely affected.
We believe that continued growth in our business is dependent upon identifying, developing and maintaining strategic relationships with companies that resell our solutions. We plan to expand our small but growing network of resellers and to add new resellers, in particular to help grow our mid-market business globally. Our agreements with our existing resellers are non-exclusive, meaning resellers may offer customers the products of several different companies, including products that compete with ours. They may also cease marketing our solutions with limited or no notice and with little or no penalty. We expect that any additional resellers we identify and develop will be similarly non-exclusive and not bound by any requirement to continue to market our solutions. If we fail to identify additional resellers, in a timely and cost-effective manner, or at all, or are unable to assist our current and future resellers in independently selling our solutions, our business, results of operations and financial condition could be adversely affected. If resellers do not effectively market and sell our solutions, or fail to meet the needs of our customers, our reputation and ability to grow our business may also be adversely affected.
If we are not able to maintain and enhance our brand, our business, operating results and financial condition may be adversely affected.
We believe that maintaining and enhancing our reputation for accounting and finance software is critical to our relationships with our existing customers and to our ability to attract new customers. The successful promotion of our brand attributes will depend on a number of factors, including our marketing efforts, our ability to continue to develop high-quality software and our ability to successfully differentiate our platform from competitive products and services. Our brand promotion activities may not ultimately be successful or yield increased revenue. In addition, independent industry analysts provide reviews of our platform, as well as products and services offered by our competitors, and perception of our platform in the marketplace may be significantly influenced by these reviews. If these reviews are negative, or less positive as compared to those of our competitors’ products and services, our brand may be adversely affected.
The promotion of our brand requires us to make substantial expenditures, and we anticipate that the expenditures will increase as our market becomes more competitive, as we expand into new markets and as more sales are generated. To the extent that these activities yield increased revenue, this revenue may not offset the increased expenses we incur. If we do not successfully maintain and enhance our brand, our business may not grow, we may have reduced pricing power relative to competitors, and we could lose customers or fail to attract potential customers, all of which would adversely affect our business, results of operations and financial condition.
25
Our long-term success depends, in part, on our ability to expand the sales of our solutions to customers located outside of the United States, and thus our business is susceptible to risks associated with international sales and operations.
We currently maintain offices and/or have sales personnel in Australia, Canada, France, Germany, Malaysia, Netherlands, Singapore, South Africa, and the United Kingdom, and we intend to build out our international operations. As part of our ongoing international expansion strategy, in August 2016, we acquired Runbook, a Netherlands-based provider of financial close automation software solutions to SAP customers. We derived approximately 16% and 14% of our revenues from sales outside the United States in the years ended December 31, 2016 and 2015, respectively. Any international expansion efforts that we may undertake, including the Runbook Acquisition, may not be successful. In addition, conducting international operations in new markets subjects us to new risks that we have not generally faced in the United States. These risks include:
|
|
• |
localization of our solutions, including translation into foreign languages and adaptation for local practices and regulatory requirements; |
|
|
• |
lack of familiarity and burdens of complying with foreign laws, legal standards, regulatory requirements, tariffs, and other barriers; |
|
|
• |
unexpected changes in regulatory requirements, taxes, trade laws, tariffs, export quotas, custom duties, or other trade restrictions; |
|
|
• |
differing technology standards; |
|
|
• |
longer accounts receivable payment cycles and difficulties in collecting accounts receivable; |
|
|
• |
difficulties in managing and staffing international operations and differing employer/employee relationships; |
|
|
• |
potentially adverse tax consequences, including the complexities of foreign value-added tax (or other tax) systems and restrictions on the repatriation of earnings; |
|
|
• |
uncertain political and economic climates, including the significant volatility in the global financial markets; and |
|
|
• |
reduced or varied protection for intellectual property rights in some countries. |
These factors may cause our international costs of doing business to exceed our comparable domestic costs. Operating in international markets also requires significant management attention and financial resources. Any negative impact from our international business efforts could negatively impact our business, results of operations and financial condition as a whole.
In addition, the President of the United States and Congress have proposed, formally or informally, various changes, including regulatory and tax reform that would have uncertain and potentially adverse effects on our business.
We use third-party contractors outside of the United States to supplement our research and development capabilities, which may expose us to risks, including risks inherent in foreign operations.
We use third-party contractors outside of the United States to supplement our research and development capabilities. We currently use third-party contractors located in Romania and China. Managing operations that are remote from our U.S. headquarters is difficult and we may not be able to manage these third-party contractors successfully. If we fail to maintain productive relationships with these contractors generally, we may be required to develop our solutions in a less efficient and cost-effective manner and our product release schedules may be delayed while we hire software developers or find alternative contract development resources. Additionally, while we take precautions to ensure that software components developed by our third-party contractors are reviewed and that our source code is protected, misconduct by our third-party contractors could result in infringement or misappropriation of our intellectual property. Furthermore, any acts of espionage, malware attacks, theft of confidential information, or other malicious cyber incidents attributed to our third-party contractors may compromise our system infrastructure, expose us to litigation and lead to reputational harm that could result in a material adverse effect on our financial condition and operating results.
26
Any failure to protect our intellectual property rights could impair our ability to protect our proprietary technology and our brand.
Our success and ability to compete depend, in part, upon our intellectual property. We currently have one patent application, which may not result in an issued patent. We primarily rely on copyright, trade secret and trademark laws, trade secret protection, and confidentiality or license agreements with our employees, customers, partners, and others to protect our intellectual property rights. However, the steps we take to protect our intellectual property rights may be inadequate.
In order to protect our intellectual property rights, we may be required to spend significant resources to monitor and protect these rights. In the past, we have utilized demand letters as a means to assert and resolve claims regarding potential misuse of our proprietary or trade secret information. Litigation brought to protect and enforce our intellectual property rights could be costly, time-consuming and distracting to management, and could result in the impairment or loss of portions of our intellectual property. Furthermore, our efforts to enforce our intellectual property rights may be met with defenses, counterclaims and countersuits attacking the validity and enforceability of our intellectual property rights. Our failure to secure, protect and enforce our intellectual property rights could adversely affect our brand and adversely impact our business.
Suits by third parties for alleged infringement of their proprietary rights could cause us to incur significant expenses or liabilities.
There is considerable patent and other intellectual property development activity in our industry. Our future success depends, in part, on not infringing upon the intellectual property rights of others. From time to time, our competitors or other third parties may claim that our solutions and underlying technology infringe or violate their intellectual property rights, and we may be found to be infringing upon such rights. We may be unaware of the intellectual property rights of others that may cover some or all of our technology. Any claims or litigation could cause us to incur significant expenses and, if successfully asserted against us, could require that we pay substantial damages or ongoing royalty payments, prevent us from offering our solutions or require that we comply with other unfavorable terms. We may also be obligated to indemnify our customers or other companies in connection with any such litigation and to obtain licenses, modify our solutions or refund subscription fees, which could further exhaust our resources. In addition, we may incur substantial costs to resolve claims or litigation, whether or not successfully asserted against us, which could include payment of significant settlement, royalty or license fees, modification of our solutions, or refunds to customers of subscription fees. Even if we were to prevail in the event of claims or litigation against us, any claim or litigation regarding our intellectual property could be costly and time-consuming and divert the attention of our management and other employees from our business operations. Such disputes could also disrupt our solutions, adversely impacting our customer satisfaction and ability to attract customers.
We use open source software in our products, which could subject us to litigation or other actions.
We use open source software in our products and may use more open source software in the future. From time to time, there have been claims challenging the use of open source software against companies that incorporate open source software into their products. As a result, we could be subject to suits by parties claiming misuse of, or a right to compensation for, what we believe to be open source software. Litigation could be costly for us to defend, have a negative effect on our operating results and financial condition or require us to devote additional research and development resources to change our products. In addition, if we were to combine our proprietary software products with open source software in a certain manner, we could, under certain of the open source licenses, be required to release the source code of our proprietary software products. If we inappropriately use open source software, we may be required to re-engineer our products, discontinue the sale of our products or take other remedial actions.
Privacy and data security concerns, and data collection and transfer restrictions and related domestic or foreign regulations, may limit the use and adoption of our solutions and adversely affect our business.
Personal privacy, information security, and data protection are significant issues in the United States, Europe and many other jurisdictions where we offer our platform. The regulatory framework governing the collection, processing, storage, and use of business information, particularly information that affects financial statements and personal data, is rapidly evolving and any failure or perceived failure to comply with applicable privacy, security or data protection laws or regulations may adversely affect our business.
27
The U.S. federal and various state and foreign governments have adopted or proposed requirements regarding the collection, distribution, use, security, and storage of personally identifiable information and other data relating to individuals, and federal and state consumer protection laws are being applied to enforce regulations related to the online collection, use and dissemination of data. Some of these requirements include obligations on companies to notify individuals of security breaches involving particular personal information, which could result from breaches experienced by us or by organizations with which we have formed strategic relationships. Even though we may have contractual protections with such organizations, notifications related to a security breach could impact our reputation, harm customer confidence, hurt our expansion into new markets, or cause us to lose existing customers.
Further, many foreign countries and governmental bodies, including the European Union, or EU, where we conduct business and have offices, have laws and regulations concerning the collection and use of personal data obtained from their residents or by businesses operating within their jurisdiction. These laws and regulations often are more restrictive than those in the United States. Laws and regulations in these jurisdictions apply broadly to the collection, use, storage, disclosure, and security of data that identifies or may be used to identify or locate an individual, such as names, email addresses and, in some jurisdictions, Internet Protocol, or IP, addresses. With regard to data transfers of personal data from our European employees and customers to the United States, we historically relied on the U.S. Department of Commerce’s Safe Harbor Privacy Principles and compliance with the U.S.-EU and U.S.-Swiss Safe Harbor Frameworks, as agreed to and set forth by the U.S. Department of Commerce, and the European Union and Switzerland, which established means for legitimizing the transfer of personal data by companies doing business in Europe from the EU to the U.S. As a result of the October 6, 2015 European Court of Justice opinion in Case C-362/14 (Schrems v. Data Protection Commissioner) or, the ECJ Ruling, the U.S.-EU Safe Harbor Framework was deemed an invalid method of compliance with EU restrictions on data transfers. We have taken certain measures to legitimize our transfers of personal data, both internally and on behalf of our customers, from the EU to the United States in the wake of the ECJ Ruling. Additionally, EU and U.S. political authorities adopted the U.S. EU Privacy Shield on July 12, 2016, which may provide a new mechanism for companies to transfer EU personal data to the United States. It is unclear at this time whether the U.S. EU Privacy Shield will serve as an appropriate means for us to transfer EU personal data from the EU to the United States. Our means for transferring personal data from the EU may not be adopted by all of our customers and may be subject to legal challenge by data protection authorities, and we may experience reluctance or refusal by European customers to use our solutions due to potential risk exposure as a result of the ECJ Ruling. We and our customers face a risk of enforcement actions taken by EU data protection authorities regarding data transfers from the EU to the United States.
We also expect that there will continue to be new proposed laws, regulations and industry standards concerning privacy, data protection and information security in the United States, the EU and other jurisdictions. For example, the European Commission recently adopted a General Data Protection Regulation, effective in May 2018, that will supersede current EU data protection legislation, impose more stringent EU data protection requirements and provide for greater penalties for noncompliance. We cannot yet determine the impact such future laws, regulations and standards may have on our business. Such laws and regulations are often subject to differing interpretations and may be inconsistent among jurisdictions. These and other requirements could reduce demand for our service, increase our costs, impair our ability to grow our business, or restrict our ability to store and process data or, in some cases, impact our ability to offer our service in some locations and may subject us to liability. Further, in view of new or modified federal, state or foreign laws and regulations, industry standards, contractual obligations, and other legal obligations, or any changes in their interpretation, we may find it necessary or desirable to fundamentally change our business activities and practices or to expend significant resources to modify our software or platform and otherwise adapt to these changes. We may be unable to make such changes and modifications in a commercially reasonable manner or at all, and our ability to develop new products and features could be limited.
Further, following a referendum in June 2016 in which voters in the United Kingdom approved an exit from the EU, it is expected that the United Kingdom government will initiate a process to leave the EU (often referred to as “Brexit”). The Brexit has created uncertainty with regard to the regulation of data protection in the United Kingdom. In particular, it is unclear whether the United Kingdom will enact data protection laws or regulations designed to be consistent with the pending EU General Data Protection Regulation and how data transfers to and from the United Kingdom will be regulated.
Our customers also expect that we comply with regulatory standards that may place additional burdens on us. Our customers expect us to meet voluntary certifications or adhere to standards established by third parties, such as the SSAE 16, SOC1 and SOC2 audit processes, and may demand that they be provided a report from our auditors that we are in compliance. If we are unable to maintain these certifications or meet these standards, it could adversely affect our customers’ demand for our service and could harm our business.
28
The costs of compliance with and other burdens imposed by laws, regulations and standards may limit the use and adoption of our service and reduce overall demand for it, or lead to significant fines, penalties or liabilities for any noncompliance. Privacy, information security and data protection concerns, whether valid or not valid, may inhibit market adoption of our platform, particularly in certain industries and foreign countries.
We depend and rely upon SaaS applications from third parties to operate our business and interruptions or performance problems with these technologies may adversely affect our business and operating results.
We rely heavily on SaaS applications from third parties in order to operate critical functions of our business, including billing and order management, enterprise resource planning and financial accounting services. If these services become unavailable due to extended outages, interruptions or because they are no longer available on commercially reasonable terms, our expenses could increase, our ability to manage finances could be interrupted and our processes for managing sales of our solutions and supporting our customers could be impaired until equivalent services, if available, are identified, obtained and implemented, all of which could adversely affect our business.
We rely on third-party computer hardware and software that may be difficult to replace or which could cause errors or failures of our software solutions.
We rely on computer hardware purchased or leased and software licensed from third parties in order to deliver our software solutions. This hardware and software may not continue to be available on commercially reasonable terms, if at all. Any loss of the right to use any of this hardware or software could result in delaying or preventing our ability to provide our software solutions until equivalent technology is either developed by us or, if available, identified, obtained and integrated. In addition, errors or defects in third-party hardware or software used in our software solutions could result in errors or a failure, which could damage our reputation, impede our ability to provide our platform or process information, and adversely affect our business and results of operations.
We face exposure to foreign currency exchange rate fluctuations that could harm our results of operations.
We conduct transactions, particularly intercompany transactions, in currencies other than the U.S. dollar, primarily the British pound and the Euro. As we grow our international operations, we expect the amount of our revenues that are denominated in foreign currencies to increase in the future. Accordingly, changes in the value of foreign currencies relative to the U.S. dollar could affect our revenue and operating results due to transactional and translational remeasurements that are reflected in our results of operations. As a result of such foreign currency exchange rate fluctuations, it could be more difficult to detect underlying trends in our business and results of operations. In addition, to the extent that fluctuations in currency exchange rates cause our results of operations to differ from our expectations or the expectations of our investors, the trading price of our common stock could be adversely affected.
Additionally, as a result of Brexit, global markets and foreign currencies were adversely impacted. In particular, the value of the British pound declined as compared to the U.S. dollar and other currencies. This volatility in foreign currencies is expected to continue as the U.K. negotiates and executes its exit from the European Union, but it is uncertain over what time period this will occur. A significantly weaker British pound compared to the U.S. dollar could have a negative effect on our business, financial condition and results of operations.
We do not currently maintain a program to hedge transactional exposures in foreign currencies. However, in the future, we may use derivative instruments, such as foreign currency forward and option contracts, to hedge exposures to fluctuations in foreign currency exchange rates. The use of such hedging activities may not offset any or more than a portion of the adverse financial effects of unfavorable movements in foreign exchange rates over the limited time the hedges are in place. Moreover, the use of hedging instruments may introduce additional risks if we are unable to structure effective hedges with such instruments.
We are subject to governmental export and import controls that could impair our ability to compete in international markets due to licensing requirements and subject us to liability if we are not in full compliance with applicable laws.
Our solutions are subject to export controls, including the Commerce Department’s Export Administration Regulations and various economic and trade sanctions regulations established by the Treasury Department’s Office of Foreign Assets Controls. Obtaining the necessary authorizations, including any required license, for a particular export or sale may be time-consuming, is not guaranteed and may result in the delay or loss of sales opportunities. The U.S. export control laws and economic sanctions laws prohibit the export, re-export or transfer of specific products and services to
29
U.S. embargoed or sanctioned countries, governments and persons. Even though we take precautions to prevent our solutions from being provided to U.S. sanctions targets, our solutions could be sold by resellers or could be used by persons in sanctioned countries despite such precautions. Failure to comply with the U.S. export control, sanctions and import laws could have negative consequences, including government investigations, penalties and reputational harm. We and our employees could be subject to civil or criminal penalties, including the possible loss of export or import privileges, fines, and, in extreme cases, the incarceration of responsible employees or managers. In addition, if our resellers fail to obtain appropriate import, export or re-export licenses or authorizations, we may also be adversely affected through reputational harm and penalties.
In addition, various countries regulate the import of encryption technology, including through import permitting/licensing requirements, and have enacted laws that could limit our ability to distribute our solutions or could limit our customers’ ability to implement or access our solutions in those countries. Changes in our solutions or changes in export, sanctions and import regulations may create delays in the introduction and sale of our solutions in international markets, prevent our customers with international operations from accessing our solutions or, in some cases, preventing the export or import of our solutions to some countries, governments or persons altogether. Any change in export or import regulations, economic sanctions or related laws, shift in the enforcement or scope of existing regulations, or change in the countries, governments, persons, or technologies targeted by such regulations, could result in decreased use of our solutions, or in our decreased ability to export or sell our solutions to existing or potential customers with international operations. Any decreased use of our solutions or limitation on our ability to export or sell our solutions would likely adversely affect our business, financial condition and results of operations.
We may be unable to integrate acquired businesses and technologies successfully or achieve the expected benefits of such transactions.
On August 31, 2016, we completed the Runbook Acquisition. We expect to evaluate and consider potential strategic transactions, including acquisitions of, or investments in, businesses, technologies, services, products, and other assets in the future. We also may enter into relationships with other businesses to expand our products and services, which could involve preferred or exclusive licenses, additional channels of distributions or discount pricing.
The Runbook Acquisition or any future acquisition, investment or business relationship may result in unforeseen operating difficulties and expenditures. In particular, we may encounter difficulties assimilating or integrating the businesses, technologies, products, personnel, or operations of the acquired companies, such as Runbook, particularly if the key personnel of the acquired company choose not to work for us, their software is not easily adapted to work with our platform, or we have difficulty retaining the customers of any acquired business due to changes in ownership, management or otherwise. In addition, Runbook offers an on-premise solution to its customers. If we are unable to migrate those customers to our cloud solution or if we are unable to integrate Runbook’s on-premise software with our platform, our business may be adversely affected. Acquisitions may also disrupt our business, divert our resources and require significant management attention that would otherwise be available for development of our existing business. Moreover, the anticipated benefits of any acquisition, investment or business relationship may not be realized or we may be exposed to unknown risks or liabilities.
Negotiating these transactions can be time-consuming, difficult and expensive, and our ability to complete these transactions may often be subject to approvals that are beyond our control. Consequently, these transactions, even if announced, may not be completed. For one or more of those transactions, we may:
|
|
• |
issue additional equity securities that would dilute our existing stockholders; |
|
|
• |
use cash that we may need in the future to operate our business; |
|
|
• |
incur large charges or substantial liabilities; |
|
|
• |
incur debt on terms unfavorable to us or that we are unable to repay; |
|
|
• |
encounter difficulties retaining key employees of the acquired company or integrating diverse software codes or business cultures; and |
|
|
• |
become subject to adverse tax consequences, substantial depreciation and amortization or deferred compensation charges. |
30
The nature of our business requires the application of complex revenue and expense recognition rules and the current legislative and regulatory environment affecting generally accepted accounting principles is uncertain. Significant changes in current principles could affect our financial statements going forward and changes in financial accounting standards or practices may cause adverse, unexpected financial reporting fluctuations and harm our operating results.
The accounting rules and regulations that we must comply with are complex and subject to interpretation by the FASB, the SEC and various bodies formed to promulgate and interpret appropriate accounting principles. Recent actions and public comments from the FASB and the SEC have focused on the integrity of financial reporting and internal controls. In addition, many companies’ accounting policies are being subject to heightened scrutiny by regulators and the public. Further, the accounting rules and regulations are continually changing in ways that could materially impact our financial statements. For example, in May 2014, the FASB issued Accounting Standards Update, or ASU, No. 2014-09, Revenue from Contracts with Customers (Topic 606), as amended, which will supersede nearly all existing revenue recognition guidance. Although the new standard permits early adoption as early as January 1, 2017, the effective date of the new revenue standard is January 1, 2018. The new standard permits adoption either by using (i) a full retrospective approach for all periods presented in the period of adoption or (ii) a modified retrospective approach with the cumulative effect of initially applying the new standard recognized at the date of initial application and providing certain additional disclosures. We will adopt the new revenue guidance in the first quarter of 2018 though we have not yet determined whether to adopt using a full retrospective or modified retrospective approach. We are currently assessing the impact of the new revenue guidance on our arrangements. We currently believe that the new guidance will impact the amount and timing of incremental costs of obtaining a contract, such as sales commissions. We generally do not pay sales commissions upon contract renewal and therefore, under the new revenue guidance, the sales commissions will be recognized over an estimated customer life rather than over the non-cancelable term under current guidance. The new guidance is also expected to impact our arrangements subject to current software revenue recognition guidance and also require incremental disclosures of our revenue arrangements. We have not yet quantified the impact of these changes. Adoption of this standard will also require changes to our business processes, systems and controls to support the new revenue recognition guidance. We are in the process of identifying such changes.
We cannot predict the impact of future changes to accounting principles or our accounting policies on our financial statements going forward, which could have a significant effect on our reported financial results, and could affect the reporting of transactions completed before the announcement of the change. In addition, if we were to change our critical accounting estimates, including those related to the recognition of license revenue and other revenue sources, our operating results could be significantly affected.
Incorrect or improper implementation or use of our solutions could result in customer dissatisfaction and negatively affect our business, results of operations, financial condition, and growth prospects.
Our platform is deployed in a wide variety of technology environments and into a broad range of complex workflows. Our platform has been integrated into large-scale, enterprise-wide technology environments, and specialized use cases, and our success depends on our ability to implement our platform successfully in these environments. We often assist our customers in implementing our platform, but many customers attempt to implement even complex deployments themselves or use a third-party service firm. If we or our customers are unable to implement our platform successfully, or are unable to do so in a timely manner, customer perceptions of our platform and company may be impaired, our reputation and brand may suffer, and customers may choose not to renew or expand the use of our platform.
Our customers and third-party resellers may need training in the proper use of our platform to maximize its potential. If our platform is not implemented or used correctly or as intended, including if customers input incorrect or incomplete financial data into our platform, inadequate performance may result. Because our customers rely on our platform to manage their financial close and other financial tasks, the incorrect or improper implementation or use of our platform, our failure to train customers on how to efficiently and effectively use our platform, or our failure to provide adequate product support to our customers, may result in negative publicity or legal claims against us. Also, as we continue to expand our customer base, any failure by us to properly provide these services will likely result in lost opportunities for additional subscriptions to our platform.
31
Any failure to offer high-quality product support may adversely affect our relationships with our customers and our financial results.
In deploying and using our solutions, our customers depend on our support services team to resolve complex technical and operational issues. We may be unable to respond quickly enough to accommodate short-term increases in customer demand for product support. We also may be unable to modify the nature, scope and delivery of our product support to compete with changes in product support services provided by our competitors. Increased customer demand for product support, without corresponding revenue, could increase costs and adversely affect our operating results. Our sales are highly dependent on our business reputation and on positive recommendations from our existing customers. Any failure to maintain high-quality product support, or a market perception that we do not maintain high-quality product support, could adversely affect our reputation, our ability to sell our solutions to existing and prospective customers, our business, operating results, and financial position.
If the market for SaaS solutions develops more slowly than we expect or declines, our business would be adversely affected.
The market for SaaS solutions is less mature than the market for on-premise software applications, and the adoption rate of SaaS solutions may be slower at companies in industries with heightened data security interests or business practices requiring highly customizable application software. Many organizations have invested substantial personnel and financial resources to integrate traditional on-premise solutions into their businesses, and therefore may be reluctant or unwilling to purchase SaaS solutions. In addition, some organizations have been reluctant to use cloud-based solutions because they have concerns regarding the risks associated with the reliability or security of the technology delivery model associated with these solutions. Because our solutions involve the aggregation, storage and use of confidential information and related data, including highly confidential financial data, some customers may be reluctant or unwilling to migrate to our cloud-based solutions.
It is difficult to predict customer adoption rates and demand for our software solutions, the future growth rate and size of the market or the entry of competitive products or services. The expansion of the SaaS solutions market depends on a number of factors, including the cost, performance and perceived value associated with SaaS, as well as the ability of SaaS providers to address data security and privacy concerns. Government agencies have adopted, or may adopt, laws and regulations regarding the collection and use of personal information obtained from consumers and other individuals, or may seek to access information on our platform, either of which may reduce the overall demand for our platform. If we or other SaaS providers experience data security incidents, loss of customer data, disruptions in delivery, or other problems, the market for SaaS solutions, including our platform, may be negatively affected. If SaaS solutions do not continue to achieve market acceptance, or there is a reduction in demand for SaaS solutions caused by a lack of customer acceptance, technological challenges, data security or privacy concerns, governmental regulation, competing technologies and products, or decreases in information technology spending, it would result in decreased revenue and our business would be adversely affected.
Unfavorable conditions in our industry or the global economy could limit our ability to grow our business and negatively affect our operating results.
Our operating results may vary based on the impact of changes in our industry or the global economy on us or our customers. The revenue growth and potential profitability of our business depend on demand for business software applications and services generally and for accounting and finance systems in particular. Weak economic conditions affect the rate of accounting and finance and information technology spending and could adversely affect our customers’ or potential customers’ ability or willingness to purchase our cloud platform, delay purchasing decisions, reduce the value or duration of their subscription contracts, or affect attrition rates, all of which could adversely affect our operating results. If economic conditions deteriorate, our customers and prospective customers may elect to decrease their accounting and finance and information technology budgets, which would limit our ability to grow our business and negatively affect our operating results.
32
Changes in laws and regulations related to the internet and cloud computing or changes to internet infrastructure may diminish the demand for our solutions and could have a negative impact on our business.
The future success of our business depends upon the continued use of the internet as a primary medium for commerce, communication and business applications. Federal, state or foreign government bodies or agencies have in the past adopted, and may in the future adopt, laws or regulations affecting the use of the internet as a commercial medium. Regulators in some industries have also adopted, and may in the future adopt, regulations or interpretive positions regarding the use of SaaS and cloud computing solutions. For example, some financial services regulators have imposed guidelines for the use of cloud computing services that mandate specific controls or require financial services enterprises to obtain regulatory approval prior to utilizing such software. Changes in these laws or regulations could require us to modify our solutions in order to comply with these changes. In addition, government agencies or private organizations have imposed and may impose additional taxes, fees or other charges for accessing the internet or commerce conducted via the internet. These laws or charges could limit the growth of internet-related commerce or communications generally, or result in reductions in the demand for internet-based solutions and services such as ours. In addition, the use of the internet as a business tool could be adversely affected due to delays in the development or adoption of new standards and protocols to handle increased demands of internet activity, security, reliability, cost, ease-of-use, accessibility, and quality of service. The performance of the internet and its acceptance as a business tool has been adversely affected by “viruses,” “worms” and similar malicious programs and the internet has experienced a variety of outages and other delays as a result of damage to portions of its infrastructure. If the use of the internet is adversely affected by these issues, demand for our solutions could decline.
We provide service level commitments under our customer contracts, and if we fail to meet these contractual commitments, our revenues could be adversely affected.
Our customer agreements typically provide service level commitments. If we are unable to meet the stated service level commitments or suffer extended periods of unavailability for our applications, we may be contractually obligated to provide these customers with service credits, refunds for prepaid amounts related to unused subscription services, or we could face contract terminations. Our revenues could be significantly affected if we suffer unscheduled downtime that exceeds the allowed downtimes under our agreements with our customers. Any extended service outages could adversely affect our reputation, revenues and operating results.
Seasonality could cause our operating results and financial metrics to fluctuate from quarter to quarter and make them more difficult to predict.
We typically add fewer customers in the first quarter of the year than other quarters. We also experience a higher volume of sales at the end of each quarter and year, which is often the result of buying decisions by our customers. Seasonality may be reflected to a much lesser extent, and sometimes may not be immediately apparent, in our revenue, due to the fact that we recognize subscription revenue over the term of our agreements. We may also increase expenses in a period in anticipation of future revenues. Changes in the number of customers and users in different periods will cause fluctuations in our financial metrics and, to a lesser extent, revenues. Those changes and fluctuations in our expenses will affect our results on a quarterly basis and will make forecasting our future operating results and financial metrics difficult.
Our international operations subject us to potentially adverse tax consequences.
We report our taxable income in various jurisdictions worldwide based upon our business operations in those jurisdictions. Our intercompany relationships are subject to complex transfer pricing regulations administered by taxing authorities in various jurisdictions. The relevant taxing authorities may disagree with our determinations as to the value of assets sold or acquired or income and expenses attributable to specific jurisdictions. If such a disagreement were to occur, and our position were not sustained, we could be required to pay additional taxes, interest and penalties, which could result in one-time tax charges, higher effective tax rates, reduced cash flows, and lower overall profitability of our operations. We believe that our financial statements reflect adequate reserves to cover such a contingency, but there can be no assurances in that regard.
33
The enactment of legislation implementing changes in the U.S. taxation of international business activities or the adoption of other tax reform policies could materially impact our financial position and results of operations.
Recent changes to U.S. tax laws, including limitations on the ability of taxpayers to claim and utilize foreign tax credits, as well as changes to U.S. tax laws that may be enacted in the future, could impact the tax treatment of our foreign earnings. Due to expansion of our international business activities, any changes in the U.S. taxation of such activities may increase our worldwide effective tax rate and adversely affect our financial position and results of operations.
Our ability to use our net operating losses to offset future taxable income may be subject to limitations.
As of December 31, 2016, we had federal and State of California net operating loss carryforwards, or NOLs, of $94.7 million and $90.9 million, respectively. In general, under Section 382 of the Internal Revenue Code of 1986, as amended, or the Code, a corporation that undergoes an “ownership change” is subject to limitations on its ability to utilize its NOLs to offset future taxable income. Our existing NOLs may be subject to limitations arising from previous ownership changes, and if we undergo an ownership change our ability to utilize NOLs could be further limited by Section 382 of the Code. Future changes in our stock ownership, some of which are outside of our control, could result in an ownership change under Section 382 of the Code. Furthermore, our ability to utilize NOLs of companies that we may acquire in the future may be subject to limitations. There is also a risk that due to regulatory changes, such as suspensions on the use of NOLs, or other unforeseen reasons, our existing NOLs could expire or otherwise be unavailable to offset future income tax liabilities. For these reasons, we may not be able to realize a tax benefit from the use of our NOLs, whether or not we attain profitability.
Taxing authorities may successfully assert that we should have collected, or in the future should collect, sales and use, value-added or similar taxes, and we could be subject to liability with respect to past or future sales, which could adversely affect our results of operations.
Sales and use, value-added and similar tax laws and rates vary greatly by jurisdiction and are subject to change from time to time. Some jurisdictions in which we do not collect such taxes may assert that such taxes are applicable, which could result in tax assessments, penalties and interest, and we may be required to collect such taxes in the future. Such tax assessments, penalties and interest or future requirements may adversely affect our results of operations.
We might require additional capital to support business growth, and this capital might not be available on acceptable terms, if at all.
We intend to continue to make investments to support our business growth and may require additional funds to respond to business challenges, including the need to develop new features or enhance our existing solutions, improve our operating infrastructure or acquire complementary businesses and technologies. Accordingly, we may need to engage in equity or debt financings to secure additional funds. If we raise additional funds through further issuances of equity or convertible debt securities, our existing stockholders could suffer significant dilution, and any new equity securities we issue could have rights, preferences and privileges superior to those of holders of our common stock. Any debt financing secured by us in the future could involve restrictive covenants relating to our capital raising activities and other financial and operational matters, which may make it more difficult for us to obtain additional capital and to pursue business opportunities, including potential acquisitions. In addition, we may not be able to obtain additional financing on terms favorable to us, or at all. If we are unable to obtain adequate financing or financing on terms satisfactory to us, when we require it, our ability to continue to support our business growth and to respond to business challenges could be significantly impaired.
Natural disasters and other events beyond our control could harm our business.
Natural disasters or other catastrophic events may cause damage or disruption to our operations, international commerce and the global economy, and thus could have a strong negative effect on us. Our business operations are subject to interruption by natural disasters, fire, power shortages, pandemics, and other events beyond our control. Although we maintain crisis management and disaster response plans, such events could make it difficult or impossible for us to deliver our solutions to our customers, and could decrease demand for our solutions. The majority of our research and development activities, corporate headquarters, information technology systems, and other critical business operations are located in California, which has experienced major earthquakes in the past. Significant recovery time could be required to resume operations and our financial condition and operating results could be harmed in the event of a major earthquake or catastrophic event.
34
If our goodwill or intangible assets become impaired, we may be required to record a significant charge to earnings.
We review our goodwill and intangible assets for impairment when events or changes in circumstances indicate the carrying value may not be recoverable. Goodwill is required to be tested for impairment at least annually. As of December 31, 2016, we had goodwill and intangible assets with a net book value of $239 million related to the acquisitions of BlackLine Systems, Inc. and Runbook. An adverse change in market conditions, particularly if such change has the effect of changing one of our critical assumptions or estimates, could result in a change to the estimation of fair value that could result in an impairment charge to our goodwill or intangible assets. Any such charges may have a material negative impact on our operating results.
Risks Related to Ownership of our Common Stock
The market price of our common stock may be volatile, and you could lose all or part of your investment.
The market price of our common stock since our initial public offering has been and may continue to be subject to wide fluctuations in response to various factors, some of which are beyond our control and may not be related to our operating performance. Factors that could cause fluctuations in the market price of our common stock include the following:
|
|
• |
actual or anticipated fluctuations in our operating results; |
|
|
• |
the financial projections we may provide to the public, any changes in these projections or our failure to meet these projections; |
|
|
• |
failure of securities analysts to initiate or maintain coverage of our company, changes in financial estimates by any securities analysts who follow our company or our failure to meet these estimates or the expectations of investors; |
|
|
• |
ratings changes by any securities analysts who follow our company; |
|
|
• |
announcements by us or our competitors of significant technical innovations, acquisitions, strategic relationships, joint ventures, or capital commitments; |
|
|
• |
changes in operating performance and stock market valuations of other technology companies generally, or those in our industry in particular; |
|
|
• |
price and volume fluctuations in the overall stock market from time to time, including as a result of trends in the economy as a whole; |
|
|
• |
changes in accounting standards, policies, guidelines, interpretations, or principles; |
|
|
• |
actual or anticipated developments in our business or our competitors’ businesses or the competitive landscape generally; |
|
|
• |
developments or disputes concerning our intellectual property, or our products or third-party proprietary rights; |
|
|
• |
announced or completed acquisitions of businesses or technologies by us or our competitors; |
|
|
• |
new laws or regulations, or new interpretations of existing laws or regulations applicable to our business; |
|
|
• |
any major change in our board of directors or management; |
|
|
• |
sales of shares of our common stock by us or our stockholders; |
|
|
• |
lawsuits threatened or filed against us; and |
|
|
• |
other events or factors, including those resulting from war, incidents of terrorism, or responses to these events. |
In addition, the stock markets, and in particular the market on which our common stock is listed, have experienced extreme price and volume fluctuations that have affected and continue to affect the market prices of equity securities of many technology companies. Stock prices of many technology companies have fluctuated in a manner unrelated or disproportionate to the operating performance of those companies. In the past, stockholders have instituted securities class action litigation following periods of market volatility. If we were to become involved in securities litigation, it could subject us to substantial costs, divert resources and the attention of management from operating our business, and adversely affect our business, results of operations, financial condition, and cash flows.
35
The Company is controlled by certain of our Principal Stockholders, whose interests may differ from those of other stockholders.
As of December 31, 2016, our Principal Stockholders beneficially owned, in the aggregate, approximately 78.5% of our outstanding common stock and directors affiliated with our Principal Stockholders comprise a majority of our board of directors. Further, we entered into a Stockholders’ Agreement with the Principal Stockholders, which provides that the Principal Stockholders will be entitled to designate members of our board of directors. We anticipate that the parties to the Stockholders’ Agreement will agree to vote for these nominees, as well as other directors recommended by independent directors constituting a majority of our independent directors in a vote in which only independent directors participate.
Under the Stockholders’ Agreement and subject to our amended and restated certificate of incorporation and amended and restated bylaws and applicable law, for so long as the Principal Stockholders collectively own or hold of record, directly or indirectly, in the aggregate at least 40% of their collective “Post-IPO Shares” (as defined in the Stockholders’ Agreement), as adjusted for any reorganization, recapitalization, stock dividend, stock split, reverse stock split, or similar changes in our capitalization, the following actions will require the approval of our board of directors, including the affirmative vote of at least two directors designated by Silver Lake Sumeru:
|
|
• |
any voluntary liquidation, winding up or dissolution or any action relating to a voluntary bankruptcy, reorganization or recapitalization of the company or its subsidiaries; |
|
|
• |
certain dispositions of assets in excess of $50 million or entry into joint ventures requiring a capital contribution in excess of $50 million, in each case, by the company or its subsidiaries; |
|
|
• |
fundamental changes in the nature of the company’s or its subsidiaries’ existing lines of business or the entry into a new significant line of business; |
|
|
• |
any amendments to the company’s amended and restated certificate of incorporation and amended and restated bylaws; |
|
|
• |
incurrence of indebtedness in excess of $150 million; |
|
|
• |
appointment or termination of the Chief Executive Officer; and |
Following our initial public offering, the Principal Stockholders are able to determine the outcome of all matters requiring stockholder approval, including mergers and other material transactions, and will be able to cause or prevent a change in the composition of our board of directors or a change in control of our company that could deprive our stockholders of an opportunity to receive a premium for their common stock as part of a sale of our company and might ultimately affect the market price of our common stock.
Further, our amended and restated certificate of incorporation provides that, to the fullest extent permitted by law, the doctrine of “corporate opportunity” will not apply to Silver Lake Sumeru, Iconiq, their respective affiliates, or the directors they designate, pursuant to their rights under the Stockholders’ Agreement in a manner that would prohibit them from investing in competing businesses or doing business with our partners or customers. Accordingly, these directors will have the rights to pursue business opportunities that may be of interest to the company and which they would otherwise need to provide to the company.
36
Although we do not expect to rely on the “controlled company” exemption, we are a “controlled company” within the meaning of the stock exchange rules and we qualify for exemptions from certain corporate governance requirements.
Because our Principal Stockholders collectively own a majority of our outstanding common stock, we are considered a “controlled company” as that term is set forth in the stock exchange rules. Under these rules, a company of which more than 50% of the voting power is held by another person or group of persons acting together is a “controlled company” and may elect not to comply with certain stock exchange rules regarding corporate governance, including:
|
|
• |
the requirement that a majority of its board of directors consist of independent directors; |
|
|
• |
the requirement that its director nominees be selected or recommended for the board’s selection by a majority of the board’s independent directors in a vote in which only independent directors participate or by a nominating committee comprised solely of independent directors, in either case, with board resolutions or a written charter, as applicable, addressing the nominations process and related matters as required under the federal securities laws; and |
|
|
• |
the requirement that its compensation committee be composed entirely of independent directors with a written charter addressing the committee’s purpose and responsibilities. |
These requirements will not apply to us as long as we remain a “controlled company.” Although we qualify as a “controlled company,” we do not expect to rely on this exemption and intend to fully comply with all corporate governance requirements under the stock exchange rules. However, if we were to utilize some or all of these exemptions, you may not have the same protections afforded to stockholders of companies that are subject to all of the stock exchange rules regarding corporate governance.
A substantial number of the outstanding shares of our capital stock are restricted from immediate resale but may be sold in the near future. The large number of shares of our capital stock eligible for public sale or subject to rights requiring us to register them for public sale could depress the market price of our common stock.
The market price of our common stock could decline as a result of sales of a large number of shares of our common stock in the market in the near future, and the perception that these sales could occur may also depress the market price of our common stock. Our executive officers, directors and the holders of substantially all of our common stock and securities convertible into or exchangeable for our common stock have entered into market standoff agreements with us or lock-up agreements with the underwriters of our initial public offering under which they have agreed, subject to specific exceptions, not to sell any of our common stock until April 26, 2017. Goldman, Sachs & Co. and J.P. Morgan Securities LLC, however, on behalf of the underwriters, may permit our officers, directors and other stockholders who are subject to these lock-up agreements to sell shares prior to the end of the lock-up period. As a result of these agreements and the provisions of Rule 144 or Rule 701 under the Securities Act, all shares of our common stock will be available for sale in the public market beginning on April 26, 2017, subject in some cases to the volume and other restrictions of Rule 144 and our insider trading policy.
Following the expiration of the market standoff and lock-up agreements referred to above, certain stockholders can require us to register shares of our capital stock owned by them for public sale in the United States. In addition, we filed a registration statement to register shares of our common stock reserved for future issuance under our equity incentive plans. As a result, subject to the satisfaction of applicable exercise periods and expiration of the market standoff agreements and lock-up agreements referred to above, the shares of our common stock issued upon exercise of outstanding options to purchase shares of our common stock will be available for immediate resale in the United States in the open market.
Sales of our common stock as restrictions end or pursuant to registration rights may make it more difficult for us to sell equity securities in the future at a time and at a price that we deem appropriate. These sales also could cause the market price of our common stock to decline and make it more difficult for you to sell shares of our common stock.
37
Provisions of our corporate governance documents could make an acquisition of the company more difficult and may impede attempts by our stockholders to replace or remove our current management, even if beneficial to our stockholders.
Our amended and restated certificate of incorporation and amended and restated bylaws and the Delaware General Corporation Law, or DGCL, contain provisions that could make it more difficult for a third-party to acquire us, even if doing so might be beneficial to our stockholders. Among other things:
|
|
• |
we have authorized but unissued shares of undesignated preferred stock, the terms of which may be established and the shares of which may be issued without stockholder approval, and which may include supermajority voting, special approval, dividend, or other rights or preferences superior to the rights of stockholders; |
|
|
• |
we have a classified board of directors with staggered three-year terms; |
|
|
• |
stockholder action by written consent will be prohibited from and, after the date on which the Principal Stockholders beneficially own, in the aggregate, less than 35% in voting power of our stock, entitled to vote generally in the election of directors; |
|
|
• |
for as long as the Principal Stockholders beneficially own, in the aggregate, at least 40% in voting power of our stock entitled to vote generally in the election of directors, any amendment, alteration, rescission, or repeal of our amended and restated bylaws or our amended and restated certificate of incorporation by our stockholders will require the affirmative vote of 60% of the voting power of our stock entitled to vote thereon, voting together as a single class and at any time when the Principal Stockholders beneficially own, in the aggregate, less than 40% in voting power of our stock entitled to vote generally in the election of directors, any amendment, alteration, rescission, or repeal of our amended and restated bylaws or of certain provisions of our amended and restated certificate of incorporation by our stockholders will require the affirmative vote of the holders of at least 75% of the voting power of our stock entitled to vote thereon, voting together as a single class outstanding; and |
|
|
• |
stockholders are required to comply with advance notice requirements for nominations for elections to our board of directors or for proposing matters that can be acted upon by stockholders at stockholder meetings; provided, however, that such advance notice procedures will not apply to the Principal Stockholders at any time such person or entity owns in the aggregate at least 10% of the voting power of our stock entitled to vote generally in the election of directors. |
Further, as a Delaware corporation, we are also subject to provisions of Delaware law, which may impair a takeover attempt that our stockholders may find beneficial. These anti-takeover provisions and other provisions under Delaware law could discourage, delay or prevent a transaction involving a change in control of the company, including actions that our stockholders may deem advantageous, or negatively affect the trading price of our common stock. These provisions could also discourage proxy contests and make it more difficult for you and other stockholders to elect directors of your choosing and to cause us to take other corporate actions you desire.
We are an “emerging growth company” and we cannot be certain if the reduced disclosure requirements applicable to emerging growth companies will make our common stock less attractive to investors.
We are an “emerging growth company,” as defined in the federal securities laws, and we may take advantage of exemptions from various reporting requirements that are applicable to other public companies that are not “emerging growth companies” including, but not limited to, not being required to comply with the auditor attestation requirements of Section 404 of the Sarbanes-Oxley Act, reduced disclosure obligations regarding executive compensation in our periodic reports and proxy statements, and exemptions from the requirements of holding a nonbinding advisory vote on executive compensation and stockholder approval of any golden parachute payments not previously approved. We cannot predict if investors will find our common stock less attractive because we may rely on these exemptions. If some investors find our common stock less attractive as a result, there may be a less active trading market for our common stock and our stock price may be more volatile. We will remain an “emerging growth company” until the last day of the fiscal year following the five-year anniversary of the completion of our initial public offering, although if the market value of our common stock that is held by non-affiliates exceeds $700 million as of the end of the second quarter of a fiscal year prior to the five-year anniversary, we would cease to be an “emerging growth company” as of the following December 31.
38
The requirements of being a public company may strain our resources, divert management’s attention, and affect our ability to attract and retain executive management and qualified board members.
As a public company, we are subject to the reporting requirements of the Securities Exchange Act of 1934, as amended, or the Exchange Act, the Sarbanes-Oxley Act, the Dodd-Frank Wall Street Reform and Consumer Protection Act of 2010, the listing requirements of the exchanges and other markets upon which our common stock is listed, and other applicable securities rules and regulations. Compliance with these rules and regulations will increase our legal and financial compliance costs, make some activities more difficult, time-consuming, or costly, and increase demand on our systems and resources, particularly after we are no longer an “emerging growth company.” The Exchange Act requires, among other things, that we file annual, quarterly and current reports with respect to our business and operating results. The Sarbanes-Oxley Act requires, among other things, that we maintain effective disclosure controls and procedures and internal control over financial reporting. In order to maintain and, if required, improve our disclosure controls and procedures and internal control over financial reporting to meet this standard, significant resources and management oversight may be required. We will be required to disclose changes made in our internal control and procedures on a quarterly basis and we will be required to furnish a report by management on, among other things, the effectiveness of our internal control over financial reporting for the first fiscal year beginning after the effective date of our initial public offering. However, our independent registered public accounting firm will not be required to attest to the effectiveness of our internal control over financial reporting pursuant to Section 404 until the later of the year following our first annual report required to be filed with the SEC, or the date we are no longer an “emerging growth company.” As a result of the complexity involved in complying with the rules and regulations applicable to public companies, our management’s attention may be diverted from other business concerns, which could adversely affect our business and operating results. Although we have already hired additional employees to assist us in complying with these requirements, we may need to hire more employees in the future or engage outside consultants, which will increase our operating expenses.
In addition, changing laws, regulations and standards relating to corporate governance and public disclosure are creating uncertainty for public companies, increasing legal and financial compliance costs, and making some activities more time-consuming. These laws, regulations and standards are subject to varying interpretations, in many cases due to their lack of specificity, and, as a result, their application in practice may evolve over time as new guidance is provided by regulatory and governing bodies. This could result in continuing uncertainty regarding compliance matters and higher costs necessitated by ongoing revisions to disclosure and governance practices. We intend to invest substantial resources to comply with evolving laws, regulations and standards, and this investment may result in increased general and administrative expenses and a diversion of management’s time and attention from business operations to compliance activities. If our efforts to comply with new laws, regulations and standards differ from the activities intended by regulatory or governing bodies due to ambiguities related to their application and practice, regulatory authorities may initiate legal proceedings against us and our business may be adversely affected
We also expect that being a public company and these new rules and regulations will make it more expensive for us to obtain director and officer liability insurance, and we may be required to accept reduced coverage or incur substantially higher costs to obtain coverage. These factors could also make it more difficult for us to attract and retain qualified members of our board of directors, particularly to serve on our audit committee and compensation committee, and qualified executive officers.
As a result of disclosure of information in the filings required of a public company, our business and financial condition will become more visible, which we believe may result in threatened or actual litigation, including by competitors and other third parties. If such claims are successful, our business and operating results could be adversely affected, and even if the claims do not result in litigation or are resolved in our favor, these claims, and the time and resources necessary to resolve them, could divert the resources of our management and adversely affect our business and operating results.
We do not intend to pay dividends on our common stock, so any returns will be limited to changes in the value of our common stock.
We have never declared or paid any cash dividends on our common stock. We currently anticipate that we will retain future earnings for the development, operation and expansion of our business and do not anticipate declaring or paying any cash dividends for the foreseeable future. Any return to stockholders will therefore be limited to the increase, if any, of our stock price, which may never occur.
39
If securities or industry analysts do not publish research or publish inaccurate or unfavorable research about our business, our stock price and trading volume could decline.
The trading market for our common stock will depend in part on the research and reports that securities or industry analysts publish about us or our business. If few securities analysts commence coverage of us, or if industry analysts cease coverage of us, the trading price for our common stock would be negatively affected. If one or more of the analysts who cover us downgrade our common stock or publish inaccurate or unfavorable research about our business, our common stock price would likely decline. If one or more of these analysts cease coverage of us or fail to publish reports on us regularly, demand for our common stock could decrease, which might cause our common stock price and trading volume to decline.
Our amended and restated bylaws designate a state or federal court located within the State of Delaware as the exclusive forum for certain litigation that may be initiated by our stockholders, which could limit our stockholders’ ability to obtain a favorable judicial forum for disputes with us.
Pursuant to our amended and restated bylaws, unless we consent in writing to the selection of an alternative forum, the sole and exclusive forum for (1) any derivative action or proceeding brought on our behalf, (2) any action asserting a claim of breach of a fiduciary duty owed by any of our directors, officers or other employees to us or our stockholders, (3) any action asserting a claim against us arising pursuant to any provision of the DGCL, or (4) any action asserting a claim against us that is governed by the internal affairs doctrine shall be a state or federal court located within the State of Delaware, in all cases subject to the court’s having personal jurisdiction over indispensable parties named as defendants. Any person or entity purchasing or otherwise acquiring any interest in shares of our capital stock shall be deemed to have notice of and consented to this provision. The forum selection clause in our amended and restated bylaws may have the effect of discouraging lawsuits against us or our directors and officers and may limit our stockholders’ ability to obtain a favorable judicial forum for disputes with us.
Not applicable.
Our principal executive offices are located in Los Angeles, California where we occupy approximately 66,000 square feet of space under a lease that expires in June 2022. We also occupy additional leased offices located in Chicago, Illinois; Atlanta, Georgia; New York, New York; London, the United Kingdom; Melbourne, Australia; Sydney, Australia; Paris, France; Johannesburg, South Africa; Frankfurt, Germany; Kuala Lumpur, Malaysia; Vancouver, Canada; Ede, Netherlands; and Singapore. We believe that our properties are generally suitable to meet our needs for the foreseeable future. In addition, to the extent we require additional space in the future, we believe that it would be readily available on commercially reasonable terms.
From time to time, we may be subject to legal proceedings arising in the ordinary course of business. In addition, from time to time, third parties may assert intellectual property infringement claims against us in the form of letters and other forms of communication. As of the date of this Form 10-K, we are not a party to any litigation the outcome of which, if determined adversely to us, would individually or in the aggregate be reasonably expected to have a material adverse effect on our results of operations, prospects, cash flows, financial position or brand.
Not applicable.
40
|
Item 5. |
Market for Registrant's Common Equity, Related Stockholder Matters and Issuer Purchases of Equity Securities |
Market for Our Common Stock and Related Stockholder Matters
Our common stock has been traded on the NASDAQ Global Select Market under the symbol “BL” since October 28, 2016. Prior to that time, there was no public market for our common stock. The following table sets forth, for the periods indicated, the high and low intraday sales prices for our common stock as reported on the NASDAQ Global Select Market.
|
|
|
Fiscal 2016 |
|
|||||
|
|
|
High |
|
|
Low |
|
||
|
Fourth Quarter (from October 28, 2016) |
|
$ |
28.77 |
|
|
$ |
21.66 |
|
On March 3, 2017, the last reported sales price on the NASDAQ Global Select Market for our common stock was $28.60 per share.
Holders of Record
As of March 3, 2017, there were 128 shareholders of record. The number of record holders does not include beneficial holders who hold their shares in “street name,” meaning that the shares are held for their accounts by a broker or other nominee. Accordingly, we believe that the total number of beneficial holders is higher than the number of our shareholders of record.
Dividend Policy
We have never declared or paid, any cash dividends on our common stock. We currently intend to retain all of our future earnings, if any, to finance our operations and do not anticipate paying any cash dividends on our common stock in the foreseeable future. Any future determination as to the declaration and payment of dividends will be at the discretion of our board of directors and will depend on then-existing conditions, including our financial condition, operating results, contractual restrictions, capital requirements, business prospects, and other factors our board of directors may deem relevant.
41
This performance graph shall not be deemed “soliciting material” or to be “filed” with the Securities and Exchange Commission, or the SEC, for purposes of Section 18 of the Securities Exchange Act of 1934, as amended, or the Exchange Act, or otherwise subject to the liabilities under that Section, and shall not be deemed to be incorporated by reference into any of our filings under the Securities Act of 1933, as amended, or the Securities Act.
The following graph compares (i) the cumulative total stockholder return on our common stock from October 28, 2016 (the date our common stock commenced trading on the NASDAQ Global Select Market) through December 31, 2016 with (ii) the cumulative total return of the S&P 500 Index and the NASDAQ Computer & Data Processing Index over the same period, assuming the investment of $100 in our common stock and in both of the other indices on October 28, 2016 and the reinvestment of dividends. The graph uses the closing market price on October 28, 2016 of $23.70 per share as the initial value of our common stock. As discussed above, we have never declared or paid a cash dividend on our common stock and do not anticipate declaring or paying a cash dividend in the foreseeable future.
COMPARISON OF CUMULATIVE TOTAL RETURN*
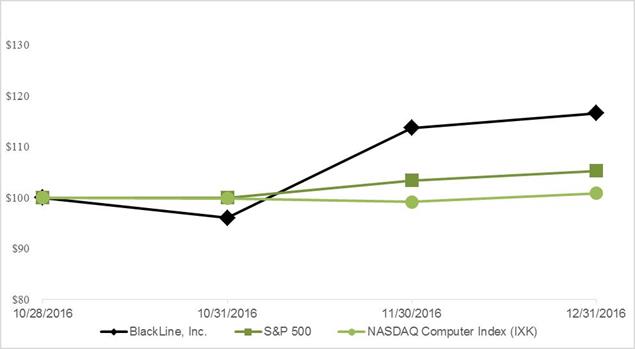
*Returns are based on historical results and are not necessarily indicative of future performance. See the disclosure in Part I, Item 1A. “Risk Factors.”
Securities Authorized for Issuance under Equity Compensation Plan
The information required by this item will be included in our Proxy Statement for the 2017 Annual Meeting of Stockholders to be filed with the SEC within 120 days of the fiscal year ended December 31, 2016, and is incorporated herein by reference.
Recent Sales of Unregistered Securities
From January 1, 2016 through the filing our Registration Statement on Form S-8 on October 28, 2016, we granted to our officers, directors, employees, consultants, and other service providers options to purchase an aggregate of 1,726,745 shares of our common stock under our 2014 Equity Incentive Plan at exercise prices ranging from $14.00 to $16.00 per share. During that same period, we issued and sold to 67 employees and other service providers an aggregate of 512,647 shares of common stock upon exercise of options under our 2014 Equity Incentive Plan at a weighted average exercise price of $5.84 per share for aggregate gross cash proceeds of $2.8 million.
42
In September 2016, we sold 192,187 shares of our common stock to Runbook employees at $16.00 per share, for aggregate gross cash proceeds of $3.1 million.
None of the foregoing transactions involved any underwriters, underwriting discounts or commissions, or any public offering.
The offers, sales and issuances of the securities described in this Item 5 were deemed to be exempt from registration under the Securities Act under either (1) Rule 701 promulgated under the Securities Act as offers and sales of securities pursuant to certain compensatory benefit plans and contracts relating to compensation in compliance with Rule 701 or (2) Section 4(a)(2) of the Securities Act as transactions by an issuer not involving any public offering. The recipients of securities in each of these transactions represented their intention to acquire the securities for investment only and not with a view to or for sale in connection with any distribution thereof and appropriate legends were affixed to the stock certificates and instruments issued in such transactions. All recipients had adequate access, through their relationships with us, to information about us. The sales of these securities were made without any general solicitation or advertising.
Use of Proceeds
On October 27, 2016, the Registration Statement on Form S-1 (File No. 333-213899) for our initial public offering was declared effective by the SEC. On November 2, 2016, we closed our initial public offering and sold 9,890,000 shares of our common stock at a public offering price of $17.00 per share for an aggregate offering price of approximately $168.1 million. Upon completion of the sale of the shares of our common stock, our initial public offering terminated.
The underwriters for our initial public offering were Goldman, Sachs & Co., J.P. Morgan Securities LLC, Pacific Crest Securities, a division of KeyBanc Capital Markets Inc., Raymond James and Associates, Inc., William Blair & Company, L.L.C. and Robert W. Baird & Co. Incorporated. We paid to the underwriters of our initial public offering underwriting discounts and commissions totaling approximately $11.8 million and incurred offering expenses of approximately $4.5 million which, when added to other underwriting discounts and commissions, amount to total expenses of approximately $16.3 million. Thus, the net offering proceeds, after deducting underwriting discounts and commission and other offering expenses, were approximately $151.9 million.
There has been no material change in the planned use of proceeds from our initial public offering as described in our final prospectus, dated October 27, 2016, pursuant to Rule 424(b)(4) of the Securities Act. On November 3, 2016, we repaid in full a total of $67.7 million outstanding debt under our credit facility, which included principal, interest, and prepayment penalties.
Issuer Purchases of Equity Securities
None.
|
|
|
On September 3, 2013, we acquired BlackLine Systems, Inc., which we refer to as the 2013 Acquisition. Prior to the 2013 Acquisition, we had no significant operations. As a result, the consolidated financial statements for the periods from January 1, 2013 to September 2, 2013 are presented as BlackLine Systems, Inc., which we refer to as the Predecessor, and all subsequent periods are presented as BlackLine, Inc., which we refer to as the Successor. The Successor financial statements reflect a new basis of accounting as a result of the 2013 Acquisition and therefore are not comparable to the Predecessor financial statements. We refer to the period from January 1, 2013 to September 2, 2013 as the 2013 Predecessor Period and the period from September 3, 2013 to December 31, 2013 as the 2013 Successor Period.
The consolidated statement of operations data for the years ended December 31, 2016, 2015 and 2014 and the consolidated balance sheet data at December 31, 2016 and 2015 are derived from, and qualified by reference to, our audited financial statements included elsewhere in this Annual Report on Form 10-K. The consolidated statements of operations data for the 2013 Successor period and the consolidated balance sheet data as of December 31, 2014 and 2013 are derived from our audited financial statements not included in this Annual Report on Form 10-K. The consolidated statements of operations data for the 2013 Predecessor periods are derived from the audited financial statements of the Predecessor not included in this Annual Report on Form 10-K.
43
The selected consolidated financial data below are not necessarily indicative of future performance and should be read in conjunction with Item 7, “Management’s Discussion and Analysis of Financial Condition and Results of Operations” and the consolidated financial statements and related notes thereto included in Item 8 of this Annual Report on Form 10-K.
Consolidated Statements of Operations Data (in thousands, except per share data):
|
|
|
Year Ended |
|
|
2013 |
|
|
|
2013 |
|
|||||||||||
|
|
|
December 31, |
|
|
Successor |
|
|
|
Predecessor |
|
|||||||||||
|
|
|
2016(1) |
|
|
2015 |
|
|
2014 |
|
|
Period |
|
|
|
Period |
|
|||||
|
Revenues |
|
|
|
|
|
|
|
|
|
|
|
|
|
|
|
|
|
|
|
|
|
|
Subscription and support |
|
$ |
117,524 |
|
|
$ |
80,080 |
|
|
$ |
49,029 |
|
|
$ |
7,723 |
|
|
|
$ |
21,977 |
|
|
Professional services |
|
|
5,599 |
|
|
|
3,527 |
|
|
|
2,648 |
|
|
|
860 |
|
|
|
|
1,407 |
|
|
Total revenues |
|
|
123,123 |
|
|
|
83,607 |
|
|
|
51,677 |
|
|
|
8,583 |
|
|
|
|
23,384 |
|
|
Cost of revenues |
|
|
|
|
|
|
|
|
|
|
|
|
|
|
|
|
|
|
|
|
|
|
Subscription and support |
|
|
25,900 |
|
|
|
19,773 |
|
|
|
14,380 |
|
|
|
4,346 |
|
|
|
|
4,442 |
|
|
Professional services |
|
|
4,311 |
|
|
|
2,956 |
|
|
|
2,218 |
|
|
|
499 |
|
|
|
|
1,145 |
|
|
Total cost of revenues(2)(3) |
|
|
30,211 |
|
|
|
22,729 |
|
|
|
16,598 |
|
|
|
4,845 |
|
|
|
|
5,587 |
|
|
Gross profit |
|
|
92,912 |
|
|
|
60,878 |
|
|
|
35,079 |
|
|
|
3,738 |
|
|
|
|
17,797 |
|
|
Operating expenses |
|
|
|
|
|
|
|
|
|
|
|
|
|
|
|
|
|
|
|
|
|
|
Sales and marketing(2)(3) |
|
|
77,810 |
|
|
|
56,546 |
|
|
|
31,837 |
|
|
|
6,895 |
|
|
|
|
10,453 |
|
|
Research and development(2) |
|
|
21,125 |
|
|
|
18,216 |
|
|
|
9,705 |
|
|
|
2,225 |
|
|
|
|
4,738 |
|
|
General and administrative(2)(3)(4) |
|
|
26,329 |
|
|
|
20,928 |
|
|
|
11,716 |
|
|
|
2,827 |
|
|
|
|
6,978 |
|
|
Acquisition-related costs |
|
|
1,582 |
|
|
|
— |
|
|
|
— |
|
|
|
1,634 |
|
|
|
|
5,586 |
|
|
Total operating expenses |
|
|
126,846 |
|
|
|
95,690 |
|
|
|
53,258 |
|
|
|
13,581 |
|
|
|
|
27,755 |
|
|
Loss from operations |
|
|
(33,934 |
) |
|
|
(34,812 |
) |
|
|
(18,179 |
) |
|
|
(9,843 |
) |
|
|
|
(9,958 |
) |
|
Other expense |
|
|
|
|
|
|
|
|
|
|
|
|
|
|
|
|
|
|
|
|
|
|
Interest expense, net |
|
|
(5,932 |
) |
|
|
(3,215 |
) |
|
|
(3,047 |
) |
|
|
(781 |
) |
|
|
|
(22 |
) |
|
Change in fair value of the common stock warrant liability |
|
|
(5,880 |
) |
|
|
(420 |
) |
|
|
(3,700 |
) |
|
|
— |
|
|
|
|
— |
|
|
Other expense, net |
|
|
(11,812 |
) |
|
|
(3,635 |
) |
|
|
(6,747 |
) |
|
|
(781 |
) |
|
|
|
(22 |
) |
|
Loss before income taxes |
|
|
(45,746 |
) |
|
|
(38,447 |
) |
|
|
(24,926 |
) |
|
|
(10,624 |
) |
|
|
|
(9,980 |
) |
|
Benefit from income taxes |
|
|
(6,587 |
) |
|
|
(13,713 |
) |
|
|
(8,174 |
) |
|
|
(3,954 |
) |
|
|
|
21 |
|
|
Net loss |
|
$ |
(39,159 |
) |
|
$ |
(24,734 |
) |
|
$ |
(16,752 |
) |
|
$ |
(6,670 |
) |
|
|
$ |
(10,001 |
) |
|
Net loss per share, basic and diluted |
|
$ |
(0.92 |
) |
|
$ |
(0.61 |
) |
|
$ |
(0.42 |
) |
|
$ |
(0.17 |
) |
|
|
$ |
(0.12 |
) |
|
Weighted average common shares outstanding, basic and diluted |
|
|
42,497 |
|
|
|
40,579 |
|
|
|
40,089 |
|
|
|
40,019 |
|
|
|
|
82,250 |
|
|
|
|
|
|
|
|
|
|
|
|
|
|
|
|
|
|
|
|
|
|
|
|
|
(1) |
On August 31, 2016, we completed the Runbook Acquisition. The Runbook Acquisition has been accounted for as a business combination. The results of Runbook have been included in our consolidated results of operations for the period subsequent to the acquisition date. See Note 4 of notes to our consolidated financial statements included in Item 8 of this Annual Report on Form 10-K. |
|
(2) |
The following table presents stock-based compensation included in each respective expense category (in thousands): |
|
|
|
Year Ended |
|
|
2013 |
|
|
|
2013 |
|
|||||||||||
|
|
|
December 31, |
|
|
Successor |
|
|
|
Predecessor |
|
|||||||||||
|
|
|
2016 |
|
|
2015 |
|
|
2014 |
|
|
Period |
|
|
|
Period |
|
|||||
|
Cost of revenues |
|
$ |
715 |
|
|
$ |
466 |
|
|
$ |
249 |
|
|
$ |
— |
|
|
|
$ |
86 |
|
|
Sales and marketing |
|
|
2,490 |
|
|
|
2,418 |
|
|
|
1,059 |
|
|
|
— |
|
|
|
|
124 |
|
|
Research and development |
|
|
809 |
|
|
|
588 |
|
|
|
229 |
|
|
|
— |
|
|
|
|
330 |
|
|
General and administrative |
|
|
2,512 |
|
|
|
2,025 |
|
|
|
480 |
|
|
|
— |
|
|
|
|
360 |
|
|
|
|
$ |
6,526 |
|
|
$ |
5,497 |
|
|
$ |
2,017 |
|
|
$ |
— |
|
|
|
$ |
900 |
|
44
|
(3) |
The following table presents the amortization of intangible assets included in each respective expense category (in thousands): |
|
|
|
Year Ended |
|
|
2013 |
|
|
|
2013 |
|
|||||||||||
|
|
|
December 31, |
|
|
Successor |
|
|
|
Predecessor |
|
|||||||||||
|
|
|
2016 |
|
|
2015 |
|
|
2014 |
|
|
Period |
|
|
|
Period |
|
|||||
|
Cost of revenues |
|
$ |
6,368 |
|
|
$ |
6,139 |
|
|
$ |
6,139 |
|
|
$ |
2,048 |
|
|
|
$ |
— |
|
|
Sales and marketing |
|
|
3,605 |
|
|
|
3,487 |
|
|
|
3,487 |
|
|
|
1,162 |
|
|
|
|
— |
|
|
General and administrative |
|
|
2,532 |
|
|
|
2,466 |
|
|
|
2,466 |
|
|
|
821 |
|
|
|
|
— |
|
|
|
|
$ |
12,505 |
|
|
$ |
12,092 |
|
|
$ |
12,092 |
|
|
$ |
4,031 |
|
|
|
$ |
— |
|
|
(4) |
General and administrative expenses include increases in fair value of contingent consideration of $0.4 million and $41,000 for the years ended December 31, 2016 and 2015, respectively, and a decrease in fair value of contingent consideration of $0.8 million for the year ended December 31, 2014. |
Consolidated Balance Sheet Data (in thousands):
|
|
|
December 31, |
|
|||||||||||||
|
|
|
2016 |
|
|
2015 |
|
|
2014 |
|
|
2013 |
|
||||
|
Cash and cash equivalents |
|
$ |
22,118 |
|
|
$ |
15,205 |
|
|
$ |
25,707 |
|
|
$ |
14,855 |
|
|
Marketable securities |
|
|
83,130 |
|
|
|
— |
|
|
|
— |
|
|
|
— |
|
|
Total assets |
|
|
420,437 |
|
|
|
286,750 |
|
|
|
285,550 |
|
|
|
275,025 |
|
|
Deferred revenue |
|
|
80,360 |
|
|
|
52,750 |
|
|
|
34,574 |
|
|
|
17,328 |
|
|
Deferred revenue, noncurrent |
|
|
2,373 |
|
|
|
— |
|
|
|
— |
|
|
|
— |
|
|
Capital lease obligations, net of current portion |
|
|
— |
|
|
|
558 |
|
|
|
— |
|
|
|
— |
|
|
Long-term debt |
|
|
— |
|
|
|
28,267 |
|
|
|
25,673 |
|
|
|
23,132 |
|
|
Total stockholders' equity |
|
|
291,410 |
|
|
|
166,168 |
|
|
|
183,947 |
|
|
|
193,852 |
|
45
The following discussion of our financial condition and results of operations should be read together with the financial statements and the related notes set forth in Item 8, “Financial Statements and Supplementary Data.” The following discussion also contains forward-looking statements that involve a number of risks and uncertainties. See Part I, “Special Note Regarding Forward-Looking Statements” for a discussion of the forward-looking statements contained below and Part I, Item 1A, “Risk Factors” for a discussion of certain risks that could cause our actual results to differ materially from the results anticipated in such forward-looking statements.
Overview
We have created a comprehensive cloud-based software platform designed to transform and modernize accounting and finance operations for organizations of all types and sizes. Our secure, scalable platform supports critical accounting processes such as the financial close, account reconciliations, intercompany accounting, and controls assurance. By introducing software to automate these processes and to enable them to function continuously, we empower our customers to improve the integrity of their financial reporting, increase efficiency in their accounting and finance processes and enhance real-time visibility into their operations.
As of December 31, 2016, we had more than 1,700 customers with over 166,000 users in over 130 countries exclusive of the Runbook Acquisition. Additionally, we continue to build strategic relationships with technology vendors, professional services firms, business process outsourcers, and resellers.
We are a holding company and conduct our operations through our wholly-owned subsidiary, BlackLine Systems, Inc. BlackLine Systems, Inc. funded its business with investments from our founder and cash flows from operations until September 3, 2013, when we acquired BlackLine Systems, Inc. and Silver Lake Sumeru and Iconiq acquired a controlling interest in us, which we refer to as the “2013 Acquisition.” We refer to Silver Lake Sumeru and Iconiq collectively as our “Investors.” The 2013 Acquisition was accounted for as a business combination under GAAP and resulted in a change in accounting basis as of the date of the 2013 Acquisition.
Our platform consists of seven core cloud-based products, including Account Reconciliation, Task Management, Transaction Matching, Journal Entry, Variance Analysis, Consolidation Integrity Manager, and Daily Reconciliation. Customers typically purchase these products in packages that we refer to as solutions, but they have the option to purchase these products individually. Current solutions include Reconciliation Management and Financial Close Management, as well as, Intercompany Hub and Insights, which were introduced in November 2015.
We derived approximately 95% of our revenue from subscriptions to our cloud-based software platform and approximately 5% from professional services for the year ended December 31, 2016. The majority of subscriptions are sold through one-year non-cancellable contracts, with a growing percentage of subscriptions sold through three-year contracts. We price our subscriptions based on a number of factors, primarily the number of users having access to the products and the number of products purchased by the customer. Subscription revenue is recognized ratably over the term of the customer agreement. The first year of subscription fees are typically payable within 30 days after execution of a contract, and thereafter upon renewal.
Professional services consist of implementation and consulting services. Although our platform is ready to use immediately after a new customer has access to it, we typically help customers implement our solutions for a fixed fee, which is initially recorded as deferred revenue and recognized on a proportional performance basis as the services are performed. We also provide consulting services to help customers optimize the use of our products. We charge customers for our consulting services on a time-and-materials basis and we recognize that revenue as services are performed.
We typically invoice customers annually in advance for annual and multi-year subscriptions and invoice in advance or on a time-and-materials basis for professional services. We record amounts invoiced for portions of annual subscription periods that have not occurred or services that have not been performed as deferred revenue on our consolidated balance sheet.
We sell our platform primarily through our direct sales force, which leverages our relationships with technology vendors, professional services firms and business process outsourcers. In particular, we have a strategic relationship with SAP. Our solution is an SAP-endorsed business solution that integrates with SAP’s ERP solutions. Under our agreement with SAP, which we entered into in 2013, we pay SAP a fee based on a percentage of revenues from our new customers that use an SAP ERP system. We continue to pay SAP a fee for these customers over the term of their subscription
46
agreements. For the year ended December 31, 2016, revenues from our customers under this agreement accounted for $20.7 million, or approximately 17%, of our total revenues. For the year ended December 31, 2015, revenues from our customers under this agreement accounted for $9.4 million, or approximately 11%, of our total revenues. Additionally, we are expanding our channel of resellers, particularly in markets outside of the United States.
We target our sales and marketing efforts at both enterprise and mid-market businesses. We define the enterprise market as companies with greater than $500 million in annual revenue, and we define mid-market as companies with between $50 and $500 million in annual revenue. For the year ended December 31, 2016, sales to enterprise and mid-market customers represented 85% and 15% of our revenues, respectively. For the years ended December 31, 2015 and 2014, sales to enterprise customers represented 86% and 90% of our revenues, respectively, while sales to mid-market customers represented 14% and 10% of our revenues, respectively. Additionally, we target our efforts at both new customers and existing customers. Existing customers may renew their subscriptions and broaden the deployment of our platform across their organizations by increasing the number of users accessing our platform or by adding additional products. We have historically signed a higher percentage of agreements with new customers, as well as renewal agreements with existing customers, in the fourth quarter of each year and usually during the last month of the quarter. This can be attributed to buying patterns typical in the software industry. As the terms of most of our customer agreements are measured in full year increments, agreements initially entered into the fourth quarter or last month of any quarter will generally come up for renewal at that same time in subsequent years. This seasonality is reflected in our revenues, though the impact to overall annual or quarterly revenues is minimal due to the fact that we recognize subscription revenue ratably over the term of the customer contract.
We believe the addressable market for our platform is large and growing. According to a study we commissioned with Frost & Sullivan, in 2015, there were more than 165,000 corporate organizations worldwide that are in our addressable market with revenues greater than $50 million. As a result, we expect to continue to grow our direct sales team and to expand our relationships with technology vendors, professional services firms, business process outsourcers, and resellers. We also intend to continue to invest in research and development to extend the functionality of our platform and develop new solutions and features.
For the years ended December 31, 2016, 2015 and 2014, we had revenues of $123.1 million, $83.6 million and $51.7 million respectively, and we incurred net losses of $39.2 million, $24.7 million and $16.8 million, respectively.
On November 2, 2016, we completed our initial public offering and raised net proceeds of approximately $151.9 million and used $67.7 million of the proceeds to repay all amounts outstanding under our credit facility.
Runbook Acquisition
On August 31, 2016, we completed our acquisition of Runbook Company B.V., or Runbook, a Netherlands-based provider of financial close automation software and integration solutions for SAP customers, or the Runbook Acquisition. We acquired Runbook to enhance the connectivity and integration of our platform to SAP and other systems. We believe this acquisition enhances our position as a leading provider of software solutions to automate the financial close process for SAP customers and supports our European expansion strategy.
The aggregate purchase consideration of $34.1 million for the Runbook Acquisition, which is subject to final working capital working adjustments, was paid in cash on the acquisition date. The estimated purchased working capital included approximately $2.6 million in cash. We amended our credit facility to add an additional term loan pursuant to which we borrowed $30.0 million and used the proceeds and cash on hand to fund the acquisition. In connection with our initial public offering, we repaid all amounts outstanding under the term loan. We incurred $1.6 million in transaction costs and fees to complete the Runbook Acquisition.
Runbook’s revenues consist of license fees associated with the sale of its on-premise software, post-contract support, and professional services required to implement its solutions and train its customers.
Factors Affecting Performance
We believe that our future performance will depend on many factors, including those described below. While these areas present significant opportunity, they also present risks that we must manage to achieve successful results. See Part I, Item 1A, “Risk Factors.” If we are unable to address these challenges, our business and operating results could be adversely affected.
47
Expansion and Further Penetration of Our Customer Base. We employ a “land-and-expand” sales strategy that focuses on efficiently acquiring new customers and growing our relationships with existing customers over time. As the chart below illustrates, we have a history of attracting new customers and expanding their revenue with us over time. Building upon this success, we believe significant opportunity exists for us to acquire new customers in both the enterprise and mid-market segments across all geographies, as well as expand the use of our platform by selling additional products and increasing the number of users within our current customers’ organizations.
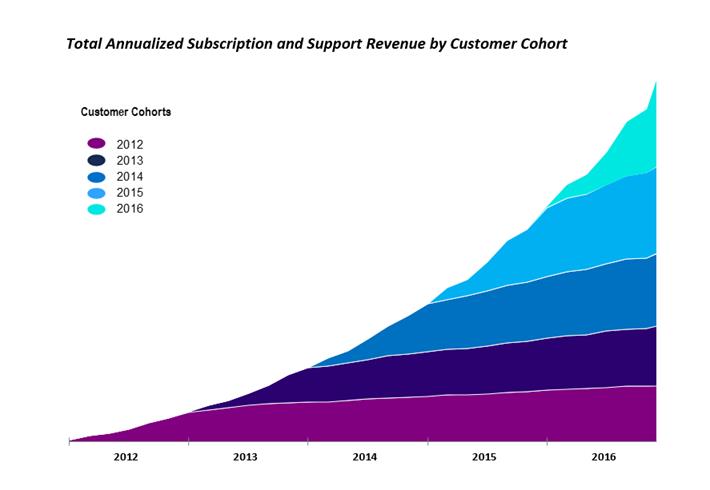
The chart reflects annualized subscription and support revenue for the group of customers that became our customers in each respective cohort year. A “cohort” is a grouping of customers by the year specified. For instance, the 2012 cohort includes all customers whose contract start date is between January 1, 2012 and December 31, 2012. We calculate annualized subscription and support revenue at a particular date as the total amount of minimum subscription and support revenue contractually committed under each of our customer agreements for that month through the remaining term of the agreement, divided by the remaining number of months in the term of the agreement, multiplied by twelve. Our annualized subscription and support revenue as of December 31, 2016 for each of our 2012, 2013, 2014, 2015, and 2016 customer cohorts represented an increase over the initial annualized subscription and support revenue for such customer cohorts of 3.0x, 2.3x, 1.9x, 1.5x, and 1.2x, respectively. We calculate initial annualized subscription and support revenue for any given cohort year as the sum of annualized subscription and support revenue as of the first month of each customer agreement that was entered into within that given cohort year. Accordingly, in contrast to annualized subscription and support revenue, initial annualized subscription and support revenue does not reflect any changes in the payments due under or the duration of customer agreements following the first month of the customer agreement. The above chart excludes the impact of the Runbook Acquisition.
Investment in Growth. We plan to continue to invest in our business so that we can capitalize on our market opportunity. We intend to continue to grow our global sales and marketing team to acquire new customers and to increase sales to existing customers. We intend to continue to grow our research and development team to extend the functionality and range of our applications to bring new and improved solutions to accounting and finance. However, we expect our
48
sales and marketing expenses and research and development expenses as a percentage of revenues to decrease over time as we grow our revenues and gain economies of scale by increasing our customer base and increase sales to our existing customer base. We believe that these investments will contribute to our long-term growth, although they may adversely affect our profitability in the near term.
Leveraging Strategic Relationships. We plan to continue to strengthen and expand our relationships with technology vendors, professional services firms, business process outsourcers, and resellers. These relationships enable us to increase the speed of deployment and offer a wider range of integrated services to our customers. We intend to support these existing relationships, seek additional relationships and further expand our channel of resellers to help us increase our presence in existing markets and to expand into new markets. Our business and results of operations will be significantly affected by our success in leveraging and expanding these relationships.
Market Adoption of Our Platform. A key focus of our sales and marketing efforts is creating market awareness about the benefits of our cloud-based SaaS platform. The market for SaaS solutions for accounting and finance is less mature than the market for on-premise accounting and finance software applications, and potential customers may be slow or unwilling to migrate from their legacy solutions such as spreadsheets, manual processes or home grown solutions. It is difficult to predict customer adoption rates and demand, the future growth rate and size of the SaaS platform for accounting and finance market or the entry of competitive solutions. Our business and operating results will be significantly affected by the degree to, and speed with, which organizations adopt our solutions.
Key Metrics
We regularly review a number of metrics, including the following key metrics, to evaluate our business, measure our performance, identify trends affecting our business, formulate financial projections, and make strategic decisions. Each of the metrics below exclude the impact of the Runbook Acquisition.
|
|
|
Year Ended |
|
|||||||||
|
|
|
December 31, |
|
|||||||||
|
|
|
2016 |
|
|
2015 |
|
|
2014 |
|
|||
|
Dollar-based net revenue retention rate |
|
|
116 |
% |
|
|
120 |
% |
|
|
118 |
% |
|
Number of customers (as of end of period) |
|
|
1,758 |
|
|
|
1,338 |
|
|
|
987 |
|
|
Number of users (as of end of period) |
|
|
166,903 |
|
|
|
128,726 |
|
|
|
93,665 |
|
Dollar-based net revenue retention rate. We believe that dollar-based net revenue retention rate is an important metric to measure the long-term value of customer agreements and our ability to retain and grow our relationships with existing customers over time. We calculate dollar-based net revenue retention rate as the implied monthly subscription and support revenue at the end of a period for the base set of customers from which we generated subscription revenue in the year prior to the calculation, divided by the implied monthly subscription and support revenue one year prior to the date of calculation for that same customer base. This calculation does not reflect implied monthly subscription and support revenue for new customers added during the one-year period but does include the effect of customers who terminated during the period. We define implied monthly subscription and support revenue as the total amount of minimum subscription and support revenue contractually committed to, under each of our customer agreements over the entire term of the agreement, divided by the number of months in the term of the agreement.
Number of customers. We believe that our ability to expand our customer base is an indicator of our market penetration and the growth of our business. We define a customer as an entity with an active subscription agreement as of the measurement date. In situations where an organization has multiple subsidiaries or divisions, each entity that is invoiced as a separate entity is treated as a separate customer. However, where an existing customer requests its invoice be divided for the sole purpose of restructuring its internal billing arrangement without any incremental increase in revenue, such customer continues to be treated as a single customer. For the years ended December 31, 2016, 2015 and 2014, no single customer accounted for more than 10% of our total revenues.
Number of users. Since our customers generally pay fees based on the number of users of our platform within their organization, we believe the total number of users is an indicator of the growth of our business.
49
Key Components of our Results of Operations
Revenues
Subscription and support. The majority of subscriptions are sold through one-year non-cancellable contracts and a growing percentage of subscriptions are sold through three-year contracts. Fees are based on a number of factors, including the number of users having access to the products and the number of products purchased by the customer. The first year of subscription fees are typically payable within 30 days after execution of a contract, and thereafter upon renewal. We initially record the subscription fees as deferred revenue and recognize revenue on a straight-line basis over the term of the agreement. At any time during the subscription period, customers may increase their number of users and add products. Additional fees are payable for the remainder of the initial or renewed contract term. Customers may only reduce their number of users or subscription to products upon renewal of their arrangement. Revenues from subscriptions to our cloud-based software platform comprised approximately 95% of our revenues for the year ended December 31, 2016.
Subscription and support revenues also include revenues associated with sales of on-premise software licenses and related support. Prior to our migration to SaaS in 2012, we licensed our legacy on-premise software. We no longer develop any new applications or functionality for our legacy on-premise software, but we continue to provide post-contract support to five customers that had not migrated to our SaaS solution as of December 31, 2016.
On August 31, 2016, we acquired Runbook. We plan to migrate Runbook’s licensed products to a cloud-based platform, but we continue to sell Runbook’s on-premise software to existing Runbook customers and provide post-contract support and implementation services.
Revenues recognized from sales of software licenses, support and implementation services related to software arrangements comprised less than 1%, 1% and 3% of total revenues for the years ended December 31, 2016, 2015 and 2014, respectively.
Professional services. We offer our customers implementation and consulting services. Although our platform is ready to use immediately after a new customer has access to it, we typically help customers implement our solutions for a fixed fee and we recognize revenue over the period such services are performed. We also provide consulting and training services to help customers optimize the use of our products. We charge customers for our consulting and training services on a time-and-materials basis and we recognize revenue as services are performed. Professional services revenues comprised approximately 5% of our revenues for the year ended December 31, 2016.
For a description of our revenue accounting policies, see “Management’s Discussion and Analysis of Financial Condition and Results of Operations—Critical Accounting Policies and Estimates.”
Cost of Revenues
Subscription and support cost of revenues. Subscription and support cost of revenues primarily consists of amortization of developed technology costs resulting from the 2013 Acquisition and the Runbook Acquisition, salaries, benefits and stock-based compensation associated with our hosting operations and support personnel, data center costs related to hosting our cloud-based software, and amortization of capitalized internal-use software costs. We also allocate a portion of overhead to subscription and support cost of revenues.
Professional services costs of revenues. Costs associated with providing professional services primarily consist of salaries, benefits and stock-based compensation associated with our implementation personnel. These costs are expensed as incurred when the services are performed. We also allocate a portion of overhead to professional services cost of revenues.
Operating Expenses
Sales and marketing. Sales and marketing expenses consist primarily of personnel costs of our sales and marketing employees, including salaries, sales commissions and incentives, benefits and stock-based compensation expense, travel and related costs, commissions paid in connection with our strategic relationships, outside consulting fees, marketing programs, including lead generation, costs of our annual conference, advertising, and trade shows, other event expenses, and allocated overhead costs. We defer sales and partner commissions and amortize them ratably over the term of the corresponding subscription agreement. Sales and marketing expenses also include amortization of customer relationship intangible assets. We expect sales and marketing expenses will increase as we expand our direct sales teams and increase sales through our strategic relationships and resellers.
50
Research and development. Research and development expenses consist primarily of salaries, benefits and stock-based compensation associated with our engineering, product and quality assurance personnel and allocated overhead costs. Research and development expenses also include the cost of third-party contractors. Other than internal-use software development costs that qualify for capitalization, research and development costs are expensed as incurred. We expect research and development costs to increase as we develop new solutions and make improvements to our existing platform.
General and administrative. General and administrative expenses consist primarily of salaries, benefits and stock-based compensation associated with our executive, finance, legal, human resources, compliance, and other administrative personnel, accounting, auditing and legal professional services fees, recruitment costs, other corporate-related expenses, and allocated overhead costs. General and administrative expenses also include amortization of covenant not to compete and tradename intangible assets, as well as acquisition-related costs to business combinations and the change in fair value of contingent consideration. We expect that general and administrative expenses will increase as we incur the costs of compliance associated with being a publicly-traded company, including legal, audit and consulting fees.
Interest Income (Expense)
Interest income (expense), net consists primarily of interest expense from borrowings under our credit facility and amortization of debt discounts and issuance costs. We repaid in full all outstanding debt and terminated our credit facility in November 2016. In connection with the termination of our credit facility, we expensed the then-unamortized debt discounts and issuance costs.
Change in Fair Value of Common Stock Warrant Liability
We issued warrants to purchase common stock in connection with our credit facility. The warrants are measured at fair value each period, with changes in fair value recorded in our consolidated statement of operations. The warrants will continue to be measured at fair value each period until the earlier of their exercise or termination. Increases in the fair value of our common stock will result in an increase in the fair value of our common stock warrant liability and a corresponding increase in our net loss.
Benefit from Income Taxes
We are subject to federal and state income taxes in the United States and taxes in foreign jurisdictions. As of December 31, 2016, we were in a net deferred tax liability position primarily as a result of intangible assets acquired in the Runbook Acquisition. This deferred tax liability and the deferred tax liabilities previously recorded as a result of the 2013 Acquisition have been an available source of income to realize our losses in foreign and U.S. jurisdictions and accordingly, we have recorded an income tax benefit in our statement of operations.
We record a valuation allowance against our deferred tax assets to the extent that realization of the deferred tax assets, including consideration of our deferred tax liabilities, is not more likely than not. For the year ended December 31, 2016, for both federal and state income taxes, our deferred assets exceeded our deferred tax liabilities and because of our recent history of operating losses we believe that the realization of the deferred tax assets is currently not more likely than not. Accordingly, we have recorded a valuation allowance against our federal and state deferred tax assets. Taxes for international operations are not material for the years ended December 31, 2016, 2015 and 2014.
Our effective tax rate for the periods presented differs from the U.S. federal tax rate of 34% due primarily to the valuation allowance on our federal and state net deferred tax assets, expenses not deductible for income tax purposes including the change in fair value of common stock warrants, state taxes, acquisition related costs, and other tax credits.
51
In addition to our results determined in accordance with GAAP, we believe the non-GAAP measures below are useful to us and our investors in evaluating our business. These non-GAAP financial measures are useful because they provide consistency and comparability with our past performance, facilitate period-to-period comparisons of operations and facilitate comparisons with other peer companies, many of which use similar non-GAAP financial measures to supplement their GAAP results.
|
|
|
Year Ended |
|
|||||||||
|
|
|
December 31, |
|
|||||||||
|
|
|
2016 |
|
|
2015 |
|
|
2014 |
|
|||
|
|
|
(in thousands, except percentages) |
|
|||||||||
|
Non-GAAP Revenues |
|
$ |
123,839 |
|
|
$ |
83,607 |
|
|
$ |
56,629 |
|
|
Non-GAAP Gross Profit |
|
$ |
100,711 |
|
|
$ |
67,483 |
|
|
$ |
46,419 |
|
|
Non-GAAP Gross Margin |
|
|
81.3 |
% |
|
|
80.7 |
% |
|
|
82.0 |
% |
|
Non-GAAP Net Loss |
|
$ |
(16,478 |
) |
|
$ |
(20,114 |
) |
|
$ |
(2,550 |
) |
Non-GAAP Revenues. Non-GAAP revenues are defined as GAAP revenues adjusted for the impact of purchase accounting resulting from the 2013 Acquisition and the Runbook Acquisition. Upon the completion of the 2013 Acquisition and the Runbook Acquisition, deferred revenue was recorded at fair value, resulting in a reduction from its then carrying value. The reduction associated with the 2013 Acquisition resulted in reduced revenue for the year ended December 31, 2014 and the reduction associated with the Runbook Acquisition resulted in reduced revenue for the year ended December 31, 2016. We believe that presenting non-GAAP revenues is useful to investors as it eliminates the impact of the purchase accounting adjustment to revenues to allow for a direct comparison of revenues between periods.
Non-GAAP Gross Profit and Non-GAAP Gross Margin. Non-GAAP gross profit is defined as non-GAAP revenues less GAAP cost of revenue adjusted for the impact of purchase accounting resulting from the 2013 Acquisition and the Runbook Acquisition, the amortization of acquired developed technology resulting from the 2013 Acquisition and the Runbook Acquisition, and stock-based compensation. Non-GAAP gross margin is defined as non-GAAP gross profit divided by non-GAAP revenues. We believe that presenting non-GAAP gross margin is useful to investors as it eliminates the impact of certain non-cash expenses and allows a direct comparison of gross margin between periods.
Non-GAAP Net Loss. Non-GAAP net loss is defined as GAAP net loss adjusted for the impact of the benefit from income taxes that we were able to recognize as a result of the deferred tax liabilities associated with the intangible assets established upon the 2013 Acquisition and the Runbook Acquisition, the impact of purchase accounting to revenues resulting from the 2013 Acquisition and the Runbook Acquisition, amortization of acquired intangible assets resulting from the 2013 Acquisition and the Runbook Acquisition, stock-based compensation, accretion and write-off of debt discount pertaining to our credit facility, accretion and write-off of warrant discount relating to warrants issued in connection with our credit facility, the change in the fair value of contingent consideration, the change in fair value of the common stock warrant liability and acquisition-related costs for the Runbook Acquisition. We believe that presenting non-GAAP net loss is useful to investors as it eliminates the impact of items that have been impacted by the 2013 Acquisition and the Runbook Acquisition, purchase accounting and other related costs in order to allow a direct comparison of net loss between current and future periods.
52
Reconciliation of Non-GAAP Financial Measures
The following table presents a reconciliation of revenues, gross profit, gross margin, and net loss, the most comparable GAAP measures, to non-GAAP revenues, non-GAAP gross profit, non-GAAP gross margin and non-GAAP net loss:
|
|
|
Year Ended |
|
|||||||||
|
|
|
December 31, |
|
|||||||||
|
|
|
2016 |
|
|
2015 |
|
|
2014 |
|
|||
|
|
|
(in thousands, except percentages) |
|
|||||||||
|
Non-GAAP Revenues |
|
|
|
|
|
|
|
|
|
|
|
|
|
Revenues |
|
$ |
123,123 |
|
|
$ |
83,607 |
|
|
$ |
51,677 |
|
|
Purchase accounting adjustment to revenues |
|
|
716 |
|
|
|
— |
|
|
|
4,952 |
|
|
Total Non-GAAP Revenues |
|
$ |
123,839 |
|
|
$ |
83,607 |
|
|
$ |
56,629 |
|
|
Non-GAAP Gross Profit: |
|
|
|
|
|
|
|
|
|
|
|
|
|
Gross profit |
|
$ |
92,912 |
|
|
$ |
60,878 |
|
|
$ |
35,079 |
|
|
Purchase accounting adjustment to revenues |
|
|
716 |
|
|
|
— |
|
|
|
4,952 |
|
|
Amortization of developed technology |
|
|
6,368 |
|
|
|
6,139 |
|
|
|
6,139 |
|
|
Stock-based compensation expense |
|
|
715 |
|
|
|
466 |
|
|
|
249 |
|
|
Total Non-GAAP Gross Profit |
|
$ |
100,711 |
|
|
$ |
67,483 |
|
|
$ |
46,419 |
|
|
Gross Margin |
|
|
75.5 |
% |
|
|
72.8 |
% |
|
|
67.9 |
% |
|
Non-GAAP Gross Margin |
|
|
81.3 |
% |
|
|
80.7 |
% |
|
|
82.0 |
% |
|
Non-GAAP Net Loss: |
|
|
|
|
|
|
|
|
|
|
|
|
|
Net Loss |
|
$ |
(39,159 |
) |
|
$ |
(24,734 |
) |
|
$ |
(16,752 |
) |
|
Benefit from income taxes |
|
|
(6,956 |
) |
|
|
(13,934 |
) |
|
|
(8,282 |
) |
|
Purchase accounting adjustment to revenues |
|
|
716 |
|
|
|
— |
|
|
|
4,952 |
|
|
Amortization of intangibles |
|
|
12,505 |
|
|
|
12,092 |
|
|
|
12,092 |
|
|
Stock-based compensation expense |
|
|
6,526 |
|
|
|
5,497 |
|
|
|
2,017 |
|
|
Accretion and write-off of debt discount |
|
|
1,303 |
|
|
|
228 |
|
|
|
228 |
|
|
Accretion and write-off of warrant discount |
|
|
754 |
|
|
|
276 |
|
|
|
276 |
|
|
Change in fair value of contingent consideration |
|
|
371 |
|
|
|
41 |
|
|
|
(781 |
) |
|
Change in fair value of the common stock warrant liability |
|
|
5,880 |
|
|
|
420 |
|
|
|
3,700 |
|
|
Acquisition related costs |
|
|
1,582 |
|
|
|
— |
|
|
|
— |
|
|
Total Non-GAAP Net Loss |
|
$ |
(16,478 |
) |
|
$ |
(20,114 |
) |
|
$ |
(2,550 |
) |
Results of Operations
We accounted for the 2013 Acquisition and the Runbook Acquisition as business combinations. The 2013 Acquisition and the Runbook Acquisition resulted in the following principal impacts on our consolidated financial statements:
|
|
• |
A reduction in revenues for the year ended December 31, 2014 as a result of the deferred revenue at the 2013 Acquisition date being recorded at fair value at an amount less than its then carrying value; |
|
|
• |
Increased amortization costs resulting from recording of intangible assets at fair value. We record amortization of acquired developed technology in cost of revenues, amortization of customer relationships in sales and marketing expenses, and amortization of covenants not to compete and tradename intangible assets in general and administrative expenses; |
|
|
• |
Shortly after the 2013 Acquisition, we issued debt, which increased our interest expense for the periods post-2013 Acquisition. We financed the purchase of the Runbook Acquisition through a term loan which increased our interest expense for the period through the termination of the credit facility. In November 2016, we repaid our credit facility in full with the proceeds from our initial public offering. |
|
|
• |
Increased operating costs in 2016 as a result of the employees and contractors assumed in the Runbook Acquisition. |
53
Comparison of Years Ended December 31, 2016, 2015 and 2014
Total revenues
|
|
|
Year Ended |
|
|||||||||
|
|
|
December 31, |
|
|||||||||
|
|
|
2016 |
|
|
2015 |
|
|
2014 |
|
|||
|
|
|
(in thousands) |
|
|||||||||
|
Subscription and support |
|
$ |
117,524 |
|
|
$ |
80,080 |
|
|
$ |
49,029 |
|
|
Professional services |
|
|
5,599 |
|
|
|
3,527 |
|
|
|
2,648 |
|
|
Total revenues |
|
|
123,123 |
|
|
|
83,607 |
|
|
|
51,677 |
|
|
|
|
Year Ended |
|
|||||||||
|
|
|
December 31, |
|
|||||||||
|
|
|
2016 |
|
|
2015 |
|
|
2014 |
|
|||
|
Number of customers (as of end of period)* |
|
|
1,758 |
|
|
|
1,338 |
|
|
|
987 |
|
|
Number of users (as of end of period)* |
|
|
166,903 |
|
|
|
128,726 |
|
|
|
93,665 |
|
|
* |
Exclusive of the Runbook Acquisition |
Total revenues increased by $39.5 million, or 47.3%, and $31.9 million, or 61.8%, for the years ended December 31, 2016 and 2015, respectively, as compared to the corresponding 2015 and 2014 periods, respectively, primarily due to an increase in the number of customers, an increase in the number of users added by existing customers and an increase in the number of products purchased by existing customers. The total number of customers increased by 31.4% and 35.6% during the years ended December 31, 2016 and 2015, respectively. The total number of users increased by 29.7% and 37.4% during the years ended December 31, 2016 and 2015, respectively.
The increase in total revenues from the year ended December 31, 2014 to December 31, 2015 was also impacted by purchase accounting. In connection with the 2013 Acquisition, deferred revenue was recorded at fair value, resulting in a reduction from its then-carrying value. This reduction resulted in reduced revenue in the 2014 period by $5.0 million. There was no corresponding reduction in the 2015 period. Excluding the impact of this purchase accounting adjustment, our total revenue increased by 47.6% for the year ended December 31, 2015 as compared to 2014.
Total cost of revenues
|
|
|
Year Ended |
|
|||||||||
|
|
|
December 31, |
|
|||||||||
|
|
|
2016 |
|
|
2015 |
|
|
2014 |
|
|||
|
|
|
(in thousands, except percentages) |
|
|||||||||
|
Subscription and support |
|
$ |
25,900 |
|
|
$ |
19,773 |
|
|
$ |
14,380 |
|
|
Professional services |
|
|
4,311 |
|
|
|
2,956 |
|
|
|
2,218 |
|
|
Total cost of revenues |
|
|
30,211 |
|
|
|
22,729 |
|
|
|
16,598 |
|
|
Gross Margin |
|
|
75.5 |
% |
|
|
72.8 |
% |
|
|
67.9 |
% |
Total cost of revenues increased by $7.5 million, or 32.9%, in 2016 as compared to 2015, primarily due to a $5.6 million increase in salaries, benefits and stock-based compensation and a $0.8 million increase in amortization of capitalized software costs. Salaries, benefits and stock-based compensation increased primarily due to growth in headcount, which increased by 45% between December 31, 2015 and 2016. Amortization of our capitalized software development costs increased due to larger total capitalized costs as we expanded the functionality of our solutions.
Total cost of revenues increased by $6.1 million, or 36.9%, in 2015 as compared to 2014, primarily due to a $4.0 million increase in salaries, benefits and stock-based compensation, a $1.1 million increase in data center costs and a $0.6 million increase in amortization of capitalized software costs. Salaries, benefits and stock-based compensation increased primarily due to growth in headcount, which increased by 69% between December 31, 2014 and 2015. Costs associated with our datacenter increased due to costs of additional bandwidth associated with the growth in our customer base. Amortization of our capitalized software development costs increased due to larger total capitalized costs as we expanded the functionality of our solutions.
54
Our gross margin was 75.5%, 72.8% and 67.9% for the years ended December 31, 2016, 2015 and 2014, respectively. The improvement in gross margin in 2016 compared to 2015 was primarily the result of amortization of developed technology associated with the 2013 Acquisition and included in our cost of revenues, which is a fixed cost each period. Accordingly, an increase in revenues resulted in an improvement in our gross margin. The improvement in gross margin was partially offset by the amortization expense of acquired developed technology associated with the Runbook Acquisition in August 2016.
The improvement in gross margin in 2015 compared to 2014 was primarily the result of the impact of purchasing accounting adjustments, which reduced revenue in the 2014 period with no corresponding adjustments in 2015. In addition, the increase in gross margin in 2015 compared to 2014 was impacted by the amortization of developed technology included in our cost of revenues, which is a fixed cost each period.
Sales and marketing
|
|
|
Year Ended |
|
|||||||||
|
|
|
December 31, |
|
|||||||||
|
|
|
2016 |
|
|
2015 |
|
|
2014 |
|
|||
|
|
|
(in thousands, except percentages) |
|
|||||||||
|
Sales and marketing |
|
$ |
77,810 |
|
|
$ |
56,546 |
|
|
$ |
31,837 |
|
|
Percentage of total revenues |
|
|
63.2 |
% |
|
|
67.6 |
% |
|
|
61.6 |
% |
Sales and marketing expenses increased by $21.3 million, or 37.6%, for the year ended December 31, 2016 primarily due to a $12.2 million increase in salaries, sales commissions and incentives and stock-based compensation, a $3.0 million increase in commissions expense for third parties that refer customers to us, a $1.1 million increase in travel and related costs, a $1.1 million increase in advertising and trade shows, and a $0.7 million increase in outside consulting fees. The increase in salaries, sales commissions and incentives and stock-based compensation was primarily driven by an increase in headcount and revenue growth. Our sales and marketing headcount increased by 31% between December 31, 2015 and 2016. The increase in commissions payable to third parties was primarily driven by revenue growth associated with our relationship with SAP as an endorsed business solution. The increase in advertising and trade shows was primarily due to an increase in our marketing efforts. The increase in consulting fees was primarily due to an increase in digital marketing services.
Sales and marketing expenses increased by $24.7 million, or 77.6%, for the year ended December 31, 2015 primarily due to a $16.4 million increase in salaries, sales commissions and incentives and stock-based compensation, a $2.4 million increase in commissions payable to third parties that refer customers to us, a $1.6 million increase in travel and related costs, a $1.0 million increase in advertising and trade shows, and a $0.9 million increase in outside consulting fees. The increase in salaries, sales commissions and incentives and stock-based compensation was primarily driven by an increase in headcount and revenue growth. Our sales and marketing headcount increased by 59% between December 31, 2014 and 2015. The increase in commissions payable to third parties was primarily driven by the expansion of our relationships with technology vendors, including SAP. The increase in advertising and trade shows was primarily due to an increase in our marketing efforts. The increase in outside consulting fees was primarily due to an increase in digital marketing services.
Research and development
|
|
|
Year Ended |
|
|||||||||
|
|
|
December 31, |
|
|||||||||
|
|
|
2016 |
|
|
2015 |
|
|
2014 |
|
|||
|
|
|
(in thousands, except percentages) |
|
|||||||||
|
Research and development |
|
$ |
21,125 |
|
|
$ |
18,216 |
|
|
$ |
9,705 |
|
|
Percentage of total revenues |
|
|
17.2 |
% |
|
|
21.8 |
% |
|
|
18.8 |
% |
Research and development expenses increased by $2.9 million, or 16.0%, for the year ended December 31, 2016 primarily due to a $2.5 million increase in salaries, benefits and stock-based compensation due to an increase in headcount and a $1.2 million increase in services provided by third-party contractors. These increases were partially offset by an increase in capitalized costs related to software development of $1.1 million. Our research and development headcount increased by 38% between December 31, 2015 and 2016. Costs of third-party contractors increased by 27% between 2015 and 2016. The additional headcount and number of third-party contractors were used to further maintain, enhance and develop our platform.
55
Research and development expenses increased by $8.5 million, or 87.7%, for the year ended December 31, 2015 primarily due to a $5.5 million increase in salaries, benefits and stock-based compensation due to an increase in headcount and a $3.2 million increase in services provided by third-party contractors. These increases were partially offset by an increase in capitalized costs related to software development of $0.7 million. Our research and development headcount increased by 32% between December 31, 2014 and 2015. Costs of third-party contractors increased by 238% between 2014 and 2015. The additional headcount and number of third-party contractors were used to further maintain, enhance and develop our platform.
General and administrative
|
|
|
Year Ended |
|
|||||||||
|
|
|
December 31, |
|
|||||||||
|
|
|
2016 |
|
|
2015 |
|
|
2014 |
|
|||
|
|
|
(in thousands, except percentages) |
|
|||||||||
|
General and administrative |
|
$ |
27,911 |
|
|
$ |
20,928 |
|
|
$ |
11,716 |
|
|
Percentage of total revenues |
|
|
22.7 |
% |
|
|
25.0 |
% |
|
|
22.7 |
% |
General and administrative expenses increased by $7.0 million, or 33.4%, during the year ended December 31, 2016 primarily due to a $3.9 million increase in salaries, benefits and stock-based compensation due to an increase in headcount of 30% between December 31, 2015 and 2016, a $0.9 million increase in computer software expenses, a $0.5 million increase in professional services costs due primarily to a $1.6 million increase in legal, accounting and auditing fees related to the Runbook Acquisition largely offset by a reduction of $1.1 million in initial public offering readiness fees and recruitment costs, and a $0.4 million increase in foreign exchange transaction losses due to the strengthening of the U.S. Dollar. In addition, our general and administrative costs in 2016 increased by $0.3 million relating to the change in fair value of contingent consideration. There was no significant change in contingent consideration during 2015.
General and administrative expenses increased by $9.2 million, or 78.6%, during the year ended December 31, 2015 primarily due to a $4.0 million increase in salaries, benefits and stock-based compensation due to an increase in headcount of 72% between December 31, 2014 and 2015 and stock option grants to new executive officers and other employees, a $2.8 million increase in professional services costs due to legal, accounting and auditing fees as we prepared for our initial public offering, additional recruitment costs, and a $0.5 million increase in facility-related expenses related to the expansion of our global headquarters. In addition, our general and administrative costs in 2014 were reduced by $0.8 million relating to the change in fair value of contingent consideration. There was no significant change in contingent consideration during 2015.
Interest expense, net
|
|
|
Year Ended |
|
|||||||||
|
|
|
December 31, |
|
|||||||||
|
|
|
2016 |
|
|
2015 |
|
|
2014 |
|
|||
|
|
|
(in thousands) |
|
|||||||||
|
Interest expense, net |
|
$ |
(5,932 |
) |
|
$ |
(3,215 |
) |
|
$ |
(3,047 |
) |
Interest expense, net increased by $2.7 million, or 84.5%, during the year ended December 31, 2016 primarily due to a $1.6 million increase in the accretion and write-off of debt issuance costs associated with borrowings under our credit facility, a $0.7 million prepayment penalty for early termination of our credit facility, and a $0.6 million increase in interest expense primarily due to a $30.0 million term loan under our credit facility issued to fund the Runbook Acquisition in August 2016. These increases were offset by a $0.2 million increase in interest income earned in 2016.
Interest expense, net increased by $0.2 million, or 5.5%, during the year ended December 31, 2015 due to an increase in interest expense on a larger long-term debt principal balance. During the year ended December 31, 2015, we paid between 20% and 30% of our interest costs in cash and the remainder increased the principal balance.
56
Change in fair value of common stock warrant liability
|
|
|
Year Ended |
|
|||||||||
|
|
|
December 31, |
|
|||||||||
|
|
|
2016 |
|
|
2015 |
|
|
2014 |
|
|||
|
|
|
(in thousands) |
|
|||||||||
|
Change in fair value of common stock warrant liability |
|
$ |
(5,880 |
) |
|
$ |
(420 |
) |
|
$ |
(3,700 |
) |
We value our common stock warrants using a binomial lattice model. The primary input into the binomial lattice model is the fair value of our common stock. The fair value of our common stock increased by approximately 84% between December 31, 2015 and December 31, 2016, resulting in a $5.9 million, or 107%, increase in our common stock warrant liability.
The fair value of our common stock did not significantly change between December 31, 2014 and December 31, 2015.
Benefit from income taxes
|
|
|
Year Ended |
|
|||||||||
|
|
|
December 31, |
|
|||||||||
|
|
|
2016 |
|
|
2015 |
|
|
2014 |
|
|||
|
|
|
(in thousands) |
|
|||||||||
|
Benefit from income taxes |
|
$ |
(6,587 |
) |
|
$ |
(13,713 |
) |
|
$ |
(8,174 |
) |
Our effective tax rate was 14.4% in 2016, 35.7% in 2015, and 32.8% in 2014. The effective tax rate differs from the U.S. federal statutory rate of 34% in 2016 primarily because of our full valuation allowance on our federal and state deferred tax assets, expenses not deductible for income tax purposes including the change in fair value of common stock warrants, state taxes net of federal benefit, acquisition-related costs, and other tax credits. We record a valuation allowance against our deferred tax assets to the extent that realization of the deferred tax assets, including consideration of our deferred tax liabilities, is not more likely than not. For 2016, our federal and state deferred tax assets exceeded our deferred tax liabilities and given our cumulative losses, we believe that it is not more likely than not that these deferred tax assets will be realized. Accordingly, we recorded a valuation allowance on our net deferred tax assets. In 2015, we recorded a valuation allowance on our State of California deferred tax assets as these deferred tax assets exceeded our State of California deferred tax liabilities. Taxes for our international operations were not material in 2016, 2015 and 2014.
Liquidity and Capital Resources
At December 31, 2016, our principal sources of liquidity were $105.2 million of cash and cash equivalents and marketable securities, which primarily consist of short-term, investment-grade commercial paper, corporate bonds, U.S. treasury bonds, and asset-backed securities. We believe our existing cash and cash equivalents, investments in marketable securities and cash from operations will be sufficient to meet our working capital needs, capital expenditures and financing obligations for at least the next 12 months.
Our future capital requirements will depend on many factors, including our growth rate, the expansion of our direct sales force, strategic relationships and international operations, the timing and extent of spending to support research and development efforts, and the continuing market acceptance of our solutions. We may require additional equity or debt financing. Sales of additional equity could result in dilution to our stockholders. If we raise funds by borrowing from third parties, the terms of those financing arrangements would require us to incur additional interest expense and may include negative covenants or other restrictions on our business that could impair our operating flexibility. We can provide no assurance that additional financing will be available at all or, if available, that we could be able to obtain financing on terms favorable to us. If we are unable to raise additional capital when needed, we would be required to curtail our operating activities and capital expenditures, and our business, operating results and financial condition would be adversely affected.
57
The following table sets forth a summary of our cash flows for the periods indicated:
|
|
|
Year Ended |
|
|||||||||
|
|
|
December 31, |
|
|||||||||
|
|
|
2016 |
|
|
2015 |
|
|
2014 |
|
|||
|
|
|
(in thousands) |
|
|||||||||
|
Net cash provided by (used in) operating activities |
|
$ |
(4,808 |
) |
|
$ |
1,006 |
|
|
$ |
8,943 |
|
|
Net cash used in investing activities |
|
|
(119,674 |
) |
|
|
(12,367 |
) |
|
|
(2,866 |
) |
|
Net cash provided by financing activities |
|
|
131,395 |
|
|
|
859 |
|
|
|
4,775 |
|
Net Cash Provided by (Used In) Operating Activities
Our net loss and cash flows from operating activities are significantly influenced by our investments in headcount and infrastructure to support anticipated growth. In addition, our net loss in recent periods has generally been significantly greater than our use of cash for operating activities due to our subscription-based revenue model in which billings occur in advance of revenue recognition and a substantial amount of non-cash charges incurred by us, primarily related to the depreciation and amortization, stock-based compensation, non-cash interest expense related to the accretion and write-off of debt discounts and paid in kind interest, and deferred taxes.
For the year ended December 31, 2016, cash used in operations was $4.8 million, resulting from our net loss of $39.2 million and a $6.4 million payment for paid-in-kind interest, largely offset by net cash flows provided through changes in net non-cash expenses of $27.3 million and changes in our operating assets and liabilities of $13.4 million. The $13.4 million of net cash flows provided as a result of changes in our operating assets and liabilities reflected a $29.5 million increase in deferred revenue as a result of the growth of our customer and user base, which are billed in advance of our revenue recognition, a $3.9 million increase in accrued expenses primarily associated with increases in employee-related accruals as a result of increases in headcount and bonuses, and a $3.5 million increase in accounts payable associated with the growth of the business. The changes in our operating assets and liabilities were partially offset by a $15.5 million increase in accounts receivable due to the growth of our customer and user base, a $3.4 million increase in deferred sales commissions due to an increase in revenue, a $3.1 million increase in prepaid expenses and other current assets due primarily to increases in prepaid software subscriptions and insurance recognized to expense over a period of one year or less, and a $1.2 million decrease in other long-term liabilities due primarily to amortization of leasehold improvement allowances and free rent periods associated with the expansion of our corporate headquarters.
For the year ended December 31, 2015, cash provided by operations was $1.0 million, resulting from our net loss of $24.7 million, largely offset by net cash flows provided through changes in our operating assets and liabilities of $16.4 million and net non-cash expenses of $9.4 million. The $16.4 million of net cash flows provided as a result of changes in our operating assets and liabilities reflected a $18.2 million increase in deferred revenue as a result of the growth of our customer and user base, which are billed in advance of our revenue recognition, a $6.8 million increase in accrued expenses primarily associated with increases in employee-related accruals as a result of increases in headcount and bonuses, and professional services costs, a $2.0 million increase in other long-term liabilities primarily related to deferred rent due to the leasehold improvement allowances and free rent periods associated with the expansion of our corporate headquarters, and a $1.1 million increase in accounts payable associated with the growth of our business. The changes in our operating assets and liabilities were partially offset by a $6.2 million increase in accounts receivable due to the growth of our customer and user base and a $4.3 million increase in deferred sales commissions due to an increase in revenues.
During the year ended December 31, 2014, cash provided by operations was $8.9 million resulting from our net loss of $16.8 million, largely offset by net cash flows provided through changes in our operating assets and liabilities of $13.0 million and non-cash expenses of $12.6 million. The $13.0 million of net cash flows provided as a result of changes in our operating assets and liabilities reflected a $17.2 million increase in deferred revenue as a result of the growth of our customer and user base which are billed in advance of our revenue recognition, a $3.2 million increase in accrued expenses primarily associated with increases in employee-related accruals as a result of increases in headcount, and a $1.0 million increase in deferred rent due to the leasehold improvement allowances and free rent periods associated with the expansion of our corporate headquarters. The changes in our operating assets and liabilities were partially offset by a $6.8 million increase in accounts receivable due to the growth of our customer and user base, a $1.3 million increase in deferred sales commissions due to an increase in commissionable revenues and a $1.1 million increase in prepaid expenses and other current assets associated with the growth of our business.
58
Net Cash Used In Investing Activities
Our primary investing activities have consisted of capital expenditures for property and equipment and capitalized software development costs. In August 2016, we completed our Runbook Acquisition. In November 2016, we completed our initial public offering and used a portion of the proceeds to invest in marketable securities.
For the year ended December 31, 2016, we used $119.7 million in cash as a result of $83.2 million of investments in marketable securities, which are primarily comprised of U.S. Treasury and corporate bonds, the Runbook Acquisition, with a total purchase price of $34.1 million, subject to a final working capital adjustment, offset by cash acquired in the amount of $2.6 million, $3.3 million in capitalized software development costs and $1.7 million of purchases of property and equipment.
For the year ended December 31, 2015, we used $12.4 million in cash primarily as a result of $10.1 million in purchases of property and equipment of which $7.1 million related to the expansion of our global headquarters. During 2015, we also paid $2.3 million of costs related to capitalized software development activities.
For the year ended December 31, 2014, we used $2.9 million in cash as a result of $1.4 million in capitalized software development costs and $1.4 million of purchases of property and equipment, of which $0.8 million related to the expansion of our global headquarters.
Net Cash Provided By Financing Activities
For the year ended December 31, 2016, financing activities provided $131.4 million in cash primarily as a result of the successful completion of our initial public offering, which resulted in proceeds of $151.9 million, net of underwriting discounts and commissions and other offering expenses, including $4.4 million in cash paid for deferred offering costs. During the year, we also received $34.3 million in proceeds under our credit facility, $3.1 million in proceeds from our issuance of common stock to former employees of Runbook Company B.V. and $2.9 million in proceeds from exercise of stock options. The net cash provided by financing activities was largely offset by the termination of our credit facility in November 2016 and the associated repayment of term loans and prepayment penalties in the amount of $60.7 million.
For the year ended December 31, 2015, financing activities provided $0.9 million in cash primarily as a result of $1.4 million in proceeds from exercises of stock options. These proceeds were partially offset by $0.5 million in principal payments on capital lease obligations.
For the year ended December 31, 2014, financing activities provided $4.8 million in cash primarily as a result of our issuances of common stock.
Backlog
We enter into both single and multi-year subscription contracts for our solutions. The timing of our invoices to the customer is a negotiated term and thus varies among our subscription contracts. For multi-year agreements, it is common to invoice an initial amount at contract signing followed by subsequent annual invoices. At any point in the contract term, there can be amounts that we have not yet been contractually able to invoice. Until such time as these amounts are invoiced, they are not recorded in revenues, deferred revenue or elsewhere in our consolidated financial statements and are considered by us to be backlog. As of December 31, 2016 and 2015, we had backlog of approximately $78.7 million and $49.0 million, respectively. We expect backlog will change from period to period for several reasons, including the timing and duration of customer agreements, varying billing cycles of subscription agreements, and the timing and duration of customer renewals. Because revenue for any period is a function of revenue recognized from deferred revenue under contracts in existence at the beginning of the period, as well as contract renewals and new customer contracts during the period, backlog at the beginning of any period is not necessarily indicative of future revenue performance. We do not utilize backlog as a key management metric internally.
59
Contractual Obligations and Commitments
The following table summarizes our contractual obligations at December 31, 2016:
|
|
|
|
|
|
|
Payments Due by Period |
|
|||||||||||||
|
|
|
Total |
|
|
Less than 1 Year |
|
|
1-3 Years |
|
|
3-5 Years |
|
|
More than 5 Years |
|
|||||
|
Operating lease obligations (1) |
|
$ |
14,594 |
|
|
$ |
3,830 |
|
|
$ |
4,848 |
|
|
$ |
3,794 |
|
|
$ |
2,122 |
|
|
Purchase obligations |
|
|
1,307 |
|
|
|
1,223 |
|
|
|
84 |
|
|
|
— |
|
|
|
— |
|
|
Capital lease obligations |
|
|
992 |
|
|
|
992 |
|
|
|
— |
|
|
|
— |
|
|
|
— |
|
|
|
|
$ |
16,893 |
|
|
$ |
6,045 |
|
|
$ |
4,932 |
|
|
$ |
3,794 |
|
|
$ |
2,122 |
|
|
(1) |
Operating leases include total future minimum rent payments under non-cancelable operating lease agreements. |
We are required to pay up to a maximum of $8 million of contingent consideration relating to our 2013 Acquisition if we realize a tax benefit from the use of net operating losses generated from the stock option exercises concurrent with the 2013 Acquisition. We have not included this obligation in the table above, because there is a high degree of uncertainty regarding the amount and timing of future cash flows to extinguish this liability. The settlement of this liability depends on our ability to generate taxable income in the future to realize this tax benefit.
At December 31, 2016, liabilities for unrecognized tax benefits of $0.4 million are not included in the table above because, due to their nature, there is a high degree of uncertainty regarding the timing of future cash outflows and other events that extinguish these liabilities.
Off-Balance Sheet Arrangements
As part of our ongoing business, we do not have any relationships with other entities or financial partnerships, such as entities often referred to as structured finance or special purpose entities that have been established for the purpose of facilitating off-balance sheet arrangements or other contractually narrow or limited purposes. We are therefore not exposed to any financing, liquidity, market, or credit risk that could arise if we had engaged in those types of relationships.
In the ordinary course of business, we may provide indemnification of varying scope and terms to customers, vendors, investors, directors, and officers with respect to certain matters, including, but not limited to, losses arising out of our breach of such agreements, services to be provided by us, or from intellectual property infringement claims made by third parties. These indemnification provisions may survive termination of the underlying agreement and the maximum potential amount of future payments we could be required to make under these indemnification provisions may not be subject to maximum loss clauses. The maximum potential amount of future payments we could be required to make under these indemnification provisions is indeterminable. We have never paid a material claim, nor have we been sued in connection with these indemnification arrangements. As of December 31, 2016, we have not accrued a liability for these indemnification arrangements because the likelihood of incurring a payment obligation, if any, in connection with these indemnification arrangements is not probable or reasonably estimable.
Critical Accounting Policies and Estimates
Our financial statements and the related notes included elsewhere in this Annual Report on Form 10-K are prepared in accordance with generally accepted accounting principles, or GAAP, in the United States. The preparation of consolidated financial statements in conformity with GAAP requires management to make estimates and assumptions that affect the reported amounts of assets and liabilities and the disclosure of contingent assets and liabilities at the dates of the consolidated financial statements, and the reported amounts of revenues and expenses during the reporting period. We evaluate our estimates and assumptions on an ongoing basis. Our estimates are based on historical experience and various other assumptions that we believe to be reasonable under the circumstances. Our actual results could differ from these estimates.
We believe that the following critical accounting policies involve a greater degree of judgment or complexity than our other accounting policies. Accordingly, these are the policies we believe are the most critical to a full understanding and evaluation of our consolidated financial condition and results of operations. See “Significant Accounting Policies” in Note 2 of the accompanying notes to our consolidated financial statements for additional information.
60
Revenue Recognition and Deferred Revenue
Subscription and support revenue—Customers pay subscription fees for access to our SaaS platform generally for a one-year period. In more limited cases, customers may pay for up to three years in advance. Fees are based on a number of factors, including the solutions subscribed for by the customer and the number of users having access to the solutions. The first year subscription fees are typically payable within 30 days after the execution of the arrangement, and thereafter upon renewal. We initially record the subscription fees as deferred revenue and recognize revenue on a straight-line basis over the term of the agreement. At any time during the subscription period, customers may increase the number of their users or subscribe for additional products. Additional user fees and additional product subscriptions are payable for the remainder of the initial or extended contract term. Subscription and support revenue also includes software revenue related to maintenance and support fees on legacy BlackLine solutions and software license and maintenance revenue on Runbook software sales.
Professional services—We offer customers assistance in implementing our solutions and optimizing their use. Professional services include training and consulting. These services are billed on either a fixed fee or time and material basis. Revenues from time and material arrangements are recognized as services are performed and revenues from fixed fee arrangements are initially recorded as deferred revenue and recognized on a proportional performance basis as the services are performed.
We recognize revenues when: (i) persuasive evidence of an arrangement for the sale of our solutions or implementation and consulting services exists, (ii) the solutions have been made available or delivered, or services have been performed, (iii) the sales price is fixed or determinable, and (iv) collectability is reasonably assured. The timing and amount we recognize as revenue is determined based on the facts and circumstances of each customer’s arrangement. Evidence of an arrangement consists of a signed customer agreement. We consider that delivery of a solution has commenced once we provide the customer with log-in information to access and use the solution. Fees are fixed based on stated rates specified in the customer agreement. We assess collectability based on a number of factors, including the creditworthiness of the customer, review of their financial information or transaction history. If collectability is not considered reasonably assured, revenue is deferred until the fees are collected.
The majority of customer arrangements include multiple deliverables such as subscriptions to our SaaS solutions and professional services. We recognize revenue in accordance with the guidance for arrangements with multiple deliverables under Accounting Standards Update, or ASU, 2009-13 – Revenue Recognition (Topic 605) – Multiple-Deliverable Revenue Arrangements – a Consensus of the Emerging Issues Task Force or ASU 2009-13. For subscription agreements, as customers do not have the right to the software code underlying our solutions, subscription revenue arrangements are outside the scope of software revenue recognition guidance as defined by ASC Topic 985-605, Software. Our agreements do not contain any refund provisions other than in the event of our non-performance or breach.
For multiple-deliverable revenue arrangements, we first assess whether each deliverable has value to the customer on a standalone basis. We have determined that the SaaS solutions have standalone value, because, once access is given to the customer, the solutions are fully functional and do not require any additional development, modification, or customization. Professional services have standalone value, because third-party partners and customers themselves can perform these services without our involvement. The performance of these professional services generally does not require highly specialized or technologically skilled individuals and the professional services are not essential to the functionality of the solutions.
We allocate revenue among the separate non-contingent deliverables in an arrangement under the relative selling price method using the selling price hierarchy established in ASU 2009-13. This hierarchy requires the selling price of each deliverable in a multiple deliverable arrangement to be based on, in descending order: (i) vendor-specific objective evidence of fair value, or VSOE, (ii) third-party evidence of fair value, or TPE, or (iii) management’s best estimate of the selling price, or BESP.
We are not able to determine VSOE or TPE for our deliverables, because the deliverables are typically bundled and infrequently sold separately within a consistent price range. Additionally, management has determined that there are no third-party offerings reasonably comparable to our solutions. Therefore, the selling prices of subscriptions to the SaaS solutions and professional services are based on BESP. The determination of BESP requires us to make significant estimates and judgments. We consider numerous factors, including the nature of the deliverables themselves, geography, customer size and number of users, and discounting practices. The determination of BESP is made through consultation with senior management. We update our estimates of BESP on an ongoing basis as events and as circumstances may require. As our marketing strategies evolve, we may modify its pricing practices in the future, which could result in changes in relative selling prices and BESP.
61
In addition to our direct sales and marketing efforts, we have strategic relationships with business process outsourcers, or BPOs, and resellers. The BPOs and resellers place orders with us after receiving an order from an end customer. The BPOs and resellers receive business terms of sale similar to those received by our direct customers, and payment to us is not contingent on the receipt of payment from the end customer. The BPOs and resellers negotiate pricing with the end customer and are responsible for implementation services, if any, and for certain support levels directly with the end customer. We recognize revenue over the term of the arrangement for the contractual amount charged to the BPO or reseller, once access to our solution has been provided to the end customer provided that the other revenue recognition criteria noted above have been met.
Deferred Sales Commissions
Deferred sales commissions are the incremental costs that are directly associated with non-cancelable subscription contracts with customers and consist of sales commissions paid to our direct sales force and third-party partners. The commissions are deferred and amortized over the non-cancelable terms of the related customer contracts, which are typically one year in duration. The commission payments are paid in full the month after the customer’s service commences. The deferred commission amounts are recoverable through the future revenue streams under the non-cancelable customer contracts. We believe this is the preferable method of accounting as the sales commission charges are so closely related to the revenue from the non-cancelable customer contracts that they should be recorded as an asset and charged to expense over the same period that the subscription revenue is recognized. Amortization of deferred sales commissions is included in sales and marketing in our consolidated statements of operations.
Stock-based Compensation
We account for stock-based compensation awards granted to employees and directors based on the awards’ estimated grant date fair value. We estimate the fair value of our stock options using the Black-Scholes option-pricing model. For awards that vest solely based on continued service (“service-only vesting conditions”), the resulting fair value, net of estimated forfeitures, is recognized on a straight-line basis over the period during which an employee is required to provide service in exchange for the award, usually the vesting period, which is generally four years. We recognize the fair value of stock options which contain performance conditions based upon the probability of the performance conditions being met, net of estimated forfeitures, using the graded vesting method. Estimated forfeitures are based upon our historical experience and we revise our estimates, if necessary, in subsequent periods if actual forfeitures differ from initial estimates.
Determining the grant date fair value of options using the Black-Scholes option pricing model requires management to make assumptions and judgments. These estimates involve inherent uncertainties and if different assumptions had been used, stock-based compensation expense could have been materially different from the amounts recorded.
The assumptions and estimates are as follows:
|
|
• |
Value per share of our common stock. Prior to our initial public offering in October 2016, because there was no public market for our common stock, our management, with the assistance of a third-party valuation specialist, determined the fair value of our common stock at the time of the grant of stock options by considering a number of objective and subjective factors, including our actual operating and financial performance, market conditions and performance of comparable publicly-traded companies, developments and milestones in our company, the likelihood of achieving a liquidity event and transactions involving our common stock, among other factors. The fair value of the underlying common stock was determined by our board of directors through the date of the initial public offering. The fair value of our common stock was determined in accordance with applicable elements of the practice aid issued by the American Institute of Certified Public Accountants, Valuation of Privately Held Company Equity Securities Issued as Compensation. For awards granted subsequent to our initial public offering, the fair value of our common stock is based on the closing price of our common stock, as reported on the NASDAQ Global Select Market, on the date of grant. |
|
|
• |
Expected volatility. We determine the expected volatility based on historical average volatilities of similar publicly traded companies corresponding to the expected term of the awards. |
|
|
• |
Expected term. We determine the expected term of awards which contain service-only vesting conditions using the simplified approach, in which the expected term of an award is presumed to be the mid-point between the vesting date and the expiration date of the award. For awards granted which contain performance conditions, we estimate the expected term based on estimates of post-vesting employment termination behavior taking into account the life of the award. |
62
|
|
• |
Risk-free interest rate. The risk-free interest rate is based on the United States Treasury yield curve in effect during the period the options were granted corresponding to the expected term of the awards. |
|
|
• |
Estimated dividend yield. The estimated dividend yield is zero, as we do not currently intend to declare dividends in the foreseeable future. |
In October 2016, we granted options to purchase shares of common stock to two executive officers that vest upon meeting certain performance conditions and continued service. The performance conditions include meeting yearly cash flow targets and cumulative annual recurring revenue targets through 2019. If each yearly cash flow target is met through 2019, but the full cumulative annual recurring target through 2019 is not met, the executive officers are still able to vest in the award if an additional cash flow target for 2020 and a cumulative annual recurring revenue target through 2020 are achieved. The cash flow performance targets for each year are determined concurrently with the annual budget process and because each yearly target has not yet been set, no grant date for the options has been established. As of December 31, 2016, we determined that the achievement of the performance targets is not probable and accordingly, no stock-based compensation expense has been recorded for these awards. To the extent that the awards become probable of vesting prior to the grant date, the amount of compensation cost to be recognized will be based on the then fair value of the options. The fair value of the options will be remeasured each period until a grant date has been established. Accordingly, stock-based compensation cost, if any, to be recognized will depend on the value of the stock options when all performance conditions have been set and whether the performance conditions are probable of being achieved.
Capitalized Software Costs
We account for the costs of computer software obtained or developed for internal use in accordance with ASC 350, Intangibles—Goodwill and Other (“ASC 350”). We capitalize certain costs in the development of our SaaS subscription solutions when (i) the preliminary project stage is completed, (ii) management has authorized further funding for the completion of the project and (iii) it is probable that the project will be completed and performed as intended. These capitalized costs include personnel and related expenses for employees and costs of third-party contractors who are directly associated with and who devote time to internal-use software projects and, when material, interest costs incurred during the development. Capitalization of these costs ceases once the project is substantially complete and the software is ready for its intended purpose. Costs incurred for significant upgrades and enhancements to our SaaS software solutions are also capitalized. Costs incurred for post-configuration training, maintenance and minor modifications or enhancements are expensed as incurred. Capitalized software development costs are amortized using the straight-line method over an estimated useful life of three years.
Business Combinations
The results of businesses acquired in a business combination are included in our consolidated financial statements from the date of the acquisition. Purchase accounting results in assets and liabilities of an acquired business being recorded at their estimated fair values on the acquisition date. Any excess consideration over the fair value of assets acquired and liabilities assumed is recognized as goodwill.
We perform valuations of assets acquired and liabilities assumed and allocate the purchase price to its respective assets and liabilities. Determining the fair value of assets acquired and liabilities assumed requires our management to use significant judgment and estimates including the selection of valuation methodologies, estimates of future revenue, costs and cash flows, discount rates and selection of comparable companies. We engage the assistance of valuation specialists in concluding on fair value measurements in connection with determining fair values of assets acquired and liabilities assumed in a business combination.
The fair value of the deferred revenue at the date of acquisition is determined based on the estimated direct and incremental costs to fulfill the legal performance obligations associated with the deferred revenue, plus a reasonable profit margin. To the extent that the fair value of deferred revenue at the acquisition date is less than it’s then carrying value, the revenue in periods subsequent to the acquisition date is reduced until such time that the underlying revenue is recognized.
Contingent consideration payable in cash arising from business combinations is recorded as a liability and measured at fair value each period. Changes in fair value are recorded in general and administrative expenses in the consolidated statements of operations. Determining the fair value of the contingent consideration each period requires our management to make assumptions and judgments. These estimates involve inherent uncertainties and if different assumptions had been used, the fair value of contingent consideration could have been materially different from the
63
amounts recorded. We are required to pay up to a maximum of $8 million of contingent consideration relating to our 2013 Acquisition if we realize a tax benefit from the use of net operating losses generated from the stock option exercises concurrent with the 2013 Acquisition. We determine the fair value of contingent consideration by discounting estimated future taxable income. The significant inputs used in the fair value measurement of contingent consideration are the timing and amount of taxable income in any given period and determining an appropriate discount rate which considers the risk associated with the forecasted taxable income. Significant changes in the estimated future taxable income and the periods in which they are generated would significantly impact the fair value of the contingent consideration liability.
Income Taxes
We use the liability method of accounting for income taxes. Under the liability method, deferred taxes are determined based on the temporary differences between the financial statement and tax bases of assets and liabilities, using tax rates expected to be in effect during the years in which the bases differences are expected to reverse. A valuation allowance is recorded when it is more likely than not that some of the deferred tax assets will not be realized.
We have assessed our income tax positions and recorded tax benefits for all years subject to examination, based upon our evaluation of the facts, circumstances and information available at each period-end. For those tax positions where we have determined there is a greater than 50% likelihood that a tax benefit will be sustained, we have recorded the largest amount of tax benefit that may potentially be realized upon ultimate settlement with a taxing authority that has full knowledge of all relevant information. For those income tax positions where we have determined there is a less than 50% likelihood that a tax benefit will be sustained, no tax benefit has been recognized in our financial statements.
Fair Value of Common Stock Warrants
In September 2013, in connection with the $25 million term loan agreement, we issued warrants to purchase 499,999 shares of common stock at an exercise price per share of $5.00. The warrants are exercisable at any time by the holder and expire upon the earlier of ten years from the issuance date or the sale of our company.
These warrants are classified as a liability and are measured at fair value each period with changes in fair value recorded in our consolidated statement of operations. The warrants will continue to be measured at fair value each period until the earlier of exercise or termination.
Determining the fair value of the common stock warrants each period requires our management to make assumptions and judgments. These estimates involve inherent uncertainties and if different assumptions had been used, fair value of the common stock warrants could have been materially different from the amounts recorded. The fair value is determined using a binomial lattice valuation model. The significant inputs used in the fair value measurement of the common stock warrants are the estimated fair value of our common stock and to a lesser extent the expected stock volatility, the probability of a change in control and future stock issuances which impact the term of the warrants. Significant increases or decreases in the estimated fair value of our common stock would significantly impact the fair value of the warrant liability. The fair value of our common stock is based on a number of quantitative and qualitative factors as described in Stock-Based Compensation section above.
Recent Accounting Pronouncements
See Note 2, "Significant Accounting Policies—Recently Issued Accounting Standards,” of the Notes to Consolidated Financial Statements included in Part II, Item 8 of this Annual Report on Form 10-K for a description of recent accounting pronouncements, including the expected dates of adoption and estimated effects on our financial condition, results of operations and cash flows.
64
We have operations both within the United States and internationally, and we are exposed to market risks in the ordinary course of our business. These risks primarily include interest rate, foreign exchange and inflation risks, as well as risks relating to changes in the general economic conditions in the countries where we conduct business. To reduce these risks, we monitor the financial condition of our clients and limit credit exposure by collecting in advance and setting credit limits as we deem appropriate. In addition, our investment strategy has historically been to invest in financial instruments that are highly liquid and readily convertible into cash and that mature within three months from the date of purchase. To date, we have not used derivative instruments to mitigate the impact of our market risk exposures. We have also not used, nor do we intend to use, derivatives for trading or speculative purposes.
Interest Rate Risk
We are exposed to market risk related to changes in interest rates.
We had cash and cash equivalents and marketable securities of $105.2 million as of December 31, 2016. Our cash equivalents and marketable securities consist of highly liquid, investment-grade commercial paper, corporate bonds, U.S. treasury bonds, and asset-backed securities. The carrying amount of our cash equivalents and marketable securities reasonably approximates fair value due to the highly liquid nature of these instruments. The primary objectives of our investment activities are the preservation of capital, the fulfillment of liquidity needs and the fiduciary control of cash and investments. We do not enter into investments for trading or speculative purposes. Our investments are exposed to market risk due to fluctuations in interest rates, which may affect our interest income and the fair market value of our investments. Due to the short-term nature of our investment portfolio, however, we do not believe an immediate 10% increase or decrease in interest rates would have a material effect on the fair market value of our portfolio. We therefore do not expect our operating results or cash flows to be materially affected by a sudden change in market interest rates.
We do not believe our cash equivalents have significant risk of default or illiquidity. While we believe our cash equivalents do not contain excessive risk, we cannot provide absolute assurance that in the future our investments will not be subject to adverse changes in market value. In addition, we maintain significant amounts of cash and cash equivalents at one or more financial institutions that are in excess of federally insured limits. We cannot be assured that we will not experience losses on these deposits.
Foreign Currency Risk
We have foreign currency risks related to our revenue and operating expenses denominated in currencies other than the U.S. Dollar. Our historical revenues have primarily been denominated in U.S. Dollars, and a significant portion of our current revenues continue to be denominated in U.S. Dollars. However, we expect an increasing portion of our future revenues to be denominated in currencies other than the U.S. Dollar, primarily the Euro and British pound. The effect of an immediate 10% adverse change in foreign exchange rates on foreign-denominated accounts receivable at December 31, 2016 would not be material to our financial condition or results of operations. Our operating expenses are generally denominated in the currencies of the countries in which our operations are located, primarily the United States and, to a much lesser extent, the United Kingdom, other European Union countries, Canada, Australia, and Singapore. Increases and decreases in our foreign-denominated revenue from movements in foreign exchange rates are partially offset by the corresponding decreases or increases in our foreign-denominated operating expenses.
As our international operations grow, our risks associated with fluctuation in currency rates will become greater, and we will continue to reassess our approach to managing this risk. In addition, currency fluctuations or a weakening U.S. Dollar can increase the costs of our international expansion. To date, we have not entered into any foreign currency hedging contracts, since exchange rate fluctuations have not had a material impact on our operating results and cash flows. Based on our current international structure, we do not plan on engaging in hedging activities in the near future.
Inflation Risk
We do not believe that inflation has had a material effect on our business, financial condition or results of operations. Nonetheless, if our costs were to become subject to significant inflationary pressures, we may not be able to fully offset such higher costs through price increases. Our inability or failure to do so could harm our business, financial condition and results of operations.
65
INDEX TO CONSOLIDATED FINANCIAL STATEMENTS
66
REPORT OF INDEPENDENT REGISTERED PUBLIC ACCOUNTING FIRM
To the Board of Directors and Stockholders of BlackLine, Inc.:
In our opinion, the accompanying consolidated balance sheets and the related consolidated statements of operations, comprehensive loss, stockholders’ equity and cash flows present fairly, in all material respects, the financial position of BlackLine, Inc. and its subsidiaries (the “Company”) at December 31, 2016 and 2015, and the results of their operations and their cash flows for each of the three years in the period ended December 31, 2016 in conformity with accounting principles generally accepted in the United States of America. These financial statements are the responsibility of the Company’s management. Our responsibility is to express an opinion on these financial statements based on our audits. We conducted our audits of these financial statements in accordance with the standards of the Public Company Accounting Oversight Board (United States). Those standards require that we plan and perform the audit to obtain reasonable assurance about whether the financial statements are free of material misstatement. An audit includes examining, on a test basis, evidence supporting the amounts and disclosures in the financial statements, assessing the accounting principles used and significant estimates made by management, and evaluating the overall financial statement presentation. We believe that our audits provide a reasonable basis for our opinion.
/s/ PricewaterhouseCoopers LLP
Los Angeles, California
March 10, 2017
67
(In thousands, except shares and par values)
|
|
|
December 31, |
|
|
December 31, |
|
||
|
|
|
2016 |
|
|
2015 |
|
||
|
ASSETS |
|
|
|
|
|
|
|
|
|
Current assets: |
|
|
|
|
|
|
|
|
|
Cash and cash equivalents |
|
$ |
22,118 |
|
|
$ |
15,205 |
|
|
Marketable securities |
|
|
83,130 |
|
|
|
— |
|
|
Accounts receivable, net of allowances for doubtful accounts of $223 and $168 as of December 31, 2016 and 2015, respectively |
|
|
42,294 |
|
|
|
24,235 |
|
|
Deferred sales commissions |
|
|
9,667 |
|
|
|
6,246 |
|
|
Prepaid expenses and other current assets |
|
|
6,614 |
|
|
|
2,801 |
|
|
Total current assets |
|
|
163,823 |
|
|
|
48,487 |
|
|
Capitalized software development costs, net |
|
|
4,591 |
|
|
|
2,967 |
|
|
Property and equipment, net |
|
|
11,318 |
|
|
|
12,419 |
|
|
Intangible assets, net |
|
|
54,118 |
|
|
|
56,828 |
|
|
Goodwill |
|
|
185,138 |
|
|
|
163,154 |
|
|
Other assets |
|
|
1,449 |
|
|
|
2,895 |
|
|
Total assets |
|
$ |
420,437 |
|
|
$ |
286,750 |
|
|
LIABILITIES AND STOCKHOLDERS' EQUITY |
|
|
|
|
|
|
|
|
|
Current liabilities: |
|
|
|
|
|
|
|
|
|
Accounts payable |
|
$ |
7,165 |
|
|
$ |
4,648 |
|
|
Accrued expenses and other current liabilities |
|
|
18,931 |
|
|
|
15,012 |
|
|
Deferred revenue |
|
|
80,360 |
|
|
|
52,750 |
|
|
Short-term portion of contingent consideration |
|
|
2,008 |
|
|
|
2,008 |
|
|
Total current liabilities |
|
|
108,464 |
|
|
|
74,418 |
|
|
Term loan, net |
|
|
— |
|
|
|
28,267 |
|
|
Common stock warrant liability |
|
|
11,380 |
|
|
|
5,500 |
|
|
Contingent consideration |
|
|
3,230 |
|
|
|
2,859 |
|
|
Deferred tax liabilities, net |
|
|
1,262 |
|
|
|
5,907 |
|
|
Deferred revenue, noncurrent |
|
|
2,373 |
|
|
|
— |
|
|
Other long-term liabilities |
|
|
2,318 |
|
|
|
3,631 |
|
|
Total liabilities |
|
|
129,027 |
|
|
|
120,582 |
|
|
Commitments and contingencies (Note 10) |
|
|
|
|
|
|
|
|
|
Stockholders' equity: |
|
|
|
|
|
|
|
|
|
Preferred stock, $0.01 par value, 50,000,000 shares authorized, no shares issued and outstanding as of December 31, 2016 and 2015 |
|
|
— |
|
|
|
— |
|
|
Common stock, $0.01 par value, 500,000,000 shares authorized, 51,277,964 issued and outstanding as of December 31, 2016 and 40,720,327 issued and 40,673,327 outstanding as of December 31, 2015 |
|
|
513 |
|
|
|
407 |
|
|
Treasury stock, 0 shares and 47,000 shares at cost at December 31, 2016 and 2015, respectively |
|
|
— |
|
|
|
(254 |
) |
|
Additional paid-in capital |
|
|
378,272 |
|
|
|
214,171 |
|
|
Accumulated other comprehensive income |
|
|
(41 |
) |
|
|
— |
|
|
Accumulated deficit |
|
|
(87,334 |
) |
|
|
(48,156 |
) |
|
Total stockholders' equity |
|
|
291,410 |
|
|
|
166,168 |
|
|
Total liabilities and stockholders' equity |
|
$ |
420,437 |
|
|
$ |
286,750 |
|
The accompanying notes are an integral part of these consolidated financial statements.
68
CONSOLIDATED STATEMENTS OF OPERATIONS
(In thousands, except per share data)
|
|
|
Year Ended |
|
|||||||||
|
|
|
December 31, |
|
|||||||||
|
|
|
2016 |
|
|
2015 |
|
|
2014 |
|
|||
|
Revenues |
|
|
|
|
|
|
|
|
|
|
|
|
|
Subscription and support |
|
$ |
117,524 |
|
|
$ |
80,080 |
|
|
$ |
49,029 |
|
|
Professional services |
|
|
5,599 |
|
|
|
3,527 |
|
|
|
2,648 |
|
|
Total revenues |
|
|
123,123 |
|
|
|
83,607 |
|
|
|
51,677 |
|
|
Cost of revenues |
|
|
|
|
|
|
|
|
|
|
|
|
|
Subscription and support |
|
|
25,900 |
|
|
|
19,773 |
|
|
|
14,380 |
|
|
Professional services |
|
|
4,311 |
|
|
|
2,956 |
|
|
|
2,218 |
|
|
Total cost of revenues |
|
|
30,211 |
|
|
|
22,729 |
|
|
|
16,598 |
|
|
Gross profit |
|
|
92,912 |
|
|
|
60,878 |
|
|
|
35,079 |
|
|
Operating expenses |
|
|
|
|
|
|
|
|
|
|
|
|
|
Sales and marketing |
|
|
77,810 |
|
|
|
56,546 |
|
|
|
31,837 |
|
|
Research and development |
|
|
21,125 |
|
|
|
18,216 |
|
|
|
9,705 |
|
|
General and administrative |
|
|
27,911 |
|
|
|
20,928 |
|
|
|
11,716 |
|
|
Total operating expenses |
|
|
126,846 |
|
|
|
95,690 |
|
|
|
53,258 |
|
|
Loss from operations |
|
|
(33,934 |
) |
|
|
(34,812 |
) |
|
|
(18,179 |
) |
|
Other expense |
|
|
|
|
|
|
|
|
|
|
|
|
|
Interest expense, net |
|
|
(5,932 |
) |
|
|
(3,215 |
) |
|
|
(3,047 |
) |
|
Change in fair value of the common stock warrant liability |
|
|
(5,880 |
) |
|
|
(420 |
) |
|
|
(3,700 |
) |
|
Other expense, net |
|
|
(11,812 |
) |
|
|
(3,635 |
) |
|
|
(6,747 |
) |
|
Loss before income taxes |
|
|
(45,746 |
) |
|
|
(38,447 |
) |
|
|
(24,926 |
) |
|
Benefit from income taxes |
|
|
(6,587 |
) |
|
|
(13,713 |
) |
|
|
(8,174 |
) |
|
Net loss |
|
$ |
(39,159 |
) |
|
$ |
(24,734 |
) |
|
$ |
(16,752 |
) |
|
Net loss per share, basic and diluted |
|
$ |
(0.92 |
) |
|
$ |
(0.61 |
) |
|
$ |
(0.42 |
) |
|
Weighted average common shares outstanding, basic and diluted |
|
|
42,497 |
|
|
|
40,579 |
|
|
|
40,089 |
|
The accompanying notes are an integral part of these consolidated financial statements.
69
CONSOLIDATED STATEMENTS OF COMPREHENSIVE LOSS
(In thousands)
|
|
|
Year Ended |
|
|||||||||
|
|
|
December 31, |
|
|||||||||
|
|
|
2016 |
|
|
2015 |
|
|
2014 |
|
|||
|
|
|
|
|
|
|
|
|
|
|
|
|
|
|
Net loss |
|
$ |
(39,159 |
) |
|
$ |
(24,734 |
) |
|
$ |
(16,752 |
) |
|
Other comprehensive loss: |
|
|
|
|
|
|
|
|
|
|
|
|
|
Net change in unrealized losses on marketable securities, net of tax of $0 for the year ended December 31, 2016 |
|
|
(41 |
) |
|
|
— |
|
|
|
— |
|
|
Other comprehensive loss |
|
|
(41 |
) |
|
|
— |
|
|
|
— |
|
|
Comprehensive loss |
|
$ |
(39,200 |
) |
|
$ |
(24,734 |
) |
|
$ |
(16,752 |
) |
The accompanying notes are an integral part of these consolidated financial statements.
70
CONSOLIDATED STATEMENTS OF STOCKHOLDERS’ EQUITY
(In thousands, except shares)
|
|
|
|
|
|
|
|
|
|
|
|
|
|
|
|
|
|
|
Accumulated |
|
|
|
|
|
|
|
|
|
||||||||||||||
|
|
|
Common Stock |
|
|
|
|
|
|
Additional |
|
|
Other |
|
|
|
|
|
|
|||||||||||||||||||||||
|
|
|
Shares Outstanding |
|
|
Amount |
|
|
Treasury Stock, at cost |
|
|
Paid-in Capital |
|
|
Comprehensive Loss |
|
|
Accumulated Deficit |
|
|
Total |
|
||||||||||||||||||||
|
Balance at December 31, 2013 |
|
|
40,080,000 |
|
|
$ |
401 |
|
|
$ |
— |
|
|
$ |
200,121 |
|
|
$ |
— |
|
|
$ |
(6,670 |
) |
|
$ |
193,852 |
|
|||||||||||||
|
Common stock issuance |
|
|
357,142 |
|
|
|
4 |
|
|
|
— |
|
|
|
4,996 |
|
|
|
— |
|
|
|
— |
|
|
|
5,000 |
|
|||||||||||||
|
Stock repurchases |
|
|
(45,000 |
) |
|
|
— |
|
|
|
(225 |
) |
|
|
— |
|
|
|
— |
|
|
|
— |
|
|
|
(225 |
) |
|||||||||||||
|
Stock-based compensation |
|
|
— |
|
|
|
— |
|
|
|
— |
|
|
|
2,072 |
|
|
|
— |
|
|
|
— |
|
|
|
2,072 |
|
|||||||||||||
|
Net loss |
|
|
— |
|
|
|
— |
|
|
|
— |
|
|
|
— |
|
|
|
— |
|
|
|
(16,752 |
) |
|
|
(16,752 |
) |
|||||||||||||
|
Balance at December 31, 2014 |
|
|
40,392,142 |
|
|
|
405 |
|
|
|
(225 |
) |
|
|
207,189 |
|
|
|
— |
|
|
|
(23,422 |
) |
|
|
183,947 |
|
|||||||||||||
|
Stock option exercises |
|
|
283,185 |
|
|
|
2 |
|
|
|
— |
|
|
|
1,418 |
|
|
|
— |
|
|
|
— |
|
|
|
1,420 |
|
|||||||||||||
|
Stock repurchases |
|
|
(2,000 |
) |
|
|
— |
|
|
|
(29 |
) |
|
|
— |
|
|
|
— |
|
|
|
— |
|
|
|
(29 |
) |
|||||||||||||
|
Stock-based compensation |
|
|
— |
|
|
|
— |
|
|
|
— |
|
|
|
5,564 |
|
|
|
— |
|
|
|
— |
|
|
|
5,564 |
|
|||||||||||||
|
Net loss |
|
|
— |
|
|
|
— |
|
|
|
— |
|
|
|
— |
|
|
|
— |
|
|
|
(24,734 |
) |
|
|
(24,734 |
) |
|||||||||||||
|
Balance at December 31, 2015 |
|
|
40,673,327 |
|
|
|
407 |
|
|
|
(254 |
) |
|
|
214,171 |
|
|
|
— |
|
|
|
(48,156 |
) |
|
|
166,168 |
|
|||||||||||||
|
Stock option exercises |
|
|
522,450 |
|
|
|
5 |
|
|
|
— |
|
|
|
2,855 |
|
|
|
— |
|
|
|
— |
|
|
|
2,860 |
|
|||||||||||||
|
Common stock issuance |
|
|
192,187 |
|
|
|
2 |
|
|
|
— |
|
|
|
3,073 |
|
|
|
— |
|
|
|
— |
|
|
|
3,075 |
|
|||||||||||||
|
Issuance of common stock in connection with initial public offering, net of offering costs |
|
|
9,890,000 |
|
|
|
99 |
|
|
|
— |
|
|
|
151,780 |
|
|
|
— |
|
|
|
— |
|
|
|
151,879 |
|
|||||||||||||
|
Retirement of treasury stock |
|
|
— |
|
|
|
— |
|
|
|
254 |
|
|
|
(235 |
) |
|
|
— |
|
|
|
(19 |
) |
|
|
— |
|
|||||||||||||
|
Stock-based compensation |
|
|
— |
|
|
|
— |
|
|
|
— |
|
|
|
6,628 |
|
|
|
— |
|
|
|
— |
|
|
|
6,628 |
|
|||||||||||||
|
Other comprehensive loss |
|
|
— |
|
|
|
— |
|
|
|
— |
|
|
|
— |
|
|
|
(41 |
) |
|
|
— |
|
|
|
(41 |
) |
|||||||||||||
|
Net loss |
|
|
— |
|
|
|
— |
|
|
|
— |
|
|
|
— |
|
|
|
— |
|
|
|
(39,159 |
) |
|
|
(39,159 |
) |
|||||||||||||
|
Balance at December 31, 2016 |
|
|
51,277,964 |
|
|
$ |
513 |
|
|
$ |
— |
|
|
$ |
378,272 |
|
|
$ |
(41 |
) |
|
$ |
(87,334 |
) |
|
$ |
291,410 |
|
|||||||||||||
The accompanying notes are an integral part of these consolidated financial statements.
71
CONSOLIDATED STATEMENTS OF CASH FLOWS
(In thousands)
|
|
|
Year Ended |
|
|||||||||
|
|
|
December 31, |
|
|||||||||
|
|
|
2016 |
|
|
2015 |
|
|
2014 |
|
|||
|
Cash flows from operating activities |
|
|
|
|
|
|
|
|
|
|
|
|
|
Net loss |
|
$ |
(39,159 |
) |
|
$ |
(24,734 |
) |
|
$ |
(16,752 |
) |
|
Adjustments to reconcile net loss to net cash provided by (used in) operating activities: |
|
|
|
|
|
|
|
|
|
|
|
|
|
Depreciation and amortization |
|
|
17,424 |
|
|
|
14,739 |
|
|
|
13,455 |
|
|
Accretion of debt discount and accrual of paid in kind interest |
|
|
4,557 |
|
|
|
2,594 |
|
|
|
2,541 |
|
|
Payment of paid in kind interest |
|
|
(6,418 |
) |
|
|
— |
|
|
|
— |
|
|
Change in fair value of common stock warrant liability |
|
|
5,880 |
|
|
|
420 |
|
|
|
3,700 |
|
|
Change in fair value of contingent consideration |
|
|
371 |
|
|
|
41 |
|
|
|
(781 |
) |
|
Stock-based compensation |
|
|
6,526 |
|
|
|
5,497 |
|
|
|
2,017 |
|
|
Deferred income taxes |
|
|
(7,432 |
) |
|
|
(13,941 |
) |
|
|
(8,283 |
) |
|
Changes in operating assets and liabilities, net of effects of the acquisition: |
|
|
|
|
|
|
|
|
|
|
|
|
|
Accounts receivable |
|
|
(15,541 |
) |
|
|
(6,195 |
) |
|
|
(6,821 |
) |
|
Deferred sales commissions |
|
|
(3,421 |
) |
|
|
(4,343 |
) |
|
|
(1,254 |
) |
|
Prepaid expenses and other current assets |
|
|
(3,095 |
) |
|
|
(507 |
) |
|
|
(1,116 |
) |
|
Other assets |
|
|
(201 |
) |
|
|
(571 |
) |
|
|
(98 |
) |
|
Accounts payable |
|
|
3,544 |
|
|
|
1,073 |
|
|
|
810 |
|
|
Accrued expenses and other current liabilities |
|
|
3,864 |
|
|
|
6,753 |
|
|
|
3,241 |
|
|
Deferred revenue |
|
|
29,482 |
|
|
|
18,176 |
|
|
|
17,246 |
|
|
Other long-term liabilities |
|
|
(1,189 |
) |
|
|
2,004 |
|
|
|
1,038 |
|
|
Net cash provided by (used in) operating activities |
|
|
(4,808 |
) |
|
|
1,006 |
|
|
|
8,943 |
|
|
Cash flows from investing activities |
|
|
|
|
|
|
|
|
|
|
|
|
|
Acquisition, net of cash acquired |
|
|
(31,488 |
) |
|
|
— |
|
|
|
— |
|
|
Investments in marketable securities |
|
|
(83,192 |
) |
|
|
— |
|
|
|
— |
|
|
Capitalized software development costs |
|
|
(3,270 |
) |
|
|
(2,273 |
) |
|
|
(1,437 |
) |
|
Purchases of property and equipment |
|
|
(1,724 |
) |
|
|
(10,094 |
) |
|
|
(1,429 |
) |
|
Net cash used in investing activities |
|
|
(119,674 |
) |
|
|
(12,367 |
) |
|
|
(2,866 |
) |
|
Cash flows from financing activities |
|
|
|
|
|
|
|
|
|
|
|
|
|
Proceeds from term loan, net of issuance costs |
|
|
34,300 |
|
|
|
— |
|
|
|
— |
|
|
Principal payments on term loan and prepayment penalties |
|
|
(60,706 |
) |
|
|
— |
|
|
|
— |
|
|
Principal payments on capital lease obligations |
|
|
(124 |
) |
|
|
(532 |
) |
|
|
— |
|
|
Proceeds from issuance of common stock |
|
|
3,075 |
|
|
|
— |
|
|
|
5,000 |
|
|
Payments of initial public offering costs |
|
|
(4,372 |
) |
|
|
— |
|
|
|
— |
|
|
Proceeds from initial public offering, net of underwriting discounts and commissions |
|
|
156,362 |
|
|
|
— |
|
|
|
— |
|
|
Repurchases of common stock |
|
|
— |
|
|
|
(29 |
) |
|
|
(225 |
) |
|
Proceeds from exercises of stock options |
|
|
2,860 |
|
|
|
1,420 |
|
|
|
— |
|
|
Net cash provided by financing activities |
|
|
131,395 |
|
|
|
859 |
|
|
|
4,775 |
|
|
Net increase (decrease) in cash and cash equivalents |
|
|
6,913 |
|
|
|
(10,502 |
) |
|
|
10,852 |
|
|
Cash and cash equivalents, beginning of period |
|
|
15,205 |
|
|
|
25,707 |
|
|
|
14,855 |
|
|
Cash and cash equivalents, end of period |
|
$ |
22,118 |
|
|
$ |
15,205 |
|
|
$ |
25,707 |
|
The accompanying notes are an integral part of these consolidated financial statements.
72
CONSOLIDATED STATEMENTS OF CASH FLOWS
SUPPLEMENTAL CASH FLOW DISCLOSURE
(In thousands)
|
|
|
Year Ended |
|
|||||||||
|
|
|
December 31, |
|
|||||||||
|
|
|
2016 |
|
|
2015 |
|
|
2014 |
|
|||
|
Supplemental disclosures of cash flow information |
|
|
|
|
|
|
|
|
|
|
|
|
|
Cash paid for interest |
|
$ |
8,646 |
|
|
$ |
634 |
|
|
$ |
506 |
|
|
Cash paid for income taxes |
|
$ |
176 |
|
|
$ |
6 |
|
|
$ |
10 |
|
|
Non-cash financing and investing activities |
|
|
|
|
|
|
|
|
|
|
|
|
|
Capitalized software development costs included in accounts payable and accrued expenses and other current liabilities |
|
$ |
153 |
|
|
$ |
— |
|
|
$ |
80 |
|
|
Purchases of property and equipment included in accounts payable and accrued expenses and other current liabilities |
|
$ |
63 |
|
|
$ |
172 |
|
|
$ |
996 |
|
|
Stock-based compensation capitalized for software development |
|
$ |
102 |
|
|
$ |
67 |
|
|
$ |
55 |
|
|
Property and equipment acquired under capital leases |
|
$ |
— |
|
|
$ |
1,648 |
|
|
$ |
— |
|
|
Deferred offering costs included in accounts payable and accrued expenses and other current liabilities |
|
$ |
110 |
|
|
$ |
1,647 |
|
|
$ |
— |
|
The accompanying notes are an integral part of these consolidated financial statements.
73
NOTES TO CONSOLIDATED FINANCIAL STATEMENTS
Note 1—The Company
BlackLine, Inc. and its subsidiaries (the “Company” or “BlackLine”) provide financial accounting close solutions delivered primarily as Software as a Service (“SaaS”). The Company’s solutions enable its customers to address various aspects of their financial close process, including account reconciliations, variance analysis of account balances, journal entry capabilities, and certain types of data matching capabilities.
The Company is headquartered in Los Angeles, California and has offices in Chicago, Atlanta, New York, Vancouver, London, Paris, Frankfurt, Sydney, Melbourne, Kuala Lumpur, Netherlands, and Singapore.
Note 2—Significant accounting policies
Principles of consolidation and basis of presentation
The Company’s consolidated financial statements are presented in accordance with accounting principles generally accepted in the United States of America (“GAAP”) and include the operating results of its wholly-owned subsidiaries. All intercompany accounts and transactions have been eliminated in consolidation.
Reverse stock split
On October 12, 2016, the Company effected a 1-for-5 reverse stock split of its outstanding common stock. All share and per share amounts for all periods presented in these consolidated financial statements and notes thereto have been adjusted retrospectively, where applicable, to reflect this reverse stock split.
Use of estimates
The preparation of consolidated financial statements in conformity with GAAP requires management to make estimates and assumptions that affect the reported amounts of assets and liabilities and the disclosure of contingent assets and liabilities at the dates of the consolidated financial statements, and the reported amounts of revenues and expenses during the reporting period.
On an ongoing basis, management evaluates its estimates, primarily those related to determining the best estimate of selling price (“BESP”) for separate deliverables in the Company’s subscription revenue arrangements, vendor-specific objective evidence (“VSOE”) for separate deliverables in the Company’s licensed revenue arrangements, allowance for doubtful accounts, fair value of assets and liabilities assumed in a business combination, recoverability of goodwill and long-lived assets, useful lives associated with long-lived assets, contingencies, fair value of contingent consideration, and the valuation and assumptions underlying stock-based compensation and common stock warrants. These estimates are based on historical data and experience, as well as various other factors that management believes to be reasonable under the circumstances. Actual results could differ from those estimates.
Segments
Management has determined that the Company has one operating segment. The Company’s chief executive officer, who is the Company’s chief operating decision maker, reviews financial information on a consolidated and aggregate basis, together with certain operating metrics principally to make decisions about how to allocate resources and to measure the Company’s performance.
Cash and cash equivalents
The Company considers all highly liquid investments with an original or remaining maturity of three months or less at the date of purchase to be cash equivalents. Cash includes cash held in checking and savings accounts. Cash equivalents are comprised of investments in money market mutual funds. The carrying value of cash and cash equivalents approximates fair value.
74
Included in non-current other assets at December 31, 2016 and 2015 was cash of $ 0.4 million required to be restricted as to use by the Company’s office leaseholder to collateralize a standby letter of credit.
Investments in Marketable Securities
Our marketable securities consist of commercial paper, corporate bonds, U.S. treasury bonds, and asset-backed securities. The Company classifies its marketable securities as available-for-sale at the time of purchase, and the Company reevaluates such classification as of each balance sheet date. All marketable securities are recorded at their estimated fair value, with any unrealized gains and losses reported as a component of stockholders’ equity until realized or until a determination is made that an other-than-temporary decline in market value has occurred. Impairments are considered to be other than temporary if they are related to deterioration in credit risk or if it is likely the Company will sell the securities before the recovery of their cost basis. Realized gains and losses and declines in value deemed to be other than temporary are determined based on the specific identification method and are reported in other income (expense), net in the consolidated statements of operations.
The Company classifies its investments in marketable securities in current assets as the investments are available for use, if needed, in current operations.
Investments in marketable securities presented within current assets on the consolidated balance sheet as of December 31, 2016 consisted of the following:
|
|
|
Amortized Cost |
|
|
Gross Unrealized Gains |
|
|
Gross Unrealized Losses |
|
|
Fair Value |
|
||||
|
Marketable securities |
|
(in thousands) |
|
|||||||||||||
|
U.S. Treasury bonds |
|
$ |
29,742 |
|
|
$ |
— |
|
|
$ |
(17 |
) |
|
$ |
29,725 |
|
|
Corporate Bonds |
|
|
25,522 |
|
|
|
— |
|
|
|
(21 |
) |
|
|
25,501 |
|
|
Commercial paper |
|
|
15,554 |
|
|
|
— |
|
|
|
— |
|
|
|
15,554 |
|
|
Asset-backed securities |
|
|
12,353 |
|
|
|
— |
|
|
|
(3 |
) |
|
|
12,350 |
|
|
|
|
$ |
83,171 |
|
|
$ |
— |
|
|
$ |
(41 |
) |
|
$ |
83,130 |
|
Gross realized gains and losses on marketable securities and net gains and losses reclassified from accumulated other comprehensive income to earnings were not material for the year ended December 31, 2016.
The Company’s marketable securities have a contractual maturity of less than 4 years. The amortized cost and fair values of marketable securities, by remaining contractual maturity, were as follows:
|
|
|
December 31, 2016 |
|
|||||
|
|
|
Amortized Cost |
|
|
Fair Value |
|
||
|
|
|
(in thousands) |
|
|||||
|
Due in 1 year or less |
|
$ |
49,371 |
|
|
$ |
49,363 |
|
|
Due after 1 year through 4 years |
|
|
33,800 |
|
|
|
33,767 |
|
|
|
|
$ |
83,171 |
|
|
$ |
83,130 |
|
The Company held no marketable securities during the years ended December 31, 2015 and 2014.
Accounts receivable and allowance for doubtful accounts
Accounts receivable are recorded at the invoiced amount, do not require collateral and do not bear interest. The Company estimates its allowance for doubtful accounts by evaluating specific accounts where information indicates the Company’s customers may have an inability to meet financial obligations, such as bankruptcy and significantly aged receivables outstanding.
75
Concentration of credit risk and significant customers
Financial instruments that potentially subject the Company to a significant concentration of credit risk consist of cash and cash equivalents, investments in marketable securities and accounts receivable.
The Company maintains the majority of its cash balances with one major commercial bank in non-interest bearing accounts, which exceeds the Federal Deposit Insurance Corporation, or FDIC, federally insured limits.
The Company invests its excess cash in money market mutual funds, commercial paper, corporate bonds, U.S. treasury bonds, and asset-backed securities. To date, the Company has not experienced any impairment losses on its investments.
For the years ended December 31, 2016, 2015 and 2014, no single customer comprised 10% or more of the Company’s total revenues. No single customer had an accounts receivable balance of 10% or greater of total accounts receivable at December 31, 2016 and 2015.
Property and equipment
Property and equipment is stated at cost less accumulated depreciation. Expenditures for repairs and maintenance are expensed as incurred, while renewals and betterments are capitalized. Depreciation expense is charged to operations on a straight-line basis over the estimated useful lives of the assets.
The estimated useful lives of the Company’s property and equipment are as follows:
|
|
|
Useful Lives |
|
Machinery and equipment |
|
3-5 years |
|
Purchased software |
|
3-5 years |
|
Furniture and fixtures |
|
5 years |
|
Leasehold improvements |
|
Lesser of 7 years or lease term |
Assets acquired under capital leases are capitalized at the present value of the related lease payments and are amortized over the shorter of the lease term or useful life of the asset.
Capitalized internal-use software costs
The Company accounts for the costs of computer software obtained or developed for internal use in accordance with ASC 350, Intangibles—Goodwill and Other (“ASC 350”). The Company capitalizes certain costs in the development of its SaaS subscription solution when (i) the preliminary project stage is completed, (ii) management has authorized further funding for the completion of the project and (iii) it is probable that the project will be completed and performed as intended. These capitalized costs include personnel and related expenses for employees and costs of third-party contractors who are directly associated with and who devote time to internal-use software projects and, when material, interest costs incurred during the development. Capitalization of these costs ceases once the project is substantially complete and the software is ready for its intended purpose. Costs incurred for significant upgrades and enhancements to the Company’s SaaS software solutions are also capitalized. Costs incurred for training, maintenance and minor modifications or enhancements are expensed as incurred. Capitalized software development costs are amortized using the straight-line method over an estimated useful life of three years.
During the years ended December 31, 2016, 2015 and 2014, the Company amortized $1.8 million, $0.9 million and $0.3 million, respectively, of internal-use software development costs to subscription and support cost of revenue. As of December 31, 2016 and 2015, the accumulated amortization of internal-use software development costs was $2.9 million and $1.2 million, respectively.
Business combinations
The results of businesses acquired in a business combination are included in the Company’s consolidated financial statements from the date of the acquisition. Purchase accounting results in assets and liabilities of an acquired business
76
generally being recorded at their estimated fair values on the acquisition date. Any excess consideration over the fair value of assets acquired and liabilities assumed is recognized as goodwill.
Transaction costs associated with business combinations are expensed as incurred and are included in general and administrative expenses in the consolidated statements of operations.
The Company performs valuations of assets acquired and liabilities assumed and allocates the purchase price to its respective assets and liabilities. Determining the fair value of assets acquired and liabilities assumed requires management to use significant judgment and estimates, including the selection of valuation methodologies, estimates of future revenue, costs and cash flows, discount rates, and selection of comparable companies. The Company engages the assistance of valuation specialists in concluding on fair value measurements in connection with determining fair values of assets acquired and liabilities assumed in a business combination.
Intangible assets
Intangible assets primarily consist of acquired developed technology, customer relationships, trade names and non-compete agreements, which were acquired as part of the Company’s acquisitions of BlackLine Systems, Inc. in September 2013 and Runbook Company B.V. (“Runbook”) in August 2016. The Company determines the appropriate useful life of its intangible assets by performing an analysis of expected cash flows of the acquired assets. Intangible assets are amortized over their estimated useful lives using the straight-line method, which approximates the pattern in which the economic benefits are consumed. The estimated useful lives of the Company’s finite-lived intangible assets are as follows:
|
|
|
Useful Lives |
|
Trade name |
|
1-10 years |
|
Developed technology |
|
6-8 years |
|
Non-compete agreements |
|
2-5 years |
|
Customer relationships |
|
8-10 years |
Impairment of long-lived assets
Management evaluates the recoverability of the Company’s property and equipment, finite-lived intangible assets and capitalized internal-software costs when events or changes in circumstances indicate a potential impairment exists. Events and changes in circumstances considered by the Company in determining whether the carrying value of long-lived assets may not be recoverable include, but are not limited to, significant changes in performance relative to expected operating results, significant changes in the use of the assets, significant negative industry or economic trends, and changes in the Company’s business strategy. Impairment testing is performed at an asset level that represents the lowest level for which identifiable cash flows are largely independent of the cash flows of other assets and liabilities (an “asset group”). In determining if impairment exists, the Company estimates the undiscounted cash flows to be generated from the use and ultimate disposition of the asset group. If impairment is indicated based on a comparison of the assets’ carrying values and the undiscounted cash flows, the impairment loss is measured as the amount by which the carrying amount of the assets exceeds the fair value of the assets. The Company determined that there were no events or changes in circumstances that potentially indicated that the Company’s long-lived assets were impaired during the years ended December 31, 2016, 2015 and 2014.
Goodwill
Goodwill represents the excess of the purchase price over the fair value of net assets acquired in a business combination. The Company tests goodwill for impairment in accordance with the provisions of Accounting Standards Codification (“ASC”) 350, Intangibles—Goodwill and Other. Goodwill is tested for impairment at least annually at the reporting unit level or whenever events or changes in circumstances indicate that goodwill might be impaired. Events or changes in circumstances which could trigger an impairment review include a significant adverse change in legal factors or in the business climate, unanticipated competition, loss of key personnel, significant changes in the use of the acquired assets or the Company’s strategy, significant negative industry or economic trends, or significant underperformance relative to expected historical or projected future results of operations.
77
ASC 350 provides that an entity has the option to first assess qualitative factors to determine whether the existence of events or circumstances leads to a determination that it is more likely than not that the fair value of a reporting unit is less than its carrying amount. If, after assessing the totality of events or circumstances, an entity determines it is not more likely than not that the fair value of a reporting unit is less than its carrying amount, then additional impairment testing is not required. However, if an entity concludes otherwise, then it is required to perform the first of a two-step impairment test.
The first step involves comparing the estimated fair value of a reporting unit with its book value, including goodwill. If the estimated fair value exceeds book value, goodwill is considered not to be impaired and no additional steps are necessary. If, however, the fair value of the reporting unit is less than book value, then, under the second step, the carrying amount of the goodwill is compared with its implied fair value. The estimate of implied fair value of goodwill may require valuations of certain internally-generated and unrecognized intangible assets. If the carrying amount of goodwill exceeds the implied fair value of that goodwill, an impairment loss is recognized in an amount equal to the excess.
The Company has one reporting unit and it tests for goodwill impairment annually during the fourth quarter of the calendar year. At December 31, 2016, the fair value of the Company significantly exceeded the carrying value of its net assets and accordingly goodwill was not impaired.
Deferred rent
Rent expense is recorded on a straight-line basis over the term of the lease. The difference between rent expense and the cash paid under the lease agreement is recorded as deferred rent. Lease incentives, including tenant improvement allowances, are also recorded as deferred rent and amortized on a straight-line basis over the lease term.
Debt issued with warrants to purchase common stock
The Company issued warrants to purchase common stock in connection with its former credit facility. These warrants are a liability classified under ASC 815-40, Contracts in Entity’s Own Equity, as they contain down-round protection such that, in the event of subsequent issuances of shares at-market by the Company below the exercise price of the warrant, then the warrant’s exercise price is reduced. The warrants are measured at fair value each period with changes in fair value recorded in other income (expense), net in the consolidated statements of operations. The warrants will continue to be measured at fair value each period until the earlier of exercise or termination.
The initial carrying value of the debt was reduced by the fair value of the warrants. The resulting debt discount was amortized to interest expense over the life of the debt on a straight-line basis, which approximates the effective interest method. In November 2016, the Company repaid all outstanding debt and expensed the then-remaining unamortized debt discount to interest expense in the consolidated statements of operations.
Fair value of financial instruments
ASC 820, Fair Value Measurements requires entities to disclose the fair value of financial instruments, both assets and liabilities recognized and not recognized on the balance sheet, for which it is practicable to estimate fair value. Fair value is defined as the exchange price that would be received for an asset or paid to transfer a liability (an exit price) in the principal or most advantageous market for the asset or liability in an orderly transaction between market participants on the measurement date.
Valuation techniques used to measure fair value must maximize the use of observable inputs and minimize the use of unobservable inputs. ASC 820 describes a fair value hierarchy based on three levels of inputs, of which the first two are considered observable and the last unobservable, that may be used to measure fair value, which are the following:
|
|
Level 1: |
Quoted prices in active markets for identical or similar assets and liabilities. |
|
|
Level 2: |
Quoted prices for identical or similar assets and liabilities in markets that are not active or observable inputs other than quoted prices in active markets for identical or similar assets or liabilities. |
|
|
Level 3: |
Unobservable inputs that are supported by little or no market activity and that are significant to the fair value of the assets or liabilities. |
As of December 31, 2016 and 2015, the carrying values of cash equivalents, accounts receivable, accounts payable, and accrued expenses, approximate fair values due to the short-term nature of such instruments.
78
The following table summarizes the Company’s financial assets and liabilities measured at fair value on a recurring basis as of December 31, 2016 and 2015, by level, within the fair value hierarchy. Financial assets and financial liabilities are classified in their entirety based on the lowest level of input that is significant to the fair value measurement (in thousands):
|
|
|
December 31, 2016 |
|
|||||||||||||
|
|
|
Level 1 |
|
|
Level 2 |
|
|
Level 3 |
|
|
Total |
|
||||
|
Cash equivalents |
|
|
|
|
|
|
|
|
|
|
|
|
|
|
|
|
|
Money market funds |
|
$ |
18,936 |
|
|
$ |
— |
|
|
$ |
— |
|
|
$ |
18,936 |
|
|
Marketable securities |
|
|
|
|
|
|
|
|
|
|
|
|
|
|
|
|
|
U.S. Treasury bonds |
|
|
29,725 |
|
|
|
— |
|
|
|
— |
|
|
|
29,725 |
|
|
Corporate bonds |
|
|
— |
|
|
|
25,501 |
|
|
|
— |
|
|
|
25,501 |
|
|
Commercial paper |
|
|
— |
|
|
|
15,554 |
|
|
|
— |
|
|
|
15,554 |
|
|
Asset-backed securities |
|
|
— |
|
|
|
12,349 |
|
|
|
— |
|
|
|
12,349 |
|
|
Total assets |
|
$ |
48,661 |
|
|
$ |
53,404 |
|
|
$ |
— |
|
|
$ |
102,065 |
|
|
Liabilities |
|
|
|
|
|
|
|
|
|
|
|
|
|
|
|
|
|
Common stock warrant liability |
|
$ |
— |
|
|
$ |
— |
|
|
$ |
11,380 |
|
|
$ |
11,380 |
|
|
Contingent consideration |
|
|
— |
|
|
|
— |
|
|
|
5,238 |
|
|
|
5,238 |
|
|
Total liabilities |
|
$ |
— |
|
|
$ |
— |
|
|
$ |
16,618 |
|
|
$ |
16,618 |
|
|
|
|
December 31, 2015 |
|
|||||||||||||
|
|
|
Level 1 |
|
|
Level 2 |
|
|
Level 3 |
|
|
Total |
|
||||
|
Cash equivalents |
|
|
|
|
|
|
|
|
|
|
|
|
|
|
|
|
|
Money market funds |
|
$ |
15,990 |
|
|
$ |
— |
|
|
$ |
— |
|
|
$ |
15,990 |
|
|
Total assets |
|
|
15,990 |
|
|
$ |
— |
|
|
$ |
— |
|
|
$ |
15,990 |
|
|
Liabilities |
|
|
|
|
|
|
|
|
|
|
|
|
|
|
|
|
|
Common stock warrant liability |
|
$ |
— |
|
|
$ |
— |
|
|
$ |
5,500 |
|
|
$ |
5,500 |
|
|
Contingent consideration |
|
|
— |
|
|
|
— |
|
|
|
4,867 |
|
|
|
4,867 |
|
|
Total liabilities |
|
$ |
— |
|
|
$ |
— |
|
|
$ |
10,367 |
|
|
$ |
10,367 |
|
Contingent consideration relating to our 2013 Acquisition (Refer to Note 9) is recorded as a liability and is measured at fair value each period, based on significant inputs not observable in the market, which represents a Level 3 measurement within the fair value hierarchy. The valuation of contingent consideration uses assumptions management believes would be made by a market participant. Management assesses these estimates on an ongoing basis as additional data impacting the assumptions becomes available. Changes in the fair value of contingent consideration related to updated assumptions and estimates are recognized within general and administrative expenses in the consolidated statements of operations. The Company determined the fair value of the contingent consideration by discounting estimated future taxable income. The significant inputs used in the fair value measurement of contingent consideration are the timing and amount of taxable income in any given period and determining an appropriate discount rate, which considers the risk associated with the forecasted taxable income. Significant changes in the estimated future taxable income and the periods in which they are generated would significantly impact the fair value of the contingent consideration liability.
Warrants to purchase common stock are liability classified and are measured at fair value each period. The fair value is determined using a binomial lattice valuation model. The fair value includes significant inputs not observable in the market, which represents a Level 3 measurement within the fair value hierarchy. The valuation of common stock warrants uses assumptions management believes would be made by a market participant. Management assesses these estimates on an ongoing basis as additional data impacting the assumptions becomes available. Changes in the fair value of the common stock warrant liability related to updated assumptions and estimates are recognized within other income (expense), net in the consolidated statements of operations. The significant inputs used in the fair value measurement of the common stock warrants are the estimated fair value of the Company’s common stock and, to a lesser extent, the expected stock volatility, the probability of a change in control and future stock issuances, which impact the term of the warrants. Significant increases or decreases in the estimated fair value of the Company’s common stock would significantly impact the fair value of the warrant liability.
79
The following table summarizes the changes in the common stock warrant liability and contingent consideration liability (in thousands):
|
|
|
Contingent |
|
|
Common Stock |
|
||
|
|
|
Consideration |
|
|
Warrant Liability |
|
||
|
Fair value as of December 31, 2013 |
|
$ |
5,607 |
|
|
$ |
1,380 |
|
|
Change in fair value |
|
|
(781 |
) |
|
|
3,700 |
|
|
Fair value as of December 31, 2014 |
|
|
4,826 |
|
|
|
5,080 |
|
|
Change in fair value |
|
|
41 |
|
|
|
420 |
|
|
Fair value as of December 31, 2015 |
|
|
4,867 |
|
|
|
5,500 |
|
|
Change in fair value |
|
|
371 |
|
|
|
5,880 |
|
|
Fair value as of December 31, 2016 |
|
$ |
5,238 |
|
|
$ |
11,380 |
|
Certain assets, including goodwill and long-lived assets, are also subject to measurement at fair value on a non-recurring basis if they are deemed to be impaired a result of an impairment review. For the years ended December 31, 2016, 2015 and 2014, no impairments were identified on those assets required to be measured at fair value on a non-recurring basis.
Revenue recognition
The Company derives its revenue from the following sources:
Subscription and support revenue – Customers pay subscription fees for access to the Company’s SaaS platform generally for a one-year period. In more limited cases, customers may pay for up to three years in advance. Fees are based on a number of factors, including the solutions subscribed for by the customer and the number of users having access to the solutions. The first year subscription fees are typically payable within 30 days after the execution of the arrangement, and thereafter upon renewal. The Company initially records the subscription fees as deferred revenue and recognizes revenue on a straight-line basis over the term of the agreement. At any time during the subscription period, customers may increase the number of their users or subscribe for additional products. Additional user fees and additional product subscriptions are payable for the remainder of the initial or extended contract term. Subscription and support revenue also includes software revenue related to maintenance and support fees on legacy BlackLine solutions and software license and maintenance revenue on Runbook software sales as described below.
Professional services – The Company offers its customers assistance in implementing its SaaS solutions and optimizing their use. Professional services include consulting and training. These services are billed on either a fixed fee or time-and-material basis. Revenues from time-and-material arrangements are recognized as services are performed and revenues from fixed fee arrangements are initially recorded as deferred revenue and recognized on a proportional performance basis as the services are performed.
The Company recognizes subscription and professional services revenues when (i) persuasive evidence of an arrangement for the sale of the Company’s solutions or consulting services exists, (ii) the solutions have been made available or delivered, or services have been performed, (iii) the sales price is fixed or determinable, and (iv) collectability is reasonably assured. The timing and amount the Company recognizes as revenue is determined based on the facts and circumstances of each customer’s arrangement. Evidence of an arrangement consists of a signed customer agreement. The Company considers that delivery of a solution has commenced once it provides the customer with log-in information to access and use the solution. Fees are fixed based on stated rates specified in the customer agreement. The Company assesses collectability based on a number of factors, including the creditworthiness of the customer, review of their financial information or transaction history. If collectability is not considered reasonably assured, revenue is deferred until the fees are collected.
The majority of customer arrangements include multiple deliverables, such as subscriptions to the Company’s SaaS solutions and professional services. The Company recognizes revenue in accordance with the guidance for arrangements with multiple deliverables under Accounting Standards Update (“ASU”) 2009-13, Revenue Recognition (Topic 605) – Multiple-Deliverable Revenue Arrangements – a Consensus of the Emerging Issues Task Force. For subscription agreements, as customers do not have the right to the software code underlying the Company’s solutions, subscription revenue arrangements are outside the scope of software revenue recognition guidance as defined by ASC 985-605, Software. The Company’s agreements do not contain any refund provisions other than in the event of the Company’s non-performance or breach.
80
For multiple-deliverable revenue arrangements, the Company first assesses whether each deliverable has value to the customer on a standalone basis. The Company has determined that the SaaS products have standalone value because, once access is given to the customer, the solutions are fully functional and do not require any additional development, modification or customization. Professional services have standalone value because third-party partners and customers themselves can perform these services without the Company’s involvement. The performance of these professional services generally does not require highly specialized or technologically skilled individuals and the professional services are not essential to the functionality of the solutions.
The Company allocates revenue among the separate non-contingent deliverables in an arrangement under the relative selling price method using the selling price hierarchy established in ASU 2009-13. This hierarchy requires the selling price of each deliverable in a multiple deliverable arrangement to be based on, in descending order, (i) vendor-specific objective evidence of fair value (“VSOE”), (ii) third-party evidence of fair value (“TPE”) or (iii) management’s best estimate of selling price (“BESP”).
The Company is not able to determine VSOE or TPE for its deliverables because the deliverables are typically bundled and infrequently sold separately within a consistent price range. Additionally, management has determined that there are no third-party offerings reasonably comparable to the Company’s solutions. Therefore, the selling prices of subscriptions to the SaaS solutions and professional services are based on BESP. The determination of BESP requires the Company to make significant estimates and judgments. The Company considers numerous factors, including the nature of the deliverables themselves, geography, customer size and number of users, and discounting practices. The determination of BESP is made through consultation with senior management. The Company updates its estimates of BESP on an ongoing basis as events and circumstances may require. As the Company’s marketing strategies evolve, the Company may modify its pricing practices in the future, which could result in changes in relative selling prices and BESP.
The Company uses business process outsourcers (“BPOs”) and resellers to complement its direct sales and marketing efforts. The BPOs and resellers place orders with the Company after receiving an order from an end customer. The BPOs and resellers receive business terms of sale similar to those received by the Company’s direct customers, and payment to the Company is not contingent on the receipt of payment from the end customer. The BPOs and resellers negotiate pricing with the end customer and are responsible for implementation services, if any, and for certain support levels directly with the end customer. The Company recognizes revenue over the term of the arrangement for the contractual amount charged to the BPO or reseller once access to the Company’s solution has been provided to the end customer provided that the other revenue recognition criteria noted above have been met.
Subscription and support revenues also include revenues associated with sales of software licenses and related support. Prior to the development of the Company’s SaaS solutions, the Company sold software licenses and post contract support related to its legacy software in accordance with ASC 985-605. The Company continues to provide post contract support for this legacy software to a limited number of customers that have not yet migrated to the SaaS solution. The Company no longer develops any new applications or functionality for the legacy software licensed to customers.
On August 31, 2016, the Company acquired Runbook, a Netherlands-based provider of licensed financial close automation software and integration for SAP customers. The Company plans to migrate Runbook’s licensed products to a cloud-based platform, but the Company continues to sell Runbook’s on-premise software to existing Runbook customers and provide post-contract support and implementation services.
Revenues recognized from sales of software licenses, support and implementation services related to software arrangements comprised approximately 1%, 1% and 3% of total revenues for the years ended December 31, 2016, 2015 and 2014, respectively.
Taxes collected from customers are accounted for on a net basis and are excluded from revenue.
Cost of revenues
Cost of revenues primarily consists of costs related to hosting the Company’s cloud-based application suite, salaries and benefits of operations and support personnel, including stock-based compensation, and amortization of capitalized internal-use software costs. The Company allocates a portion of overhead, such as rent, IT costs and depreciation and amortization to cost of revenues. Costs associated with providing professional services are expensed as incurred when the services are performed. In addition, subscription and support cost of revenues includes amortization of acquired developed technology.
81
Sales and marketing expenses consist primarily of compensation and employee benefits, including stock-based compensation, of sales and marketing personnel and related sales support teams, sales and partner commissions, marketing events, advertising costs, travel, trade shows, other marketing materials, and allocated overhead. Sales and marketing expenses also include amortization of customer relationship intangible assets. Advertising costs are expensed as incurred and totaled $4.2 million, $3.0 million and $1.5 million for the years ended December 31, 2016, 2015 and 2014, respectively.
Deferred sales commissions
Deferred sales commissions are the incremental costs that are directly associated with non-cancelable subscription contracts with customers and consist of sales commissions paid to the Company’s direct sales force and third-party partners. The commissions are deferred and amortized over the non-cancelable terms of the related customer contracts, which are typically one year in duration. The commission payments are paid in full the month after the customer’s service commences. The deferred commission amounts are recoverable through the future revenue streams under the non-cancelable customer contracts. The Company believes this is the preferable method of accounting as the sales commission charges are so closely related to the revenue from the non-cancelable customer contracts and accordingly, should be recorded as an asset and charged to expense over the same period that the subscription revenue is recognized. Amortization of deferred sales commissions is included in sales and marketing in the accompanying consolidated statements of operations. As of December 31, 2016 and 2015, deferred commission costs, net of accumulated amortization were $9.7 million and $6.2 million, respectively. Amortization of commission costs was $13.2 million, $7.3 million and $2.5 million for the years ended December 31, 2016, 2015 and 2014, respectively.
Research and development
Research and development expenses are comprised primarily of salaries, benefits and stock-based compensation associated with the Company’s engineering, product and quality assurance personnel. Research and development expenses also include third-party contractors and supplies and allocated overhead. Other than software development costs that qualify for capitalization, as discussed above, research and development costs are expensed as incurred.
General and administrative
General and administrative expenses consist primarily of personnel costs associated with the Company’s executive, finance, legal, human resources, compliance, and other administrative personnel, as well as accounting and legal professional services fees, other corporate-related expenses and allocated overhead. General and administrative expenses also include amortization of covenant not to compete and tradename intangible assets, the change in value of the contingent consideration and acquisition-related costs of business combinations.
Stock-based compensation
The Company accounts for stock-based compensation awards granted to employees and directors based on the awards’ estimated grant date fair value. The Company estimates the fair value of its stock options using the Black-Scholes option-pricing model. For awards that vest solely based on continued service (“service-only vesting conditions”), the resulting fair value, net of estimated forfeitures, is recognized on a straight-line basis over the period during which an employee is required to provide service in exchange for the award, usually the vesting period, which is generally four years. The Company recognizes the fair value of stock options which contain performance conditions based upon the probability of the performance conditions being met, net of estimated forfeitures, using the graded vesting method. Estimated forfeitures are based upon the Company’s historical experience and the Company revises its estimates, if necessary, in subsequent periods if actual forfeitures differ from initial estimates.
Determining the grant date fair value of options using the Black-Scholes option-pricing model requires management to make assumptions and judgments. These estimates involve inherent uncertainties and, if different assumptions had been used, stock-based compensation expense could have been materially different from the amounts recorded.
82
The assumptions and estimates are as follows:
Value per share of the Company’s common stock. Prior to the Company’s initial public offering in October 2016, because there was no public market for the Company’s common stock, the Company’s management, with the assistance of a third-party valuation specialist, determined the fair value of the Company’s common stock at the time of the grant of stock options by considering a number of objective and subjective factors, including the Company’s actual operating and financial performance, market conditions and performance of comparable publicly-traded companies, developments and milestones in the Company, the likelihood of achieving a liquidity event and transactions involving the Company’s common stock, among other factors. The fair value of the underlying common stock was determined by the Company’s board of directors through the date of the initial public offering. The fair value of the Company’s common stock was determined in accordance with applicable elements of the practice aid issued by the American Institute of Certified Public Accountants, Valuation of Privately Held Company Equity Securities Issued as Compensation. For awards granted subsequent to the Company’s initial public offering, the fair value of common stock is based on the closing price of the Company’s common stock, as reported on the NASDAQ, on the date of grant.
Expected volatility. The Company determines the expected volatility based on historical average volatilities of similar publicly-traded companies corresponding to the expected term of the awards.
Expected term. The Company determines the expected term of awards which contain service-only vesting conditions using the simplified approach, in which the expected term of an award is presumed to be the mid-point between the vesting date and the expiration date of the award, as the Company does not have sufficient historical data relating to stock option exercises. For awards granted which contain performance conditions, the Company estimates the expected term based on estimates of post-vesting employment termination behavior taking into account the life of the award.
Risk-free interest rate. The risk-free interest rate is based on the United States Treasury yield curve in effect during the period the options were granted corresponding to the expected term of the awards.
Estimated dividend yield. The estimated dividend yield is zero, as the Company does not currently intend to declare dividends in the foreseeable future.
The following information represents the weighted average of the assumptions used in Black-Scholes option-pricing model:
|
|
|
Year ended December 31, |
|
|||||||||
|
|
|
2016 |
|
|
2015 |
|
|
2014 |
|
|||
|
Expected term (years) |
|
|
6.3 |
|
|
|
6.3 |
|
|
6.2 |
|
|
|
Expected volatility |
|
|
47.5 |
% |
|
|
49.6 |
% |
|
|
54.0 |
% |
|
Risk free interest rate |
|
|
1.4 |
% |
|
|
1.7 |
% |
|
|
1.9 |
% |
|
Expected dividends |
|
|
— |
|
|
|
— |
|
|
|
— |
|
Income taxes
The Company accounts for income taxes in accordance with ASC 740, Income Taxes. ASC 740 requires the recognition of deferred tax assets and liabilities for the expected future tax consequences of temporary differences between the carrying amounts and the tax bases of assets and liabilities. Deferred income tax assets and liabilities are measured using enacted tax rates expected to apply to taxable income in the years in which those temporary differences are expected to be recovered or settled. The effect of a change in tax rates on deferred tax assets and liabilities is recognized in the consolidated statements of operations in the period that includes the enactment date. A valuation allowance is recorded when it is more likely than not that some of the deferred tax assets will not be realized.
The Company recognizes the tax benefit from an uncertain tax position only if it is more likely than not that the tax position will be sustained on examination by the taxing authorities, based on the technical merits of the position. The tax benefits recognized in the consolidated financial statements from such positions are then measured based on the largest benefit that has a greater than 50% likelihood of being realized. The Company recognizes interest and penalties accrued with respect to uncertain tax positions, if any, in the provision for income taxes in the consolidated statements of operations.
83
Basic and diluted loss per share is calculated by dividing net loss by the weighted average number of shares of common stock outstanding. As the Company has net losses for the periods presented, all potentially dilutive common stock, which are comprised of stock options and warrants, are antidilutive.
As of December 31, 2016 and 2015, the following potentially dilutive shares have been excluded from the calculation of diluted net loss per share attributable to common stockholders because they are anti-dilutive:
|
|
|
December 31, |
|
|||||
|
|
|
2016 |
|
|
2015 |
|
||
|
Options to purchase common stock |
|
|
6,556,986 |
|
|
|
5,904,376 |
|
|
Common stock warrants |
|
|
499,999 |
|
|
|
499,999 |
|
|
Total shares excluded from net loss per share |
|
|
7,056,985 |
|
|
|
6,404,375 |
|
Foreign currency
The Company’s foreign subsidiaries’ functional currency is the U.S. Dollar. The foreign exchange impacts of remeasuring the foreign subsidiaries’ local currency to the U.S. Dollar functional currency is recorded in general and administrative expenses, net in the Company’s consolidated statements of operations. Monetary assets and liabilities of foreign operations are remeasured at balance sheet date exchange rates, non-monetary assets and liabilities and equity are remeasured at the historical exchange rates, while results of operations are remeasured at average exchange rates in effect for the period. Foreign currency transaction gains or losses were immaterial for each period presented.
Recently issued accounting standards
Under the Jumpstart Our Business Startups Act, or the JOBS Act, the Company meets the definition of an emerging growth company. The Company has irrevocably elected to opt out of the extended transition period for complying with new or revised accounting standards pursuant to Section 107(b) of the JOBS Act.
In May 2014, the Financial Accounting Standards Board (“FASB”) issued guidance related to revenue from contracts with customers. Under this guidance, revenue is recognized when promised goods or services are transferred to customers in an amount that reflects the consideration that is expected to be received for those goods or services. The updated standard will replace all existing revenue recognition guidance under GAAP when it becomes effective and permits the use of either the retrospective or cumulative effect transition method. In July 2015, the FASB voted to defer the effective date to January 1, 2018, with early adoption beginning January 1, 2017. In March, April, May, and December 2016, the FASB issued amendments to the new guidance relating to reporting revenue on a gross versus net basis, identifying performance obligations and licensing arrangements and other narrow scope improvements. The Company will adopt the new revenue guidance in the first quarter of 2018 though has not yet determined whether to adopt using a full retrospective or modified retrospective approach. The Company is currently assessing the impact of the new revenue guidance on its arrangements. The Company currently believes that the new guidance will impact the amount and timing of incremental costs of obtaining a contract, such as sales commissions. The Company generally does not pay sales commissions upon contract renewal and therefore, under the new revenue guidance, the sales commissions will be recognized over an estimated customer life rather than over the non-cancelable term under current guidance. The new guidance is also expected to impact the Company’s arrangements subject to current software revenue recognition guidance and also require incremental disclosures of the Company’s revenue arrangements. The Company has not yet quantified the impact of these changes. Adoption of this standard will also require changes to the Company’s business processes, systems and controls to support the new revenue recognition guidance. The Company is in the process of identifying such changes.
In February 2016, the FASB issued new guidance which significantly changes the accounting for leases. The new guidance requires a lessee recognize in the balance sheet a liability to make lease payments (the lease liability) and a right-of-use asset representing its right to use the underlying asset for the lease term. For leases with a term of 12 months or less, a lessee is permitted to make an accounting policy election by class of underlying asset not to recognize lease assets and lease liabilities. If a lessee makes this election, it should recognize lease expense for such leases generally on a straight-line basis over the lease term. For income statement purposes, the new guidance retained a dual model, requiring leases to be classified as either operating or financing. Operating leases will result in straight-line expense while finance leases will result in a front-loaded expense pattern similar to existing capital lease guidance. For statement of cash flow purposes, the new guidance also retained the existing dual method, where cash payments for operating leases
84
are reflected in cash flows from operating activities and principal and interest payments for finance leases are reflected in cash flows from financing activities and cash flows from operating activities, respectively. The new guidance is effective for fiscal years beginning after December 15, 2018 and interim periods within those fiscal years. The new guidance requires the recognition and measurement of leases at the beginning of the earliest period presented using a modified retrospective approach. The use of the modified retrospective approach allows an entity to use a number of practical expedients in the application of this new guidance. Although the Company is evaluating the impact of adopting this guidance on its consolidated financial statements, the Company expects that most of its operating lease commitments will be recognized as operating lease liabilities and right-of-use assets upon adoption of the new guidance.
In March 2016, the FASB issued new guidance to simplify various aspects relating to accounting for stock-based compensation and related tax impacts, the classification of excess tax benefits on the statement of cash flows, statutory tax withholding requirements and other stock-based compensation classification matters. The guidance is effective for annual reporting periods beginning after December 15, 2016 and interim periods within those annual periods. Early adoption was permitted in any interim or annual period. All of the amendments in the new guidance must be adopted in the same period. The Company is required to adopt this guidance during the first quarter ending March 31, 2017. The Company expects to adopt a policy to account for forfeitures when they occur rather than estimate a forfeiture rate. The impact of this change in policy will be recorded as an adjustment to the January 1, 2017 accumulated deficit and additional paid-in capital balances, which the Company does not expect to be material. The new standard also requires the Company to record, on a prospective basis, the income tax effects of stock-based compensation awards in the income statement as discrete items in the reporting period in which they occur, which will increase volatility in the Company’s income tax provision in the future. In addition, any previously unrecognized tax benefits will be recorded as an adjustment to accumulated deficit, subject to assessment for the need for a valuation allowance, as of January 1, 2017. The Company had $36.7 million of net operating losses related to tax benefits for stock-based compensation awards as of December 31, 2016 which were not recorded as deferred tax assets. As the Company has a full valuation allowance against its deferred tax assets, the Company does not expect this new guidance relating to recording unrecognized tax benefits on the balance sheet will have a material impact on the Company’s balance sheet upon adoption.
In June 2016, the FASB issued guidance which requires that financial assets measured at amortized costs be presented at the net amount expected to be collected. This guidance amends the accounting for credit losses for available-for-sale securities and purchased financial assets with credit deterioration. This guidance is effective for annual periods beginning after December 15, 2019, and interim periods within those annual periods. Early adoption is permitted for any interim or annual period after December 15, 2018. The Company has not determined the impact of this guidance on its consolidated financial statements.
In August 2016, the FASB issued cash flow guidance which addresses eight specific cash flow issues with the objective of reducing the existing diversity in practice, including presentation of cash flows relating to contingent consideration payments, debt prepayment and debt extinguishment costs, among other matters. This guidance is effective for fiscal years beginning after December 15, 2017 and interim periods within those fiscal years. Early adoption is permitted, including adoption in an interim period. If adopted in an interim period, any adjustments should be reflected as of the beginning of the fiscal year that includes the interim period. The adoption of this guidance should be applied using a retrospective transition method to each period presented, unless impracticable to do so. The Company early adopted this during the fourth quarter of 2016 and, as a result, classified debt prepayment costs of $0.7 million incurred in November 2016 upon repayment in full of its credit facility as a financing cash outflow. The adoption of this guidance had no impact on amounts previously reported in prior years or the first three quarters within 2016.
In November 2016, the FASB issued guidance which requires that restricted cash and restricted cash equivalents be included with cash and cash equivalents when reconciling the beginning and ending total amounts shown on the statement of cash flows. This guidance is effective for fiscal years beginning after December 15, 2017, and interim periods within those years, and should be applied using a retrospective transition method to each period presented. Early adoption is permitted, including adoption in an interim period. If an entity early adopts the amendments in an interim period, any adjustments should be reflected as of the beginning of the fiscal year that includes that interim period. The Company’s restricted cash as of December 31, 2016 and 2015 was $0.4 million and therefore, the adoption of this guidance is not expected to have a material impact on the Company’s consolidated statements of cash flows.
In February 2017, the FASB issued guidance which simplifies the subsequent measurement of goodwill by no longer requiring an entity to determine goodwill impairment by calculating the implied fair value of goodwill by assigning the fair value of a reporting unit to all of its assets and liabilities as if that reporting unit had been acquired in a business combination. Under this new guidance, an entity would perform its goodwill impairment test by comparing the fair value of a reporting unit with its carrying amount and would recognize an impairment charge for the amount by which the carrying
85
amount exceeds the reporting unit’s fair value; however, the loss recognized would not exceed the total amount of goodwill allocated to that reporting unit. Additionally, an entity would consider income tax effects from any tax deductible goodwill on the carrying amount of the reporting unit when measuring the goodwill impairment loss, if applicable. Under the new guidance, an entity continues to have the option to perform the qualitative assessment for a reporting unit to determine if the quantitative impairment test is necessary. This guidance is effective for fiscal years beginning after December 15, 2019 and interim periods within those years. Early adoption is permitted for interim or annual goodwill impairment tests performed on testing dates after January 1, 2017. The adoption of this guidance is not expected to have a material impact on the Company’s consolidated financial statements.
Note 3—Property and equipment
Property and equipment consisted of the following at December 31, 2016 and 2015 (in thousands):
|
|
|
December 31, |
|
|||||
|
|
|
2016 |
|
|
2015 |
|
||
|
Computers and equipment |
|
$ |
3,287 |
|
|
$ |
2,173 |
|
|
Purchased software |
|
|
3,829 |
|
|
|
2,501 |
|
|
Furniture and fixtures |
|
|
1,725 |
|
|
|
1,852 |
|
|
Leasehold improvements |
|
|
6,888 |
|
|
|
7,670 |
|
|
Construction in progress |
|
|
523 |
|
|
|
1,274 |
|
|
|
|
|
16,252 |
|
|
|
15,470 |
|
|
Less: accumulated depreciation |
|
|
(4,934 |
) |
|
|
(3,051 |
) |
|
|
|
$ |
11,318 |
|
|
$ |
12,419 |
|
Depreciation expense was $3.1 million, $1.8 million and $1.1 million for the years ended December 31, 2016, 2015 and 2014, respectively.
Software and construction in progress includes assets held under capital lease of $1.6 million as of December 31, 2016 and 2015, reduced by related accumulated amortization thereon of $0.4 million and $0.1 million, respectively.
Note 4 – Business combination
On August 31, 2016, the Company acquired all the issued and outstanding capital stock of Runbook, a Netherlands-based provider of financial close automation software and integration solutions for SAP. The purpose of the acquisition was to enhance the Company’s position as a leading provider of software solutions to automate the financial close process for SAP customers and supports the Company’s European expansion strategy. The acquisition has been accounted for as a business combination under GAAP.
The total purchase consideration was approximately $34.1 million, subject to a final working capital adjustment, which was paid in cash. Upon the finalization of the working capital adjustment, the amount of the purchase price allocated to goodwill may change. A portion of the purchase price totaling $3.1 million, was paid into escrow for indemnification obligations relating to potential breach of representations and warranties of the sellers and any amounts remaining in escrow after satisfaction of any resolved claims, will be released from escrow on the one-year anniversary of the acquisition. Acquisition-related costs incurred by the Company of approximately $1.6 million were expensed as incurred and are included in general and administrative expenses in the consolidated statements of operations.
86
The following table summarizes the estimated fair values of the assets acquired and liabilities assumed as of the date of the acquisition (in thousands):
|
Total cash consideration to selling shareholders |
|
$ |
34,052 |
|
|
Assets acquired and liabilities assumed |
|
|
|
|
|
Cash and cash equivalents |
|
|
2,564 |
|
|
Accounts receivable |
|
|
2,518 |
|
|
Prepaid expenses and other current assets |
|
|
718 |
|
|
Property and equipment |
|
|
427 |
|
|
Intangible assets |
|
|
9,790 |
|
|
Accounts payable |
|
|
(285 |
) |
|
Accrued expenses and other current liabilities |
|
|
(376 |
) |
|
Deferred revenue |
|
|
(501 |
) |
|
Net deferred income tax liabilities |
|
|
(2,787 |
) |
|
Net assets |
|
|
12,068 |
|
|
Goodwill |
|
$ |
21,984 |
|
The Company believes the amount of goodwill resulting from the acquisition is primarily attributable to expected synergies from assembled workforce, an increase in development capabilities, increased offerings to customers, and enhanced opportunities for growth and innovation. The goodwill resulting from the acquisition is not tax deductible.
To determine the estimated fair value of intangible assets acquired, the Company engaged a third-party valuation specialist to assist management. The fair value measurements of the intangible assets were based primarily on significant unobservable inputs and thus represent a Level 3 measurement as defined in ASC 820. The acquired intangible asset categories, fair value and amortization periods, were as follows:
|
|
|
Amortization Period |
|
Fair Value (in thousands) |
|
|
|
Trade name |
|
1 year |
|
$ |
20 |
|
|
Developed technology |
|
8 years |
|
|
5,710 |
|
|
Non-compete agreements |
|
2 years |
|
|
180 |
|
|
Customer relationships |
|
10 years |
|
|
3,880 |
|
|
|
|
|
|
$ |
9,790 |
|
The weighted average lives of intangible assets at the acquisition date was 8.7 years.
Unaudited Pro forma information
The following table presents the Company’s unaudited pro forma information for the years ended December 31, 2016 and 2015 as if the acquisition occurred on January 1, 2015 (in thousands):
|
|
|
Year Ended |
|
|||||
|
|
|
December 31, |
|
|||||
|
|
|
2016 |
|
|
2015 |
|
||
|
Pro forma total revenues |
|
$ |
128,196 |
|
|
$ |
88,303 |
|
|
Pro forma net loss |
|
|
(39,000 |
) |
|
|
(28,161 |
) |
|
Pro forma net loss per share, basic and diluted |
|
|
(0.92 |
) |
|
|
(0.69 |
) |
The pro forma results reflect certain adjustments for the depreciation and amortization of the fair values of the intangible assets acquired, adjustments to revenue resulting from the fair value adjustment to deferred revenue, acquisition-related costs, and related tax adjustments. Such pro forma amounts are not necessarily indicative of the results that actually would have occurred had the acquisition been completed on the date indicated, nor is it indicative of the future operating results of the Company.
The total amount of Runbook revenue and net loss included in the Company’s consolidated results of operations from the date of acquisition to December 31, 2016 was $0.8 million and $1.7 million, respectively.
87
Note 5—Intangible assets and Goodwill
The carrying value of intangible assets as of December 31, 2016 and 2015 was as follows (in thousands):
|
|
|
December 31, 2016 |
|
|||||||||
|
|
|
Gross Carrying Amount |
|
|
Accumulated Amortization |
|
|
Net Carrying Amount |
|
|||
|
Trade name |
|
$ |
15,977 |
|
|
$ |
(5,361 |
) |
|
$ |
10,616 |
|
|
Developed technology |
|
|
42,558 |
|
|
|
(20,694 |
) |
|
|
21,864 |
|
|
Non-compete agreements |
|
|
4,520 |
|
|
|
(2,924 |
) |
|
|
1,596 |
|
|
Customer relationships |
|
|
31,783 |
|
|
|
(11,741 |
) |
|
|
20,042 |
|
|
|
|
$ |
94,838 |
|
|
$ |
(40,720 |
) |
|
$ |
54,118 |
|
|
|
|
December 31, 2015 |
|
|||||||||
|
|
|
Gross Carrying Amount |
|
|
Accumulated Amortization |
|
|
Net Carrying Amount |
|
|||
|
Trade name |
|
$ |
15,964 |
|
|
$ |
(3,727 |
) |
|
$ |
12,237 |
|
|
Developed technology |
|
|
36,844 |
|
|
|
(14,326 |
) |
|
|
22,518 |
|
|
Non-compete agreements |
|
|
4,341 |
|
|
|
(2,026 |
) |
|
|
2,315 |
|
|
Customer relationships |
|
|
27,894 |
|
|
|
(8,136 |
) |
|
|
19,758 |
|
|
|
|
$ |
85,043 |
|
|
$ |
(28,215 |
) |
|
$ |
56,828 |
|
Amortization expense is included in the following functional statement of operations expense categories. Amortization expense was as follows (in thousands):
|
|
|
Year ended December 31, |
|
|||||||||
|
|
|
2016 |
|
|
2015 |
|
|
2014 |
|
|||
|
Cost of revenue |
|
$ |
6,368 |
|
|
$ |
6,139 |
|
|
$ |
6,139 |
|
|
Sales and marketing |
|
|
3,605 |
|
|
|
3,487 |
|
|
|
3,487 |
|
|
General and administrative |
|
|
2,532 |
|
|
|
2,466 |
|
|
|
2,466 |
|
|
|
|
$ |
12,505 |
|
|
$ |
12,092 |
|
|
$ |
12,092 |
|
The following table presents the Company’s estimate of remaining amortization expense for each of the five succeeding fiscal years and thereafter for finite-lived intangible assets at December 31, 2016 (in thousands):
|
2017 |
|
$ |
13,285 |
|
|
2018 |
|
|
12,966 |
|
|
2019 |
|
|
10,280 |
|
|
2020 |
|
|
6,187 |
|
|
2021 |
|
|
5,024 |
|
|
Thereafter |
|
|
6,376 |
|
|
|
|
$ |
54,118 |
|
The change in the carrying amount of goodwill is as follows (in thousands):
|
Goodwill as of December 31, 2014 |
|
$ |
163,154 |
|
|
Activity during fiscal 2015 |
|
|
— |
|
|
Goodwill as of December 31, 2015 |
|
|
163,154 |
|
|
Acquisition of Runbook |
|
|
21,984 |
|
|
Goodwill as of December 31, 2016 |
|
$ |
185,138 |
|
88
Note 6—Accrued expenses and other current liabilities
At December 31, 2016 and 2015, accrued expenses and other current liabilities were comprised of the following (in thousands):
|
|
|
December 31, |
|
|||||
|
|
|
2016 |
|
|
2015 |
|
||
|
Accrued salary and employee benefits |
|
$ |
11,589 |
|
|
$ |
9,716 |
|
|
Accrued income and other taxes payable |
|
|
1,553 |
|
|
|
1,047 |
|
|
Short-term portion of capital lease |
|
|
992 |
|
|
|
558 |
|
|
Accrued commissions to third party partners |
|
|
2,081 |
|
|
|
2,305 |
|
|
Accrued initial public offering costs |
|
|
110 |
|
|
|
419 |
|
|
Accrued professional services costs |
|
|
454 |
|
|
|
16 |
|
|
Other accrued expenses |
|
|
2,152 |
|
|
|
951 |
|
|
|
|
$ |
18,931 |
|
|
$ |
15,012 |
|
Note 7—Term Loan
In September 2013, the Company entered into a $25 million term loan agreement (the “Term Loan”). The Term Loan had a term of five years and expired and was repayable on September 25, 2018. The Term Loan bore interest at (i) the greater of LIBOR or 1.5% plus (ii) 8%. In March 2016 and August 2016, the Company amended its credit facility to add an additional $5.0 million term loan (the “2016 Incremental Term Loan”) and to add an additional $30 million term loan (the “2016 Acquisition Term Loan”), respectively. Both the 2016 Incremental Term Loan and the 2016 Acquisition Term Loan had similar terms and conditions to the original Term Loan, and both were subject to prepayment penalties if the Company elected to repay the loans before the expiration date. The term loans bore interest at a rate of 9.5% per annum. Under the provisions of each term loan, the Company had the option to pay interest in varying amounts in cash or in payment in kind. For the years ended December 31, 2016, 2015 and 2014, interest of $1.8 million, $2.1 million and $2.0 million, respectively, was paid in kind, thereby increasing the outstanding principal. Interest paid in kind was due and payable at maturity of each term loan. In November 2016, the Company repaid in full all outstanding debt under the Company’s credit facility and terminated the agreement, as amended. In connection with the termination of the agreement, the Company paid a total of approximately $67.7 million, which included principal, accrued interest, paid in kind interest, and prepayment penalties. Prepayment penalties of $0.7 million were expensed to interest expense in November 2016 upon repayment and termination of the credit facility. Upon the termination of the credit facility, accumulated paid in kind interest of $6.4 million was repaid and has been classified in cash flows from operating activities.
The Company incurred $1.1 million, $0.2 million and $0.5 million in transaction costs and fees payable to the lender related to the issuance of the Term Loan, the 2016 Incremental Term Loan, and the 2016 Acquisition Term Loan, respectively. These amounts, net of amortization, had been presented as a discount against the carrying amount of the term loans. In November 2016, in connection with the repayment of the Company’s term loans and termination of its credit facility, the Company expensed the remaining unamortized debt issuance costs of $1.1 million to interest expense in the accompanying consolidated statements of operations.
In conjunction with Term Loan, the Company issued warrants to purchase 499,999 shares of common stock at an exercise price per share of $5.00. The warrants are exercisable at any time by the holder and expire upon the earlier of ten years from the issuance date or the sale of the Company. At December 31, 2016, the warrants remain outstanding. The carrying value of the Term Loan was reduced by the fair value of the warrants at issuance of $1.4 million. The resulting debt discount was being amortized over the term of the debt on a straight-line basis which approximates the effective interest method. The amortization of the debt discount was recorded in interest expense in the consolidated statements of operations. In November 2016, in connection with the repayment of the Company’s term loans and termination of its credit facility, the Company expensed the remaining unamortized debt issuance costs associated with the issuance of the warrants of $0.5 million to interest expense in the consolidated statements of operations.
89
The components of income (loss) before income taxes for the years ended December 31, 2016, 2015 and 2014 were as follows (in thousands):
|
|
|
Year ended December 31, |
|
|||||||||
|
|
|
2016 |
|
|
2015 |
|
|
2014 |
|
|||
|
United States |
|
$ |
(45,123 |
) |
|
$ |
(39,350 |
) |
|
$ |
(25,387 |
) |
|
International |
|
|
(623 |
) |
|
|
903 |
|
|
|
461 |
|
|
|
|
$ |
(45,746 |
) |
|
$ |
(38,447 |
) |
|
$ |
(24,926 |
) |
The components of the total benefit from income taxes for the years ended December 31, 2016, 2015 and 2014 were as follows (in thousands):
|
|
|
Year ended December 31, |
|
|||||||||
|
|
|
2016 |
|
|
2015 |
|
|
2014 |
|
|||
|
Current |
|
|
|
|
|
|
|
|
|
|
|
|
|
Federal |
|
$ |
— |
|
|
$ |
— |
|
|
$ |
— |
|
|
State |
|
|
5 |
|
|
|
7 |
|
|
|
1 |
|
|
International |
|
|
840 |
|
|
|
221 |
|
|
|
108 |
|
|
Total current tax expense |
|
|
845 |
|
|
|
228 |
|
|
|
109 |
|
|
Deferred |
|
|
|
|
|
|
|
|
|
|
|
|
|
Federal |
|
|
(6,086 |
) |
|
|
(12,468 |
) |
|
|
(7,111 |
) |
|
State |
|
|
(202 |
) |
|
|
(1,473 |
) |
|
|
(1,172 |
) |
|
International |
|
|
(1,144 |
) |
|
|
— |
|
|
|
— |
|
|
Total deferred tax benefit |
|
|
(7,432 |
) |
|
|
(13,941 |
) |
|
|
(8,283 |
) |
|
Total benefit from income taxes |
|
$ |
(6,587 |
) |
|
$ |
(13,713 |
) |
|
$ |
(8,174 |
) |
A reconciliation of the statutory U.S. federal income tax rate to the Company’s effective tax rate for the years ended December 31, 2016, 2015 and 2014 was as follows:
|
|
|
Year ended December 31, |
|
|||||||||
|
|
|
2016 |
|
|
2015 |
|
|
2014 |
|
|||
|
Federal statutory income tax rate |
|
|
34.0 |
% |
|
|
34.0 |
% |
|
|
34.0 |
% |
|
State tax, net of federal benefit |
|
|
3.0 |
% |
|
|
4.0 |
% |
|
|
3.1 |
% |
|
Federal tax credits |
|
|
1.2 |
% |
|
|
1.1 |
% |
|
|
0.6 |
% |
|
Change in valuation allowance |
|
|
(16.5 |
%) |
|
|
(2.3 |
%) |
|
|
— |
|
|
Common stock warrants |
|
|
(4.4 |
%) |
|
|
(0.4 |
%) |
|
|
(5.0 |
%) |
|
Other |
|
|
(2.9 |
%) |
|
|
(0.7 |
%) |
|
|
0.1 |
% |
|
|
|
|
14.4 |
% |
|
|
35.7 |
% |
|
|
32.8 |
% |
90
Significant components of the Company’s deferred tax assets and liabilities at December 31, 2016 and 2015 were as follows (in thousands):
|
|
|
Year ended December 31, |
|
|||||
|
|
|
2016 |
|
|
2015 |
|
||
|
Deferred tax assets |
|
|
|
|
|
|
|
|
|
Accrued expenses and other current liabilities |
|
$ |
1,065 |
|
|
$ |
1,147 |
|
|
Business credits |
|
|
2,913 |
|
|
|
1,962 |
|
|
Stock-based compensation |
|
|
4,393 |
|
|
|
2,488 |
|
|
Net operating loss carryover |
|
|
21,151 |
|
|
|
13,586 |
|
|
Other |
|
|
1,253 |
|
|
|
358 |
|
|
Total deferred tax assets |
|
|
30,775 |
|
|
|
19,541 |
|
|
Less: valuation allowance |
|
|
(8,489 |
) |
|
|
(887 |
) |
|
Deferred tax assets, net of valuation allowance |
|
|
22,286 |
|
|
|
18,654 |
|
|
Deferred tax liabilities |
|
|
|
|
|
|
|
|
|
Property and equipment |
|
|
(1,250 |
) |
|
|
(1,473 |
) |
|
Common stock warrants |
|
|
— |
|
|
|
(63 |
) |
|
Intangible assets |
|
|
(20,439 |
) |
|
|
(21,800 |
) |
|
Prepaid expenses |
|
|
(1,859 |
) |
|
|
(1,225 |
) |
|
Total deferred tax liabilities |
|
|
(23,548 |
) |
|
|
(24,561 |
) |
|
Net deferred taxes |
|
$ |
(1,262 |
) |
|
$ |
(5,907 |
) |
ASC 740 requires that the tax benefit of net operating losses, temporary differences and credit carryforwards be recorded as an asset to the extent that management assesses that realization is "more likely than not." A valuation allowance is recorded when it is more likely than not that some of the deferred tax assets will not be realized. Realization of future tax benefits is dependent on the Company’s ability to generate sufficient taxable income within the carryforward period. For financial reporting purposes, the Company has incurred losses for each of the past three years. Based on available objective evidence, including the company’s history of losses, management believes it is more likely than not that the net deferred tax assets will not be fully realizable. Accordingly, the Company provided a valuation allowance against its federal and state deferred tax assets. The Company’s foreign tax jurisdictions were in a net deferred tax liability position as of December 31, 2016.
The change in the valuation allowance for the years ended December 31, 2016 and 2015 was as follows (in thousands). There was no valuation allowance for the year ended December 31, 2014.
|
|
|
December 31, 2016 |
|
|||||
|
|
|
2016 |
|
|
2015 |
|
||
|
Valuation allowance, at beginning of year |
|
$ |
887 |
|
|
$ |
— |
|
|
Increase in valuation allowance |
|
|
7,602 |
|
|
|
887 |
|
|
Valuation allowance, at end of year |
|
$ |
8,489 |
|
|
$ |
887 |
|
The Company did not provide for United States income taxes on the undistributed earnings and other outside temporary differences of foreign subsidiaries as they are considered indefinitely reinvested outside the United States. As of December 31, 2016 and 2015 the amount of temporary differences related to undistributed earnings and other outside temporary differences upon which United States income taxes have not been provided is immaterial to these consolidated financial statements.
As of December 31, 2016, the Company had consolidated federal and state net operating loss carryforwards available to offset future taxable income of approximately $94.7 million and $90.9 million, respectively. The federal losses will begin to expire in 2033, and the state losses will begin to expire between 2023 and 2033, depending on the jurisdiction. The Company has federal research and development credits and foreign tax credits of $1.1 million and $0.6 million, respectively, which begin to expire on 2033 and 2023, respectively. The Company has state research and development credits and enterprise zone credits of $1.8 million and $0.6 million, respectively, which are indefinite in expiration and begin to expire by 2023, respectively. Pursuant to Internal Revenue Code Section 382, use of the Company’s net operating loss carryforwards may be limited if the Company experiences a cumulative change in ownership of more than 50% over a three-year period.
91
At December 31, 2016, $36.7 million of net operating losses related to tax benefits for stock-based compensation resulting from gains that certain individual option holders experienced from the exercise are not included in the deferred tax assets.
The following is a roll forward of the Company’s total gross unrecognized tax benefits (in thousands):
|
Total Gross unrecognized tax benefits, December 31, 2013 |
|
$ |
153 |
|
|
Increase related to positions taken in the year ended December 31, 2014 |
|
|
35 |
|
|
Total gross unrecognized tax benefits, December 31, 2014 |
|
|
188 |
|
|
Increase related to positions taken in the year ended December 31, 2015 |
|
|
90 |
|
|
Total gross unrecognized tax benefits, December 31, 2015 |
|
|
278 |
|
|
Increase related to positions taken in the year ended December 31, 2016 |
|
|
104 |
|
|
Total gross unrecognized tax benefits, December 31, 2016 |
|
$ |
382 |
|
As of December 31, 2016, the realization of unrecognized tax benefits are not expected to impact the effective rate due to a full valuation on federal and state deferred taxes. The Company has not recorded any interest or penalties in its benefit from income taxes for the years ended December 31, 2016, 2015 and 2014 and no such amounts have been accrued as of December 31, 2016 and 2015.
The Company files U.S. federal, various state and foreign income tax returns. In the normal course of business, the Company is subject to examination by taxing authorities. The tax years 2013, 2014, and 2015 remain subject to examination for federal purposes. Generally, state and foreign tax authorities may examine the Company’s tax returns for four years and five years, respectively, from the date an income tax return is filed. However, the taxing authorities may continue to adjust the Company’s federal and state net operating loss carryforwards until the statute of limitations closes on the tax years in which the federal and state net operating losses are utilized.
The consolidated federal tax filings are under examination by the Internal Revenue Service for the 2014 tax year. The Company does not anticipate any material adjustments as a result of the examination. While it is often difficult to predict the outcome or the timing or resolution of any particular tax position, the Company believes no reserves for income taxes are necessary as a result of this audit.
The Company does not anticipate either material changes in the total amount or composition of its unrecognized tax benefits within 12 months of the reporting date.
Note 9—Contingent consideration
On September 3, 2013, the Company acquired BlackLine Systems, Inc. Under the terms of the acquisition agreement, BlackLine Systems, Inc.’s option holders were allowed to cancel their stock option rights and receive a cash payment equal to the amount of calculated gain (less applicable expense and other items) had they exercised their stock options and then sold their common shares as part of the acquisition. As a condition of the acquisition, the Company is required to pay additional cash consideration to certain equity holders if the Company realizes a tax benefit from the use of net operating losses generated from the stock option exercises concurrent with the acquisition. The maximum contingent cash consideration to be distributed is $8.0 million. The fair value of the contingent consideration was $5.2 million and $4.9 million as of December 31, 2016 and 2015, respectively. See Note 2—Significant accounting policies—Fair value of financial instruments for additional information regarding the valuation of the contingent consideration.
92
Note 10—Commitments and contingencies
Operating leases—The Company has various non-cancelable operating leases for its corporate and international offices. These leases expire at various times through 2023. Certain lease agreements contain renewal options, rent abatement and escalation clauses. The Company recognizes rent expense on a straight-line basis over the lease term, commencing when the Company takes possession of the property. Certain of the Company’s office leases entitle the Company to receive a tenant allowance from the landlord. The Company records tenant allowances as a deferred rent credit, which the Company amortizes on a straight-line basis, as a reduction of rent expense, over the term of the underlying lease. Total rent expense under the operating leases was approximately $2.9 million, $2.5 million and $1.8 million for the years ended December 31, 2016, 2015 and 2014, respectively.
Future minimum lease payments under non-cancelable operating leases are as follows for the years ended December 31 (in thousands):
|
2017 |
|
$ |
3,830 |
|
|
2018 |
|
|
2,616 |
|
|
2019 |
|
|
2,232 |
|
|
2020 |
|
|
1,963 |
|
|
2021 |
|
|
1,831 |
|
|
Thereafter |
|
|
2,122 |
|
|
|
|
$ |
14,594 |
|
Capital leases—The Company leases computer software from various parties under capital lease agreements. Outstanding principal payments under capital lease obligations were $1.0 million as of December 31, 2016, which is payable in full in 2017.
Litigation—From time to time, the Company may become subject to legal proceedings, claims and litigation arising in the ordinary course of business. The Company is not currently a party to any legal proceedings, nor is it aware of any pending or threatened litigation, that would have a material adverse effect on the Company’s business, operating results, cash flows, or financial condition should such litigation be resolved unfavorably.
Indemnification—In the ordinary course of business, the Company may provide indemnification of varying scope and terms to customers, vendors, investors, directors, and officers with respect to certain matters, including, but not limited to, losses arising out of our breach of such agreements, services to be provided by the Company, or from intellectual property infringement claims made by third parties. These indemnification provisions may survive termination of the underlying agreement and the maximum potential amount of future payments the Company could be required to make under these indemnification provisions may not be subject to maximum loss clauses. The maximum potential amount of future payments the Company could be required to make under these indemnification provisions is indeterminable. The Company has never paid a material claim, nor has it been sued in connection with these indemnification arrangements. As of December 31, 2016 and 2015, the Company has not accrued a liability for these indemnification arrangements because the likelihood of incurring a payment obligation, if any, in connection with these indemnification arrangements was not probable or reasonably estimable.
Note 11—Capitalization
As of December 31, 2016, the authorized capital stock of the Company consisted of 500 million shares of common stock and 50 million shares of preferred stock. No shares of preferred stock are issued and outstanding at December 31, 2016. The board of directors can determine the voting rights, dividend rights, conversion rights, redemption privileges and liquidation preferences of the preferred stock.
As of December 31, 2016, the Company had reserved for issuance 7.1 million shares of common stock from its available but unissued authorized shares, consisting of 5.9 million shares issuable upon the exercise of stock options under the Company’s 2014 and 2016 Equity Incentive plans, 0.7 million shares issuable upon the exercise of performance-based stock options, and warrants to purchase 0.5 million shares of common stock.
On January 14, 2016, the board of directors approved the retirement of 47,000 shares of treasury stock.
93
In September 2016, the Company raised gross proceeds of $3.1 million from the sale of 192,187 shares of common stock to former Runbook employees.
On November 2, 2016, the Company completed its initial public offering in which it issued and sold 9,890,000 shares of its common stock, which included the exercise in full of the underwriters’ option to purchase an additional 1,290,000 shares at an initial offering price of $17.00 per share. The Company received proceeds from the offering of approximately $151.9 million after deducting underwriting discounts and commissions and other offering expenses.
Note 12—Stock options
2014 and 2016 Plans
On March 3, 2014, the Company adopted the 2014 Stock Incentive Plan (the “2014 Plan”). In November 2016, upon the completion of the Company’s initial public offering, the Company adopted the 2016 Equity Incentive Plan (the “2016 Plan”) and determined that it will no longer grant any additional awards under the 2014 Plan. However, the 2014 Plan continues to govern the terms and conditions of the outstanding awards previously granted under the 2014 plan. Upon the adoption of the 2016 Plan, the maximum number of shares issuable was 6.2 million, plus a number of shares equal to the number of shares subject to outstanding awards granted under the 2014 Plan after the date the 2014 Plan is terminated without having been exercised in full. The Company’s board of directors may grant stock options to employees, directors and consultants under the 2016 Plan. The aggregate number of shares available under the 2016 Plan and the number of shares subject to outstanding options automatically adjusts for any changes in the Company’s outstanding common stock by reason of any recapitalization, spin-off, reorganization, reclassification, stock dividend, stock split, reverse stock split, or similar transaction. Stock options generally vest over four years and have contractual terms of ten years.
As of December 31, 2016, 6,188,425 shares were available for issuance under the 2016 Plan.
Stock options with service-only vesting conditions
A summary of the Company’s stock option activity and related information for the year ended December 31, 2016 for awards that contain service-only vesting conditions was as follows:
|
|
|
Shares |
|
|
Weighted Average Exercise Price |
Weighted Average Remaining Contractual Term (Years) |
|
|
Aggregate Intrinsic Value (in thousands) |
|
||||||
|
Outstanding at December 31, 2015 |
|
|
5,904,376 |
|
|
$ |
8.62 |
|
|
|
8.6 |
|
|
$ |
37,788 |
|
|
Granted |
|
|
1,072,920 |
|
|
|
14.65 |
|
|
|
|
|
|
|
|
|
|
Exercised |
|
|
(522,450 |
) |
|
|
5.84 |
|
|
|
|
|
|
|
|
|
|
Forfeited |
|
|
(580,660 |
) |
|
|
7.47 |
|
|
|
|
|
|
|
|
|
|
Outstanding at December 31, 2016 |
|
|
5,874,186 |
|
|
$ |
10.09 |
|
|
|
8.0 |
|
|
$ |
103,038 |
|
|
Exercisable at December 31, 2016 |
|
|
1,925,687 |
|
|
$ |
7.79 |
|
|
|
7.5 |
|
|
$ |
38,212 |
|
|
Vested and expected to vest at December 31, 2016 |
|
|
5,506,193 |
|
|
$ |
10.05 |
|
|
|
8.0 |
|
|
$ |
96,799 |
|
The weighted average grant date fair value per share of options granted during the years ended December 31, 2016 and 2015 that contain service only vesting conditions were $6.78 and $7.04, respectively. The aggregate intrinsic value of options exercised that contain service only vesting conditions during the years ended December 31, 2016 and 2015 were $4.8 million and $2.6 million, respectively.
Unrecognized compensation expense relating to stock options that contain service only vesting conditions was $15.8 million at December 31, 2016, which is expected to be recognized over a weighted-average period of 2.6 years.
Stock options with performance conditions
In October 2016, the Company granted options to purchase 682,800 shares of common stock at an exercise price of $14.00 per share to two executive officers that vest upon meeting certain performance conditions and continued service. The performance conditions include meeting yearly cash flow targets and cumulative annual recurring revenue targets through 2019. If each yearly cash flow target is met through 2019, but the full cumulative annual recurring target through 2019 is not met, the executive officers are still able to vest in the award if an additional cash flow target for 2020 and a
94
cumulative annual recurring revenue target through 2020 are achieved. The cash flow performance targets for each year are determined concurrently with the annual budget process and because each yearly target has not yet been set, no grant date for the options has been established. As of December 31, 2016, the Company has determined that the achievement of the performance targets is not probable and, accordingly, no stock-based compensation expense has been recorded for these awards. To the extent that the awards become probable of vesting prior to the grant date, the amount of compensation cost to be recognized will be based on the then fair value of the options. The fair value of the options will be remeasured each period until a grant date has been established. Accordingly, stock-based compensation cost, if any, to be recognized will depend on the value of the stock options when all performance conditions have been set and whether the performance conditions are probable of being achieved. Based on the Company’s stock price as of December 31, 2016, the cumulative unrecognized stock compensation cost relating to these awards is approximately $12 million.
Stock-based compensation expense
Stock-based compensation expense for stock option awards for the years ended December 31, 2016, 2015 and 2014 was as follows (in thousands):
|
|
|
Year ended December 31, |
|
|||||||||
|
|
|
2016 |
|
|
2015 |
|
|
2014 |
|
|||
|
Cost of revenues |
|
$ |
715 |
|
|
$ |
466 |
|
|
$ |
249 |
|
|
Sales and marketing |
|
|
2,490 |
|
|
|
2,418 |
|
|
|
1,059 |
|
|
Research and development |
|
|
809 |
|
|
|
588 |
|
|
|
229 |
|
|
General and administrative |
|
|
2,512 |
|
|
|
2,025 |
|
|
|
480 |
|
|
|
|
$ |
6,526 |
|
|
$ |
5,497 |
|
|
$ |
2,017 |
|
Note 13—Defined contribution plan
The Company sponsors a defined contribution retirement plan (the “Plan”) that covers substantially all domestic employees. The Company makes matching contributions of 100% of each $1 of the employee’s contribution up to the first 3% of the employee’s bi-weekly compensation and 50% of each $1 of the employee’s contribution up to the next 2% of the employee’s bi-weekly compensation. Matching contributions to the Plan totaled $2.3 million, $1.7 million and $0.9 million for the years ended December 31, 2016, 2015 and 2014, respectively.
Note 14—Related party transactions
As of December 31, 2015, the Company accrued for costs of third party legal services incurred on behalf of Silver Lake Sumeru, ICONIQ Capital Group, L.P., another significant shareholder, and the Company’s Chief Marketing Officer relating to the Company’s initial public offering and other corporate related matters. Total amounts accrued at December 31, 2015 were $0.2 million, of which $0.1 million were expensed during 2015 and $0.1 million were included in other assets as deferred offering costs. The Company had no material related party transactions for the year ended December 31, 2016.
Note 15—Geographic information
Revenue by region is classified based on the country of the customer’s contracting office. The following table sets forth the Company’s revenue by geographic region (in thousands):
|
|
|
Year ended December 31, |
|
|||||||||
|
|
|
2016 |
|
|
2015 |
|
|
2014 |
|
|||
|
United States |
|
$ |
102,896 |
|
|
$ |
71,832 |
|
|
$ |
45,039 |
|
|
International |
|
|
20,227 |
|
|
|
11,775 |
|
|
|
6,638 |
|
|
|
|
$ |
123,123 |
|
|
$ |
83,607 |
|
|
$ |
51,677 |
|
95
The following table sets forth the Company’s property and equipment, net by geographic region (in thousands):
|
|
|
December 31, |
|
|||||
|
|
|
2016 |
|
|
2015 |
|
||
|
United States |
|
$ |
10,602 |
|
|
$ |
12,108 |
|
|
International |
|
|
716 |
|
|
|
311 |
|
|
|
|
$ |
11,318 |
|
|
$ |
12,419 |
|
No countries outside the United States represented greater than 10% of total revenues.
Note 16—Unaudited quarterly data
The following table sets forth unaudited quarterly consolidated statements of operations data for each of the eight quarters in the period ended December 31, 2016. The Company has prepared the unaudited quarterly consolidated statements of operations data on a basis consistent with the audited annual consolidated financial statements. In the opinion of management, the financial information in this table reflects all adjustments, consisting of normal and recurring adjustments, necessary for the fair statement of this data.
|
|
|
Quarter Ended |
|
|||||||||||||||||||||||||||||
|
|
|
2016 |
|
|
2015 |
|
||||||||||||||||||||||||||
|
|
|
December 31, |
|
|
September 30, |
|
|
June 30, |
|
|
March 31, |
|
|
December 31, |
|
|
September 30, |
|
|
June 30, |
|
|
March 31, |
|
||||||||
|
|
|
(in thousands, except per share data) |
|
|||||||||||||||||||||||||||||
|
Revenues |
|
$ |
35,340 |
|
|
$ |
32,196 |
|
|
$ |
29,026 |
|
|
$ |
26,561 |
|
|
$ |
24,474 |
|
|
$ |
21,661 |
|
|
$ |
19,425 |
|
|
$ |
18,047 |
|
|
Gross profit |
|
|
26,673 |
|
|
|
24,655 |
|
|
|
21,963 |
|
|
|
19,621 |
|
|
|
18,127 |
|
|
|
15,718 |
|
|
|
13,939 |
|
|
|
13,094 |
|
|
Net loss |
|
$ |
(15,664 |
) |
|
$ |
(6,619 |
) |
|
$ |
(7,541 |
) |
|
$ |
(9,335 |
) |
|
$ |
(7,207 |
) |
|
$ |
(6,735 |
) |
|
$ |
(6,538 |
) |
|
$ |
(4,254 |
) |
|
Net loss per share, basic and diluted |
|
$ |
(0.33 |
) |
|
$ |
(0.16 |
) |
|
$ |
(0.19 |
) |
|
$ |
(0.23 |
) |
|
$ |
(0.18 |
) |
|
$ |
(0.17 |
) |
|
$ |
(0.16 |
) |
|
$ |
(0.11 |
) |
96
None.
Evaluation of Disclosure Controls and Procedures
Disclosure controls and procedures, as defined in Rules 13a-15(e) and 15d-15(e) under the Exchange Act, means controls and other procedures of a company that are designed to provide reasonable assurance that information required to be disclosed by a company in the reports that it files or submits under the Securities Exchange Act, as amended, or “the Exchange Act,” is recorded, processed, summarized, and reported, within the time periods specified in the SEC’s rules and forms; and that such information is accumulated and communicated to the company’s management, including its principal executive officer and principal financial officer, as appropriate, to allow timely decisions regarding required disclosure. Our management, with the participation of our principal executive officer and principal financial officer, evaluated the effectiveness of our disclosure controls and procedures as of December 31, 2016, the last day of the period covered by this Annual Report. Based on this evaluation, our principal executive officer and principal financial officer have concluded that, as of December 31, 2016, our disclosure controls and procedures were effective at the reasonable assurance level.
Limitations on the Effectiveness of Controls and Procedures
In designing and evaluating our disclosure controls and procedures, our management recognizes that any controls and procedures, no matter how well designed and operated, can provide only reasonable, not absolute, assurance of achieving the desired control objectives. In addition, the design of disclosure controls and procedures must reflect the fact that there are resource constraints and our management is required to apply judgment in evaluating the benefits of possible controls and procedures relative to their costs. The design of any disclosure controls and procedures also is based in part upon certain assumptions about the likelihood of future events, and there can be no assurance that any design will succeed in achieving its stated goals under all potential future conditions.
Management’s Annual Report on Internal Control over Financial Reporting
This Annual Report on Form 10-K does not include a report of management’s assessment regarding internal control over financial reporting or an attestation report of our independent registered public accounting firm due to a transition period established by SEC rules and regulations for newly public companies.
Changes in Internal Control over Financial Reporting
Other than the actions taken to improve our internal control over financial reporting as summarized below, there were no changes in our internal control over financial reporting identified in connection with the evaluation required by Rules 13a-15(d) and 15d-15(d) under the Exchange Act that occurred during the quarter ended December 31, 2016 that have materially affected, or are reasonably likely to materially affect, our internal control over financial reporting.
Remediation of Previously-Identified Material Weaknesses in Internal Control over Financial Reporting
As we previously disclosed, during 2015, we identified material weaknesses in our internal control over financial reporting. A material weakness is a deficiency, or a combination of deficiencies, in internal control over financial reporting such that there is a reasonable possibility that a material misstatement of our annual or interim consolidated financial statements will not be prevented or detected on a timely basis. The material weaknesses identified related to an insufficient complement of resources with an appropriate level of accounting knowledge, experience and training commensurate with our structure and financial reporting requirements. This lack of an effective control environment contributed to material weaknesses from the lack of controls over the selection of certain accounting policies and procedures and segregation of duties. Specifically, we did not have policies and controls designed to address the accounting for unusual or complex transactions, or the initial selection of, and the ongoing monitoring of changes in, accounting policies. Further, we did not maintain sufficiently designed segregation of duties, including controls over journal entries such that there was a reasonable possibility that a material misstatement would not be prevented or detected on a timely basis.
97
In response to the identified material weaknesses, we took a number of actions to improve our internal control over financial reporting during the year ended December 31, 2016, including the following:
|
|
1. |
We hired additional personnel in our accounting and finance department with extensive knowledge in accounting and financial reporting; |
|
|
2. |
We developed and implemented a financial reporting risk assessment and formalization of accounting policies and procedures; |
|
|
3. |
We created additional internal reporting procedures, including those designed to enhance our review processes; |
|
|
4. |
We increased segregation of duties, including controls over journal entries; |
|
|
5. |
We organized and implemented a Disclosure Committee to review our transactions each quarter with key management and operational personnel, which includes the review and discussion of unusual, complex and non-routine transactions; and |
|
|
6. |
We prepared memoranda addressing accounting considerations of significant new transactions, which was reviewed by the principal accounting officer. |
Management believes that these and other actions taken during the year ended December 31, 2016 have been fully implemented and are operating effectively. As a result, we have concluded that our remediation efforts have been successful, and that the previously-identified material weaknesses in our internal controls have been remediated. However, while these material weaknesses have been remediated, we continue to seek improvements to enhance our control environment and to strengthen our internal controls to provide reasonable assurance that our financial statements continue to be fairly stated in all material respects.
None.
The information required by this item will be included in our Definitive Proxy Statement for the 2017 Annual Meeting of Stockholders to be filed with the Securities and Exchange Commission, or the SEC, within 120 days of the fiscal year ended December 31, 2016, and is incorporated herein by reference.
The information required by this item will be included in our Definitive Proxy Statement for the 2017 Annual Meeting of Stockholders to be filed with the SEC within 120 days of the fiscal year ended December 31, 2016, and is incorporated herein by reference.
|
Item 12. |
Security Ownership of Certain Beneficial Owners and Management and Related Stockholder Matters |
The information required by this item will be included in our Definitive Proxy Statement for the 2017 Annual Meeting of Stockholders to be filed with the SEC within 120 days of the fiscal year ended December 31, 2016, and is incorporated herein by reference.
The information required by this item will be included in our Definitive Proxy Statement for the 2017 Annual Meeting of Stockholders to be filed with the SEC within 120 days of the fiscal year ended December 31, 2016, and is incorporated herein by reference.
98
The information required by this item will be included in our Definitive Proxy Statement for the 2017 Annual Meeting of Stockholders to be filed with the SEC within 120 days of the fiscal year ended December 31, 2016, and is incorporated herein by reference.
With the exception of the information incorporated in Items 10, 11, 12, 13, and 14 of this Annual Report on Form 10-K, our Definitive Proxy Statement for the 2017 Annual Meeting of Stockholders to be filed with the SEC within 120 days of the fiscal year ended December 31, 2016 is not deemed “filed” as part of this Annual Report on Form 10-K.
99
Documents filed as part of this report are as follows:
|
|
1. |
Consolidated Financial Statements: |
Our Consolidated Financial Statements are listed in the “Index to Consolidated Financial Statements” under Part II, Item 8 of this Annual Report on Form 10-K.
|
|
2. |
Financial Statement Schedules: |
Financial Statement Schedules have been omitted as information required is inapplicable or the information is presented in the consolidated financial statements and the related notes.
|
|
3. |
Exhibits: |
The documents listed in the Exhibit Index immediately following the signature page of this Annual Report on Form 10-K are incorporated by reference or are filed or furnished with this Annual Report on Form 10-K, in each case as indicted therein (numbered in accordance with Item 601 of Regulation S-K).
Not applicable.
100
Pursuant to the requirements of Section 13 or 15(d) of the Securities Exchange Act of 1934, the Registrant has duly caused this Annual Report on Form 10-K to be signed on its behalf by the undersigned, thereunto duly authorized, on March 10, 2017.
|
BLACKLINE, INC. |
|
|
|
|
|
By: |
/s/ Therese Tucker |
|
Name: |
Therese Tucker |
|
Title: |
Chief Executive Officer |
POWER OF ATTORNEY
Each person whose signature appears below constitutes and appoints Therese Tucker and Mark Partin, and each of them, as his or her true and lawful attorney-in-fact and agent, with full power of substitution and resubstitution, for him or her and in his or her name, place and stead, in any and all capacities, to sign any and all amendments to this Annual Report on Form 10-K, and to file the same, with all exhibits thereto, and other documents in connection therewith, with the Securities and Exchange Commission, granting unto said attorneys-in-fact and agents, and each of them, full power and authority to do and perform each and every act and thing requisite and necessary to be done in connection therewith, as fully to all intents and purposes as he or she might or could do in person, hereby ratifying and confirming all that said attorneys-in-fact and agents, or any of them, or their or his substitutes, may lawfully do or cause to be done by virtue thereof.
Pursuant to the requirements of the Securities Exchange Act of 1934, this report has been signed below by the following persons on behalf of the Company and in the capacities and on the dates indicated:
|
|
|||
|
|
|
|
|
|
Signature |
|
Title |
|
Date |
|
|
|
|
|
|
|
/s/ Therese Tucker |
|
Chief Executive Officer and Director (Principal Executive Officer) |
|
March 10, 2017 |
|
Therese Tucker |
|
|
|
|
|
|
|
|
|
|
|
/s/ Mark Partin |
|
Chief Financial Officer (Principal Financial Officer) |
|
March 10, 2017 |
|
Mark Partin |
|
|
|
|
|
|
|
|
|
|
|
/s/ Patrick Villanova |
|
VP, Corporate Controller (Principal Accounting Officer) |
|
March 10, 2017 |
|
Patrick Villanova |
|
|
|
|
|
|
|
|
|
|
|
/s/ Jason Babcoke |
|
Director |
|
March 10, 2017 |
|
Jason Babcoke |
|
|
|
|
|
|
|
|
|
|
|
/s/ John Brennan |
|
Director |
|
March 10, 2017 |
|
John Brennan |
|
|
|
|
|
|
|
|
|
|
|
/s/ William Griffith |
|
Director |
|
March 10, 2017 |
|
William Griffith |
|
|
|
|
|
|
|
|
|
|
|
/s/ Hollie Haynes |
|
Director |
|
March 10, 2017 |
|
Hollie Haynes |
|
|
|
|
|
|
|
|
|
|
|
|
|
|||
|
|
|
|
|
|
|
/s/ Graham Smith |
|
Director |
|
March 10, 2017 |
|
Graham Smith |
|
|
|
|
|
|
|
|
|
|
|
/s/ Mario Spanicciati |
|
Director |
|
March 10, 2017 |
|
Mario Spanicciati |
|
|
|
|
|
|
|
|
|
|
|
/s/ Thomas Unterman |
|
Director |
|
March 10, 2017 |
|
Thomas Unterman |
|
|
|
|
101
|
Exhibit |
|
Incorporated by Reference |
|||
|
Number |
Description |
Form |
File No. |
Exhibit |
Filing Date |
|
2.1 |
Agreement and Plan of Merger, by and among SLS Breeze Holdings, Inc., SLS Breeze Intermediate Holdings, Inc., SLS Breeze Merger Sub, Inc. and BlackLine Systems, Inc., dated as of August 9, 2013 |
S-1 |
333-213899 |
2.1 |
September 30, 2016 |
|
|
|
|
|
|
|
|
3.1 |
Certificate of Amendment to the Second Amended and Restated Certificate of Incorporation of the Registrant, effecting a one-for-five reverse stock split. |
S-1/A |
333-213899 |
3.2 |
October 17, 2016 |
|
|
|
|
|
|
|
|
3.2 |
Amended and Restated Certificate of Incorporation of the Registrant. |
10-Q |
3.2 |
December 12, 2016 |
|
|
|
|
|
|
|
|
|
3.3 |
Amended and Restated Bylaws of the Registrant. |
10-Q |
001-37924 |
3.3 |
December 12, 2016 |
|
|
|
|
|
|
|
|
4.1 |
Specimen Common Stock Certificate of the Company. |
S-1 |
333-213899 |
4.1 |
September 30, 2016 |
|
|
|
|
|
|
|
|
4.2 |
Amended and Restated Stockholders’ Agreement, by and among the Registrant, Silver Lake Sumeru, Iconiq, Therese Tucker and Mario Spanicciati. |
10-Q |
001-37924 |
4.2 |
December 12, 2016 |
|
|
|
|
|
|
|
|
4.3 |
Amended and Restated Registration Rights Agreement, by and among the Registrant, Silver Lake Sumeru, Iconiq, Therese Tucker and Mario Spanicciati. |
10-Q |
001-37924 |
4.3 |
December 12, 2016 |
|
|
|
|
|
|
|
|
4.4 |
Warrant to Purchase Stock held by Special Value Continuation Partners, LP, dated as of September 25, 2013. |
S-1 |
333-213899 |
4.2 |
September 30, 2016 |
|
|
|
|
|
|
|
|
4.5 |
Warrant to Purchase Stock held by Tennenbaum Opportunities Fund VI, LLC, dated as of September 25, 2013. |
S-1 |
333-213899 |
4.3 |
September 30, 2016 |
|
|
|
|
|
|
|
|
4.6 |
Warrant to Purchase Stock held by Tennenbaum Senior Loan Fund II, LP, dated as of September 25, 2013. |
S-1 |
333-213899 |
4.4 |
September 30, 2016 |
|
|
|
|
|
|
|
|
4.7 |
Warrant to Purchase Stock held by Tennenbaum Senior Loan SPV III, LLC, dated as of September 25, 2013. |
S-1 |
333-213899 |
4.5 |
September 30, 2016 |
|
|
|
|
|
|
|
|
4.8 |
Warrant to Purchase Stock held by Tennenbaum Senior Loan Fund IV-B, LP, dated as of September 25, 2013. |
S-1 |
333-213899 |
4.6 |
September 30, 2016 |
|
|
|
|
|
|
|
|
4.9 |
Subscription Agreement, by and between the Company and Iconiq, dated as of October 21, 2014. |
S-1 |
333-213899 |
4.7 |
September 30, 2016 |
|
|
|
|
|
|
|
|
10.1* |
Software Development Cooperation Agreement, by and between the Company and SAP AG, effective as of October 1, 2013. |
S-1 |
333-213899 |
10.1 |
September 30, 2016 |
|
|
|
|
|
|
|
|
10.2+ |
2014 Equity Incentive Plan and form of equity agreements thereunder. |
S-1 |
333-213899 |
10.6 |
September 30, 2016 |
|
|
|
|
|
|
|
|
10.3+ |
Amendment No. 1 to the 2014 Equity Incentive Plan. |
S-1 |
333-213899 |
10.7 |
September 30, 2016 |
|
|
|
|
|
|
|
102
|
Exhibit |
|
Incorporated by Reference |
|||
|
Number |
Description |
Form |
File No. |
Exhibit |
Filing Date |
|
Amendment No. 2 to the 2014 Equity Incentive Plan. |
S-1 |
333-213899 |
10.8 |
September 30, 2016 |
|
|
|
|
|
|
|
|
|
10.5+ |
Amendment No. 3 to the 2014 Equity Incentive Plan. |
S-1 |
333-213899 |
10.9 |
September 30, 2016 |
|
|
|
|
|
|
|
|
10.6+ |
2016 Equity Incentive Plan and the form of equity award agreements thereunder. |
S-1/A |
333-213899 |
10.10 |
October 17, 2016 |
|
|
|
|
|
|
|
|
10.7+ |
Employee Incentive Compensation Plan of the Company. |
S-1 |
333-213899 |
10.11 |
September 30, 2016 |
|
|
|
|
|
|
|
|
10.8+ |
Form of 2015 Executive Officer Bonus Plan. |
S-1 |
333-213899 |
10.12 |
September 30, 2016 |
|
|
|
|
|
|
|
|
10.9+ |
Form of Change of Control and Severance Policy. |
S-1 |
333-213899 |
10.13 |
September 30, 2016 |
|
|
|
|
|
|
|
|
10.10+ |
Executive Employment Agreement, by and between the Registrant and Therese Tucker, effective as of January 1, 2016. |
S-1 |
333-213899 |
10.14 |
September 30, 2016 |
|
|
|
|
|
|
|
|
10.11+ |
2015 Chief Executive Officer (CEO) Bonus Plan, by and between the Company and Therese Tucker, dated as of February 5, 2016. |
S-1 |
333-213899 |
10.15 |
September 30, 2016 |
|
|
|
|
|
|
|
|
10.12+ |
Employment Offer Letter, by and between the Company and Karole Morgan-Prager, dated as of May 4, 2015. |
S-1 |
333-213899 |
10.16 |
September 30, 2016 |
|
|
|
|
|
|
|
|
10.13+ |
2015 Chief Legal Officer (CLO) Bonus Plan, by and between the Company and Karole Morgan-Prager, dated as of December 29, 2015. |
S-1 |
333-213899 |
10.17 |
September 30, 2016 |
|
|
|
|
|
|
|
|
10.14+ |
Confirmatory Offer Letter, by and between the Registrant and Karole Morgan-Prager, dated as of September 29, 2016. |
S-1 |
333-213899 |
10.18 |
September 30, 2016 |
|
|
|
|
|
|
|
|
10.15+ |
Employment Offer Letter, by and between the Company and Mark Partin, dated as of December 25, 2014. |
S-1 |
333-213899 |
10.19 |
September 30, 2016 |
|
|
|
|
|
|
|
|
10.16+ |
Confirmatory Offer Letter, by and between the Registrant and Mark Partin, dated as of September 29, 2016. |
S-1 |
333-213899 |
10.20 |
September 30, 2016 |
|
|
|
|
|
|
|
|
10.17+ |
Confirmatory Offer Letter, by and between the Registrant and Chris Murphy, dated as of September 29, 2016. |
S-1 |
333-213899 |
10.21 |
September 30, 2016 |
|
|
|
|
|
|
|
|
10.18+ |
Form of Indemnification Agreement between the Registrant and each of its directors and executive officers. |
S-1 |
333-213899 |
10.22 |
September 30, 2016 |
|
|
|
|
|
|
|
|
10.19 |
Restrictive Covenant Agreement, by and between the Company and Therese Tucker, dated as of August 8, 2013. |
S-1 |
333-213899 |
10.23 |
September 30, 2016 |
|
|
|
|
|
|
|
|
10.20 |
Restrictive Covenant Agreement, by and between the Company and Mario Spanicciati, dated as of August 9, 2013. |
S-1 |
333-213899 |
10.24 |
September 30, 2016 |
|
|
|
|
|
|
|
103
|
Exhibit |
|
Incorporated by Reference |
|||
|
Number |
Description |
Form |
File No. |
Exhibit |
Filing Date |
|
Office Lease, by and between the Company and Douglas Emmet 2008, LLC, dated November 22, 2010. |
S-1 |
333-213899 |
10.25 |
September 30, 2016 |
|
|
|
|
|
|
|
|
|
10.22* |
First Amendment to Office Lease, by and between the Company and Douglas Emmett 2008, LLC, dated August 14, 2012. |
S-1 |
333-213899 |
10.26 |
September 30, 2016 |
|
|
|
|
|
|
|
|
10.23* |
Second Amendment to Office Lease, by and between the Company and Douglas Emmett 2008, LLC, dated December 26, 2013. |
S-1 |
333-213899 |
10.27 |
September 30, 2016 |
|
|
|
|
|
|
|
|
10.24* |
Third Amendment to Office Lease, by and between the Company and Douglas Emmett 2008, LLC, dated June 24, 2014. |
S-1 |
333-213899 |
10.28 |
September 30, 2016 |
|
|
|
|
|
|
|
|
10.25 |
Fourth Amendment to Office Lease, by and between the Company and Douglas Emmett 2008, LLC, dated January 29, 2015. |
S-1 |
333-213899 |
10.29 |
September 30, 2016 |
|
|
|
|
|
|
|
|
21.1 |
List of subsidiaries of the Company. |
S-1 |
333-213899 |
21.1 |
September 30, 2016 |
|
|
|
|
|
|
|
|
23.1** |
Consent of Independent Registered Public Accounting Firm. |
|
|
|
|
|
|
|
|
|
|
|
|
24.1** |
Power of Attorney (included in signature pages hereto). |
|
|
|
|
|
|
|
|
|
|
|
|
31.1** |
Certification of Chief Executive Officer pursuant to Exchange Act Rules 13a-14(a) and 15d-14(a), as adopted pursuant to Section 302 of the Sarbanes-Oxley Act of 2002. |
|
|
|
|
|
|
|
|
|
|
|
|
31.2** |
Certification of Chief Financial Officer pursuant to Exchange Act Rules 13a-14(a) and 15d-14(a), as adopted pursuant to Section 302 of the Sarbanes-Oxley Act of 2002. |
|
|
|
|
|
|
|
|
|
|
|
|
32.1† |
Certifications of Chief Executive Officer and Chief Financial Officer pursuant to 18 U.S.C. Section 1350 as adopted pursuant to Section 906 of the Sarbanes-Oxley Act of 2002. |
|
|
|
|
|
|
|
|
|
|
|
|
101.INS** |
XBRL Instance Document |
|
|
|
|
|
|
|
|
|
|
|
|
101.SCH** |
XBRL Taxonomy Extension Schema Document |
|
|
|
|
|
|
|
|
|
|
|
|
101.CAL** |
XBRL Taxonomy Extension Calculation Linkbase Document |
|
|
|
|
|
|
|
|
|
|
|
|
101.DEF** |
XBRL Taxonomy Extension Definition Linkbase Document |
|
|
|
|
|
|
|
|
|
|
|
|
101.LAB** |
XBRL Taxonomy Extension Label Linkbase Document |
|
|
|
|
|
|
|
|
|
|
|
|
101.PRE** |
XBRL Taxonomy Extension Presentation Linkbase Document |
|
|
|
|
|
* |
Portions of this exhibit have been omitted pursuant to confidential treatment request. Omitted information has been separately filed with the Securities and Exchange Commission. |
|
** |
Filed herewith. |
|
+ |
Indicates management contract or compensatory plan. |
|
† |
The certifications attached as Exhibit 32.1 that accompany this Annual Report on Form 10-K are deemed furnished and not filed with the Securities and Exchange Commission and are not to be incorporated by reference into any filing of BlackLine, Inc. under the Securities Act of 1933, as amended, or the Securities Exchange Act of 1934, as amended, whether made before or after the date of this Annual Report on Form 10-K, irrespective of any general incorporation language contained in such filing. |
104