Attached files
UNITED STATES
SECURITIES AND EXCHANGE COMMISSION
Washington, D.C. 20549
_____________________
FORM 10-K
(MARK ONE)
|
[X]
|
ANNUAL REPORT PURSUANT TO SECTION 13 OR 15(d) OF THE SECURITIES EXCHANGE ACT OF 1934
|
|
For the Fiscal Year Ended December 31, 2016
|
|
|
or
|
|
|
[ ]
|
TRANSITION REPORT PURSUANT TO SECTION 13 OR 15(d) OF THE SECURITIES EXCHANGE ACT OF 1934
|
|
For the transition period from ___________ to ____________
|
|
Commission File No. 0-11676
_____________________
BEL FUSE INC.
206 Van Vorst Street
Jersey City, NJ 07302
(201) 432-0463
206 Van Vorst Street
Jersey City, NJ 07302
(201) 432-0463
(Address of principal executive offices and zip code)
(Registrant's telephone number, including area code)
|
NEW JERSEY
|
|
22-1463699
|
|
(State of incorporation)
|
|
(I.R.S. Employer Identification No.)
|
Securities registered pursuant to Section 12(b) of the Act:
|
Title of Each Class |
|
Name of Each Exchange
on which Registered |
|
Class A Common Stock ($0.10 par value)
|
|
NASDAQ Global Select Market
|
|
Class B Common Stock ($0.10 par value)
|
NASDAQ Global Select Market
|
Securities registered pursuant to Section 12(g) of the Act: None
|
Indicate by checkmark if the registrant is a well-known seasoned issuer, as defined in Rule 405 of the Securities Act.
|
Yes [ ] |
No [X] |
|
Indicate by checkmark if the registrant is not required to file reports to Section 13 or 15(d) of the Act.
|
Yes [ ]
|
No [X]
|
|
Indicate by check mark whether the registrant (1) has filed all reports required to be filed by Section 13 or 15(d) of the Securities Exchange Act of 1934 during the preceding 12 months (or for such shorter period that the registrant was required to file such reports), and (2) has been subject to such filing requirements for the past 90 days.
|
Yes [X]
|
No [ ]
|
|
Indicate by check mark whether the registrant has submitted electronically and posted on its corporate Web site, if any, every Interactive Data File required to be submitted and posted pursuant to Rule 405 of Regulation S-T (§232.405 of this chapter) during the preceding 12 months (or for such shorter period that the registrant was required to submit and post such files).
|
Yes [X]
|
No [ ]
|
|
Indicate by check mark if disclosure of delinquent filers pursuant to Item 405 of Regulation S-K (§229.405 of this chapter) is not contained herein, and will not be contained, to the best of registrant's knowledge, in definitive proxy or information statements incorporated by reference in Part III of this Form 10-K or any amendment to this Form 10-K.
|
[X]
|
|
Indicate by checkmark whether the registrant is a large accelerated filer, an accelerated filer, a non-accelerated filer or a smaller reporting company. See the definitions of large accelerated filer, accelerated filer and smaller reporting company in Rule 12b-2 of the Exchange Act.
|
||
|
Large accelerated filer [ ]
|
Accelerated filer [X]
|
Non-accelerated filer [ ]
(Do not check if a smaller reporting company) |
Smaller reporting company [ ]
|
||
|
Indicate by check mark whether the registrant is a shell company (as defined in Rule 12b-2 of the Act).
|
Yes [ ]
|
No [X]
|
|||
The aggregate market value of the voting and non-voting common equity of the registrant held by non-affiliates (for this purpose, persons and entities other than executive officers and directors) of the registrant, as of the last business day of the registrant's most recently completed second fiscal quarter (June 30, 2016) was $189.8 million based on the closing sale price as reported on the NASDAQ Global Select Market.
|
Title of Each Class |
|
Number of Shares of Common Stock
Outstanding as of March 1, 2017
|
|
Class A Common Stock
|
|
2,174,912
|
|
Class B Common Stock
|
9,851,652
|
DOCUMENTS INCORPORATED BY REFERENCE:
Portions of Bel Fuse Inc.'s Definitive Proxy Statement for the 2017 Annual Meeting of Stockholders are incorporated by reference into Part III of this Annual Report on Form 10-K.
|
BEL FUSE INC.
|
|||
|
Page
|
|||
|
Cautionary Notice Regarding Forward-Looking Information
|
1
|
||
|
Part I
|
|||
|
Item 1.
|
2
|
||
|
Item 1A.
|
6
|
||
|
Item 1B.
|
14
|
||
|
Item 2.
|
15
|
||
|
Item 3.
|
15
|
||
|
Item 4.
|
15
|
||
|
Part II
|
|||
|
Item 5.
|
|||
|
16
|
|||
|
Item 6.
|
18
|
||
|
Item 7.
|
|||
|
20
|
|||
|
Item 7A.
|
32
|
||
|
Item 8.
|
32
|
||
|
Item 9.
|
|||
|
72
|
|||
|
Item 9A.
|
72
|
||
|
Item 9B.
|
72
|
||
|
Part III
|
|||
|
Item 10.
|
73
|
||
|
Item 11.
|
73
|
||
|
Item 12.
|
|||
|
73
|
|||
|
Item 13.
|
73
|
||
|
Item 14.
|
73
|
||
|
Part IV
|
|||
|
Item 15.
|
74
|
||
|
Item 16.
|
75
|
||
| Signatures | 76 | ||
CAUTIONARY NOTICE REGARDING FORWARD-LOOKING INFORMATION
The terms the "Company," "Bel," "we," "us," and "our" as used in this Annual Report on Form 10-K ("Form 10-K") refer to Bel Fuse Inc. and its consolidated subsidiaries unless otherwise specified.
The Company's consolidated operating results are affected by a wide variety of factors that could materially and adversely affect revenues and profitability, including the risk factors described in Item 1A of this Form 10-K. As a result of these and other factors, the Company may experience material fluctuations in future operating results on a quarterly or annual basis, which could materially and adversely affect its business, consolidated financial condition, operating results, and common stock prices. Furthermore, this document and other documents filed by the Company with the Securities and Exchange Commission ("SEC") contain certain forward-looking statements under the Private Securities Litigation Reform Act of 1995 ("Forward-Looking Statements") with respect to the business of the Company. Forward-Looking Statements are necessarily subject to risks and uncertainties, many of which are outside our control, that could cause actual results to differ materially from these statements. Forward-Looking Statements can be identified by such words as "anticipates," "believes," "plans to," "assumes," "could," "should," "estimates," "expects," "intends," "potential," "seek," "predict," "may," "will" and similar expressions. These Forward-Looking Statements are subject to certain risks and uncertainties, including those detailed in Item 1A. of this Form 10-K, which could cause actual results to differ materially from these Forward-Looking Statements. The Company undertakes no obligation to publicly release the results of any revisions to these Forward-Looking Statements which may be necessary to reflect events or circumstances after the date hereof or to reflect the occurrence of unanticipated events. Any Forward-Looking Statement made by the Company is based only on information currently available to us and speaks only as of the date on which it is made.
PART I
Bel Fuse Inc. designs, manufactures and markets a broad array of products that power, protect and connect electronic circuits. These products are primarily used in the networking, telecommunications, computing, military, aerospace, transportation and broadcasting industries. Bel's portfolio of products also finds application in the automotive, medical and consumer electronics markets.
With over 65 years in operation, Bel has reliably demonstrated the ability to succeed in a variety of product areas across a global platform. The Company has a strong track record of technical innovation working with the engineering teams of market leaders. Bel has consistently proven itself a valuable supplier to the foremost companies in its chosen industries by developing cost-effective solutions for the challenges of new product development. By combining our strength in product design with our own specially-designed manufacturing facilities, Bel has established itself as a formidable competitor on a global basis.
The Company, which is organized under New Jersey law, operates in one industry with three reportable operating segments, North America, Asia and Europe (representing 51%, 34% and 15% of the Company's 2016 sales, respectively). Bel's principal executive offices are located at 206 Van Vorst Street, Jersey City, New Jersey 07302; (201) 432-0463. The Company operates facilities in North America, Europe and Asia and trades on the NASDAQ Global Select Market (BELFA and BELFB). For information regarding Bel's three geographic operating segments, see Note 12, "Segments", of the notes to consolidated financial statements. Hereinafter, all references to "Note" will refer to the notes to consolidated financial statements included in Part II, Item 8. "Financial Statements and Supplementary Data" of this Annual Report on Form 10-K.
Acquisitions have played a critical role in the growth of Bel and the expansion of both our product portfolio and our customer base and continue to be a key element in our growth strategy. We may, from time to time, purchase equity positions in companies that are potential merger candidates. We frequently evaluate possible merger candidates that would provide an expanded product and technology base that will allow us to expand the breadth of our product offerings to our strategic customers and/or provide an opportunity to reduce overall operating expense as a percentage of revenue. We also consider whether the merger candidates are positioned to take advantage of our lower cost offshore manufacturing facilities, and whether a cultural fit will allow the acquired company to be integrated smoothly and efficiently.
2014 Acquisitions
On June 19, 2014, we completed the acquisition of the Power Solutions business of Power-One ("Power Solutions") from ABB Ltd. for $109.9 million, net of cash acquired. Power Solutions is a leading provider of high-efficiency and high-density power conversion products for server, storage and networking equipment, industrial applications and power systems. Power Solutions offers a premier line of standard, modified-standard and custom designed AC/DC, DC/DC and other specific power conversion products for a variety of technologies in data centers, telecommunications and industrial applications. The acquisition of Power Solutions brought a complementary, industry-leading power product portfolio to Bel's existing line of power solutions and protection products, expanded our current customer base in the areas of server, storage and networking equipment and added industrial and additional transportation applications to the Company's product offering.
On July 25, 2014, we completed the acquisition of 100% of the issued and outstanding capital stock of the U.S. and U.K. Connectivity Solutions businesses from Emerson Electric Co. ("Emerson"). On August 29, 2014, we completed the acquisition of the Connectivity Solutions business in China from Emerson (collectively with the U.S. and U.K. portion of the transaction, "Connectivity Solutions"). The Company paid a total of $98.8 million for Connectivity Solutions, net of cash acquired and including a working capital adjustment. Connectivity Solutions is a leading provider of high‑performance RF/Microwave and Harsh Environment Optical Connectors and Assemblies for military, aerospace, wireless communications, data communications, broadcast and industrial applications. The acquisition of Connectivity Solutions enabled the Company to further expand into the aerospace and military markets where long-term product reliability resulting from highly engineered solutions is critical. The acquisition enhanced our position in the expanded beam fiber optic market place and significantly expanded our copper‑based product offerings with the addition of RF/Microwave components and assemblies.
The acquisitions of Power Solutions and Connectivity Solutions may hereafter be referred to collectively as either the "2014 Acquisitions" or the "2014 Acquired Companies".
Products
Bel's three reportable operating segments, North America, Asia and Europe, sell, or participate in the sale of, the following products:
Magnetic Solutions
Bel's Magnetics offers industry leading products. The Company's ICM products integrate RJ45 connectors with discrete magnetic components to provide a more robust part that allows customers to substantially reduce board space and inventory requirements. The Company's 2013 acquisition of the TE wire wound magnetics business broadened the ICM product line and provided access to strategically important customer programs. Power Transformers include standard and custom designs for use in industrial instrumentation, alarm and security systems, motion control, elevators, and medical products. All Power Transformers are designed to comply with international safety standards governing transformers. Bel's SMD Power Inductors include a selection of over 3,000 parts utilized in power supplies, DC-DC converters, LED lighting and other electronic applications. Discrete Components are magnetic devices that condition, filter and isolate the signal as it travels through network equipment, ensuring accurate data/voice/video transmission.
|
Product Line
|
Function
|
Applications
|
Brands Sold Under
|
|
|
Magnetic Solutions
|
Integrated Connector Modules (ICMs)
|
Condition, filter, and isolate the electronic signal to ensure accurate data/voice/video transmission and provide RJ45 and USB connectivity.
|
Network switches, routers, hubs, and PCs used in 10/100/1000 Gigabit Ethernet, Power over Ethernet (PoE), PoE Plus and home networking applications.
|
Bel, TRP Connector®, MagJack®
|
|
Power Transformers
|
Safety isolation and distribution.
|
Power supplies, alarm, fire detection, and security systems, HVAC, lighting and medical equipment. Class 2, three phase, chassis mount, and PC mount designs available.
|
Signal
|
|
|
SMD Power Inductors & SMPS Transformers
|
A passive component that stores energy in a magnetic field. Widely used in analog electronic circuitry.
|
Switchmode power supplies, DC-DC converters, LED lighting, automotive and consumer electronics.
|
Signal
|
|
|
Discrete Components-Telecom
|
Condition, filter, and isolate the electronic signal to ensure accurate data/voice/video transmission.
|
Network switches, routers, hubs, and PCs used in 10/100/1000 Gigabit Ethernet and Power over Ethernet (PoE).
|
Bel
|
Power Solutions & Protection
Bel's power conversion products include AC-DC power supplies, DC-DC converters and battery charging solutions. The DC-DC product offering consists of standard and custom isolated and non-isolated DC-DC converters designed specifically to power low voltage silicon devices or provide regulated mid-bus voltages. The need for converting one DC voltage to another is growing rapidly as developers of integrated circuits commonly adjust the supply voltage as a means of optimizing device performance. The DC-DC converters are used in data networking equipment, distributed power architecture, and telecommunication devices, as well as data storage systems, computers and peripherals. Opportunities for the DC-DC products also extend into industrial applications.
With the acquisition of the Power Solutions business from ABB in 2014, Bel's power solutions product portfolio, R&D capabilities and customer base were significantly expanded. Already a leader in DC/DC board mount products, since 2014 Bel has offered a sizeable portfolio of AC/DC products with industry leading efficiency and power density. The acquisition of Power Solutions also added considerable presence in the railway market and broader industrial markets with MelcherTM branded products. The Melcher brand is well known for reliability and performance in demanding applications.
Bel circuit protection products include board level fuses (miniature, micro and surface mount), and Polymeric PTC (Positive Temperature Coefficient) devices, designed for the global electronic and telecommunication markets. Fuses and PTC devices prevent currents in an electrical circuit from exceeding certain predetermined levels, acting as a safety valve to protect expensive components from damage by cutting off high currents before they can generate enough heat to cause smoke or fire. Additionally, PTC devices are resettable and do not have to be replaced before normal operation of the end product can resume.
|
Product Line
|
Function
|
Applications
|
Brands Sold Under
|
|
|
Power Solutions & Protection
|
Front-End Power Supplies
|
Provides the primary point of isolation between AC main line (input) and the low-voltage DC output that is used to power all electronics downstream
|
Servers, telecommunication, network and data storage equipment
|
Bel Power Solutions, Power-One
|
|
Board-Mount Power Products
|
These are designed to be mounted on a circuit board. These converters take input voltage and provide localized on-board power to low-voltage electronics.
|
Telecom (central office switches), networking and a broad range of industrial applications
|
Bel Power Solutions, Power-One, MelcherTM
|
|
|
Industrial Power Products
|
Converts between AC main line inputs and a wide variety of DC output voltages.
|
Rail, transportation, automation, test and measurement, medical, military and aerospace applications.
|
Bel Power Solutions, Power-One, MelcherTM
|
|
|
Module Products
|
Condition, filter, and isolate the electronic signal to ensure accurate data/voice/video transmission within a highly integrated, reduced footprint.
|
Broadband equipment, home networking, set top boxes, and telecom equipment supporting ISDN, T1/E1 and DSL technologies. Industrial applications include Smart Meters, Smart Grid communication platforms, vehicle communications and traffic management.
|
Bel
|
|
|
Circuit Protection
|
Protects devices by preventing current in an electrical circuit from exceeding acceptable levels.
|
Power supplies, cell phone chargers, consumer electronics, and battery protection.
|
Bel
|
Connectivity Solutions
Bel offers a comprehensive line of high speed and harsh environment copper and optical fiber connectors and integrated assemblies, which provide connectivity for a wide range of applications across multiple industries including commercial aerospace, military communications, network infrastructure, structured building cabling and several industrial applications. Bel's Stewart Connector business designs and deploys modular connector systems primarily used in high speed Telecom/Datacom applications. In January 2010, Bel completed the acquisition of Cinch Connectors. Cinch products are designed and manufactured for high reliablity/harsh enviroment applications. Cinch also possesses various enabling technologies and expertise with which to provide custom solutions and products. In 2012, the acquistions of Fiberco and GigaCom further enhanced the Cinch product offering with the addition of fiber optic connector and cable products optomized for harsh envirment applications. In 2013, the acquisition of Array (a manufacturer of aerospace and military connector products) further broadened the copper based product portfolio and expanded sales within the aerospace market. The acquisition of Connectivity Solutions in 2014 brought additional products and has strengthened our position with strategic OEM customers in the military, aerospace and networking segments. Connectivity Solutions is a leading innovator and producer of RF coaxial connectors and cables, harsh environment optical active and passive devices, and microwave components.
|
Product Line
|
Function
|
Applications
|
Brands Sold Under
|
|
|
Connectivity Solutions
|
Expanded Beam Fiber Optic Connectors, Cable Assemblies and Active Optical Devices (transceivers and media converters)
|
Harsh-environment, high-reliability, flight-grade optical connectivity for high-speed communications.
|
Military/aerospace, oil and gas well monitoring and exploration, broadcast, communications, RADAR
|
Stratos®, Fibreco®
|
|
Copper-based Connectors / Cable Assemblies-FQIS
|
Harsh-environment, high-reliability connectivity and fuel quantity monitoring (FQIS).
|
Commercial aerospace, avionics, smart munitions, communications, navigations and various industrial equipment
|
Cinch®
|
|
|
RF Connectors, Cable Assemblies, Microwave Devices and Low Loss Cable
|
Connectors and cable assemblies designed to provide connectivity within radio frequency (RF) applications.
|
Military/aerospace, test and measurement, high-frequency and wireless communications
|
Johnson, Trompeter, Midwest MicrowaveTM, Semflex®
|
|
|
RJ Connectors and Cable Assemblies
|
RJ45 and RJ11 connectivity for data/voice/video transmission.
|
Largely Ethernet applications including network routers, hubs, switches, and patch panels.
|
Stewart Connector
|
Sales and Marketing
We sell our products to customers throughout North America, Europe and Asia. Sales are made through one of three channels: direct strategic account managers, regional sales managers working with independent sales representative organizations or authorized distributors. Bel's strategic account managers are assigned to handle major accounts requiring global coordination.
Independent sales representatives and authorized distributors are overseen by the Company's sales management personnel located throughout the world. As of December 31, 2016, we had a sales and support staff of 221 persons that supported a network of sales representative organizations and non-exclusive distributors. We have written agreements with all of our sales representative organizations and most of our major distributors. These written agreements, terminable on short notice by either party, are standard in the industry.
Sales support functions have also been established and located in our international facilities to provide timely, efficient support for customers. This supplemental level of service, in addition to first-line sales support, enables us to be more responsive to customers' needs on a global level. Our marketing capabilities include product management which drives new product development, application engineering for technical support and marketing communications.
For information regarding customer concentrations, see "Management's Discussion and Analysis of Financial Condition and Results of Operations – Critical Accounting Policies and Other Matters – Revenue Recognition."
Research and Development ("R&D")
Our engineering groups are strategically located around the world to facilitate communication with and access to customers' engineering personnel. This collaborative approach enables partnerships with customers for technical development efforts. On occasion, we execute non-disclosure agreements with customers to help develop proprietary, next generation products destined for rapid deployment.
We also sponsor membership in technical organizations that allow our engineers to participate in developing standards for emerging technologies. It is management's opinion that this participation is critical in establishing credibility and a reputable level of expertise in the marketplace, as well as positioning the Company as an industry leader in new product development.
R&D costs are expensed as incurred and are included in cost of sales on the consolidated statements of operations. Generally, R&D is performed internally for the benefit of the Company. R&D costs include salaries, building maintenance and utilities, rents, materials, administrative costs and miscellaneous other items. R&D expenses for the years ended December 31, 2016, 2015 and 2014 amounted to $26.7 million, $27.7 million and $21.5 million, respectively.
Competition
We operate in a variety of markets, all of which are highly competitive. There are numerous independent companies and divisions of major companies that manufacture products that are competitive with one or more of our products.
Our ability to compete is dependent upon several factors including product performance, quality, reliability, depth of product line, customer service, technological innovation, design, delivery time and price. Overall financial stability and global presence also give us a favorable position in relation to many of our competitors. Management intends to maintain a strong competitive posture in the markets we serve by continued expansion of our product lines and ongoing investment in research, development and manufacturing resources.
Associates
As of December 31, 2016, we employed 7,694 full-time associates, a decrease of 277 full-time associates from December 31, 2015. At December 31, 2016, we employed 1,490 people at our North American facilities, 5,385 people at our Asian facilities and 819 people at our European facilities, excluding approximately 1,055 workers supplied by independent contractors. Our manufacturing facility in New York is represented by a labor union and all factory workers in the PRC, Worksop, England and Reynosa, Mexico are represented by unions. While the majority of our manufacturing associates are members of workers unions, approximately 490 associates worldwide are covered by collective bargaining agreements expiring within one year. We believe that our relations with our associates are satisfactory.
Raw Materials and Sourcing
We have multiple suppliers for most of the raw materials that we purchase. Where possible, we have contractual agreements with suppliers to assure a continuing supply of critical components.
With respect to those items which are purchased from single sources, we believe that comparable items would be available in the event that there was a termination of our existing business relationships with any such supplier. While such a termination could produce a disruption in production, we believe that the termination of business with any one of our suppliers would not have a material adverse effect on our long-term operations. Actual experience could differ materially from this belief as a result of a number of factors, including the time required to locate an alternative supplier, and the nature of the demand for our products. In the past, we have experienced shortages in certain raw materials, such as capacitors, ferrites and integrated circuits ("IC's"), when these materials were in great demand. Even though we may have more than one supplier for certain materials, it is possible that these materials may not be available to us in sufficient quantities or at the times desired by us. In the event that the current economic conditions have a negative impact on the financial condition of our suppliers, this may impact the availability and cost of our raw materials.
Backlog
We typically manufacture products against firm orders and projected usage by customers. Cancellation and return arrangements are either negotiated by us on a transactional basis or contractually determined. We estimate the value of the backlog of orders as of February 28, 2017 to be approximately $137.6 million as compared with a backlog of $126.1 million as of February 29, 2016. Management expects that substantially all of the Company's backlog as of February 28, 2017 will be shipped by December 31, 2017. Factors that could cause the Company to fail to ship all such orders by year-end include unanticipated supply difficulties, changes in customer demand and new customer designs. Due to these factors, backlog may not be a reliable indicator of the timing of future sales. See Item 1A of this Annual Report - "Risk Factors - Our backlog figures may not be reliable indicators."
Intellectual Property
We have acquired or been granted a number of patents in the U.S., Europe and Asia and have additional patent applications pending relating to our products. While we believe that the issued patents are defendable and that the pending patent applications relate to patentable inventions, there can be no assurance that a patent will be obtained from the applications or that our existing patents can be successfully defended. It is management's opinion that the successful continuation and operation of our business does not depend upon the ownership of patents or the granting of pending patent applications, but upon the innovative skills, technical competence and marketing and managerial abilities of our personnel. Our U.S. design patents have a life of 14 years and our U.S. utility patents have a life of 17 years from the date of issue or 20 years from filing of patent applications. Our existing patents expire on various dates from June 2017 to June 2035.
We utilize registered trademarks in the U.S., Europe and Asia to identify various products that we manufacture. The trademarks survive as long as they are in use and the registrations of these trademarks are renewed.
Available Information
We maintain a website at www.belfuse.com where we make available the proxy statements, press releases, registration statements and reports on Forms 3, 4, 8-K, 10-K and 10-Q that we and our insiders file with the SEC. These forms are made available as soon as reasonably practicable after such material is electronically filed with or furnished to the SEC. Press releases are also issued via electronic transmission to provide access to our financial and product news, and we provide notification of and access to voice and internet broadcasts of our quarterly and annual results. Our website also includes investor presentations and corporate governance materials.
The risks described below should be carefully considered before making an investment decision. These are the risk factors that we consider to be the most significant risk factors, but they are not the only risk factors that should be considered in making an investment decision. This Form 10-K also contains Forward-Looking Statements that involve risks and uncertainties. See the "Cautionary Notice Regarding Forward-Looking Information," above. Our business, consolidated financial condition and results of operations could be materially adversely affected by any of the risk factors described below, under "Cautionary Notice Regarding Forward-Looking Information" or with respect to specific Forward-Looking Statements presented herein. The trading price of our securities could decline due to any of these risks, and investors in our securities may lose all or part of their investment. Additional risks and uncertainties not presently known to us or that we currently believe to be immaterial may also materially adversely affect our business in the future.
We conduct business in a highly competitive industry.
Our business is largely in a highly competitive worldwide industry, with relatively low barriers to competitive entry. We compete principally on the basis of product performance, quality, reliability, depth of product line, customer service, technological innovation, design, delivery time and price. The industry in which we operate has become increasingly concentrated and globalized in recent years and our major competitors, some of which are larger than Bel, have significant financial resources and technological capabilities.
We may not be able to generate sufficient cash to service all of our indebtedness and may be forced to take other actions to satisfy our obligations under our indebtedness, which may not be successful.
Our ability to make scheduled payments on or refinance our debt obligations depends on our financial condition and operating performance, which are subject to prevailing economic and competitive conditions and to certain financial, business, legislative, regulatory and other factors beyond our control. We may be unable to maintain a level of cash flows from operating activities sufficient to permit us to pay the principal, premium, if any, and interest on our indebtedness.
If our cash flows and capital resources are insufficient to fund our debt service obligations, we could face substantial liquidity problems and could be forced to reduce or delay investments and capital expenditures or to dispose of material assets or operations, seek additional debt or equity capital or restructure or refinance our indebtedness. We may not be able to effect any such alternative measures on commercially reasonable terms or at all and, even if successful, those alternative actions may not allow us to meet our scheduled debt service obligations. Our credit agreement restricts our ability to dispose of assets and use the proceeds from those dispositions and may also restrict our ability to raise debt or equity capital to be used to repay other indebtedness when it becomes due. We may not be able to consummate those dispositions or to obtain proceeds in an amount sufficient to meet any debt service obligations then due.
In addition, we conduct a substantial portion of our operations through our subsidiaries, certain of which are not guarantors of our indebtedness. Accordingly, repayment of our indebtedness is dependent on the generation of cash flow by our subsidiaries and their ability to make such cash available to us, by dividend, debt repayment or otherwise. Unless they are guarantors of our indebtedness, our subsidiaries do not have any obligation to pay amounts due on indebtedness or to make funds available for that purpose. Our subsidiaries may not be able to, or may not be permitted to, make distributions to enable us to make payments in respect of our indebtedness. Each subsidiary is a distinct legal entity, and, under certain circumstances, legal and contractual restrictions may limit our ability to obtain cash from our subsidiaries. In the event that we do not receive distributions from our subsidiaries, we may be unable to make required principal and interest payments on our indebtedness.
Our inability to generate sufficient cash flows to satisfy our debt obligations, or to refinance our indebtedness on commercially reasonable terms or at all, would materially and adversely affect our consolidated financial position and results of operations.
If we cannot make scheduled payments on our debt, we will be in default, the lenders under the credit agreement could terminate their commitments to loan money, the lenders could foreclose against the assets securing their borrowings and we could be forced into bankruptcy or liquidation.
Our variable rate indebtedness subjects us to interest rate risk, which could cause our debt service obligations to increase significantly.
Borrowings under our credit facility are at variable rates of interest and expose us to interest rate risk. If interest rates increase, our debt service obligations on the variable rate indebtedness will increase even though the amount borrowed remained the same, and our net earnings and cash flows, including cash available for servicing our indebtedness, will correspondingly decrease. As of December 31, 2016, we had $143.8 million of borrowings under our credit facility at a variable interest rate. A 1% increase or decrease in the assumed interest rates on the senior secured credit facilities would result in a $1.4 million increase or decrease in annual interest expense.
Our high level of indebtedness could negatively impact our access to the capital markets and our ability to satisfy financial covenants under our existing credit agreement.
We incurred substantial amounts of indebtedness to fund the acquisitions of Power Solutions and Connectivity Solutions in 2014, and we may need to incur additional indebtedness to finance operations or for other general corporate purposes. Our consolidated principal amount of outstanding indebtedness was $143.8 million at December 31, 2016, resulting in a leverage ratio of 2.53x adjusted EBITDA, as calculated in accordance with our credit agreement. Accordingly, our debt service requirements are significant in relation to our net sales and cash flow. This leverage exposes us to risk in the event of downturns in our business, in our industry or in the economy generally, and may impair our operating flexibility and our ability to compete effectively. Our current credit agreement requires us to maintain a certain covenant leverage ratio, and the ratio becomes more restrictive at specific dates during the term. If we do not continue to satisfy this required ratio or receive waivers from our lenders, we will be in default under the credit agreement, which could result in an accelerated maturity of our debt obligations.
Our backlog figures may not be reliable indicators.
Many of the orders that comprise our backlog may be delayed, accelerated or canceled by customers without penalty. Customers may on occasion double order from multiple sources to ensure timely delivery when lead times are particularly long. Customers often cancel orders when business is weak and inventories are excessive. Therefore, we cannot be certain that the amount of our backlog equals or exceeds the level of orders that will ultimately be delivered. Our results of operations could be adversely impacted if customers cancel a material portion of orders in our backlog.
There are several factors which can cause us to lower our prices or otherwise cause our margins to suffer.
Our prices and/or margins could be substantially impacted by the following factors:
a) The average selling prices for our products tend to decrease over their life cycles, and customers put pressure on suppliers to lower prices even when production costs are increasing. Our profits suffer if we are not able to reduce our costs of production, introduce technological innovations as sales prices decline, or pass through cost increases to customers.
b) Any drop in demand for our products or increase in supply of competitive products could cause a dramatic drop in our average sales prices which in turn could result in a decrease in our gross margins. A shift in product mix could also have an unfavorable or favorable impact on our gross margins, depending upon the underlying raw material content and labor requirements of the associated products.
c) Increased competition from low cost suppliers around the world has put further pressures on pricing. We continually strive to lower our costs, negotiate better pricing for components and raw materials and improve our operating efficiencies. Profit margins will be materially and adversely impacted if we are not able to reduce our costs of production or introduce technological innovations when sales prices decline.
Our annual effective income tax rate can change materially as a result of changes in our mix of U.S. and foreign earnings and other factors, including changes in tax laws and changes made by regulatory authorities.
Our overall effective income tax rate is equal to our total tax expense as a percentage of total earnings before tax. However, income tax expense and benefits are not recognized on a global basis but rather on a jurisdictional or legal entity basis. Losses in one jurisdiction may not be used to offset profits in other jurisdictions and may cause an increase in our tax rate. Changes in statutory tax rates and laws, as well as ongoing audits by domestic and international authorities, could affect the amount of income taxes and other taxes paid by us. For example, legislative proposals to change U.S. taxation of non-U.S. earnings could increase our effective tax rate. Also, changes in the mix of earnings (or losses) between jurisdictions and assumptions used in the calculation of income taxes, among other factors, could have a significant effect on our overall effective income tax rate. In addition, our effective tax rate would increase if we were unable to generate sufficient future taxable income in certain jurisdictions, or if we were otherwise required to increase our valuation allowances against our deferred tax assets.
We are subject to taxation in multiple jurisdictions. As a result, any adverse development in the tax laws of any of these jurisdictions or any disagreement with our tax positions could have a material adverse effect on our business, consolidated financial condition or results of operations.
We are subject to taxation in, and to the tax laws and regulations of, multiple jurisdictions as a result of the international scope of our operations and our corporate and financing structure. We are also subject to transfer pricing laws with respect to our intercompany transactions, including those relating to the flow of funds among our companies. Adverse developments in these laws or regulations, or any change in position regarding the application, administration or interpretation thereof, in any applicable jurisdiction, could have a material adverse effect on our business, consolidated financial condition or results of our operations. In addition, the tax authorities in any applicable jurisdiction, including the United States, may disagree with the positions we have taken or intend to take regarding the tax treatment or characterization of any of our transactions. If any applicable tax authorities, including U.S. tax authorities, were to successfully challenge the tax treatment or characterization of any of our transactions, it could have a material adverse effect on our business, consolidated financial condition or consolidated results of our operations.
In the PRC, we are challenged to match availability of workers and maintain lead times in line with customer demand for certain of our products, which demand has been highly volatile in recent years. This volatility can materially adversely affect Bel's results.
In the PRC, the availability of labor is cyclical and is significantly affected by the migration of workers in relation to the annual Lunar New Year holiday as well as economic conditions in the PRC. In addition, we have little visibility into the ordering habits of our customers and can be subjected to large and unpredictable variations in demand for our products. Accordingly, we must continually recruit and train new workers to replace those lost to attrition each year and to address peaks in demand that may occur from time to time. These recruiting and training efforts and related inefficiencies, as well as overtime required in order to meet demand, can add volatility to the costs incurred by the Company for labor in the PRC.
We are dependent on our ability to develop new products.
Our future operating results are dependent, in part, on our ability to develop, produce and market new and more technologically advanced products. There are numerous risks inherent in this process, including the risks that we will be unable to anticipate the direction of technological change or that we will be unable to timely develop and bring to market new products and applications to meet customers' changing needs.
Our insurance policies may not cover all operating risks and a casualty loss beyond the limits of our coverage could adversely impact our business.
Our business is subject to operating hazards and risks relating to handling, storing, transporting and use of the products we sell. We maintain insurance policies in amounts and with coverage and deductibles that we believe are reasonable and prudent. Nevertheless, our insurance coverage may not be adequate to protect us from all liabilities and expenses that may arise from claims for personal injury or death or property damage arising in the ordinary course of business, and our current levels of insurance may not be maintained or available in the future at economical prices. If a significant liability claim is brought against us that is not adequately covered by insurance, we may have to pay the claim with our own funds, which could have a material adverse effect on our business, consolidated financial condition or results of operations.
Our acquisitions may not produce the anticipated results.
A significant portion of our growth has been attributable to acquisitions. We cannot assure that we will identify or successfully complete transactions with suitable acquisition candidates in the future. If an acquired business fails to operate as anticipated or cannot be successfully integrated with our other businesses, our results of operations, enterprise value, market value and prospects could all be materially and adversely affected. Integration of new acquisitions into our consolidated operations may result in lower average operating results for the group as a whole, and may divert management's focus from the ongoing operations of the Company during the integration period.
Our strategy also focuses on the reduction of selling, general and administrative expenses through the integration or elimination of redundant sales facilities and administrative functions at acquired companies. The Company completed two acquisitions in 2014, as previously described in Item 1 of this Form 10-K. If we are unable to achieve our expectations with respect to these or future acquisitions, such inability could have a material and adverse effect on our results of operations. In connection with the 2014 Acquisitions, we recorded $105.4 million of goodwill and $73.2 million of other intangible assets. During the first half of 2016, due to a decline in general market conditions, which lowered the Company's forecasted revenues and EBITDA growth rates for each of its reporting units, we recognized impairment charges of $101.7 million related to goodwill and $4.3 million related to indefinite-lived intangible assets. If the acquisitions fail to perform up to our expectations, as a result of further weakening of economic conditions, we could be required to record additional impairment charges.
We may not achieve all of the expected benefits from our restructuring programs.
We have implemented a number of restructuring programs in recent years and we may continue to restructure or rationalize our operations in future periods. These programs include various cost savings, the consolidation of certain facilities and the reduction of headcount. We make certain assumptions in estimating the anticipated savings we expect to achieve under such programs, which include the estimated savings from the elimination of certain headcount and the consolidation of facilities. These assumptions may turn out to be incorrect due to a variety of factors. In addition, our ability to realize the expected benefits from these programs is subject to significant business, economic and competitive uncertainties and contingencies, many of which are beyond our control. If we are unsuccessful in implementing these programs or if we do not achieve our expected results, our results of operations and cash flows could be adversely affected or our business operations could be disrupted.
The global nature of our operations exposes us to numerous risks that could materially adversely affect our consolidated financial condition and results of operations.
We operate in 15 countries, and our products are distributed in those countries as well as in other parts of the world. A large portion of our manufacturing operations are located outside of the United States and a large portion of our sales are generated outside of the United States. Operations outside of the United States, particularly operations in developing regions, are subject to various risks that may not be present or as significant for our U.S. operations. Economic uncertainty in some of the geographic regions in which we operate, including developing regions, could result in the disruption of commerce and negatively impact cash flows from our operations in those areas.
Risks inherent in our international operations include:
|
•
|
|
foreign currency exchange controls and tax rates;
|
|
•
|
|
foreign currency exchange rate fluctuations, including devaluations;
|
|
•
|
|
the potential for changes in regional and local economic conditions, including local inflationary pressures;
|
|
•
|
|
restrictive governmental actions such as those on transfer or repatriation of funds and trade protection matters, including antidumping duties, tariffs, embargoes and prohibitions or restrictions on acquisitions or joint ventures;
|
|
•
|
|
changes in laws and regulations, including the laws and policies of the United States affecting trade and foreign investment;
|
|
•
|
|
the difficulty of enforcing agreements and collecting receivables through certain foreign legal systems;
|
|
•
|
|
variations in protection of intellectual property and other legal rights;
|
|
•
|
|
more expansive legal rights of foreign unions or works councils;
|
|
•
|
|
changes in labor conditions and difficulties in staffing and managing international operations;
|
|
•
|
|
Inability or regulatory limitations on our ability to move goods across borders;
|
|
•
|
|
social plans that prohibit or increase the cost of certain restructuring actions;
|
|
•
|
|
the potential for nationalization of enterprises or facilities; and
|
|
•
|
|
unsettled political conditions and possible terrorist attacks against U.S. or other interests.
|
In addition, there are potential tax inefficiencies and tax costs in repatriating funds from our non-U.S. subsidiaries.
On June 23, 2016, the United Kingdom (UK) held a referendum in which voters approved an exit from the European Union (the "EU"), commonly referred to as "Brexit". As a result of the referendum, it is expected that the British government will begin negotiating the terms of the UK's future relationship with the EU. Although it is unknown what those terms will be, it is possible that there will be greater restrictions on imports and exports between the UK and EU countries and increased regulatory complexities and that such restrictions could materially adversely impact our Company.
In addition, the U.S. federal government has made explicit statements about its intention to make changes to U.S. trade policy, including signing an executive order to withdraw from the negotiating process of the Trans-Pacific Partnership, renegotiate the terms of NAFTA, and imposing border taxes on imports into the U.S. We manufacture a significant amount of our products in Mexico and any legislation enacted that impacts the relationship between the U.S. and Mexico and/or the continuity of NAFTA could materially and adversely affect our consolidated financial position or results of operations. If enacted, any legislation by the U.S. federal government that restricts trade, such as tariffs, trade barriers, and other protectionist or retaliatory measures taken by governments in Europe, Asia, and other countries, could adversely impact our ability to sell products and services in our foreign markets, and could also impact some of our customers and their demand for our products.
Furthermore, a large portion of our sales outside of the U.S. are denominated in U.S. dollars. As a result, an increase in the value of the U.S. dollar relative to foreign currencies could make our products less competitive and/or less affordable in foreign markets.
These and other factors may have a material adverse effect on our international operations and, consequently, on our consolidated financial position or results of operations.
The loss of certain substantial customers could materially and adversely affect us.
During the year ended December 31, 2016, sales to one direct customer exceeded 10% of our consolidated net sales. Hon Hai Precision Industry Company Ltd., a contract manufacturer utilized by various end customers, represented 12.0% of our 2016 consolidated net sales. We believe that the loss of this customer could have a material adverse effect on our consolidated financial position and consolidated results of operations. We have experienced significant concentrations in prior years. See Note 12, "Segments" for additional disclosures related to our significant customers.
We may experience labor unrest.
As we implement transfers of certain of our operations, we may experience strikes or other types of labor unrest as a result of lay-offs or termination of employees in higher labor cost countries. Our manufacturing facilities in New York State, the United Kingdom and Mexico are represented by labor unions and substantially all of our factory workers in the PRC are represented by government-sponsored unions.
We may experience labor shortages.
Government, economic, social and labor policies in the PRC may cause shortages of factory labor in areas where we have some of our products manufactured. If we are required to manufacture more of these products outside of the PRC as a result of such shortages, our margins will likely be materially adversely affected.
There are risks related to the implementation of our new global enterprise resource planning system.
We are currently engaged in a multi-year process of conforming the majority of our operations onto one global enterprise resource planning system ("ERP"). The ERP is designed to improve the efficiency of our supply chain and financial transaction processes, accurately maintain our books and records, and provide information important to the operation of the business to our management team. The implementation of the ERP will continue to require significant investment of human and financial resources, and we may experience significant delays, increased costs and other difficulties as a result. Any significant disruption or deficiency in the design and implementation of the ERP could have a material adverse effect on our ability to fulfill and invoice customer orders, apply cash receipts, place purchase orders with suppliers, and make cash disbursements, and could negatively impact data processing and electronic communications among business locations, which may have a material adverse effect on our business, consolidated financial condition or results of operations. We also face the challenge of supporting our older systems and implementing necessary upgrades to those systems while we implement the new ERP system. While we have invested significant resources in planning and project management, significant implementation issues may arise.
Our results of operations may be materially and adversely impacted by environmental and other regulations.
Our manufacturing operations, products and/or product packaging are subject to environmental laws and regulations governing air emissions; wastewater discharges; the handling, disposal and remediation of hazardous substances, wastes and certain chemicals used or generated in our manufacturing processes; employee health and safety labeling or other notifications with respect to the content or other aspects of our processes, products or packaging; restrictions on the use of certain materials in or on design aspects of our products or product packaging; and, responsibility for disposal of products or product packaging. More stringent environmental regulations may be enacted in the future, and we cannot presently determine the modifications, if any, in our operations that any such future regulations might require, or the cost of compliance with these regulations.
We may face risks relating to climate change that could have an adverse impact on our business.
Greenhouse gas ("GHG") emissions have increasingly become the subject of substantial international, national, regional, state and local attention. GHG emission regulations have been promulgated in certain of the jurisdictions in which we operate, and additional GHG requirements are in various stages of development. Such measures could require us to modify existing or obtain new permits, implement additional pollution control technology, curtail operations or increase our operating costs. Any additional regulation of GHG emissions, including a cap-and-trade system, technology mandate, emissions tax, reporting requirement or other program, could materially adversely affect our business.
Regulations related to conflict minerals will cause the Company to incur additional expenses and may have other adverse consequences.
The SEC has adopted inquiry, diligence and additional disclosure requirements related to certain minerals sourced from the Democratic Republic of the Congo and surrounding countries, or "conflict minerals", that are necessary to the functionality of a product manufactured, or contracted to be manufactured, by an SEC reporting company. The minerals that the rules cover are commonly referred to as "3TG" and include tin, tantalum, tungsten and gold. As a public company, Bel was required to make its first filing under these new rules on May 31, 2014. In such filing, Bel described the due diligence it had undertaken of its suppliers in an effort to determine the source of any conflict minerals used in its products or components. These due diligence requirements are ongoing, and Bel will continue to incur additional costs, which could be substantial, related to its due diligence and compliance process. In addition, the Company's supply chain is complex, and if it is not able to determine with certainty the source and chain of custody for all conflict minerals used in its products that are sourced from the Democratic Republic of the Congo and surrounding countries or determine that its products are "conflict free", then the Company may face reputational challenges with customers, investors or others. As there may be only a limited number of suppliers offering "conflict free" minerals, if the Company chooses to use only conflict minerals that are "conflict free" in its products and components, the Company cannot be sure that it will be able to obtain necessary materials from such suppliers in sufficient quantities or at competitive prices.
Our results may vary substantially from period to period.
Our revenues and expenses may vary significantly from one accounting period to another accounting period due to a variety of factors, including customers' buying decisions, our product mix, the volatility of raw material costs, the impact of competition, the impact of the Chinese New Year and general market and economic conditions. Such variations could significantly impact our stock price.
A shortage of availability or an increase in the cost of high-quality raw materials, components and other resources may adversely impact our ability to procure these items at cost effective prices and thus may negatively impact profit margins.
Our results of operations may be materially adversely impacted by difficulties in obtaining raw materials, supplies, power, labor, natural resources and any other items needed for the production of our products, as well as by the effects of quality deviations in raw materials and the effects of significant fluctuations in the prices of existing inventories and purchase commitments for these materials. Many of these materials and components are produced by a limited number of suppliers and their availability to us may be constrained by supplier capacity.
As product life cycles shorten and during periods of market slowdowns, the risk of materials obsolescence increases and this may materially and adversely impact our financial results.
Rapid shifts in demand for various products may cause some of our inventory of raw materials, components or finished goods to become obsolete.
The life cycles and demand for our products are directly linked to the life cycles and demand for the end products into which they are designed. Rapid shifts in the life cycles or demand for these end products due to technological shifts, economic conditions or other market trends may result in material amounts of either raw materials or finished goods inventory becoming obsolete. While the Company works diligently to manage inventory levels, rapid shifts in demand may result in obsolete or excess inventory and materially adversely impact financial results.
A loss of the services of the Company's executive officers or other skilled associates could negatively impact our operations and results.
The success of the Company's operations is largely dependent upon the performance of its executive officers, managers, engineers and sales people. Many of these individuals have a significant number of years of experience within the Company and/or the industry in which we compete and would be extremely difficult to replace. The loss of the services of any of these associates may materially and adversely impact our results of operations if we are unable to replace them in a timely manner.
Our stock price, like that of many technology companies, has been and may continue to be volatile.
The market price of our common stock may fluctuate as a result of variations in our quarterly operating results and other factors beyond our control. These fluctuations may be exaggerated if the trading volume of our common stock is low. The market price of our common stock may rise and fall in response to a variety of other factors, including:
|
·
|
announcements of technological or competitive developments;
|
|
·
|
general market or economic conditions;
|
|
·
|
market or economic conditions specific to particular geographical areas in which we operate;
|
|
·
|
acquisitions or strategic alliances by us or our competitors;
|
|
·
|
the gain or loss of a significant customer or order; or
|
|
·
|
changes in estimates of our financial performance or changes in recommendations by securities analysts regarding us or our industry
|
In addition, equity securities of many technology companies have experienced significant price and volume fluctuations even in periods when the capital markets generally are not distressed. These price and volume fluctuations often have been unrelated to the operating performance of the affected companies.
Our intellectual property rights may not be adequately protected under the current state of the law.
Our efforts to protect our intellectual property rights through patent, copyright, trademark and trade secret laws in the United States and in other countries may not prevent misappropriation, and our failure to protect our proprietary rights could materially adversely affect our business, financial condition, operating results and future prospects. A third party could, without authorization, copy or otherwise appropriate our proprietary information. Our agreements with employees and others who participate in development activities could be breached, we may not have adequate remedies for any breach, and our trade secrets may otherwise become known or independently developed by competitors.
We may be sued by third parties for alleged infringement of their proprietary rights and we may incur defense costs and possibly royalty obligations or lose the right to use technology important to our business.
From time to time, we receive claims by third parties asserting that our products violate their intellectual property rights. Any intellectual property claims, with or without merit, could be time consuming and expensive to litigate or settle and could divert management attention from administering our business. A third party asserting infringement claims against us or our customers with respect to our current or future products may materially and adversely affect us by, for example, causing us to enter into costly royalty arrangements or forcing us to incur settlement or litigation costs.
As a result of protective provisions in the Company's certificate of incorporation, the voting power of certain officers, directors and principal shareholders may be increased at future meetings of the Company's shareholders.
The Company's certificate of incorporation provides that if a shareholder, other than shareholders subject to specific exceptions, acquires (after the date of the Company's 1998 recapitalization) 10% or more of the outstanding Class A common stock and does not own an equal or greater percentage of all then outstanding shares of both Class A and Class B common stock (all of which common stock must have been acquired after the date of the 1998 recapitalization), such shareholder must, within 90 days of the trigger date, purchase Class B common shares, in an amount and at a price determined in accordance with a formula described in the Company's certificate of incorporation, or forfeit its right to vote its Class A common shares. As of February 28, 2017, to the Company's knowledge, there was one shareholder of the Company's common stock with ownership in excess of 10% of Class A outstanding shares with no ownership of the Company's Class B common stock and with no basis for exception from the operation of the above-mentioned provisions. In order to vote its shares at Bel's next shareholders' meeting, this shareholder must either purchase the required number of Class B common shares or sell or otherwise transfer Class A common shares until its Class A holdings are under 10%. As of February 28, 2017, to the Company's knowledge, this shareholder owned 23.2% of the Company's Class A common stock and had not taken steps to either purchase the required number of Class B common shares or sell or otherwise transfer Class A common shares until its Class A holdings fall below 10%. Unless and until this situation is satisfied in a manner permitted by the Company's Restated Certificate of Incorporation, the subject shareholder will not be permitted to vote its shares of common stock.
To the extent that the voting rights of particular holders of Class A common stock are suspended as of times when the Company's shareholders vote due to the above-mentioned provisions, such suspension will have the effect of increasing the voting power of those holders of Class A common shares whose voting rights are not suspended. As of February 28, 2017, Daniel Bernstein, the Company's chief executive officer, beneficially owned 353,204 Class A common shares (or 21.1%) of the outstanding Class A common shares whose voting rights were not suspended, Howard Bernstein beneficially owned 140,000 Class A common shares (or 8.4%) of the outstanding Class A common shares whose voting rights were not suspended, the Estate of Elliot Bernstein beneficially owned 82,357 Class A common shares (or 4.9%) of the outstanding Class A common shares whose voting rights were not suspended and all directors and executive officers as a group (which includes Daniel Bernstein, but does not include Howard Bernstein or the Estate of Elliot Bernstein) beneficially owned 359,187 Class A common shares (or 21.4%) of the outstanding Class A common shares whose voting rights were not suspended.
Cyber risk and the failure to maintain the integrity of our operational or security systems or infrastructure, or those of third parties with which we do business, could have a material adverse effect on our business, consolidated financial condition and results of operations.
We are subject to an increasing number of various types of information technology vulnerabilities, threats and targeted computer crimes which pose a risk to the security of our systems and networks and the confidentiality, availability and integrity of our data. Disruptions or failures in the physical infrastructure or operating systems that support our businesses and customers, or cyber-attacks or security breaches of our networks or systems, could result in the loss of customers and business opportunities, legal liability, regulatory fines, penalties or intervention, reputational damage, reimbursement or other compensatory costs, and additional compliance costs, any of which could materially adversely affect our business, financial condition and results of operations. While we attempt to mitigate these risks, our systems, networks, products, solutions and services remain potentially vulnerable to advanced and persistent threats. We also maintain and have access to sensitive, confidential or personal data or information in certain of our businesses that is subject to privacy and security laws, regulations and customer controls. Despite our efforts to protect such sensitive, confidential or personal data or information, our facilities and systems and those of our customers and third-party service providers may be vulnerable to security breaches, theft, misplaced or lost data, programming and/or human errors that could lead to the compromising of sensitive, confidential or personal data or information, improper use of our systems, software solutions or networks, unauthorized access, use, disclosure, modification or destruction of information, defective products, production downtimes and operational disruptions, which in turn could adversely affect our consolidated financial condition and results of operations.
As a U.S. Government contractor, we are subject to a number of procurement rules and regulations.
We must comply with and are affected by laws and regulations relating to the award, administration, and performance of U.S. Government contracts. Government contract laws and regulations affect how we do business with our customers and, in some instances, impose added costs on our business. A violation of specific laws and regulations could result in the imposition of fines and penalties or the termination of our contracts or debarment from bidding on contracts. These fines and penalties could be imposed for failing to follow procurement integrity and bidding rules, employing improper billing practices or otherwise failing to follow cost accounting standards, receiving or paying kickbacks, or filing false claims. We have been, and expect to continue to be, subjected to audits and investigations by government agencies. The failure to comply with the terms of our government contracts could harm our business reputation. It could also result in our progress payments being withheld.
In some instances, these laws and regulations impose terms or rights that are more favorable to the government than those typically available to commercial parties in negotiated transactions. For example, the U.S. Government may terminate any of our government contracts and, in general, subcontracts, at its convenience as well as for default based on performance. Upon termination for convenience of a fixed-price type contract, we normally are entitled to receive the purchase price for delivered items, reimbursement for allowable costs for work-in-process, and an allowance for profit on work actually completed on the contract or adjustment for loss if completion of performance would have resulted in a loss. Upon termination for convenience of a Federal Government cost reimbursement contract, we normally are entitled to reimbursement of allowable costs plus a portion of the fee. Such allowable costs would normally include our cost to terminate agreements with our suppliers and subcontractors. The amount of the fee recovered, if any, is related to the portion of the work accomplished prior to termination and is determined by negotiation.
None.
The Company is headquartered in Jersey City, New Jersey, where it currently owns 19,000 square feet of office and warehouse space. In addition to its facilities in Jersey City, New Jersey, the Company leases 166,000 square feet in 15 facilities and owns properties of 155,000 square feet which are used primarily for management, financial accounting, engineering, sales and administrative support.
The Company also operated 21 manufacturing facilities in 7 countries as of December 31, 2016. Approximately 19% of the 2.6 million square feet the Company occupies is owned while the remainder is leased. See Note 16, "Commitments and Contingencies", for additional information pertaining to leases.
The following is a list of the locations of the Company's principal manufacturing facilities at December 31, 2016:
|
Location
|
Approximate
Square Feet |
Owned/
Leased |
Percentage
Used for Manufacturing |
||||||
|
Dongguan, People's Republic of China
|
650,000
|
Leased
|
28
|
%
|
|||||
|
Pingguo, People's Republic of China
|
258,000
|
Leased
|
69
|
%
|
|||||
|
Shanghai, People's Republic of China*
|
32,000
|
Leased
|
70
|
%
|
|||||
|
Shenzhen, People's Republic of China
|
227,000
|
Leased
|
100
|
%
|
|||||
|
Zhongshan, People's Republic of China
|
315,000
|
Leased
|
86
|
%
|
|||||
|
Zhongshan, People's Republic of China
|
118,000
|
Owned
|
100
|
%
|
|||||
|
Zhongshan, People's Republic of China
|
78,000
|
Owned
|
100
|
%
|
|||||
|
Louny, Czech Republic
|
11,000
|
Owned
|
75
|
%
|
|||||
|
Dubnica nad Vahom, Slovakia
|
35,000
|
Owned
|
100
|
%
|
|||||
|
Dubnica nad Vahom, Slovakia
|
70,000
|
Leased
|
100
|
%
|
|||||
|
Worksop, England
|
52,000
|
Leased
|
28
|
%
|
|||||
|
Chelmsford, United Kingdom
|
21,000
|
Leased
|
60
|
%
|
|||||
|
Dominican Republic
|
41,000
|
Leased
|
85
|
%
|
|||||
|
Cananea, Mexico
|
42,000
|
Leased
|
60
|
%
|
|||||
|
Reynosa, Mexico
|
77,000
|
Leased
|
56
|
%
|
|||||
|
Inwood, New York
|
39,000
|
Owned
|
40
|
%
|
|||||
|
Glen Rock, Pennsylvania
|
74,000
|
Owned
|
60
|
%
|
|||||
|
Waseca, Minnesota
|
124,000
|
Leased
|
83
|
%
|
|||||
|
McAllen, Texas
|
40,000
|
Leased
|
56
|
%
|
|||||
|
Melbourne, Florida
|
18,000
|
Leased
|
64
|
%
|
|||||
|
Mesa, Arizona
|
7,000
|
Leased
|
100
|
%
|
|||||
|
2,329,000
|
|||||||||
* Subsequent to December 31, 2016, the Company transitioned its Shanghai manufacturing operations to its other facilities in Dongguan, PRC and Waseca, Minnesota noted above, and expects to exit the lease arrangement on the Shanghai facility in 2017.
Of the space described above, 333,000 square feet is used for engineering, warehousing, sales and administrative support functions at various locations and 470,000 square feet is designated for dormitories, canteen and other employee related facilities in the PRC.
The Territory of Hong Kong became a Special Administrative Region ("SAR") of the PRC during 1997. The territory of Macao became a SAR of the PRC at the end of 1999. Management cannot presently predict what future impact, if any, this will have on the Company or how the political climate in the PRC will affect its contractual arrangements in the PRC. A significant portion of the Company's manufacturing operations and approximately 40% of its identifiable assets are located in Asia.
The information called for by this Item is incorporated herein by reference to the caption "Legal Proceedings" in Note 16, "Commitments and Contingencies."
Not applicable.
PART II
Item 5. Market for Registrant's Common Equity and Related Stockholder Matters and Issuer Purchases of Equity Securities
|
(a)
|
Market Information
|
The Company's voting Class A Common Stock, par value $0.10 per share, and non-voting Class B Common Stock, par value $0.10 per share ("Class A" and "Class B," respectively), are traded on the NASDAQ Global Select Market under the symbols BELFA and BELFB. The following table sets forth the high and low sales price range (as reported by The Nasdaq Stock Market Inc.) for the Common Stock on NASDAQ for each quarter during the past two years.
|
Class A
|
Class B
|
|||||||||||||||
|
High
|
Low
|
High
|
Low
|
|||||||||||||
|
Year Ended December 31, 2016
|
||||||||||||||||
|
First Quarter
|
$
|
15.87
|
$
|
9.69
|
$
|
19.15
|
$
|
13.33
|
||||||||
|
Second Quarter
|
17.16
|
12.80
|
19.35
|
13.31
|
||||||||||||
|
Third Quarter
|
20.47
|
15.00
|
24.43
|
16.98
|
||||||||||||
|
Fourth Quarter
|
26.97
|
18.27
|
33.60
|
23.00
|
||||||||||||
|
Year Ended December 31, 2015
|
||||||||||||||||
|
First Quarter
|
$
|
24.66
|
$
|
18.17
|
$
|
27.53
|
$
|
18.79
|
||||||||
|
Second Quarter
|
23.38
|
17.33
|
23.23
|
17.35
|
||||||||||||
|
Third Quarter
|
20.95
|
14.19
|
23.77
|
16.46
|
||||||||||||
|
Fourth Quarter
|
21.80
|
14.29
|
23.73
|
16.16
|
||||||||||||
(b) Holders
As of February 28, 2017, there were 51 registered shareholders of the Company's Class A Common Stock and 231 registered shareholders of the Company's Class B Common Stock. As of February 28, 2017, the Company estimates that there were 632 beneficial shareholders of the Company's Class A Common Stock and 2,220 beneficial shareholders of the Company's Class B Common Stock. At February 28, 2017, to the Company's knowledge, there was one shareholder of the Company's Class A common stock whose voting rights were suspended. This shareholder owned 23.2% of the Company's outstanding shares of Class A common stock. For additional discussion, see Item 1A – "Risk Factors – As a result of protective provisions in the Company's certificate of incorporation, the voting power of certain officers, directors and principal shareholders may be increased at future meetings of the Company's shareholders".
(c) Dividends
During the years ended December 31, 2016, 2015 and 2014, the Company declared dividends on a quarterly basis at a rate of $0.06 per Class A share of common stock and $0.07 per Class B share of common stock totaling $3.2 million during each year. There are no contractual restrictions on the Company's ability to pay dividends provided the Company is not in default under its credit agreements immediately before such payment and after giving effect to such payment. On February 1, 2017, the Company paid a dividend to all shareholders of record at January 13, 2017 of Class A and Class B Common Stock in the total amount of $0.1 million ($0.06 per share) and $0.7 million ($0.07 per share), respectively. On February 16, 2017, Bel's Board of Directors declared a dividend in the amount of $0.06 per Class A common share and $0.07 per Class B common share which is scheduled to be paid on May 1, 2017 to all shareholders of record at April 14, 2017. The Company currently anticipates paying dividends quarterly in the future.
|
(d)
|
Common Stock Performance Comparisons
|
The following graph shows, for the five years ended December 31, 2016, the cumulative total return on an investment of $100 assumed to have been made on December 31, 2011 in our common stock. The graph compares this return ("Bel") with that of comparable investments assumed to have been made on the same date in: (a) the NASDAQ Stock Market (U.S. Companies) and (b) a group of companies within our industry.
Total return for each assumed investment assumes the reinvestment of all dividends on December 31 of the year in which the dividends were paid.
Comparison of 5 Year Cumulative Total Return
Assumes Initial Investment of $100
December 2016
Assumes Initial Investment of $100
December 2016
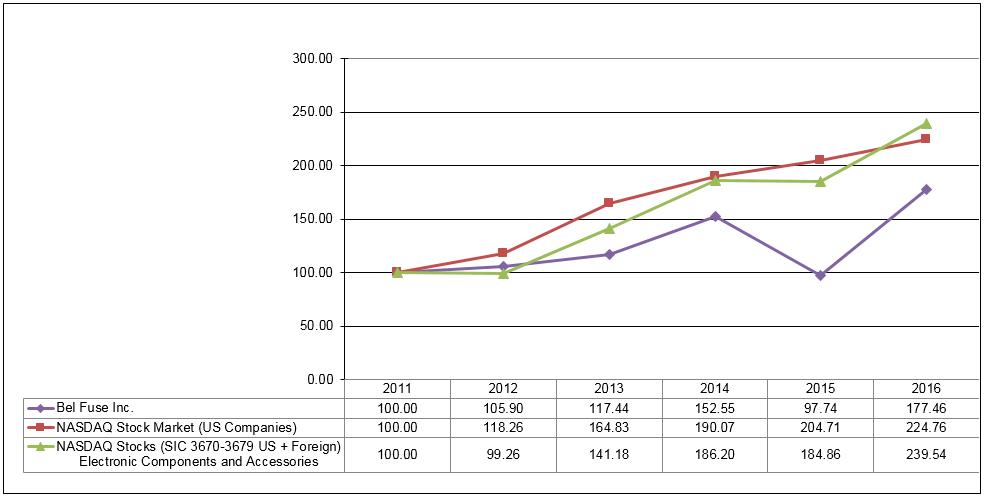
The following tables set forth selected consolidated financial data as of the dates and for the periods presented. The selected consolidated balance sheet data as of December 31, 2016 and 2015 and the selected consolidated statement of operations data for the years ended December 31, 2016, 2015 and 2014 have been derived from our audited consolidated financial statements and related notes that we have included elsewhere in this Form 10-K. The selected financial data below includes the results of acquired companies from their respective acquisition dates. The selected consolidated balance sheet data as of December 31, 2014, 2013 and 2012 and the selected consolidated statement of operations data for the years ended December 31, 2013 and 2012 have been derived from audited consolidated financial statements that are not presented in this Form 10-K. The selected consolidated balance sheet data for years presented prior to 2016 have been revised to reflect the retrospective application of accounting pronouncements that the Company adopted effective January 1, 2016. See Note 1 for further information. The selected consolidated balance sheet data as of December 31, 2014 and 2013 and the selected consolidated statement of operations data for the years ended December 31, 2014, 2013 and 2012 have been revised to reflect measurement period adjustments related to the 2012, 2013 and 2014 Acquisitions.
For information regarding the Company's acquisitions, see Note 2, "Acquisitions and Disposition."
|
Years Ended December 31,
|
||||||||||||||||||||
|
2016
|
2015
|
2014
|
2013
|
2012
|
||||||||||||||||
|
(In thousands of dollars, except per share data)
|
||||||||||||||||||||
|
Selected Consolidated Statements of Operations Data: (a)
|
||||||||||||||||||||
|
Net sales
|
$
|
500,153
|
$
|
567,080
|
$
|
487,076
|
$
|
349,189
|
$
|
286,594
|
||||||||||
|
Cost of sales
|
400,245
|
458,253
|
399,721
|
286,952
|
240,115
|
|||||||||||||||
|
Selling, general and administrative expenses
|
71,005
|
77,952
|
72,061
|
45,872
|
39,388
|
|||||||||||||||
|
Impairment of goodwill and other intangible assets (b)
|
105,972
|
-
|
-
|
-
|
-
|
|||||||||||||||
|
(Gain) loss on sale of property, plant and equipment (c)
|
(2,644
|
)
|
161
|
(10
|
) |
(69
|
)
|
183
|
||||||||||||
|
Stock-based compensation
|
2,817
|
2,815
|
2,717
|
1,879
|
1,767
|
|||||||||||||||
|
Restructuring charges (d)
|
2,087
|
2,114
|
1,832
|
1,387
|
5,245
|
|||||||||||||||
|
(Loss) earnings before income taxes
|
(82,552
|
)
|
25,732
|
9,770
|
15,165
|
997
|
||||||||||||||
|
Net (loss) earnings
|
$
|
(64,834
|
)
|
$
|
19,197
|
$
|
8,603
|
$
|
15,908
|
$
|
2,373
|
|||||||||
|
Reconciliation of net earnings to EBITDA (e):
|
||||||||||||||||||||
|
Net (loss) earnings
|
$
|
(64,834
|
)
|
$
|
19,197
|
$
|
8,603
|
$
|
15,908
|
$
|
2,373
|
|||||||||
|
Depreciation and amortization (f)
|
21,778
|
23,008
|
20,367
|
12,382
|
9,113
|
|||||||||||||||
|
Interest expense
|
6,662
|
7,588
|
3,978
|
156
|
16
|
|||||||||||||||
|
Income tax (benefit) provision
|
(17,718
|
)
|
6,535
|
1,167
|
(743
|
)
|
(1,376
|
)
|
||||||||||||
|
EBITDA (e)
|
$
|
(54,112
|
)
|
$
|
56,328
|
$
|
34,115
|
$
|
27,703
|
$
|
10,126
|
|||||||||
|
Net (loss) earnings per share:
|
||||||||||||||||||||
|
Class A common share - basic and diluted
|
$
|
(5.25
|
)
|
$
|
1.53
|
$
|
0.69
|
$
|
1.32
|
$
|
0.17
|
|||||||||
|
Class B common share - basic and diluted
|
$
|
(5.48
|
)
|
$
|
1.64
|
$
|
0.75
|
$
|
1.41
|
$
|
0.21
|
|||||||||
|
Cash dividends declared per share:
|
||||||||||||||||||||
|
Class A common share
|
$
|
0.24
|
$
|
0.24
|
$
|
0.24
|
$
|
0.24
|
$
|
0.24
|
||||||||||
|
Class B common share
|
$
|
0.28
|
$
|
0.28
|
$
|
0.28
|
$
|
0.28
|
$
|
0.28
|
||||||||||
|
As of December 31,
|
||||||||||||||||||||
|
2016
|
2015
|
2014
|
2013
|
2012
|
||||||||||||||||
|
(In thousands of dollars, except percentages)
|
||||||||||||||||||||
|
Selected Consolidated Balance Sheet Data and Ratios:
|
||||||||||||||||||||
|
Cash and cash equivalents
|
$
|
73,411
|
$
|
85,040
|
$
|
77,138
|
$
|
62,123
|
$
|
71,262
|
||||||||||
|
Working capital (g)
|
163,115
|
158,619
|
183,459
|
134,179
|
141,535
|
|||||||||||||||
|
Goodwill
|
17,951
|
121,634
|
118,369
|
18,490
|
13,559
|
|||||||||||||||
|
Total assets (g)
|
426,740
|
578,505
|
630,372
|
308,141
|
275,189
|
|||||||||||||||
|
Total debt (g)
|
141,245
|
183,548
|
227,576
|
-
|
-
|
|||||||||||||||
|
Stockholders' equity
|
158,434
|
233,122
|
224,273
|
228,702
|
215,362
|
|||||||||||||||
|
Return on average total assets (g)(h)
|
-13.9
|
%
|
3.0
|
%
|
1.8
|
%
|
5.4
|
%
|
0.9
|
%
|
||||||||||
|
Return on average stockholders' equity (h)
|
-38.6
|
%
|
8.2
|
%
|
3.8
|
%
|
7.3
|
%
|
1.1
|
%
|
||||||||||
|
(a)
|
See Item 7, "Management's Discussion and Analysis of Financial Condition and Results of Operations," for a discussion of the factors that contributed to our consolidated operating results and our consolidated cash flows for the three years ended December 31, 2016.
|
|
(b)
|
During 2016, the Company recorded an impairment charge related to its goodwill and other intangible assets of $106.0 million. See Note 4, "Goodwill and Other Intangible Assets," for further information.
|
|
(c)
|
In connection with the sale of certain of its properties in Hong Kong and San Diego, the Company recorded a gain on sale of $2.6 million during 2016.
|
|
(d)
|
See Note 3, "Restructuring Activities," for further information on restructuring charges incurred during the three years ended December 31, 2016. During 2012, Bel initiated the closure of its Cinch North American manufacturing facility in Vinita, Oklahoma, and transition of the operations to Reynosa, Mexico and a new facility in McAllen, Texas. The Company recorded $5.2 million related to this restructuring during 2012, comprised primarily of $3.2 million in severance costs, $1.4 million related to asset disposals and $0.6 million of other expenses.
|
|
(e)
|
EBITDA is a non‑U.S. GAAP measure that is not a measure of performance under accounting principles generally accepted in the United States of America ("U.S. GAAP"). EBITDA has limitations as an analytical tool and should not be considered in isolation from or as a substitute for U.S. GAAP information. It does not purport to represent any similarly titled U.S. GAAP information and is not an indicator of our performance under U.S. GAAP. EBITDA may not be comparable with similarly titled measures used by others. Investors are cautioned against placing undue reliance on this non-GAAP measure. Our management may assess our financial results both on a U.S. GAAP basis and on a non-U.S. GAAP basis. Non-U.S. GAAP financial measures provide management with additional means to understand and evaluate the core operating results and trends in our ongoing business.
|
|
(f)
|
Depreciation and amortization is included in both cost of sales and selling, general and administrative expenses on the consolidated statements of operations.
|
|
(g)
|
The Company adopted accounting standards effective January 1, 2016 related to deferred tax assets and liabilities, and deferred financing costs. Both standards were applied retrospectively and impacted the presentation of these items on the balance sheet. For the December 31, 2014 information presented, working capital, total assets and total debt have been revised to reflect the reclassification of deferred tax assets and liabilities from current to noncurrent, as well as the reclassification of deferred financing costs from other assets to being presented as a reduction of long-term debt. For the December 31, 2013 and 2012 information presented, working capital was adjusted to reflect the change in accounting principle related to the reclassification of deferred tax assets and liabilities from current to noncurrent.
|
|
(h)
|
Returns on average total assets and stockholders' equity are computed for each year by dividing net earnings for such year by the average balances of total assets or stockholders' equity, as applicable, on the last day of each quarter during such year and on the last day of the immediately preceding year.
|
The information in this MD&A should be read in conjunction with the Company's consolidated financial statements and the notes related thereto. The discussion of results, causes and trends should not be construed to imply any conclusion that such results, causes or trends will necessarily continue in the future. See "Cautionary Notice Regarding Forward-Looking Information" above for further information. Also, when we cross reference to a "Note," we are referring to our "Notes to Consolidated Financial Statements," unless the context indicates otherwise. All amounts and percentages are approximate due to rounding.
Overview
Our Company
We design, manufacture and market a broad array of products that power, protect and connect electronic circuits. These products are primarily used in the networking, telecommunications, computing, military, aerospace, transportation and broadcasting industries. Bel's portfolio of products also finds application in the automotive, medical and consumer electronics markets.
We operate through three geographic segments: North America, Asia and Europe. In 2016, 51% of the Company's revenues were derived from North America, 34% from Asia and 15% from its Europe operating segment. By product group, 34% of 2016 sales related to the Company's power solutions and protection products, 34% in connectivity solutions products and 32% in magnetic products.
Our operating expenses are driven principally by the cost of labor where the factories that Bel uses are located, the cost of the materials that we use and our ability to effectively and efficiently manage overhead costs. As labor and material costs vary by product line and region, any significant shift in product mix can have an associated impact on our costs of sales. Costs are recorded as incurred for all products manufactured. Such amounts are determined based upon the estimated stage of production and include labor cost and fringes and related allocations of factory overhead. Our products are manufactured at various facilities in the U.S., Mexico, Dominican Republic, England, Czech Republic, Slovakia and the PRC.
In the PRC, where we generally enter into processing arrangements with several independent third-party contractors and also have our own manufacturing facilities, the availability of labor is cyclical and is significantly affected by the migration of workers in relation to the annual Lunar New Year holiday as well as economic conditions in the PRC. In addition, we have little visibility into the ordering habits of our customers and we can be subjected to large and unpredictable variations in demand for our products. Accordingly, we must continually recruit and train new workers to replace those lost to attrition each year and be able to address peaks in demand that may occur from time to time. These recruiting and training efforts and related inefficiencies, and overtime required in order to meet demand, can add volatility to the costs incurred by us for labor in the PRC.
The consolidated results included in this MD&A include the results of acquired companies discussed above from their respective acquisition dates.
Key Factors Affecting our Business
The Company believes the key factors affecting Bel's 2016 and/or future results include the following:
|
·
|
Revenues –The Company's revenues declined by $66.9 million (or 11.8%) in 2016 as compared to 2015. The year-over-year declines in sales were primarily due to missed design cycles within the Power Solutions business and general market softness. During the latter part of 2016, sales were also impacted by weak sales to distributors, as their inventory levels continued to be high.
|
|
·
|
Product Mix – Material and labor costs vary by product line and any significant shift in product mix between higher- and lower-margin product lines will have a corresponding impact on the Company's gross margin percentage. In general, our connectivity products have the highest contribution margins, our magnetic products are more labor intensive and are therefore less profitable than the connectivity products and our power products are on the lower end of our profit margin range, due to their high material content. Fluctuations in sales volume among our product groups will have a corresponding impact on Bel's profit margins.
|
|
·
|
Impairment Charges – Due to continued market weakness, the Company reviewed its goodwill and other intangible assets for impairment in the first and second quarters of 2016. In connection with this analysis, we recorded a total non-cash impairment charge of $106.0 million related to our goodwill and indefinite-lived trademarks during the first half of 2016. During the fourth quarter of 2016, we completed our annual goodwill and intangible impairment testing and determined that no impairment existed at that time.
|
|
·
|
Restructuring – The Company continues to implement restructuring programs to increase operational efficiencies. The Company incurred $2.1 million of restructuring charges during 2016. In October 2016, the Company announced its decision to close its manufacturing facility in Shanghai, PRC and transition the operations to other existing Bel facilities. During the fourth quarter of 2016, the Company recorded pre-tax restructuring charges of $1.4 million associated with the Shanghai closure, consisting primarily of termination benefits. Annual savings of approximately $2 million are expected from this initiative once fully implemented ($1.0 million within cost of sales and $1.0 million within selling, general and administrative expenses).
|
|
·
|
Impact of Foreign Currency – Since we are a U.S. domiciled company, we translate our foreign currency-denominated financial results into U.S. dollars. Due to the changes in the value of foreign currencies relative to the U.S. dollar, translating our financial results and the revaluation of certain intercompany as well as third-party transactions to and from foreign currencies to U.S. dollars may result in a favorable or unfavorable impact to our consolidated statements of operations and cash flows. The Company monitors changes in foreign currencies and may implement pricing actions to help mitigate the impact that changes in foreign currencies may have on its consolidated operating results. The Company believes that its results of operations for the year ended December 31, 2016 were not materially impacted by the referendum passed by Great Britain in June 2016 to exit the European Union, or the resulting strengthening of the U.S. dollar to the Great Britain pound to the U.S. dollar. See Selling, General and Administrative Expense and Item 3. Quantitative and Qualitative Disclosures About Market Risk for further details. However, long-term effects from the referendum could be materially adverse to the Company. See "The global nature of our operations exposes us to numerous risks that could materially adversely affect our consolidated financial condition and results of operations" in Item 1A of this Annual Report on 10-K.
|
|
·
|
Effective Tax Rate – The Company's effective tax rate will fluctuate based on the geographic segment in which our pretax profits are earned. Of the geographic segments in which we operate, the U.S. has the highest tax rates; Europe's tax rates are generally lower than U.S. tax rates; and Asia has the lowest tax rates of the Company's three geographical segments.
|
While we continued to see general market weakness in our industry throughout the fourth quarter of 2016, our pipeline for new opportunities has started to show signs of increasing in recent months. We anticipate future growth to be driven by product demand related to datacenter and e-Mobility initiatives in our Power Solutions business, and within the commercial aerospace segment for our connectivity solutions products. We have realigned our North American sales organization and restructured our European sales organization to create more narrow areas of focus for each team and to achieve better accountability. The preceding discussions represent Forward-Looking Statements. See "Cautionary Notice Regarding Forward-Looking Statements."
Summary by Operating Segment
Net sales to external customers by reportable operating segment for the years ended December 31, 2016, 2015 and 2014 were as follows (dollars in thousands):
|
2016
|
2015
|
2014
|
||||||||||||||||||||||
|
North America
|
$
|
256,760
|
51
|
%
|
$
|
304,328
|
54
|
%
|
$
|
217,258
|
45
|
%
|
||||||||||||
|
Asia
|
168,458
|
34
|
%
|
188,146
|
33
|
%
|
201,338
|
41
|
%
|
|||||||||||||||
|
Europe
|
74,935
|
15
|
%
|
74,606
|
13
|
%
|
68,480
|
14
|
%
|
|||||||||||||||
|
$
|
500,153
|
100
|
%
|
$
|
567,080
|
100
|
%
|
$
|
487,076
|
100
|
%
|
|||||||||||||
Net sales and income (loss) from operations by operating segment for the years ended December 31, 2016, 2015 and 2014 were as set forth in the following table (dollars in thousands). Segment net sales are attributed to individual segments based on the geographic source of the billing for such customer sales.
|
2016
|
2015
|
2014
|
||||||||||
|
Total segment sales:
|
||||||||||||
|
North America
|
$
|
268,935
|
$
|
329,304
|
$
|
248,007
|
||||||
|
Asia
|
256,202
|
295,751
|
275,765
|
|||||||||
|
Europe
|
86,750
|
148,735
|
114,748
|
|||||||||
|
Total segment sales
|
611,887
|
773,790
|
638,520
|
|||||||||
|
Reconciling item:
|
||||||||||||
|
Intersegment sales
|
(111,734
|
)
|
(206,710
|
)
|
(151,444
|
)
|
||||||
|
Net sales
|
$
|
500,153
|
$
|
567,080
|
$
|
487,076
|
||||||
|
(Loss) income from operations:
|
||||||||||||
|
North America
|
$
|
(35,722
|
)
|
$
|
11,012
|
$
|
(4,531
|
)
|
||||
|
Asia
|
(24,360
|
)
|
8,175
|
13,090
|
||||||||
|
Europe
|
(16,430
|
)
|
9,413
|
4,913
|
||||||||
|
$
|
(76,512
|
)
|
$
|
28,600
|
$
|
13,472
|
||||||
Sales in North America declined during 2016 compared to 2015 primarily due to reductions in power solutions and protection sales of $42.6 million. See Net Sales, Power Solutions and Protection, below. North America sales were also impacted by lower military spending for our connectivity solutions products and reduced sales through distributors. The decline in Asia segment sales in 2016 noted in the table above resulted from a reduction in customer demand for our integrated connector module (ICM) and TRP products in 2016 (producing an $11.2 million reduction in sales), as well as a $6.1 million decrease in sales of our DC/DC products. Net sales were favorably impacted in all segments in 2015 due to the 2014 Acquisitions. See Note 12, "Segments," for details on contributions from recent acquisitions to net sales and income from operations by segment.
Net Sales
The Company's net sales by major product line for the years ended December 31, 2016, 2015 and 2014 were as follows (dollars in thousands):
|
Years Ended
|
||||||||||||||||||||||||
|
December 31,
|
||||||||||||||||||||||||
|
2016
|
2015
|
2014
|
||||||||||||||||||||||
|
Power solutions and protection
|
$
|
172,176
|
34
|
%
|
$
|
214,766
|
38
|
%
|
$
|
159,867
|
33
|
%
|
||||||||||||
|
Connectivity solutions
|
168,845
|
34
|
%
|
181,697
|
32
|
%
|
152,954
|
31
|
%
|
|||||||||||||||
|
Magnetic solutions
|
159,132
|
32
|
%
|
170,617
|
30
|
%
|
174,255
|
36
|
%
|
|||||||||||||||
|
$
|
500,153
|
100
|
%
|
$
|
567,080
|
100
|
%
|
$
|
487,076
|
100
|
%
|
|||||||||||||
2016 as Compared to 2015
Power Solutions and Protection:
The decline in power solutions and protection products during 2016 as compared to 2015 was primarily attributable to a $34.4 million reduction in Power Solutions product sales and lower DC/DC converter product sales of $6.1 million. The power solutions and protection product group was impacted by the general market softness which continued through the fourth quarter of 2016. The Power Solutions business is still showing year over year declines as we work through the new design cycles, which we were able to enter again in mid-2015 after quality issues had been resolved. As the design-to-market cycle for the Power Solutions business is approximately 18 months, we anticipate seeing some growth in this business in 2017. The preceding sentence represents a Forward-Looking Statement. See "Cautionary Notice Regarding Forward-Looking Statements."
Connectivity Solutions:
Sales declined as a result of general weakness in the military and industrial sectors as well as RF Connector sales through distribution where weakness in broadline distribution offset increases in sales to our value-added distributors. Sales into the commercial aerospace sector remained solid throughout 2016, and this is an anticipated area of growth for 2017. The preceding sentence represents a Forward-Looking Statement. See "Cautionary Notice Regarding Forward-Looking Statements."
Magnetic Solutions:
We experienced reduced customer demand for our ICM/TRP products due to the continued weakness in the macro environment during 2016. This resulted in a decrease of $11.2 million in sales related to these products as compared to 2015 volumes.
2015 as Compared to 2014
Power Solutions and Protection:
The Power Solutions acquisition contributed incremental sales of $60.1 million to the power solutions and protection product line during 2015 as compared to 2014. Excluding the incremental impact of the Power Solutions acquisition, power solutions and protection net sales decreased by $5.2 million, or 8.8% in 2015 as compared to 2014. This decrease was primarily due to a reduction in demand of our DC/DC products in 2015, resulting in a decrease in sales of $8.2 million during 2015 as compared to 2014. This was partially offset by an increase in sales of our custom module products of $2.5 million during the same timeframe.
Connectivity Solutions:
The Connectivity Solutions acquisition contributed incremental sales of $35.9 million to the connectivity solutions product line during 2015 as compared to 2014. Excluding the incremental impact of the Connectivity Solutions acquisition, connectivity solutions net sales decreased by $7.1 million, or 6.0%, during 2015 as compared to 2014 reflecting lower demand from our customers for these products. This decrease was primarily due to declines in sales volumes from our passive connector products and Cinch products.
Magnetic Solutions:
The decreases in magnetic solutions' sales from 2014 to 2015 noted in the table above were primarily due to a reduction in sales volume of Bel's ICM products of $2.1 million during 2015 as compared to 2014 due to lower customer demand for these products.
Cost of Sales
Cost of sales as a percentage of net sales for the three years ended December 31, 2016 consisted of the following:
|
Years Ended
|
||||||||||||
|
December 31,
|
||||||||||||
|
2016
|
2015
|
2014
|
||||||||||
|
Material costs
|
41.6
|
%
|
43.6
|
%
|
44.9
|
%
|
||||||
|
Labor costs
|
10.3
|
%
|
10.7
|
%
|
12.1
|
%
|
||||||
|
Research and development expenses
|
5.3
|
%
|
4.9
|
%
|
4.4
|
%
|
||||||
|
Other expenses
|
22.8
|
%
|
21.6
|
%
|
20.7
|
%
|
||||||
|
Total cost of sales
|
80.0
|
%
|
80.8
|
%
|
82.1
|
%
|
||||||
2016 as Compared to 2015
Material costs as a percentage of sales were lower during 2016 as compared 2015 primarily due to the decline in sales within our power solutions and protection group, as those products carry a higher material content than our other product groups. Other contributing factors of the decline in material costs as a percentage of sales included a $2.1 million reduction in warranty claims incurred in 2016 as compared to 2015, and lower material costs in the PRC due to the depreciation of the renminbi against the U.S. dollar in 2016. See "Inflation and Foreign Currency Exchange" below for further information.
Labor costs as a percentage of sales declined during 2016 as compared to 2015 primarily due to the reduction in sales volume of our labor-intensive magnetic products discussed above. The depreciation of the peso and renminbi versus the U.S. dollar also contributed to the reduction in local labor costs in Mexico and the PRC during 2016.
2015 as Compared to 2014
Material costs as a percentage of sales decreased slightly in 2015 as compared to 2014. The decrease resulted from an improvement in Power Solutions material costs as a percentage of sales during 2015 (at 52.3%) versus 2014 (at 60%), as warranty claims incurred in the latter part of 2014 related to the Power Solutions business did not recur in 2015. A full year of sales related to the Connectivity Solutions business also contributed to lower material costs as a percentage of sales on a consolidated basis, as Connectivity Solutions' products carry a lower material content than Bel's other products.
Labor costs as a percentage of sales continued to decline in 2015 as compared to 2014 as a result of a full year of sales of Power Solutions and Connectivity Solutions products during 2015, as the products of the 2014 Acquisitions carry a much lower labor content compared with the Bel's other products.
Research and Development ("R&D)
Included in cost of sales are R&D expenses of $26.7 million, $27.7 million and $21.5 million for the years ended December 31, 2016, 2015 and 2014, respectively. The reduction in R&D expense from 2015 to 2016 was primarily due to lower fixed costs resulting from R&D facility consolidations. The majority of the increase from 2014 to 2015 relates to the inclusion of R&D expenses of the 2014 Acquired Companies, which have been included in Bel's results since their respective acquisition dates.
Selling, General and Administrative Expenses ("SG&A")
2016 as Compared to 2015
SG&A expenses declined by $6.9 million in 2016 as compared to 2015. During 2016, SG&A benefited from a reversal of certain value-added and business tax items recorded in connection with the acquisition of Power Solutions of $5.2 million. SG&A in 2016 also benefited from cost savings initiatives in North America and Europe implemented during the latter part of 2015 and earlier part of 2016, and lower sales commissions of $1.2 million due to the decline in sales. These factors were offset in part by a decrease in net foreign currency exchange gains of $2.0 million and an increase in incentive compensation in 2016 of $1.2 million as compared with 2015.
2015 as Compared to 2014
SG&A expenses increased $6.1 million in 2015 as compared to 2014. This increase was primarily due to the inclusion of a full year of SG&A expenses related to the 2014 Acquisitions, which accounted for an additional $11.5 million in SG&A expenses in 2015. Bel's legal and professional fees were also higher by $1.3 million in 2015 due to incremental audit and tax work related to the 2014 Acquisitions performed in 2015. These increased expenses were offset by a reduction in acquisition-related costs of $6.9 million in 2015 as compared to 2014.
Restructuring Charges
The Company recorded restructuring charges of $2.1 million in 2016, $2.1 million in 2015 and $1.8 million in 2014 in connection with its restructuring programs. See Note 3, "Restructuring Activities" for a discussion of restructuring charges incurred in 2015 and 2016. In 2014, the Company incurred severance costs associated with restructuring of the management and sales teams after the acquisitions of Power Solutions and Connectivity Solutions.
Interest Expense
The Company incurred interest expense of $6.7 million in 2016, $7.6 million in 2015 and $4.0 million in 2014 primarily due to our outstanding borrowings under the Company's credit and security agreement used to fund the 2014 Acquisitions. The decline in interest expense in 2016 compared to 2015 was due to mandatory and voluntary repayments made in 2016. Interest expense for 2014 represents approximately a half year of expense, due to the timing of borrowings, versus a full year of expense in 2015. See "Liquidity and Capital Resources" and Note 10, "Debt," for further information on the Company's outstanding debt.
Income Taxes
The Company's effective tax rate will fluctuate based on the geographic segment in which the pretax profits are earned. Of the geographic segments in which the Company operates, the U.S. has the highest tax rates; Europe's tax rates are generally lower than U.S. tax rates; and Asia has the lowest tax rates of the Company's three geographical segments. See Note 9, "Income Taxes."
2016 as Compared to 2015
The (benefit) provision for income taxes for the year ended December 31, 2016 and 2015 was ($17.7) million and $6.5 million, respectively. The Company's loss before benefit for income taxes for the year ended December 31, 2016, was primarily attributable to the $106.0 million impairment of goodwill and intangible assets recognized in the first half of 2016. The Company's effective tax rate was 21.5% and 25.4% for the year ended December 31, 2016 and 2015, respectively. The change in the effective tax rate during the year ended December 31, 2016 as compared to 2015, was primarily attributable to the tax effect related to the settlement of liabilities for uncertain tax positions and, to a lesser extent, the impairment of the goodwill and intangible assets. See Note 9, "Income Taxes."
2015 as Compared to 2014
The provision for income taxes for the year ended December 31, 2015 and 2014 was $6.5 million and $1.2 million, respectively. The Company's earnings before income taxes for the year ended December 31, 2015 were $16.0 million greater than in 2014. The Company's effective tax rate was 25.4% and 11.9% for the year ended December 31, 2015 and 2014, respectively. The change in the effective tax rate during 2015 as compared to 2014, was primarily attributed to an increase in U.S. taxes resulting from a significant increase in the North America segment's pre-tax income and an increase in Asia taxes resulting from taxes related to uncertain tax positions. In addition, there was a significant increase in the Europe segment income offset, in part, by a decrease in the Asia segment income which resulted in higher foreign taxes during 2015 compared to 2014. See Note 9, "Income Taxes."
Other Tax Matters
The Company has a portion of its products manufactured on the mainland of the PRC where Bel is not subject to corporate income tax on manufacturing services provided by third parties. Hong Kong has a territorial tax system which imposes corporate income tax at a rate of 16.5% on income from activities solely conducted in Hong Kong.
The Company holds an offshore business license from the government of Macao. With this license, a Macao offshore company named Bel Fuse (Macao Commercial Offshore) Limited has been established to handle the Company's sales to third-party customers in Asia. Sales by this company primarily consist of products manufactured in the PRC. This company is not subject to Macao corporate profit taxes which are imposed at a tax rate of 12%. Additionally, the Company established TRP International, a China Business Trust ("CBT"), when it acquired the TRP group, as previously discussed. Sales by the CBT consists of products manufactured in the PRC and sold to third-party customers inside and outside Asia. The CBT is not subject to PRC income taxes, which are generally imposed at a tax rate of 25%.
It is the Company's intention to repatriate substantially all net income from its wholly owned PRC subsidiary, Dongguan Transpower Electric Products Co., Ltd, a Chinese Limited Liability Company, to its direct Hong Kong parent Transpower Technologies (Hong Kong) Ltd. Applicable income and dividend withholding taxes have been reflected in the accompanying consolidated statements of operations for the year ended December 31, 2016. However, U.S. deferred taxes need not be provided as there is no intention to repatriate such amounts to the U.S. Management's intention is to permanently reinvest the majority of the remaining earnings of foreign subsidiaries in the expansion of its foreign operations. Unrepatriated earnings, upon which U.S. income taxes have not been accrued, are approximately $100.4 million at December 31, 2016. Such unrepatriated earnings are deemed by management to be permanently reinvested. At December 31, 2016, the estimated federal income tax liability related to unrepatriated foreign earnings is $23.3 million under the current tax law.
Inflation and Foreign Currency Exchange
During the past three years, we do not believe the effect of inflation on our consolidated financial position and results of operations was material to our consolidated financial position or our consolidated results of operations. We are exposed to market risk from changes in foreign currency exchange rates. Fluctuations of the U.S. dollar against other major currencies have not significantly affected our foreign operations as most sales continue to be denominated in U.S. dollars or currencies directly or indirectly linked to the U.S. dollar. Most significant expenses, including raw materials, labor and manufacturing expenses, are incurred primarily in U.S. dollars or the Chinese renminbi, and to a lesser extent in British pounds and Mexican pesos. The Chinese renminbi depreciated by approximately 6.1% in 2016 as compared to 2015 and the Mexican peso depreciated by 15.1% in 2016 as compared to 2015 . To the extent the renminbi or peso appreciate in future periods, it could result in the Company's incurring higher costs for most expenses incurred in the PRC and Mexico. The Company's European entities, whose functional currencies are euros, British pounds and Czech korunas, enter into transactions which include sales that are denominated principally in euros, British pounds and various other European currencies, and purchases that are denominated principally in U.S. dollars and British pounds. Such transactions, as well as those related to our multi-currency intercompany payable and receivable transactions, resulted in net realized and unrealized currency exchange gains of $3.1 million, $5.1 million and $4.3 million for the years ended December 31, 2016, 2015 and 2014, respectively, which were included in SG&A expenses on the consolidated statements of operations. The currency exchange gains recorded in 2016 were primarily due to the favorable impact of the depreciation of the Chinese renminbi and euro against the U.S. dollar. The currency exchange gains recorded in 2015 and 2014 were primarily due to the favorable impact of the depreciation of the euro against the U.S. dollar on a $34 million multi-currency intercompany loan. This loan was settled by the end of 2015. Translation of subsidiaries' foreign currency financial statements into U.S. dollars resulted in translation adjustments, net of taxes, of ($9.7) million, ($10.0) million and ($11.3) million for the years ended December 31, 2016, 2015 and 2014, respectively, which are included in accumulated other comprehensive income (loss) on the consolidated balance sheets.
Liquidity and Capital Resources
Our primary sources of cash are the collection of trade receivables generated from the sales of our products and services to our customers and amounts available under our existing lines of credit, including our credit facility. Our primary uses of cash are payments for operating expenses, investments in working capital, capital expenditures, interest, taxes, dividends, debt obligations and other long-term liabilities. We believe that our current liquidity position and future cash flows from operations will enable us to fund our operations, including all of the items mentioned above in the next twelve months.
At December 31, 2016 and 2015, $61.1 million and $67.9 million, respectively (or 83% and 80%, respectively), of cash and cash equivalents was held by foreign subsidiaries of the Company. Management's intention is to permanently reinvest the majority of these funds outside the U.S. and there are no current plans that would indicate a need to repatriate them to fund the Company's U.S. operations. In the event these funds were needed for Bel's U.S. operations, the Company would be required to accrue and pay U.S. taxes to repatriate these funds. See "Income Taxes" above for further details.
On June 19, 2014, the Company entered into a senior Credit and Security Agreement ("CSA") (see Note 10, "Debt," for additional details). The CSA contains customary representations and warranties, covenants and events of default and financial covenants that measure (i) the ratio of the Company's total funded indebtedness, on a consolidated basis, to the amount of the Company's consolidated EBITDA, as defined ("Leverage Ratio"), and (ii) the ratio of the amount of the Company's consolidated EBITDA to the Company's consolidated fixed charges ("Fixed Charge Coverage Ratio"). If an event of default occurs, the lenders under the CSA would be entitled to take various actions, including the acceleration of amounts due thereunder and all actions permitted to be taken by a secured creditor. At December 31, 2016, the Company was in compliance with its debt covenants, including its most restrictive covenant, the Leverage Ratio. The unused credit available under the credit facility at December 31, 2016 was $50.0 million, of which we had the ability to borrow the full amount without violating our Leverage Ratio covenant based on the Company's existing consolidated EBITDA. In January 2017, the Company borrowed $6.0 million from the available credit facility.
In connection with its acquisitions of Power Solutions and Connectivity Solutions (see Note 2, "Acquisitions and Disposition"), the Company borrowed $235.0 million under the CSA during 2014, of which $143.8 million is outstanding as of December 31, 2016. Scheduled principal payments of the long-term debt outstanding are included in "Contractual Obligations" below and in Note 10, "Debt."
For information regarding further commitments under the Company's operating leases, see Note 16, "Commitments and Contingencies."
We are currently engaged in a multi-year process of conforming the majority of our operations onto one global ERP. The ERP is designed to improve the efficiency of our supply chain and financial transaction processes, accurately maintain our books and records, and provide information important to the operation of the business to our management team. The implementation of the ERP is being conducted by business unit on a three phase approach over the next three years. We currently estimate total costs over the next three years to be between $4 million to $5 million. These costs will be included in SG&A on the consolidated financial statements. Upon completion of the implementation of the new ERP, we anticipate lower maintenance and lower external information and technology support fees resulting in annual savings of approximately $2 million. The preceding sentence represents a Forward-Looking Statement. See "Cautionary Notice Regarding Forward-Looking Statements."
Cash Flows
During the year ended December 31, 2016, the Company's cash and cash equivalents decreased by $11.6 million. This decrease was primarily due to repayments of long-term debt of $43.4 million, the purchase of property, plant and equipment of $8.2 million and $3.2 million for payments of dividends. These cash outflows were partially offset by net cash provided by operations of $38.6 million and cash proceeds received from the sale of properties in Hong Kong and San Diego of $5.8 million. Cash provided by operating activities decreased by $27.2 million in 2016 as compared to 2015, primarily due to lower earnings on the reduced sales volume in 2016 and an increase in year-end inventory levels in 2016.
During the year ended December 31, 2015, the Company's cash and cash equivalents increased by $7.9 million. This resulted primarily from $65.8 million of cash provided by operating activities, including the impact of the changes in accounts receivable and inventories described below, proceeds of $9.0 million received from the NPS sale and related transactions and $4.2 million received for an acquisition-related settlement payment during 2015. This increase was partially offset by $23.0 million of net repayments under the revolving credit line, $22.4 million of repayments of long-term debt, $9.9 million paid for the purchase of property, plant and equipment and $3.2 million for payments of dividends. As compared to 2014, cash provided by operating activities increased by $43.3 million, partially due to a $10.1 increase in net earnings and a $2.6 increase in depreciation and amortization as 2015 contained a full year of expense for the 2014 Acquired Companies. Reductions in accounts receivable and inventory balances at December 31, 2015 as compared to December 31, 2014 were also contributing factors to the increase in cash provided by operating activities during 2015.
During the year ended December 31, 2014, the Company's cash and cash equivalents increased by $15.0 million. This resulted primarily from $22.5 million provided by operating activities, $215.0 million of proceeds from long-term debt and $23.0 million of proceeds from borrowing under the revolver, partially offset by, among other items, payments totaling $208.7 million, net of cash acquired, for the acquisitions of Power Solutions and Connectivity Solutions, $12.0 million of repayments under the revolving credit line, $5.4 million of repayments of long-term debt, $5.8 million paid in deferred financing costs, $9.0 million paid for the purchase of property, plant and equipment and $3.2 million for payments of dividends. As compared to 2013, cash provided by operating activities increased by $11.9 million, partially due to a $7.4 million increase in depreciation and amortization related to the inclusion of expense from the 2014 Acquisitions and additional depreciation and amortization on the fair value adjustments to tangible and intangible assets.
Cash and cash equivalents, marketable securities and accounts receivable comprised approximately 34.6% and 29.6% of the Company's total assets at December 31, 2016 and December 31, 2015, respectively. The Company's current ratio (i.e., the ratio of current assets to current liabilities) was 2.8 to 1 and 2.3 to 1 at December 31, 2016 and December 31, 2015, respectively.
During the year ended December 31, 2016, accounts receivable decreased $10.8 million primarily due to lower sales volume in the fourth quarter of 2016 as compared to the fourth quarter of 2015. Days sales outstanding (DSO) declined to 54 days at December 31, 2016 from 59 days at December 31, 2015. Inventories remained flat with the December 31, 2015 level as raw material and work in progress volumes picked up in the fourth quarter of 2016 in response to an increase in customer demand for our products. Inventory turns decreased to 3.8 times per year at December 31, 2016 from 4.5 times per year at December 31, 2015, as year-end inventory levels were high in relation to the 2016 sales volume.
Contractual Obligations
The following table sets forth at December 31, 2016 the amounts of payments due under specific types of contractual obligations, aggregated by category of contractual obligation, for the time periods described below.
|
Payments due by period (dollars in thousands)
|
||||||||||||||||||||
|
Contractual Obligations
|
Total
|
Less than 1 year
|
1-3
years |
3-5
years |
More than
5 years |
|||||||||||||||
|
Long-term debt obligations(1)
|
$
|
143,798
|
$
|
12,495
|
$
|
131,303
|
$
|
-
|
$
|
-
|
||||||||||
|
Interest payments due on long-term debt(2)
|
9,745
|
4,337
|
5,408
|
-
|
-
|
|||||||||||||||
|
Capital expenditure obligations
|
2,807
|
2,807
|
-
|
-
|
-
|
|||||||||||||||
|
Operating leases(3)
|
18,770
|
6,491
|
6,403
|
4,705
|
1,171
|
|||||||||||||||
|
Raw material purchase obligations
|
30,968
|
30,862
|
106
|
-
|
-
|
|||||||||||||||
|
First quarter 2017 quarterly cash dividend declared
|
781
|
781
|
-
|
-
|
-
|
|||||||||||||||
|
Total
|
$
|
206,869
|
$
|
57,773
|
$
|
143,220
|
$
|
4,705
|
$
|
1,171
|
||||||||||
|
(1)
|
Represents the principal amount of the debt required to be repaid in each period.
|
|
(2)
|
Includes interest payments required under our CSA related to our term loans and revolver balance. The interest rate in place under our CSA on December 31, 2016 was utilized and this calculation assumes obligations are repaid when due.
|
|
(3)
|
Represents estimated future minimum annual rental commitments primarily under non-cancelable real and personal property leases as of December 31, 2016.
|
At December 31, 2016, we had liabilities for unrecognized tax benefits and related interest and penalties of $27.8 million, most of which is included in other liabilities and the remaining balance of which is included as a reduction to deferred tax assets on our Consolidated Balance Sheet. At December 31, 2016, we cannot reasonably estimate the future period or periods of cash settlement of these liabilities. See Note 9, "Income Taxes," of the Notes to Consolidated Financial Statements for further discussion.
The Company is required to pay SERP obligations at the occurrence of certain events. As of December 31, 2016, $16.9 million is included in long-term liabilities as an unfunded pension obligation on the Company's consolidated balance sheet. Included in other assets at December 31, 2016 is the cash surrender value of company-owned life insurance and marketable securities held in a rabbi trust with an aggregate value of $12.7 million, which has been designated by the Company to be utilized to fund the Company's SERP obligations.
Critical Accounting Policies and Other Matters
The Company's consolidated financial statements include certain amounts that are based on management's best estimates and judgments. Estimates are used when accounting for amounts recorded in connection with mergers and acquisitions, including determination of the fair value of assets and liabilities. Additionally, estimates are used in determining such items as current fair values of goodwill and other intangible assets, as well as provisions related to product returns, bad debts, inventories, intangible assets, investments, SERP expense, income taxes and contingencies and litigation. The Company bases its estimates on historical experience and on various other assumptions, including in some cases future projections, that are believed to be reasonable under the circumstances, the results of which form the basis for making judgments about the carrying values of assets and liabilities that are not readily apparent from other sources. Actual results may differ from these estimates under different assumptions or conditions. The following accounting policies require accounting estimates that have the potential for significantly impacting Bel's financial statements.
Allowance for Doubtful Accounts
In the normal course of business, we extend credit to our customers if they satisfy pre-defined credit criteria. We maintain an accounts receivable allowance for estimated losses resulting from the likelihood of failure of our customers to make required payments. An additional allowance may be required if the financial condition of our customers deteriorates. The allowance for doubtful accounts is maintained at a level that management assesses to be appropriate to absorb estimated losses in the accounts receivable portfolio. The allowance for doubtful accounts is reviewed at a minimum quarterly, and changes to the allowance are made through the provision for bad debts, which is included in SG&A expenses on our consolidated statements of operations. These changes may reflect changes in economic, business and market conditions. The allowance is increased by the provision for bad debts and decreased by the amount of charge-offs, net of recoveries.
The provision for bad debts charged against operating results is based on several factors including, but not limited to, a regular assessment of the collectability of specific customer balances, the length of time a receivable is past due and our historical experience with our customers. In circumstances where a specific customer's inability to meet its financial obligations is known, we record a specific provision for bad debt against amounts due, thereby reducing the receivable to the amount we reasonably assess will be collected. If circumstances change, such as higher than expected defaults or an unexpected material adverse change in a major customer's ability to pay, our estimates of recoverability could be reduced by a material amount. At December 31, 2016 and 2015, the Company had allowance for doubtful accounts of $1.8 million and $1.7 million, respectively.
Inventory
The Company makes purchasing and manufacturing decisions principally based upon firm sales orders from customers, projected customer requirements and the availability and pricing of raw materials. Future events that could adversely affect these decisions and result in significant charges to the Company's operations include miscalculating customer requirements, technology changes which render certain raw materials and finished goods obsolete, loss of customers and/or cancellation of sales orders, stock rotation with distributors and termination of distribution agreements. The Company reduces the carrying value of its inventory for estimated obsolescence or unmarketable inventory by an amount equal to the difference between the cost of inventory and the estimated market value based on the aforementioned assumptions. When such inventory is subsequently used in the manufacturing process, the lower adjusted cost of the material is charged to cost of sales and the improved gross profit is recognized at the time the completed product is shipped and the sale is recorded. As of December 31, 2016 and 2015, the Company had reserves for excess or obsolete inventory of $6.3 million and $7.1 million, respectively. If actual market conditions are less favorable than those projected by management, additional inventory write-downs may be required.
Goodwill and Indefinite-Lived Intangible Assets
Goodwill is reviewed for possible impairment at least annually on a reporting unit level during the fourth quarter of each year. A review of goodwill may be initiated before or after conducting the annual analysis if events or changes in circumstances indicate the carrying value of goodwill may no longer be recoverable.
A reporting unit is the operating segment unless, at businesses one level below that operating segment — the "component" level — discrete financial information is prepared and regularly reviewed by management, and the component has economic characteristics that are different from the economic characteristics of the other components of the operating segment, in which case the component is the reporting unit.
While we are permitted to conduct a qualitative assessment to determine whether it is necessary to perform a two-step quantitative goodwill impairment test, for our annual goodwill impairment tests in the fourth quarter of 2016, 2015 and 2014, we performed quantitative tests for all of our reporting units that have goodwill allocated.
The goodwill impairment test involves a two-step process. In step one, we compare the fair value of each of our reporting units with goodwill to its carrying value, including the goodwill allocated to the reporting unit. If the fair value of the reporting unit exceeds its carrying value, there is no indication of impairment and no further testing is required. If the fair value of the reporting unit is less than the carrying value, we must perform step two of the impairment test to measure the amount of impairment loss, if any. In step two, the reporting unit's fair value is allocated to all of the assets and liabilities of the reporting unit, including any unrecognized intangible assets, in a hypothetical analysis that calculates the implied fair value of goodwill in the same manner as if the reporting unit were being acquired in a business combination. If the implied fair value of the reporting unit's goodwill is less than the carrying value, the difference is recorded as an impairment loss.
We use a fair value approach to test goodwill for impairment. We must recognize a non-cash impairment charge for the amount, if any, by which the carrying amount of goodwill exceeds its implied fair value. We derive an estimate of fair values for each of our reporting units using a combination of an income approach and an appropriate market approach, each based on an applicable weighting. We assess the applicable weighting based on such factors as current market conditions and the quality and reliability of the data. Absent an indication of fair value from a potential buyer or similar specific transactions, we believe that the use of these methods provides a reasonable estimate of a reporting unit's fair value.
Fair value computed by these methods is arrived at using a number of factors, including projected future operating results, anticipated future cash flows, effective income tax rates, comparable marketplace data within a consistent industry grouping, and the cost of capital. There are inherent uncertainties, however, related to these factors and to our judgment in applying them to this analysis. Nonetheless, we believe that the combination of these methods provides a reasonable approach to estimate the fair value of our reporting units. Assumptions for sales, net earnings and cash flows for each reporting unit were consistent among these methods.
Income Approach Used to Determine Fair Values
The income approach is based upon the present value of expected cash flows. Expected cash flows are converted to present value using factors that consider the timing and risk of the future cash flows. The estimate of cash flows used is prepared on an unleveraged debt-free basis. We use a discount rate that reflects a market-derived weighted average cost of capital. We believe that this approach is appropriate because it provides a fair value estimate based upon the reporting unit's expected long-term operating and cash flow performance. The projections are based upon our best estimates of projected economic and market conditions over the related period including growth rates, estimates of future expected changes in operating margins and cash expenditures. Other significant estimates and assumptions include terminal value long-term growth rates, provisions for income taxes, future capital expenditures and changes in future cashless, debt-free working capital.
2016 Annual Goodwill Impairment Test
Critical assumptions that the Company used in performing the income approach for its reporting units included the following:
|
·
|
Applying a compounded annual growth rate for forecasted sales in our projected cash flows through 2021.
|
|
Reporting Unit
|
Compounded Annual Growth Rate
|
|||
|
North America
|
3.0
|
%
|
||
|
Europe
|
2.8
|
%
|
||
|
·
|
Applying a terminal value growth rate of 2% for our reporting units to reflect our estimate of stable and perpetual growth.
|
|
·
|
Determining an appropriate discount rate to apply to our projected cash flow results. This discount rate reflects, among other things, certain risks due to the uncertainties of achieving the cash flow results and the growth rates assigned. The discount rates applied were as follows:
|
|
Reporting Unit
|
Discount Rate
|
|
|
North America
|
11.5%
|
|
|
Europe
|
13.5%
|
|
·
|
A weighting of the results of the income approach of 75% of our overall fair value calculation for each reporting unit.
|
Changes in any of these assumptions could materially impact the estimated fair value of our reporting units. Our forecasts take into account the near and long-term expected business performance, considering the long-term market conditions and business trends within the reporting units. For further discussion of the factors that could result in a change in our assumptions, see "Risk Factors" in this Form 10-K and our other filings with the SEC.
Market Approach Used to Determine Fair Values
Each year we consider various relevant market approaches that could be used to determine fair value.
The market approach estimates the fair value of the reporting unit by applying multiples of operating performance measures to the reporting unit's operating performance (the "Public Company Method"). These multiples are derived from comparable publicly-traded companies with similar investment characteristics to the reporting unit, and such comparables are reviewed and updated as needed annually. We believe that this approach is appropriate because it provides a fair value estimate using multiples from entities with operations and economic characteristics comparable to our reporting units and the Company. The second market approach is based on the publicly traded common stock of the Company, and the estimate of fair value of the reporting unit is based on the applicable multiples of the Company (the "Quoted Price Method"). The third market approach is based on recent mergers and acquisitions of comparable publicly-traded and privately-held companies in our industries (the "Mergers and Acquisition Method").
The key estimates and assumptions that are used to determine fair value under these market approaches include current and forward 12-month operating performance results and the selection of the relevant multiples to be applied. Under the Public Company and Quoted Price Methods, a control premium, or an amount that a buyer is usually willing to pay over the current market price of a publicly traded company, is applied to the calculated equity values to adjust the public trading value upward for a 100% ownership interest, where applicable.
In order to assess the reasonableness of the calculated fair values of our reporting units, we also compare the sum of the reporting units' fair values to our market capitalization and calculate an implied control premium (the excess of the sum of the reporting units' fair values over the market capitalization). We evaluate the control premium by comparing it to control premiums of recent comparable market transactions. If the implied control premium is not reasonable in light of these recent transactions, we will reevaluate our fair value estimates of the reporting units by adjusting the discount rates and/or other assumptions.
We applied a combined weighting of 25% to the market approach when determining the fair value of these reporting units.
If our assumptions and related estimates change in the future, or if we change our reporting unit structure or other events and circumstances change (such as a sustained decrease in the price of our common stock, a decline in current market multiples, a significant adverse change in legal factors or business climates, an adverse action or assessment by a regulator, heightened competition, strategic decisions made in response to economic or competitive conditions or a more-likely-than-not expectation that a reporting unit or a significant portion of a reporting unit will be sold or disposed of), we may be required to record impairment charges in future periods. Any impairment charges that we may take in the future could be material to our consolidated results of operations and financial condition.
Due to weakened market conditions in early 2016, which lowered our forecasted results, we performed an interim impairment test related to goodwill. In connection with that interim test, we recorded an impairment charge of $101.7 million during the first half of 2016. The Company conducted its annual goodwill impairment test as of October 1, 2016, and no impairment was identified at that time. Management has also concluded that the fair value of its goodwill exceeded the associated carrying value at December 31, 2016 and that no impairment exists as of that date. See Note 4, "Goodwill and Other Intangible Assets," for details of our goodwill balance and the goodwill review performed in 2016.
We will continue to monitor goodwill on an annual basis and whenever events or changes in circumstances, such as significant adverse changes in business climate or operating results, changes in management's business strategy or significant declines in our stock price, indicate that there may be potential indicator of impairment.
Indefinite-Lived Intangible Assets
The Company annually tests indefinite-lived intangible assets for impairment on October 1, using a fair value approach, the relief-from-royalty method (a form of the income approach). Due to weakened market conditions in early 2016, which lowered our forecasted results, the Company performed an interim impairment test related to its indefinite-lived intangible assets. In connection with the interim test, the Company recorded an impairment charge of $4.3 million during the first half of 2016. The Company conducted its annual impairment test as of October 1, 2016, and no impairment was identified at that time. Management has also concluded that the fair value of its trademarks exceeds the associated carrying values at December 31, 2016 and that no impairment existed as of that date. At December 31, 2016, the Company's indefinite-lived intangible assets related solely to trademarks.
Long-Lived Assets and Other Intangible Assets
The Company depreciates its property, plant and equipment on a straight-line basis over the estimated useful lives of the assets. Intangible assets with a finite useful life are amortized on a straight-line basis over the estimated useful lives of the assets. Management reviews long-lived assets and other intangible assets for potential impairment whenever significant events or changes in circumstances indicate that the carrying amount of an asset may not be recoverable. An impairment exists when the estimated undiscounted cash flows expected to result from the use of an asset and its eventual disposition are less than its carrying amount. If an impairment exists, the resulting write-down would be the difference between the fair market value of the long-lived asset and the related net book value. No material impairments related to long-lived assets or amortized intangible assets were recorded during the years ended December 31, 2016 or 2015.
Income Taxes
Deferred tax assets and liabilities are recognized for the future tax consequences attributable to differences between the financial statement carrying amounts of existing assets and liabilities and their respective tax bases, as measured by enacted tax rates that are expected to be in effect in the periods when the deferred tax assets and liabilities are expected to be settled or realized. Significant judgment is required in determining the worldwide provisions for income taxes. Valuation allowances are provided for deferred tax assets where it is considered more likely than not that the Company will not realize the benefit of such asset. In the ordinary course of a global business, the ultimate tax outcome is uncertain for many transactions. It is the Company's policy not to recognize tax benefits arising from uncertain tax positions that may not be realized in future years as a result of an examination by tax authorities. The Company establishes the provisions based upon management's assessment of exposure associated with permanent tax differences and tax credits applied to temporary difference adjustments. The tax provisions are analyzed periodically (at least quarterly) and adjustments are made as events occur that warrant adjustments to those provisions. The accounting literature requires significant judgment in determining what constitutes an individual tax position as well as assessing the outcome of each tax position. Changes in judgment as to recognition or measurement of tax positions can materially affect the estimate of the effective tax rate and, consequently, affect our operating results.
Revenue Recognition
Revenue is recognized when the product has been delivered and title and risk of loss have passed to the customer, collection of the resulting receivable is deemed reasonably assured by management, persuasive evidence of an arrangement exists and the sale price is fixed and determinable.
Historically the Company has been successful in mitigating the risks associated with its revenue. Such risks include product warranty, creditworthiness of customers and concentration of sales among a few major customers.
The Company is not contractually obligated to accept returns from non-distributor customers except for defective products or in instances where the product does not meet the Company's quality specifications. If these conditions exist, the Company would be obligated to repair or replace the defective product or make a cash settlement with the customer. Distributors generally have the right to return up to 5% of their purchases depending on the product line for a specified period of time and are obligated to purchase an amount at least equal to the return. If the Company terminates a relationship with a distributor, the Company is obligated to accept as a return all of the distributor's inventory from the Company. The Company accrues an estimate for anticipated returns based on historical experience at the time revenue is recognized and adjusts such estimate as specific anticipated returns are identified. If a distributor terminates its relationship with the Company, the Company is not obligated to accept any inventory returns.
During the year ended December 31, 2016, the Company had one customer with sales in excess of 10% of Bel's consolidated revenue. Management believes that the loss of this individual customer could have a material adverse effect on our consolidated financial position and results of operations. During the year ended December 31, 2016, the Company had sales of $59.8 million to Hon Hai Precision Industry Company Ltd., representing 12.0% of Bel's consolidated revenue. Sales to this customer are primarily in the Company's Asia operating segment.
Commitments and Contingencies — Litigation
On an ongoing basis, we assess the potential liabilities and costs related to any lawsuits or claims brought against us. We accrue a liability when we believe a loss is probable and when the amount of loss can be reasonably estimated. Litigation proceedings are evaluated on a case-by-case basis considering the available information, including that received from internal and outside legal counsel, to assess potential outcomes. While it is typically very difficult to determine the timing and ultimate outcome of these actions, we use our best judgment to determine if it is probable that we will incur an expense related to the settlement or final adjudication of these matters and whether a reasonable estimation of the probable loss, if any, can be made. In assessing probable losses, we consider insurance recoveries, if any. We expense legal costs, including those legal costs expected to be incurred in connection with a loss contingency, as incurred. We have in the past adjusted existing accruals as proceedings have continued, been settled or otherwise provided further information on which we could review the likelihood of outflows of resources and their measurability, and we expect to do so in future periods. Due to the inherent uncertainties related to the eventual outcome of litigation and potential insurance recovery, it is possible that disputed matters may be resolved for amounts materially different from any provisions or disclosures that we have previously made.
Other Matters
The Company believes that it has sufficient cash reserves to fund its foreseeable working capital needs. It may, however, seek to expand such resources through bank borrowings, at favorable lending rates, from time to time. If the Company were to undertake another substantial acquisition for cash, the acquisition would either be funded with cash on hand or would be financed in part through cash on hand and in part through bank borrowings or the issuance of public or private debt or equity. If the Company borrows additional money to finance acquisitions, this would further decrease the Company's ratio of earnings to fixed charges, and could further impact the Company's material restrictive covenants, depending on the size of the borrowing and the nature of the target company. Under its existing credit facility, the Company is required to obtain its lender's consent for certain additional debt financing and to comply with other covenants, including the application of specific financial ratios, and may be restricted from paying cash dividends on its common stock. Depending on the nature of the transaction, the Company cannot assure investors that the necessary acquisition financing would be available to it on acceptable terms, or at all, when required. If the Company issues a substantial amount of stock either as consideration in an acquisition or to finance an acquisition, such issuance may dilute existing stockholders and may take the form of capital stock having preferences over its existing common stock.
New Financial Accounting Standards
The discussion of new financial accounting standards applicable to the Company is incorporated herein by reference to Note 1, "Description of Business and Summary of Significant Accounting Policies."
Fair Value of Financial Instruments — The estimated fair values of financial instruments have been determined by the Company using available market information and appropriate valuation methodologies. See Note 1, "Description of Business and Summary of Significant Accounting Policies."
The Company has not entered into any financial instruments for trading or hedging purposes. The Company does not currently anticipate entering into interest rate swaps and/or similar instruments.
The Company's carrying values of cash, cash equivalents, marketable securities, accounts receivable, restricted cash, accounts payable, accrued expenses and notes payable are a reasonable approximation of their fair value.
The Company enters into transactions denominated in U.S. dollars, Hong Kong dollars, the Chinese renminbi, euros, British pounds, Mexican pesos, the Czech koruna, the Swiss franc and other European currencies. Fluctuations in the U.S. dollar exchange rate against these currencies could significantly impact the Company's consolidated results of operations.
A hypothetical increase in the interest rate on our outstanding debt of 1% would result in incremental annual interest expense of approximately $1.4 million on the Company's consolidated statement of operations.
See the consolidated financial statements listed in the accompanying Index to Consolidated Financial Statements for the information required by this item.
|
BEL FUSE INC.
|
|||
|
INDEX
|
|||
|
Financial Statements
|
Page
|
||
|
34
|
|||
|
35
|
|||
|
36
|
|||
|
37
|
|||
|
38
|
|||
|
39
|
|||
|
41
|
|||
To the Board of Directors and Stockholders of Bel Fuse Inc.
Jersey City, New Jersey
We have audited the accompanying consolidated balance sheets of Bel Fuse Inc. and subsidiaries (the "Company") as of December 31, 2016 and 2015, and the related consolidated statements of operations, comprehensive (loss) income, stockholders' equity, and cash flows for each of the three years in the period ended December 31, 2016. Our audits also included the financial statement schedule listed in the Index at Item 15. We also have audited the Company's internal control over financial reporting as of December 31, 2016, based on criteria established in Internal Control — Integrated Framework (2013) issued by the Committee of Sponsoring Organizations of the Treadway Commission. The Company's management is responsible for these consolidated financial statements and financial statement schedule, for maintaining effective internal control over financial reporting, and for its assessment of the effectiveness of internal control over financial reporting, included in the accompanying Management's Annual Report on Internal Control Over Financial Reporting. Our responsibility is to express an opinion on these consolidated financial statements and financial statement schedule and an opinion on the Company's internal control over financial reporting based on our audits.
We conducted our audits in accordance with the standards of the Public Company Accounting Oversight Board (United States). Those standards require that we plan and perform the audit to obtain reasonable assurance about whether the consolidated financial statements are free of material misstatement and whether effective internal control over financial reporting was maintained in all material respects. Our audits of the consolidated financial statements included examining, on a test basis, evidence supporting the amounts and disclosures in the consolidated financial statements, assessing the accounting principles used and significant estimates made by management, and evaluating the overall consolidated financial statement presentation. Our audit of internal control over financial reporting included obtaining an understanding of internal control over financial reporting, assessing the risk that a material weakness exists, and testing and evaluating the design and operating effectiveness of internal control based on the assessed risk. Our audits also included performing such other procedures as we considered necessary in the circumstances. We believe that our audits provide a reasonable basis for our opinions.
A company's internal control over financial reporting is a process designed by, or under the supervision of, the company's principal executive and principal financial officers, or persons performing similar functions, and effected by the company's board of directors, management, and other personnel to provide reasonable assurance regarding the reliability of financial reporting and the preparation of financial statements for external purposes in accordance with generally accepted accounting principles. A company's internal control over financial reporting includes those policies and procedures that (1) pertain to the maintenance of records that, in reasonable detail, accurately and fairly reflect the transactions and dispositions of the assets of the company; (2) provide reasonable assurance that transactions are recorded as necessary to permit preparation of financial statements in accordance with generally accepted accounting principles and that receipts and expenditures of the company are being made only in accordance with authorizations of management and directors of the company; and (3) provide reasonable assurance regarding prevention or timely detection of unauthorized acquisition, use, or disposition of the company's assets that could have a material effect on the financial statements.
Because of the inherent limitations of internal control over financial reporting, including the possibility of collusion or improper management override of controls, material misstatements due to error or fraud may not be prevented or detected on a timely basis. Also, projections of any evaluation of the effectiveness of the internal control over financial reporting to future periods are subject to the risk that the controls may become inadequate because of changes in conditions, or that the degree of compliance with the policies or procedures may deteriorate.
In our opinion, the consolidated financial statements referred to above present fairly, in all material respects, the consolidated financial position of Bel Fuse Inc. and subsidiaries as of December 31, 2016 and 2015, and the results of their operations and their cash flows for each of the three years in the period ended December 31, 2016, in conformity with accounting principles generally accepted in the United States of America. Also, in our opinion, such financial statement schedule of Bel Fuse Inc. and subsidiaries, when considered in relation to the basic consolidated financial statements taken as a whole, presents fairly, in all material respects, the information set forth therein. Also, in our opinion, the Company maintained, in all material respects, effective internal control over financial reporting as of December 31, 2016, based on the criteria established in Internal Control — Integrated Framework (2013) issued by the Committee of Sponsoring Organizations of the Treadway Commission.
/s/ DELOITTE & TOUCHE LLP
New York, New York
March 10, 2017
|
BEL FUSE INC. AND SUBSIDIARIES
|
||||||||
|
(dollars in thousands, except share and per share data)
|
||||||||
|
December 31,
|
December 31,
|
|||||||
|
2016
|
2015
|
|||||||
|
(Revised)
|
||||||||
|
ASSETS
|
||||||||
|
Current assets:
|
||||||||
|
Cash and cash equivalents
|
$
|
73,411
|
$
|
85,040
|
||||
|
Accounts receivable - less allowance for doubtful accounts
|
||||||||
|
of $1,781 and $1,747 at December 31, 2016 and 2015, respectively
|
74,416
|
86,268
|
||||||
|
Inventories
|
98,871
|
98,510
|
||||||
|
Other current assets
|
8,744
|
10,653
|
||||||
|
Total current assets
|
255,442
|
280,471
|
||||||
|
Property, plant and equipment, net
|
48,755
|
57,611
|
||||||
|
Intangible assets, net
|
74,828
|
87,827
|
||||||
|
Goodwill
|
17,951
|
121,634
|
||||||
|
Deferred income taxes
|
3,410
|
3,438
|
||||||
|
Other assets
|
26,354
|
27,524
|
||||||
|
Total assets
|
$
|
426,740
|
$
|
578,505
|
||||
|
LIABILITIES AND STOCKHOLDERS' EQUITY
|
||||||||
|
Current liabilities:
|
||||||||
|
Accounts payable
|
$
|
47,235
|
$
|
49,798
|
||||
|
Accrued expenses
|
31,549
|
38,323
|
||||||
|
Current maturities of long-term debt
|
11,395
|
24,772
|
||||||
|
Other current liabilities
|
2,148
|
8,959
|
||||||
|
Total current liabilities
|
92,327
|
121,852
|
||||||
|
Long-term liabilities:
|
||||||||
|
Long-term debt
|
129,850
|
158,776
|
||||||
|
Liability for uncertain tax positions
|
27,458
|
40,295
|
||||||
|
Minimum pension obligation and unfunded pension liability
|
16,900
|
15,576
|
||||||
|
Deferred income taxes
|
1,460
|
8,310
|
||||||
|
Other long-term liabilities
|
311
|
574
|
||||||
|
Total liabilities
|
268,306
|
345,383
|
||||||
|
Commitments and contingencies
|
||||||||
|
Stockholders' equity:
|
||||||||
|
Preferred stock, no par value, 1,000,000 shares authorized; none issued
|
-
|
-
|
||||||
|
Class A common stock, par value $.10 per share, 10,000,000 shares
|
||||||||
|
authorized; 2,174,912 shares outstanding at each date (net of
|
||||||||
|
1,072,769 treasury shares)
|
217
|
217
|
||||||
|
Class B common stock, par value $.10 per share, 30,000,000 shares
|
||||||||
|
authorized; 9,851,652 and 9,701,977 shares outstanding, respectively
|
||||||||
|
(net of 3,218,307 treasury shares)
|
985
|
970
|
||||||
|
Additional paid-in capital
|
27,242
|
24,440
|
||||||
|
Retained earnings
|
161,287
|
229,371
|
||||||
|
Accumulated other comprehensive loss
|
(31,297
|
)
|
(21,876
|
)
|
||||
|
Total stockholders' equity
|
158,434
|
233,122
|
||||||
|
Total liabilities and stockholders' equity
|
$
|
426,740
|
$
|
578,505
|
||||
|
See accompanying notes to consolidated financial statements.
|
||||||||
|
BEL FUSE INC. AND SUBSIDIARIES
|
||||||||||||
|
(dollars in thousands, except per share data)
|
||||||||||||
|
|
||||||||||||
|
|
Year Ended December 31,
|
|||||||||||
|
|
2016
|
2015
|
2014
|
|||||||||
|
|
||||||||||||
|
|
||||||||||||
|
Net sales
|
$
|
500,153
|
$
|
567,080
|
$
|
487,076
|
||||||
|
Cost of sales
|
400,245
|
458,253
|
399,721
|
|||||||||
|
Gross profit
|
99,908
|
108,827
|
87,355
|
|||||||||
|
|
||||||||||||
|
Selling, general and administrative expenses
|
71,005
|
77,952
|
72,061
|
|||||||||
|
Impairment of goodwill and other intangible assets
|
105,972
|
-
|
-
|
|||||||||
|
(Gain) loss on sale of property, plant and equipment
|
(2,644
|
)
|
161
|
(10
|
)
|
|||||||
|
Restructuring charges
|
2,087
|
2,114
|
1,832
|
|||||||||
|
(Loss) income from operations
|
(76,512
|
)
|
28,600
|
13,472
|
||||||||
|
|
||||||||||||
|
Interest expense
|
(6,662
|
)
|
(7,588
|
)
|
(3,978
|
)
|
||||||
|
Interest income and other, net
|
622
|
4,720
|
276
|
|||||||||
|
(Loss) earnings before (benefit) provision for income taxes
|
(82,552
|
)
|
25,732
|
9,770
|
||||||||
|
|
||||||||||||
|
(Benefit) provision for income taxes
|
(17,718
|
)
|
6,535
|
1,167
|
||||||||
|
Net (loss) earnings available to common shareholders
|
$
|
(64,834
|
)
|
$
|
19,197
|
$
|
8,603
|
|||||
|
|
||||||||||||
|
|
||||||||||||
|
Net (loss) earnings per common share:
|
||||||||||||
|
Class A common shares - basic and diluted
|
$
|
(5.25
|
)
|
$
|
1.53
|
$
|
0.69
|
|||||
|
Class B common shares - basic and diluted
|
$
|
(5.48
|
)
|
$
|
1.64
|
$
|
0.75
|
|||||
|
|
||||||||||||
|
Weighted-average shares outstanding:
|
||||||||||||
|
Class A common shares - basic and diluted
|
2,175
|
2,175
|
2,175
|
|||||||||
|
Class B common shares - basic and diluted
|
9,749
|
9,698
|
9,491
|
|||||||||
|
|
||||||||||||
|
Dividends paid per common share:
|
||||||||||||
|
Class A common shares
|
$
|
0.24
|
$
|
0.24
|
$
|
0.24
|
||||||
|
Class B common shares
|
$
|
0.28
|
$
|
0.28
|
$
|
0.28
|
||||||
|
|
||||||||||||
|
|
||||||||||||
|
See accompanying notes to consolidated financial statements.
|
||||||||||||
|
BEL FUSE INC. AND SUBSIDIARIES
|
||||||||||||
|
(dollars in thousands)
|
||||||||||||
|
|
||||||||||||
|
|
||||||||||||
|
|
Year Ended December 31,
|
|||||||||||
|
|
2016
|
2015
|
2014
|
|||||||||
|
|
||||||||||||
|
|
||||||||||||
|
Net (loss) earnings
|
$
|
(64,834
|
)
|
$
|
19,197
|
$
|
8,603
|
|||||
|
|
||||||||||||
|
Other comprehensive (loss) income:
|
||||||||||||
|
Currency translation adjustment, net of taxes of ($648), ($194) and ($219)
|
(9,671
|
)
|
(9,954
|
)
|
(11,255
|
)
|
||||||
|
Unrealized holding (losses) gains on marketable securities arising during
|
||||||||||||
|
the period, net of taxes of ($2), $5 and $90
|
(10
|
)
|
5
|
147
|
||||||||
|
Change in unfunded SERP liability, net of taxes of $71, $2 and
|
||||||||||||
|
($631), respectively
|
260
|
21
|
(1,485
|
)
|
||||||||
|
Other comprehensive loss
|
(9,421
|
)
|
(9,928
|
)
|
(12,593
|
)
|
||||||
|
|
||||||||||||
|
Comprehensive (loss) income
|
$
|
(74,255
|
)
|
$
|
9,269
|
$
|
(3,990
|
)
|
||||
|
|
||||||||||||
|
|
||||||||||||
|
See accompanying notes to consolidated financial statements.
|
||||||||||||
|
BEL FUSE INC. AND SUBSIDIARIES
|
||||||||||||||||||||||||
|
(dollars in thousands)
|
||||||||||||||||||||||||
|
|
||||||||||||||||||||||||
|
|
Accumulated
|
|||||||||||||||||||||||
|
|
Other
|
Class A
|
Class B
|
Additional
|
||||||||||||||||||||
|
|
Retained
|
Comprehensive
|
Common
|
Common
|
Paid-In
|
|||||||||||||||||||
|
|
Total
|
Earnings
|
(Loss) Income
|
Stock
|
Stock
|
Capital
|
||||||||||||||||||
|
Balance at December 31, 2013
|
$
|
228,702
|
$
|
207,993
|
$
|
645
|
$
|
217
|
$
|
933
|
$
|
18,914
|
||||||||||||
|
|
||||||||||||||||||||||||
|
Cash dividends declared on Class A common stock
|
(522
|
)
|
(522
|
)
|
- | - | - | - | ||||||||||||||||
|
Cash dividends declared on Class B common stock
|
(2,665
|
)
|
(2,665
|
)
|
- | - | - | - | ||||||||||||||||
|
Issuance of restricted common stock
|
-
|
- | - | - |
38
|
(38
|
)
|
|||||||||||||||||
|
Forfeiture of restricted common stock
|
-
|
- | - | - |
(2
|
)
|
2
|
|||||||||||||||||
|
Foreign currency translation adjustment, net of taxes of ($219)
|
(11,255
|
)
|
- |
(11,255
|
)
|
- | - | - | ||||||||||||||||
|
Unrealized holding gains on marketable securities
|
||||||||||||||||||||||||
|
arising during the year, net of taxes of $90
|
147
|
- |
147
|
- | - | - | ||||||||||||||||||
|
Increase in APIC pool associated with tax
|
||||||||||||||||||||||||
|
benefits related to restricted stock awards
|
31
|
- | - | - | - |
31
|
||||||||||||||||||
|
Stock-based compensation expense
|
2,717
|
- | - | - | - |
2,717
|
||||||||||||||||||
|
Change in unfunded SERP liability, net of taxes of ($631)
|
(1,485
|
)
|
- |
(1,485
|
)
|
- | - | - | ||||||||||||||||
|
Net earnings
|
8,603
|
8,603
|
- | - | - | - | ||||||||||||||||||
|
|
||||||||||||||||||||||||
|
Balance at December 31, 2014
|
$
|
224,273
|
$
|
213,409
|
$
|
(11,948
|
)
|
$
|
217
|
$
|
969
|
$
|
21,626
|
|||||||||||
|
|
||||||||||||||||||||||||
|
Cash dividends declared on Class A common stock
|
(522
|
)
|
(522
|
)
|
- | - | - | - | ||||||||||||||||
|
Cash dividends declared on Class B common stock
|
(2,713
|
)
|
(2,713
|
)
|
- | - | - | - | ||||||||||||||||
|
Issuance of restricted common stock
|
-
|
- | - | - |
8
|
(8
|
)
|
|||||||||||||||||
|
Forfeiture of restricted common stock
|
-
|
- | - | - |
(7
|
)
|
7
|
|||||||||||||||||
|
Foreign currency translation adjustment, net of taxes of ($194)
|
(9,954
|
)
|
- |
(9,954
|
)
|
- | - | - | ||||||||||||||||
|
Unrealized holding gains on marketable securities
|
- | - | - | |||||||||||||||||||||
|
arising during the year, net of taxes of $5
|
5
|
- |
5
|
- | - | - | ||||||||||||||||||
|
Stock-based compensation expense
|
2,815
|
- | - | - | - |
2,815
|
||||||||||||||||||
|
Change in unfunded SERP liability, net of taxes of $2
|
21
|
- |
21
|
- | - | - | ||||||||||||||||||
|
Net earnings
|
19,197
|
19,197
|
- | - | - | - | ||||||||||||||||||
|
|
||||||||||||||||||||||||
|
Balance at December 31, 2015
|
$
|
233,122
|
$
|
229,371
|
$
|
(21,876
|
)
|
$
|
217
|
$
|
970
|
$
|
24,440
|
|||||||||||
|
|
||||||||||||||||||||||||
|
Cash dividends declared on Class A common stock
|
(522
|
)
|
(522
|
)
|
- | - | - | - | ||||||||||||||||
|
Cash dividends declared on Class B common stock
|
(2,728
|
)
|
(2,728
|
)
|
- | - | - | - | ||||||||||||||||
|
Issuance of restricted common stock
|
-
|
- | - | - |
18
|
(18
|
)
|
|||||||||||||||||
|
Forfeiture of restricted common stock
|
-
|
- | - | - |
(3
|
)
|
3
|
|||||||||||||||||
|
Foreign currency translation adjustment, net of taxes of ($648)
|
(9,671
|
)
|
- |
(9,671
|
)
|
- | - | - | ||||||||||||||||
|
Unrealized holding gains on marketable securities
|
||||||||||||||||||||||||
|
arising during the year, net of taxes of ($2)
|
(10
|
)
|
- |
(10
|
)
|
- | - | - | ||||||||||||||||
|
Stock-based compensation expense
|
2,817
|
- | - | - | - |
2,817
|
||||||||||||||||||
|
Change in unfunded SERP liability, net of taxes of $71
|
260
|
- |
260
|
- | - | - | ||||||||||||||||||
|
Net loss
|
(64,834
|
)
|
(64,834
|
)
|
- | - | - | - | ||||||||||||||||
|
|
||||||||||||||||||||||||
|
Balance at December 31, 2016
|
$
|
158,434
|
$
|
161,287
|
$
|
(31,297
|
)
|
$
|
217
|
$
|
985
|
$
|
27,242
|
|||||||||||
|
|
||||||||||||||||||||||||
|
See accompanying notes to consolidated financial statements.
|
||||||||||||||||||||||||
|
BEL FUSE INC. AND SUBSIDIARIES
|
||||||||||||
|
(dollars in thousands)
|
||||||||||||
|
|
||||||||||||
|
|
Years Ended December 31,
|
|||||||||||
|
|
2016
|
2015
|
2014
|
|||||||||
|
|
||||||||||||
|
Cash flows from operating activities:
|
||||||||||||
|
Net (loss) earnings
|
$
|
(64,834
|
)
|
$
|
19,197
|
$
|
8,603
|
|||||
|
Adjustments to reconcile net (loss) earnings to net cash
|
||||||||||||
|
provided by operating activities:
|
||||||||||||
|
Impairment of goodwill and other intangible assets
|
105,972
|
-
|
-
|
|||||||||
|
Depreciation and amortization
|
21,778
|
23,009
|
20,367
|
|||||||||
|
Stock-based compensation
|
2,817
|
2,815
|
2,717
|
|||||||||
|
Amortization of deferred financing costs
|
1,804
|
1,432
|
699
|
|||||||||
|
Deferred income taxes
|
(6,401
|
)
|
(356
|
)
|
(2,691
|
)
|
||||||
|
Realized and unrealized gains on foreign currency revaluation
|
(3,063
|
)
|
(5,095
|
)
|
(4,313
|
)
|
||||||
|
(Gain) loss on disposal of property, plant and equipment
|
(2,583
|
)
|
426
|
273
|
||||||||
|
Other, net
|
864
|
3,209
|
389
|
|||||||||
|
Changes in operating assets and liabilities:
|
||||||||||||
|
Accounts receivable
|
10,803
|
12,187
|
1,382
|
|||||||||
|
Inventories
|
(2,794
|
)
|
12,951
|
9,121
|
||||||||
|
Other current assets
|
(670
|
)
|
846
|
693
|
||||||||
|
Other assets
|
297
|
2,161
|
(450
|
)
|
||||||||
|
Accounts payable
|
(588
|
)
|
(10,022
|
)
|
(3,890
|
)
|
||||||
|
Accrued expenses
|
(6,120
|
)
|
(3,113
|
)
|
(10,170
|
)
|
||||||
|
Other liabilities
|
(16,565
|
)
|
(295
|
)
|
423
|
|||||||
|
Income taxes payable
|
(2,114
|
)
|
6,437
|
(696
|
)
|
|||||||
|
Net cash provided by operating activities
|
38,603
|
65,789
|
22,457
|
|||||||||
|
|
||||||||||||
|
Cash flows from investing activities:
|
||||||||||||
|
Purchase of property, plant and equipment
|
(8,223
|
)
|
(9,891
|
)
|
(9,042
|
)
|
||||||
|
Purchase of marketable securities
|
-
|
-
|
(2,936
|
)
|
||||||||
|
Purchase of company-owned life insurance
|
(2,164
|
)
|
(2,820
|
)
|
(2,820
|
)
|
||||||
|
Payments for acquisitions, net of cash acquired
|
-
|
-
|
(208,693
|
)
|
||||||||
|
Proceeds from cash surrender of COLI policies
|
-
|
-
|
5,756
|
|||||||||
|
Proceeds from sale of marketable securities
|
2,164
|
2,820
|
-
|
|||||||||
|
Proceeds from disposal/sale of property, plant and equipment
|
5,839
|
77
|
65
|
|||||||||
|
Net cash used in investing activities
|
(2,384
|
)
|
(9,814
|
)
|
(217,670
|
)
|
||||||
|
|
||||||||||||
|
(continued)
|
||||||||||||
|
|
||||||||||||
|
See notes to consolidated financial statements.
|
||||||||||||
|
BEL FUSE INC. AND SUBSIDIARIES
|
||||||||||||
|
CONSOLIDATED STATEMENTS OF CASH FLOWS (Continued)
|
||||||||||||
|
(dollars in thousands)
|
||||||||||||
|
|
||||||||||||
|
|
Year Ended December 31,
|
|||||||||||
|
|
2016
|
2015
|
2014
|
|||||||||
|
|
||||||||||||
|
Cash flows from financing activities:
|
||||||||||||
|
Dividends paid to common shareholders
|
(3,245
|
)
|
(3,238
|
)
|
(3,160
|
)
|
||||||
|
Deferred financing costs
|
(718
|
)
|
(15
|
)
|
(5,756
|
)
|
||||||
|
Borrowings under revolving credit line
|
-
|
12,500
|
23,000
|
|||||||||
|
Repayments under revolving credit line
|
-
|
(35,500
|
)
|
(12,000
|
)
|
|||||||
|
Reduction in notes payable
|
(126
|
)
|
(123
|
)
|
(161
|
)
|
||||||
|
Proceeds from long-term debt
|
-
|
-
|
215,000
|
|||||||||
|
Repayments of long-term debt
|
(43,389
|
)
|
(22,438
|
)
|
(5,375
|
)
|
||||||
|
Net cash (used in) provided by financing activities
|
(47,478
|
)
|
(48,814
|
)
|
211,548
|
|||||||
|
Effect of exchange rate changes on cash
|
(370
|
)
|
741
|
(1,320
|
)
|
|||||||
|
|
||||||||||||
|
Net (decrease) increase in cash and cash equivalents
|
(11,629
|
)
|
7,902
|
15,015
|
||||||||
|
|
||||||||||||
|
Cash and cash equivalents - beginning of year
|
85,040
|
77,138
|
62,123
|
|||||||||
|
|
||||||||||||
|
Cash and cash equivalents - end of year
|
$
|
73,411
|
$
|
85,040
|
$
|
77,138
|
||||||
|
|
||||||||||||
|
|
||||||||||||
|
Supplemental cash flow information:
|
||||||||||||
|
|
||||||||||||
|
Cash paid during the year for:
|
||||||||||||
|
Income taxes, net of refunds received
|
$
|
2,459
|
$
|
580
|
$
|
4,686
|
||||||
|
Interest payments
|
$
|
4,843
|
$
|
6,153
|
$
|
3,210
|
||||||
|
|
||||||||||||
|
Details of acquisition (see Note 2):
|
||||||||||||
|
Fair value of identifiable net assets acquired
|
$
|
-
|
$
|
-
|
$
|
130,747
|
||||||
|
Goodwill
|
-
|
-
|
105,402
|
|||||||||
|
Fair value of net assets acquired
|
$
|
-
|
$
|
-
|
$
|
236,149
|
||||||
|
|
||||||||||||
|
Fair value of consideration transferred
|
$
|
-
|
$
|
-
|
$
|
236,149
|
||||||
|
Less: Cash acquired in acquisition
|
-
|
-
|
(27,456
|
)
|
||||||||
|
Cash paid for acquisition, net of cash acquired
|
$
|
-
|
$
|
-
|
$
|
208,693
|
||||||
|
|
||||||||||||
|
See accompanying notes to consolidated financial statements.
|
||||||||||||
BEL FUSE INC. AND SUBSIDIARIES
AS OF AND FOR THE YEARS ENDED DECEMBER 31, 2016, 2015 AND 2014
1. DESCRIPTION OF BUSINESS AND SUMMARY OF SIGNIFICANT ACCOUNTING POLICIES
Bel Fuse Inc. and subsidiaries ("Bel," the "Company," "we," "us," and "our") design, manufacture and sell a broad array of products that power, protect and connect electronic circuits. These products are used in the networking, telecommunication, high-speed data transmission, commercial aerospace, military, broadcasting, transportation and consumer electronic industries around the world. We manage our operations geographically through our three reportable operating segments: North America, Asia and Europe.
On June 19, 2014, we completed the acquisition of 100% of the issued and outstanding capital stock of the Power-One Power Solutions business ("Power Solutions") of ABB Ltd. On July 25, 2014, we completed the acquisition of 100% of the issued and outstanding capital stock of the U.S. and U.K. Connectivity Solutions businesses from Emerson Electric Co. ("Emerson"). On August 29, 2014, we completed the acquisition of the Connectivity Solutions business in China from Emerson (collectively with the U.S. and U.K. portion of the transaction, "Connectivity Solutions"). The acquisitions of Power Solutions and Connectivity Solutions may hereafter be referred to collectively as either the "2014 Acquisitions" or the "2014 Acquired Companies".
Accordingly, as of the respective acquisition dates, all of the assets acquired and liabilities assumed were recorded at their preliminary fair values and the Company's consolidated results of operations for the years ended December 31, 2016, 2015 and 2014 include the operating results of the acquired companies from their respective acquisition dates through the respective period end dates. The consolidated financial statements for the year ended December 31, 2014 reflect measurement period adjustments related to the 2014 Acquisitions. The measurement period adjustments were finalized within the respective measurement periods, and, in the aggregate, were not considered material to the consolidated financial statements. See Note 2, "Acquisitions and Disposition," for further details.
All amounts included in the tables to these notes to consolidated financial statements, except per share amounts, are in thousands.
Principles of Consolidation - The consolidated financial statements include all of the accounts of the Company and its wholly owned subsidiaries. All intercompany transactions and balances have been eliminated in consolidation.
Use of Estimates - The preparation of the consolidated financial statements in conformity with accounting principles generally accepted in the United States of America ("U.S. GAAP") requires us to make estimates and judgments that affect the reported amounts of assets, liabilities, revenues and expenses, and related disclosure of contingent assets and liabilities. On an on-going basis, we evaluate our estimates, including but not limited to those related to product returns, provisions for bad debt, inventories, goodwill, intangible assets, investments, Supplemental Executive Retirement Plan ("SERP") expense, income taxes, contingencies and litigation. We base our estimates on historical experience and on various other assumptions that are believed to be reasonable under the circumstances, the results of which form the basis for making judgments about the carrying values of assets and liabilities that are not readily apparent from other sources. Actual results may differ from these estimates under different assumptions or conditions.
Cash Equivalents - Cash equivalents include short-term investments in money market funds and certificates of deposit with an original maturity of three months or less when purchased.
Allowance for Doubtful Accounts - We maintain an allowance for doubtful accounts for estimated losses from the inability of our customers to make required payments. We determine our allowance by both specific identification of customer accounts where appropriate and the application of historical loss experience to non-specific accounts.
Effects of Foreign Currency – In non-U.S. locations that are not considered highly inflationary, we translate the balance sheets at the end of period exchange rates with translation adjustments accumulated within stockholders' equity on our consolidated balance sheets. We translate the statements of operations at the average exchange rates during the applicable period. In connection with foreign currency denominated transactions, including multi-currency intercompany payable and receivable transactions and loans, the Company incurred net realized and unrealized currency exchange gains of $3.1 million, $5.1 million and $4.3 million for the years ended December 31, 2016, 2015 and 2014, respectively, which were included in SG&A expenses on the consolidated statements of operations.
Concentration of Credit Risk - Financial instruments which potentially subject us to concentrations of credit risk consist principally of accounts receivable and temporary cash investments. We grant credit to customers that are primarily original equipment manufacturers and to subcontractors of original equipment manufacturers based on an evaluation of the customer's financial condition, without requiring collateral. Exposure to losses on receivables is principally dependent on each customer's financial condition. We control our exposure to credit risk through credit approvals, credit limits and monitoring procedures and establish allowances for anticipated losses. See Note 12, "Segments," for disclosures regarding significant customers.
We place temporary cash investments with quality financial institutions and commercial issuers of short-term paper and, by policy, limit the amount of credit exposure in any one financial instrument.
Inventories - Inventories are stated at the lower of weighted-average cost or market. Costs related to inventories include raw materials, direct labor and manufacturing overhead which are included in cost of sales on the consolidated statements of operations. The Company utilizes the average cost method in determining amounts to be removed from inventory.
Revenue Recognition – Revenue is recognized when the product has been delivered and title and risk of loss has passed to the customer, collection of the resulting receivable is deemed reasonably assured by management, persuasive evidence of an arrangement exists and the sales price is fixed and determinable. Substantially all of our shipments are FCA (free carrier), which provides for title to pass upon delivery to the customer's freight carrier. Some product is shipped DDP/DDU with title passing when the product arrives at the customer's dock. DDP is defined as Delivered Duty Paid by the Company and DDU is Delivered Duty Unpaid by the Company.
For certain customers, we provide consigned inventory, either at the customer's facility or at a third-party warehouse. Sales of consigned inventory are recorded when the customer withdraws inventory from consignment.
The Company is not contractually obligated to accept returns except for defective product or in instances where the product does not meet the Company's product specifications. However, the Company may permit its customers to return product for other reasons. In these instances, the Company would generally require a significant cancellation penalty payment by the customer. The Company estimates such returns, where applicable, based upon management's evaluation of historical experience, market acceptance of products produced and known negotiations with customers. Such estimates are deducted from sales and provided for at the time revenue is recognized.
Product Warranties – Warranties vary by product line and are competitive for the markets in which the Company operates. Warranties generally extend for one to three years from the date of sale. The Company reviews its warranty liability quarterly based on an analysis of actual expenses and failure rates accompanied with estimated future costs and projected failure rate trends. Factors taken into consideration when evaluating our warranty reserve are (i) historical claims for each product, (ii) volume increases, (iii) life of warranty, (iv) historical warranty repair costs and (v) other factors. To the extent that actual experience differs from our estimate, the provision for product warranties will be adjusted in future periods. Actual warranty repair costs are charged against the reserve balance as incurred. See Note 11, "Accrued Expenses."
Goodwill and Identifiable Intangible Assets – Goodwill represents the excess of the aggregate of the following (1) consideration transferred, (2) the fair value of any noncontrolling interest in the acquiree and, (3) if the business combination is achieved in stages, the acquisition-date fair value of our previously held equity interest in the acquiree over the net of the acquisition-date amounts of the identifiable assets acquired and the liabilities assumed.
Identifiable intangible assets consist primarily of patents, licenses, trademarks, trade names, customer lists and relationships, non-compete agreements and technology based intangibles and other contractual agreements. We amortize finite lived identifiable intangible assets over the shorter of their stated or statutory duration or their estimated useful lives, ranging from 1 to 29 years, on a straight-line basis to their estimated residual values and periodically review them for impairment. Total identifiable intangible assets comprise 17.5% and 15.2% in 2016 and 2015, respectively, of our consolidated total assets.
We use the acquisition method of accounting for all business combinations and do not amortize goodwill or intangible assets with indefinite useful lives. Goodwill and intangible assets with indefinite useful lives are tested for possible impairment annually during the fourth quarter of each fiscal year or more frequently if events or changes in circumstances indicate that the asset might be impaired.
Impairment and Disposal of Long-Lived Assets – For definite-lived intangible assets, such as customer relationships, contracts, intellectual property, and for other long-lived assets, such as property, plant and equipment, whenever impairment indicators are present, we perform a review for impairment. We calculate the undiscounted value of the projected cash flows associated with the asset, or asset group, and compare this estimated amount to the carrying amount. If the carrying amount is found to be greater, we record an impairment loss for the excess of book value over the fair value. In addition, in all cases of an impairment review, we re-evaluate the remaining useful lives of the assets and modify them, as appropriate.
For indefinite-lived intangible assets, such as trademarks and trade names, each year and whenever impairment indicators are present, we determine the fair value of the asset and record an impairment loss for the excess of book value over the fair value, if any. In addition, in all cases of an impairment review we re-evaluate whether continuing to characterize the asset as indefinite-lived is appropriate. See Note 4, "Goodwill and Other Intangible Assets," for additional details.
Depreciation - Property, plant and equipment are stated at cost less accumulated depreciation and amortization. Depreciation and amortization are calculated primarily using the straight-line method over the estimated useful life of the asset. The estimated useful lives primarily range from 2 to 39 years for buildings and leasehold improvements, and from 3 to 15 years for machinery and equipment.
Income Taxes - We account for income taxes under the asset and liability method, which requires the recognition of deferred tax assets and liabilities for the expected future tax consequences of events that have been included in the consolidated financial statements. Under this method, deferred tax assets and liabilities are determined based on the differences between the financial statement and tax bases of assets and liabilities using enacted tax rates in effect for the year in which the differences are expected to reverse. The effect of a change in tax rates on deferred tax assets and liabilities is recognized in income in the period that includes the enactment date.
We record net deferred tax assets to the extent we believe these assets will more-likely-than-not be realized. In making such determination, we consider all available positive and negative evidence, including future reversals of existing taxable temporary differences, projected future taxable income, tax planning strategies and recent financial operations. We have established valuation allowances for deferred tax assets that are not likely to be realized. In the event we were to determine that we would be able to realize our deferred income tax assets in the future in excess of our net recorded amount, we would adjust the valuation allowance, which would reduce the provision for income taxes.
We establish reserves for tax contingencies when, despite the belief that our tax return positions are fully supported, it is probable that certain positions may be challenged and may not be fully sustained. The tax contingency reserves are analyzed on a quarterly basis and adjusted based upon changes in facts and circumstances, such as the conclusion of federal and state audits, expiration of the statute of limitations for the assessment of tax, case law and emerging legislation. Our effective tax rate includes the effect of tax contingency reserves and changes to the reserves as considered appropriate by management.
Earnings per Share – We utilize the two-class method to report our earnings per share. The two-class method is an earnings allocation formula that determines earnings per share for each class of common stock according to dividends declared and participation rights in undistributed earnings. The Company's Certificate of Incorporation, as amended, states that Class B common shares are entitled to dividends at least 5% greater than dividends paid to Class A common shares, resulting in the two-class method of computing earnings per share. In computing earnings per share, the Company has allocated dividends declared to Class A and Class B based on amounts actually declared for each class of stock and 5% more of the undistributed earnings have been allocated to Class B shares than to the Class A shares on a per share basis. Basic earnings per common share are computed by dividing net earnings by the weighted-average number of common shares outstanding during the period. Diluted earnings per common share, for each class of common stock, are computed by dividing net earnings by the weighted-average number of common shares and potential common shares outstanding during the period. There were no potential common shares outstanding during the years ended December 31, 2016, 2015 or 2014 which would have had a dilutive effect on earnings per share.
The earnings and weighted average shares outstanding used in the computation of basic and diluted earnings per share are as follows:
|
2016
|
2015
|
2014
|
||||||||||
|
Numerator:
|
||||||||||||
|
Net (loss) earnings
|
$
|
(64,834
|
)
|
$
|
19,197
|
$
|
8,603
|
|||||
|
Less dividends declared:
|
||||||||||||
|
Class A
|
522
|
522
|
522
|
|||||||||
|
Class B
|
2,728
|
2,713
|
2,665
|
|||||||||
|
Undistributed (loss) earnings
|
$
|
(68,084
|
)
|
$
|
15,962
|
$
|
5,416
|
|||||
|
Undistributed (loss) earnings allocation - basic and diluted:
|
||||||||||||
|
Class A undistributed (loss) earnings
|
$
|
(11,930
|
)
|
$
|
2,809
|
$
|
970
|
|||||
|
Class B undistributed (loss) earnings
|
(56,154
|
)
|
13,153
|
4,446
|
||||||||
|
Total undistributed (loss) earnings
|
$
|
(68,084
|
)
|
$
|
15,962
|
$
|
5,416
|
|||||
|
Net (loss) earnings allocation - basic and diluted:
|
||||||||||||
|
Class A net (loss) earnings
|
$
|
(11,408
|
)
|
$
|
3,331
|
$
|
1,492
|
|||||
|
Class B net (loss) earnings
|
(53,426
|
)
|
15,866
|
7,111
|
||||||||
|
Net (loss) earnings
|
$
|
(64,834
|
)
|
$
|
19,197
|
$
|
8,603
|
|||||
|
Denominator:
|
||||||||||||
|
Weighted average shares outstanding:
|
||||||||||||
|
Class A - basic and diluted
|
2,175
|
2,175
|
2,175
|
|||||||||
|
Class B - basic and diluted
|
9,749
|
9,698
|
9,491
|
|||||||||
|
Net (loss) earnings per share:
|
||||||||||||
|
Class A - basic and diluted
|
$
|
(5.25
|
)
|
$
|
1.53
|
$
|
0.69
|
|||||
|
Class B - basic and diluted
|
$
|
(5.48
|
)
|
$
|
1.64
|
$
|
0.75
|
|||||
Research and Development ("R&D") - Our engineering groups are strategically located around the world to facilitate communication with and access to customers' engineering personnel. This collaborative approach enables partnerships with customers for technical development efforts. On occasion, we execute non-disclosure agreements with our customers to help develop proprietary, next generation products destined for rapid deployment. R&D costs are expensed as incurred, and are included in cost of sales on the consolidated statements of operations. Generally, R&D is performed internally for the benefit of the Company. R&D costs include salaries, building maintenance and utilities, rents, materials, administration costs and miscellaneous other items. R&D expenses for the years ended December 31, 2016, 2015 and 2014 amounted to $26.7 million, $27.7 million and $21.5 million, respectively. The majority of the increase over the past two years relates to the inclusion of R&D expenses of the 2014 Acquired Companies, which have been included in Bel's results since their respective acquisition dates.
Fair Value Measurements - We utilize the accounting guidance for fair value measurements and disclosures for all financial assets and liabilities and nonfinancial assets and liabilities that are recognized or disclosed at fair value in the consolidated financial statements on a recurring basis or on a nonrecurring basis during the reporting period. The fair value is an exit price, representing the price that would be received to sell an asset or paid to transfer a liability in an orderly transaction between market participants based upon the best use of the asset or liability at the measurement date. The Company utilizes market data or assumptions that market participants would use in pricing the asset or liability. The accounting guidance establishes a three-tier fair value hierarchy, which prioritizes the inputs used in measuring fair value. These tiers are defined as follows:
Level 1 - Observable inputs such as quoted market prices in active markets
Level 2 - Inputs other than quoted prices in active markets that are either directly or indirectly observable
Level 3 - Unobservable inputs about which little or no market data exists, therefore requiring an entity to develop its own assumptions
For financial instruments such as cash and cash equivalents, accounts receivable, accounts payable, accrued expenses and notes payable, the carrying amount approximates fair value because of the short maturities of such instruments. See Note 5, "Fair Value Measurements," for additional disclosures related to fair value measurements.
Recently Issued Accounting Standards
Recently Adopted Accounting Standards
In June 2014, the FASB issued ASU 2014-12, Compensation – Stock Compensation (Topic 718): Accounting for Share-Based Payments When the Terms of an Award Provide That a Performance Target Could Be Achieved after the Requisite Service Period. The amendment requires that a performance target that affects vesting and that could be achieved after the requisite service period be treated as a performance condition. A reporting entity should apply existing guidance in Topic 718 as it relates to awards with performance conditions that affect vesting to account for such awards. Compensation cost should be recognized in the period in which it becomes probable that the performance target will be achieved and should represent the compensation cost attributable to the period(s) for which the requisite service has already been rendered. This guidance was adopted by the Company effective January 1, 2016 and it did not have any impact on the Company's consolidated financial position or results of operations.
In January 2015, the FASB issued ASU 2015-01, Income Statement – Extraordinary and Unusual Items (Subtopic 225-20): Simplifying Income Statement Presentation by Eliminating the Concept of Extraordinary Items. Extraordinary items are events and transactions that are distinguished by their unusual nature and by the infrequency of their occurrence. Eliminating the extraordinary classification simplifies income statement presentation by altogether removing the concept of extraordinary items from consideration. This guidance was adopted by the Company effective January 1, 2016 and it did not have any impact on the Company's consolidated financial position or results of operations.
In April 2015, the FASB issued ASU 2015-03, Interest – Imputation of Interest (Subtopic 835-30): Simplifying the Presentation of Debt Issuance Costs. The update requires that debt issuance costs related to a recognized debt liability be presented in the balance sheet as a direct deduction from the carrying amount of the related debt liability instead of being presented as an asset. Debt disclosures will include the face amount of the debt liability and the effective interest rate. In August 2015, the FASB amended this guidance for debt issuance costs associated with line-of-credit arrangements to reflect that the SEC would not object to the deferral and presentation of debt issuance costs as an asset and subsequent amortization of debt issuance costs over the term of the line-of-credit arrangement, whether or not there are any outstanding borrowings on the line-of-credit arrangement. The update requires retrospective application and represents a change in accounting principle. This guidance was adopted by the Company effective January 1, 2016 and it was applied retrospectively for all prior periods. At December 31, 2016 and December 31, 2015, deferred financing costs totaling $2.6 million and $3.6 million, respectively, are reflected as a reduction in the carrying value of the Company's current and long-term debt on the consolidated balance sheet.
In September 2015, the FASB issued ASU 2015-16, Simplifying the Accounting for Measurement-Period Adjustments, which eliminates the requirement for an acquirer in a business combination to account for measurement period adjustments retrospectively. Under this guidance, acquirers must recognize measurement period adjustments in the period in which they determine the amounts, including the effect on earnings of any amount they would have recorded in previous periods if the accounting had been completed at the acquisition date. This guidance was adopted by the Company effective January 1, 2016 on a prospective basis as required. Measurement period adjustments of any future acquisitions will be accounted for under this new guidance.
In November 2015, the FASB issued ASU 2015-17, Balance Sheet Classification of Deferred Taxes, which requires entities to present deferred tax assets and deferred tax liabilities as noncurrent on the consolidated balance sheet. The guidance simplifies the current guidance, which requires entities to separately present deferred tax assets and deferred tax liabilities as current and noncurrent on the consolidated balance sheet. The Company adopted this guidance effective January 1, 2016 and it was applied retrospectively for all prior periods. The following table summarizes the adjustments made to conform prior period classifications to the new guidance:
|
|
December 31, 2015
|
|||||||||||
|
|
As Reported
|
Reclass
|
Revised
|
|||||||||
|
|
||||||||||||
|
Other current assets
|
$
|
15,636
|
$
|
(4,983
|
)
|
$
|
10,653
|
|||||
|
Long-term deferred income tax assets
|
3,321
|
117
|
3,438
|
|||||||||
|
Other current liabilities
|
(9,133
|
)
|
174
|
(8,959
|
)
|
|||||||
|
Long-term deferred income tax liabilities
|
(13,002
|
)
|
4,692
|
(8,310
|
)
|
|||||||
In August 2014, the FASB issued ASU 2014-15, Presentation of Financial Statements – Going Concern (Subtopic - 205-40) ("ASU 2014-15"). This ASU requires management to evaluate whether it is probable that known conditions or events, considered in the aggregate, would raise substantial doubt about the entity's ability to continue as a going concern within one year after the date that the financial statements are issued. If such conditions or events are identified, the standard requires management's mitigation plans to alleviate the doubt or a statement of the substantial doubt about the entity's ability to continue as a going concern to be disclosed in the financial statements. The amendments in ASU 2014-15 are effective for fiscal years, and interim periods within those years, beginning after December 15, 2016. We adopted this amendment on December 31, 2016. The adoption of ASU 2014-15 did not have a material impact on the financial statements
Accounting Standards Issued But Not Yet Adopted
In October 2016, the FASB issued ASU 2016-16, Income Taxes (Topic 740): Intra-Entity Transfers of Assets Other Than Inventory. Current GAAP prohibits the recognition of current and deferred income taxes for intra-entity asset transfer until the asset has been sold to an outside party. The new guidance eliminates the exception and requires an entity to recognize the income tax consequences of an intra-entity transfer of an asset other than inventory when the transfer occurs. This accounting guidance is effective for annual reporting periods beginning after December 15, 2017, including interim reporting periods within those annual reporting periods, and should be applied on a modified retrospective basis through a cumulative-effect adjustment directly to retained earnings as of the beginning of the period of adoption. This guidance is not expected to have a material impact on our consolidated financial statements.
In March 2016, the FASB issued ASU 2016-09, Compensation – Stock Compensation (Topic 718): Improvements to Employee Share-Based Payment Accounting, to simplify the accounting for share-based payment transactions including the income tax consequences, classification of awards as either equity or liabilities and classification on the statements of cash flows. Under the new guidance, all excess tax benefits and tax deficiencies (including tax benefits of dividends on share-based payment awards) should be recognized as income tax expense or benefit on the statements of operations. Under current GAAP, excess tax benefits are recognized in additional paid-in capital while tax deficiencies are recognized either as an offset to accumulated excess tax benefits, if any, or on the statements of operations. The new accounting guidance is effective for annual periods beginning after December 15, 2016. Certain provisions require retrospective/modified retrospective transition while others are to be applied prospectively. Based on historical results, management does not expect the adoption of this guidance to have a material impact on the Company's consolidated financial statements.
In February 2016, the FASB issued ASU 2016-02, Leases (Topic 842), to provide a new comprehensive model for lease accounting. Under this guidance, lessees and lessors should apply a "right-of-use" model in accounting for all leases (including subleases) and eliminate the concept of operating leases and off-balance sheet leases. Recognition, measurement and presentation of expenses will depend on classification as a finance or operating lease. Similar modifications have been made to lessor accounting in-line with revenue recognition guidance. This guidance is effective for annual periods and interim periods within those annual periods beginning after December 15, 2018. The amendments also require certain quantitative and qualitative disclosures about leasing arrangements. Early adoption is permitted. The updated guidance requires a modified retrospective adoption. We are currently in the process of evaluating this new standard update.
In January 2016, the FASB issued ASU 2016-01, Financial Instruments-Overall (Subtopic 825-10): Recognition and Measurement of Financial Assets and Financial Liabilities. This guidance primarily affects the accounting for equity investments, financial liabilities under the fair value option, and the presentation and disclosure requirements for financial instruments. Under the new guidance, entities will be required to measure certain equity investments at fair value and recognize any changes in fair value in net earnings, unless the investments qualify for the new practicability exception. The new standard is effective for fiscal years, including interim periods within those fiscal years, beginning after December 15, 2017. We are currently evaluating the impact of adopting this new standard.
In July 2015, the FASB issued ASU 2015-11, Simplifying the Measurement of Inventory, which requires entities to measure most inventory at the lower of cost and net realizable value, thereby simplifying the current guidance under which an entity must measure inventory at the lower of cost or market. The update is effective for fiscal years beginning after December 15, 2016, and interim periods therein. The adoption of this guidance is not expected to have a material impact on the Company's consolidation financial statements.
In May 2014, the FASB issued ASU No. 2014-09, Revenue from Contracts with Customers (Topic 606) ("ASU 2014-09"), which amends the existing accounting standards for revenue recognition. ASU 2014-09 is based on principles that govern the recognition of revenue at an amount an entity expects to be entitled when products are transferred to customers.
Subsequently, the FASB has issued the following standards related to ASU 2014-09: ASU No. 2016-08, Revenue from Contracts with Customers (Topic 606): Principal versus Agent Considerations ("ASU 2016-08"); ASU No. 2016-10, Revenue from Contracts with Customers (Topic 606): Identifying Performance Obligations and Licensing ("ASU 2016-10"); ASU No. 2016-12, Revenue from Contracts with Customers (Topic 606): Narrow-Scope Improvements and Practical Expedients ("ASU 2016-12"); and ASU No. 2016-20, Technical Corrections and Improvements to Topic 606, Revenue from Contracts with Customers ("ASU 2016-20"). The Company must adopt ASU 2016-08, ASU 2016-10, ASU 2016-12 and ASU 2016-20 with ASU 2014-09 (collectively, the "new revenue standards").
In August 2015, the FASB issued ASU No. 2015-14, Revenue from Contracts with Customers - Deferral of the Effective Date which approved a one-year deferral of ASU 2014-09 for annual reporting periods beginning after December 15, 2017.
The new revenue standards become effective for the Company in the first quarter of fiscal year 2018, but allow adoption one year earlier if the Company so chooses. The Company currently plans to adopt this accounting standard in the first quarter of fiscal year 2018. The guidance permits two methods of adoption: full retrospective in which the standard is applied to all of the periods presented or modified retrospective where an entity will have to recognize the cumulative effect of initially applying the standard as an adjustment to the opening balance of retained earnings. We are currently evaluating the full impact of this new guidance on its consolidated financial statements, including selection of the transition method.
The Company is still in the process of evaluating the effect of the new standard on the Company's historical financial statements. Our efforts to adopt this standard to date have focused on contract analysis at a business unit and regional level. As the Company completes its evaluation of this new standard, new information may arise that could change the Company's current understanding of the impact to revenue and expense recognized. Additionally, the Company will continue to monitor industry activities and any additional guidance provided by regulators, standards setters, or the accounting profession and adjust the Company's assessment and implementation plans accordingly.
In January 2017, the FASB issued ASU 2017-04, Intangibles-Goodwill and Other (Topic 350): Simplifying the Test for Goodwill Impairment ("ASU 2017-04"). ASU 2017-04 simplifies how an entity is required to test goodwill for impairment by eliminating Step 2 from the goodwill impairment test. The Company is required to adopt ASU 2017-04 for its annual or any interim goodwill impairment tests for annual periods beginning after December 15, 2019, and the guidance is to be applied on a prospective basis.
In January 2017, the FASB issued ASU 2017-01, Business Combinations (Topic 805): Clarifying the Definition of a Business ("ASU 2017-01"), to clarify the definition of a business with the objective of adding guidance to assist entities with evaluating whether transactions should be accounted for as acquisitions (or disposals) of assets or businesses. The definition of a business affects many areas of accounting including acquisitions, disposals, goodwill and consolidation. ASU 2017-01 provides a framework that gives entities a basis for making reasonable judgments about whether a transaction involves an asset or a business. The Company is required to adopt ASU 2017-01 for periods beginning after December 15, 2017, including interim periods, and the guidance is to be applied on a prospective basis. Early application is permitted for transactions for which the acquisition date occurs before the issuance date or effective date of the amendments, only when the transaction has not been reported in financial statements that have been issued.
|
2.
|
ACQUISITIONS AND DISPOSITION
|
2014 Acquisitions:
On June 19, 2014, the Company completed its acquisition of Power Solutions for $109.9 million, net of cash acquired. Power Solutions is a leading provider of high-efficiency and high-density power conversion products for server, storage and networking equipment, industrial applications and power systems. In connection with its acquisition of Power Solutions from ABB Ltd., the Company acquired a 49% interest in a joint venture in the People's Republic of China ("PRC"). The Company has assigned no value to this investment. See Note 18, "Related Party Transactions," for additional information. At the conclusion of the measurement period, which was one year after the acquisition date, there were certain working capital and tax related items outstanding with ABB Ltd. The working capital item was settled with ABB Ltd. during the third quarter of 2015, which was after the conclusion of the measurement period and, as a result, the Company recognized $4.2 million of other income on the consolidated statements of operations. See Note 9, "Income Taxes," for further information on the tax related items outstanding with ABB Ltd.
On July 25, 2014, the Company completed its acquisition of the U.S. and U.K. entities of Connectivity Solutions. On August 29, 2014, the China portion of the transaction closed. The Company paid a total of $98.8 million for Connectivity Solutions, net of cash acquired and including a working capital adjustment. Connectivity Solutions is a leading provider of high‑performance RF/Microwave and Harsh Environment Optical Connectors and Assemblies for military, aerospace, wireless communications, data communications, broadcast and industrial applications.
During the years ended December 31, 2015 and 2014, the Company incurred $0.6 million and $7.3 million of acquisition-related costs, respectively, associated with the 2014 Acquisitions primarily for audit-related costs, investment banker fees and legal fees. These costs are included in selling, general and administrative expenses on the consolidated statements of operations. The purchase accounting related to the 2014 Acquisitions was finalized within one year of the respective acquisition dates.
The results of operations of the 2014 Acquired Companies have been included in the Company's consolidated financial statements for the period subsequent to their respective acquisition dates. During the years ended December 31, 2016, 2015 and 2014, the 2014 Acquired Companies contributed revenue of $195.6 million, $230.3 million and $134.3 million, respectively, and operating income (loss) of approximately $3.8 million, $10.3 million and ($2.5) million, respectively, to the Company's consolidated financial results.
The following unaudited pro forma information presents a summary of the combined results of operations of the Company and the aggregate results of Power Solutions and Connectivity Solutions for the periods presented as if the 2014 Acquisitions had occurred on January 1, 2013, along with certain pro forma adjustments. These pro forma adjustments give effect to the amortization of certain definite-lived intangible assets, adjusted depreciation based upon estimated fair value of assets acquired, interest expense and amortization of deferred financing costs related to the financing of the business combinations, and related tax effects. The 2014 unaudited pro forma net earnings for the year ended December 31, 2014 were adjusted to exclude $14.9 million ($9.8 million after tax) of non-recurring expenses, including audit, legal and other transaction fees, IT migration costs and employee-related expenses, which were incurred in connection with the 2014 Acquisitions. The pro forma results do not reflect the realization of any potential cost savings, or any related integration costs. Certain cost savings may result from these acquisitions; however, there can be no assurance that these cost savings will be achieved. The unaudited pro forma results are presented for illustrative purposes only and are not necessarily indicative of the results that would have actually been obtained if the acquisitions had occurred on the assumed dates, nor is the pro forma data intended to be a projection of results that may be obtained in the future.
|
Year Ended
|
||||
|
December 31,
|
||||
|
2014
|
||||
|
Revenue
|
$
|
629,132
|
||
|
Net earnings
|
11,705
|
|||
|
Earnings per Class A common share - basic and diluted
|
0.94
|
|||
|
Earnings per Class B common share - basic and diluted
|
1.02
|
|||
Disposition – Sale of NPS
On January 23, 2015, the Company completed the sale of the Network Power Systems ("NPS") product line and related transactions of the acquired Power Solutions business to Unipower LLC ("Unipower") for $9.0 million in cash. The sale also included $1.0 million of escrow pending Unipower's realization of certain sales targets. The net proceeds of $9.0 million from the sale were used to repay outstanding borrowings in accordance with the provisions of the Credit and Security Agreement (see Note 10, "Debt"). The transaction provided that Bel would move processes and people to Unipower under an interim transition services agreement and that Bel would also continue to manufacture the NPS products for up to 24 months under a manufacturing services agreement.
As a result of the sale and related transactions, the Company recorded deferred revenue of $9.0 million. Of this amount, the Company has recognized net sales of $4.5 million during each of 2016 and 2015. None of the $1.0 million of escrow was recognized as Unipower did not achieve the sales targets specified in the agreement. In January 2017, the Company extended the manufacturing services agreement with Unipower through June 2017 at renegotiated pricing by product for that term.
|
3.
|
RESTRUCTURING ACTIVITIES
|
Activity and liability balances related to restructuring costs for the years ended December 31, 2015 and 2016 are as follows:
|
|
2015
|
2016
|
||||||||||||||||||||||||||
|
|
Liability at
|
Cash Payments
|
Liability at
|
Cash Payments
|
Liability at
|
|||||||||||||||||||||||
|
|
December 31,
|
New
|
and Other
|
December 31,
|
New
|
and Other
|
December 31,
|
|||||||||||||||||||||
|
|
2014
|
Charges
|
Settlements
|
2015
|
Charges
|
Settlements
|
2016
|
|||||||||||||||||||||
|
Severance costs
|
$
|
-
|
$
|
1,144
|
$
|
(1,034
|
)
|
$
|
110
|
$
|
1,407
|
$
|
(929
|
)
|
$
|
588
|
||||||||||||
|
Other restructuring costs
|
-
|
626
|
(626
|
)
|
-
|
2
|
(2
|
)
|
-
|
|||||||||||||||||||
|
Total
|
$
|
-
|
$
|
1,770
|
$
|
(1,660
|
)
|
$
|
110
|
$
|
1,409
|
$
|
(931
|
)
|
$
|
588
|
||||||||||||
During 2016, the Company's restructuring charges included costs associated with the closure of a manufacturing facility in Shanghai, PRC and transition of the operations to other existing Bel facilities. In addition to the charges noted above, the Company incurred $0.7 million related to fixed asset disposals, lease acceleration charges, relocation expenses and other costs associated with the exit of a leased facility located in Shanghai, China which are included as restructuring charges on the consolidated statement of operations during 2016. During 2015, the Company's restructuring charges included costs related to reductions in headcount and consolidation and relocation of certain facilities and offices in North America, Asia and Europe and additional headcount reductions at Cinch US, Array and the U.S. and Asia locations of Connectivity Solutions.
|
4.
|
GOODWILL AND OTHER INTANGIBLE ASSETS
|
Goodwill
Goodwill represents the excess of the purchase price and related acquisition costs over the fair value assigned to the net tangible and other intangible assets acquired in a business acquisition.
The changes in the carrying value of goodwill classified by our segment reporting structure for the years ended December 31, 2016 and 2015 are as follows:
|
Total
|
North America
|
Asia
|
Europe
|
|||||||||||||
|
Balance at January 1, 2015
|
||||||||||||||||
|
Goodwill, gross
|
$ |
145,310
|
$ |
69,380
|
$ |
50,052
|
$ |
25,878
|
||||||||
|
Accumulated impairment charges
|
(26,941
|
)
|
(14,066
|
)
|
(12,875
|
)
|
-
|
|||||||||
|
Goodwill, net
|
$
|
118,369
|
$
|
55,314
|
$
|
37,177
|
$
|
25,878
|
||||||||
|
Measurement period adjustments
|
4,590
|
(6,016
|
)
|
4,351
|
6,255
|
|||||||||||
|
Foreign currency translation
|
(1,325
|
)
|
-
|
129
|
(1,454
|
)
|
||||||||||
|
Balance at December 31, 2015:
|
||||||||||||||||
|
Goodwill, gross
|
148,575
|
63,364
|
54,532
|
30,679
|
||||||||||||
|
Accumulated impairment charges
|
(26,941
|
)
|
(14,066
|
)
|
(12,875
|
)
|
-
|
|||||||||
|
Goodwill, net
|
$
|
121,634
|
$
|
49,298
|
$
|
41,657
|
$
|
30,679
|
||||||||
|
Impairment charge
|
(101,650
|
)
|
(40,408
|
)
|
(41,633
|
)
|
(19,609
|
)
|
||||||||
|
Foreign currency translation
|
(2,033
|
)
|
-
|
(24
|
)
|
(2,009
|
)
|
|||||||||
|
Balance at December 31, 2016:
|
||||||||||||||||
|
Goodwill, gross
|
146,542
|
63,364
|
54,508
|
28,670
|
||||||||||||
|
Accumulated impairment charges
|
(128,591
|
)
|
(54,474
|
)
|
(54,508
|
)
|
(19,609
|
)
|
||||||||
|
Goodwill, net
|
$
|
17,951
|
$
|
8,890
|
$
|
-
|
$
|
9,061
|
||||||||
The goodwill associated with the 2014 acquisitions, as well as the allocation by reporting unit, was finalized by the end of each of the respective measurement periods in 2015, and resulted in an additional $4.6 million of goodwill being recorded in 2015.
As discussed in Note 5, Fair Value Measurements, goodwill is reviewed for impairment on a reporting unit basis annually during the fourth quarter of each year and whenever events or changes in circumstances indicate the carrying value of goodwill may not be recoverable. The goodwill impairment test involves a two-step process. In the first step, the fair value of each reporting unit is compared to its carrying value. If the fair value of the reporting unit exceeds its carrying value, goodwill is not impaired and no further testing is required. If the fair value of the reporting unit is less than the carrying value, the second step of the impairment test must be performed to measure the amount of impairment loss. In the second step, the reporting unit's fair value is allocated to all of the assets and liabilities of the reporting unit, including any unrecognized intangible assets, in a hypothetical analysis that calculates the implied fair value of goodwill in the same manner as if the reporting unit was being acquired in a business combination. If the implied fair value of the reporting unit's goodwill is less than the carrying value, the difference is recorded as an impairment loss and a reduction to goodwill.
We estimated the fair value of these reporting units using a weighting of fair values derived from income and market approaches. Under the income approach, we determine the fair value of a reporting unit based on the present value of estimated future cash flows. Cash flow projections are based on management's estimates of revenue growth rates and operating margins, taking into consideration industry and market conditions. The discount rate used is based on a weighted average cost of capital adjusted for the relevant risk associated with the characteristics of the business and the projected cash flows. The market approach estimates fair value based on market multiples of revenue and earnings derived from comparable publicly traded companies with similar operating and investment characteristics as the reporting unit.
2016 Annual Impairment Test
During the fourth quarter of 2016, the Company completed step one of our annual goodwill impairment test for our reporting units. We concluded that the fair value of each of the Company's reporting units exceeded the respective carrying values and that there was no indication of impairment.
The excess of estimated fair values over carrying value, including goodwill for each of our reporting units that had goodwill as of the 2016 annual impairment test were as follows:
|
Reporting Unit
|
% by Which Estimated Fair Value Exceeds Carrying Value
|
|
|
North America
|
13%
|
|
|
Europe
|
30%
|
2016 Interim Impairment Test
During the first quarter of 2016, management determined that sufficient indicators of potential impairment existed to require an interim goodwill impairment analysis for all of the Company's reporting units. These indicators included the recent business performance of those reporting units, combined with the long-term market conditions and business trends within the reporting units.
Detailed below is a table of key underlying assumptions utilized in the Level 3 fair value estimate calculation for the interim test performed as of March 31, 2016 as compared to those assumptions utilized during the annual valuation performed as of October 1, 2015. Assumptions may vary by reporting unit. The table below shows the range of assumptions utilized across the various reporting units.
|
|
|
|
Goodwill Impairment Analysis
|
||
|
|
|
|
Key Assumptions
|
||
|
|
|
2016 - Interim
|
|
2015 - Annual
|
|
|
|
|
|
|
|
|
|
Income Approach - Discounted Cash Flows (a):
|
|
|
|
|
|
|
|
Revenue 5-year compound annual growth rate (CAGR)
|
|
(9.0%) - (0.6%)
|
|
2.6% - 2.7%
|
|
|
2016 EBITDA margins (b)
|
|
5.1% - 6.6%
|
|
7.2% - 8.4%
|
|
|
Cost of equity capital
|
|
11.6% - 14.7%
|
|
12.3% - 16.5%
|
|
|
Cost of debt capital
|
|
3.6% - 8.5%
|
|
2.4% - 5.9%
|
|
|
Weighted average cost of capital
|
|
10.0% - 14.0%
|
|
11.0% - 15.0%
|
|
|
|
|
|
|
|
|
Market Approach - Multiples of Guideline Companies (a):
|
|
|
|
|
|
|
|
Net operating revenue multiples used
|
|
0.4 - 0.6
|
|
0.4 - 0.5
|
|
|
Operating EBITDA multiples used (b)
|
|
5.9 - 6.3
|
|
5.0 - 5.3
|
|
|
Invested capital control premium
|
|
25%
|
|
25%
|
|
|
|
|
|
|
|
|
Weighting of Valuation Methods:
|
|
|
|
|
|
|
|
Income Approach - Discounted Cash Flows
|
|
75%
|
|
75%
|
|
|
Market Approach - Multiples of Guideline Companies
|
|
25%
|
|
25%
|
|
|
|
|
|
|
|
|
|
(a) Ranges noted reflect assumptions and multiples used throughout the North America, Asia and Europe reporting units
|
||||
|
|
(b) EBITDA represents earnings before interest, taxes, depreciation and amortization. EBITDA margin is calculated by
|
||||
|
|
dividing EBITDA by net sales.
|
|
|
|
|
The March 31, 2016 interim impairment test related to the Company's goodwill was performed by reporting unit (North America, Asia and Europe). The valuation test, which heavily weights future discounted cash flow projections, indicated impairment of the goodwill associated with all three of the Company's reporting units. As a result, the Company recorded a provisional non-cash goodwill impairment charges totaling $104.3 million during the first quarter of 2016. During the second quarter of 2016, the Company finalized its interim impairment test, which resulted in a $2.6 million reduction to the provisional impairment charge recorded during the first quarter of 2016. The Company's goodwill associated with its reporting units originated from several of Bel's prior acquisitions, primarily Power Solutions acquired in 2014 and Connectivity Solutions acquired in 2014 (which represented $55.5 million and $55.0 million, respectively, of the carrying value of goodwill at the testing date). The carrying value of the Company's goodwill was $121.6 million at December 31, 2015.
As noted above, the fair value determined under step one of the goodwill impairment test completed in the fourth quarter of 2016 exceeded the carrying value for each reporting unit. Therefore, there was no impairment of goodwill. However, if the fair value decreases in future periods, the Company may fail step one of the goodwill impairment test and be required to perform step two. In performing step two, the fair value would have to be allocated to all of the assets and liabilities of the reporting unit. Therefore, any potential goodwill impairment charge would be dependent upon the estimated fair value of the reporting unit at that time and the outcome of step two of the impairment test. The fair values of the assets and liabilities of the reporting unit, including the intangible assets, could vary depending on various factors.
The future occurrence of a potential indicator of impairment, such as a decrease in expected net earnings, adverse equity market conditions, a decline in current market multiples, a decline in our common stock price, a significant adverse change in legal factors or business climates, an adverse action or assessment by a regulator, unanticipated competition, strategic decisions made in response to economic or competitive conditions, or a more-likely-than-not expectation that a reporting unit or a significant portion of a reporting unit will be sold or disposed of, could require an interim assessment for some or all of the reporting units before the next required annual assessment. In the event of significant adverse changes of the nature described above, it may be necessary for us to recognize an additional non-cash impairment of goodwill, which could have a material adverse effect on our consolidated financial condition and results of operations.
Based on annual impairment tests performed in prior years, there was no indication of goodwill impairment during 2014 or 2015.
Other Intangible Assets
Other identifiable intangible assets include patents, technology, license agreements, non-compete agreements and trademarks. Amounts assigned to these intangible assets have been determined by management. Management considered a number of factors in determining the allocations, including valuations and independent appraisals. Trademarks have indefinite lives and are reviewed for impairment on an annual basis. Other intangible assets, excluding trademarks, are being amortized over 1 to 29 years.
The Company tests indefinite-lived intangible assets for impairment using a fair value approach, the relief-from-royalty method (a form of the income approach). At December 31, 2016, the Company's indefinite-lived intangible assets related to the trademarks acquired in the Power Solutions, Connectivity Solutions, Cinch and Fibreco acquisitions.
The components of definite and indefinite-lived intangible assets are as follows:
|
December 31, 2016
|
December 31, 2015
|
|||||||||||||||||||||||
|
Gross Carrying
|
Accumulated
|
Net Carrying
|
Gross Carrying
|
Accumulated
|
Net Carrying
|
|||||||||||||||||||
|
Amount
|
Amortization
|
Amount
|
Amount
|
Amortization
|
Amount
|
|||||||||||||||||||
|
Patents, licenses and technology
|
$
|
38,658
|
$
|
11,276
|
$
|
27,382
|
$
|
39,388
|
$
|
7,932
|
$
|
31,456
|
||||||||||||
|
Customer relationships
|
43,821
|
8,302
|
35,519
|
44,894
|
5,735
|
39,159
|
||||||||||||||||||
|
Non-compete agreements
|
2,667
|
2,376
|
291
|
2,753
|
1,838
|
915
|
||||||||||||||||||
|
Trademarks
|
11,677
|
41
|
11,636
|
16,338
|
41
|
16,297
|
||||||||||||||||||
|
$
|
96,823
|
$
|
21,995
|
$
|
74,828
|
$
|
103,373
|
$
|
15,546
|
$
|
87,827
|
|||||||||||||
Amortization expense was $7.0 million in each of 2016 and 2015 and $5.4 million in 2014.
Estimated amortization expense for intangible assets for the next five years is as follows:
|
December 31,
|
Amortization Expense
|
|||
|
2017
|
$
|
6,521
|
||
|
2018
|
6,229
|
|||
|
2019
|
6,229
|
|||
|
2020
|
6,197
|
|||
|
2021
|
6,196
|
|||
2016 Annual Impairment Test
The Company completed its annual indefinite-lived intangible assets impairment test during the fourth quarter of 2016, noting no further impairment. Management has concluded that the fair value of these trademarks exceeded the related carrying values at December 31, 2016 and that there was no indication of impairment.
2016 Interim Impairment Test
During the first quarter of 2016, management determined that sufficient indicators of potential impairment existed to require an interim impairment review of our trademarks. Based on the Company's analysis, the fair values of all of the Company's trademarks were lower than the respective carrying values. As a result, in 2016, the Company recorded a non-cash impairment of $4.3 million which is included in impairment of goodwill and other intangible assets on the consolidated statements of operations.
Detailed below is a table of key underlying assumptions utilized in the Level 3 fair value estimate calculation of the Company's trademarks for the interim test performed as of March 31, 2016 as compared to those assumptions utilized during the annual valuation performed as of October 1, 2015. Assumptions may vary by individual trademark. The table below shows the range of assumptions utilized across the Company's various trademarks.
|
|
|
Trademark Impairment Analysis
|
||
|
|
|
Key Assumptions
|
||
|
|
2016 - Interim
|
|
2015 - Annual
|
|
|
|
|
|
|
|
|
Revenue 5-year compound annual growth rate (CAGR)
|
|
(0.4%) - 2.7%
|
|
0.2% - 4.0%
|
|
Estimated fair royalty rate
|
|
0.25% - 1.5%
|
|
0.5% - 2.0%
|
|
Discount rate
|
|
11.0% - 15.0%
|
|
12.0% - 14.0%
|
Based on annual impairment tests performed in prior years, there was no indication of indefinite-lived intangible assets impairment during 2014 or 2015.
The future occurrence of a potential indicator of impairment, such as those described above, could require an interim assessment for some or all of the Company's trademarks. In such a case, it may be necessary for us to recognize an additional non-cash impairment charge related to our trademarks, which could have a material adverse effect on our consolidated financial condition and results of operations.
|
5.
|
FAIR VALUE MEASUREMENTS
|
As of December 31, 2016 and 2015, the Company held certain financial assets that are measured at fair value on a recurring basis. These consisted of securities that are among the Company's investments in a rabbi trust which are intended to fund the Company's Supplemental Executive Retirement Plan ("SERP") obligations, and other marketable securities described below. The securities that are held in the rabbi trust are categorized as available-for-sale securities and are included as other assets in the accompanying consolidated balance sheets at December 31, 2016 and 2015. The gross unrealized gains associated with the investments held in the rabbi trust were $0.7 million and $0.7 million at December 31, 2016 and 2015, respectively. Such unrealized gains are included, net of tax, in accumulated other comprehensive income.
As of December 31, 2016 and 2015, our available-for-sale securities, which primarily consist of investments held in a rabbi trust of $1.7 million and $3.6 million, respectively, are measured at fair value using quoted prices in active markets for identical assets (Level 1) inputs. The Company does not have any financial assets measured at fair value on a recurring basis categorized as Level 3, and there were no transfers in or out of Level 1, Level 2 or Level 3 during 2016 or 2015. There were no changes to the Company's valuation techniques used to measure asset fair values on a recurring or nonrecurring basis during 2016.
There were no financial assets accounted for at fair value on a nonrecurring basis as of December 31, 2016 or 2015.
The Company has other financial instruments, such as cash and cash equivalents, accounts receivable, restricted cash, accounts payable, accrued expenses and notes payable, which are not measured at fair value on a recurring basis but are recorded at amounts that approximate fair value due to their liquid or short-term nature. The fair value of the Company's long-term debt is estimated using a discounted cash flow method based on interest rates that are currently available for debt issuances with similar terms and maturities. At December 31, 2016 and 2015, the estimated fair value of total debt was $144.3 million and $188.1 million, respectively, compared to a carrying amount of $141.2 million and $183.5 million, respectively. The Company did not have any other financial liabilities within the scope of the fair value disclosure requirements as of December 31, 2016.
Nonfinancial assets and liabilities, such as goodwill, indefinite-lived intangible assets and long-lived assets, are accounted for at fair value on a nonrecurring basis. These items are tested for impairment upon the occurrence of a triggering event or in the case of goodwill, on at least an annual basis. See Note 4, "Goodwill and Other Intangible Assets," for further information about goodwill and other indefinite-lived intangible assets.
|
6.
|
OTHER ASSETS
|
At December 31, 2016 and 2015, the Company has obligations of $16.9 million and $15.6 million, respectively, associated with its SERP. As a means of informally funding these obligations, the Company has invested in life insurance policies related to certain employees and marketable securities held in a rabbi trust. At December 31, 2016 and 2015, these assets had a combined value of $12.7 million and $12.2 million, respectively.
Company-Owned Life Insurance
Investments in company-owned life insurance policies ("COLI") were made with the intention of utilizing them as a long-term funding source for the Company's SERP obligations. However, the cash surrender value of the COLI does not represent a committed funding source for these obligations. Any proceeds from these policies are subject to claims from creditors. The cash surrender value of the COLI of $10.9 million and $8.5 million at December 31, 2016 and 2015, respectively, is included in other assets in the accompanying consolidated balance sheets. During 2016 and 2015, the Company sold $2.2 million and $2.8 million, respectively, of marketable securities within the rabbi trust and utilized the proceeds to purchase additional COLI. The volatility in global equity markets in recent years has also had an effect on the cash surrender value of the COLI policies. The Company recorded income (expense) to account for the increase (decrease) in cash surrender value in the amount of $0.5 million, ($0.1) million and $0.2 million during the years ended December 31, 2016, 2015 and 2014, respectively. These fluctuations in the cash surrender value were allocated between cost of sales and selling, general and administrative expenses on the consolidated statements of operations for the years ended December 31, 2016, 2015 and 2014. The allocation is consistent with the costs associated with the long-term employee benefit obligations that the COLI is intended to fund.
Other Investments
At December 31, 2016 and 2015, the Company held, in the aforementioned rabbi trust, available-for-sale investments at a cost of $1.0 million and $2.9 million, respectively. Together with the COLI described above, these investments are intended to fund the Company's SERP obligations and are classified as other assets in the accompanying consolidated balance sheets. The Company monitors these investments for impairment on an ongoing basis. As discussed above, the Company sold $2.2 million of its SERP investments during 2016 and $2.8 million during 2015. At December 31, 2016 and 2015, the fair market value of these investments was $1.7 million and $3.6 million, respectively. The gross unrealized gain of $0.7 million and $0.7 million at December 31, 2016 and 2015, respectively, has been included, net of tax, in accumulated other comprehensive income (loss).
|
7.
|
INVENTORIES
|
The components of inventories are as follows:
|
December 31,
|
||||||||
|
2016
|
2015
|
|||||||
|
Raw materials
|
$
|
43,376
|
$
|
42,036
|
||||
|
Work in progress
|
18,008
|
16,908
|
||||||
|
Finished goods
|
37,487
|
39,566
|
||||||
|
Inventories
|
$
|
98,871
|
$
|
98,510
|
||||
|
8.
|
PROPERTY, PLANT AND EQUIPMENT, NET
|
Property, plant and equipment, net consist of the following:
|
December 31,
|
||||||||
|
2016
|
2015
|
|||||||
|
Land
|
$
|
2,234
|
$
|
2,240
|
||||
|
Buildings and improvements
|
30,061
|
29,346
|
||||||
|
Machinery and equipment
|
113,780
|
116,921
|
||||||
|
Construction in progress
|
3,029
|
4,949
|
||||||
|
149,104
|
153,456
|
|||||||
|
Accumulated depreciation
|
(100,349
|
)
|
(95,845
|
)
|
||||
|
Property, plant and equipment, net
|
$
|
48,755
|
$
|
57,611
|
||||
Depreciation expense for the years ended December 31, 2016, 2015 and 2014 was $14.8 million, $16.0 million and $15.0 million, respectively.
9. INCOME TAXES
The Company and its subsidiaries file income tax returns in the U.S. federal jurisdiction and various states and foreign jurisdictions. The Company is no longer subject to U.S. federal examinations by tax authorities for years before 2013 and for state examinations before 2010. Regarding foreign subsidiaries, the Company is no longer subject to examination by tax authorities for years before 2006 in Asia and generally 2009 in Europe. At December 31, 2015, the Company was under examination by the taxing authorities in Germany for the tax years 2011 through 2013. This audit concluded in April 2016 and resulted in an immaterial amount of incremental tax expense.
At December 31, 2016 and 2015, the Company has approximately $27.8 million and $42.2 million, respectively, of liabilities for uncertain tax positions ($0.4 million and $1.9 million, respectively, is included in other current liabilities on the consolidated balance sheets and $27.4 million and $40.3 million, respectively, is included in liability for uncertain tax positions on the consolidated balance sheets). These amounts, if recognized, would reduce the Company's effective tax rate. As of December 31, 2016, approximately $0.4 million of the Company's liabilities for uncertain tax positions are expected to be resolved during the next twelve months by way of expiration of the related statute of limitations.
In connection with the acquisition of the Power Solutions business in 2014, the Company acquired a liability for additional uncertain tax positions related to various tax matters for the years 2007 through 2013. During the year ended December 31, 2016, a portion of these tax matters was resolved with the taxing authorities which resulted in a reduction of $13.9 million in the liability for uncertain tax positions, of which $11.1 million related to interest and penalties. The Company is actively pursuing resolution of the remaining tax matters. From the date of acquisition through December 31, 2016, the Company has recorded $4.5 million of interest and penalties pertaining to this issue, of which $2.6 million was reversed during 2016 in relation to the settlement of the exposure. The Company will continue to accrue approximately $0.7 million annually until the issues are resolved.
As part of the acquisition of Power Solutions, the Company acquired a $12.0 million liability for uncertain tax positions relating to an ongoing claim by the Arezzo Revenue Agency in Italy concerning certain tax matters related to what was then Power-One Asia Pacific Electronics Shenzhen Co. Ltd. (now Bel Power Solutions Asia Pacific Electronics Shenzhen Co. Ltd.) for the years 2004 through 2006, as further described in Note 16, "Commitments and Contingencies."
As a result of the expiration of the statutes of limitations for specific jurisdictions, it is reasonably possible that the related unrecognized benefits for tax positions taken regarding previously filed tax returns may change materially from those recorded as liabilities for uncertain tax positions in the Company's consolidated financial statements at December 31, 2016. A total of $0.4 million of the acquired liability for uncertain tax positions relates to the 2006 tax year and is scheduled to expire on December 31, 2017. Additionally, a total of $0.2 million of previously recorded liabilities for uncertain tax positions relating to the 2010 tax year were reversed during the year ended December 31, 2015. This was offset by an increase to the liability for uncertain tax positions in the amount of $3.2 million, of which $2.1 million relates to interest and penalties on the uncertain tax positions acquired from Power Solutions, which is included in the consolidated statement of operations during the year ended December 31, 2015. A total of $0.8 million of previously recorded liabilities for uncertain tax positions relating to 2010 were reversed during the year ended December 31, 2014.
A reconciliation of the beginning and ending amount of the liability for uncertain tax positions, including the portion included in income taxes payable, is as follows:
|
2016
|
2015
|
2014
|
||||||||||
|
Liability for uncertain tax positions - January 1
|
$
|
42,158
|
$
|
39,970
|
$
|
2,189
|
||||||
|
Additions based on tax positions
|
||||||||||||
|
related to the current year
|
2,483
|
3,241
|
2,732
|
|||||||||
|
Additions relating to acquisitions
|
-
|
-
|
35,874
|
|||||||||
|
Translation adjustment
|
(881
|
)
|
(844
|
)
|
-
|
|||||||
|
Settlement/expiration of statutes of limitations
|
(15,932
|
)
|
(209
|
)
|
(825
|
)
|
||||||
|
Liability for uncertain tax positions - December 31
|
$
|
27,828
|
$
|
42,158
|
$
|
39,970
|
||||||
The Company's policy is to recognize interest and penalties related to uncertain tax positions as a component of the current provision for income taxes. During the years ended December 31, 2016, 2015 and 2014, the Company recognized $1.3 million, $2.5 million and $1.6 million, respectively, in interest and penalties in the consolidated statements of operations. During the years ended December 31, 2016, 2015 and 2014, the Company recognized a benefit of $3.1 million, less than $0.1 million and $0.2 million, respectively, for the reversal of such interest and penalties, relating to the expiration of statues of limitations and settlement of the acquired liability for uncertain tax positions, respectively. The Company has approximately $2.2 million and $4.0 million accrued for the payment of interest and penalties at December 31, 2016 and 2015, respectively, which is included in both income taxes payable and liability for uncertain tax positions in the consolidated balance sheets.
The Company's total (loss) earnings before (benefit) provision for income taxes included (loss) earnings from domestic operations of ($43.3) million, $6.1 million and ($9.2) million for 2016, 2015 and 2014, respectively, and (loss) earnings before (benefit) provision for income taxes from foreign operations of ($39.2) million, $19.6 million and $19.0 million for 2016, 2015 and 2014, respectively.
The (benefit) provision for income taxes consists of the following:
|
Years Ended December 31,
|
||||||||||||
|
2016
|
2015
|
2014
|
||||||||||
|
Current:
|
||||||||||||
|
Federal
|
$
|
(1,163
|
)
|
$
|
1,494
|
$
|
402
|
|||||
|
State
|
18
|
70
|
175
|
|||||||||
|
Foreign
|
(10,172
|
)
|
5,327
|
3,281
|
||||||||
|
(11,317
|
)
|
6,891
|
3,858
|
|||||||||
|
Deferred:
|
||||||||||||
|
Federal
|
(6,272
|
)
|
1,019
|
(2,698
|
)
|
|||||||
|
State
|
(464
|
)
|
(64
|
)
|
(407
|
)
|
||||||
|
Foreign
|
335
|
(1,311
|
)
|
414
|
||||||||
|
(6,401
|
)
|
(356
|
)
|
(2,691
|
)
|
|||||||
|
$
|
(17,718
|
)
|
$
|
6,535
|
$
|
1,167
|
||||||
A reconciliation of taxes on income computed at the U.S. federal statutory rate to amounts provided is as follows:
|
Years Ended December 31,
|
||||||||||||||||||||||||
|
2016
|
2015
|
2014
|
||||||||||||||||||||||
| $ |
|
%
|
$ |
|
%
|
$ |
|
%
|
||||||||||||||||
|
Tax (benefit) provision computed at the
|
||||||||||||||||||||||||
|
federal statutory rate
|
$
|
(28,893
|
)
|
35
|
%
|
$
|
9,006
|
35
|
%
|
$
|
3,420
|
35
|
%
|
|||||||||||
|
Increase (decrease) in taxes resulting from:
|
||||||||||||||||||||||||
|
Different tax rates applicable to foreign operations
|
(4,427
|
)
|
5
|
%
|
(5,353
|
)
|
(21
|
%)
|
(4,458
|
)
|
(46
|
%)
|
||||||||||||
|
Impairment of goodwill & intangibles
|
30,445
|
(37
|
%)
|
-
|
0
|
%
|
-
|
0
|
%
|
|||||||||||||||
|
Increase in (reversal of) liability for uncertain
|
||||||||||||||||||||||||
|
tax positions - net
|
(13,974
|
)
|
17
|
%
|
3,032
|
12
|
%
|
1,907
|
20
|
%
|
||||||||||||||
|
Utilization of research and experimentation, solar and foreign
|
||||||||||||||||||||||||
|
tax credits
|
(349
|
)
|
0
|
%
|
(349
|
)
|
(1
|
%)
|
(508
|
)
|
(5
|
%)
|
||||||||||||
|
State taxes, net of federal benefit
|
(420
|
)
|
1
|
%
|
56
|
0
|
%
|
(183
|
)
|
(2
|
%)
|
|||||||||||||
|
Current year (reversal) increase in U.S. valuation allowances
|
-
|
0
|
%
|
(343
|
)
|
(1
|
%)
|
335
|
3
|
%
|
||||||||||||||
|
Federal tax on profit of foreign disregarded entities
|
||||||||||||||||||||||||
|
net of deferred tax
|
-
|
0
|
%
|
872
|
3
|
%
|
770
|
8
|
%
|
|||||||||||||||
|
Other, including qualified production activity credits, SERP/COLI
|
||||||||||||||||||||||||
|
income, under/(over) accruals, unrealized foreign exchange gains
|
||||||||||||||||||||||||
|
and amortization of purchase accounting intangibles
|
(100
|
)
|
0
|
%
|
(386
|
)
|
(2
|
%)
|
(116
|
)
|
(1
|
%)
|
||||||||||||
|
Tax (benefit) provision computed at the Company's
|
||||||||||||||||||||||||
|
effective tax rate
|
$
|
(17,718
|
)
|
21
|
%
|
$
|
6,535
|
25
|
%
|
$
|
1,167
|
12
|
%
|
|||||||||||
The Company holds an offshore business license from the government of Macao. With this license, a Macao offshore company named Bel Fuse (Macao Commercial Offshore) Limited has been established to handle the Company's sales to third-party customers in Asia. Sales by this company consist of products manufactured in the PRC. This company is not subject to Macao corporate profit taxes which are imposed at a tax rate of 12%. Additionally, the Company established TRP International, a China Business Trust ("CBT"), when it acquired the TRP group, as previously discussed. Sales by the CBT consists of products manufactured in the PRC and sold to third-party customers inside and outside Asia. The CBT is not subject to PRC income taxes, which are generally imposed at a tax rate of 25%.
As of December 31, 2016, the Company has gross foreign income tax net operating losses ("NOL") of $25.6 million, foreign tax credits of $0.3 million and capital loss carryforwards of $0.2 million which amount to a total of $6.2 million of deferred tax assets. The Company has established valuation allowances totaling $6.1 million against these deferred tax assets. In addition, the Company has gross federal and state income tax NOLs of $16.0 million, including $3.8 million of NOLs acquired from Array and $10.0 million of NOLs acquired from Connectivity Solutions, which amount to $5.3 million of deferred tax assets and tax credit carryforwards of $2.3 million. The Company has established valuation allowances of $0.2 million and $1.2 million, respectively, against these deferred tax assets. The foreign NOL's can be carried forward indefinitely, the NOL acquired from Array expires at various times during 2026 – 2027, the NOL acquired from Connectivity Solutions expire at various times during 2022-2033, the state NOL's expire at various times during 2017 – 2031 and the tax credit carryforwards expire at various times during 2025 - 2034.
It is the Company's intention to repatriate substantially all net income from its wholly owned PRC subsidiary, Dongguan Transpower Electric Products Co., Ltd, a Chinese Limited Liability Company, to its direct Hong Kong parent Transpower Technologies (Hong Kong) Ltd. Applicable income and dividend withholding taxes have been reflected in the accompanying consolidated statements of operations for the year ended December 31, 2016. However, U.S. deferred taxes need not be provided as there is no intention to repatriate such amounts to the U.S. Management's intention is to permanently reinvest the majority of the remaining earnings of foreign subsidiaries in the expansion of its foreign operations. Unrepatriated earnings, upon which U.S. income taxes have not been accrued, are approximately $100.4 million at December 31, 2016. Such unrepatriated earnings are deemed by management to be permanently reinvested. At December 31, 2016, the estimated federal income tax liability related to unrepatriated foreign earnings is $23.3 million under the current tax law.
Components of deferred income tax assets are as follows:
|
December 31,
|
||||||||
|
2016
|
2015
|
|||||||
|
Tax Effect
|
Tax Effect
|
|||||||
|
Deferred tax assets:
|
||||||||
|
State tax credits
|
$
|
902
|
$
|
902
|
||||
|
Unfunded pension liability
|
1,398
|
1,327
|
||||||
|
Reserves and accruals
|
4,335
|
4,349
|
||||||
|
Federal, state and foreign net operating loss
|
||||||||
|
and credit carryforwards
|
12,891
|
10,953
|
||||||
|
Depreciation
|
1,057
|
880
|
||||||
|
Amortization
|
-
|
814
|
||||||
|
Other accruals
|
8,278
|
9,622
|
||||||
|
Total deferred tax assets
|
28,861
|
28,847
|
||||||
|
Deferred tax liabilities:
|
||||||||
|
Reserves and accruals
|
64
|
64
|
||||||
|
Depreciation
|
3,028
|
2,391
|
||||||
|
Amortization
|
15,361
|
23,772
|
||||||
|
Other accruals
|
973
|
857
|
||||||
|
Total deferred tax liabilities
|
19,426
|
27,084
|
||||||
|
Valuation allowance
|
7,485
|
6,635
|
||||||
|
Net deferred tax assets/(liabilities)
|
$
|
1,950
|
$
|
(4,872
|
)
|
|||
The Company continues to monitor proposed legislation affecting the taxation of transfers of U.S. intangible property and other potential tax law changes.
|
10.
|
DEBT
|
On June 19, 2014, the Company entered into a senior Credit and Security Agreement with KeyBank National Association ("KeyBank"), as administrative agent and lender, which was amended on June 30, 2014 principally to add a syndicate of additional lenders (as so amended, the "Credit and Security Agreement" or "CSA"). The maturity date of the CSA is June 18, 2019.
The CSA consists of (i) a $50 million revolving credit facility ("Revolver"), (ii) a $145 million term loan facility ("Term Loan") and (iii) a $70 million delayed draw term loan ("DDTL"). Under the terms of the CSA, the Company is entitled, subject to the satisfaction of certain conditions, to request additional commitments under the revolving credit facility or term loans in the aggregate principal amount of up to $100 million to the extent that existing or new lenders agree to provide such additional commitments and/or term loans.
The obligations of the Company under the CSA are guaranteed by certain of the Company's material U.S. subsidiaries (together with the Company, the "Loan Parties") and are secured by a first priority security interest in substantially all of the existing and future personal property of the Loan Parties, certain material real property of the Loan Parties and certain of the Loan Parties' material U.S. subsidiaries, including 65% of the voting capital stock of certain of the Loan Parties' direct foreign subsidiaries.
The borrowings under the CSA will bear interest at a rate equal to, at the Company's option, either (1) LIBOR, plus a margin ranging from 1.75% per annum to 3.00% per annum depending on the Company's leverage ratio, or (2)(a) an "Alternate Base Rate," which is the highest of (i) the federal funds rate plus 0.50%, (ii) KeyBank's prime rate and (iii) the LIBOR rate with a maturity of one month plus 1.00%, plus (b) a margin ranging from 0.75% per annum to 2.00% per annum, depending on the Company's leverage ratio. The interest rate in effect at December 31, 2016 was 3.06%, which consisted of LIBOR of 0.81% plus the Company's margin of 2.25%. The interest rate in effect at December 31, 2015 was 3.19%, which consisted of LIBOR of 0.44% plus the Company's margin of 2.75%.
The CSA contains customary representations and warranties, covenants and events of default and financial covenants that measure (i) the ratio of the Company's total funded indebtedness, on a consolidated basis, to the amount of the Company's consolidated EBITDA, as defined, ("Leverage Ratio") and (ii) the ratio of the amount of the Company's consolidated EBITDA to the Company's consolidated fixed charges ("Fixed Charge Coverage Ratio"). If an event of default occurs, the lenders under the CSA would be entitled to take various actions, including the acceleration of amounts due thereunder and all actions permitted to be taken by a secured creditor. At December 31, 2016, the Company was in compliance with its debt covenants, including its most restrictive covenant, the Leverage Ratio. The unused credit available under the credit facility at December 31, 2016 was $50.0 million. In January 2017, the Company borrowed $6.0 million of its available credit under the credit facility.
Concurrent with its entry into the CSA on June 19, 2014, the Company borrowed $145.0 million under the Term Loan to complete its acquisition of Power Solutions. In July 2014, in connection with the acquisition of Connectivity Solutions, the Company borrowed an additional $90.0 million under the CSA ($70.0 million through the DDTL and $20.0 million under the Revolver).
In March 2016, the Company amended the terms of the CSA to modify (i) the date by which the Company was obligated to make excess cash flow prepayments in 2016 on account of excess cash flow achieved for fiscal year 2015, (ii) the method of application of mandatory and voluntary prepayments related to the Company's loans, and (iii) the maximum Leverage Ratio of the Company allowed under the CSA for the period from the effective date of the amendment through September 2017. In connection with this amendment to the CSA, the Company paid $0.7 million of deferred financing costs, and the modification to the amortization schedule resulted in $0.5 million of existing deferred financing costs to be accelerated and recorded as interest expense during the first quarter of 2016.
The Company recorded a total of $6.5 million in deferred financing costs related to the CSA since 2014, and these costs are being amortized in interest expense over the remaining term of the loan. At December 31, 2016 and 2015, the carrying value of the debt on the consolidated balance sheets is reflected net of $2.6 million and $3.6 million, respectively, of deferred financing costs as a result of the adoption of accounting guidance effective January 1, 2016. See Note 1, "Basis of Presentation and Accounting Policies".
In connection with its outstanding borrowings and amortization of the deferred financing costs described above, the Company incurred $6.7 million and $7.6 million of interest expense during the years ended December 31, 2016 and 2015, respectively. At December 31, 2016 and 2015, borrowings outstanding related to the term loans (Term Loan and DDTL combined) were $143.8 million and $187.2 million, respectively, with no borrowings outstanding under the revolver at either period.
Scheduled principal payments of the total debt outstanding at December 31, 2016 are as follows (in thousands):
|
2017
|
$
|
12,495
|
||
|
2018
|
20,860
|
|||
|
2019
|
110,443
|
|||
|
Total long-term debt
|
143,798
|
|||
|
Less: Current maturities of long-term debt
|
(12,495
|
)
|
||
|
Noncurrent portion of long-term debt
|
$
|
131,303
|
11. ACCRUED EXPENSES
Accrued expenses consist of the following:
|
|
Year Ended December 31,
|
|||||||
|
|
2016
|
2015
|
||||||
|
Sales commissions
|
$
|
2,066
|
$
|
2,824
|
||||
|
Subcontracting labor
|
1,370
|
1,942
|
||||||
|
Salaries, bonuses and related benefits
|
17,587
|
15,672
|
||||||
|
Warranty accrual
|
2,718
|
3,659
|
||||||
|
Deferred revenue
|
-
|
4,500
|
||||||
|
Other
|
7,808
|
9,726
|
||||||
|
|
$
|
31,549
|
$
|
38,323
|
||||
A tabular presentation of the activity within the warranty accrual account for the years ended December 31, 2016 and 2015 is presented below:
|
|
Year Ended December 31,
|
|||||||
|
|
2016
|
2015
|
||||||
|
Balance, beginning of year
|
$
|
3,659
|
$
|
6,032
|
||||
|
Charges and costs accrued
|
761
|
2,892
|
||||||
|
Adjustments related to pre-existing warranties
|
||||||||
|
(including changes in estimates)
|
(1,063
|
)
|
(1,208
|
)
|
||||
|
Less: Repair costs incurred
|
(544
|
)
|
(2,932
|
)
|
||||
|
Less: Cash settlements
|
-
|
(1,000
|
)
|
|||||
|
Currency translation
|
(95
|
)
|
(125
|
)
|
||||
|
Balance, end of year
|
$
|
2,718
|
$
|
3,659
|
||||
12. SEGMENTS
The Company operates in one industry with three reportable operating segments, which are geographic in nature. The segments consist of North America, Asia and Europe. The primary criteria by which financial performance is evaluated and resources are allocated are net sales and income from operations. The following is a summary of key financial data:
|
2016
|
2015
|
2014
|
||||||||||
| (Revised) | (Revised) | |||||||||||
|
Net Sales to External Customers:
|
||||||||||||
|
North America
|
$
|
256,760
|
$
|
304,328
|
$
|
217,258
|
||||||
|
Asia
|
168,458
|
188,146
|
201,338
|
|||||||||
|
Europe
|
74,935
|
74,606
|
68,480
|
|||||||||
|
$
|
500,153
|
$
|
567,080
|
$
|
487,076
|
|||||||
|
Net Sales:
|
||||||||||||
|
North America
|
$
|
268,935
|
$
|
329,304
|
$
|
248,007
|
||||||
|
Asia
|
256,202
|
295,751
|
275,765
|
|||||||||
|
Europe
|
86,750
|
148,735
|
114,748
|
|||||||||
|
Less intercompany
|
||||||||||||
|
net sales
|
(111,734
|
)
|
(206,710
|
)
|
(151,444
|
)
|
||||||
|
$
|
500,153
|
$
|
567,080
|
$
|
487,076
|
|||||||
|
(Loss) Income from Operations:
|
||||||||||||
|
North America
|
$
|
(35,722
|
)
|
$
|
11,012
|
$
|
(4,531
|
)
|
||||
|
Asia
|
(24,360
|
)
|
8,175
|
13,090
|
||||||||
|
Europe
|
(16,430
|
)
|
9,413
|
4,913
|
||||||||
|
$
|
(76,512
|
)
|
$
|
28,600
|
$
|
13,472
|
||||||
|
Total Assets:
|
||||||||||||
|
North America
|
$
|
168,061
|
$
|
238,930
|
$
|
309,516
|
||||||
|
Asia
|
166,028
|
231,063
|
251,240
|
|||||||||
|
Europe
|
92,651
|
108,512
|
69,616
|
|||||||||
|
$
|
426,740
|
$
|
578,505
|
$
|
630,372
|
|||||||
|
Capital Expenditures:
|
||||||||||||
|
North America
|
$
|
2,641
|
$
|
2,425
|
$
|
3,862
|
||||||
|
Asia
|
4,329
|
4,888
|
4,089
|
|||||||||
|
Europe
|
1,253
|
2,578
|
1,091
|
|||||||||
|
$
|
8,223
|
$
|
9,891
|
$
|
9,042
|
|||||||
|
Depreciation and Amortization Expense:
|
||||||||||||
|
North America
|
$
|
10,522
|
$
|
10,841
|
$
|
7,986
|
||||||
|
Asia
|
7,976
|
8,706
|
8,391
|
|||||||||
|
Europe
|
3,280
|
3,462
|
3,990
|
|||||||||
|
$
|
21,778
|
$
|
23,009
|
$
|
20,367
|
|||||||
Net Sales – Segment net sales are attributed to individual segments based on the geographic source of the billing for such customer sales. Intercompany sales include finished products manufactured in foreign countries which are then transferred to the United States and Europe for sale; finished goods manufactured in the United States which are transferred to Europe and Asia for sale; and semi-finished components manufactured in the United States which are sold to Asia for further processing. Income from operations represents net sales less operating costs and expenses and does not include any amounts related to intercompany transactions.
The following items are included in the segment data presented above:
Acquisitions – Since the 2014 Acquisitions occurred mid-year during 2014, Bel's segment net sales and income from operations presented above for the year ended December 31, 2014 only include contributions from the respective dates of acquisitions. The following table indicates the contributions to net sales and income (loss) from operations from the 2014 Acquisitions:
|
Year Ended December 31,
|
||||||||
|
2015
|
2014
|
|||||||
|
Net Sales to External Customers:
|
||||||||
|
North America
|
$
|
189,118
|
$
|
101,772
|
||||
|
Asia
|
5,898
|
5,870
|
||||||
|
Europe
|
35,319
|
26,694
|
||||||
|
Net sales from the 2014 Acquisitions
|
$
|
230,335
|
$
|
134,336
|
||||
|
Income (loss) from operations:
|
||||||||
|
North America
|
$
|
5,123
|
$
|
(3,585
|
)
|
|||
|
Asia
|
(2,403
|
)
|
(3,358
|
)
|
||||
|
Europe
|
7,530
|
4,406
|
||||||
|
Total income (loss) from operations
|
||||||||
|
from the 2014 Acquisitions
|
$
|
10,250
|
$
|
(2,537
|
)
|
|||
Restructuring Charges – The following restructuring charges are included in income (loss) from operations by segment. See Note 3, "Restructuring Activities," for further information on the Company's restructuring efforts.
|
|
2016
|
2015
|
2014
|
|||||||||
|
North America
|
$
|
692
|
$
|
1,452
|
$
|
1,539
|
||||||
|
Asia
|
1,305
|
352
|
-
|
|||||||||
|
Europe
|
90
|
310
|
293
|
|||||||||
|
|
$
|
2,087
|
$
|
2,114
|
$
|
1,832
|
||||||
Impairment Charges – As discussed in Note 4, Goodwill and Other Intangible Assets, the Company recorded a $106.0 million non-cash impairment charge related to its goodwill and trademarks in 2016. Of this charge, $44.0 million was recorded in the Company's North America segment, $41.7 million was recorded in its Asia segment and $20.3 million was recorded in its Europe segment. These charges impacted the Company's income from operations for 2016 and the reduction in goodwill accounted for the majority of the decline in total assets from December 31, 2015 noted above.
Entity-Wide Information
The following is a summary of entity-wide information related to the Company's net sales to external customers by geographic area and by major product line.
|
|
2016
|
2015
|
2014
|
|||||||||
|
Net Sales by Geographic Location:
|
||||||||||||
|
|
||||||||||||
|
United States
|
$
|
256,760
|
$
|
304,328
|
$
|
217,258
|
||||||
|
Macao
|
163,971
|
182,248
|
195,469
|
|||||||||
|
United Kingdom
|
21,953
|
27,552
|
22,852
|
|||||||||
|
Slovakia
|
17,622
|
2,807
|
1,353
|
|||||||||
|
Germany
|
14,104
|
16,314
|
18,663
|
|||||||||
|
Switzerland
|
14,048
|
18,050
|
15,236
|
|||||||||
|
All other foreign countries
|
11,695
|
15,781
|
16,245
|
|||||||||
|
Consolidated net sales
|
$
|
500,153
|
$
|
567,080
|
$
|
487,076
|
||||||
|
|
||||||||||||
|
Net Sales by Major Product Line:
|
||||||||||||
|
|
||||||||||||
|
Power solutions and protection
|
$
|
172,176
|
$
|
214,766
|
$
|
159,867
|
||||||
|
Connectivity solutions
|
168,845
|
181,697
|
152,954
|
|||||||||
|
Magnetic solutions
|
159,132
|
170,617
|
174,255
|
|||||||||
|
Consolidated net sales
|
$
|
500,153
|
$
|
567,080
|
$
|
487,076
|
||||||
The following is a summary of long-lived assets by geographic area as of December 31, 2016 and 2015:
|
2016
|
2015
|
|||||||
|
Long-lived Assets by Geographic Location:
|
(Revised)
|
|||||||
|
United States
|
$
|
29,740
|
$
|
32,327
|
||||
|
People's Republic of China (PRC)
|
32,666
|
37,796
|
||||||
|
Slovakia
|
6,574
|
7,758
|
||||||
|
Switzerland
|
3,593
|
4,006
|
||||||
|
United Kingdom
|
1,419
|
2,016
|
||||||
|
All other foreign countries
|
1,117
|
1,232
|
||||||
|
Consolidated long-lived assets
|
$
|
75,109
|
$
|
85,135
|
||||
Long-lived assets consist of property, plant and equipment, net and other assets of the Company that are identified with the operations of each geographic area.
The territory of Hong Kong became a Special Administrative Region ("SAR") of the PRC in the middle of 1997. The territory of Macao became a SAR of the PRC at the end of 1999. Management cannot presently predict what future impact this will have on the Company, if any, or how the political climate in the PRC will affect the Company's contractual arrangements in the PRC. A significant portion of the Company's manufacturing operations and approximately 40% of its identifiable assets are located in Asia.
Net Sales to Major Customers
The Company had net sales to one customer in excess of ten percent of consolidated net sales in each of 2016, 2015 and 2014. The net sales associated with this customer was $59.8 million in 2016 (12.0% of sales), $74.8 million in 2015 (13.2% of sales) and $76.4 million in 2014 (15.7% of sales). Net sales related to this significant customer were primarily reflected in the Asia operating segment during each of the three years discussed.
13. RETIREMENT FUND AND PROFIT SHARING PLAN
The Company maintains the Bel Fuse Inc. Employees' Savings Plan, a defined contribution plan that is intended to meet the applicable requirements for tax-qualification under sections 401(a) and (k) of the Internal Revenue Code of 1986, as amended (the "Code"). The Employees' Savings Plan allows eligible employees to voluntarily contribute a percentage of their eligible compensation, subject to Code limitations, which contributions are matched by the Company. For plan years beginning on and after January 1, 2012, the Company's matching contributions are made in cash and are equal to 100% of the first 1% of compensation contributed by participants, and 50% of the next 5% of compensation contributed by participants. Prior to January 1, 2012, the Company's matching and profit sharing contributions were made in the form of shares of Bel Fuse Inc. Class A and Class B common stock. The expense for the years ended December 31, 2016, 2015 and 2014 amounted to $1.1 million, $1.2 million and $0.8 million, respectively. As of December 31, 2016, the plan owned 13,637 and 159,688 shares of Bel Fuse Inc. Class A and Class B common stock, respectively. Effective January 1, 2017, the Company's matching contribution will be made in the form of Bel Fuse Inc. Class A common stock.
The Company's subsidiaries in Asia have a retirement fund covering substantially all of their Hong Kong based full-time employees. Eligible employees contribute up to 5% of salary to the fund. In addition, the Company must contribute a minimum of 5% of eligible salary, as determined by Hong Kong government regulations. The Company currently contributes 7% of eligible salary in cash or Company stock. The expense for the years ended December 31, 2016, 2015 and 2014 amounted to approximately $0.3 million in each year. As of December 31, 2016, the plan owned 3,323 and 17,342 shares of Bel Fuse Inc. Class A and Class B common stock, respectively.
The Company maintains a SERP, which is designed to provide a limited group of key management and other key employees of the Company with supplemental retirement and death benefits. Participants in the SERP are selected by the Compensation Committee of the Board of Directors. The SERP initially became effective in 2002 and was amended and restated in April 2007 to conform with applicable requirements of Section 409A of the Internal Revenue Code and to modify the provisions regarding benefits payable in connection with a change in control of the Company. The Plan is unfunded. Benefits under the SERP are payable from the general assets of the Company, but the Company has established a rabbi trust which includes certain life insurance policies in effect on participants as well as other investments to partially cover the Company's obligations under the Plan. See Note 6, "Other Assets," for further information on these assets.
The benefits available under the Plan vary according to when and how the participant terminates employment with the Company. If a participant retires (with the prior written consent of the Company) on his normal retirement date (65 years old, 20 years of service, and 5 years of Plan participation), his normal retirement benefit under the Plan would be annual payments equal to 40% of his average base compensation (calculated using compensation from the highest five consecutive calendar years of Plan participation), payable in monthly installments for the remainder of his life. If a participant retires early from the Company (55 years old, 20 years of service, and five years of Plan participation), his early retirement benefit under the Plan would be an amount (i) calculated as if his early retirement date were in fact his normal retirement date, (ii) multiplied by a fraction, with the numerator being the actual years of service the participant has with the Company and the denominator being the years of service the participant would have had if he had retired at age 65, and (iii) actuarially reduced to reflect the early retirement date. If a participant dies prior to receiving 120 monthly payments under the Plan, his beneficiary would be entitled to continue receiving benefits for the shorter of (i) the time necessary to complete 120 monthly payments or (ii) 60 months. If a participant dies while employed by the Company, his beneficiary would receive, as a survivor benefit, an annual amount equal to (i) 100% of the participant's annual base salary at date of death for one year, and (ii) 50% of the participant's annual base salary at date of death for each of the following four years, each payable in monthly installments. The Plan also provides for disability benefits, and a forfeiture of benefits if a participant terminates employment for reasons other than those contemplated under the Plan. The expense related to the Plan for the years ended December 31, 2016, 2015 and 2014 amounted to $1.6 million, $1.5 million and $1.3 million, respectively.
Net Periodic Benefit Cost
The net periodic benefit cost related to the SERP consisted of the following components during the years ended December 31, 2016, 2015 and 2014:
|
2016
|
2015
|
2014
|
||||||||||
|
Service Cost
|
$
|
593
|
$
|
552
|
$
|
542
|
||||||
|
Interest Cost
|
659
|
567
|
541
|
|||||||||
|
Net amortization
|
391
|
366
|
182
|
|||||||||
|
Net periodic benefit cost
|
$
|
1,643
|
$
|
1,485
|
$
|
1,265
|
||||||
Obligations and Funded Status
Summarized information about the changes in plan assets and benefit obligation, the funded status and the amounts recorded at December 31, 2016 and 2015 are as follows:
Summarized information about the changes in plan assets and benefit obligation, the funded status and the amounts recorded at December 31, 2016 and 2015 are as follows:
|
|
2016
|
2015
|
||||||
|
Fair value of plan assets, January 1
|
$
|
-
|
$
|
-
|
||||
|
Company contributions
|
129
|
85
|
||||||
|
Benefits paid
|
(129
|
)
|
(85
|
)
|
||||
|
Fair value of plan assets, December 31
|
|
-
|
|
-
|
||||
|
Benefit obligation, January 1
|
15,576
|
14,205
|
||||||
|
Service cost
|
593
|
552
|
||||||
|
Interest cost
|
659
|
567
|
||||||
|
Benefits paid
|
(129
|
)
|
(85
|
)
|
||||
|
Plan amendments
|
487
|
-
|
||||||
|
Actuarial (gains) losses
|
(286
|
)
|
337
|
|||||
|
Benefit obligation, December 31
|
|
16,900
|
|
15,576
|
||||
|
Underfunded status, December 31
|
$
|
(16,900
|
)
|
$
|
(15,576
|
)
|
||
The Company has recorded the 2016 and 2015 underfunded status as a long-term liability on the consolidated balance sheets. The accumulated benefit obligation for the SERP was $13.8 million as of December 31, 2016 and $12.7 million as of December 31, 2015. The aforementioned company-owned life insurance policies and marketable securities held in a rabbi trust had a combined value of $12.7 million and $12.2 million at December 31, 2016 and 2015, respectively. See Note 6, "Other Assets," for additional information on these investments.
The estimated net loss and prior service cost for the defined benefit pension plan that will be amortized from accumulated other comprehensive loss into net periodic benefit cost over the next fiscal year is $0.4 million. The Company expects to make contributions of $0.1 million to the SERP in 2017. The Company had no net transition assets or obligations recognized as an adjustment to other comprehensive income and does not anticipate any plan assets being returned to the Company during 2017, as the plan has no assets.
The following benefit payments, which reflect expected future service, are expected to be paid:
|
Years Ending
|
||||
|
December 31,
|
||||
|
2017
|
$
|
129
|
||
|
2018
|
288
|
|||
|
2019
|
543
|
|||
|
2020
|
658
|
|||
|
2021
|
658
|
|||
|
2022 - 2026
|
5,160
|
|||
The following gross amounts are recognized net of tax in accumulated other comprehensive loss:
|
2016
|
2015
|
|||||||
|
Prior service cost
|
$
|
1,172
|
$
|
866
|
||||
|
Net loss
|
2,970
|
3,465
|
||||||
|
$
|
4,142
|
$
|
4,331
|
|||||
Actuarial Assumptions
The weighted average assumptions used in determining the periodic net cost and benefit obligation information related to the SERP are as follows:
|
|
2016
|
|
2015
|
|
2014
|
|
Net periodic benefit cost
|
|
|
|
|
|
|
Discount rate
|
4.25%
|
4.00%
|
5.00%
|
||
|
Rate of compensation increase
|
3.00%
|
3.00%
|
3.00%
|
||
|
Benefit obligation
|
|
|
|
|
|
|
Discount rate
|
4.00%
|
4.25%
|
4.00%
|
||
|
Rate of compensation increase
|
3.00%
|
|
3.00%
|
|
3.00%
|
14. SHARE-BASED COMPENSATION
The Company has an equity compensation program (the "Program") which provides for the granting of "Incentive Stock Options" within the meaning of Section 422 of the Internal Revenue Code of 1986, as amended, non-qualified stock options and restricted stock awards. The Company believes that such awards better align the interest of its employees with those of its shareholders. The 2011 Equity Compensation Plan provides for the issuance of 1.4 million shares of the Company's Class B common stock. At December 31, 2016, 599,800 shares remained available for future issuance under the 2011 Equity Compensation Plan.
The Company records compensation expense in its consolidated statements of operations related to employee stock-based options and awards. The aggregate pretax compensation cost recognized for stock-based compensation amounted to approximately $2.8 million, $2.8 million and $2.7 million for 2016, 2015 and 2014, respectively, and related solely to restricted stock awards. The Company did not use any cash to settle any equity instruments granted under share-based arrangements during 2016, 2015 and 2014. At December 31, 2016 and 2015, the only instruments issued and outstanding under the Program related to restricted stock awards.
Restricted Stock Awards
The Company provides common stock awards to certain officers and key employees. The Company grants these awards, at its discretion, from the shares available under the Program. Unless otherwise provided at the date of grant or unless subsequently accelerated, the shares awarded are typically earned in 25% increments on the second, third, fourth and fifth anniversaries of the award and are distributed provided the employee has remained employed by the Company through such anniversary dates; otherwise the unearned shares are forfeited. The market value of these shares at the date of award is recorded as compensation expense on the straight-line method over the five-year periods from the respective award dates, as adjusted for forfeitures of unvested awards. During 2016, 2015 and 2014, the Company issued 180,000 shares, 84,000 shares and 378,000 shares of the Company's Class B common stock, respectively, under a restricted stock plan to various officers and employees.
A summary of the restricted stock activity under the Program as of December 31, 2016 is presented below:
|
Weighted Average
|
|||||||||
|
Restricted Stock
|
Weighted Average
|
Remaining
|
|||||||
|
Awards
|
Shares
|
Award Price
|
Contractual Term
|
||||||
|
Outstanding at January 1, 2016
|
564,025
|
$
|
22.00
|
3.2 years
|
|||||
|
Granted
|
180,000
|
23.30
|
|||||||
|
Vested
|
(155,100
|
)
|
20.99
|
||||||
|
Forfeited
|
(30,325
|
)
|
23.06
|
||||||
|
Outstanding at December 31, 2016
|
558,600
|
$
|
22.64
|
3.1 years
|
|||||
As of December 31, 2016, there was $8.7 million of total pretax unrecognized compensation cost included within additional paid-in capital related to non-vested stock based compensation arrangements granted under the restricted stock award plan. That cost is expected to be recognized over a period of 4.9 years. This expense is recorded in cost of sales and SG&A expense based upon the employment classification of the award recipients.
The Company's policy is to issue new shares to satisfy restricted stock awards. Currently the Company believes that substantially all restricted stock awards will vest.
15. COMMON STOCK
As of December 31, 2016, according to regulatory filings, there was one shareholder of the Company's common stock (other than shareholders subject to specific exceptions) with ownership in excess of 10% of Class A outstanding shares with no ownership of the Company's Class B common stock. In accordance with the Company's certificate of incorporation, the Class B Protection clause is triggered if a shareholder owns 10% or more of the outstanding Class A common stock and does not own an equal or greater percentage of all then outstanding shares of both Class A and Class B common stock (all of which common stock must have been acquired after the date of the 1998 recapitalization). In such a circumstance, such shareholder must, within 90 days of the trigger date, purchase Class B common shares, in an amount and at a price determined in accordance with a formula described in the Company's certificate of incorporation, or forfeit its right to vote its Class A common shares. As of December 31, 2016, to the Company's knowledge, this shareholder had not purchased any Class B shares to comply with these requirements. In order to vote its shares at Bel's next shareholders' meeting, this shareholder must either purchase the required number of Class B common shares or sell or otherwise transfer Class A common shares until its Class A holdings are under 10%. As of December 31, 2016, to the Company's knowledge, this shareholder owned 23.15% of the Company's Class A common stock in the aggregate and had not taken steps to either purchase the required number of Class B common shares or sell or otherwise transfer Class A common shares until its Class A holdings fall below 10%. Unless and until this situation is satisfied in a manner permitted by the Company's Restated Certificate of Incorporation, the subject shareholder will not be permitted to vote its shares of common stock.
Throughout 2016, 2015 and 2014, the Company declared cash dividends on a quarterly basis at a rate of $0.06 per Class A share of common stock and $0.07 per Class B share of common stock. The Company declared and paid cash dividends totaling $3.2 million in each of 2016, 2015 and 2014. There are no contractual restrictions on the Company's ability to pay dividends, provided that the Company is not in default under its credit agreements immediately before such payment and after giving effect to such payment.
16. COMMITMENTS AND CONTINGENCIES
Leases
The Company leases various facilities under operating leases expiring through December 2023. Some of these leases require the Company to pay certain executory costs (such as insurance and maintenance).
Future minimum lease payments for operating leases are approximately as follows:
|
Year Ending
|
||||
|
December 31,
|
||||
|
|
||||
|
2017
|
$
|
6,491
|
||
|
2018
|
3,590
|
|||
|
2019
|
2,813
|
|||
|
2020
|
2,597
|
|||
|
2021
|
2,108
|
|||
|
Thereafter
|
1,171
|
|||
|
|
$
|
18,770
|
||
Rental expense for all leases was approximately $7.9 million, $8.8 million and $7.5 million for the years ended December 31, 2016, 2015 and 2014, respectively.
Other Commitments
The Company submits purchase orders for raw materials to various vendors throughout the year for current production requirements, as well as forecasted requirements. Certain of these purchase orders relate to special purpose material and, as such, the Company may incur penalties if an order is cancelled. The Company had outstanding purchase orders related to raw materials in the amount of $31.0 million and $42.6 million at December 31, 2016 and December 31, 2015, respectively. The Company also had outstanding purchase orders related to capital expenditures in the amount of $2.8 million and $1.5 million at December 31, 2016 and December 31, 2015, respectively.
Legal Proceedings
The Company was a defendant in a lawsuit captioned SynQor, Inc. v. Artesyn Technologies, Inc., et al. brought in the United States District Court for the Eastern District of Texas in September 2011. This was a patent infringement action for damages in the form of lost profits and reasonable royalties for the period beginning January 24, 2011 (the post-verdict period of a related case). SynQor, Inc. also sought enhanced damages. The Company had an indemnification agreement in place with one of its customers specifically covering post-verdict damages related to this case. This case went to trial on July 30, 2013. In April 2014, a final judgment was rendered in this case, whereby the Company was assessed an additional $0.7 million in post-verdict damages. This amount was paid by the Company in July 2014 and was subsequently reimbursed by one of its customers under the terms of the indemnification agreement referenced above. SynQor filed an appeal of the final judgment in May 2014. The appeals court heard oral arguments from the parties on this matter on March 2, 2015. The matter was settled as to all further damages and claims relating to the appeal in early 2016 with no further payment required from the Company.
The Company is a plaintiff in a lawsuit captioned Bel Fuse Inc. et al. v. Molex Inc. brought in the United District Court of New Jersey in April 2013. The Company claims that Molex infringed three of the Company's patents related to integrated magnetic connector products. Molex filed a motion to dismiss the complaint on August 6, 2013. The Company filed an amended complaint and response on August 20, 2013. Molex withdrew its original Motion to Dismiss and filed a second, revised Motion to Dismiss on September 6, 2013. The Company filed its response on October 7, 2013. The Court denied Molex's revised Motion to Dismiss on June 16, 2014. In June 2014, Molex initiated an Inter Partes Review (IPR) at the U.S. Patent and Trademark Office for one of the three patents associated with this case. The Company and Molex executed an agreement in September 2014 to terminate the IPR and to withdraw one of the patents from the district court litigation. The Parties settled the case involving the two remaining patents for $0.5 million in September 2015 and the case was subsequently dismissed by the Court in October 2015. The Company recognized the settlement amount in net sales on the consolidated statements of operations.
In connection with the acquisition of Power Solutions, there is an ongoing claim by the Arezzo Revenue Agency in Italy concerning certain tax matters related to what was then Power-One Asia Pacific Electronics Shenzhen Co. Ltd. (now Bel Power Solutions Asia Pacific Electronics Shenzhen Co. Ltd, or "BPS China") for the years 2004 to 2006. In September 2012, the Tax Court of Arezzo ruled in favor of BPS China and cancelled the claim. In February 2013, the Arezzo Revenue Agency filed an appeal of the Tax Court's ruling. The hearing of the appeal was held on October 2, 2014. On October 13, 2014, BPS China was informed of the Regional Tax Commission of Florence ruling which was in favor of the Arezzo Revenue Agency and against BPS China. An appeal was filed on July 18, 2015 before the Regional Tax Commission of Florence and rejected. On December 5, 2016, the Arezzo Revenue Agency filed an appeal with the Supreme Court and BPS China filed a counter-appeal on January 4, 2017. The Supreme Court has yet to render its judgment. The estimated liability related to this matter is approximately $12.0 million and has been included as a liability for uncertain tax positions on the accompanying consolidated balance sheets. As Bel is fully indemnified in this matter per the terms of the stock purchase agreement with ABB, a corresponding other asset for indemnification is also included in other assets on the accompanying consolidated balance sheets at December 31, 2016 and December 31, 2015.
In 2015, the Company was provided notice of a potential patent infringement claim by Setec Netzwerke AG ("Setec"), a German company, for the alleged infringement of their patent EP 306 934 B1. Setec subsequently filed a lawsuit against the Company and three of its subsidiaries in Dusseldorf, Germany on January 29, 2016 for patent infringement. The Company filed its defense to Setec's complaint and a nullity lawsuit against Setec's patent on August 31, 2016. The Court hearing on infringement is currently scheduled for March 23, 2017. The Company does not have enough information at this time in order to make any further conclusions or assessments as to infringement or potential damages.
The Company is not a party to any other legal proceeding, the adverse outcome of which is likely to have a material adverse effect on the Company's consolidated financial condition or results of operations.
17. ACCUMULATED OTHER COMPREHENSIVE LOSS
The components of accumulated other comprehensive loss as of December 31, 2016, 2015 and 2014 are summarized below:
|
2016
|
2015
|
2014
|
||||||||||
|
Foreign currency translation adjustment
|
$
|
(28,976
|
)
|
$
|
(19,305
|
)
|
$
|
(9,351
|
)
|
|||
|
Unrealized holding gain on available-for-sale
|
||||||||||||
|
securities, net of taxes of $263, $265 and $259 as of
|
||||||||||||
|
December 31, 2016, 2015 and 2014
|
424
|
434
|
429
|
|||||||||
|
Unfunded SERP liability, net of taxes of ($1,398), ($1,327)
|
||||||||||||
|
and ($1,325) as of December 31, 2016, 2015 and 2014
|
(2,745
|
)
|
(3,005
|
)
|
(3,026
|
)
|
||||||
|
Accumulated other comprehensive loss
|
$
|
(31,297
|
)
|
$
|
(21,876
|
)
|
$
|
(11,948
|
)
|
|||
Changes in accumulated other comprehensive (loss) income by component during the years ended December 31, 2016 and 2015 are as follows. All amounts are net of tax.
|
|
Unrealized Holding
|
|
|||||||||||||||
|
|
Foreign Currency
|
Gains on
|
|
||||||||||||||
|
|
Translation
|
Available-for-
|
Unfunded
|
|
|||||||||||||
|
|
Adjustment
|
Sale Securities
|
SERP Liability
|
|
Total
|
||||||||||||
|
|
|
||||||||||||||||
|
Balance at January 1, 2015
|
$
|
(9,351
|
)
|
$
|
429
|
$
|
(3,026
|
)
|
|
$
|
(11,948
|
)
|
|||||
|
Other comprehensive income (loss) before reclassifications
|
(9,954
|
)
|
5
|
(233
|
)
|
|
(10,182
|
)
|
|||||||||
|
Amounts reclassified from accumulated other
|
|
||||||||||||||||
|
comprehensive income (loss)
|
-
|
-
|
254
|
(a)
|
254
|
||||||||||||
|
Net current period other comprehensive income (loss)
|
(9,954
|
)
|
5
|
21
|
|
(9,928
|
)
|
||||||||||
|
|
|
||||||||||||||||
|
Balance at December 31, 2015
|
(19,305
|
)
|
434
|
(3,005
|
)
|
|
(21,876
|
)
|
|||||||||
|
|
|
||||||||||||||||
|
Other comprehensive income (loss) before reclassifications
|
(9,671
|
)
|
(10
|
)
|
5
|
|
(9,676
|
)
|
|||||||||
|
Amounts reclassified from accumulated other
|
|
||||||||||||||||
|
comprehensive income (loss)
|
-
|
- |
255
|
(a)
|
255
|
||||||||||||
|
Net current period other comprehensive income (loss)
|
(9,671
|
)
|
(10
|
)
|
260
|
|
(9,421
|
)
|
|||||||||
|
|
|
||||||||||||||||
|
Balance at December 31, 2016
|
$
|
(28,976
|
)
|
$
|
424
|
$
|
(2,745
|
)
|
|
$
|
(31,297
|
)
|
|||||
|
(a)
|
This reclassification relates to the amortization of prior service costs and gains/losses associated with the Company's SERP plan. This expense is allocated between cost of sales and selling, general and administrative expense based upon the employment classification of the plan participants.
|
18. RELATED PARTY TRANSACTIONS
The Company maintains minority ownership in a joint venture in the PRC. See Note 2, "Acquisitions and Disposition." The joint venture may purchase raw components and other goods from the Company and may sell finished goods to the Company as well as to other third parties. The Company purchased $1.5 million and $4.3 million of inventory from the joint venture during the year ended December 31, 2015 and during the period from its acquisition date of June 19, 2014 through December 31, 2014, respectively. The Company did not purchase any inventory from the joint venture during 2016. At December 31, 2016, the Company owed the joint venture approximately $0.5 million, which is included in accounts payable on the accompanying consolidated balance sheet.
19. SELECTED QUARTERLY DATA (UNAUDITED)
Quarterly results for the year ended December 31, 2016 and 2015 are summarized as follows:
|
2016
|
||||||||||||||||
|
First
|
Second
|
Third
|
Fourth
|
|||||||||||||
|
Quarter
|
Quarter
|
Quarter
|
Quarter
|
|||||||||||||
|
Net sales
|
$
|
121,182
|
$
|
131,622
|
$
|
128,809
|
$
|
118,539
|
||||||||
|
Gross profit
|
23,074
|
25,692
|
26,575
|
24,579
|
||||||||||||
|
Net (loss) earnings
|
(100,696
|
)(a)
|
22,776
|
(a) |
9,710
|
3,377
|
||||||||||
|
Net (loss) earnings per share:
|
||||||||||||||||
|
Class A common share - basic and diluted
|
$
|
(8.15
|
)
|
$
|
1.83
|
$
|
0.78
|
$
|
0.27
|
|||||||
|
Class B common share - basic and diluted
|
$
|
(8.55
|
)
|
$
|
1.93
|
$
|
0.82
|
$
|
0.29
|
|||||||
|
2015
|
||||||||||||||||
|
First
|
Second
|
Third
|
Fourth
|
|||||||||||||
|
Quarter(b)
|
Quarter
|
Quarter
|
Quarter
|
|||||||||||||
|
Net sales
|
$
|
142,015
|
$
|
145,658
|
$
|
144,161
|
$
|
135,246
|
||||||||
|
Gross profit
|
26,813
|
(b) |
28,560
|
27,412
|
26,043
|
|||||||||||
|
Net earnings
|
5,320
|
(b) |
6,062
|
4,920
|
2,895
|
|||||||||||
|
Earnings per share:
|
||||||||||||||||
|
Class A common share - basic and diluted
|
$
|
0.43
|
(b) |
$
|
0.49
|
$
|
0.39
|
$
|
0.23
|
|||||||
|
Class B common share - basic and diluted
|
$
|
0.45
|
(b) |
$
|
0.52
|
$
|
0.42
|
$
|
0.25
|
|||||||
|
(a)
|
In connection with an interim impairment test related to the Company's goodwill and other intangible assets, provisional non-cash impairment charges totaling $104.3 million were recorded during the first quarter of 2016. During the second quarter of 2016, the Company finalized its interim impairment test, which resulted in a $2.6 million reduction to the provisional impairment charge recorded during the first quarter.
|
|
(b)
|
Revised from 10-Q disclosures to reflect immaterial measurement period adjustments related to the 2014 Acquisitions. First quarter 10-Q reflected gross profit of $27.1 million, net earnings of $5.6 million, earnings per Class A common share of $0.45 per share and earnings per Class B common share of $0.48 per share.
|
|
BEL FUSE INC. AND SUBSIDIARIES
|
||||||||||||||||||||
|
SCHEDULE II - VALUATION AND QUALIFYING ACCOUNTS
|
||||||||||||||||||||
|
(Amounts in thousands)
|
||||||||||||||||||||
|
|
||||||||||||||||||||
|
Column A
|
Column B
|
Column C
|
Column D
|
Column E
|
||||||||||||||||
|
|
||||||||||||||||||||
|
|
Additions
|
|||||||||||||||||||
|
|
Balance at
|
(1)
|
|
(2)
|
|
Balance
|
||||||||||||||
|
|
beginning
|
Charged to costs
|
Charged to other
|
Deductions
|
at end
|
|||||||||||||||
|
Description
|
of period
|
and expenses
|
accounts (b)
|
(a)
|
of period
|
|||||||||||||||
|
Year ended December 31, 2016:
|
||||||||||||||||||||
|
Allowance for doubtful accounts
|
$
|
1,747
|
$
|
(163
|
)
|
$
|
281
|
$
|
(84
|
)
|
$
|
1,781
|
||||||||
|
Allowance for excess and obsolete inventory
|
$
|
5,268
|
$
|
3,513
|
$
|
185
|
$
|
(2,703
|
)
|
$
|
6,263
|
|||||||||
|
Deferred tax assets - valuation allowances
|
$
|
6,635
|
$
|
887
|
$
|
-
|
$
|
(37
|
)
|
$
|
7,485
|
|||||||||
|
|
||||||||||||||||||||
|
Year ended December 31, 2015:
|
||||||||||||||||||||
|
Allowance for doubtful accounts
|
$
|
1,989
|
$
|
295
|
$
|
303
|
$
|
(840
|
)
|
$
|
1,747
|
|||||||||
|
Allowance for excess and obsolete inventory
|
$
|
6,809
|
$
|
2,186
|
$
|
(59
|
)
|
$
|
(3,668
|
)
|
$
|
5,268
|
||||||||
|
Deferred tax assets - valuation allowances
|
$
|
6,692
|
$
|
456
|
$
|
-
|
$
|
(513
|
)
|
$
|
6,635
|
|||||||||
|
|
||||||||||||||||||||
|
Year ended December 31, 2014:
|
||||||||||||||||||||
|
Allowance for doubtful accounts
|
$
|
941
|
$
|
1,434
|
$
|
-
|
$
|
(386
|
)
|
$
|
1,989
|
|||||||||
|
Allowance for excess and obsolete inventory
|
$
|
3,941
|
$
|
4,438
|
$
|
(1
|
)
|
$
|
(1,569
|
)
|
$
|
6,809
|
||||||||
|
Deferred tax assets - valuation allowances
|
$
|
1,955
|
$
|
4,766
|
$
|
-
|
$
|
(29
|
)
|
$
|
6,692
|
|||||||||
|
|
||||||||||||||||||||
|
(a) Write-offs
|
||||||||||||||||||||
|
|
||||||||||||||||||||
|
(b) Includes foreign currency translation adjustments
|
||||||||||||||||||||
None.
Evaluation of Disclosure Controls and Procedures
During the fourth quarter of 2016, the Company's management, including the principal executive officer and principal financial officer, supervised and participated in the evaluation of the Company's disclosure controls and procedures (as defined in Rules 13a-15(e) and 15d-15(e) under the Securities Exchange Act of 1934) related to the recording, processing, summarization, and reporting of information in the Company's periodic reports that the Company files with the SEC. These disclosure controls and procedures have been designed to ensure that material information relating to the Company, including its subsidiaries, is made known to the Company's management, including these officers, by other of the Company's employees, and that this information is recorded, processed, summarized, evaluated, and reported, as applicable, within the time periods specified in the SEC's rules and forms.
In designing and evaluating the disclosure controls and procedures, the Company recognizes that any controls and procedures, no matter how well designed and operated, provide only reasonable, not absolute, assurance that the above objectives have been met. Notwithstanding these limitations, the Company believes that its disclosure controls and procedures are designed and are operating to provide reasonable assurances of achieving their objectives.
Based on their evaluation as of December 31, 2016, the Company's principal executive officer and principal financial officer have concluded that the Company's disclosure controls and procedures (as defined in Rules 13a-15(e) and 15d-15(e) under the Securities Exchange Act of 1934) are effective to ensure that the information required to be disclosed by the Company in the reports that the Company files or submits under the Securities Exchange Act of 1934 is recorded, processed, summarized and reported within the time periods specified in SEC rules and forms.
Management's Annual Report on Internal Control Over Financial Reporting
The Company's management is responsible for establishing and maintaining adequate internal control over financial reporting, as such term is defined in Exchange Act Rule 13a-15(f). Under the supervision and with the participation of the Company's management, including the Company's principal executive officer and principal financial officer, the Company conducted an evaluation of the effectiveness of the Company's internal control over financial reporting based on the framework in Internal Control – Integrated Framework (2013) issued by the Committee of Sponsoring Organizations of the Treadway Commission.
Based on the Company's evaluation under the framework in Internal Control – Integrated Framework (2013), the Company's management concluded that the Company's internal control over financial reporting was effective as of December 31, 2016.
The Company's independent registered public accounting firm, Deloitte & Touche LLP, has audited the effectiveness of the Company's internal control over financial reporting as of December 31, 2016 and has expressed an unqualified opinion on the effectiveness of our internal control over financial reporting as of December 31, 2016 in their report which is included in Item 8 herein.
Changes in Internal Controls Over Financial Reporting
There has not been any change in our internal control over financial reporting during the three months ended December 31, 2016 that has materially affected, or is reasonably likely to materially affect, our internal control over financial reporting.
None.
The Registrant incorporates by reference herein information to be set forth in its definitive proxy statement for its 2017 annual meeting of shareholders that is responsive to the information required with respect to this item.
The Registrant has adopted a code of ethics for all of its associates, including directors, executive officers and all other senior financial personnel. The code of ethics, as amended from time to time, is available on the Registrant's website under Corporate Governance. The Registrant will also make copies of its code of ethics available to investors upon request. Any such request should be sent by mail to Bel Fuse Inc., 206 Van Vorst Street, Jersey City, NJ 07302 Attn: Craig Brosious or should be made by telephone by calling Craig Brosious at 201-432-0463.
The Registrant incorporates by reference herein information to be set forth in its definitive proxy statement for its 2017 annual meeting of shareholders that is responsive to the information required with respect to this Item.
Item 12. Security Ownership of Certain Beneficial Owners and Management and Related Stockholder Matters
The Registrant incorporates by reference herein information to be set forth in its definitive proxy statement for its 2017 annual meeting of shareholders that is responsive to the remaining information required with respect to this Item.
The table below depicts the securities authorized for issuance under the Company's equity compensation plans.
Equity Compensation Plan Information
|
Plan Category
|
Number of Securities to be Issued Upon Exercise of Outstanding Options, Warrants and Rights
(a)
|
Weighted Average Exercise Price of Outstanding Options, Warrants and Rights
(b)
|
Number of Securities Remaining Available for Future Issuance Under Equity Compensation Plans (Excluding Securities Reflected in Column (a))
(c)
|
|||||||||
|
Equity compensation plans approved by security holders:
|
||||||||||||
|
2011 Equity Compensation Plan
|
-
|
$
|
-
|
599,800
|
||||||||
|
Equity compensation plans not approved by security holders
|
-
|
-
|
-
|
|||||||||
|
Totals
|
-
|
$
|
-
|
599,800
|
||||||||
The Registrant incorporates by reference herein information to be set forth in its definitive proxy statement for its 2017 annual meeting of shareholders that is responsive to the information required with respect to this Item.
The Registrant incorporates by reference herein information to be set forth in its definitive proxy statement for its 2017 annual meeting of shareholders that is responsive to the information required with respect to this Item.
PART IV
|
Exhibits, Financial Statement Schedules
(a) Documents filed as a part of this Annual Report on Form 10-K:
(1) Financial Statements
See Index to Consolidated Financial Statements and Schedule of this Form 10-K.
(2) Financial Statement Schedule
See Schedule II — Valuation and Qualifying Accounts — Years Ended December 31, 2016, 2015 and 2014 of this Annual Report on Form 10-K.
(3) Exhibits
|
|||
|
Exhibit No.:
|
|||
|
3.1
|
Restated Certificate of Incorporation, as amended, is incorporated by reference to (i) Restated Certificate of Incorporation filed as Exhibit 3.1 of the Company's Quarterly Report on Form 10-Q for the quarterly period ended June 30, 1998 and (ii) Certificate of Amendment to the Company's Restated Certificate of Incorporation filed as Exhibit 3.1 of the Company's Annual Report on Form 10-K for the fiscal year ended December 31, 1999.
|
||
|
3.2
|
By-laws, as amended and restated on May 13, 2014, are incorporated by reference to Exhibit 3.1 of the Company's Quarterly Report on Form 10-Q for the six months ended June 30, 2014.
|
||
|
10.1†
|
2002 Equity Compensation Program. Incorporated by reference to the Registrant's proxy statement for its 2002 annual meeting of shareholders.
|
||
|
10.2
|
Credit and Guaranty Agreement, dated as of February 12, 2007, by and among Bel Fuse Inc., as Borrower, the Subsidiary Guarantors party thereto and the Bank of America, N.A., as Lender. Filed as Exhibit 10.1 to the Company's Current Report on Form 8-K filed on February 16, 2007 and incorporated herein by reference.
|
||
|
10.3†
|
Amended and Restated Bel Fuse Supplemental Executive Retirement Plan, dated as of April 17, 2007. Filed as Exhibit 10.1 to the Company's Current Report on Form 8-K filed on April 23, 2007 and incorporated herein by reference.
|
||
|
10.4
|
Stock and Asset Purchase Agreement between Bel Fuse Inc. and Tyco Electronics Corporation, dated as of November 28, 2012. Filed as Exhibit 2.1 to the Company's Current Report on Form 8-K filed on December 4, 2012 and incorporated herein by reference.
|
||
|
10.5†
|
2011 Equity Compensation Program. Incorporated by reference to the Registrant's proxy statement for its 2011 annual meeting of shareholders.
|
||
|
10.6
|
Stock Purchase Agreement dated as of April 24, 2014, by and among Bel Fuse Inc., Power-One, Inc. and PWO Holdings B.V. Filed as Exhibit 2.1 to the Company's Quarterly Report on Form 10-Q for the three months ended March 31, 2014 and incorporated herein by reference.
|
||
|
10.7
|
Stock Purchase Agreement dated as of May 16, 2014, by and among Bel Fuse Inc. and Emerson Electric Co. Filed as Exhibit 2.1 to the Company's Current Report on Form 8-K filed on May 22, 2014 and incorporated herein by reference.
|
||
|
10.8
|
Credit and Security Agreement dated June 19, 2014, as amended and restated as of June 30, 2014, by and among Bel Fuse Inc., as Borrower, and KeyBank National Association, as Administrative Agent, Swing Line Lender and Issuing Lender, and the other lenders identified therein. Filed as Exhibit 10.1 to the Company's Current Report on Form 8-K filed on July 7, 2014 and incorporated herein by reference.
|
||
|
10.9
|
Second Amendment, dated as of March 21, 2016, to the Credit and Security Agreement dated June 19, 2014, as amended and restated as of June 30, 2014, by and among Bel Fuse Inc., as Borrower, and KeyBank National Association, as Administrative Agent, Swing Line Lender and Issuing Lender, and the other lenders identified therein. Filed as Exhibit 10.1 to the Company's Current Report on Form 8-K filed on March 22, 2016 and incorporated herein by reference.
|
||
|
11.1
|
A statement regarding the computation of earnings per share is omitted because such computation can be clearly determined from the material contained in this Annual Report on Form 10-K.
|
||
|
12.1*
|
Computation of Ratio of Earnings to Fixed Charges.
|
||
|
21.1*
|
Subsidiaries of the Registrant.
|
||
|
23.1*
|
Consent of Independent Registered Public Accounting Firm.
|
||
|
24.1*
|
Power of attorney (included on the signature page)
|
||
|
31.1*
|
Certification of the Chief Executive Officer pursuant to Section 302 of the Sarbanes-Oxley Act of 2002
|
||
|
31.2*
|
Certification of the Vice President of Finance pursuant to Section 302 of the Sarbanes-Oxley Act of 2002.
|
||
|
32.1**
|
Certification of the Chief Executive Officer pursuant to Section 906 of the Sarbanes - Oxley Act of 2002.
|
||
|
32.2**
|
Certification of the Vice-President of Finance pursuant to Section 906 of the Sarbanes-Oxley Act of 2002.
|
||
|
101.INS*
|
XBRL Instance Document
|
||
|
101.SCH*
|
XBRL Taxonomy Extension Schema Document
|
||
|
101.CAL*
|
XBRL Taxonomy Extension Calculation Linkbase Document
|
||
|
101.DEF*
|
XBRL Taxonomy Extension Definition Linkbase Document
|
||
|
101.LAB*
|
XBRL Taxonomy Extension Label Linkbase Document
|
||
|
101.PRE*
|
XBRL Taxonomy Extension Presentation Linkbase Document
|
* Filed herewith.
** Submitted herewith.
† Management contract or compensatory plan or arrangement.
None.
Pursuant to the requirements of Section 13 or 15(d) of the Securities Exchange Act of 1934, the registrant has duly caused this report to be signed on its behalf by the undersigned, thereunto duly authorized.
BEL FUSE INC.
(Registrant)
|
By:
|
/s/ Daniel Bernstein
|
|
Daniel Bernstein
|
|
|
President and Chief Executive Officer
|
|
|
Dated: March 10, 2017
|
KNOW ALL MEN BY THESE PRESENTS, that each person whose signature appears below constitutes and appoints Daniel Bernstein and Colin Dunn as his/her attorney-in-fact and agent, with full power of substitution and resubstitution, for him/her and in his/her name, place, and stead, in any and all capacities, to sign and file any and all amendments to this Annual Report on Form 10-K, with all exhibits thereto and hereto, and other documents with the Securities and Exchange Commission, granting unto said attorney-in-fact and agent, and each of them, full power and authority to do and perform each and every act and thing requisite or necessary to be done in and about the premises, as fully to all intents and purposes as he/she might or could do in person, hereby ratifying and confirming all that said attorneys-in-fact and agents, or any of them, or their or his substitutes, may lawfully do or cause to be done by virtue hereof.
Pursuant to the requirements of the Securities Exchange Act of 1934, this report has been signed below by the following persons on behalf of the registrant and in the capacities and on the dates indicated.
|
Signature
|
Title
|
Date
|
||
|
/s/ Daniel Bernstein
|
President, Chief Executive Officer
|
March 10, 2017
|
||
|
Daniel Bernstein
|
and Director
|
|||
|
/s/ Robert H. Simandl
|
Director
|
March 10, 2017
|
||
|
Robert H. Simandl
|
||||
|
/s/ Peter Gilbert
|
Director
|
March 10, 2017
|
||
|
Peter Gilbert
|
||||
|
/s/ John Tweedy
|
Director
|
March 10, 2017
|
||
|
John Tweedy
|
||||
|
/s/ Avi Eden
|
Director
|
March 10, 2017
|
||
|
Avi Eden
|
||||
|
/s/ Mark Segall
|
Director
|
March 10, 2017
|
||
|
Mark Segall
|
||||
|
/s/ Norman Yeung
|
Director
|
March 10, 2017
|
||
|
Norman Yeung
|
|
/s/ Eric Nowling
|
Director
|
March 10, 2017
|
||
|
Eric Nowling
|
||||
|
/s/ Vincent Vellucci
|
Director
|
March 10, 2017
|
||
|
Vincent Vellucci
|
||||
|
/s/ Colin Dunn
|
Vice President of Finance and Secretary
|
March 10, 2017
|
||
|
Colin Dunn
|
(Principal Financial Officer and Principal
|
|||
|
Accounting Officer)
|
77