Attached files
| file | filename |
|---|---|
| EX-32.2 - EXHIBIT 32.2 - MRV COMMUNICATIONS INC | mrv-ex322x2016.htm |
| EX-32.1 - EXHIBIT 32.1 - MRV COMMUNICATIONS INC | mrv-exx321x2016.htm |
| EX-31.2 - EXHIBIT 31.2 - MRV COMMUNICATIONS INC | mrv-exx312x2016.htm |
| EX-31.1 - EXHIBIT 31.1 - MRV COMMUNICATIONS INC | mrv-exx311x2016.htm |
| EX-23.1 - EXHIBIT 23.1 - MRV COMMUNICATIONS INC | mrv-ex231x2016.htm |
| EX-21.1 - EXHIBIT 21.1 - MRV COMMUNICATIONS INC | mrv-ex211x2016.htm |
UNITED STATES
SECURITIES AND EXCHANGE COMMISSION
Washington, D.C. 20549
_______________________
FORM 10-K
_______________________
(Mark One) | |
x | Annual Report Pursuant to Section 13 or 15(d) of the Securities Exchange Act of 1934 |
For the fiscal year ended December 31, 2016 | |
OR | |
o | Transition Report Pursuant to Section 13 or 15(d) of the Securities Exchange Act of 1934 |
For the transition period from _____________ t o _____________ | |
Commission file number: 001-11174 |
 |
MRV COMMUNICATIONS, INC.
(Exact name of registrant as specified in its charter)
Delaware | 06-1340090 |
(State or other jurisdiction of | (I.R.S. employer |
incorporation or organization) | identification no.) |
20520 Nordhoff Street, Chatsworth, CA 91311
(Address of principal executive offices, zip code)
(818) 773-0900
(Registrant's telephone number, including area code)
Securities registered pursuant to Section 12(b) of the Exchange Act: None
Securities registered pursuant to Section 12(g) of the Exchange Act:
Title of Each Class | Name of Each Exchange on Which Registered: |
Common Stock, $0.0017 Par Value Per Share | Nasdaq Capital Market |
Series A Junior Participating Preferred Stock Purchase Rights | |
Indicate by check mark whether the Registrant is a well-known seasoned issuer, as defined by Rule 405 of the Securities Act. Yes o No x
Indicate by check mark whether the Registrant is not required to file reports pursuant to Section 13 or Section 15(d) of the Act of 1934. Yes o No x
Indicate by check mark, whether the Registrant (1) has filed all reports required to be filed by Section 13 or 15(d) of the Securities Exchange Act of 1934 during the preceding 12 months (or for such shorter period that the Registrant was required to file such reports), and (2) has been subject to such filing requirements for the past 90 days. Yes x No o
Indicate by check mark, whether the Registrant has submitted electronically and posted on its corporate website, if any, every Interactive Data File required to be submitted and posted pursuant to Rule 405 of Regulation S-T (§232.405 of this chapter) during the preceding 12 months (or for such shorter period that the Registrant was required to submit and post such files.) Yes x No o
Indicate by check mark if disclosure of delinquent filers pursuant to Item 405 of Regulation S-K (§232.405) is not contained herein, and will not be contained to the best of registrant's knowledge, in definitive proxy or information statements incorporated by reference in Part III of this Form 10-K or any amendment to this Form 10-K. x
Indicate by check mark whether the Registrant is a large accelerated filer, an accelerated filer, a non-accelerated filer, or a smaller reporting company. See the definitions of "large accelerated filer," "accelerated filer" and "smaller reporting company" in Rule 12b-2 of the Exchange Act. (Check one):
Large accelerated filer o | Accelerated filer x | Non-accelerated filer o (Do not check if a smaller reporting company) | Smaller reporting company o | |||
Indicate by check mark whether the Registrant is a shell company (as defined in Rule 12b-2 of the Act). Yes o No x
The aggregate market value of the Registrant's Common Stock held by non-affiliates based upon the closing price of a share of the Registrant's Common Stock on June 30, 2016 (based upon the closing sale price of such shares on the NASDAQ on June 30, 2016) was $50,622,475. The number of shares of Common Stock, $0.0017 par value, outstanding as of March 8, 2017 — 6,801,961.
DOCUMENTS INCORPORATED BY REFERENCE
If the Registrant files a definitive Proxy Statement relating to its next Annual Meeting of Stockholders on or prior to 120 days after the end of the fiscal year for which this report relates, portions of the Proxy Statement will be incorporated by reference into Part III of this Annual Report on Form 10-K where indicated. However, if this Proxy Statement is not filed within that time period, we will file an amendment to this Annual Report with the Securities and Exchange Commission within 120 days after the end of the fiscal year to which this report relates.
MRV Communications, Inc.
Annual Report on Form 10-K
For the Year Ended December 31, 2016
Table of Contents
Page | ||||
PART I
Item 1. Business.
Company Background
At MRV Communications, Inc. and subsidiaries ("MRV" or the "Company"), we design, develop and sell products and services that enable our customers to build reliable, scalable and cost effective networks.
We develop our products and services to meet the needs of telecommunications service providers and cable operators (collectively “Service Providers”), data center operators, government entities and enterprises, including the educational, financial, healthcare and equipment manufacturing segments in North, South and Central America (“Americas”), Europe, Middle East and Africa (“EMEA”) and Asia Pacific (“APAC”).
Our technologies, platforms and expertise enable our customers to overcome the challenge of orchestrating the ever-increasing need for capacity while improving service delivery and lowering network costs for critical applications such as, high-capacity business services, mobile backhaul and data center connectivity.
On December 2, 2011, we announced that we entered into a stock purchase agreement with CES Holding SA, as purchaser, represented for purpose of the agreement by Vinci Capital Switzerland SA, for the sale of our former wholly-owned Swiss subsidiary, CES Creative Electronic Systems SA ("CES"). The sale of CES was subject to stockholder approval, which was obtained on January 9, 2012 and the sale was completed on March 29, 2012.
On October 12, 2012, we sold all of the issued and outstanding capital stock of our former wholly-owned operating subsidiary, Alcadon-MRV AB ("Alcadon").
On October 16, 2012, we sold all of the issued and outstanding capital stock of our former wholly-owned operating subsidiary, Pedrena Enterprises B.V. ("Pedrena"). Pedrena is the parent company of Interdata, and Interdata in turn is the parent company of J3TEL.
In December 2015, we sold our Network Integration business, which consisted of one business unit in Italy, Tecnonet S.p.A. ("Tecnonet") that provided end-to-end solutions including consulting, installation and support and managed services for fixed line, cable and mobile communications networks.
Our remaining reporting segment, Network Equipment includes two business units: Optical Communications Systems division ("OCS") and Appointech, Inc. ("Appointech"), a Taiwan based business that provides design and manufacturing of fiber optic modules for the fiber-optic communications industry. As of December 31, 2016, OCS had 222 employees and Appointech had 13 employees.
MRV was organized in July 1988 as MRV Technologies, Inc., a California corporation. In April 1992, we reincorporated in Delaware and changed the company name to MRV Communications, Inc. Our corporate headquarters are located in Chatsworth, California and our website address is www.mrv.com.
Strategy
We deliver highly scalable packet and optical edge solutions and network infrastructure management solutions that enable our customers to reliably grow the revenue they generate from their networks while supporting their efforts to reduce operational costs and operate more efficiently. Our strategy is to position our hardware, software and service offerings to meet the current and future needs of Service Providers, data center operators and other customers in our target vertical markets.
Strong Market Drivers
We believe the long-term growth of metro networking investments and the demand for our packet and optical products will be fueled by the increasing demand for more bandwidth capacity, higher connection speeds, and more service flexibility. The massive proliferation of video media creation and sharing, the shift to mobile and the rise of cloud-based services and remote data storage networks are collectively driving exponential growth in bandwidth consumption. As a result of ongoing bandwidth demand and network architectural changes, Service Providers are upgrading their metro network infrastructure, a trend that we expect benefits network equipment manufacturers like us. Additionally, we have seen significant growth in the number of data centers, particularly in metro areas as customers move to 100G solutions and beyond. We believe that the requirements of data center operators - high density, low power consumption, limited rack space, low latency, faster service turn-ups with embedded diagnostic tools and desire for simplicity - all favor the MRV solution set.
1
Credibility as a Leading Global Supplier of Network Equipment
Our customers will generally make a long-term commitment to a select few network equipment vendors; they need to be assured that their chosen vendors are credible and reliable. For almost three decades, the most demanding service providers, Fortune 1000 companies and governments worldwide have trusted MRV to provide best-in-class solutions for their mission-critical network operations. With an installed base of equipment valued at an original purchase cost exceeding $2 billion, MRV solutions are field-proven.
Comprehensive Product Portfolio
We offer a comprehensive portfolio of packet and optical solutions enabling the access, aggregation, transport, and management of various communications traffic for fixed line, cable, content delivery, cloud-based and mobile communications networks. Our product portfolio of packet and optical platforms places us at the nexus of two important trends in networking today: the convergence of optical and packet networking and the extension of fiber-based networking technologies to connect the end user to content and interconnect data intensive cloud traffic between data centers. Our infrastructure management solutions complement our packet and optical communications products and enable focused solutions for network monitoring and lab automation for network equipment manufacturers and Service Providers. We believe that our comprehensive product portfolio gives us a strong competitive advantage as it enables us to gain multiple points of entry to reach our target customers and it also provides us with broad visibility into our customers’ networks, enabling us to gain valuable insights into our customers’ current and future networking requirements.
Building on Technology Leadership
As a pioneer and technological leader for almost three decades, we have established a reputation for high quality and innovation across a broad array of product and service offerings, including integrated packet and optical equipment and services connecting communication networks that transport digital data, voice and video across metropolitan and regional networks. Our comprehensive product portfolio for metro networks enable the delivery of next generation high-capacity services over any fiber infrastructure, facilitating network transformation and increasing efficiency, while reducing complexity and costs. We maintain three development centers covering packet, optical and software technologies and continue to invest in innovation across each of our platforms.
As an example of our commitment to innovation, we introduced industry first 100G NID, OptiPacket® ("OP-X1"), which leverages the field-proven technology and expertise of MRV’s existing solutions into an all-in-one, highly flexible, intelligent Carrier Ethernet 2.0 100G demarcation. This purpose-built product has received several awards for being one of the first 100G carrier Ethernet Access Devices in the market. The OP-X1 platform addresses the growing need for higher bandwidth, driven by the increased and ongoing adoption of cloud services. Its innovative hardware and software architectures future-proof the solution in anticipation of customers’ evolution to next generation networks. For the optical transport solutions, we expanded the spectrum of our 100G products as part of OptiDriver, our flagship optical product line that scored multiple accolades and industry recognition. This product line, designed from the ground up to reduce capital and operational expenses, and engineered to support the latest advances in optical technologies, to enable high-growth cloud connectivity with the industry’s leading 10Gbps, 100Gbps and future upgradeable 200Gbps densities.
Our vision is to help our customers simplify and converge their networks, enabling them to seamlessly deliver multi-layer services over the same metro service edge. This, along with the solution’s industry-leading bandwidth capacity, port density, and power efficiency, makes it easier to manage unpredictable bandwidth demand and creates a strong foundation for Software-Defined Networking (SDN), Network Function Virtualization (NFV), and consequently enable highly beneficial metro network transformation. In 2016, we invested 26% of revenue in product development and engineering.
Partnership with our Customers
We work very closely with our customers to develop products and services to meet their specific and evolving requirements. In some cases, our own employees work and operate within our customers’ premises, which provides us with a deep appreciation for our customers’ requirements and challenges. The insights that we gain from our intimate customer partnerships informs our product roadmap and ensures that our development efforts are focused on solving real customer issues.
2
Sale of Tecnonet and Positioning MRV as a “Pure Play”
On August 10, 2015, we announced that we entered into a shares purchase agreement (the "Purchase Agreement”) with Maticmind S.p.A., (the “Purchaser”), a company incorporated under the laws of Italy, for the sale of all of the shares of our wholly-owned subsidiary Tecnonet. We believe that the sale of Tecnonet enables us to focus our attention on growing our core network equipment business and will enhance the clarity and visibility of the MRV brand in the marketplace.
The sale of Tecnonet has also enabled us to strengthen our balance sheet. The consideration for the transaction included a cash payment by the Purchaser to the Company of €15.6 million (approximately $17.0 million) at closing plus a cash payment by Tecnonet to the Company of €4.1 million (approximately $4.6 million) prior to closing to repay an outstanding intercompany obligation. Tecnonet procured third party debt financing and repaid the loan in full in two payments: €1.5 million was received during the quarter ended September 30, 2015, with the remaining amount received during October 2015. The Purchaser assumed this debt at closing pursuant to the Purchase Agreement. On December 1, 2015, the sale of Tecnonet was approved by the Company's stockholders at the Company's special meeting of stockholders. On December 3, 2015, the Company completed the sale of all of the shares of Tecnonet. On February 19, 2016, the Company received a payment of €4.3 million (approximately $4.8 million) representing the post-closing purchase price adjustment pursuant to the Purchase Agreement. The Purchase Agreement also contains customary representations, warranties, covenants and indemnification obligations.
At the discretion of our Board of Directors, we may use a portion of our existing balances of cash and cash equivalents to provide liquidity to our shareholders through one or more special dividends or the repurchase of additional shares of our common stock ("Common Stock"), make investments in other businesses and pursue other strategic opportunities or a combination thereof.
The historical financial results of Tecnonet prior to the date of sale are reclassified as discontinued operations for all periods presented. Cash flows from discontinued operations are presented separately from the cash flows from continuing operations in the accompanying Consolidated Statements of Cash Flows. (See Note 3, Discontinued Operations)
Focused Sales and Marketing Strategy
While we serve a broad range of customers including large global service providers, small regional carriers, enterprises, educational institutions and governments, our strategy is to focus our sales and marketing efforts on servicing existing customers across our wide base while also focusing on developing new opportunities with smaller regional Service Providers as well as Data Center Operators, Network Equipment Manufacturers, Government Entities, Enterprises and other entities for data center interconnect applications. We believe that recent consolidation among network equipment vendors has created an opportunity for MRV to grow its business among relatively under-served customers in its target market segments.
Markets Served
MRV primarily serves the following markets:
Service Providers
Historically, Service Providers have been categorized separately as telecommunications service providers or cable operators, but in recent years, service providers have converged through acquisitions, mergers, and partnerships so we consider the providers as a group. Our telecommunications service provider customer base includes international, national and regional telecommunications carriers, both wireline and wireless. Telecommunications service providers are under increasing competitive pressure, primarily from emerging competitors that offer similar services at competitive prices. Additionally, as the Internet has become ubiquitous and consumers demand significantly more mobile, providers of content delivery and cloud-based services have been driving the need for more flexible high bandwidth applications. Our products and services enable both established and emerging telecommunications service providers to transition their existing network infrastructures to deliver a broader mix of higher bandwidth services to consumers and enterprises. We provide products that enable telecommunications service providers to support demand for video delivery, broadband data and video and wireless broadband services. Additionally, we enable these telecommunications service providers to sell wholesale services to each other thereby building wider network access for the end user.
3
Our cable operator customers include leading cable and multiple system operators in the United States and internationally. These customers rely upon us for a wide range of products including Carrier-grade, optical Ethernet transport and switching equipment. Our networking products allow our cable operator customers to integrate voice, video and data applications over a converged packet-optical infrastructure. This enables our customers to grow bandwidth capacity and lower the operational expense of supporting disparate networks. By enabling this network convergence, cable operators can expand their end user offerings to include high-value service bundles. Our products support key cable applications including broadcast video, Voice over Internet Protocol ("VoIP"), video on demand, broadband data services and services for enterprises.
Data Center Operators
Our customers include leading data center operators. This market segment includes co-location companies, Internet exchange centers, web service companies, cloud and content providers, and large enterprises. These customers are witnessing an increasing demand for flexible bandwidth between sites. Driven by the growing use of streaming video services (enterprise demand for cloud services as well as the virtualization of data center operations) data center operators are faced with the challenge of quickly connecting large campuses with very high bandwidth across metro and regional distances. The data center market is an important growth area also for traditional service providers and for enterprises that continue to transition toward cloud services. Cloud services represent an important offering for service providers, enabling them to retain customers while also representing a source of revenue in a growing market segment.
Other Markets
In addition to Service Providers and Data Center Operators, we also supply Network Equipment Manufacturers, Government Entities and Enterprises. Our network equipment manufacturer customers incorporate our infrastructure management and automation products to increase the efficiency in the test lab environment, enabling more tests in less time with fewer resources and with added flexibility. Our enterprise customers include small to large commercial organizations from every industry with IT requirements, including end users in the healthcare, financial, retail, industrial and technology industries, as well as schools and universities. Our government customers include federal, state and local agencies in the United States and internationally.
Major Customers
Revenue from one customer accounted for 17%, 19% and 11% of our consolidated revenue for the years ended December 31, 2016, 2015 and 2014, respectively. As of December 31, 2016 and 2015, amounts due from this customer accounted for 11% and 15% of our consolidated gross accounts receivables, respectively. Revenue from another customer accounted for 12% of our consolidated revenue for the years ended December 31, 2016, 2015 and 2014, respectively. As of December 31, 2016 and 2015, amounts due from this customer accounted for 11% and 5% of our consolidated gross accounts receivables, respectively.
Products and Services
Our comprehensive portfolio of field-proven packet and optical communications solutions empower digital network transformation in access and metro networks, enabling convergence of historically separate Ethernet and Optical Transport technologies to expand capacity and provide the packet-level intelligence needed to support today's services. MRV packet and optical products can be used as complete end-to-end solution for metro networks or as independent elements within a large heterogeneous network with field-proven interoperability.
Our products and services include:
• | Optical Transport products; |
• | Packet/Carrier Ethernet products; |
• | Network management products; and |
• | Infrastructure management products |
4
Optical Transport Products
Optical Transport refers to the transmission of data signals through a fiber optic cable. One of the more common techniques utilized for Optical Transport optimization is Wave Division Multiplexing, or WDM. Multiple wavelengths are combined, or multiplexed, utilizing different wavelengths of light as individual communications transport channels, and passed through a single optical fiber. MRV's Optical Transport portfolio addresses the rapidly increasing demand for transport capacity, multiple services and end-to-end management to the network optical edge enabling access, metro and regional long-haul optical communications. With the integration of WDM and Ethernet packet functionality, MRV is delivering advanced packet-optical transport solutions. MRV’s best-of-breed optical transport proposition provides a scalable and flexible Optical Transport solution with a robust and simplified system architecture that provides entry level access platforms to high-end solutions that can support up to 8 Tbps per fiber pair. MRV's optical transport portfolio offers a pay-as-you-grow cost-effective business model to meet the significantly increasing bandwidth demands in today’s networks. Our products provide carriers, enterprises, data center and Internet exchange providers with a comprehensive solution that features simplicity, compact size, low latency small footprint and low power consumption.
OptiDriver® is the most recent addition to MRV’s comprehensive family of advanced optical transport network elements. Designed to offer the industry’s highest density 10Gbps and 100Gbps transport, with more than 80 wavelengths in only 10RU, OptiDriver is engineered to support the latest advances in optical technologies, including intelligent optical automated ROADM networks and 100Gbps transport. OptiDriver is designed from the ground up to reduce the capital costs and operational expenses of our customers. A flexible shelf and component architecture dramatically lowers initial and ongoing hardware costs, simplifies operations, and minimizes power and space requirements. Multifunction hardware allows a minimum number of components to serve the maximum variety of applications, including Ethernet, OTN, TDM, Fibre Channel, ESCON/FICON, Infiniband, and others. Built-in testing and rapid turn up features lower operational and costs of installation and significantly decrease time to revenue. Additionally, the ‘pay as grow’ approach of our modular Optical Transport solution set is well suited to the requirements of Carrier Neutral Providers ("CNPs") to modulate their capital expenditures while building out for 100G, 200G and beyond. OptiDriver is fully integrated into MRV’s advanced Pro-Vision® service provisioning and management software, which operates seamlessly in a mixed network of MRV’s Optical and Carrier Ethernet systems.
The Fiber Driver® optical multi-service access product line provides a full range of services including demarcation, media conversion, signal repeating and fiber-optimization solutions. The Fiber Driver line includes several families of products with the flexibility for any type of optical or copper technology, covering virtually every protocol in use in networking today.
Packet/Carrier Ethernet Products
Carrier Ethernet service growth is driven by the fact that many Service Providers and other customers seek to reduce their network costs and improve their service flexibility. Customers and service providers get a better per-bit cost for Ethernet services and enjoy the scalability over fiber optic networks. The maturity of carrier Ethernet technology and massive infrastructure changes from legacy to next generation packet network requires highly intelligent demarcation and first mile aggregation equipment to serve both wireline and wireless/mobile services.
The OptiSwitch® Carrier Ethernet service demarcation and first-mile aggregation series delivers best-of-breed capabilities that enable carriers and service providers to deliver assured SLA services that create new revenue streams with an attractive return on investment for our customers. Major Tier-1 service providers have deployed OptiSwitch in their networks and will benefit from the new standardized Carrier Ethernet 2.0 features, including multi class of service, interconnect and manageability. These features are critical for enabling high-revenue services like LTE 4G mobile backhaul, business Ethernet services and cloud access services. An integral part of the OptiSwitch CE 2.0 solution is MRV's Pro-Vision®, an industry recognized and award-wining Service Provisioning and Management software, that enables carriers to simplify Ethernet service delivery, accelerate time-to-market for new applications and provides centralized service visibility, intelligence along with substantial OPEX reductions. The latest addition, the OS-V Series, a next generation portfolio of modular and compact 1RU 10GbE CPEs, is a new enhancement to the award-winning OptiSwitch® product line. The OS-V devices expand MRV’s successful and field-proven OptiSwitch 900 family, extending the benefits and offerings of MRV’s certified Layer 2 MEF CE 2.0 access solutions.
5
Metro networks continue to expand and require more intelligent high-density aggregation with a focus on 10G and 100G packet switched services. OptiPacket® metro aggregation product line opens new market segments in Metro Service Edge that enables a broader solution to our customers' needs while providing more strategic value with end-to-end solutions for smaller service providers and carriers. OptiPacket upgrades our solution from the metro access market to the metro service edge market. Our strategy is to combine a broader metro solution that extends from OptiSwitch in the access domain to OptiPacket in the metro service aggregation domain to OptiDriver in the optical transport domain, all manageable and operable with our Pro-Vision® service delivery software. The OptiPacket series is a carrier-class, high capacity provider edge aggregator with a packet-optical roadmap positioned for multi-layer service convergence, intelligence, and high capacity aggregation needed for next-gen Metro networks. OptiPacket® (OP-X models) combines the field-proven technology and expertise of MRV’s optical and packet product families into an all-in-one, highly flexible, intelligent architecture. Our vision is to help service providers simplify and converge their networks. By optimizing the platform for new dynamic services and integration with our optical products, MRV is enabling service providers to seamlessly deliver multi-layer services over the same metro service edge. This, along with the solution’s industry-leading bandwidth capacity, port density, and power efficiency makes it easier for service providers to manage unpredictable bandwidth demand and create a strong foundation for Software-Defined Networking (SDN), Network Function Virtualization (NFV), and consequently enable highly beneficial metro network transformation.
The flexibility of the OptiPacket® platform is fully maximized when used as a converged packet-optical solution with MRV's optical transport products and combined under the same management and provisioning software, Pro-Vision® according to a service provider’s network demands.
Network Management
Pro-Vision® is designed to improve operational efficiency by unifying the management of packet switching and optical transport equipment. Pro-Vision is the orchestration software overlay that enables convergence of the packet and optical layers into a robust network capable of efficiently supporting new and existing services. Pro-Vision® is MRV's service orchestration platform that gives service providers the automated tools to design, provision, manage, diagnose, visualize and optimize both packet and optical access networks. It seamlessly automates the provisioning, orchestration and management of thousands of network elements and millions of services. Pro-Vision's packet and optical tools bring a new level of service control to networks and provide a suite of applications for automated service provisioning, assurance, monitoring, reporting, inventory and maintenance. It is a centralized carrier-class, web based platform that uses intuitive GUI based displays and offers powerful methods to reduce operational expense and paves the way for the software defined network of the future. Pro-Vision® creates an ecosystem that enables the transformation of service providers’ networks into dynamic, intelligent, highly flexible, orchestrated and virtualized networks for enriched service offerings and rapid service roll out.
Infrastructure Management Products
MRV's physical layer switches are scalable, OSI layer 1 switches that allows users to connect any port to any other port within the system using a non-blocking matrix. The Media Cross Connect (MCC) is an optical/electrical/optical (OEO) switch used for data rates and media up to 10Gbps. Deploying the MCC in a lab environment allows test commitments to be met without compromising quality or responsiveness, or increasing capital or operational expenses.
Out-of-band LX Series
An out-of-band network leveraging our LX product line provides secure remote service port access and remote power control to devices in an organization's networks and infrastructures, including data centers, remote sites, and test labs. Rich security and management features are supported, in addition to distributed clustering, sophisticated automation capabilities, very strong encryption, and security certifications.
Worldwide Sales and Marketing
As of December 31, 2016, our worldwide sales and marketing organization consisted of 58 employees, including sales representatives, pre- and post- sales technical support, product line management, technical marketing, marketing communications and management. We have field sales personnel in more than 10 countries involved in the sales and distribution of our products, as well as providing pre- and post- sales technical support to end users of our products. We sell and service our products both directly and through channel partners including distributors, value-added resellers and system integrators.
6
We employ various methods, such as public relations, advertising, and trade shows, in an effort to build awareness of our products and to establish our corporate MRV brand name. We conduct our public relations activities both internally and through relationships with outside agencies. We focus on major public relations activities concentrated around new product introductions, corporate partnerships and other events of interest to the market. We supplement our public relations through media advertising programs, including electronic media and attendance at various trade shows worldwide throughout the year.
Backlog
Our product backlog as of December 31, 2016 was approximately $7.2 million, an increase of 43% year over year. Our product backlog at December 31, 2015 was approximately $5.1 million. The product backlog includes orders confirmed for products planned to be shipped within 90 days to customers with approved credit status. Subscription-based sales arrangements are not included in product backlog. Our cycle time between order and shipment is generally short and customers occasionally change delivery schedules. Additionally, orders can be canceled without significant penalties. As a result of these factors, we do not believe that our product backlog, as of any particular date, is necessarily indicative of actual product revenue for any future period.
Competition
The communications equipment industry is intensely competitive. We compete directly with a number of established and emerging networking companies.
Our direct competitors in networking products, switches, routers and media converters generally include: Adtran, ADVA Optical Networking, BATM Advanced Communications, Ciena Corporation, Cisco Systems, Inc., Coriant, ECI Telecom Ltd., Ekinops, Ericsson, Fujitsu Limited, Huawei Technologies Ltd., Infinera Corporation, Juniper Networks, Nokia Siemens Networks BV, and RAD Data Communications, Ltd.
Many of our larger competitors offer customers a broader product line, which provides a more comprehensive networking solution than we provide. Accordingly, in certain markets, we have collaborated with other vendors in order to provide a comprehensive solution to customers.
We believe the principal competitive factors in the markets in which we compete include:
• | Product performance, features, quality and price; |
• | A comprehensive range of complementary products and services; |
• | Customer service and technical support; |
• | Lead and delivery times; |
• | Timeliness of new product introductions; |
• | Global presence, including distribution network; |
• | Conformance to standards; and |
• | Brand name recognition. |
Product Development and Engineering
We believe that in order to maintain our technological competitiveness and to serve our customers better, we must continually enhance our existing products and continue to develop new products. Accordingly, we focus a significant amount of resources on product development and engineering. Product development and engineering expenses were $20.5 million, $20.4 million, and $20.8 million for the years ended December 31, 2016, 2015, and 2014, respectively.
Manufacturing
We outsource the manufacturing of our network equipment products to world class contract manufacturers. These products include: switches and optical transport platforms, remote device management products and networking physical infrastructure equipment. Outsourcing allows us to react more quickly to market demand; avoid the significant capital investment required to establish automated manufacturing and assembly facilities; and allocate resources on product design and development. Our Operations personnel primarily perform: supply chain management, commodity management, quality compliance and assurance, supplier engineering, test software development, and NPI Program Management. Our processes and procedures are ISO 9001 certified and so are those of our electronic manufacturing service providers.
7
Intellectual Property
To date, we have relied principally on a combination of patents, copyrights and trade secrets to protect proprietary technology. We have 11 U.S. patents which expire through 2034. In addition, we have one U.S. patent application pending. Our products rely principally on a combination of industry standard technology, our trade secrets, and software copyrights. Generally, we enter into confidentiality agreements with our employees and key suppliers and otherwise seek to limit access to and distribution of the source code to our software and other proprietary information. These steps may not be adequate to prevent misappropriation of our technologies, or a third party may independently develop technologies similar or superior to any that we possess.
Employees
As of December 31, 2016, MRV employed 235 employees. Of these employees, 93 were in product development and engineering, 48 were in manufacturing, and 94 were in sales, marketing and general administration. Of these employees, 119 work in locations outside the United States.
We believe our employee relationships are satisfactory. We believe that our long-term success depends in part on our continued ability to recruit and retain qualified personnel. The risks associated with dependence on qualified personnel are more fully discussed under the heading "The loss of key management could negatively affect our business" in the "Risk Factors" section contained in Item 1A of this Form 10-K.
Revenue by Segment and Geography
We currently have one reporting segment: Network Equipment. Until the third quarter of 2015, we operated as two segments. Please refer to Note 13 "Geographic Information" for further information.
Financial information for revenue, total assets and breakdown by geographic region is included in Item 7 "Management's Discussion and Analysis of Financial Condition and Results of Operations," and Item 8 "Financial Statements and Supplemental Data" of this Form 10-K.
Internet Access to Our Financial Documents
We maintain a website at www.mrv.com. We make available on our website, free of charge, reports that we electronically file with or furnish to the SEC. We make the reports available on our website as soon as reasonably practicable after filing or furnishing such reports to the SEC. These reports include Annual Reports on Form 10-K, Quarterly Reports on Form 10-Q, Current Reports on Form 8-K and amendments to those reports filed or furnished pursuant to Section 13(a) or 15(d) of the Exchange Act. These reports are also available directly through the SEC's website at www.sec.gov.
Item 1A. Risk Factors.
The following risk factors and other information included in this Form 10-K should be carefully considered. The Company is subject to numerous risks and uncertainties, the outcome of which may impact future results of operations and the Company's financial condition. The risks and uncertainties described below are not all encompassing and should be considered carefully together with the other information contained in this report and in the other reports and materials filed by us with the Securities and Exchange Commission (“SEC”), as well as news releases and other information we publicly disseminate from time to time. Additional risks and uncertainties not presently known to us or which we currently deem immaterial also may impair our business operations. If any of the following risks occur, our business, financial condition, operating results, and cash flows could be materially adversely affected and the trading price of our Common Stock could decline.
We did not achieve profitability on a consolidated basis for the years ended December 31, 2016, 2015 and 2014, and may not achieve profitability in the future.
We did not achieve profitability for the years ended December 31, 2016, 2015 and 2014 on a consolidated basis, and we expect to continue to incur significant product development, sales and marketing and general and administrative expenses, and costs related to improving efficiency in the near term. As a result, we will need to continue our efforts to contain expense levels and increase revenue levels in an effort to achieve profitability in the future. We may not be successful in our efforts to contain expense levels and increase revenue levels, and we may not attain profitability on a sustained basis or at all.
8
Our operating results may be adversely impacted by worldwide economic and political uncertainties and specific conditions in the markets we address, including the cyclical nature of and volatility in the network equipment industry.
We are a global business with a significant presence in Europe which is experiencing difficult economic conditions. Such conditions are characterized by decreases in product demand, excess customer inventories, and accelerated price erosion, and may be interspersed with, or followed by, significant and temporary increased demand in products. Further, these markets are cyclical and subject to rapid change and evolving industry standards. These factors could cause substantial fluctuations in our revenue, gross margins and results of operations, and may cause difficulty in predicting demand and short-term production needs. In addition, during downturns some competitors become more aggressive in their pricing practices, which, if we follow their actions, could adversely impact our product gross margins. Any downturns in the network equipment markets may be severe and prolonged or intermittent, and any failure to fully recover from downturns of these industries or the markets in which we operate could seriously impact our revenue and harm our business, financial condition and results of operations. The network equipment industries also periodically experience increased demand and production capacity constraints, which may affect our ability to ship products in a timely manner and may cause delivery penalties. Accordingly, our operating results may vary significantly as a result of the general conditions in the network equipment industries, which could cause large fluctuations in our stock price.
Many other factors have the potential to significantly impact our business, such as concerns about inflation and deflation, deterioration in credit availability due to economic downturns or instability on a local or global level, volatility in energy costs, decreased consumer confidence, reduced corporate profits and capital spending, adverse business conditions and liquidity concerns in the communications markets, reduced availability of insurance coverage or reduced ability to pay claims by insurance carriers, international conflicts and terrorist and military activity, and the impact of natural disasters and public health emergencies. These conditions may make it extremely difficult for our customers, our vendors and us to accurately forecast and plan future business activities, and they could cause U.S. and foreign businesses to reduce spending on our products and services, which would delay and lengthen sales cycles. Furthermore, during challenging economic times our customers may face issues gaining timely access to sufficient credit or could even need to file for bankruptcy. Either of these circumstances could result in an impairment of their ability to make timely payments to us. If these circumstances were to occur, we may be required to increase our allowance for doubtful accounts. Historically, a portion of our business has not come from the end customer directly, and we have experienced growth patterns that are different than what the end customer demand might be, particularly during periods of high volatility. This can manifest itself in periods of growth in excess of our customers' growth followed by periods of under-shipment before the volatility abates as our customers adjust their inventory levels. Given recent economic conditions it is possible that any correlation will continue to be less predictable and will result in increased volatility in our operating results and stock price. We cannot predict the timing, strength or duration of any economic slowdown or recovery, worldwide, in the network equipment industry or in the markets in which we operate. If the economy or the markets in which we operate deviate from present levels or deteriorate, we may record additional charges related to restructuring costs and the impairment of goodwill and long-lived assets, and our business, financial condition and results of operations may be materially and adversely affected. The impact of market volatility is not limited to revenue but may also affect our product gross margins and other financial metrics.
A few customers account for a substantial portion of our sales, increasing both our dependence on a few revenue sources and the risk that our operations will suffer materially if a significant customer stops ordering from us or substantially reduces its business with us.
Revenue from two customers accounted for 29%, 31% and 23% of our consolidated revenues for the years ended December 31, 2016, 2015 and 2014, respectively. As of December 31, 2016 and 2015, amounts due from these customers accounted for 22% and 20% of our consolidated gross accounts receivables, respectively. While our financial performance benefited from substantial sales to these customers, because of the magnitude of sales to these customers, our results would suffer if we were to lose their business. Additionally, if those customers, or other significant customers, made substantial reductions in order volume or stopped paying their invoices when due, our results of operations would suffer unless we were able to replace the orders or collect on the payments due. Both customers are major telecom companies, one operating in Australia and one in Canada.
9
Our quarterly operating results are subject to significant fluctuations, and you should not rely on them as an indication of our future performance. Our operating results could fluctuate significantly from quarter to quarter and year to year.
Our operating results for a particular quarter are difficult to predict. Our revenue, gross margins and operating results could fluctuate substantially from quarter to quarter and from year to year as a whole. This could result from any one or a combination of factors such as:
• | the cancellation or postponement of orders from one period to the next; |
• | the timing and amount of significant orders; |
• | the mix in any period of higher and lower margin products and services; |
• | software, hardware or other errors in the products we sell requiring replacements or increased warranty reserves; |
• | charges for excess or obsolete inventory; |
• | our annual reviews of other intangibles that may lead to impairment charges; |
• | the ability of our suppliers to produce and deliver components and parts, including sole or limited source components, in a timely manner, in the quantity and quality desired and at the prices we have budgeted; |
• | political stability in the areas of the world in which we operate; |
• | price reductions that we make, such as marketing decisions that we have made in the past to reduce the price for our products in an effort to secure new customers or to provide competitive bulk discounts; |
• | decreases in average selling prices of our products which result from factors such as overcapacity and market conditions, the introduction of new and more technologically advanced products, and increased sales discounts; |
• | the relative success of our efforts to continually reduce product manufacturing costs; |
• | our introduction of new products, with initial sales at relatively small volumes with resulting higher production costs, and the rate of market acceptance of the products; |
• | delays or reductions in customer purchases of our products in anticipation of the introduction of new and enhanced products by us or our competitors; |
• | the timing of capital spending of our customers; |
• | currency fluctuations; |
• | the ability of our customers to pay for our products; |
• | general economic conditions; and |
• | changes in conditions specific to our business. |
Moreover, the volume and timing of orders we receive during a quarter are difficult to forecast. Customers often view the purchase of our products as a significant and strategic decision. As a result, customers typically expend significant effort in evaluating, testing and qualifying our products. This customer evaluation and qualification process frequently results in a lengthy initial sales cycle of up to one year or more. We may also expend significant management effort and order long lead-time components or materials prior to receiving an order. Further, our customers encounter uncertain and changing demand for their products. Customers generally order based on their forecasts. If demand falls below these forecasts or if customers do not control inventories effectively, they may cancel or reschedule shipments previously ordered from us even after acceptance of orders. We do not recognize revenue until a product has been shipped to a customer, all significant vendor obligations have been performed, and collection is considered reasonably assured. Our expense levels during any particular period are based, in part, on expectations of future sales. If sales in a particular quarter do not meet expectations, our operating results could be materially adversely affected.
We expect revenue and gross margins generally and for specific products and services to continue to fluctuate from quarter to quarter and year to year. Changes in service gross margin may result from various factors such as changes in the mix between technical support services and advanced services, as well as the timing of support service contract initiations and renewals. It is possible that, in future periods, our results of operations will be below the expectations of public market analysts and investors. This failure to meet expectations could cause the trading price of our Common Stock to decline. Similarly, the failure by our competitors or customers to meet or exceed the results expected by their analysts or investors could, by association, cause our stock price to decline.
10
Changes in the seasonality of our business could cause our operating results to fluctuate.
Sales of our products are subject to seasonality. However, the current global economic environment may impact typical seasonal trends, making it more difficult for us to forecast our business. Changes in the product or channel mix of our business can also impact seasonal patterns, adding to complexity in forecasting demand. If our forecasts are inaccurate, we may lose market share or procure excess inventory or inappropriately increase or decrease our operating expenses, any of which could harm our business, financial condition and operating results. Changes in seasonality may also lead to greater volatility in our stock price.
We are making investments in engineering and product and software development. These investments will negatively affect our short-term operating results, and may achieve delayed, or lower than expected, benefits which could harm our long-term operating results.
While we intend to focus on managing our costs and expenses, the investments in engineering and development will impact our short-term operating results, as we are likely to recognize the costs associated with these investments earlier than some of the anticipated benefits, and the return on these investments may be lower, or may develop more slowly, than we expect. If we do not achieve the benefits anticipated from these investments, or if the achievement of these benefits is delayed, our long-term operating results may be adversely affected.
Competition is ever increasing, and we face additional challenges when entering into new markets which could reduce our revenue and gross margins or cause us to lose market share.
The network equipment industry is intensely competitive, and we must continually compete against new products from larger, better capitalized global competitors while we must also compete against aggressive pricing from low-cost producers in Asia and elsewhere.
Many of our competitors have significantly greater financial, technical, marketing, distribution, sales and customer support organizations and other resources and larger installed customer bases than we have. Our competitors continually introduce new competitive products, and may be able to devote greater resources to the development, promotion, sale and support of their products. Moreover, recent consolidation in our markets may enhance these competitive advantages of some of our competitors. They may also be able to leverage their buying power with vendors to give them preferential treatment in delivery of high-demand products in times of supply constraint. Many of our larger competitors offer customers broader product lines, which provide a more comprehensive networking solution than we provide. These companies can leverage their customer bases and broader product offerings and adopt aggressive pricing policies to gain market share. In addition, several of our competitors have large market capitalizations, have substantially larger cash reserves, and are much better positioned than we are to acquire other companies in order to gain new technologies or products that may displace our product lines and give them a strategic advantage. Accordingly, in certain regional markets we have collaborated with other vendors in an effort to enhance our overall capability in providing products and services, and we focus on consolidating our purchasing programs globally to improve purchasing power with vendors.
Additional competitors may enter the market from regions of the world, including China, which offer lower labor costs as well as government incentives that may not be available to MRV. As a result of such advantages, such companies may threaten our business with products that are more competitively priced, have increased performance or functionality, or incorporate technological advances that we have not yet developed or implemented, and may be able to react more quickly to changing customer requirements and expectations. There is also the risk that other network system vendors may enter or re-enter the subsystem market and begin to manufacture in-house the networking subsystems incorporated into their network systems. We also expect to encounter potential customers that, because of existing relationships with our competitors, are committed to the products offered by these competitors. As a result of the foregoing factors, we expect that competitive pressures may result in price reductions, reduced or negative margins or loss of market share in our markets.
11
Our markets are subject to rapid technological change, and to compete effectively, we must continually introduce new products that achieve market acceptance.
The markets for our products are characterized by rapid technological change, frequent new product introductions, changes in customer requirements and evolving industry standards. We expect that new technologies will emerge as competition and the need for higher and more cost effective transmission capacity, or bandwidth, increases. Our future performance will depend on the successful development of new and enhanced products that address these changes and other customer requirements. The introduction of new and enhanced products may cause our customers to defer or cancel orders for existing products. We have in the past experienced delays in product development and these delays may occur in the future. Therefore, to the extent that customers defer or cancel orders in the expectation of a new product release or there is any delay in development or introduction of our new products or enhancements of our products, our operating results could suffer.
During the years ended December 31, 2016 and 2015, product development and engineering expenses accounted for 26% and 23% of revenue, respectively. Introduction of new products and product enhancements will require that we effectively transfer production processes from development to manufacturing and coordinate our efforts with those of our manufacturers and suppliers to achieve volume production rapidly. If we fail to transfer production processes effectively, develop product enhancements or introduce new products in sufficient quantities to meet the needs of our customers as scheduled, our net sales may be reduced and our business may be harmed. We also may not be able to develop the underlying core technologies necessary to create new products and enhancements, or to license these technologies from third parties. Product development delays may result from numerous factors, including:
• | changing product specifications and customer requirements; |
• | difficulties in hiring and retaining necessary technical personnel; |
• | difficulties in reallocating engineering resources and overcoming resource limitations; |
• | difficulties with contract manufacturers; |
• | changing market or competitive product requirements; and |
• | unanticipated engineering complexities. |
The development of new, technologically advanced products is a complex and uncertain process requiring high levels of innovation and highly skilled engineering and development personnel, as well as the accurate anticipation of technological and market trends. In order to compete, we must be able to deliver to customers products that are highly reliable, operate with their existing equipment, lower their costs of acquisition, installation and maintenance, and provide an overall cost-effective solution. We may not be able to identify, develop, manufacture, market or support new or enhanced products successfully, if at all, or on a timely basis. Further, our new products may not gain market acceptance or we may not be able to respond effectively to product announcements by competitors, technological changes or emerging industry standards. Our failure to respond effectively to technological changes could significantly harm our business.
Our products are deployed in large and complex systems and may contain defects that are not detected until after our products have been installed, which may cause us to incur significant costs, divert our attention from product development efforts, or damage our reputation and cause us to lose customers.
Our products are complex and undergo internal quality testing and qualification as well as formal qualification by our customers. However, defects may be found from time to time. Our customers' testing procedures are limited to evaluating our products under likely and foreseeable failure scenarios and over varying amounts of time. For various reasons, including the occurrence of performance problems that are unforeseeable in testing or that are detected only when products age or are operated under peak stress conditions, our products may fail to perform as expected long after customer acceptance. Failures could result from faulty components or design, problems in manufacturing or other unforeseen reasons. As a result, we could incur significant costs to repair and/or replace defective products under warranty, particularly when such failures occur in installed systems. We have experienced such failures in the past and will continue to face this risk going forward, as our products are widely deployed throughout the world in multiple demanding environments and applications. In addition, we may in certain circumstances honor warranty claims after the warranty period has expired or for problems not covered by warranty in order to maintain customer relationships. We believe that our warranty reserves adequately address our potential exposure to liability for warranty claims. Our warranty reserves are based on historical return rates, and our average material costs incurred to repair items, including labor costs. The warranty reserves are evaluated and adjusted based on actual experience.
12
In addition, certain of our networking products are typically embedded in, or deployed in conjunction with, our customers' products, which incorporate a variety of components and may be expected to interoperate with modules produced by third parties. As a result, not all defects are immediately detectable and when problems occur, it may be difficult to identify the source of the problem. These problems may cause us to incur significant damages or warranty and repair costs, divert the attention of our engineering personnel from our product development efforts, cause significant customer relation problems or loss of customers, and harm our reputation and brand, any of which could materially and adversely affect our business.
Our customers may adopt alternate technologies for which we do not produce products or for which our products are not adaptable.
The market for our products is characterized by rapidly changing technology, evolving industry standards and new product introductions, which may minimize the demand for our existing products or render them obsolete. Our future success will depend in part upon our ability to enhance existing products and to develop and introduce new products that address such changes in technology and standards and respond to our customers' potential desire to adopt such technologies in place of those supported by our current product offerings. The development of new or enhanced products is a complex and uncertain process requiring the accurate anticipation of technological and market trends as well as precise technological execution. Further, the development cycle for products integrating new technologies or technologies with which we are not as familiar may be longer and more costly than our current product development process. We may experience difficulties that could delay or prevent the successful development, introduction and marketing of these new products, and the new products may not be successfully commercialized. These costs and delays may prevent us from being able to establish a market position with respect to such new technologies and industry standards or be as responsive as we would like to be in meeting our customers' demands for such products, thus adversely affecting our results of operations and our customer relationships.
We do not have many long-term volume purchase contracts with our customers, so our customers may increase, decrease, cancel or delay their purchasing levels at any time with minimal advance notice to us, which may significantly harm our business.
Our customers typically purchase our products pursuant to individual purchase orders. While our customers generally provide us with their demand forecasts, in most cases they are not contractually committed to buy any quantity of products beyond firm purchase orders. Our customers may increase, decrease, cancel or delay purchase orders already in place. If any of our major customers decrease, stop or delay purchasing our products for any reason, our business and results of operations would be harmed. Cancellation or delays of such orders may cause us to fail to achieve our short- and long-term financial and operating goals. Lead times for components and materials that we order vary significantly and depend on factors including the specific supplier requirements, the size of the order, contract terms and current market demand for components. For substantial increases in our sales levels, some of our suppliers may need significant lead time. In the past, during periods of market downturns, certain of our largest customers canceled or delayed significant orders with us and with our competitors, which resulted in losses of sales and excess and obsolete inventory. Similarly, decreases or deferrals of purchases by our customers may significantly harm our industry and specifically our business in these and in additional unforeseen ways, particularly if they are not anticipated.
We may suffer losses as a result of entering into fixed price contracts.
From time to time we enter into contracts with certain customers in which the price we charge for particular products is fixed. Although our estimated production costs for these products are used to compute fixed sales prices, if actual production costs exceed the estimated production costs because of our inability to obtain needed components timely, or at all, or we cannot continue to cut costs in production and have incrementally decreased future fixed prices, we may incur a loss on the sale. Sales of material amounts of products on a fixed price basis, for which we have not accurately forecast the production costs, could have a material adverse effect on our results of operations.
13
There are a limited number of potential source suppliers for certain components, which makes us susceptible to supply shortages.
We currently purchase several key components from single or limited sources. Moreover, we depend on the quality of the products supplied to us, over which we have limited control. We have encountered shortages and delays in obtaining components in the past and expect to encounter shortages and delays in the future. Sudden significant increases in demand for products that we purchase may cause delays in delivery of subcomponents, which may cause delay in delivery of our products. Larger competitors may be able to demand more rapid delivery of components parts in comparison to us. If we cannot supply products due to a lack of certain components or are unable to redesign products with other components in a timely manner, our business will be significantly harmed.
We typically have not entered into long-term agreements with our suppliers and, therefore, our suppliers could stop supplying materials and equipment at any time or fail to supply adequate quantities of component parts on a timely basis. It is difficult, costly, time consuming and, on short notice, sometimes impossible for us to identify and qualify new component suppliers. The reliance on a sole supplier, single qualified vendor or limited number of suppliers could result in delivery and quality problems, reduced control over product pricing, reliability and performance. We may have difficulty in identifying and qualifying another supplier in a timely manner. We have in the past had to change suppliers, which, in some instances, resulted in delays in product development and manufacturing until another supplier was found and qualified. Any such delays in the future may limit our ability to respond to changes in customer and market demands. During the last several years, the number of suppliers of components has decreased significantly and, more recently, demand for components has increased. Any supply deficiencies relating to the quality or quantities of components we use to manufacture our products could adversely affect our ability to fulfill customer orders and our results of operations.
We rely substantially upon a limited number of contract manufacturing partners, and if these contract manufacturers fail to meet our short- and long-term needs and contractual obligations, our business may be negatively impacted.
We rely to a significant extent on a limited number of contract manufacturers to, manufacture, assemble, test and in certain cases ship our products to our customers directly. The qualification and set up of these independent manufacturers under quality assurance standards is an expensive and time-consuming process. Our reliance upon third party manufacturers could expose us to increased risks related to lead times, continuity of supply, on-time delivery, quality assurance, and compliance with environmental standards and other regulations. Reliance upon third party manufacturers also exposes us to significant risks related to their operations, financial position, business continuity, sourcing relationships and labor relationships that may affect their manufacturing of our products including their continued viability. Product manufacturing with our contract manufacturing partners principally takes place in the United States, Israel and Canada. Significant disruptions in these and other countries where our products or key components are manufactured, including natural disasters, epidemics, acts of war or terrorism, social or political unrest or work stoppages, could affect the cost, availability or allocation of supply and manufacturing capacity and negatively affect our business and results of operations. As a result, we may lose existing or potential customers or orders and our business may be negatively impacted.
If we fail to forecast component and material requirements accurately, we could incur additional costs or experience manufacturing delays.
We use rolling forecasts based on anticipated product orders to determine our component and material requirements. It is very important that we accurately predict both the demand for our products and the lead times required to obtain the necessary components and materials. Lead times for components and materials that we order vary significantly and depend on factors such as specific supplier requirements, the size of the order, contract terms and current market demand for the components. For substantial increases in production levels, some suppliers may need six months or more lead time. If we overestimate our component and material requirements, we may have excess or obsolete inventory, which may not get used or have to be discounted to eliminate. If we underestimate our component and material requirements, we may have inadequate inventory, which could interrupt our manufacturing and delay delivery of our products to our customers. Any of these occurrences could negatively impact our business.
14
Changes in key management and loss of highly qualified personnel could negatively affect our business.
Our ability to run our operations, develop, manufacture and market our products, and compete with our current and future competitors depends in large part on our ability to attract and retain qualified personnel. The loss or unavailability of any of our key personnel, which includes our executive officers, could have an adverse effect on the Company’s financial condition and results of operations. We have had a succession of chief executive officers and other executive management in the recent past, and maintaining consistency and providing structure and reliability to the Company's employees and our customers and vendors will be important for the Company's ability to produce reliable financial results. We are dependent upon our management team, especially in places where personal relationships are a significant part of a business transaction. We do not have succession plans in every key position, and the loss of the services of these officers could have a material adverse effect on our operations. Further, competition for highly-qualified engineers in the network equipment and integration industries is intense, and we will be required to compete for those personnel with companies having substantially greater financial and other resources than we do. If we do not attract and retain necessary team members to operate our business and build our products, our business could be materially adversely affected.
Our business and future operating results are subject to a wide range of uncertainties arising out of the international nature of our operations and facilities that could adversely affect our results of operations.
External revenues from foreign subsidiaries accounted for 22%, 24% and 26% of revenue for the years ended December 31, 2016, 2015, and 2014, respectively.
We have offices and facilities in, and conduct a significant portion of our operations in Israel. We are, therefore, influenced by the political and economic conditions affecting that country. Risks we face from international sales and our use of facilities and suppliers overseas for manufacturing include:
• | ensuring compliance with local regulations and laws in each country and locality in which we do business; |
• | greater difficulty in accounts receivable collection and longer collection periods; |
• | the impact of recessions in economies outside the United States; |
• | changes in regulatory requirements; |
• | seasonal reductions in business activities in some parts of the world, such as during the summer months in Europe; |
• | difficulties in managing operations across disparate geographic areas; |
• | difficulties associated with enforcing agreements through foreign legal systems; |
• | the payment of operating expenses in local currencies, which exposes us to risks of currency exchange rate fluctuations; |
• | higher credit risks requiring cash in advance or letters of credit; |
• | potentially adverse tax consequences, increasing taxes, and heightened efforts by officials of foreign countries to increase revenue from tax collection; |
• | unavailability or delays in delivery of equipment, raw materials or key components; |
• | trade restrictions, tariff increases and increasing import-export duties; |
• | shipping delays; |
• | limited protection of intellectual property rights; |
• | tightening immigration controls that may adversely affect our ability to hire new non-U.S. employees in our U.S. facilities; and |
• | increasing foreign environmental regulation or unforeseen environmental problems. |
Our business and operations are also subject to general geopolitical conditions, such as terrorism, political and economic instability, changes in the costs of key resources such as crude oil and changes in diplomatic or trade relationships. Economic conditions in several countries and markets outside the United States in which we have offices, personnel, facilities or sales represent significant risks to us. Instability in the Middle East, China or the European Union could have a negative impact on our sales and operations in these regions, and unstable conditions could have a material adverse effect on our business and results of operations. In addition to the effect of global economic instability on our operations or facilities on sales to customers outside the United States, sales to domestic customers could be negatively impacted by these conditions.
15
Our ability to utilize our NOLs and certain other tax attributes may be limited.
As of December 31, 2016 MRV had net operating losses ("NOLs") of $183.3 million, $112.0 million and $100.8 million, for federal, state and foreign income tax purposes, respectively. Under the Internal Revenue Code, if a corporation undergoes an "ownership change," the corporation's ability to use its pre-change NOLs, capital loss carry-forwards and other pre-change tax attributes to offset its post-change income may be limited. An ownership change is generally defined as a greater than 50% change in equity ownership over a three-year period. We may experience an ownership change in the future as a result of subsequent shifts in our stock ownership. If we were to trigger an ownership change in the future, our ability to use any NOLs and capital loss carry-forwards existing at that time could be limited. As of December 31, 2016, the US federal and state NOLs had a full valuation allowance.
Our business and future operating results may be adversely affected by events outside of our control.
We use our facilities in California, Massachusetts and Israel for major product design and development and customer support, and we manufacture products through third-party manufacturers in Israel, Taiwan and Canada. The risk of earthquakes in Southern California is significant because of the proximity of these facilities to major earthquake fault lines. In January 1994, major earthquakes near Chatsworth, California affected our facilities. While our facility did not suffer material damage and our business was not materially disrupted by this earthquake, the occurrence of an earthquake or other natural disaster could result in the disruption of our business. Cyber-attacks, or severe weather conditions and other natural phenomena (such as earthquakes, fire and floods, terrorist attacks, wars, etc.) could result in an unplanned event that could be significant in scale and could negatively impact the Company's operations, and transportation of products, which could have a negative impact on the Company's manufacturing ability, which could harm our operations and financial results.
Although we believe our insurance coverage is adequate to address the variety of potential liabilities we face, our insurance coverage is subject to deductibles and coverage limits. Upon an occurrence of a significant natural disaster, or manmade problems such as computer viruses, civil war, terrorism, blackout or disruptions to the economies of the United States and other countries, such coverage may not be adequate or continue to be available at commercially reasonable rates and terms. In the event of a major earthquake or other disaster affecting one or more of our facilities, our operations could be significantly disrupted, delayed or prevented for the time required to transfer production, repair, rebuild or replace the affected manufacturing facilities. This time frame could be lengthy, and result in significant expenses for repair and related costs. In addition, concerns about an outbreak of epidemic diseases such as avian or swine influenza or severe acute respiratory syndrome, could have a negative effect on travel and our business operations, and result in adverse consequences to our business and results of operations.
Environmental regulations applicable to our manufacturing operations could limit our ability to expand or subject us to substantial costs. Compliance with current and future environmental regulations may be costly which could impact our future operating results.
We are subject to a variety of environmental regulations relating to the use, storage, discharge and disposal of hazardous chemicals used during our development processes, as are the third parties who manufacture our products. Further, we are subject to other safety, labeling and training regulations as required by foreign, local, state and federal law. We believe we are compliant in all material respects with applicable environmental regulations in the United States, Taiwan and Israel. However, any failure by us or our contract manufacturers to comply with present and future regulations could subject us to future liabilities or the suspension of production. In addition, such regulations could restrict our ability to expand our facilities and we may need to acquire costly equipment or incur other significant expenses to comply with environmental regulations. We cannot provide assurance that legal requirements will not be imposed on us that would require additional capital expenditures or the satisfaction of other requirements. If we fail to obtain required permits or make adequate reporting submissions, or otherwise fail to operate within current or future legal requirements, including those applicable to us in the countries in which we manufacture our products, we may be required to pay substantial penalties, suspend our operations, or make costly changes to our development processes or facilities.
16
In addition, we could face significant costs and liabilities in connection with legislation which enables customers to return a product at the end of its useful life and charges us with financial and other responsibility for environmentally safe collection, recycling, treatment and disposal. We also face increasing complexity in our product design and procurement operations as we adjust to new and upcoming requirements relating to the materials composition of our products, and disclosure related to the origin of certain raw materials used in our products. This includes the restrictions on lead and certain other substances in electronics that apply to specified electronics products put on the market in the European Union and China. Many of our customers have adopted this approach and have required our full compliance. Even though we have devoted a significant amount of resources and effort planning and executing our compliance program and believe that we are in compliance with such legislation, it is possible that some of our products might be incompatible with such regulations. In such event, we could experience loss of revenue, damaged reputation, diversion of resources, monetary penalties and legal action. Other environmental regulations may require us to re-engineer our products to utilize components that are more environmentally compatible. Such re-engineering and component substitution may result in additional costs to us. Although we currently do not anticipate any material adverse effects based on the nature of our operations and the effect of such laws, there is no assurance that such existing laws or future laws will not have a material adverse effect on us.
Changes in accounting standards issued by the Financial Accounting Standards Board (“FASB”) or other standard-setting bodies may adversely affect the Company’s consolidated financial statements.
The Company’s consolidated financial statements are subject to the application of generally accepted accounting principles ("GAAP"), which is periodically revised and/or expanded. Accordingly, the Company is required to adopt new or revised accounting standards from time to time issued by recognized authoritative bodies, including the FASB. It is possible that future changes the Company is required to adopt could change the current accounting treatment that the Company applies to its consolidated financial statements and that such changes could have a material effect on the Company’s financial condition and results of operations.
New regulations related to conflict-free minerals may force us to incur additional expenses.
The Dodd-Frank Wall Street Reform and Consumer Protection Act contains provisions to improve transparency and accountability concerning the supply of minerals originating from the conflict zones of the Democratic Republic of Congo (DRC) and adjoining countries. As a result, in August 2012, the Securities and Exchange Commission adopted disclosure rules regarding a company’s use of conflict minerals in their products, with substantial supply chain verification requirements in the event that the conflict minerals come from, or could have come from the DRC or adjoining countries. These rules and verification requirements will impose additional costs on us and on our suppliers, and may limit the sources or increase the prices of materials used in our products. Further, if we are unable to certify that our products are conflict-free, we may face challenges with customers, which could place us at a competitive disadvantage and could harm our reputation.
Our business is dependent upon the proper functioning of our internal business processes and information systems and modification or interruption of such systems may disrupt our business, processes and internal controls.
We rely upon a number of internal business processes and information systems to support key business functions and the efficient operation of these processes and systems is critical to our business. We implemented an enterprise resource planning (“ERP”) system in 2013 that allows the financial and other business functions to interact and scale to support the growth of our business. The continued integration of the ERP system into our business can be costly and imposes substantial demands on management's time, and may be disruptive to our operations. Further, it may require changes in our other information systems, modification of internal control procedures and training of employees or third party resources. Our information technology systems, and those of third party providers, may also be vulnerable to damage or disruption caused by circumstances beyond our control. These include catastrophic events, power anomalies or outages, natural disasters, computer system or network failures, viruses or malware, physical or electronic break-ins, unauthorized access and cyber-attacks affecting our systems or those of third party business partners. Any material disruption, malfunction or similar challenges with our business processes or information systems, or disruptions or challenges relating to the transition to new processes, systems or providers, could have a material adverse effect on the operation of our business and our results of operations.
17
If we fail to protect our intellectual property, we may not be able to compete.
We rely on a combination of trade secret laws and restrictions on disclosure and patents, copyrights and trademarks to protect our intellectual property rights. We cannot be sure that our pending patent and trademark applications will be approved, that any patents or trademarks that may be issued will protect our intellectual property or that third parties will not challenge any issued patents. Other parties may independently develop similar or competing technology or design around any patents that may be issued to us. We cannot be certain that the steps we have taken will prevent the misappropriation of our intellectual property, particularly in foreign countries where the laws may not protect our proprietary rights as fully as in the United States. Specifically there is a risk of poor enforcement of intellectual property rights in China, where the validity, enforceability and scope of protection of intellectual property is uncertain and still evolving. Policing unauthorized use of proprietary technology is difficult and expensive. Reverse engineering, unauthorized copying or other misappropriation of our proprietary technologies could enable competitors, especially in China, to benefit from our technologies without paying us any royalties. Enforcing our intellectual property rights or resolving intellectual property disputes may involve litigation. Litigation of this sort, regardless of outcome, could be expensive and time consuming, and adverse determinations in any of this kind of litigation could seriously harm our business.
We are involved in intellectual property disputes from time to time as part of doing business in the network equipment industry, which could divert management's attention, cause us to incur significant costs, and prevent us from selling or using the challenged technology.
Participants in the network equipment markets in which we sell our products have experienced litigation regarding patent and other intellectual property rights. Numerous patents in these industries are held by others, including our competitors. From time to time, we have become aware of the possibility or have been notified that we may be infringing certain patents or other intellectual property rights of others, and we have been involved in litigation matters regarding intellectual property right claims of others in the past. In addition, we may be a party to litigation to protect our intellectual property. These claims and any resulting lawsuits, if successful, could subject us to significant liability for damages or invalidation of our proprietary rights, and there can be no assurance that we will be successful in our defense and, even if we are successful, we may incur substantial legal fees and other costs in defending such lawsuits. Any lawsuit that we may become party to, regardless of its success, may be time-consuming and expensive to resolve and divert technical and management time and attention. Accordingly, any infringement claim or litigation against us could significantly harm our business, operating results and financial condition. In the event of an adverse result in any litigation with respect to intellectual property rights relevant to our products, we could be required to obtain licenses to the infringing technology, to pay substantial damages under applicable law, to cease the manufacture, use and sale of infringing products, or to expend significant resources to develop non-infringing technology. Licenses may not be available from third parties either on commercially reasonable terms or at all.
Data breaches and cyber-attacks could compromise our intellectual property or other sensitive information and cause significant damage to our business and reputation.
In the ordinary course of our business, we maintain sensitive data on our servers, data centers and the cloud-based solutions on which customers, suppliers, and business partners' data are stored, including our intellectual property and proprietary or confidential business information relating to our business. The secure maintenance of this information is critical to our business and reputation. We believe that companies in the technology industry have been increasingly subject to a wide variety of security incidents, cyber-attacks and other attempts to gain unauthorized access. Notwithstanding our implementation of network security measures, our network and storage applications may be subject to unauthorized access by hackers or breached due to operator error, malfeasance or other system disruptions. In some cases, it is difficult to anticipate or immediately detect such incidents and the damage caused thereby. These data breaches and any unauthorized access or disclosure of our information, could compromise our intellectual property and expose sensitive business information. Cyber-attacks could also cause us to incur significant remediation costs, disrupt key business operations and divert attention of management and key information technology resources. These incidents could also subject us to liability, expose us to significant expense, or cause significant harm to our reputation.
18
We are involved in other lawsuits and legal proceedings, which, if determined against us, could require us to pay substantial damages, fines and/or penalties.
We are involved in various lawsuits, disputes and claims arising in the ordinary course of business. These suits or actions may raise complex factual and legal issues and are subject to uncertainties. Actions filed against us could include product liability, commercial, intellectual property, customer, employment, indemnification claims for past divestitures and securities related claims, including class action lawsuits. Plaintiffs (or defendants who counterclaim) may seek unspecified damages or injunctive relief, or both. Although we carry product liability and other insurance, and believe such coverage is adequate based on the historical rate and nature of customer product quality claims or complaints, we cannot provide assurance that this insurance would adequately cover our costs arising from any significant defects in our products. Adverse results to any lawsuits, disputes or claims may harm our business and have material adverse effects on our results of operations, liquidity or financial position, any or all of which could adversely affect our stock price.
Failure to achieve and maintain internal controls in accordance with Sections 302 and 404 of the Sarbanes-Oxley Act of 2002 could have a material adverse effect on our business and stock price.
We have examined and evaluated our internal control procedures to satisfy the requirements of Section 404 of the Sarbanes-Oxley Act of 2002 and identified no material weaknesses. We cannot assure you that we will not discover material weaknesses in the future. If we fail to maintain the internal controls we implemented, or fail to implement required new or improved controls, as such control standards are modified, supplemented or amended from time to time, or as our business changes, we may fail to meet our annual or periodic reporting obligations and there may be material misstatements in our financial statements, and substantial costs and resources may be required to rectify these or other internal control deficiencies. Effective internal controls are necessary for us to produce reliable financial reports and are important in the prevention of financial fraud. If we cannot produce reliable financial reports or prevent fraud, our business and operating results could be harmed, investors may lose further confidence in our reported financial information, there could be investigations or sanctions by regulatory authorities or litigation and there could be a material adverse effect on our stock price.
The Company's disclosure controls and procedures may not prevent or detect all acts of fraud.
The Company’s disclosure controls and procedures are designed to reasonably ensure that information required to be disclosed in reports filed or submitted under the Securities Exchange Act is accumulated and communicated to management and is recorded, processed, summarized, and reported within the time periods specified in the SEC’s rules and forms. The Company’s management believes that any disclosure controls and procedures or internal controls and procedures, no matter how well conceived and operated, can provide only reasonable, not absolute, assurance that the objectives of the control system are met. Because of the inherent limitations in all control systems, they cannot provide absolute assurance that all control issues and instances of fraud, if any, within the Company have been prevented or detected. These inherent limitations include the realities that judgments in decision making can be faulty and that breakdowns can occur because of a simple error or mistake. Additionally, controls can be circumvented by the individual acts of some persons, by collusion of two or more people, or by an unauthorized override of the controls. The design of any system of controls also is based in part upon certain assumptions about the likelihood of future events, and the Company cannot ensure that any design will succeed in achieving its stated goals under all potential future conditions. Accordingly, because of the inherent limitations in a cost effective control system, misstatements due to error or fraud may occur and may not be detected.
Failure to comply with the U.S. Foreign Corrupt Practices Act or the U.K. Bribery Act could subject us to penalties and other adverse consequences. We could suffer losses from corrupt or fraudulent business practices.
We are subject to the U.S. Foreign Corrupt Practices Act ("FCPA"), and potentially the U.K. Bribery Act, each of which generally prohibits companies from engaging in bribery or making other prohibited payments to foreign officials for the purpose of obtaining or retaining business. In addition, we are required to maintain records that accurately and fairly represent our transactions and have an adequate system of internal accounting controls. Foreign companies, including some that may compete with us, are not subject to these prohibitions, and therefore may have a competitive advantage over us. We have implemented and maintained preventative measures and policies, but cannot assure that our employees or other agents will not engage in such conduct and render us responsible under the FCPA. If our employees or other agents are found to have engaged in these practices, we could suffer severe penalties and other consequences that may have a material adverse effect on our business, financial condition and results of operations.
19
Our Rights Plan, Delaware law and our ability to issue additional preferred stock may have anti-takeover effects that could prevent a change in control, which may cause our stock price to decline.
On January 26, 2016, the Board approved the adoption of a "Rights Plan" in an effort to protect the Company from potential adverse consequences arising under the Internal Revenue Code, such adverse consequences including a significant reduction in the annual utilization of the Company’s net operating loss carryforwards and built-in losses and the impairment or loss of the NOLs and built-in losses prior to their use. While the Rights Plan is intended to reduce the risk of an “ownership change” within the meaning of Section 382, and thereby preserve the current ability of the Company to utilize NOLs, the Rights Plan could have certain anti-takeover effects. The Rights will cause substantial dilution to a person or group acquiring 4.99% or more of our outstanding Common Stock on terms not approved by the Board.
We are authorized to issue up to 1,000,000 shares of Preferred Stock. This Preferred Stock may be issued in one or more series, the terms of which may be determined at the time of issuance by our Board of Directors without further action by stockholders. The terms of any series of preferred stock may include voting rights (including the right to vote as a series on particular matters), preferences as to dividend, liquidation, conversion and redemption rights and sinking fund provisions. No preferred stock is currently outstanding. The issuance of any preferred stock could materially adversely affect the rights of the holders of our Common Stock, and therefore reduce the value of our Common Stock. In particular, specific rights granted to future holders of preferred stock could be used to restrict our ability to merge with, or sell our assets to, a third party and thereby preserve control by the present management. We are also subject to the anti-takeover provisions of Section 203 of the Delaware General Corporation Law, which prohibit us from engaging in a business combination with an interested stockholder (generally an entity that, together with its affiliates, owns or within the last three-year period has owned 15% or more of our Common Stock) for a period of three years after the date of the transaction in which the person became an interested stockholder unless the business combination is approved in the manner prescribed under Section 203. These provisions of Delaware law also may discourage, delay or prevent someone from acquiring or merging with us, which may cause the market price of our Common Stock to decline.
Our largest stockholder may be able to exert significant influence over key corporate actions requiring a stockholder vote.
At March 8, 2017, the Company’s largest stockholder, Raging Capital, beneficially owned approximately 31% of the Company’s outstanding Common Stock and had two representatives - Kenneth H. Traub and Brian J. Bellinger - on the Board of Directors. Raging Capital's significant ownership of the Company and its representation on the Board of Directors may allow Raging Capital to exert significant influence over corporate actions requiring stockholder approval, including the following actions:
• | to elect or defeat the election of the Company’s directors; |
• | to amend or prevent amendment of the Company’s Certificate of Incorporation or Bylaws; |
• | to effect or prevent a merger, sale of assets or other corporate transaction; and |
• | to control the outcome of any other matter submitted to the Company’s stockholders for vote. |
Raging Capital's ownership may also discourage a potential acquirer from making a tender offer or otherwise attempting to obtain control of the Company, which in turn could reduce the Company’s stock price or prevent the Company’s stockholders from realizing a premium over the Company’s stock price.
We do not currently intend to pay dividends on our Common Stock, and, consequently, stockholders’ ability to achieve a return on their investment will depend on appreciation in the price of our Common Stock.
We have not declared or paid cash dividends on our Common Stock since 2012, and do not currently intend to do so for the foreseeable future. We currently intend to retain all available funds and future earnings, if any, for use in the operation of our business. Therefore, investors are not likely to receive any dividends on their Common Stock for the foreseeable future, and the success of an investment in shares of our Common Stock will depend upon any future appreciation in its value. There is no guarantee that shares of our Common Stock will appreciate in value or even maintain the price at which our stockholders have purchased their shares. Any future determination to declare dividends will be made at the discretion of the board of directors and will depend on our financial condition, operating results, capital requirements, general business conditions and other factors that our board of directors may deem relevant.
20
Because this Form 10-K contains forward-looking statements, it may not prove to be accurate.
This Form 10-K and other Company releases and filings with the SEC may contain forward-looking statements. Words such as "will likely result," "are expected to," " is anticipated," "appear," "believe," "could," "estimate," "expect," "intend," "may," "should," "outlook," "plan," "project," "contemplate," "target," "foresee," "goal," "likely," "will," and "would" or variations of such words and similar expressions, are intended to identify such forward-looking statements which are not statements of historical facts. These forward-looking statements are not guarantees of future performance nor guarantees that the events anticipated will occur or expected conditions will remain the same or improve. These statements involve certain risks, uncertainties and assumptions, the likelihood of which are difficult to assess and may not occur, including risks that each of its business units may not make the expected progress in its respective market, or that management's long-term strategy may not achieve the expected results. Therefore, actual outcomes, performance and results may differ from what is expressed or forecast in such forward-looking statements, and such differences may vary materially from current expectations. We do not undertake to update any forward-looking statements or risk factors to reflect future events or circumstances.
Item 1B. Unresolved Staff Comments.
None.
Item 2. Properties.
Our properties consist of leased facilities for product development, sales, support, and administrative operations. Our largest offices are located in Chatsworth, California (Los Angeles area) and Chelmsford, Massachusetts (Boston Area) in the United States and in Yokneam, Israel (Haifa area). We believe that our existing properties are in good condition and suitable for the conduct of our business. Should the need arise; we believe that suitable replacement and additional space will be available in the future on commercially reasonable terms subject to force majeure conditions. For additional information regarding obligations under operating leases, see Note 9 to the consolidated financial statements located in Item 8 of this Form 10-K.
Item 3. Legal Proceedings.
We are subject to legal claims and litigation in the ordinary course of business, including but not limited to product liability, employment and intellectual property claims. The outcome of any such matters is currently not determinable. In addition, we were party to the litigation set forth below.
Nhan T. Vo, individually and on behalf of other aggrieved employees vs. MRV Communications, Inc., Superior Court of California, County of Los Angeles. On June 27, 2013, the plaintiff in this matter filed a lawsuit against the Company alleging claims for failure to properly pay overtime or provide meal and rest breaks to its non-exempt employees in California, among other things. The complaint seeks an unspecified amount of damages and penalties under provisions of the Labor Code, including the Labor Code Private Attorneys General Act. The Company has filed an answer denying all allegations regarding the plaintiff’s claims and asserting various defenses. Management believes it has accrued adequate reserves for this matter and does not expect the matter to have a material adverse effect on its business or financial condition. However, depending on the actual outcome of this case, further provisions could be recorded in the future which may have a material adverse effect on the Company’s operating results.
In connection with the sale by MRV of Source Photonics, Inc. ("SPI") in October 2010, MRV agreed to indemnify the buyer against certain claims brought after the closing for prior-occurring events. The Company has received a notice from SPI, advising the Company of a tax audit for periods including tax returns filed prior to the acquisition of SPI by the buyer. Management believes that it has meritorious defenses to the extent a formal indemnification claim is asserted and has notified its insurer of the potential claim. MRV intends to vigorously contest any claim; however, no formal legal proceeding has been commenced, and MRV can provide no assurance that such claim would not have a material adverse effect on its business, operating results or financial condition.
From time to time, MRV receives notices from third parties alleging possible infringement of patents with respect to product features or manufacturing processes. Management believes such notices are common in the communications industry because of the large number of patents that have been filed on these subjects. The Company's policy is to discuss these notices with the parties in an effort to demonstrate that MRV's products and/or processes do not violate any patents. Management does not believe that any of these matters will result in a material adverse outcome.
21
MRV and its subsidiaries have from time to time been named as a defendant in other lawsuits involving matters that management considers routine to the nature of its business. Management is of the opinion that the ultimate resolution of such outstanding matters will not have a material adverse effect on our business, operating results and financial condition.
Item 4. Mine Safety Disclosures.
Not applicable.
22
PART II
Item 5. Market for the Company's Common Equity, Related Stockholder Matters and Issuer Purchases of Equity Securities.
Market Information and Holders
Our Common Stock is traded on the NASDAQ Capital Market under the symbol "MRVC". The high and low sales prices (by quarter) during the last two comparable twelve month periods are as follows:
High | Low | |||||||
Year Ended December 31, 2016 | ||||||||
First quarter ending March 31 | $ | 12.99 | $ | 8.75 | ||||
Second quarter ending June 30 | $ | 11.95 | $ | 8.95 | ||||
Third quarter ending September 30 | $ | 13.09 | $ | 10.61 | ||||
Fourth quarter ending December 31 | $ | 14.40 | $ | 7.11 | ||||
Year Ended December 31, 2015 | ||||||||
First quarter ending March 31 | $ | 11.65 | $ | 6.38 | ||||
Second quarter ending June 30 | $ | 12.35 | $ | 7.25 | ||||
Third quarter ending September 30 | $ | 21.50 | $ | 11.03 | ||||
Fourth quarter ending December 31 | $ | 15.20 | $ | 12.01 | ||||
As of March 7, 2017 the closing price of our Common Stock was $7.10 per share, and there were approximately 1,122 stockholders of record.
Dividends
The payment of dividends on the Company's Common Stock is within the discretion of the Company's Board of Directors. The Board of Directors did not declare cash dividends during the years ended December 31, 2016 and 2015. The Board of Directors regularly evaluates its capital position to consider the return of cash to stockholders. The Board of Directors does not currently have plans to begin paying a regular dividend.
Equity Compensation Plans
The table below sets forth information with respect to shares of Common Stock that may be issued under our stock option plans as of December 31, 2016.
Plan Category | Number of securities issuable upon exercise of outstanding options | Weighted average exercise price of outstanding options | Number of securities remaining available for future issuance under equity compensation plans (excluding securities reflected in column (a)) | |||||||
(a) | (b) | (c) | ||||||||
Equity compensation plans approved by security holders (1) | 599,973 | $ | 12.68 | 531,204 | ||||||
Equity compensation plans not approved by security holders | — | $ | — | — | ||||||
Total | 599,973 | $ | 12.68 | 531,204 | ||||||
(1) Includes shares underlying options granted under the 2007 Omnibus Incentive Plan, as amended, (the "Omnibus Plan") and the 2015 Long Term Incentive Plan.
In May 2015, MRV's stockholders approved the 2015 Long Term Incentive Plan (LTIP) to replace MRV's outstanding equity compensation plan, the Omnibus Plan. Upon adoption of the 2015 Long Term Incentive Plan, no further shares were available for future grants of options or warrants under its predecessor plans including shares that become available as a consequence of the cancellation or forfeiture of outstanding options granted under such plans.
23
Performance Graph
The chart below compares the five-year cumulative total return, assuming the reinvestment of dividends, on MRV's Common Stock with that of the NASDAQ Composite Index, and the RDG SmallCap Technology Index. The graph assumes $100 was invested on December 31, 2011, in our Common Stock and the companies in each of the NASDAQ Composite Index, and the RDG SmallCap Technology Index. It should be noted that this graph represents historical stock price performance and should not be considered indicative of potential future stock price performance.
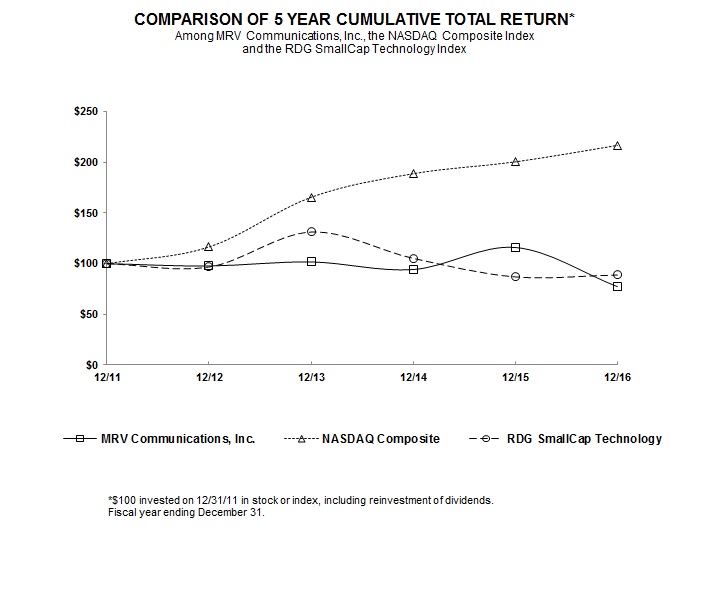
Cumulative Total Return | ||||||||||||||||||
2011 | 2012 | 2013 | 2014 | 2015 | 2016 | |||||||||||||
MRV Communications, Inc. | 100.00 | 97.70 | 101.69 | 94.19 | 115.91 | 77.31 | ||||||||||||
NASDAQ Composite | 100.00 | 116.41 | 165.47 | 188.69 | 200.32 | 216.54 | ||||||||||||
RDG SmallCap Technology | 100.00 | 96.74 | 131.16 | 105.22 | 86.98 | 88.81 | ||||||||||||
24
Issuer Purchases of Equity Securities
On March 15, 2016, the Company's Board of Directors approved a repurchase of shares of the Company's Common Stock in an amount up to $10.0 million under a stock repurchase program scheduled to expire on March 10, 2017. On November 2, 2016, the Company's Board of Directors approved the termination of the Company's stock repurchase program. During the year ended December 31, 2016, the Company repurchased a total of 264,058 shares at a total cost of approximately $2.7 million, excluding commissions, under this stock repurchase program, leaving remaining authority to repurchase shares up to an additional $7.3 million, excluding commissions, under this stock repurchase program prior to its termination.
Period | Total number of shares purchased | Average price paid per share | Total number of shares purchased as part of publicly announced plans or programs | Maximum amount remaining for purchase under the repurchase plan | ||||||||||
October 1, 2016 to October 31, 2016 | 31,774 | $ | 11.55 | 31,774 | $ | 7,260,758 | ||||||||
November 1, 2016 to November 30, 2016 | — | $ | — | — | $ | — | ||||||||
December 1, 2016 to December 31, 2016 | — | $ | — | — | $ | — | ||||||||
Total | 31,774 | $ | 11.55 | 31,774 | ||||||||||
Item 6. Selected Financial Data.
The following data should be read in conjunction with "Management's Discussion and Analysis of Financial Condition and Results of Operations" and the consolidated financial statements and notes thereto, in Items 7 and 8, respectively, of this Annual Report on Form 10-K in order to fully understand factors that may affect the comparability of the financial data.
On December 3, 2015, we sold all of the issued and outstanding capital stock of Tecnonet, which was the last business unit in our Network Integration segment. We have reclassified the historical financial results of Tecnonet as discontinued operations in all periods presented. The historical results do not necessarily indicate results expected for any future period. (See Note 3, Discontinued Operations)
The following selected balance sheet data as of December 31, 2016 and 2015 and selected statement of operations data for each of the three years in the period ended December 31, 2016 are derived from our audited financial statements included in Item 8 of this Annual Report on Form 10-K. The selected balance sheet data as of December 31, 2014, 2013 and 2012 and selected statement of operations data for the years ended December 31, 2013 and 2012 are derived from the selected financial data contained in Item 6 of MRV's 2014 Annual Report on Form 10-K after giving effect to the discontinued operations of Tecnonet.
25
Year ended December 31, | ||||||||||||||||||||
(in thousands, except per share amounts) | 2016 | 2015 | 2014 | 2013 | 2012 | |||||||||||||||
Statements of Operations Data: | ||||||||||||||||||||
Revenues | $ | 80,315 | $ | 88,199 | $ | 86,538 | $ | 90,564 | $ | 79,241 | ||||||||||
Cost of sales | 41,209 | 42,619 | 43,937 | 43,496 | 35,916 | |||||||||||||||
Gross profit | 39,106 | 45,580 | 42,601 | 47,068 | 43,325 | |||||||||||||||
Operating expenses: | ||||||||||||||||||||
Product development and engineering | 20,481 | 20,448 | 20,833 | 19,381 | 15,344 | |||||||||||||||
Selling, general and administrative | 29,674 | 28,966 | 35,080 | 36,696 | 42,338 | |||||||||||||||
Total operating expenses | 50,155 | 49,414 | 55,913 | 56,077 | 57,682 | |||||||||||||||
Operating loss | (11,049 | ) | (3,834 | ) | (13,312 | ) | (9,009 | ) | (14,357 | ) | ||||||||||
Interest and other income (expense), net | (266 | ) | (103 | ) | 647 | (383 | ) | 2,330 | ||||||||||||
Loss from continuing operations before income taxes | (11,315 | ) | (3,937 | ) | (12,665 | ) | (9,392 | ) | (12,027 | ) | ||||||||||
Provision (benefit) for income taxes | 322 | 2,871 | 1,873 | (34 | ) | (2,549 | ) | |||||||||||||
Loss from continuing operations | (11,637 | ) | (6,808 | ) | (14,538 | ) | (9,358 | ) | (9,478 | ) | ||||||||||
Income (loss) from discontinued operations, net of tax | — | (371 | ) | 2,383 | 2,536 | 15,142 | ||||||||||||||
Net income (loss) | $ | (11,637 | ) | $ | (7,179 | ) | $ | (12,155 | ) | $ | (6,822 | ) | $ | 5,664 | ||||||
Net income (loss) per share — basic: | ||||||||||||||||||||
From continuing operations | $ | (1.69 | ) | $ | (0.97 | ) | $ | (1.98 | ) | $ | (1.25 | ) | $ | (1.21 | ) | |||||
From discontinued operations | — | (0.05 | ) | 0.32 | 0.34 | 1.94 | ||||||||||||||
Net income (loss) per share — basic | $ | (1.69 | ) | $ | (1.02 | ) | $ | (1.66 | ) | $ | (0.91 | ) | $ | 0.72 | ||||||
Net income (loss) per share — diluted: | ||||||||||||||||||||
From continuing operations | $ | (1.69 | ) | $ | (0.97 | ) | $ | (1.98 | ) | $ | (1.25 | ) | $ | (1.21 | ) | |||||
From discontinued operations | — | (0.05 | ) | 0.32 | 0.34 | 1.94 | ||||||||||||||
Net income (loss) per share — diluted | $ | (1.69 | ) | $ | (1.02 | ) | $ | (1.66 | ) | $ | (0.91 | ) | $ | 0.72 | ||||||
Basic weighted average shares | 6,886 | 7,019 | 7,344 | 7,484 | 7,813 | |||||||||||||||
Diluted weighted average shares | 6,886 | 7,019 | 7,344 | 7,484 | 7,817 | |||||||||||||||
Cash dividend declared per share | $ | — | $ | — | $ | — | $ | — | $ | 7.40 | ||||||||||
December 31, | ||||||||||||||||||||
(in thousands) | 2016 | 2015 | 2014 | 2013 | 2012 | |||||||||||||||
Selected Balance Sheet Data: | ||||||||||||||||||||
Cash and cash equivalents | $ | 25,116 | $ | 26,169 | $ | 16,142 | $ | 26,028 | $ | 39,824 | ||||||||||
Working capital | 27,635 | 39,481 | 47,081 | 58,249 | 69,111 | |||||||||||||||
Total assets | 56,260 | 69,084 | 114,572 | 127,947 | 128,565 | |||||||||||||||
Total long-term liabilities | 3,478 | 3,846 | 5,271 | 5,236 | 5,184 | |||||||||||||||
Additional paid-in capital | 1,287,336 | 1,285,787 | 1,284,483 | 1,281,883 | 1,281,170 | |||||||||||||||
Accumulated deficit | (1,239,308 | ) | (1,227,671 | ) | (1,120,492 | ) | (1,208,337 | ) | (1,201,515 | ) | ||||||||||
Total stockholders' equity | $ | 28,699 | $ | 41,446 | $ | 50,970 | $ | 63,790 | $ | 72,901 | ||||||||||
26
Item 7. Management's Discussion and Analysis of Financial Condition and Results of Operations.
The following discussion and analysis of our financial condition and results of operations should be read in conjunction with the consolidated financial statements and notes thereto included in Item 8 of this Annual Report on Form 10-K. In addition to historical information, the discussion in this Annual Report on Form 10-K contains certain forward-looking statements that involve risks and uncertainties. Our actual results could differ materially from those anticipated by these forward-looking statements. We assume no obligation to update any of the forward-looking statements after the date of this Annual Report on Form 10-K. The following discussion and analysis is organized as follows:
• | Overview |
• | Critical Accounting Policies |
• | Recently Issued Accounting Standards |
• | Currency Rate Fluctuations |
• | Results of Operations |
• | Liquidity and Capital Resources |
• | Off Balance Sheet Arrangements |
Overview
At MRV, we design, develop and sell products and services that enable our customers to build reliable, scalable and cost effective networks.
We develop our products and services to meet the needs of telecommunications service providers and cable operators (collectively “Service Providers”), data center operators, government entities and enterprises, including the education, financial, healthcare and equipment manufacturing segments in the Americas, EMEA and APAC.
Our technologies, platforms and expertise enable our customers to overcome the challenge of orchestrating the ever-increasing need for capacity while improving service delivery and lowering network costs for critical applications such as high-capacity business services, mobile backhaul and data center connectivity.
Until the third quarter of 2015, we operated our business along two principal segments: Network Equipment and Network Integration. Our Network Integration segment, which consisted of Tecnonet as its sole business unit, operated primarily in Italy, servicing Tier One service providers, regional carriers, large enterprises, and government institutions. Tecnonet is a supplier of a wide range of communications equipment from leading global manufacturers, as well as telecommunications solutions and services, including network infrastructure, unified communications, mobility and wireless, network security, cloud computing services, managed call center services, network integration, and optimization. On December 3, 2015, the Company completed the sale of all of the shares of Tecnonet.
The sale of Tecnonet is reported as discontinued operations requiring retrospective restatement of prior periods to classify the results of operations for Tecnonet as discontinued operations in this Form 10-K for all periods presented. Cash flows from discontinued operations are presented separately from the cash flows from continuing operations in the accompanying Statement of Cash Flows. (See Note 3, Discontinued Operations)
Our business involves reliance on foreign-based offices. Several of our divisions, outside subcontractors and suppliers are located in foreign countries; including Argentina, Australia, Canada, Denmark, Germany, Israel, Italy, Netherlands, Philippines, Poland, Russia, Taiwan, Thailand, and the United Kingdom. For the years ended December 31, 2016, 2015 and 2014, external revenues from foreign subsidiaries accounted for 22%, 24% and 26%, respectively, of our total revenue. The majority of our foreign sales are to customers located in the European region, with remaining foreign sales primarily to customers in the Asia Pacific region.
In 2016, we experienced improvement in the Americas (excluding the U.S.) but witnessed contraction in Europe, United States and Asia Pacific geographic regions. In 2015, we experienced significant improvement in Asia Pacific and in the Americas (excluding the U.S.) but witnessed significant contraction in the United States and minor deterioration in Europe. The variations in 2016 and 2015 were not materially impacted by exchange rates fluctuations.
27
As of December 31, 2016, the Company had $25.1 million in cash and cash equivalents and $0.3 million in restricted time deposits.
On December 16, 2014, the Company's Board of Directors approved a repurchase of shares of the Company's Common Stock in an amount up to $8.0 million under a stock repurchase program which expired in accordance with its terms on November 13, 2015. During the year ended December 31, 2015, the Company repurchased 502,077 shares at a total cost of approximately $4.9 million, excluding commission, under this stock repurchase program.
On March 15, 2016, the Company's Board of Directors approved a repurchase of shares of the Company's Common Stock in an amount up to $10.0 million under a stock repurchase program scheduled to expire on March 10, 2017. On November 2, 2016, the Company's Board of Directors approved the termination of the Company's stock repurchase program. During the year ended December 31, 2016, the Company repurchased a total of 264,058 shares at a total cost of approximately $2.7 million, excluding commissions, under this stock repurchase program, leaving remaining authority to repurchase shares up to an additional $7.3 million, excluding commissions, under this stock repurchase program prior to its termination.
Critical Accounting Policies
Our discussion and analysis of the Company's financial condition and results of operations are based upon the financial statements, which have been prepared in accordance with U.S. generally accepted accounting principles (“GAAP”).
The preparation of these consolidated financial statements requires us to make estimates and judgments that affect the reported amounts of assets, liabilities, revenue and expenses, and related disclosure of contingent assets and liabilities. We believe that the estimates, assumptions and judgments involved in the accounting policies described below have the greatest potential impact on our financial statements, so we consider these to be our critical accounting policies. Because of the uncertainty inherent in these matters, actual results could differ from the estimates we use in applying the critical accounting policies. Certain of these critical accounting policies affect working capital account balances, including the policies for revenue recognition, allowance for doubtful accounts, inventory reserves and income taxes. These policies require that we make estimates in the preparation of our consolidated financial statements as of a given date. In 2016, the Company accounted for a change in estimate related to the useful lives of its service inventory resulting in a $0.2 million charge to cost of services and increasing net loss $0.2 million for the year ended December 31, 2016. The change in accounting estimate also affected the Company's basic and diluted net loss per share $0.03 for the year ended December 31, 2016.
Within the context of these critical accounting policies, we are not currently aware of any reasonably likely events or circumstances that would result in materially different amounts being reported.
Prior Period Reclassifications. The sale of Tecnonet is reported as discontinued operations requiring retrospective restatement of prior periods to classify the results of operations for Tecnonet as discontinued operations in this Form 10-K for all periods presented. We have also reclassified the related assets and liabilities transferred as "assets of discontinued operations" and "liabilities of discontinued operations" on the Consolidated Balance Sheet as of December 31, 2014. Cash flows from discontinued operations are presented separately from the cash flows from continuing operations in the accompanying Statement of Cash Flows. (See Note 3, Discontinued Operations)
28
Revenue Recognition. Our major revenue-generating products consist of switches and routers, console management, physical layer products, and fiber optic components. We recognize product revenue, net of sales discounts, returns and allowances, when persuasive evidence of an arrangement exists, delivery has occurred and all significant contractual obligations have been satisfied, the fee is fixed or determinable and collection is considered reasonably assured. Products are generally shipped "FOB shipping point," with no right of return and revenue is recognized upon shipment. If revenue is to be recognized upon delivery, such delivery date is tracked through information provided by the third party shipping company we use to deliver the product to the customer. Sales of services and system support are deferred and recognized ratably over the contract period. Sales to end customers with contingencies, such as rights of return, rotation rights and conditional acceptance provisions, are infrequent and insignificant and are deferred until the contingencies have been satisfied or the contingent period has lapsed. For sales to distributors, we generally recognize revenue when product is sold to the distributor rather than when the product is sold by the distributor to the end user. In certain circumstances, distributors have limited rights of return such as stock rotation rights. We estimate and establish allowances for expected future product returns and credits. We record a reduction in revenue for estimated future product returns and future credits to be issued to the customer in the period in which revenue is recognized, and for future credits to be issued in relation to price protection at the time we make changes to our distributor price book. We monitor product returns and potential price adjustments on an ongoing basis and estimate future returns and credits based on historical sales returns, analysis of credit memo data, and other factors known at the time of revenue recognition.
We generally warrant our products against defects in materials and workmanship for 90 days to three year periods. The estimated costs of warranty obligations and sales returns and other allowances are recognized at the time of revenue recognition based on contract terms and prior claims experience.
Accounting for Multiple-Element Arrangements. We allocate arrangement consideration at the inception of the arrangement to all deliverables using the relative selling price method. The selling price we use for each deliverable is based on (a) vendor-specific objective evidence if available; (b) third-party evidence if vendor-specific objective evidence is not available; or (c) estimated selling price if neither vendor-specific objective evidence nor third-party evidence is available. We allocate discounts in the arrangement proportionally on the basis of the selling price of each deliverable.
Allowance for Doubtful Accounts. We make ongoing estimates relating to the collectability of our accounts receivable and maintain a reserve for estimated losses resulting from the inability of customers to meet their financial obligations to us. In determining the amount of the reserve, we consider our historical level of credit losses and make judgments about the creditworthiness of significant customers based on ongoing credit evaluations. Because we cannot precisely predict future changes in the financial stability of our customers, actual future losses from uncollectible accounts may differ from our estimates. If the financial condition of our customers deteriorates, resulting in their inability to make payments, a larger reserve may be required. In the event we determine that a change in the allowance is appropriate, we would record a credit or a charge to selling, general and administrative expense in the period in which we make such a determination.
Concentration of Credit Risk. Financial instruments that potentially subject the Company to concentrations of credit risk consist primarily of cash and cash equivalents placed with high credit quality institutions and accounts receivable due from customers. We perform ongoing credit evaluations of our customers and maintain reserves for potential credit losses.
Inventory. We make ongoing estimates relating to the net realizable value of inventories, based upon our assumptions about future demand and market conditions. If we estimate that the net realizable value of our inventory is less than the cost of the inventory recorded on our books, we record an adjustment to the cost basis equal to the difference between the cost of the inventory and the estimated net realizable market value. This adjustment is recorded as a charge to cost of goods sold, and includes estimates for excess quantities and obsolete inventory. If changes in market conditions result in reductions in the estimated net realizable value of our inventory below previous estimates, we would make further adjustments in the period in which we make such a determination and record a charge to cost of goods sold. At the time of recording the adjustment, a new, lower cost basis for that inventory is established, and subsequent changes in facts and circumstances do not result in the restoration of, or increase in, that newly established cost basis.
29
Intangibles. We make judgments about the recoverability of intangible assets with finite lives whenever events or changes in circumstances indicate that impairment may exist. Recoverability of intangible assets with finite lives is measured by comparing the carrying amount of the asset to the future undiscounted cash flows the asset is expected to generate. Our ongoing consideration of all the factors described previously could result in additional impairment charges in the future, which could adversely affect our net income.
Software Development Costs. Development costs related to software products are expensed as incurred until the technological feasibility of the product has been established. Technological feasibility occurs when a working model is completed or a detail program design exists. After technological feasibility is established, additional costs are capitalized. We believe that our process for internally developed software is essentially completed concurrent with the establishment of technological feasibility, and, accordingly, no software development costs for internally developed software have been capitalized to date.
Internal Use Software Development. Any software that we acquire, internally develop, or modify solely to meet our internal needs, and for which we have no substantive plan to market the software externally, is capitalized.
Income Taxes. As part of the process of preparing our annual financial statements, we estimate the income taxes in each of the jurisdictions in which we operate based on the estimated annual effective tax rate by jurisdiction. This process involves estimating the current income tax exposure together with assessing temporary differences resulting from differing treatment of items, such as deferred revenue, for income tax and accounting purposes. These differences result in deferred income tax assets and liabilities, which are included in our Consolidated Balance Sheets. We assess the likelihood that our deferred income tax assets will be recovered from future taxable income and, to the extent we believe that recovery is not likely, we establish a valuation allowance. To the extent we establish a valuation allowance or increase this allowance in a period, we include an expense within the income tax provision in the Consolidated Statements of Operations.
We utilize significant management judgment to determine the provision for income taxes, deferred income tax assets and liabilities, including uncertain tax positions, and any valuation allowance recorded against net deferred income tax assets. Management periodically evaluates the deferred income tax assets as to whether it is likely that the deferred income tax assets will be realized. We establish a valuation allowance on the deferred income tax asset at the time we determine the asset is not likely to be realized. If we later determine that it is more-likely-than-not that a deferred tax asset will be realized, we release the valuation allowance and record a credit within the Consolidated Statements of Operations.
Share-Based Compensation. We determine the fair value of stock options using the Black-Scholes valuation model. The assumptions used in calculating the fair value of share-based payment awards represent our best estimates. Our estimates may be impacted by certain variables including stock price volatility, employee stock option exercise behaviors, additional stock option grants, estimates of forfeitures, and the related income tax impact. (See Note 12 “Share-Based Compensation” to the Consolidated Financial Statements in Item 8 of this Form 10-K for further discussion.)
Currency Rate Fluctuations
Changes in the relative values of non-U.S. currencies to the U.S. dollar affect our results. We conduct a significant portion of our business in foreign currencies, the Israeli new shekel and to a substantially lesser extent, the Taiwan dollar and Euro. For the years ended December 31, 2016 and 2015, 22% and 24% of external revenue, respectively, and 35% and 36% of operating expenses, respectively, were incurred at foreign subsidiaries. During the year ended December 31, 2016, the Israeli new shekel strengthened 1% against the U.S. dollar, translating revenue and expense into slightly more dollars than they would have in the prior period, while the Taiwan dollar weakened 2% against the U.S. dollar, translating into slightly fewer dollars than they would have in the prior period. The Euro was relatively flat against the U.S. dollar during the year ended December 31, 2016 when compared to the prior year period. Additional discussion of foreign currency risk and other market risks is included in Part II, Item 7a “Quantitative and Qualitative Disclosures About Market Risk” of this Form 10-K.
30
Results of Operations
The following table sets forth, for the periods indicated, certain consolidated statements of operations data (in thousands):
For the Years Ended December 30, | ||||||||||||
2016 | 2015 | 2014 | ||||||||||
Revenue: | ||||||||||||
Product revenue | $ | 68,349 | $ | 77,553 | $ | 76,828 | ||||||
Service revenue | 11,966 | 10,646 | 9,710 | |||||||||
Total revenue | 80,315 | 88,199 | 86,538 | |||||||||
Cost of Revenue: | ||||||||||||
Cost of product | 36,335 | 38,496 | 39,705 | |||||||||
Cost of services | 4,874 | 4,123 | 4,232 | |||||||||
Total cost of revenue | 41,209 | 42,619 | 43,937 | |||||||||
Gross profit | 39,106 | 45,580 | 42,601 | |||||||||
Operating expenses: | ||||||||||||
Product development and engineering | 20,481 | 20,448 | 20,833 | |||||||||
Selling, general and administrative | 29,674 | 28,966 | 35,080 | |||||||||
Total operating expenses | 50,155 | 49,414 | 55,913 | |||||||||
Operating loss | (11,049 | ) | (3,834 | ) | (13,312 | ) | ||||||
Interest expense | — | (55 | ) | (24 | ) | |||||||
Other income (expense), net | (266 | ) | (48 | ) | 671 | |||||||
Loss from continuing operations before provision for income taxes | (11,315 | ) | (3,937 | ) | (12,665 | ) | ||||||
Provision for income taxes | 322 | 2,871 | 1,873 | |||||||||
Loss from continuing operations | (11,637 | ) | (6,808 | ) | (14,538 | ) | ||||||
Income (loss) from discontinued operations, net of income taxes of $1,311 and $2,430 in 2015 and 2014, respectively | — | (371 | ) | 2,383 | ||||||||
Net loss | $ | (11,637 | ) | $ | (7,179 | ) | $ | (12,155 | ) | |||
Discontinued Operations
On December 3, 2015, the Company completed the sale of all of its shares of Tecnonet. On February 19, 2016, the Company received a payment of €4.3 million (approximately $4.8 million) representing the post-closing purchase price adjustment pursuant to the Purchase Agreement. The Company included the $4.8 million receivable representing the post-closing purchase price adjustment on its consolidated balance sheet within other current assets as of December 31, 2015. Prior to its disposition, Tecnonet was the last remaining business unit in our Network Integration segment. The historical financial results of Tecnonet, prior to its sale, have been reclassified as discontinued operations for all periods presented.
In 2015, the Company reported an after-tax gain on the sale of Tecnonet in the amount of $0.2 million. In addition, the Company recorded a cumulative translation loss of $2.2 million and $0.8 million in transaction costs related to the sale, all of which are recorded within discontinued operations in 2015. The $2.2 million of foreign currency related losses included $1.0 million of historical translation related adjustments previously included in accumulated other comprehensive income on the consolidated balance sheet and $1.2 million recognized loss on the intercompany obligation that was settled as part of the transaction.
The results of operations of Tecnonet for the years ended December 31, 2015 and 2014 that are reflected in consolidated statements of operations as discontinued operations consist of the following (in thousands):
31
Year Ended December 31: | 2015 | 2014 | ||||||
Revenue: | ||||||||
Product revenue | $ | 32,315 | $ | 47,649 | ||||
Service revenue | 30,274 | 37,869 | ||||||
Total revenue | 62,589 | 85,518 | ||||||
Cost of Revenue: | ||||||||
Cost of product | 28,472 | 42,883 | ||||||
Cost of services | 24,181 | 29,458 | ||||||
Total cost of revenue | 52,653 | 72,341 | ||||||
Gross profit | 9,936 | 13,177 | ||||||
Selling, general and administrative (1) | 6,574 | 7,615 | ||||||
Operating income | 3,362 | 5,562 | ||||||
Interest expense | (124 | ) | (305 | ) | ||||
Cumulative translation loss recognized upon sale of Tecnonet | (2,180 | ) | — | |||||
Other expense, net | (307 | ) | (444 | ) | ||||
Income from discontinued operations before income taxes | 751 | 4,813 | ||||||
Provision for income taxes | 1,311 | 2,430 | ||||||
(Loss) income from discontinued operations, net of tax | (560 | ) | 2,383 | |||||
Gain on sale of Tecnonet, net of tax | 189 | — | ||||||
Net income (loss) from discontinued operations, net of income taxes | $ | (371 | ) | $ | 2,383 | |||
(1) Includes Transaction costs of $0.8 million in 2015.
The assets and liabilities of Tecnonet were removed from our consolidated balance sheet as of the date of the divestiture.
32
Year ended December 31, 2016 Compared to the Year ended December 31, 2015
Year Ended December 31: | 2016 | 2015 | $ Change | % Change | |||||||||||
Revenue: | |||||||||||||||
Product revenue | $ | 68,349 | $ | 77,553 | $ | (9,204 | ) | (12 | )% | ||||||
Service revenue | 11,966 | 10,646 | 1,320 | 12 | % | ||||||||||
Total revenue | 80,315 | 88,199 | (7,884 | ) | (9 | )% | |||||||||
Cost of Revenue: | |||||||||||||||
Cost of product | 36,335 | 38,496 | (2,161 | ) | (6 | )% | |||||||||
Cost of services | 4,874 | 4,123 | 751 | 18 | % | ||||||||||
Total cost of revenue | 41,209 | 42,619 | (1,410 | ) | (3 | )% | |||||||||
Gross profit | 39,106 | 45,580 | (6,474 | ) | (14 | )% | |||||||||
Operating expenses: | |||||||||||||||
Product development and engineering | 20,481 | 20,448 | 33 | — | % | ||||||||||
Selling, general and administrative | 29,674 | 28,966 | 708 | 2 | % | ||||||||||
Total operating expenses | 50,155 | 49,414 | 741 | 1 | % | ||||||||||
Operating loss | (11,049 | ) | (3,834 | ) | (7,215 | ) | 188 | % | |||||||
Interest expense | — | (55 | ) | 55 | (100 | )% | |||||||||
Other expense, net | (266 | ) | (48 | ) | (218 | ) | 454 | % | |||||||
Loss from continuing operations before provision for income taxes | (11,315 | ) | (3,937 | ) | (7,378 | ) | 187 | % | |||||||
Provision for income taxes | 322 | 2,871 | (2,549 | ) | (89 | )% | |||||||||
Loss from continuing operations | (11,637 | ) | (6,808 | ) | 4,829 | (71 | )% | ||||||||
Loss from discontinued operations, net of income taxes of $1,311 | — | (371 | ) | (371 | ) | 100 | % | ||||||||
Net loss | $ | (11,637 | ) | $ | (7,179 | ) | $ | 4,458 | (62 | )% | |||||
Revenue
Revenue decreased $7.9 million, or 9% for the year ended December 31, 2016 compared to the year ended December 31, 2015, primarily driven by a $9.2 million, or 12%, decrease in product revenue, offset by a $1.3 million, or 12%, increase in service revenue. The decrease in revenue in three out of four geographic regions was driven by reduced sales of legacy infrastructure management products and fewer network expansion projects particularly in the United States. The $3.2 million decrease in revenues generated in the United States was attributable to decreased order volume for legacy infrastructure management products and from regional service providers for project related expansions. Additionally, revenues in the United States were impacted by delays in expected timing of run rate orders at a large regional service provider. The $4.9 million decrease in revenues generated in Europe was primarily the result of a decrease in channel partner order volume resulting from decreased sales to a couple of significant Carrier Ethernet customers, a reduced number of project sales for optical transport, and some loss of passive components business to low cost competition. The $1.2 million decline in revenues generated in the Asia Pacific region was primarily the result of decreased orders from a Global Tier-1 service provider customer who adjusted its inventory levels beginning in the third quarter of fiscal 2016. The reduced demand from both the large regional service provider in the United States and our Tier-1 customer in the Asia Pacific region was short term in nature. These decreases were partially offset by the $1.4 million increase in revenues generated in the Americas (excluding the U.S.) primarily the result of increased orders from a Tier-1 customer in Canada.
The following table summarizes revenue by geographic region (in thousands):
33
Favorable/(Unfavorable) | |||||||||||||||
Year ended December 31: | 2016 | 2015 | $ Change | % Change | |||||||||||
Revenue: | |||||||||||||||
United States | $ | 39,727 | $ | 42,933 | $ | (3,206 | ) | (7 | )% | ||||||
Americas (Excluding the U.S.) | 8,250 | 6,828 | 1,422 | 21 | % | ||||||||||
Europe | 14,531 | 19,463 | (4,932 | ) | (25 | )% | |||||||||
Asia Pacific | 17,807 | 18,975 | (1,168 | ) | (6 | )% | |||||||||
Total revenue | $ | 80,315 | $ | 88,199 | $ | (7,884 | ) | (9 | )% | ||||||
Gross Profit
The Company's cost of revenue consists of raw materials, compensation expense including non-cash stock-based compensation expense, depreciation expense and other manufacturing overhead costs, expenses associated with excess and obsolete inventories, and product warranty costs. Historically, our cost of revenue as a percentage of revenue, which we refer to as our gross margin, has fluctuated significantly due to product mix, manufacturing yields and sales volumes, and inventory and specific product warranty charges.
Consolidated gross profit decreased $6.5 million, or 14%, for the year ended December 31, 2016, compared to the year ended December 31, 2015, principally due to the $7.0 million, or 18%, decrease in product revenue gross profit, offset by the $0.6 million, or 9% increase in service revenue gross profit. The combined gross profit margin for product and service revenues decreased 3.0 percentage points to 48.7% for the year ended December 31, 2016, compared to 51.7% for the year ended December 31, 2015. The gross profit margin for product revenues decreased 3.6 percentage points to 46.8% for the year ended December 31, 2016, compared to 50.4% for the year ended December 31, 2015, while the gross profit margin for service revenues decreased 2.0 percentage points to 59.3% for the year ended December 31, 2016, compared to 61.3% for the year ended December 31, 2015. The decline in product gross profit margin was primarily a result of termination benefits paid to operations employees in connection with their termination following the consolidation of all packet and optical manufacturing into a single contract manufacturer and the effect of the mix of products sold and the geographic region sold into. The decline in service revenue gross profit margin was primarily attributable to a $0.4 million increase in labor expense that was directly related to improvement efforts related to customer support and maintenance to enhance our customer experience and a charge of approximately $0.4 million for excess and obsolete inventory.
Operating Expenses
Consolidated operating expenses were $50.2 million, or 62% of revenue, for the year ended December 31, 2016, compared to $49.4 million, or 56% of revenue, for the year ended December 31, 2015.
Operating expenses increased $0.7 million, or 1% for the year ended December 31, 2016, compared to the year ended December 31, 2015. The increase was primarily comprised of a $1.7 million increase in general and administrative expenses offset by a $1.0 million decrease in sales and marketing expenses. Product development and engineering expenses were relatively flat year over year. The $1.7 million increase in general and administrative expenses included $0.6 million of one-time termination benefits attributable to a headcount reduction initiated in December 2016, $0.6 million due to increased accounting and legal fees, $0.3 million increase in share based compensation expenses and $0.2 million increase in other overhead expenses related to the facility consolidation. The fluctuations in product development and engineering were also affected by one-time termination benefits related to a reduction in force initiated in December 2016 in the amount of $0.3 million, partially offset by a $0.2 million decrease in material costs. The $1.0 million decrease in sales and marketing was primarily driven due to lower salaries and wages in the amount of $1.3 million due to decreased headcount, partially offset by one-time termination benefits related due to a reduction in force initiated in December 2016 in the amount of $0.6 million, and a $0.3 million decrease in sales commission expenses due primarily to lower product revenue.
Operating Loss
The Company reported an operating loss of $11.0 million for the year ended December 31, 2016, compared to an operating loss of $3.8 million for the year ended December 31, 2015. The $7.2 million decline in operating results was primarily the result of $7.9 million, or 9%, decrease in revenues in addition to the $0.7 million, or 1% increase in operating expenses. Our operating margin declined to (14)% for the year ended December 31, 2016, compared to
34
(4)% operating margin for the year ended December 31, 2015. The operating loss included share-based compensation expense of $1.5 million and $1.1 million for the year ended December 31, 2016 and 2015, respectively.
Provision for Income Taxes
The tax provision for the year ended December 31, 2016 was $0.3 million compared to $2.9 million for the year ended December 31, 2015. The decrease in income tax expense in 2016 is primarily attributable to an increase in pre-tax loss in 2016 when compared to 2015. Additionally, the 2015 year was burdened by an increase in the valuation allowance of $2.6 million related to our foreign subsidiaries. Our income tax provision fluctuates based on the amount of pre-tax income or loss generated in the various jurisdictions where we conduct operations and pay income tax.
Tax Loss Carryforwards
As of December 31, 2016, MRV had federal, state, and foreign net operating loss ("NOL") carryforwards available of $183.3 million, $112.0 million and $100.8 million, respectively. Under the Internal Revenue Code, if a corporation undergoes an "ownership change," the corporation's ability to use its pre-change NOLs, capital loss carry-forwards and other pre-change tax attributes to offset its post-change income may be limited. An ownership change is generally defined as a greater than 50% change in its equity ownership by value over a three-year period. We may experience an ownership change in the future as a result of subsequent shifts in our stock ownership. If we were to trigger an ownership change in the future, our ability to use any NOLs and capital loss carry-forwards existing at that time could be limited. As of December 31, 2016, the federal, state and foreign NOLs had a full valuation allowance.
On January 26, 2016, the Company's Board of Directors approved the adoption of a "Rights Plan" in an effort to protect the Company from potential adverse consequences arising under the Internal Revenue Code, such adverse consequences including a significant reduction in the annual utilization of the Company’s net operating loss carryforwards and built-in losses and the impairment or loss of the NOLs and built-in losses prior to their use. (See Note 11, Stockholders' Equity)
35
Year ended December 31, 2015 Compared To Year ended December 31, 2014
Year Ended December 31: | 2015 | 2014 | $ Change | % Change | |||||||||||
Revenue: | |||||||||||||||
Product revenue | $ | 77,553 | $ | 76,828 | $ | 725 | 1 | % | |||||||
Service revenue | 10,646 | 9,710 | 936 | 10 | % | ||||||||||
Total revenue | 88,199 | 86,538 | 1,661 | 2 | % | ||||||||||
Cost of Revenue: | |||||||||||||||
Cost of product | 38,496 | 39,705 | (1,209 | ) | (3 | )% | |||||||||
Cost of services | 4,123 | 4,232 | (109 | ) | (3 | )% | |||||||||
Total cost of revenue | 42,619 | 43,937 | (1,318 | ) | (3 | )% | |||||||||
Gross profit | 45,580 | 42,601 | 2,979 | 7 | % | ||||||||||
Operating expenses: | |||||||||||||||
Product development and engineering | 20,448 | 20,833 | (385 | ) | (2 | )% | |||||||||
Selling, general and administrative | 28,966 | 35,080 | (6,114 | ) | (17 | )% | |||||||||
Total operating expenses | 49,414 | 55,913 | (6,499 | ) | (12 | )% | |||||||||
Operating loss | (3,834 | ) | (13,312 | ) | 9,478 | (71 | )% | ||||||||
Interest expense | (55 | ) | (24 | ) | (31 | ) | 129 | % | |||||||
Other income (expense), net | (48 | ) | 671 | (719 | ) | (107 | )% | ||||||||
Loss from continuing operations before provision for income taxes | (3,937 | ) | (12,665 | ) | 8,728 | (69 | )% | ||||||||
Provision for income taxes | 2,871 | 1,873 | 998 | 53 | % | ||||||||||
Loss from continuing operations | (6,808 | ) | (14,538 | ) | (7,730 | ) | 53 | % | |||||||
Income (loss) from discontinued operations, net of income taxes of $1,311 and $2,430, respectively | (371 | ) | 2,383 | 2,754 | 116 | % | |||||||||
Net loss | $ | (7,179 | ) | $ | (12,155 | ) | $ | (4,976 | ) | 41 | % | ||||
Revenue
Revenue increased $1.7 million, or 2% for the year ended December 31, 2015 compared to the year ended December 31, 2014, primarily due to a $0.9 million, or 10%, increase in service revenue and $0.7 million, or 1%, increase in product revenue. The $0.9 million improvement in service revenue was primarily driven by better penetration rates, along with engineering fees related to deployment of our end-to-end solutions. Revenue for our optical transport and carrier Ethernet products increased during the year ended December 31, 2015 compared to the year ended December 30, 2014, offset by a decrease in network and infrastructure management products. Geographically, the increase in revenues was mainly attributable to higher sales in Latin America and Asia Pacific. Sales in Asia Pacific increased $5.5 million in the year ended December 31, 2015 when compared to December 31, 2014 as there was increased order volume over the same period in the prior year from a Tier One carrier. Sales in Latin America experienced increased order volume from one of our larger South American customers in Chile. Sales in the United States decreased $8.1 million in the year ended December 31, 2015 when compared to the year ended December 31, 2014, primarily driven by timing of bookings from two of the region’s top customers. Sales in Europe decreased $1.0 million in the year ended December 31, 2015 when compared to the year ended December 31, 2014 as a result of a decrease in channel partner order volume.
36
The following table summarizes revenue by geographic region (in thousands):
Favorable/(Unfavorable) | |||||||||||||||
Year ended December 31: | 2015 | 2014 | $ Change | % Change | |||||||||||
Revenue: | |||||||||||||||
United States | $ | 42,933 | $ | 51,036 | $ | (8,103 | ) | (16 | )% | ||||||
Americas (Excluding the U.S.) | 6,828 | 1,507 | 5,321 | 353 | % | ||||||||||
Europe | 19,463 | 20,478 | (1,015 | ) | (5 | ) | |||||||||
Asia Pacific | 18,975 | 13,517 | 5,458 | 40 | |||||||||||
Total revenue | $ | 88,199 | $ | 86,538 | $ | 1,661 | 2 | % | |||||||
Gross Profit
Consolidated gross profit increased $3.0 million, or 7%, for the year ended December 31, 2015, compared to the year ended December 31, 2014, principally due to a $1.9 million, or 5%, increase in product revenue gross profit and the $1.1 million or 19% increase in service revenue gross profit. The combined gross profit margin for product and service revenues increased 2.5 percentage points to 51.7% for the year ended December 31, 2015, compared to 49.2% for the year ended December 31, 2014. The gross profit margin for service revenues increased 4.9 percentage points to 61.3% for the year ended December 31, 2015, compared to 56.4% for the year ended December 31, 2014, while the gross profit margin for product revenues increased 2.1 percentage points to 50.4% for the year ended December 31, 2015, compared to 48.3% for the year ended December 31, 2014. The 2.5 percentage point improvement in combined gross profit margin was primarily a result of the revenue mix shift toward products that generally have higher margins, in addition to improvements made in our supply chain related to a re-alignment of outsourcing and contract manufacturing efforts that have afforded us savings in our internal overhead.
Operating Expenses
Consolidated operating expenses were $49.4 million, or 56% of revenue, for the year ended December 31, 2015, compared to $55.9 million, or 65% of revenue, for the year ended December 31, 2014.
Operating expenses decreased $6.5 million, or 12% for the year ended December 31, 2015, compared to the year ended December 31, 2014. The decrease was primarily comprised of a $2.5 million decrease in salaries and wages, a $1.0 million decrease in travel and advertising related expenses, a $1.8 million decrease in legal, consulting and accounting fees and a $1.2 million decrease in other general and administrative charges.
Operating Loss
The Company improved its operating results $9.5 million or 71% during the year ended December 31, 2015 compared to the year ended December 31, 2014. The improvement in operating results was primarily the result of $3.0 million, or 7%, increase in gross profit along with the $6.5 million, or 12% planned decrease in operating expenses. Our operating margin improved to (4)% for the year ended December 31, 2015 compared to (15)% operating margin for the year ended December 31, 2014. Operating loss included share-based compensation expense of $1.1 million and $0.9 million for the years ended December 31, 2015 and 2014, respectively.
Provision for Income Taxes
The tax provision for the year ended December 31, 2015 was $2.9 million compared to $1.9 million for the year ended December 31, 2014. The increase in income tax expense in 2015, is primarily attributable to an increase in the valuation allowance of $2.6 million related to our foreign subsidiaries, compared to an increase in the valuation allowance of $1.9 million recorded in 2014, related to our German subsidiary. Our income tax provision fluctuates based on the amount of pre-tax income or loss generated in the various jurisdictions where we conduct operations and pay income tax.
37
Discontinued Operations
The Company reported a $0.4 million loss from discontinued operations for the year ended December 31, 2015, compared to income from discontinued operations of $2.4 million for the year ended December 31, 2014. The tax provision for discontinued operations was $1.3 million and $2.4 million for the years ended December 31, 2015 and 2014, respectively. The effective income tax rate of our discontinued operations increased from 50% in 2014 to 175% in 2015 due to nondeductible transaction costs and the cumulative translation loss recognized in 2015. The effective tax rate for 2014 also includes the settlement of prior Italy tax examinations. The Company completed the sale of Tecnonet on December 3, 2015. Please see Note 3, "Discontinued Operations" for further discussion.
Liquidity and Capital Resources
During the year ended December 31, 2016, the Company's cash decreased $1.1 million to $25.1 million from $26.2 million. As of December 31, 2016 and 2015, the Company's U.S. entities held $19.2 million and $21.6 million in cash and cash equivalents. The remaining $5.9 million and $4.6 million, respectively, were held by the company's foreign subsidiaries in foreign bank deposit accounts. There were net cash inflows from working capital of approximately $1.0 million, including $2.1 million in accounts payable and accrued liabilities as a result of timing of cash disbursements, $0.8 million decrease in inventory due to timing of shipments, $0.6 million in accounts receivable primarily due to timing of cash receipts, offset by cash outflows of $1.8 million in deferred revenue due to timing of shipments and $0.7 million in other assets. Net cash provided by investing activities included $4.8 million in proceeds from the sale of the Tecnonet and $4.9 million in proceeds from the release of restricted time deposits, offset by $0.8 million in purchases of property, plant and equipment and $0.2 million in purchases of intangible assets. Net cash used in financing activities included $2.7 million in purchases of treasury shares.
We periodically review our capital position and consider returning capital to stockholders through special dividends or share repurchases when cash on hand exceeds our foreseeable cash needs. We also periodically review the capital needs of our business units. We plan to invest approximately $2.6 million over the next 12 months to upgrade our infrastructure and equipment needed to support the Company's growth objectives in the carrier Ethernet and optical transport markets among others. We believe that cash on hand will be sufficient to satisfy current operating needs, capital expenditures, and product development and engineering requirements for at least the next 12 months. We may seek to obtain additional debt or equity financing if we believe it appropriate. We may limit our ability to use available NOLs and capital loss carryforwards if we seek financing through issuance of additional equity securities.
Working Capital
The following table summarizes our working capital position at December 31, (in thousands):
2016 | 2015 | |||||||
Current assets | $ | 51,718 | $ | 63,273 | ||||
Current liabilities | 24,083 | 23,792 | ||||||
Working capital | $ | 27,635 | $ | 39,481 | ||||
Current ratio (1) | 2.1 | 2.7 | ||||||
(1) Determined by dividing total current assets by total current liabilities.
Off-Balance Sheet Arrangements
We do not have transactions, arrangements or other relationships with unconsolidated entities that are reasonably likely to affect our liquidity or capital resources. We have no special purpose or limited purpose entities that provided off-balance sheet financing, liquidity or market or credit risk support, engaged in leasing, hedging, research and development services, or other relationships that expose us to liability that is not reflected on the face of the financials.
38
Indemnification
In connection with the sale by MRV of SPI in October 2010, MRV agreed to indemnify the buyer against certain claims brought after the closing for prior-occurring events. Most of the indemnification obligations have expired; however, indemnifications related to employee benefits, environmental liabilities and taxes extend until their applicable statute of limitations has run plus 90 days, and indemnification obligations are not time limited for title and ownership representations. These indemnification obligations are subject to a $1.0 million deductible and a $20.0 million cap and we have purchased an insurance policy to protect against such obligations.
The Company has received a notice from SPI, advising the Company of a tax audit for periods including tax returns filed prior to the acquisition of SPI by the buyer. MRV believes that it has meritorious defenses to the extent a formal indemnification claim is asserted and has submitted the potential claim to its insurer. MRV intends to vigorously contest any claim; however, no formal legal proceeding has been commenced, and MRV can provide no assurance that such claim would not have a material adverse effect on its business, operating results or financial condition.
Our agreements for the sale of certain businesses (CES Creative Electronic Systems SA ("CES") in March 2012, Alcadon and Interdata in October 2012, and Tecnonet in December 2015) include customary indemnification obligations running to the respective buyers.
In connection with the sale of CES, MRV agreed to indemnify the buyer for the representations and warranties made in the sale purchase agreement and purchased an insurance policy to protect against any claims of indemnification related to the representations and warranties.
In addition, MRV has indemnification obligations to its current and former officers and directors as set forth in the Company's bylaws. We have agreements whereby our officers and directors are indemnified for certain events or occurrences while the officer or director is, or was, serving at our request in such capacity. The maximum potential amount of future payments we could be required to make under these indemnification agreements is unlimited; however, we retain directors and officers insurance that reduces our exposure and enables us to recover portions of amounts paid. As a result of our insurance coverage, we believe the estimated fair value of these indemnification agreements is minimal.
Accordingly, no liabilities have been recorded for these indemnification agreements as of December 31, 2016 and 2015.
In the normal course of business to facilitate sales of its products, MRV indemnifies other parties, including customers, lessors and parties to other transactions with us, with respect to certain matters. The Company has agreed to hold the other parties harmless against losses arising from a breach of representation or covenants, for intellectual property infringement, or other claims made against certain parties. These agreements may limit the time within which an indemnification claim can be made and the amount of the claim.
We cannot estimate the amount of potential future payments, if any, that it might be required to make as a result of these obligations. Over the last decade, the Company has not incurred any significant expense as a result of obligations of this type. Accordingly, the Company has not accrued any amounts for such indemnification obligations. However, there can be no assurances that expenses will not be incurred under these indemnification provisions in the future.
39
Contractual Obligations
The following table illustrates our contractual obligations as of December 31, 2016 (in thousands):
Contractual Obligations | Total | Less than 1 Year | 1 - 3 Years | 3 - 5 Years | After 5 Years | |||||||||||||||
Operating leases | $ | 2,242 | $ | 984 | $ | 1,006 | $ | 252 | $ | — | ||||||||||
Purchase commitments with suppliers and contract manufacturers | 14,192 | 14,192 | — | — | — | |||||||||||||||
Deferred consideration payable | 233 | 233 | — | — | — | |||||||||||||||
Total contractual obligations | $ | 16,667 | $ | 15,409 | $ | 1,006 | $ | 252 | $ | — | ||||||||||
We expect to have sufficient cash and cash flow to meet our short-term and long-term obligations shown in the table above. Our operating leases consist primarily of leases for buildings worldwide from which we conduct our business. Purchase commitments consist primarily of purchase orders for components used to build finished goods inventory.
Internet Access to Our Financial Documents
We maintain a website at www.mrv.com. We make available, free of charge, either by direct access or hyperlink, our Annual Reports on Form 10-K, Quarterly Reports on Form 10-Q, Current Reports on Form 8-K and amendments to those reports filed or furnished pursuant to Section 13(a) or 15(d) of the Exchange Act as soon as reasonably practicable after such reports are electronically filed with, or furnished to, the SEC. Our reports filed with, or furnished to, the SEC are also available directly at the SEC's website at www.sec.gov.
Item 7A. Quantitative and Qualitative Disclosures About Market Risk.
Market risk represents the risk of loss that may impact our consolidated financial statements through adverse changes in financial market prices and rates and inflation. Our market risk exposure results primarily from fluctuations in foreign exchange and interest rates. We manage our exposure to these market risks through our regular operating and financing activities and, when deemed necessary, through the use of derivative financial instruments. The Company may from time to time use derivative financial instruments as risk management tools to manage risks of volatility in interest and foreign exchange rate movements on anticipated transactions and not for trading or speculative purposes and does not maintain such instruments that may expose the Company to significant market risk. During the years ended December 31, 2016, 2015 and 2014 the Company did not use derivative financial instruments and as of December 31, 2016 and 2015, the Company did not have any such derivative financial instruments outstanding.
Interest Rates. Our investments expose us to interest rate fluctuations. Our cash and short-term investments are subject to limited interest rate risk, and are primarily maintained in money market funds and bank deposits.
Foreign Exchange Rates. We operate on an international basis with revenues and expenses transacted in currencies other than the U.S. dollar. Fluctuation in the value of these foreign currencies affects our results and will cause U.S. dollar translation of such currencies to vary from one period to another. We cannot predict the effect of exchange rate fluctuations upon future operating results. However, because we have revenues and expenses in each of these foreign currencies, the effect on our results of operations from currency fluctuations is reduced.
Certain assets and liabilities, including certain bank accounts, accounts receivables, and accounts payables of some of our business units, exist in currencies other than the functional currency of the related business units and are sensitive to foreign currency exchange rate fluctuations. These currencies principally include the U.S. dollar, the Israeli new shekel, the Euro, and the Taiwan dollar. When these transactions are settled in a currency other than the functional currency, we recognize a foreign currency transaction gain or loss.
40
When we translate the financial position or results of operations of subsidiaries with functional currencies other than the U.S. dollar, we recognize a foreign currency translation gain or loss as a component of other comprehensive income (loss). Changes in the relative values of non-U.S. currencies to the U.S. dollar affect our results. We conduct a significant portion of our business in foreign currencies, the Israeli new shekel and o a substantially lesser extent, the Taiwan dollar and Euro. For the year ended December 31, 2016 and 2015, 22% and 24% of external revenue, and 35% and 36%, respectively, of operating expenses, were incurred at foreign subsidiaries. During the year ended December 31, 2016, the Israeli new shekel strengthened 1% against the U.S. dollar, translating revenue and expense into slightly more dollars than they would have in the prior period, while the Taiwan dollar weakened 2% against the U.S. dollar, translating into slightly fewer dollars than they would have in the prior period. The Euro was relatively flat against the U.S. dollar during the year ended December 31, 2016 when compared to the prior year period.
Fluctuations in currency exchange rates of foreign currencies have an impact on the U.S. dollar equivalent of such currencies included in cash and cash equivalents reported in our financial statements. The following table summarizes cash and cash equivalents held in various currencies and translated into U.S. dollars (in thousands).
December 31 | 2016 | 2015 | ||||||
U.S. dollars | $ | 22,923 | $ | 23,461 | ||||
Euros | 194 | 171 | ||||||
Taiwan dollars | 43 | 141 | ||||||
Israeli new shekels | 952 | 1,723 | ||||||
Other | 1,004 | 673 | ||||||
Total cash and cash equivalents | $ | 25,116 | $ | 26,169 | ||||
Macro-economic uncertainties. We believe that the past few years of sustained softness in the global economy has affected our revenues and operating results. When economic uncertainties increase, our customers often take a more cautious approach in their capital expenditures, resulting in order delays, slowing deployments, and lengthening sales cycles. This may lead to increased competition for projects and price pressures resulting in lower gross margins. Despite these economic uncertainties, we believe that our customers need to continue investing in their networks to meet the growth in consumer and enterprise use of high-bandwidth communications services. We believe in our longer term market opportunities, but we are uncertain how long the downturn in economic conditions will continue and how our customers will interpret and react to market conditions.
41
Item 8. Financial Statements and Supplementary Data.
Report of Independent Registered Public Accounting Firm
Board of Directors and Stockholders
MRV Communications, Inc.
We have audited the accompanying consolidated balance sheets of MRV Communications, Inc., a Delaware corporation (the “Company”), as of December 31, 2016 and 2015, and the related consolidated statements of operations, comprehensive loss, stockholders’ equity, and cash flows for each of the three years in the period ended December 31, 2016. These financial statements are the responsibility of the Company’s management. Our responsibility is to express an opinion on these financial statements based on our audits.
We conducted our audits in accordance with the standards of the Public Company Accounting Oversight Board (United States). Those standards require that we plan and perform the audit to obtain reasonable assurance about whether the financial statements are free of material misstatement. An audit includes examining, on a test basis, evidence supporting the amounts and disclosures in the financial statements. An audit also includes assessing the accounting principles used and significant estimates made by management, as well as evaluating the overall financial statement presentation. We believe that our audits provide a reasonable basis for our opinion.
In our opinion, the consolidated financial statements referred to above present fairly, in all material respects, the financial position of MRV Communications, Inc. as of December 31, 2016 and 2015, and the results of their operations and their cash flows for each of the three years in the period ended December 31, 2016, in conformity with accounting principles generally accepted in the United States of America.
We also have audited, in accordance with the standards of the Public Company Accounting Oversight Board (United States), the Company’s internal control over financial reporting as of December 31, 2016, based on criteria established in the 2013 Internal Control-Integrated Framework issued by the Committee of Sponsoring Organizations of the Treadway Commission (COSO), and our report dated March 9, 2017 expressed an unqualified opinion thereon.
/s/ Grant Thornton LLP
Los Angeles, California
March 9, 2017
42
MRV Communications, Inc.
Consolidated Statements of Operations
For the Years Ended December 31,
(In thousands, except per share data)
2016 | 2015 | 2014 | ||||||||||
Revenue: | ||||||||||||
Product revenue | $ | 68,349 | $ | 77,553 | $ | 76,828 | ||||||
Service revenue | 11,966 | 10,646 | 9,710 | |||||||||
Total revenue | 80,315 | 88,199 | 86,538 | |||||||||
Cost of Revenue: | ||||||||||||
Cost of product | 36,335 | 38,496 | 39,705 | |||||||||
Cost of services | 4,874 | 4,123 | 4,232 | |||||||||
Total cost of revenue | 41,209 | 42,619 | 43,937 | |||||||||
Gross profit | 39,106 | 45,580 | 42,601 | |||||||||
Operating expenses: | ||||||||||||
Product development and engineering | 20,481 | 20,448 | 20,833 | |||||||||
Selling, general and administrative | 29,674 | 28,966 | 35,080 | |||||||||
Total operating expenses | 50,155 | 49,414 | 55,913 | |||||||||
Operating loss | (11,049 | ) | (3,834 | ) | (13,312 | ) | ||||||
Interest expense | — | (55 | ) | (24 | ) | |||||||
Other income (expense), net | (266 | ) | (48 | ) | 671 | |||||||
Loss from continuing operations before provision for income taxes | (11,315 | ) | (3,937 | ) | (12,665 | ) | ||||||
Provision for income taxes | 322 | 2,871 | 1,873 | |||||||||
Loss from continuing operations | (11,637 | ) | (6,808 | ) | (14,538 | ) | ||||||
Income (loss) from discontinued operations, net of income taxes of $1,311 and $2,430 in 2015 and 2014, respectively | — | (371 | ) | 2,383 | ||||||||
Net loss | $ | (11,637 | ) | $ | (7,179 | ) | $ | (12,155 | ) | |||
Net income (loss) per share — basic and diluted | ||||||||||||
From continuing operations | $ | (1.69 | ) | $ | (0.97 | ) | $ | (1.98 | ) | |||
From discontinued operations | — | (0.05 | ) | 0.32 | ||||||||
Net loss per share — basic and diluted | $ | (1.69 | ) | $ | (1.02 | ) | $ | (1.66 | ) | |||
Weighted average number of shares: | ||||||||||||
Basic and diluted | 6,886 | 7,019 | 7,344 | |||||||||
The accompanying notes are an integral part of these consolidated financial statements.
43
MRV Communications, Inc.
Consolidated Statements of Comprehensive Loss
For the Years Ended December 31,
(In thousands)
2016 | 2015 | 2014 | ||||||||||
Net loss | $ | (11,637 | ) | $ | (7,179 | ) | $ | (12,155 | ) | |||
Other comprehensive income (loss), net of tax | ||||||||||||
Foreign currency translation gain (loss) | 84 | (886 | ) | (3,265 | ) | |||||||
Foreign currency translation loss realized upon divestiture of subsidiary | — | 2,180 | — | |||||||||
Other comprehensive income (loss): | 84 | 1,294 | (3,265 | ) | ||||||||
Total comprehensive loss | $ | (11,553 | ) | $ | (5,885 | ) | $ | (15,420 | ) | |||
The accompanying notes are an integral part of these consolidated financial statements.
44
MRV Communications, Inc.
Consolidated Balance Sheets
(In thousands, except par values)
December 31, 2016 | December 31, 2015 | ||||||
Assets | |||||||
Current assets: | |||||||
Cash and cash equivalents | $ | 25,116 | $ | 26,169 | |||
Restricted time deposits | 272 | 5,190 | |||||
Accounts receivable, net | 14,295 | 14,837 | |||||
Inventories | 9,657 | 10,226 | |||||
Other current assets | 2,378 | 6,851 | |||||
Total current assets | 51,718 | 63,273 | |||||
Property and equipment, net | 3,130 | 4,050 | |||||
Intangible assets, net | 1,064 | 1,153 | |||||
Other assets | 348 | 608 | |||||
Total assets | $ | 56,260 | $ | 69,084 | |||
Liabilities and stockholders' equity | |||||||
Current liabilities: | |||||||
Deferred consideration payable | $ | 233 | $ | 233 | |||
Accounts payable | 8,353 | 5,749 | |||||
Accrued liabilities | 9,195 | 9,972 | |||||
Deferred revenue | 6,146 | 7,642 | |||||
Other current liabilities | 156 | 196 | |||||
Total current liabilities | 24,083 | 23,792 | |||||
Long-term liabilities | 3,478 | 3,846 | |||||
Commitments and contingencies (Note 9) | |||||||
Stockholders' equity: | |||||||
Preferred Stock, $0.01 par value: Authorized — 1,000 shares; no shares issued or outstanding | — | — | |||||
Common Stock, $0.0017 par value: | |||||||
Authorized — 16,000 shares | |||||||
Issued — 8,425 shares in 2016 and 8,341 shares in 2015 | |||||||
Outstanding — 6,802 shares in 2016 and 6,982 shares in 2015 | 270 | 270 | |||||
Additional paid-in capital | 1,287,336 | 1,285,787 | |||||
Accumulated deficit | (1,239,308 | ) | (1,227,671 | ) | |||
Treasury stock — 1,623 shares in 2016 and 1,359 shares in 2015 | (18,098 | ) | (15,355 | ) | |||
Accumulated other comprehensive loss | (1,501 | ) | (1,585 | ) | |||
Total stockholders' equity | 28,699 | 41,446 | |||||
Total liabilities and stockholders' equity | $ | 56,260 | $ | 69,084 | |||
The accompanying notes are an integral part of these consolidated financial statements.
45
MRV Communications, Inc.
Consolidated Statements of Stockholders' Equity
For the Years Ended December 31, 2016, 2015 and 2014
(In thousands, except per share data)
Additional Paid-In Capital | Accumulated Other Comprehensive Income (Loss) | Total Stockholders' Equity | |||||||||||||||||||||||||
Common Stock | Accumulated Deficit | Treasury Stock | |||||||||||||||||||||||||
Shares | Amount | ||||||||||||||||||||||||||
Balance, January 1, 2014 | 7,286 | $ | 270 | $ | 1,281,883 | $ | (1,208,337 | ) | $ | (10,412 | ) | $ | 386 | $ | 63,790 | ||||||||||||
Exercise of stock options and warrants | 100 | — | 1,641 | — | — | — | 1,641 | ||||||||||||||||||||
Share-based compensation | — | — | 959 | — | — | — | 959 | ||||||||||||||||||||
Net loss | — | — | — | (12,155 | ) | — | — | (12,155 | ) | ||||||||||||||||||
Other comprehensive (loss) | — | — | — | — | — | (3,265 | ) | (3,265 | ) | ||||||||||||||||||
Balance, December 31, 2014 | 7,386 | 270 | 1,284,483 | (1,220,492 | ) | (10,412 | ) | (2,879 | ) | 50,970 | |||||||||||||||||
Purchase of treasury shares | (502 | ) | — | — | — | (4,943 | ) | — | (4,943 | ) | |||||||||||||||||
Exercise of stock options | 98 | — | 140 | — | — | — | 140 | ||||||||||||||||||||
Share-based compensation | — | — | 1,164 | — | — | — | 1,164 | ||||||||||||||||||||
Net loss | — | — | — | (7,179 | ) | — | — | (7,179 | ) | ||||||||||||||||||
Other comprehensive income | — | — | — | — | — | 1,294 | 1,294 | ||||||||||||||||||||
Balance, December 31, 2015 | 6,982 | 270 | 1,285,787 | (1,227,671 | ) | (15,355 | ) | (1,585 | ) | 41,446 | |||||||||||||||||
Purchase of treasury shares | (264 | ) | — | — | — | (2,743 | ) | — | (2,743 | ) | |||||||||||||||||
Exercise of stock options | 84 | — | 45 | — | — | — | 45 | ||||||||||||||||||||
Share-based compensation | — | — | 1,504 | — | — | — | 1,504 | ||||||||||||||||||||
Net loss | — | — | — | (11,637 | ) | — | — | (11,637 | ) | ||||||||||||||||||
Other comprehensive income | — | — | — | — | — | 84 | 84 | ||||||||||||||||||||
Balance, December 31, 2016 | 6,802 | $ | 270 | $ | 1,287,336 | $ | (1,239,308 | ) | $ | (18,098 | ) | $ | (1,501 | ) | $ | 28,699 | |||||||||||
The accompanying notes are an integral part of these consolidated financial statements.
46
MRV Communications, Inc.
Consolidated Statements of Cash Flows
For the Years Ended December 31,
(In thousands)
2016 | 2015 | 2014 | |||||||||
Cash flows from operating activities: | |||||||||||
Net loss | $ | (11,637 | ) | $ | (7,179 | ) | $ | (12,155 | ) | ||
(Income) loss from discontinued operations, net of taxes | — | 371 | (2,383 | ) | |||||||
Loss from continuing operations | (11,637 | ) | (6,808 | ) | (14,538 | ) | |||||
Adjustments to reconcile net loss to net cash provided by (used in) operating activities: | |||||||||||
Depreciation and amortization | 1,845 | 2,062 | 2,051 | ||||||||
Share-based compensation expense | 1,504 | 1,119 | 932 | ||||||||
Provision for doubtful accounts | (5 | ) | 40 | 42 | |||||||
Deferred income taxes | — | 2,669 | 1,804 | ||||||||
Loss (gain) on disposition of property and equipment | 110 | (1 | ) | 11 | |||||||
Gain on sale of Tecnonet | — | (189 | ) | — | |||||||
Changes in operating assets and liabilities: | |||||||||||
Accounts and other receivables | 548 | 2,649 | 186 | ||||||||
Inventories | 754 | 127 | 2,878 | ||||||||
Other assets | (651 | ) | 2,002 | (221 | ) | ||||||
Accounts payable | 2,602 | (1,420 | ) | (1,035 | ) | ||||||
Accrued liabilities | (275 | ) | (761 | ) | (1,672 | ) | |||||
Income tax payable | 53 | (39 | ) | 38 | |||||||
Deferred revenue | (1,819 | ) | (745 | ) | 1,662 | ||||||
Other current and long term liabilities | (239 | ) | (540 | ) | (80 | ) | |||||
Cash provided by (used in) operating activities - continuing operations | (7,210 | ) | 165 | (7,942 | ) | ||||||
Cash provided by operating activities - discontinued operations | — | 8,438 | 3,806 | ||||||||
Net cash provided by (used in) operating activities | (7,210 | ) | 8,603 | (4,136 | ) | ||||||
Cash flows from investing activities: | |||||||||||
Purchases of property and equipment | (786 | ) | (1,375 | ) | (1,314 | ) | |||||
Purchases of intangible assets | (163 | ) | — | (650 | ) | ||||||
Decrease (increase) in restricted time deposits | 4,919 | (4,955 | ) | 13 | |||||||
Proceeds from sale of property and equipment | 2 | 9 | — | ||||||||
Proceeds from sale of Tecnonet, net of cash divested and transaction costs in 2015 | 4,789 | 8,688 | — | ||||||||
Cash provided by (used in) investing activities - continuing operations | 8,761 | 2,367 | (1,951 | ) | |||||||
Cash used in investing activities - discontinued operations | — | (81 | ) | (177 | ) | ||||||
Net cash provided by (used in) investing activities | 8,761 | 2,286 | (2,128 | ) | |||||||
Cash flows from financing activities: | |||||||||||
Proceeds from exercise of stock options | 145 | 190 | 72 | ||||||||
Payments for shares repurchased for tax withholdings on vesting of restricted stock awards | (100 | ) | (50 | ) | (87 | ) | |||||
Purchase of treasury shares | (2,743 | ) | (4,943 | ) | — | ||||||
Cash used in financing activities - continuing operations | (2,698 | ) | (4,803 | ) | (15 | ) | |||||
Cash provided by (used in) financing activities - discontinued operations | — | (1,649 | ) | 1,795 | |||||||
Net cash provided by (used in) financing activities | (2,698 | ) | (6,452 | ) | 1,780 | ||||||
Effect of exchange rate changes on cash and cash equivalents | 94 | (690 | ) | (685 | ) | ||||||
Net increase (decrease) in cash and cash equivalents | (1,053 | ) | 3,747 | (5,169 | ) | ||||||
Cash and cash equivalents, beginning of year | 26,169 | 22,422 | 27,591 | ||||||||
Cash and cash equivalents, end of year | 25,116 | 26,169 | 22,422 | ||||||||
Less cash and equivalents of discontinued operations, end of year | — | — | 6,280 | ||||||||
Cash and cash equivalents, end of year | $ | 25,116 | $ | 26,169 | $ | 16,142 | |||||
Supplemental disclosure of cash flow information: | |||||||||||
Cash paid during year for interest | $ | — | $ | 125 | $ | 283 | |||||
Cash paid during year for income taxes | $ | 155 | $ | 1,825 | $ | 1,791 | |||||
The accompanying notes are an integral part of these consolidated financial statements.
47
MRV Communications, Inc.
Notes to Consolidated Financial Statements
1. Description of Business and Basis of Presentation
Description of Business
MRV Communications, Inc. and subsidiaries ("MRV" or the "Company"), a Delaware corporation, is a global supplier of communications solutions to telecommunications service providers, data center operators, enterprises and governments throughout the world. MRV markets and sells its products worldwide, through a variety of channels, which include a dedicated direct sales force, distributors, value-added-resellers, systems integrators and sales agents. Until the third quarter of 2015, MRV conducted its business along two principal segments: the Network Equipment segment and the Network Integration segment. MRV's Network Equipment segment designs, manufactures, sells and services equipment used by commercial customers, governments, and telecommunications service providers. Products include packet switching, optical transport, infrastructure management equipment and service orchestration and provisioning software. The Network Integration segment, which primarily operated in Italy and provided network system design, integration and distribution services that included products manufactured by third-party vendors, was sold in December 2015.
On December 3, 2015, the Company completed the sale of all of its shares of its wholly owned subsidiary, Tecnonet S.p.A.("Tecnonet"), pursuant to a shares purchase agreement, dated as of August 10, 2015 (the "Purchase Agreement") with Maticmind S.p.A, a company incorporated under the laws of Italy. Tecnonet was the last business unit in our Network Integration segment. On February 19, 2016, the Company received a payment of €4.3 million (approximately $4.8 million) representing the post-closing purchase price adjustment pursuant to the Purchase Agreement.
Our business involves reliance on foreign-based offices. Several of our divisions, outside subcontractors and suppliers are located in foreign countries, including Argentina, Australia, Canada, Denmark, Germany, Israel, Italy, Netherlands, Philippines, Poland, Russia, Taiwan, Thailand, and the United Kingdom. For the years ended December 31, 2016, 2015 and 2014, external revenues from foreign subsidiaries accounted for 22%, 24% and 26%, respectively, of our total revenue. The majority of our foreign sales are to customers located in the European and Asia Pacific region.
Basis of Presentation
MRV's fiscal year is based on the calendar year ending on December 31. The accompanying consolidated financial statements include the accounts of MRV and its wholly-owned subsidiaries. All significant intercompany transactions and accounts have been eliminated. MRV consolidates the financial results of less than majority-owned subsidiaries when it has effective control, voting control, or has provided the entity's working capital. When investment by others in these enterprises reduces the Company's voting control below 50%, MRV discontinues consolidation and uses the cost or equity method of accounting for these investments, unless otherwise required.
2. Summary of Significant Accounting Policies
Revenue Recognition
MRV's revenue-generating products consist of switches and routers, console management, physical layer products, and fiber optic components. We recognize product revenue, net of sales discounts, returns and allowances, when persuasive evidence of an arrangement exists, delivery has occurred and all significant contractual obligations have been satisfied, the fee is fixed or determinable and collection is considered reasonably assured. Products are generally shipped "FOB shipping point," with no right of return and revenue is recognized upon shipment. If revenue is to be recognized upon delivery, such delivery date is tracked through information provided by the third party shipping company we use to deliver the product to the customer.
Sales of services and system support are deferred and recognized ratably over the contract period. Sales to end customers with contingencies, such as rights of return, rotation rights, conditional acceptance provisions and price protection, are infrequent and insignificant and are deferred until the contingencies have been satisfied or the contingent period has lapsed. For sales to distributors, we generally recognize revenue when product is sold to the distributor rather than when the product is sold by the distributor to the end user. In certain circumstances, distributors have limited rights of return such as stock rotation rights.
48
We estimate and establish allowances for expected future product returns and credits. We record a reduction in revenue for estimated future product returns and future credits to be issued to the customer in the period in which revenue is recognized, and for future credits to be issued in relation to price protection at the time we make changes to our distributor price book. We monitor product returns and potential price adjustments on an ongoing basis and estimate future returns and credits based on historical sales returns, analysis of credit memo data, and other factors known at the time of revenue recognition.
MRV collects sales taxes from its customers to remit to the applicable taxing authorities. These amounts are not included in revenues, but are included on the balance sheet in accrued liabilities.
Amounts billed to customers in a sale transaction related to shipping and handling represent revenues earned for goods provided and are classified as revenue. Shipping and handling costs are classified as cost of sales.
MRV generally warrants its products against defects in materials and workmanship for 90 days to three-year periods. The estimated cost of warranty obligations and sales returns and other allowances are recognized at the time of revenue recognition based on contract terms and prior claims experience.
Accounting for Multiple-Element Arrangements. We allocate arrangement consideration at the inception of the arrangement to all deliverables using the relative selling price method. The selling price we use for each deliverable is based on (a) vendor-specific objective evidence if available; (b) third-party evidence if vendor-specific objective evidence is not available; or (c) best estimate of selling price if neither vendor-specific objective evidence nor third-party evidence is available. We allocate discounts in the arrangement proportionally on the basis of the selling price of each deliverable.
Cash and Cash Equivalents
MRV treats highly liquid investments with an original maturity of 90 days or less as cash equivalents. Investments with original maturities at the date of purchase greater than 90 days and remaining time to maturity of one year or less as short-term and are included in restricted time deposits. MRV maintains cash balances and investments in qualified financial institutions, and at various times such amounts are in excess of federal insured limits. As of December 31, 2016 and 2015, the Company's U.S. entities held $19.2 million and $21.6 million in cash and cash equivalents. The remaining $5.9 million and $4.6 million, respectively, were held by the company's foreign subsidiaries in foreign bank deposit accounts.
Restricted Time Deposits
Restricted time deposits represent investments that are restricted as to withdrawal or use and from time to time may include certificates of deposit. The investments in and releases of restricted time deposits are included in investing activities on the Company's Consolidated Statements of Cash Flows because the funds are invested in certificates of deposit. As of December 31, 2016 and 2015, the Company held $0.3 million and $5.2 million of restricted time deposits, respectively; $5.0 million of which represented a certificate of deposit with a highly rated financial institution that matured in December 2016. The $0.3 million and remaining $0.2 million of restricted time deposits held as of December 31, 2016 and 2015, respectively, represent security deposits that are restricted due to their respective agreements.
Concentration of Credit Risk, Accounts Receivable and Allowance for Doubtful Accounts
Financial instruments that potentially subject the Company to concentrations of credit risk primarily consist of cash and cash equivalents placed with high credit quality institutions and accounts receivable due from customers. Management evaluates the collectability of accounts receivable based on a combination of factors. If management becomes aware of a customer's inability to meet its financial obligations after a sale has occurred, the Company records an allowance to reduce the net receivable to the amount that management reasonably believes to be collectable from the customer. If the financial conditions of MRV's customers were to deteriorate or if economic conditions worsen, additional allowances may be required in the future. Accounts receivable are charged off at the point they are considered uncollectible.
49
The following table summarizes the changes in the allowance for doubtful accounts (in thousands):
Year ended: | Balance at beginning of period | Charged to expense | Deductions | Effect of foreign currency exchange rates | Balance at end of period | ||||||||||||
December 31, 2014 | $ | 1,117 | 42 | (91 | ) | (6 | ) | $ | 1,062 | ||||||||
December 31, 2015 | $ | 1,062 | 40 | (38 | ) | (4 | ) | $ | 1,060 | ||||||||
December 31, 2016 | $ | 1,060 | (5 | ) | (795 | ) | 7 | $ | 267 | ||||||||
As of December 31, 2016 and 2015, two customers, accounted for 22% and 20% of gross accounts receivables, respectively.
Inventories
Inventories are stated at the lower of cost or market and consist of materials, labor and overhead. Cost is computed using global standard cost, which approximates actual cost, on a first-in, first-out basis. Intercompany sales are recorded using standard costs for book purposes, and are eliminated in consolidation. If management estimates that the net realizable value of inventory is less than the cost of the inventory recorded, an adjustment to the cost basis equal to the difference between the cost of the inventory and the estimated net realizable market value is recorded. This adjustment is recorded as a charge to cost of goods sold, and includes estimates for excess quantities and obsolete inventory. If changes in market conditions result in reductions in the estimated net realizable value of our inventory below previous estimates, we would make further adjustments in the period in which we make such a determination and record a charge to cost of goods sold. At each balance sheet date, management evaluates the ending inventories for excess quantities or obsolescence. This evaluation includes analysis of sales levels and projections of future demand. Based on this evaluation, management writes down the inventory to net realizable value if necessary. At the time of recording the adjustment, a new, lower cost basis for that inventory is established, and subsequent changes in facts and circumstances do not result in the restoration of, or increase in, that newly established cost basis.
Inventories, net of reserves, consisted of the following (in thousands):
December 31: | 2016 | 2015 | ||||||
Raw materials | $ | 2,485 | $ | 3,132 | ||||
Work-in process | 347 | 839 | ||||||
Finished goods | 6,825 | 6,255 | ||||||
Total inventories | $ | 9,657 | $ | 10,226 | ||||
Property and Equipment
Property and equipment are stated at cost. Maintenance and repairs are charged to expense as incurred and the costs of additions and betterments that increase the useful lives of the assets are capitalized. When property or equipment are disposed of, the cost and related accumulated depreciation and amortization are removed from the accounts and any gain or loss is included in other income, net, in the accompanying Consolidated Statements of Operations.
Depreciation is computed using the straight line method over the estimated useful lives of the related assets, as follows:
Life (years) | ||||
Asset category | From | To | ||
Machinery and equipment | 2 | 5 | ||
Computer hardware and software | 3 | 7 | ||
Leasehold improvements | 1 | 10 | ||
Furniture and fixtures | 3 | 15 | ||
50
Intangible Assets
Intangible assets that are determined to have definite lives are amortized over their useful lives. The Company recorded an impairment charge of $0.1 million during the year ended December 31, 2014. The Company did not record any impairment charges for the years ended December 31, 2016 and 2015. (See Note 4, Property and Equipment and Intangible Assets)
Impairment of Long-Lived Assets
Management evaluates its long-lived assets, such as property and equipment and other long-term assets, for impairment whenever events or changes in circumstances indicate that the carrying value of an asset may be impaired. Management takes into consideration events or changes such as product discontinuance, plant closures, product dispositions and history of operating losses or other changes in circumstances to indicate that the carrying amount may not be recoverable. The carrying value of an asset is considered impaired when the anticipated undiscounted cash flow from such asset is less than its carrying value. In that event, a loss is recognized based on the amount by which the carrying value exceeds the estimated fair value. Fair value is determined using the anticipated cash flows discounted at a rate based on our weighted average cost of capital, which represents the blended after-tax costs of debt and equity. There was no impairment loss on long-lived assets during the three years ended December 31, 2016.
Fair Value of Financial Instruments
MRV's financial instruments including cash and cash equivalents, restricted time deposits, accounts receivable, other receivables included in other assets and accounts payable are carried at cost, which approximates their fair value. The fair values of accounts receivable and accounts payable approximate their carrying amounts due to their short-term nature.
The Company follows a framework for measuring fair value using a three-level hierarchy that prioritizes the use of observable inputs. The fair value hierarchy is divided into three levels based on the source of inputs as follows: Level 1 - Valuations based on unadjusted quoted prices in active markets for identical assets or liabilities; Level 2 - Valuations for which all significant inputs are observable, either directly or indirectly, other than level 1 inputs for similar instruments; Level 3 - Valuations based on inputs that are unobservable and significant to the overall fair value measurement.
All of MRV's financial assets and a majority of its financial liabilities that are measured at fair value are measured using the unadjusted quoted prices in active markets for identical assets or liabilities that are accessible at the measurement date. Under this framework, fair value is defined as the price that would be received to sell an asset or paid to transfer a liability (i.e., the “exit price”) in an orderly transaction between market participants at the measurement date. Management has not elected the fair value option for non-financial assets and liabilities.
As of December 31, 2015, the Company had cash equivalents consisting of money market funds of $1.8 million that were classified as Level 1 investments and were held at market price. No such instruments were held as of December 31, 2016. Cash equivalents are included in the Consolidated Balance Sheets as follows (in thousands):
Cost | Fair Value | |||||||
December 31, 2015 | $ | 1,807 | $ | 1,807 | ||||
During 2014, the Company issued 250,000 Common Stock warrants that prior to issuance were recorded as a liability at fair value. These Common Stock warrants were awarded to a plaintiffs' counsel in connection with a previously settled litigation matter. Upon issuance, the carrying value of the Common Stock warrants was reclassified to equity as a component of additional paid in capital in the amount of $1.6 million. In calculating the fair value of the Common Stock warrants, management used the Black Scholes option pricing model including a volatility of 41% based on the Company's historical quoted prices and peer company data, the risk free interest rate of 1.5% and a 5 year expected term of the Common Stock warrants. Volatility was based on both the Company's historical quoted prices and peer company data as the Company's stock is thinly traded. The resulting calculated fair value was $6.59 per warrant. As of the issuance date of Common Stock warrants, the requirements necessary for equity classification were met and were recorded as a component of additional paid in capital.
51
During the year ended December 31, 2014, one of plaintiffs' counsel exercised 152,500 Common Stock warrants under the 'cashless' exercise provisions contained within the warrant agreement, leaving 97,500 Common Stock warrants with an exercise price of $8.80 per warrant still available for future exercise. No Common Stock warrants were exercised during the years ended December 31, 2016 and 2015. The Common Stock warrants expire on July 18, 2018.
Other Current Assets
Other current assets include other accounts receivable, prepaid expenses and other assets that will be consumed or collected within a twelve month period. Other current assets as of December 31, 2016, included pre-paid expenses of $1.1 million and $1.3 million of other receivables. Other current assets as of December 31, 2015 included other accounts receivable of $4.8 million related to the post-closing purchase price adjustment on the sale of Tecnonet, prepaid expenses of $1.2 million and $0.9 of other assets.
Liability for Severance Pay
Under the laws of certain foreign jurisdictions, MRV is obligated to make severance payments to employees in those foreign jurisdictions on the basis of factors such as each employee's current salary and length of employment. The liability for severance pay is calculated as the amount that the Company would be required to pay if every employee were to separate as of the end of the period, and is recorded as part of other long-term liabilities.
Cost of Sales
Cost of sales includes material, depreciation on fixed assets used in the manufacturing process, shipping costs, direct labor and overhead.
Product Development and Engineering
Product development and engineering costs are charged to expense as incurred.
Software Development Costs
Development costs related to software products for sale or to be included in our products are expensed as incurred until the technological feasibility of the product has been established. Technological feasibility occurs when a working model is completed. After technological feasibility is established, additional costs are capitalized. We believe that our process for internally developed software is essentially completed concurrent with the establishment of technological feasibility, and, accordingly, no software development costs for internally developed software have been capitalized to date.
Internal Use Software Development Costs
Any software that we acquire, internally develop, or modify solely to meet our internal needs, and for which we have no substantive plan to market the software externally, is capitalized during the development phase. Costs incurred during the research phase are expensed as incurred. There were no such costs capitalized during the years ended December 31, 2016, 2015 and 2014.
Sales and Marketing
Sales and marketing costs are charged to expense as incurred. For the years ended December 31, 2016, 2015 and 2014, advertising and trade show costs were $0.6 million, $0.4 million and $0.9 million, respectively.
Income Taxes
We account for income taxes using the liability method, which requires the recognition of deferred tax assets and liabilities for the expected future tax consequences of events that have been included in the financial statements. Under this method, deferred tax assets and liabilities are determined based on the differences between the financial statements and tax basis of assets and liabilities using enacted tax rates in effect for the year in which the differences are expected to reverse. The effect of a change in tax rates on deferred tax assets and liabilities is recognized in income in the period that includes the enactment date.
52
We record net deferred tax assets to the extent we believe these assets will more likely than not be realized. In making such determination, we consider all available positive and negative evidence, including scheduled reversals of deferred tax liabilities, projected future taxable income, tax planning strategies and recent financial operations. In the event we were to determine that we would be able to realize our deferred income tax assets in the future in excess of their net recorded amount, we would make an adjustment to the valuation allowance which would reduce the provision for income taxes.
We use a risk based approach and analysis to identify potential tax exposures, estimate those tax exposures, and record appropriate uncertain tax liabilities based on whether or not the tax position is more-likely-than-not to be sustained under examination. We recognize interest and penalties related to unrecognized tax benefits within the income tax expense line in the accompanying consolidated statement of operations if the sustainability of the uncertain tax position does not meet the "more likely than not" recognition threshold based on its technical merits. Accrued interest and penalties are included within the related tax liability line in the consolidated balance sheet.
Net Income (Loss) Per Share
Basic net income (loss) per share is computed using the weighted average number of shares of common stock ("Common Stock") outstanding, including restricted shares which, although they are legally outstanding and have voting rights, are subject to vesting and are treated as Common Stock equivalents in calculating basic net income (loss) per share. Diluted net income (loss) per share is computed using the weighted average number of shares of Common Stock outstanding and dilutive potential shares of Common Stock from stock options and warrants outstanding during the period. Diluted shares outstanding include the dilutive effect of in-the-money options, which is calculated based on the average share price for each period using the treasury stock method.
Employee equity share options, non-vested shares and similar equity instruments granted by MRV, are treated as potential shares of Common Stock outstanding in computing diluted net income per share. Under the treasury stock method, the amount the employee must pay for exercising stock options, the amount of compensation cost for future service not yet recognized, and the amount of income tax benefits that would be realized and recorded in additional paid-in capital if the deduction for the award would reduce income taxes payable are assumed to be used to repurchase shares.
Outstanding stock options to purchase 455,498, 295,366 and 309,309 shares were excluded from the computation of dilutive shares for the years ended December 31, 2016, 2015 and 2014, respectively, as they were anti-dilutive because of the net loss from continuing operations. The outstanding 97,500 warrants were excluded from the computation of dilutive shares for the years ended December 31, 2016, 2015 and 2014 as they were anti-dilutive because of the net loss from continuing operations. Treasury shares are excluded from the number of shares outstanding.
Share-Based Compensation
The Company accounts for stock-based payment awards at fair value at the grant date. The estimated fair value of stock options and warrants are determined using the Black-Scholes valuation model. The assumptions used in calculating the fair value of share-based payment awards represent MRV's best estimates. Those estimates may be impacted by certain variables including stock price volatility, employee stock option exercise behaviors, additional stock option grants, estimates of forfeitures, and the related income tax impact. Stock-based compensation cost is recorded as expense using the straight-line method over the requisite service period.
Recently Issued Accounting Standards Not Yet Adopted
We consider the applicability and impact of all Accounting Standards Updates (“ASUs”) not yet adopted. The ASUs not listed below were assessed and determined to be either not applicable or are expected to have minimal impact on our consolidated financial position and results of operations.
53
In May 2014, the Financial Accounting Standards Board (the "FASB") issued ASU No. 2014-09, "Revenue from Contracts with Customers (Topic 606)," ("ASU 2014-09") and in August 2015 issued ASU No. 2015-14, which amended the effective date of the standard to annual reporting periods beginning after December 15, 2017. ASU 2014-09 outlines a new, single comprehensive model for entities to use in accounting for revenue arising from contracts with customers and supersedes current revenue recognition guidance, including industry-specific guidance. This new revenue recognition model provides a five-step analysis in determining when and how revenue is recognized. The new model will require revenue recognition to depict the transfer of promised goods or services to customers in an amount that reflects the consideration a company expects to receive in exchange for those goods or services. The amendments may be applied retrospectively to each prior period presented or retrospectively with the cumulative effect recognized as of the date of initial application. During 2016, the FASB has issued the following standards related to ASU 2014-09: ASU No. 2016-08, Revenue from Contracts with Customers (Topic 606): Principal versus Agent Considerations (“ASU 2016-08”); ASU No. 2016-10, Revenue from Contracts with Customers (Topic 606): Identifying Performance Obligations and Licensing (“ASU 2016-10”); ASU No. 2016-12, Revenue from Contracts with Customers (Topic 606): Narrow-Scope Improvements and Practical Expedients (“ASU 2016-12”); and ASU No. 2016-20, Technical Corrections and Improvements to Topic 606, Revenue from Contracts with Customers (“ASU 2016-20”). The Company must adopt ASU 2016-08, ASU 2016-10, ASU 2016-12 and ASU 2016-20 with ASU 2014-09 (collectively, the “new revenue standards”). Management is continuing to assess the potential impact that adopting the new revenue standards will have on its consolidated financial statements and footnote disclosures. The Company’s current analysis indicates that the most significant effect of the new standard relates to the Company's accounting for certain fulfillment and contract acquisition costs, which will now be capitalized, rather than expensed as incurred, which is the Company's current practice under the current guidance. In addition, the Company expects to continue recognizing product sales at a point in time and service revenue over time. While the Company continues its assessment of the potential effects of the new standard, management anticipates adopting the new standard on a modified retrospective basis effective January 1, 2018.
In July 2015, the FASB issued ASU No. 2015-11, "Simplifying the Measurement of Inventory" (“ASU 2015-11”). ASU 2015-11 simplifies the guidance on the subsequent measurement of inventory, excluding inventory measured using the last-in, first out (LIFO), or the retail inventory method. Under the new standard, inventory should be at the lower of cost and net realizable value, and defines net realizable value as the estimated selling price in the ordinary course of business, less reasonably predictable costs of completion, disposal and transportation. ASU 2015-11 will become effective for the Company for fiscal years beginning after December 15, 2016, including interim periods within those fiscal years. Early adoption is permitted. Management has determined that the adoption of ASU 2015-11 on January 1, 2017, will not have a significant impact on its consolidated financial statements and footnote disclosures.
In November 2015, the FASB issued ASU No. 2015-17, "Balance Sheet Classification of Deferred Taxes" ("ASU 2015-17"). The amendments in ASU 2015-17 simplify the presentation of deferred income taxes by requiring that deferred tax assets and liabilities be classified as non-current. ASU 2015-17 will become effective for the Company for fiscal years beginning after December 15, 2016, including interim periods within those fiscal years. Early adoption is permitted. Management has determined that the adoption of ASU 2015-17 on January 1, 2017, will not have a significant impact on its consolidated financial statements and footnote disclosures.
In February 2016, the FASB issued ASU No. 2016-02, "Leases" ("ASU 2016-02"). The amendments in ASU 2016-02 require companies that lease assets to recognize on their balance sheets the assets and liabilities for the rights and obligations generated by contracts longer than a year. ASU 2016-02 will become effective for the Company for fiscal years beginning after December 15, 2018, including interim periods within those fiscal years. The guidance is required to be applied using the modified retrospective transition approach. Early adoption is permitted. Management is currently evaluating the potential impact that adopting ASU 2016-02 will have on its condensed consolidated financial statements and footnote disclosures.
In March 2016, the FASB issued ASU No. 2016-09, "Stock Compensation (Topic 718): Improvements to employee Share-Based Payment Accounting" ("ASU 2016-09"). The amendments in ASU 2016-09 simplify the accounting for share-based payment award transactions including: income tax consequences, classification of awards as either equity or liabilities and classification on the statement of cash flows. ASU 2016-09 will become effective for fiscal years beginning after December 15, 2016, including interim periods within those fiscal years. Early adoption is permitted. Management has determined that the adoption of ASU 2016-09 on January 1, 2017, will not have a significant impact on its consolidated financial statements and footnote disclosures.
54
Use of Estimates
The preparation of these consolidated financial statements require management to make certain estimates, assumptions and judgments that can affect the reported amounts of assets and liabilities, revenue and expenses, and related disclosure of contingent assets and liabilities as of the date of the financial statements, and the reported amounts of revenues and expenses during the periods presented. On an ongoing basis, management evaluates its significant estimates and assumptions, including those related to revenue recognition, stock-based compensation, inventory valuation, accrued warranty, allowance for doubtful accounts, and accounting for income taxes. Management bases its estimates on historical and anticipated results, trends and on various other assumptions that it believes are reasonable under the circumstances, including assumptions as to future events. These estimates form the basis for making assumptions about the carrying values of assets and liabilities that are not readily apparent from other sources. By their nature, estimates are subject to an inherent degree of uncertainty. Actual results could differ materially from those estimates. In 2016, the Company accounted for a change in estimate related to the useful lives of its service inventory resulting in a $0.2 million charge to cost of services and increasing net loss $0.2 million for the year ended December 31, 2016. The change in accounting estimate also affected the Company's basic and diluted net loss per share $0.03 for the year ended December 31, 2016.
3. Discontinued Operations
On August 10, 2015, we announced that we entered into a shares purchase agreement (“the Purchase Agreement”) with Maticmind S.p.A., (the “Purchaser”), a company incorporated under the laws of Italy, for the sale of all of the shares of our wholly-owned subsidiary Tecnonet. The consideration for the transaction included a cash payment by the Purchaser to the Company of €15.6 million (approximately $17.0 million) at closing plus a cash payment by Tecnonet to the Company of €4.1 million (approximately $4.6 million) prior to closing to repay an outstanding intercompany obligation. Tecnonet procured third party debt financing and repaid the loan in full in two payments: €1.5 million was received during the quarter ended September 30, 2015, with the remaining amount received during October 2015. The Purchaser assumed this debt at closing pursuant to the Purchase Agreement. On December 1, 2015, the sale of Tecnonet was approved by the Company's stockholders at the Company's special meeting of stockholders. On December 3, 2015, the Company completed the sale of all of the shares of Tecnonet. On February 19, 2016, the Company received a payment of €4.3 million (approximately $4.8 million) representing the post-closing purchase price adjustment pursuant to the Purchase Agreement. The Purchase Agreement also contains customary representations, warranties, covenants and indemnification obligations.
The Company included the $4.8 million receivable representing the post-closing purchase price adjustment on its consolidated balance sheet within other current assets as of December 31, 2015.
In 2015, the Company reported an after-tax gain on the sale of Tecnonet in the amount of $0.2 million. In addition, the Company recorded a cumulative translation loss $2.2 million and $0.8 million in transaction costs related to the sale, all of which are recorded within discontinued operations in 2015. The $2.2 million of foreign currency related losses included $1.0 million of historical translation related adjustments previously included in accumulated other comprehensive income on the consolidated balance sheet and $1.2 million recognized loss on the intercompany obligation that was settled as part of the transaction.
The results of operations of Tecnonet for the years ended December 31, 2015 and 2014 that are reflected in consolidated statements of operations as discontinued operations consist of the following (in thousands):
55
Year Ended December 31: | 2015 | 2014 | ||||||
Revenue: | ||||||||
Product revenue | $ | 32,315 | $ | 47,649 | ||||
Service revenue | 30,274 | 37,869 | ||||||
Total revenue | 62,589 | 85,518 | ||||||
Cost of Revenue: | ||||||||
Cost of product | 28,472 | 42,883 | ||||||
Cost of services | 24,181 | 29,458 | ||||||
Total cost of revenue | 52,653 | 72,341 | ||||||
Gross profit | 9,936 | 13,177 | ||||||
Selling, general and administrative (1) | 6,574 | 7,615 | ||||||
Operating income | 3,362 | 5,562 | ||||||
Interest expense | (124 | ) | (305 | ) | ||||
Cumulative translation loss recognized upon sale of Tecnonet | (2,180 | ) | — | |||||
Other expense, net | (307 | ) | (444 | ) | ||||
Income from discontinued operations before income taxes | 751 | 4,813 | ||||||
Provision for income taxes | 1,311 | 2,430 | ||||||
Income (loss) from discontinued operations, net of tax | (560 | ) | 2,383 | |||||
Gain on sale of Tecnonet, net of tax | 189 | — | ||||||
Net income (loss) from discontinued operations, net of income taxes | $ | (371 | ) | $ | 2,383 | |||
(1) Includes Transaction costs of $0.8 million in 2015.
The assets and liabilities of Tecnonet were removed from our consolidated balance sheet as of the date of the divestiture.
4. Property and Equipment and Intangible Assets
Property and Equipment
Property and equipment, at cost, consisted of the following (in thousands):
December 31: | 2016 | 2015 | ||||||
Machinery and equipment | $ | 9,026 | $ | 8,557 | ||||
Computer hardware and software | 6,080 | 6,512 | ||||||
Leasehold improvements | 2,041 | 2,406 | ||||||
Furniture and fixtures | 382 | 438 | ||||||
Construction in progress | 53 | 119 | ||||||
Total property and equipment, at cost | 17,582 | 18,032 | ||||||
Less — accumulated depreciation and amortization | (14,452 | ) | (13,982 | ) | ||||
Total property and equipment | $ | 3,130 | $ | 4,050 | ||||
Depreciation expense for the years ended December 31, 2016, 2015 and 2014 was $1.6 million, $1.9 million and $1.9 million, respectively.
Intangible Assets
Intangible assets, net of amortization, consist of intellectual property such as license agreements and totaled $1.1 million and $1.2 million as of December 31, 2016 and 2015, respectively. The terms of the some of these license agreements provide for use of the licensed software into perpetuity while others are definite. The Company amortizes the cost of the license agreements over the estimated useful life, which can range between three to five years. A portion of these assets, approximating $0.4 million and $0.7 million, were placed into service during the years ended December 31, 2016 and 2015, respectively.
56
The following table illustrates the estimated future amortization expense of intangible assets as of December 31, 2016 (in thousands):
Year ending December 31, | Estimated Amortization Expense | |||
2017 | $ | 305 | ||
2018 | 247 | |||
2019 | 247 | |||
2020 | 149 | |||
2021 | 110 | |||
Thereafter | 6 | |||
Total | $ | 1,064 | ||
Amortization of intangible assets was $0.3 million, $0.2 million and $0.1 million for the years ended December 31, 2016, 2015 and 2014 respectively. The Company recorded an impairment charge of $0.1 million during the year ended December 31, 2014 on one of the software license agreements placed into service. The Company did not record any impairment charges related to intangible assets for the years ended December 31, 2016 and 2015. As of December 31, 2016, intangible assets not yet placed into service totaled approximately $0.2 million.
5. Accrued Liabilities
Accrued liabilities consisted of the following (in thousands):
December 31: | 2016 | 2015 | ||||||
Payroll and related | $ | 5,552 | $ | 6,514 | ||||
Professional fees | 1,185 | 1,284 | ||||||
Non-income taxes | 489 | 483 | ||||||
Product warranty | 587 | 593 | ||||||
Severance and other employee related costs | 643 | — | ||||||
Other | 739 | 1,098 | ||||||
Total accrued liabilities | $ | 9,195 | $ | 9,972 | ||||
57
6. Income Taxes
For financial reporting purposes, loss from continuing operations before provision for income taxes includes the following (in thousands):
Year ended December 31: | 2016 | 2015 | 2014 | |||||||||
United States | $ | (8,499 | ) | $ | (3,308 | ) | $ | (7,993 | ) | |||
Foreign | (2,816 | ) | (629 | ) | (4,672 | ) | ||||||
Loss from continuing operations before provision for income taxes | $ | (11,315 | ) | $ | (3,937 | ) | $ | (12,665 | ) | |||
The provision (benefit) for income taxes consists of the following (in thousands):
Year ended December 31: | 2016 | 2015 | 2014 | |||||||||
Current: | ||||||||||||
State | $ | 4 | $ | 49 | $ | (89 | ) | |||||
Foreign | 318 | 144 | 68 | |||||||||
Total current | 322 | 193 | (21 | ) | ||||||||
Deferred: | ||||||||||||
Foreign | — | 2,678 | 1,894 | |||||||||
Total deferred | — | 2,678 | 1,894 | |||||||||
Provision for income taxes | $ | 322 | $ | 2,871 | $ | 1,873 | ||||||
The income tax provision differs from the amount computed by applying the federal statutory income tax rate as follows:
Year ended December 31: | 2016 | 2015 | 2014 | ||||||
Income tax provision, at statutory federal rate | 34 | % | 34 | % | 34 | % | |||
State and local income taxes, net of federal income taxes effect | 3 | 4 | 3 | ||||||
Permanent differences | (1 | ) | (4 | ) | (1 | ) | |||
Foreign taxes at rates different than domestic rates | (2 | ) | (1 | ) | (3 | ) | |||
Expired capital loss carryforwards | — | (880 | ) | — | |||||
Change in tax rates | (12 | ) | — | — | |||||
Change in valuation allowance | (23 | ) | 775 | (47 | ) | ||||
Other adjustments | (2 | ) | (1 | ) | (1 | ) | |||
Effective tax rate | (3 | )% | (73 | )% | (15 | )% | |||
58
The components of deferred income taxes consist of the following (in thousands):
December 31: | 2016 | 2015 | ||||||
Deferred tax assets: | ||||||||
Net operating losses | $ | 92,176 | $ | 91,893 | ||||
Allowance for doubtful accounts | 118 | 365 | ||||||
Inventory reserve | 2,413 | 3,161 | ||||||
Accrued liabilities | 2,397 | 2,794 | ||||||
Other | 4,162 | 4,697 | ||||||
Total deferred tax assets | 101,266 | 102,910 | ||||||
Valuation allowance | (100,810 | ) | (102,747 | ) | ||||
Net deferred tax assets | 456 | 163 | ||||||
Deferred tax liabilities: | ||||||||
Depreciation and amortization | (456 | ) | (163 | ) | ||||
Total deferred tax liabilities | (456 | ) | (163 | ) | ||||
Total deferred income taxes | $ | — | $ | — | ||||
MRV records valuation allowances against deferred income tax assets, when necessary. Realization of deferred income tax assets, such as net operating loss ("NOL") carryforwards and income tax credits, is dependent on future taxable earnings and is therefore uncertain. At least quarterly, the Company assesses the likelihood that the deferred income tax asset balance will be recovered from future taxable income. To the extent management believes that recovery is unlikely, the Company establishes a valuation allowance against the deferred income tax asset, which increases income tax expense in the period such determination is made. During the year ended December 31, 2016, the Company recorded a net decrease to the valuation allowance totaling $2.0 million against deferred income tax assets primarily as a result of domestic and foreign net operating losses and changes in temporary differences.
The change in the valuation allowance is as follows (in millions):
December 31: | 2016 | 2015 | 2014 | |||||||||
Balance at beginning of period | $ | (103 | ) | $ | (139 | ) | $ | (133 | ) | |||
(Increase) decrease in valuation allowance | 2 | 36 | (6 | ) | ||||||||
Balance at end of period | $ | (101 | ) | $ | (103 | ) | $ | (139 | ) | |||
As of December 31, 2016, MRV had federal, state, and foreign NOL carryforwards available of $183.3 million, $112.0 million and $100.8 million, respectively. For the year ended December 31, 2016, federal NOL carryforwards increased by $0.8 million, state net operating loss carryforwards increased by $14.9 million, and foreign NOL carryforwards increased by $3.4 million. For federal and state income tax purposes, the NOLs are available to offset future taxable income, begin expiring in 2017 and are available through 2036. Certain foreign NOL carryforwards and tax credits are available indefinitely. Under the Internal Revenue Code, if a corporation undergoes an "ownership change," the corporation's ability to use its pre-change NOLs, capital loss carryforwards and other pre-change tax attributes to offset its post-change income may be limited. An ownership change is generally defined as a greater than 50% change in its equity ownership by value over a three-year period. We may experience an ownership change in the future as a result of subsequent shifts in our stock ownership. If we were to trigger an ownership change in the future, our ability to use any NOLs and capital loss carryforwards existing at that time could be limited. As of December 31, 2016, the federal, state and foreign NOLs had a full valuation allowance.
59
MRV has not recorded U.S. income tax expense for foreign earnings that it has declared as indefinitely reinvested offshore, thus reducing its overall income tax expense. At December 31, 2016, MRV had approximately $4.2 million of accumulated but undistributed earnings at certain foreign entities. The amount of earnings designated as indefinitely reinvested offshore is based upon our expectations of the future cash needs of the Company's foreign and domestic entities. Income tax considerations are also a factor in determining the amount of foreign earnings to be repatriated. In the event actual cash needs of the Company's U.S. entities exceed current expectations or the actual cash needs of the Company's foreign entities are less than expected, the Company may need to repatriate foreign earnings that have been designated as indefinitely reinvested offshore. This would result in recording additional U.S. income tax expense. It is not practicable to estimate the amount of deferred tax liability related to investments in these foreign subsidiaries.
During the year ended December 31, 2016, the Company reported a loss of $11.3 million from continuing operations before provision for income taxes. The Company recognized income tax expense of $1.3 million and $2.4 million for the years ended December 31, 2015 and 2014, respectively, with respect to its discontinued operations.
The Company or one of its subsidiaries files income tax returns in the US federal jurisdiction, and various state and foreign jurisdictions. A reconciliation of the beginning and ending amounts of unrecognized tax benefits is as follows (in thousands):
December 31: | 2016 | 2015 | 2014 | |||||||||
Balance at beginning of period | $ | (81 | ) | $ | (100 | ) | $ | (134 | ) | |||
Reductions related to prior year positions | 43 | 19 | 34 | |||||||||
Balance at end of period | $ | (38 | ) | $ | (81 | ) | $ | (100 | ) | |||
Substantially all of the uncertain tax benefits as of December 31, 2016, if recognized, would affect the effective tax rate. The Company recognizes interest related to unrecognized tax benefits in interest expense and penalties in operating expenses. The tax years 2002-2016 remain open to examination by the major taxing jurisdictions to which the Company is subject. Management does not anticipate a significant change to the total amount of unrecognized tax benefits within the next 12 months.
7. Long-term liabilities
Long-term liabilities consisted of the following (in thousands):
December 31: | 2016 | 2015 | ||||||
Liability for social contribution (1) | $ | 2,643 | $ | 2,729 | ||||
Long-term portion of deferred revenue | 797 | 1,036 | ||||||
Other | 38 | 81 | ||||||
Total Long-term liabilities | $ | 3,478 | $ | 3,846 | ||||
(1) | Represents statutory post-employment benefits related to Israeli operations. |
8. 401(k) Plan
The Company sponsors a 401(k) plan to provide retirement benefits for its U.S. employees. As allowed under Section 401(k) of the Internal Revenue Code, MRV's plan provides for tax-deferred salary contributions for eligible employees. The Plan allows employees to contribute a portion of their annual compensation to the plan on a pretax basis. The Company currently matches pretax contributions up to 50% of the first 6% of eligible earnings contributed by employees. Matching contributions to the Plan totaled approximately $521,000, $424,000, and $562,000 for the years ended December 31, 2016, 2015, and 2014, respectively.
9. Commitments and Contingencies
Lease Commitments
MRV leases certain facilities and equipment under non-cancelable lease agreements expiring in various years through 2020. Following are the aggregate minimum annual lease payments under leases in effect as of December 31, 2016 (in thousands):
60
Year ending December 31: | Operating leases | |||
2017 | $ | 984 | ||
2018 | 607 | |||
2019 | 400 | |||
2020 | 251 | |||
Total | $ | 2,242 | ||
Rental expense under non-cancelable operating lease agreements for the years ended December 31, 2016, 2015 and 2014, was $1.2 million, $1.0 million and $1.3 million, respectively.
On June 30, 2005, the Company entered into a lease amendment as successor-in-interest to Luminent, Inc. for the lease of office and warehouse space located in Chatsworth, CA (Los Angeles area). In February 2017, the Company extended its current lease through March 31, 2019, with no option to extend the lease term. The remaining lease payments will approximate $0.6 million. (See Note 16, Subsequent Events)
On October 8, 1996, the Company entered into a lease amendment for the lease of office space located in Chatsworth, CA (Los Angeles area). The current term of the lease is for 10 years through April 1, 2017, with no option to extend the lease term. Pursuant to the amendment, the Company was granted an improvement allowance of $70,000 which is being amortized as a reduction to rent expense over the life of the lease. In August 2016, the Company vacated this facility in an effort to consolidate its two existing Chatsworth facilities. The remaining lease obligation of $33 thousand is recorded in accrued liabilities on the Consolidated Balance Sheets as of December 31, 2016. In January 2017, the Company accelerated the termination date of this lease amendment to January 31, 2017. (See Note 16, Subsequent Events)
On December 16, 2009, the Company entered into a lease amendment with Chelmsford Associates, LLC for the lease of office space located in Chelmsford, MA (Boston area). In April 2015, the Company extended the terms of its existing lease for five years, six months through August 31, 2020, with an option to extend the lease term for a five year period. The remaining lease payments over the current term will approximate $1.2 million. Pursuant to the lease, the Company was granted rent abatement of $214,067, which is being amortized as a reduction to rent expense over the life of the lease.
On August 9 2007, the Company entered into a lease with Mirobin Ltd. for the lease of office space located in Yokneam, Israel (Haifa area) through December 31, 2017, with no option to extend the lease term. The remaining lease payments over the current term will approximate $0.4 million.
Purchase Commitments with Outsourcing Partners and Component Suppliers
We utilize several outsourcing partners to manufacture sub-assemblies for the Company’s products and to perform final assembly and testing of finished products. These outsourcing partners acquire components and build product based on demand information supplied by the Company, which typically covers periods up to 150 days. The Company also obtains individual components for its products from a wide variety of individual suppliers. Consistent with industry practice, the Company acquires components through a combination of purchase orders, supplier contracts, and open orders based on projected demand information. As of December 31, 2016, the Company had outstanding minimum future commitments for manufacturing and component purchases totaled $14.2 million.
The Company records a liability for firm, non-cancelable and unconditional purchase commitments for quantities in excess of its future demand forecasts. As of December 31, 2016 and December 31, 2015, the liability for these purchase commitments was $0.4 million and $0.2 million, respectively, and is included in accounts payable on the consolidated balance sheets.
61
Royalty Commitment
Certain of MRV's Israeli subsidiaries are obligated to the Office of the Chief Scientist of the Government of Israel ("Chief Scientist") with respect to the government's participation in research and development expenses for certain products. The royalty to the Chief Scientist is recorded in cost of goods sold, and is calculated at a rate of 2.0% to 5.0% of sales of such products developed with the participation, up to the cost of such participation. We have reserved approximately $243,000 against a disputed claim that was raised in 2005, though the last correspondence with the Chief Scientist on the matter occurred in 2008. Amounts received from the participation of the Chief Scientist are offset against the related research and development expenses incurred. MRV did not receive participation from the Chief Scientist for the years ended December 31, 2016, 2015, and 2014.
Indemnification Obligations
In connection with the sale by MRV of SPI in October 2010, MRV agreed to indemnify the buyer against certain claims brought after the closing for prior-occurring events. Most of the indemnification obligations have expired; however, indemnifications related to employee benefits, environmental liabilities and taxes extend until their applicable statute of limitations has run plus 90 days, and indemnification obligations are not time limited for title and ownership representations. These indemnification obligations are subject to a $1.0 million deductible and a $20.0 million cap and we have purchased an insurance policy to protect against such obligations.
The Company has received a notice from SPI, advising the Company of a tax audit for periods including tax returns filed prior to the acquisition of SPI by the buyer. MRV believes that it has meritorious defenses to the extent a formal indemnification claim is asserted and has notified its insurer of the potential claim. MRV intends to vigorously contest any claim; however, no formal legal proceeding has been commenced, and MRV can provide no assurance that such claim would not have a material adverse effect on its business, operating results or financial condition.
Our agreements for the sale of certain business (CES in March 2012, Alcadon and Interdata in October 2012, and Tecnonet in December 2015) include customary indemnification obligations to the respective buyers.
In connection with the sale of CES, MRV agreed to indemnify the buyer for the representations and warranties made in the sale purchase agreement and purchased an insurance policy to protect against any claims of indemnification related to the representations and warranties.
In addition, the Company has indemnification obligations to its current and former officers and directors as set forth in the Company's bylaws. We have agreements whereby our officers and directors are indemnified for certain events or occurrences while the officer or director is, or was, serving at our request in such capacity. The maximum potential amount of future payments we could be required to make under these indemnification agreements is unlimited; however, we retain directors and officers insurance that reduces our exposure and enables us to recover portions of amounts paid. As a result of our insurance coverage, we believe the estimated fair value of these indemnification agreements is minimal.
Accordingly, no liabilities have been recorded for these indemnification agreements as of December 31, 2016 and 2015.
In the normal course of business to facilitate sales of its products, MRV indemnifies other parties, including customers, lessors and parties to other transactions with us, with respect to certain matters. The Company has agreed to hold the other parties harmless against losses arising from a breach of representation or covenants, for intellectual property infringement, or other claims made against certain parties. These agreements may limit the time within which an indemnification claim can be made and the amount of the claim.
We cannot estimate the amount of potential future payments, if any, that it might be required to make as a result of these obligations. Over the last decade, the Company has not incurred any significant expense as a result of obligations of this type. Accordingly, the Company has not accrued any amounts for such indemnification obligations. However, there can be no assurances that expenses will not be incurred under these indemnification provisions in the future.
62
Litigation
We are subject to legal claims and litigation in the ordinary course of business, including but not limited to product liability, employment and intellectual property claims. The outcome of any such matters is currently not determinable. In addition, we were party to the litigation set forth below.
Nhan T. Vo, individually and on behalf of other aggrieved employees vs. MRV Communications, Inc., Superior Court of California, County of Los Angeles. On June 27, 2013, the plaintiff in this matter filed a lawsuit against the Company alleging claims for failure to properly pay overtime or provide meal and rest breaks to its non-exempt employees in California, among other things. The complaint seeks an unspecified amount of damages and penalties under provisions of the Labor Code, including the Labor Code Private Attorneys General Act. The Company has filed an answer denying all allegations regarding the plaintiff’s claims and asserting various defenses. Management believes it has accrued adequate reserves for this matter and does not expect the matter to have a material adverse effect on its business or financial condition. However, depending on the actual outcome of this case, further provisions could be recorded in the future which may have a material adverse effect on the Company’s operating results.
In connection with the sale by MRV of SPI in October 2010, MRV agreed to indemnify the buyer against certain claims brought after the closing for prior-occurring events. The Company has received a notice from SPI, advising the Company of a tax audit for periods including tax returns filed prior to the acquisition of SPI by the buyer. Management believes that it has meritorious defenses to the extent a formal indemnification claim is asserted and has notified its insurer of the potential claim. MRV intends to vigorously contest any claim; however, no formal legal proceeding has been commenced, and MRV can provide no assurance that such claim would not have a material adverse effect on its business, operating results or financial condition.
From time to time, MRV receives notices from third parties alleging possible infringement of patents with respect to product features or manufacturing processes. Management believes such notices are common in the communications industry because of the large number of patents that have been filed on these subjects. The Company's policy is to discuss these notices with the parties in an effort to demonstrate that MRV's products and/or processes do not violate any patents. Management does not believe that any of these matters will result in a material adverse outcome.
MRV and its subsidiaries have from time to time been named as a defendant in other lawsuits involving matters that management considers routine to the nature of its business. Management is of the opinion that the ultimate resolution of such outstanding matters will not have a material adverse effect on our business, operating results and financial condition.
Cost Saving Measures and Asset Impairments
During the second half of fiscal 2016, the Company initiated cost saving measures intended to optimize its cost structure. These cost saving measures included consolidating facilities in Chatsworth, California which amounted to approximately $0.2 million, in addition to reductions in workforce which included one-time termination benefits of approximately $1.6 million. The costs of implementation were reported under cost of net revenues and operating expenses in the Consolidated Statements of Operations. Substantially all cash outlays in connection with these measures occurred in the third and fourth quarter of fiscal 2016.
As of December 31, 2016, activities related to these measures were substantially complete.
The changes in reserves associated with these measures for fiscal 2016 consisted of the following and are included in accrued liabilities on the accompanying Consolidated Balance Sheets (in thousands):
Severance and Other employee related costs | Facility Closures and Asset impairments | |||||||
Balance at January 1, 2016 | $ | — | $ | — | ||||
Provision for cost saving measures | 1,557 | 166 | ||||||
Cash payments made | (914 | ) | (63 | ) | ||||
Balance at December 31, 2016 | $ | 643 | $ | 103 | ||||
63
10. Product Warranty
As of December 31, 2016 and 2015, MRV's product warranty liability recorded in accrued liabilities was $0.6 million. The following table summarizes the activity related to the product warranty liability (in thousands):
Balance at beginning of period | Cost of warranty claims | Accruals for product warranties | Balance at end of period | |||||||||||||
December 31, 2014 | $ | 578 | $ | (17 | ) | $ | 55 | $ | 616 | |||||||
December 31, 2015 | $ | 616 | $ | — | $ | (23 | ) | $ | 593 | |||||||
December 31, 2016 | $ | 593 | $ | (72 | ) | $ | 66 | $ | 587 | |||||||
MRV accrues for warranty costs as part of its cost of sales based on associated material product costs, technical support labor costs and associated overhead. The products sold are generally covered by a warranty for periods of 90 days to three years.
11. Stockholders' Equity
Stock Repurchase Programs and Stock Repurchase
On August 15, 2013, the Company's Board of Directors terminated an existing stock repurchase plan and approved a replacement repurchase plan on substantially the same terms in an amount up to $7.0 million that expired on May 14, 2014. From August 15, 2013, through December 31, 2014, the Company repurchased 127,510 shares at a total cost of approximately $1.3 million. No additional shares were repurchased during year ended December 31, 2014, under this plan.
On December 16, 2014, the Company's Board of Directors approved a repurchase of shares of the Company's Common Stock in an amount up to $8.0 million under a share repurchase plan that expired in accordance with its terms on November 13, 2015. During the year ended December 31, 2015, the Company repurchased 502,077 shares at a total cost of approximately $4.9 million, excluding commission under this share repurchase plan.
On March 15, 2016, the Company's Board of Directors approved a repurchase of shares of the Company's Common Stock in an amount up to $10.0 million under a stock repurchase program scheduled to expire on March 10, 2017. On November 2, 2016, the Company's Board of Directors approved the termination of the Company's stock repurchase program. During the year ended December 31, 2016, the Company repurchased a total of 264,058 shares at a total cost of approximately $2.7 million, excluding commissions, under this stock repurchase program, leaving remaining authority to repurchase shares up to an additional $7.3 million, excluding commissions, under this stock repurchase program prior to its termination.
Equity Grants
MRV's equity plans provide for granting options, restricted stock or other forms of equity to purchase shares of MRV's Common Stock, to employees, directors and non-employees performing consulting or advisory services for the Company. Under these plans, stock options exercise prices generally equal the fair market value of MRV's Common Stock at the date of grant and restricted stock grants do not have exercise prices. The options generally vest over one year to three years with expiration dates of ten years from the date of grant and all outstanding restricted stock grants vest one year from the date of grant. The Company's 2015 Long Term Incentive Plan provides for granting options, restricted stock, and other forms of equity, and is at the discretion of the Board of Directors. As of December 31, 2016, 531,204 shares of Common Stock were available for future awards under the plan. (See Note 12, Share-Based Compensation)
64
Dividends
The payment of dividends on the Company's Common Stock is within the discretion of the Company's Board of Directors. The Board of Directors did not declare cash dividends during the years ended December 31, 2016, 2015 and 2014. The Board of Directors regularly evaluates its capital position to consider the return of cash to stockholders. The Board of Directors does not currently have plans to begin paying a regular dividend.
12. Share-Based Compensation
MRV records share-based compensation expense at fair value. The following table summarizes the impact on MRV's results of continuing operations of recording share-based compensation for the years ended December 31, 2016, 2015 and 2014 (in thousands):
Year Ended December 31: | 2016 | 2015 | 2014 | |||||||||
Cost of goods sold | $ | 105 | $ | 131 | $ | 113 | ||||||
Product development and engineering | 222 | 232 | 166 | |||||||||
Selling, general and administrative | 1,177 | 756 | 653 | |||||||||
Total share-based compensation expense (1) | $ | 1,504 | $ | 1,119 | $ | 932 | ||||||
(1) | Income tax benefits realized from stock option exercises and similar awards were immaterial in all periods. |
Equity Incentive Plans
In May 2015, MRV's stockholders approved the 2015 Long Term Incentive Plan (LTIP) to replace MRV's outstanding equity compensation plan, the Omnibus Plan. Upon adoption of the 2015 Long Term Incentive Plan, no further shares were available for future grants of options or warrants under its predecessor plans including shares that become available as a consequence of the cancellation or forfeiture of outstanding options granted under such plans.
All stock options granted under the 2015 LTIP have a maximum contractual life of ten years from the date of the grant and typically vest over a period of one to three years from the date of the grant.
Share-Based Payment Awards
The Company granted 245,539, 255,914 and 198,647 stock options during the years ended December 31, 2016, 2015 and 2014, respectively, with the related average grant date fair value of $4.89, $4.48 and $6.95 per share, respectively. The Company granted restricted shares of 90,869, 95,587 and 100,355 at average grant date fair values of $10.95, $10.58 and $13.91 per share during the years ended December 31, 2016, 2015 and 2014, respectively. As of December 31, 2016, the total unrecognized share-based compensation balance for unvested securities, net of expected forfeitures, was $2.0 million, which is expected to be amortized over a weighted-average period of 1.8 years.
Stock Options
Valuation Assumptions
MRV uses the Black-Scholes option pricing model to estimate the fair value of stock option awards. The Black-Scholes model requires the use of subjective and complex assumptions including the option's expected life and the underlying stock price volatility. MRV bases volatility on the Company's historical quoted prices and peer company data. The expected term of options granted is based on the simplified method, using the mid-point between the vesting term and the original contractual term. The risk free interest rate is determined based on U.S. Treasury yields with equivalent remaining terms in effect at the time of the grant.
65
The following weighted average assumptions were used for estimating the fair value of options granted during the years ended December 31, 2016, 2015 and 2014:
Year ended December 31: | 2016 | 2015 | 2014 | ||||||
Risk-free interest rate | 1.4 | % | 1.7 | % | 2.0 | % | |||
Dividend yield (1) | — | — | — | ||||||
Volatility | 46 | % | 43 | % | 50 | % | |||
Expected life (in years) | 5.9 | 5.9 | 5.9 | ||||||
(1) | As the Company does not pay a dividend on a regular basis, and dividends paid in the past have been special in nature, a dividend rate of zero was used. |
Share-Based Payment Award Activity
The following table summarizes option share-based payment award activity for the three-year period ended December 31, 2016:
Shares under option | Weighted average exercise price | Weighted average remaining contractual term (in years) | Aggregate intrinsic value | ||||||||||||||
Balance as of December 31, 2013 | 349,454 | $ | 28.15 | 4.34 | $ | 48,939 | |||||||||||
Granted | 198,647 | $ | 14.11 | ||||||||||||||
Exercised | (6,812 | ) | $ | 10.55 | |||||||||||||
Forfeited | (133,339 | ) | $ | 26.58 | |||||||||||||
Balance as of December 31, 2014 | 407,950 | $ | 22.12 | 4.89 | $ | 22,479 | |||||||||||
Granted | 255,914 | $ | 10.46 | ||||||||||||||
Exercised | (16,878 | ) | $ | 11.27 | |||||||||||||
Forfeited | (183,073 | ) | $ | 23.84 | |||||||||||||
Balance as of December 31, 2015 | 463,913 | $ | 15.10 | 7.96 | $ | 614,591 | |||||||||||
Granted | 245,539 | $ | 10.93 | ||||||||||||||
Exercised | (15,415 | ) | $ | 9.42 | |||||||||||||
Forfeited | (94,064 | ) | $ | 20.77 | |||||||||||||
Outstanding, December 31, 2016 | 599,973 | $ | 12.68 | 8.05 | $ | — | |||||||||||
Vested and expected to vest, December 31, 2016 | 544,232 | $ | 12.86 | 7.94 | $ | — | |||||||||||
Exercisable, December 31, 2016 | 219,956 | $ | 15.57 | 6.48 | $ | — | |||||||||||
66
The following table summarizes significant ranges of outstanding and exercisable options at December 31, 2016:
Range of Exercise prices | Options outstanding as of December 31, 2016 | Weighted average remaining contractual life (years) | Weighted average exercise price | Options exercisable as of December 31, 2016 | Weighted average exercise price of exercisable options | |||||||||||
$9.10 - $9.20 | 21,998 | 6.86 | $ | 9.12 | 18,609 | $ | 9.10 | |||||||||
$9.63 - $9.63 | 155,636 | 8.26 | $ | 9.63 | 64,315 | $ | 9.63 | |||||||||
$9.72 - $10.55 | 14,007 | 5.59 | $ | 10.06 | 12,675 | $ | 10.09 | |||||||||
$10.95 - $10.95 | 225,650 | 9.42 | $ | 10.95 | — | $ | — | |||||||||
$12.12 - $13.40 | 63,416 | 8.38 | $ | 12.78 | 30,086 | $ | 12.94 | |||||||||
$13.46 - $14.51 | 81,030 | 6.81 | $ | 14.27 | 57,701 | $ | 14.23 | |||||||||
$16.80 - $27.60 | 19,461 | 4.75 | $ | 23.79 | 17,795 | $ | 24.18 | |||||||||
$29.80 - $29.80 | 4,150 | 0.92 | $ | 29.80 | 4,150 | $ | 29.80 | |||||||||
$32.00 - $32.00 | 1,200 | 1.33 | $ | 32.00 | 1,200 | $ | 32.00 | |||||||||
$52.60 - $52.60 | 13,425 | 0.54 | $ | 52.60 | 13,425 | $ | 52.60 | |||||||||
$9.10 - $52.60 | 599,973 | 8.05 | $ | 12.68 | 219,956 | $ | 15.57 | |||||||||
Restricted Stock Awards
The Company accounts for the fair value of the restricted shares using the closing market price of the Company’s Common Stock on the date of grant.
The following table summarizes restricted stock award activity for the three-year period ended December 31, 2016:
Number of Restricted Stock Awards | Weighted Average Grant Date Fair Value Per Share | Aggregate intrinsic value | |||||||||||
Balance as of December 31, 2013 | 81,193 | $ | 9.94 | $ | 870,399 | ||||||||
Granted | 100,355 | $ | 13.91 | ||||||||||
Released | (39,238 | ) | $ | 10.08 | |||||||||
Canceled | (39,276 | ) | $ | 12.45 | |||||||||
Balance as of December 31, 2014 | 103,034 | $ | 12.80 | $ | 1,023,128 | ||||||||
Granted | 95,587 | $ | 10.58 | ||||||||||
Released | (41,136 | ) | $ | 12.58 | |||||||||
Canceled | (14,306 | ) | $ | 12.79 | |||||||||
Balance as of December 31, 2015 | 143,179 | $ | 11.38 | $ | 1,749,647 | ||||||||
Granted | 90,869 | $ | 10.95 | ||||||||||
Released | (65,766 | ) | $ | 11.23 | |||||||||
Canceled | (22,326 | ) | $ | 11.94 | |||||||||
Outstanding, December 31, 2016 | 145,956 | $ | 11.14 | $ | 1,189,541 | ||||||||
The following table summarizes certain stock option exercise and restricted share activity during the periods presented (in thousands):
Year ended December 31: | 2016 | 2015 | 2014 | |||||||||
Total intrinsic value of stock options exercised | $ | 34 | $ | 42 | $ | 17 | ||||||
Cash received from stock options exercised | $ | 145 | $ | 190 | $ | 72 | ||||||
Total value of restricted shares vested | $ | 697 | $ | 380 | $ | 525 | ||||||
67
13. Geographic Information
Following the completion of the sale of the Tecnonet business unit on December 3, 2015, MRV now has one reportable segment: Network Equipment.
The Network Equipment segment designs, manufactures, distributes and services optical networking solutions and Internet infrastructure products. Network Equipment revenue primarily consists of optical communication systems that include metro ethernet equipment, optical transport equipment, lab automation equipment, out-of-band network equipment, and the related service revenue and fiber optic components sold as part of system solutions.
Management evaluates reportable segment information pursuant to ASC 280, Segment Reporting. Based on this evaluation as of December 31, 2016, management has determined the Company operates as a single reportable segment.
Revenues:
The following table summarizes external revenue by geographic region (in thousands):
Year Ended December 31: | 2016 | % of revenue | 2015 | % of revenue | 2014 | % of revenue | |||||||||||||||
United States | $ | 39,727 | 49 | % | $ | 42,933 | 49 | % | $ | 51,036 | 59 | % | |||||||||
Americas (Excluding the U.S.) | 8,250 | 10 | % | 6,828 | 8 | % | 1,507 | 2 | % | ||||||||||||
Europe | 14,531 | 18 | % | 19,463 | 22 | % | 20,478 | 24 | % | ||||||||||||
Asia Pacific | 17,807 | 23 | % | 18,975 | 21 | % | 13,517 | 15 | % | ||||||||||||
Total | $ | 80,315 | 100 | % | $ | 88,199 | 100 | % | $ | 86,538 | 100 | % | |||||||||
A significant percentage of the revenues generated in the Asia Pacific region are derived from Australia and accounted for 20%, 18% and 13% of our consolidated revenue for the years ended December 31, 2016, 2015 and 2014, respectively. Revenues generated in Europe and the Americas (excluding U.S.) did not reflect any significant individual country concentration for the years ended December 31, 2016, 2015 and 2014.
Significant Customers:
Revenue from one customer accounted for 17%, 19% and 11% of our consolidated revenue for the years ended December 31, 2016, 2015 and 2014, respectively. As of December 31, 2016 and 2015, amounts due from this customer accounted for 11% and 15% of our consolidated gross accounts receivables, respectively. Revenue from another customer accounted for 12% of our consolidated revenue for the years ended December 31, 2016, 2015 and 2014. As of December 31, 2016 and 2015, amounts due from this customer accounted for 11% and 5% of our consolidated gross accounts receivables, respectively.
Long-lived Assets:
The following table summarizes long-lived assets, consisting of property and equipment, by geographic region (in thousands):
December 31: | 2016 | 2015 | ||||||
United States | $ | 2,336 | $ | 2,808 | ||||
Americas (Excluding the U.S.) | — | — | ||||||
Europe 1 | 782 | 1,223 | ||||||
Asia Pacific | 12 | 19 | ||||||
Total | $ | 3,130 | $ | 4,050 | ||||
(1) Includes Long-lived Assets held in Israel of $0.8 million and $1.2 million as December 31, 2015 and 2016, respectively.
68
14. Other Income (Expense), Net
Following is a summary of other income (expense), net (in thousands):
Year ended December 31: | 2016 | 2015 | 2014 | |||||||||
Interest income | $ | 39 | $ | 1 | $ | 5 | ||||||
Gain (loss) on foreign currency transactions | (310 | ) | (133 | ) | 441 | |||||||
Other (expense) income, net | 5 | 84 | 225 | |||||||||
Total | $ | (266 | ) | $ | (48 | ) | $ | 671 | ||||
15. Quarterly Financial Data (Unaudited)
The following tables summarize MRV's Consolidated Statements of Operations for 2016 (in thousands):
Three months ended: | March 31, 2016 | June 30, 2016 | September 30, 2016 | December 31, 2016 | ||||||||||||
Revenue | $ | 18,882 | $ | 21,584 | $ | 18,947 | $ | 20,902 | ||||||||
Cost of sales | 9,079 | 11,513 | 9,981 | 10,636 | ||||||||||||
Gross profit | 9,803 | 10,071 | 8,966 | 10,266 | ||||||||||||
Operating expenses: | ||||||||||||||||
Product development and engineering | 5,344 | 5,125 | 4,937 | 5,075 | ||||||||||||
Selling, general and administrative | 8,017 | 7,007 | 6,931 | 7,719 | ||||||||||||
Total operating expenses | 13,361 | 12,132 | 11,868 | 12,794 | ||||||||||||
Operating loss | (3,558 | ) | (2,061 | ) | (2,902 | ) | (2,528 | ) | ||||||||
Other income (loss), net | (277 | ) | 74 | (180 | ) | 117 | ||||||||||
Loss before provision for income taxes | (3,835 | ) | (1,987 | ) | (3,082 | ) | (2,411 | ) | ||||||||
Provision for income taxes | 61 | 36 | 31 | 194 | ||||||||||||
Net loss | $ | (3,896 | ) | $ | (2,023 | ) | $ | (3,113 | ) | $ | (2,605 | ) | ||||
Net loss per share — basic and diluted | $ | (0.56 | ) | $ | (0.29 | ) | $ | (0.45 | ) | $ | (0.38 | ) | ||||
Basic and diluted weighted average shares | 6,981 | 7,092 | 6,868 | 6,808 | ||||||||||||
The above table includes adjustments to revenue for the quarters ended March 31, 2016, June 30, 2016, September 30, 2016 and December 31, 2016 in the amounts of $0.3 million, $0.4 million, $0.3 million and $0.5 million, respectively, related to the reversing of an excess accrual for future product discounts upon the expiration of a customer contract.
69
The following tables summarize MRV's Consolidated Statements of Operations for 2015 (in thousands):
Three months ended: | March 31, 2015 | June 30, 2015 | September 30, 2015 | December 31, 2015 | ||||||||||||
Revenue | $ | 22,185 | $ | 24,519 | $ | 22,933 | $ | 18,562 | ||||||||
Cost of sales | 10,641 | 12,560 | 10,819 | 8,599 | ||||||||||||
Gross profit | 11,544 | 11,959 | 12,114 | 9,963 | ||||||||||||
Operating expenses: | ||||||||||||||||
Product development and engineering | 5,125 | 5,310 | 4,901 | 5,112 | ||||||||||||
Selling, general and administrative | 7,736 | 7,379 | 7,281 | 6,570 | ||||||||||||
Total operating expenses | 12,861 | 12,689 | 12,182 | 11,682 | ||||||||||||
Operating loss | (1,317 | ) | (730 | ) | (68 | ) | (1,719 | ) | ||||||||
Interest expense | (14 | ) | (22 | ) | (11 | ) | (8 | ) | ||||||||
Other income (loss), net | 81 | (296 | ) | 188 | (21 | ) | ||||||||||
Income (loss) from continuing operations before provision for income taxes | (1,250 | ) | (1,048 | ) | 109 | (1,748 | ) | |||||||||
Provision (benefit) for income taxes | 50 | 77 | (39 | ) | 2,783 | |||||||||||
Income (loss) from continuing operations | (1,300 | ) | (1,125 | ) | 148 | (4,531 | ) | |||||||||
Gain (loss) from discontinued operations | 232 | 844 | 738 | (2,185 | ) | |||||||||||
Net income (loss) | $ | (1,068 | ) | $ | (281 | ) | $ | 886 | $ | (6,716 | ) | |||||
Net income (loss) per share — basic | ||||||||||||||||
From continuing operations | $ | (0.18 | ) | $ | (0.16 | ) | $ | 0.02 | $ | (0.65 | ) | |||||
From discontinued operations | 0.03 | 0.12 | 0.11 | (0.31 | ) | |||||||||||
Net income (loss) per share — basic | $ | (0.15 | ) | $ | (0.04 | ) | $ | 0.13 | $ | (0.96 | ) | |||||
Net income (loss) per share — diluted | ||||||||||||||||
From continuing operations | $ | (0.18 | ) | $ | (0.16 | ) | $ | 0.02 | $ | (0.65 | ) | |||||
From discontinued operations | 0.03 | 0.12 | 0.11 | (0.31 | ) | |||||||||||
Net income (loss) per share — diluted | $ | (0.15 | ) | $ | (0.04 | ) | $ | 0.13 | $ | (0.96 | ) | |||||
Basic weighted average shares | 7,131 | 6,988 | 6,978 | 6,980 | ||||||||||||
Diluted weighted average shares | 7,131 | 6,988 | 7,014 | 6,980 | ||||||||||||
The above table includes a $2.6 million increase in the provision for income taxes for the three months ended December 31, 2015 related to an increase in the Company's valuation allowance on deferred tax assets. (See Note 6, Income Taxes).
16. Subsequent Events
On January 9, 2017, the Company entered into an agreement to accelerate the termination date of its existing lease amendment for office space (Fulbright building) in Chatsworth, California (Los Angeles area) to January 31, 2017. The original lease term included an expiration date of March 31, 2017, and would have required remaining lease payments in the amount $0.1 million. This facility had remained idle since August 2016 when the Company consolidated its two existing Chatsworth facilities.
On February 1, 2017, the Company entered into an agreement to extend its current lease of office and warehouse space (Mason building) located in Chatsworth, California (Los Angeles area) through March 31, 2019, with no option to extend the lease term. The remaining lease payments will approximate $0.6 million.
70
Item 9. Changes in and Disagreements with Accountants on Accounting and Financial Disclosure.
None.
Item 9A. Controls and Procedures.
Controls and Procedures
We maintain disclosure controls and procedures that are designed to ensure that information required to be disclosed in our reports under the Exchange Act is recorded, processed, summarized and reported within the time periods specified in the Securities and Exchange Commission's rules and forms, and that such information is accumulated and communicated to our management, including our principal executive officer and principal financial officer, as appropriate, to allow timely decisions regarding required disclosures. Any controls and procedures, no matter how well designed and operated, can provide only reasonable assurance of achieving the desired control objectives. An evaluation was performed under the supervision and with the participation of our management, including our Chief Executive Officer, and our Chief Financial Officer, of the effectiveness of the design and operation of our disclosure controls and procedures (as that term is defined in Rule 13a-15(e) and 15d-15(e) under the Exchange Act) as of December 31, 2016. Based on that evaluation, our management, including our Chief Executive Officer and our Chief Financial Officer, concluded that our disclosure controls and procedures were effective as of December 31, 2016 at the reasonable assurance level. There has been no change in our internal control over financial reporting (as that term is defined in Rule 13a-15(f) and 15d-15(f) under the Exchange Act) during the year ended December 31, 2016 that has materially affected, or is reasonably likely to materially affect, our internal control over financial reporting.
Management's Report on Internal Control over Financial Reporting
Our management is responsible for establishing and maintaining adequate internal control over financial reporting as defined in Rule 13a-15(f) and 15d-15(f) under the Exchange Act. We have performed an evaluation under the supervision and with the participation of our management, including our Chief Executive Officer and our Chief Financial Officer, of the effectiveness of our internal control over financial reporting based on the criteria established in “Internal Control-Integrated Framework (2013)” issued by the Committee of Sponsoring Organizations of the Treadway Commission (COSO). Based on that evaluation, our management, including our Chief Executive Officer and Chief Financial Officer, concluded that our internal control over financial reporting was effective as of December 31, 2016.
The effectiveness of our internal control over financial reporting as of December 31, 2016 has been audited by Grant Thornton LLP, an independent registered public accounting firm, as stated in their audit report appearing on page 72 of this Annual Report on Form 10-K.
71
Report of Independent Registered Public Accounting Firm
Board of Directors and Stockholders
MRV Communications, Inc.
We have audited the internal control over financial reporting of MRV Communications, Inc., a Delaware corporation (the “Company”), as of December 31, 2016, based on criteria established in the 2013 Internal Control-Integrated Framework issued by the Committee of Sponsoring Organizations of the Treadway Commission (COSO). The Company’s management is responsible for maintaining effective internal control over financial reporting and for its assessment of the effectiveness of internal control over financial reporting, included in the accompanying Management’s Report on Internal Control over Financial Reporting. Our responsibility is to express an opinion on the Company’s internal control over financial reporting based on our audit.
We conducted our audit in accordance with the standards of the Public Company Accounting Oversight Board (United States). Those standards require that we plan and perform the audit to obtain reasonable assurance about whether effective internal control over financial reporting was maintained in all material respects. Our audit included obtaining an understanding of internal control over financial reporting, assessing the risk that a material weakness exists, testing and evaluating the design and operating effectiveness of internal control based on the assessed risk, and performing such other procedures as we considered necessary in the circumstances. We believe that our audit provides a reasonable basis for our opinion.
A company’s internal control over financial reporting is a process designed to provide reasonable assurance regarding the reliability of financial reporting and the preparation of financial statements for external purposes in accordance with generally accepted accounting principles. A company’s internal control over financial reporting includes those policies and procedures that (1) pertain to the maintenance of records that, in reasonable detail, accurately and fairly reflect the transactions and dispositions of the assets of the company; (2) provide reasonable assurance that transactions are recorded as necessary to permit preparation of financial statements in accordance with generally accepted accounting principles, and that receipts and expenditures of the company are being made only in accordance with authorizations of management and directors of the company; and (3) provide reasonable assurance regarding prevention or timely detection of unauthorized acquisition, use, or disposition of the company’s assets that could have a material effect on the financial statements.
Because of its inherent limitations, internal control over financial reporting may not prevent or detect misstatements. Also, projections of any evaluation of effectiveness to future periods are subject to the risk that controls may become inadequate because of changes in conditions, or that the degree of compliance with the policies or procedures may deteriorate.
In our opinion, the Company maintained, in all material respects, effective internal control over financial reporting as of December 31, 2016, based on criteria established in the 2013 Internal Control-Integrated Framework issued by COSO.
We also have audited, in accordance with the standards of the Public Company Accounting Oversight Board (United States), the consolidated financial statements of the Company as of and for the year ended December 31, 2016, and our report dated March 9, 2017 expressed an unqualified opinion on those financial statements.
/s/ Grant Thornton LLP
Los Angeles, California
March 9, 2017
72
PART III
Item 10. Directors, Executive Officers and Corporate Governance.
The information required by this Item under the heading "Directors, Executive Officers and Corporate Governance" may be incorporated herein by reference from information to be contained in the Company's next proxy statement or will be included in an amendment to this Form 10-K to be filed with the SEC within 120 days after the end of the fiscal year to which this report relates.
Item 11. Executive Compensation.
The information required by this Item under the heading "Executive Compensation" may be incorporated herein by reference from information to be contained in the Company's next proxy statement or will be included in an amendment to this Form 10-K to be filed with the SEC within 120 days after the end of the fiscal year to which this report relates.
Item 12. Security Ownership of Certain Beneficial Owners and Management and Related Stockholder Matters.
The information required by this Item under the heading "Security Ownership of Certain Beneficial Owners and Management and Related Stockholder Matters" may be incorporated herein by reference from information to be contained in the Company's next proxy statement or will be included in an amendment to this Form 10-K to be filed with the SEC within 120 days after the end of the fiscal year to which this report relates.
Item 13. Certain Relationships and Related Transactions, and Director Independence.
The information required by this Item under the heading "Certain Relationships and Related Transactions, and Director Independence" may be incorporated herein by reference from information to be contained in the Company's next proxy statement or will be included in an amendment to this Form 10-K to be filed with the SEC within 120 days after the end of the fiscal year to which this report relates.
Item 14. Principal Accounting Fees and Services.
The information required by this Item under the heading "Principal Accounting Fees and Services" may be incorporated herein by reference from information to be contained in the Company's next proxy statement or will be included in an amendment to this Form 10-K to be filed with the SEC within 120 days after the end of the fiscal year to which this report relates.
73
PART IV
Item 15. Exhibits and Financial Statement Schedules.
(1) Included in Part II, Item 8 of this Annual Report on Form 10-K:
Form 10-K Page No. | ||
Consolidated Financial Statements: | ||
(2) Schedule II — Valuation and Qualifying Accounts
Information required to be set forth herein is shown in the financial statements or notes thereto.
(3) Exhibits
Exhibit No. | Description |
2.1 | Stock Purchase Agreement, dated as of December 2, 2011, by and between MRV Communications, Inc., as Seller, and CES Holding SA, as Purchaser, represented for purpose of the Agreement by Vinci Capital Switzerland SA (incorporated by reference from Exhibit 10.1 of Form 8-K filed on December 7, 2011) |
2.2 | Share Purchase Agreement, dated as of August 1, 2012, between the Company, as Seller, and IJ Next, as Purchaser in the presence of Holding Baelen Gaillard (incorporated by reference from Exhibit 10.1 of Form 8-K filed on August 7, 2012) |
2.3 | Representations and Warranties Agreement, dated as of August 1, 2012, between the Company, as warrantor, and IJ Next, as beneficiary (incorporated by reference from Exhibit 10.2 of Form 8-K filed on August 7, 2012) |
2.4 | Stock Purchase Agreement, dated as of September 11, 2012, by and between the Company as Seller, and Deltaco Aktiebolag, as Purchaser (incorporated by reference from Exhibit 10.1 of Form 8-K filed on September 12, 2012) |
2.5 | Share Sale and Purchase Agreement, dated as of August 7, 2015, between MRV Communications, Inc. and Maticmind S.p.A. (incorporated by reference from Exhibit 4.1 of Form 8-K filed on August 10, 2015) |
3.1 | Amended and Restated Certificate of Incorporation of MRV Communications, Inc. (incorporated by reference from Exhibit 4.1 of Form 10-Q for the quarter ended June 30, 2007) |
3.2 | Amended and Restated Certificate of Incorporation of MRV Communications, Inc., as amended by a Certificate of Ownership and Merger on July 31, 2009 (incorporated by reference from Exhibit 3.1 on Form 10-Q for the quarter ended September 30, 2012) |
3.3 | Certificate of Amendment of the Amended and Restated Certificate of Incorporation of MRV Communications, Inc., filed on December 19, 2012 (incorporated by reference from Exhibit 3.3 of Form 10-K for the year ended December 31, 2012) |
3.4 | Bylaws of MRV Communications, Inc., as amended through October 5, 2009 (incorporated by reference from Exhibit 3.1 of Form 8-K filed on October 6, 2009) |
3.5 | Bylaws of MRV Communications, Inc. as amended through November 8, 2013 (incorporated by reference from Exhibit 3.1 on Form 10-Q for the quarter ended September 30, 2013) |
3.6 | Amended and Restated Bylaws of MRV Communications, Inc. as amended through November 5, 2014 (incorporated by reference from Exhibit 3.1 on Form 10-Q for the quarter ended September 30, 2014) |
3.7 | Certificate of Designations of Series A Junior Participating Preferred Stock of MRV Communications, Inc. (incorporated by reference from Exhibit 3.1 of Form 8-K filed on January 26, 2016) |
74
4.1 | Specimen certificate of Common Stock (incorporated by reference to Exhibit 4.5 of Form S-3 (file No. 333-64017) filed on September 9, 1998) |
4.2 | Warrant Agreement dated as of July 16, 2013 between MRV Communications, Inc. and American Stock Transfer and Trust Company (incorporated by reference from Exhibit 4.1 on Form 10-Q for the quarter ended June 30, 2013) |
4.3 | Rights Agreement, dated as of January 26, 2016, between MRV Communications, Inc. and American Stock Transfer & Trust Company, LLC, as Rights Agent, which includes the Form of Certificate of Designations as Exhibit A, Form of Right Certificate as Exhibit B and the Summary of Rights to Purchase Preferred Shares as Exhibit C (incorporated by reference from Exhibit 4.1 of Form 8-K filed on January 26, 2016) |
10.1 | Employment Agreement, dated February 1, 2013, by and between the Company and David Stehlin (incorporated by reference from Exhibit 10.2 of Form 8-K filed on February 4, 2013) |
10.2 | Engagement Agreement, dated February 23, 2012, by and between the Company and Avant Advisory Group, LLC (incorporated by reference from Exhibit 10.1 of Form 8-K filed on April 3, 2012) |
10.3 | Employment Agreement, dated October 10, 2012, by and between the Company and Stephen Garcia (incorporated by reference from Exhibit 10.1 of Form 8-K filed on October 11, 2012) |
10.4 | Form of Executive Severance Agreement, by and between the Company and the Executive (incorporated by reference from Exhibit 10.2 of Form 8-K filed on May 27, 2010) |
10.5 | Letter Agreement, dated February 8, 2012, by and between the Company and Jennifer Hankes Painter (incorporated by reference from Exhibit 10.2 of Form 8-K filed on February 8, 2012) |
10.6 | Letter Agreement, dated February 8, 2012, by and between the Company and Barry R. Gorsun (incorporated by reference from Exhibit 10.1 of Form 8-K filed on February 8, 2012) |
10.7 | Separation and Consulting Agreement, dated January 31, 2013, by and between the Company and Barry Gorsun (incorporated by reference from Exhibit 10.1 of Form 8-K filed on February 4, 2013) |
10.8 | Separation and Transition Agreement, dated January 20, 2012, by and between the Company and Chris King (incorporated by reference from Exhibit 10.1 of Form 8-K filed on January 24, 2012) |
10.9 | Separation and Release Agreement, dated December 5, 2011, by and between the Company and Dilip Singh (incorporated by reference from Exhibit 10.1 of Form 8-K filed on December 6, 2011) |
10.10 | Separation and Transition Agreement, dated January 23, 2012, by and between the Company and Blima Tuller (incorporated by reference from Exhibit 10.2 of Form 8-K filed on January 24, 2012) |
10.11 | Notice of Grant of Non-Qualified Stock Option Award to Dilip Singh (incorporated by reference from Exhibit 4.1 of Form S-8 (file no. 333-168910) filed on August 17, 2010) |
10.12 | MRV Communications, Inc. 2007 Omnibus Incentive Plan (incorporated by reference from Exhibit 4.1 of Form S-8 (file no. 333-167971) filed on July 2, 2010) |
10.13 | Amendment to MRV Communications, Inc. 2007 Omnibus Incentive Plan dated November 5, 2012 (incorporated by reference from Exhibit 10.6 of Form 10-Q for the quarter ended September 30, 2012) |
10.14 | Form of Notice of Grant and Agreement for Non-Qualified Stock Option Awards for employees under the 2007 Omnibus Incentive Plan for 2007 - 2010 (incorporated by reference from Exhibit 10.8 of Form 10-K filed on October 8, 2009) |
10.15 | Form of Notice of Grant and Agreement for Non-Qualified Stock Option Awards for employees under the 2007 Omnibus Incentive Plan for 2011 - present (incorporated by reference from Exhibit 10.2 of Form 8-K filed on March 15, 2011) |
10.16 | Form of Notice of Grant and Agreement for Non-Qualified Stock Option Awards for directors under the 2007 Omnibus Incentive Plan for the years 2007 - 2008 (incorporated by reference from Exhibit 10.9 of Form 10-K filed on October 8, 2009) |
10.17 | Form of Notice of Grant and Agreement for Non-Qualified Stock Option Awards for directors under the 2007 Omnibus Incentive Plan for 2010 - present (incorporated by reference from Exhibit 4.3 of Form S-8 (file no. 333-167971) filed on July 2, 2010) |
10.18 | Form of Notice of Grant and Agreement for Restricted Stock Award for directors under the 2007 Omnibus Incentive Plan (incorporated by reference from Exhibit 4.4 of Form S-8 (file no. 333-167971) filed on July 2, 2010) |
10.19 | Non-Director and Non-Executive Officer Consolidated Long-Term Stock Incentive Plan (incorporated by reference from Exhibit 4.1 of Form S-8 (file no. 333-107109) filed on July 17, 2003) |
10.20 | Form of Non-Director and Non-Executive Officer Consolidated Long-Term Stock Incentive Plan Award Agreement (incorporated by reference to Exhibit 4.2 of Form S-8 (file no. 333-107109) filed on July 17, 2003) |
75
10.21 | 1997 Incentive and Nonstatutory Stock Option Plan, as amended (incorporated by reference from Exhibit 10.8 of Form 10-K filed on October 8, 2009) |
10.22 | Form of Stock Option Agreement under the 1997 Incentive and Nonstatutory Stock Option Plan (incorporated by reference from Exhibit 4.2 of Form S-8 (file no. 333-87735) filed on September 24, 1999) |
10.23 | Agreement, dated October 17, 2011, by and among the Company, Charles M. Gillman, Joan E. Herman, Michael E. Keane, Michael J. McConnell, Igal Shidlovsky, Kenneth Shubin Stein, Dilip Singh, Philippe Tartavull, Spencer Capital Management and Boston Avenue Capital LLC (incorporated by reference from Exhibit 10.1 of Form 8-K filed on October 21, 2011) |
10.24 | Share Purchase Agreement, dated as of August 17, 2012, by and among T2 Accredited Fund, L.P., T2 Qualified Fund, L.P. and Tilson Offshore Fund, Ltd., and the Company as Purchaser (incorporated by reference from Exhibit 10.1 of Form 8-K filed on August 20, 2012) |
10.25 | Settlement and Mutual Release Agreement, dated as of June 11, 2012, by and among the Company, Source Photonics, Ying Lu, Jingchun Sun, Starry Holdings Limited, Min Wang and Chao Zhang (incorporated by reference from Exhibit 10.1 of Form 8-K filed on June 15, 2012) |
10.26 | Memorandum of Understanding, dated January 16, 2013, by and among the Plaintiffs, Individual Defendants and the company (incorporated by reference from Exhibit 10.1 of Form 8-K filed on January 17, 2013) |
10.27 | Form of Notice of Grant for Restricted Stock Award for executives under the 2007 Omnibus Incentive Plan, as amended (incorporated by reference from Exhibit 10.1 of Form 8-K filed on April 5, 2013) |
10.28 | Form of Notice of Grant of Non-Qualified Stock Option Award for executives under the 2007 Omnibus Incentive Plan, as amended (incorporated by reference from Exhibit 10.2 of Form 8-K filed on April 5, 2013) |
10.29 | Stipulation of Settlement (incorporated by reference from Exhibit 99.1 of Form 8-K filed on April 11, 2013) |
10.30 | Executive Management Incentive Plan - CEO (incorporated by reference from Exhibit 99.1 of Form 10-Q for the quarter ended June 30, 2013) |
10.31 | Executive Management Incentive Plan - CFO (incorporated by reference from Exhibit 99.2 of Form 10-Q for the quarter ended June 30, 2013) |
10.32 | Resignation Agreement, dated as of December 12, 2014, by and between the Company and David Stehlin (incorporated by reference from Exhibit 10.1 of Form 8-K filed on December 16, 2014) |
10.33 | Amended and Restated Employment Agreement, dated as of December 12, 2014, by and between the Company and Mark Bonney (incorporated by reference from Exhibit 10.2 of Form 8-K filed on December 16, 2014 |
10.34 | MRV Communications, Inc. 2015 Long-Term Incentive Plan (incorporated by reference to Appendix A of the Company’s Definitive Proxy Statement on Schedule 14A for the 2014 Annual Meeting of Stockholders, filed on April 10, 2015) |
10.35 | Form of MRV Communications, Inc. 2015 Long-Term Incentive Plan Restricted Stock Agreement (incorporated by reference from Exhibit 10.1 of Form 8-K filed on June 4, 2015) |
10.36 | Form of MRV Communications, Inc. 2015 Long-Term Incentive Plan Stock Option Agreement (incorporated by reference from Exhibit 10.2 of Form 8-K filed on June 4, 2015) |
10.37 | Change in Control Agreement, dated as of May 5, 2016, by and between the Company and Stephen G. Krulik (incorporated by reference from Exhibit 10.1 of May 5, 2016) |
10.38 | Letter Agreement, dated as of October 1, 2015, by and between the Company and Adam Scheer (incorporated by reference from Exhibit 10.1 of Form 8-K filed on December 27, 2016) |
10.39 | Amendment to Letter Agreement, dated as of September 27, 2016, by and between the Company and Adam Scheer (incorporated by reference from Exhibit 10.2 of Form 8-K filed on December 27, 2016) |
21.1 | Subsidiaries of the Registrant |
23.1 | Consent of Independent Registered Public Accounting Firm |
31.1 | Certification of the Principal Executive Officer pursuant to Section 302 of the Sarbanes-Oxley Act of 2002 (filed herewith) |
31.2 | Certification of the Principal Financial Officer pursuant to Section 302 of the Sarbanes-Oxley Act of 2002 (filed herewith) |
76
32.1 | Certification of the Principal Executive Officer pursuant to Section 906 of the Sarbanes-Oxley Act of 2002 (filed herewith) |
32.2 | Certification of the Principal Financial Officer pursuant to Section 906 of the Sarbanes-Oxley Act of 2002 (filed herewith) |
101.INS | XBRL Instance Document (filed herewith) |
101.SCH | XBRL Taxonomy Extension Schema Document (furnished herewith) |
101.CAL | XBRL Taxonomy Calculation Linkbase Document (filed herewith) |
101.LAB | XBRL Taxonomy Label Linkbase Document (filed herewith) |
101.PRE | XBRL Taxonomy Presentation Linkbase Document (filed herewith) |
101.DEF | XBRL Taxonomy Extension Definition Document (filed herewith) |
SIGNATURES
Pursuant to the requirements of Section 13 or 15(d) of the Securities Exchange Act of 1934, the Registrant has duly caused this report to be signed on its behalf by the undersigned, thereunto duly authorized.
MRV Communications, Inc. | ||
By: | ||
March 9, 2017 | /s/ Mark J. Bonney | |
Mark J. Bonney Chief Executive Officer | ||
Pursuant to the requirements of the Exchange Act, this report has been signed below by the following persons on behalf of the Registrant and in the capacities and on the dates indicated.
POWER OF ATTORNEY
KNOW ALL PERSONS BY THESE PRESENTS, that each person whose signature appears below constitutes and appoints Mark J. Bonney and Stephen G. Krulik, and each of them, as his or her true and lawful attorneys-in-fact and agents, with full power of substitution and resubstitution, for him or her and in his or her name, place and stead, in any and all capacities, to sign any and all amendments to this Annual Report on Form 10-K, and to file the same, with all exhibits thereto, and other documents in connection therewith, with the Securities and Exchange Commission, granting unto said attorneys-in-fact and agents, and each of them, full power and authority to do and perform each and every act and thing requisite and necessary to be done in connection therewith, as fully to all intents and purposes as he or she might or could do in person, hereby ratifying and confirming that all said attorneys-in-fact and agents, or any of them or their or his or her substitute or substitutes, may lawfully do or cause to be done by virtue hereof.
Principal Executive Officer: | ||
March 9, 2017 | /s/ Mark J. Bonney | |
Mark J. Bonney Chief Executive Officer and Director | ||
Principal Financial and Accounting Officer: | ||
March 9, 2017 | /s/ Stephen G. Krulik | |
Stephen G. Krulik Chief Financial Officer | ||
77
Board of Directors: | ||
March 9, 2017 | /s/ Kenneth H. Traub | |
Kenneth H. Traub | ||
March 9, 2017 | /s/ Robert Pons | |
Robert Pons | ||
March 9, 2017 | /s/ Brian Bellinger | |
Brian Bellinger | ||
March 9, 2017 | /s/ Jeannie Diefenderfer | |
Jeannie Diefenderfer | ||
March 9, 2017 | /s/ Jeffrey Tuder | |
Jeffrey Tuder | ||
78