Attached files
| file | filename |
|---|---|
| EX-32.2 - EX-32.2 - CBIZ, Inc. | cbz-ex322_9.htm |
| EX-32.1 - EX-32.1 - CBIZ, Inc. | cbz-ex321_8.htm |
| EX-31.2 - EX-31.2 - CBIZ, Inc. | cbz-ex312_10.htm |
| EX-31.1 - EX-31.1 - CBIZ, Inc. | cbz-ex311_11.htm |
| EX-23 - EX-23 - CBIZ, Inc. | cbz-ex23_12.htm |
| EX-21.1 - EX-21.1 - CBIZ, Inc. | cbz-ex211_13.htm |
UNITED STATES
SECURITIES AND EXCHANGE COMMISSION
WASHINGTON, D.C. 20549
FORM 10-K
|
☒ |
ANNUAL REPORT PURSUANT TO SECTION 13 OR 15(d) OF THE SECURITIES EXCHANGE ACT OF 1934 |
For the fiscal year ended December 31, 2016
or
|
☐ |
TRANSITION REPORT PURSUANT TO SECTION 13 OR 15(d) OF THE SECURITIES EXCHANGE ACT OF 1934 |
For the transition period from to
Commission file number 1-32961
CBIZ, INC.
(Exact name of registrant as specified in its charter)
|
Delaware |
|
22-2769024 |
|
(State or other jurisdiction of incorporation or organization) |
|
(I.R.S. Employer Identification No.) |
|
|
|
|
|
6050 Oak Tree Boulevard, South, Suite 500, Cleveland, Ohio |
|
44131 |
|
(Address of principal executive offices) |
|
(Zip Code) |
Registrant’s telephone number, including area code: (216) 447-9000
Securities registered pursuant to Section 12(b) of the Act:
|
Common Stock, par value $0.01 |
|
New York Stock Exchange |
|
(Title of class) |
|
(Name of exchange on which registered) |
Securities registered pursuant to Section 12(g) of the Act: None
Indicate by check mark if the registrant is a well-known seasoned issuer, as defined in Rule 405 of the Securities Act. Yes ☐ No ☒
Indicate by check mark if the registrant is not required to file reports pursuant to Section 13 or Section 15(d) of the Act. Yes ☐ No ☒
Indicate by check mark whether the registrant (1) has filed all reports required to be filed by Section 13 or 15(d) of the Securities Exchange Act of 1934 during the preceding 12 months, and (2) has been subject to such filing requirements for the past 90 days. Yes ☒ No ☐
Indicate by check mark whether the registrant has submitted electronically and posted on its corporate Web site, if any, every Interactive Data File required to be submitted and posted pursuant to Rule 405 of Regulation S-T during the preceding 12 months. Yes ☒ No ☐
Indicate by check mark if disclosure of delinquent filers pursuant to Item 405 of Regulation S-K is not contained herein, and will not be contained, to the best of registrant’s knowledge, in definitive proxy or information statements incorporated by reference in Part III of this Form 10-K or any amendment to this Form 10-K. ☒
Indicate by check mark whether the registrant is a large accelerated filer, an accelerated filer, a non-accelerated filer, or a smaller reporting company. See the definitions of “large accelerated filer,” “accelerated filer” and “smaller reporting company” in Rule 12b-2 of the Exchange Act.
|
Large accelerated filer ☐ |
|
Accelerated filer ☒ |
|
Non-accelerated filer ☐ |
|
Smaller reporting company ☐ |
Indicate by check mark whether the registrant is a shell company (as defined in Rule 12b-2 of the Act). Yes ☐ No ☒
The aggregate market value of the voting stock held by non-affiliates of the registrant was approximately $555.3 million as of June 30, 2016.
The number of outstanding shares of the registrant’s common stock is 54,029,555 as of February 28, 2017.
DOCUMENTS INCORPORATED BY REFERENCE
The registrant incorporates by reference in Part III hereof portions of its definitive Proxy Statement for its 2017 Annual Meeting of Stockholders.
ANNUAL REPORT ON FORM 10-K
FOR THE FISCAL YEAR ENDED DECEMBER 31, 2016
Table of Contents
|
|
|
|
Page |
|
|
PART I |
|
|
|
|
|
Item 1. |
|
|
4 |
|
|
Item 1A. |
|
|
9 |
|
|
Item 1B. |
|
|
14 |
|
|
Item 2. |
|
|
14 |
|
|
Item 3. |
|
|
14 |
|
|
Item 4. |
|
|
14 |
|
|
|
|
|
|
|
|
PART II |
|
|
|
|
|
Item 5. |
|
|
15 |
|
|
Item 6. |
|
|
18 |
|
|
Item 7. |
|
Management’s Discussion and Analysis of Financial Condition and Results of Operations |
|
19 |
|
Item 7A. |
|
|
31 |
|
|
Item 8. |
|
|
32 |
|
|
Item 9. |
|
Changes in and Disagreements with Accountants on Accounting and Financial Disclosure |
|
32 |
|
Item 9A. |
|
|
32 |
|
|
Item 9B. |
|
|
33 |
|
|
|
|
|
|
|
|
PART III |
|
|
|
|
|
Item 10. |
|
|
34 |
|
|
Item 11. |
|
|
37 |
|
|
Item 12. |
|
Security Ownership of Certain Beneficial Owners and Management and Related Stockholder Matters |
|
37 |
|
Item 13. |
|
Certain Relationships and Related Transactions, and Director Independence |
|
37 |
|
Item 14. |
|
|
37 |
|
|
|
|
|
|
|
|
PART IV |
|
|
|
|
|
Item 15. |
|
|
38 |
|
|
|
|
|
41 |
|
2
This Annual Report on Form 10-K contains “forward-looking statements” within the meaning of Section 27A of the Securities Act of 1933 (the “Securities Act”) and Section 21E of the Securities Exchange Act of 1934 (“the Exchange Act”). All statements other than statements of historical fact included in this Annual Report on Form 10-K including, without limitation, “Business” and “Management’s Discussion and Analysis of Financial Condition and Results of Operations” regarding CBIZ’s financial position, business strategy and plans and objectives for future performance are forward-looking statements. You can identify these statements by the fact that they do not relate strictly to historical or current facts. Forward-looking statements are commonly identified by the use of such terms and phrases as “will,” “could,” “can,” “may,” “strives,” “hopes,” “intends,” “believes,” “estimates,” “expects,” “projects,” “anticipates,” “foreseeable future,” “seeks” and words or phrases of similar import in connection with any discussion of future operating or financial performance. In particular, these include statements relating to future actions, future performance or results of current and anticipated services, sales efforts, expenses, and financial results.
From time to time, the Company may also provide oral or written forward-looking statements in other materials the Company releases to the public. Any or all of the Company’s forward-looking statements in this Annual Report on Form 10-K and in any other public statements that the Company makes, are subject to certain risks and uncertainties that could cause actual results to differ materially from those projected. Such forward-looking statements can be affected by inaccurate assumptions the Company might make or by known or unknown risks and uncertainties. Many factors mentioned in “Item 1A. Risk Factors” will be important in determining future results. Should one or more of these risks or assumptions materialize, or should the underlying assumptions prove incorrect, actual results may vary materially from those anticipated, estimated or projected. Such risks and uncertainties include, but are not limited to:
|
|
• |
CBIZ’s ability to adequately manage its growth; |
|
|
• |
CBIZ’s dependence on the services of its executive officers and other key employees; |
|
|
• |
competitive pricing pressures; |
|
|
• |
general business and economic conditions; |
|
|
• |
changes in governmental regulation and tax laws affecting CBIZ’s operations; |
|
|
• |
reversal or decline in the current trend of outsourcing business services; |
|
|
• |
revenue seasonality or fluctuations in and collectability of receivables; |
|
|
• |
liability for errors and omissions of CBIZ businesses; |
|
|
• |
regulatory investigations and future regulatory activity (including without limitation inquiries into compensation arrangements within the insurance brokerage industry); and |
|
|
• |
reliance on information processing systems and availability of software licenses. |
Consequently, no forward-looking statement can be guaranteed. The Company’s actual future results may vary materially, and CBIZ undertakes no obligation to publicly update any forward-looking statements, whether as a result of new information, future events or otherwise. You are advised, however, to consult any further disclosures the Company makes on related subjects in the quarterly, periodic and annual reports the Company files with the United States Securities and Exchange Commission (the “SEC”). Also note that the Company provides cautionary discussion of risks, uncertainties and possibly inaccurate assumptions relevant to its businesses as discussed in Item 1. These are factors that the Company thinks could cause its actual results to differ materially from expected and historical results. Other factors besides those described here could also adversely affect operating or financial performance.
The following text is qualified in its entirety by reference to the more detailed information and consolidated financial statements (including the notes thereto) appearing elsewhere in this Annual Report on Form 10-K. Unless the context otherwise requires, references in this Annual Report to “we,” “our,” “us”, “CBIZ” or the “Company” shall mean CBIZ, Inc., a Delaware corporation, and its wholly-owned subsidiaries. All references to years, unless otherwise noted, refer to CBIZ’s fiscal year which ends on December 31.
3
Introduction
CBIZ has been operating as a professional services business since 1996. We built our professional services business through acquiring and integrating accounting and financial service providers, group health benefits consulting firms, property and casualty brokerage firms, payroll service providers, and valuation and other service firms throughout the United States. CBIZ is listed on the New York Stock Exchange (“NYSE”) under the symbol “CBZ.”
We provide professional business services, products and solutions that help our clients grow and succeed by better managing their finances and employees. These services are provided to primarily small and midsized businesses (“SMB”), as well as individuals, governmental entities and not-for-profit enterprises throughout the United States and parts of Canada. CBIZ delivers its integrated services through the following three practice groups:
|
|
• |
Financial Services |
|
|
• |
Benefits and Insurance Services (formerly known as Employee Services) |
|
|
• |
National Practices |
We believe that our diverse and integrated service offerings result in advantages for both the client and for CBIZ. By providing custom solutions that help clients manage their finances and employees, we enable our clients to focus their resources on their own core business and operational competencies. Additionally, working with one provider for several solutions enables our clients to utilize their resources more efficiently by eliminating the need to coordinate with multiple service providers. The ability to combine several services and offer them through one trusted provider distinguishes CBIZ from other service providers.
Business Strategy
We strive to maximize shareholder value and believe this is accomplished through growth in revenue and earnings per share, as well as the strategic allocation and deployment of free cash-flow and capital resources.
Revenue
We believe revenue growth will be achieved through internal organic growth, cross-serving additional services to our existing clients, and targeted acquisitions. Each of these components is critical to the long-term growth strategy, and we expect each component to contribute to our long-term revenue growth.
|
|
• |
We believe we can capitalize on organic growth opportunities by offering a higher level of national resources than traditional local professional service firms, but delivering these services locally with a higher level of personal service than is expected from traditional national firms. We are also able to leverage technology to create efficiencies and to link together aligned services such as benefits, payroll and human resource services. |
|
|
• |
Cross-serving provides us with the opportunity to offer and deliver multiple services our existing clients. Cross-serving opportunities are identified by CBIZ employees as they provide services to their existing clients. Being a trusted advisor to our clients provides us with the opportunity to identify the clients’ needs, while the diverse and integrated services offered by CBIZ allows us to provide solutions to satisfy these needs. |
|
|
• |
Our acquisition strategy is to selectively acquire businesses that expand our market position and strengthen our existing service offerings. Strategic businesses that we seek to acquire generally have strong and energetic leadership, a positive local market reputation, commitment to client service, the potential for cross-serving additional CBIZ services to our clients, an ability to integrate quickly with existing CBIZ operations and are accretive to earnings. |
Earnings Per Share
We expect to grow earnings per share by increasing revenue and achieving operating leverage through improved productivity and cost management.
4
Cash Flows and Capital Resources
Our strategy is to utilize capital resources for strategic initiatives that will optimize shareholder return. The highest priority for the utilization of capital is focused on strategic acquisitions. We also believe that repurchasing shares of our common stock is a use of cash that provides stockholder value. Accordingly, CBIZ has historically adopted a repurchase plan annually and continually evaluates share repurchase opportunities. We may repurchase shares of our common stock when, after assessing capital needed to fund acquisitions and seasonal working capital needs, capital resources are available and such repurchases are accretive to stockholders.
Business Services
CBIZ delivers its integrated services through three operating practice groups. A general description of services provided by each practice group is provided in the table below.
|
Benefits and Insurance Services |
National Practices |
|
|
• Accounting and Tax • Government Healthcare Consulting • Financial Advisory • Valuation • Risk & Advisory Services
|
• Group Health Benefits Consulting • Payroll • Property and Casualty • Retirement Plan Services
|
• Managed Networking and Hardware Services • Healthcare Consulting
|
Practice Groups
Revenue by practice group for the years ended December 31, 2016, 2015 and 2014 is provided in the table below (in thousands):
|
|
|
Year Ended December 31, |
|
|||||||||||||||||||||
|
|
|
2016 |
|
|
2015 |
|
|
2014 |
|
|||||||||||||||
|
Financial Services |
|
$ |
501,307 |
|
|
|
62.7 |
% |
|
$ |
476,396 |
|
|
|
63.5 |
% |
|
$ |
465,130 |
|
|
|
64.6 |
% |
|
Benefits and Insurance Services |
|
|
267,606 |
|
|
|
33.5 |
% |
|
|
244,493 |
|
|
|
32.6 |
% |
|
|
224,898 |
|
|
|
31.3 |
% |
|
National Practices |
|
|
30,919 |
|
|
|
3.8 |
% |
|
|
29,533 |
|
|
|
3.9 |
% |
|
|
29,455 |
|
|
|
4.1 |
% |
|
Total CBIZ |
|
$ |
799,832 |
|
|
|
100.0 |
% |
|
$ |
750,422 |
|
|
|
100.0 |
% |
|
$ |
719,483 |
|
|
|
100.0 |
% |
A discussion of our practice groups and certain external relationships and regulatory factors that currently impact those practice groups are provided below. See Note 21, Segment Disclosures, to the accompanying consolidated financial statements for further discussion of the CBIZ practice groups.
Financial Services
The Financial Services practice group is divided into a Financial Services division, which represents the various accounting units spread geographically throughout the United States that provide core accounting services regionally, and a National Services division consisting of those units that provide their specialty services nationwide. Core accounting services consist mainly of accounting and tax compliance and consulting, as well as litigation support, while National Services consist primarily of federal and state governmental healthcare compliance, valuation services, real estate consulting and internal audit outsourcing.
Restrictions imposed by independence requirements and state accountancy laws and regulations preclude CBIZ from rendering audit and attest services (other than internal audit services). As such, CBIZ and its subsidiaries maintain joint-referral relationships and administrative service agreements (“ASAs”) with independent licensed Certified Public Accounting (“CPA”) firms (the “CPA firms”) under which audit and attest services may be provided to CBIZ's clients by such CPA firms. These firms are owned by licensed CPAs, a vast majority of whom are also employed by our subsidiaries. Under these ASAs, we provide a range of services to the CPA firms, including (but not limited to): administrative functions such as office management, bookkeeping and accounting; preparing marketing and promotional materials; providing office space, computer equipment and systems support; and leasing administrative and professional staff. Services are performed in exchange for a fee.
Fees earned by CBIZ under the ASAs are recorded as revenue in the accompanying Consolidated Statements of Comprehensive Income and totaled approximately $144.8 million, $137.5 million and $133.7 million for the years ended December 31, 2016, 2015 and 2014, respectively, a majority of which is related to services rendered to privately-held clients and governmental agencies. In the event that accounts receivable and unbilled work in process become uncollectible by the CPA firms, the service fee due to CBIZ is
5
typically reduced on a proportional basis. The ASAs have terms ranging up to eighteen years, are renewable upon agreement by both parties, and have certain rights of extension and termination.
At December 31, 2016, we maintained ASAs with four CPA firms. Most of the members and/or stockholders of the CPA firms are also CBIZ employees, and CBIZ renders services to the CPA firms as an independent contractor. One of our ASAs is with Mayer Hoffman McCann, P.C. (“Mayer Hoffman”), an independent national CPA firm headquartered in Kansas City, Missouri. Mayer Hoffman has 251 stockholders, a vast majority of whom are also employees of CBIZ. Mayer Hoffman maintains an eight member board of directors. There are no board members of Mayer Hoffman who hold senior officer positions at CBIZ. Our association with Mayer Hoffman offers clients access to the multi-state resources and expertise of a national CPA firm. We also have an ASA with Myers & Stauffer LLC (“M&S”), an independent national governmental healthcare consulting firm headquartered in Kansas City, Missouri. M&S has eight equity members, all of whom are also employees of CBIZ. M&S maintains a three member executive committee, none of whom hold senior officer positions at CBIZ.
Although the ASAs do not constitute control, we are one of the beneficiaries of the agreements and may bear certain economic risks. As such, the CPA firms with which we maintain ASAs qualify as variable interest entities. Refer Note 1, Organization and Summary of Significant Accounting Policies, to the accompanying consolidated financial statements for further discussion.
Benefits and Insurance Services
The CBIZ Benefits and Insurance Services practice group operates under a divisional President who oversees the practice group, along with a senior management team aligned along functional, product, and unit management lines. The Benefits and Insurance Services group is organized along lines of services such as employee benefits consulting and brokerage, property and casualty brokerage, retirement plan advisory services, payroll services, human capital advisory services, actuarial services, life insurance and other services that serve local and regional clients with national resources.
The Benefits and Insurance Services practice group maintains relationships with many different insurance carriers. Some of these carriers have compensation arrangements with CBIZ whereby some portion of payments due may be contingent upon meeting certain performance goals, or upon CBIZ providing client services that would otherwise be provided by the carriers. These compensation arrangements are provided to us as a result of our performance and expertise, and may result in enhancing our ability to access certain insurance markets and services on behalf of our clients. The aggregate compensation related to these arrangements received during the years ended December 31, 2016, 2015 and 2014 was less than 2% of consolidated CBIZ revenue for the respective periods.
National Practices
Our National Practices group consists of two services; healthcare consulting and information technology. The healthcare consulting serves hospitals and other healthcare providers, specializing in revenue management, reimbursement optimization and managed care contracting. The information technology has been serving one client in the United States and Canada for more than fifteen years.
Sales and Marketing
Our branding goals are focused on providing us with a consistent image while at the same time providing support, tools and resources for each practice and market to utilize within each of our distinct geographic and industry markets. Three key strategies are employed to accomplish these goals: (i) thought leadership, (ii) market segmentation, and (iii) sales/sales management process development.
|
• |
Thought leadership: CBIZ marketing efforts continue to capitalize on the extensive knowledge and expertise of our associates. This has been accomplished through media visibility, social media, webinars, and the creation of a wide variety of white papers, newsletters, books, and other information offerings. |
|
• |
Market segmentation: The majority of CBIZ marketing resources are devoted to the highly measurable and high return on investment strategies that specifically target those industries and service areas where we have particularly deep experience. These efforts typically involve local, regional or national trade show and event sponsorships, targeted direct mail, email, and telemarketing campaigns, and practice and industry specific websites and newsletters. |
|
• |
Sales/sales management process development: CBIZ continues to enhance an accountable business development culture with several initiatives, including enhanced management visibility, analytics and forecasting through Salesforce.com and the implementation of performance management scorecards and business development pipeline reports. Together, these initiatives have helped create a more effective, efficient and successful sales management process throughout the Company. |
6
Our focus has been on developing marketing strategies that specifically support each of our major practice areas: Financial Services (accounting) and Benefits and Insurance Services (insurance, payroll and human resources). In each of these segments, emphasis has been put on marketing technology that has the highest and most measurable return on investment, including enhanced targeted email campaigns, webinars, web lead generation, and an evolving web presence.
We have an initiative to build relationships and reputation through social media. Beginning with comprehensive training and support for LinkedIn and Twitter, our social media efforts have expanded to include programs on Facebook, Google+, YouTube and social sharing sites such as Slideshare and Pinterest.
Clients
We provide professional services to over 90,000 clients, including over 50,000 business clients. By providing various professional services and administrative functions, we enable our clients to focus their resources on their own operational competencies. Reducing administrative functions allows clients to enhance productivity, reduce costs and improve service quality and efficiency by focusing on their core business. Depending on a client's size and capabilities, it may choose to utilize one, some or many of the diverse and integrated services offered by the Company.
Our clients represent a large variety of industries and markets, including many government agencies, with the Company targeting SMB companies that have between 100 and 2,000 employees and annual revenues between $5 million and $200 million. Our largest client comprised less than 3% of our consolidated revenue in 2016 and is included in the National Practices operating practice group. Management believes that its client diversity helps insulate the Company from a downturn in a particular industry or geographic market. Nevertheless, economic conditions among select clients and groups of clients may have an impact on the demand for services provided by us.
Competition
The professional business services industry is highly fragmented and competitive, with a majority of industry participants, such as accounting, group health and welfare benefits consultants, payroll providers or professional service organizations, offering only a limited number of services. Competition is based primarily on client relationships, quality of professional advice, range and quality of services or product offerings, customer service, timeliness, geographic proximity, and competitive rates. We compete with a number of multi-location regional or national professional services firms and a large number of relatively small independent firms in local markets. Our competitors in the professional business services industry include, but are not limited to, independent consulting services companies, independent accounting and tax firms, payroll service providers, independent insurance brokers and divisions of diversified services companies.
Acquisitions and Divestitures
We seek to strengthen our operations and customer service capabilities by selectively acquiring businesses that expand our market position and strengthen our existing service offerings. We completed six acquisitions in 2016. Aggregate consideration for the acquisitions consisted of approximately $40.0 million in cash, $21.1 million in contingent consideration and $2.1 million in CBIZ common stock. We also purchased seven client lists in 2016 for approximately $1.2 million in cash, $1.2 million in guaranteed future consideration and $1.5 million contingent upon future financial performances.
For further discussion regarding acquisitions and divestitures, refer to Note 18, Acquisitions, and Note 19, Discontinued Operations and Divestitures, to the accompanying consolidated financial statements.
Regulation
Our operations are subject to regulation by federal, state, local and professional governing bodies. Accordingly, our business services may be impacted by legislative changes by these bodies, particularly with respect to provisions relating to payroll, benefits administration and insurance services, pension plan administration and tax and accounting. We remain abreast of regulatory changes affecting its business, as these changes often affect clients’ activities with respect to employment, taxation, benefits, and accounting. For instance, changes in income, estate, or property tax laws may require additional consultation with clients subject to these changes to ensure their activities comply with revised regulations.
7
We are subject to industry regulation and changes, including changes in laws, regulations, and codes of ethics governing our accounting, insurance, valuation, registered investment advisory and broker-dealer operations, as well as in other industries, the interpretation of which may impact our operations.
We are subject to certain privacy and information security laws and regulations, including, but not limited to those under the Health Insurance Portability and Accountability Act of 1996, The Financial Modernization Act of 1999 (the Gramm-Leach-Bliley Act), the Health Information Technology for Economic and Clinical Health Act, and other provisions of federal and state laws which may restrict our operations and give rise to expenses related to compliance.
As a public company, we are subject to the provisions of the Sarbanes-Oxley Act of 2002 to reform the oversight of public company auditing, improve the quality and transparency of financial reporting by those companies and strengthen the independence of auditors.
With respect to CPA firm clients that are required to file audited financial statements with the SEC, the SEC staff views CBIZ and the CPA firms with which we have contractual relationships as a single entity in applying independence rules established by the accountancy regulators and the SEC. Accordingly, we do not hold any financial interest in an SEC-reporting attest client of an associated CPA firm, enter into any business relationship with an SEC-reporting attest client that the CPA firm performing an audit could not maintain, or sell any non-audit services to an SEC-reporting attest client that the CPA firm performing an audit could not sell, under the auditor independence limitations set out in the Sarbanes-Oxley Act of 2002 and other professional accountancy independence standards. Applicable professional standards generally permit us to provide additional services to privately-held companies in addition to those services which may be provided to SEC-reporting attest clients of an associated CPA firm. CBIZ and the CPA firms with which we are associated have implemented policies and procedures designed to enable the Company and the CPA firms to maintain independence and freedom from conflicts of interest in accordance with applicable standards. Given the policies set by us on our relationships with SEC-reporting attest clients of associated CPA firms, and the limited number and size of such clients, the Sarbanes-Oxley Act independence limitations do not, and are not expected to, materially affect our revenues.
The CPA firms with which we maintain ASAs may operate as limited liability companies, limited liability partnerships or professional corporations. The firms are separate legal entities with separate governing bodies and officers. Neither the existence of the ASAs nor the providing of services thereunder constitutes control of the CPA firms by us. CBIZ and the CPA firms maintain their own respective liability and risk of loss in connection with the performance of their respective services. Attest services are not permitted to be performed by any individual or entity that is not licensed to do so. We are not permitted to perform audits, reviews, compilations, or other attest services, do not contract to perform them and do not provide the associated attest reports. Given this legal prohibition and course of conduct, we do not believe it is likely that we would bear the risk of litigation losses related to attest services provided by the CPA firms.
Although the ASAs do not constitute control, we are one of the beneficiaries of the agreements and may bear certain economic risks. As such, the CPA firms with which we maintain ASAs qualify as variable interest entities. Refer to Note 1, Organization and Summary of Significant Accounting Policies, to the accompanying consolidated financial statements for further discussion.
As of December 31, 2016, we believe we are in compliance with all governmental and professional organizations regulations in which we provide services.
Liability Insurance
We carry insurance policies, including those for commercial general liability, automobile liability, property, crime, professional liability, directors’ and officers’ liability, fiduciary liability, employment practices liability and workers' compensation, subject to prescribed state mandates. Excess liability coverage is carried over the underlying limits provided by the commercial general liability, directors’ and officers’ liability, professional liability and automobile liability policies.
Employees
At December 31, 2016, we employed approximately 4,600 employees. We believe that we have a good relationship with our employees. A large number of our employees hold professional licenses or degrees. As a professional services company that differentiates itself from competitors through the quality and diversity of its service offerings, we believe that our employees are our most important asset. Accordingly, we strive to remain competitive as an employer while increasing the capabilities and performance of our employees.
8
A disproportionately large amount of our revenue occurs in the first half of the year. This is due primarily to accounting and tax services provided by our Financial Services practice group, which is subject to seasonality related to heavy volume in the first four months of the year. The Financial Services practice group generated more than 40% of its revenue in the first four months of each of the past five years. In addition, more than 50% of our annual earnings per share have been earned during the first quarter of each of the past five years. Like most professional service companies, most of our operating costs are relatively fixed in the short term, which generally results in higher operating margins in the first half of the year.
Available Information
CBIZ's principal executive office is located at 6050 Oak Tree Boulevard, South, Suite 500, Cleveland, Ohio 44131, and the Company’s telephone number is (216) 447-9000. CBIZ’s website is located at http://www.cbiz.com. CBIZ makes available, free of charge on its website, through the investor information page, its annual reports on Form 10-K, quarterly reports on Form 10-Q, current reports on Form 8-K, and any amendments to those reports as soon as reasonably practicable after CBIZ files (or furnishes) such reports with the SEC. The public may read and copy materials the Company files (or furnishes) with the SEC at the SEC’s Public Reference Room at 100 F Street, NE, Washington, D.C. 20549, and may obtain information on the operations of the Public Reference Room by calling the SEC at 1-800-732-0330. In addition, the SEC maintains an Internet Website that contains reports, proxy and information statements and other information about CBIZ at http://www.sec.gov. CBIZ’s corporate code of conduct and ethics and the charters of the Audit Committee, the Compensation Committee and the Nominating and Governance Committee of the Board of Directors are available on the investor information page of CBIZ's website, referenced above, and in print to any shareholder who requests them.
The following factors may affect our actual operating and financial results and could cause results to differ materially from those in any forward-looking statements. You should carefully consider the following information.
We may be more sensitive to revenue fluctuations than other companies, which could result in fluctuations in the market price of our common stock.
A substantial majority of our operating expenses, such as personnel and related costs and occupancy costs, are relatively fixed in the short term. As a result, we may not be able to quickly reduce costs in response to any decrease in revenue. This factor could cause our quarterly results to be lower than expectations of securities analysts and stockholders, which could result in a decline in the price of our common stock.
Payments on accounts receivable may be slower than expected, or amounts due on receivables or notes may not be fully collectible.
Professional services firms often experience higher average accounts receivable days outstanding compared to many other industries, which may be magnified if the general economy worsens. If our collections become slower, our liquidity may be adversely impacted. We monitor the aging of receivables regularly and make assessments of the ability of customers to pay amounts due. We provide for potential bad debts each month and recognize additional reserves against bad debts as we deem it appropriate. Notwithstanding these measures, our customers may face unexpected circumstances that adversely impact their ability to pay their trade receivables or note obligations to us and we may face unexpected losses as a result.
We are dependent on the services of our executive officers and other key employees, the loss of any of whom may have a material adverse effect on our business, financial condition and results of operations.
Our success depends in large part upon the abilities and continued services of our executive officers and other key employees, such as our business unit presidents. In the course of business operations, employees may resign and seek employment elsewhere. Certain principal employees, however, are bound in writing to agreements containing non-compete and other restrictive covenants barring competitive employment, client acceptance, and solicitation of employees for a period of between two and ten years following his or her resignation. We cannot assure you that we will be able to retain the services of our key personnel. If we cannot retain the services of key personnel, there could be a material adverse effect on our business, financial condition and results of operations. While we generally have contractual arrangements with key personnel that contain restrictive covenants, courts are at times reluctant to enforce such covenants. In addition, many of our executive officers and other key personnel are either participants in our stock option plan or holders of a significant amount of our common stock. We believe that these interests provide additional incentives for these key employees to remain with us. In order to support our growth, we intend to continue to effectively recruit, hire, train and retain
9
additional qualified management personnel. Our inability to attract and retain necessary personnel could have a material adverse effect on our business, financial condition and results of operations.
Restrictions imposed by independence requirements and conflict of interest rules may limit our ability to provide services to clients of the attest firms with which we have contractual relationships and the ability of such attest firms to provide attestation services to our clients.
Restrictions imposed by independence requirements and state accountancy laws and regulations preclude CBIZ from rendering audit and other attest services (other than internal audit services). As such, CBIZ and its subsidiaries maintain joint-referral relationships and ASAs with independent licensed CPA firms under which audit and other attest services may be provided to CBIZ’s clients by such CPA firms. The CPA firms are owned by licensed CPAs, a vast majority of whom are employed by CBIZ.
Under these ASAs, CBIZ provides a range of services to the CPA firms, including: administrative functions such as office management, bookkeeping, and accounting; preparing marketing and promotion materials; providing office space, computer equipment, and systems support; and leasing administrative and professional staff. Services are performed in exchange for a fee. Fees earned by CBIZ under the ASAs are recorded as revenue in the accompanying Consolidated Statements of Comprehensive Income. In the event that accounts receivable and unbilled work in process become uncollectible by the CPA firms, the service fee due to CBIZ is typically reduced on a proportional basis.
With respect to CPA firm clients that are required to file audited financial statements with the SEC, the SEC staff views CBIZ and the CPA firms with which we have contractual relationships as a single entity in applying independence rules established by the accountancy regulators and the SEC. Accordingly, we do not hold any financial interest in, nor do we enter into any business relationship with, an SEC-reporting attest client that the CPA firm performing an audit could not maintain; further, we do not sell any non-audit services to an SEC-reporting attest client that the CPA firm performing an audit could not sell under the auditor independence limitations set out in the Sarbanes-Oxley Act of 2002 and other professional accountancy independence standards. SEC staff informed us that independence rules that apply to clients that receive attest services under SEC and Public Company Accounting Oversight Board (“PCAOB”) standards from such CPA firms would prohibit such clients from holding any stock of CBIZ, Inc. However, applicable professional standards generally permit CBIZ to provide additional services to privately-held companies, in addition to those services which may be provided to SEC-reporting attest clients of a CPA firm. CBIZ and the CPA firms have implemented policies and procedures designed to enable us to maintain independence and freedom from conflicts of interest in accordance with applicable standards. Given the pre-existing limits set by CBIZ on its relationships with SEC-reporting attest clients of associated CPA firms, and the limited number and size of such clients, the imposition of independence limitations under the Sarbanes-Oxley Act, SEC rule or interpretation, or PCAOB standards do not and are not expected to materially affect CBIZ revenues.
There can be no assurance that following the policies and procedures implemented by us and the CPA firms will enable us and the CPA firms to avoid circumstances that would cause us and them to lack independence from an SEC-reporting attest client; nor can there be any assurance that state, U.S. Government Accountability Office or U.S. Department Of Labor accountancy authorities will not impose additional restrictions on the profession. To the extent that the CPA firms for whom we provide administrative and other services are affected, we may experience a decline in fee revenue from these businesses as well as expenses related to addressing independence concerns. To date, revenues derived from providing services in connection with attestation engagements of the attest firms performed for SEC-reporting clients have not been material.
Our goodwill and intangible assets could become impaired, which could lead to material non-cash charges against earnings.
We assess potential impairment on our goodwill and intangible asset balances, including client lists, on an annual basis, or more frequently if there is any indication that the asset may be impaired. Any impairment of goodwill or intangible assets resulting from this periodic assessment would result in a non-cash charge against current earnings, which could lead to a material impact on our results of operations, statements of financial position, and earnings per share. Any significant decline in future revenues, cash flows or growth rates as a result of adverse changes in the economic environment or an adverse change resulting from new governmental regulations could lead to an impairment of goodwill or intangible assets.
Certain liabilities resulting from acquisitions are estimated and could lead to a material impact on earnings.
Through our acquisition activities, we record liabilities for estimated future contingent earnout payments. These liabilities are reviewed quarterly and changes in assumptions used to determine the amount of the liability could lead to an adjustment that may have a material impact, favorable or unfavorable, on the Consolidated Statements of Comprehensive Income.
10
Governmental regulations and interpretations are subject to changes, which could have a material adverse effect on revenue.
Laws and regulations could result in changes in the amount or the type of business services required by businesses and individuals. We cannot be sure that future laws and regulations will provide the same or similar opportunities for us to provide business consulting and management services to businesses and individuals. State insurance regulators have conducted inquiries to clarify the nature of compensation arrangements within the insurance brokerage industry. Future regulatory actions or laws, including the Affordable Care Act, may limit or eliminate our ability to enhance revenue through all current compensation arrangements and may result in a diminution of future insurance brokerage revenue from these sources. Accordingly, CBIZ’s ability to continue to operate in some states may depend on our flexibility to modify our operational structure in response to these changes in regulations.
Changes in the United States healthcare environment, including new healthcare legislation, may adversely affect the revenue and margins in our healthcare benefit businesses.
Our employee benefits business, specifically our group health consulting and brokerage businesses, receives commissions for brokering employer-sponsored healthcare policies with insurance carriers on behalf of the client. In many cases, these commissions consist of a ratable portion of the insurance premiums on those policies, based upon a sliding scale pertaining to the dollar volume of premiums and/or the number of participants in the plan.
Changes in the healthcare environment, including, but not limited to, any legislated changes in the U.S. national healthcare system, that affect the methods by which insurance carriers remunerate brokers, could adversely impact our revenues and margins in this business. Specifically, legislation or other changes could afford our clients and their employees the ability to seek insurance coverage through other means, including, but not limited to, direct access with insurance carriers or other similar avenues, which could eliminate or adversely alter the remuneration brokers receive from insurance carriers for their services.
Higher rates of unemployment in the U.S. could result in a general reduction in the number of individuals with employer-sponsored healthcare coverage. This decline in employee participation in healthcare insurance plans at our clients could result in a reduction in the commissions we receive from insurance carriers for our brokerage services, which could have an adverse impact on revenues and margins in this business.
We are subject to risks relating to processing customer transactions for our payroll and other transaction processing businesses.
The high volume of client funds and data processed by us, or by our out-sourced resources abroad, in our transaction related businesses entails risks for which we may be held liable if the accuracy or timeliness of the transactions processed is not correct. In addition, related to our payroll and employee benefits businesses, we store personal information about some of our clients and their employees for which we may be liable under the Health Insurance Portability and Accountability Act or other governmental regulations if the security of this information is breached. We could incur significant legal expense to defend any claims against us, even those claims without merit. While we carry insurance against these potential liabilities, we cannot be certain that circumstances surrounding such an error or breach of security would be entirely reimbursed through insurance coverage. We believe we have controls and procedures in place to address our fiduciary responsibility and mitigate these risks. However, if we are not successful in managing these risks, our business, financial condition and results of operations may be harmed.
Cyber attacks or other security breaches involving our computer systems or the systems of one or more of our vendors could materially and adversely affect our business.
Our systems, like others in the payroll, retirement and financial services industries, are vulnerable to cyber security risks, and we are subject to potential disruption caused by such activities. Corporations such as ours are subject to frequent attacks on their systems. Such attacks may have various goals, from seeking confidential information to causing operational disruption. Although to date such activities have not resulted in material disruptions to our operations or, to our knowledge, a material breach of any security or confidential information, no assurance can be provided that such disruptions or breach will not occur in the future. Any significant violations of data privacy could result in the loss of business, litigation, regulatory investigations, penalties, ongoing expenses related to client credit monitoring and support, and other expenses, any of which could damage our reputation and adversely affect the growth of our business.
We are subject to risk as it relates to software that we license from third parties.
We license software from third parties, much of which is integral to our systems and our business. The licenses are generally terminable if we breach our obligations under the license agreements. If any of these relationships were terminated or if any of these parties were to cease doing business or cease to support the applications we currently utilize, we may be forced to spend significant
11
time and money to replace the licensed software. However, we cannot assure you that the necessary replacements will be available on reasonable terms, if at all.
We could be held liable for errors and omissions.
All of our business services entail an inherent risk of malpractice and other similar claims resulting from errors and omissions. Therefore, we maintain errors and omissions insurance coverage. Although we believe that our insurance coverage is adequate, we cannot be certain that actual future claims or related legal expenses would not exceed the coverage amounts. In addition, we cannot be certain that the different insurance carriers which provide errors and omissions coverage for different lines of our business will not dispute their obligation to cover a particular claim. If we have a large claim, or a large number of claims, on our insurance, the rates for such insurance may increase, and amounts expended in defense or settlement of these claims prior to exhaustion of deductible or self-retention levels may become significant, but contractual arrangements with clients may constrain our ability to incorporate such increases into service fees. Insurance rate increases, disputes by carriers over coverage questions, payments by us within deductible or self-retention limits, as well as any underlying claims or settlement of such claims, could have a material adverse effect on our business, financial condition and results of operations.
CBIZ is not a CPA firm and does not perform any attest services for clients. CBIZ does not maintain any ownership interest in or control over any CPA firm with which a CBIZ subsidiary may maintain an ASA. All personnel and staff of CBIZ who are provided to such CPA firms work under the sole direction, supervision and control of the particular CPA firm, and CBIZ does not control how attest work is conducted. For these reasons we do not believe we have liability to any party related to their receipt of attest services from such CPA firms. Nevertheless, from time to time CBIZ has been sued for attest work that we do not perform but which is performed by such CPA firms. While we have been successful to date in defending against such suits, it is possible that similar claims may be brought in the future. We will be required to defend against such claims, and may incur expenses related to such lawsuits and may not be successful in defending against such lawsuits. In the event that the CPA firms with which we maintain ASAs incur judgments and costs related to such suits that threaten the solvency of the CPA firms, CBIZ may incur expenditures related to such proceedings.
The future issuance of additional shares could adversely affect the price of our common stock.
Future sales or issuances of common stock, including those related to the uses described below, or the perception that sales could occur, could adversely affect the market price of our common stock and dilute the percentage ownership held by our stockholders. We have authorized 250.0 million shares, and have approximately 54.1 million shares outstanding at February 28, 2017. A substantial number of these shares have been issued in connection with acquisitions. As part of many acquisition transactions, shares are contractually restricted from sale for a one-year period, and as of February 28, 2017, approximately 0.6 million shares of common stock were under lock-up contractual restrictions that expire by December 31, 2017. We cannot be sure when sales by holders of our stock will occur, how many shares will be sold or the effect that sales may have on the market price of our common stock.
Our principal stockholders may have substantial control over our operations.
Our stockholders that beneficially own (within the meaning of Rule 13d-3 of the Exchange Act) significant percentages of our common stock relative to other individual stockholders may exert substantial influence over actions that require the consent of a majority of our outstanding shares, including the election of directors. CBIZ’s share repurchase activities may result in increased ownership percentages of these individuals and therefore increase the influence they may exert, if they do not participate in these share repurchase transactions or otherwise dispose of their common stock.
We require a significant amount of cash for interest payments on our debt and to expand our business as planned.
At December 31, 2016, our debt consisted primarily of $191.4 million in principal amount outstanding under our $400 million unsecured credit facility (as amended the “credit facility”). Our debt requires us to dedicate a significant portion of our cash flow from operations to pay interest on our indebtedness, thereby reducing the funds available to use for acquisitions, capital expenditures and general corporate purposes. Our ability to make interest payments on our debt, and to fund acquisitions, will depend upon our ability to generate cash in the future. Insufficient cash flow could place us at risk of default under our debt agreements or could prevent us from expanding our business as planned. Our ability to generate cash is subject to general economic, financial, competitive, legislative, regulatory and other factors that are beyond our control. Our business may not generate sufficient cash flow from operations and future borrowings may not be available to us under our credit facility in an amount sufficient to enable us to fund our other liquidity needs. Volatility in interest rates from monetary policy or economic conditions could increase expenses, cause uncertainty and impact our ability to pay interest on our indebtedness. Refer to Item 7A, Quantitative and Qualitative Disclosures about Market Risk, for more information regarding interest rate risk.
12
Terms of our credit facility may adversely affect our ability to run our business and/or reduce stockholder returns.
The terms of our credit facility, as well as the guarantees of our subsidiaries, could impair our ability to operate our business effectively and may limit our ability to take advantage of business opportunities. For example, our credit facility may (i) restrict our ability to repurchase or redeem our capital stock or debt, or merge or consolidate with another entity; (ii) limit our ability to borrow additional funds or to obtain other financing in the future for working capital, capital expenditures, acquisitions, investments and general corporate purposes; (iii) limit our ability to dispose of our assets, to create liens on our assets, to extend credit or to issue dividends to our stockholders; and (iv) make us more vulnerable to economic downturns and reduce our flexibility in responding to changing business and economic conditions.
Our failure to satisfy covenants in our debt instruments will cause a default under those instruments.
Our debt instruments include a number of covenants relating to financial ratios and tests. Our ability to comply with these covenants may be affected by events beyond our control, including prevailing economic, financial and industry conditions. The breach of any of these covenants could result in a default under these instruments. An event of default would permit our lenders and other debt holders to declare all amounts borrowed from them to be due and payable, together with accrued and unpaid interest. If the lenders accelerate the repayment of borrowings, we may not have sufficient assets to repay our debt.
We are reliant on information processing systems and any failure of these systems could have a material adverse effect on our business, financial condition and results of operations.
Our ability to provide business services depends on our capacity to store, retrieve, process and manage significant databases, and expand and upgrade periodically our information processing capabilities. Interruption or loss of our information processing capabilities through loss of stored data, breakdown or malfunctioning of computer equipment and software systems, telecommunications failure, or damage caused by fire, tornadoes, lightning, electrical power outage, or other disruption could have a material adverse effect on our business, financial condition and results of operations. Although we have disaster recovery procedures in place and insurance to protect against such contingencies, we cannot be sure that insurance or these services will continue to be available, cover all our losses or compensate us for the possible loss of clients occurring during any period that we are unable to provide business services.
We may not be able to acquire and finance additional businesses which may limit our ability to pursue our business strategy.
CBIZ acquired six businesses and seven client lists during 2016, and maintains a healthy pipeline of potential businesses for acquisition. Targeted acquisitions are part of our growth strategy, and it is our intention to selectively acquire businesses or client lists that are complementary to existing service offerings in our target markets. However, we cannot be certain that we will be able to continue identifying appropriate acquisition candidates and acquire them on satisfactory terms, and we cannot be assured that such acquisitions, even if completed, will perform as expected or will contribute significant synergies, revenues or profits. In addition, we may also face increased competition for acquisition opportunities, which may inhibit our ability to complete transactions on terms that are favorable to us. As discussed above, there are certain provisions under our credit facility that may limit our ability to acquire additional businesses. In the event that we are not in compliance with certain covenants as specified in our credit facility, we could be restricted from making acquisitions, restricted from borrowing funds from our credit facility for other uses, or required to pay down the outstanding balance on the line of credit. However, management believes that funds available under the credit facility, along with cash generated from operations, will be sufficient to meet our liquidity needs, including planned acquisition activity in the foreseeable future. To the extent we are unable to find suitable acquisition candidates, an important component of our growth strategy may not be realized.
The business services industry is competitive and fragmented. If we are unable to compete effectively, our business, financial condition and results of operations may be negatively impacted.
We face competition from a number of sources in the business services industry. Many of our competitors are large companies that may have greater financial, technical, marketing and other resources. Our principal competitors include financial and management consulting firms, the consulting practices of major accounting firms, local and regional business services companies, independent contractors, the in-house or former in-house resources of our clients, as well as new entrants into our markets. We cannot assure you that, as our industry continues to evolve, additional competitors will not enter the industry or that our clients will not choose to conduct more of their business services internally or through alternative business services providers. Although we intend to monitor industry trends and respond accordingly, we cannot assure you that we will be able to anticipate and successfully respond to such trends in a timely manner. We cannot be certain that we will be able to effectively compete against current and future competitors, or that competitive pressure will not have a material adverse effect on our business, financial condition and results of operations.
13
There is volatility in our stock price.
The market for our common stock has, from time to time, experienced price and volume fluctuations. Factors such as announcements of variations in our quarterly financial results and fluctuations in revenue, as well as the expectations of stockholders and securities analysts regarding the ability of our business to grow and achieve certain revenue or profitability targets, could cause the market price of our common stock to fluctuate significantly. In addition, the stock market in general has experienced volatility that often has been unrelated to the operating performance of companies such as ours. These broad market and industry fluctuations may adversely affect the price of our stock, regardless of our operating performance.
Item 1B. Unresolved Staff Comments.
None.
CBIZ’s corporate headquarters is located at 6050 Oak Tree Boulevard, South, Suite 500, Cleveland, Ohio 44131, in leased premises. CBIZ and its subsidiaries lease more than 100 offices in 33 states. CBIZ believes that its current facilities are sufficient for its current needs.
Refer to Note 11, Commitments and Contingencies, to the accompanying consolidated financial statements for information on legal proceedings, which is incorporated by reference herein.
Item 4. Mine Safety Disclosures.
Not applicable.
14
Item 5. Market for Registrant’s Common Equity, Related Stockholder Matters and Issuer Purchases of Equity Securities.
Price Range of Common Stock
Our common stock is traded on the NYSE under the trading symbol “CBZ.” The table below sets forth the range of high and low sales prices for our common stock as reported on the NYSE for the periods indicated.
|
|
|
2016 |
|
|
2015 |
|
||||||||||
|
|
|
High |
|
|
Low |
|
|
High |
|
|
Low |
|
||||
|
First quarter |
|
$ |
10.64 |
|
|
$ |
9.60 |
|
|
$ |
9.44 |
|
|
$ |
7.93 |
|
|
Second quarter |
|
$ |
10.80 |
|
|
$ |
9.76 |
|
|
$ |
9.88 |
|
|
$ |
8.65 |
|
|
Third quarter |
|
$ |
11.71 |
|
|
$ |
10.39 |
|
|
$ |
10.28 |
|
|
$ |
9.07 |
|
|
Fourth quarter |
|
$ |
14.05 |
|
|
$ |
10.85 |
|
|
$ |
11.54 |
|
|
$ |
9.78 |
|
On December 30, 2016, the last reported sale price of our common stock as reported on the NYSE was $13.70 per share. As of February 28, 2017, we had approximately 2,125 holders of record of our common stock, and the last sale of our common stock as of that date was $13.30.
Dividend Policy
Our $400 million credit facility does not permit us to declare or make any dividend payments, other than dividend payments made by one of our wholly-owned subsidiaries to the parent company. Historically, we have not paid cash dividends on our common stock. We do not anticipate paying cash dividends in the foreseeable future. The CBIZ Board of Directors has discretion over the payment and level of dividends on common stock, subject to the limitations of the credit facility and applicable law.
Issuer Purchases of Equity Securities
(a) Recent sales of unregistered securities
During the year ended December 31, 2016, we issued approximately 0.4 million shares of our common stock as payment for contingent consideration for acquisitions that occurred prior to 2016.
The above referenced shares were issued in transactions not involving a public offering in reliance on the exemption from registration afforded by Section 4(a)(2) of the Securities Act. The persons to whom the shares were issued had access to full information about CBIZ and represented that they acquired the shares for their own account and not for the purpose of distribution. The certificates for the shares contain a restrictive legend advising that the shares may not be offered for sale, sold, or otherwise transferred without having first been registered under the Securities Act or pursuant to an exemption from the Securities Act.
As previously disclosed, the 2010 Notes matured on October 1, 2015. Prior to the maturity date, we issued 5.1 million shares of our common stock plus cash consideration in privately negotiated transactions in exchange for retiring $49.3 million of our 2010 Notes during the second quarter of 2015. The issuances of common stock were made pursuant to the exemption from the registration provided by Section 3(a)(9) of the Securities Act, on the basis that the exchange constitutes an exchange with an existing holder exclusively in a privately negotiated transaction where no commission or other remuneration has been paid or given directly or indirectly for soliciting such exchange.
(c) Issuer purchases of equity securities
Our first priority for the use of capital is to make strategic acquisitions. We have the financing flexibility and the capacity to carry out an active acquisition program and to take an opportunistic approach towards using funds to repurchase shares. Periodically, the CBIZ Board of Directors authorizes a Share Repurchase Program (the “Share Repurchase Program”) which allows us to purchase shares of our common stock in the open market or in a privately negotiated transaction, which may include purchases from CBIZ employees, Officers and Directors, according to SEC rules. In 2016, we repurchased approximately 0.8 million shares of our common stock at a cost of approximately $7.8 million, which does not include the purchase of shares withheld for tax purposes under the stock incentive plan.
On February 9, 2017, February 11, 2016 and February 11, 2015, the CBIZ Board of Directors authorized the continuation of the Share Repurchase Program, which has been renewed annually for the past thirteen years. The Share Repurchase Program authorizes the
15
purchase of up to 5.0 million shares of our common stock to be obtained in open market, privately negotiated, or 10b5-1 trading plan purchases, which may include purchases from CBIZ employees, Officers and Directors. It is effective beginning April 1 of the respective program year and expires one year from the respective effective date. The Share Repurchase Program does not obligate us to acquire any specific number of shares and may be suspended at any time. At December 31, 2016, there were approximately 4.7 million shares of our common stock that may yet be purchased under the Share Repurchase Program that expires on March 31, 2017.
We have utilized, and may utilize in the future, trading plans under Rule 10b5-1 to allow for repurchases during periods when we would not normally be active in the trading market due to regulatory restrictions. Subsequent to December 31, 2016 up to the date of this filing, we repurchased approximately 0.2 million shares in the open market at a total cost of approximately $2.2 million under our current Rule 10b5-1 trading plan, which allows us to repurchase shares below a predetermined price per share.
Shares repurchased during the three months ended December 31, 2016 (reported on a trade date basis) are summarized in the table below (in thousands, except per share data). During the fourth quarter of 2016, no shares were purchased from stock plan recipients in lieu of cash to satisfy certain tax obligations under the 2014 CBIZ, Inc. Stock Incentive Plan. Average price paid per share includes fees and commissions.
|
|
|
Issuer Purchases of Equity Securities |
|
|||||||||||||
|
Fourth Quarter Purchases |
|
Total Number of Shares Purchased |
|
|
Average Price Paid Per Share |
|
|
Total Number of Shares Purchased as Part of Publicly Announced Plan |
|
|
Maximum Number of Shares That May Yet Be Purchased Under the Plan |
|
||||
|
October 1 – October 31, 2016 |
|
|
50 |
|
|
$ |
11.03 |
|
|
|
50 |
|
|
|
4,772 |
|
|
November 1 – November 30, 2016 |
|
|
58 |
|
|
$ |
10.95 |
|
|
|
58 |
|
|
|
4,714 |
|
|
December 1 – December 31, 2016 |
|
|
— |
|
|
$ |
— |
|
|
|
— |
|
|
|
4,714 |
|
|
Fourth quarter purchases |
|
|
108 |
|
|
$ |
10.99 |
|
|
|
108 |
|
|
|
|
|
16
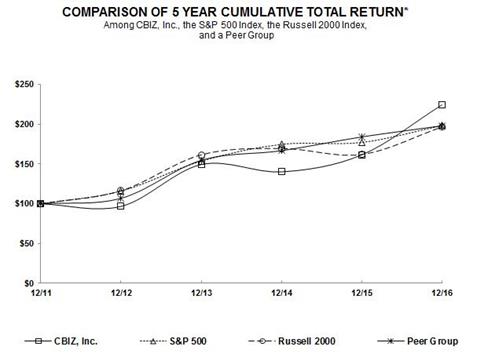
The graph below matches the cumulative 5-Year total return of holders of CBIZ, Inc.’s common stock with the cumulative total returns of the S&P 500 index, the Russell 2000 index and a customized peer group of five companies that includes: Brown & Brown, Inc., H & R Block, Inc., Paychex, Inc., Resources Connection, Inc. and Towers Watson & Company. The graph assumes that the value of the investment in our common stock, in each index, and in the peer group (including reinvestment of dividends) was $100 on 12/31/2011 and tracks it through 12/31/2016.
COMPARISON OF 5 YEAR CUMULATIVE TOTAL RETURN*
Among CBIZ, Inc., the S&P 500 Index, the Russell 2000 Index, and a Peer Group
|
* |
$100 invested on 12/31/11 in stock or index, including reinvestment of dividends. |
Fiscal year ending December 31.
Copyright© 2017 Standard & Poor's, a division of S&P Global. All rights reserved.
Copyright© 2017 Russell Investment Group. All rights reserved.
|
|
|
12/11 |
|
|
12/12 |
|
|
12/13 |
|
|
12/14 |
|
|
12/15 |
|
|
12/16 |
|
||||||
|
CBIZ, Inc. |
|
|
100.00 |
|
|
|
96.73 |
|
|
|
149.26 |
|
|
|
140.10 |
|
|
|
161.37 |
|
|
|
224.22 |
|
|
S&P 500 |
|
|
100.00 |
|
|
|
116.00 |
|
|
|
153.58 |
|
|
|
174.60 |
|
|
|
177.01 |
|
|
|
198.18 |
|
|
Russell 2000 |
|
|
100.00 |
|
|
|
116.35 |
|
|
|
161.52 |
|
|
|
169.43 |
|
|
|
161.95 |
|
|
|
186.45 |
|
|
Peer Group |
|
|
100.00 |
|
|
|
106.79 |
|
|
|
154.62 |
|
|
|
166.64 |
|
|
|
183.89 |
|
|
|
197.90 |
|
The stock price performance included in this graph is not necessarily indicative of future stock price performance.
17
Item 6. Selected Financial Data.
The following table presents selected historical financial data for CBIZ. The information set forth below should be read in conjunction with Management’s Discussion and Analysis of Financial Condition and Results of Operations and the accompanying consolidated financial statements and notes thereto, which are included elsewhere in this Annual Report.
|
|
|
Year Ended December 31, |
|
|||||||||||||||||
|
|
|
2016 |
|
|
2015 |
|
|
2014 |
|
|
2013 |
|
|
2012 |
|
|||||
|
|
|
(In thousands, except per share data) |
|
|||||||||||||||||
|
Statement of Operations Data: |
|
|
|
|
|
|
|
|
|
|
|
|
|
|
|
|
|
|
|
|
|
Revenue |
|
$ |
799,832 |
|
|
$ |
750,422 |
|
|
$ |
719,483 |
|
|
$ |
677,171 |
|
|
$ |
612,689 |
|
|
Operating expenses (1) |
|
|
697,726 |
|
|
|
652,391 |
|
|
|
629,804 |
|
|
|
593,339 |
|
|
|
540,305 |
|
|
Gross margin |
|
|
102,106 |
|
|
|
98,031 |
|
|
|
89,679 |
|
|
|
83,832 |
|
|
|
72,384 |
|
|
Corporate general and administrative expenses (1) |
|
|
36,319 |
|
|
|
32,527 |
|
|
|
34,183 |
|
|
|
34,398 |
|
|
|
30,209 |
|
|
Operating income |
|
|
65,787 |
|
|
|
65,504 |
|
|
|
55,496 |
|
|
|
49,434 |
|
|
|
42,175 |
|
|
Other (expense) income: |
|
|
|
|
|
|
|
|
|
|
|
|
|
|
|
|
|
|
|
|
|
Interest expense |
|
|
(6,593 |
) |
|
|
(8,902 |
) |
|
|
(13,124 |
) |
|
|
(15,374 |
) |
|
|
(14,999 |
) |
|
Gain on sale of operations, net |
|
|
855 |
|
|
|
84 |
|
|
|
1,303 |
|
|
|
79 |
|
|
|
2,766 |
|
|
Other income, net (1) (2) |
|
|
6,957 |
|
|
|
1,146 |
|
|
|
6,893 |
|
|
|
7,817 |
|
|
|
8,215 |
|
|
Total other income (expense), net |
|
|
1,219 |
|
|
|
(7,672 |
) |
|
|
(4,928 |
) |
|
|
(7,478 |
) |
|
|
(4,018 |
) |
|
Income from continuing operations before income tax expense |
|
|
67,006 |
|
|
|
57,832 |
|
|
|
50,568 |
|
|
|
41,956 |
|
|
|
38,157 |
|
|
Income tax expense |
|
|
26,399 |
|
|
|
22,829 |
|
|
|
20,154 |
|
|
|
16,577 |
|
|
|
14,364 |
|
|
Income from continuing operations |
|
|
40,607 |
|
|
|
35,003 |
|
|
|
30,414 |
|
|
|
25,379 |
|
|
|
23,793 |
|
|
(Loss) income from operations of discontinued operations, net of tax |
|
|
(542 |
) |
|
|
(2,323 |
) |
|
|
(754 |
) |
|
|
2,148 |
|
|
|
7,263 |
|
|
Gain on disposal of discontinued operations, net of tax |
|
|
— |
|
|
|
1,427 |
|
|
|
99 |
|
|
|
58,336 |
|
|
|
90 |
|
|
Net income |
|
$ |
40,065 |
|
|
$ |
34,107 |
|
|
$ |
29,759 |
|
|
$ |
85,863 |
|
|
$ |
31,146 |
|
|
Basic weighted average common shares |
|
|
52,321 |
|
|
|
50,280 |
|
|
|
48,343 |
|
|
|
48,632 |
|
|
|
49,002 |
|
|
Diluted weighted average common shares |
|
|
53,513 |
|
|
|
52,693 |
|
|
|
51,487 |
|
|
|
49,141 |
|
|
|
49,252 |
|
|
Diluted earnings per share: |
|
|
|
|
|
|
|
|
|
|
|
|
|
|
|
|
|
|
|
|
|
Continuing operations |
|
$ |
0.76 |
|
|
$ |
0.66 |
|
|
$ |
0.59 |
|
|
$ |
0.52 |
|
|
$ |
0.48 |
|
|
Net income |
|
$ |
0.75 |
|
|
$ |
0.65 |
|
|
$ |
0.58 |
|
|
$ |
1.75 |
|
|
$ |
0.63 |
|
|
Other Data: |
|
|
|
|
|
|
|
|
|
|
|
|
|
|
|
|
|
|
|
|
|
Total assets |
|
$ |
1,118,588 |
|
|
$ |
996,331 |
|
|
$ |
991,244 |
|
|
$ |
897,458 |
|
|
$ |
970,191 |
|
|
Long-term debt (3) |
|
$ |
191,400 |
|
|
$ |
206,550 |
|
|
$ |
203,969 |
|
|
$ |
173,756 |
|
|
$ |
332,538 |
|
|
Total liabilities |
|
$ |
638,567 |
|
|
$ |
568,383 |
|
|
$ |
591,399 |
|
|
$ |
523,012 |
|
|
$ |
674,959 |
|
|
Total stockholders’ equity |
|
$ |
480,021 |
|
|
$ |
427,948 |
|
|
$ |
399,845 |
|
|
$ |
374,446 |
|
|
$ |
295,232 |
|
|
Adjusted EBITDA (4) |
|
$ |
94,842 |
|
|
$ |
87,039 |
|
|
$ |
82,220 |
|
|
$ |
75,542 |
|
|
$ |
66,538 |
|
|
(1) |
“Other income, net” includes net losses/gains attributable to assets held in our non-qualified deferred compensation plan which totaled net gains (losses) of $5.3 million, $(0.7) million, $3.7 million, $8.2 million, and $4.3 million for 2016, 2015, 2014, 2013 and 2012, respectively. These net losses/gains do not impact “Income from continuing operations before income tax expense” or diluted earnings per share from continuing operations as they are directly offset by compensation adjustments included in “Operating expenses” and “Corporate general and administrative expenses.” |
|
(2) |
In 2016, 2015, 2014, 2013 and 2012, we recorded other income (expense) of $1.0 million, $2.9 million, $4.0 million, ($0.9) million, and $1.0 million, respectively, in “Other income, net” related to net decreases/increases in the fair value of contingent consideration related to our prior acquisitions. |
In 2015 and 2014, we recorded non-operating charges of $0.8 million and $1.5 million in “Other income, net” from the early retirement of $49.3 million and $32.4 million face value of our 2010 Notes. Included in 2012 are proceeds of $1.9 million related to a legal settlement.
18
|
(3) |
Represents bank debt and the convertible notes, which are reported in the accompanying Consolidated Balance Sheets. |
|
(4) |
We report our financial results in accordance with United States generally accepted accounting principles (“GAAP”). Adjusted EBITDA, a Non-GAAP measure, represents income from continuing operations before income tax expense, interest expense, gain on sale of operations, net, and depreciation and amortization expense. We have included Adjusted EBITDA because such data is commonly used as a performance measure by analysts and investors and as a measure of our ability to service debt. Adjusted EBITDA should not be regarded as an alternative or replacement to any measurement of performance under generally accepted accounting principles. Refer to the GAAP Reconciliation table in Part II - Item 7, Management’s Discussion and Analysis of Financial Condition and Results of Operations, which reconciles the Non-GAAP financial measure to the nearest GAAP financial measure, “Income from continuing operations.” |
Item 7. Management’s Discussion and Analysis of Financial Condition and Results of Operations.
The following discussion is intended to assist in the understanding of CBIZ’s financial position at December 31, 2016 and 2015, and results of operations and cash flows for each of the years ended December 31, 2016, 2015 and 2014. This discussion should be read in conjunction with CBIZ’s consolidated financial statements and related notes included elsewhere in this Annual Report on Form 10-K. This discussion and analysis contains forward-looking statements and should also be read in conjunction with the disclosures and information contained in “Forward-Looking Statements” and “Item 1A. Risk Factors” in this Annual Report on Form 10-K.
Executive Summary
Revenue
Revenue of $799.8 million in 2016 grew $49.4 million, or 6.6%, from revenue of $750.4 million in 2015. Acquisitions contributed $29.9 million, or 4.0%, while same-unit revenue improved by $19.5 million, or 2.6%. A detailed discussion of revenue by practice group is included under “Operating Practice Groups.”
Income from Continuing Operations
Income from continuing operations in 2016 increased $5.6 million, or 16.0%, to $40.6 million from $35.0 million in 2015. Refer to “Results of Operations — Continuing Operations” for a detailed discussion of the components of income from continuing operations.
Earnings Per Diluted Share from Continuing Operations
Earnings per diluted share from continuing operations were $0.76, $0.66 and $0.59 in 2016, 2015 and 2014, respectively, with a fully diluted weighted average share count of 53.5 million shares, 52.7 million shares and 51.5 million shares, respectively, in those same periods. The dilutive impact of the common stock equivalents related to the 4.875% 2010 Convertible Senior Subordinated Notes (the “2010 Notes”) was 1.2 million shares in 2015 and 2.0 million shares in 2014. Excluding the impact of the common stock equivalents, fully diluted earnings per share from continuing operations would have been $0.68 and $0.61 in 2015 and 2014, respectively.
Share Repurchases
Our first priority for the use of capital is to make strategic acquisitions. We have the financing flexibility and the capacity to carry out an active acquisition program and to take an opportunistic approach towards using funds to repurchase shares. On February 9, 2017, the CBIZ Board of Directors authorized the purchase of up to 5.0 million shares of CBIZ common stock under the Share Repurchase Program, which may be suspended or discontinued at any time and expires on April 1, 2018. The shares may be purchased in open market, privately negotiated or Rule 10b5-1 trading plan purchases, which may include purchases from CBIZ employees, Officers and Directors, in accordance with the SEC rules. CBIZ management will determine the timing and amount of the transactions based on its evaluation of market conditions and other factors.
We believe that repurchasing shares of our common stock under the Share Repurchase Program is a prudent use of our financial resources, and that investing in our shares is an attractive use of capital and an efficient means to provide value to the CBIZ shareholders. We repurchased 0.8 million shares of our common stock at a total cost of approximately $7.8 million in 2016 compared to 3.8 million shares at a total cost of approximately $35.2 million in 2015 and 3.2 million shares at a total cost of approximately $26.6 million in 2014. Subsequent to December 31, 2016 up to the date of this filing, we repurchased approximately 0.2 million shares at a total cost of approximately $2.2 million under a Rule 10b5-1 trading plan, which allows us to repurchase shares below a predetermined price per share.
19
We completed six acquisitions in 2016. Aggregate consideration for the acquisitions consisted of approximately $40.0 million in cash, $21.1 million in contingent consideration and $2.1 million in CBIZ common stock. We also purchased seven client lists in 2016 for approximately $1.2 million in cash, $1.2 million in guaranteed future consideration and $1.5 million contingent upon future financial performances. For further discussion regarding acquisitions, refer to Note 18, Acquisitions, to the accompanying consolidated financial statements.
Recent Accomplishments and Other Events
The following items highlight the Company’s significant, recent accomplishments and other events for the year ended December 31, 2016.
Jerome P. Grisko, Jr. Appointed as Chief Executive Officer
Jerome P. Grisko, Jr. was appointed Chief Executive Officer, effective March 9, 2016, following the retirement of Steven L. Gerard. Prior to the appointment, Mr. Grisko served as the President and Chief Operating Officer of CBIZ since February 2000. He will retain his role as President and as a member of the Board of Directors, to which he was appointed in November 2015.
CBIZ National and Local Market Recognition Awards
In 2016, CBIZ was honored and recognized for 34 various national and local market awards, with the two main awards being;
Best Places to Work
In 2016, CBIZ was selected and honored as a “Best Places to Work in Insurance” by Business Insurance magazine based on our commitment to attracting, developing and retaining great talent through employee benefits and other programs. We were recognized for this award based on core focus areas such as leadership and planning, corporate culture, and communications, work environment and overall engagement.
Best and Brightest Companies to Work For
In 2016, CBIZ was selected and honored as a “2016 Best and Brightest Company” by National Association of Business Resources based on our commitment to human resource practices and employee enrichment. Organizations are assessed based on categories such as communication, work-life balance, employee education, diversity, recognition and retention.
Results of Operations — Continuing Operations
We provide professional business services that help clients manage their finances and employees. We deliver our integrated services through the following three practice groups: Financial Services, Benefits and Insurance Services and National Practices. A description of these groups’ operating results and factors affecting their businesses is provided below.
Same-unit revenue represents total revenue adjusted to reflect comparable periods of activity for acquisitions and divestitures. For example, for a business acquired on July 1, 2015, revenue for the period January 1, 2016 through June 30, 2016 would be reported as revenue from acquired businesses; same-unit revenue would include revenue for the periods July 1 through December 31 of both years. Divested operations represent operations that did not meet the criteria for treatment as discontinued operations. Those businesses that have met the requirements to be treated as a discontinued operation are eliminated from continuing operations for all periods presented below.
Revenue
The following table summarizes total revenue for the years ended December 31, 2016, 2015 and 2014:
|
|
|
Year Ended December 31, |
|
|||||||||||||||||||||
|
|
|
2016 |
|
|
2015 |
|
|
2014 |
|
|||||||||||||||
|
Financial Services |
|
$ |
501,307 |
|
|
|
62.7 |
% |
|
$ |
476,396 |
|
|
|
63.5 |
% |
|
$ |
465,130 |
|
|
|
64.6 |
% |
|
Benefits and Insurance Services |
|
|
267,606 |
|
|
|
33.5 |
% |
|
|
244,493 |
|
|
|
32.6 |
% |
|
|
224,898 |
|
|
|
31.3 |
% |
|
National Practices |
|
|
30,919 |
|
|
|
3.8 |
% |
|
|
29,533 |
|
|
|
3.9 |
% |
|
|
29,455 |
|
|
|
4.1 |
% |
|
Total CBIZ |
|
$ |
799,832 |
|
|
|
100.0 |
% |
|
$ |
750,422 |
|
|
|
100.0 |
% |
|
$ |
719,483 |
|
|
|
100.0 |
% |
20
A detailed discussion of same-unit revenue by practice group is included under “Operating Practice Groups.”
Non-qualified Deferred Compensation Plan
We sponsor a non-qualified deferred compensation plan, under which a CBIZ employee’s compensation deferral is held in a rabbi trust and invested accordingly as directed by the employee. Income and expenses related to the non-qualified deferred compensation plan are included in “Operating expenses”, “Gross margin” and “G&A expenses” and are directly offset by deferred compensation gains or losses in “Other income, net” in the accompanying Consolidated Statements of Comprehensive Income. The non-qualified deferred compensation plan has no impact on “Income from continuing operations before income tax expense” or diluted earnings per share from continuing operations.
Operating Expenses
The following table presents our operating expenses for the years ended December 31, 2016, 2015 and 2014:
|
|
|
Year Ended December 31, |
|
|||||||||
|
|
|
2016 |
|
|
2015 |
|
|
2014 |
|
|||
|
|
|
(Dollars in thousands, except percentages) |
|
|||||||||
|
Operating expenses |
|
$ |
697,726 |
|
|
$ |
652,391 |
|
|
$ |
629,804 |
|
|
Operating expenses % of revenue |
|
|
87.2 |
% |
|
|
86.9 |
% |
|
|
87.5 |
% |
2016 Compared to 2015
The majority of our operating expenses relate to personnel costs, which includes (i) salaries and benefits, (ii) commissions paid to producers (iii) incentive compensation and (iv) share-based compensation. Our operating expenses increased by $45.3 million, or 6.9%, in 2016 compared to 2015, and increased to 87.2% of revenue from 86.9% of revenue for the prior year. Personnel costs increased $36.9 million, or 7.3%, to support our growth in revenue, with acquisitions contributing approximately $17.9 million to personnel costs. Personnel costs and other operating expenses are discussed in further detail under “Operating Practice Groups.”
The non-qualified deferred compensation plan added expense of $4.6 million in 2016 compared to income of $0.6 million in 2015. Excluding these items, operating expenses would have been $693.2 million, or 86.7% of revenue, in 2016 compared to $652.9 million, or 87.0%, in 2015.
2015 Compared to 2014
Our operating expenses increased $22.6 million, or 3.5%, in 2015 compared to 2014, and decreased to 86.9% of revenue from 87.5% of revenue for the prior year. The increase in operating expenses was due to the same factors in the “2016 Compared to 2015” period as discussed above. Personnel costs increased $20.2 million, or 4.2%. Acquisitions contributed approximately $11.0 million to personnel costs.
The non-qualified deferred compensation plan added income of $0.6 million in 2015 compared to expense of $3.2 million in 2014. Excluding these items, operating expenses would have been $652.9 million, or 87.0% of revenue, in 2015 compared to $626.6 million, or 87.1%, in 2014.
G&A Expenses
The following table presents our G&A expenses for the years ended December 31, 2016, 2015 and 2014:
|
|
|
Year Ended December 31, |
|
|||||||||
|
|
|
2016 |
|
|
2015 |
|
|
2014 |
|
|||
|
|
|
(Dollars in thousands, except percentages) |
|
|||||||||
|
G&A expenses |
|
$ |
36,319 |
|
|
$ |
32,527 |
|
|
$ |
34,183 |
|
|
G&A expenses % of revenue |
|
|
4.6 |
% |
|
|
4.4 |
% |
|
|
4.8 |
% |
21
Our G&A expenses increased by $3.8 million, or 11.7%, in 2016 compared to 2015, and increased to 4.6% of revenue from 4.4% of revenue for the prior year. Personnel costs increased $1.8 million, or 9.9%, due to an increase in incentive-based compensation due to the Company’s performance in 2016. Also contributing to the increase in G&A expenses was an increase of $0.9 million in professional fees related to legal fees incurred.
The non-qualified deferred compensation plan added expense of $0.7 million in 2016 compared to income of $0.1 million in 2015. Excluding these items, G&A expenses would have been $35.6 million, or 4.5% of revenue, in 2016 compared to $32.6 million, or 4.4% of revenue, in 2015.
2015 Compared to 2014
Our G&A expenses decreased by $1.7 million, or 4.8%, in 2015 compared to 2014, and decreased to 4.4% of revenue from 4.8% of revenue for the prior year. Professional fees decreased $1.2 million due to a decrease in legal expenses related to case dismissals and settlements. Also contributing to the decrease in G&A expenses was a decrease of $0.3 million related to incentive-based compensation.
The non-qualified deferred compensation plan added income of $0.1 million in 2015 compared to expense of $0.5 million in 2014. Excluding these items, G&A expenses would have been $32.6 million, or 4.4% of revenue, in 2015 compared to $33.7 million, or 4.7%, in 2014.
Other Income (Expense), Net
The following tables present our other income (expense), net for the years ended December 31, 2016, 2015 and 2014:
|
|
|
Year Ended December 31, |
|
|||||||||
|
|
|
2016 |
|
|
2015 |
|
|
2014 |
|
|||
|
|
|
(Dollars in thousands) |
|
|||||||||
|
Interest expense |
|
$ |
(6,593 |
) |
|
$ |
(8,902 |
) |
|
$ |
(13,124 |
) |
|
Gain on sale of operations, net |
|
|
855 |
|
|
|
84 |
|
|
|
1,303 |
|
|
Other income, net (1) |
|
|
6,957 |
|
|
|
1,146 |
|
|
|
6,893 |
|
|
Total other income (expense), net |
|
$ |
1,219 |
|
|
$ |
(7,672 |
) |
|
$ |
(4,928 |
) |
|
(1) |
Other income, net includes a net gain of $5.3 million, a net loss of $0.7 million and a net gain of $3.7 million in the years 2016, 2015 and 2014, respectively, associated with the value of investments held in a rabbi trust related to the non-qualified deferred compensation plan. The adjustments to the investments held in a rabbi trust related to the non-qualified deferred compensation plan are offset by a corresponding increase or decrease to compensation expense, which is recorded as “Operating expenses” and “G&A expenses” in the accompanying Consolidated Statements of Comprehensive Income. The non-qualified deferred compensation plan has no impact on “Income from continuing operations before income tax expense” or diluted earnings per share from continuing operations |
Interest Expense
Interest expense decreased $2.3 million during 2016 compared to 2015 primarily due to a lower average interest rate, partially offset by a higher average debt balance. Our primary financing arrangement is the $400 million credit facility. We early retired a portion of the 2010 Notes in the second quarter of 2015 with funds available under the credit facility at an average interest rate of 2.14%. We used cash of $71.8 million under the credit facility at an average interest rate of 2.02% when the 2010 Notes matured in the fourth quarter of 2015. The 2010 Notes had an interest rate of 7.50%. Our average debt balance and interest rate was $234.5 million and 2.43% in 2016 compared to $213.8 million and 3.50% in 2015.
Interest expense decreased $4.2 million during 2015 compared to 2014 primarily due to the same factors as discussed above. In 2015 and 2014 we early retired a portion of the 2010 Notes with funds available under the $400 million credit facility at an average interest rate of 2.14% and 2.55%, respectively. Our average debt balance and interest rate was $213.8 million and 3.50% in 2015 compared to $209.5 million and 5.43% in 2014. Our debt is further discussed in Note 8, Debt and Financing Arrangements, to the accompanying consolidated financial statements.
22
Gain on Sale of Operations, Net
The $0.9 million net gain on sale of operations in 2016 was primarily due to the sale of two small books of business under the Benefits and Insurance Services practice group. The net gain on sale of operations of $1.3 million in 2014 was primarily due to the sale of the Miami, Florida office under the Financial Services practice group.
Other Income, Net
In addition to the impact of the non-qualified deferred compensation plan on “Other income, net” discussed above in footnote 1 (net gain of $5.3 million, a net loss of $0.7 million and a net gain of $3.7 million in the years 2016, 2015 and 2014), adjustments to the fair value of our contingent purchase price liability related to prior acquisitions resulted in other income, net of $1.3 million, $2.9 million and $4.0 million in 2016, 2015 and 2014, respectively. Also included in “Other income, net” is a non-operating charge of $0.8 million and $1.5 million from the early retirement of the 2010 Notes in 2015 and 2014, respectively. No such charge was incurred in 2016.
Income Tax Expense
The following tables present our income tax expense for the years ended December 31, 2016, 2015 and 2014:
|
|
|
Year Ended December 31, |
|
|||||||||
|
|
|
2016 |
|
|
2015 |
|
|
2014 |
|
|||
|
|
|
(Dollars in thousands, except percentages) |
|
|||||||||
|
Income tax expense |
|
$ |
26,399 |
|
|
$ |
22,829 |
|
|
$ |
20,154 |
|
|
Effective tax rate |
|
|
39.4 |
% |
|
|
39.5 |
% |
|
|
39.9 |
% |
We recorded income tax expense from continuing operations of $26.4 million, $22.8 million and $20.2 million in 2016, 2015 and 2014, respectively. The effective tax rate for those same periods is 39.4%, 39.5% and 39.9%, respectively. For further discussion regarding income tax expense, refer to Note 7, Income Taxes, to the accompanying consolidated financial statements.
GAAP RECONCILIATION
Income from Continuing Operations to Non-GAAP Financial Measures (1)
|
|
|
Year Ended December 31, |
|
|||||||||||||||||
|
|
|
2016 |
|
|
2015 |
|
|
2014 |
|
|
2013 |
|
|
2012 |
|
|||||
|
|
|
(Dollars in thousands) |
|
|||||||||||||||||
|
Income from continuing operations |
|
$ |
40,607 |
|
|
$ |
35,003 |
|
|
$ |
30,414 |
|
|
$ |
25,379 |
|
|
$ |
23,793 |
|
|
Interest expense |
|
|
6,593 |
|
|
|
8,902 |
|
|
|
13,124 |
|
|
|
15,374 |
|
|
|
14,999 |
|
|
Income tax expense |
|
|
26,399 |
|
|
|
22,829 |
|
|
|
20,154 |
|
|
|
16,577 |
|
|
|
14,364 |
|
|
Gain on sale of operations, net |
|
|
(855 |
) |
|
|
(84 |
) |
|
|
(1,303 |
) |
|
|
(79 |
) |
|
|
(2,766 |
) |
|
Depreciation |
|
|
5,378 |
|
|
|
5,658 |
|
|
|
5,353 |
|
|
|
4,756 |
|
|
|
4,688 |
|
|
Amortization |
|
|
16,720 |
|
|
|
14,731 |
|
|
|
14,478 |
|
|
|
13,535 |
|
|
|
11,460 |
|
|
Adjusted EBITDA |
|
$ |
94,842 |
|
|
$ |
87,039 |
|
|
$ |
82,220 |
|
|
$ |
75,542 |
|
|
$ |
66,538 |
|
|
(1) |
We report our financial results in accordance with GAAP. This table reconciles Non-GAAP financial measures to the nearest GAAP financial measure, “Income from continuing operations.” Adjusted EBITDA is not defined by GAAP, is not based on any comprehensive set of accounting rules or principles, and should not be considered in isolation from, or regarded as an alternative or replacement to, any measurement of performance or cash flow under GAAP. Because of these limitations, Adjusted EBITDA should be considered alongside our financial results presented in accordance with GAAP. Adjusted EBITDA is commonly used by the Company, its shareholders and debt holders to evaluate, assess and benchmark the Company’s operational results and to provide an additional measure with respect to the Company’s ability to meet future debt obligations. |
Operating Practice Groups
We deliver our integrated services through three practice groups: Financial Services, Benefits and Insurance Services and National Practices. A description of these groups’ operating results and factors affecting their businesses is provided below.
23
|
|
|
Year Ended December 31, |
|
|||||||||||||
|
|
|
2016 |
|
|
2015 |
|
|
$ Change |
|
|
% Change |
|
||||
|
|
|
(Dollars in thousands) |
|
|||||||||||||
|
Revenue |
|
|
|
|
|
|
|
|
|
|
|
|
|
|
|
|
|
Same-unit |
|
$ |
498,431 |
|
|
$ |
474,340 |
|
|
$ |
24,091 |
|
|
|
5.1 |
% |
|
Acquired businesses |
|
|
2,879 |
|
|
|
— |
|
|
|
2,879 |
|
|
|
|
|
|
Divested operations |
|
|
(3 |
) |
|
|
2,056 |
|
|
|
(2,059 |
) |
|
|
|
|
|
Total revenue |
|
|
501,307 |
|
|
|
476,396 |
|
|
|
24,911 |
|
|
|
5.2 |
% |
|
Operating expenses |
|
|
432,254 |
|
|
|
411,325 |
|
|
|
20,929 |
|
|
|
5.1 |
% |
|
Gross margin |
|
$ |
69,053 |
|
|
$ |
65,071 |
|
|
$ |
3,982 |
|
|
|
6.1 |
% |
|
Gross margin percent |
|
|
13.8 |
% |
|
|
13.7 |
% |
|
|
|
|
|
|
|
|
|
|
|
Year Ended December 31, |
|
|||||||||||||
|
|
|
2015 |
|
|
2014 |
|
|
$ Change |
|
|
% Change |
|
||||
|
|
|
(Dollars in thousands) |
|
|||||||||||||
|
Revenue |
|
|
|
|
|
|
|
|
|
|
|
|
|
|
|
|
|
Same-unit |
|
$ |
475,587 |
|
|
$ |
459,733 |
|
|
$ |
15,854 |
|
|
|
3.4 |
% |
|
Acquired businesses |
|
|
809 |
|
|
|
— |
|
|
|
809 |
|
|
|
|
|
|
Divested operations |
|
|
— |
|
|
|
5,397 |
|
|
|
(5,397 |
) |
|
|
|
|
|
Total revenue |
|
|
476,396 |
|
|
|
465,130 |
|
|
|
11,266 |
|
|
|
2.4 |
% |
|
Operating expenses |
|
|
411,325 |
|
|
|
399,783 |
|
|
|
11,542 |
|
|
|
2.9 |
% |
|
Gross margin |
|
$ |
65,071 |
|
|
$ |
65,347 |
|
|
$ |
(276 |
) |
|
|
-0.4 |
% |
|
Gross margin percent |
|
|
13.7 |
% |
|
|
14.0 |
% |
|
|
|
|
|
|
|
|
2016 Compared to 2015
The Financial Services practice group revenue in 2016 grew by 5.2% to $501.3 million from $476.4 million in 2015, primarily reflecting same-unit growth of 5.1%, driven by those units that provide national services, which increased 8.3%, as well as those units that provide traditional accounting and tax related services, which increased 3.5%, respectively. The Financial Services practice group benefited from project work and growth in the governmental health care compliance business, as well as an increase of 2% in billable hours and moderate price increases in those units that provide traditional accounting and tax related services.
We provide a range of services to affiliated CPA firms under ASAs. Fees earned under the ASAs are recorded as revenue in the accompanying Consolidated Statements of Comprehensive Income and were $144.8 million and $137.5 million in 2016 and 2015, respectively.
Operating expenses increased by $20.9 million in 2016, but decreased to 86.2% of revenue from 86.3% of revenue for the prior year. To support the growth of our revenue in 2016, personnel costs increased by $21.5 million, driven by incremental growth in our headcount and salaries and related benefits.
2015 Compared to 2014
The Financial Services practice group revenue in 2015 grew by 2.4% to $476.4 million from $465.1 million in 2014. Same-unit revenue grew 3.4%, driven by project work and growth in the governmental health care compliance business, as well as a slight increase in those units that provide traditional accounting and tax related services. The revenue from divestitures was from a business located in Miami, Florida which was sold in the fourth quarter of 2014. Fees earned under the ASAs were $137.5 million and $133.7 million in 2015 and 2014, respectively.
Operating expenses increased by $11.5 million in 2015 to 86.3% of revenue from 86.0% of revenue for the prior year due to the same factors as discussed above in the 2016 compared to 2015 period. In 2015, personnel costs increased by $8.5 million, while occupancy costs increased by $2.3 million due to additional costs related to the relocation of the Kansas City, Missouri office as well as increases in common area charges at numerous other locations.
24
Benefits and Insurance Services
|
|
|
Year Ended December 31, |
|
|||||||||||||
|
|
|
2016 |
|
|
2015 |
|
|
$ Change |
|
|
% Change |
|
||||
|
|
|
(Dollars in thousands) |
|
|||||||||||||
|
Revenue |
|
|
|
|
|
|
|
|
|
|
|
|
|
|
|
|
|
Same-unit |
|
$ |
238,478 |
|
|
$ |
244,493 |
|
|
$ |
(6,015 |
) |
|
|
-2.5 |
% |
|
Acquired businesses |
|
|
29,128 |
|
|
|
- |
|
|
|
29,128 |
|
|
|
|
|
|
Total revenue |
|
|
267,606 |
|
|
|
244,493 |
|
|
|
23,113 |
|
|
|
9.5 |
% |
|
Operating expenses |
|
|
223,487 |
|
|
|
202,138 |
|
|
|
21,349 |
|
|
|
10.6 |
% |
|
Gross margin |
|
$ |
44,119 |
|
|
$ |
42,355 |
|
|
$ |
1,764 |
|
|
|
4.2 |
% |
|
Gross margin percent |
|
|
16.5 |
% |
|
|
17.3 |
% |
|
|
|
|
|
|
|
|
|
|
|
Year Ended December 31, |
|
|||||||||||||
|
|
|
2015 |
|
|
2014 |
|
|
$ Change |
|
|
% Change |
|
||||
|
|
|
(Dollars in thousands) |
|
|||||||||||||
|
Revenue |
|
|
|
|
|
|
|
|
|
|
|
|
|
|
|
|
|
Same-unit |
|
$ |
226,482 |
|
|
$ |
224,898 |
|
|
$ |
1,584 |
|
|
|
0.7 |
% |
|
Acquired businesses |
|
|
18,011 |
|
|
|
— |
|
|
|
18,011 |
|
|
|
|
|
|
Total revenue |
|
|
244,493 |
|
|
|
224,898 |
|
|
|
19,595 |
|
|
|
8.7 |
% |
|
Operating expenses |
|
|
202,138 |
|
|
|
186,002 |
|
|
|
16,136 |
|
|
|
8.7 |
% |
|
Gross margin |
|
$ |
42,355 |
|
|
$ |
38,896 |
|
|
$ |
3,459 |
|
|
|
8.9 |
% |
|
Gross margin percent |
|
|
17.3 |
% |
|
|
17.3 |
% |
|
|
|
|
|
|
|
|
2016 Compared to 2015
The Benefits and Insurance Services practice group revenue in 2016 grew by 9.5% to $267.6 million from $244.5 million in 2015, primarily driven by $27.3 million of incremental revenue from the acquisition of The Savitz Organization (“Savitz”), Flex-Pay Business Services, Inc. (“Flex-Pay”), Pension Resource Group, Inc. (“PRG”) and Cottonwood Group, Inc. (“Cottonwood”). The same-unit revenue decrease in 2016 was primarily attributable to fewer recruiting projects in our human capital services group as well as non-recurring actuarial projects in our retirement plan services group.
Operating expenses increased by $21.3 million in 2016 to 83.5% of revenue from 82.7% of revenue for the prior year. Personnel costs increased by $16.8 million primarily due to the acquisitions as discussed above. Excluding acquisitions, personnel costs decreased $1.1 million, due to decreased commissions paid to producers associated with decreased revenue. Occupancy costs increased $1.8 million primarily due to the acquisitions as discussed above.
2015 Compared to 2014
The Benefits and Insurance Services practice group revenue in 2015 grew by 8.7% to $244.5 million from $224.9 million in 2014, primarily driven by $15.1 million of incremental revenue from the acquisition of Weeks & Callaway (“W&C”), Tegrit Group (“Tegrit”) and Model Consulting, Inc. (“Model”). The same-unit revenue increase in 2015 was primarily driven by property and casualty and a strong performance within its specialty program business, as well as an increase in carrier bonus payments.
Operating expenses increased by $16.1 million in 2015, but remained flat at 82.7% of revenue in 2015 and 2014. Personnel costs increased by $11.5 million primarily due to the acquisitions as discussed above in revenue. Excluding acquisitions, personnel costs increased slightly at $0.5 million. Occupancy costs increased $1.7 million primarily due to the acquisitions as discussed above, as well as additional costs related to the relocation of the Kansas City, Missouri office.
25
|
|
|
Year Ended December 31, |
|
|||||||||
|
|
|
2016 |
|
|
2015 |
|
|
2014 |
|
|||
|
|
|
(Dollars in thousands) |
|
|||||||||
|
Revenue |
|
|
|
|
|
|
|
|
|
|
|
|
|
Same-unit |
|
$ |
30,919 |
|
|
$ |
29,533 |
|
|
$ |
29,455 |
|
|
Operating expenses |
|
|
27,697 |
|
|
|
26,417 |
|
|
|
26,798 |
|
|
Gross margin |
|
$ |
3,222 |
|
|
$ |
3,116 |
|
|
$ |
2,657 |
|
|
Gross margin percent |
|
|
10.4 |
% |
|
|
10.6 |
% |
|
|
9.0 |
% |
2016 Compared to 2015
Revenue in 2016 grew by 4.7% to $30.9 million from $29.5 million in 2015, primarily driven by our cost-plus contract with a single client. Since 1999, this cost-plus contract has been renewed several times. The cost-plus contract is a five year contract with the most recent renewal through December 31, 2018. Revenues from this single client accounted for approximately 70% of the National Practice group’s revenue. Operating expenses increased by $1.3 million in 2016 and increased to 89.6% of revenue from 89.4% of revenue for the prior year, mainly due to an increase in salaries and benefits.
2015 Compared to 2014
Revenue remained flat in 2015, but operating expenses decreased $0.4 million in 2015 and decreased to 89.4% of revenue from 91.0% of revenue for the prior year, primarily due to lower legal fees incurred by the healthcare consulting business in 2015 compared to 2014.
Liquidity
Our principal sources of liquidity are cash generated from operating activities and financing activities. Our cash flows from operating activities are driven primarily by our operating results and changes in our working capital requirements while our cash flows from financing activities are dependent upon our ability to access credit or other capital. We historically maintain low cash levels and apply any available cash to pay down the outstanding debt balance.
Total cash provided by operating activities from continuing operations was $71.0 million in 2016 as compared to $47.4 million in 2015. We historically experience use of cash to fund working capital requirements during the first quarter of each fiscal year. This is primarily due to the seasonal accounting and tax services period under the Financial Services practice group. Upon completion of the seasonal accounting and tax services period, cash provided by operations during the remaining three quarters of the fiscal year substantially exceeds the use of cash in the first quarter of the fiscal year.
Accounts receivable balances increase in response to the increase in first quarter revenue generated by the Financial Services practice group. A significant amount of this revenue is billed and collected in subsequent quarters. Days sales outstanding (“DSO”) from continuing operations represent accounts receivable and unbilled revenue (net of realization adjustments) at the end of the period, divided by trailing twelve months daily revenue. We experienced an increase to 76 days in 2016 from 72 days in 2015 mainly due to the balance sheet impact of acquisitions. We provide DSO data because such data is commonly used as a performance measure by analysts and investors and as a measure of our ability to collect on receivables in a timely manner.
The following table presents selected cash flow information (in thousands). For additional details, refer to the accompanying Consolidated Statements of Cash Flows.
|
|
|
Year Ended December 31, |
|
|||||||||
|
|
|
2016 |
|
|
2015 |
|
|
2014 |
|
|||
|
Net cash provided by continuing operations |
|
$ |
70,655 |
|
|
$ |
46,396 |
|
|
$ |
43,117 |
|
|
Operating cash flows provided by discontinued operations |
|
|
387 |
|
|
|
990 |
|
|
|
801 |
|
|
Net cash provided by operating activities |
|
|
71,042 |
|
|
|
47,386 |
|
|
|
43,918 |
|
|
Net cash used in investing activities |
|
|
(50,014 |
) |
|
|
(6,957 |
) |
|
|
(64,334 |
) |
|
Investing cash flows provided by discontinued operations |
|
|
— |
|
|
|
8 |
|
|
|
416 |
|
|
Net cash used in investing activities |
|
|
(50,014 |
) |
|
|
(6,949 |
) |
|
|
(63,918 |
) |
|
Net cash (used in) provided by financing activities |
|
|
(18,384 |
) |
|
|
(40,566 |
) |
|
|
20,208 |
|
|
Increase (decrease) in cash and cash equivalents |
|
$ |
2,644 |
|
|
$ |
(129 |
) |
|
$ |
208 |
|
26
Operating Activities
Cash provided by operating activities was $71.0 million in 2016, compared with $47.4 million of cash provided by operating activities in 2015. The net change in cash from operations was mainly due to a decrease in working capital and an increase in net income. Working capital provided $17.2 million more cash flow in 2016 compared to 2015, primarily due to our ongoing effort to manage payables and the timing of certain accrued liabilities. Net income increased by $6.0 million in 2016 compared to 2015.
Cash provided by operating activities was $47.4 million in 2015, compared with $43.9 million in 2015. The $3.5 million net increase in cash provided by operating activities was primarily due to an increase in net income of $4.3 million.
Investing Activities
Cash used for investing activities in 2016 consisted primarily of $35.6 million related to the acquisitions of Savitz, Flex-Pay and Ed Jacobs & Associates, Inc., as well as net activity related to funds held for clients of $4.8 million and the $4.1 million of additions to property and equipment.
In 2015, cash used for investing activities consisted primarily of $10.5 million related to the acquisitions of Model, Cottonwood and PRG, as well as capital expenditures of $7.4 million, partially offset by net activity related to funds held for clients of $11.1 million.
In 2014, cash used for investing activities consisted primarily of $36.2 million related to the acquisitions of W&C, Tegrit, Lewis Birch & Ricardo, LLC, Clearview National Partners, LLC and Rognstad’s Inc. d.b.a. Sattler Insurance Agency, as well as net activity related to funds held for clients of $18.6 million and $4.8 million of additions to property and equipment.
A further description of funds held for clients and client fund obligations is provided in Note 1, Organization and Summary of Significant Accounting Policies, to the accompanying consolidated financial statements.
Financing Activities
Cash used for financing activities in 2016 consisted primarily of $14.4 million in net payments on our credit facility, as well as the repurchase of CBIZ common stock at a cost of approximately $6.7 million and the purchase of shares withheld for taxes at a cost of approximately $2.4 million.
In 2015, cash used for financing activities consisted primarily of $89.0 million for the extinguishment of our 2010 Notes, the repurchase of CBIZ common stock for $36.5 million, mainly representing the repurchase of 3.8 million common shares available under the Share Repurchase Program, as well as a net decrease of $12.6 million in client fund obligations as a result of timing of cash receipts and related payments, partially offset by $98.4 million in net proceeds from the credit facility.
In 2014, cash provided by financing activities consisted primarily of $58.9 million in net proceeds under the credit facility, partially offset by $30.6 million for the early retirement of a portion of our 2010 Notes.
Capital Resources
The following table presents our capital structure (in thousands).
|
|
|
December 31, |
|
|||||
|
|
|
2016 |
|
|
2015 |
|
||
|
Bank debt |
|
$ |
191,400 |
|
|
$ |
205,800 |
|
|
Convertible notes, net |
|
|
— |
|
|
|
750 |
|
|
Total debt |
|
|
191,400 |
|
|
|
206,550 |
|
|
Shareholders’ equity |
|
|
480,021 |
|
|
|
427,948 |
|
|
Total capital |
|
$ |
671,421 |
|
|
$ |
634,498 |
|
Credit Facility
Our primary financing arrangement, the credit facility which matures in July 2019, is with Bank of America, N.A., as agent for a group of eight participating banks. At December 31, 2016, we had $191.4 million outstanding under the credit facility, as well as letters of credit and performance guarantees totaling $4.6 million. Available funds under the credit facility, based on the terms of the
27
commitment, were approximately $137.5 million at December 31, 2016. The credit facility provided flexibility to refinance our 2010 Notes, lowered our borrowing costs and allows for the allocation of funds for future strategic initiatives, including acquisitions and the repurchase of CBIZ common stock, subject to the terms and conditions of the credit facility.
Borrowing Costs
Our weighted average interest rate was 2.43% under the credit facility in 2016 compared to 3.50% under the credit facility and 2010 Notes in 2015. The interest rate on the 2010 Notes was 7.50% in 2015.
Debt Covenant Compliance
Under the credit facility, we are required to meet certain financial covenants with respect to (i) total leverage ratio and (ii) a minimum fixed charge coverage ratio. The Company was in compliance with its covenants as of December 31, 2016. Our ability to service our debt and to fund future strategic initiatives will depend upon our ability to generate cash in the future.
For further discussion regarding our credit facility, see Note 8, Debt and Financing Arrangements, to the accompanying consolidated financial statements.
Acquisitions
We completed six acquisitions in 2016 for approximately $40.0 million in cash, $21.1 million in contingent consideration and $2.1 million in CBIZ common stock. For further details on acquisitions, refer to Note 18, Acquisitions, to the accompanying consolidated financial statements.
Share Repurchases
Our first priority for the use of capital is to make strategic acquisitions. We have the financing flexibility and the capacity to carry out an active acquisition program and to take an opportunistic approach towards using funds to repurchase shares. We believe that repurchasing shares of our common stock under the Share Repurchase Program is a prudent use of the Company’s financial resources, and that investing in our shares is an attractive use of capital and an efficient means to provide value to CBIZ shareholders.
We repurchased 0.8 million shares of our common stock at a total cost of approximately $7.8 million in 2016 compared to 3.8 million shares at a total cost of approximately $35.2 million in 2015. These repurchases do not include the purchase of shares withheld for tax purposes under the stock incentive plan. Subsequent to December 31, 2016 up to the date of this filing, we repurchased approximately 0.2 million shares at a total cost of approximately $2.2 million under a Rule 10b5-1 trading plan, which allows us to repurchase shares below a predetermined price per share.
Cash Requirements for 2017
Cash requirements for 2017 will include interest payments on debt, seasonal working capital requirements, acquisitions, share repurchases and capital expenditures. We believe that cash provided by operations and borrowings available under our credit facility will be sufficient to meet cash requirements for the next 12 months.
28
CBIZ’s aggregate amount of future obligations for the next five years and thereafter is set forth below (in thousands):
|
|
|
Total |
|
|
2017 |
|
|
2018-2019 |
|
|
2020-2021 |
|
|
2022 and Thereafter |
|
|||||
|
Credit facility (1) |
|
|
203,415 |
|
|
|
4,651 |
|
|
|
198,764 |
|
|
|
— |
|
|
|
— |
|
|
Operating leases (2) |
|
|
203,328 |
|
|
|
30,572 |
|
|
|
56,746 |
|
|
|
40,151 |
|
|
|
75,859 |
|
|
Contingent purchase price liabilities (3) |
|
|
33,709 |
|
|
|
16,322 |
|
|
|
16,528 |
|
|
|
859 |
|
|
|
— |
|
|
Other liabilities (4) |
|
|
8,422 |
|
|
|
4,260 |
|
|
|
2,895 |
|
|
|
432 |
|
|
|
835 |
|
|
Total |
|
$ |
448,874 |
|
|
$ |
55,805 |
|
|
$ |
274,933 |
|
|
$ |
41,442 |
|
|
$ |
76,694 |
|
|
(1) |
Our $400 million credit facility matures in July 2019. Interest on the credit facility is not determinable due to the revolving nature of the credit facility and the variability of the related interest rate. Dollar amounts are estimates based on applying the 2.43% weighted average rate of the credit facility at December 31, 2016 to the $191.4 million outstanding balance of the credit facility at December 31, 2016. |
|
(2) |
Operating leases include the minimum rent commitments under non-cancelable operating leases. Amount excludes cash expected to be received under subleases. |
|
(3) |
Represents contingent earnout liability that is expected to be paid over the next three years resulting from business acquisitions. For the years ended December 31, 2017, 2018, 2019, and 2020 the cash only portions of the contingent earnout liability are $10.5 million, $7.3 million, $6.5 million and $0.9 million, respectively, with the remaining contingent earnout liability representing the stock portions. |
|
(4) |
Other liabilities include; (i) $4.6 million related to letters of credit and license bonds; (ii) $2.8 million related to the purchase of client lists; and (iii) $1.0 million related to federal and state income tax. For further discussion regarding commitments and contingencies, refer to Note 11, Commitments and Contingencies, to the accompanying consolidated financial statements |
The liability for unrecognized tax benefits of $4.1 million under Financial Accounting Standards Board (“FASB”) Accounting Standards Codification (“ASC”) Topic 740, “Income Taxes,” is excluded, since we are unable to reasonably estimate the timing of cash settlements with the respective tax authorities.
Off-Balance Sheet Arrangements
We maintain ASAs with independent CPA firms (as described more fully under “Business — Financial Services” and in Note 1, Organization and Summary of Significant Accounting Policies, to the accompanying consolidated financial statements), which qualify as variable interest entities. The accompanying consolidated financial statements do not reflect the operations or accounts of variable interest entities as the impact is not material to the consolidated financial condition, results of operations, or cash flows of CBIZ.
We provide guarantees of performance obligations for a CPA firm with which we maintain an ASA. We had $1.9 million in potential obligations at December 31, 2015, but no such obligation existed at December 31, 2016. The liability in 2015 was recorded as “Other current liabilities” in the accompanying Consolidated Balance Sheets.
We provide letters of credit to landlords (lessors) of our leased premises in lieu of cash security deposits. Letters of credit totaled $2.3 million at December 31, 2016 and 2015. In addition, we provide license bonds to various state agencies to meet certain licensing requirements. The amount of license bonds outstanding was $2.3 million at December 31, 2016 and 2015, respectively.
We have various agreements under which we may be obligated to indemnify the other party with respect to certain matters. Generally, these indemnification clauses are included in contracts arising in the normal course of business under which we customarily agree to hold the other party harmless against losses arising from a breach of representations, warranties, covenants or agreements, related to matters such as title to assets sold and certain tax matters. Payment by CBIZ under such indemnification clauses are generally conditioned upon the other party making a claim. Such claims are typically subject to challenge by CBIZ and to dispute resolution procedures specified in the particular contract. Further, our obligations under these agreements may be limited in terms of time and/or amount and, in some instances, we may have recourse against third parties for certain payments made by us. It is not possible to predict the maximum potential amount of future payments under these indemnification agreements due to the conditional nature of our obligations and the unique facts of each particular agreement. Historically, we have not made any payments under these agreements that have been material individually or in the aggregate. As of December 31, 2016, we were not aware of any obligations arising under indemnification agreements that would require material payments.
29
We utilize interest rate swaps to manage interest rate risk exposure associated with our floating-rate debt under the credit facility. We do not purchase or hold any derivative instruments for trading or speculative purposes. Under these interest rate swap contracts, we receive cash flows from counterparties at variable rates based on the London Interbank Offered Rate (“LIBOR”) and pay the counterparties a fixed rate. To mitigate counterparty credit risk, we only enter into contracts with selected major financial institutions with investment grade ratings and continually assess their creditworthiness. There are no credit risk-related contingent features in our interest rate swaps nor do the swaps contain provisions under which the Company would be required to post collateral.
During the first quarter of 2016, we entered into an interest rate swap with a notional value of $10.0 million and maturity tenor of 5 years. During the fourth quarter of 2015, we entered into three interest rate swaps. The notional hedged amounts were $10.0 million, $15.0 million and $25.0 million, with maturity tenors of 2, 3 and 5 years, respectively. For further details on our interest rate swaps, refer to Note 8, Debt and Financing Arrangements, to the accompanying consolidated financial statements.
In connection with payroll services provided to clients, we collect funds from our clients’ accounts in advance of paying these client obligations. These funds held for clients are segregated and invested in accordance with the Company’s investment policy, which requires that all investments carry an investment grade rating at the time of initial investment. The interest income on these investments mitigates the interest rate risk for the borrowing costs of our credit facility, as the rates on both the investments and the outstanding borrowings against the credit facility are based on market conditions.
Critical Accounting Policies and Estimates
Management’s Discussion and Analysis of Financial Condition and Results of Operations are based on our consolidated financial statements, which have been prepared in accordance with GAAP. The preparation of financial statements in accordance with GAAP requires that we make estimates and assumptions that affect the amounts reported in the consolidated financial statements and accompanying notes. Management’s estimates and assumptions are derived from and are continually evaluated based upon available information that we believe to be reasonable under the circumstances. We employ judgment in making our estimates and assumptions but they are based on historical experience. Actual results could differ from those estimates. The policies discussed below address the most critical accounting policies which are the most important to the portrayal of our financial statements and require the most difficult, subjective and complex judgments. Significant accounting policies are described more fully in Note 1, Organization and Summary of Significant Accounting Policies, to the accompanying consolidated financial statements.
Revenue Recognition: Revenue is recognized when all of the following criteria are satisfied: persuasive evidence of a sales arrangement exists; delivery has occurred or service has been rendered; the fee to the client is fixed or determinable; and collectability is reasonably assured. Contract terms are typically contained in a signed agreement with the client (or when applicable, other third parties) which generally defines the scope of services to be provided, pricing of services, and payment terms generally ranging from invoice date to 90 days after invoice date. Billing may occur prior to, during, or upon completion of the service. We typically do not have acceptance provisions or right of refund arrangements included in these agreements. Contract terms vary depending on the scope of services provided, the deliverables, and the complexity of the engagement.
We offer a vast array of products and business services to our clients, delivered through our practice groups. CBIZ has three major streams of revenue; (i) services performed for a fee; (ii) commissions and (iii) contingent arrangements. A description of revenue recognition, as it relates to our streams of revenue and practice groups, is provided in more detail in Note 1, Organization and Summary of Significant Accounting Policies, to the accompanying consolidated financial statements.
Valuation of Accounts Receivable and Notes Receivable: Management determines the valuation of accounts receivable (including unbilled accounts receivable) and notes receivable, and the adequacy of the allowance for doubtful accounts based on estimates of losses related to the respective receivable balance. Management analyzes historical bad debts, client credit-worthiness, the age of accounts receivable and current economic trends and conditions when evaluating the adequacy of the allowance for doubtful accounts and the collectability of notes receivable. Significant management judgments and estimates must be made and used in connection with establishing the allowance for doubtful accounts for each accounting period. Material differences may result if facts and circumstances change in relation to the original estimation.
Valuation of Goodwill: A significant portion of our assets is goodwill. At December 31, 2016, the carrying value of goodwill totaled $487.5 million, compared to total assets of $1.1 billion and total shareholders’ equity of $480.0 million. CBIZ utilizes the acquisition method of accounting for all business combinations. Goodwill is recorded when the cost of acquired businesses exceeds the fair value of the identifiable net assets acquired. In accordance with GAAP, goodwill is not amortized, but rather is tested for impairment annually, or between annual tests if an event occurs or circumstances change that would more likely than not (defined as a likelihood of more than 50%) reduce the fair value of a reporting unit below its carrying value.
30
We test goodwill for impairment on an annual basis during the fourth quarter, with the option to perform a qualitative assessment to determine whether further impairment testing is necessary or to perform a quantitative assessment by comparing the fair value of a reporting unit to its carrying amount, including goodwill. Under the qualitative assessment, an entity is not required to calculate the fair value of a reporting unit unless the entity determines that it is more likely than not that its fair value is less than its carrying amount. If under the quantitative assessment the fair value of a reporting unit is less than its carrying amount, then the amount of the impairment loss, if any, must be measured. Any such impairment charge would reduce earnings and could be material. Events and conditions that could result in impairment include a sustained drop in the market price of our common stock, increased competition or loss of market share.
At November 1, 2016, we applied the principles as prescribed in FASB ASC Topic 350, “Intangibles – Goodwill and Other” in order to complete our goodwill impairment test. After considering changes to assumptions used in our most recent quantitative testing for each reporting unit, including the capital market environment, economic and market conditions, industry competition and trends, the Company’s weighted average cost of capital, changes in management and key personnel, the price of the Company’s common stock, changes in our results of operations, the magnitude of the excess of fair value over the carrying amount of each reporting unit as determined in our most recent quantitative testing, and other factors, we concluded that it was more likely than not that the fair values of each of our reporting units were more than their respective carrying values and, therefore, did not perform a quantitative analysis.
For further discussion regarding goodwill, refer to Note 4, Goodwill and Other Intangible Assets, Net, to the accompanying consolidated financial statements.
Long-Lived Assets: Long-lived assets primarily consist of property and equipment and intangible assets, which include client lists and non-compete agreements. The intangible assets are amortized over their expected periods of benefit, which generally ranges from two to fifteen years. Long-lived assets are reviewed for impairment whenever events or changes in circumstances indicate that the carrying value of such assets or groups of assets may not be recoverable. Recoverability of long-lived assets or groups of assets is assessed based on a comparison of the undiscounted cash flows to the recorded value of the asset. If impairment is indicated, the asset is written down to its estimated fair value based on a discounted cash flow analysis or market comparable method. Determining the fair value of long-lived assets includes significant judgment by management, and different judgments could yield different results.
Loss Contingencies: Loss contingencies, including litigation claims, are recorded as liabilities when it is probable that a liability has been incurred and the amount of the loss is reasonably estimable. Contingent liabilities are often resolved over long time periods. Estimating probable losses requires analysis that often depends on judgment about potential actions by third parties.
Income Taxes: Determining the consolidated provision for income tax expense, income tax liabilities and deferred tax assets and liabilities involves management judgment. Management estimates an annual effective tax rate (which takes into consideration expected full-year results), which is applied to the Company’s quarterly operating results to determine the provision for income tax expense. In the event there is a significant, unusual or infrequent item recognized in the quarterly operating results, the tax attributable to that item is recorded in the interim period in which it occurs. In addition, reserves are established for uncertain tax positions and contingencies. See Note 7, Income Taxes, to the accompanying consolidated financial statements for further information.
Circumstances that could cause CBIZ’s estimates of effective income tax rates to change include the impact of information that subsequently becomes available as CBIZ prepares its corporate income tax returns; the level of actual pre-tax income; revisions to tax positions and valuation allowances taken as a result of further analysis and consultation; the restructuring of legal entities; the receipt and expected utilization of federal and state income tax credits; and changes mandated as a result of audits by taxing authorities. Management believes it makes reasonable judgments using all significant information available when estimating income taxes.
Other Significant Policies: Other significant accounting policies, not involving the same level of management judgment and uncertainty as those discussed above, are also critical in understanding the consolidated financial statements. Those policies are described in Note 1, Organization and Summary of Significant Accounting Policies, to the accompanying consolidated financial statements.
Recent Accounting Pronouncements: Refer to Note 1, Organization and Summary of Significant Accounting Policies, to the accompanying consolidated financial statements for a description of recent accounting pronouncements, which is incorporated herein by reference.
Item 7A. Quantitative and Qualitative Disclosures about Market Risk.
We do not purchase or hold any derivative instruments for trading or speculative purposes. We utilize interest rate swaps to manage interest rate risk exposure associated with our floating-rate debt under the credit facility. Under these interest rate swap contracts, we
31
receive cash flows from counterparties at variable rates based on LIBOR and pay the counterparties a fixed rate. To mitigate counterparty credit risk, we only enter into contracts with selected major financial institutions with investment grade ratings and continually assess their creditworthiness. There are no credit risk-related contingent features in our interest rate swaps nor do the swaps contain provisions under which we would be required to post collateral.
|
|
• |
During the first quarter of 2016, we entered into an interest rate swap with a notional value of $10.0 million and maturity tenor of 5 years. |
|
|
• |
During the fourth quarter of 2015, we entered into three interest rate swaps. The notional hedged amounts were $10.0 million, $15.0 million and $25.0 million, with maturity tenors of 2, 3 and 5 years, respectively. |
See Note 5, Financial Instruments, to the accompanying consolidated financial statements for further discussion regarding interest rate swaps.
Interest rate risk results when the maturity or repricing intervals of interest-earning assets and interest-bearing liabilities are different. A change in the Federal Funds Rate, or the reference rate set by Bank of America, N.A., would affect the rate at which we could borrow funds under its credit facility. Our balance outstanding under the credit facility at December 31, 2016 was $191.4 million, of which $131.4 million is subject to rate risk. If market rates were to increase or decrease 100 basis points from the levels at December 31, 2016, interest expense would increase or decrease approximately $1.3 million annually.
In connection with our payroll business, funds held for clients are segregated and invested in short-term investments, such as corporate and municipal bonds. In accordance with the Company’s investment policy, all investments carry an investment grade rating at the time of the initial investment. At each respective balance sheet date, these investments are adjusted to fair value with fair value adjustments being recorded to other comprehensive income or loss for the respective period. Refer to Notes 5, Financial Instruments, and Note 6, Fair Value Measurements, to the accompanying consolidated financial statements for further discussion regarding these investments and the related fair value assessments.
Item 8. Financial Statements and Supplementary Data.
The Financial Statements, together with the notes thereto and the reports of KPMG LLP dated March 9, 2017 thereon, and the Supplementary Data required hereunder, are included in this Annual Report as set forth in Item 15(a) hereof and are incorporated herein by reference.
Item 9. Changes in and Disagreements with Accountants on Accounting and Financial Disclosure.
None.
Item 9A. Controls and Procedures.
Evaluation of Disclosure Controls and Procedures
Management has evaluated the effectiveness of the Company’s disclosure controls and procedures (“Disclosure Controls”) as of the end of the period covered by this report. This evaluation (“Controls Evaluation”) was done with the participation of CBIZ’s Chief Executive Officer (“CEO”) and Chief Financial Officer (“CFO”). Disclosure Controls are controls and other procedures that are designed to ensure that information required to be disclosed by the Company in the reports that CBIZ files or submits under the Exchange Act is recorded, processed, summarized and reported within the time periods specified in the SEC’s rules and forms. Disclosure Controls include, without limitation, controls and procedures designed to ensure that information required to be disclosed by CBIZ in the reports that it files under the Exchange Act is accumulated and communicated to management, including the CEO and CFO, as appropriate to allow timely decisions regarding required disclosure.
Limitations on the Effectiveness of Controls
Management, including the Company’s CEO and CFO, does not expect that its Disclosure Controls or its internal control over financial reporting (“Internal Controls”) will prevent all errors and all fraud. Although CBIZ’s Disclosure Controls are designed to provide reasonable assurance of achieving their objective, a control system, no matter how well conceived and operated, can provide only reasonable, but not absolute, assurance that the objectives of a control system are met. Further, any control system reflects limitations on resources, and the benefits of a control system must be considered relative to its costs. Because of the inherent limitations in all control systems, no evaluation of controls can provide absolute assurance that all control issues and instances of
32
fraud, if any, within CBIZ have been detected. These inherent limitations include the realities that judgments in decision-making can be faulty and that breakdowns can occur because of simple error or mistake. Additionally, controls can be circumvented by the individual acts of some persons, by collusion of two or more people, or by management override of a control. A design of a control system is also based upon certain assumptions about the likelihood of future events, and there can be no assurance that any design will succeed in achieving its stated goals under all potential future conditions; over time, controls may become inadequate because of changes in conditions, or the degree of compliance with the policies or procedures may deteriorate. Because of the inherent limitations in a cost-effective control system, misstatements due to error or fraud may occur and may not be detected.
Conclusions
Based upon the Controls Evaluation, the Company’s CEO and CFO have concluded that as of the end of the period covered by this report, CBIZ’s Disclosure Controls are effective at the reasonable assurance level described above.
There were no changes in the Company’s Internal Controls that occurred during the quarter ended December 31, 2016 that have materially affected, or are reasonably likely to materially affect, CBIZ’s Internal Controls.
Management’s Report on Internal Control Over Financial Reporting
The Company’s management is responsible for establishing and maintaining adequate internal control over financial reporting, as such term is defined in Rule 13a-15(f) and 15d-15(f) under the Exchange Act. Under the supervision of management, including the Company’s CEO and CFO, CBIZ conducted an evaluation of its internal control over financial reporting based on the framework provided in Internal Control — Integrated Framework (2013) issued by the Committee of Sponsoring Organizations of the Treadway Commission (the COSO Framework). Based on this evaluation, the Company’s management has concluded that CBIZ’s internal control over financial reporting was effective as of December 31, 2016.
CBIZ’s independent auditor, KPMG LLP, an independent registered public accounting firm, has issued an audit report on the effectiveness of CBIZ’s internal control over financial reporting which appears in Item 8 of this Annual Report.
None.
33
Item 10. Directors, Executive Officers and Corporate Governance.
Information with respect to this item not included below is incorporated by reference from CBIZ’s Definitive Proxy Statement for the 2017 Annual Stockholders’ Meeting to be filed with the SEC no later than 120 days after the end of CBIZ’s fiscal year.
CBIZ has adopted a Code of Professional Conduct and Ethics Guide that applies to its principal executive officer, principal financial officer, principal accounting officer or controller, or persons performing similar functions. CBIZ’s Code of Professional Conduct and Ethics Guide is available on the investor information page of CBIZ’s website, located at http://www.cbiz.com, and in print to any shareholder who requests them. Any waiver or amendment to the code will be posted on CBIZ’s website.
Executive Officers, Directors and Key Employees of the Registrant:
The following table sets forth certain information regarding the directors, executive officers and certain key employees of CBIZ. Each executive officer and director of CBIZ named in the following table has been elected to serve until his successor is duly appointed or elected or until his earlier removal or resignation from office. No arrangement or understanding exists between any executive officer of CBIZ and any other person pursuant to which he or she was selected as an officer.
|
Name |
|
Age |
|
Position(s) |
|
Executive Officers and Directors: |
|
|
|
|
|
Steven L. Gerard (1) |
|
71 |
|
Chairman |
|
Jerome P. Grisko, Jr. (1) |
|
55 |
|
President & Chief Executive Officer, Director |
|
Rick L. Burdick (1)(3) |
|
65 |
|
Lead Director and Vice Chairman |
|
Michael H. DeGroote (3) |
|
56 |
|
Director |
|
Joseph S. DiMartino (2)(3)(4) |
|
73 |
|
Director |
|
Gina D. France (3) |
|
58 |
|
Director |
|
Sherrill W. Hudson (2)(3) |
|
73 |
|
Director |
|
Todd J. Slotkin (2)(3)(4) |
|
63 |
|
Director |
|
Donald V. Weir (2)(3) |
|
75 |
|
Director |
|
Benaree Pratt Wiley (3)(4) |
|
70 |
|
Director |
|
Ware H. Grove |
|
66 |
|
Senior Vice President and Chief Financial Officer |
|
Chris Spurio |
|
51 |
|
President, Financial Services |
|
Michael P. Kouzelos |
|
48 |
|
President, Benefits and Insurance Services |
|
Richard E. Mills |
|
61 |
|
Chief Operating Officer, Financial Services |
|
Michael W. Gleespen |
|
58 |
|
Secretary and General Counsel |
|
Other Key Employees: |
|
|
|
|
|
John A. Fleischer |
|
55 |
|
Senior Vice President and Chief Information Officer |
|
Mark M. Waxman |
|
60 |
|
Senior Vice President and Chief Marketing Officer |
|
Teresa E. Bur |
|
52 |
|
Senior Vice President and Chief Human Resources Officer |
|
Bruce J. Kowalski |
|
56 |
|
Vice President, Tax |
|
Cynthia L. Sobe |
|
49 |
|
Treasurer |
|
Andrew K. Dambrosio |
|
59 |
|
Controller |
|
(1) |
Member of Executive Management Committee |
|
(2) |
Member of Audit Committee |
|
(3) |
Member of Nominating & Governance Committee |
|
(4) |
Member of Compensation Committee |
Steven L. Gerard was appointed Chief Executive Officer and Director of CBIZ in October 2000 and served as Chief Executive Officer until his retirement in March 2016. Mr. Gerard was elected by the Board to serve as its Chairman in October 2002, where he continues to serve as non-executive Chairman following his retirement as Chief Executive Officer. Mr. Gerard was Chairman and Chief Executive Officer of Great Point Capital, Inc., a provider of operational and advisory services from 1997 to October 2000. From 1991 to 1997, he was Chairman and Chief Executive Officer of Triangle Wire & Cable, Inc. and its successor Ocean View Capital, Inc. Mr. Gerard’s prior experience includes 16 years with Citibank, N.A. in various senior corporate finance and banking positions. Further, Mr. Gerard served seven years with the American Stock Exchange, where he last served as Vice President of the Securities Division. Mr. Gerard also serves on the Boards of Directors of Lennar Corporation, Joy Global, Inc. and Las Vegas Sands Corporation.
34
Jerome P. Grisko, Jr. was appointed to the CBIZ Board in November, 2015. Mr. Grisko was appointed Chief Executive Officer in March 2016, and has served as President since February 2000. He was Chief Operating Officer from February 2000 until his appointment as Chief Executive Officer. Mr. Grisko joined CBIZ as Vice President, Mergers & Acquisitions in September 1998 and was promoted to Senior Vice President, Mergers & Acquisitions and Legal Affairs in December of 1998. Prior to joining CBIZ, Mr. Grisko was associated with the law firm of Baker & Hostetler LLP, where he practiced from September 1987 until September 1998, serving as a partner of such firm from January 1995 to September 1998. While at Baker & Hostetler, Mr. Grisko concentrated his practice in the area of mergers, acquisitions and divestitures.
Rick L. Burdick has served as a Director of CBIZ since October 1997, when he was elected as an independent director. On May 17, 2007, Mr. Burdick was elected by the Board to be its Lead Director, a non-officer position. Previously, in October 2002, he was elected by the Board as Vice Chairman, a non-officer position. Mr. Burdick has been a partner at the law firm of Akin Gump Strauss Hauer & Feld LLP since April 1988. Mr. Burdick serves on the Board of Directors of AutoNation, Inc.
Michael H. DeGroote, son of CBIZ founder Michael G. DeGroote, was appointed a Director of CBIZ in November 2006. Mr. DeGroote currently serves as President of Westbury International, a full-service real estate development company, specializing in commercial/industrial land, residential development and property management. Prior to joining Westbury, Mr. DeGroote was Vice President of MGD Holdings and previously held a management position with Cooper Corporation, and previously served on the Board of Directors of Progressive Waste Solutions Ltd. He served on the Board of Governors of McMaster University in Hamilton, Ontario.
Joseph S. DiMartino has served as a Director of CBIZ since November 1997, when he was elected as an independent director. Mr. DiMartino has been Chairman of the Boards of the funds in The Dreyfus Family of Funds since January 1995. Mr. DiMartino served as President, Chief Operating Officer and Director of The Dreyfus Corporation from October 1982 until December 1994 and also served as a director of Mellon Bank Corporation. Mr. DiMartino served on the Boards of SunAir Services Corp., LEVCOR International, Inc., The Newark Group and the Muscular Dystrophy Association.
Gina D. France was appointed to the CBIZ Board in February, 2015. Ms. France founded France Strategic Partners, LLC, a strategy and transaction advisory firm, and has served as its President and Chief Executive Officer since 2003. Ms. France has over 30 years of experience in strategy, investment banking and corporate finance. Prior to founding France Strategic Partners, Ms. France was a Managing Director with Ernst & Young, LLP and directed the Firm’s Center for Strategic Transactions. Prior to her work with Ernst & Young, Ms. France was a Senior Vice President with Lehman Brothers, Inc. Ms. France serves on the boards of Huntington Bancshares, Inc. and Cedar Fair, L.P. and has previously served on the boards of FirstMerit Corporation, Dawn Food Products, Inc. and Mack Industries.
Sherrill W. Hudson was appointed to the CBIZ Board in February, 2015. Until July 2016, upon the sale of the Company, Mr. Hudson was Chairman of the Board of TECO Energy, Inc. and was a member of its board since January 2003. He was executive chairman from August 2010 to December 2012, after having served as Chairman and Chief Executive Officer since July 2004. Mr. Hudson also serves on the boards of Lennar Corporation and United Insurance Holdings Corporation. He served on the Publix Super Markets, Inc. board from January 2003 until April 2015. Mr. Hudson is also Chairman of the Florida Chapter of the National Association of Corporate Directors. Mr. Hudson retired from Deloitte & Touche, LLP in August 2002, after 37 years of service.
Todd J. Slotkin has served as a Director of CBIZ since September 2003, when he was elected as an independent director. Mr. Slotkin has served as the Global Business Head of Alvarez & Marsal’s Asset Management Services. Mr. Slotkin is also an independent director of the Apollo Closed End Fund Complex (Apollo Floating Rate Fund, Apollo Tactical Income Fund). In 2011, Mr. Slotkin was appointed the Managing Partner of Newton Pointe LLC, an advisory firm, a position he also held during the period 2007-2008. Mr. Slotkin served on the Board of Martha Stewart Living Omnimedia from 2008 to 2012, and was head of its Audit Committee and Special Committee. Between 2008 and 2010, Mr. Slotkin was a Senior Managing Director of Irving Place Capital. From 2006 to 2007 Mr. Slotkin served as a Managing Director of Natixis Capital Markets. From 1992 to 2006, Mr. Slotkin served as a SVP (1992-1998) and EVP and Chief Financial Officer (1998-2006) of MacAndrews & Forbes Holdings Inc. Additionally, he was the Executive Vice President and Chief Financial Officer of publicly owned M&F Worldwide (1998-2006). Prior to 1992, Mr. Slotkin spent 17 years with Citigroup, ultimately serving as Senior Managing Director and Senior Credit Officer. He was the Global Head of Citigroup’s Leveraged Capital Group. Mr. Slotkin is a co-founder of the Food Allergy Research & Education, Inc., formerly known as the Food Allergy Initiative.
Donald V. Weir has served as a Director of CBIZ since September 2003, when he was elected as an independent director. Mr. Weir is Vice President of Private Equity for Sanders Morris Harris Group Inc. (“SMHG”) and has been with SMHG for the past fourteen years. Prior to this Mr. Weir was Chief Financial Officer and director of publicly-held Deeptech International Inc. and two of its subsidiaries, Tatham Offshore, Inc. and Leviathan Gas Pipeline Company, both of which were publicly-held companies. Prior to his employment with Deeptech, Mr. Weir worked for eight years with Sugar Bowl Gas Corporation, as Controller and Treasurer and later in a consulting capacity. Mr. Weir was associated with Price Waterhouse, an international accounting firm, from 1966 to 1979.
35
Benaree Pratt Wiley has served as a Director of CBIZ since May 2008, when she was elected as an independent director. Ms. Wiley is a Principal of The Wiley Group, a firm specializing in personnel strategy, talent management, and leadership development primarily for global insurance and consulting firms. Ms. Wiley served as the President and Chief Executive Officer of The Partnership, Inc., a talent management organization for multicultural professionals in the greater Boston region for fifteen years before retiring in 2005. Ms. Wiley is currently a director on the boards of The Dreyfus Family of Funds and Blue Cross and Blue Shield of Massachusetts. Her civic activities include serving on the boards of the Efficacy Institute, Howard University and Dress for Success Boston.
Ware H. Grove has served as Senior Vice President and Chief Financial Officer of CBIZ since December 2000. Before joining CBIZ, Mr. Grove served as Senior Vice President and Chief Financial Officer of Bridgestreet Accommodations, Inc., which he joined in early 2000 to restructure financing, develop strategic operating alternatives, and assist with merger negotiations. Prior to joining Bridgestreet, Mr. Grove served for three years as Vice President and Chief Financial Officer of LESCO, Inc. Since beginning his career in corporate finance in 1972, Mr. Grove has held various financial positions with large companies representing a variety of industries, including Revco D.S., Inc., Computerland/Vanstar, Manville Corporation, The Upjohn Company, and First of America Bank. Mr. Grove served on the Board of Directors for Applica, Inc. (NYSE: APN) from September 2004 through January 2007, at which time the company was sold to a private equity firm.
Chris Spurio was appointed Senior Vice President of CBIZ and President of CBIZ’s Financial Services practice group, effective January 1, 2014. Mr. Spurio joined CBIZ in January 1998 and served as Corporate Controller until July 1999. He then served as Vice President of Finance from July 1999 until September 2008. Mr. Spurio served as Executive Managing Director of the Financial Services Group’s Midwest Region from September 2008 through March 2010, and as the Group’s Chief Operating Officer from March 2010 through December 2013. Mr. Spurio was associated with KPMG LLP, an international accounting firm, from July 1988 to January 1998. Mr. Spurio is a CPA, CGMA and a member of the American Institute of Certified Public Accountants and the Ohio Society of Certified Public Accountants.
Michael P. Kouzelos joined CBIZ in June 1998 and has held several positions in the Company. He was appointed President of the Benefits & Insurance practice group in May 2015, and was appointed Senior Vice President of Strategic Initiatives in September 2005. Mr. Kouzelos also served as the Chief Operating Officer of the Benefits & Insurance division between April 2007 and May 2015, as Vice President of Strategic Initiatives from April 2001 through August 2005, as Vice President of Shared Services from August 2000 to March 2001, and as Director of Business Integration from June 1998 to July 2000. Mr. Kouzelos was associated with KPMG LLP, an international accounting firm, from 1990 to September 1996 and received his Master of Business Administration degree from The Ohio State University in May of 1998.
Richard E. Mills has served as the Chief Operating Officer of CBIZ’s Financial Services practice group since January 2014. Prior to this appointment, Mr. Mills was President of CBIZ MHM, LLC — Kansas City, and responsible for offices in St. Louis, Topeka, Wichita and Tulsa. His responsibilities at a corporate level include business development, marketing, strategic planning, national training and organizational efficiency. Mr. Mills has also served as the Kansas City and Midwest Regional Attest Leader, and for many years consulted with clients on a variety of topics, including acquisitions, strategic planning, succession planning and improving profitability. His clients included not-for-profit organizations, construction companies, manufacturing and distribution companies. Mr. Mills began his career with Mayer Hoffman McCann in 1978.
Michael W. Gleespen has served as Corporate Secretary since April 2001 and General Counsel since June 2001. Mr. Gleespen is an attorney and has served as CBIZ’s Vice President of Regulatory Compliance and Accountancy Compliance Officer and Technical Director since February 1998. Prior to joining CBIZ, Mr. Gleespen was an Assistant Ohio Attorney General in the Business & Government Regulation Section and the Court of Claims Defense Section from 1988 until 1998, during which time he was counsel to the Ohio Accountancy Board, the Ohio State Teachers Retirement System and represented many other state departments and agencies. Mr. Gleespen also held the post of Associate Attorney General for Pension, Disability and Annuity Plans and was the Co-Chairman of the Public Pension Plan Working Group.
Other Key Employees:
John A. Fleischer has served as Senior Vice President and Chief Information Officer of CBIZ since August 2014. Prior to joining CBIZ, Mr. Fleischer held CIO roles at TTT Holdings (a Talisman Capital Partners company), Ferro Corporation, The Goodyear Tire & Rubber Company and T-Systems. He began his career in the United States Army and served in numerous senior leadership roles, which included directing large-scale systems development and integration projects in communications and computing.
Mark M. Waxman has served as Chief Marketing Officer since 2001. Mr. Waxman has over thirty years of experience in marketing and branding. Prior to joining CBIZ, he was Chief Executive Officer/Creative Director of one of Silicon Valley’s most well-known advertising agencies, Carter Waxman. He was also a founding partner of SK Consulting (acquired by CBIZ in 1998) providing strategic marketing and branding services to a wide range of companies and industries. Mr. Waxman has been a featured marketing columnist and
36
contributor to many business and trade publications, and currently serves on the Advisory Board of several Silicon Valley start-ups. He currently serves on the Board of Trustees of Silicon Valley Creates and the West Valley Mission Foundation, and has served as the Chairman of the Board for the Silicon Valley Chamber of Commerce, Artsopolis.com, and The San Jose Repertory Theatre.
Teresa E. Bur has been responsible for the Human Resources function at CBIZ since 1999 when she was appointed Vice President of Human Resources. Her role was elevated in 2006 when she was appointed Senior Vice President and again in 2014 when she was appointed Chief Human Resources Officer. From 1995 to 1999 Ms. Bur served as Director of Human Resources for Robert D. O’Byrne & Associates, Inc. and The Grant Nelson Group, Inc., subsidiaries of CBIZ now known as CBIZ Benefits and Insurance Services, Inc. Ms. Bur served as an Executive Board member of CBIZ Women’s Advantage from 2006-2014 where she chaired the Professional Development committee. Ms. Bur has over 25 years of experience in human resources, is an active member of the Society of Human Resources Management, and is certified as a SPHR and SHRM — SCP.
Bruce J. Kowalski joined CBIZ in December 2003 as Corporate Tax Manager and was appointed Vice President — Tax in April 2008. Mr. Kowalski has more than thirty years of corporate tax experience, beginning his career in 1982 with Price Waterhouse and holding various corporate tax positions with The Scott Fetzer Company and UCAR Carbon Company Inc. Mr. Kowalski is a CPA (inactive) and received his Masters of Taxation degree from the University of Akron.
Cynthia L. Sobe joined CBIZ in August 2016 as Treasurer. Prior to joining CBIZ, Ms. Sobe served as Vice President, Corporate Treasurer for Crowne Group, LLC from November 2014 through January 2016. Prior to joining Crowne Group, LLC, Ms. Sobe was Vice President, Chief Financial Officer of AMRESCO, LLC (a division of VWR) from October 2012 to October 2014. Prior to joining AMRESCO, LLC, Ms. Sobe held various financial and accounting positions with companies representing a variety of industries, including Associated Materials, LLC, Jo-Ann Stores, LLC, Revco D.S., Inc., and Ernst & Young, LLP. Ms. Sobe is a CPA (inactive), and she received a Master of Business Administration from Case Western Reserve University in May 2000. Ms. Sobe is a member of the American Institute of Certified Public Accountants and the Association for Financial Professionals.
Andrew K. Dambrosio joined CBIZ in September 2012 as Controller. Prior to joining CBIZ, Mr. Dambrosio served as Controller and Executive Director of Financial Planning and Analysis for American Greetings Corporation’s North American Greeting Card Division from January 2004 through February 2012. Prior to joining American Greetings Corporation, Mr. Dambrosio was Corporate Controller for LESCO, Inc. from December 2000 through January 2004. Since beginning his career in 1979, Mr. Dambrosio has held various financial and accounting positions with companies representing a variety of industries, including American Greetings.COM, Picker International, Inc., Medusa Corporation and NACCO Industries, Inc. Mr. Dambrosio is a CPA and a member of the American Institute of Certified Public Accountants and the Ohio Society of Certified Public Accountants.
Item 11. Executive Compensation.
Information with respect to this item is incorporated by reference from CBIZ’s Definitive Proxy Statement for the 2017 Annual Stockholders’ Meeting to be filed with the SEC no later than 120 days after the end of CBIZ’s fiscal year.
Item 12. Security Ownership of Certain Beneficial Owners and Management and Related Stockholder Matters.
Information with respect to this item is incorporated by reference from CBIZ’s Definitive Proxy Statement for the 2017 Annual Stockholders’ Meeting to be filed with the SEC no later than 120 days after the end of CBIZ’s fiscal year.
Item 13. Certain Relationships and Related Transactions, and Director Independence.
Information with respect to this item is incorporated by reference from CBIZ’s Definitive Proxy Statement for the 2017 Annual Stockholders’ Meeting to be filed with the SEC no later than 120 days after the end of CBIZ’s fiscal year.
Item 14. Principal Accounting Fees and Services.
Information with respect to this item is incorporated by reference from CBIZ’s Definitive Proxy Statement for the 2017 Annual Stockholders’ Meeting to be filed with the SEC no later than 120 days after the end of CBIZ’s fiscal year.
37
(a) The following documents are filed as part of this Annual Report or incorporated by reference:
1. Financial Statements.
As to financial statements and supplementary information, reference is made to “Index to Financial Statements” on page F-1 of this Annual Report.
2. Exhibits.
The following documents are filed as exhibits to this Form 10-K pursuant to Item 601 of Regulation S-K. Since its incorporation, CBIZ has operated under various names including: Republic Environmental Systems, Inc.; International Alliance Services, Inc.; Century Business Services, Inc.; and CBIZ, Inc. Exhibits listed below refer to these names collectively as “the Company”.
|
Exhibit No. |
|
Description |
|
|
|
|
|
2.1 |
|
Purchase Agreement, dated November 24, 2008, among CBIZ, Inc., CBIZ Accounting Tax & Advisory of New York, LLC, Mahoney Cohen & Company, CPA, P.C., Mahoney Cohen Consulting Corp., Mahoney Cohen Family Office Services LLC and the members of Mahoney Cohen Family Office Services LLC (filed as Exhibit 2.1 to the Company’s Report on Form 8-K, File No. 001-32961, dated November 25, 2008, and incorporated herein by reference). |
|
|
|
|
|
2.2 |
|
Stock Purchase Agreement dated July 26, 2013, among CBIZ Operations, Inc. and Zotec Partners, LLC (filed as Exhibit 2.1 to the Company’s Report on Form 8-K, File No. 001-32961, dated August 1, 2013, and incorporated herein by reference). |
|
|
|
|
|
3.1 |
|
Amended and Restated Certificate of Incorporation of the Company (filed as Exhibit 3.1 to the Company’s Registration Statement on Form 10, File No. 0-25890, and incorporated herein by reference). |
|
|
|
|
|
3.2 |
|
Certificate of Amendment of the Certificate of Incorporation of the Company dated October 17, 1996 (filed as Exhibit 3.2 to the Company’s Annual Report on Form 10-K for the year ended December 31, 1996, File No. 000-25890, dated March 31, 1997, and incorporated herein by reference). |
|
|
|
|
|
3.3 |
|
Certificate of Amendment to the Certificate of Incorporation of the Company effective December 23, 1997 (filed as Exhibit 3.3 to the Company’s Annual Report on Form 10-K for the year ended December 31, 1997, File No. 000-25890, dated February 18, 1998, and incorporated herein by reference). |
|
|
|
|
|
3.4 |
|
Certificate of Amendment of the Certificate of Incorporation of the Company dated September 10, 1998 (filed as Exhibit 3.4 to the Company’s Annual Report on Form 10-K for the year ended December 31, 1998, File No. 000-25890, dated March 4, 1999, and incorporated herein by reference). |
|
|
|
|
|
3.5 |
|
Certificate of Amendment of the Certificate of Incorporation of the Company, effective August 1, 2005 (filed as Exhibit 3.5 to the Company’s Annual Report on Form 10-K for the year ended December 31, 2005, File No. 000-25890, dated March 16, 2006, and incorporated herein by reference). |
|
|
|
|
|
3.6 |
|
Amended and Restated Bylaws of the Company (filed as Exhibit 3.2 to the Company’s Registration Statement on Form 10, File No. 000-25890, and incorporated herein by reference). |
|
|
|
|
|
3.7 |
|
Amendment to Amended and Restated Bylaws of the Company dated November 1, 2007 (filed as Exhibit 3.1 to the Company’s Report on Form 8-K, File No. 001-32961, dated November 1, 2007, and incorporated herein by reference). |
|
|
|
|
|
4.1 |
|
Form of Stock Certificate of Common Stock of the Company (filed as Exhibit 4.1 to the Company’s Annual Report Form 10-K for the year ended December 31, 1998, File No. 000-25890, dated March 4, 1999, and incorporated herein by reference). |
|
|
|
|
|
4.2 |
|
Employee Stock Investment Plan (filed as Exhibit 4.4 to the Company’s Report on Form S-8, File No. 000-333-62148, dated June 1, 2001, and incorporated herein by reference). |
|
|
|
|
|
4.3 |
|
Indenture, dated as of May 30, 2006, between CBIZ, Inc. and U.S. Bank National Association as Trustee (filed as Exhibit 4.1 to the Company’s Report on Form 8-K, File No. 000-25890, dated May 30, 2006, and incorporated herein by reference). |
38
|
Exhibit No. |
|
Description |
|
|
|
|
|
4.4 |
|
Registration Rights Agreement, dated as of May 30, 2006, between CBIZ, Inc. and Banc of America Securities, LLC (filed as Exhibit 4.2 to the Company’s Report on Form 8-K, File No. 000-25890, dated May 30, 2006, and incorporated herein by reference). |
|
|
|
|
|
4.5 |
|
Indenture, dated as of September 27, 2010, between CBIZ, Inc. and U.S. Bank National Association as Trustee (filed as Exhibit 4.1 to the Company’s Report on Form 8-K, File No. 0001-32961, dated September 27, 2010, and incorporated herein by reference). |
|
|
|
|
|
10.1 † |
|
2002 Stock Incentive Plan (filed as Appendix A to the Company’s Proxy Statement for the 2002 Annual Meeting of Stockholders, File No. 000-25890, dated April 1, 2002, and incorporated herein by reference). |
|
|
|
|
|
10.2 † |
|
Severance Protection Agreement by and between the Company and Jerome P. Grisko, Jr. (filed as Exhibit 10.11 to the Company’s Annual Report on Form 10-K for the year ended December 31, 2000, File No. 000-25890, dated April 2, 2001, and incorporated herein by reference). |
|
|
|
|
|
10.3 † |
|
Employment Agreement by and between the Company and Ware H. Grove (filed as Exhibit 10.14 to the Company’s Annual Report on Form 10-K for the year ended December 31, 2000, File No. 000-25890, dated April 2, 2001, and incorporated herein by reference). |
|
|
|
|
|
10.4 † |
|
First Amended and Restated Employment Agreement by and between the Company and Steven L. Gerard dated March 22, 2007 (filed as Exhibit 99.1 to the Company’s Report on Form 8-K, File No. 001-32961, dated March 23, 2007, and incorporated herein by reference). |
|
|
|
|
|
10.5 † |
|
Employment Agreement by and between the Company and David J. Sibits, dated April 17, 2007 (filed as Exhibit 10.8 to the Company’s Annual Report on Form 10-K for the year ended December 31, 2007, File No. 001-32961, dated March 17, 2008, and incorporated herein by reference). |
|
|
|
|
|
10.6 |
|
Stock and Option Purchase Agreement dated September 14, 2010, by and among Westbury (Bermuda) Ltd., Westbury Trust, Michael G. DeGroote, and CBIZ, Inc. (filed as Exhibit 10.1 to the Company’s Report on Form 8-K, File No. 001-32961, dated September 17, 2010, and incorporated herein by reference). |
|
|
|
|
|
10.7 |
|
Purchase Agreement, dated as of September 21, 2010, between CBIZ, Inc. and Merrill Lynch, Pierce, Fenner & Smith Incorporated, as representative of the initial purchasers named in Schedule A thereto (filed as Exhibit 10.1 to the Company’s Report on Form 8-K, File No. 001-32961, dated September 27, 2010, and incorporated herein by reference). |
|
|
|
|
|
10.8 † |
|
Amended Employment Agreement by and between the Company and Ware H. Grove, dated November 22, 2010 (filed as Exhibit 99.1 to the Company’s Report on Form 8-K, File No. 001-32961, dated November 24, 2010, and incorporated herein by reference). |
|
|
|
|
|
10.9 † |
|
CBIZ, Inc. 2002 Amended and Restated Stock Incentive Plan (Amended and Restated as of May 12, 2011), (filed as Exhibit 10.1 to the Company’s Report on Form 10-Q, File No. 001-32961, dated August 9, 2011, and incorporated herein by reference). |
|
|
|
|
|
10.10 |
|
Stock Purchase Agreement, dated July 26, 2013, among CBIZ, Inc., Westbury (Bermuda) Ltd., Westbury Trust, and Michael G. DeGroote (filed as Exhibit 10.1 to the Company’s Report on Form 8-K, File No. 001-32961, dated August 1, 2013, and incorporated herein by reference). |
|
|
|
|
|
10.11 † |
|
2014 Stock Incentive Plan and 2002 Amended and Restated Stock Incentive Plan (filed as Exhibit 4.2 to Form S-8, dated July 7, 2014, and incorporated herein by reference). |
|
|
|
|
|
10.12 |
|
Credit Agreement, dated as of July 28, 2014, by and among CBIZ, Inc., Bank of America, N.A., as administrative agent, and other participating financial institutions (filed as Exhibit 10.1 to the Company’s Report on Form 8-K, File No. 001-32961, dated August 1, 2014, and incorporated herein by reference). |
|
|
|
|
|
10.13 |
|
First Amendment to Credit Agreement by and among CBIZ Operations, Inc., CBIZ, Inc., and Bank of America, N.A., as agent, lender, issuing bank, and the other financial institutions from time to time party to the Credit Agreement. (filed as Exhibit 10.1 to the Company’s Report on Form 8-K, File No. 001-32961, dated April 10, 2015 and incorporated herein by reference). |
|
|
|
|
|
10.14 |
|
Second Amendment to Credit Agreement by and among CBIZ Operations, Inc., CBIZ, Inc., and Bank of America, N.A., as agent, lender, issuing bank, swing line issuing bank and the other financial institutions from time to time party to the Credit Agreement. (filed as Exhibit 10.1 to the Company’s Report on Form 10-Q, File No. 001-32961, dated November 3, 2015 and incorporated herein by reference). |
39
|
Exhibit No. |
|
Description |
|
|
|
|
|
10.15 † |
|
Consulting Agreement by and between the Company and Steven L. Gerard, dated March 9, 2016 (filed as Exhibit 10.1 to the Company’s Report on Form 10-Q, File No. 001-32961, dated March 3, 2016, and incorporated herein by reference). |
|
|
|
|
|
10.16 † |
|
Employment Agreement by and between the Company and Jerome P. Grisko, Jr., dated September 1, 2016 (filed as Exhibit 10.1 to the Company’s Report on Form 8-K, File No. 001-32961, dated September 8, 2016, and incorporated herein by reference). |
|
|
|
|
|
21.1* |
|
List of Subsidiaries of CBIZ, Inc. |
|
|
|
|
|
23* |
|
Consent of KPMG LLP |
|
|
|
|
|
24* |
|
Powers of attorney (included on the signature page hereto). |
|
|
|
|
|
31.1* |
|
Certification of Chief Executive Officer Pursuant to Section 302 of the Sarbanes-Oxley Act of 2002 |
|
|
|
|
|
31.2* |
|
Certification of Chief Financial Officer Pursuant to Section 302 of the Sarbanes-Oxley Act of 2002 |
|
|
|
|
|
32.1** |
|
Certification of Chief Executive Officer Pursuant to Section 906 of the Sarbanes-Oxley Act of 2002 |
|
|
|
|
|
32.2** |
|
Certification of Chief Financial Officer Pursuant to Section 906 of the Sarbanes-Oxley Act of 2002 |
|
|
|
|
|
101* |
|
The following materials from CBIZ, Inc.’s Annual Report on Form 10-K for the year ended December 31, 2016, formatted in XBRL (eXtensible Business Reporting Language); (i) Consolidated Statements of Comprehensive Income for the years ended December 31, 2016, 2015 and 2014, (ii) Consolidated Balance Sheets at December 31, 2016 and 2015, (iii) Consolidated Statements of Cash Flows for the years ended December 31, 2016, 2015 and 2014, (iv) Consolidated Statements of Stockholders’ Equity for the years ended December 31, 2016, 2015 and 2014, and (v) Notes to the Consolidated Financial Statements. |
|
* |
Indicates documents filed herewith. |
|
** |
Indicates documents furnished herewith. |
|
† |
Management contract or compensatory plan contract or arrangement filed pursuant to Item 601 of Regulation S-K. |
40
Pursuant to the requirements of Section 13 or 15(d) of the Securities Exchange Act of 1934, the registrant has duly caused this Annual Report to be signed on its behalf by the undersigned, thereunto duly authorized.
|
CBIZ, INC. |
||
|
(REGISTRANT) |
||
|
|
|
|
|
By |
|
/s/ WARE H. GROVE |
|
|
|
Ware H. Grove |
|
|
|
Chief Financial Officer |
|
|
|
March 9, 2017 |
KNOW ALL MEN AND WOMEN BY THESE PRESENTS that each person whose signature appears below on this Annual Report hereby constitutes and appoints Jerome P. Grisko, Jr. and Ware H. Grove, and each of them, with full power to act without the other, his true and lawful attorney-in-fact and agent, with full power of substitution for him and her and his and her name, place and stead, in all capacities (until revoked in writing), to sign any and all amendments to this Annual Report of CBIZ, Inc. and to file the same, with all exhibits thereto, and other documents in connection therewith, with the Securities and Exchange Commission, granting unto each attorney-in-fact and agent, full power and authority to do and perform each and every act and thing requisite and necessary fully to all intents and purposes as he might or could do in person, thereby ratifying and confirming all that each attorney-in-fact and agent, or their or his substitute or substitutes, may lawfully do or cause to be done by virtue hereof.
Pursuant to the requirements of the Securities Exchange Act of 1934, this Annual Report has been signed below by the following persons on behalf of the registrant and in the capacities and on the date indicated above.
|
Signature |
|
Title |
|
Date |
|
|
|
|
||
|
/s/ JEROME P. GRISKO, JR. |
President & Chief Executive Officer, Director (Principal Executive Officer) |
|
March 9, 2017 |
|
|
Jerome P. Grisko, Jr. |
||||
|
|
|
|
||
|
/s/ WARE H. GROVE |
|
Chief Financial Officer (Principal Financial and Accounting Officer) |
|
March 9, 2017 |
|
Ware H. Grove |
|
|
||
|
|
|
|
||
|
/s/ STEVEN L. GERARD |
|
Chairman |
|
March 9, 2017 |
|
Steven L. Gerard |
|
|
||
|
|
|
|
||
|
/s/ RICK L. BURDICK |
|
Lead Director |
|
March 9, 2017 |
|
Rick L. Burdick |
|
|
||
|
|
|
|
||
|
/s/ MICHAEL H. DE GROOTE |
|
Director |
|
March 9, 2017 |
|
Michael H. DeGroote |
|
|
||
|
|
|
|
||
|
/s/ JOSEPH S. DI MARTINO |
|
Director |
|
March 9, 2017 |
|
Joseph S. DiMartino |
|
|
||
|
|
|
|
||
|
/s/ GINA D. FRANCE |
|
Director |
|
March 9, 2017 |
|
Gina D. France |
|
|
||
|
|
|
|
|
|
|
/s/ SHERRILL W. HUDSON |
|
Director |
|
March 9, 2017 |
|
Sherrill W. Hudson |
|
|
||
|
|
|
|
|
|
|
/s/ TODD J. SLOTKIN |
|
Director |
|
March 9, 2017 |
|
Todd J. Slotkin |
|
|
||
|
|
|
|
|
|
|
/s/ DONALD V. WEIR |
|
Director |
|
March 9, 2017 |
|
Donald V. Weir |
|
|
||
|
|
|
|
|
|
|
/s/ BENAREE PRATT WILEY |
|
Director |
|
March 9, 2017 |
|
Benaree Pratt Wiley |
|
|
||
41
INDEX TO FINANCIAL STATEMENTS
F-1
Report of Independent Registered Public Accounting Firm
The Board of Directors and Stockholders
CBIZ, Inc.:
We have audited CBIZ, Inc.’s (the Company) internal control over financial reporting as of December 31, 2016, based on criteria established in Internal Control – Integrated Framework (2013) issued by the Committee of Sponsoring Organizations of the Treadway Commission (COSO). The Company’s management is responsible for maintaining effective internal control over financial reporting and for its assessment of the effectiveness of internal control over financial reporting, included in the accompanying Management’s Report on Internal Control Over Financial Reporting included in Item 9A. Our responsibility is to express an opinion on the Company’s internal control over financial reporting based on our audit.
We conducted our audit in accordance with the standards of the Public Company Accounting Oversight Board (United States). Those standards require that we plan and perform the audit to obtain reasonable assurance about whether effective internal control over financial reporting was maintained in all material respects. Our audit included obtaining an understanding of internal control over financial reporting, assessing the risk that a material weakness exists, and testing and evaluating the design and operating effectiveness of internal control based on the assessed risk. Our audit also included performing such other procedures as we considered necessary in the circumstances. We believe that our audit provides a reasonable basis for our opinion.
A company’s internal control over financial reporting is a process designed to provide reasonable assurance regarding the reliability of financial reporting and the preparation of financial statements for external purposes in accordance with generally accepted accounting principles. A company’s internal control over financial reporting includes those policies and procedures that (1) pertain to the maintenance of records that, in reasonable detail, accurately and fairly reflect the transactions and dispositions of the assets of the company; (2) provide reasonable assurance that transactions are recorded as necessary to permit preparation of financial statements in accordance with generally accepted accounting principles, and that receipts and expenditures of the company are being made only in accordance with authorizations of management and directors of the company; and (3) provide reasonable assurance regarding prevention or timely detection of unauthorized acquisition, use, or disposition of the company’s assets that could have a material effect on the financial statements.
Because of its inherent limitations, internal control over financial reporting may not prevent or detect misstatements. Also, projections of any evaluation of effectiveness to future periods are subject to the risk that controls may become inadequate because of changes in conditions, or that the degree of compliance with the policies or procedures may deteriorate.
In our opinion, the Company maintained, in all material respects, effective internal control over financial reporting as of December 31, 2016, based on criteria established in Internal Control – Integrated Framework (2013) issued by the Committee of Sponsoring Organizations of the Treadway Commission (COSO)”).
We also have audited, in accordance with the standards of the Public Company Accounting Oversight Board (United States), the consolidated balance sheets of the Company and subsidiaries as of December 31, 2016 and 2015, and the related consolidated statements of comprehensive income, stockholders’ equity, and cash flows for each of the years in the three-year period ended December 31, 2016, and our report dated March 9, 2017 expressed an unqualified opinion on those consolidated financial statements.
/s/ KPMG LLP
Cleveland, Ohio
March 9, 2017
F-2
Report of Independent Registered Public Accounting Firm
The Board of Directors and Stockholders
CBIZ, Inc.:
We have audited the accompanying consolidated balance sheets of CBIZ, Inc. and subsidiaries (the Company) as of December 31, 2016 and 2015, and the related consolidated statements of comprehensive income, stockholders’ equity, and cash flows for each of the years in the three‑year period ended December 31, 2016. These consolidated financial statements are the responsibility of the Company’s management. Our responsibility is to express an opinion on these consolidated financial statements based on our audits.
We conducted our audits in accordance with the standards of the Public Company Accounting Oversight Board (United States). Those standards require that we plan and perform the audit to obtain reasonable assurance about whether the financial statements are free of material misstatement. An audit includes examining, on a test basis, evidence supporting the amounts and disclosures in the financial statements. An audit also includes assessing the accounting principles used and significant estimates made by management, as well as evaluating the overall financial statement presentation. We believe that our audits provide a reasonable basis for our opinion.
In our opinion, the consolidated financial statements referred to above present fairly, in all material respects, the financial position of the Company as of December 31, 2016 and 2015, and the results of its operations and its cash flows for each of the years in the three‑year period ended December 31, 2016, in conformity with U.S. generally accepted accounting principles.
We also have audited, in accordance with the standards of the Public Company Accounting Oversight Board (United States), the Company’s internal control over financial reporting as of December 31, 2016, based on criteria established in Internal Control – Integrated Framework (2013) issued by the Committee of Sponsoring Organizations of the Treadway Commission (COSO), and our report dated March 9, 2017 expressed an unqualified opinion on the effectiveness of the Company’s internal control over financial reporting.
/s/ KPMG LLP
Cleveland, Ohio
March 9, 2017
F-3
DECEMBER 31, 2016 AND 2015
(In thousands, except per share data)
|
|
|
2016 |
|
|
2015 |
|
||
|
ASSETS |
|
|
|
|
|
|
|
|
|
Current assets: |
|
|
|
|
|
|
|
|
|
Cash and cash equivalents |
|
$ |
3,494 |
|
|
$ |
850 |
|
|
Restricted cash |
|
|
27,880 |
|
|
|
24,860 |
|
|
Accounts receivable, net |
|
|
175,354 |
|
|
|
153,608 |
|
|
Income taxes refundable |
|
|
— |
|
|
|
966 |
|
|
Deferred income taxes, net |
|
|
— |
|
|
|
4,796 |
|
|
Other current assets |
|
|
21,407 |
|
|
|
15,903 |
|
|
Current assets before funds held for clients |
|
|
228,135 |
|
|
|
200,983 |
|
|
Funds held for clients |
|
|
213,457 |
|
|
|
171,497 |
|
|
Total current assets |
|
|
441,592 |
|
|
|
372,480 |
|
|
Non-current assets: |
|
|
|
|
|
|
|
|
|
Property and equipment, net |
|
|
19,450 |
|
|
|
20,162 |
|
|
Goodwill and other intangible assets, net |
|
|
584,401 |
|
|
|
535,653 |
|
|
Assets of deferred compensation plan |
|
|
69,912 |
|
|
|
64,245 |
|
|
Notes receivable |
|
|
1,227 |
|
|
|
1,760 |
|
|
Other non-current assets |
|
|
2,006 |
|
|
|
2,031 |
|
|
Total non-current assets |
|
|
676,996 |
|
|
|
623,851 |
|
|
Total assets |
|
$ |
1,118,588 |
|
|
$ |
996,331 |
|
|
LIABILITIES |
|
|
|
|
|
|
|
|
|
Current liabilities: |
|
|
|
|
|
|
|
|
|
Accounts payable |
|
$ |
45,772 |
|
|
$ |
35,555 |
|
|
Income taxes payable |
|
|
1,048 |
|
|
|
— |
|
|
Accrued personnel costs |
|
|
45,221 |
|
|
|
39,611 |
|
|
Notes payable |
|
|
1,060 |
|
|
|
— |
|
|
Contingent purchase price liability |
|
|
16,322 |
|
|
|
12,855 |
|
|
Other current liabilities |
|
|
16,169 |
|
|
|
11,714 |
|
|
Current liabilities before client fund obligations |
|
|
125,592 |
|
|
|
99,735 |
|
|
Client fund obligations |
|
|
213,855 |
|
|
|
171,318 |
|
|
Total current liabilities |
|
|
339,447 |
|
|
|
271,053 |
|
|
Non-current liabilities: |
|
|
|
|
|
|
|
|
|
Convertible notes, net |
|
|
— |
|
|
|
750 |
|
|
Bank debt (1) |
|
|
191,400 |
|
|
|
205,800 |
|
|
Debt issuance costs (1) |
|
|
(1,351 |
) |
|
|
(1,869 |
) |
|
Total long-term debt |
|
|
190,049 |
|
|
|
204,681 |
|
|
Notes payable |
|
|
1,721 |
|
|
|
— |
|
|
Income taxes payable |
|
|
4,426 |
|
|
|
4,084 |
|
|
Deferred income taxes, net (1) |
|
|
3,545 |
|
|
|
4,902 |
|
|
Deferred compensation plan obligations |
|
|
69,912 |
|
|
|
64,245 |
|
|
Contingent purchase price liability |
|
|
17,387 |
|
|
|
11,962 |
|
|
Other non-current liabilities |
|
|
12,080 |
|
|
|
7,456 |
|
|
Total non-current liabilities |
|
|
299,120 |
|
|
|
297,330 |
|
|
Total liabilities |
|
|
638,567 |
|
|
|
568,383 |
|
|
STOCKHOLDERS’ EQUITY |
|
|
|
|
|
|
|
|
|
Common stock, par value $0.01 per share; shares authorized 250,000; shares issued 128,191 and 126,182; shares outstanding 54,044 and 52,954 |
|
|
1,282 |
|
|
|
1,262 |
|
|
Additional paid-in capital |
|
|
655,629 |
|
|
|
634,626 |
|
|
Retained earnings |
|
|
294,925 |
|
|
|
254,860 |
|
|
Treasury stock, 74,147 and 73,228 shares |
|
|
(471,311 |
) |
|
|
(462,167 |
) |
|
Accumulated other comprehensive loss |
|
|
(504 |
) |
|
|
(633 |
) |
|
Total stockholders’ equity |
|
|
480,021 |
|
|
|
427,948 |
|
|
Total liabilities and stockholders’ equity |
|
$ |
1,118,588 |
|
|
$ |
996,331 |
|
|
(1) |
See Note 1, Organization and Summary of Significant Accounting Policies, to the accompanying consolidated financial statements for discussion of our adoption of ASU 2015-03, ASU 2015-15 and ASU 2015-17. |
See the accompanying notes to the consolidated financial statements
F-4
CONSOLIDATED STATEMENTS OF COMPREHENSIVE INCOME
YEARS ENDED DECEMBER 31, 2016, 2015 AND 2014
(In thousands, except per share data)
|
|
|
2016 |
|
|
2015 |
|
|
2014 |
|
|||
|
Revenue |
|
$ |
799,832 |
|
|
$ |
750,422 |
|
|
$ |
719,483 |
|
|
Operating expenses |
|
|
697,726 |
|
|
|
652,391 |
|
|
|
629,804 |
|
|
Gross margin |
|
|
102,106 |
|
|
|
98,031 |
|
|
|
89,679 |
|
|
Corporate general and administrative expenses |
|
|
36,319 |
|
|
|
32,527 |
|
|
|
34,183 |
|
|
Operating income |
|
|
65,787 |
|
|
|
65,504 |
|
|
|
55,496 |
|
|
Other income (expense): |
|
|
|
|
|
|
|
|
|
|
|
|
|
Interest expense |
|
|
(6,593 |
) |
|
|
(8,902 |
) |
|
|
(13,124 |
) |
|
Gain on sale of operations, net |
|
|
855 |
|
|
|
84 |
|
|
|
1,303 |
|
|
Other income, net |
|
|
6,957 |
|
|
|
1,146 |
|
|
|
6,893 |
|
|
Total other income (expense), net |
|
|
1,219 |
|
|
|
(7,672 |
) |
|
|
(4,928 |
) |
|
Income from continuing operations before income tax expense |
|
|
67,006 |
|
|
|
57,832 |
|
|
|
50,568 |
|
|
Income tax expense |
|
|
26,399 |
|
|
|
22,829 |
|
|
|
20,154 |
|
|
Income from continuing operations |
|
|
40,607 |
|
|
|
35,003 |
|
|
|
30,414 |
|
|
Loss from operations of discontinued operations, net of tax |
|
|
(542 |
) |
|
|
(2,323 |
) |
|
|
(754 |
) |
|
Gain on disposal of discontinued operations, net of tax |
|
|
— |
|
|
|
1,427 |
|
|
|
99 |
|
|
Net income |
|
$ |
40,065 |
|
|
$ |
34,107 |
|
|
$ |
29,759 |
|
|
Earnings per share: |
|
|
|
|
|
|
|
|
|
|
|
|
|
Basic: |
|
|
|
|
|
|
|
|
|
|
|
|
|
Continuing operations |
|
$ |
0.78 |
|
|
$ |
0.70 |
|
|
$ |
0.63 |
|
|
Discontinued operations |
|
|
(0.01 |
) |
|
|
(0.01 |
) |
|
|
(0.01 |
) |
|
Net income |
|
$ |
0.77 |
|
|
$ |
0.69 |
|
|
$ |
0.62 |
|
|
Diluted: |
|
|
|
|
|
|
|
|
|
|
|
|
|
Continuing operations |
|
$ |
0.76 |
|
|
$ |
0.66 |
|
|
$ |
0.59 |
|
|
Discontinued operations |
|
|
(0.01 |
) |
|
|
(0.01 |
) |
|
|
(0.01 |
) |
|
Net income |
|
$ |
0.75 |
|
|
$ |
0.65 |
|
|
$ |
0.58 |
|
|
Basic weighted average common shares outstanding |
|
|
52,321 |
|
|
|
50,280 |
|
|
|
48,343 |
|
|
Diluted weighted average common shares outstanding |
|
|
53,513 |
|
|
|
52,693 |
|
|
|
51,487 |
|
|
Comprehensive income: |
|
|
|
|
|
|
|
|
|
|
|
|
|
Net income |
|
$ |
40,065 |
|
|
$ |
34,107 |
|
|
$ |
29,759 |
|
|
Other comprehensive income: |
|
|
|
|
|
|
|
|
|
|
|
|
|
Net unrealized loss on available-for-sale securities, net of income tax benefit of $16, $77 and $74 |
|
|
(23 |
) |
|
|
(114 |
) |
|
|
(117 |
) |
|
Net unrealized gain on interest rate swaps, net of income tax expense of $107, $135 and $121 |
|
|
182 |
|
|
|
230 |
|
|
|
206 |
|
|
Foreign currency translation |
|
|
(30 |
) |
|
|
(54 |
) |
|
|
(59 |
) |
|
Total other comprehensive income |
|
|
129 |
|
|
|
62 |
|
|
|
30 |
|
|
Total comprehensive income |
|
$ |
40,194 |
|
|
$ |
34,169 |
|
|
$ |
29,789 |
|
See the accompanying notes to the consolidated financial statements
F-5
CONSOLIDATED STATEMENTS OF STOCKHOLDERS’ EQUITY
YEARS ENDED DECEMBER 31, 2016, 2015 AND 2014
(In thousands)
|
|
|
Issued Common Shares |
|
|
Treasury Shares |
|
|
|
Common Stock |
|
|
Additional Paid-In Capital |
|
|
Retained Earnings |
|
|
Treasury Stock |
|
|
Accumulated Other Comprehensive Loss |
|
|
Totals |
|
||||||||
|
December 31, 2013 |
|
|
114,957 |
|
|
|
65,993 |
|
|
|
|
1,149 |
|
|
|
580,576 |
|
|
|
190,994 |
|
|
|
(397,548 |
) |
|
|
(725 |
) |
|
|
374,446 |
|
|
Net income |
|
|
— |
|
|
|
— |
|
|
|
|
— |
|
|
|
— |
|
|
|
29,759 |
|
|
|
— |
|
|
|
— |
|
|
|
29,759 |
|
|
Other comprehensive income |
|
|
— |
|
|
|
— |
|
|
|
|
— |
|
|
|
— |
|
|
|
— |
|
|
|
— |
|
|
|
30 |
|
|
|
30 |
|
|
Share repurchases |
|
|
— |
|
|
|
3,340 |
|
|
|
|
— |
|
|
|
— |
|
|
|
— |
|
|
|
(28,137 |
) |
|
|
— |
|
|
|
(28,137 |
) |
|
Restricted stock |
|
|
464 |
|
|
|
— |
|
|
|
|
5 |
|
|
|
(5 |
) |
|
|
— |
|
|
|
— |
|
|
|
— |
|
|
|
— |
|
|
Stock options exercised |
|
|
1,507 |
|
|
|
— |
|
|
|
|
15 |
|
|
|
11,341 |
|
|
|
— |
|
|
|
— |
|
|
|
— |
|
|
|
11,356 |
|
|
Share-based compensation |
|
|
— |
|
|
|
— |
|
|
|
|
— |
|
|
|
6,205 |
|
|
|
— |
|
|
|
— |
|
|
|
— |
|
|
|
6,205 |
|
|
Tax expense from employee share plans |
|
|
— |
|
|
|
— |
|
|
|
|
— |
|
|
|
(133 |
) |
|
|
— |
|
|
|
— |
|
|
|
— |
|
|
|
(133 |
) |
|
Convertible bond retirement |
|
|
1,477 |
|
|
|
— |
|
|
|
|
15 |
|
|
|
2,639 |
|
|
|
— |
|
|
|
— |
|
|
|
— |
|
|
|
2,654 |
|
|
Business acquisitions |
|
|
415 |
|
|
|
— |
|
|
|
|
4 |
|
|
|
3,661 |
|
|
|
— |
|
|
|
— |
|
|
|
— |
|
|
|
3,665 |
|
|
December 31, 2014 |
|
|
118,820 |
|
|
|
69,333 |
|
|
|
|
1,188 |
|
|
|
604,284 |
|
|
|
220,753 |
|
|
|
(425,685 |
) |
|
|
(695 |
) |
|
|
399,845 |
|
|
Net income |
|
|
— |
|
|
|
— |
|
|
|
|
— |
|
|
|
— |
|
|
|
34,107 |
|
|
|
— |
|
|
|
— |
|
|
|
34,107 |
|
|
Other comprehensive income |
|
|
— |
|
|
|
— |
|
|
|
|
— |
|
|
|
— |
|
|
|
— |
|
|
|
— |
|
|
|
62 |
|
|
|
62 |
|
|
Share repurchases |
|
|
— |
|
|
|
3,895 |
|
|
|
|
— |
|
|
|
— |
|
|
|
— |
|
|
|
(36,482 |
) |
|
|
— |
|
|
|
(36,482 |
) |
|
Restricted stock |
|
|
360 |
|
|
|
— |
|
|
|
|
4 |
|
|
|
(4 |
) |
|
|
— |
|
|
|
— |
|
|
|
— |
|
|
|
— |
|
|
Stock options exercised |
|
|
1,548 |
|
|
|
— |
|
|
|
|
15 |
|
|
|
10,713 |
|
|
|
— |
|
|
|
— |
|
|
|
— |
|
|
|
10,728 |
|
|
Share-based compensation |
|
|
— |
|
|
|
— |
|
|
|
|
— |
|
|
|
5,729 |
|
|
|
— |
|
|
|
— |
|
|
|
— |
|
|
|
5,729 |
|
|
Tax expense from employee share plans |
|
|
— |
|
|
|
— |
|
|
|
|
— |
|
|
|
772 |
|
|
|
— |
|
|
|
— |
|
|
|
— |
|
|
|
772 |
|
|
Convertible bond retirement |
|
|
5,069 |
|
|
|
— |
|
|
|
|
51 |
|
|
|
9,422 |
|
|
|
— |
|
|
|
— |
|
|
|
— |
|
|
|
9,473 |
|
|
Business acquisitions |
|
|
385 |
|
|
|
— |
|
|
|
|
4 |
|
|
|
3,710 |
|
|
|
— |
|
|
|
— |
|
|
|
— |
|
|
|
3,714 |
|
|
December 31, 2015 |
|
|
126,182 |
|
|
|
73,228 |
|
|
|
|
1,262 |
|
|
|
634,626 |
|
|
|
254,860 |
|
|
|
(462,167 |
) |
|
|
(633 |
) |
|
|
427,948 |
|
|
Net income |
|
|
— |
|
|
|
— |
|
|
|
|
— |
|
|
|
— |
|
|
|
40,065 |
|
|
|
— |
|
|
|
— |
|
|
|
40,065 |
|
|
Other comprehensive income |
|
|
— |
|
|
|
— |
|
|
|
|
— |
|
|
|
— |
|
|
|
— |
|
|
|
— |
|
|
|
129 |
|
|
|
129 |
|
|
Share repurchases |
|
|
— |
|
|
|
919 |
|
|
|
|
— |
|
|
|
— |
|
|
|
— |
|
|
|
(9,144 |
) |
|
|
— |
|
|
|
(9,144 |
) |
|
Restricted stock |
|
|
300 |
|
|
|
— |
|
|
|
|
3 |
|
|
|
(3 |
) |
|
|
— |
|
|
|
— |
|
|
|
— |
|
|
|
— |
|
|
Stock options exercised |
|
|
1,128 |
|
|
|
— |
|
|
|
|
11 |
|
|
|
8,059 |
|
|
|
— |
|
|
|
— |
|
|
|
— |
|
|
|
8,070 |
|
|
Share-based compensation |
|
|
— |
|
|
|
— |
|
|
|
|
— |
|
|
|
5,725 |
|
|
|
— |
|
|
|
— |
|
|
|
— |
|
|
|
5,725 |
|
|
Tax benefit from employee share plans |
|
|
— |
|
|
|
— |
|
|
|
|
— |
|
|
|
1,004 |
|
|
|
— |
|
|
|
— |
|
|
|
— |
|
|
|
1,004 |
|
|
Business acquisitions |
|
|
581 |
|
|
|
— |
|
|
|
|
6 |
|
|
|
6,218 |
|
|
|
— |
|
|
|
— |
|
|
|
— |
|
|
|
6,224 |
|
|
December 31, 2016 |
|
|
128,191 |
|
|
|
74,147 |
|
|
|
|
1,282 |
|
|
|
655,629 |
|
|
|
294,925 |
|
|
|
(471,311 |
) |
|
|
(504 |
) |
|
|
480,021 |
|
See the accompanying notes to the consolidated financial statements
F-6
CONSOLIDATED STATEMENTS OF CASH FLOWS
YEARS ENDED DECEMBER 31, 2016, 2015 AND 2014
(In thousands)
|
|
|
2016 |
|
|
2015 |
|
|
2014 |
|
|||
|
Cash flows from operating activities: |
|
|
|
|
|
|
|
|
|
|
|
|
|
Net income |
|
$ |
40,065 |
|
|
$ |
34,107 |
|
|
$ |
29,759 |
|
|
Adjustments to reconcile net income to net cash provided by (used in) operating activities: |
|
|
|
|
|
|
|
|
|
|
|
|
|
Loss from discontinued operations, net of tax |
|
|
542 |
|
|
|
896 |
|
|
|
655 |
|
|
Gain on sale of operations, net of tax |
|
|
(855 |
) |
|
|
(84 |
) |
|
|
(1,303 |
) |
|
Loss on early extinguishment of convertible debt |
|
|
— |
|
|
|
833 |
|
|
|
1,529 |
|
|
Depreciation and amortization expense |
|
|
22,098 |
|
|
|
20,389 |
|
|
|
19,831 |
|
|
Amortization of discount on notes and deferred financing costs |
|
|
523 |
|
|
|
2,271 |
|
|
|
4,169 |
|
|
Amortization of discount on contingent earnout liabilities |
|
|
348 |
|
|
|
144 |
|
|
|
128 |
|
|
Bad debt expense, net of recoveries |
|
|
4,090 |
|
|
|
5,658 |
|
|
|
5,484 |
|
|
Adjustment to contingent earnout liability |
|
|
(1,342 |
) |
|
|
(2,853 |
) |
|
|
(6,079 |
) |
|
Deferred income taxes |
|
|
4,829 |
|
|
|
1,734 |
|
|
|
2,043 |
|
|
Employee stock awards |
|
|
5,725 |
|
|
|
5,729 |
|
|
|
6,205 |
|
|
Excess tax benefits from share based payment arrangements |
|
|
(1,108 |
) |
|
|
(948 |
) |
|
|
(503 |
) |
|
Changes in assets and liabilities, net of acquisitions and divestitures: |
|
|
|
|
|
|
|
|
|
|
|
|
|
Restricted cash |
|
|
(3,019 |
) |
|
|
3,433 |
|
|
|
(6,182 |
) |
|
Accounts receivable, net |
|
|
(19,188 |
) |
|
|
(15,276 |
) |
|
|
(6,246 |
) |
|
Other assets |
|
|
(5,612 |
) |
|
|
(1,269 |
) |
|
|
(3,027 |
) |
|
Accounts payable |
|
|
10,217 |
|
|
|
(1,288 |
) |
|
|
(3,826 |
) |
|
Income taxes payable |
|
|
1,881 |
|
|
|
(3,674 |
) |
|
|
(338 |
) |
|
Accrued personnel costs |
|
|
5,496 |
|
|
|
(349 |
) |
|
|
1,643 |
|
|
Other liabilities |
|
|
5,965 |
|
|
|
(3,057 |
) |
|
|
(825 |
) |
|
Net cash provided by continuing operations |
|
|
70,655 |
|
|
|
46,396 |
|
|
|
43,117 |
|
|
Operating cash flows provided by discontinued operations |
|
|
387 |
|
|
|
990 |
|
|
|
801 |
|
|
Net cash provided by operating activities |
|
|
71,042 |
|
|
|
47,386 |
|
|
|
43,918 |
|
|
Cash flows from investing activities: |
|
|
|
|
|
|
|
|
|
|
|
|
|
Business acquisitions and purchases of client lists, net of cash acquired |
|
|
(42,883 |
) |
|
|
(14,636 |
) |
|
|
(45,972 |
) |
|
Purchases of client fund investments |
|
|
(11,355 |
) |
|
|
(15,429 |
) |
|
|
(14,089 |
) |
|
Proceeds from the sales and maturities of client fund investments |
|
|
9,778 |
|
|
|
10,664 |
|
|
|
6,671 |
|
|
Proceeds on sales of divested and discontinued operations |
|
|
802 |
|
|
|
2,938 |
|
|
|
4,537 |
|
|
(Decrease) increase in funds held for clients |
|
|
(3,193 |
) |
|
|
15,921 |
|
|
|
(11,223 |
) |
|
Additions to property and equipment |
|
|
(4,141 |
) |
|
|
(7,390 |
) |
|
|
(4,837 |
) |
|
Collection of notes receivable |
|
|
998 |
|
|
|
955 |
|
|
|
555 |
|
|
Other |
|
|
(20 |
) |
|
|
20 |
|
|
|
24 |
|
|
Net cash used for continuing operations |
|
|
(50,014 |
) |
|
|
(6,957 |
) |
|
|
(64,334 |
) |
|
Investing cash flows provided by discontinued operations |
|
|
— |
|
|
|
8 |
|
|
|
416 |
|
|
Net cash used for investing activities |
|
|
(50,014 |
) |
|
|
(6,949 |
) |
|
|
(63,918 |
) |
|
Cash flows from financing activities: |
|
|
|
|
|
|
|
|
|
|
|
|
|
Proceeds from bank debt |
|
|
416,800 |
|
|
|
408,800 |
|
|
|
404,500 |
|
|
Payment of bank debt |
|
|
(431,200 |
) |
|
|
(310,400 |
) |
|
|
(345,600 |
) |
|
Payment on extinguishment of convertible debt |
|
|
(760 |
) |
|
|
(88,964 |
) |
|
|
(30,621 |
) |
|
Payment for acquisition of treasury stock |
|
|
(9,144 |
) |
|
|
(36,482 |
) |
|
|
(28,137 |
) |
|
Increase (decrease) in client funds obligations |
|
|
5,257 |
|
|
|
(12,617 |
) |
|
|
19,624 |
|
|
Payment of contingent consideration of acquisitions |
|
|
(7,504 |
) |
|
|
(11,987 |
) |
|
|
(7,991 |
) |
|
Proceeds from exercise of stock options |
|
|
8,070 |
|
|
|
10,728 |
|
|
|
11,356 |
|
|
Payment of notes payable |
|
|
(347 |
) |
|
|
(574 |
) |
|
|
(1,690 |
) |
|
Deferred financing costs |
|
|
(6 |
) |
|
|
(18 |
) |
|
|
(1,736 |
) |
|
Payment of acquired debt |
|
|
(658 |
) |
|
|
— |
|
|
|
— |
|
|
Excess tax benefit from exercise of stock awards |
|
|
1,108 |
|
|
|
948 |
|
|
|
503 |
|
|
Net cash (used for) provided by financing activities |
|
|
(18,384 |
) |
|
|
(40,566 |
) |
|
|
20,208 |
|
|
Net increase (decrease) in cash and cash equivalents |
|
|
2,644 |
|
|
|
(129 |
) |
|
|
208 |
|
See the accompanying notes to the consolidated financial statements
F-7
NOTES TO THE CONSOLIDATED FINANCIAL STATEMENTS
Note 1. Organization and Summary of Significant Accounting Policies
Organization: CBIZ, Inc. is a diversified services company which, acting through its subsidiaries, provides professional business services primarily to small and medium-sized businesses, as well as individuals, governmental entities, and not-for-profit enterprises throughout the United States and parts of Canada. CBIZ, Inc. manages and reports its operations along three practice groups: Financial Services, Benefits and Insurance Services and National Practices. A further description of products and services offered by each of the practice groups is provided in Note 21, Segment Disclosures, to the accompanying consolidated financial statements.
Principles of Consolidation: The accompanying consolidated financial statements reflect the operations of CBIZ, Inc. and all of its wholly-owned subsidiaries (“CBIZ,” the “Company,” “we” or “our”). All intercompany accounts and transactions have been eliminated in consolidation.
CBIZ has determined that its relationship with certain Certified Public Accounting (“CPA”) firms with whom it maintains administrative service agreements (“ASAs”) qualify as variable interest entities. The accompanying consolidated financial statements do not reflect the operations or accounts of variable interest entities as the impact is not material to the consolidated financial condition, results of operations or cash flows of CBIZ.
Fees earned by CBIZ under the ASAs are recorded as “Revenue” (at net realizable value) in the accompanying Consolidated Statements of Comprehensive Income and were approximately $144.8 million, $137.5 million and $133.7 million for the years ended December 31, 2016, 2015 and 2014, respectively, the majority of which was related to services rendered to privately-held clients. In the event that accounts receivable and unbilled work in process become uncollectible by the CPA firms, the service fee due to CBIZ is typically reduced on a proportional basis. Although the ASAs do not constitute control, CBIZ is one of the beneficiaries of the agreements and may bear certain economic risks.
Use of Estimates: The preparation of consolidated financial statements in conformity with United States generally accepted accounting principles (“GAAP”) requires management to make estimates and assumptions that affect the amounts reported in the consolidated financial statements and accompanying notes. Management’s estimates and assumptions are derived from and are continually evaluated based upon available information, judgment and experience. Actual results could differ from those estimates.
Cash and Cash Equivalents: Cash and cash equivalents consist of cash on hand and investments with an original maturity of three months or less when purchased.
Restricted Cash: Restricted cash consists of funds held by CBIZ in relation to its capital and investment advisory services as those funds are restricted in accordance with applicable Financial Industry Regulatory Authority (“FINRA”) regulations. Restricted cash also consists of funds on deposit from clients in connection with the pass-through of insurance premiums to the carrier with the related liability for these funds recorded in “Accounts payable” in the accompanying Consolidated Balance Sheets.
Accounts Receivable and Allowance for Doubtful Accounts: Accounts receivable, less allowances for doubtful accounts, reflects the net realizable value of receivables and approximates fair value. Unbilled revenues are recorded at estimated net realizable value. Assessing the collectability of receivables (billed and unbilled) requires management judgment based on a combination of factors. When evaluating the adequacy of the allowance for doubtful accounts and the overall probability of collecting on receivables, we analyze historical collection experience, client credit-worthiness, the length of time the receivables are past due and an evaluation of current and projected economic trends and conditions at the time of the balance sheet date. At December 31, 2016 and 2015, the allowance for doubtful accounts was $13.5 million and $12.7 million, respectively, in the accompanying Consolidated Balance Sheets.
Funds Held for Clients and Client Fund Obligations: Services provided by our payroll operations include the preparation of payroll checks, federal, state, and local payroll tax returns, and flexible spending account administration. In relation to these services, as well as other similar service offerings, we collect funds from our clients’ accounts in advance of paying client obligations. Funds that are collected before they are due are segregated and reported separately as “Funds held for clients” in the accompanying Consolidated Balance Sheets. Other than certain federal and state regulations pertaining to flexible spending account administration, there are no regulatory or other contractual restrictions placed on these funds.
Funds held for clients are reported in current assets and client fund obligations are reported in current liabilities in the accompanying Consolidated Balance Sheets. The balances in these accounts fluctuate with the timing of cash receipts and the related cash payments.
F-8
CBIZ, INC. AND SUBSIDIARIES
NOTES TO THE CONSOLIDATED FINANCIAL STATEMENTS — (continued)
Funds held for clients include cash, overnight investments and corporate and municipal bonds (refer to Note 5, Financial Instruments, to the accompanying consolidated financial statements for further discussion of investments). If the par value of investments held does not approximate fair value, the balance in funds held for clients may not be equal to the balance in client fund obligations. The amount of collected but not yet remitted funds may vary significantly during the year based on the timing of clients’ payroll periods.
Property and Equipment: Property and equipment is recorded at cost less accumulated depreciation and amortization. Depreciation and amortization are provided on a straight-line basis over the following estimated useful lives:
|
Buildings |
|
25 to 40 years |
|
Furniture and fixtures |
|
5 to 10 years |
|
Capitalized software |
|
2 to 7 years |
|
Equipment |
|
3 to 7 years |
Leasehold improvements are amortized over the shorter of their estimated useful lives or the remaining term of the respective lease. The cost of software purchased or developed for internal use is capitalized and amortized to expense using the straight-line method over an estimated useful life not to exceed seven years. Capitalized software is classified as property and equipment, net in the accompanying Consolidated Balance Sheets.
Goodwill: A significant portion of our assets is goodwill as a result of current and past acquisitions. We utilize the acquisition method of accounting for all business combinations. Goodwill is not amortized, but rather is tested for impairment annually, or between annual tests if an event occurs or circumstances change that would more likely than not reduce the fair value of a reporting unit below its carrying value.
At December 31, 2016, the carrying value of goodwill totaled $487.5 million, compared to total assets of $1.1 billion and total shareholders’ equity of $480.0 million. During the fourth quarter of 2016 and 2015, we applied the principles as prescribed in Financial Accounting Standards Board (“FASB”) Accounting Standards Codification (“ASC”) Topic 350, “Intangibles – Goodwill and Other” in order to complete our goodwill impairment test. If the carrying value of a reporting unit exceeds the current estimated fair value, then the amount of the impairment loss, if any, must be measured.
Qualitative Assessment - In the fourth quarter of 2016, we based our goodwill assessment on a qualitative assessment for each of our reporting units that carried a goodwill balance. The qualitative assessment included an analysis of many factors and assumptions used in our most recent quantitative testing for each reporting unit, including the capital market environment, economic and market conditions, industry competition and trends, the Company’s weighted average cost of capital, changes in management and key personnel, the price of the Company’s common stock, changes in results of operations, the magnitude of the excess of fair value over the carrying amount of each reporting unit as determined in our most recent quantitative testing, and other factors. Management determined that there has not been a significant change in the operations of the five reporting units since the most recent quantitative assessment, as a result, it was concluded that it was more likely than not that the fair value of each of its reporting units was greater than its carrying value.
Quantitative Assessment - In the fourth quarter of 2015, we based our goodwill assessment on a quantitative assessment for each of our reporting units that carried a goodwill balance using both a discounted cash flow valuation technique and a market-based approach. The impairment test incorporated estimates of future cash flows; allocation of certain assets, liabilities, and cash flows among reporting units; future growth rates; and the applicable weighted-average cost of capital used to discount those estimated cash flows. No goodwill impairment was recognized as a result of the annual evaluation performed as of November 1, 2015. The estimated fair value of each of the five reporting units was substantially in excess of its carrying value as of the annual test date.
Long-Lived Assets: Long-lived assets primarily consist of property and equipment and intangible assets, which include client lists and non-compete agreements. The intangible assets are amortized over their expected periods of benefit, which generally ranges from two to fifteen years. Long-lived assets are reviewed for impairment whenever events or changes in circumstances indicate that the carrying value of such assets or groups of assets may not be recoverable. Recoverability of long-lived assets or groups of assets is assessed based on a comparison of the undiscounted cash flows to the recorded value of the asset. If impairment is indicated, the asset is written down to its estimated fair value based on a discounted cash flow analysis or market comparable method. Determining the fair value of long-lived assets includes significant judgment by management, and different judgments could yield different results.
Income Taxes: Income taxes are provided for the tax effects of transactions reported in the consolidated financial statements and consist of taxes currently payable and deferred taxes. Deferred tax assets and liabilities are recognized for the future tax consequences
F-9
CBIZ, INC. AND SUBSIDIARIES
NOTES TO THE CONSOLIDATED FINANCIAL STATEMENTS — (continued)
attributable to differences between the financial statement carrying amounts of existing assets and liabilities and their respective tax basis, and operating losses and tax credit carryforwards. State income tax credits are accounted for using the flow-through method.
A valuation allowance is provided when it is more-likely-than-not that some portion of a deferred tax asset will not be realized. CBIZ determines valuation allowances based on all available evidence. Such evidence includes historical results, the reversal of deferred tax liabilities, expectations of future consolidated and/or separate company profitability and the feasibility of tax-planning strategies. Determining valuation allowances includes significant judgment by management, and different judgments could yield different results.
Accounting for uncertain tax positions requires a more-likely-than-not threshold for recognition in the consolidated financial statements. The Company recognizes a tax benefit based on whether it is more-likely-than-not that a tax position will be sustained. The Company records a liability to the extent that a tax position taken or expected to be taken on a tax return exceeds the amount recognized in the consolidated financial statements.
Share-Based Awards: The measurement and recognition of share-based compensation expense is based on the grant date fair value of the share-based awards made to employees and non-employee directors over the required vesting period which is generally up to four years. The fair value of stock options is determined using the Black-Sholes-Merton option pricing model, which incorporates assumptions regarding the expected volatility, the expected option life, the risk-free interest rate and the expected dividend yield.
Share-based compensation expense is recorded in the accompanying Consolidated Statements of Comprehensive Income as “Operating expenses” or “Corporate general and administrative expenses” (“G&A expenses”), depending on where the respective individual’s compensation is recorded. For additional discussion regarding share-based awards, see Note 14, Employee Share Plans, to the accompanying consolidated financial statements.
Earnings Per Share: Basic earnings per share are computed by dividing net income by the weighted average number of common shares outstanding during the period. Diluted earnings per share are computed by dividing net income by diluted weighted average shares. Diluted weighted average shares are determined using the weighted average number of common shares outstanding during the period plus the dilutive effect of potential future issues of common stock relating to CBIZ’s stock award programs, CBIZ’s convertible senior subordinated notes, which matured in October 2015, business acquisitions, and other potentially dilutive securities. In calculating diluted earnings per share, the dilutive effect of stock awards is computed using the average market price for the period, in accordance with the treasury stock method.
Derivative Instruments: We account for derivative instruments in accordance with FASB ASC Topic 815, “Derivatives and Hedging,” which requires all derivative instruments to be recognized in the financial statements and measured at fair value, regardless of the purpose or intent for holding them.
The designation of a derivative instrument as a hedge and its ability to meet the hedge accounting criteria determine how we reflect the change in fair value of the derivative instrument. A derivative qualifies for hedge accounting treatment if, at inception, it meets defined correlation and effectiveness criteria. These criteria require that the anticipated cash flows and/or changes in fair value of the hedging instrument substantially offset those of the position being hedged.
CBIZ utilizes derivative instruments to manage interest rate risk associated with our floating-rate debt under the $400 million unsecured credit facility (as amended the “credit facility”). Interest rate swap contracts mitigate the risk associated with the underlying hedged item. If the contract is designated as a cash flow hedge, the mark-to-market gains or losses on the swap are deferred and included as a component of accumulated other comprehensive loss (“AOCL”), net of tax, to the extent effective, and reclassified to interest expense in the same period during which the hedged transaction affects earnings. If the contract is designated as a fair value hedge, the swap is recognized at fair value on the balance sheet, and changes in the fair value are recognized in interest expense. For further discussion regarding derivative financial instruments, see Note 5, Financial Instruments, to the accompanying consolidated financial statements.
Revenue Recognition and Valuation of Unbilled Revenues: Revenue is recognized and earned when all of the following criteria are satisfied: (a) persuasive evidence of a sales arrangement exists; (b) delivery has occurred or service has been rendered; (c) the fee to the client is fixed or determinable; and (d) collectability is reasonably assured.
Contract terms are typically contained in a signed agreement with the client (or when applicable, other third parties) which generally defines the scope of services to be provided, pricing of services, and payment terms generally ranging from invoice date to 90 days after invoice date. Billing may occur prior to, during, or upon completion of the service. We typically do not have acceptance
F-10
CBIZ, INC. AND SUBSIDIARIES
NOTES TO THE CONSOLIDATED FINANCIAL STATEMENTS — (continued)
provisions or right of refund arrangements included in these agreements. Contract terms vary depending on the scope of services provided, the deliverables, and the complexity of the engagement. We offer a vast array of products and business services to our clients delivered through our three practice groups. A description of revenue recognition, as it relates to those groups, is provided below:
Financial Services — Revenue primarily consists of fees for services rendered to our clients for traditional accounting services, tax return preparation, consulting services, compliance projects, services pursuant to administrative service agreements (described under “Principles of Consolidation”), and valuation services including fairness opinions, capital assets, litigation support, purchase price allocations and derivative valuations. Clients are billed for these services based upon a fixed fee, a time and expense model and outcome-based fee.
Revenue recognition as it pertains to each of these arrangements is as follows:
|
|
• |
Fixed fee arrangements — Revenue for fixed-fee arrangements is recognized over the performance period. Performance is measured in hours worked and anticipated realization. |
|
|
• |
Time and expense arrangements — Revenue is recognized over the performance period. Progress is measured towards completion with value being transferred through our hourly fee arrangement at expected net realizable rates per hour, plus agreed-upon out-of-pocket expenses. The cumulative impact on any subsequent revision in the estimated realizable value of unbilled fees for a particular client project is reflected in the period in which the change becomes known. |
|
|
• |
Outcome-based arrangements — Revenue is at a point in time when savings to the client is determined and verified by a third party. |
|
|
• |
Administrative service agreement revenue — Revenue for administrative service fees is recognized as services are provided, based upon actual hours incurred. |
Benefits and Insurance Services — Revenue consists primarily of brokerage and agency commissions, fee income for administering health and retirement plans and payroll service fees. Revenue also includes investment income related to client payroll funds that are held in CBIZ accounts, as is industry practice. A description of the revenue recognition, based on the service provided, insurance product sold, and billing arrangement, is provided below:
|
|
• |
Commissions revenue — Commissions relating to brokerage and agency activities whereby CBIZ has primary responsibility for the collection of premiums from the insured (agency or indirect billing) are recognized as of the later of the effective date of the insurance policy or the date billed to the customer; commissions to be received directly from insurance companies (direct billing) are recognized when the data necessary from the carriers to properly record revenue becomes available; and life insurance commissions are recognized when the policy becomes effective, which can be either the effective date or the date payment is received and policy is bound. Commission revenue is reported net of reserves for estimated policy cancellations and terminations. The cancellation and termination reserve is based upon estimates and assumptions using historical cancellation and termination experience and other current factors to project future experience. CBIZ periodically reviews the adequacy of the reserve and makes adjustments as necessary. The use of different estimates or assumptions could produce different results. |
Contingent revenue arrangements related to commissions are based upon certain performance targets recognized at the earlier of written notification that the target has been achieved or cash collection.
|
|
• |
Fee income — Fee income is recognized in the period in which services are provided and may be based on predetermined agreed-upon fixed fees, actual hours incurred on an hourly fee basis, or asset-based fees. Revenue for fixed-fee arrangements is recognized on a straight-line basis over the contract period, as these services are provided to clients continuously throughout the term of the arrangement. Revenue which is based upon actual hours incurred is recognized as services are performed. |
Revenue for asset-based fees is recognized when the data necessary to compute revenue is determinable, which is typically on an accrual basis or when market valuation information is available.
|
|
• |
Payroll — Revenue related to payroll processing fees is recognized when the actual payroll processing occurs. Revenue related to investment income earned on payroll funds is based upon actual amounts earned on those funds and is recognized in the period that the income is earned. |
F-11
CBIZ, INC. AND SUBSIDIARIES
NOTES TO THE CONSOLIDATED FINANCIAL STATEMENTS — (continued)
National Practices — The business units that comprise the National Practices group offer a variety of services which is described below:
|
|
• |
Technology consulting — Revenue consists of services that primarily relate to the installation, maintenance and repair of hardware. These services are charged to customers based on cost plus an agreed-upon markup percentage. |
|
|
• |
Healthcare consulting — Clients are billed for healthcare consulting services based upon a predetermined agreed-upon fixed fee, a time and expense model, or as a percentage of savings. Revenue for fixed fee and time and expense arrangements is recognized over the performance period based upon actual hours incurred, and revenue that is contingent upon savings is recognized after contingencies have been resolved and verified by a third party. |
Operating Expenses: Operating expenses represent costs of service and other costs incurred to operate our business units and are primarily comprised of personnel costs and occupancy related expenses. Personnel costs include (i) salaries and benefits; (ii) commissions paid to producers; (iii) incentive compensation; and (iv) share-based compensation. Incentive compensation costs and share-based compensation are estimated and accrued on a monthly basis. The ultimate determination of incentive compensation is made after year-end results are finalized. Gains or losses earned on assets of the non-qualified deferred compensation plan are recognized as income or expense and offset in “Other income (expense), net.”
Total personnel costs were $544.8 million, $502.8 million and $487.0 million for the years ended December 31, 2015, 2014 and 2013, respectively.
The largest components of occupancy costs are rent expense and utilities. Base rent expense is recognized over respective lease terms, while utilities and common area maintenance charges are recognized as incurred. Total occupancy costs were $45.7 million, $41.4 million and $37.1 million for the years ended December 31, 2016, 2015 and 2014, respectively.
Operating Leases: We lease most of our office facilities and equipment under various operating leases. Rent expense under such leases is recognized evenly throughout the term of the lease obligation when the total lease commitment is a known amount, and recorded on a cash basis when future rent payment increases under the obligation are unknown due to rent escalations being tied to factors that are not currently measurable (such as increases in the consumer price index). Differences between rent expense recognized and the cash payments required under operating lease agreements are recorded in the accompanying Consolidated Balance Sheets as “Other non-current liabilities.”
We may receive incentives to lease office facilities in certain areas. Such incentives are recorded as a deferred credit and recognized as a reduction to rent expense on a straight-line basis over the lease term.
New Accounting Pronouncements
The FASB ASC is the sole source of authoritative GAAP other than the Securities and Exchange Commission (“SEC”) issued rules and regulations that apply only to SEC registrants. The FASB issues an Accounting Standards Update (“ASU”) to communicate changes to the FASB codification. We assess and review the impact of all ASU's. ASU's not listed below were reviewed and determined to be either not applicable or are not expected to have a material impact on the consolidated financial statements.
Accounting Standards Adopted in 2016
Balance Sheet Reclassification of Deferred Taxes: In November 2015, the FASB issued ASU No. 2015-17, “Income Taxes (Topic 740) – Balance Sheet Reclassification of Deferred Taxes” (“ASU 2015-17”). ASU 2015-17 requires that deferred tax assets and liabilities be classified as noncurrent on the balance sheet. The standard may be applied either prospectively to all deferred tax assets and liabilities or retrospectively to all periods presented. Effective January 1, 2016, the Company adopted ASU 2015-17 on a prospective basis. As such, prior periods were not retrospectively adjusted. If ASU 2015-17 were adopted retrospectively, $4.7 million would have been reclassified from “Deferred income taxes – current, net” (current asset) to “Deferred income taxes – non-current” (non-current liability) resulting in a net non-current deferred income tax liability of $0.1 million in the accompanying Consolidated Balance Sheet at December 31, 2015.
Presentation of Debt Issuance Costs: In April 2015, the FASB issued ASU No. 2015-03, “Interest – Imputation of Interest (Subtopic 835-30) – Simplifying the Presentation of Debt Issuance Costs” (“ASU 2015-03”), which amends the current presentation of debt issuance costs in the financial statements. ASU 2015-03 requires an entity to present debt issuance costs related to a recognized debt liability in the balance sheet as a direct deduction from the carrying amount of the debt liability, consistent with debt discounts. The
F-12
CBIZ, INC. AND SUBSIDIARIES
NOTES TO THE CONSOLIDATED FINANCIAL STATEMENTS — (continued)
recognition and measurement guidance for debt issuance costs are not affected by ASU 2015-03. The FASB issued ASU 2015-15, “Presentation and Subsequent Measurement of Debt Issuance Costs Associated with Line-of-Credit Arrangements” (“ASU 2015-15”) in August 2015. This ASU was meant to clarify the guidance in ASU 2015-03, and stated that the SEC staff would not object to a company presenting debt issuance costs related to a line-of-credit arrangement on the balance sheet as a deferred asset, regardless of whether there were any outstanding borrowings at period-end. ASU 2015-15 does not require this presentation as a deferred asset. We adopted these standards on January 1, 2016 and have retrospectively adjusted the prior period presented. This change in classification resulted in a net decrease of $1.9 million to “Other non-current assets” with a corresponding line item called “Debt issuance costs” which decreased “Total long term debt” in the accompanying Consolidated Balance Sheets as of December 31, 2015.
Consolidation Analysis: In February 2015, the FASB issued ASU No. 2015-02, “Consolidation (Topic 810) – Amendments to the Consolidation Analysis” (“ASU 2015-02”), which changes the analysis that a reporting entity must perform to determine whether it should consolidate certain types of legal entities. The amendments in the standard affect limited partnerships and similar legal entities, evaluating fees paid to a decision maker or a service provider as a variable interest, the effect of fee arrangements on the primary beneficiary determination, the effect of related parties on the primary beneficiary determination, and certain investment funds. Effective January 1, 2016, the Company adopted the provisions of ASU 2015-02, which had no effect on our consolidated financial statements.
Going Concern Analysis: In August 2014, the FASB issued ASU No. 2014-15, “Presentation of Financial Statements - Going Concern (Subtopic 205-40): Disclosure of Uncertainties about an Entity’s Ability to Continue as a Going Concern” (“ASU 2014-15”), which requires management to assess an entity’s ability to continue as a going concern, and to provide related footnote disclosures in certain circumstances, such as the existence of substantial doubt. We are required to evaluate going concern uncertainties at each annual and interim reporting period, considering the entity’s ability to continue as a going concern within one year after the date that the financial statements are issued. If such conditions or events are identified, we are required to disclose our mitigation plans to alleviate the doubt or disclose a statement of the substantial doubt about our ability to continue as a going concern. ASU 2014-15 was effective for us on December 31, 2016. No probable conditions or events were identified, individually or in the aggregate, that would raise a substantial doubt about our ability to continue as a going concern.
Accounting Standards Not Yet Adopted
Goodwill Impairment Test: In January 2017, the FASB issued ASU No. 2017-04, "Intangibles—Goodwill and Other (Topic 350): Simplifying the Test for Goodwill Impairment" ("ASU 2017-04"), which removes Step 2 of the goodwill impairment test. Goodwill impairment will now be the amount by which a reporting unit’s carrying value exceeds its fair value, not to exceed the carrying amount of goodwill allocated to that reporting unit. An entity still has the option to perform the qualitative assessment for a reporting unit to determine if the quantitative impairment test is necessary. ASU 2017-04 should be applied on a prospective basis and is effective for us for annual periods beginning January 1, 2020. Early adoption is permitted for interim or annual goodwill impairment tests performed on testing dates after January 1, 2017. We are currently evaluating the impact of ASU 2017-04 on our consolidated financial statements.
Business Combinations: In January 2017, the FASB issued ASU 2017-01, “Business Combinations (Topic 805): Clarifying the Definition of a Business,” (“ASU 2017-01”) which clarifies the definition of a business to assist entities with evaluating whether transactions should be accounted for as acquisitions (or disposals) of assets or businesses. The standard will be effective for the Company in the first quarter of 2018. Early adoption is permitted. We are currently evaluating the impact of ASU 2017-01 on our consolidated financial statements.
Technical Corrections and Improvements: In December 2016, the FASB issued ASU No. 2016-19, “Technical Corrections and Improvements” (“ASU 2016-19”), which clarifies guidance, corrects errors and makes minor improvements affecting a variety of topics in the Accounting Standards Codification. The new standard is effective upon issuance (December 14, 2016) for amendments that do not have transition guidance, with all other amendments effective for fiscal years, and interim periods within those years, beginning after December 15, 2016, with early adoption permitted. We are currently evaluating the impact of ASU 2016-19 on our consolidated financial statements.
Restricted Cash - Statement of Cash Flows: In November 2016, the FASB issued ASU No. 2016-18, “Statement of Cash Flows (Topic 230)” (“ASU 2016-18”), which applies to all entities that have restricted cash or restricted cash equivalents and are required to present a statement of cash flows. ASU 2016-18 requires that a statement of cash flows explain the change during the period in the total of cash, cash equivalents, and the amounts generally described as restricted cash or restricted cash equivalents when reconciling beginning-of-period and end-of-period total amounts show on the statement of cash flows. ASU 2016-18 also requires the disclosure
F-13
CBIZ, INC. AND SUBSIDIARIES
NOTES TO THE CONSOLIDATED FINANCIAL STATEMENTS — (continued)
of information about the nature of the restriction. This ASU is effective retrospectively for fiscal years and interim periods beginning after December 15, 2017, with early adoption permitted. We are currently assessing the impact of this ASU on our consolidated financial statements.
Intra-Entity Transfers of Assets: In October 2016, the FASB issued ASU No. 2016-16, “Income Taxes (Topic 740): Intra-Entity Transfers of Assets Other Than Inventory” (“ASU 2016-16”), which requires the recognition of the income tax consequences of an intra-entity transfer of an asset, other than inventory, when the transfer occurs. The tax consequences were previously deferred until the asset was sold to a third party or recovered through use. ASU 2016-16 is effective for annual reporting periods beginning after December 15, 2017, including interim periods within those annual periods, with early adoption permitted. The amendments are to be applied on a modified retrospective basis as of the beginning of the period of adoption. We are currently assessing the impact of this ASU on our consolidated financial statements.
Statement of Cash Flows: In August 2016, the FASB issued ASU No. 2016-15, “Statement of Cash Flows (Topic 230) – Classification of Certain Cash Receipts and Cash Payments” (“ASU 2016-15”). This ASU provides guidance for eight specific cash flow issues with the objective of reducing the existing diversity in practice. ASU 2016-15 is effective retrospectively for annual reporting periods beginning after December 15, 2017, including interim periods within those annual reporting periods, with early adoption permitted. We are currently evaluating the impact of this ASU on our consolidated financial statements.
Share-Based Compensation: In March 2016, FASB issued ASU No. 2016-09, “Compensation – Stock Compensation (Topic 718) – Improvements to Employee Share-Based Payment Accounting” (“ASU 2016-09”), which requires the tax effects related to share-based payments to be recorded through the income statement and simplifies the accounting requirements for forfeitures and employers' tax withholding requirements. ASU 2016-09 is effective for us for annual periods beginning January 1, 2017. The adoption of ASU 2016-09 will have an immaterial impact on our number of diluted shares and will eliminate the presentation of excess tax benefits as a financing inflow on our Consolidated Statements of Cash Flows. Further, we expect to make an accounting policy election to account for forfeitures of share-based compensation awards as they occur. We do not expect the adoption of ASU 2016-09 to have any other material impacts on our consolidated financial statements, however, we anticipate some moderate volatility in our effective tax rate as any windfall or shortfall tax benefits related to our share-based compensation incentives will be recorded directly into our results of operations.
Leases: In February 2016, FASB issued ASU No. 2016-02, “Leases (Topic 842)” (“ASU 2016-02”) which is intended to increase transparency and comparability among organizations relating to leases. Under ASU 2016-02, lessees will be required to recognize a liability to make lease payments and a right-of-use asset representing the right to use the underlying asset for the lease term (other than leases that meet the definition of a short-term lease). The FASB retained a dual model for lease classification, requiring leases to be classified as either operating or finance leases to determine recognition in the income statement and statements of cash flows; however, substantially all leases will be required to be recognized on the balance sheets. Operating leases will result in straight-line expense (similar to current operating leases) while finance leases will result in a front-loaded expense pattern (similar to current capital leases). This ASU will also require quantitative and qualitative disclosures regarding key information about leasing arrangements. ASU 2016-02 is effective for fiscal years, and interim periods within those fiscal years, beginning after December 15, 2018, with early adoption permitted. It must be adopted using a modified retrospective approach, and provides for certain practical expedients. The Company is currently evaluating the impact of this ASU on our consolidated financial statements, which we anticipate will have a material impact on the Consolidated Balance Sheets and no material impact on the Consolidated Statements of Comprehensive Income.
Revenue from Contracts with Customers: In August 2015, FASB issued ASU No. 2015-14, “Revenue from Contracts with Customers (Topic 606) – Deferral of the Effective Date” (“ASU 2015-14”). ASU 2015-14 defers the effective date of ASU No. 2014-09, “Revenue from Contracts with Customers (Topic 606)” (“ASU 2014-09”) which was issued in May 2014, by one year for all entities. ASU 2014-09 introduces a new five-step revenue recognition model in which an entity should recognize revenue to depict the transfer of promised goods or services to customers in an amount that reflects the consideration to which the entity expects to be entitled in exchange for those goods or services. It will be effective for annual periods beginning after December 15, 2017 for public companies. Early adoption is permitted but not before annual periods beginning after December 15, 2016.
Entities are permitted two transition methods of adoption under the new standard; 1) the full retrospective method, in which case the standard would be applied to all reporting periods presented, or 2) the modified retrospective method, with a cumulative-effect adjustment as of the date of adoption. In March, April and May 2016, the FASB issued additional ASUs clarifying certain aspects of ASU 2014-09. The core principle of ASU 2014-09 was not changed by the additional guidance. ASU 2015-09 is effective for us for annual periods beginning January 1, 2018.
F-14
CBIZ, INC. AND SUBSIDIARIES
NOTES TO THE CONSOLIDATED FINANCIAL STATEMENTS — (continued)
We are currently assessing the impact of adopting ASU 2014-09 on our revenue recognition practices. We have organized a team and have developed a project plan to guide the implementation. The project plan includes working sessions to review, evaluate and document the arrangements with customers under our various reporting units to identify potential differences that would result from applying the requirements of the new standard. We are currently in the process of developing an updated accounting policy, evaluating new disclosure requirements and identifying and implementing appropriate changes to business processes, systems and controls to support recognition and disclosure under the new standard. We have made significant progress on our assessment and will continue our evaluation of using either the full retrospective method or the modified retrospective method and will continue to evaluate the impact on our consolidated financial statements. We expect to finalize our evaluation in 2017 and will provide updates on our progress in future filings.
Note 2. Accounts Receivable, Net
Accounts receivable, net balances at December 31, 2016 and 2015 were as follows (in thousands):
|
|
|
2016 |
|
|
2015 |
|
||
|
Trade accounts receivable |
|
$ |
132,880 |
|
|
$ |
118,916 |
|
|
Unbilled revenue, at net realizable value |
|
|
55,982 |
|
|
|
47,351 |
|
|
Total accounts receivable |
|
|
188,862 |
|
|
|
166,267 |
|
|
Allowance for doubtful accounts |
|
|
(13,508 |
) |
|
|
(12,659 |
) |
|
Accounts receivable, net |
|
$ |
175,354 |
|
|
$ |
153,608 |
|
Changes in the allowance for doubtful accounts on accounts receivable are as follows (in thousands):
|
|
|
2016 |
|
|
2015 |
|
|
2014 |
|
|||
|
Balance at beginning of period |
|
$ |
(12,659 |
) |
|
$ |
(11,915 |
) |
|
$ |
(9,975 |
) |
|
Provision for losses |
|
|
(4,154 |
) |
|
|
(5,804 |
) |
|
|
(5,740 |
) |
|
Charge-offs, net of recoveries |
|
|
3,305 |
|
|
|
5,060 |
|
|
|
3,800 |
|
|
Balance at end of period |
|
$ |
(13,508 |
) |
|
$ |
(12,659 |
) |
|
$ |
(11,915 |
) |
Note 3. Property and Equipment, Net
Property and equipment, net at December 31, 2016 and 2015 consisted of the following (in thousands):
|
|
|
2016 |
|
|
2015 |
|
||
|
Buildings and leasehold improvements |
|
$ |
19,841 |
|
|
$ |
18,075 |
|
|
Furniture and fixtures |
|
|
23,893 |
|
|
|
23,515 |
|
|
Capitalized software |
|
|
36,429 |
|
|
|
35,632 |
|
|
Equipment |
|
|
11,751 |
|
|
|
11,396 |
|
|
Total property and equipment |
|
|
91,914 |
|
|
|
88,618 |
|
|
Accumulated depreciation and amortization |
|
|
(72,464 |
) |
|
|
(68,456 |
) |
|
Property and equipment, net |
|
$ |
19,450 |
|
|
$ |
20,162 |
|
Depreciation expense for property and equipment was $5.4 million, $5.7 million and $5.4 million in 2016, 2015 and 2014, respectively.
F-15
CBIZ, INC. AND SUBSIDIARIES
NOTES TO THE CONSOLIDATED FINANCIAL STATEMENTS — (continued)
Note 4. Goodwill and Other Intangible Assets, Net
A summary of changes in the carrying amount of goodwill by operating segment for the years ended December 31, 2016 and 2015 were as follows (in thousands):
|
|
|
Financial Services |
|
|
Benefits and Insurance Services |
|
|
National Practices |
|
|
Total Goodwill |
|
||||
|
December 31, 2014 |
|
$ |
268,630 |
|
|
$ |
164,935 |
|
|
$ |
1,666 |
|
|
$ |
435,231 |
|
|
Additions |
|
|
409 |
|
|
|
13,599 |
|
|
|
— |
|
|
|
14,008 |
|
|
Divestitures |
|
|
(1,554 |
) |
|
|
— |
|
|
|
— |
|
|
|
(1,554 |
) |
|
December 31, 2015 |
|
$ |
267,485 |
|
|
$ |
178,534 |
|
|
$ |
1,666 |
|
|
$ |
447,685 |
|
|
Additions |
|
|
3,845 |
|
|
|
35,954 |
|
|
|
— |
|
|
|
39,799 |
|
|
Divestitures |
|
|
— |
|
|
|
— |
|
|
|
— |
|
|
|
— |
|
|
December 31, 2016 |
|
$ |
271,330 |
|
|
$ |
214,488 |
|
|
$ |
1,666 |
|
|
$ |
487,484 |
|
We review goodwill at least annually for impairment in accordance with FASB ASC Topic 350 “Intangibles — Goodwill and Other.” The annual impairment review was performed as of November 1, 2016. Goodwill impairment is tested at the reporting unit level. At November 1, 2016, we had five reporting units. No goodwill impairment was recognized as a result of the annual evaluation performed as of November 1, 2016.
The components of goodwill and other intangible assets, net at December 31, 2016 and 2015 were as follows (in thousands):
|
|
|
2016 |
|
|
2015 |
|
||
|
Goodwill |
|
$ |
487,484 |
|
|
$ |
447,685 |
|
|
Intangibles : |
|
|
|
|
|
|
|
|
|
Client lists |
|
|
172,343 |
|
|
|
147,706 |
|
|
Other intangibles |
|
|
7,994 |
|
|
|
6,977 |
|
|
Total intangibles |
|
|
180,337 |
|
|
|
154,683 |
|
|
Total goodwill and other intangibles assets |
|
|
667,821 |
|
|
|
602,368 |
|
|
Accumulated amortization: |
|
|
|
|
|
|
|
|
|
Client lists |
|
|
(80,560 |
) |
|
|
(65,037 |
) |
|
Other intangibles |
|
|
(2,860 |
) |
|
|
(1,678 |
) |
|
Total accumulated amortization |
|
|
(83,420 |
) |
|
|
(66,715 |
) |
|
Goodwill and other intangible assets, net |
|
$ |
584,401 |
|
|
$ |
535,653 |
|
Amortization expense for client lists and other intangible assets was $16.7 million, $14.7 million and $14.5 million in 2016, 2015 and 2014, respectively. The weighted-average useful lives of total intangible assets, client lists and other intangible assets were 7.6 years, 7.5 years and 8.9 years, respectively. Other intangible assets are amortized over periods ranging from 2 to 15 years. Based on the amount of intangible assets subject to amortization at December 31, 2016, the estimated amortization expense is $17.4 million for 2017, $16.3 million for 2018, $12.1 million for 2019, $10.9 million for 2020 and $9.7 million for 2021.
Note 5. Financial Instruments
The carrying amounts of our cash and cash equivalents, accounts receivable and accounts payable approximate fair value because of the short maturity of these instruments. The carrying value of bank debt approximates fair value, as the interest rate on the bank debt is variable and approximates current market rates.
Concentrations of Credit Risk
Financial instruments that may subject us to concentration of credit risk consist primarily of cash and cash equivalents and accounts receivable. We place our cash and cash equivalents with highly-rated financial institutions, limiting the amount of credit exposure with any one financial institution. Our client base consists of large numbers of geographically diverse customers dispersed throughout the United States; thus, concentration of credit risk with respect to accounts receivable is not significant.
F-16
CBIZ, INC. AND SUBSIDIARIES
NOTES TO THE CONSOLIDATED FINANCIAL STATEMENTS — (continued)
We held corporate and municipal bonds with par values totaling $42.4 million and $40.8 million at December 31, 2016 and 2015, respectively. All bonds are investment grade and are classified as available-for-sale. Our bonds have maturity dates or callable dates ranging from January 2017 through December 2021, and are included in “Funds held for clients — current” in the accompanying Consolidated Balance Sheets based on the intent and ability of us to sell these investments at any time under favorable conditions.
The following table summarizes our bond activity for the years ended December 31, 2016 and 2015 (in thousands):
|
|
|
2016 |
|
|
2015 |
|
||
|
Fair value at January 1 |
|
$ |
43,142 |
|
|
$ |
38,399 |
|
|
Purchases |
|
|
11,355 |
|
|
|
15,429 |
|
|
Sales |
|
|
(2,900 |
) |
|
|
(987 |
) |
|
Maturities and calls |
|
|
(6,878 |
) |
|
|
(9,677 |
) |
|
Decrease (increase) in bond premium |
|
|
(106 |
) |
|
|
172 |
|
|
Fair market value adjustment |
|
|
(40 |
) |
|
|
(194 |
) |
|
Fair value at December 31 |
|
$ |
44,573 |
|
|
$ |
43,142 |
|
Interest Rate Swaps
Our $25.0 million notional value interest rate swap expired in June 2015. During the fourth quarter of 2015, we entered into three interest rate swaps. The notional hedged amounts were $10.0 million, $15.0 million and $25.0 million, with maturity tenors of 2, 3 and 5 years, respectively. During the first quarter of 2016, we entered into one interest rate swap. The notional hedged amount was $10.0 million with a maturity tenor of 5 years.
We do not purchase or hold any derivative instruments for trading or speculative purposes. We utilize interest rate swaps to manage interest rate risk exposure associated with our floating-rate debt under the credit facility. Under these interest rate swap contracts, we receive cash flows from counterparties at variable rates based on the London Interbank Offered Rate and pay the counterparties a fixed rate. To mitigate counterparty credit risk, we only entered into contracts with selected major financial institutions with investment grade ratings and continually assess their creditworthiness. There are no credit risk-related contingent features in our interest rate swaps nor do the swaps contain provisions under which we would be required to post collateral.
The designation of a derivative instrument as a hedge and its ability to meet the hedge accounting criteria determine how we reflect the change in fair value of the derivative instrument. A derivative qualifies for hedge accounting treatment if, at inception, it meets defined correlation and effectiveness criteria. These criteria require that the anticipated cash flows and/or changes in fair value of the hedging instrument substantially offset those of the position being hedged.
We had no fair value hedging instruments at December 31, 2016 or 2015. Our interest rate swaps are designated as cash flow hedges. Accordingly, the interest rate swaps are recorded as either an asset or liability in the accompanying Consolidated Balance Sheets at fair value. The mark-to-market gains or losses on the swaps are deferred and included as a component of AOCL, net of tax, to the extent the hedge is determined to be effective, and reclassified to interest expense in the same period during which the hedged transaction affects earnings. The interest rate swaps are assessed for effectiveness and continued qualification for hedge accounting on a quarterly basis. For the years ended December 31, 2016 and 2015, the interest rate swaps were deemed to be highly effective.
F-17
CBIZ, INC. AND SUBSIDIARIES
NOTES TO THE CONSOLIDATED FINANCIAL STATEMENTS — (continued)
The following table summarizes our outstanding interest rate swaps and their classification in the accompanying Consolidated Balance Sheets at December 31, 2016 and 2015 (in thousands). Refer to Note 6, Fair Value Measurements, to the accompanying consolidated financial statements for additional disclosures regarding fair value measurements.
|
|
|
December 31, 2016 |
||||||||
|
|
|
Notional Amount |
|
|
Fair Value |
|
|
Balance Sheet Location |
||
|
Interest rate swaps |
|
$ |
50,000 |
|
|
$ |
525 |
|
|
Other non-current assets |
|
Interest rate swaps |
|
$ |
10,000 |
|
|
$ |
4 |
|
|
Other current assets |
|
|
|
|
|
|
|
|
|
|
|
|
|
|
|
December 31, 2015 |
||||||||
|
|
|
Notional Amount |
|
|
Fair Value |
|
|
Balance Sheet Location |
||
|
Interest rate swap |
|
$ |
50,000 |
|
|
$ |
240 |
|
|
Other non-current assets |
During the next twelve months, the amount of the December 31, 2016 AOCL balance that will be reclassified to earnings is expected to be immaterial. The following table summarizes the effects of the interest rate swap on our accompanying Consolidated Statements of Comprehensive Income for the years ended December 31, 2016 and 2015 (in thousands):
|
|
|
Gain recognized in AOCL, net of tax |
|
|
Loss reclassified from AOCL into expense |
|
|
|
||||||||||
|
|
|
Twelve Months Ended December 31, |
|
|
Twelve Months Ended December 31, |
|
|
Location |
||||||||||
|
|
|
2016 |
|
|
2015 |
|
|
2016 |
|
|
2015 |
|
|
|
||||
|
Interest rate swap |
|
$ |
182 |
|
|
$ |
230 |
|
|
$ |
(410 |
) |
|
$ |
(214 |
) |
|
Interest expense |
Note 6. Fair Value Measurements
The valuation hierarchy under GAAP categorizes assets and liabilities measured at fair value into one of three different levels depending on the observability of the inputs employed in the measurement. The three levels are defined as follows:
|
|
• |
Level 1 — inputs to the valuation methodology are quoted prices (unadjusted) for identical assets or liabilities in active markets. |
|
|
• |
Level 2 — inputs to the valuation methodology include quoted prices for similar assets and liabilities in active markets, and inputs that are observable for the asset or liability, either directly or indirectly, for substantially the full term of the financial instrument. |
|
|
• |
Level 3 — inputs to the valuation methodology are unobservable and are significant to the fair value measurement. |
A financial instrument’s categorization within the valuation hierarchy is based upon the lowest level of input that is significant to the fair value measurement. Our assessment of the significance of a particular input to the fair value measurement in its entirety requires judgment and considers factors specific to the asset or liability.
The following table summarizes our assets and liabilities at December 31, 2016 and 2015 that are measured at fair value on a recurring basis subsequent to initial recognition and indicates the fair value hierarchy of the valuation techniques utilized by us to determine such fair value (in thousands):
|
|
|
Level |
|
|
December 31, 2016 |
|
|
December 31, 2015 |
|
|||
|
Deferred compensation plan assets |
|
|
1 |
|
|
$ |
69,912 |
|
|
$ |
64,245 |
|
|
Corporate and municipal bonds |
|
|
1 |
|
|
$ |
44,573 |
|
|
$ |
43,142 |
|
|
Interest rate swap |
|
|
2 |
|
|
$ |
529 |
|
|
$ |
240 |
|
|
Contingent purchase price liabilities |
|
|
3 |
|
|
$ |
(33,709 |
) |
|
$ |
(24,817 |
) |
F-18
CBIZ, INC. AND SUBSIDIARIES
NOTES TO THE CONSOLIDATED FINANCIAL STATEMENTS — (continued)
For the years ended December 31, 2016 and 2015, there were no transfers between the valuation hierarchy Levels 1, 2 and 3. The following table summarizes the change in fair value of our contingent purchase price liabilities identified as Level 3 for the years ended December 31, 2016 and 2015 (pre-tax basis, in thousands):
|
|
|
Contingent Purchase Price Liabilities |
|
|
|
Beginning balance — January 1, 2015 |
|
$ |
(33,368 |
) |
|
Additions from business acquisitions |
|
|
(8,522 |
) |
|
Payment of contingent purchase price payable |
|
|
14,364 |
|
|
Change in fair value of contingency |
|
|
2,854 |
|
|
Change in net present value of contingency |
|
|
(145 |
) |
|
Balance — December 31, 2015 |
|
$ |
(24,817 |
) |
|
Additions from business acquisitions |
|
|
(21,088 |
) |
|
Settlement of contingent purchase price payable |
|
|
11,202 |
|
|
Change in fair value of contingency |
|
|
1,342 |
|
|
Change in net present value of contingency |
|
|
(348 |
) |
|
Balance — December 31, 2016 |
|
$ |
(33,709 |
) |
Contingent Purchase Price Liabilities
Contingent purchase price liabilities result from business acquisitions and are classified as Level 3 due to the utilization of a probability weighted discounted cash flow approach to determine the fair value of the contingency. A contingent liability is established for each acquisition that has a contingent purchase price component and normally extends over a term of two to six years. The significant unobservable input used in the fair value measurement of the contingent purchase price liabilities is the future performance of the acquired business. The future performance of the acquired business directly impacts the contingent purchase price that is paid to the seller, thus performance that exceeds target could result in a higher payout, and a performance under target could result in a lower payout. Changes in the expected amount of potential payouts are recorded as adjustments to the initial contingent purchase price liability, with the same amount being recorded in the Consolidated Statements of Comprehensive Income. These liabilities are reviewed quarterly and adjusted if necessary. Refer to Note 18, Acquisitions, for further discussion of contingent purchase price liabilities.
The carrying amounts of our cash and cash equivalents, accounts, receivable and accounts payable approximate fair value because of the short maturity of these instruments, and the carrying value of bank debt approximates fair value as the interest rate on the bank debt is variable and approximates current market rates. As a result, the fair value measurement of our bank debt is considered to be Level 2.
Note 7. Income Taxes
For financial reporting purposes, income from continuing operations before income taxes includes the following components (in thousands):
|
|
|
2016 |
|
|
2015 |
|
|
2014 |
|
|||
|
United States |
|
$ |
66,848 |
|
|
$ |
57,665 |
|
|
$ |
50,385 |
|
|
Foreign (Canada) |
|
|
158 |
|
|
|
167 |
|
|
|
183 |
|
|
Total |
|
$ |
67,006 |
|
|
$ |
57,832 |
|
|
$ |
50,568 |
|
F-19
CBIZ, INC. AND SUBSIDIARIES
NOTES TO THE CONSOLIDATED FINANCIAL STATEMENTS — (continued)
Income tax expense included in the accompanying Consolidated Statements of Comprehensive Income for the years ended December 31, 2016, 2015 and 2014 was as follows (in thousands):
|
|
|
2016 |
|
|
2015 |
|
|
2014 |
|
|||
|
Continuing operations : |
|
|
|
|
|
|
|
|
|
|
|
|
|
Current: |
|
|
|
|
|
|
|
|
|
|
|
|
|
Federal |
|
$ |
18,816 |
|
|
$ |
18,079 |
|
|
$ |
15,749 |
|
|
Foreign |
|
|
42 |
|
|
|
43 |
|
|
|
47 |
|
|
State and local |
|
|
2,681 |
|
|
|
2,694 |
|
|
|
1,782 |
|
|
Total |
|
|
21,539 |
|
|
|
20,816 |
|
|
|
17,578 |
|
|
Deferred: |
|
|
|
|
|
|
|
|
|
|
|
|
|
Federal |
|
|
4,148 |
|
|
|
1,060 |
|
|
|
952 |
|
|
State and local |
|
|
712 |
|
|
|
953 |
|
|
|
1,624 |
|
|
Total |
|
|
4,860 |
|
|
|
2,013 |
|
|
|
2,576 |
|
|
Total income tax expense from continuing operations |
|
|
26,399 |
|
|
|
22,829 |
|
|
|
20,154 |
|
|
Discontinued operations : |
|
|
|
|
|
|
|
|
|
|
|
|
|
Operations of discontinued operations: |
|
|
|
|
|
|
|
|
|
|
|
|
|
Current |
|
|
(365 |
) |
|
|
(1,263 |
) |
|
|
51 |
|
|
Deferred |
|
|
(10 |
) |
|
|
68 |
|
|
|
(222 |
) |
|
Total |
|
|
(375 |
) |
|
|
(1,195 |
) |
|
|
(171 |
) |
|
Gain on disposal of discontinued operations: |
|
|
|
|
|
|
|
|
|
|
|
|
|
Current |
|
|
— |
|
|
|
427 |
|
|
|
34 |
|
|
Deferred |
|
|
— |
|
|
|
(344 |
) |
|
|
— |
|
|
Total |
|
|
— |
|
|
|
83 |
|
|
|
34 |
|
|
Total income tax expense from discontinued operations |
|
|
(375 |
) |
|
|
(1,112 |
) |
|
|
(137 |
) |
|
Total income tax expense |
|
$ |
26,024 |
|
|
$ |
21,717 |
|
|
$ |
20,017 |
|
The provision for income taxes attributable to income from continuing operations differed from the amount obtained by applying the federal statutory income tax rate to income from continuing operations before income taxes, as follows (in thousands, except percentages):
|
|
|
2016 |
|
|
2015 |
|
|
2014 |
|
|||
|
Tax at statutory rate (35%) |
|
$ |
23,452 |
|
|
$ |
20,241 |
|
|
$ |
17,699 |
|
|
State taxes (net of federal benefit) |
|
|
2,643 |
|
|
|
2,899 |
|
|
|
3,361 |
|
|
Business meals and entertainment — non-deductible |
|
|
784 |
|
|
|
779 |
|
|
|
667 |
|
|
Reserves for uncertain tax positions |
|
|
(87 |
) |
|
|
(324 |
) |
|
|
(1,724 |
) |
|
Net change in tax rate |
|
|
(64 |
) |
|
|
(1,046 |
) |
|
|
(214 |
) |
|
Other, net |
|
|
(329 |
) |
|
|
280 |
|
|
|
365 |
|
|
Provision for income taxes from continuing operations |
|
$ |
26,399 |
|
|
$ |
22,829 |
|
|
$ |
20,154 |
|
|
Effective income tax rate |
|
|
39.4 |
% |
|
|
39.5 |
% |
|
|
39.9 |
% |
The income tax benefits associated with the exercise of non-qualified stock options and restricted stock awards reflected in additional paid-in-capital were $1.1 million, $0.9 million and $0.5 million for the years ended December 31, 2016, December 31, 2015 and December 31, 2014, respectively.
F-20
CBIZ, INC. AND SUBSIDIARIES
NOTES TO THE CONSOLIDATED FINANCIAL STATEMENTS — (continued)
The tax effects of temporary differences that gave rise to significant portions of the deferred tax assets and deferred tax liabilities at December 31, 2016 and 2015, were as follows (in thousands):
|
|
|
2016 |
|
|
2015 |
|
||
|
Deferred tax assets: |
|
|
|
|
|
|
|
|
|
Net operating loss carryforwards . |
|
$ |
884 |
|
|
$ |
952 |
|
|
Allowance for doubtful accounts |
|
|
4,486 |
|
|
|
4,569 |
|
|
Employee benefits and compensation |
|
|
29,166 |
|
|
|
27,984 |
|
|
Lease costs |
|
|
2,772 |
|
|
|
3,318 |
|
|
State tax credit carryforwards |
|
|
1,489 |
|
|
|
1,393 |
|
|
Other deferred tax assets |
|
|
2,951 |
|
|
|
2,497 |
|
|
Total gross deferred tax assets |
|
|
41,748 |
|
|
|
40,713 |
|
|
Less: valuation allowance |
|
|
(1,314 |
) |
|
|
(1,376 |
) |
|
Total deferred tax assets, net |
|
$ |
40,434 |
|
|
$ |
39,337 |
|
|
Deferred tax liabilities: |
|
|
|
|
|
|
|
|
|
Accrued interest |
|
$ |
2,494 |
|
|
$ |
3,847 |
|
|
Client list intangible assets |
|
|
2,717 |
|
|
|
3,273 |
|
|
Goodwill and other intangibles |
|
|
38,646 |
|
|
|
32,114 |
|
|
Other deferred tax liabilities |
|
|
122 |
|
|
|
209 |
|
|
Total gross deferred tax liabilities |
|
$ |
43,979 |
|
|
$ |
39,443 |
|
|
Net deferred tax (liability) asset |
|
$ |
(3,545 |
) |
|
$ |
(106 |
) |
We have established valuation allowances for certain states’ deferred tax assets, primarily related to portions of the state net operating loss (“NOL”) carryforwards and state income tax credit carryforwards at December 31, 2016 and December 31, 2015. The net decrease in the valuation allowance of $0.1 million for the year ended December 31, 2016 related to changes in the valuation allowance for NOL’s. The net increase in the valuation allowance of $0.3 million for the year ended December 31, 2015 primarily related to changes in the valuation allowance for certain state tax credit carryforwards.
In assessing the realization of deferred tax assets, management considers all available positive and negative evidence, including projected future taxable income, scheduled reversal of deferred tax liabilities, historical financial operations and tax planning strategies. Based upon review of these items, management believes it is more-likely-than-not that the Company will realize the benefits of these deferred tax assets, net of the existing valuation allowances.
CBIZ and its subsidiaries file income tax returns in the United States, Canada, and most state jurisdictions. In March 2016, the Internal Revenue Service (“IRS”) completed its audit of the Company’s 2013 and 2014 federal income tax returns. We paid $0.5 million in settlement of this audit which had no impact on the 2016 income tax expense. With limited exceptions, our state and local income tax returns and non-U.S. income tax returns are no longer subject to tax authority examinations for years ending prior to January 1, 2012 and January 1, 2011, respectively.
The availability of NOL’s and state tax credits are reported as deferred tax assets, net of applicable valuation allowances, in the accompanying Consolidated Balance Sheets. At December 31, 2016, we had state net operating loss carryforwards of $23.9 million and state tax credit carryforwards of $1.5 million. The state net operating loss carryforwards expire on various dates between 2017 and 2030 and the state tax credit carryforwards expire on various dates between 2017 and 2036.
A reconciliation of the beginning and ending amount of unrecognized tax benefits is as follows (in thousands):
|
|
|
2016 |
|
|
2015 |
|
|
2014 |
|
|||
|
Balance at January 1 |
|
$ |
4,287 |
|
|
$ |
4,591 |
|
|
$ |
5,508 |
|
|
Additions for tax positions of the current year |
|
|
110 |
|
|
|
126 |
|
|
|
1,107 |
|
|
Additions for tax positions of prior years |
|
|
— |
|
|
|
— |
|
|
|
118 |
|
|
Settlements of prior year positions |
|
|
(11 |
) |
|
|
(94 |
) |
|
|
(1,343 |
) |
|
Lapse of statutes of limitation |
|
|
(296 |
) |
|
|
(336 |
) |
|
|
(799 |
) |
|
Balance at December 31 |
|
$ |
4,090 |
|
|
$ |
4,287 |
|
|
$ |
4,591 |
|
F-21
CBIZ, INC. AND SUBSIDIARIES
NOTES TO THE CONSOLIDATED FINANCIAL STATEMENTS — (continued)
Included in the balance of unrecognized tax benefits at December 31, 2016 are $2.6 million of unrecognized tax benefits that, if recognized, would affect the effective tax rate. We believe it is reasonably possible that certain of these unrecognized tax benefits could change in the next twelve months. We expect reductions in the liability for unrecognized tax benefits of approximately $0.3 million within the next twelve months due to expiration of statutes of limitation. Given the number of years that are currently subject to examination, we are unable to estimate the range of potential adjustments to the remaining balance of unrecognized tax benefits at this time.
We recognize interest expense, and penalties related to unrecognized tax benefits as a component of income tax expense. During 2016, we accrued interest expense of $0.2 million and, as of December 31, 2016, had recognized a liability for interest expense and penalties of $0.4 million and $0.3 million, respectively, relating to unrecognized tax benefits. During 2015, we accrued interest expense of $0.2 million and, as of December 31, 2015, had recognized a liability for interest expense and penalties of $0.3 million and $0.3 million, respectively, relating to unrecognized tax benefits.
Note 8. Debt and Financing Arrangements
At December 31, 2016, our primary financing arrangement was the $400 million credit facility which provides us with the capital necessary to meet our working capital needs as well as the flexibility to continue with our strategic initiatives, including business acquisitions and share repurchases. A previous financing arrangement, the 4.875% 2010 Convertible Senior Subordinated Notes (the “2010 Notes”), matured on October 1, 2015, as is discussed more fully below.
Bank Debt
We have a $400 million unsecured credit facility with Bank of America as agent for a group of eight participating banks that matures in July 2019. The balance outstanding under the credit facility was $191.4 million and $205.8 million at December 31, 2016 and December 31, 2015, respectively. Rates for the years ended December 31, 2016 and 2015 were as follows (includes bank debt and interest rate swaps):
|
|
|
2016 |
|
|
2015 |
|
||
|
Weighted average rates |
|
|
2.43% |
|
|
|
2.02% |
|
|
Range of effective rates |
|
1.82% - 3.75% |
|
|
1.65% - 3.50% |
|
||
We have approximately $137.5 million of available funds under the credit facility at December 31, 2016, based on the terms of the commitment.
|
|
• |
Available funds under the credit facility are based on a multiple of earnings before interest, taxes, depreciation and amortization as defined in the credit facility, and are reduced by letters of credit, performance guarantees, other indebtedness and outstanding borrowings under the credit facility. |
|
|
• |
Under the credit facility, loans are charged an interest rate consisting of a base rate or Eurodollar rate plus an applicable margin, letters of credit are charged based on the same applicable margin, and a commitment fee is charged on the unused portion of the credit facility. |
The credit facility provides us operating flexibility and funding to support seasonal working capital needs and other strategic initiatives such as acquisitions and share repurchases.
Debt Covenant Compliance
The credit facility is subject to certain financial covenants that may limit our ability to borrow up to the total commitment amount. Covenants require us to meet certain requirements with respect to (i) a total leverage ratio and (ii) minimum fixed charge coverage ratio. As of December 31, 2016, we were in compliance with these debt covenants.
The credit facility also places restrictions on our ability to create liens or other encumbrances, to make certain payments, investments, loans and guarantees and to sell or otherwise dispose of a substantial portion of assets, or to merge or consolidate with an unaffiliated entity. According to the terms of the credit facility, we are not permitted to declare or make any dividend payments, other than dividend payments made by one of our wholly-owned subsidiaries to us. The credit facility contains a provision that, in the event of a defined change in control, the credit facility may be terminated.
F-22
CBIZ, INC. AND SUBSIDIARIES
NOTES TO THE CONSOLIDATED FINANCIAL STATEMENTS — (continued)
Amendments to Credit Agreement
In 2015, we entered into two amendments to the Credit Agreement that governs the credit facility, dated as of July 28, 2014, by and among the Company and Bank of America, N.A., as administrative agent and bank, and other participating banks, to (i) remove certain events from the definition of Change of Control contained therein and (ii) to incorporate swap obligations in the Agreement. These amendments had no impact on the terms of the credit facility (other than as described above), the accompanying Consolidated Balance Sheets, Consolidated Statements of Comprehensive Income and Consolidated Statements of Cash Flows.
2010 Notes
As of December 31, 2016, no amounts related to the 2010 Notes were outstanding. The $48.4 million outstanding principal amount of the 2010 Notes matured on October 1, 2015. Holders received $1,000 in cash for each $1,000 principal amount of 2010 Notes along with the premium of the conversion value over par value. The $71.8 million conversion value of the 2010 Notes was determined by a cash averaging period that began on October 5, 2015 and ended on October 30, 2015. Cash payments were settled on November 4, 2015 with funds available under the credit facility.
Prior to the October 1, 2015 maturity date:
|
|
• |
We issued approximately 5.1 million shares of CBIZ common stock and paid cash consideration in exchange for $49.3 million of the Company’s 2010 Notes, in two privately negotiated transactions during the second quarter of 2015. Notes repurchased are deemed to be extinguished. |
|
|
• |
During the nine months ended September 30, 2014, we issued 1.5 million shares of CBIZ common stock plus cash consideration in privately negotiated transactions in exchange for retiring $32.4 million of its 2010 Notes. |
|
|
• |
We recorded non-operating charges of approximately $0.8 million and $1.5 million related to the privately negotiated transactions which are included in “Other income, net” in the accompanying Consolidated Statements of Comprehensive Income for the years ended December 31, 2015 and 2014, respectively. |
The common stock equivalents related to the 2010 Notes had no impact on diluted weighted average shares outstanding in 2016. The common stock equivalent impact during the year ended December 31, 2015 and 2014 was 1.2 million shares and 2.0 million shares, respectively.
Interest Expense
For the years ended December 31, 2016, 2015 and 2014, CBIZ recognized interest expense as follows (in thousands):
|
|
|
2016 |
|
|
2015 |
|
|
2014 |
|
|||
|
Credit facility (1) |
|
$ |
6,585 |
|
|
$ |
4,320 |
|
|
$ |
4,033 |
|
|
2010 Notes |
|
|
— |
|
|
|
4,559 |
|
|
|
9,068 |
|
|
2006 Notes (2) |
|
|
8 |
|
|
|
23 |
|
|
|
23 |
|
|
Balance at December 31 |
|
$ |
6,593 |
|
|
$ |
8,902 |
|
|
$ |
13,124 |
|
|
(1) |
Components of interest expense related to the credit facility include amortization of deferred financing costs, commitment fees and line of credit fees. |
|
(2) |
During the second quarter of 2016, we redeemed the remaining 3.125% Convertible Senior Subordinated Notes (the “2006 Notes”) for $750 thousand in cash plus accrued interest under an optional early redemption provision. |
F-23
CBIZ, INC. AND SUBSIDIARIES
NOTES TO THE CONSOLIDATED FINANCIAL STATEMENTS — (continued)
Note 9. Accumulated Other Comprehensive Loss
The components of accumulated other comprehensive loss at December 31, 2016 and 2015 were as follows (in thousands):
|
|
|
2016 |
|
|
2015 |
|
||
|
Net unrealized loss on available-for-sale securities, net of income tax benefit of $129 and $108, respectively |
|
$ |
(194 |
) |
|
$ |
(172 |
) |
|
Net unrealized gain on interest rate swap, net of income tax expense of $196 and $91, respectively |
|
|
333 |
|
|
|
151 |
|
|
Foreign currency translation |
|
|
(643 |
) |
|
|
(612 |
) |
|
Accumulated other comprehensive loss |
|
$ |
(504 |
) |
|
$ |
(633 |
) |
Note 10. Lease Commitments
Operating Leases
We lease certain of our office facilities and equipment under various operating leases. Future minimum cash commitments under operating leases as of December 31, 2016 were as follows (in thousands):
|
Year Ending December 31, |
|
Gross Operating Lease Commitments |
|
|
Sub-Leases |
|
|
Net Operating Lease Commitments |
|
|||
|
2017 |
|
$ |
30,571 |
|
|
$ |
306 |
|
|
$ |
30,265 |
|
|
2018 |
|
|
30,464 |
|
|
|
234 |
|
|
|
30,230 |
|
|
2019 |
|
|
26,282 |
|
|
|
234 |
|
|
|
26,048 |
|
|
2020 |
|
|
22,230 |
|
|
|
234 |
|
|
|
21,996 |
|
|
2021 |
|
|
17,921 |
|
|
|
— |
|
|
|
17,921 |
|
|
Thereafter |
|
|
75,859 |
|
|
|
— |
|
|
|
75,859 |
|
|
Total |
|
$ |
203,327 |
|
|
$ |
1,008 |
|
|
$ |
202,319 |
|
Rent expense for continuing operations (excluding consolidation and integration charges) incurred under operating leases was $37.0 million, $35.7 million and $34.3 million for the years ended December 31, 2016, 2015 and 2014, respectively. Rent expense does not necessarily reflect cash payments, as described under “Operating Leases” in Note 1.
Note 11. Commitments and Contingencies
Acquisitions
The purchase price that we normally pay for businesses and client lists consists of two components: an up-front non-contingent portion, and a portion which is contingent upon the acquired businesses or client lists’ actual future performance. The fair value of the purchase price contingency related to businesses is recorded at the date of acquisition and re-measured each reporting period until the liability is settled. Shares of CBIZ common stock that are issued in connection with acquisitions may be contractually restricted from sale for periods up to one year. Acquisitions are further disclosed in Note 18, Acquisitions.
Indemnifications
We have various agreements in which we may be obligated to indemnify the other party with respect to certain matters. Generally, these indemnification clauses are included in contracts arising in the normal course of business under which the Company customarily agrees to hold the other party harmless against losses arising from a breach of representations, warranties, covenants or agreements, related to matters such as title to assets sold and certain tax matters. Payment by us under such indemnification clauses are generally conditioned upon the other party making a claim. Such claims are typically subject to challenge by us and to dispute resolution procedures specified in the particular contract. Further, our obligations under these agreements may be limited in terms of time and/or amount and, in some instances, we may have recourse against third parties for certain payments made by us. It is not possible to predict the maximum potential amount of future payments under these indemnification agreements due to the conditional nature of our obligations and the unique facts of each particular agreement. Historically, we have not made any payments under these agreements that have been material individually or in the aggregate. As of December 31, 2016, we were not aware of any obligations arising under indemnification agreements that would require material payments.
F-24
CBIZ, INC. AND SUBSIDIARIES
NOTES TO THE CONSOLIDATED FINANCIAL STATEMENTS — (continued)
We maintain severance and employment agreements with certain of our executive officers, whereby such officers may be entitled to payment in the event of termination of their employment. We also have arrangements with certain non-executive employees which may include severance and other employment provisions. We accrue for amounts payable under these contracts and arrangements as triggering events occur and obligations become known. During the years ended December 31, 2016, 2015 and 2014, payments regarding such contracts and arrangements were not material.
Letters of Credit and Guarantees
We provide letters of credit to landlords (lessors) of our leased premises in lieu of cash security deposits which totaled $2.3 million at December 31, 2016 and 2015. In addition, we provide license bonds to various state agencies to meet certain licensing requirements. The amount of license bonds outstanding was $2.3 million at December 31, 2016 and 2015.
Legal Proceedings
In 2010, CBIZ, Inc. and its subsidiary, CBIZ MHM, LLC (fka CBIZ Accounting, Tax & Advisory Services, LLC) (the “CBIZ Parties”), were named as defendants in lawsuits filed in the U.S. District Court for the District of Arizona and the Superior Court for Maricopa County, Arizona. The federal court case is captioned Robert Facciola, et al v. Greenberg Traurig LLP, et al, and the state court cases are captioned Victims Recovery, LLC v. Greenberg Traurig LLP, et al, Roger Ashkenazi, et al v. Greenberg Traurig LLP, et al, Mary Marsh, et al v. Greenberg Traurig LLP, et al; and ML Liquidating Trust v. Mayer Hoffman McCann PC, et al. Prior to these suits CBIZ MHM, LLC was named as a defendant in Jeffrey C. Stone v. Greenberg Traurig LLP, et al.
These lawsuits arose out of the bankruptcy of Mortgages Ltd., a mortgage lender to developers in the Phoenix, Arizona area. Various other professional firms and individuals not related to the Company were also named defendants in these lawsuits. The lawsuits asserted claims for, among others things, violations of the Arizona Securities Act, common law fraud, and negligent misrepresentation, and sought to hold the CBIZ Parties vicariously liable for Mayer Hoffman’s conduct as Mortgage Ltd.’s auditor, as either a statutory control person under the Arizona Securities Act or a joint venturer under Arizona common law.
With the exception of claims being pursued by two plaintiffs from the Ashkenazi lawsuit (“Baldino Group”), all other related matters have been dismissed or settled without payment by the CBIZ Parties. The Baldino Group’s claims, which allege damages of approximately $16.0 million, are currently stayed as to the CBIZ Parties and Mayer Hoffman, and no trial date has been set.
On September 16, 2016, CBIZ, Inc. and its subsidiary CBIZ Benefits & Insurance Services, Inc. (“CBIZ Benefits”) were named as defendants in a lawsuit filed in the U.S. District Court for the Western District of Pennsylvania. The federal court case is brought by UPMC, d/b/a University of Pittsburgh Medical Center, and a health system it acquired, UPMC Altoona (formerly, Altoona Regional Health System). The lawsuit asserts professional negligence, breach of contract, and negligent misrepresentation claims against CBIZ, CBIZ Benefits and a former employee of CBIZ Benefits in connection with actuarial services provided by CBIZ Benefits to Altoona Regional Health System. The complaint seeks damages in an amount of no less than $142.0 million.
The Company cannot predict the outcome of the above matters or estimate the possible loss or range of possible loss, if any. Although the proceedings are subject to uncertainties inherent in the litigation process and the ultimate disposition of these proceedings is not presently determinable, the Company intends to vigorously defend these cases.
In addition to those items disclosed above, the Company is, from time to time, subject to claims and suits arising in the ordinary course of business.
Note 12. Employee Benefits
Employee Savings Plan
We sponsor a qualified 401(k) defined contribution plan that covers substantially all of our employees. Participating employees may elect to contribute, on a tax-deferred basis, up to 80% of their pre-tax annual compensation (subject to a maximum permissible contribution under Section 401(k) of the Internal Revenue Code). Matching contributions by us are 50% of the first 6% of base compensation that the participant contributes, and additional amounts may be contributed at the discretion of the Board of Directors. Participants may elect to invest their contributions in various funds including: equity, fixed income, stable value, and balanced -
F-25
CBIZ, INC. AND SUBSIDIARIES
NOTES TO THE CONSOLIDATED FINANCIAL STATEMENTS — (continued)
lifecycle funds. Employer contributions (net of forfeitures) made to the plan during the years ended December 31, 2016, 2015 and 2014 were approximately $9.6 million, $9.0 million and $8.5 million, respectively.
Non-qualified Deferred Compensation Plan
We sponsor a non-qualified deferred compensation plan, under which certain members of management and other highly compensated employees may elect to defer receipt of a portion of their annual compensation, subject to maximum and minimum percentage limitations. The amount of compensation deferred under the plan is credited to each participant’s deferral account and a non-qualified deferred compensation plan obligation is established by us. An amount equal to each participant’s compensation deferral is transferred into a rabbi trust and invested in various debt and equity securities as directed by the participants. The assets of the rabbi trust are held by the Company and recorded as “Assets of deferred compensation plan” in the accompanying Consolidated Balance Sheets.
Assets of the non- qualified deferred compensation plan consist primarily of investments in mutual funds, money market funds and equity securities. The values of these investments are based on published market prices at the end of the period. Adjustments to the fair value of these investments are recorded in “Other income, net,” offset by the same adjustments to compensation expense (recorded as “Operating expenses” or “G&A expenses” in the accompanying Consolidated Statements of Comprehensive Income).
We recorded a gain of $5.3 million for the year ended December 31, 2016, a loss of $0.7 million for the year ended December 31, 2015 and a gain of $3.7 million for the year ended December 31, 2014 related to these investments. These investments are specifically designated as available to the Company solely for the purpose of paying benefits under the non-qualified deferred compensation plan. However, the investments in the rabbi trusts would be available to all unsecured general creditors in the event that we become insolvent.
Deferred compensation plan obligations represent amounts due to plan participants and consist of accumulated participant deferrals and changes in fair value of investments thereon since the inception of the plan, net of withdrawals. This liability is an unsecured general obligation of the Company and is recorded as “Deferred compensation plan obligations” in the accompanying Consolidated Balance Sheets.
The assets and liabilities related to the non-qualified deferred compensation plan at December 31, 2016 and 2015 were $69.9 million and $64.2 million, respectively.
Note 13. Common Stock
The Company’s authorized common stock consists of 250.0 million shares of common stock, par value $0.01 per share (“common stock”). The holders of our common stock are entitled to one vote for each share held on all matters submitted to a vote of stockholders. There are no cumulative voting rights with respect to the election of directors. Accordingly, the holder or holders of a majority of the outstanding shares of common stock will be able to elect the directors of the Company then standing for election as terms expire. Holders of common stock have no preemptive rights and are entitled to such dividends as may be declared by the CBIZ Board of Directors out of funds legally available. The holders of our common stock are not entitled to any sinking fund, redemption or conversion rights. On liquidation, dissolution or winding up of the Company, the holders of common stock are entitled to share ratably in the net assets of the Company remaining after the payment to any and all creditors. The outstanding shares of common stock are duly authorized, validly issued, fully paid and non-assessable.
Treasury Stock
The CBIZ Board of Directors approved various share repurchase programs that were effective during the years ended December 31, 2016, 2015 and 2014. Under these programs, shares may be purchased in the open market or in privately negotiated transactions according to SEC rules.
The Company’s Share Repurchase Program (the “Share Repurchase Program”) does not obligate us to acquire any specific number of shares and may be suspended at any time. Repurchased shares are held in treasury and may be reserved for future use in connection with acquisitions, employee share plans and other general purposes. Under our credit facility, (described in Note 8, Debt and Financing Arrangements) share repurchases are unlimited when total leverage is less than 3.0. When leverage is greater than 3.0, the annual share repurchase is limited to $25.0 million.
F-26
CBIZ, INC. AND SUBSIDIARIES
NOTES TO THE CONSOLIDATED FINANCIAL STATEMENTS — (continued)
During the years ended December 31, 2016 and 2015, we repurchased 0.9 million and 3.8 million shares on the open market at a cost (including fees and commissions) of $9.1 million and $35.2 million under the Share Repurchase Program, respectively.
Note 14. Employee Share Plans
Employee Stock Purchase Plan
The 2007 Employee Stock Purchase Plan (“ESPP”), which has a termination date of June 30, 2017, allows qualified employees to purchase shares of common stock through payroll deductions up to a limit of $25,000 of stock per calendar year. The price an employee pays for shares is 85% of the fair market value of CBIZ common stock on the last day of the purchase period. Purchase periods begin on the sixteenth day of the month and end on the fifteenth day of the subsequent month. Other than a one-year holding period from the date of purchase, there is no vesting or other restrictions on the stock purchased by employees under the ESPP. Under the ESPP, the total number of shares of common stock that can be purchased shall not exceed two million shares.
Stock Awards
In 2015, our shareholders approved the CBIZ, Inc. 2014 Stock Incentive Plan (“2014 Plan”), which replaced and, for future grants, superseded the previous 2002 Plan. The 2014 Plan, which expires in 2024, has operating terms substantially similar to those of the 2002 Plan.
We granted various stock-based awards through the year ended December 31, 2016 under the 2014 Plan. The terms and vesting schedules for the stock-based awards vary by type and date of grant. A maximum of 9.6 million stock options, restricted stock or other stock based compensation awards may be granted. Shares subject to award under the 2014 Plan may be either authorized but unissued shares of CBIZ common stock or treasury shares. At December 31, 2016, approximately 8.2 million shares were available for future grant under the 2014 Plan.
We utilized the Black-Scholes-Merton option-pricing model to determine the fair value of stock options on the date of grant. The fair value of stock options granted during the years ended December 31, 2016, 2015 and 2014 were $2.40, $2.34, $2.25, respectively. The following weighted average assumptions were utilized:
|
|
|
2016 |
|
|
2015 |
|
|
2014 |
|
|||
|
Expected volatility (1) |
|
|
24.88 |
% |
|
|
26.65 |
% |
|
|
28.83 |
% |
|
Expected option life (years) (2) |
|
|
4.62 |
|
|
|
4.64 |
|
|
|
4.66 |
|
|
Risk-free interest rate (3) |
|
|
1.12 |
% |
|
|
1.32 |
% |
|
|
1.38 |
% |
|
Expected dividend yield (4) |
|
|
0 |
% |
|
|
0 |
% |
|
|
0 |
% |
|
(1) |
The expected volatility assumption was determined based upon the historical volatility of our stock price, using daily price intervals. |
|
(2) |
The expected option life was determined based upon our historical data using a midpoint scenario, which assumes all options are exercised halfway between the expiration date and the weighted average time it takes the option to vest. |
|
(3) |
The risk-free interest rate assumption was upon zero-coupon U.S. Treasury bonds with a term approximating the expected life of the respective options. |
|
(4) |
The expected dividend yield assumption was determined in view of our historical and estimated dividend payouts. We do not expect to change our dividend payout policy in the foreseeable future. |
During the years ended December 31, 2016, 2015 and 2014, we recognized compensation expense for these awards as follows (in thousands):
|
|
|
2016 |
|
|
2015 |
|
|
2014 |
|
|||
|
Stock options |
|
$ |
2,253 |
|
|
$ |
2,541 |
|
|
$ |
2,576 |
|
|
Restricted stock awards |
|
|
3,472 |
|
|
|
3,188 |
|
|
|
3,629 |
|
|
Total stock-based compensation expense before income tax benefit |
|
$ |
5,725 |
|
|
$ |
5,729 |
|
|
$ |
6,205 |
|
F-27
CBIZ, INC. AND SUBSIDIARIES
NOTES TO THE CONSOLIDATED FINANCIAL STATEMENTS — (continued)
Stock options granted during the years ended December 31, 2016, 2015 and 2014 were generally subject to a 25% incremental vesting schedule over a four-year period commencing from the date of grant. Stock options expire six years from the date of grant and are awarded with an exercise price equal to the market value of CBIZ common stock on the date of grant. At the discretion of the Compensation Committee of the Board of Directors, options awarded under the 2014 Plan may vest in a time period shorter than four years. Under the 2014 Plan, stock options awarded to non-employee directors have generally been granted with immediate vesting. Stock options may be granted alone or in addition to other awards and may be of two types: incentive stock options and nonqualified stock options. Stock option activity during the year ended December 31, 2016 was as follows (number of options in thousands):
|
|
|
Number of Options |
|
|
Weighted Average Exercise Price Per Share |
|
|
Weighted Average Remaining Contractual Term |
|
Aggregate Intrinsic Value (in millions) |
|
|||
|
Outstanding at December 31, 2015 |
|
|
4,885 |
|
|
$ |
7.50 |
|
|
|
|
|
|
|
|
Granted |
|
|
654 |
|
|
$ |
10.35 |
|
|
|
|
|
|
|
|
Exercised |
|
|
(1,127 |
) |
|
$ |
7.16 |
|
|
|
|
|
|
|
|
Expired or canceled |
|
|
(36 |
) |
|
$ |
7.56 |
|
|
|
|
|
|
|
|
Outstanding at December 31, 2016 |
|
|
4,376 |
|
|
$ |
8.02 |
|
|
3.17 years |
|
$ |
24.9 |
|
|
Vested and exercisable at December 31, 2016 |
|
|
2,215 |
|
|
$ |
7.08 |
|
|
2.25 years |
|
$ |
14.7 |
|
|
|
• |
The weighted-average grant-date fair value of stock options granted during the years ended December 31, 2016, 2015 and 2014 was $1.6 million, $2.1 million and $3.0 million, respectively. |
|
|
• |
The aggregate intrinsic value of stock options exercised during each of the years ended December 31, 2016, 2015 and 2014 was $4.2 million, $4.6 million and $2.3 million, respectively. The intrinsic value is calculated as the difference between CBIZ’s stock price on the exercise date and the exercise price of each option exercised. |
|
|
• |
At December 31, 2016, we had unrecognized compensation cost for non-vested stock options of $4.9 million to be recognized over a weighted average period of approximately 1.2 years. |
Restricted Stock Awards
Under the 2014 Plan, certain employees and non-employee directors were granted restricted stock awards. Restricted stock awards are independent of option grants and are granted at no cost to the recipients. The awards are subject to forfeiture if employment terminates prior to the release of restrictions, generally one to four years from the date of grant. Recipients of restricted stock awards are entitled to the same dividend and voting rights as holders of other CBIZ common stock, subject to certain restrictions during the vesting period, and the awards are considered to be issued and outstanding from the date of grant. Shares granted under the 2014 Plan cannot be sold, pledged, transferred or assigned during the vesting period.
Restricted stock award activity during the year ended December 31, 2016 was as follows:
|
|
|
Number of Shares (in thousands) |
|
|
Weighted Average Grant-Date Fair Value (1) |
|
||
|
Non-vested at December 31, 2015 |
|
|
962 |
|
|
$ |
8.08 |
|
|
Granted |
|
|
305 |
|
|
$ |
10.37 |
|
|
Vested |
|
|
(435 |
) |
|
$ |
7.66 |
|
|
Forfeited |
|
|
(5 |
) |
|
$ |
7.68 |
|
|
Non-vested at December 31, 2016 |
|
|
827 |
|
|
$ |
9.14 |
|
|
(1) |
Represents weighted average market value of the shares as the awards are granted at no cost to the recipients. |
|
|
• |
At December 31, 2016, CBIZ had unrecognized compensation cost for restricted stock awards of $7.6 million to be recognized over a weighted average period of approximately 1.12 years. |
|
|
• |
The total fair value of shares vested during the years ended December 31, 2016, 2015 and 2014 was approximately $3.3 million, $3.1 million and $3.5 million, respectively. |
F-28
CBIZ, INC. AND SUBSIDIARIES
NOTES TO THE CONSOLIDATED FINANCIAL STATEMENTS — (continued)
|
|
• |
Awards outstanding at December 31, 2016 will be released from restrictions at dates ranging from February 2017 through May 2020. |
Note 15. Earnings Per Share
The following table sets forth the reconciliation of the numerator and the denominator of basic earnings per share and diluted earnings per share from continuing operations for the years ended December 31, 2016, 2015 and 2014 (in thousands, except per share data):
|
|
|
Year Ended December 31, |
|
|||||||||
|
|
|
2016 |
|
|
2015 |
|
|
2014 |
|
|||
|
Numerator: |
|
|
|
|
|
|
|
|
|
|
|
|
|
Income from continuing operations |
|
$ |
40,607 |
|
|
$ |
35,003 |
|
|
$ |
30,414 |
|
|
Denominator: |
|
|
|
|
|
|
|
|
|
|
|
|
|
Basic |
|
|
|
|
|
|
|
|
|
|
|
|
|
Weighted average common shares outstanding |
|
|
52,321 |
|
|
|
50,280 |
|
|
|
48,343 |
|
|
Diluted |
|
|
|
|
|
|
|
|
|
|
|
|
|
Stock options (1) |
|
|
870 |
|
|
|
876 |
|
|
|
761 |
|
|
Restricted stock awards |
|
|
261 |
|
|
|
277 |
|
|
|
293 |
|
|
Contingent shares (2) |
|
|
61 |
|
|
|
29 |
|
|
|
129 |
|
|
Convertible senior subordinated notes (3) |
|
|
— |
|
|
|
1,231 |
|
|
|
1,961 |
|
|
Diluted weighted average common shares outstanding |
|
|
53,513 |
|
|
|
52,693 |
|
|
|
51,487 |
|
|
Earnings Per Share: |
|
|
|
|
|
|
|
|
|
|
|
|
|
Basic earnings per share from continuing operations |
|
$ |
0.78 |
|
|
$ |
0.70 |
|
|
$ |
0.63 |
|
|
Diluted earnings per share from continuing operations |
|
$ |
0.76 |
|
|
$ |
0.66 |
|
|
$ |
0.59 |
|
|
(1) |
For the years ended December 31, 2016, 2015 and 2014, a total of 0.8 million, 1.5 million and 0.9 million stock based awards, respectively, were excluded from the calculation of diluted earnings per share as their exercise prices would render them anti-dilutive. |
|
(2) |
Contingent shares represent additional shares to be issued for purchase price earned by former owners of businesses acquired by CBIZ once future conditions have been met. For further details, refer to Note 18, Acquisitions. |
|
(3) |
The 2010 Notes were retired on October 1, 2015 with the amounts available under the credit facility. The dilutive impact of potential shares to be issued related to the 2010 Notes was based on the average share price of $9.62 and $8.71 in 2015 and 2014, which exceeded the conversion price of $7.41. |
Note 16. Supplemental Cash Flow Disclosures
Cash paid for interest and income taxes during the years ended December 31, 2016, 2015 and 2014 were as follows (in thousands):
|
|
|
2016 |
|
|
2015 |
|
|
2014 |
|
|||
|
Interest |
|
$ |
6,019 |
|
|
$ |
7,986 |
|
|
$ |
9,268 |
|
|
Income taxes |
|
$ |
19,314 |
|
|
$ |
23,558 |
|
|
$ |
18,277 |
|
Note 17. Related Parties
The following is a summary of certain agreements and transactions between or among the Company and certain related parties. Management reviews these transactions as they occur and monitors them for compliance with the Company’s Code of Conduct, internal procedures and applicable legal requirements. The Audit Committee reviews and ratifies such transactions annually, or as they are more frequently brought to the attention of the Audit Committee by the Company’s Director of Internal Audit, General Counsel or other members of Management.
F-29
CBIZ, INC. AND SUBSIDIARIES
NOTES TO THE CONSOLIDATED FINANCIAL STATEMENTS — (continued)
A number of the businesses acquired by us are located in properties owned indirectly by and leased from persons employed by the Company, none of whom are members of our senior management. In the aggregate, we paid approximately $3.2 million, $2.7 million and $2.2 million during the years ended December 31, 2016, 2015 and 2014, respectively, under such leases.
Rick L. Burdick, a director of CBIZ, is a partner of Akin Gump Strauss Hauer & Feld LLP (“Akin Gump”). Akin Gump performed legal work for the Company during the years ended December 31, 2016, 2015 and 2014 for which we paid approximately $0.1 million, $0.2 million and $0.6 million, respectively.
We maintain joint-referral relationships and administrative service agreements with independent licensed CPA firms under which we provide administrative services in exchange for a fee. These firms are owned by licensed CPAs who are employed by our subsidiaries and provide audit and attest services to clients including our clients. The CPA firms with which we maintain administrative service agreements operate as limited liability companies, limited liability partnerships or professional corporations. The firms are separate legal entities with separate governing bodies and officers. We have no ownership interest in any of these CPA firms, and neither the existence of the administrative service agreements nor the providing of services thereunder is intended to constitute control of the CPA firms by the Company. CBIZ and the CPA firms maintain their own respective liability and risk of loss in connection with performance of each of its respective services, and we do not believe that our arrangements with these CPA firms result in additional risk of loss.
Note 18. Acquisitions
2016
During the year ended December 31, 2016, we acquired substantially all of the non-attest assets of six businesses; Millimaki Eggert, L.L.P. (“Millimaki”), The Savitz Organization (“Savitz”), Flex-Pay Business Services, Inc. (Flex-Pay”), Ed Jacobs & Associates, Inc. (“EJ&A”), Actuarial Consultants, Inc. (“ACI”) and The Seff Group, P.C. (“Seff”). Aggregate consideration for such acquisitions was approximately $40.0 million in cash, $2.1 million in CBIZ common stock, and $21.1 million in contingent consideration.
Under the terms of the acquisition agreements, a portion of the purchase price is contingent on future performance of the businesses acquired. The maximum potential undiscounted amount of all future payments that we could be required to make under the contingent arrangements is $23.5 million. We are required to record the fair value of this obligation at the acquisition date. Utilizing a probability weighted income approach, we determined that the fair value of the contingent consideration arrangement was $21.1 million, of which $6.6 million was recorded in “Contingent purchase price liability — current” and $14.5 million was recorded in “Contingent purchase price liability — non-current” in the accompanying Consolidated Balance Sheets at December 31, 2016.
Annualized revenue for these acquisitions is estimated to be approximately $41.2 million. Pro forma results of operations have not been presented because the effects of these acquisitions, individually and in aggregate, were not material to our “Income from continuing operations before income taxes.”
First Quarter 2016
|
|
• |
The acquisition of Millimaki, located in San Diego, California, was effective January 1, 2016. Millimaki provides professional tax, accounting, and financial services, with a specialty niche practice in the real estate sector, to closely held businesses, their owners, and mid-to-high net worth individuals. Operating results are reported in the Financial Services practice group. |
Second Quarter 2016
|
|
• |
The acquisition of Savitz, headquartered in Philadelphia, Pennsylvania, with offices in Atlanta, Georgia, and Newton, Massachusetts, was effective April 1, 2016. Savitz is an employee retirement and health and welfare benefits firm that provides actuarial, consulting and administration outsourcing services. Operating results are reported in the Benefit and Insurance Services practice group. |
|
|
• |
The acquisition of Flex-Pay, located in Winston-Salem, North Carolina, was effective June 1, 2016. Flex-Pay provides payroll processing, Affordable Care Act fulfillment, and human resource solutions to more than 3,600 clients primarily in the Southeast. Operating results are reported in the Benefit and Insurance Services practice group. |
F-30
CBIZ, INC. AND SUBSIDIARIES
NOTES TO THE CONSOLIDATED FINANCIAL STATEMENTS — (continued)
|
|
• |
The acquisition of EJ&A, an employee benefits consulting business located in Cleveland, Tennessee, was effective July 1, 2016. Operating results are reported in the Benefit and Insurance Services practice group. |
Fourth Quarter 2016
|
|
• |
The acquisition of ACI, based in Torrance, California, was effective November 1, 2016. ACI provides design, consultation and administration of 401(k) plans, profit-sharing plans, nonqualified plan administration and traditional defined benefit plans. Operating results are reported in the Benefit and Insurance Services practice group. |
|
|
• |
The acquisition of Seff, a full service accounting, tax, compliance and financial consulting firm located in Denver, Colorado, was effective November 1, 2016. Operating results attributable to Seff are reported in the Financial Services practice group. |
2015
During the year ended December 31, 2015, we acquired substantially all of the assets of three businesses; Model Consulting, Inc. (“Model”), Pension Resource Group, Inc. (“PRG”) and Cottonwood Group, Inc. (“Cottonwood”). Aggregate consideration for these acquisitions consisted of approximately $10.5 million in cash, $1.4 million in CBIZ common stock, and $8.5 million in contingent consideration.
Under the terms of the acquisition agreements, a portion of the purchase price is contingent on future performance of the businesses acquired. The maximum potential undiscounted amount of all future payments that we could be required to make under the contingent arrangements is $8.7 million. We are required to record the fair value of this obligation at the acquisition date. Utilizing a probability weighted income approach, we determined that the fair value of the contingent consideration arrangement was $8.5 million, of which $2.9 million was recorded in “Contingent purchase price liability — current” and $5.6 million was recorded in “Contingent purchase price liability — non-current” in the accompanying Consolidated Balance Sheets at December 31, 2015.
Pro forma results of operations have not been presented because the effects of these acquisitions, individually and in aggregate, were not material to our “Income from continuing operations before income taxes.”
First Quarter 2015
The acquisition of Model, located in Trevose, Pennsylvania, was effective March 1, 2015. Model provides employee benefit consulting services to mid-sized companies in the Philadelphia and Southern New Jersey markets. Operating results are reported in the Benefit and Insurance Services practice group.
Fourth Quarter 2015
|
|
• |
The acquisition of PRG, located in Woodstock, Georgia, was effective October 1, 2015. PRG provides pension administration solutions including defined benefit administration, data warehousing, benefit communication, compensation statement and human capital services to clients ranging in size from 500 to over 60,000 participants. Operating results are reported in the Benefits and Insurance Services practice group. |
|
|
• |
The acquisition of Cottonwood, located in Overland Park, Kansas, was effective December 1, 2015. Cottonwood provides pension plan consulting, actuarial and investment services for institutional pension plans, retirement funds, endowment funds and foundations. Operating results are reported in the Benefits and Insurance Services practice group. |
2014
During the year ended December 31, 2014, we acquired substantially all of the assets of six businesses; Centric Insurance Agency (“Centric”), Clearview National Partners, LLC (“Clearview”), Lewis Birch & Ricardo, LLC (“LBR”), Tegrit Group (“Tegrit”), Rognstad’s Inc. d.b.a. Sattler Insurance Agency (“Sattler”) and Weekes & Callaway (“W&C”). Aggregate consideration for these acquisitions consisted of approximately $43.9 million in cash, $2.9 million in CBIZ common stock, and $19.4 million in contingent consideration.
F-31
CBIZ, INC. AND SUBSIDIARIES
NOTES TO THE CONSOLIDATED FINANCIAL STATEMENTS — (continued)
Under the terms of the acquisition agreements, a portion of the purchase price is contingent on future performance of the businesses acquired. The maximum potential undiscounted amount of all future payments that we could be required to make under the contingent arrangements is $20.9 million. We are required to record the fair value of this obligation at the acquisition date. Utilizing a probability weighted income approach, we determined that the fair value of the contingent consideration arrangement was $19.4 million, of which $5.0 million was recorded in “Contingent purchase price liability — current” and $14.4 million was recorded in “Contingent purchase price liability — non-current” in the accompanying Consolidated Balance Sheets at December 31, 2014.
Pro forma results of operations have not been presented because the effects of these acquisitions, individually and in aggregate, were not material to our “Income from continuing operations before income taxes.”
First Quarter 2014
|
|
• |
The acquisition of Centric, located in New Providence, New Jersey, was effective January 1, 2014. Centric is an insurance broker providing property and casualty insurance, with a specialty in education and public schools. Operating results are reported in the Benefit and Insurance Services practice group. |
|
|
• |
The acquisition of Clearview, a specialized employee benefits broker focused on providing employee benefit solutions to clients with more than 100 employees, located in Waltham, Massachusetts, was effective January 1, 2014. Operating results are reported in the Benefit and Insurance Services practice group. |
|
|
• |
The acquisition of LBR, located in Tampa Bay, Florida, was effective February 1, 2014. LBR is a professional tax, accounting and consulting service provider with significant experience and expertise in matrimonial and family law litigation support, not-for-profit entities and health care provider services. Operating results are reported in the Financial Services practice group. |
Second Quarter 2014
|
|
• |
The acquisition of Tegrit, a national provider of actuarial consulting and retirement plan administration based in Akron, Ohio, was effective June 1, 2014. Operating results are reported in the Benefit and Insurance Services practice group. |
Third Quarter 2014
|
|
• |
The acquisition of Sattler, based in Lewiston, Idaho, was effective September 1, 2014. Sattler provides property and casualty, personal, and life insurance services, with a specialty in outdoor recreation insurance, to businesses across the United States. Operating results are reported in the Benefit and Insurance Services practice group. |
Fourth Quarter 2014
|
|
• |
The acquisition of W&C, located in Delray Beach, Florida, was effective November 1, 2014. W&C is a full service insurance brokerage firm offering clients a complete line of services including commercial lines, personal lines, risk management, and employee benefits. Operating results are reported in the Benefit and Insurance Services practice group. |
F-32
CBIZ, INC. AND SUBSIDIARIES
NOTES TO THE CONSOLIDATED FINANCIAL STATEMENTS — (continued)
The following table summarizes the amounts of identifiable assets acquired, liabilities assumed and aggregate purchase price for the acquisitions in 2016, 2015 and 2014 (in thousands):
|
|
|
2016 |
|
|
2015 |
|
|
2014 |
|
|||
|
Cash |
|
$ |
10 |
|
|
$ |
— |
|
|
$ |
1,381 |
|
|
Accounts receivable, net |
|
|
6,649 |
|
|
|
1,501 |
|
|
|
4,204 |
|
|
Funds held for clients |
|
|
37,230 |
|
|
|
— |
|
|
|
— |
|
|
Property and equipment |
|
|
440 |
|
|
|
— |
|
|
|
— |
|
|
Other assets |
|
|
294 |
|
|
|
52 |
|
|
|
464 |
|
|
Identifiable intangible assets |
|
|
22,177 |
|
|
|
7,037 |
|
|
|
17,952 |
|
|
Accounts payable |
|
|
— |
|
|
|
(62 |
) |
|
|
(3,319 |
) |
|
Accrued liabilities |
|
|
(1,133 |
) |
|
|
(1,552 |
) |
|
|
(3,513 |
) |
|
Income taxes payable |
|
|
— |
|
|
|
— |
|
|
|
(1,058 |
) |
|
Deferred taxes |
|
|
— |
|
|
|
— |
|
|
|
(1,834 |
) |
|
Client fund obligations |
|
|
(37,230 |
) |
|
|
— |
|
|
|
— |
|
|
Total identifiable net assets |
|
$ |
28,437 |
|
|
$ |
6,976 |
|
|
$ |
14,277 |
|
|
Goodwill |
|
|
34,803 |
|
|
|
13,471 |
|
|
|
51,873 |
|
|
Aggregate purchase price |
|
$ |
63,240 |
|
|
$ |
20,447 |
|
|
$ |
66,150 |
|
The goodwill of $34.8 million, $13.5 million and $51.9 million arising from the acquisitions in 2016, 2015 and 2014, respectively, consists largely of expected future earnings and cash flows from the existing management team, as well as the synergies created by the integration of the new businesses within the CBIZ organization, including cross-selling opportunities expected with our Financial Services group and the Benefit and Insurance Services group, to help strengthen our existing service offerings and expand our market position. All of the goodwill is deductible for income tax purposes for 2016 and 2015, while substantially all of the goodwill is deductible for 2014.
Client Lists
In 2016, we purchased seven client lists, one of which is recorded in the Financial Services practice group and six of which are reported in the Benefit and Insurance Services practice group. Total consideration for these client lists was $1.2 million cash paid at closing and an additional $1.2 million in guaranteed future consideration, and $1.5 million which is contingent upon future financial performance of the client list.
We purchased six client lists in 2015, all of which are reported in the Benefit and Insurance Services practice group. Total consideration for these client lists was $2.8 million cash paid at closing and an additional $0.8 million in guaranteed future consideration, and $0.1 million which is contingent upon future financial performance of the client list.
In 2014, we purchased four client lists, three of which are reported in the Financial Services practice group and one of which is recorded in the Benefit and Insurance Services practice group. Total consideration for these client lists was $1.0 million cash paid at closing and an additional $0.2 million in cash, which is contingent upon future financial performance of the client list.
Contingent Earnouts for Previous Acquisitions
Under the terms of the acquisition agreements, we pay cash consideration and issue shares of CBIZ common stock as contingent earnout for previous acquisitions. In 2016, we paid $7.1 million in cash and issued approximately 0.4 million shares of common stock. In 2015, we paid $12.0 million in cash and issued approximately 0.3 million shares of common stock and in 2014, we paid $4.6 million in cash and issued approximately 0.1 million shares of common stock.
Change in Contingent Purchase Price Liability for Previous Acquisitions
In accordance with FASB ASC Topic 805, “Business Combinations,” we are required to evaluate in subsequent reporting periods the fair value of contingent consideration related to previous acquisitions. We decreased the fair value of the contingent purchase price liability related to prior acquisitions in 2016, by $1.3 million, due to lower than originally projected future results of the acquired businesses. In 2015 and 2014, we decreased the fair value of the contingent purchase price liability by $2.9 million and $3.9 million, respectively. These decreases are included as income in “Other income, net” in the accompanying Consolidated Statements of
F-33
CBIZ, INC. AND SUBSIDIARIES
NOTES TO THE CONSOLIDATED FINANCIAL STATEMENTS — (continued)
Comprehensive Income. For further discussion on contingent purchase price liabilities, refer to Note 6, Fair Value Measurements, to the accompanying consolidated financial statements.
Note 19. Discontinued Operations and Divestitures
CBIZ will divest (through sale or closure) business operations that do not contribute to the Company’s long-term objectives for growth, or that are not complementary to its target service offerings and markets. Divestitures are classified as discontinued operations provided they meet the criteria as provided in FASB ASC Topic 205 “Presentation of Financial Statements — Discontinued Operations — Other Presentation Matters”.
Discontinued Operations
Discontinued operations primarily consist of two small businesses under the Financial Services segment. In 2014, we committed to a plan to sell these businesses and classified them as held for sale. In 2015, we completed the sale of these businesses for a total purchase price of $2.7 million and recorded a gain of $1.4 million in “Gain on disposal of discontinued operations, net of tax” in the accompanying Consolidated Statements of Comprehensive Income. Proceeds that are contingent upon a divested operation’s actual future performance are recorded as gain on sale of discontinued operations in the period in which they are earned.
Summarized financial information for discontinued operations is shown below (in thousands):
|
|
|
2016 |
|
|
2015 |
|
|
2014 |
|
|||
|
Revenue |
|
$ |
— |
|
|
$ |
6,248 |
|
|
$ |
14,589 |
|
|
Loss from operations of discontinued operations before income tax expense |
|
$ |
(917 |
) |
|
$ |
(3,518 |
) |
|
$ |
(925 |
) |
|
Income tax benefit |
|
|
(375 |
) |
|
|
(1,195 |
) |
|
|
(171 |
) |
|
Loss from operations of discontinued operations, net of tax |
|
$ |
(542 |
) |
|
$ |
(2,323 |
) |
|
$ |
(754 |
) |
|
|
|
|
|
|
|
|
|
|
|
|
|
|
|
Gain on disposal of discontinued operations, before income tax expense |
|
$ |
— |
|
|
$ |
1,510 |
|
|
$ |
133 |
|
|
Income tax expense |
|
|
— |
|
|
|
83 |
|
|
|
34 |
|
|
Gain on disposal of discontinued operations, net of tax |
|
$ |
— |
|
|
$ |
1,427 |
|
|
$ |
99 |
|
Divestitures
Gains or losses from divested operations and assets that do not qualify for treatment as discontinued operations under GAAP are recorded as “Gain on sale of operations, net” in the accompanying Consolidated Statements of Comprehensive Income. The $0.9 million net gain on sale of operations in 2016 was primarily due to the sale of two small books of business under the Benefits and Insurance Services practice group. The net gain on sale of operations of $1.3 million in 2014 was primarily due to the sale of the Miami, Florida office under the Financial Services practice group.
F-34
CBIZ, INC. AND SUBSIDIARIES
NOTES TO THE CONSOLIDATED FINANCIAL STATEMENTS — (continued)
Note 20. Quarterly Financial Data (Unaudited)
The following is a summary of the unaudited quarterly results of operations for the years ended December 31, 2016 and 2015 (in thousands, except per share amounts).
|
|
|
2016 |
|
|||||||||||||
|
|
|
March 31, |
|
|
June 30, |
|
|
September 30, |
|
|
December 31, |
|
||||
|
Revenue |
|
$ |
224,238 |
|
|
$ |
197,015 |
|
|
$ |
199,794 |
|
|
$ |
178,785 |
|
|
Operating expenses |
|
|
178,117 |
|
|
|
173,996 |
|
|
|
174,069 |
|
|
|
171,544 |
|
|
Gross margin |
|
|
46,121 |
|
|
|
23,019 |
|
|
|
25,725 |
|
|
|
7,241 |
|
|
Corporate general and administrative expenses |
|
|
10,245 |
|
|
|
8,346 |
|
|
|
8,679 |
|
|
|
9,049 |
|
|
Operating income (loss) |
|
|
35,876 |
|
|
|
14,673 |
|
|
|
17,046 |
|
|
|
(1,808 |
) |
|
Other income (expense): |
|
|
|
|
|
|
|
|
|
|
|
|
|
|
|
|
|
Interest expense |
|
|
(1,526 |
) |
|
|
(1,733 |
) |
|
|
(1,760 |
) |
|
|
(1,574 |
) |
|
Gain on sale of operations, net |
|
|
101 |
|
|
|
50 |
|
|
|
329 |
|
|
|
375 |
|
|
Other income, net |
|
|
2,147 |
|
|
|
703 |
|
|
|
2,632 |
|
|
|
1,475 |
|
|
Total other income (expense), net |
|
|
722 |
|
|
|
(980 |
) |
|
|
1,201 |
|
|
|
276 |
|
|
Income (loss) from continuing operations before income tax expense (benefit) |
|
|
36,598 |
|
|
|
13,693 |
|
|
|
18,247 |
|
|
|
(1,532 |
) |
|
Income tax expense (benefit) |
|
|
14,800 |
|
|
|
5,306 |
|
|
|
7,260 |
|
|
|
(967 |
) |
|
Income (loss) from continuing operations |
|
|
21,798 |
|
|
|
8,387 |
|
|
|
10,987 |
|
|
|
(565 |
) |
|
Loss from operations of discontinued operations, net of tax |
|
|
(30 |
) |
|
|
(258 |
) |
|
|
(133 |
) |
|
|
(121 |
) |
|
Net income (loss) |
|
$ |
21,768 |
|
|
$ |
8,129 |
|
|
$ |
10,854 |
|
|
$ |
(686 |
) |
|
Earnings (loss) per share: |
|
|
|
|
|
|
|
|
|
|
|
|
|
|
|
|
|
Basic: |
|
|
|
|
|
|
|
|
|
|
|
|
|
|
|
|
|
Continuing operations |
|
$ |
0.42 |
|
|
$ |
0.16 |
|
|
$ |
0.21 |
|
|
$ |
(0.01 |
) |
|
Discontinued operations |
|
|
— |
|
|
|
— |
|
|
|
— |
|
|
|
— |
|
|
Net income (loss) |
|
$ |
0.42 |
|
|
$ |
0.16 |
|
|
$ |
0.21 |
|
|
$ |
(0.01 |
) |
|
Diluted: |
|
|
|
|
|
|
|
|
|
|
|
|
|
|
|
|
|
Continuing operations |
|
$ |
0.41 |
|
|
$ |
0.16 |
|
|
$ |
0.20 |
|
|
$ |
(0.01 |
) |
|
Discontinued operations |
|
|
— |
|
|
|
— |
|
|
|
— |
|
|
|
— |
|
|
Net income (loss) |
|
$ |
0.41 |
|
|
$ |
0.16 |
|
|
$ |
0.20 |
|
|
$ |
(0.01 |
) |
|
Basic weighted average common shares |
|
|
51,572 |
|
|
|
52,031 |
|
|
|
52,648 |
|
|
|
53,019 |
|
|
Diluted weighted average common shares |
|
|
52,745 |
|
|
|
53,079 |
|
|
|
53,846 |
|
|
|
53,019 |
|
F-35
CBIZ, INC. AND SUBSIDIARIES
NOTES TO THE CONSOLIDATED FINANCIAL STATEMENTS — (continued)
|
|
|
2015 |
|
|||||||||||||
|
|
|
March 31, |
|
|
June 30, |
|
|
September 30, |
|
|
December 31, |
|
||||
|
Revenue |
|
$ |
213,866 |
|
|
$ |
185,042 |
|
|
$ |
187,102 |
|
|
$ |
164,412 |
|
|
Operating expenses (1) |
|
|
170,864 |
|
|
|
163,117 |
|
|
|
158,496 |
|
|
|
159,914 |
|
|
Gross margin |
|
|
43,002 |
|
|
|
21,925 |
|
|
|
28,606 |
|
|
|
4,498 |
|
|
Corporate general and administrative expenses (1) |
|
|
9,865 |
|
|
|
6,615 |
|
|
|
8,028 |
|
|
|
8,019 |
|
|
Operating income (loss) |
|
|
33,137 |
|
|
|
15,310 |
|
|
|
20,578 |
|
|
|
(3,521 |
) |
|
Other (expense) income: |
|
|
|
|
|
|
|
|
|
|
|
|
|
|
|
|
|
Interest expense |
|
|
(2,977 |
) |
|
|
(2,848 |
) |
|
|
(1,840 |
) |
|
|
(1,237 |
) |
|
Gain (loss) on sale of operations, net |
|
|
56 |
|
|
|
45 |
|
|
|
5 |
|
|
|
(22 |
) |
|
Other income (loss), net (1) |
|
|
2,859 |
|
|
|
(1,126 |
) |
|
|
(2,367 |
) |
|
|
1,780 |
|
|
Total other (expense) income, net |
|
|
(62 |
) |
|
|
(3,929 |
) |
|
|
(4,202 |
) |
|
|
521 |
|
|
Income (loss) from continuing operations before income tax expense (benefit) |
|
|
33,075 |
|
|
|
11,381 |
|
|
|
16,376 |
|
|
|
(3,000 |
) |
|
Income tax expense (benefit) |
|
|
13,572 |
|
|
|
4,696 |
|
|
|
6,787 |
|
|
|
(2,226 |
) |
|
Income (loss) from continuing operations |
|
|
19,503 |
|
|
|
6,685 |
|
|
|
9,589 |
|
|
|
(774 |
) |
|
Loss from operations of discontinued operations, net of tax |
|
|
(335 |
) |
|
|
(330 |
) |
|
|
(561 |
) |
|
|
(1,097 |
) |
|
Gain (loss) on disposal of discontinued operations, net of tax |
|
|
— |
|
|
|
290 |
|
|
|
1,172 |
|
|
|
(35 |
) |
|
Net income (loss) |
|
$ |
19,168 |
|
|
$ |
6,645 |
|
|
$ |
10,200 |
|
|
$ |
(1,906 |
) |
|
Earnings (loss) per share: |
|
|
|
|
|
|
|
|
|
|
|
|
|
|
|
|
|
Basic: |
|
|
|
|
|
|
|
|
|
|
|
|
|
|
|
|
|
Continuing operations |
|
$ |
0.41 |
|
|
$ |
0.14 |
|
|
$ |
0.19 |
|
|
$ |
(0.02 |
) |
|
Discontinued operations |
|
|
(0.01 |
) |
|
|
(0.01 |
) |
|
|
0.01 |
|
|
|
(0.01 |
) |
|
Net income (loss) |
|
$ |
0.40 |
|
|
$ |
0.13 |
|
|
$ |
0.20 |
|
|
$ |
(0.03 |
) |
|
Diluted: |
|
|
|
|
|
|
|
|
|
|
|
|
|
|
|
|
|
Continuing operations |
|
$ |
0.38 |
|
|
$ |
0.13 |
|
|
$ |
0.18 |
|
|
$ |
(0.02 |
) |
|
Discontinued operations |
|
|
(0.01 |
) |
|
|
— |
|
|
|
0.01 |
|
|
|
(0.02 |
) |
|
Net income (loss) |
|
$ |
0.37 |
|
|
$ |
0.13 |
|
|
$ |
0.19 |
|
|
$ |
(0.04 |
) |
|
Basic weighted average common shares |
|
|
48,146 |
|
|
|
49,464 |
|
|
|
51,736 |
|
|
|
51,669 |
|
|
Diluted weighted average common shares |
|
|
51,385 |
|
|
|
52,024 |
|
|
|
54,445 |
|
|
|
51,669 |
|
|
(1) |
“Operating expenses” and “Corporate general and administrative expenses” include a reduction ($1.6 million and less than $0.1 million) related to a state payroll tax incentive associated with an office relocation. The reduction was recorded in “Other (expense) income, net” beginning in the third quarter of 2015, but was reclassified to “Operating expenses” and “Corporate general and administrative expenses” to align the incentives with the expenses associated with the office relocation. The reclassification had no impact on “Income from continuing operations” or diluted earnings per share from continuing operations. |
F-36
CBIZ, INC. AND SUBSIDIARIES
NOTES TO THE CONSOLIDATED FINANCIAL STATEMENTS — (continued)
CBIZ’s business units have been aggregated into three practice groups: Financial Services, Benefits and Insurance Services and National Practices. The business units have been aggregated based on the following factors: similarity of the products and services provided to clients, similarity of the regulatory environment and similarity of economic conditions affecting long-term performance. The business units are managed along these segment lines. A general description of services provided by practice group is provided in the table below.
|
Financial Services |
|
Benefits and Insurance Services |
|
National Practices |
|
• Accounting and Tax |
|
• Group Health Benefits Consulting |
|
• Managed Networking and Hardware Services |
|
• Government Healthcare Consulting • Financial Advisory |
|
• Payroll • Property & Casualty |
|
• Healthcare Consulting |
|
• Valuation |
|
• Retirement Plan Services |
|
|
|
• Risk & Advisory Services |
|
|
|
|
|
|
|
|
|
|
Corporate and Other
Included in Corporate and Other are operating expenses that are not directly allocated to the individual business units. These expenses are primarily comprised of certain healthcare costs, gains or losses attributable to assets held in the Company’s non-qualified deferred compensation plan, share-based compensation, consolidation and integration charges, certain professional fees, certain advertising costs and other various expenses.
Accounting policies of the practice groups are the same as those described in Note 1. Upon consolidation, intercompany accounts and transactions are eliminated, thus inter-segment revenue is not included in the measure of profit or loss for the practice groups. Performance of the practice groups is evaluated on operating income excluding those costs listed above, which are reported in the “Corporate and Other” segment.
CBIZ operates in the United States and Canada and revenue generated from such operations during the years ended December 31, 2016, 2015 and 2014 was as follows (in thousands):
|
|
|
Year Ended December 31, |
|
|||||||||
|
|
|
2016 |
|
|
2015 |
|
|
2014 |
|
|||
|
United States |
|
$ |
798,420 |
|
|
$ |
748,971 |
|
|
$ |
717,865 |
|
|
Canada |
|
|
1,412 |
|
|
|
1,451 |
|
|
|
1,618 |
|
|
Total revenue |
|
$ |
799,832 |
|
|
$ |
750,422 |
|
|
$ |
719,483 |
|
There is no one customer that represents a significant portion of CBIZ’s revenue.
F-37
CBIZ, INC. AND SUBSIDIARIES
NOTES TO THE CONSOLIDATED FINANCIAL STATEMENTS — (continued)
Segment information for the years ended December 31, 2016, 2015 and 2014 was as follows (in thousands):
|
|
|
For the Year Ended December 31, 2016 |
|
|||||||||||||||||
|
|
|
Financial Services |
|
|
Benefits and Insurance Services |
|
|
National Practices |
|
|
Corporate and Other |
|
|
Total |
|
|||||
|
Revenue |
|
$ |
501,307 |
|
|
$ |
267,606 |
|
|
$ |
30,919 |
|
|
$ |
— |
|
|
$ |
799,832 |
|
|
Operating expenses |
|
|
432,254 |
|
|
|
223,487 |
|
|
|
27,697 |
|
|
|
14,288 |
|
|
|
697,726 |
|
|
Gross margin |
|
|
69,053 |
|
|
|
44,119 |
|
|
|
3,222 |
|
|
|
(14,288 |
) |
|
|
102,106 |
|
|
Corporate general and administrative expenses |
|
|
— |
|
|
|
— |
|
|
|
— |
|
|
|
36,319 |
|
|
|
36,319 |
|
|
Operating income (loss) |
|
|
69,053 |
|
|
|
44,119 |
|
|
|
3,222 |
|
|
|
(50,607 |
) |
|
|
65,787 |
|
|
Other income (expense): |
|
|
|
|
|
|
|
|
|
|
|
|
|
|
|
|
|
|
|
|
|
Interest expense |
|
|
— |
|
|
|
(39 |
) |
|
|
— |
|
|
|
(6,554 |
) |
|
|
(6,593 |
) |
|
Gain on sale of operations, net |
|
|
— |
|
|
|
— |
|
|
|
— |
|
|
|
855 |
|
|
|
855 |
|
|
Other income, net |
|
|
209 |
|
|
|
367 |
|
|
|
3 |
|
|
|
6,378 |
|
|
|
6,957 |
|
|
Total other income |
|
|
209 |
|
|
|
328 |
|
|
|
3 |
|
|
|
679 |
|
|
|
1,219 |
|
|
Income (loss) from continuing operations before income tax expense |
|
$ |
69,262 |
|
|
$ |
44,447 |
|
|
$ |
3,225 |
|
|
$ |
(49,928 |
) |
|
$ |
67,006 |
|
|
|
|
For the Year Ended December 31, 2015 |
|
|||||||||||||||||
|
|
|
Financial Services |
|
|
Benefits and Insurance Services |
|
|
National Practices |
|
|
Corporate and Other |
|
|
Total |
|
|||||
|
Revenue |
|
$ |
476,396 |
|
|
$ |
244,493 |
|
|
$ |
29,533 |
|
|
$ |
— |
|
|
$ |
750,422 |
|
|
Operating expenses (1) |
|
|
411,325 |
|
|
|
202,138 |
|
|
|
26,417 |
|
|
|
12,511 |
|
|
|
652,391 |
|
|
Gross margin |
|
|
65,071 |
|
|
|
42,355 |
|
|
|
3,116 |
|
|
|
(12,511 |
) |
|
|
98,031 |
|
|
Corporate general and administrative expenses (1) |
|
|
— |
|
|
|
— |
|
|
|
— |
|
|
|
32,527 |
|
|
|
32,527 |
|
|
Operating income (loss) |
|
|
65,071 |
|
|
|
42,355 |
|
|
|
3,116 |
|
|
|
(45,038 |
) |
|
|
65,504 |
|
|
Other income (expense): |
|
|
|
|
|
|
|
|
|
|
|
|
|
|
|
|
|
|
|
|
|
Interest expense |
|
|
— |
|
|
|
(35 |
) |
|
|
— |
|
|
|
(8,867 |
) |
|
|
(8,902 |
) |
|
Gain on sale of operations, net |
|
|
— |
|
|
|
— |
|
|
|
— |
|
|
|
84 |
|
|
|
84 |
|
|
Other (expense) income, net (1) |
|
|
(147 |
) |
|
|
467 |
|
|
|
4 |
|
|
|
822 |
|
|
|
1,146 |
|
|
Total other (expense) income |
|
|
(147 |
) |
|
|
432 |
|
|
|
4 |
|
|
|
(7,961 |
) |
|
|
(7,672 |
) |
|
Income (loss) from continuing operations before income tax expense |
|
$ |
64,924 |
|
|
$ |
42,787 |
|
|
$ |
3,120 |
|
|
$ |
(52,999 |
) |
|
$ |
57,832 |
|
|
(1) |
“Operating expenses” under the Financial Services and Benefits and Insurance Services practice groups include a reduction of $0.9 million and $0.6 million related to a state payroll tax incentive associated with an office relocation. “Corporate general and administrative expenses” include a reduction of less than $0.1 million related to the office relocation as discussed above. The reductions was recorded in “Other (expense) income, net” in 2015 but was reclassified to “Operating expenses” and “Corporate general and administrative expenses” to align the incentives with the expenses associated with the office relocation. The reclassification had no impact on “Income from continuing operations” or diluted earnings per share from continuing operations. |
F-38
CBIZ, INC. AND SUBSIDIARIES
NOTES TO THE CONSOLIDATED FINANCIAL STATEMENTS — (continued)
|
|
|
For the Year Ended December 31, 2014 |
|
|||||||||||||||||
|
|
|
Financial Services |
|
|
Benefits and Insurance Services |
|
|
National Practices |
|
|
Corporate and Other |
|
|
Total |
|
|||||
|
Revenue |
|
$ |
465,130 |
|
|
$ |
224,898 |
|
|
$ |
29,455 |
|
|
$ |
— |
|
|
$ |
719,483 |
|
|
Operating expenses |
|
|
399,783 |
|
|
|
186,002 |
|
|
|
26,798 |
|
|
|
17,221 |
|
|
|
629,804 |
|
|
Gross margin |
|
|
65,347 |
|
|
|
38,896 |
|
|
|
2,657 |
|
|
|
(17,221 |
) |
|
|
89,679 |
|
|
Corporate general and administrative expenses |
|
|
— |
|
|
|
— |
|
|
|
— |
|
|
|
34,183 |
|
|
|
34,183 |
|
|
Operating income (loss) |
|
|
65,347 |
|
|
|
38,896 |
|
|
|
2,657 |
|
|
|
(51,404 |
) |
|
|
55,496 |
|
|
Other income (expense): |
|
|
|
|
|
|
|
|
|
|
|
|
|
|
|
|
|
|
|
|
|
Interest expense |
|
|
— |
|
|
|
(31 |
) |
|
|
— |
|
|
|
(13,093 |
) |
|
|
(13,124 |
) |
|
Gain on sale of operations, net |
|
|
— |
|
|
|
— |
|
|
|
— |
|
|
|
1,303 |
|
|
|
1,303 |
|
|
Other income, net |
|
|
417 |
|
|
|
557 |
|
|
|
4 |
|
|
|
5,915 |
|
|
|
6,893 |
|
|
Total other income (expense) |
|
|
417 |
|
|
|
526 |
|
|
|
4 |
|
|
|
(5,875 |
) |
|
|
(4,928 |
) |
|
Income (loss) from continuing operations before income tax expense |
|
$ |
65,764 |
|
|
$ |
39,422 |
|
|
$ |
2,661 |
|
|
$ |
(57,279 |
) |
|
$ |
50,568 |
|
Note 22. Subsequent Events
On February 9, 2017, the CBIZ Board of Directors authorized the continuation of the Share Repurchase Program, which has been renewed annually for the past thirteen years. This authorization renews the 5.0 million share authorization currently in place which expires on March 31, 2017 and authorizes the purchase of up to 5.0 million additional shares of our outstanding common stock to be obtained in open market, privately negotiated, or 10b5-1 trading plan purchases through March 31, 2018, which may include purchases from CBIZ employees, Officers and Directors.
Subsequent to December 31, 2016 up to the date of this filing, we repurchased approximately 0.2 million shares in the open market at a total cost of approximately $2.2 million under our current Rule 10b5-1 trading plan, which allows us to repurchase shares below a predetermined price per share.
F-39