Attached files
| file | filename |
|---|---|
| EX-32 - EX-32 - MARCHEX INC | mchx-ex32_6.htm |
| EX-31.2 - EX-31.2 - MARCHEX INC | mchx-ex312_7.htm |
| EX-31.1 - EX-31.1 - MARCHEX INC | mchx-ex311_8.htm |
| EX-21.1 - EX-21.1 - MARCHEX INC | mchx-ex211_945.htm |
| EX-10.44 - EX-10.44 - MARCHEX INC | mchx-ex1044_644.htm |
| EX-10.43 - EX-10.43 - MARCHEX INC | mchx-ex1043_643.htm |
| EX-10.42 - EX-10.42 - MARCHEX INC | mchx-ex1042_128.htm |
| EX-10.14 - EX-10.14 - MARCHEX INC | mchx-ex1014_623.htm |
UNITED STATES
SECURITIES AND EXCHANGE COMMISSION
WASHINGTON, D.C. 20549
FORM 10-K
|
☒ |
ANNUAL REPORT PURSUANT TO SECTION 13 OR 15(d) OF THE SECURITIES EXCHANGE ACT OF 1934 |
For the fiscal year ended December 31, 2016
or
|
☐ |
TRANSITION REPORT PURSUANT TO SECTION 13 OR 15(d) OF THE SECURITIES EXCHANGE ACT OF 1934 |
For the transition period from to .
Commission File Number 000-50658
Marchex, Inc.
(Exact name of Registrant as specified in its charter)
|
Delaware |
|
35-2194038 |
|
(State or other jurisdiction of incorporation or organization) |
|
(I.R.S Employer Identification No.) |
520 Pike Street, Suite 2000, Seattle, Washington 98101
(Address of principal executive offices, including zip code)
Registrant’s telephone number, including area code: (206) 331-3300
Securities registered pursuant to Section 12(b) of the Act:
|
Title of Each Class |
|
Name of Exchange on Which Registered |
|
Class B Common Stock, $0.01 par value per share |
|
The NASDAQ Stock Market LLC (NASDAQ Global Select Market) |
Securities registered pursuant to Section 12(g) of the Act:
None
Indicate by check mark if the registrant is a well-known seasoned issuer, as defined in Rule 405 of the Securities Act. Yes ☐ No ☒
Indicate by check mark if the registrant is not required to file reports pursuant to Section 13 or Section 15(d) of the Act. Yes ☐ No ☒
Indicate by check mark whether the registrant (1) has filed all reports required to be filed by Section 13 or 15(d) of the Securities Exchange Act of 1934 during the preceding 12 months (or for such shorter period that the registrant was required to file such reports), and (2) has been subject to such filing requirements for the past 90 days. Yes ☒ No ☐
Indicate by check mark whether the registrant has submitted electronically and posted on its corporate Web site, if any, every Interactive Data File required to be submitted and posted pursuant to Rule 405 of Regulation S-T during the preceding 12 months (or for such shorter period that the registrant was required to submit and post such files). Yes ☒ No ☐
Indicate by check mark if disclosure of delinquent filers pursuant to Item 405 of Regulation S-K is not contained herein, and will not be contained, to the best of the registrant’s knowledge, in definitive proxy or information statements incorporated by reference in Part III of this Form 10-K or any amendment to this Form 10-K. ☒
Indicate by check mark whether the registrant is a large accelerated filer, an accelerated filer, a non-accelerated filer, or a smaller reporting company. See the definitions of “large accelerated filer,” “accelerated filer” and “smaller reporting company” in Rule 12b-2 of the Exchange Act. (Check one):
|
Large accelerated filer |
|
☐ |
|
Accelerated filer |
|
☒ |
|
|
|
|
|
|||
|
Non-accelerated filer |
|
☐ (Do not check if a smaller reporting company) |
|
Smaller reporting company |
|
☐ |
Indicate by check mark whether the registrant is a shell company (as defined in Rule 12b-2 of the Act). Yes ☐ No ☒
Aggregate market value of the voting and non-voting common equity held by non-affiliates of the registrant was approximately $102,428,153 as of June 30, 2016 based upon the closing sale price on the NASDAQ Global Select Market reported for such date. This determination of affiliate status is not necessarily a conclusive determination for other purposes.
There were 5,056,136 shares of the registrant’s Class A common stock issued and outstanding as of March 6, 2017 and 38,044,263 shares of the registrant’s Class B common stock issued and outstanding as of March 6, 2017.
DOCUMENTS INCORPORATED BY REFERENCE
Portions of the registrant’s definitive proxy statement for the 2017 Annual Meeting of Stockholders are incorporated herein by reference in Part III of this Annual Report on Form 10-K to the extent stated herein.
|
|
|
Page |
|
Part I |
||
|
|
|
|
|
ITEM 1. |
3 |
|
|
|
|
|
|
ITEM 1A. |
17 |
|
|
|
|
|
|
ITEM 1B. |
40 |
|
|
|
|
|
|
ITEM 2. |
40 |
|
|
|
|
|
|
ITEM 3. |
40 |
|
|
|
|
|
|
ITEM 4. |
40 |
|
|
|
|
|
|
Part II |
|
|
|
|
|
|
|
ITEM 5. |
41 |
|
|
|
|
|
|
ITEM 6. |
44 |
|
|
|
|
|
|
ITEM 7. |
MANAGEMENT’S DISCUSSION AND ANALYSIS OF FINANCIAL CONDITION AND RESULTS OF OPERATIONS |
46 |
|
|
|
|
|
ITEM 7A. |
69 |
|
|
|
|
|
|
ITEM 8. |
70 |
|
|
|
|
|
|
ITEM 9. |
CHANGES IN AND DISAGREEMENTS WITH ACCOUNTANTS ON ACCOUNTING AND FINANCIAL DISCLOSURE |
99 |
|
|
|
|
|
ITEM 9A. |
99 |
|
|
|
|
|
|
ITEM 9B. |
99 |
|
|
|
|
|
|
Part III |
|
|
|
|
|
|
|
ITEM 10. |
100 |
|
|
|
|
|
|
ITEM 11. |
100 |
|
|
|
|
|
|
ITEM 12. |
SECURITY OWNERSHIP OF CERTAIN BENEFICIAL OWNERS AND MANAGEMENT AND RELATED STOCKHOLDER MATTERS |
100 |
|
|
|
|
|
ITEM 13. |
CERTAIN RELATIONSHIPS AND RELATED TRANSACTIONS, AND DIRECTOR INDEPENDENCE |
100 |
|
|
|
|
|
ITEM 14. |
100 |
|
|
|
|
|
|
Part IV |
|
|
|
|
|
|
|
ITEM 15. |
101 |
|
This Annual Report on Form 10-K contains forward-looking statements within the meaning of Section 27A of the Securities Act of 1933, as amended, and Section 21E of the Securities Exchange Act of 1934, as amended. We use words such as “believes”, “intends”, “expects”, “anticipates”, “plans”, “may”, “will” and similar expressions to identify forward-looking statements. All forward-looking statements, including, but not limited to, statements regarding our future operating results, financial position, prospects, acquisitions and business strategy, expectations regarding our growth and the growth of the industry in which we operate, and plans and objectives of management for future operations, are inherently uncertain as they are based on our expectations and assumptions concerning future events. Any or all of our forward-looking statements in this report may turn out to be inaccurate. We have based these forward-looking statements largely on our current expectations and projections about future events and financial trends that we believe may affect our financial condition, results of operations, business strategy and financial needs. They may be affected by inaccurate assumptions we might make or by known or unknown risks and uncertainties, including the risks, uncertainties and assumptions described in Item 1A of this Annual Report on Form 10-K under the caption “Risk Factors” and elsewhere in this report. In light of these risks, uncertainties and assumptions, the forward-looking events and circumstances discussed in this report may not occur as contemplated, and actual results could differ materially from those anticipated or implied by the forward-looking statements. All forward-looking statements in this report are made as of the date hereof, based on information available to us as of the date hereof, and we assume no obligation to update any forward-looking statement.
Overview
References herein to “we,” “us” or “our” refer to Marchex, Inc. and its wholly-owned subsidiaries unless the context specifically states or implies otherwise.
Marchex is a mobile advertising analytics company. We power global brands to understand the consumer journey by connecting online behavior to real-world, offline actions.
We believe that mobile devices have forever changed the consumer journey. We believe people are spending more time than ever on their smartphones. It’s second nature to research on mobile devices and interact with a business either over the phone or in a store. We believe that understanding this behavior and connecting key data points of this new online-to-offline consumer journey is the next frontier in marketing analytics.
We believe we have a powerful set of tools for enterprises that depend on phone calls to maximize advertising returns and convert prospects into customers. Our mission is to connect key media sources – paid, earned and owned – to any offline purchase outcome and deliver this insight directly into marketer workflows. We provide products and services for enterprises that depend on consumer phone calls to drive sales. Our media analytics products can provide actionable intelligence on the major media channels advertisers use to acquire customers over the phone. In February 2017, we launched Marchex Omnichannel Analytics Cloud which helps marketers connect customer conversions driven from paid media channels, including search, display and video, social and sites, to phone calls made to a business. We believe that this omni-channel view of marketing activities can result in smarter media spend and lower new customer acquisition costs, higher phone call conversion rates by callers based on optimized media, and increased customer conversion and revenue to businesses.
3
Our primary product offerings are:
|
|
• |
Marchex Call Analytics. Marchex Call Analytics is an analytics platform for enterprises that depend on inbound phone calls to drive sales, appointments and reservations. Marketers can use this platform to understand which marketing channels, advertisements, keywords and advertising are driving calls to their business, allowing them to optimize their advertising expenditures across media channels. Marchex Call Analytics also includes technology that can extract data and insights about what is happening during a call and measures the outcome of calls and return on investment. The platform also includes technology that blocks robocalls, telemarketers and spam calls to save businesses time. Marchex Call Analytics data can integrate directly into third-party marketer workflows such as Salesforce, Eloqua, Adobe, Kenshoo, DoubleClick Search, Marin Software, and beginning in 2017 Facebook and Instagram, in addition to other marketing dashboards and tools. Advertisers pay us a fee for each call or call related data element they receive from calls including call-based ads we distribute through our sources of call distribution or for each phone number tracked based on pre-negotiated rates. |
|
|
• |
Marchex Search Analytics. Marchex Search Analytics is a product for search marketers that drive phone calls from search campaigns. Marchex Search Analytics attributes inbound phone calls made directly from paid search ads and landing pages to a keyword. The platform can deliver this data as well as data about call outcomes directly into search management platforms like DoubleClick Search and Kenshoo. According to a June 2015 BIA Kelsey report, phone calls from search to businesses from smartphones will reach over 40 billion and the number of mobile searches will exceed desktop searches in 2016. |
|
|
• |
Marchex Display and Video Analytics. Marchex Display and Video Analytics is a product for marketers that buy digital display advertising. Marchex Display and Video Analytics can measure the influence that display advertising has on inbound phone calls so that marketers can better attribute their return on advertising spend for inbound phone calls and delivers this data to marketers in a reporting dashboard. According to a January 2017 eMarketer report, US display advertising spend is expected to reach over $40 billion in 2017. |
|
|
• |
Marchex Social Analytics. Launched in 2017, Marchex Social Analytics is a product for marketers that buy social media advertising. Marchex Social Analytics can measure the influence that social advertising from select sources like Facebook or Instagram has on inbound phone calls so that marketers can better attribute their return on advertising spend for inbound phone calls and delivers this data to marketers in a reporting dashboard. According to a December 2016 Zenith Media report, global social media advertising is forecasted to grow 72% between 2016 and 2019, rising from $29 billion to $50 billion. |
|
|
• |
Marchex Call Marketplace. Marchex Call Marketplace is a mobile advertising network for businesses that depend on inbound phone calls to drive sales. We offer advertisers ad placements across numerous mobile and online media sources to deliver qualified calls to their businesses. It leverages analytics for tracking, reporting and optimization. Advertisers are charged on a pay-per-call or cost per action basis. |
4
Prior to 2016, we generated pay-per-click advertising revenue from our Archeo business segment on our previously owned and operated websites and third-party distribution sources. In 2015, we sold our Archeo operations. For further discussion regarding the Archeo segment and dispositions, See Note 9. Segment Reporting and Geographic Information and Note 10. Discontinued Operations, Dispositions, and Other of the notes to our consolidated financial statements. We operate primarily in domestic markets.
Industry Overview
Calls are critical for businesses to drive sales. For businesses of all sizes, in-bound phones calls are a key source of new customer leads and increased revenue. We believe consumers that call businesses directly typically have higher purchase intent and are more likely to make a purchase or become a customer. According to BIA/Kelsey Local Commerce Monitor (LCM) survey in 2014, 66% of advertisers rate phone calls as a good or excellent source of leads, more than any other category. Calls are particularly relevant in high-value categories, such as professional services, financial services, cable and satellite, telecom, automotive and travel, where transaction values are large, complex or require additional information prior to completion. Calls are also important for local businesses that set appointments or sell products and services over the phone. According to an April 2014 BIA/Kelsey report, advertisers in the U.S. spend an estimated $68 billion each year to drive telephone leads. Historically, the majority of this advertising has been spent on traditional media such as television, newspapers and directories. With the mass adoption of mobile, both large and small advertisers are increasingly seeking new marketing channels that allow them to connect with consumers over the phone. According to a July 2016 BIA/Kelsey Industry Watch report, mobile calls represents 60% of inbound calls to businesses which equates to 85 billion in global calls annually, that will grow to 169 billion in 2020. In that same report, BIA/Kelsey estimates phone calls influence $1 trillion in U.S. spending at some stage of the path to purchase.
Mobile search and calls from search are growing rapidly. Today we are witnessing an evolution in consumer behavior as Internet-enabled mobile devices proliferate and media consumption shifts to mobile devices. This trend is increasingly evident in the way consumers research products and services and connect with businesses through the phone or through walking into a store, both offline environments, when they are ready to make a purchase decision. According to a 2013 study by Google/Ipsos, over 70% of mobile search users have used a click-to-call feature to connect with a business directly from their mobile devices. According to a BIA/Kelsey study in January 2014, mobile searches also have higher conversion rates in driving calls (57%) compared to desktop searches (7%). Mobile users are more ready-to-buy, in the right location and with a device whose core function is to make phone calls.
5
Ad budgets are shifting to performance-based models. As businesses have expanded their marketing through digital channels, they have increasingly turned to performance-based advertising formats in which they are only charged when a desired outcome is reached. Performance-based advertising models provide advertisers with greater transparency into their advertising spend and the ability to accurately measure results and return on investment. Over time, the online advertising market has shifted from CPM-based banner and display advertisements to cost-per-click search advertising and other forms of performance marketing. According to Interactive Advertising Bureau’s November 2016 advertising revenue report, performance-based formats accounted for 65% of an estimated $60 billion online advertising market in 2016 compared to 7% of the $5 billion market in 1999.
Calls are becoming the currency of mobile advertising. The global mobile advertising market was $71 billion in 2015 and is expected to grow to $247 billion by 2020, according to a 2016 Statista report. As the mobile advertising market matures, we believe advertisers will increasingly utilize performance based advertising formats available on mobile devices, as they did on desktop. Further, we believe the demand for businesses to connect with consumers over the phone combined with the inherent functionality and technical capabilities of mobile devices will result in calls becoming a primary measurement unit/format for mobile advertising. As advertisers continue to shift their budgets to accommodate for the growth of mobile and online channels, we believe the market for call-driven advertising will grow even more.
Understanding calls is highly complex. Unlike clicks, impressions and other actions that are tracked and measured in digital format, calls take place offline and require unique technical capabilities and expertise to accurately measure and analyze. To realize the full benefit of call-based marketing, advertisers need technology that allows them to capture and analyze attributes of a call before, during and after the call is completed. This technology helps them properly measure return on investment (“ROI”) and optimize their marketing campaigns across media channels. For example, advertisers must be able to dynamically track the source of a call back to the media channels and advertisements that influenced the consumer to make the call. Once a call is initiated, technology is required to understand what is happening on a call, to record calls, and to block unwanted or spam calls. For advertisers with call center operations, calls are often tracked and routed through interactive voice response (“IVR”) phone systems and integrated with customer relationship management (“CRM”) applications and back-office systems to measure transactions and return on investment. Successful marketing analytics for calls requires expertise from multiple disciplines, including digital advertising, communications infrastructure, voice and speech recognition expertise, and marketing software.
Our Competitive Strengths
Focus on calls. We were early to realize the value of calls and the importance that mobile devices would play in advertising. Over the past several years, we have shifted the focus of our company to address the large opportunity for mobile performance-based advertising focused on driving offline actions like calls. As a pioneer in the category, we have developed a unique business model that delivers measurable return on investment to both large national advertisers and local small businesses. Our call analytics technology and products are specifically designed to address the unique challenges associated with closing the loop between digital marketing and phone calls. Working closely with our customers, we have innovated in call-based technology, creating specific solutions to address common needs and wants among both large enterprise advertisers and SMBs. We believe we are unique with our call-focused approach to technology developments and marketing solutions, providing a competitive advantage as mobile advertising grows and advertising budgets shift towards performance-based formats.
6
Proprietary call analytics technology. Marchex Call Analytics technology provides data and insights to advertisers looking to measure the performance of their mobile, online, and offline ad campaigns. When consumers call a business or call center from their smartphones, our technology can analyze that conversation data and provides detailed feedback to advertisers on the quality of these over-the-phone experiences. Our data also helps advertisers adjust and improve their marketing strategies in order to drive more sales over the phone. This intelligence helps advertisers to optimize their ad campaigns across media channels, keywords, and creative elements, which maximizes their return on investment. We also provide integrations with other marketing dashboards to give advertisers one place to review their analytics information. Integrations may take the form of working with CRM platforms or customer-specific systems, with the purpose of enhancing advertisers’ understanding and measurement of outcomes at scale. We are consistently working to create products to help advertisers spend their budgets more efficiently, whether the channel is online, offline, or mobile and search-based. For example, our search analytics technology tracks every consumer call from a mobile search campaign at the keyword level. It can determine in which of these calls converts into a sale. Access to these insights provides advertisers newfound visibility and measurement into their ad expenditures.
Transparent, performance-based model. Through our call analytics technology, we have a deep understanding of which publishers, devices, ad formats, keywords and ad creatives drive call conversion for specific advertising verticals and helps optimize the placements of advertisements across our network to maximize the number of calls for our advertisers and revenue for our partners. As a result, advertisers utilize us to place ads on their behalf and our partners believe in us that we will only deliver ads on their properties to help generate revenue and/or customers for them. Through our pay-for-call business model, we can better align our interests with those of our advertising customers and our publishing partners. We work with customers to define a quality call for their business, and then only charge our customers, on a per call basis. As a result, we are able to deliver qualified leads that provide a measurable return on investment for our advertisers. We typically pay our publishing partners a percentage of the revenue we generate from advertisements on their properties.
Scalable technology platform and business model. We have developed our technology platform to address the large advertisers, while also being able to support a large number of small local business advertisers. Our platform can support hundreds of millions of calls and over 100,000 unique advertiser accounts, and in aggregate manages hundreds of millions of dollars in advertising spend across various digital channels. We leverage our relationships with Yellow Pages providers and vertical market service providers to efficiently re-sell our solutions to their small businesses customers, adding scale and data to our platform, which provides us with recurring revenues with minimal associated sales costs. We have deployed a direct sales model to acquire and service large advertisers and also have been successful at deepening our relationships with existing advertiser clients over time in an effort to capture a greater share of their advertising budgets.
Strategy
Our Strategy
To take advantage of the shift to performance-based models in marketing, key elements of our strategy include:
Innovating on Our Mobile Performance Advertising. We plan to continue to expand our range of call-based advertising product capabilities and channel specific solutions by growing our call analytics offerings including number provisioning, call tracking, call mining, keyword-level tracking, display ad impression measurement and other products as part of our owned, end-to-end, call-based advertising solutions. We launched Display and Video Analytics in 2016 with general availability in early 2017, which measures the impact of display and video advertising campaigns on inbound phone calls to call centers and stores. In February 2017, we launched Marchex Omnichannel Analytics Cloud which can connect call data to media channels, including search, display and video, social and sites, to phone calls made to a business. We are also focused on growing our base of call distribution by bringing in new sources of the rapidly growing mobile advertising market as well as other online and offline sources of distribution.
7
Supporting and Growing the Number of Advertisers Using Our Products and Services. We plan to continue to provide a consistently high level of service and support to our advertisers and we will continue to help them achieve their return on investment goals. We are focused on continuing to grow our advertiser base through our direct sales and marketing efforts, including strategic sales, inside sales, and additional partnerships with large local advertiser resellers.
Evolving Our Business Strategy. Our industry is undergoing significant change and our business strategy is continuing to evolve to meet these changes. In order to profitably grow our business, we may need to expand into new lines of business beyond our current focus of providing mobile advertising analytics products and services, which may involve pursuing strategic transactions, including potential acquisitions of, or investments in, related or unrelated businesses. In addition, we may seek divestitures of existing businesses or assets.
Pursuing Selective Acquisition Opportunities. We intend to pursue select acquisition opportunities and will apply rigorous evaluation criteria to any acquisitions we may pursue in order to enhance our strategic position, strengthen our financial profile, augment our points of defensibility and increase shareholder value. We will focus on acquisition opportunities that represent one or more of the following characteristics:
|
|
• |
revenue growth and expanding margins and operating profitability or the characteristics to achieve significant scale and profitability; |
|
|
• |
opportunities for business model, product or service innovation, evolution or expansion; |
|
|
• |
under-leveraged and under-commercialized assets in related or unrelated businesses; |
|
|
• |
an opportunity to enhance efficiencies and provide incremental growth opportunities for our operating businesses; and |
|
|
• |
business defensibility. |
Developing New Markets. We intend to analyze opportunities and may seek to expand our technology-based products into new business areas or geographic markets where our services can be replicated on a cost-effective basis, or where the creation or development of a product or service may be appropriate. We have technology integration partnerships and referral agreements with Adobe, DoubleClick, and Salesforce and other third-party marketers; and in 2017, we signed an integration agreement with Facebook. We anticipate utilizing various strategies to enter new markets, including: developing strategic relationships; acquiring products that address a new category or opportunity; and creating joint venture relationships.
Building and Expanding Relationships with Advertising Agencies. Advertising agencies are influential in determining how large national advertisers allocate their advertising budgets. We believe building deep relationships with leading global advertising agencies and creating awareness within these agencies about the benefits of our offerings is an important step in attracting new large advertising customers. We plan to continue building strong relationships with advertising agencies.
Our Distribution Network
We have built a broad distribution network for our pay-for-call advertising services that includes hundreds of mobile sources, search engines and applications, directories, third party vertical and branded web sites, and offline sources. Through our call advertising services, our local leads, and search marketing services, we distribute advertisements from our tens of thousands of advertisers, as well as from our reseller partners’ advertisers, through hundreds of call-ready media and traffic sources, including mobile sources, search engines and directories, and web sites.
8
Our Distribution partners include:
|
Selected Carriers |
AT&T |
T-Mobile |
TracFone |
Verizon |
|
|
|
|
|
|
|
Selected Search Engines |
|
Bing |
Yahoo! |
|
|
|
|
|
|
|
|
Selected Call Sources and Vertical and Local Distribution |
Avantar Mapquest |
xAd MSN |
Google Mobile Whitepages, Inc. |
|
Payment arrangements with our distribution partners are often subject to minimum payment amounts per phone call. Other payment structures that we may use to a lesser degree include:
|
|
• |
variable payments based on a specified metric, such as number of paid phone calls; |
|
|
• |
advance or fixed payments, based on a guaranteed minimum amount of usage delivered; and |
|
|
• |
a combination arrangement with both fixed and variable amounts. |
Sales, Marketing & Business Development
Our sales department focuses on adding new advertisers to our business and growing existing advertiser relationships, while our business development and partnership department focuses on adding new reseller partnerships, selectively adding new distribution partnerships and servicing existing partnerships. Our marketing department focuses on promoting our services through online customer acquisition, affiliate relationships, press coverage, strategic marketing campaigns and industry exposure. Advertising and promotion of our services is broken into the following main categories:
|
|
• |
Direct Sales. Our direct sales team targets new relationships with national and global advertisers and the advertising agencies that represent them through in-person presentations, direct marketing, telesales and attendance at industry events, among other methods. Our advertiser agreements include a combination of agency fees, pay-for-call fees, and cost-per-action fees. |
|
|
• |
Technology Integration Partnerships and Referral Agreements. We have integration partnerships with Adobe, DoubleClick, Salesforce, and other third-party marketers and in 2017, we signed an agreement with Facebook which will integrate across Facebook’s social analytics solution into the Marchex Omnichannel Analytics Cloud. We also have referral agreements with entities that promote our services to large numbers of potential advertisers including select technology partners. Our referral partner agreements are based on a combination of revenue sharing and performance-based fees. |
|
|
• |
Reseller Partnerships. We have a business development team that focuses primarily on securing partnerships with large advertiser reseller partners, under which we supply and integrate our products and services. Our reseller partner agreements include a combination of revenue and profit sharing, licensing revenue, pay-for-call, and cost-per-action. |
We intend to continue our strategy of growing our advertiser base through sales and marketing programs while being as efficient as possible in terms of our marketing and advertising costs. We continually evaluate our marketing and advertising strategies to maximize the effectiveness of our programs and their return on investment.
Information Technology and Systems
We have a proprietary technology platform for the purposes of managing and delivering call, click-based, and cost-per-action advertising products and services to our partners. We also combine third party licenses and hardware to create an operating environment for delivering high quality products and services, with such features as automated online account creation and management process for advertisers, real-time customer support with both interactive and online reporting for customers and partners. We employ commercially available technologies and products distributed by various companies, including Cisco, Dell, Oracle, Intel, AMD, Microsoft, IBM, Nuance and Veritas. We also utilize public domain software such as Apache, Linux, MySQL, PostgreSQL, Java, Scala and Tomcat.
9
Our technology platform is compatible with the systems used by our distribution partners, enabling us to deliver call, click-based, and cost-per-action advertising products and services through mobile, online and offline sources in rapid response to user queries made through such partners at scale. We continue to build and innovate additional functionality to attempt to meet the quickly evolving demands of the marketplace. We devote significant financial and human resources to improving our advertiser and partner experiences by continuing to develop our technology infrastructure. The cost of developing our technology solutions is included in the overall cost structure of our services and is not separately funded by any individual advertisers or partners. In order to maintain a professional level of service and availability, we primarily rely upon third parties to provide hosting services, including hardware support and service, and network monitoring at various domestic and international locations. Our servers are configured for high availability and large volumes of call, mobile and Internet traffic and are located in leased third party facilities. Back-end databases make use of redundant servers and data storage arrays. We also have standby servers that provide for additional capacity as necessary. The facilities housing our servers provide redundant HVAC, power and internet connectivity. As revenue grows and the volume of transactions and call, mobile and internet traffic increases, we will need to expand our network infrastructure. Inefficiencies in our network infrastructure to scale and adapt to higher call, mobile and internet traffic volumes could materially and adversely affect our revenue and results of operations.
We continuously review ways to improve major aspects of our technology support and maintenance, including improving, upgrading and implementing business continuity plans, data retention initiatives, and backup and recovery processes.
Competition
Our Call-driven offerings currently or potentially compete with a variety of companies in a highly competitive and fragmented industry. We currently or potentially compete with leading search engines such as Google, Microsoft, and Yahoo!, and call analytics technology providers such as Twilio, Telemetrics, Invoca, Convirza, and Dialogtech mobile ad networks and digital advertising networks. As we continue to advance our data analytics technologies, we anticipate facing increased competition from companies providing a wide range of analytics and advertising solutions. We also face competition on the call supply side, where competing companies look to outbid, partner with or otherwise secure sources of call supply we utilize. Many of our potential competitors, as well as potential entrants into our target markets, have longer operating histories, larger customer or user bases, greater brand recognition and greater financial, marketing and other resources than we have. Many current and potential competitors can devote substantially greater resources than we can to marketing, web site and systems development. In addition, as the use of the mobile, Internet, and other online services increases, there will likely be larger, more well-established and well-financed entities that acquire companies relevant to our business strategy; and invest in or form joint ventures in categories or countries relevant to our business strategy; all of which could adversely impact our business. Any of these trends could increase competition, reduce the demand for any of our services and could have a material adverse effect on our business, operating results and financial condition.
We believe our strategy allows us to work with most, if not all, of the relevant companies in our industry, even those companies that may be perceived as our competitors. To some extent, we may compete with our business partners, as we do with all other types of advertising sales companies and agencies. We may also compete with traditional offline media, such as television, radio and print and direct marketing companies, for a share of advertisers’ total advertising budgets. Although our strategy enables us to work with most, if not all, of our competitors, there are no guarantees that all companies will view us as a potential partner.
We provide our services to and also may compete with: (1) mobile and online advertisers; (2) partners who provide a distribution network for mobile, online, and offline advertising; and (3) other intermediaries who may provide purchasing and/or sales opportunities, including advertising agencies, and other search engine marketing companies. Many of the companies that could fall into these categories are also our partners, including Google, Yahoo!, Citysearch, Microsoft and YP. We depend on maintaining and continually expanding our network of partners and advertisers to generate mobile and online transactions.
10
The mobile and online advertising and marketing services industry is highly competitive. In addition, we believe today’s typical Internet and mobile advertiser is becoming more sophisticated in utilizing the different forms of Internet and mobile advertising, purchasing Internet and mobile advertising in a cost-effective manner, and measuring return on investment. The competition for this pool of advertising dollars has also put downward pressure on price points and mobile and online advertisers have demanded more effective means of reaching customers. We believe these factors have contributed to the growth in performance-based advertising relative to certain other forms of online advertising and marketing, and as a result this sector has attracted many competitors.
Due to the long-term growth trends in mobile and online advertising, these competitors, real and potential, range in size and focus. Our competitors may include such diverse participants as small referral companies, established advertising agencies, inventory resellers, search engines, and destination web sites. We are also affected by the competition among destination web sites that reach users or customers of search services. While thousands of smaller outlets are available to customers, several large media and search engine companies, such as Google, Yahoo!, Microsoft and IAC, dominate online user traffic. The online search industry continues to experience consolidation of major web sites and search engines, which has the effect of increasing the negotiating power of these parties in relation to smaller providers. The major destination web sites and distribution providers may have leverage to demand more favorable contract terms, such as pricing, renewal and termination provisions.
There are additional competitive factors relating to attracting and retaining users, including the quality and relevance of our search results, and the usefulness, accessibility, integration and personalization of the mobile and online services that we offer as well as the overall user experience on our web sites. The other features that we offer, which we believe attract advertisers are reach, effectiveness and creativity of marketing services, and tools and information to help track performance.
Finally, we operate in the relatively nascent market of call-based advertising. The adoption of these call-based products could take longer than we expect and could become more competitive as the category becomes more developed and visible.
Seasonality
We believe we will experience seasonality. Our quarterly results have fluctuated in the past and may fluctuate in the future due to seasonal fluctuations in levels of mobile and internet usage and seasonal purchasing cycles of many advertisers. Our experience has shown that during the spring and summer months, mobile and internet usage is lower than during other times of the year and during the latter part of the fourth quarter of the calendar year we generally experience lower call volume and reduced demand for calls from our call advertising customers. The extent to which usage and call volume may decrease during these off-peak periods is difficult to predict. Prolonged or severe decreases in usage and call volume during these periods may adversely affect our growth rate and results and in turn the market price of our securities. Historically, we have seen in the first quarter of the calendar year, this trend generally reversing with increased mobile and internet usage and often new budgets at the beginning of the year for many of our customers with fiscal years ending December 31. However, there can be no assurances such seasonal trends will consistently repeat each year. The current business environment and our industry has generally both resulted in, and we may continue to see, many advertisers and reseller partners reducing advertising and marketing services budgets or adjusting such budgets throughout the year, changing marketing strategies or agency affiliations, or advertisers being acquired by parent companies with alternative media initiatives, which we expect will impact our quarterly results of operations in addition to the typical seasonality seen in our industry.
Intellectual Property and Proprietary Rights
We seek to protect our intellectual property through existing laws and regulations and by contractual restrictions. We rely upon trademark, patent and copyright law, trade secret protection and confidentiality or license agreements with our employees, customers, partners and others to help us protect our intellectual property.
11
Our technologies involve a combination of proprietary rights, owned and developed by us, commercially available software and hardware elements that are licensed or purchased by us from various providers, including Cisco, Dell, Oracle, Intel, Microsoft, IBM and Veritas, and public domain software, such as Apache, Linux, MySQL, IBM Java and Tomcat. We continue to develop additional technologies to update, supplement and replace existing components of the platform. We intend to protect our proprietary rights through patent and additional intellectual property laws.
Our policy is to apply for patents or for other appropriate intellectual property protection when we develop valuable new or improved technology. We currently own the following pending patent applications and issued patents:
|
|
• |
U.S. Patent Number 7,668,950 entitled “Automatically Updating Performance-Based Online Advertising System and Method” was issued February 23, 2010. |
|
|
• |
U.S. Patent Number 8,442,862 entitled “Method and System for Tracking Telephone Calls” was issued on May 14, 2013 and a corresponding divisional Patent Application Number 13/294,436 was filed November 11, 2011. The following divisional applications of Patent Application Number 13/294,436 were also filed: 14/045,536 titled “Method and System for Phone Number Cleaning” was filed November 3, 2013; 14/058,037 titled “Method and System for Collecting Data from Advertising Campaigns Including Phone Number Placement Techniques” was filed November 18, 2013; 14/058,080 titled “Method and System for Monitoring Campaign Referral Sources” was filed October 18, 2013, and 14/065,345 titled “Method and System for Tracking Telephone Calls” was filed October 28, 2013. |
|
|
• |
U.S. Patent Number 6,822,663 entitled “Transform Rule Generator for Web-Based Markup Languages” was issued November 23, 2004. |
|
|
• |
U.S. Patent Number 8,583,571 entitled “Facility for Reconciliation of Business Records Using Genetic Algorithms” was issued November 12, 2013. |
|
|
• |
U.S. Patent Number 8,433,048 entitled “System and Method to Direct Telephone Calls to Advertisers” was issued April 30, 2013. |
|
|
• |
U.S. Patent Number 8,259,915 entitled “System and Method to Analyze Calls to Advertised Telephone Numbers” was issued September 4, 2012 and its continuation Patent Number 8,788,344 was issued July 22, 2014. |
|
|
• |
U.S. Patent Number 8,630,393 entitled “System and Method for Blocking Telephone Calls” was issued January 14, 2014. |
|
|
• |
U.S. Patent Number 7,212,615 entitled “Criteria Based Marketing For Telephone Directory Assistance” was issued May 1, 2007 and owned by Jingle Networks, which we acquired in 2011. |
|
|
• |
U.S. Patent Number 7,702,084 entitled “Toll-Free Directory Assistance With Preferred Advertisement Listing” was issued April 20, 2010. |
|
|
• |
U.S. Patent Number 7,961,861 entitled “Telephone Search Supported By Response Location Advertising” was issued June 14, 2011. |
|
|
• |
U.S. Patent Number 9,367,846 entitled “Telephone Search Supported By Advertising Based On Past History Of Requests” was issued June 14, 2016. |
|
|
• |
U.S. Patent Number 8,175,231 entitled “Toll-Free Directory Assistance With Automatic Selection Of An Advertisement From A Category” issued May 8, 2012. |
|
|
• |
U.S. Patent Number 8,107,602 entitled “Directory Assistance With Data Processing Station” was issued January 31, 2012. |
|
|
• |
U.S. Patent Number 8,929,522 entitled “System and Method to Customize a Connection Interface for Multimodal Connection to a Telephone Number” was issued January 16, 2015. |
|
|
• |
U.S. Patent Number 8,634,520 entitled “Call Tracking System Utilizing an Automated Filtering Function” was issued January 21, 2014. |
12
|
|
• |
U.S. Patent Number 8,671,020 entitled “Call Tracking System Utilizing a Pooling Algorithm” was issued March 11, 2014. |
|
|
• |
U.S. Patent Number 8,687,782 entitled “Call Tracking System Utilizing a Sampling Algorithm” was issued April 1, 2014. |
|
|
• |
U.S. Patent Application Number 13/865,966 entitled “Correlated Consumer Telephone Numbers and User Identifiers for Advertising Retargeting” was filed April 18, 2013, claiming priority to U.S. Provisional Patent Application Number 61/801,893 entitled “Cross-Channel Targeting Using Historical Online and Call Data” filed March 15, 2013, and its continuation Patent Application Number 15/019,826 entitled “Cross-Channel Correlation of Consumer Telephone Numbers and User Identifiers” was filed February 9, 2016. |
|
|
• |
U.S. Patent Number 9,118,751 entitled “System and Method for Analyzing and Classifying Calls without Transcription” was issued August 25, 2015. |
|
|
• |
U.S. Patent Number 9,263,038 entitled “System and Method for Analyzing and Classifying Calls Without Transcription via Keyword Spotting” was issued February 16, 2016. |
|
|
• |
US Patent Number 9,484,026 entitled “System and Method for Analyzing and Classifying Calls Without Transcription via Keyword Spotting” was issued November 1, 2016. |
|
|
• |
U.S. Patent Number 9,232,052 entitled “Analyzing Voice Characteristics to Detect Fraudulent Call Activity and Take Corrective Action Without Using Recording, Transcription or Caller ID” was issued January 5, 2016 and its continuation Patent Application Number 14/987,565 was filed January 4, 2016. |
|
|
• |
U.S. Patent Application Number 14/550,089 entitled “Identifying Call Characteristics to Detect Fraudulent Call Activity and Take Corrective Action Without Using Recording, Transcription or Caller ID” was filed November 21, 2014. |
|
|
• |
U.S. Patent Application Number 14/714,141 entitled “Call Analytics for Mobile Advertising” was filed May 15, 2015. |
|
|
• |
U.S. Patent Number 9,485,354 entitled “Identifying Call Features and Associations to Detect Call Traffic Pumping and Take Corrective Action” was issued November 1, 2016. |
The status of any patent involves complex legal and factual questions. The scope of allowable claims is often uncertain. As a result, we cannot be sure that: (1) any patent application filed by us will result in a patent being issued; (2) that any patents issued in the future will afford adequate protection against competitors with similar technology; and (3) that the patents issued to us, if any, will not be infringed upon or designed around by others. Furthermore, the performance-based mobile and search advertising industry has been the subject of numerous patents and patent applications, which in turn has resulted in litigation. The mobile advertising industry is also witnessing a significant number of patent related lawsuits. The outcome of this ongoing litigation or any future claims in this sector may adversely affect our business or financial prospects.
We have registered trademarks in the United States for Marchex, Marchex and Design, Marchex Voice Services, JingleConnect, Clean Call, and Call DNA. We also own pending U.S. trademark applications for Call Genome and Search Genome. In addition, we have trademark registrations for Marchex in the following jurisdictions: Australia, Benelux, Brazil, Canada, China, the European Union, Hong Kong, India, Japan, Republic of Korea, Russian Federation and Taiwan.
We do not know whether we will be able to successfully defend our proprietary rights since the validity, enforceability and scope of protection of proprietary rights in Internet-related industries are uncertain and still evolving.
13
The manner in which existing laws and regulations should be applied to the Internet and call-based advertising services in general, and how they relate to our businesses in particular, is unclear. A host of federal and state laws covering user privacy, defamation, pricing, advertising, taxation, gambling, sweepstakes, promotions, financial market regulation, quality of products and services, computer trespass, telemarketing, spyware, adware, child protection and intellectual property ownership and infringement are potentially applicable to our business practices and the content offered by our mobile and online distribution partners.
In addition, our business is impacted by laws in a constant state of flux, and new legislation is introduced on a regular basis. Any such new legislation could expose us to substantial liability, including significant expenses necessary to comply with such laws and regulations. Courts may apply each of these laws in unintended and unexpected ways. As a company that provides services over the Internet as well as call recording and call tracking services, we may be subject to an action brought under any of these or future laws.
A number of federal, state and foreign laws that could have an impact on our business practices and compliance costs have already been adopted:
|
|
• |
The Digital Millennium Copyright Act (DMCA) provides protection from copyright liability for online service providers that list or link to third party web sites. We currently qualify for the safe harbor under the DMCA; however, if it were determined that we did not meet the safe harbor requirements, we could be exposed to copyright infringement litigation, which could be costly and time-consuming. |
|
|
• |
The Children’s Online Privacy Protection Act (COPPA) restricts the online collection of personal information about children and the use of that information. The Federal Trade Commission (FTC) has the authority to impose fines and penalties upon web site operators and online service providers that do not comply with the law’s requirements. We do not currently offer any web sites or online services “directed to children,” nor do we knowingly collect personal information from children. |
|
|
• |
The Protection of Children from Sexual Predators Act requires online service providers to report evidence of violations of federal child pornography laws under certain circumstances. |
|
|
• |
The Controlling the Assault of Non-Solicited Pornography and Marketing (CAN-SPAM) Act of 2003 establishes requirements for those who send commercial e-mails, spells out penalties for entities that transmit noncompliant commercial e-mail and/or whose products are advertised in noncompliant commercial e-mail and gives consumers the right to opt-out of receiving commercial e-mails. The majority of the states also have adopted similar statutes governing the transmission of commercial e-mail. The FTC and the states, as applicable, are authorized to enforce the CAN-SPAM Act and the state-specific statutes, respectively. CAN-SPAM gives the Department of Justice the authority to enforce its criminal sanctions. Other federal and state agencies can enforce the law against organizations under their jurisdiction, and companies that provide Internet access may sue violators as well. |
|
|
• |
The Electronic Communications Privacy Act prevents private entities from disclosing Internet subscriber records and the contents of electronic communications, subject to certain exceptions. |
|
|
• |
The Computer Fraud and Abuse Act and other federal and state laws protect computer users from unauthorized computer access/hacking, and other actions by third parties which may be viewed as a violation of privacy. Courts may apply each of these laws in unintended and unexpected ways. As a company that provides services over the Internet as well as call recording and call tracking services, we may be subject to an action brought under any of these or future laws. |
|
|
• |
Among the types of legislation currently being considered at the federal and state levels are consumer laws regulating for the use of certain types of software applications or downloads and the use of “cookies.” These proposed laws are intended to target specific types of software applications often referred to as “spyware,” “invasiveware” or “adware,” and may also cover certain applications currently used in the online advertising industry to serve and distribute advertisements. In addition, the FTC has sought inquiry regarding the implementation of a “do-not-track” requirement. Federal legislation is also expected to be introduced that would regulate “online behavioral advertising” practices. If passed, these laws would impose new obligations for companies that use such software applications or technologies. |
14
|
|
• |
The U.S. Congress, the FCC, state legislatures or state agencies may target, among other things, access or settlement charges, imposing taxes related to Internet communications, imposing tariffs or other regulations based on encryption concerns, or the characteristics and quality of products and services that we may offer. Any new laws or regulations concerning these or other areas of our business could restrict our growth or increase our cost of doing business. |
|
|
• |
The FCC has initiated a proceeding regarding the regulation of broadband services. The increasing growth of the broadband IP telephony market and popularity of broadband IP telephony products and services heighten the risk that the FCC or other legislative bodies will seek to regulate broadband IP telephony and the Internet. In addition, large, established telecommunication companies may devote substantial lobbying efforts to influence the regulation of the broadband IP telephony market, which may be contrary to our interests. |
|
|
• |
There is risk that a regulatory agency will require us to conform to rules that are unsuitable for IP communications technologies or rules that cannot be complied with due to the nature and efficiencies of IP routing, or are unnecessary or unreasonable in light of the manner in which we offer voice-related services such as call recording and pay-for-call services to our customers. |
|
|
• |
Federal and state telemarketing laws including the Telephone Consumer Protection Act, the Telemarketing Sales Rule, the Telemarketing Consumer Fraud and Abuse Prevention Act and the rules and regulations promulgated thereunder. |
|
|
• |
Laws affecting telephone call recording and data protection, such as consent and personal data statutes. Under the federal Wiretap Act, at least one party taking part in a call must be notified if the call is being recorded. Under this law, and most state laws, there is nothing illegal about one of the parties to a telephone call recording the conversation. However, several states (i.e., California, Connecticut, Florida, Illinois, Maryland, Massachusetts, Michigan, Montana, Nevada, New Hampshire, Pennsylvania and Washington) require that all parties consent when one party wants to record a telephone conversation. The telephone recording laws in other states, like federal law, require only one party to be aware of the recording. |
|
|
• |
The Communications Assistance for Law Enforcement Act may require that we undertake material modifications to its platforms and processes to permit wiretapping and other access for law enforcement personnel. |
|
|
• |
Under various Orders of the Federal Communications Commission, including its Report and Order and Further Notice of Proposed Rulemaking in Docket Number WC 04-36, dated June 27, 2006, we may be required to make material retroactive and prospective contributions to funds intended to support Universal Service, Telecommunications Relay Service, Local Number Portability, the North American Numbering Plan and the budget of the Federal Communications Commission. |
|
|
• |
Laws in most states of the United States of America may require registration or licensing of one or more of our subsidiaries, and may impose additional taxes, fees or telecommunications surcharges on the provision of our services which we may not be able to pass through to customers. |
|
|
• |
Our international operations may expose us to telecommunications regulations in the countries where we are operating and these regulations could negatively affect the viability of our business. |
15
In addition, there are a large number of federal and state legislative proposals related to our business. It is not possible to predict whether, or when, such legislation might be adopted, and certain proposals, if adopted, could result in a decrease in user registrations and revenue.
We comply with existing law and intend to fully comply with all future laws and regulations that may govern our industry. We have dedicated internal resources and hired outside professionals who regularly establish, review and maintain policies and procedures to reduce the risk of noncompliance. Nevertheless, these laws may impose significant additional costs on our business or subject us to additional liability, if we failed to fully comply, even if such failure was unintentional.
The acquisition of Internet domains generally is governed by Internet regulatory bodies, predominantly the Internet Corporation for Assigned Names and Numbers (ICANN). The regulation of Internet domains in the United States and in foreign countries is subject to change. ICANN and other regulatory bodies could establish additional requirements for previously owned Internet domains or modify the requirements for Internet domains. Furthermore, ICANN has and will likely continue to make changes to the scope of domain products available to the marketplace that could have an impact on the competition for domain.
Compliance with complex foreign and U.S. laws and regulations that apply to our international operations increases our cost of doing business in international jurisdictions and could interfere with our ability to offer our products and services to one or more countries or expose us or our employees to fines and penalties. Our continued international expansion also subjects us to increased foreign currency exchange rate risks and will require additional management attention and resources. We cannot assure you that we will be successful in our international expansion.
We post a privacy policy which describes our practices concerning the use and disclosure of any user data collected or submitted via our web sites. Any failure by us to comply with our posted privacy policies, Federal Trade Commission requirements or other federal, state or international privacy or direct marketing laws and regulations could result in governmental or regulatory investigations that could potentially harm our businesses, operational results and overall financial condition.
Employees
As of December 31, 2016, we employed a total of 291 full-time employees. We have never had a work stoppage, and none of our employees are represented by a labor union. We consider our employee relationships to be positive. If we were unable to retain our key employees or we were unable to maintain adequate staffing of qualified employees, particularly during peak sales seasons, our business would be adversely affected.
Web site
Our web site, www.marchex.com, provides access, without charge, to our annual report on Form 10-K, quarterly reports on Form 10-Q, current reports on Form 8-K, and all amendments to those reports as soon as reasonably practicable after such materials are electronically filed with the Securities and Exchange Commission. To view these filings, please go to our web site and click on “Investor Relations” and then click on “SEC Filings.” Investors and others should note that we announce material financial information to our investors using our investor relations website, press releases, SEC filings, and public conference calls and webcasts. We also use the following social media channels as a means of disclosing information about us, our services, and other matters, and for complying with our disclosure obligations under Regulation FD:
|
|
• |
Marchex Twitter Account (https://twitter.com/marchex) |
|
|
• |
Marchex Company Blog (http://blog.marchex.com/) |
|
|
• |
Marchex LinkedIn Account (http://linkedin.com/company/marchex) |
16
The information we post through these social media channels may be deemed material. Accordingly, investors should monitor the above account and the blog, in addition to following our investor relations website, press releases, SEC filings, and public conference calls and webcasts. This list may be updated from time to time. The information we post through these channels is not a part of this Annual Report on Form 10-K.
An investment in our Class B common stock involves various risks, including those mentioned below and those that are discussed from time to time in our other periodic filings with the SEC. Investors should carefully consider these risks, along with the other information contained in this report, before making an investment decision regarding our stock. There may be additional risks of which we are currently unaware, or which we currently consider immaterial. All of these risks could have a material adverse effect on our business, financial condition, results of operations, and the value of our stock.
Risks Relating to Our Company
We have largely incurred net losses since our inception, and we may incur net losses in the foreseeable future.
We had an accumulated deficit of $247.6 million as of December 31, 2016. Our net expenses may increase based on the initiatives we undertake which for instance, may include increasing our sales and marketing activities, hiring additional personnel, incurring additional costs as a result of being a public company, acquiring additional businesses and making additional equity grants to our employees. This may result in the reduction of our cash balances or the incurrence of debt.
We have in the past and may in the future find it advisable to take measures to streamline operations and reduce expenses, including, without limitation, reducing our workforce or discontinuing certain products or businesses. Such measures may place significant strains on our management and employees, and could impair our development, marketing, sales, and customer support efforts. We may also incur liabilities from these measures. Such effects from streamlining could have a negative impact on our business and financial results.
We believe that our future revenue growth will depend on, among other factors, our ability to attract new advertisers, compete effectively, maximize our sales efforts, demonstrate a positive return on investment for advertisers, successfully improve existing products and services, develop successful new products and services and expand internationally. If we are unable to generate adequate revenue growth and to manage our expenses, we may continue to incur significant losses in the future and may not be able to achieve or maintain profitability.
We are dependent on certain distribution partners, for distribution of our services, and we derive a significant portion of our total revenue through these distribution partners. A loss of distribution partners or a decrease in revenue from certain distribution partners could adversely affect our business.
A relatively small number of distribution partners currently deliver a significant percentage of calls and traffic to our advertisers. Our largest distribution partner was paid less than 10% of total revenues for the year ended December 31, 2016. Our existing agreements with many of our other larger distribution partners permit either company to terminate without penalty on short notice and are primarily structured on a variable-payment basis, under which we make payments based on a specified percentage of revenue or based on the number of paid phone calls or click-throughs. We intend to continue devoting resources in support of our larger distribution partners, but there are no guarantees that these relationships will remain in place over the short-or long-term. In addition, we cannot be assured that any of these distribution partners will continue to generate current levels of revenue for us or that we will be able to maintain the applicable variable payment terms at their current levels. A loss of any of these distribution partners or a decrease in revenue or contribution due to lower calls and traffic or less favorable variable payment terms from any one of these distribution relationships could have a material adverse effect on our business, financial condition and results of operations.
17
Companies distributing advertising through mobile or online Internet have experienced, and will likely continue to experience, consolidation. This consolidation has reduced the number of partners that control the mobile and online advertising outlets with the most user calls and traffic. According to the comScore qSearch analysis of the U.S. desktop search marketplace for November 2016, Yahoo! and Microsoft accounted for 11.6% and 22.3%, respectively, of the core search market in the United States and Google accounted for 63.7%. As a result, the larger distribution partners have greater control over determining the market terms of distribution, including placement of call and click-based advertisements and cost of placement. In addition, many participants in the performance-based advertising and search marketing industries control significant portions of mobile and online traffic that they deliver to advertisers. We do not believe, for example, that Google, Microsoft, and Yahoo! are as reliant as we are on a third party distribution network to deliver their services. This gives these companies a significant advantage over us in delivering their services, and with a lesser degree of risk.
We rely on certain advertiser reseller partners and agencies, including YP, Resolution Media, OMD Digital, hibu, Inc., CDK Global, Yodle, and Yellow Pages Ltd (“YPG”) for the purchase of various advertising and marketing services, as well as to provide us with a large number of advertisers. A loss of certain advertiser reseller partners and agencies or a decrease in revenue from these reseller partners and agencies could adversely affect our business. Such advertisers are subject to varying terms and conditions, which may result in claims or credit risks to us.
We benefit from the established relationships and national sales teams that certain of our reseller partners, who are leading reseller partners of advertisers and advertising agencies, have in place throughout the U.S. and international markets. These advertiser reseller partners and agencies refer or bring advertisers to us for the purchase of various advertising products and services. We derive a sizeable portion of our total revenue through these advertiser reseller partners and agencies. Additionally, these advertiser reseller partners and agencies may decide to operate the advertising services we perform internally with their own teams and technology. A loss of certain advertiser reseller partners and agencies or a decrease in revenue from these clients could adversely affect our business.
Through our primary contract with YP, we generate revenues from our local leads platform. We also have a separate pay-for-call services arrangement with YP. In 2016, we extended these agreements through December 31, 2018. The primary local leads platform arrangement provides YP additional flexibility to migrate active accounts to itself or a third-party provider prior to the end of an advertiser contract and provides YP with certain termination rights beginning January 1, 2018 upon four months prior notice. YP is our largest reseller partner and was responsible for 23% of our total revenues for the year ended December 31, 2016. Our revenues from YP as a percentage of our total revenue have decreased and may continue to comprise a smaller percentage of our total revenue. We expect YP may decrease the number of new advertiser accounts with us and may elect to migrate certain active accounts to itself or a third party provider which would result in fewer small business accounts and related revenues, as well as reduced contribution and profitability. YP’s small business account base utilizing our platform has declined, and to the extent declines occur in their business, their small business accounts may spend fewer dollars on our pay-for-call services. We expect YP in future periods will comprise lower total revenues compared to previous periods. We also have a separate distribution partner agreement with YP. There can be no assurance that our business with them in the future will continue at or near current revenue and contribution levels, that we will be able to renew and extend the contracts, and if renewed, the contracts may be on less favorable terms to us, any of which could have a material adverse effect on our future operating results.
We also have arrangements with advertising agencies, such as Resolution Media and OMD Digital, who act on an advertiser’s behalf and may represent more than one advertiser that utilizes our products and services. Our primary arrangements with Resolution Media and OMD Digital are for pay-for-call services whereby we charge an agreed-upon price for qualified calls or leads from our network and call analytic services. Resolution Media and OMD Digital accounted for 20% and less than 10% of total revenues, respectively, for the year ended December 31, 2016.
18
These reseller partners and agencies may in certain cases be subject to negotiated terms and conditions separate from those applied to advertising clients. In some cases, the applicable contract terms may be the result of legacy or industry association documentation or simply customized advertising solutions for large reseller partners and agencies. In any case, as a consequence of such varying terms and conditions, we may be subject to claims or credit risks that we may otherwise mitigate more efficiently across our automated advertiser management platform.
These claims and risks may vary depending on the nature of the aggregated client base. Among other claims, we may be subject to disputes based on third party tracking information or analysis. We may also be subject to differing credit profiles and risks based on the agency relationship associated with these advertisers. For such advertisers, payment may be made on an invoice basis, unlike our retail platform, which in many instances is paid in advance of the service. In some limited circumstances we may also have accepted individual advertiser payment liability in place of liability of the advertising agency or media advisor.
We received approximately 61% and 60% of our revenue from our five largest customers for the years ended December 31, 2015 and 2016, respectively, and the loss of one or more of these customers could adversely impact our results of operations and financial condition.
Our five largest customers accounted for approximately 61% and 60% of our total revenues for the years ended December 31, 2015 and 2016, respectively. YP and Resolution Media were our largest customers and were responsible for 23% and 20% of our total revenues, respectively, for the year ended December 31, 2016.
Through our primary contract with YP, we generate revenues from our local leads platform. We also have a separate pay-for-call services arrangement with YP. In 2016, we extended these agreements through December 31, 2018. The primary local leads platform arrangement provides YP additional flexibility to migrate active accounts to itself or a third-party provider prior to the end of an advertiser contract and provides YP with certain termination rights beginning January 1, 2018 upon four months prior notice. Our revenues from YP as a percentage of our total revenue have decreased and may continue to comprise a smaller percentage of our total revenue. We expect YP may decrease the number of new advertiser accounts with us and may elect to migrate certain active accounts to itself or a third party provider which would result in fewer small business accounts and related revenues, as well as reduced contribution and profitability. YP’s small business account base utilizing our platform has declined, and to the extent declines occur in their business, their small business accounts may spend fewer dollars on our pay-for-call services. We expect YP in future periods will comprise lower total revenues compared to previous periods. We also have a separate distribution partner agreement with YP. There can be no assurance that our business with them in the future will continue at or near current revenue and contribution levels, that we will be able to renew and extend the contracts, and if renewed, the contracts may be on less favorable terms to us, any of which could have a material adverse effect on our future operating results.
Our primary arrangement with Resolution Media, who acts as an agent on advertisers’ behalf, is for pay-for-call services whereby we charge an agreed upon price for qualified calls or leads from our network and call analytic services. A single advertiser, State Farm, represented the majority of the revenue generated by Resolution Media for the year ended December 31, 2016. State Farm, who utilizes our services through multiple relationships, accounted for 23% of total revenues for the year ended December 31, 2016. We expect campaign spend levels related to State Farm to be lower compared to previous periods, which will result in lower total revenues and contributions.
Many of our other largest customers are not subject to long term contracts with us or have contracts with near term expiration dates such as YPG, and are able to reduce or cease advertising spend at any time and for any reason. We expect YPG revenues to be lower compared to previous periods.
19
In some cases, we engage with our customers through advertising agencies, who act on behalf of the customer. Advertising agencies, such as Resolution Media and OMD Digital, may place insertion orders with us on behalf of advertisers (including State Farm) for particular advertising campaigns for a set period of time and are not obligated to commit beyond the campaign governed by a particular insertion order and may also cancel the campaign prior to completion. Advertising agencies also have relationships with many different providers, each of whom may be running portions of the advertising campaign. If any of our largest customers are acquired, such acquisition may impact its advertising spending or budget with us, including due to rebranding, change in advertising agency, or change in media tactics. A significant reduction in advertising spending or budgets by our largest customers, or the loss of one or more of these customers, if not replaced by new customers or an increase in business from existing customers, would have a material adverse effect on our future operating results.
Our large customers have substantial negotiating leverage, which may require that we agree to terms and conditions that may have an adverse effect on our business.
Our large customers have substantial purchasing power and leverage in negotiating contractual arrangements with us. These customers may seek for us to develop additional features, may require penalties for failure to deliver such features, may seek discounted product or service pricing, and may seek more favorable contractual terms. As we sell more products and services to this class of customer, we may be required to agree to such terms and conditions. Such large customers also have substantial leverage in negotiating resolution of any disagreements or disputes that may arise. Any of the foregoing factors could result in a material adverse effect on our business, financial condition and results of operations.
If some of our customers experience financial distress or suffer disruptions in their business, their weakened financial position could negatively affect our own financial position and results.
We have a diverse customer base and, at any given time, one or more customers may experience financial distress, file for bankruptcy protection, go out of business, or suffer disruptions in their business. If a customer with whom we do a substantial amount of business experiences financial difficulty or suffers disruptions in their business, it could delay or jeopardize the collection of accounts receivable, result in significant reductions in services provided by us and may have a material adverse effect on our results of operations and liquidity.
We may incur liabilities for the activities of our advertisers, reseller partners, distribution partners and other users of our services, which could adversely affect our business.
Many of our advertisement distribution processes are automated. In some cases, advertisers or reseller partners use our online tools and account management systems to create and submit advertiser listings, and in other cases, we create and submit advertising listings on behalf of our advertisers or reseller partners using the distribution partners’ user interface. Although we monitor our distribution partners on an ongoing basis primarily for traffic quality, these partners control the distribution of the advertiser listings provided in the user interface submissions.
We have a large number of distribution partners who display our advertiser listings on their networks. Our advertiser listings are delivered to our distribution partners in an automated fashion through the distribution partners’ user interface. Our distribution partners are contractually required to use the listings created by our advertiser customers in accordance with applicable laws and regulations and in conformity with the publication restrictions in our agreements, which are intended to promote the quality and validity of the traffic provided to our advertisers. Nonetheless, we do not operationally control or manage these distribution partners or third parties they may contract with and any breach of these agreements on the part of any distribution partner or its affiliates could result in liability for our business. These agreements include indemnification obligations on the part of our distribution partners, but there is no guarantee that we would be able to collect against offending distribution partners or their affiliates in the event of a claim under these indemnification provisions. Alternatively, we may incur substantial costs as part of our indemnification obligations to distribution partners for liability they may incur as a result of displaying content we have provided them. Any costs incurred as a result of activities of our distribution partners and their third party partners could have a material adverse effect on our business, operating results and financial condition.
20
We do not conduct a manual editorial review of a substantial number of the advertiser listings directly submitted by advertisers or reseller partners online, nor do we manually review the display of the vast majority of the advertiser listings by our distribution partners submitted to us by the distribution partners’ user interface. Likewise, in cases where we provide editorial or value-added services for our large reseller partners or agencies, such as ad creation and optimization for local advertisers or landing pages and micro-sites for pay-for-call customers, we rely on the content and information provided to us by these agents on behalf of their individual advertisers. We do not investigate the individual business activities of these advertisers other than the information provided to us or in some cases review of advertiser websites. We may not successfully avoid liability for unlawful activities carried out by our advertisers or reseller partners and other users of our services or unpermitted uses of our advertiser listings by distribution partners and their affiliates.
Our potential liability for unlawful activities of our advertisers and other users of our services or unpermitted uses of our advertiser listings and advertising services and platform by distribution partners and reseller partners and agencies could require us to implement measures to reduce our exposure to such liability, which may require us, among other things, to spend substantial resources, to discontinue certain service offerings or to terminate certain distribution partner relationships. For example, as a result of the actions of advertisers in our network, we may be subject to private or governmental actions relating to a wide variety of issues, such as privacy, gambling, promotions, and intellectual property ownership and infringement. Under agreements with certain of our larger distribution partners, we may be required to indemnify these distribution partners against liabilities or losses resulting from the content of our advertiser listings, or resulting from third party intellectual property infringement claims. Although our advertisers agree to indemnify us with respect to claims arising from these listings, we may not be able to recover all or any of the liabilities or losses incurred by us as a result of the activities of our advertisers.
Our insurance policies may not provide coverage for liability arising out of activities of users of our services. In addition, our reliance on some content and information provided to us by our large advertiser reseller partners and agencies may expose us to liability not covered by our insurance policies. Furthermore, we may not be able to obtain or maintain adequate insurance coverage to reduce or limit the liabilities associated with our businesses. Any costs incurred as a result of such liability or asserted liability could have a material adverse effect on our business, operating results and financial condition. Our insurance policies may not provide coverage for liability arising out of activities of users of our services. In addition, our reliance on some content and information provided to us by our large advertiser reseller partners and agencies may expose us to liability not covered by our insurance policies. Furthermore, we may not be able to obtain or maintain adequate insurance coverage to reduce or limit the liabilities associated with our businesses. Any costs incurred as a result of such liability or asserted liability could have a material adverse effect on our business, operating results and financial condition.
If we do not maintain and grow a critical mass of advertisers and distribution partners, the value of our services could be adversely affected.
Our success depends, in large part, on the maintenance and growth of a critical mass of advertisers and distribution partners and a continued interest in our call analytics, pay-for-call, performance-based advertising, and search marketing services. Advertisers will generally seek the most competitive return on investment from advertising and marketing services. Distribution partners will also seek the most favorable payment terms available in the market. Advertisers and distribution partners may change providers or the volume of business with a provider, unless the product and terms are competitive. In this environment, we must compete to acquire and maintain our network of advertisers and distribution partners. If our business is unable to maintain and grow our base of advertisers, our current distribution partners may be discouraged from continuing to work with us, and this may create obstacles for us to enter into agreements with new distribution partners. Our business also depends in part on certain of our large reseller partners and agencies to grow their base of advertisers as these advertisers become increasingly important to our business and our ability to attract additional distribution partners and opportunities. Similarly, if our distribution network does not grow and does not continue to improve over time, current and prospective advertisers and reseller partners and agencies may reduce or terminate this portion of their business with us. Any decline in the number of advertisers and distribution partners could adversely affect the value of our services.
21
The mobile advertising market may develop more slowly than expected, which could harm our business.
If the market for mobile marketing and advertising develops more slowly than we expect, our business could suffer. Our future success is highly dependent on the commitment of advertisers and marketers to mobile communications as an advertising and marketing medium, the willingness of our potential advertisers to outsource their mobile advertising and marketing needs, and our ability to sell our mobile advertising services to reseller partners and agencies. The mobile advertising and marketing market is rapidly evolving. Businesses, including current and potential advertisers, may find mobile advertising or marketing to be less effective than traditional advertising media or marketing methods or other technologies for promoting their products and services. As a result, the future demand and market acceptance for mobile marketing and advertising is uncertain. Many of our current or potential advertisers may have little or no experience using mobile communications for advertising or marketing purposes and have allocated only a limited portion of their advertising or marketing budgets to mobile communications advertising or marketing, and there is no certainty that they will allocate more funds in the future, if any. Funds to these types of campaigns may fluctuate greatly as different agencies and advertisers test and refine their overall marketing strategies to include mobile advertising and analytics tools. The adoption rate and budget commitments may vary from period to period as agencies and advertisers determine the appropriate mix of media and lead sources in short term and longer term campaigns.
We are dependent upon the quality of mobile, online, offline and other traffic sources in our network to provide value to our advertisers and the advertisers of our reseller partners and agencies, and any failure in our quality control could have a material adverse effect on the value of our services to our advertisers and adversely affect our revenues.
We utilize certain monitoring processes with respect to the quality of the mobile, online, offline and other traffic sources that we deliver to our advertisers. Among the factors we seek to monitor are sources and causes of low quality phone calls such as unwanted telemarketer calls or other actions such as non-human processes, including robots or robocallers, spiders or other software, the mechanical automation of calling, and other types of invalid calls, call fraud, or call spam, the purpose of which is something other than to view the underlying content. Additionally, we also seek to identify other indicators which may suggest that a user may not be targeted by or desirable to our advertisers. Even with such monitoring in place, there is a risk that a certain amount of low quality mobile, online, offline and other traffic or traffic that is deemed to be less valuable by our advertisers will be delivered to such advertisers, which may be detrimental to those relationships. We have regularly refunded fees that our advertisers had paid to us which were attributed to low quality mobile, online, offline and other traffic. If we are unable to stop or reduce low quality phone calls and Internet traffic, these refunds may increase. Low quality mobile, online, offline and other traffic may further prevent us from growing our base of advertisers and cause us to lose relationships with existing advertisers, or become the target of litigation, both of which would adversely affect our revenues.
We depend on being able to secure enough phone numbers to support our advertisers and other users of our services and any obstacles that we face which prevent us from meeting this demand could adversely affect our business.
We utilize phone numbers as part of a number of information and analytic services to advertisers, such as our call analytics, call tracking, and pay-for-call services. Our services that utilize phone numbers are designed to enable advertisers and other users of our services to utilize mobile, online and offline advertising and to help measure the effectiveness of mobile, online and offline advertising campaigns. We secure a majority of our phone numbers through telecommunication carriers that we have contracted with and a smaller number through the 800 Service Management System, and such telecommunication carriers provide the underlying telephone service. Our telecommunications carriers and telephone number acquisition process are subject to the rules and guidelines established by the Federal Communications Commission. Furthermore, to the extent we offer call recording and pay-for-call services, we may be directly subject to certain telecommunications-related regulations. The Federal Communications Commission and our telecommunication carriers may change the rules and guidelines for securing phone numbers or change the requirements for retaining the phone numbers we have already secured. As a result, we may not be able to secure or retain sufficient phone numbers needed for our services. We may also be limited in the number of available telecommunications carriers or vendors to provide such phone numbers to us in the event of any industry consolidations.
22
Our automated voice and mobile advertising-based technologies are heavily reliant on vendors.
Certain voice and mobile advertising-based products are heavily reliant on vendors. The free directory product that we provide relies on technology provided by third party vendors that include voice recognition software and business, government and residence data listings. We cannot guarantee that the technology, data and services provided by our third party vendors will be of sufficient quality to meet the demands of our customers and partners. Further, we cannot guarantee that the technologies, data and services will be available to us in the future on acceptable terms, if at all. Any perception by our customers or partners that our voice and mobile advertising-based products are incomplete or not of sufficient quality could lead to a loss in confidence by our customers or partners, which in turn could lead to a decline in revenues. If we are unable to continue maintaining, advancing and improving our voice and mobile advertising-based products, our operating results may be adversely affected.
Our business strategy is evolving and may involve pursuing new lines of business or strategic transactions and investments, some of which may not be successful.
Our industry is undergoing significant change and our business strategy is continuing to evolve to meet these changes. In order to profitably grow our business, we may need to expand into new lines of business beyond our current focus of providing mobile advertising analytics products and services, which may involve pursuing strategic transactions, including potential acquisitions of, or investments in, related or unrelated businesses. In addition, we may seek divestitures of existing businesses or assets. There can be no assurance that we will be successful with our efforts to evolve our business strategy and we could suffer significant losses as a result, which could have a material adverse effect on our business, financial condition and results of operations.
Our acquisitions could divert management’s attention, cause ownership dilution to our stockholders, cause our earnings to decrease and be difficult to integrate.
Our business strategy includes identifying, structuring, completing and integrating acquisitions. Acquisitions involve a high degree of risk. We may also be unable to find a sufficient number of attractive opportunities to meet our objectives which include revenue growth, profitability and competitive market share. Our acquired companies may have histories of net losses and may expect net losses for the foreseeable future. Acquisitions are accompanied by a number of risks that could harm our business, operating results and financial condition:
|
|
• |
We could experience a substantial strain on our resources, including time and money, and we may not be successful; |
|
|
• |
Our management’s attention could be diverted from our ongoing business concerns; |
|
|
• |
We may seek to enter new markets where we have no or limited experience or where competitors may have stronger market positions; |
|
|
• |
While integrating new companies, we may lose key executives or other employees of these companies; |
|
|
• |
We may issue shares of our Class B common stock as consideration for acquisitions which may result in ownership dilution to our stockholders; |
|
|
• |
We could fail to successfully integrate our financial and management controls, technology, reporting systems and procedures, or adequately expand, train and manage our workforce; |
|
|
• |
We could experience customer dissatisfaction or performance problems with an acquired company or technology; |
|
|
• |
We could become subject to unknown or underestimated liabilities of an acquired entity or incur unexpected expenses or losses from such acquisitions, including litigation; |
|
|
• |
We could incur possible impairment charges related to goodwill or other intangible assets resulting from acquisitions or other unanticipated events or circumstances, any of which could harm our business; and |
|
|
• |
We may be exposed to investigations and/or audits by federal, state or other taxing authorities. |
23
Consequently, we might not be successful in integrating any acquired businesses, products or technologies, and might not achieve anticipated revenue and cost benefits.
We may decide to dispose of assets or business that may no longer help us meet our objectives.
If we decide to sell assets or a business, we may encounter difficulty in finding buyers or alternative exit strategies on acceptable terms in a timely manner, which could delay the achievement of our strategic objectives. We may also dispose of a business at a price or on terms that are less desirable than we had anticipated. In addition, we may experience greater dis-synergies than expected, and the impact of the divestiture on our revenue may be larger than projected.
Our international operations and any expansion subjects us to additional risks and uncertainties and we may not be successful with our strategy to expand such operations.
We have limited operations, through our international subsidiaries, in other countries. We have international subsidiaries in Australia, Canada, Ireland, and the United Kingdom. Any international expansion presents unique challenges and risks. Compliance with complex foreign and U.S. laws and regulations that apply to our international operations increases our cost of doing business in international jurisdictions and could interfere with our ability to offer our products and services to one or more countries or expose us or our employees to fines and penalties. We may also have to offer our products and services in a modified format which may not be as compelling to certain customers, and we are subject to increased foreign currency exchange rate risks and our international operations and any expansion will require additional management attention and resources. We cannot assure you that we will be successful in any international expansion. There are risks inherent in conducting business in international markets, including:
|
|
• |
the need to localize our products and services to foreign customers’ preferences and customs, including the possibility of storing data locally if customers require; |
|
|
• |
difficulties in managing operations due to language barriers, distance, staffing and cultural differences; |
|
|
• |
application of foreign laws and regulations to us, in particular data and privacy regulations in Europe and other international jurisdictions, which continue to change and impose significantly more liability and product limitations on service providers in our industry; |
|
|
• |
compliance with anti-bribery laws, such as the Foreign Corrupt Practices Act and the UK Anti-Bribery Act; |
|
|
• |
tariffs and other trade barriers; |
|
|
• |
fluctuations in currency exchange rates; |
|
|
• |
establishing local offices, sales channels, management systems and infrastructures; |
|
|
• |
reduced protection for intellectual property rights in some countries; |
|
|
• |
changes in foreign political and economic conditions; |
|
|
• |
compliance with the laws of numerous taxing jurisdictions, both foreign and domestic; |
|
|
• |
foreign exchange controls that might prevent us from repatriating cash earned outside the United States; |
|
|
• |
the complexity and potentially adverse tax consequences of U.S. tax laws as they relate to our international operations; |
|
|
• |
increased costs to establish and maintain effective controls at foreign locations; and |
|
|
• |
overall higher costs of doing business internationally. |
Our failure to address these risks adequately could materially and adversely affect our business, revenue, results of operations and financial condition.
24
We may be subject to intellectual property claims, which could adversely affect our financial condition and ability to use certain critical technologies, divert our resources and management attention from our business operations and create uncertainty about ownership of technology essential to our business.
Our success depends, in part, on our ability to operate without infringing on the intellectual property rights of others. There can be no guarantee that any of our intellectual property will not be challenged by third parties. We may be subject to patent infringement claims or other intellectual property infringement claims, and claims of copyright infringement with respect to certain of our websites that would be costly to defend and could limit our ability to use certain critical technologies. The expansion of our call advertising business increases the potential intellectual property infringement claims we may be subject to, particularly in light of the large number of patents which have been issued (or are pending) in the telecommunications field over the last several decades, both in the U.S. and internationally. Jingle, which we acquired in 2011, was subject to patent infringement claims, which were unsuccessful at trial. We resolved this matter and obtained a license to the patents at issue.
We believe that a consolidation of patent portfolios by major technology companies and independent asset holding companies will increase the chances of aggressive assertions of patent and other intellectual property claims. Within the technology telecommunications and online sectors, among other related sectors, we have witnessed various claim holders and alleged rights holders pursue business strategies devoted to extracting settlements or license fees for a wide range of basic and commonly accepted methods and practices. We may be subject to those intellectual property claims in the ordinary course of our business. Also, our partners and customers may also find that they are subject to similar claims, in which case we may be included in any related process or dispute settlement. Any patent or other intellectual property litigation could negatively impact our business by diverting resources and management attention from other aspects of the business and adding uncertainty as to the ownership of technology, services and property that we view as proprietary and essential to our business. In addition, a successful claim of patent infringement against us and our failure or inability to license the infringed or similar technology on reasonable terms, or at all, could prevent us from using critical technologies which could have a material adverse effect on our business.
We may need additional funding to meet our obligations and to pursue our business strategy. Additional funding may not be available to us and our financial condition could therefore be adversely affected.
We may require additional funding to meet our ongoing obligations and to pursue our business strategy, which may include the selective acquisition of businesses and technologies. In addition, we have incurred and we may incur certain obligations in the future. There can be no assurance that, if we were to need additional funds to meet these obligations, additional financing arrangements would be available in amounts or on terms acceptable to us, if at all. Furthermore, if adequate additional funds are not available, we will be required to delay, reduce the scope of, or eliminate material parts of the implementation of our business strategy, including potential additional acquisitions or internally-developed businesses.
The loss of our senior management, including other key personnel, could harm our current and future operations and prospects.
We are heavily dependent upon the continued services of members of our senior management team and other key personnel. Each member of our senior management team and other key personnel are at-will employees and may voluntarily terminate his or her employment with us at any time with minimal notice. Following any termination of employment, each of these employees would only be subject to a twelve-month non-competition and non-solicitation obligation with respect to our customers and employees under our standard confidentiality agreement. The loss of the services of any member of our senior management, including other key personnel, for any reason, or any conflict among our senior management or other key personnel, could harm our current and future operations and prospects.
25
We have experienced recent turnover in certain senior executives at our Company. In particular, our chief executive officer resigned, by mutual agreement, from the Company and our executive chairman resigned as a member of the Board of Directors in October 2016. As a result, our Board of Directors has established an Interim Office of the CEO consisting of Michael Arends, Ethan Caldwell, Gary Nafus and Russell C. Horowitz and subject to oversight by our Chairman, Anne Devereux-Mills. We are working on a plan to locate a successor chief executive officer, although we may not be successful in finding or hiring a suitable replacement. Additional turnover at the senior management level may create instability within the Company and our employees may decide to terminate their employment, which could further impede the maintenance of our day to day operations. Such instability could impede our ability to implement fully our business plan and growth strategy, which would harm our business and prospects.
We may have difficulty retaining current personnel as well as attracting and retaining additional qualified, experienced, highly skilled personnel, which could adversely affect the implementation of our business plan.
Our performance is largely dependent upon the talents and efforts of highly skilled individuals. In order to fully implement our business plan, we will need to retain our current qualified personnel, as well as attract and retain additional qualified personnel. Thus, our success will, in significant part, depend upon our retention of current personnel as well as the efforts of personnel not yet identified and upon our ability to attract and retain highly skilled managerial, engineering, sales and marketing personnel. We are also dependent on managerial and technical personnel to the extent they may have knowledge or information about our businesses and technical systems that may not be known by our other personnel. There can be no assurance that we will be able to attract and retain necessary personnel. The failure to hire and retain such personnel could adversely affect the implementation of our business plan.
If we are unable to obtain and maintain adequate insurance, our financial condition could be adversely affected in the event of uninsured or inadequately insured loss or damage. Our ability to effectively recruit and retain qualified officers and directors may also be adversely affected if we experience difficulty in maintaining adequate directors’ and officers’ liability insurance.
We may not be able to obtain and maintain insurance policies on terms affordable to us that would adequately insure our business and property against damage, loss or claims by third parties. To the extent our business or property suffers any damages, losses or claims by third parties that are not covered or adequately covered by insurance, our financial condition may be materially adversely affected. We currently have directors’ and officers’ liability insurance. If we are unable to maintain sufficient insurance as a public company to cover liability claims made against our officers and directors, we may not be able to retain or recruit qualified officers and directors to manage our company, which could have a material adverse effect on our operations.
It may be difficult for us to retain or attract qualified officers and directors, which could adversely affect our business and our ability to maintain the listing of our Class B common stock on the NASDAQ Global Select Market.
We may be unable to attract and retain qualified officers, directors and members of board committees required to provide for our effective management as a result of changes in the rules and regulations which govern publicly-held companies, including, but not limited to, certifications from executive officers and requirements for financial experts on boards of directors. The perceived increased personal risk associated with these changes may deter qualified individuals from accepting these roles. Further, applicable rules and regulations of the Securities and Exchange Commission and the NASDAQ Stock Market heighten the requirements for board or committee membership, particularly with respect to an individual’s independence from the corporation and level of experience in finance and accounting matters. We may have difficulty attracting and retaining directors with the requisite qualifications. If we are unable to attract and retain qualified officers and directors, our business and our ability to maintain the listing of our shares of Class B common stock on the NASDAQ Global Select Market could be adversely affected.
26
If we fail to maintain an effective system of internal controls, we may not be able to accurately report our financial results or prevent fraud, which could harm our brand and operating results.
Effective internal controls are necessary for us to provide reliable and accurate financial reports and effectively prevent fraud. We have devoted significant resources and time to comply with the internal control over financial reporting requirements of the Sarbanes-Oxley Act of 2002. In addition, Section 404 under the Sarbanes-Oxley Act of 2002 requires that we assess and our auditors attest to the effectiveness of our controls over financial reporting. Our current and future compliance with the annual internal control report requirement will depend on the effectiveness of our financial reporting and data systems and controls across our operating subsidiaries. We expect these systems and controls to become increasingly complex to the extent that we integrate acquisitions and our business grows. To effectively manage this growth, we will need to continue to improve our operational, financial and management controls and our reporting systems and procedures. We cannot be certain that these measures will ensure that we design, implement and maintain adequate controls over our financial processes and reporting in the future. Any failure to implement required new or improved controls, or difficulties encountered in their implementation or operation, could harm our operating results or cause us to fail to meet our financial reporting obligations. Inadequate internal controls could also cause investors to lose confidence in our reported financial information, which could have a negative effect on the trading price of our stock and our access to capital.
We may be required to increase or decrease the valuation allowance against our deferred tax assets.
Factors in our ability to realize a tax benefit from our deferred tax assets include tax attributes and operating results of acquired businesses, the nature, extent and periods that temporary differences are expected to reverse and our expectations about future operating results. We regularly review our deferred tax assets to assess whether or not it is more likely than not that the deferred tax assets will be realized, and if necessary, increase or decrease the valuation allowance for portions of such assets to reduce the carrying value. At the end of the fourth quarter of 2012, we recognized a partial valuation allowance of $16.4 million on our federal deferred tax assets which reduced our net deferred assets to $28.5 million. At the end of the second quarter of 2013, our gross deferred tax assets increased by approximately $651,000 due primarily to the 2012 and 2013 research and development credit which was reinstated as part the 2012 American Taxpayer Relief Act signed into law in January 2013. This increase was offset by a corresponding increase in our valuation allowance. We increased the valuation allowance by $22.3 million to record a full valuation allowance against our deferred tax assets as of September 30, 2014 resulting in a corresponding income tax expense of $22.3 million for the third quarter of 2014. As of December 31, 2016, our deferred tax assets were $44.5 million and we have provided a full valuation allowance of $44.5 million as we believe it is not more likely than not that these assets will be realized.
We may experience unforeseen liabilities arising out of third party domain names included in our distribution network, which could negatively impact our financial results.
We display pay-for-call listings on third party domain names and third party websites that are part of our distribution network, which could subject us to a wide variety of civil claims including intellectual property ownership and infringement. The potential violation of third party intellectual property rights and potential causes of action under consumer protection laws may subject us to unforeseen liabilities including injunctions and judgments for money damages.
We may face risks related to litigation that could result in significant legal expenses and settlement or damage awards.
From time to time, we are subject to claims and litigation, which could seriously harm our business and require us to incur significant costs.
We are generally obliged, to the extent permitted by law, to indemnify our current and former directors and officers who are named as defendants in these types of lawsuits. Defending against litigation may require significant attention and resources of management. Regardless of the outcome, such litigation could result in significant legal expenses.
27
If we are a party to material litigation and if the defenses we claim are ultimately unsuccessful, or if we are unable to achieve a favorable settlement, we could be liable for large damage awards that could have a material adverse effect on our business and consolidated financial statements.
Risks Relating to Our Business and Our Industry
If we are unable to compete in the highly competitive performance-based advertising and search marketing industries, we may experience reduced demand for our products and services.
We operate in a highly competitive and changing environment. We principally compete with other companies which offer services in the following areas:
|
|
• |
sales to advertisers of call analytics and call tracking; |
|
|
• |
sales to advertisers of pay-for-call services; |
|
|
• |
delivery of pay-for-call advertising to end users or customers of advertisers through mobile and online destination websites or other offline distribution outlets; |
|
|
• |
services and outsourcing of technologies that allow advertisers to manage their advertising campaigns across multiple networks and track the success of these campaigns; |
|
|
• |
aggregation or optimization of online advertising for distribution through mobile and online search engines and applications, product shopping engines, directories, websites or other offline outlets; |
|
|
• |
provision of local and vertical websites containing information designed to attract users and help consumers make better, more informed local decisions, while providing targeted advertising inventory for advertisers; and |
|
|
• |
local search sales training. |
Although we currently pursue a strategy that allows us to potentially partner with all relevant companies in the industry, there are certain companies in the industry that may not wish to partner with us. Despite the fact that we currently work with several of our potential competitors, there are no guarantees that these companies will continue to work with us in the future.
We currently or potentially compete with leading search engines and digital advertising networks such as Google, Microsoft, and Yahoo!. We also compete with call analytics technology providers such as Twilio, Telemetrics, Invoca, DialogTech and Convirza. As we continue to advance our data analytics technologies, we anticipate facing increased competition from companies providing more broad advertising solutions, such as data management companies like Datalogix. We also face competition on the call supply side, where competing mobile ad companies like xAd look to outbid, partner with or otherwise secure sources of call supply we utilize. Many of these actual or perceived competitors also currently or may in the future have business relationships with us, particularly in distribution. However, such companies may terminate their relationships with us. Furthermore, our competitors may be able to secure agreements with us on more favorable terms, which could reduce the usage of our services, increase the amount payable to our distribution partners, reduce total revenue and thereby have a material adverse effect on our business, operating results and financial condition. We expect competition to intensify in the future because current and new competitors can enter our market with little difficulty. The barriers to entering our market are relatively low. Further, if the consolidation trend continues among the larger media and search engine companies with greater brand recognition, the share of the market remaining for smaller search marketing services providers could decrease, even though the number of smaller providers could continue to increase. These factors could adversely affect our competitive position. Some of our competitors, as well as potential entrants into our market, may be better positioned to succeed in this market. They may have:
|
|
• |
longer operating histories; |
|
|
• |
more management experience; |
|
|
• |
an employee base with more extensive experience; |
|
|
• |
better geographic coverage; |
28
|
|
• |
greater brand recognition; and |
|
|
• |
significantly greater financial, marketing and other resources. |
Currently, and in the future, as the use of the Internet and other mobile and online services increases, there will likely be larger, more well-established and well-financed entities that acquire companies and/or invest in or form joint ventures in categories or countries of interest to us, all of which could adversely impact our business. Any of these trends could increase competition and reduce the demand for any of our services.
We face competition from traditional media companies, and we may not be included in the advertising budgets of large advertisers, which could harm our operating results.
In addition to digital/online companies, we face competition from companies that offer traditional media advertising opportunities. Most large advertisers have set advertising budgets, a very small portion of which is allocated to mobile or Internet advertising. We expect that large advertisers will continue to focus most of their advertising efforts on traditional media. If we fail to convince these companies to spend a portion of their advertising budgets with us, or if our existing advertisers reduce the amount they spend on our programs, our operating results would be harmed.
If we are not able to respond to the rapid technological change characteristic of our industry, our products and services may cease to be competitive.
The market for our products and services is characterized by rapid change in business models and technological infrastructure, and we will need to constantly adapt to changing markets and technologies to provide new and competitive products and services. If we are unable to ensure that our users, advertisers, reseller partners, and distribution partners have a high-quality experience with our products and services, then they may become dissatisfied and move to competitors’ products and services. Accordingly, our future success will depend, in part, upon our ability to develop and offer competitive products and services for both our target market and for applications in new markets. We may not, however, be able to successfully do so, and our competitors may develop innovations that render our products and services obsolete or uncompetitive.
Our technical systems are vulnerable to interruption and damage that may be costly and time-consuming to resolve and may harm our business and reputation.
A disaster could interrupt our services for an indeterminate length of time and severely damage our business, prospects, financial condition and results of operations. Our systems and operations are vulnerable to damage or interruption from:
|
|
• |
fire; |
|
|
• |
floods; |
|
|
• |
network failure; |
|
|
• |
hardware failure; |
|
|
• |
software failure; |
|
|
• |
power loss; |
|
|
• |
telecommunications failures; |
|
|
• |
break-ins; |
|
|
• |
terrorism, war or sabotage; |
|
|
• |
computer viruses; |
|
|
• |
denial of service attacks; |
29
|
|
• |
natural disasters, including, but not limited to, hurricanes, tornadoes, and earthquakes; and |
|
|
• |
other unanticipated problems. |
We may not have developed or implemented adequate protections or safeguards to overcome any of these events. We also may not have anticipated or addressed many of the potential events that could threaten or undermine our technology network. Any of these occurrences could cause material interruptions or delays in our business, result in the loss of data or render us unable to provide services to our customers. In addition, if a person is able to circumvent our security measures, he or she could destroy or misappropriate valuable information, including sensitive customer information, or disrupt our operations. We have deployed firewall hardware intended to thwart hacker attacks. Although we maintain property insurance and business interruption insurance, our insurance may not be adequate to compensate us for all losses that may occur as a result of a catastrophic system failure or other loss, and our insurers may not be able or may decline to do so for a variety of reasons. If we fail to address these issues in a timely manner, we may lose the confidence of our advertisers, reseller partners, and distribution partners, our revenue may decline and our business could suffer. In addition, as we expand our service offerings and enter into new business areas, we may be required to significantly modify and expand our software and technology platform. If we fail to accomplish these tasks in a timely manner, our business and reputation will likely suffer. Furthermore, some of these events could disrupt the economy and/or our customers’ business activities and in turn materially affect our operating results.
We rely on third party technology, platforms, carriers, communications providers, and server and hardware providers, and a failure of service by these providers could adversely affect our business and reputation.
We rely upon third party colocation providers to host our main servers. If these providers are unable to handle current or higher volumes of use, experience any interruption in operations or cease operations for any reason or if we are unable to agree on satisfactory terms for continued hosting relationships, we would be forced to enter into a relationship with other service providers or assume hosting responsibilities ourselves. If we are forced to switch hosting facilities, we may not be successful in finding an alternative service provider on acceptable terms or in hosting the computer servers ourselves. We may also be limited in our remedies against these providers in the event of a failure of service. In the past, we have experienced short-term outages in the service maintained by one of our colocation providers.
We also rely on a select group of third party providers for components of our technology platform and support for our call-based and advertising services, such as hardware and software providers, telecommunications carriers and Voice over Internet Protocol (VoIP) providers, credit card processors and domain name registrars. As a result, key operational resources of our business are concentrated with a limited number of third party providers. A failure or limitation of service or available capacity by any of these third party providers could adversely affect our business and reputation. Furthermore, if any of these significant providers are unable to provide the levels of service and dedicated resources over time that we required in our business, we may not be able to replace certain of these providers in a manner that is efficient, cost-effective or satisfactory to our customers, and as a result our business could be materially and adversely affected. Short term or repeat problems with any of these service providers could provide an interruption of service or service quality impairment to significant customers, which could also impact materially our revenue in any period due to credits or potential loss of significant customers.
30
If our security measures, including those of our vendors or partners, are breached or are perceived as not being secure, we may lose advertisers, reseller partners and distribution partners and as a result we may incur significant legal and financial exposure and suffer an adverse effect on our business.
We store and transmit data and information about our advertisers, reseller partners, distribution partners and their respective users. We also work with vendors and partners who may come into contact with certain data, such as carriers, colocation and data storage facilities and distribution partners referring callers. We deploy security measures to protect this data and information, as do third parties we utilize to assist in data and information storage. Our security measures and those of the third parties we partner with to assist in data and information storage, as well as to assist in the delivery of services to our advertisers, may suffer breaches. Security breaches of our data storage systems or our third party colocation and technology providers we utilize to store data and information relating to our advertisers, reseller partners, distribution partners and their respective users could expose us to significant potential liability. Similarly, security breaches of our vendors and partners, or ineffective data security by our vendors or partners, may result in similar significant liability. In addition, security breaches, actual or perceived, could result in legal liability, government fines, and the loss of advertisers, reseller partners and distribution partners that could potentially have an adverse effect on our business.
We may not be able to protect our intellectual property rights, which could result in our competitors marketing competing products and services utilizing our intellectual property and could adversely affect our competitive position.
Our success and ability to compete effectively are substantially dependent upon our internally developed and acquired technology and data resources, which we protect through a combination of copyright, trade secret, and patent and trademark law. To date, we have had issued or have applications pending for the following patents:
|
|
• |
U.S. Patent Number 7,668,950 entitled “Automatically Updating Performance-Based Online Advertising System and Method” was issued February 23, 2010. |
|
|
• |
U.S. Patent Number 8,442,862 entitled “Method and System for Tracking Telephone Calls” was issued on May 14, 2013 and a corresponding divisional Patent Application Number 13/294,436 was filed November 11, 2011. The following divisional applications of Patent Application Number 13/294,436 were also filed: 14/045,536 titled “Method and System for Phone Number Cleaning” was filed November 3, 2013; 14/058,037 titled “Method and System for Collecting Data from Advertising Campaigns Including Phone Number Placement Techniques” was filed November 18, 2013; 14/058,080 titled “Method and System for Monitoring Campaign Referral Sources” was filed October 18, 2013, and 14/065,345 titled “Method and System for Tracking Telephone Calls” was filed October 28, 2013. |
|
|
• |
U.S. Patent Number 6,822,663 entitled “Transform Rule Generator for Web-Based Markup Languages” was issued November 23, 2004. |
|
|
• |
U.S. Patent Number 8,583,571 entitled “Facility for Reconciliation of Business Records Using Genetic Algorithms” was issued November 12, 2013. |
|
|
• |
U.S. Patent Number 8,433,048 entitled “System and Method to Direct Telephone Calls to Advertisers” was issued April 30, 2013. |
|
|
• |
U.S. Patent Number 8,259,915 entitled “System and Method to Analyze Calls to Advertised Telephone Numbers” was issued September 4, 2012 and its continuation Patent Number 8,788,344 was issued July 22, 2014. |
|
|
• |
U.S. Patent Number 8,630,393 entitled “System and Method for Blocking Telephone Calls” was issued January 14, 2014. |
|
|
• |
U.S. Patent Number 7,212,615 entitled “Criteria Based Marketing For Telephone Directory Assistance” was issued May 1, 2007 and owned by Jingle Networks, which we acquired in 2011. |
|
|
• |
U.S. Patent Number 7,702,084 entitled “Toll-Free Directory Assistance With Preferred Advertisement Listing” was issued April 20, 2010. |
31
|
|
• |
U.S. Patent Number 7,961,861 entitled “Telephone Search Supported By Response Location Advertising” was issued June 14, 2011. |
|
|
• |
U.S. Patent Number 9,367,846 entitled “Telephone Search Supported By Advertising Based On Past History Of Requests” was issued June 14, 2016. |
|
|
• |
U.S. Patent Number 8,175,231 entitled “Toll-Free Directory Assistance With Automatic Selection Of An Advertisement From A Category” issued May 8, 2012. |
|
|
• |
U.S. Patent Number 8,107,602 entitled “Directory Assistance With Data Processing Station” was issued January 31, 2012. |
|
|
• |
U.S. Patent Number 8,929,522 entitled “System and Method to Customize a Connection Interface for Multimodal Connection to a Telephone Number” was issued January 16, 2015. |
|
|
• |
U.S. Patent Number 8,634,520 entitled “Call Tracking System Utilizing an Automated Filtering Function” was issued January 21, 2014. |
|
|
• |
U.S. Patent Number 8,671,020 entitled “Call Tracking System Utilizing a Pooling Algorithm” was issued March 11, 2014. |
|
|
• |
U.S. Patent Number 8,687,782 entitled “Call Tracking System Utilizing a Sampling Algorithm” was issued April 1, 2014. |
|
|
• |
U.S. Patent Application Number 13/865,966 entitled “Correlated Consumer Telephone Numbers and User Identifiers for Advertising Retargeting” was filed April 18, 2013, claiming priority to U.S. Provisional Patent Application Number 61/801,893 entitled “Cross-Channel Targeting Using Historical Online and Call Data” filed March 15, 2013, and its continuation Patent Application Number 15/019,826 entitled “Cross-Channel Correlation of Consumer Telephone Numbers and User Identifiers” was filed February 9, 2016. |
|
|
• |
U.S. Patent Number 9,118,751 entitled “System and Method for Analyzing and Classifying Calls without Transcription” was issued August 25, 2015. |
|
|
• |
U.S. Patent Number 9,263,038 entitled “System and Method for Analyzing and Classifying Calls Without Transcription via Keyword Spotting” was issued February 16, 2016. |
|
|
• |
U.S. Patent Number 9,484,026 entitled “System and Method for Analyzing and Classifying Calls Without Transcription via Keyword Spotting” was issued November 1, 2016. |
|
|
• |
U.S. Patent Number 9,232,052 entitled “Analyzing Voice Characteristics to Detect Fraudulent Call Activity and Take Corrective Action Without Using Recording, Transcription or Caller ID” was issued January 5, 2016 and its continuation Patent Application Number 14/987,565 was filed January 4, 2016. |
|
|
• |
U.S. Patent Application Number 14/550,089 entitled “Identifying Call Characteristics to Detect Fraudulent Call Activity and Take Corrective Action Without Using Recording, Transcription or Caller ID” was filed November 21, 2014. |
|
|
• |
U.S. Patent Application Number 14/714,141 entitled “Call Analytics for Mobile Advertising” was filed May 15, 2015. |
|
|
• |
U.S. Patent Number 9,485,354 912 entitled “Identifying Call Features and Associations to Detect Call Traffic Pumping and Take Corrective Action” was issued November 1, 2016. |
32
In the future, additional patent applications may be filed with respect to internally developed or acquired technologies. Our industry is highly competitive and many individuals and companies have sought to patent processes in the industry. We may decide not to protect certain intellectual properties or business methods which may later turn out to be significant to us. In addition, the patent process takes several years and involves considerable expense. Further, patent applications and patent positions in our industry are highly uncertain and involve complex legal and factual questions due in part to the number of competing technologies. As a result, we may not be able to successfully prosecute these patent applications, in whole or in part, or any additional patent filings that we may make in the future. We also depend on our trademarks, trade names and domain names. We may not be able to adequately protect our technology and data resources. In addition, intellectual property laws vary from country to country, and it may be more difficult to protect our intellectual property in some foreign jurisdictions in which we may plan to enter. If we fail to obtain and maintain patent or other intellectual property protection for our technology, our competitors could market competing products and services utilizing our technology.
Despite our efforts to protect our proprietary rights, unauthorized parties domestically and internationally may attempt to copy or otherwise obtain and use our services, technology and other intellectual property. We cannot be certain that the steps we have taken will prevent any misappropriation or confusion among consumers and advertisers. If we are unable to protect our intellectual property rights from unauthorized use, our competitive position could be adversely affected.
We may be involved in lawsuits to protect or enforce our patents, which could be expensive and time consuming.
We may initiate patent litigation against third parties to protect or enforce our patent rights, and we may be sued by others seeking to invalidate our patents or prevent the issuance of future patents. We may also become subject to interference proceedings conducted in the patent and trademark offices of various countries to determine the priority of inventions. The defense and prosecution, if necessary, of intellectual property suits, interference proceedings and related legal and administrative proceedings is costly and may divert our technical and management personnel from their normal responsibilities. We may not prevail in any of these suits. An adverse determination of any litigation or defense proceedings could put our patents at risk of being invalidated or interpreted narrowly and could put our patent applications at risk of not being issued. Furthermore, because of the substantial amount of discovery required in connection with intellectual property litigation, there is a risk that some of our confidential information could be compromised by disclosure during this type of litigation. In addition, during the course of this kind of litigation, there could be public announcements of the results of hearings, motions or other interim proceedings or developments in the litigation. If securities analysts or investors perceive these results to be negative, it could have an adverse effect on the trading price of our Class B common stock.
Our quarterly results of operations might fluctuate due to seasonality, which could adversely affect our growth rate and in turn the market price of our securities.
Our quarterly results have fluctuated in the past and may fluctuate in the future due to seasonal fluctuations in the level of mobile and Internet usage and seasonal purchasing cycles of many advertisers. Our experience has shown that during the spring and summer months, mobile and Internet usage is generally lower than during other times of the year and during the latter part of the fourth quarter of the calendar year we generally experience lower call volume and reduced demand for calls from our call advertising customers. The extent to which usage and call volume may decrease during these off-peak periods is difficult to predict. Prolonged or severe decreases in usage and call volume during these periods may adversely affect our growth rate and results, and in turn, the market price of our securities. Historically, we have seen in the first quarter of the calendar year, this trend generally reversing with increased mobile and internet usage and often new budgets at the beginning of the year for many of our customers with fiscal years ending December 31. However, there can be no assurances such seasonal trends will consistently repeat each year. The current business environment and our industry has generally both resulted in, and we may continue to see, many advertisers and reseller partners reducing advertising and marketing services budgets or adjusting such budgets throughout the year, changing marketing strategies or agency affiliations, or advertisers being acquired by parent companies with alternative media initiatives, which we expect will impact our quarterly results of operations in addition to the typical seasonality seen in our industry.
33
We are susceptible to general economic conditions, and a downturn in advertising and marketing spending by advertisers could adversely affect our operating results.
Our operating results will be subject to fluctuations based on general economic conditions, in particular those conditions that impact advertiser-consumer transactions. Deterioration in economic conditions could cause decreases in or delays in advertising spending and reduce and/or negatively impact our short-term ability to grow our revenues. Further, any decreased collectability of accounts receivable or early termination of agreements due to deterioration in economic conditions could negatively impact our results of operations.
We depend on the growth of mobile technologies, the Internet and the Internet infrastructure for our future growth and any decrease in growth or anticipated growth in mobile and Internet usage could adversely affect our business prospects.
Our future revenue and profits, if any, depend upon the continued widespread use of mobile technologies and the Internet as an effective commercial and business medium. Factors which could reduce the widespread use of mobile technologies (including mobile devices, in particular) and the Internet include:
|
|
• |
possible disruptions or other damage to the mobile, Internet or telecommunications infrastructure and networks; |
|
|
• |
failure of the individual networking infrastructures of our advertisers, reseller partners, and distribution partners to alleviate potential overloading and delayed response times; |
|
|
• |
a decision by advertisers and consumers to spend more of their marketing dollars on offline programs; |
|
|
• |
increased governmental regulation and taxation; and |
|
|
• |
actual or perceived lack of data security or privacy protection. |
In particular, concerns over the security of online transactions and the privacy of users, including the risk of identity theft, may inhibit the growth of Internet usage, including commercial transactions. In order for the mobile and online commerce market to develop successfully, we and other market participants must be able to transmit confidential information, including credit card information, securely over public networks. Any decrease in anticipated mobile and Internet growth and usage could have a material adverse effect on our business prospects.
We are exposed to risks associated with credit card fraud and credit payment, and we may continue to suffer losses as a result of fraudulent data or payment failure by advertisers.
We have suffered losses and may continue to suffer losses as a result of payments made with fraudulent credit card data. Our failure to control fraudulent credit card transactions could reduce our net revenue and gross margin and negatively impact our standing with applicable credit card authorization agencies. In addition, under limited circumstances, we extend credit to advertisers who may default on their accounts payable to us or fraudulently “charge-back” amounts on their credit cards for services that have already been delivered by us.
Regulation of E-Commerce, Online Tracking, Online Data Collection, and Use of the Internet may adversely affect our business and operating results.
Mobile and online search, e-commerce and related businesses face uncertainty related to new or future government regulation at the federal, state, and international levels regarding e-commerce, online tracking, online data collection, and use of the Internet. Due to the rapid growth and widespread use of the Internet, state and federal legislatures (both domestically and abroad) have enacted and may continue to enact various laws and regulations relating to the Internet. Individual states may also enact consumer protection laws that are more restrictive than the ones that already exist.
34
Furthermore, the application of existing laws and regulations to companies that engage in e-commerce, or otherwise interact with the Internet remains somewhat unclear. For example, as a result of the actions of advertisers in our network, we may be subject to existing laws and regulations relating to a wide variety of issues such as consumer privacy, gambling, sweepstakes, advertising, promotions, defamation, pricing, taxation, financial market regulation, quality of products and services, computer trespass, spyware, adware, child protection and intellectual property ownership and infringement. In addition, it is not clear whether existing laws that require licenses or permits for certain of our advertisers’ lines of business apply to us, including those related to insurance and securities brokerage, law offices and pharmacies. Existing federal, state, and foreign laws that may affect the growth and profitability of our business include, among others:
|
|
• |
The Digital Millennium Copyright Act (DMCA) provides protection from copyright liability for online service providers that list or link to third party websites. We currently qualify for the safe harbor under the DMCA; however, if it were determined that we did not meet the safe harbor requirements, we could be exposed to copyright infringement litigation, which could be costly and time-consuming. |
|
|
• |
The Children’s Online Privacy Protection Act (COPPA) restricts the online collection of personal information about children and the use of that information. The Federal Trade Commission (FTC) has the authority to impose fines and penalties upon website operators and online service providers that do not comply with the law. We do not currently offer any websites or online services “directed to children,” nor do we knowingly collect personal information from children. |
|
|
• |
The Protection of Children from Sexual Predators Act requires online service providers to report evidence of violations of federal child pornography laws under certain circumstances. |
|
|
• |
The Controlling the Assault of Non-Solicited Pornography and Marketing (CAN SPAM) Act of 2003 establishes requirements for those who send commercial e-mails, spells out penalties for entities that transmit noncompliant commercial e-mail and/or whose products are advertised in noncompliant commercial e-mail and gives consumers the right to opt-out of receiving commercial e-mails. The majority of the states also have adopted similar statutes governing the transmission of commercial e-mail. The FTC and the states, as applicable, are authorized to enforce the CAN-SPAM Act and the state-specific statutes, respectively. CAN-SPAM gives the Department of Justice the authority to enforce its criminal sanctions. Other federal and state agencies can enforce the law against organizations under their jurisdiction, and companies that provide Internet access may sue violators as well. |
|
|
• |
The Electronic Communications Privacy Act prevents private entities from disclosing Internet subscriber records and the contents of electronic communications, subject to certain exceptions. |
|
|
• |
The Computer Fraud and Abuse Act and other federal and state laws protect computer users from unauthorized computer access/hacking, and other actions by third parties which may be viewed as a violation of privacy. Courts may apply each of these laws in unintended and unexpected ways. As a company that provides services over the Internet as well as call recording and call tracking services, we may be subject to an action brought under any of these or future laws. |
|
|
• |
Among the types of legislation currently being considered at the federal and state levels are consumer laws regulating for the use of certain types of software applications or downloads and the use of “cookies.” These proposed laws are intended to target specific types of software applications often referred to as “spyware,” “invasiveware” or “adware,” and may also cover certain applications currently used in the online advertising industry to serve and distribute advertisements. In addition, the FTC has sought inquiry regarding the implementation of a “do-not-track” requirement. Federal legislation is also expected to be introduced that would regulate “online behavioral advertising” practices. If passed, these laws would impose new obligations for companies that use such software applications or technologies. At least one state already has enacted a law, which went into effect in January 2014, regarding online tracking. |
Many Internet services are automated, and companies such as ours may be unknowing conduits for illegal or prohibited materials. It is possible that some courts may impose a strict liability standard or require such companies to monitor their customers’ conduct. Although we would not be responsible or involved in any way in such illegal conduct, it is possible that we would somehow be held responsible for the actions of our advertisers or distribution partners.
35
We may also be subject to costs and liabilities with respect to privacy issues. Several companies have incurred penalties for failing to abide by the representations made in their public-facing privacy policies. In addition, several states have passed laws that require businesses to implement and maintain reasonable security procedures and practices to protect sensitive personal information and to provide notice to consumers in the event of a security breach. Further, it is anticipated that additional federal and state privacy-related legislation will be enacted. Such legislation could negatively affect our business. In addition, foreign countries may enact laws that could negatively impact our business and/or may prosecute us for violating existing laws. Such laws might include EU member country conforming legislation under applicable EU Privacy, eCommerce, Data Protection Directives (and similar legislation in other countries where we may have operations), and the recently enacted EU General Data Protection Regulation, which is directly applicable to all member states. Any costs incurred in addressing foreign laws could negatively affect the viability of our business. Our exposure to this risk will increase to the extent we expand our operations internationally.
Federal, state, and foreign regulation of telecommunications may adversely affect our business and operating results.
We provide information and analytics services to certain advertisers and reseller partners that may include information services. In connection therewith, we obtain certain telecommunications products and services from carriers in order to deliver these packages of information and analytic services.
Telecommunications laws and regulations (and interpretations thereof) are evolving in response to rapid changes in the telecommunications industry. If our carrier partners were to be subject to any changes in applicable law or regulation (or interpretations thereof), or additional taxes or surcharges, then we in turn may be subject to increased costs for their products and services or receive products and services that may be of less value to our customers, which in turn could adversely affect our business and operating results. Furthermore, our call recording and pay-for-call services may directly subject us to certain telecommunications-related regulations. Finally, in the event that any federal or state regulators were to expand the scope of applicable laws and regulations or their application to include certain end users and information service providers, then our business and operating results could also be adversely affected. The following existing and possible future federal and state laws could impact the growth and profitability of our business:
|
|
• |
The Communications Act of 1934, as amended by the Telecommunications Act of 1996 (the “Act”), and the regulations promulgated by the Federal Communications Commission under Title II of the Act, may impose federal licensing, reporting and other regulatory obligations on the Company. To the extent we contract with and use the networks of voice over IP service providers, new legislation or FCC regulation in this area could restrict our business, prevent us from offering service or increase our cost of doing business. There are an increasing number of regulations and rulings that specifically address access to commerce and communications services on the Internet, including IP telephony. We are unable to predict the impact, if any, that future legislation, legal decisions or regulations concerning voice services offered via the Internet may have on our business, financial condition, and results of operations. |
|
|
• |
The U.S. Congress, the FCC, state legislatures or state agencies may target, among other things, access or settlement charges, imposing taxes related to Internet communications, imposing tariffs or other regulations based on encryption concerns, or the characteristics and quality of products and services that we may offer. Any new laws or regulations concerning these or other areas of our business could restrict our growth or increase our cost of doing business. |
|
|
• |
The FCC has initiated a proceeding regarding the regulation of broadband services. The increasing growth of the broadband IP telephony market and popularity of broadband IP telephony products and services heighten the risk that the FCC or other legislative bodies will seek to regulate broadband IP telephony and the Internet. In addition, large, established telecommunication companies may devote substantial lobbying efforts to influence the regulation of the broadband IP telephony market, which may be contrary to our interests. |
36
|
|
• |
Federal and state telemarketing laws including the Telephone Consumer Protection Act, the Telemarketing Sales Rule, the Telemarketing Consumer Fraud and Abuse Prevention Act and the rules and regulations promulgated thereunder. |
|
|
• |
Laws affecting telephone call recording and data protection, such as consent and personal data statutes. Under the federal Wiretap Act, at least one party taking part in a call must be notified if the call is being recorded. Under this law, and most state laws, there is nothing illegal about one of the parties to a telephone call recording the conversation. However, several states (i.e., California, Connecticut, Florida, Illinois, Maryland, Massachusetts, Michigan, Montana, Nevada, New Hampshire, Pennsylvania and Washington) require that all parties consent when one party wants to record a telephone conversation. The telephone recording laws in other states, like federal law, require only one party to be aware of the recording. A Wiretap Act violation is a Class D felony; the maximum authorized penalties for a violation of section 2511(1) of the Wiretap Act are imprisonment of not more than five years and a fine under Title 18. Authorized fines are typically not more than $250,000 for individuals or $500,000 for an organization, unless there is a substantial loss. State laws impose similar penalties. |
|
|
• |
The Communications Assistance for Law Enforcement Act may require that we undertake material modifications to our platforms and processes to permit wiretapping and other access for law enforcement personnel. |
|
|
• |
Under various Orders of the Federal Communications Commission, we may be required to make material retroactive and prospective contributions to funds intended to support Universal Service, Telecommunications Relay Service, Local Number Portability, the North American Numbering Plan and the budget of the Federal Communications Commission. |
|
|
• |
Laws in most states of the United States of America may require registration or licensing of one or more of our subsidiaries, and may impose additional taxes, fees or telecommunications surcharges on the provision of our services which we may not be able to pass through to customers. |
|
|
• |
Our international operations may expose us to telecommunications regulations in the countries where we are operating and these regulations could negatively affect the viability of our business in those regions. |
State and local governments may in the future be permitted to levy additional taxes on Internet access and electronic commerce transactions, which could result in a decrease in the level of usage of our services. In addition, we may be required to pay additional income, sales, or other taxes.
The federal government has placed a ban for now on state and local governments’ imposition of new taxes on Internet access or electronic commerce transactions through the Internet Tax Freedom Act. The proposed Marketplace Fairness Act, if enacted into law, would allow states to require online and other out of state merchants to collect and remit sales and use tax on products and services that they may sell. An increase in taxes may make electronic commerce transactions less attractive for advertisers and businesses, which could result in a decrease in the level of usage of our services. Additionally, from time to time, various state, federal and other jurisdictional tax authorities undertake reviews of us and our filings. In evaluating the exposure associated with various tax filing positions, we may on occasion accrue charges for probable exposures. We cannot predict the outcome of any of these reviews.
37
Risks Relating to Ownership of our Class B common stock
Our Class B common stock prices have been and are likely to continue to be highly volatile.
The trading prices of our Class B common stock have been and are likely to continue to be highly volatile and subject to wide fluctuations and has more recently declined significantly. Our stock prices may fluctuate in response to a number of events and factors, which may be the result of our business strategy or events beyond our control, including:
|
|
• |
actual or anticipated fluctuations in our operating results; |
|
|
• |
developments concerning proprietary rights, including patents, by us or a competitor; |
|
|
• |
announcements by us or our competitors of significant contracts, acquisitions, financings, commercial relationships, joint ventures or capital commitments; |
|
|
• |
loss of senior management or other key personnel; |
|
|
• |
registration of additional shares of Class B common stock in connection with acquisitions; |
|
|
• |
lawsuits initiated against us or lawsuits initiated by us; |
|
|
• |
announcements of acquisitions or technical innovations; |
|
|
• |
potential loss or reduced contributions from distribution partners, reseller partners and agencies, or advertisers; |
|
|
• |
significant volatility in the market price and trading volume of technology companies in general and of companies in the digital advertising industry in particular; |
|
|
• |
changes in growth or earnings estimates or recommendations by analysts; |
|
|
• |
changes in the market valuations of similar companies; |
|
|
• |
changes in our industry and the overall economic environment; |
|
|
• |
volume of shares of Class B common stock available for public sale, including upon conversion of Class A common stock or upon exercise of stock options; |
|
|
• |
Class B common stock repurchases under our share repurchase program; |
|
|
• |
sales and purchases of stock by us or by our stockholders, including sales by certain of our executive officers and directors pursuant to written pre-determined selling and purchase plans under Rule 10b5-1 of the Securities Exchange Act of 1934, as amended (the “Exchange Act”); |
|
|
• |
short sales, hedging and other derivative transactions on shares of our Class B common stock; and |
|
|
• |
an adverse impact on us from any of the other risks cited n this Risk Factors section. |
In addition, the stock market in general, and the NASDAQ Global Select Market and the market for mobile and online commerce companies in particular, have experienced extreme price and volume fluctuations that have often been unrelated or disproportionate to the operating performance of the listed companies. These broad market and industry factors may seriously harm the market price of our Class B common stock, regardless of our operating performance. In the past, following periods of volatility in the market, securities class action litigation has often been instituted against these companies.
Litigation against us, whether or not judgment is entered against us, could result in substantial costs and potentially economic loss, and a diversion of our management’s attention and resources, any of which could seriously harm our financial condition. Additionally, there can be no assurance that an active trading market of our Class B common stock will be sustained.
38
If securities analysts do not continue to publish research or publish negative research about our business, our stock price and trading volume could decline.
The trading market for our Class B common stock depends in part on the research and reports that securities analysts publish about us or our business. If one or more of the analysts who covers us downgrades our stock or publishes negative research about our business, our stock price would likely decline. If one or more of these analysts ceases coverage of our company or fails to publish reports on us regularly, we could lose visibility in the market for our stock and demand for our stock could decrease, which could cause our stock price or trading volume to decline.
Our founders control the outcome of stockholder voting, and there may be an adverse effect on the price of our Class B common stock due to the disparate voting rights of our Class A common stock and our Class B common stock.
As of December 31, 2016, Russell C. Horowitz and Ethan A. Caldwell, two of our founders, beneficially owned 100% of the outstanding shares of our Class A common stock, which shares represented 77% of the combined voting power of all outstanding shares of our capital stock. These founders together controlled 77% of the combined voting power of all outstanding shares of our capital stock as of December 31, 2016. The holders of our Class A common stock and Class B common stock have identical rights except that the holders of our Class B common stock are entitled to one vote per share, while holders of our Class A common stock are entitled to twenty-five votes per share on all matters to be voted on by stockholders. This concentration of control could be disadvantageous to our other stockholders with interests different from those of these founders. This difference in the voting rights of our Class A common stock and Class B common stock could adversely affect the price of our Class B common stock to the extent that investors or any potential future purchaser of our shares of Class B common stock give greater value to the superior voting rights of our Class A common stock. Further, as long as these founders have a controlling interest, they will continue to be able to elect all or a majority of our board of directors and generally be able to determine the outcome of all corporate actions requiring stockholder approval. As a result, these founders will be in a position to continue to control all fundamental matters affecting our company, including any merger involving, sale of substantially all of the assets of, or change in control of, our company. The ability of these founders to control our company may result in our Class B common stock trading at a price lower than the price at which such stock would trade if these founders did not have a controlling interest in us. This control may deter or prevent a third party from acquiring us which could adversely affect the market price of our Class B common stock.
Anti-takeover provisions may limit the ability of another party to acquire us, which could cause our stock price to decline.
Our certificate of incorporation, as amended, our by-laws and Delaware law contain provisions that could discourage, delay or prevent a third party from acquiring us, even if doing so may be beneficial to our stockholders. In addition, these provisions could limit the price investors would be willing to pay in the future for shares of our Class B common stock. The following are examples of such provisions in our certificate of incorporation, as amended, or our by-laws:
|
|
• |
the authorized number of our directors can be changed only by a resolution of our board of directors; |
|
|
• |
advance notice is required for proposals that can be acted upon at stockholder meetings; |
|
|
• |
there are limitations on who may call stockholder meetings; and |
|
|
• |
our board of directors is authorized, without prior stockholder approval, to create and issue “blank check” preferred stock. |
We are also subject to Section 203 of the Delaware General Corporation Law, which provides, subject to enumerated exceptions, that if a person acquires 15% or more of our voting stock, the person is an “interested stockholder” and may not engage in “business combinations” with us for a period of three years from the time the person acquired 15% or more of our voting stock. The application of Section 203 of the Delaware General Corporation Law could have the effect of delaying or preventing a change of control of our company.
39
We may not pay dividends on our Class B common stock in the future which could impair the value of such stock.
Under Delaware law, dividends to stockholders may be made only from the surplus of a company, or, in certain situations, from the net profits for the current fiscal year or the fiscal year before which the dividend is declared. We initiated and paid a quarterly dividend on our Class B common stock from November 2006 through May 2015. Our ability to pay dividends in the future will depend on our financial results, liquidity and financial condition. We currently do not anticipate declaring or paying dividends in the foreseeable future.
None.
Our headquarters are located in Seattle, Washington and consist of approximately 61,000 square feet of leased office space. We lease additional office space in San Francisco, California, and New York, New York. Our information technology systems are hosted and maintained in third party facilities under collocation services agreements. See Item 1 of this Annual Report on Form 10-K under the caption “Information Technology and Systems.”
We believe that our existing facilities, together with additional space we believe we can lease at reasonable market rates, are adequate for our near-term business needs.
We are not a party to any material legal proceedings. From time to time, however, we may be subject to legal proceedings and claims in the ordinary course of business, including claims of alleged infringement of intellectual property rights, and a variety of claims arising in connection with our products and services.
Not Applicable.
40
|
ITEM 5. |
MARKET FOR REGISTRANT’S COMMON EQUITY, RELATED STOCKHOLDER MATTERS AND ISSUER PURCHASES OF EQUITY SECURITIES. |
Market Information
Our Class B common stock has been traded on the NASDAQ Global Select Market under the symbol “MCHX” since March 31, 2004 when we completed our initial public offering at a price of $6.50 per share. Prior to that time, there was no public market for our Class B common stock. The following table sets forth, for the periods indicated, the high and low closing sales prices for Marchex’s Class B common stock as reported on the NASDAQ Global Select Market:
|
|
|
High |
|
|
Low |
|
||
|
Year ended December 31, 2015 |
|
|
|
|
|
|
|
|
|
First Quarter |
|
$ |
4.75 |
|
|
$ |
3.81 |
|
|
Second Quarter |
|
$ |
5.21 |
|
|
$ |
3.92 |
|
|
Third Quarter |
|
$ |
4.93 |
|
|
$ |
3.65 |
|
|
Fourth Quarter |
|
$ |
4.60 |
|
|
$ |
3.64 |
|
|
Year ended December 31, 2016 |
|
|
|
|
|
|
|
|
|
First Quarter |
|
$ |
4.63 |
|
|
$ |
3.45 |
|
|
Second Quarter |
|
$ |
4.47 |
|
|
$ |
3.10 |
|
|
Third Quarter |
|
$ |
3.39 |
|
|
$ |
2.74 |
|
|
Fourth Quarter |
|
$ |
2.87 |
|
|
$ |
2.48 |
|
Holders
As of March 6, 2017, there were 43,100,399 shares of common stock outstanding that were held by 42 stockholders of record. Of these shares:
|
|
• |
5,056,136 shares were issued as Class A common stock, and as of this date were held by 2 stockholders of record; and |
|
|
• |
38,044,263 shares were issued as Class B common stock, and as of this date were held by 42 stockholders of record. |
Dividends
In 2014 and the first half of 2015, our board of directors declared quarterly dividends in the amount of $0.02 per share on our Class A and Class B common stock in each of the quarters, totaling $3.3 million and $1.7 million for those years, respectively. We discontinued paying dividends on our common stock after the second quarter of 2015, and we do not anticipate declaring or paying dividends in the foreseeable future.
41
Issuer Purchases of Equity Securities
During the fourth quarter of 2016, share repurchase activity was as follows:
|
Period |
|
Total number of shares purchased |
|
|
Average price paid per share |
|
|
Total number of shares purchased as part of publicly announced plans or programs |
|
|
Maximum number of shares (or approximate dollar value) that may yet be purchased under the plans or programs (1) |
|
||||
|
Class B Common Shares: |
|
|
|
|
|
|
|
|
|
|
|
|
|
|
|
|
|
October 1—October 31, 2016 (2), (3) |
|
|
295,767 |
|
|
$ |
0.49 |
|
|
|
— |
|
|
|
1,319,128 |
|
|
November 1—November 30, 2016 |
|
|
— |
|
|
$ |
— |
|
|
|
— |
|
|
|
1,319,128 |
|
|
December 1—December 31, 2016 |
|
|
— |
|
|
$ |
— |
|
|
|
— |
|
|
|
1,319,128 |
|
|
Total Class B Common Shares |
|
|
295,767 |
|
|
$ |
0.49 |
|
|
|
— |
|
|
|
1,319,128 |
|
|
(1) |
In November 2014, we established a 2014 share repurchase program, which supersedes and replaces any prior repurchase programs, and authorized the Company to repurchase up to 3 million shares in the aggregate of the Company’s Class B common stock. The timing and actual number of shares repurchased will depend on a variety of factors including price, corporate and regulatory requirements, capital availability, and other market conditions. |
|
(2) |
Includes shares of restricted equity subject to vesting, which were issued to certain employees. We repurchased 243,750 shares which were not already vested for $0.01 per share upon termination of employment. |
|
(3) |
Includes 52,017 shares of Class B common stock, which were repurchased to satisfy certain employees’ minimum tax withholding obligations in connection with the vesting of restricted stock awards and were based on the fair market value on the vesting date. |
42
This performance graph shall not be deemed “filed” for purposes of Section 18 of the Securities Exchange Act of 1934, as amended (the “Exchange Act”) or otherwise subject to the liabilities under that Section and shall not be deemed to be incorporated by reference into any filing of Marchex under the Securities Act of 1933, as amended or the Exchange Act.
The following graph shows a comparison from December 31, 2011 through December 31, 2016 of cumulative total return for our Class B common stock, the NASDAQ Composite Index (the “NASDAQ Composite Index”) and the RDG Internet Composite Index (the “RDG Index”). Measurement points are the last trading day of each of our fiscal years ended December 31, 2011 through 2016. The graph assumes that $100 was invested on December 31, 2011 in our Class B common stock, the NASDAQ Composite Index and the RDG Internet Composite Index and assumes reinvestment of any dividends. Such returns are based on historical results and are not intended to suggest future performance.
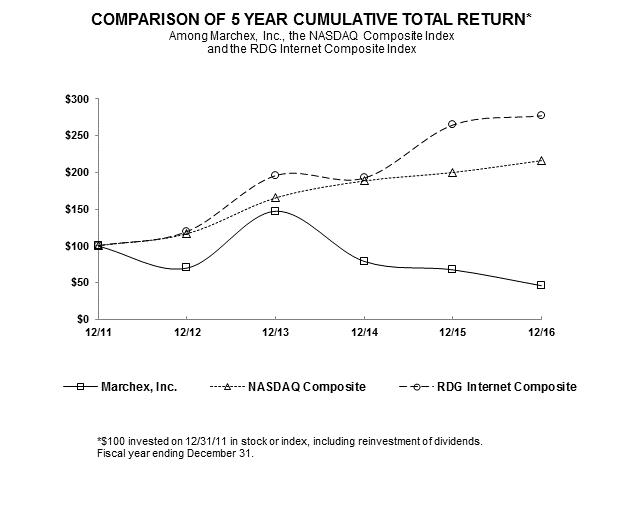
|
|
|
12/31/11 |
|
|
12/31/12 |
|
|
12/31/13 |
|
|
12/31/14 |
|
|
12/31/15 |
|
|
12/31/16 |
|
||||||
|
Marchex, Inc. |
|
$ |
100 |
|
|
$ |
70.03 |
|
|
$ |
147.40 |
|
|
$ |
79.11 |
|
|
$ |
67.70 |
|
|
$ |
46.12 |
|
|
NASDAQ Composite Index |
|
$ |
100 |
|
|
$ |
116.41 |
|
|
$ |
165.47 |
|
|
$ |
188.69 |
|
|
$ |
200.32 |
|
|
$ |
216.54 |
|
|
RDG Internet Composite Index |
|
$ |
100 |
|
|
$ |
119.34 |
|
|
$ |
195.83 |
|
|
$ |
192.42 |
|
|
$ |
264.96 |
|
|
$ |
277.56 |
|
43
The following selected consolidated financial data should be read in conjunction with Item 7 “Management’s Discussion and Analysis of Financial Condition and Results of Operations” and our consolidated financial statements and the related notes appearing elsewhere in this Form 10-K.
The consolidated financial data for the years ended December 31, 2012 and 2013 is derived from our audited consolidated financial statements which are not included in this Form 10-K.
The consolidated statements of operations data for the years ended December 31, 2014, 2015 and 2016, and the consolidated balance sheet data at December 31, 2015 and 2016, are derived from our audited consolidated financial statements appearing elsewhere in this Form 10-K.
The historical results are not necessarily indicative of the results to be expected in any future period.
Consolidated Statements of Operations Data (in thousands except per share amounts):
|
|
|
Year ended December 31, |
|
|||||||||||||||||
|
|
|
2012 (1) |
|
|
2013 |
|
|
2014 (2) |
|
|
2015 (2) |
|
|
2016 (2) |
|
|||||
|
Revenue |
|
$ |
129,309 |
|
|
$ |
147,837 |
|
|
$ |
173,601 |
|
|
$ |
143,013 |
|
|
$ |
129,547 |
|
|
Loss from operations |
|
$ |
(14,061 |
) |
|
$ |
(2,102 |
) |
|
$ |
(222 |
) |
|
$ |
(507 |
) |
|
$ |
(83,897 |
) |
|
Loss from continuing operations |
|
$ |
(29,845 |
) |
|
$ |
(2,162 |
) |
|
$ |
(22,793 |
) |
|
$ |
(597 |
) |
|
$ |
(84,066 |
) |
|
Discontinued operations, net of tax |
|
$ |
(5,352 |
) |
|
$ |
3,979 |
|
|
$ |
3,703 |
|
|
$ |
27,318 |
|
|
$ |
— |
|
|
Net income (loss) |
|
$ |
(35,196 |
) |
|
$ |
1,817 |
|
|
$ |
(19,090 |
) |
|
$ |
26,721 |
|
|
$ |
(84,066 |
) |
|
Net income (loss) applicable to common stockholders |
|
$ |
(35,853 |
) |
|
$ |
1,817 |
|
|
$ |
(19,217 |
) |
|
$ |
26,684 |
|
|
$ |
(84,066 |
) |
|
Basic and diluted net income (loss) per Class A share applicable to common stockholders: |
|
|
|
|
|
|
|
|
|
|
|
|
|
|
|
|
|
|
|
|
|
Continuing operations applicable to common stockholders |
|
$ |
(0.90 |
) |
|
$ |
(0.06 |
) |
|
$ |
(0.57 |
) |
|
$ |
(0.01 |
) |
|
$ |
(2.01 |
) |
|
Discontinued operations, net of tax |
|
$ |
(0.16 |
) |
|
$ |
0.11 |
|
|
$ |
0.09 |
|
|
$ |
0.66 |
|
|
$ |
— |
|
|
Net income (loss) per Class A share applicable to common stockholders |
|
$ |
(1.06 |
) |
|
$ |
0.05 |
|
|
$ |
(0.48 |
) |
|
$ |
0.65 |
|
|
$ |
(2.01 |
) |
|
Basic and diluted net income (loss) per Class B share applicable to common stockholders: |
|
|
|
|
|
|
|
|
|
|
|
|
|
|
|
|
|
|
|
|
|
Continuing operations applicable to common stockholders |
|
$ |
(0.89 |
) |
|
$ |
(0.06 |
) |
|
$ |
(0.57 |
) |
|
$ |
(0.01 |
) |
|
$ |
(2.01 |
) |
|
Discontinued operations, net of tax |
|
$ |
(0.16 |
) |
|
$ |
0.11 |
|
|
$ |
0.09 |
|
|
$ |
0.66 |
|
|
$ |
— |
|
|
Net income (loss) per Class B share applicable to common stockholders |
|
$ |
(1.05 |
) |
|
$ |
0.05 |
|
|
$ |
(0.48 |
) |
|
$ |
0.65 |
|
|
$ |
(2.01 |
) |
|
Shares used to calculate basic net income (loss) per share: |
|
|
|
|
|
|
|
|
|
|
|
|
|
|
|
|
|
|
|
|
|
Class A |
|
|
9,574 |
|
|
|
8,816 |
|
|
|
5,853 |
|
|
|
5,233 |
|
|
|
5,190 |
|
|
Class B |
|
|
24,412 |
|
|
|
26,798 |
|
|
|
34,157 |
|
|
|
35,935 |
|
|
|
36,550 |
|
|
Shares used to calculate diluted net income (loss) per share: |
|
|
|
|
|
|
|
|
|
|
|
|
|
|
|
|
|
|
|
|
|
Class A |
|
|
9,574 |
|
|
|
8,816 |
|
|
|
5,853 |
|
|
|
5,233 |
|
|
|
5,190 |
|
|
Class B |
|
|
33,986 |
|
|
|
35,614 |
|
|
|
40,010 |
|
|
|
41,168 |
|
|
|
41,740 |
|
|
|
(1) |
During 2012, we recorded a pre-tax non-cash impairment charge of $16.7 million related to our Archeo segment and a non-cash charge to income tax expense of $16.4 million to establish a valuation allowance on certain deferred tax assets. |
|
|
(2) |
See Notes 5, 8, and 10 of the Notes to Consolidated Financial Statements for information with respect to income taxes, goodwill, and discontinued operations, respectively, for 2014, 2015, and 2016. |
44
Consolidated Balance Sheet Data (in thousands), except per share data:
|
|
|
December 31, |
|
|||||||||||||||||
|
|
|
2012 |
|
|
2013 |
|
|
2014 |
|
|
2015 |
|
|
2016 |
|
|||||
|
Cash and cash equivalents |
|
$ |
15,930 |
|
|
$ |
30,912 |
|
|
$ |
80,032 |
|
|
$ |
109,155 |
|
|
$ |
103,950 |
|
|
Working capital |
|
$ |
21,683 |
|
|
$ |
39,675 |
|
|
$ |
85,849 |
|
|
$ |
118,823 |
|
|
$ |
109,634 |
|
|
Total assets |
|
$ |
149,147 |
|
|
$ |
162,148 |
|
|
$ |
180,669 |
|
|
$ |
204,992 |
|
|
$ |
128,272 |
|
|
Other non-current liabilities |
|
$ |
2,216 |
|
|
$ |
2,095 |
|
|
$ |
1,118 |
|
|
$ |
662 |
|
|
$ |
134 |
|
|
Total liabilities |
|
$ |
26,212 |
|
|
$ |
27,393 |
|
|
$ |
24,516 |
|
|
$ |
17,526 |
|
|
$ |
15,001 |
|
|
Total stockholders’ equity |
|
$ |
122,935 |
|
|
$ |
134,755 |
|
|
$ |
156,153 |
|
|
$ |
187,466 |
|
|
$ |
113,271 |
|
|
Cash dividends declared per common share |
|
$ |
0.25 |
|
|
$ |
— |
|
|
$ |
0.08 |
|
|
$ |
0.04 |
|
|
$ |
— |
|
45
The following discussion should be read in conjunction with the audited consolidated financial statements and the notes to those statements which appear elsewhere in this Annual Report on Form 10-K. This discussion contains forward-looking statements. Please see page 1 on this Annual Report on Form 10-K “Forward-Looking Statements” and Item 1A of this Annual Report on Form 10-K under the caption “Risk Factors” for a discussion of the risks, uncertainties and assumptions associated with these statements.
Overview
Marchex is a mobile advertising analytics company. We power global brands to understand the consumer journey by connecting online behavior to real-world, offline actions.
We provide products and services for enterprises that depend on consumer phone calls to drive sales. Our media analytics products can provide actionable intelligence on the major media channels advertisers use to acquire customers over the phone.
Our primary product offerings are:
|
|
• |
Marchex Call Analytics. Marchex Call Analytics is an analytics platform for enterprises that depend on inbound phone calls to drive sales, appointments and reservations. Marketers can use this platform to understand which marketing channels, advertisements, keywords and advertising are driving calls to their business, allowing them to optimize their advertising expenditures across media channels. Marchex Call Analytics also includes technology that can extract data and insights about what is happening during a call and measures the outcome of calls and return on investment. The platform also includes technology that blocks robocalls, telemarketers and spam calls to save businesses time. Marchex Call Analytics data can integrate directly into third-party marketer workflows such as Salesforce, Eloqua, Adobe, Kenshoo, DoubleClick Search, Marin Software, and in 2017 Facebook and Instagram, in addition to other marketing dashboards and tools. Advertisers pay us a fee for each call or call related data element they receive from calls including call-based ads we distribute through our sources of call distribution or for each phone number tracked based on pre-negotiated rates. |
|
|
• |
Marchex Search Analytics. Marchex Search Analytics is a product for search marketers that drive phone calls from search campaigns. Marchex Search Analytics attributes inbound phone calls made directly from paid search ads and landing pages to a keyword. The platform can deliver this data as well as data about call outcomes directly into search management platforms like DoubleClick Search and Kenshoo. According to a June 2015 BIA Kelsey report, phone calls from search to businesses from smartphones will reach over 40 billion and the number of mobile searches will exceed desktop searches in 2016. |
|
|
• |
Marchex Display and Video Analytics. Marchex Display and Video Analytics is a product for marketers that buy digital display advertising. Marchex Display and Video Analytics can measure the influence that display advertising has on inbound phone calls so that marketers can better attribute their return on advertising spend for inbound phone calls and delivers this data to marketers in a reporting dashboard. According to a January 2017 eMarketer report, US display advertising spend is expected to reach over $40 billion in 2017. |
|
|
• |
Marchex Social Analytics. Launched in 2017, Marchex Social Analytics is a product for marketers that buy social media advertising. Marchex Social Analytics can measure the influence that social advertising from select sources like Facebook or Instagram has on inbound phone calls so that marketers can better attribute their return on advertising spend for inbound phone calls and delivers this data to marketers in a reporting dashboard. According to a December 2016 Zenith Media report, global social media is forecasted to grow 72% between 2016 and 2019, rising from $29 billion to $50 billion. |
46
|
|
• |
Local Leads. Our local leads platform is a white-labeled, full service advertising solution for small business resellers, such as Yellow Pages providers and vertical marketing service providers, to sell call advertising, search marketing and other lead generation products through their existing sales channels to their small business advertisers. These calls and leads are then fulfilled by us across our distribution network, including mobile sources, and search engines. The lead services we offer to small business advertisers through our local leads platform include pay-for-call, search marketing and ad creation and include advanced features such as call tracking, geo-targeting, campaign management, reporting and analytics. The local leads platform is highly scalable and has the capacity to support hundreds of thousands of advertiser accounts. Reseller partners and publishers generally pay us account fees and agency fees for our products in the form of a percentage of the cost of every click or call delivered to their advertisers. Through our primary contract with Yellowpages.com LLC (“YP”), we generate revenues from our local leads platform. We also have a separate pay-for-call services arrangement with YP. In 2016, we extended these agreements through December 31, 2018. The primary local leads platform arrangement provides YP additional flexibility to migrate active accounts to itself or a third-party provider prior to the end of an advertiser contract and provides YP with certain termination rights beginning January 1, 2018 upon four months prior notice. YP is our largest reseller partner and was responsible for 25%, 29% and 23% of our total revenues in the years ended December 31, 2014, 2015 and 2016, respectively. We also have a separate distribution partner agreement with YP. |
We were incorporated in Delaware on January 17, 2003. Acquisition initiatives have played an important part in our corporate history to date.
We have offices in Seattle, Washington; New York, New York; and San Francisco, California.
On October 3, 2016, by mutual agreement, Peter Christothoulou resigned as our Chief Executive Officer. In addition, Clark Kokich resigned as Executive Chairman of our Board of Directors (the “Board”) and as a member of the Board on October 1, 2016. Effective on October 3, 2016, the Board established an Interim Office of the CEO subject to oversight by Anne Devereux-Mills as Chairman. The Interim Office of the CEO consists of Michael Arends, Ethan Caldwell, Gary Nafus, and Russell C. Horowitz who is currently a consultant to Marchex and previously Chief Executive Officer and Chairman of the Board. The Interim Office of the CEO will perform the duties and responsibilities of the chief executive officer on an interim basis while a search for a permanent chief executive officer is conducted.
Consolidated Statements of Operations
All significant inter-company transactions and balances within Marchex have been eliminated in consolidation. Our purchase accounting resulted in all assets and liabilities from our acquisitions being recorded at their estimated fair values on the respective acquisition dates. All goodwill, intangible assets, and liabilities resulting from the acquisitions have been recorded in our consolidated financial statements.
We primarily generate our revenues from our Call-driven products and services. Call-driven revenue consists of payments from advertisers for use of our call analytics technology and pay-for-call advertising services. Call-driven revenue also consists of payments from our reseller partners for use of our local leads platform and marketing services, which they offer to their small business customers, as well as payments from advertisers for cost-per-action services. Prior to 2016, we also generated revenue from our Archeo operations, which included revenue generated from our click based advertising and Internet domain operations. In April 2015, we sold certain assets related to Archeo’s domain operations, including the bulk of its domain name portfolio. The operating results related to this April 2015 disposition are shown as discontinued operations in the consolidated statements of operations. In December 2015, we sold the remaining Archeo operations which did not meet the criteria for discontinued operations, and as a result the operating results are reflected in continuing operations in 2015. See Note 9. Segment Reporting and Geographic Information for revenue detail by segment and geographical area and Note 10. Discontinued Operations, Dispositions, and Other of the Notes to Consolidated Financial Statements for further discussion on the Archeo dispositions.
47
Presentation of Financial Reporting Periods
The comparative periods presented are for the years ended December 31, 2014, 2015 and 2016.
Revenue
We generate revenue through our call advertising services, which includes our call analytics and call marketplace services, and our local leads platform. Historically, we also generated revenue through pay-per-click advertising services.
Our performance-based advertising services, which include call advertising, cost-per-action services, and pay-per-click services, amounted to greater than 80% of revenues in all periods presented. In addition, we generate revenue through our local leads platform, which enables partner resellers to sell call advertising and/or search marketing products, and campaign management services. These secondary sources accounted for less than 20% of our revenues in all periods presented. We have no barter transactions.
We recognize revenue upon the completion of our performance obligation, provided that: (1) evidence of an arrangement exists; (2) the arrangement fee is fixed and determinable; and (3) collection is reasonably assured.
In certain cases, we record revenue based on available and reported preliminary information from third parties. Collection on the related receivables may vary from reported information based upon third party refinement of the estimated and reported amounts owed that occurs subsequent to period ends.
Performance-Based Advertising and Other Services
Our call analytics technology platform provides data and insights that can measure the performance of mobile, online and offline advertising for advertisers and small business resellers. We generate revenue from our call analytics technology platform when advertisers pay us a fee for each call or call related data element they receive from calls including call-based ads we distribute through our sources of call distribution or for each phone number tracked based on a pre-negotiated rate.
Our call marketplace offers advertisers and adverting service providers’ ad placements across our distribution network. Advertisers or advertising service providers are charged on a pay-per-call or cost-per-action basis. We generate revenue upon delivery of qualified and reported phone calls to advertisers or advertising service providers’ listings. These advertisers and advertising service providers pay us a designated transaction fee for each qualified phone call, which occurs when a user makes a phone call, clicks, or completes a specified action on any of their advertisement listings after it has been placed by us or by our distribution partners. Each qualified phone call or specified action on an advertisement listing represents a completed transaction. We also generate revenue from cost-per-action services, which occurs when a user makes a phone call from our advertiser’s listing or is redirected from one of our web sites or a third party web site in our distribution network to an advertiser web site and completes the specified action.
Our Local Leads platform allows reseller partners to sell call advertising, search marketing, and other lead generation products through their existing sales channels to small business advertisers. We generate revenue from reseller partners utilizing our local leads platform and are paid account fees and also agency fees for our products in the form of a percentage of the cost of every call or click delivered to advertisers. The reseller partners engage the advertisers and are the primary obligor, and we, in certain instances, are only financially liable to the publishers in our capacity as a collection agency for the amount collected from the advertisers. We recognize revenue for these fees under the net revenue recognition method. In limited arrangements resellers pay us a fee for fulfilling an advertiser’s campaign in our distribution network and we act as the primary obligor. We recognize revenue for these fees under the gross revenue recognition method.
48
We enter into agreements with various mobile, online and offline distribution partners to provide distribution for pay-for-call advertisement listings which contain call tracking numbers and/or URL strings of our advertisers. We generally pay distribution partners based on a percentage of revenue or a fixed amount for each phone call on these listings. The level of phone calls contributed by our distribution partners has varied, and we expect it will continue to vary, from quarter to quarter and year to year, sometimes significantly. If we do not add new distribution partners or renew our existing distribution partner agreements and on terms as favorable as current arrangements, replace traffic lost from terminated distribution agreements with other sources, or if our distribution partners’ businesses do not grow or are adversely affected, our revenue and results of operations may be materially and adversely affected. Our ability to grow will be impacted by our ability to increase our distribution, which impacts the number of mobile and Internet users who have access to our advertisers’ listings and the rate at which our advertisers are able to convert calls from these mobile and Internet users into completed transactions, such as a purchase or sign up. Our ability to grow also depends on our ability to continue to increase the number of advertisers who use our products and services, the amount these advertisers spend on our products and services, advertiser adoption of new products and services and the amount these advertisers are willing to pay for these new products and services.
We utilize phone numbers as part of our call analytics and pay-for-call services to advertisers, which enables advertisers and other users of our services to help measure the effectiveness of mobile, online, and offline advertising campaigns. If we are not able to secure or retain sufficient phone numbers needed for our services or we are limited in the number of available telecommunication carriers or vendors to provide such phone numbers to us in the event of any industry consolidation or if telecommunication carriers or vendors were to experience system disruptions, our revenue and results of operations may be materially and adversely affected.
We have revenue concentrations with certain large customers. Many of these customers are not subject to long term contracts with us or have contracts with near term expiration dates, and are able to reduce or cease advertising spend at any time and for any reason. In some cases, we engage with advertisers through advertising agencies, who act on behalf of the advertisers. Advertising agencies may place insertion orders with us for particular advertising campaigns for a set period of time and are not obligated to commit beyond the campaign governed by a particular insertion order and may also cancel the campaign prior to completion. Advertising agencies also have relationships with many different providers, each of whom may be running portions of the advertising campaign. If any of our largest customers are acquired, such acquisition may impact its advertising spending or budget with us, including due to rebranding, change in advertising agency, or change in media tactics. A significant reduction in advertising spending or budgets by our largest customers, or the loss of one or more of these customers, if not replaced by new customers or an increase in business from existing customers, would have a material adverse effect on our future operating results.
We anticipate that these variables will fluctuate in the future, affecting our ability to grow and our financial results. In particular, it is difficult to project phone call usage, the number of phone calls or other actions performed by users of our products and services, which will be delivered to our advertisers, and how much advertisers will spend with us and the amount they are willing to pay for our products and services. It is even more difficult to anticipate the average revenue per phone call or other performance-based actions. It is also difficult to anticipate the impact of worldwide economic conditions on advertising budgets.
49
In addition, we believe we will experience seasonality. Our quarterly results have fluctuated in the past and may fluctuate in the future due to seasonal fluctuations in levels of mobile and internet usage and seasonal purchasing cycles of many advertisers. Our experience has shown that during the spring and summer months, mobile and Internet usage is lower than during other times of the year and during the latter part of the fourth quarter of the calendar year we generally experience lower call volume and reduced demand for calls from our call advertising customers. The extent to which usage and call volume may decrease during these off-peak periods is difficult to predict. Prolonged or severe decreases in usage and call volume during these periods may adversely affect our growth rate and results and in turn the market price of our securities. Historically, we have seen in the first quarter of the calendar year, this trend generally reversing with increased mobile and internet usage and often new budgets at the beginning of the year for many of our customers with fiscal years ending December 31. However, there can be no assurances such seasonal trends will consistently repeat each year. The current business environment and our industry has generally both resulted in, and we may continue to see, many advertisers and reseller partners reducing advertising and marketing services budgets or adjusting such budgets throughout the year, changing marketing strategies or agency affiliations, or advertisers being acquired by parent companies with alternative media initiatives, which we expect will impact our quarterly results of operations in addition to the typical seasonality seen in our industry.
We believe that our future revenue growth will depend on, among other factors, our ability to attract new advertisers, compete effectively, maximize our sales efforts, demonstrate a positive return on investment for advertisers, successfully improve existing products and services, develop successful new products and services, and expand internationally. If we are unable to generate adequate revenue growth and to manage our expenses, we may continue to incur significant losses in the future and may not be able to achieve or maintain profitability.
Service Costs
Our service costs represent the cost of providing our performance-based advertising services and our search marketing services. The service costs that we have incurred in the periods presented primarily include:
|
|
• |
user acquisition costs; |
|
|
• |
amortization of intangible assets; |
|
|
• |
license and content fees; |
|
|
• |
credit card processing fees; |
|
|
• |
network operations; |
|
|
• |
serving our search results; |
|
|
• |
telecommunication costs, including the use of phone numbers relating to our call products and services; |
|
|
• |
maintaining our websites; |
|
|
• |
domain name registration renewal fees; |
|
|
• |
domain name costs; |
|
|
• |
network fees; |
|
|
• |
fees paid to outside service providers; |
|
|
• |
delivering customer service; |
|
|
• |
depreciation of our websites, network equipment and software; |
|
|
• |
colocation service charges of our network website equipment; |
|
|
• |
bandwidth and software license fees; |
|
|
• |
payroll and related expenses of related personnel; and |
|
|
• |
stock-based compensation of related personnel. |
50
For the periods presented the largest component of our service costs consists of user acquisition costs that relate primarily to payments made to distribution partners for access to their mobile, online, offline, or other user traffic. We enter into agreements of varying durations with distribution partners that integrate our services into their web sites, indexes or other sources of user traffic. The primary economic structure of the distribution partner agreements is a variable payment based on a specified percentage of revenue.
These variable payments are often subject to minimum payment amounts per phone call or other action. Other payment structures that to a lesser degree exist include:
|
|
• |
variable payments based on a specified metric, such as number of paid phone calls or other actions; |
|
|
• |
fixed payments, based on a guaranteed minimum amount of usage delivered; and |
|
|
• |
a combination arrangement with both fixed and variable amounts that may be paid in advance. |
We expense user acquisition costs based on whether the agreement provides for variable or fixed payments. Agreements with variable payments based on a percentage of revenue, number of paid phone calls, or other metrics are expensed as incurred based on the volume of the underlying activity or revenue multiplied by the agreed-upon price or rate. Agreements with fixed payments and with minimum guaranteed amounts of usage are expensed at the greater of the pro-rata amount over the term of arrangement or the actual usage delivered to date based on the contractual revenue share.
Sales and Marketing
Sales and marketing expenses consist primarily of:
|
|
• |
payroll and related expenses for personnel engaged in marketing and sales functions; |
|
|
• |
advertising and promotional expenditures including online and outside marketing activities; |
|
|
• |
cost of systems used to sell to and serve advertisers; and |
|
|
• |
stock-based compensation of related personnel. |
Product Development
Product development costs consist primarily of expenses incurred in the research and development, creation and enhancement of our websites and services.
Our research and development expenses include:
|
|
• |
payroll and related expenses for personnel; |
|
|
• |
costs of computer hardware and software; |
|
|
• |
costs incurred in developing features and functionality of the services we offer; and |
|
|
• |
stock-based compensation of related personnel. |
For the periods presented, substantially all of our product development expenses are research and development. Product development costs are expensed as incurred or capitalized into property and equipment in accordance with FASB ASC 350, Intangibles – Goodwill and Other. This statement requires that costs incurred in the preliminary project and post-implementation stages of an internal use software project be expensed as incurred and that certain costs incurred in the application development stage of a project be capitalized.
51
General and administrative expenses consist primarily of:
|
|
• |
payroll and related expenses for executive and administrative personnel; |
|
|
• |
professional services, including accounting, legal and insurance; |
|
|
• |
bad debt provisions; |
|
|
• |
facilities costs; |
|
|
• |
other general corporate expenses; and |
|
|
• |
stock-based compensation of related personnel. |
Stock-Based Compensation
We measure stock-based compensation cost at the grant date based on the fair value of the award and recognize it as expense, net of estimated forfeitures, over the vesting or service period, as applicable, of the stock award using the straight-line method. Stock-based compensation expense has been included in the same lines as compensation paid to the same employees in the consolidated statements of operations.
Provision for Income Taxes
We utilize the asset and liability method of accounting for income taxes. Under this method, deferred tax assets and liabilities are recognized for the future tax consequences attributable to differences between the financial statement carrying amounts of existing assets and liabilities and their respective tax bases and operating loss and tax credit carryforwards. Deferred tax assets and liabilities are measured using enacted tax rates expected to apply to taxable income in the years in which those temporary differences are expected to be recovered or settled. The effect on deferred tax assets and liabilities of a change in tax law is recognized in results of operations in the period that includes the enactment date. Uncertain tax positions as of December 31, 2015 and 2016 amounted to $888,000 and $1.1 million, respectively.
At December 31, 2016, based upon both positive and negative evidence available, we determined that it is not more likely than not that our deferred tax assets of $44.5 million will be realized and accordingly, we have recorded 100% valuation allowance of $44.5 million against these deferred tax assets. This compares to a valuation allowance of $34.5 million at December 31, 2015. Based on the level of historical taxable losses and the uncertainty of projections for future taxable income over the periods for which the deferred tax assets are deductible, we concluded that it is not more likely than not that the gross deferred tax assets will be realized. In assessing the realizability of deferred tax assets, we considered whether it is more likely than not that some or all of the deferred tax assets will be realized. The ultimate realization of deferred tax assets depends on the generation of future taxable income during the periods in which those temporary differences are deductible. We also considered the future reversal of deferred tax liabilities, carryback potential, projected taxable income, and tax planning strategies as well as its history of taxable income or losses in the relevant jurisdictions in making this assessment. We incurred taxable losses in 2014, 2015, and 2016. As of December 31, 2016, our federal NOL carryforwards were approximately $63.5 million for income tax purposes, which will begin to expire in 2026. As of December 31, 2016, our state, city, and other foreign jurisdiction NOL carryforwards were approximately $6.4 million, which begin to expire in 2025.
In addition, at December 31, 2015 and 2016, we have certain federal NOL carryforwards of approximately $1.7 million, which begin to expire in 2019. The Tax Reform Act of 1986 limits the use of NOL and tax credit carryforwards in certain situations where changes occur in the stock ownership of a company. We believe that such a change has occurred related to these specific NOL carryforwards, and that the utilization is limited such that substantially all of these NOL carryforwards will never be utilized. Accordingly, we have not included these federal NOL carryforwards in its deferred tax assets.
From time to time, various state, federal, and other jurisdictional tax authorities undertake reviews of us and our filings. We believe any adjustments that may ultimately be required as a result of any of these reviews will not be material to the financial statements.
52
Comparison of the year ended December 31, 2015 (2015) to the year ended December 31, 2016 (2016) and comparison of the year ended December 31, 2014 (2014) to the year ended December 31, 2015 (2015).
Segments
We have historically organized our operations into two segments: (1) Call-driven, which is comprised of our performance-based advertising business focused on driving phone calls and our Local Leads platform; and (2) Archeo, which included our click-based advertising and Internet domain name operations that were sold in 2015. For the year ended December 31, 2016, our operating results are primarily all Call-driven and other operating activities related to the transition related activities of the Archeo operations were not significant and therefore are not presented below. For the years ended December 31, 2014 and 2015, operating results by segment were as follows:
|
|
|
Years ended December 31, |
|
|||||
|
|
|
2014 |
|
|
2015 |
|
||
|
Call-driven |
|
|
|
|
|
|
|
|
|
Revenue |
|
$ |
168,051 |
|
|
$ |
139,886 |
|
|
Operating expenses |
|
|
156,952 |
|
|
|
132,077 |
|
|
Segment profit |
|
$ |
11,099 |
|
|
$ |
7,809 |
|
|
Archeo |
|
|
|
|
|
|
|
|
|
Revenue |
|
$ |
5,550 |
|
|
$ |
3,127 |
|
|
Operating expenses |
|
|
4,617 |
|
|
|
2,696 |
|
|
Segment profit |
|
$ |
933 |
|
|
$ |
431 |
|
|
Reconciliation of segment profit to loss from continuing operations before provision for income taxes: |
|
|
|
|
|
|
|
|
|
Total segment profit |
|
$ |
12,032 |
|
|
$ |
8,240 |
|
|
Less reconciling items: |
|
|
|
|
|
|
|
|
|
Stock-based compensation |
|
|
11,888 |
|
|
|
10,024 |
|
|
Amortization of intangible assets from acquisitions |
|
|
434 |
|
|
|
— |
|
|
Acquisition and disposition related costs |
|
|
(68 |
) |
|
|
219 |
|
|
Gain on sale of Archeo assets |
|
|
— |
|
|
|
(1,496 |
) |
|
Interest expense and other, net |
|
|
62 |
|
|
|
63 |
|
|
Loss from continuing operations before provision for income taxes |
|
$ |
(284 |
) |
|
$ |
(570 |
) |
|
|
|
Years ended December 31, |
|
|||||
|
|
|
2014 |
|
|
2015 |
|
||
|
Reconciliation of segment revenue to consolidated revenue |
|
|
|
|
|
|
|
|
|
Call-driven |
|
$ |
168,051 |
|
|
$ |
139,886 |
|
|
Archeo |
|
|
5,550 |
|
|
|
3,127 |
|
|
Total |
|
$ |
173,601 |
|
|
$ |
143,013 |
|
Revenue
2015 to 2016
Revenue decreased 9% from $143.0 million in 2015 to $129.5 million in 2016. The decrease was due primarily to a decrease in our Call-driven revenues and no Archeo revenues generated in 2016 as a result of the sale of the Archeo operations in 2015. Archeo revenues for the year ended December 31, 2015 were $3.1 million.
Our Call-driven revenues decreased 7% from $139.9 million in 2015 to $129.5 million in 2016. This decrease was due primarily to lower advertiser budgets for our pay-for-call services and fewer YP small business accounts and related revenues.
53
We expect our revenues to be lower in the near and intermediate terms compared to the previous year’s quarters with fewer small business accounts on our local leads platform and reduced demand for calls from our call advertising customers.
Under our primary contract with YP, we generate revenues from our local leads platform to sell call advertising and/or search marketing packages through their existing sales channels, which are then fulfilled by us across our distribution network. We are paid account fees and agency fees for our products in the form of a percentage of the cost of every call or click delivered to their advertisers. We also have a separate pay-for-call relationship with YP. We charge an agreed-upon price for qualified calls or leads from our network. In 2016, we extended these agreements through December 31, 2018. The primary local leads platform arrangement provides YP flexibility to migrate active accounts to itself or a third-party provider prior to the end of an advertiser contract and provides YP with certain termination rights beginning January 1, 2018 upon four months prior notice. Our revenues from YP as a percentage of our total revenue have decreased and may continue to comprise a smaller percentage of our total revenue. We expect YP may decrease the number of new advertiser accounts with us and may elect to migrate certain active accounts to itself or a third party provider which would result in fewer small business accounts and related revenues, as well as reduced contribution and profitability. YP’s small business account base utilizing our platform has declined, and to the extent declines occur in their business, their small business accounts may spend fewer dollars on our pay-for-call services. We expect YP in future periods will comprise lower total revenues compared to previous periods. We also have a separate distribution partner agreement with YP. There can be no assurance that our business with them in the future will continue at or near current revenue and contribution levels, that we will be able to renew and extend the contracts, and if renewed, the contracts may be on less favorable terms to us, any of which could have a material adverse effect on our future operating results. YP accounted for 29% and 23% of total revenues for the years ended December 31, 2015 and 2016, respectively.
We also have arrangements with advertising agencies, such as Resolution Media and OMD Digital, who act on an advertiser’s behalf and may represent more than one advertiser that utilizes our products and services. Our primary arrangement with Resolution Media is for pay-for-call services whereby we charge an agreed-upon price for qualified calls or leads from our network and call analytic services. Resolution Media accounted for 18% and 20% of total revenues for the years ended December 31, 2015 and 2016, respectively, of which the majority related to a single advertiser, State Farm. State Farm, who utilizes our services through Resolution Media and OMD Digital, accounted for 19% and 23% of total revenues for the years ended December 31, 2015 and 2016, respectively. Resolution Media and OMD Digital place insertion orders for our services on behalf of State Farm for campaigns which are for a set period of time and/or budget level. We expect in the near to intermediate term campaign spend levels related to State Farm to be lower compared to previous quarters, which will result in lower total revenues and contribution.
2014 to 2015
Revenue decreased 18% from $173.6 million in 2014 to $143.0 million in 2015. The decrease was due primarily to a decrease in our Call-driven revenues.
Our Call-driven revenues decreased 17% from $168.1 million in 2014 to $139.9 million in 2015. This decrease was due primarily to our call advertising arrangement with Allstate Insurance Company (“Allstate”), which ceased in September 2014 and contributed $48.8 million of revenue for the year ended December 31, 2014 and, to a lesser extent, fewer YP small business accounts related revenues. This was partially offset by an increase in other advertiser budgets for our pay-for-call and call analytic services.
Our arrangement with Allstate was for call advertising services and accounted for 28% of total revenues for the year ended December 31, 2014. Our primary arrangement with Allstate in 2014 was for pay-for-call services within our call marketplace whereby we charge an agreed-upon price for qualified calls or leads from our network. In September 2014, Allstate ceased purchases of the pay-for-call services. Allstate accounted for $48.8 million of total revenues for the year ended December 31, 2014. The related distribution partner payments (a component of service costs) were $43.3 million and revenues less such distribution partner payments were $5.5 million for the year ended December 31, 2014. During the three months ended March 31, 2015, we recognized $462,000 in revenues from Allstate, primarily related to a final performance clause under our arrangement with Allstate. We do not expect Allstate will purchase additional pay-for-call services in the foreseeable future.
54
Our Archeo revenues decreased 44% from $5.6 million for the year ended December 31, 2014 to $3.1 million in the same period for 2015. These decreases were primarily due to lower revenues from cost-per-actions from resellers related to our local search and directory web sites.
In April 2015, we sold certain assets related to Archeo’s domain operations, including the bulk of our domain portfolio. The operating results of this disposition are shown as discontinued operations in the consolidated statements of operations. In December 2015, we sold the remaining Archeo operations. This disposition did not meet the criteria for discontinued operations, and, as a result, the operating results are reflected in continuing operations.
We have revenue concentrations with other certain large customers. Many of these customers are not subject to long term contracts with us or may have contracts with near term expiration dates such as Yellow Pages Ltd (“YPG), and are able to reduce or cease advertising spend at any time and for any reason. We expect YPG revenues to be lower compared to previous periods. In some cases, we engage with advertisers through advertising agencies, who act on behalf of the advertisers. Advertising agencies, such as Resolution Media and OMD Digital, may place insertion orders with us on behalf of advertisers (including State Farm) for particular advertising campaigns for a set period of time and are not obligated to commit beyond the campaign governed by a particular insertion order and may also cancel the campaign prior to completion. Advertising agencies also have relationships with many different providers, each of whom may be running portions of the advertising campaign. If any of our largest customers are acquired, such acquisition may impact its advertising spending or budget with us, including due to rebranding, change in advertising agency, or change in media tactics. A significant reduction in advertising spending or budgets by our largest customers, or the loss of one or more of these customers, if not replaced by new customers or an increase in business from existing customers, would have a material adverse effect on our future operating results.
Our ability to maintain and grow our revenues will depend in part on maintaining and increasing the number and volume of transactions with advertisers and advertising services providers and maintaining and increasing the number of phone calls and the other actions performed by users of our services through our distribution partners. We believe this is dependent in part on delivering quality traffic that ultimately results in purchases or conversions as well as providing through our call analytics platform quality data and insights that can measure the performance of advertising spend for our advertisers and advertising service providers. Our revenues are primarily generated using third party distribution networks to deliver the pay-for-call advertisers’ listings. The distribution network includes mobile and online search engine applications, directories, destination sites, shopping engines, third party Internet domains or web sites, other targeted Web-based content and offline sources. We generate revenue upon delivery of qualified and reported phone calls to our advertisers or to advertising services providers’ listings. We pay a revenue share to the distribution partners to access their mobile, online, offline or other user traffic. We also generate revenue from cost-per-action services, which occurs when a user makes a phone call from our advertiser’s listing or is redirected from one of our web sites or a third party web site in our distribution network to an advertiser web site and completes the specified action. Other revenues include our call provisioning and call tracking services, local leads platform for resellers, and campaign management services. Companies distributing advertising through mobile and internet based sources have experienced, and are likely to continue to experience consolidation. If we do not add new distribution partners or renew our existing distribution partner agreements and on terms as favorable as current arrangements, replace traffic lost from terminated distribution agreements with other sources, or if our distribution partners’ businesses do not grow or are adversely affected, our revenue and results of operations may be materially and adversely affected. We utilize phone numbers as part of our call analytics and pay-for-call services to advertisers, which enables advertisers and other users of our services to help measure the effectiveness of mobile, online, and offline advertising campaigns. If we are not able to secure or retain sufficient phone numbers needed for our services or we are limited in the number of available telecommunication carriers or vendors to provide such phone numbers to us in the event of any industry consolidation or if telecommunication carriers or vendors were to experience system disruptions, our revenue and results of operations may be materially and adversely affected. In addition, if revenue grows and the volume of transactions and traffic increases, we will need to expand our network infrastructure. Inefficiencies in our network infrastructure to scale and adapt to higher call volumes could materially and adversely affect our revenue and results of operations.
55
We anticipate that these variables will fluctuate in the future, affecting our ability to grow and our financial results. In particular, it is difficult to project phone call usage, the number of phone calls or other actions performed by users of our products and services, which will be delivered to our advertisers, and how much advertisers will spend with us and the amount they are willing to pay for our products and services. It is even more difficult to anticipate the average revenue per phone call or other performance-based actions. It is also difficult to anticipate the impact of worldwide economic conditions on advertising budgets.
In addition, we believe we will experience seasonality. Our quarterly results have fluctuated in the past and may fluctuate in the future due to seasonal fluctuations in levels of mobile and internet usage and seasonal purchasing cycles of many advertisers. Our experience has shown that during the spring and summer months, mobile and Internet usage is lower than during other times of the year and during the latter part of the fourth quarter of the calendar year we generally experience lower call volume and reduced demand for calls from our call advertising customers. The extent to which usage and call volume may decrease during these off-peak periods is difficult to predict. Prolonged or severe decreases in usage and call volume during these periods may adversely affect our growth rate and results and in turn the market price of our securities. Historically, we have seen in the first quarter of the calendar year, this trend generally reversing with increased mobile and internet usage and often new budgets at the beginning of the year for many of our customers with fiscal years ending December 31. However, there can be no assurances such seasonal trends will consistently repeat each year. The current business environment and our industry has generally both resulted in, and we may continue to see, many advertisers and reseller partners reducing advertising and marketing services budgets or adjusting such budgets throughout the year, changing marketing strategies or agency affiliations, or advertisers being acquired by parent companies with alternative media initiatives, which we expect will impact our quarterly results of operations in addition to the typical seasonality seen in our industry.
We believe that our future revenue growth will depend on, among other factors, our ability to attract new advertisers, compete effectively, maximize our sales efforts, demonstrate a positive return on investment for advertisers, successfully improve existing products and services, develop successful new products and services, and expand internationally. If we are unable to generate adequate revenue growth and to manage our expenses, we may continue to incur significant losses in the future and may not be able to achieve or maintain profitability.
Expenses
Expenses were as follows (in thousands):
|
|
|
Years ended December 31, |
|
|||||||||||||||||||||
|
|
|
2014 |
|
|
% of revenue |
|
|
2015 |
|
|
% of revenue |
|
|
2016 |
|
|
% of revenue |
|
||||||
|
Service costs |
|
$ |
111,259 |
|
|
|
64 |
% |
|
$ |
78,767 |
|
|
|
55 |
% |
|
$ |
76,970 |
|
|
|
59 |
% |
|
Sales and marketing |
|
|
11,719 |
|
|
|
7 |
% |
|
|
16,462 |
|
|
|
11 |
% |
|
|
22,307 |
|
|
|
17 |
% |
|
Product development |
|
|
29,561 |
|
|
|
17 |
% |
|
|
31,058 |
|
|
|
22 |
% |
|
|
28,446 |
|
|
|
22 |
% |
|
General and administrative |
|
|
20,918 |
|
|
|
12 |
% |
|
|
18,510 |
|
|
|
13 |
% |
|
|
21,754 |
|
|
|
17 |
% |
|
Amortization of intangible assets from acquisitions |
|
|
434 |
|
|
|
0 |
% |
|
|
— |
|
|
|
— |
|
|
|
— |
|
|
|
— |
|
|
Acquisition and disposition related costs |
|
|
(68 |
) |
|
|
0 |
% |
|
|
219 |
|
|
|
0 |
% |
|
|
662 |
|
|
|
1 |
% |
|
|
|
$ |
173,823 |
|
|
|
100 |
% |
|
$ |
145,016 |
|
|
|
101 |
% |
|
$ |
150,139 |
|
|
|
116 |
% |
We record stock-based compensation expense under the fair value method. Stock-based compensation expense has been included in the same lines as compensation paid to the same employees in the consolidated statements of operations. Stock-based compensation expense was included in the following operating expense categories as follows (in thousands):
56
|
|
|
Years ended December 31, |
|
|||||||||
|
|
|
2014 |
|
|
2015 |
|
|
2016 |
|
|||
|
Service costs |
|
$ |
1,373 |
|
|
$ |
1,189 |
|
|
$ |
693 |
|
|
Sales and marketing |
|
|
888 |
|
|
|
1,307 |
|
|
|
1,738 |
|
|
Product development |
|
|
2,595 |
|
|
|
2,410 |
|
|
|
1,569 |
|
|
General and administrative |
|
|
7,032 |
|
|
|
5,118 |
|
|
|
6,183 |
|
|
Total stock-based compensation |
|
$ |
11,888 |
|
|
$ |
10,024 |
|
|
$ |
10,183 |
|
See Note 6 (b). Stock Option Plan of the Notes to Consolidated Financial Statements, as well as our Critical Accounting Policies for additional information about stock-based compensation.
Service Costs. Service costs decreased 2% from $78.8 million in 2015 to $77.0 million in 2016. The decrease was primarily attributable to a decrease in personnel costs, stock-based compensation, communication and network costs, travel costs, fees paid to outside service providers, and other operating costs totaling $5.6 million, offset partially by an increase in distribution partner payments of $3.8 million. As a percentage of revenue, service costs were 55% and 59% for 2015 and 2016, respectively. The 2016 increase as a percentage of revenue in service costs was primarily a result of an increase in distribution partner payments and revenues from our local leads platform comprising a lower proportion of revenue compared to the 2015 period. Our local leads platform revenues have a lower service cost as a percentage of revenue relative to our overall service cost percentage.
Service costs decreased 29% from $111.3 million in 2014 to $78.8 million in 2015. The decrease was primarily attributable to a decrease in distribution partner payments, personnel costs, and stock-based compensation totaling $33.0 million, offset partially by increases in communication and network costs. As a percentage of revenue, service costs were 64% and 55% for 2014 and 2015, respectively. The 2015 decrease as a percentage of revenue in service costs was primarily a result of a decrease in distribution partner payments and, to a lesser extent, revenues from our local leads platform comprising a higher proportion of revenue compared to the 2014 period.
We expect that user acquisition costs and revenue shares to distribution partners are likely to increase prospectively given the competitive landscape for distribution partners. To the extent that payments to pay-for-call, or cost-per-action distribution partners make up a larger percentage of future operations, or the addition or renewal of existing distribution partner agreements are on terms less favorable to us, we expect that service costs will increase as a percentage of revenue. To the extent of revenue declines in these areas, we expect revenue shares to distribution partners to decrease in absolute dollars. Our other sources of revenues, such as our local leads platform have no corresponding distribution partner payments and accordingly have a lower service cost as a percentage of revenue relative to our overall service cost percentage. In addition, advertisers from whom we generate a portion of our call advertising revenues through our local leads platform generally have lower service costs as a percentage of revenue relative to our overall service cost percentage. To the extent our local leads platform makes up a smaller percentage of our future operations, we expect that service costs will increase as a percentage of revenue. We expect in the near and intermediate term for service costs as a percentage of revenue to be relatively stable and in absolute dollars for service costs to be lower relative to the most recent quarterly periods. We also expect service costs in absolute dollars to increase over the longer term in connection with any revenue increase and expansion in our communication and network infrastructure.
Sales and Marketing. Sales and marketing expenses increased 36% from $16.5 million in 2015 to $22.3 million in 2016. As a percentage of revenue, sales and marketing expenses were 11% and 17% for 2015 and 2016, respectively. The increase in dollars and percentage of revenue was primarily attributable to an increase in personnel costs as a result of an increase in our sales force, stock-based compensation, travel costs, fees paid to outside service providers, facility expenses and employee separation related costs totaling $6.3 million, offset partially by a decrease in outside marketing activities of $485,000. The increase as a percentage of revenue was also attributable to lower revenues.
57
Sales and marketing expenses increased 40% from $11.7 million in 2014 to $16.5 million in 2015. As a percentage of revenue, sales and marketing expenses were 7% and 11% for 2014 and 2015, respectively. The increase in dollars and percentage of revenue was primarily attributable to an increase in personnel costs, stock-based compensation, outside marketing activities, travel costs, and fees paid to outside service providers totaling $4.6 million. The increase as a percentage of revenue was also attributable to lower revenues.
We expect some volatility in sales and marketing expenses based on the timing of marketing initiatives but expect sales and marketing expenses in the near and intermediate term to be relatively stable to higher in absolute dollars relative to the most recent quarterly periods. We expect that sales and marketing expenses will increase in connection with any revenue increase to the extent that we also increase our marketing activities and correspondingly could increase as a percentage of revenue.
Product Development. Product development expenses decreased 8% from $31.1 million in 2015 to $28.4 million in 2016. The net decrease in dollars was primarily due to decrease in personnel costs, stock-based compensation, travel costs, fees paid to outside service providers, and depreciation totaling $2.6 million. As a percentage of revenue, product development expenses were relatively flat at 22% for 2015 and 2016.
Product development expenses increased 5% from $29.6 million in 2014 to $31.1 million in 2015. As a percentage of revenue, product development expenses were 17% and 22% for 2014 and 2015, respectively. The net increase in dollars and percentage of revenue was primarily due to an increase in personnel costs, fees paid to outside service providers, depreciation, and facility expenses of $1.6 million, offset partially by a decrease in stock-based compensation. The increase as a percentage of revenue was also attributable to lower revenues.
We expect product development expenditures to be lower in the near and intermediate term in absolute dollars relative to our most recent quarterly periods. In the longer term, to the extent our revenues increase, we expect that product development expenses will increase in absolute dollars as we increase the number of personnel and consultants to enhance our service offerings and as a result of additional stock-based compensation expense.
General and Administrative. General and administrative expenses increased 18% from $18.5 million in 2015 to $21.8 million in 2016. As a percentage of revenue, general and administrative expenses were 13% and 17% for 2015 and 2016, respectively. The increase in dollars and percentage of revenue was primarily due to an increase in personnel costs which included employee separation related costs, stock-based compensation, and fees paid to outside service providers. The increase as a percentage of revenue was also attributable to lower revenues.
General and administrative expenses decreased 12% from $20.9 million in 2014 to $18.5 million in 2015. The net decrease was primarily due to a decrease in personnel costs, stock-based compensation, fees paid to outside service providers, and bad debt expense totaling $2.6 million, offset partially by an increase in travel and other operating expenses. The 2015 percentage of revenue was relatively consistent with the 2014 percentage of revenue.
We expect our general and administrative expenses to be modestly lower in the near and intermediate term relative to our most recent quarterly periods. We expect that our general and administrative expenses will be stable to modestly higher in the longer term to the extent that we expand our operations, and incur additional costs in connection with being a public company, including expenses related to professional fees and insurance, and as a result of stock-based compensation expense. We also expect fluctuations in our general and administrative expenses to the extent the recognition timing of stock compensation is impacted by market conditions relating to our stock price.
Impairment of goodwill. In the second quarter of 2016, we recorded an impairment loss of $63.3 million resulting in no goodwill on our balance sheet as of December 31, 2016. During the second quarter of 2016, our stock price was impacted by volatility in the U.S. financial markets, among other factors, and traded below the then book value for an extended period of time. Accordingly, we tested goodwill for impairment and concluded that the carrying value exceeded the estimated fair value of our single reporting unit. The estimated fair value of our single reporting unit was based on estimates of future operating results, discounted cash flows and other market-based factors, including our stock price. The goodwill impairment loss resulted primarily from a sustained decline in our common stock share price and market capitalization as well as lower projected revenue growth rates and profitability levels compared to historical results. The lower projected operating results reflected changes in assumptions related to organic revenue growth rates, market trends, business mix, cost structure, and other expectations about the anticipated short-term and long-term operating results.
58
The testing of goodwill for impairment requires us to make significant estimates about our future performance and cash flows, as well as other assumptions. Events and circumstances considered in determining whether the carrying value of goodwill may not be recoverable include, but are not limited to: significant changes in performance relative to expected operating results; significant changes in the use of the assets; significant changes in competition and market dynamics; significant and sustained declines in our stock price and market capitalization; a significant decline in its expected future cash flows or a significant adverse change in our business climate. These estimates and circumstances are inherently uncertain and can be affected by numerous factors, including changes in economic, industry or market conditions, changes in business operations, a loss of a significant customer, changes in competition, volatility in financial markets, or changes in the share price of our common stock and market capitalization.
Income Taxes. The income tax expense from continuing operations was $54,000 in 2016 and was primarily related to state income taxes. In 2016, the effective tax rate differed from the expected tax rate of 34% due to a full valuation allowance and to a lesser extent due to state income taxes, non-deductible stock-based compensation related to incentive stock options recorded under the fair-value method, federal research and development credits, and other non-deductible amounts. We recognized approximately $541,000 of federal research and experimental credits for 2016.
At December 31, 2016, based upon both positive and negative evidence available, we determined that it is not more likely than not that our deferred tax assets of $44.5 million will be realized and accordingly, we have recorded 100% valuation allowance of $44.5 million against these deferred tax assets. This compares to a valuation allowance of $34.5 million at December 31, 2015. In assessing the realizability of deferred tax assets, we considered whether it is more likely than not that some or all of the deferred tax assets will be realized. The ultimate realization of deferred tax assets depends on the generation of future taxable income during the periods in which those temporary differences are deductible. We considered the future reversal of deferred tax liabilities, carryback potential, projected taxable income, and tax planning strategies as well as its history of taxable income or losses in the relevant jurisdictions in making this assessment. We have incurred federal taxable losses in 2014, 2015, and 2016. During 2015, we sold our Archeo operations and will no longer benefit from the contribution from these operations. Based on the level of historical taxable losses and the uncertainty of projections for future taxable income over the periods for which the deferred tax assets are deductible, we concluded that it is not more likely than not that the gross deferred tax assets will be realized.
The income tax expense from continuing operations was $27,000 in 2015 and was related to state income taxes. In 2015, the effective tax rate differed from the expected tax rate of 34% due to a full valuation allowance and to a lesser extent due to state income taxes, non-deductible stock-based compensation related to incentive stock options recorded under the fair-value method, federal research and development credits, and other non-deductible amounts. We recognized approximately $510,000 of federal research and experimental credits as a result of the retroactive extension of the federal research and experimental credit for 2015 as part of the Protecting Americans from Tax Hikes (Path) Act of 2015 signed into law in December 2015. Under Path, the research and development tax credit prospectively became permanent.
The income tax expense was $22.5 million in 2014. The effective rate differed from the expected tax rate of 34% due primarily to an increase in the valuation allowance of $22.3 million recorded in the third quarter of 2014 and to a lesser extent due to state income taxes, non-deductible stock-based compensation related to incentive stock options recorded under the fair-value method, federal research and development credits, and other non-deductible amounts. We recognized approximately $547,000 of federal research and experimental credits as a result of the retroactive extension of the federal research and experimental credit in 2014 as part of the Tax Increase Prevention Act of 2014 signed into law in December 2014. We recognized excess tax shortfalls on stock option exercises, restricted stock vesting, and dividends paid on unvested restricted stock of approximately $1.2 million which were recorded to additional paid-in capital during the year ended December 31, 2014.
Discontinued Operations, net of tax. In April 2015, we sold certain assets related to Archeo’s domain operations, including the bulk of its domain name portfolio. This disposal met the requirements of Accounting Standards Codification 205-20, Discontinued Operations, for presentation as discontinued operations. As a result, the operating results related to this disposition is shown as discontinued operations, net of tax.
59
Income from discontinued operations, net of tax was $3.4 million, $5.1 million, and $0 million in 2014, 2015 and 2016, respectively. In the April 2015 sale, we received net cash proceeds at closing of $28.1 million and the sale includes contingent earn-out payments that depend on the achievement of certain sales thresholds. As a result of the sale, we recognized a gain on sale of discontinued operations, net of tax of $22.2 million in 2015. See Note 10. Discontinued Operations, Dispositions and Other of the Notes to Consolidated Financial Statements for further discussion.
Net Income (Loss). Net income was $26.7 million in 2015 compared to net loss of $84.1 million in 2016. The decrease in net income was primarily attributable to a goodwill impairment charge in the second quarter of 2016 in the amount of $63.3 million and the sale of Archeo’s domain operations in April 2015 resulting in a $22.2 million gain on sale of discontinued operations, net of tax, in the year ended December 31, 2015 with no corresponding amounts in 2016. The decrease to a lesser extent was also a result of lower revenues and higher sales and marketing costs. Net loss was ($19.1) million in 2014 compared to net income of $26.7 million in 2015. The increase in net income was primarily a result of the $22.2 million gain on the sale of discontinued operations related to the April 2015 sale of Archeo’s domain operations.
60
Quarterly Results of Operations (Unaudited)
The following tables set forth our unaudited quarterly results of operations data for the eight most recent quarters ended December 31, 2016. The information in the tables below should be read in conjunction with our consolidated financial statements and the notes thereto included elsewhere in this report. We have prepared this information on the same basis as the consolidated financial statements and the information includes all adjustments, consisting only of normal recurring adjustments, that we consider necessary for a fair presentation of our financial position and operating results for the quarters or other periods presented. Our quarterly operating results have varied substantially in the past and may vary substantially in the future. You should not draw any conclusions about our future results from the results of operations for any particular quarter or period presented.
|
|
|
Quarter Ended |
|
|||||||||||||||||||||||||||||
|
(in thousands) |
|
Mar 31, 2015 |
|
|
June 30, 2015 |
|
|
Sept 30, 2015 |
|
|
Dec 31, 2015 |
|
|
Mar 31, 2016 |
|
|
June 30, 2016 |
|
|
Sept 30, 2016 |
|
|
Dec 31, 2016 |
|
||||||||
|
Consolidated Statements of Operations: |
|
|
|
|
|
|
|
|
|
|
|
|
|
|
|
|
|
|
|
|
|
|
|
|
|
|
|
|
|
|
|
|
|
Revenue |
|
$ |
35,916 |
|
|
$ |
35,346 |
|
|
$ |
36,852 |
|
|
$ |
34,900 |
|
|
$ |
35,985 |
|
|
$ |
34,412 |
|
|
$ |
30,749 |
|
|
$ |
28,401 |
|
|
Expenses: |
|
|
|
|
|
|
|
|
|
|
|
|
|
|
|
|
|
|
|
|
|
|
|
|
|
|
|
|
|
|
|
|
|
Service costs |
|
|
19,366 |
|
|
|
19,797 |
|
|
|
20,003 |
|
|
|
19,601 |
|
|
|
21,982 |
|
|
|
20,477 |
|
|
|
18,505 |
|
|
|
16,006 |
|
|
Sales and marketing |
|
|
3,458 |
|
|
|
4,245 |
|
|
|
4,266 |
|
|
|
4,493 |
|
|
|
5,522 |
|
|
|
5,649 |
|
|
|
5,562 |
|
|
|
5,574 |
|
|
Product development |
|
|
7,693 |
|
|
|
8,147 |
|
|
|
7,769 |
|
|
|
7,450 |
|
|
|
7,472 |
|
|
|
7,555 |
|
|
|
6,832 |
|
|
|
6,587 |
|
|
General and administrative |
|
|
5,699 |
|
|
|
4,505 |
|
|
|
4,721 |
|
|
|
3,585 |
|
|
|
4,662 |
|
|
|
5,833 |
|
|
|
5,320 |
|
|
|
5,939 |
|
|
Acquisition and disposition related costs |
|
|
— |
|
|
|
118 |
|
|
|
81 |
|
|
|
20 |
|
|
|
4 |
|
|
|
304 |
|
|
|
354 |
|
|
|
— |
|
|
Total operating expenses |
|
|
36,216 |
|
|
|
36,812 |
|
|
|
36,840 |
|
|
|
35,149 |
|
|
|
39,642 |
|
|
|
39,818 |
|
|
|
36,573 |
|
|
|
34,106 |
|
|
Impairment of goodwill |
|
|
— |
|
|
|
— |
|
|
|
— |
|
|
|
— |
|
|
|
— |
|
|
|
(63,305 |
) |
|
|
— |
|
|
|
— |
|
|
Gain on sale of Archeo assets |
|
|
— |
|
|
|
— |
|
|
|
— |
|
|
|
1,496 |
|
|
|
— |
|
|
|
— |
|
|
|
— |
|
|
|
— |
|
|
Income (loss) from operations |
|
|
(300 |
) |
|
|
(1,466 |
) |
|
|
12 |
|
|
|
1,247 |
|
|
|
(3,657 |
) |
|
|
(68,711 |
) |
|
|
(5,824 |
) |
|
|
(5,705 |
) |
|
Other income (expense): |
|
|
|
|
|
|
|
|
|
|
|
|
|
|
|
|
|
|
|
|
|
|
|
|
|
|
|
|
|
|
|
|
|
Interest and line of credit expense |
|
|
(19 |
) |
|
|
(18 |
) |
|
|
(11 |
) |
|
|
(8 |
) |
|
|
(4 |
) |
|
|
(34 |
) |
|
|
(3 |
) |
|
|
(1 |
) |
|
Other |
|
|
(6 |
) |
|
|
2 |
|
|
|
(1 |
) |
|
|
(3 |
) |
|
|
(3 |
) |
|
|
(34 |
) |
|
|
(12 |
) |
|
|
(24 |
) |
|
Total other income (expense) |
|
|
(25 |
) |
|
|
(16 |
) |
|
|
(12 |
) |
|
|
(11 |
) |
|
|
(7 |
) |
|
|
(68 |
) |
|
|
(15 |
) |
|
|
(25 |
) |
|
Income (loss) from continuing operations before provision for income taxes |
|
|
(325 |
) |
|
|
(1,482 |
) |
|
|
— |
|
|
|
1,236 |
|
|
|
(3,664 |
) |
|
|
(68,779 |
) |
|
|
(5,839 |
) |
|
|
(5,730 |
) |
|
Income tax expense (benefit) |
|
|
5 |
|
|
|
(185 |
) |
|
|
191 |
|
|
|
16 |
|
|
|
13 |
|
|
|
12 |
|
|
|
15 |
|
|
|
14 |
|
|
Net income (loss) from continuing operations |
|
|
(330 |
) |
|
|
(1,297 |
) |
|
|
(191 |
) |
|
|
1,220 |
|
|
|
(3,677 |
) |
|
|
(68,791 |
) |
|
|
(5,854 |
) |
|
|
(5,744 |
) |
|
Discontinued operations, net of tax |
|
|
4,913 |
|
|
|
22,165 |
|
|
|
200 |
|
|
|
38 |
|
|
|
— |
|
|
|
— |
|
|
|
— |
|
|
|
— |
|
|
Net income (loss) |
|
|
4,583 |
|
|
|
20,868 |
|
|
|
9 |
|
|
|
1,258 |
|
|
|
(3,677 |
) |
|
|
(68,791 |
) |
|
|
(5,854 |
) |
|
|
(5,744 |
) |
|
Dividends paid to participating securities |
|
|
(19 |
) |
|
|
(19 |
) |
|
|
— |
|
|
|
— |
|
|
|
— |
|
|
|
— |
|
|
|
— |
|
|
|
— |
|
|
Net income (loss) applicable to common stockholders |
|
$ |
4,564 |
|
|
$ |
20,849 |
|
|
$ |
9 |
|
|
$ |
1,258 |
|
|
$ |
(3,677 |
) |
|
$ |
(68,791 |
) |
|
$ |
(5,854 |
) |
|
$ |
(5,744 |
) |
Due to rounding, the sum of quarterly amounts may not equal amounts reported for year-to-date periods.
Liquidity and Capital Resources
As of December 31, 2015, and 2016, we had cash and cash equivalents of $109.2 million and $104.0 million, respectively. As of December 31, 2016, we had current and long term contractual obligations of $9.2 million, of which $2.9 million is for rent under our facility operating leases.
61
Cash used provided by (used in) operating activities primarily consists of net income (loss) adjusted for certain non-cash items such as impairment of goodwill, amortization and depreciation, stock-based compensation, allowance for doubtful accounts and advertiser credits, and changes in working capital.
Cash used in operating activities for the year ended December 31, 2016 of approximately $3.7 million consisted primarily of a net loss of $84.1 million adjusted for non-cash items of $78.4 million, which included depreciation and amortization, allowance for doubtful accounts and advertiser credits, stock-based compensation, and impairment of goodwill of $63.3 million, and approximately $2.0 million used in working capital and other activities. Cash provided by operating activities for the year ended December 31, 2015 of approximately $12.8 million consisted primarily of net income of $26.7 million adjusted for non-cash items of $14.0 million, which included amortization and depreciation, allowance for doubtful accounts and advertiser credits, and stock-based compensation, less $1.5 million of gain on sale of Archeo assets related to the sale of the remaining Archeo operations in December 2015, less $22.2 million gain on sale of discontinued operations related to the April 2015 sale of certain assets related to Archeo’s domain operations, and $4.3 million used in working capital and other activities. Cash provided by operating activities for the year ended December 31, 2014 of approximately $22.4 million consisted primarily of a net loss of $19.1 million adjusted for non-cash items of $41.9 million, including amortization and depreciation, allowance for doubtful accounts and advertiser credits, stock-based compensation, acquisition and disposition related costs, and deferred income taxes of $24.4 million that includes a $22.3 million increase in the valuation allowance, less $422,000 of gain on sale of discontinued operations related to the July 2013 sale of certain pay-per-click assets, and $72,000 provided by working capital and other activities.
With respect to a significant portion of our call-based advertising services, the amount payable to our distribution partners will be calculated at the end of a calendar month, with a payment period following the delivery of the phone calls or other actions. These services constituted the majority of revenues for the years ended December 31, 2015 and 2016. We generally receive payment from advertisers in close proximity to the timing of the corresponding payments to the distribution partners who provide calls, other delivery actions, or placement for the listings. In certain cases, payments to distribution partners are paid in advance or are fixed in advance based on a guaranteed minimum amount of usage delivered. We have no corresponding payments to distribution partners related to our local leads platform.
Nearly all of our reseller partner arrangements are billed on a monthly basis following the month of our phone call or other action delivery. This payment structure results in our advancement of monies to the distribution partners who have provided the corresponding calls, other delivery actions, or placements of the listings. For these services, reseller partner payments are generally received two to four weeks following payment to the distribution partners. We also have payment arrangements with advertising agencies whereby we receive payment after the agency’s advertiser pays the agency, which is generally between 60 and 120 days or longer, following the delivery of services. We expect that in the future periods, if the amounts from our reseller partner and agency arrangements account for a greater percentage of our operating activity, working capital requirements will increase as a result.
We have payment arrangements with reseller partners particularly related to our local leads and call advertising services, such as YP, CDK Global, hibu, Dex Media, Inc., and YPG, whereby we receive payment generally between 30 and 60 days following the delivery of services. We also have payment arrangements with Resolution Media and OMD Digital, advertising agencies related to our call marketplace and call analytics services, whereby we receive payment when the agency’s advertiser pays the agency, which is generally between 60 and 90 days following the delivery of services and in some instances may take longer.
For the year ended and as of December 31, 2016, amounts from these partners and agencies totaled 59% of revenue and $10.7 million in accounts receivable. Based on the timing of payments, we generally have this level of amounts in outstanding accounts receivable at any given time from these partners and advertising agencies. A single advertiser, State Farm, who represented the majority of the revenue and accounts receivable generated by Resolution Media and OMD Digital, accounted for 23% of total revenues for the year ended December 31, 2016 and 30% of accounts receivable as of December 31, 2016. We expect campaign spend levels related to State Farm to be lower compared to previous periods, which will result in lower total revenues and contributions.
62
In 2016, we extended our local leads platform and pay-for-call services agreements with YP through December 31, 2018. The primary local leads platform arrangement provides YP additional flexibility to migrate active accounts to itself or a third-party provider prior to the end of an advertiser contract and provides YP with certain termination rights beginning January 1, 2018 upon four months prior notice. We also have a separate distribution partner agreement with YP. There can be no assurance that our business with them in the future will continue at or near current revenue and contribution levels, that we will be able to renew and extend the contracts, and if renewed, the contracts may be on less favorable terms to us, any of which could have a material adverse effect on our future operating results. Net accounts receivable balances outstanding as of December 31, 2016 from YP totaled $2.0 million.
We have revenue concentrations with certain other large advertisers and advertising agencies and most of these customers are not subject to long term contracts with us or have contracts with near term expiration dates such as Yellow Pages Ltd, and are generally able to reduce or cease advertising spending at any time and for any reason. In some cases, we engage with advertisers through advertising agencies, who act on behalf of the advertisers. Advertising agencies, such as Resolution Media and OMD Digital, may place insertion orders with us on behalf of advertisers (including State Farm) for particular advertising campaigns for a set period of time and are not obligated to commit beyond the campaign governed by a particular insertion order and may also cancel the campaign prior to completion. Advertising agencies also have relationships with many different providers, each of whom may be running portions of the advertising campaign. A significant reduction in advertising spending or budgets by our largest customers, or the loss of one or more of these customers, if not replaced by new customers or an increase in business from existing customers, would adversely affect revenues and profitability. This could have a material adverse effect on our results of operations and financial condition. There can be no assurances that these partners or other advertisers will not experience financial difficulty, curtail operations, reduce or eliminate spend budgets, change marketing strategies or agency affiliations, be acquired by parent companies with alternative media tactics, delay payments or otherwise forfeit balances owed.
Cash used in investing activities for the year ended December 31, 2016 of $1.2 million was primarily attributable to purchases for property and equipment of approximately $986,000 and cash paid for costs incurred as a result of the sale of the remaining Archeo assets of $224,000. Cash provided by investing activities for the year ended December 31, 2015 of $21.8 million was primarily attributable to proceeds from sales of discontinued operations related to the April 2015 sale of Archeo’s domain operations, net of transaction costs of $25.2 million and proceeds from the sale of Archeo assets in December 2015, net of transaction costs, of $731,000. These amounts were partially offset by purchases of property and equipment of $4.1 million. Cash used in investing activities for the year ended December 31, 2014 of $3.2 million was primarily attributable to purchases of property and equipment of $3.3 million and purchases of intangible and noncurrent assets of primarily domain names of $217,000, that were partially offset by proceeds from the sale of discontinued operations of $304,000 related to an earn-out consideration payment from the July 2013 sale of certain pay-per-click advertising services.
We expect property and equipment purchases in the near and intermediate term to be relatively stable compared to our most recent periods. We expect any increase to our operations to have a corresponding increase in expenditures for our systems and personnel. We expect our expenditures for product development initiatives and internally developed software will be modestly lower in the near and intermediate term and increase in the longer term in absolute dollars with any acceleration in development activities and as we increase the number of personnel and consultants to enhance our service offerings. In the intermediate to long term, we also expect to increase the number of personnel supporting our sales, marketing and related growth initiatives.
63
Cash used in financing activities for the year ended December 31, 2016 of approximately $312,000 was primarily attributable to repurchases of 89,000 shares of Class B common stock for treasury and minimum tax withholding payments related to certain executive restricted stock award vests totaling $662,000, which was partially offset by proceeds primarily from employee stock option exercises and the employee stock purchase plan of $350,000. Cash used in financing activities for the year ended December 31, 2015 of approximately $5.5 million was primarily attributable to the payment of common stock dividends of $1.7 million and repurchases of 924,000 shares of Class B common stock for treasury of $3.8 million. Cash provided by financing activities for the year ended December 31, 2014 of approximately $29.9 million was primarily attributable to proceeds from a follow-on offering, net of offering costs paid, of $32.5 million and proceeds from employee stock option exercises and employee stock purchase plan of $4.3 million, which was partially offset by payment of common stock dividends, minimum tax withholding payments related to certain executive restricted stock award vests, and the repurchase of 669,000 shares of Class B common stock for treasury all totaling approximately $6.9 million. In April 2014, we completed a follow-on public offering in which we sold an aggregate of 3.4 million shares of our Class B common stock, which includes the exercise of the underwriters’ option to purchase 514,100 additional shares, at a public offering price of $10.50 per share. In addition, another 3.2 million shares were sold by the selling stockholders, which include the exercise of the underwriter’s option to purchase 343,000 additional shares. Our aggregate net proceeds of $32.5 million are after deducting underwriting discounts and commissions and offering expenses paid. We did not receive any of the proceeds from the sales of shares by the selling stockholders.
The following table summarizes our contractual obligations as of December 31, 2016, and the effect these obligations are expected to have on our liquidity and cash flows in future periods.
|
In thousands |
|
Total |
|
|
Less than 1 year |
|
|
1-3 years |
|
|
4-5 years |
|
|
thereafter |
|
|||||
|
Contractual Obligations: |
|
|
|
|
|
|
|
|
|
|
|
|
|
|
|
|
|
|
|
|
|
Operating leases |
|
$ |
2,939 |
|
|
$ |
2,362 |
|
|
$ |
577 |
|
|
$ |
— |
|
|
$ |
— |
|
|
Other contractual obligations |
|
|
6,292 |
|
|
|
4,044 |
|
|
|
2,247 |
|
|
|
1 |
|
|
|
— |
|
|
Total contractual obligations (1) |
|
$ |
9,231 |
|
|
$ |
6,406 |
|
|
$ |
2,824 |
|
|
$ |
1 |
|
|
$ |
— |
|
|
(1) |
Our tax contingencies of approximately $1.1 million are not included due to their uncertainty. |
We anticipate that we will need to invest working capital towards the development of our overall operations, to fund any losses from operations, and we expect that capital expenditures may increase in future periods, particularly if our operating activity increases. We may also make a significant number of acquisitions. As a result, we could experience a reduction of our cash balances or the incurrence of debt.
In December 2016, we terminated our Credit Agreement originally dated April 1, 2008 and as amended to date which provided for a senior secured $30 million revolving credit facility (“Credit Agreement”). We never borrowed funds under the Credit Agreement through the termination date and determined that the credit facility was no longer needed. We did not incur any early termination penalties associated with the termination of the Credit Agreement.
In November 2014, our board of directors authorized a new share repurchase program (the “2014 Repurchase Program”) which supersedes and replaces any prior repurchase programs. Under the 2014 Repurchase Program, we are authorized to repurchase up to 3 million shares of our Class B common stock in the aggregate through open market and privately negotiated transactions, at such times and in such amounts as we deem appropriate. Repurchases may also be made under a Rule 10b5-1 plan, which would permit shares to be repurchased when we might otherwise be precluded from doing so under insider trading laws. The timing and actual number of shares repurchased will depend on a variety of factors including price, corporate and regulatory requirements, capital availability, and other market conditions. The 2014 Repurchase Program does not have an expiration date and may be expanded, limited or terminated at any time without prior notice. During the years ended December 31, 2015 and 2016, approximately 924,000 and 89,000 shares of Class B common stock were repurchased.
64
In 2014 and the first half of 2015, quarterly dividends in the amount of $0.02 per share were paid in each of the quarters, totaling $3.3 million and $1.7 million, for those years, respectively. We discontinued paying dividends on our common stock after the second quarter of 2015, and we do not anticipate declaring or paying dividends in the foreseeable future.
Based on our operating plans we believe that our resources will be sufficient to fund our operations for at least twelve months. Additional equity and debt financing may be needed to support our acquisition strategy, our long-term obligations and our company’s needs. There can be no assurance that, if we needed additional funds, financing arrangements would be available in amounts or on terms acceptable to us, if at all. Failure to generate sufficient revenue or raise additional capital could have a material adverse effect on our ability to continue as a going concern and to achieve our intended business objectives.
Critical Accounting Policies
The policies below are critical to our business operations and the understanding of our results of operations. In the ordinary course of business, we make a number of estimates and assumptions relating to the reporting of our results.
Our consolidated financial statements have been prepared using accounting principles generally accepted in the United States. The preparation of these consolidated financial statements requires us to make estimates and judgments that affect the reported amounts of assets, liabilities, revenue and expenses and the related disclosures of contingent assets and liabilities. We base our estimates on historical experience and on various assumptions that we believe to be reasonable under the circumstances, the results of which form the basis for making judgments about the carrying values of assets and liabilities that are not readily apparent from other sources. Actual results may differ from these estimates under different assumptions or conditions.
Our critical accounting policies relate to the following matters and are described below:
|
|
• |
Revenue; |
|
|
• |
Goodwill; |
|
|
• |
Stock-based compensation; |
|
|
• |
Allowance for doubtful accounts and advertiser credits; and |
|
|
• |
Provision for income taxes. |
Revenue
We currently generate revenue by delivering call advertising services that enable advertisers of all sizes to reach consumers across online, mobile and offline sources. Our primary source of revenue is performance-based advertising, which includes pay-for-call advertising and cost-per-action services. For pay-for-call advertising, revenue is recognized upon delivery of qualified and reported phone calls or other action to our advertisers or advertising service providers’ listing which occurs when a mobile, online or offline user makes a phone call or clicks on any of their advertisements after it has been placed by us or by our distribution partners. Each phone call or other action on an advertisement listing represents a completed transaction. For cost-per-action services, revenue is recognized when a user makes a phone call from our advertiser’s listing or is redirected from one of our websites or a third party website in our distribution network to an advertiser website and completes the specified action.
65
We have entered into agreements with various distribution partners in order to expand our distribution network, which includes search engines, directories, product shopping engines, third party vertical and branded websites, and mobile and offline sources. We generally pay distribution partners based on a specified percentage of revenue or a fixed amount per phone call or other action on these listings. We act as the primary obligor in these transactions, and we are responsible for providing customer and administrative services to the advertiser. In accordance with FASB ASC 605, Revenue Recognition the revenue derived from advertisers who receive paid introductions through us as supplied by distribution partners is reported gross based upon the amounts received from the advertiser. We also recognize revenue for certain agency contracts with advertisers under the net revenue recognition method. Under these specific agreements, we purchase listings on behalf of advertisers from search engines and directories. We are paid account fees and also agency fees based on the total amount of the purchase made on behalf of these advertisers. Under these agreements, our advertisers are primarily responsible for choosing the publisher and determining pricing, and we, in certain instances, are only financially liable to the publisher for the amount collected from our advertisers. This creates a sequential liability for media purchases made on behalf of advertisers. In certain instances, the web publishers engage the advertisers directly and we are paid an agency fee based on the total amount of the purchase made by the advertiser. In limited arrangements, resellers pay us a fee for fulfilling an advertiser’s campaign in our distribution network and we act as the primary obligor. We recognize revenue for these fees under the gross revenue recognition method.
When an arrangement involves multiple deliverables, the entire fee from the arrangement is allocated to each respective deliverable based on its relative selling price and recognized when revenue recognition criteria for each deliverable are met. The selling price for each deliverable is established based on the sales price charged when the same deliverable is sold separately, the price at which a third party sells the same or similar and largely interchangeable deliverable on a standalone basis or the estimated selling price if the deliverable were to be sold separately.
In certain cases, we record revenue based on available and reported preliminary information from third parties. Collection on the related receivables may vary from reported information based upon third party refinement of the estimated and reported amounts owed that occurs subsequent to period ends.
Goodwill
Goodwill represents the excess of the purchase price over the fair value of identifiable assets acquired and liabilities assumed in business combinations accounted for under the purchase method.
Goodwill is tested annually for impairment and is tested for impairment more frequently if events and circumstances indicate that the asset might be impaired. The provisions of the accounting standard for goodwill allow us to first assess qualitative factors to determine whether it is necessary to perform the two-step quantitative goodwill impairment test. The testing of goodwill for impairment requires us to make significant estimates about our future performance and cash flows, as well as other assumptions. Events and circumstances considered in determining whether the carrying value of goodwill may not be recoverable include, but are not limited to: significant changes in performance relative to expected operating results; significant changes in the use of the assets; significant changes in competition and market dynamics; significant and sustained declines in our stock price and market capitalization; a significant decline in our expected future cash flows or a significant adverse change in our business climate. These estimates and circumstances are inherently uncertain and can be affected by numerous factors, including changes in economic, industry or market conditions, changes in business operations, a loss of a significant customer, changes in competition, volatility in financial markets, or changes in our share price of our common stock and market capitalization.
In the second quarter of 2016, we recorded an impairment loss of $63.3 million which resulting in no goodwill on our balance sheet as of December 31, 2016.
66
FASB ASC 718, Compensation – Stock Compensation requires the measurement and recognition of compensation for all stock-based awards made to employees, non-employees and directors including stock options, restricted stock issuances, and restricted stock units be based on estimated fair values. Under the fair value recognition provisions, we recognize stock-based compensation net of an estimated forfeiture rate, and therefore only recognize compensation cost for those shares expected to vest over the requisite service period.
We generally use the Black-Scholes option pricing model as our method of valuation for stock-based awards with time-based vesting. Our determination of the fair value of stock-based awards on the date of grant using an option pricing model is affected by our stock price as well as assumptions regarding a number of highly complex and subjective variables. These variables include, but are not limited to the expected life of the award, our expected stock price, volatility over the term of the award and actual and projected exercise behaviors. For stock-based awards with time-based vesting, we are required to estimate the expected forfeiture rate and only recognize expense for those shares expected to vest. We estimate the forfeiture rate based on historical experience of our stock-based awards that are granted, exercised and cancelled. If our actual forfeiture rate is materially different from our estimate, the stock-based compensation expense could be significantly different from what we have recorded in the current period.
We may issue equity awards of stock options and restricted stock awards that have vesting based on a combination of certain service and market conditions. For equity awards with vesting based on a combination of certain service and market conditions, we factor an estimated probability of achieving certain service and market conditions and recognize compensation cost over the requisite service period of the award. We use a binomial lattice model to determine the fair value for each tranche and a Monte Carlo simulation to determine the derived service period for each tranche.
Although the fair value of stock-based awards is determined in accordance with FASB ASC 718, Compensation – Stock Compensation the assumptions used in calculating fair value of stock-based awards, the use of the Black-Scholes option pricing model, and the use of the binomial lattice model and a Monte Carlo simulation are highly subjective, and other reasonable assumptions could provide differing results. As a result, if factors change and we use different assumptions, our stock-based compensation expense could be materially different in the future. See Note 6(b) Stock Option Plan in the Notes to Consolidated Financial Statements for additional information.
Allowance for Doubtful Accounts and Advertiser Credits
Accounts receivable balances are presented net of allowance for doubtful accounts and advertiser credits. The allowance for doubtful accounts is our best estimate of the amount of probable credit losses in our accounts receivable. We determine our allowance based on analysis of historical bad debts, advertiser concentrations, advertiser creditworthiness and current economic trends. We review the allowance for collectability on a quarterly basis. Account balances are written off against the allowance after all reasonable means of collection have been exhausted and the potential recovery is considered remote. If the financial condition of our advertisers were to deteriorate, resulting in an impairment of their ability to make payments, or if we underestimated the allowances required, additional allowances may be required which would result in increased general and administrative expenses in the period such determination was made.
We determine our allowance for advertiser credits and adjustments based upon our analysis of historical credits. Material differences may result in the amount and timing of our revenue for any period if our management made different judgments and estimates.
67
We are subject to income taxes in the U.S. Significant judgment is required in evaluating our uncertain tax positions and determining our provision for income taxes. We utilize the asset and liability method of accounting for income taxes. Under this method, deferred tax assets and liabilities are recognized for the future tax consequences attributable to differences between the financial statement carrying amounts of existing assets and liabilities and their respective tax bases and operating loss and tax credit carryforwards. Deferred tax assets and liabilities are measured using enacted tax rates expected to apply to taxable income in the years in which those temporary differences are expected to be recovered or settled. The effect on deferred tax assets and liabilities of a change in tax law is recognized in results of operations in the period that includes the enactment date. Uncertain tax positions as of December 31, 2015 and 2016 amounted to $888,000 and $1.1 million, respectively.
We determined that it is not more likely than not that our deferred tax assets will be realized and accordingly recorded 100% valuation allowance against these deferred tax assets as of December 31, 2015 and December 31, 2016. In assessing whether it is more likely than not that our deferred tax assets will be realized, factors considered included: historical taxable income, historical trends related to advertiser usage rates, projected revenues and expenses, macroeconomic conditions, issues facing the industry, existing contracts, our ability to project future results and any appreciation of its other assets. The ultimate realization of deferred tax assets depends on the generation of future taxable income during the periods in which those temporary differences are deductible. We considered the future reversal of deferred tax liabilities, carryback potential, projected taxable income, and tax planning strategies as well as its history of taxable income or losses in the relevant jurisdictions in making this assessment. Based on the level of historical taxable losses and the uncertainty of projections for future taxable income over the periods for which the deferred tax assets are deductible, we concluded that it is not more likely than not that the gross deferred tax assets will be realized.
Recent Accounting Pronouncement Not Yet Effective
In May 2014, the FASB issued Accounting Standards Update No. 2014-09, Revenue from Contracts with Customers (Topic 606) (ASU 2014-09), which amends the existing accounting standards for revenue recognition. ASU 2014-09 requires an entity to recognize the amount of revenue to which it expects to be entitled when products or services are transferred to customers. In July 2015, the FASB voted to approve a one-year delay of the effective date. ASU 2014-09 is effective for annual reporting periods beginning after December 15, 2017, including interim periods within that reporting period. Early adoption is permitted as of annual reporting periods beginning after December 15, 2016, including interim reporting periods within those annual periods. ASU 2014-09 may be applied using either (i) a full retrospective approach for all periods presented in the period of adoption, or (ii) a modified retrospective approach with the cumulative effect of initially applying the new standard recognized at the date of adoption and providing certain additional disclosures. In 2016, the FASB issued additional guidance to clarify the implementation guidance including ASU No. 2016-08, Revenue from Contracts with Customers - Principal versus Agent Considerations. This ASU clarifies the implementation guidance for principal versus agent considerations in ASU No. 2014-09 and provides indicators that assist in the assessment of control. We will adopt the new standard on January 1, 2018. We initiated an assessment of our revenue streams and a project plan for implementing these standards. Our evaluation of the impact of the new standard is ongoing and we have not yet completed our assessment of the effect that ASU No. 2014-09 and related standards will have on our consolidated financial statements and related disclosures. We currently plan to use the modified retrospective approach; however, a final decision regarding the adoption method has not been finalized at this time.
In November 2015, the FASB issued Accounting Standards Update No. 2015-17, Income Taxes (Topic 740), Balance Sheet Classification of Deferred Taxes (ASU 2015-17), an ASU amending the accounting for income taxes and requiring all deferred tax assets and liabilities to be classified as non-current on the consolidated balance sheet. The ASU is effective for reporting periods beginning after December 15, 2016, with early adoption permitted. The ASU may be adopted either prospectively or retrospectively. We do not expect adoption of ASU 2015-17 to have a material impact on our consolidated financial statements.
68
In February 2016, the FASB issued Accounting Standards Update No. 2016-02 Leases (Topic 842), an ASU requiring the recognition of lease assets and lease liabilities on the balance sheet and disclosing key information about leasing arrangements. The ASU is effective for reporting periods beginning after December 15, 2018, with early adoption permitted. The ASU must be adopted retrospectively. We are currently in the process of evaluating the impact of adoption of ASU 2016-02 on our consolidated financial statements.
In March 2016, the FASB amended the existing accounting standards for stock-based compensation, with Accounting Standards Update No. 2016-09, Compensation-Stock Compensation (Topic 718): Improvements to Employee Share-Based Payment Accounting (ASU 2016-09). The amendments impact several aspects of accounting for share-based payment transactions, including the income tax consequences, forfeitures, classification of awards as either equity or liabilities, and classification on the statement of cash flows. The ASU is effective for reporting periods beginning after December 15, 2016, with early adoption permitted. If early adoption is elected, all amendments must be adopted in the same period. The manner of application varies by the various provisions of the guidance, with certain provisions applied on a retrospective or modified retrospective approach, while others are applied prospectively. We will adopt this standard on January 1, 2017. We elected to account for forfeitures as they occur and no longer use an estimated forfeiture rate in the calculation of stock-based compensation expense. We determined this election did not result in a significant charge to retained earnings from applying an estimated forfeiture rate. Upon adoption, excess tax benefits generated when equity awards vest will be recorded as a reduction to income taxes. We have unrecognized excess tax benefits which will be recorded to retained earnings with a corresponding change to the valuation allowance as of January 1, 2017. Due to the full valuation allowance on our deferred tax assets, we do not expect any significant impact to the financial statements beyond disclosure as a result of this adoption.
In June 2016, the FASB issued Accounting Standards Update No. 2016-13, Financial Instruments — Credit Losses (Topic 326), Measurement of Credit Losses on Financial Instruments (ASU 2016-13), an ASU amending the impairment model for most financial assets and certain other instruments. The ASU is effective for reporting periods beginning after December 15, 2019, with early adoption permitted after December 15, 2018. The ASU must be adopted using a modified-retrospective approach. We do not expect adoption of ASU 2016-13 to have a material impact on our consolidated financial statements.
Our exposure to market risk is limited to foreign currency and interest income sensitivity, which is affected by changes in the general level of U.S. interest rates, particularly because the majority of our investments are in short-term, money market funds. We place our investments with high-quality financial institutions. During the years ended December 31, 2015 and 2016, the effects of changes in interest rates on the fair market value of our investments and our earnings and the effect of changes in foreign currency exchange rates on our earnings were not material. Further, we believe that the impact on the fair market value of our investments and our earnings from a hypothetical 10% change in interest rates would not be significant. We do not have any material foreign currency or other derivative financial instruments.
69
INDEX TO FINANCIAL STATEMENTS
70
REPORT OF INDEPENDENT REGISTERED PUBLIC ACCOUNTING FIRM
The Board of Directors and Stockholders
Marchex, Inc.:
We have audited the accompanying consolidated balance sheets of Marchex, Inc. and subsidiaries (the Company) as of December 31, 2015 and 2016, and the related consolidated statements of operations, stockholders’ equity, and cash flows for each of the years in the three-year period ended December 31, 2016. These consolidated financial statements are the responsibility of the Company’s management. Our responsibility is to express an opinion on these consolidated financial statements based on our audits.
We conducted our audits in accordance with the standards of the Public Company Accounting Oversight Board (United States). Those standards require that we plan and perform the audit to obtain reasonable assurance about whether the financial statements are free of material misstatement. An audit includes examining, on a test basis, evidence supporting the amounts and disclosures in the financial statements. An audit also includes assessing the accounting principles used and significant estimates made by management, as well as evaluating the overall financial statement presentation. We believe that our audits provide a reasonable basis for our opinion.
In our opinion, the consolidated financial statements referred to above present fairly, in all material respects, the financial position of Marchex, Inc. and subsidiaries as of December 31, 2015 and 2016, and the results of their operations and their cash flows for each of the years in the three-year period ended December 31, 2016, in conformity with U.S. generally accepted accounting principles.
We also have audited, in accordance with the standards of the Public Company Accounting Oversight Board (United States), Marchex, Inc.’s internal control over financial reporting as of December 31, 2016, based on criteria established in Internal Control – Integrated Framework (2013) issued by the Committee of Sponsoring Organizations of the Treadway Commission (COSO), and our report dated March 8, 2017 expressed an unqualified opinion on the effectiveness of the Company’s internal control over financial reporting.
/s/ KPMG LLP
Seattle, Washington
March 8, 2017
71
REPORT OF INDEPENDENT REGISTERED PUBLIC ACCOUNTING FIRM
The Board of Directors and Stockholders
Marchex, Inc.:
We have audited Marchex, Inc.’s (the Company) internal control over financial reporting as of December 31, 2016, based on criteria established in Internal Control – Integrated Framework (2013) issued by the Committee of Sponsoring Organizations of the Treadway Commission (COSO). Marchex, Inc.’s management is responsible for maintaining effective internal control over financial reporting and for its assessment of the effectiveness of internal control over financial reporting, included in the accompanying Management’s Report on Internal Control over Financial Reporting. Our responsibility is to express an opinion on the Company’s internal control over financial reporting based on our audit.
We conducted our audit in accordance with the standards of the Public Company Accounting Oversight Board (United States). Those standards require that we plan and perform the audit to obtain reasonable assurance about whether effective internal control over financial reporting was maintained in all material respects. Our audit included obtaining an understanding of internal control over financial reporting, assessing the risk that a material weakness exists, and testing and evaluating the design and operating effectiveness of internal control based on the assessed risk. Our audit also included performing such other procedures as we considered necessary in the circumstances. We believe that our audit provides a reasonable basis for our opinion.
A company’s internal control over financial reporting is a process designed to provide reasonable assurance regarding the reliability of financial reporting and the preparation of financial statements for external purposes in accordance with generally accepted accounting principles. A company’s internal control over financial reporting includes those policies and procedures that (1) pertain to the maintenance of records that, in reasonable detail, accurately and fairly reflect the transactions and dispositions of the assets of the company; (2) provide reasonable assurance that transactions are recorded as necessary to permit preparation of financial statements in accordance with generally accepted accounting principles, and that receipts and expenditures of the company are being made only in accordance with authorizations of management and directors of the company; and (3) provide reasonable assurance regarding prevention or timely detection of unauthorized acquisition, use, or disposition of the company’s assets that could have a material effect on the financial statements.
Because of its inherent limitations, internal control over financial reporting may not prevent or detect misstatements. Also, projections of any evaluation of effectiveness to future periods are subject to the risk that controls may become inadequate because of changes in conditions, or that the degree of compliance with the policies or procedures may deteriorate.
In our opinion, Marchex, Inc. maintained, in all material respects, effective internal control over financial reporting as of December 31, 2016, based on criteria established in Internal Control – Integrated Framework (2013) issued by the Committee of Sponsoring Organizations of the Treadway Commission (COSO).
We also have audited, in accordance with the standards of the Public Company Accounting Oversight Board (United States), the consolidated balance sheets of Marchex, Inc. and subsidiaries as of December 31, 2015 and 2016, and the related consolidated statements of operations, stockholders’ equity, and cash flows for each of the years in the three-year period ended December 31, 2016, and our report dated March 8, 2017 expressed an unqualified opinion on those consolidated financial statements.
/s/ KPMG LLP
Seattle, Washington
March 8, 2017
72
MARCHEX, INC. AND SUBSIDIARIES
(in thousands, except per share amounts)
|
|
|
As of December 31, |
|
|||||
|
|
|
2015 |
|
|
2016 |
|
||
|
Assets |
|
|
|
|
|
|
|
|
|
Current assets: |
|
|
|
|
|
|
|
|
|
Cash and cash equivalents |
|
$ |
109,155 |
|
|
$ |
103,950 |
|
|
Accounts receivable, net |
|
|
24,621 |
|
|
|
18,922 |
|
|
Prepaid expenses and other current assets |
|
|
1,784 |
|
|
|
1,531 |
|
|
Refundable taxes |
|
|
127 |
|
|
|
98 |
|
|
Total current assets |
|
|
135,687 |
|
|
|
124,501 |
|
|
Property and equipment, net |
|
|
5,778 |
|
|
|
3,557 |
|
|
Other assets, net |
|
|
222 |
|
|
|
214 |
|
|
Goodwill |
|
|
63,305 |
|
|
|
— |
|
|
Total assets |
|
$ |
204,992 |
|
|
$ |
128,272 |
|
|
Liabilities and Stockholders’ Equity |
|
|
|
|
|
|
|
|
|
Current liabilities: |
|
|
|
|
|
|
|
|
|
Accounts payable |
|
$ |
9,460 |
|
|
$ |
6,811 |
|
|
Accrued expenses and other current liabilities |
|
|
6,712 |
|
|
|
7,707 |
|
|
Deferred revenue |
|
|
692 |
|
|
|
349 |
|
|
Total current liabilities |
|
|
16,864 |
|
|
|
14,867 |
|
|
Other non-current liabilities |
|
|
662 |
|
|
|
134 |
|
|
Total liabilities |
|
|
17,526 |
|
|
|
15,001 |
|
|
Commitments and contingencies |
|
|
|
|
|
|
|
|
|
Stockholders’ equity: |
|
|
|
|
|
|
|
|
|
Common stock, $0.01 par value. Authorized 137,500 shares; |
|
|
|
|
|
|
|
|
|
Class A: 12,500 shares authorized; 8,032 and 5,233 shares issued and outstanding, respectively, at December 31, 2015; 8,032 and 5,056 shares issued and outstanding, respectively at December 31, 2016 |
|
|
55 |
|
|
|
53 |
|
|
Class B: 125,000 shares authorized; 36,833 and 36,711 shares issued and outstanding, respectively, at December 31, 2015, including 785 shares of restricted stock; and 38,004 shares issued and outstanding, at December 31, 2016, including 875 shares of restricted stock |
|
|
368 |
|
|
|
380 |
|
|
Treasury stock: 122 shares of Class B stock at December 31, 2015 |
|
|
(238 |
) |
|
|
— |
|
|
Additional paid-in capital |
|
|
350,799 |
|
|
|
360,422 |
|
|
Accumulated deficit |
|
|
(163,518 |
) |
|
|
(247,584 |
) |
|
Total stockholders’ equity |
|
|
187,466 |
|
|
|
113,271 |
|
|
Total liabilities and stockholders’ equity |
|
$ |
204,992 |
|
|
$ |
128,272 |
|
See accompanying Notes to Consolidated Financial Statements.
73
MARCHEX, INC. AND SUBSIDIARIES
Consolidated Statements of Operations
(in thousands, except per share amounts)
|
|
|
Years ended December 31, |
|
|||||||||
|
|
|
2014 |
|
|
2015 |
|
|
2016 |
|
|||
|
Revenue |
|
$ |
173,601 |
|
|
$ |
143,013 |
|
|
$ |
129,547 |
|
|
Expenses: |
|
|
|
|
|
|
|
|
|
|
|
|
|
Service costs (1) |
|
|
111,259 |
|
|
|
78,767 |
|
|
|
76,970 |
|
|
Sales and marketing |
|
|
11,719 |
|
|
|
16,462 |
|
|
|
22,307 |
|
|
Product development |
|
|
29,561 |
|
|
|
31,058 |
|
|
|
28,446 |
|
|
General and administrative |
|
|
20,918 |
|
|
|
18,510 |
|
|
|
21,754 |
|
|
Amortization of intangible assets from acquisitions (2) |
|
|
434 |
|
|
|
— |
|
|
|
— |
|
|
Acquisition and disposition related costs |
|
|
(68 |
) |
|
|
219 |
|
|
|
662 |
|
|
Total operating expenses |
|
|
173,823 |
|
|
|
145,016 |
|
|
|
150,139 |
|
|
Impairment of goodwill |
|
|
— |
|
|
|
— |
|
|
|
(63,305 |
) |
|
Gain on sale of Archeo assets |
|
|
— |
|
|
|
1,496 |
|
|
|
— |
|
|
Loss from operations |
|
|
(222 |
) |
|
|
(507 |
) |
|
|
(83,897 |
) |
|
Other income (expense): |
|
|
|
|
|
|
|
|
|
|
|
|
|
Interest income |
|
|
2 |
|
|
|
21 |
|
|
|
67 |
|
|
Interest and line of credit expense |
|
|
(76 |
) |
|
|
(76 |
) |
|
|
(109 |
) |
|
Other, net |
|
|
12 |
|
|
|
(8 |
) |
|
|
(73 |
) |
|
Total other expense |
|
|
(62 |
) |
|
|
(63 |
) |
|
|
(115 |
) |
|
Loss from continuing operations before provision for income taxes |
|
|
(284 |
) |
|
|
(570 |
) |
|
|
(84,012 |
) |
|
Income tax expense |
|
|
22,509 |
|
|
|
27 |
|
|
|
54 |
|
|
Loss from continuing operations |
|
|
(22,793 |
) |
|
|
(597 |
) |
|
|
(84,066 |
) |
|
Discontinued operations: |
|
|
|
|
|
|
|
|
|
|
|
|
|
Income from discontinued operations, net of tax |
|
|
3,425 |
|
|
|
5,123 |
|
|
|
— |
|
|
Gain on sale of discontinued operations, net of tax |
|
|
278 |
|
|
|
22,195 |
|
|
|
— |
|
|
Discontinued operations, net of tax |
|
|
3,703 |
|
|
|
27,318 |
|
|
|
— |
|
|
Net income (loss) |
|
|
(19,090 |
) |
|
|
26,721 |
|
|
|
(84,066 |
) |
|
Dividends paid to participating securities |
|
|
(127 |
) |
|
|
(37 |
) |
|
|
— |
|
|
Net income (loss) applicable to common stockholders |
|
$ |
(19,217 |
) |
|
$ |
26,684 |
|
|
$ |
(84,066 |
) |
|
Basic and diluted net income (loss) per Class A and Class B share applicable to common stockholders: |
|
|
|
|
|
|
|
|
|
|
|
|
|
Continuing operations |
|
$ |
(0.57 |
) |
|
$ |
(0.01 |
) |
|
$ |
(2.01 |
) |
|
Discontinued operations, net of tax |
|
$ |
0.09 |
|
|
$ |
0.66 |
|
|
$ |
— |
|
|
Basic and diluted net income (loss) per Class A and Class B share applicable to common stockholders |
|
$ |
(0.48 |
) |
|
$ |
0.65 |
|
|
$ |
(2.01 |
) |
|
Dividends paid per share |
|
$ |
0.08 |
|
|
$ |
0.04 |
|
|
$ |
— |
|
|
Shares used to calculate basic net income (loss) per share applicable to common stockholders: |
|
|
|
|
|
|
|
|
|
|
|
|
|
Class A |
|
|
5,853 |
|
|
|
5,233 |
|
|
|
5,190 |
|
|
Class B |
|
|
34,157 |
|
|
|
35,935 |
|
|
|
36,550 |
|
|
Shares used to calculate diluted net income (loss) per share applicable to common stockholders: |
|
|
|
|
|
|
|
|
|
|
|
|
|
Class A |
|
|
5,853 |
|
|
|
5,233 |
|
|
|
5,190 |
|
|
Class B |
|
|
40,010 |
|
|
|
41,168 |
|
|
|
41,740 |
|
(1)Excludes amortization of intangible assets from acquisitions.
(2)Components of amortization of intangible assets from acquisitions:
|
Service costs |
|
$ |
434 |
|
|
$ |
— |
|
|
$ |
— |
|
|
|
|
|
|
|
|
|
|
|
|
|
|
|
See accompanying Notes to Consolidated Financial Statements.
74
MARCHEX, INC. AND SUBSIDIARIES
Consolidated Statements of Stockholders’ Equity
(in thousands)
|
|
|
Class A |
|
|
Class B |
|
|
|
|
|
|
|
|
|
|
Additional |
|
|
|
|
|
|
Total |
|
||||||||||||
|
|
|
common stock |
|
|
common stock |
|
|
Treasury stock |
|
|
paid-in |
|
|
Accumulated |
|
|
stockholders’ |
|
||||||||||||||||||
|
|
|
Shares |
|
|
Amount |
|
|
Shares |
|
|
Amount |
|
|
Shares |
|
|
Amount |
|
|
capital |
|
|
deficit |
|
|
equity |
|
|||||||||
|
Balances at December 31, 2013 |
|
|
7,770 |
|
|
$ |
80 |
|
|
|
30,879 |
|
|
$ |
309 |
|
|
|
(159 |
) |
|
$ |
(2 |
) |
|
$ |
305,517 |
|
|
$ |
(171,149 |
) |
|
$ |
134,755 |
|
|
Issuance of common stock in offering, net of costs |
|
|
— |
|
|
|
— |
|
|
|
3,371 |
|
|
|
34 |
|
|
|
— |
|
|
|
— |
|
|
|
32,448 |
|
|
|
— |
|
|
|
32,482 |
|
|
Issuance of common stock upon exercise of options, issuance and vesting of restricted stock and under employee stock purchase plan, net |
|
|
— |
|
|
|
— |
|
|
|
1,082 |
|
|
|
11 |
|
|
|
(49 |
) |
|
|
— |
|
|
|
4,237 |
|
|
|
— |
|
|
|
4,248 |
|
|
Income tax shortfall of option exercises, restricted stock vesting and other, net |
|
|
— |
|
|
|
— |
|
|
|
— |
|
|
|
— |
|
|
|
— |
|
|
|
— |
|
|
|
(1,229 |
) |
|
|
— |
|
|
|
(1,229 |
) |
|
Tax withholding related to restricted stock awards |
|
|
— |
|
|
|
— |
|
|
|
|
|
|
|
— |
|
|
|
(175 |
) |
|
|
(1 |
) |
|
|
(1,079 |
) |
|
|
— |
|
|
|
(1,080 |
) |
|
Repurchase of Class B common stock |
|
|
— |
|
|
|
— |
|
|
|
— |
|
|
|
— |
|
|
|
(669 |
) |
|
|
(2,506 |
) |
|
|
— |
|
|
|
— |
|
|
|
(2,506 |
) |
|
Conversion of Class A common stock to Class B common stock |
|
|
(2,537 |
) |
|
|
(25 |
) |
|
|
2,537 |
|
|
|
25 |
|
|
|
— |
|
|
|
— |
|
|
|
— |
|
|
|
— |
|
|
|
— |
|
|
Stock compensation from options and restricted stock, net of estimated forfeitures |
|
|
— |
|
|
|
— |
|
|
|
— |
|
|
|
— |
|
|
|
— |
|
|
|
— |
|
|
|
11,903 |
|
|
|
— |
|
|
|
11,903 |
|
|
Retirement of treasury stock |
|
|
— |
|
|
|
— |
|
|
|
(598 |
) |
|
|
(6 |
) |
|
|
598 |
|
|
|
6 |
|
|
|
— |
|
|
|
— |
|
|
|
— |
|
|
Net loss |
|
|
— |
|
|
|
— |
|
|
|
— |
|
|
|
— |
|
|
|
— |
|
|
|
— |
|
|
|
— |
|
|
|
(19,090 |
) |
|
|
(19,090 |
) |
|
Common stock cash dividends |
|
|
— |
|
|
|
— |
|
|
|
— |
|
|
|
— |
|
|
|
— |
|
|
|
— |
|
|
|
(3,330 |
) |
|
|
— |
|
|
|
(3,330 |
) |
|
Balances at December 31, 2014 |
|
|
5,233 |
|
|
$ |
55 |
|
|
|
37,271 |
|
|
$ |
373 |
|
|
|
(454 |
) |
|
$ |
(2,503 |
) |
|
$ |
348,467 |
|
|
$ |
(190,239 |
) |
|
$ |
156,153 |
|
|
Issuance of common stock upon exercise of options, issuance and vesting of restricted stock and under employee stock purchase plan, net |
|
|
— |
|
|
|
— |
|
|
|
937 |
|
|
|
9 |
|
|
|
(49 |
) |
|
|
— |
|
|
|
330 |
|
|
|
— |
|
|
|
339 |
|
|
Tax withholding related to restricted stock awards |
|
|
— |
|
|
|
— |
|
|
|
— |
|
|
|
— |
|
|
|
(70 |
) |
|
|
(1 |
) |
|
|
(283 |
) |
|
|
— |
|
|
|
(284 |
) |
|
Repurchase of Class B common stock |
|
|
— |
|
|
|
— |
|
|
|
— |
|
|
|
— |
|
|
|
(924 |
) |
|
|
(3,803 |
) |
|
|
— |
|
|
|
— |
|
|
|
(3,803 |
) |
|
Stock compensation from options and restricted stock, net of estimated forfeitures |
|
|
— |
|
|
|
— |
|
|
|
— |
|
|
|
— |
|
|
|
— |
|
|
|
— |
|
|
|
10,025 |
|
|
|
— |
|
|
|
10,025 |
|
|
Retirement of treasury stock |
|
|
— |
|
|
|
— |
|
|
|
(1,375 |
) |
|
|
(14 |
) |
|
|
1,375 |
|
|
|
6,069 |
|
|
|
(6,055 |
) |
|
|
— |
|
|
|
— |
|
|
Net income |
|
|
— |
|
|
|
— |
|
|
|
— |
|
|
|
— |
|
|
|
— |
|
|
|
— |
|
|
|
— |
|
|
|
26,721 |
|
|
|
26,721 |
|
|
Common stock cash dividends |
|
|
— |
|
|
|
— |
|
|
|
— |
|
|
|
— |
|
|
|
— |
|
|
|
— |
|
|
|
(1,685 |
) |
|
|
— |
|
|
|
(1,685 |
) |
|
Balances at December 31, 2015 |
|
|
5,233 |
|
|
$ |
55 |
|
|
|
36,833 |
|
|
$ |
368 |
|
|
|
(122 |
) |
|
$ |
(238 |
) |
|
$ |
350,799 |
|
|
$ |
(163,518 |
) |
|
$ |
187,466 |
|
|
Issuance of common stock upon exercise of options, issuance and vesting of restricted stock and under employee stock purchase plan, net |
|
|
— |
|
|
|
— |
|
|
|
1,714 |
|
|
|
17 |
|
|
|
(412 |
) |
|
|
(4 |
) |
|
|
337 |
|
|
|
— |
|
|
|
350 |
|
|
Tax withholding related to restricted stock awards |
|
|
— |
|
|
|
— |
|
|
|
— |
|
|
|
— |
|
|
|
(97 |
) |
|
|
(1 |
) |
|
|
(296 |
) |
|
|
— |
|
|
|
(297 |
) |
|
Repurchase of Class B common stock |
|
|
— |
|
|
|
— |
|
|
|
— |
|
|
|
— |
|
|
|
(89 |
) |
|
|
(365 |
) |
|
|
— |
|
|
|
— |
|
|
|
(365 |
) |
|
Conversion of Class A common stock to Class B common stock |
|
|
(177 |
) |
|
|
(2 |
) |
|
|
177 |
|
|
|
2 |
|
|
|
— |
|
|
|
— |
|
|
|
— |
|
|
|
— |
|
|
|
— |
|
|
Stock compensation from options and restricted stock, net of estimated forfeitures |
|
|
— |
|
|
|
— |
|
|
|
— |
|
|
|
— |
|
|
|
— |
|
|
|
— |
|
|
|
10,183 |
|
|
|
— |
|
|
|
10,183 |
|
|
Retirement of treasury stock |
|
|
— |
|
|
|
— |
|
|
|
(720 |
) |
|
|
(7 |
) |
|
|
720 |
|
|
|
608 |
|
|
|
(601 |
) |
|
|
— |
|
|
|
— |
|
|
Net loss |
|
|
— |
|
|
|
— |
|
|
|
— |
|
|
|
— |
|
|
|
— |
|
|
|
— |
|
|
|
— |
|
|
|
(84,066 |
) |
|
|
(84,066 |
) |
|
Balances at December 31, 2016 |
|
|
5,056 |
|
|
$ |
53 |
|
|
|
38,004 |
|
|
$ |
380 |
|
|
|
— |
|
|
|
— |
|
|
$ |
360,422 |
|
|
$ |
(247,584 |
) |
|
$ |
113,271 |
|
See accompanying Notes to Consolidated Financial Statements.
75
MARCHEX, INC. AND SUBSIDIARIES
Consolidated Statements of Cash Flows
(in thousands)
|
|
|
Years ended December 31, |
|
|||||||||
|
|
|
2014 |
|
|
2015 |
|
|
2016 |
|
|||
|
Cash flows from operating activities: |
|
|
|
|
|
|
|
|
|
|
|
|
|
Net income (loss) |
|
$ |
(19,090 |
) |
|
$ |
26,721 |
|
|
$ |
(84,066 |
) |
|
Adjustments to reconcile net income (loss) to net cash provided by (used in) operating activities: |
|
|
|
|
|
|
|
|
|
|
|
|
|
Amortization and depreciation |
|
|
4,105 |
|
|
|
3,661 |
|
|
|
3,194 |
|
|
Impairment of goodwill |
|
|
— |
|
|
|
— |
|
|
|
63,305 |
|
|
Acquisition and disposition related costs |
|
|
(68 |
) |
|
|
— |
|
|
|
— |
|
|
Loss on disposals of fixed assets and intangible assets, net |
|
|
— |
|
|
|
— |
|
|
|
5 |
|
|
Gain on sale of discontinued operations |
|
|
(422 |
) |
|
|
(22,195 |
) |
|
|
— |
|
|
Gain on sale of Archeo assets |
|
|
— |
|
|
|
(1,496 |
) |
|
|
— |
|
|
Allowance for doubtful accounts and advertiser credits |
|
|
1,528 |
|
|
|
321 |
|
|
|
1,682 |
|
|
Stock-based compensation |
|
|
11,903 |
|
|
|
10,025 |
|
|
|
10,183 |
|
|
Deferred income taxes |
|
|
24,390 |
|
|
|
— |
|
|
|
— |
|
|
Change in certain assets and liabilities: |
|
|
|
|
|
|
|
|
|
|
|
|
|
Accounts receivable, net |
|
|
2,536 |
|
|
|
999 |
|
|
|
4,017 |
|
|
Refundable taxes, net |
|
|
(34 |
) |
|
|
4 |
|
|
|
29 |
|
|
Prepaid expenses, other current assets, and other assets |
|
|
(104 |
) |
|
|
695 |
|
|
|
245 |
|
|
Accounts payable |
|
|
(2,199 |
) |
|
|
(4,085 |
) |
|
|
(2,611 |
) |
|
Accrued expenses and other current liabilities |
|
|
(480 |
) |
|
|
(1,008 |
) |
|
|
1,219 |
|
|
Deferred revenue |
|
|
729 |
|
|
|
(433 |
) |
|
|
(343 |
) |
|
Other non-current liabilities |
|
|
(375 |
) |
|
|
(456 |
) |
|
|
(528 |
) |
|
Net cash provided by (used in) operating activities |
|
|
22,419 |
|
|
|
12,753 |
|
|
|
(3,669 |
) |
|
Cash flows from investing activities: |
|
|
|
|
|
|
|
|
|
|
|
|
|
Purchases of property and equipment |
|
|
(3,265 |
) |
|
|
(4,107 |
) |
|
|
(986 |
) |
|
Purchases of intangibles and changes in other non-current assets |
|
|
(217 |
) |
|
|
(51 |
) |
|
|
(14 |
) |
|
Proceeds from sale of discontinued operations, net |
|
|
304 |
|
|
|
25,249 |
|
|
|
— |
|
|
Proceeds from (cash paid for) sale of Archeo assets, net |
|
|
— |
|
|
|
731 |
|
|
|
(224 |
) |
|
Net cash provided by (used in) investing activities |
|
|
(3,178 |
) |
|
|
21,822 |
|
|
|
(1,224 |
) |
|
Cash flows from financing activities: |
|
|
|
|
|
|
|
|
|
|
|
|
|
Proceeds from offering, net of costs |
|
|
32,527 |
|
|
|
— |
|
|
|
— |
|
|
Tax withholding related to restricted stock awards |
|
|
(1,080 |
) |
|
|
(284 |
) |
|
|
(297 |
) |
|
Repurchase of Class B common stock for treasury stock |
|
|
(2,486 |
) |
|
|
(3,822 |
) |
|
|
(365 |
) |
|
Common stock dividends payments |
|
|
(3,330 |
) |
|
|
(1,685 |
) |
|
|
— |
|
|
Proceeds from exercises of stock options, issuance and vesting of restricted stock and employee stock purchase plan, net |
|
|
4,248 |
|
|
|
339 |
|
|
|
350 |
|
|
Net cash provided by (used in) financing activities |
|
|
29,879 |
|
|
|
(5,452 |
) |
|
|
(312 |
) |
|
Net increase (decrease) in cash and cash equivalents |
|
|
49,120 |
|
|
|
29,123 |
|
|
|
(5,205 |
) |
|
Cash and cash equivalents at beginning of period |
|
|
30,912 |
|
|
|
80,032 |
|
|
|
109,155 |
|
|
Cash and cash equivalents at end of period |
|
$ |
80,032 |
|
|
$ |
109,155 |
|
|
$ |
103,950 |
|
|
Supplemental disclosure of cash flow information: |
|
|
|
|
|
|
|
|
|
|
|
|
|
Cash paid during the period for income taxes, net |
|
|
70 |
|
|
|
28 |
|
|
|
24 |
|
|
Cash paid during the period for interest, net |
|
|
74 |
|
|
|
55 |
|
|
|
37 |
|
|
Supplemental disclosure of non-cash investing and financing activities: |
|
|
|
|
|
|
|
|
|
|
|
|
|
Property and equipment acquired in accounts payable and accrued expenses |
|
|
157 |
|
|
|
195 |
|
|
|
— |
|
See accompanying Notes to Consolidated Financial Statements.
76
MARCHEX, INC. AND SUBSIDIARIES
Notes to Consolidated Financial Statements
(1) Description of Business and Summary of Significant Accounting Policies and Practices
(a) Description of Business and Basis of Presentation
Marchex, Inc. (the “Company”) was incorporated in the state of Delaware on January 17, 2003. The Company is a mobile advertising analytics company that helps connect online behavior to real-world, offline actions. The Company provides products and services for businesses of all sizes that depend on consumer phone calls to drive sales. The Company’s analytics technology can facilitate call quality, analyze calls and measure the outcomes of calls. The Company also delivers performance-based, pay-for-call advertising across numerous mobile and online publishers to connect consumers with businesses over the phone.
The consolidated financial statements include the accounts of the Company and its wholly-owned subsidiaries. All inter-company transactions and balances have been eliminated in consolidation.
In April 2015, the Company sold certain assets related to Archeo’s domain operations, including the bulk of its domain name portfolio. The operating results related to this April 2015 disposition are shown as discontinued operations in the consolidated statements of operations. In December 2015, the Company sold the remaining Archeo operations which did not meet the criteria for discontinued operations, and as a result the operating results are reflected in continuing operations in 2015. See Note 10. Discontinued Operations, Dispositions, and Other of the Notes to Consolidated Financial Statements for further discussion. Unless otherwise indicated, information presented in the Notes to Consolidated Financial Statements relates only to the Company’s continuing operations.
(b) Cash and Cash Equivalents
The Company considers all highly liquid investments with an original maturity of three months or less at the date of purchase to be cash equivalents. Cash equivalents consist primarily of money market funds.
(c) Fair Value of Financial Instruments
The Company had the following financial instruments as of December 31, 2015 and 2016: cash and cash equivalents, accounts receivable, refundable taxes, accounts payable and accrued liabilities. The carrying value of these financial instruments approximates their fair value based on the liquidity of these financial instruments and their short-term nature.
(d) Accounts Receivable
Accounts receivable are recorded at the invoiced amount and do not bear interest. Accounts receivable balances are presented net of allowance for doubtful accounts and allowance for advertiser credits.
Allowance for Doubtful Accounts
The allowance for doubtful accounts is the Company’s best estimate of the amount of probable credit losses in existing accounts receivable. The Company determines the allowance based on analysis of historical bad debts, advertiser concentrations, advertiser credit-worthiness and current economic trends. Past due balances over 90 days and specific other balances are reviewed individually for collectability. The Company reviews the allowance for collectability quarterly. Account balances are written off against the allowance after all means of collection have been exhausted and the potential for recovery is considered remote.
77
The allowance for doubtful accounts activity for the periods indicated is as follows (in thousands):
|
|
|
Balance at beginning of period |
|
|
Charged to costs and expenses |
|
|
Write-offs, net of recoveries |
|
|
Balance at end of period |
|
||||
|
December 31, 2014 |
|
|
621 |
|
|
|
256 |
|
|
|
294 |
|
|
|
583 |
|
|
December 31, 2015 |
|
|
583 |
|
|
|
61 |
|
|
|
160 |
|
|
|
484 |
|
|
December 31, 2016 |
|
|
484 |
|
|
|
90 |
|
|
|
75 |
|
|
|
499 |
|
Allowance for Advertiser Credits
The allowance for advertiser credits is the Company’s best estimate of the amount of expected future reductions in advertisers’ payment obligations related to delivered services. The Company determines the allowance for advertiser credits and adjustments based on analysis of historical credits.
The allowance for advertiser credits activity for the periods indicated is as follows (in thousands):
|
|
|
Balance at beginning of period |
|
|
Additions charged against revenue |
|
|
Credits processed |
|
|
Balance at end of period |
|
||||
|
December 31, 2014 |
|
|
709 |
|
|
|
1,257 |
|
|
|
948 |
|
|
|
1,018 |
|
|
December 31, 2015 |
|
|
1,018 |
|
|
|
263 |
|
|
|
756 |
|
|
|
525 |
|
|
December 31, 2016 |
|
|
525 |
|
|
|
1,592 |
|
|
|
1,179 |
|
|
|
938 |
|
(e) Property and Equipment
Property and equipment are stated at cost. Depreciation on computers and other related equipment, purchased and internally developed software, and furniture and fixtures is calculated on the straight-line method over the estimated useful lives of the assets, generally averaging three years. Leasehold improvements are amortized straight-line over the shorter of the lease term or estimated useful lives of the assets ranging from two to eight years.
(f) Goodwill
Goodwill represents the excess of the purchase price over the fair value of identifiable assets acquired and liabilities assumed in business combinations accounted for under the purchase method.
Goodwill acquired in a purchase business combination is not amortized, but instead tested for impairment at least annually, and is tested for impairment more frequently if events and circumstances indicate that the asset might be impaired. As of December 31, 2016 the Company has no goodwill on its balance sheet.
(g) Impairment or Disposal of Long-Lived Assets
The Company reviews its long-lived assets for impairment in accordance with FASB ASC 360, Property, Plant, and Equipment whenever events or changes in circumstances indicate that the carrying amount of an asset may not be recoverable. Recoverability of assets held and used is measured by a comparison of the carrying amount of an asset to estimated undiscounted future cash flows expected to be generated by the asset. If such assets are considered to be impaired, the impairment to be recognized is measured by the amount by which the carrying amount of the assets exceeds fair value. Assets to be disposed of would be separately presented on the balance sheet and reported at the lower of their carrying amount or fair value less costs to sell, and no longer depreciated.
78
The Company generates revenue through call advertising services, which includes call analytics and call marketplace services, and its local leads platform. Historically, the Company has also generated revenue through pay-per-click advertising services.
The Company’s performance-based advertising services, which include call advertising, cost-per-action services, and historically pay-per-click services, amounted to greater than 80% of revenues in all periods presented. In addition, the Company generates revenue through its Local Leads platform, which enables partner resellers to sell call advertising and/or search marketing products, and campaign management services. These secondary sources accounted for less than 20% of revenues in all periods presented.
The Company recognizes revenue upon the completion of its performance obligation, provided that: (1) evidence of an arrangement exists; (2) the arrangement fee is fixed and determinable; and (3) collection is reasonably assured. The Company has no barter transactions.
The Company’s call analytics technology platform provides data and insights that can measure the performance of mobile, online and offline advertising for advertisers and small business resellers. The Company generates revenue from the Company’s call analytics technology platform when advertisers pay the Company a fee for each call or call related data element they receive from calls including call-based ads the Company distributes through its sources of call distribution or for each phone number tracked based on a pre-negotiated rate.
The Company’s call marketplace offers advertisers and adverting service providers’ ad placements across the Company’s distribution network. Advertisers or advertising service providers are charged on a pay-per-call or cost-per-action basis. The Company generates revenue upon delivery of qualified and reported phone calls to advertisers or advertising service providers’ listings. These advertisers and advertising service providers pay the Company a designated transaction fee for each qualified phone call, which occurs when a user makes a phone call, clicks, or completes a specified action on any of their advertisement listings after it has been placed by the Company or by the Company’s distribution partners. Each qualified phone call or specified action on an advertisement listing represents a completed transaction. The Company also generates revenue from cost-per-action services, which occurs when a user makes a phone call from the Company’s advertiser’s listing or is redirected from one of the Company’s web sites or a third party web site in the Company’s distribution network to an advertiser web site and completes the specified action. The Company’s distribution network is primarily comprised of third party mobile and online search engines and applications, mobile carriers, directories, destination sites, shopping engines, Internet domains or web sites, other targeted Web-based content, and offline sources. The Company enters into agreements with these third party distribution partners to provide distribution for pay-for-call advertisement listings, which contain call tracking numbers and/or URL strings. The Company generally pays distribution partners based on a percentage of revenue or a fixed amount per phone call on these listings. The Company acts as the primary obligor with the advertiser for revenue call transactions, and is responsible for the fulfillment of services.
The Company’s local leads platform allows reseller partners to sell call advertising, search marketing, and other lead generation products through their existing sales channels to small business advertisers. The Company generates revenue from reseller partners utilizing the Company’s local leads platform and is paid account fees and also agency fees for the Company’s products in the form of a percentage of the cost of every call or click delivered to advertisers. The reseller partners engage the advertisers and are the primary obligor, and the Company, in certain instances, is only financially liable to the publishers in the Company’s capacity as a collection agency for the amount collected from the advertisers. The Company recognizes revenue for these fees under the net revenue recognition method. In limited arrangements resellers pay the Company a fee for fulfilling an advertiser’s campaign in its distribution network and the Company acts as the primary obligor. The Company recognizes revenue for these fees under the gross revenue recognition method.
The revenue derived from advertisers is generally reported gross based upon the amounts received from the advertiser. The Company also recognizes revenue for certain agency contracts with advertisers under the net revenue recognition method. Under these specific agreements, the Company purchases listings on behalf of advertisers from search engines and directories. The Company is paid account fees and also agency fees based on the total amount of the purchase made on behalf of these advertisers. Under these agreements, the advertisers are primarily responsible for choosing the publisher and determining pricing, and the Company, in certain instances, is only financially liable to the publisher for the amount collected from its advertisers. This creates a sequential liability for media purchases made on behalf of advertisers. In certain instances, the web publishers engage the advertisers directly and the
79
Company is paid an agency fee based on the total amount of the purchase made by the advertiser. In limited arrangements, resellers pay the Company a fee for fulfilling an advertiser’s campaign in its distribution network and the Company acts as the primary obligor. The Company recognizes revenue for these fees under the gross revenue recognition method.
For arrangements that include multiple deliverables, the entire fee from the arrangement is allocated to each respective deliverable based on its relative selling price and recognized when revenue recognition criteria for each deliverable are met. The selling price for each deliverable is established based on the sales price charged when the same deliverable is sold separately, the price at which a third party sells the same or similar and largely interchangeable deliverable on a standalone basis or the estimated selling price if the deliverable were to be sold separately.
In certain cases, the Company records revenue based on available and reported preliminary information from third parties. Collection on the related receivables may vary from reported information based upon third party refinement of the estimated and reported amounts owed that occurs subsequent to the end of a reporting period.
(i) Service Costs
The largest component of the Company’s service costs consist of user acquisition costs that relate primarily to payments made to distribution partners for access to their mobile, online, offline, or other user traffic. The Company enters into agreements of varying durations with distribution partners that integrate the Company’s services into their web sites, indexes or other sources of user traffic. The primary economic structure of the distribution partner agreements is a variable payment based on a specified percentage of revenue. These variable payments are often subject to minimum payment amounts per phone call or other action. Other payment structures that to a lesser degree exist include: 1) variable payments based on a specified metric, such as number of paid calls or other actions, 2) fixed payments, based on a guaranteed minimum amount of usage delivered, and 3) a combination arrangement with both fixed and variable amounts that may be paid in advance.
The Company expenses user acquisition costs based on whether the agreement provides for variable or fixed payments. Agreements with variable payments based on a percentage of revenue, number of paid phone calls or other metrics are expensed as incurred based on the volume of the underlying activity or revenue multiplied by the agreed-upon price or rate. Agreements with fixed payments and with minimum guaranteed amounts of usage are expensed as the greater of the pro-rata amount over the term of arrangement or the actual usage delivered to date based on the contractual revenue share.
Service costs also include network operations and customer service costs that consist primarily of costs associated with providing performance-based advertising and marketing services, network costs and fees paid to outside service providers that provide the Company’s paid listings and customer services. Customer service and other costs associated with serving the Company’s call marketing services include depreciation and colocation charges of network equipment, bandwidth and software license fees, salaries of related personnel, stock-based compensation and telecommunication costs, including the use of telephone numbers for providing call-based advertising services. Other service costs include credit card processing fees and domain name and related costs, including the renewal of the domain name registrations.
(j) Advertising Expenses
Advertising costs are expensed as incurred and include mobile and online advertising and related outside marketing activities, including sponsorships and trade shows. Such costs are included in sales and marketing. Advertising costs were approximately $742,000, $2.4 million and $2.0 million for the years ended December 31, 2014, 2015 and 2016, respectively.
(k) Product Development and Other Intangible Assets
Product development costs consist primarily of expenses incurred by the Company in the research and development, creation, and enhancement of the Company’s products and services. Research and development costs are expensed as incurred and include compensation and related expenses, costs of computer hardware and software,
80
and costs incurred in developing features and functionality of the services. For the periods presented, substantially all of the product development expenses are research and development. Product development costs are expensed as incurred or capitalized into property and equipment in accordance with FASB ASC 350, Intangibles – Goodwill and Other. FASB ASC 350 requires that cost incurred in the preliminary project and post-implementation stages of an internal use software project be expensed as incurred and that certain costs incurred in the application development stage of a project be capitalized.
(l) Income Taxes
The Company utilizes the asset and liability method of accounting for income taxes. Under this method, deferred tax assets and liabilities are recognized for the future tax consequences attributable to differences between the financial statement carrying amounts of existing assets and liabilities and their respective tax bases and operating loss and tax credit carryforwards. Deferred tax assets and liabilities are measured using enacted tax rates expected to apply to taxable income in the years in which those temporary differences are expected to be recovered or settled. The effect on deferred tax assets and liabilities of a change in tax law is recognized in results of operations in the period that includes the enactment date.
(m) Stock-Based Compensation
The Company measures stock-based compensation cost at the grant date based on the fair value of the award and recognizes it as expense, net of estimated forfeitures, over the vesting or service period, as applicable, of the stock award using the straight-line method.
(n) Use of Estimates
The preparation of consolidated financial statements in conformity with accounting principles generally accepted in the United States of America requires management to make estimates and assumptions that affect the amounts of assets and liabilities and disclosures of contingent assets and liabilities at the date of the financial statements and the reported amounts of revenue and expenses during the reporting period. The Company has used estimates related to several financial statement amounts, including revenues, allowance for doubtful accounts, allowance for advertiser credits, useful lives for property and equipment and intangible assets, the fair value of the Company’s common stock and stock option awards, the impairment of goodwill and the valuation allowance for deferred tax assets. Actual results could differ from those estimates.
(o) Concentrations
The Company maintains substantially all of its cash and cash equivalents with one financial institution and are all considered at Level 1 fair value with observable inputs that reflect quoted prices for identical assets or liabilities in active markets. At various points during 2015 and 2016, the Company held cash equivalents in a commercial paper sweep account with the same financial institution. These Level 2 assets were fully liquidated prior to December 31, 2015 and 2016.
A significant majority of the Company’s revenue earned from advertisers is generated through arrangements with distribution partners. The Company may not be successful in renewing any of these agreements, or, if they are renewed, they may not be on terms as favorable as current arrangements. The Company may not be successful in entering into agreements with new distribution partners or advertisers on commercially acceptable terms. In addition, several of these distribution partners or advertisers may be considered potential competitors.
There was one distribution partner which was paid less than 17% of consolidated revenue for the year ended December 31, 2014, and there were no distribution partners paid more than 10% of consolidated revenue for the years ended December 31, 2015 and 2016.
81
The advertisers representing more than 10% of consolidated revenue are as follows (in percentages):
|
|
|
Years ended December 31, |
|
|||||||||
|
|
|
2014 |
|
|
2015 |
|
|
2016 |
|
|||
|
Advertiser A |
|
|
25 |
% |
|
|
29 |
% |
|
|
23 |
% |
|
Advertiser B |
|
|
28 |
% |
|
* |
|
|
* |
|
||
|
Advertiser C |
|
* |
|
|
|
19 |
% |
|
|
23 |
% |
|
Advertiser A is also a distribution partner.
The outstanding receivable balance for each advertiser representing more than 10% of consolidated accounts receivable is as follows (in percentages):
|
|
|
At December 31, |
|
|||||
|
|
|
2015 |
|
|
2016 |
|
||
|
Advertiser A |
|
|
14 |
% |
|
|
11 |
% |
|
Advertiser C |
|
|
28 |
% |
|
|
30 |
% |
|
Advertiser D |
|
|
19 |
% |
|
|
15 |
% |
|
* |
Less than 10%. |
In certain cases, the Company may engage directly with one or more advertising agencies who act on an advertiser’s behalf. In addition, an advertising agency may represent more than one advertiser that utilizes the Company’s products and services. There was no advertising agency which represented more than 10% of consolidated revenue for the year ended December 31, 2014, and one advertising agency represented 18% and 20% of consolidated revenue for the years ended December 31, 2015 and 2016, respectively. There was one advertising agency, which represented 13%, 22%, and 26% of consolidated accounts receivable as of December 31, 2014, 2015 and 2016, respectively.
(p) Net Income (Loss) Per Share
The Company computes net income (loss) per share of Class A and Class B common stock using the two class method. Under the provisions of the two class method, basic net income (loss) per share is computed by dividing net income (loss) applicable to common stockholders by the weighted average number of common shares outstanding during the year. Diluted net income (loss) per share is computed by dividing net income (loss) applicable to common stockholders by the weighted average number of common and dilutive common equivalent shares outstanding during the period. The computation of the diluted net income (loss) per share of Class B common stock assumes the conversion of Class A common stock to Class B common stock, while the diluted net income (loss) per share of Class A common stock does not assume the conversion of those shares.
In accordance with the two class method, the undistributed earnings (losses) for each year are allocated based on the contractual participation rights of the Class A and Class B common shares and the restricted shares as if the earnings for the year had been distributed. Considering the terms of the Company’s charter which provides that, if and when dividends are declared on its common stock in accordance with Delaware General Corporation Law, equivalent dividends shall be paid with respect to the shares of Class A common stock and Class B common stock and that both classes of common stock have identical dividend rights and would share equally in the Company’s net assets in the event of liquidation, the Company has allocated undistributed earnings (losses) on a proportionate basis. Additionally, the Company has paid cash dividends equally to both classes of common stock and the unvested restricted shares from November 2006 until the cash dividends were discontinued after May 2015.
Instruments granted in unvested share-based payment awards that contain nonforfeitable rights to dividends or dividend equivalents, whether paid or unpaid, are participating securities prior to vesting. As such, the Company’s restricted stock awards are considered participating securities for purposes of calculating earnings per share. Under the two class method, dividends paid on unvested restricted stock are allocated to these participating securities and therefore impact the calculation of amounts allocated to common stock.
82
The following table calculates net income (loss) from continuing operations to net income (loss) applicable to common stockholders used to compute basic net income (loss) per share for the periods ended (in thousands, except per share amounts):
|
|
|
Twelve months ended December 31, |
|
|||||||||||||||||||||
|
|
|
2014 |
|
|
2015 |
|
|
2016 |
|
|||||||||||||||
|
|
|
Class A |
|
|
Class B |
|
|
Class A |
|
|
Class B |
|
|
Class A |
|
|
Class B |
|
||||||
|
Basic net income (loss) per share: |
|
|
|
|
|
|
|
|
|
|
|
|
|
|
|
|
|
|
|
|
|
|
|
|
|
Numerator: |
|
|
|
|
|
|
|
|
|
|
|
|
|
|
|
|
|
|
|
|
|
|
|
|
|
Net loss from continuing operations |
|
$ |
(3,352 |
) |
|
$ |
(19,441 |
) |
|
$ |
(81 |
) |
|
$ |
(516 |
) |
|
$ |
(10,452 |
) |
|
$ |
(73,614 |
) |
|
Dividends paid to participating securities |
|
|
— |
|
|
|
(127 |
) |
|
|
— |
|
|
|
(37 |
) |
|
|
— |
|
|
|
— |
|
|
Net loss from continuing operations applicable to common stockholders |
|
$ |
(3,352 |
) |
|
$ |
(19,568 |
) |
|
$ |
(81 |
) |
|
$ |
(553 |
) |
|
$ |
(10,452 |
) |
|
$ |
(73,614 |
) |
|
Discontinued operations, net of tax |
|
|
540 |
|
|
|
3,163 |
|
|
|
3,472 |
|
|
|
23,846 |
|
|
|
— |
|
|
|
— |
|
|
Net income (loss) applicable to common stockholders |
|
$ |
(2,812 |
) |
|
$ |
(16,405 |
) |
|
$ |
3,391 |
|
|
$ |
23,293 |
|
|
$ |
(10,452 |
) |
|
$ |
(73,614 |
) |
|
Denominator: |
|
|
|
|
|
|
|
|
|
|
|
|
|
|
|
|
|
|
|
|
|
|
|
|
|
Weighted average number of shares outstanding used to calculate basic net income (loss) per share |
|
|
5,853 |
|
|
|
34,157 |
|
|
|
5,233 |
|
|
|
35,935 |
|
|
|
5,190 |
|
|
|
36,550 |
|
|
Basic net income (loss) per share: |
|
|
|
|
|
|
|
|
|
|
|
|
|
|
|
|
|
|
|
|
|
|
|
|
|
Net loss from continuing operations applicable to common stockholders |
|
$ |
(0.57 |
) |
|
$ |
(0.57 |
) |
|
$ |
(0.01 |
) |
|
$ |
(0.01 |
) |
|
$ |
(2.01 |
) |
|
$ |
(2.01 |
) |
|
Discontinued operations, net of tax |
|
|
0.09 |
|
|
|
0.09 |
|
|
|
0.66 |
|
|
|
0.66 |
|
|
|
— |
|
|
|
— |
|
|
Basic net income (loss) per share applicable to common stockholders |
|
$ |
(0.48 |
) |
|
$ |
(0.48 |
) |
|
$ |
0.65 |
|
|
$ |
0.65 |
|
|
$ |
(2.01 |
) |
|
$ |
(2.01 |
) |
83
The following table calculates net income (loss) from continuing operations to net income (loss) applicable to common stockholders used to compute diluted net income (loss) per share for the periods ended (in thousands, except per share amounts):
|
|
|
Twelve months ended December 31, |
|
|||||||||||||||||||||
|
|
|
2014 |
|
|
2015 |
|
|
2016 |
|
|||||||||||||||
|
|
|
Class A |
|
|
Class B |
|
|
Class A |
|
|
Class B |
|
|
Class A |
|
|
Class B |
|
||||||
|
Diluted net income (loss) per share: |
|
|
|
|
|
|
|
|
|
|
|
|
|
|
|
|
|
|
|
|
|
|
|
|
|
Numerator: |
|
|
|
|
|
|
|
|
|
|
|
|
|
|
|
|
|
|
|
|
|
|
|
|
|
Net loss from continuing operations |
|
$ |
(3,352 |
) |
|
$ |
(19,441 |
) |
|
$ |
(81 |
) |
|
$ |
(516 |
) |
|
$ |
(10,452 |
) |
|
$ |
(73,614 |
) |
|
Dividends paid to participating securities |
|
|
— |
|
|
|
(127 |
) |
|
|
— |
|
|
|
(37 |
) |
|
|
— |
|
|
|
— |
|
|
Reallocation of net loss for Class A shares as a result of conversion of Class A to Class B shares |
|
|
— |
|
|
|
(3,352 |
) |
|
|
— |
|
|
|
(81 |
) |
|
|
— |
|
|
|
(10,452 |
) |
|
Net loss from continuing operations applicable to common stockholders |
|
$ |
(3,352 |
) |
|
$ |
(22,920 |
) |
|
$ |
(81 |
) |
|
$ |
(634 |
) |
|
$ |
(10,452 |
) |
|
$ |
(84,066 |
) |
|
Discontinued operations, net of tax |
|
|
540 |
|
|
|
3,163 |
|
|
|
3,472 |
|
|
|
23,846 |
|
|
|
— |
|
|
|
— |
|
|
Reallocation of discontinued operations for Class A shares as a result of conversion of Class A to Class B share |
|
|
— |
|
|
|
540 |
|
|
|
— |
|
|
|
3,472 |
|
|
|
— |
|
|
|
— |
|
|
Diluted discontinued operations, net of tax |
|
$ |
540 |
|
|
$ |
3,703 |
|
|
$ |
3,472 |
|
|
$ |
27,318 |
|
|
$ |
— |
|
|
$ |
— |
|
|
Net income (loss) applicable to common stockholders |
|
$ |
(2,812 |
) |
|
$ |
(19,217 |
) |
|
$ |
3,391 |
|
|
$ |
26,684 |
|
|
$ |
(10,452 |
) |
|
$ |
(84,066 |
) |
|
Weighted average number of shares outstanding used to calculate basic net income (loss) per share |
|
|
5,853 |
|
|
|
34,157 |
|
|
|
5,233 |
|
|
|
35,935 |
|
|
|
5,190 |
|
|
|
36,550 |
|
|
Conversion of Class A to Class B common shares outstanding |
|
|
— |
|
|
|
5,853 |
|
|
|
— |
|
|
|
5,233 |
|
|
|
— |
|
|
|
5,190 |
|
|
Weighted average number of shares outstanding used to calculate diluted net income (loss) per share |
|
|
5,853 |
|
|
|
40,010 |
|
|
|
5,233 |
|
|
|
41,168 |
|
|
|
5,190 |
|
|
|
41,740 |
|
|
Diluted net income (loss) per share: |
|
|
|
|
|
|
|
|
|
|
|
|
|
|
|
|
|
|
|
|
|
|
|
|
|
Net loss from continuing operations applicable to common stockholders |
|
$ |
(0.57 |
) |
|
$ |
(0.57 |
) |
|
$ |
(0.01 |
) |
|
$ |
(0.01 |
) |
|
$ |
(2.01 |
) |
|
$ |
(2.01 |
) |
|
Discontinued operations, net of tax |
|
|
0.09 |
|
|
|
0.09 |
|
|
|
0.66 |
|
|
|
0.66 |
|
|
|
— |
|
|
|
— |
|
|
Diluted net income (loss) per share applicable to common stockholders |
|
$ |
(0.48 |
) |
|
$ |
(0.48 |
) |
|
$ |
0.65 |
|
|
$ |
0.65 |
|
|
$ |
(2.01 |
) |
|
$ |
(2.01 |
) |
The computation of diluted net income (loss) per share excludes the following because their effect would be anti-dilutive (in thousands):
|
|
• |
For the years ended December 31, 2014, 2015 and 2016, outstanding options to acquire 7,797, 8,937, and 7,678 shares, respectively, of Class B common stock. |
|
|
• |
For the years ended December 31, 2014, 2015, and 2016, 1,007, 785, and 875 shares of unvested Class B restricted common shares, respectively. |
|
|
• |
For the years ended December 31, 2014, 2015 and 2016, 1,134, 1,437, and 1,882 restricted stock units, respectively. |
84
FASB ASC 460, Guarantees provides accounting guidance surrounding liability recognition and disclosure requirements related to guarantees. In the ordinary course of business, the Company is not subject to potential obligations under guarantees that fall within the scope of FASB ASC 460 except for standard indemnification provisions that are contained within many of the Company’s advertiser and distribution partner agreements, and give rise only to the disclosure requirements prescribed by FASB ASC 460.
In certain agreements, the Company has agreed to indemnification provisions of varying scope and terms with advertisers, vendors and other parties with respect to certain matters, including, but not limited to, losses arising out of the Company’s breach of agreements or representations and warranties made by the Company, services to be provided by the Company and intellectual property infringement claims made by third parties. As a result of these provisions, the Company may from time to time provide certain levels of financial support to contract parties to seek to minimize the impact of any associated litigation in which they may be involved. To date, there have been no known events or circumstances that have resulted in any material costs related to these indemnification provisions and no liabilities therefore have been recorded in the accompanying consolidated financial statements. However, the maximum potential amount of the future payments the Company could be required to make under these indemnification provisions could be material.
(r) Recent Accounting Pronouncement Not Yet Effective
In May 2014, the FASB issued Accounting Standards Update No. 2014-09, Revenue from Contracts with Customers (Topic 606) (ASU 2014-09), which amends the existing accounting standards for revenue recognition. ASU 2014-09 requires an entity to recognize the amount of revenue to which it expects to be entitled when products or services are transferred to customers. In July 2015, the FASB voted to approve a one-year delay of the effective date. ASU 2014-09 is effective for annual reporting periods beginning after December 15, 2017, including interim periods within that reporting period. Early adoption is permitted as of annual reporting periods beginning after December 15, 2016, including interim reporting periods within those annual periods. In 2016, the FASB issued additional guidance to clarify the implementation guidance including ASU No. 2016-08, Revenue from Contracts with Customers - Principal versus Agent Considerations. This ASU clarifies the implementation guidance for principal versus agent considerations in ASU 2014-09 and provides indicators that assist in the assessment of control. ASU 2014-09 allows adoption using either (i) a full retrospective approach for all periods presented in the period of adoption, or (ii) a modified retrospective approach with the cumulative effect of initially applying the new standard recognized at the date of adoption and providing certain additional disclosures. The Company will adopt the new standard on January 1, 2018. The Company initiated an assessment of its revenue streams and a project plan for implementing these standards. The Company’s evaluation of the impact of the new standard is ongoing and it has not yet completed its assessment of the effect that ASU 2014-09 and related standards will have on its consolidated financial statements and related disclosures. The Company currently plans to use the modified retrospective approach; however, a final decision regarding the adoption method has not been finalized at this time.
In November 2015, the FASB issued Accounting Standards Update No. 2015-17, Income Taxes (Topic 740), Balance Sheet Classification of Deferred Taxes (ASU 2015-17), an ASU amending the accounting for income taxes and requiring all deferred tax assets and liabilities to be classified as non-current on the consolidated balance sheet. The ASU is effective for reporting periods beginning after December 15, 2016, with early adoption permitted. The ASU may be adopted either prospectively or retrospectively. The Company does not expect adoption of ASU 2015-17 to have a material impact on its consolidated financial statements.
In February 2016, the FASB issued Accounting Standards Update No. 2016-02 Leases (Topic 842), an ASU requiring the recognition of lease assets and lease liabilities on the balance sheet and disclosing key information about leasing arrangements. The ASU is effective for reporting periods beginning after December 15, 2018, with early adoption permitted. The ASU must be adopted retrospectively. The Company is currently in the process of evaluating the impact of adoption of ASU 2016-02 on its consolidated financial statements.
85
In March 2016, the FASB amended the existing accounting standards for stock-based compensation, with Accounting Standards Update No. 2016-09, Compensation-Stock Compensation (Topic 718): Improvements to Employee Share-Based Payment Accounting (ASU 2016-09). The amendments impact several aspects of accounting for share-based payment transactions, including the income tax consequences, forfeitures, classification of awards as either equity or liabilities, and classification on the statement of cash flows. The ASU is effective for reporting periods beginning after December 15, 2016, with early adoption permitted. If early adoption is elected, all amendments must be adopted in the same period. The manner of application varies by the various provisions of the guidance, with certain provisions applied on a retrospective or modified retrospective approach, while others are applied prospectively. The Company will adopt this standard on January 1, 2017. Upon adoption, the Company will elect to account for forfeitures as they occur and no longer use an estimated forfeiture rate in the calculation of stock-based compensation expense. The Company determined this election will not result in a significant charge to retained earnings from applying an estimated forfeiture rate. Upon adoption, excess tax benefits generated by stock-based awards will be recorded as a reduction to income taxes. The Company has unrecognized excess tax benefits which will be recorded to retained earnings with a corresponding change to the valuation allowance as of January 1, 2017. Due to the full valuation allowance on the Company’s deferred tax assets, the Company does not expect any significant impact to the financial statements beyond disclosure as a result of this adoption.
In June 2016, the FASB issued Accounting Standards Update No. 2016-13, Financial Instruments — Credit Losses (Topic 326), Measurement of Credit Losses on Financial Instruments (ASU 2016-13), an ASU amending the impairment model for most financial assets and certain other instruments. The ASU is effective for reporting periods beginning after December 15, 2019, with early adoption permitted after December 15, 2018. The ASU must be adopted using a modified-retrospective approach. The Company does not expect adoption of ASU 2016-13 to have a material impact on its consolidated financial statements.
(2) Property and Equipment
Property and equipment consisted of the following (in thousands):
|
|
|
Years ended December 31, |
|
|||||
|
|
|
2015 (1) |
|
|
2016 (1) |
|
||
|
Computer and other related equipment |
|
$ |
21,551 |
|
|
$ |
18,467 |
|
|
Purchased and internally developed software |
|
|
7,893 |
|
|
|
6,811 |
|
|
Furniture and fixtures |
|
|
1,778 |
|
|
|
1,493 |
|
|
Leasehold improvements |
|
|
2,123 |
|
|
|
2,371 |
|
|
|
|
$ |
33,345 |
|
|
$ |
29,142 |
|
|
Less: accumulated depreciation and amortization |
|
|
(27,567 |
) |
|
|
(25,585 |
) |
|
Property and equipment, net |
|
$ |
5,778 |
|
|
$ |
3,557 |
|
|
(1) |
Includes the original cost and accumulated depreciation of fully-depreciated fixed assets which were $21.8 million and $19.5 million at December 31, 2015 and 2016, respectively. |
Depreciation and amortization expense incurred by the Company was approximately $3.4 million, $3.6 million, and $3.2 million for the years ended December 31, 2014, 2015 and 2016, respectively.
(3) Credit Agreement
In December 2016, the Company terminated its Credit Agreement originally entered into in April 2008 and amended to date which provided for a senior secured $30 million revolving credit facility (“Credit Agreement”). The Company never borrowed funds under the Credit Agreement and determined that the credit facility was no longer needed. The Company did not incur any early termination penalties associated with the termination of the Credit Agreement.
86
(4) Commitments and Contingencies
(a) Commitments
The Company has commitments for future payments related to office facilities leases and other contractual obligations. The Company leases its office facilities under operating lease agreements and recognizes rent expense on a straight-line basis over the lease term with any lease incentive amortized as a reduction of rent expense over the lease term. Other contractual obligations primarily relate to minimum contractual payments due to outside service providers.
Future minimum payments are approximately as follows (in thousands):
|
|
|
Facilities operating leases |
|
|
Other contractual obligations |
|
|
Total |
|
|||
|
2017 |
|
$ |
2,362 |
|
|
$ |
4,044 |
|
|
$ |
6,406 |
|
|
2018 |
|
|
577 |
|
|
|
1,632 |
|
|
|
2,209 |
|
|
2019 |
|
|
— |
|
|
|
615 |
|
|
|
615 |
|
|
2020 |
|
|
— |
|
|
|
1 |
|
|
|
1 |
|
|
2021 and after |
|
|
— |
|
|
|
— |
|
|
|
— |
|
|
Total minimum payments |
|
$ |
2,939 |
|
|
$ |
6,292 |
|
|
$ |
9,231 |
|
Rent expense incurred by the Company was approximately $1.9 million for the years ended December 31, 2014, 2015, and $2.0 million for the year ended December 31, 2016.
(b) Contingencies
On November 17, 2015, Steven Porter, a purported shareholder of the Company, filed a securities class action against the Company and certain officers of the Company, alleging violations of the federal securities laws (the “Complaint”). Mr. Porter sought to represent all people who purchased or otherwise acquired the Company’s Class B common stock during the period from March 19, 2014 to September 18, 2014, and sought unspecified damages. The Complaint alleged that the Defendants made false and/or misleading statements and/or failed to disclose material adverse facts about the Company’s business, operations, and prospects. On April 1, 2016, Mr. Porter was appointed “Lead Plaintiff” in the action. On April 22, 2016, the case was dismissed without prejudice after the Lead Plaintiff filed a notice of voluntary dismissal of the case.
In addition, the Company from time to time is a party to disputes and legal and administrative proceedings arising from the ordinary course of business. In some agreements to which the Company is a party to, the Company has agreed to indemnification provisions of varying scope and terms with advertisers, vendors and other parties with respect to certain matters, including, but not limited to, losses arising out of the Company’s breach of agreements or representations and warranties made by the Company, services to be provided by the Company and intellectual property infringement claims made by third parties. As a result of these provisions, the Company may from time to time provide certain levels of financial support to its contract parties to seek to minimize the impact of any associated litigation in which they may be involved. To date, there have been no known events or circumstances that have resulted in any material costs related to these indemnification provisions and no liabilities therefore have been recorded in the accompanying consolidated financial statements. However, the maximum potential amount of the future payments the Company could be required to make under these indemnification provisions could be material.
While any litigation contains an element of uncertainty, the Company is not aware of any legal proceedings or claims which are pending that the Company believes, based on current knowledge, will have, individually or taken together, a material adverse effect on the Company’s financial condition, results of operations or liquidity.
87
The components of loss from continuing operations before provision for income taxes consist of the following (in thousands):
|
|
|
Years ended December 31, |
|
|||||||||
|
|
|
2014 |
|
|
2015 |
|
|
2016 |
|
|||
|
United States |
|
$ |
(285 |
) |
|
$ |
(573 |
) |
|
$ |
(83,920 |
) |
|
Foreign |
|
|
1 |
|
|
|
3 |
|
|
|
(92 |
) |
|
Loss before provision for income taxes |
|
$ |
(284 |
) |
|
$ |
(570 |
) |
|
$ |
(84,012 |
) |
The provision for income taxes from continuing operations for the Company consists of the following (in thousands):
|
|
|
Years ended December 31, |
|
|||||||||
|
|
|
2014 |
|
|
2015 |
|
|
2016 |
|
|||
|
Current provision |
|
|
|
|
|
|
|
|
|
|
|
|
|
Federal |
|
$ |
2 |
|
|
$ |
— |
|
|
$ |
— |
|
|
State |
|
|
34 |
|
|
|
27 |
|
|
|
54 |
|
|
Deferred provision (benefit) |
|
|
|
|
|
|
|
|
|
|
|
|
|
Federal |
|
|
2,018 |
|
|
|
1,187 |
|
|
|
(9,830 |
) |
|
State |
|
|
— |
|
|
|
— |
|
|
|
— |
|
|
Tax benefit of equity adjustment for stock option exercises and restricted stock vesting |
|
|
(1,231 |
) |
|
|
— |
|
|
|
— |
|
|
Valuation allowance |
|
|
21,686 |
|
|
|
(1,187 |
) |
|
|
9,830 |
|
|
Total income tax expense |
|
$ |
22,509 |
|
|
$ |
27 |
|
|
$ |
54 |
|
Income tax expense from continuing operations differed from the amounts computed by applying the U.S. federal income tax rates of 34% to loss before provision for income taxes as a result of the following (in thousands):
|
|
|
Years ended December 31, |
|
|||||||||
|
|
|
2014 |
|
|
2015 |
|
|
2016 |
|
|||
|
Income tax benefit at U.S. statutory rate |
|
$ |
(97 |
) |
|
$ |
(194 |
) |
|
$ |
(28,564 |
) |
|
State taxes, net of valuation allowance |
|
|
22 |
|
|
|
17 |
|
|
|
35 |
|
|
Non-deductible stock compensation |
|
|
598 |
|
|
|
802 |
|
|
|
489 |
|
|
Non-deductible goodwill |
|
|
— |
|
|
|
— |
|
|
|
16,917 |
|
|
Valuation allowance |
|
|
21,686 |
|
|
|
(1,187 |
) |
|
|
9,830 |
|
|
Research tax credits |
|
|
(547 |
) |
|
|
(510 |
) |
|
|
(541 |
) |
|
Other non-deductible expenses |
|
|
847 |
|
|
|
1,099 |
|
|
|
1,888 |
|
|
Total income tax expense |
|
$ |
22,509 |
|
|
$ |
27 |
|
|
$ |
54 |
|
88
The tax effects of temporary differences that give rise to significant portions of the deferred tax assets and deferred tax liabilities are presented below (in thousands):
|
|
|
As of December 31, |
|
|||||
|
|
|
2015 |
|
|
2016 |
|
||
|
Deferred tax assets: |
|
|
|
|
|
|
|
|
|
Accrued liabilities not currently deductible |
|
$ |
1,124 |
|
|
$ |
1,323 |
|
|
Intangible assets-excess of financial statement over tax amortization |
|
|
2,643 |
|
|
|
2,045 |
|
|
Goodwill recognized on financial statements in excess of tax amortization |
|
|
6,689 |
|
|
|
8,683 |
|
|
Stock-based compensation |
|
|
4,645 |
|
|
|
4,181 |
|
|
Federal net operating losses and AMT credit carryforwards |
|
|
9,634 |
|
|
|
17,619 |
|
|
State and city net operating loss carryforwards |
|
|
6,098 |
|
|
|
6,330 |
|
|
Research & experimental tax credit carryforwards |
|
|
3,136 |
|
|
|
3,676 |
|
|
Other |
|
|
492 |
|
|
|
665 |
|
|
Gross deferred tax assets |
|
|
34,461 |
|
|
|
44,522 |
|
|
Valuation allowance |
|
|
(34,461 |
) |
|
|
(44,522 |
) |
|
Net deferred tax assets |
|
$ |
— |
|
|
$ |
— |
|
As of December 31, 2016, the Company’s federal NOL carryforwards were approximately $63.5 million for income tax purposes, which will begin to expire in 2026. As of December 31, 2016, the Company’s state, city, and other foreign jurisdiction NOL carryforwards were approximately $6.4 million, which begin to expire in 2025.
In addition, at December 31, 2015 and 2016, the Company had certain federal NOL carryforwards of approximately $1.7 million, which begin to expire in 2019. The Tax Reform Act of 1986 limits the use of NOL and tax credit carryforwards in certain situations where changes occur in the stock ownership of a company. The Company believes that such a change has occurred related to these specific NOL carryforwards, and that the utilization of the approximately $1.7 million in carryforwards is limited such that substantially all of these NOL carryforwards will never be utilized. Accordingly, the Company has not included these federal NOL carryforwards in its deferred tax assets.
As of December 31, 2016, the Company has research and development credit carryforwards of $4.7 million available for income tax purposes, which will begin to expire 2029. In December 2015, the Protecting Americans from Tax Hikes (Path) Act of 2015 was signed into law and retroactively extended the research and development tax credit to January 1, 2015 through December 31, 2015 and prospectively made the credit permanent.
The Company has recorded a deferred tax asset for stock-based compensation recorded on unexercised non-qualified stock options and certain restricted shares and restricted share units. The ultimate realization of this asset is dependent upon the fair value of the Company’s stock when the options are exercised and when restricted shares or restricted share units vest, and generation of sufficient taxable income to realize the benefit of the related tax deduction.
At December 31, 2014, 2015 and 2016, the Company recorded a valuation allowance of $44.8 million, $34.5 million, and $44.5 million, respectively, against its federal, state, city and foreign net deferred tax assets, as it believes it is more likely than not that these benefits will not be realized. The net change in the total valuation allowance for each of the years ended December 31, 2015 and 2016 was ($10.3) million and $10.0 million, respectively.
89
The Company regularly reviews deferred tax assets to assess whether it is more likely than not that the deferred tax assets will be realized and, if necessary, establishes a valuation allowance for portions of such assets to reduce the carrying value. In assessing whether it is more likely than not that the Company’s deferred tax assets will be realized, factors considered included: historical taxable income, historical trends related to advertiser usage rates, projected revenues and expenses, macroeconomic conditions, issues facing the industry, existing contracts, the Company’s ability to project future results and any appreciation of its other assets. The Company incurred taxable losses in 2014, 2015, and 2016. Based on the level of historical taxable losses and the uncertainty of projections for future taxable income over the periods for which the deferred tax assets are deductible, the Company concluded that it is not more likely than not that the gross deferred tax assets will be realized.
From time to time, various state, federal and other jurisdictional tax authorities undertake audits of the Company and its filings. In evaluating the exposure associated with various tax filing positions, the Company on occasion accrues charges for uncertain positions. Resolution of uncertain tax positions will impact the Company’s effective tax rate when settled. The Company does not have any significant interest or penalty accruals. The provision for income taxes includes the impact of contingency provisions and changes to contingencies that are considered appropriate. The following table summarizes activity related to tax contingencies from January 1, 2014 to December 31, 2016 which are recorded as an offset to deferred tax assets (in thousands):
|
Gross tax contingencies—January 1, 2014 |
|
$ |
534 |
|
|
Gross increases to tax positions associated with prior periods |
|
$ |
— |
|
|
Gross increases to current period tax positions |
|
$ |
183 |
|
|
Gross decreases to tax positions associated with prior periods |
|
$ |
— |
|
|
Settlements |
|
$ |
— |
|
|
Lapse of statute of limitations |
|
$ |
— |
|
|
Gross tax contingencies—December 31, 2014 |
|
$ |
717 |
|
|
Gross increases to tax positions associated with prior periods |
|
$ |
— |
|
|
Gross increases to current period tax positions |
|
$ |
171 |
|
|
Gross decreases to tax positions associated with prior periods |
|
$ |
— |
|
|
Settlements |
|
$ |
— |
|
|
Lapse of statute of limitations |
|
$ |
— |
|
|
Gross tax contingencies—December 31, 2015 |
|
$ |
888 |
|
|
Gross increases to tax positions associated with prior periods |
|
$ |
— |
|
|
Gross increases to current period tax positions |
|
$ |
182 |
|
|
Gross decreases to tax positions associated with prior periods |
|
$ |
— |
|
|
Settlements |
|
$ |
— |
|
|
Lapse of statute of limitations |
|
$ |
— |
|
|
Gross tax contingencies—December 31, 2016 |
|
$ |
1,070 |
|
The Company files U.S. federal, certain U.S. states, and certain foreign tax returns. Generally, U.S. federal, U.S. state, and foreign tax returns filed for years after 2012 are within the statute of limitations and are under examination or may be subject to examination.
(6) Stockholders’ Equity
(a) Common Stock and Authorized Capital
The authorized capital stock of the Company consists of 1,000,000 shares of undesignated preferred stock and 125,000,000 shares of Class B common stock. The Company’s board of directors has the authority to issue up to 1,000,000 shares of preferred stock, $0.01 par value in one or more series and has the authority to designate rights, privileges and restrictions of each such series, including dividend rights, dividend rates, conversion rights, voting rights, terms of redemption, redemption prices, liquidation preferences and the number of shares constituting any series.
90
The Company has two classes of authorized common stock: Class A common stock and Class B common stock. Except with respect to voting rights, the Class A and Class B shares have identical rights. Each share of Class A common stock is entitled to twenty-five votes per share, and each share of Class B common stock is entitled to one vote per share. Each share of Class A common stock is convertible at the holder’s option into one share of Class B common stock.
In accordance with the stockholders’ agreement signed by the founding Class A common stockholders, the following provisions survived the Company’s initial public offering: Class A stockholders other than Russell C. Horowitz may only sell, assign or transfer their Class A stock to existing Class A stockholders or to the Company and in the event of transfers of Class A stock not expressly permitted by the stockholders’ agreement, such shares of Class A stock shall be converted into shares of Class B common stock.
In April 2014, the Company completed a follow-on public offering in which the Company sold an aggregate of 3.4 million shares of the Company’s Class B common stock, which includes the exercise of the underwriters’ option to purchase 514,100 additional shares, at a public offering price of $10.50 per share. In addition, another 3.2 million shares were sold by the selling stockholders, which include the exercise of the underwriter’s option to purchase 343,000 additional shares. The Company received aggregate net proceeds of $32.5 million, after deducting underwriting discounts and commissions and estimated offering expenses. The Company did not receive any of the proceeds from the sales of shares by the selling stockholders.
In November 2014, the Company’s board of directors authorized a new share repurchase program (the “2014 Repurchase Program”), which supersedes and replaces any prior repurchase programs. Under the 2014 Repurchase Program, the Company is authorized to repurchase up to 3 million shares of the Company’s Class B common stock in the aggregate through open market and privately negotiated transactions, at such times and in such amounts as the Company deems appropriate. Repurchases may also be made under a Rule 10b5-1 plan, which would permit shares to be repurchased when the Company might otherwise be precluded from doing so under insider trading laws. The timing and actual number of shares repurchased will depend on a variety of factors including price, corporate and regulatory requirements, capital availability, and other market conditions. The 2014 Repurchase Program does not have an expiration date and may be expanded, limited or terminated at any time without prior notice. During the years ended December 31, 2014, 2015 and 2016, the Company repurchased 669,000, 924,000 and 89,000 shares of Class B common stock for $2.5 million, $3.8 million and $365,000, respectively.
During the years ended December 31, 2014, 2015 and 2016, the Company’s board of directors authorized the retirement of 598,000, 1,375,000, and 720,000 shares, respectively, of the Company’s Class B common stock, all of which have been repurchased by the Company. Shares repurchased but not yet retired by the Company are classified as treasury stock on the consolidated balance sheet before retirement. Retirement of treasury stock results in reductions to common stock and additional paid-in capital.
In 2014 and the first half of 2015, the Company’s board of directors declared quarterly dividends in the amount of $0.02 per share on the Company’s Class A and Class B common stock in each of the quarters, totaling $3.3 million and $1.7 million, for those years, respectively. The Company discontinued paying dividends on its common stock after the second quarter of 2015, and does not anticipate declaring or paying dividends in the foreseeable future.
91
The Company’s stock incentive plan (the “2012 Plan”), which was established in 2012, allows for grants of stock options, restricted stock units and restricted stock awards to eligible participants and such options may be designated as incentive or non-qualified stock options at the discretion of the 2012 Plan’s Administrative Committee. Prior to the 2012 Plan, the Company granted stock-based awards under its 2003 Amended and Restated Stock Incentive Plan (the “2003 Plan”). No further awards were made under the 2003 Plan after December 31, 2012. The 2012 Plan authorizes up to 3,500,000 shares of Class B common stock that may be issued with respect to awards granted under the 2012 Plan, and provides that the total number of shares of Class B common stock for which options designated as incentive stock options may be granted shall not exceed 3,500,000 shares. Annual increases to each of these share limits are to be added on the first day of each fiscal year beginning on January 1, 2013 equal to 5% of the outstanding common stock (including for this purpose any shares of common stock issuable upon conversion of any outstanding capital stock of the Company) or in the case of incentive stock options, the lesser of 2,000,000 shares of Class B common stock or such number as determined by the Company’s board of directors. As a result of this provision, the authorized number of shares available under the 2012 Plan was increased by 2,097,153 and 2,152,989 on January 1, 2016 and 2017, respectively, bringing the aggregate authorized number of shares available under the 2012 plan to 13,654,534. The Company may issue new shares or reissue treasury shares for stock option exercises and restricted stock grants. Generally, stock options have 10-year terms and vest 25% each year either annually or quarterly, over a 4-year period and restricted stock awards and units vest 25% each year annually over a 4-year period.
The Company did not grant any options with exercise prices less than the then current market value during 2014, 2015, and 2016.
The Company measures stock-based compensation cost at the grant date based on the fair value of the award and recognizes it as expense, net of estimated forfeitures, over the vesting or service period, as applicable, of the stock award using the straight-line method. Stock-based compensation has been included in the same lines as compensation paid to the same employees in the consolidated statements of operations.
Stock-based compensation expense was included in the following operating expense categories (in thousands):
|
|
|
Twelve months ended December 31, |
|
|||||||||
|
|
|
2014 |
|
|
2015 |
|
|
2016 |
|
|||
|
Service costs |
|
$ |
1,373 |
|
|
$ |
1,189 |
|
|
$ |
693 |
|
|
Sales and marketing |
|
|
888 |
|
|
|
1,307 |
|
|
|
1,738 |
|
|
Product development |
|
|
2,595 |
|
|
|
2,410 |
|
|
|
1,569 |
|
|
General and administrative |
|
|
7,032 |
|
|
|
5,118 |
|
|
|
6,183 |
|
|
Total stock-based compensation |
|
$ |
11,888 |
|
|
$ |
10,024 |
|
|
$ |
10,183 |
|
For the years ended December 31, 2014, 2015, and 2016, the income tax benefit related to stock-based compensation included in net loss from continuing operations was $0 for all periods.
FASB ASC 718, Compensation – Stock Compensation requires the benefits of tax deductions in excess of the stock-based compensation cost to be classified as financing cash inflows and is shown as “Excess tax benefit related to stock-based compensation” on the consolidated statement of cash flows. In addition, a tax benefit and a credit to additional paid-in capital for the excess deductions is not recognized until that deduction reduces taxes payable. For the years ended December 31, 2014, 2015 and 2016, the Company incurred excess tax benefits of $6.6 million, $331,000 and $72,000, respectively, which were not recorded because the Company is in a cumulative loss carryforward position for income taxes.
92
The Company uses the Black-Scholes option pricing model to estimate the per share fair value of stock option grants with time-based vesting. The Black-Scholes model relies on a number of key assumptions to calculate estimated fair values. For years ended December 31, 2014, 2015 and 2016, the expected life of each award granted was determined based on historical experience with similar awards, giving consideration to contractual terms, anticipated exercise patterns, vesting schedules and forfeitures. Expected volatility is based on historical volatility levels of the Company’s Class B common stock and the expected volatility of companies in similar industries that have similar vesting and contractual terms. The risk-free interest rate is based on the implied yield currently available on U.S. Treasury issues with terms approximately equal to the expected life of the option. The Company uses an expected annual dividend yield in consideration of the Company’s common stock dividend payments.
The following weighted average assumptions were used in determining the fair value of time-vested stock options granted for the periods indicated:
|
|
|
Years ended December 31, |
|
|||||||||
|
|
|
2014 |
|
|
2015 |
|
|
2016 |
|
|||
|
Expected life (in years) |
|
|
4.00 |
|
|
4.00 – 6.25 |
|
|
4.00 – 6.25 |
|
||
|
Risk-free interest rate |
|
1.25% to 1.45% |
|
|
1.13% to 1.56% |
|
|
0.86% to 1.7% |
|
|||
|
Expected volatility |
|
55% to 62% |
|
|
59% to 65% |
|
|
56% to 58% |
|
|||
|
Weighted average expected volatility |
|
|
56% |
|
|
|
62% |
|
|
|
58% |
|
|
Expected dividend yield |
|
0.76% to 2.03% |
|
|
0% to 0.36% |
|
|
0% |
|
|||
Stock option, restricted stock award, and restricted stock unit activity during the period is as follows:
|
|
|
Options and Restricted Stock available for grant (in thousands) |
|
|
Number of options outstanding (in thousands) |
|
|
Weighted average exercise price of options |
|
|
Weighted average remaining contractual term (in years) |
|
|
Aggregate intrinsic value (in thousands) |
|
|||||
|
Balance at December 31, 2015 |
|
|
2,008 |
|
|
|
8,937 |
|
|
$ |
6.97 |
|
|
|
6.33 |
|
|
$ |
52 |
|
|
Increase to option pool January 1, 2016 |
|
|
2,097 |
|
|
|
— |
|
|
|
|
|
|
|
|
|
|
|
|
|
|
Options granted |
|
|
(1,813 |
) |
|
|
1,813 |
|
|
|
4.08 |
|
|
|
|
|
|
|
|
|
|
Restricted stock granted |
|
|
(2,895 |
) |
|
|
— |
|
|
|
|
|
|
|
|
|
|
|
|
|
|
Restricted stock forfeited |
|
|
1,237 |
|
|
|
— |
|
|
|
|
|
|
|
|
|
|
|
|
|
|
Options exercised |
|
|
— |
|
|
|
(60 |
) |
|
|
4.01 |
|
|
|
|
|
|
|
|
|
|
Options expired |
|
|
1,779 |
|
|
|
(1,779 |
) |
|
|
9.60 |
|
|
|
|
|
|
|
|
|
|
Options forfeited |
|
|
1,233 |
|
|
|
(1,233 |
) |
|
|
5.31 |
|
|
|
|
|
|
|
|
|
|
Balance at December 31, 2016 |
|
|
3,646 |
|
|
|
7,678 |
|
|
|
5.97 |
|
|
|
5.07 |
|
|
$ |
0 |
|
|
Options exercisable at December 31, 2016 |
|
|
|
|
|
|
5,421 |
|
|
|
6.52 |
|
|
|
3.77 |
|
|
$ |
— |
|
Information related to stock compensation activity during the period indicated is as follows:
|
|
|
Years ended December 31, |
|
|||||||||
|
|
|
2014 |
|
|
2015 |
|
|
2016 |
|
|||
|
Weighted average fair value of options granted |
|
$ |
3.89 |
|
|
$ |
2.13 |
|
|
$ |
2.05 |
|
|
Intrinsic value of options exercised (in thousands) |
|
$ |
4,016 |
|
|
$ |
36 |
|
|
$ |
23 |
|
|
Total grant date fair value of restricted stock vested (in thousands) |
|
$ |
6,568 |
|
|
$ |
7,657 |
|
|
$ |
5,612 |
|
At December 31, 2016, there was $4.1 million of unrecognized stock option compensation expense related to non-vested awards, which is expected to be recognized over a weighted average period of 2.1 years.
93
During the years ended December 31, 2014, 2015, and 2016 gross proceeds recognized from the exercise of stock options was $4.2 million, $220,000, and $242,000 respectively. The net excess tax benefit (shortfall) on stock option exercises, restricted stock vesting, and dividends paid on unvested restricted stock during the years ended December 31, 2014, 2015, and 2016 of ($1.2) million, $0 and $0, respectively, was recorded to additional paid-in capital.
Restricted stock awards and restricted stock unit activity during the period is as follows:
|
|
|
Shares/ Units (in thousands) |
|
|
Weighted Average Grant Date Fair Value |
|
||
|
Unvested at December 31, 2015 |
|
|
2,222 |
|
|
$ |
4.86 |
|
|
Granted |
|
|
2,895 |
|
|
|
3.87 |
|
|
Vested |
|
|
(1,123 |
) |
|
|
5.00 |
|
|
Forfeited |
|
|
(1,237 |
) |
|
|
4.56 |
|
|
Unvested at December 31, 2016 |
|
|
2,757 |
|
|
|
3.90 |
|
Restricted stock awards and restricted stock units are generally measured at fair value on the date of grant based on the number of awards granted and the quoted price of the Company’s common stock. Restricted stock awards and restricted stock units are accounted for under FASB ASC 718 using the straight-line method net of estimated forfeitures.
At December 31, 2016, there was $8.3 million of unrecognized restricted stock compensation expense related to non-vested restricted stock, which is expected to be recognized over a weighted average period of 2.4 years.
During 2014, 2015 and 2016, the Company repurchased 175,000, 70,000, and 97,000 shares, respectively, from certain executives for minimum withholding taxes on 527,000, 257,000, and 284,000 restricted stock award vests, respectively. The number of shares repurchased was based on the value on the vesting date of the restricted stock awards equivalent to the value of the executives’ minimum withholding taxes of $1.1 million, $284,000 and $297,000 for 2014, 2015, and 2016, respectively. The Company then remitted cash to the appropriate taxing authorities. The payments are reflected as a financing activity within the consolidated statement of cash flows when paid. The payments had the effect of share repurchases by the Company as they reduced the number of shares that would have otherwise been issued on the vesting date and were recorded as a reduction of additional paid-in capital.
In February 2015, vesting of approximately 139,000 stock options and 108,000 restricted stock awards were accelerated in light of certain terms in a certain executive’s employment agreement resulting in approximately $661,000 of related stock-based compensation expense recognized in 2015. In May 2016, approximately 27,000 stock options and 33,000 restricted stock awards were fully accelerated and the period to exercise any outstanding vested stock options was modified to extend through the 10-year anniversary of the respective grant dates in connection with an executive’s transition to a consulting arrangement, and in October 2016, vesting of 288,877 stock options and 190,187 restricted stock awards were accelerated in connection with an executive’s separation agreement resulting in approximately $2.4 million of related stock-based compensation recognized in 2016.
(c) Employee Stock Purchase Plan
On March 8, 2013, the Company’s board of directors adopted and in May 2013 the stockholders approved the 2014 Employee Stock Purchase Plan (“2014 ESPP”), which became effective on January 1, 2014. The Company authorized an aggregate of 225,000 shares of Class B common stock for issuance under the plan to participating employees. The 2014 ESPP provides eligible employees the opportunity to purchase the Company’s Class B common stock at a price equal to 95% of the closing price on the last business day of each purchase periods. The 2014 ESPP permits eligible employees to purchase amounts up to 15% of their compensation in the purchase period, and no employee is permitted to purchase stock worth more than $25,000 in any calendar year, valued as of the first day of each purchase period. During the year ended December 31, 2014, 11,944 shares purchased at prices ranging from $3.94 to $11.42 per share. During the year ended December 31, 2015, 27,692 shares were purchased at prices ranging from $3.70 to $4.70 per share. During the year ended December 31, 2016, 29,365 shares were purchased at prices ranging from $2.52 to $4.23 per share.
94
The Company has a Retirement/Savings Plan (401(k) Plan) under Section 401(k) of the Internal Revenue Code, which covers those employees that meet eligibility requirements. Eligible employees may contribute up to the Internal Revenue Code prescribed maximum amounts. During 2011, the Company elected to match a portion of the employee contributions up to a defined maximum. In 2014, 2015 and 2016, cash contributions were made in the amount of $276,000, $276,000, and $288,000 respectively.
(8) Goodwill
Changes in the carrying amount of goodwill during the year ended December 31, 2016 are as follows (in thousands):
|
Balance as of December 31, 2015 |
|
$ |
63,305 |
|
|
Impairment of goodwill |
|
|
(63,305 |
) |
|
Balance as of December 31, 2016 |
|
$ |
— |
|
The Company has historically reviewed goodwill for impairment annually on November 30 and whenever events or changes in circumstances indicate the carrying value of goodwill may not be recoverable. When evaluating goodwill for impairment, the Company may first perform a qualitative assessment and determine if the fair value of the reporting unit is more likely than not greater than its carrying amount. For the three months ended June 30, 2016, the Company’s stock price was impacted by volatility, among other factors, in the U.S. financial markets, and traded below the then book value for an extended period of time. Accordingly, the Company tested its goodwill for impairment and concluded that the carrying value exceeded the estimated fair value of the Company’s single reporting unit and recognized an impairment loss during the second quarter of 2016 of $63.3 million. The fair value of the Company’s single reporting unit was based on estimates of future operating results, discounted cash flows and other market-based factors, including the Company’s stock price. The goodwill impairment loss resulted primarily from a sustained decline in the Company’s common stock share price and market capitalization as well as lower projected revenue growth rates and profitability levels compared to historical results. The lower projected operating results reflect changes in assumptions related to organic revenue growth rates, market trends, business mix, cost structure, and other expectations about the anticipated short-term and long-term operating results.
The testing of goodwill for impairment requires the Company to make significant estimates about its future performance and cash flows, as well as other assumptions. Events and circumstances considered in determining whether the carrying value of goodwill may not be recoverable include, but are not limited to: significant changes in performance relative to expected operating results; significant changes in the use of the assets; significant changes in competition and market dynamics; significant and sustained declines in the Company’s stock price and market capitalization; a significant decline in its expected future cash flows or a significant adverse change in the Company’s business climate. These estimates and circumstances are inherently uncertain and can be affected by numerous factors, including changes in economic, industry or market conditions, changes in business operations, a loss of a significant customer, changes in competition, volatility in financial markets, or changes in the share price of the Company’s common stock and market capitalization.
(9) Segment Reporting and Geographic Information
Operating segments are revenue-producing components of the enterprise for which separate financial information is produced internally for the Company’s management. Historically, the Company operated under two segments: Call-driven and Archeo. Subsequent to the sale of the Company’s remaining Archeo operations in December 2015, the Company operates primarily under the Call-driven segment which is comprised of performance-based advertising business focused on driving phone calls and its local leads platform.
95
The Archeo segment historically comprised the Company’s click-based advertising businesses. In April 2015, the Company sold certain assets related to Archeo’s domain operations, including the bulk of its domain name portfolio. The operating results related to this April 2015 disposition are shown as discontinued operations in the consolidated statements of operation. In December 2015, the Company sold the remaining Archeo operations which did not meet the criteria for discontinued operations, and as a result the operating results are reflected in continuing operations in 2015. See Note 10. Discontinued Operations, Dispositions, and Other of the Notes to Consolidated Financial Statements for further discussion. Unless otherwise indicated, information presented in the Notes to Consolidated Financial Statements relates only to the Company’s continuing operations.
The Call-driven segment expenses include both direct costs incurred by the segment as well as corporate overhead costs. The Archeo segment expenses only include direct costs incurred by the segment. Segment expenses exclude the following: stock-based compensation, acquisition and disposition related costs, and other expense.
For the year ended December 31, 2016, the Company’s operating results are primarily all Call-driven. There were other operating activities related to transition related activities of the Archeo operations in 2016, which were not significant and therefore are not presented below.
Selected segment information (in thousands):
|
|
|
Year ended December 31, 2015 |
|
|||||||||
|
|
|
Call-driven |
|
|
Archeo |
|
|
Total |
|
|||
|
Revenue |
|
$ |
139,886 |
|
|
$ |
3,127 |
|
|
$ |
143,013 |
|
|
Operating expenses |
|
|
132,077 |
|
|
|
2,696 |
|
|
|
134,773 |
|
|
Segment profit |
|
$ |
7,809 |
|
|
$ |
431 |
|
|
$ |
8,240 |
|
|
Less reconciling items: |
|
|
|
|
|
|
|
|
|
|
|
|
|
Stock-based compensation |
|
|
|
|
|
|
|
|
|
|
10,024 |
|
|
Acquisition and disposition related costs |
|
|
|
|
|
|
|
|
|
|
219 |
|
|
Gain on sale of Archeo assets |
|
|
|
|
|
|
|
|
|
|
(1,496 |
) |
|
Interest expense and other, net |
|
|
|
|
|
|
|
|
|
|
63 |
|
|
Loss from continuing operations before provision for income taxes |
|
|
|
|
|
|
|
|
|
$ |
(570 |
) |
|
|
|
Year ended December 31, 2014 |
|
|||||||||
|
|
|
Call-driven |
|
|
Archeo |
|
|
Total |
|
|||
|
Revenue |
|
$ |
168,051 |
|
|
$ |
5,550 |
|
|
$ |
173,601 |
|
|
Operating expenses |
|
|
156,952 |
|
|
|
4,617 |
|
|
|
161,569 |
|
|
Segment profit |
|
$ |
11,099 |
|
|
$ |
933 |
|
|
$ |
12,032 |
|
|
Less reconciling items: |
|
|
|
|
|
|
|
|
|
|
|
|
|
Stock-based compensation |
|
|
|
|
|
|
|
|
|
|
11,888 |
|
|
Amortization of intangible assets from acquisitions |
|
|
|
|
|
|
|
|
|
|
434 |
|
|
Acquisition and disposition related costs |
|
|
|
|
|
|
|
|
|
|
(68 |
) |
|
Interest expense and other, net |
|
|
|
|
|
|
|
|
|
|
62 |
|
|
Loss from continuing operations before provision for income taxes |
|
|
|
|
|
|
|
|
|
$ |
(284 |
) |
Revenues from advertisers by geographical areas are tracked on the basis of the location of the advertiser. The vast majority of the Company’s revenue and accounts receivable are derived from domestic sales to advertisers engaged in various mobile, online and other activities.
96
Revenues by geographic region are as follows:
|
|
|
Years ended December 31, |
|
|||||||||
|
|
|
2014 |
|
|
2015 |
|
|
2016 |
|
|||
|
United States |
|
|
97 |
% |
|
|
97 |
% |
|
|
97 |
% |
|
Canada |
|
|
3 |
% |
|
|
3 |
% |
|
|
3 |
% |
|
Other countries |
|
* |
|
|
* |
|
|
* |
|
|||
|
|
|
|
100 |
% |
|
|
100 |
% |
|
|
100 |
% |
|
* |
Less than 1% of revenue |
(10) Discontinued Operations, Dispositions and Other
(a) Discontinued Operations
In April 2015, the Company sold certain assets related to Archeo’s domain operations, including the bulk of its domain name portfolio. This disposal meets the requirements of Accounting Standards Codification 205-20, Discontinued Operations, for presentation as discontinued operations. As a result, the operating results related to this disposition are shown as discontinued operations, net of tax. The operating results for the discontinued operation were as follows (in thousands):
|
|
|
Years ended December 31, |
|
|||||
|
|
|
2014 |
|
|
2015 |
|
||
|
Revenue |
|
$ |
9,043 |
|
|
$ |
7,081 |
|
|
Expenses: |
|
|
|
|
|
|
|
|
|
Service costs |
|
|
3,322 |
|
|
|
1,624 |
|
|
Sales and marketing |
|
|
518 |
|
|
|
334 |
|
|
General and administrative |
|
|
5 |
|
|
|
— |
|
|
Income from discontinued operations before provision for income taxes |
|
|
5,198 |
|
|
|
5,123 |
|
|
Income tax expense |
|
|
1,773 |
|
|
|
— |
|
|
Income from discontinued operations, net of tax |
|
$ |
3,425 |
|
|
$ |
5,123 |
|
The discontinued operation incurred amortization of $115,000 and $16,000 in the years ended December 31, 2014 and 2015, respectively.
The net cash proceeds from this disposition were approximately $28.1 million. The sale includes a contingent earn-out consideration payment that depends upon the achievement of certain thresholds and will be recognized as income when received.
In July 2013, the Company completed the sale of certain pay-per-click advertising services. The net cash proceeds from the sale of the pay-per-click assets in July 2013 were approximately $1.4 million.
(b) Disposition
On December 31, 2015, the Company sold the remaining Archeo operations for cash proceeds of $750,000. The transaction costs were approximately $244,000 and the net carrying value of the liabilities assumed were approximately $990,000, resulting in a net gain of $1.5 million from the sale. The Company evaluated this disposition and determined that it did not meet the criteria for classification as a discontinued operation. As a result, operating results of these Archeo operations and the related gain on sale are reflected in the Company’s continuing operations in the consolidated statements of operations. For the years ended December 31, 2014 and 2015, income before provision for income taxes for these Archeo operations included in the Company’s continuing operations, were $950,000, and $431,000, respectively.
97
In the third quarter of 2016, the Company incurred approximately $1.6 million in employee separation and facility termination related costs. As of December 31, 2016, approximately $354,000 of these costs were accrued and expected to be paid in 2017.
In January 2017, the Company incurred approximately $800,000 of employee separation related costs as part of savings measures implemented in 2017.
98
None.
Evaluation of Disclosure Controls and Procedures
As of the end of the period covered by this report, we carried out an evaluation, under the supervision and with the participation of our principal executive officer and our principal financial officer, of the effectiveness of our “disclosure controls and procedures” (as defined in Rules 13a-15(e) and 15d-15(e) of the Securities Exchange Act of 1934). Based on this evaluation, our principal executive officer and our principal financial officer have concluded that, as of the date of the evaluation, our disclosure controls and procedures were effective.
Management’s Report on Internal Control Over Financial Reporting
(a) Management’s report on internal control over financial reporting
Management of Marchex, Inc. is responsible for establishing and maintaining adequate internal control over financial reporting, as such term is defined in the Securities Exchange Act of 1934 Rule 13a-15(f). Under the supervision and with the participation of our management, including our principal executive officer and principal financial officer, we conducted an evaluation of the effectiveness of our internal control over financial reporting as of December 31, 2016 as required by the Securities Exchange Act of 1934 Rule 13a-15(c). In making this assessment, we used the criteria set forth in the framework in Internal Control-Integrated Framework issued by the Committee of Sponsoring Organizations of the Treadway Commission (2013 framework). Based on our evaluation, our management concluded that our internal control over financial reporting was effective as of December 31, 2016.
(b) Report of the registered public accounting firm
The report of KPMG LLP, the Company’s independent registered public accounting firm, on the effectiveness of the Company’s internal control over financial reporting is included in this Annual Report on Form 10-K.
(c) Changes in Internal Control over Financial Reporting
During the quarter ended December 31, 2016, no change was made to our internal control over financial reporting that has materially affected, or is reasonably likely to materially affect, our internal control over financial reporting.
Limitations on the Effectiveness of Controls
In designing and evaluating the disclosure controls and procedures, management recognizes that any controls and procedures, no matter how well designed and operated, cannot provide absolute assurance of achieving the desired control objectives.
In addition, because of its inherent limitations, internal control over financial reporting may not prevent or detect misstatements. Also, projections of any evaluation of effectiveness to future periods are subject to the risk that controls may become inadequate because of changes in conditions, or that the degree of compliance with the policies or procedures may deteriorate.
None.
99
The information required by this item is incorporated herein by reference to the Company’s definitive proxy statement relating to the 2017 annual meeting of stockholders (the “2017 Proxy Statement”), which the Company intends to file with the Securities and Exchange Commission within 120 days of the Company’s fiscal year ended December 31, 2016.
Our Code of Ethics for our Chief Executive Officer, Chief Financial Officer and Senior Financial Officers is available on our web site, www.marchex.com, by clicking “Investors” and then “Corporate Governance”.
The information required under this item may be found in the 2017 Proxy Statement and is incorporated herein by reference.
|
ITEM 12. |
SECURITY OWNERSHIP OF CERTAIN BENEFICIAL OWNERS AND MANAGEMENT AND RELATED STOCKHOLDER MATTERS. |
The information required under this item may be found in the 2017 Proxy Statement and is incorporated herein by reference.
The information required under this item may be found in the 2017 Proxy Statement and is incorporated herein by reference.
The information required under this item may be found in the 2017 Proxy Statement and is incorporated herein by reference.
100
|
1. |
The following reports and financial statements are included in Part II, Item 8 of this Form 10-K: |
|
|
• |
Reports of Independent Registered Public Accounting Firm; |
|
|
• |
Consolidated Balance Sheets as of December 31, 2015 and 2016; |
|
|
• |
Consolidated Statements of Operations for the years ended December 31, 2014, 2015 and 2016; |
|
|
• |
Consolidated Statements of Stockholders’ Equity for the years ended December 31, 2014, 2015 and 2016; |
|
|
• |
Consolidated Statements of Cash Flow for the years ended December 31, 2014, 2015 and 2016; and |
|
|
• |
Notes to Consolidated Financial Statements. |
|
2. |
Financial Statement Schedules |
Financial statement schedules are omitted because they are not required or are not applicable, or the required information is provided in the consolidated financial statements or notes described in Item 15 (a) (1) above.
|
3. |
We have filed, or incorporated into this Form 10-K by reference, the exhibits listed on the accompanying Exhibit Index immediately following the signature page of this Form 10-K. |
101
Pursuant to the requirements of Section 13 or 15(d) of the Securities Exchange Act of 1934, the Registrant has duly caused this report to be signed on its behalf by the undersigned, thereunto duly authorized in the City of Seattle, State of Washington on March 8, 2017.
|
MARCHEX, INC. |
|
|
|
|
|
By: |
/S/ MICHAEL A. ARENDS |
|
|
Michael A. Arends Chief Financial Officer (Principal Financial and Accounting Officer) |
POWER OF ATTORNEY
KNOW ALL PERSONS BY THESE PRESENTS, that each person whose signature appears below constitutes and appoints Ethan Caldwell and Michael A. Arends, jointly and severally, as his or her attorneys-in-fact, each with the full power of substitution, for him or her, in any and all capacities, to sign any amendment to this Annual Report on Form 10-K, and to file the same, with exhibits thereto and other documents in connection therewith, with the Securities and Exchange Commission, granting to said attorneys-in-fact, and each of them, full power and authority to do and perform each and every act and thing requisite and necessary to be done in connection therewith, as fully to all intents and purposes as he or she might or could do in person, hereby ratifying and confirming all that said attorneys-in-fact or any of them, or their or his or her substitute or substitutes, may lawfully do or cause to be done by virtue hereof.
Pursuant to the requirements of the Securities Exchange Act of 1934, this Annual Report on Form 10-K has been signed below by the following persons on behalf of the Registrant and in the capacities and on the dates indicated.
|
Signature |
|
Date |
|
|
|
|
|
/S/ Ethan Caldwell |
|
March 8, 2017 |
|
Ethan Caldwell Chief Administrative Officer, General Counsel and Corporate Secretary and member of the Interim Office of the CEO and designated Principal Executive Officer for SEC reporting purposes (Principal Executive Officer) |
|
|
|
|
|
|
|
/S/ MICHAEL A. ARENDS |
|
March 8, 2017 |
|
Michael A. Arends Chief Financial Officer (Principal Financial and Accounting Officer) |
|
|
|
|
|
|
|
|
|
|
|
/S/ DENNIS CLINE |
|
March 8, 2017 |
|
Dennis Cline Director |
|
|
|
|
|
|
|
/S/ ANNE DEVEREUX – MILLS |
|
March 8, 2017 |
|
Anne Devereux – Mills Chairman and Director |
|
|
|
|
|
|
|
/S/ NICOLAS J. HANAUER |
|
March 8, 2017 |
|
Nicolas J. Hanauer Vice Chairman and Director |
|
|
|
|
|
|
|
/S/ IAN MORRIS |
|
March 8, 2017 |
|
Ian Morris Director |
|
|
|
|
|
|
|
/S/ M. WAYNE WISEHART |
|
March 8, 2017 |
|
M. Wayne Wisehart Director |
|
|
102
|
Exhibit |
|
Description of Document |
|
|
|
|
|
2.1 |
|
Asset Purchase Agreement, dated as of November 19, 2004, by and among the Registrant, Name Development Ltd. and the Sole Stockholder of Name Development Ltd. (incorporated by reference to Exhibit 2.4 to the Registrant’s Registration Statement on Form SB-2 (No. 333-121213), filed with the SEC on December 13, 2004). |
|
|
|
|
|
2.2 |
|
Agreement and Plan of Merger, dated as of August 9, 2007, by and among Registrant, VoiceStar, Inc., and the Shareholders of VoiceStar, Inc. (incorporated by reference to Exhibit 2.9 to the Registrant’s Annual Report on Form 10-K for the fiscal year ended December 31, 2012 filed with the SEC on March 12, 2013). |
|
|
|
|
|
+2.3 |
|
Agreement and Plan of Merger, dated as of April 7, 2011, by and among the Registrant, Marchex Acquisition Corporation, Jingle Networks, Inc. and with respect to Articles II, V and VIII only, Chip Hazard as the Stockholder Representative (incorporated by reference to Exhibit 4.4 to the Registrant’s Amendment No. 1 to the Registration Statement on Form S-3 (No. 333-174016) filed with the SEC on June 29, 2011). |
|
|
|
|
|
+2.4 |
|
Asset Purchase Agreement dated as of April 21, 2015, by and among NameFind LLC, GoDaddy.com, LLC, Marchex Sales, LLC and Marchex (incorporated by reference to Exhibit 2.11 to the Registrant’s Current Report on Form 8-K filed with the SEC on April 27, 2015). |
|
|
|
|
|
3.1 |
|
Amended and Restated Certificate of Incorporation of the Registrant (incorporated by reference to Exhibit 3.3 to the Registrant’s Amendment No. 2 to the Registration Statement on Form SB-2 (No. 333-111096) filed with the SEC on March 19, 2004). |
|
|
|
|
|
3.2 |
|
Amended and Restated By-Laws of the Registrant (incorporated by reference to Exhibit 3.4 to the Registrant’s Annual Report on Form 10-K for the fiscal year ended December 31, 2012 filed with the SEC on March 12, 2013). |
|
|
|
|
|
4.1 |
|
Specimen stock certificate representing shares of Class B Common Stock of the Registrant (incorporated by reference to Exhibit 4.1 to the Registrant’s Amendment No. 3 to the Registration Statement on Form SB-2 (No. 333-111096) filed with the SEC on March 30, 2004). |
|
|
|
|
|
*10.1 |
|
Amended and Restated 2003 Stock Incentive Plan (incorporated by reference to Exhibit 10.1 to the Registrant’s Amendment No. 2 to the Registration Statement on Form SB-2 (No. 333-111096) filed with the SEC on March 19, 2004). |
|
|
|
|
|
*10.2 |
|
Form of Retention Agreement (incorporated by reference to Exhibit 10.10 to the Registrant’s Annual Report on Form 10-K for the fiscal year ended December 31, 2011 filed with the SEC on March 12, 2012). |
|
|
|
|
|
+10.3 |
|
Master Services and License Agreement dated as of October 1, 2007, by and between MDNH, Inc. and YellowPages.com LLC (incorporated by reference to Exhibit 10.11 to the Registrant’s Annual Report on Form 10-K for the fiscal year ended December 31, 2012 filed with the SEC on March 12, 2013). |
|
|
|
|
|
+10.4 |
|
Credit Agreement dated as of April 1, 2008, by and between the Registrant, the several banks and other financial institutions or entities from time to time parties to the agreement, and U.S. Bank National Association, as administrative agent (incorporated by reference to Exhibit 10.12 to the Registrant’s Annual Report on Form 10-K for the fiscal year ended December 31, 2013 filed with the SEC on March 3, 2014). |
|
|
|
|
|
*10.5 |
|
Form of First Amendment to Retention Agreement (incorporated by reference to Exhibit 10.13 to the Registrant’s Annual Report on Form 10-K for the fiscal year ended December 31, 2014 filed with the SEC on March 10, 2015). |
|
|
|
|
103
|
Exhibit |
|
Description of Document |
|
|
Revised Form of Retention Agreement (incorporated by reference to Exhibit 10.14 to the Registrant’s Annual Report on Form 10-K for the fiscal year ended December 31, 2014 filed with the SEC on March 10, 2015). |
|
|
|
|
|
|
10.7 |
|
Amended and Restated Lease effective as of June 5, 2009, between 520 Pike Street, Inc. and the Registrant (incorporated by reference to Exhibit 10.19 to the Registrant’s Annual Report on Form 10-K for the fiscal year ended December 31, 2014 filed with the SEC on March 10, 2015). |
|
|
|
|
|
*10.8 |
|
Form of Executive Officer Stock Option Agreement (2003 Amended and Restated Stock Incentive Plan) (incorporated by reference to Exhibit 10.20 to the Registrant’s Annual Report on Form 10-K for the fiscal year ended December 31, 2014 filed with the SEC on March 10, 2015). |
|
|
|
|
|
+10.9 |
|
Amendment No. 1 to Master Services and License Agreement effective as of April 30, 2010, by the between MDNH, Inc. and YellowPages.com LLC d/b/a AT&T Interactive and related Project Addendum No. 1, effective as of January 1, 2009, as amended (incorporated by reference to Exhibit 10.18 to the Registrant’s Annual Report on Form 10-K filed with the SEC on March 7, 2016). |
|
*10.10 |
|
Form of Notice of Grant of Executive Officer Stock Option (Performance-Based) (2003 Amended and Restated Stock Incentive Plan) (incorporated by reference to Exhibit 10.19 to the Registrant’s Annual Report on Form 10-K filed with the SEC on March 7, 2016). |
|
|
|
|
|
*10.11 |
|
Form of Notice of Grant of Executive Officer Stock Option (Time-Based) (2003 Amended and Restated Stock Incentive Plan) (incorporated by reference to Exhibit 10.20 to the Registrant’s Annual Report on Form 10-K filed with the SEC on March 7, 2016). |
|
|
|
|
|
+10.12 |
|
Amendments No. 1, 2 and 3 to YAHOO! Publisher Network Service Order, effective as of September 25, 2007, August 1, 2008 and June 1, 2010 respectively, by and between Yahoo! Inc., as successor in interest to Overture Services, Inc., and Yahoo! Sarl, as successor in interest to Overture Search Services (Ireland) Limited, MDNH, Inc. and MDNH International Ltd. (incorporated by reference to Exhibit 10.24 to the Registrant’s Annual Report on Form 10-K filed with the SEC on March 7, 2016). |
|
|
|
|
|
*10.13 |
|
Amendment to the Marchex, Inc. 2003 Amended and Restated Stock Incentive Plan (incorporated by reference to Exhibit 10.25 to the Registrant’s Annual Report on Form 10-K filed with the SEC on March 7, 2016). |
|
|
|
|
|
†††*10.14 |
|
Marchex, Inc. Amended and Restated Annual Incentive Plan. |
|
|
|
|
|
10.15 |
|
First Amendment to the Credit Agreement made and entered into as of March 1, 2011, by and among the Registrant, the several banks and other financial institutions or entities from time to time parties to the agreement, and U.S. Bank National Association, as administrative agent (incorporated by reference to Exhibit 10.32 to the Registrant’s Annual Report on Form 10-K for the fiscal year ended December 31, 2011 filed with the SEC on March 12, 2012). |
|
|
|
|
|
*10.16 |
|
Marchex, Inc. 2012 Stock Incentive Plan (incorporated by reference to Appendix A to the Registrant’s Definitive Proxy Statement on Form 14A filed with the SEC on April 9, 2012). |
|
|
|
|
|
*10.17 |
|
Marchex, Inc. 2014 Employee Stock Purchase Plan, as amended on December 20, 2012 (incorporated by reference to Appendix A to the Registrant’s Definitive Proxy Statement on Form 14A filed with the SEC on April 3, 2013). |
|
|
|
|
|
*10.18 |
|
Form of Incentive Stock Option Notice and Agreement (2012 Stock Incentive Plan) (incorporated by reference to Exhibit 10.33 to the Registrant’s Quarterly Report on Form 10-Q filed with the SEC on August 8, 2013). |
|
|
|
|
|
*10.19 |
|
Form of Nonstatutory Stock Option Notice and Agreement (2012 Stock Incentive Plan) (incorporated by reference to Exhibit 10.34 to the Registrant’s Quarterly Report on Form 10-Q filed with the SEC on August 8, 2013). |
|
|
|
|
104
|
Exhibit |
|
Description of Document |
|
|
Form of Restricted Stock Agreement (2012 Stock Incentive Plan) (incorporated by reference to Exhibit 10.35 to the Registrant’s Quarterly Report on Form 10-Q filed with the SEC on August 8, 2013). |
|
|
|
|
|
|
*10.21 |
|
Form of Restricted Stock Units Notice and Agreement (2012 Stock Incentive Plan) (incorporated by reference to Exhibit 10.36 to the Registrant’s Quarterly Report on Form 10-Q filed with the SEC on August 8, 2013). |
|
|
|
|
|
+10.22 |
|
Amendment No. 2 to Master Services and License Agreement, effective as of July 1, 2013, by and between Marchex Sales LLC, a Delaware limited liability company, and YellowPages.com LLC, a Delaware limited liability company (incorporated by reference to Exhibit 10.37 to the Registrant’s Quarterly Report on Form 10-Q filed with the SEC on November 12, 2013). |
|
|
|
|
|
*10.23 |
|
Form of Indemnity Agreement (Section 16 Executive Officers and Directors) (incorporated by reference to Exhibit 10.1 to the Registrant’s Current Report on Form 8-K filed with the SEC on May 7, 2013). |
|
|
|
|
|
10.24 |
|
Second Amendment to the Credit Agreement made and entered into as of February 24, 2014, by and among the Registrant, the several banks and other financial institutions or entities from time to time parties to the agreement, and U.S. Bank National Association, as administrative agent (incorporated by reference to Exhibit 10.40 to the Registrant’s Annual Report on Form 10-K for the fiscal year ended December 31, 2013 filed with the SEC on March 3, 2014). |
|
|
|
|
|
+10.25 |
|
Pay-For-Call Distribution Agreement, by and between Yellowpages.com LLC, a Delaware limited liability company (d/b/a AT&T Interactive) and Marchex Sales, Inc., a Delaware corporation, effective as of January 1, 2011 (incorporated by reference to Exhibit 10.44 to the Registrant’s Quarterly Report on Form 10-Q filed with the SEC on November 10, 2014). |
|
|
|
|
|
+10.26 |
|
Amendment No. 1 to Pay-For-Call Distribution Agreement, by and between Yellowpages.com LLC, a Delaware limited liability company (formally d/b/a AT&T Interactive or ATTi) and Marchex Sales LLC, a Delaware limited liability company and successor in interest to Marchex Sales, Inc., effective as of December 31, 2012 (incorporated by reference to Exhibit 10.45 to the Registrant’s Quarterly Report on Form 10-Q filed with the SEC on November 10, 2014). |
|
|
|
|
|
+10.27 |
|
Third Amendment to the Credit Agreement and Consent made and entered into as of April 21, 2015, by and among Marchex, the several banks and other financial institutions or entities from time to time parties to the agreement, and U.S. Bank National Association, as administrative agent (incorporated by reference to Exhibit 10.46 to the Registrant’s Quarterly Report on Form 10-Q filed with the SEC on August 10, 2015). |
|
|
|
|
|
+10.28 |
|
Amendment No. 3 to Master Services and License Agreement, effective June 25, 2015, by and between Marchex Sales LLC, a Delaware limited liability company and successor in interest to Marchex Sales, Inc. and YellowPages.com LLC, a Delaware limited liability company (formally d/b/a AT&T Interactive or ATTi) (incorporated by reference to Exhibit 10.47 to the Registrant’s Quarterly Report on Form 10-Q filed with the SEC on August 10, 2015). |
|
|
|
|
|
+10.29 |
|
Amendment No. 2 to Pay-For-Call Distribution Agreement, effective June 25, 2015, by and between Marchex Sales LLC, a Delaware limited liability company and successor in interest to Marchex Sales, Inc. and YellowPages.com LLC, a Delaware limited liability company (formally d/b/a AT&T Interactive or ATTi) (incorporated by reference to Exhibit 10.48 to the Registrant’s Quarterly Report on Form 10-Q filed with the SEC on August 10, 2015). |
|
|
|
|
|
+10.30 |
|
Terms and Conditions For Pay-For-Call Advertising for Resolution Media Clients, by and between Marchex Sales, LLC (f/k/a Marchex Sales, Inc.) and Resolution Media Inc., dated September 7, 2010 (incorporated by reference to Exhibit 10.45 to the Registrant’s Annual Report on Form 10-K filed with the SEC on March 7, 2016). |
|
|
|
|
105
|
Exhibit |
|
Description of Document |
|
|
Marchex Call Marketplace Insertion Order (State Farm – Auto Campaign), by and between Marchex Sales, LLC and Resolution Media Inc., dated December 22, 2015 (incorporated by reference to Exhibit 10.46 to the Registrant’s Annual Report on Form 10-K filed with the SEC on March 7, 2016). |
|
|
|
|
|
|
+10.32 |
|
Marchex Call Marketplace Insertion Order Amendment No. 1 (State Farm – Auto Campaign), by and between Marchex Sales, LLC and Resolution Media Inc., dated January 20, 2016 (incorporated by reference to Exhibit 10.47 to the Registrant’s Annual Report on Form 10-K filed with the SEC on March 7, 2016). |
|
|
|
|
|
+10.33 |
|
Marchex Call Marketplace Insertion Order (State Farm – Life Campaign), by and between Marchex Sales, LLC and Resolution Media Inc., dated December 24, 2015 (incorporated by reference to Exhibit 10.48 to the Registrant’s Annual Report on Form 10-K filed with the SEC on March 7, 2016). |
|
|
|
|
|
+10.34 |
|
Marchex Call Marketplace Insertion Order Amendment No. 1 (State Farm – Life Campaign), by and between Marchex Sales, LLC and Resolution Media Inc., dated January 20, 2016 (incorporated by reference to Exhibit 10.49 to the Registrant’s Annual Report on Form 10-K filed with the SEC on March 7, 2016). |
|
|
|
|
|
*10.35 |
|
Amended and Restated Executive Employment Agreement effective as of April 21, 2016, by and between Michael Arends and the Registrant (incorporated by reference to Exhibit 10.50 to the Registrant’s Quarterly Report on Form 10-Q filed with the SEC on August 9, 2016). |
|
|
|
|
|
*10.36 |
|
Amended and Restated Executive Employment Agreement effective as of April 21, 2016, by and between Ethan Caldwell and the Registrant (incorporated by reference to Exhibit 10.51 to the Registrant’s Quarterly Report on Form 10-Q filed with the SEC on August 9, 2016). |
|
|
|
|
|
*10.37 |
|
Amended and Restated Executive Employment Agreement effective as of April 21, 2016, by and between Peter Christothoulou and the Registrant (incorporated by reference to Exhibit 10.52 to the Registrant’s Quarterly Report on Form 10-Q filed with the SEC on August 9, 2016). |
|
|
|
|
|
*10.38 |
|
Amended and Restated Executive Employment Agreement effective as of April 21, 2016, by and between Ziad Ismail and the Registrant (incorporated by reference to Exhibit 10.53 to the Registrant’s Quarterly Report on Form 10-Q filed with the SEC on August 9, 2016). |
|
|
|
|
|
*10.39 |
|
Amended and Restated Executive Employment Agreement effective as of April 21, 2016, by and between Gary Nafus and the Registrant (incorporated by reference to Exhibit 10.54 to the Registrant’s Quarterly Report on Form 10-Q filed with the SEC on August 9, 2016). |
|
|
|
|
|
*10.40 |
|
Separation Agreement dated May 11, 2016, by and between Russell C. Horowitz and the Registrant incorporated by reference to Exhibit 10.55 to the Registrant’s Quarterly Report on Form 10-Q filed with the SEC on August 9, 2016). |
|
|
|
|
|
+10.41 |
|
Fourth Amendment to the Credit Agreement made and entered into as of June 30, 2016, by and among the Registrant, the several banks and other financial institutions or entities from time to time parties to the agreement, and U.S. Bank National Association, as administrative agent (incorporated by reference to Exhibit 10.56 to the Registrant’s Quarterly Report on Form 10-Q filed with the SEC on August 9, 2016). |
|
|
|
|
|
†*10.42 |
|
Separation Agreement dated October 3, 2016, by and between Peter Christothoulou and the Registrant. |
|
|
|
|
|
†10.43 |
|
Amendment No. 4 to Master Services and License Agreement, effective December 15, 2016, by and between Marchex Sales LLC, a Delaware limited liability company and successor in interest to Marchex Sales, Inc. and YellowPages.com LLC, a Delaware limited liability company (formally d/b/a AT&T Interactive or ATTi). |
|
|
|
|
106
|
Exhibit |
|
Description of Document |
|
|
Amendment No. 3 to Pay-For-Call Distribution Agreement, effective December 15, 2016, by and between Marchex Sales LLC, a Delaware limited liability company and successor in interest to Marchex Sales, Inc. and YellowPages.com LLC, a Delaware limited liability company (formally d/b/a AT&T Interactive or ATTi). |
|
|
|
|
|
|
†21.1 |
|
Subsidiaries of the Registrant. |
|
|
|
|
|
†23.1 |
|
Consent of Independent Registered Public Accounting Firm. |
|
|
|
|
|
24.1 |
|
Power of Attorney (incorporated herein by reference to the signature page of the Annual Report on Form 10-K) |
|
|
|
|
|
†31(i) |
|
Certification of Principal Executive Officer pursuant to Rule 13a-14(a)/15d-14(a) as Adopted Pursuant to Section 302 of the Sarbanes-Oxley Act of 2002. |
|
|
|
|
|
†31(ii) |
|
Certification of Principal Financial Officer pursuant to Rule 13a-14(a)/15d-14(a) as Adopted Pursuant to Section 302 of the Sarbanes-Oxley Act of 2002. |
|
|
|
|
|
††32 |
|
Certification of Principal Executive Officer and Principal Financial Officer Pursuant to 18 U.S.C. Section 1350, as Adopted Pursuant to Section 906 of the Sarbanes-Oxley Act of 2002. |
|
|
|
|
|
†101. INS |
|
XBRL Instance Document. |
|
|
|
|
|
†101.SCH |
|
XBRL Taxonomy Extension Schema Document. |
|
|
|
|
|
†101.CAL |
|
XBRL Taxonomy Extension Calculation Linkbase Document. |
|
|
|
|
|
†101.DEF |
|
XBRL Taxonomy Extension Definition Linkbase Document. |
|
|
|
|
|
†101.LAB |
|
XBRL Taxonomy Extension Labels Linkbase Document. |
|
|
|
|
|
†101.PRE |
|
XBRL Taxonomy Presentation Linkbase Document. |
|
* |
Management contract or compensatory plan or arrangement. |
|
(+) |
Certain information in this agreement has been omitted and filed separately with the Securities and Exchange Commission. Confidential treatment has been granted with respect to the omitted portions. |
|
(+)(+) |
Certain information in this Agreement has been omitted and filed separately with the SEC. Confidential treatment has been requested with respect to the omitted portions. |
|
† |
Filed herewith. |
|
†† |
Furnished herewith. |
|
††† |
Refiled herewith pursuant to Regulation S-K Item 10. |
107