Attached files
UNITED STATES
SECURITIES AND EXCHANGE COMMISSION
Washington, D.C. 20549
FORM 10-K
(Mark One)
x | ANNUAL REPORT PURSUANT TO SECTION 13 OR 15(d) OF THE SECURITIES EXCHANGE ACT OF 1934 |
For the fiscal year ended December 31, 2016
OR
o | TRANSITION REPORT PURSUANT TO SECTION 13 OR 15(d) OF THE SECURITIES EXCHANGE ACT OF 1934 |
For the transition period from to
001-37505 |
Commission file number
FIRST COMMUNITY FINANCIAL PARTNERS, INC.
(Exact name of registrant as specified in its charter)
Illinois | 20-4718752 | |
(State or other jurisdiction of incorporation or organization) | (I.R.S. Employer Identification No.) | |
2801 Black Road, Joliet, IL | 60435 | |
(Address of Principal Executive Offices) | (Zip Code) | |
Registrant’s telephone number, including area code: (815) 725-0123
Securities registered pursuant to Section 12(b) of the Act:
Common Stock, par value $1.00 per share | The NASDAQ Stock Market LLC | |
(Title of each class) | (Name of cash exchange on which registered) | |
Securities registered pursuant to Section 12(g) of the Act:
None
(Title of Class)
Indicate by check mark if the registrant is a well-known seasoned issuer, as defined in Rule 405 of the Securities Act. Yes o No x
Indicate by check mark if the registrant is not required to file reports pursuant to Section 13 or Section 15(d) of the Act. Yes o No x
Indicate by check mark whether the registrant (1) has filed all reports required to be filed by Section 13 or 15(d) of the Securities Exchange Act of 1934 during the preceding 12 months (or for such shorter period that the registrant was required to file such reports), and (2) has been subject to such filing requirements for the past 90 days. Yes x No o
Indicate by check mark whether the registrant has submitted electronically and posted on its corporate Web site, if any, every Interactive Data File required to be submitted and posted pursuant to Rule 405 of Regulation S-T (§ 232.405 of this chapter) during the preceding 12 months (or for such shorter period that the registrant was required to submit and post such files). Yes x No o
Indicate by check mark if disclosure of delinquent filers pursuant to Item 405 of Regulation S-K is (§ 229.405) not contained herein, and will not be contained, to the best of registrant’s knowledge, in definitive proxy or information statement incorporated by reference in Part III of this Form 10-K or any amendment to this Form 10-K. o
Indicate by check mark whether the registrant is a large accelerated filer, an accelerated filer, a non-accelerated filer, or a smaller reporting company. See definition of “large accelerated filer,” “accelerated filer” and “smaller reporting company” in Rule 12b-2 of the Exchange Act. (Check one):
Large accelerated filer o | Accelerated filer x | |
Non-accelerated filer o (Do not check if a smaller reporting company) | Smaller reporting company o | |
Indicate by check mark whether the registrant is a shell company (as defined in Rule 12b-2 of the Act). Yes o No x
The aggregate market value of the voting shares held by non-affiliates of the Registrant was approximately $111,425,732 as of June 30, 2016, the last business day of the Registrant’s most recently completed second fiscal quarter. Solely for the purpose of this computation, it has been assumed that executive officers and directors of the Registrant are “affiliates,” and the Registrant is not bound by this determination for any other purpose.
There were issued and outstanding 17,758,386 shares of the Registrant’s common stock as of March 1, 2017.
FIRST COMMUNITY FINANCIAL PARTNERS, INC.
FORM 10-K
December 31, 2016
Page | ||
3
PART I
Item 1. Business
First Community
First Community Financial Partners, Inc. (“First Community” or the “Company”) was formed as a bank holding company in 2006. First Community is headquartered in Joliet, Illinois. First Community has one banking subsidiary, First Community Financial Bank (the “Bank”). The Bank is the result of the consolidation of our four legacy banking subsidiaries and affiliates.
On February 6, 2017, First Community entered into an Agreement and Plan of Merger with First Busey Corporation, a Nevada corporation (“First Busey”), pursuant to which First Community will merge into First Busey, with First Busey as the surviving corporation (the “Merger”). It is anticipated that the Bank will be merged with and into First Busey’s bank subsidiary, Busey Bank, at a date following the completion of the Merger. At the time of the bank merger, the Bank’s banking offices will become branches of Busey Bank. The Merger is anticipated to be completed in mid-2017, and is subject to the satisfaction of customary closing conditions contained in the Agreement and Plan of Merger, including the approval of the appropriate regulatory authorities and the stockholders of First Community.
On July 1, 2016, First Community completed its acquisition of Mazon State Bank through the merger of Mazon State Bank with and into the Bank. In connection with the merger, First Community paid aggregate merger consideration of $8.5 million in cash. For additional information on this merger, see Note 3 to our Consolidated Financial Statements.
As of December 31, 2016, on a consolidated basis, First Community had total assets of $1.3 billion, total deposits of $1.1 billion and total shareholders’ equity of $113.7 million. For the Company’s complete financial information as of December 31, 2016 and 2015 and for each of the three years in the period ended December 31, 2016, see Item 8. Financial Statements and Supplementary Data.
The Bank
The Bank is a full-service community bank principally engaged in the business of commercial, family and personal banking, and offers customers a broad range of loan, deposit, and other financial products and services through nine full-service banking offices located in Cook, DuPage, Grundy, and Will Counties, Illinois.
The Bank’s primary business is making loans and accepting deposits. The Bank also offers customers a variety of financial products and services that are related or ancillary to loans and deposits, including cash management, funds transfers, bill payment and other online banking transactions, automated teller machines, and safe deposit boxes.
The Bank’s primary lending area consists of the counties where its banking offices are located, and contiguous counties in the State of Illinois. The Bank derives the most significant portion of its revenues from these geographic areas.
The Bank originates deposits predominantly from the areas where its banking offices are located. The Bank relies on its favorable locations, customer service, competitive pricing, internet and mobile banking, and related deposit services, such as cash management, to attract and retain deposits. While the Bank accepts certificates of deposit in excess of FDIC deposit insurance limits, the Bank generally does not solicit such deposits because they are more difficult to retain than core deposits and at times are more costly than wholesale deposits.
Lending Activities
At December 31, 2016, $36.7 million, or 3.70% of the total loan portfolio, consisted of multi-family mortgage loans; $426.0 million, or 42.96% of the total loan portfolio, consisted of other commercial real estate loans; $281.8 million, or 28.42% of the total loan portfolio, consisted of commercial and industrial loans; $47.3 million, or 4.77%, of the total loan portfolio, consisted of construction and land development loans; and $176.0 million, or 17.75% of the total loan portfolio, consisted of one-to-four family residential mortgage loans, including home equity loans and lines of credit. In addition, the Bank had farm and agricultural loans totaling $12.6 million, or 1.27%, and consumer and other loans totaling $8.0 million, or 0.80%, of the total portfolio as of December 31, 2016. The Bank’s loan portfolio consists primarily of non-residential real estate loans (owner occupied commercial real estate and investor commercial real estate, multi-family, construction and land development loans), which represented 52.71% of the total loan portfolio, or $522.7 million, at December 31, 2016.
Deposit Activities
The Bank’s deposit accounts consist principally of savings accounts, NOW accounts, checking accounts, money market accounts, certificates of deposit, and individual retirement accounts (“IRAs”) and other qualified plan accounts. The
4
Bank also provides commercial checking accounts and related services such as cash management, as well as provide low-cost checking account services.
At December 31, 2016, the Bank’s deposits totaled $1.1 billion; interest bearing deposits totaled $835.3 million; non-interest bearing demand deposits totaled $247.9 million; savings, money market and NOW account deposits totaled $508.4 million; and certificates of deposit totaled $326.9 million.
Competition
First Community and the Bank face significant competition in both originating loans and attracting deposits. The Chicago metropolitan area has a high concentration of financial institutions, many of which are significantly larger institutions that have greater financial resources than us, and many of which are our competitors to varying degrees. Our competition for loans comes principally from commercial banks, savings banks, mortgage banking companies, the U.S. government, credit unions, leasing companies, insurance companies, FinTech companies, real estate conduits and other companies that provide financial services to businesses and individuals. Our most direct competition for deposits has historically come from commercial banks, savings banks and credit unions. We face additional competition for deposits from Internet-based financial institutions and non-depository competitors such as the mutual fund industry, securities and brokerage firms and insurance companies.
We seek to meet this competition by emphasizing personalized service and efficient decision-making tailored to individual needs. In addition, we reward long-standing relationships with preferred rates and terms on deposit products based on existing and prospective lending business. We do not rely on any individual, group or entity for a material portion of our loans or our deposits.
Employees
At December 31, 2016, First Community and the Bank had 131 full-time employees and 24 part-time employees. The employees are not represented by a collective bargaining unit and we consider our working relationship with our employees to be good.
Internet Website
We maintain a website with the address investors.fcfp.com. The information contained on our website is not included as a part of, or incorporated by reference into, this Annual Report on Form 10-K. Other than an investor’s own Internet access charges, we make available free of charge through our website our Annual Reports on Form 10-K, Quarterly Reports on Form 10-Q and Current Reports on Form 8-K, and amendments to these reports, as soon as reasonably practicable after we have electronically filed such material with, or furnished such material to, the Securities and Exchange Commission (“SEC”).
SUPERVISION AND REGULATION
General
FDIC-insured institutions, their holding companies and their affiliates are extensively regulated under federal and state law. As a result, our growth and earnings performance may be affected not only by management decisions and general economic conditions, but also by the requirements of federal and state statutes and by the regulations and policies of various bank regulatory agencies, including the Illinois Department of Financial and Professional Regulation (the “DFPR”), the Board of Governors of the Federal Reserve System (the “Federal Reserve”), the Federal Deposit Insurance Corporation (the “FDIC”) and the Consumer Financial Protection Bureau (the “CFPB”). Furthermore, taxation laws administered by the Internal Revenue Service and state taxing authorities, accounting rules developed by the Financial Accounting Standards Board, securities laws administered by the SEC and state securities authorities, and anti-money laundering laws enforced by the U.S. Department of the Treasury (“Treasury”) have an impact on the Company’s business. The effect of these statutes, regulations, regulatory policies and accounting rules are significant to the Company’s operations and results.
Federal and state banking laws impose a comprehensive system of supervision, regulation and enforcement on the operations of FDIC-insured institutions, their holding companies and affiliates that is intended primarily for the protection of the FDIC-insured deposits and depositors of banks, rather than shareholders. These laws, and the regulations of the bank regulatory agencies issued under them, affect, among other things, the scope of the Company’s business, the kinds and amounts of investments the Company and the Bank may make, reserve requirements, required capital levels relative to assets, the nature and amount of collateral for loans, the establishment of branches, the Company’s ability to merge, consolidate and acquire, dealings with the Company’s and the Bank’s insiders and affiliates, and the Company’s payment of dividends. In the last several years, the Company has experienced heightened regulatory requirements and scrutiny following the global financial crisis and as a result of the Dodd-Frank Wall Street Reform and Consumer Protection Act (the “Dodd-Frank Act”). Although
5
the reforms primarily targeted systemically important financial service providers, their influence filtered down in varying degrees to community banks over time and the reforms have caused the Company’s compliance and risk management processes, and the costs thereof, to increase. While it is anticipated that the Trump administration will not increase the regulatory burden on community banks and may reduce some of the burdens associated with implementation of the Dodd-Frank Act, the true impact of the new administration is impossible to predict with any certainty.
This supervisory and regulatory framework subjects banks and bank holding companies to regular examination by their respective regulatory agencies, which results in examination reports and ratings that are not publicly available and that can impact the conduct and growth of their business. These examinations consider not only compliance with applicable laws and regulations, but also capital levels, asset quality and risk, management ability and performance, earnings, liquidity, and various other factors. The regulatory agencies generally have broad discretion to impose restrictions and limitations on the operations of a regulated entity where the agencies determine, among other things, that such operations are unsafe or unsound, fail to comply with applicable law or are otherwise inconsistent with laws and regulations or with the supervisory policies of these agencies.
The following is a summary of the material elements of the supervisory and regulatory framework applicable to First Community and the Bank, beginning with a discussion of the continuing regulatory emphasis on the Company’s capital levels. It does not describe all of the statutes, regulations and regulatory policies that apply, nor does it restate all of the requirements of those that are described. The descriptions are qualified in their entirety by reference to the particular statutory and regulatory provision.
Regulatory Emphasis on Capital
Regulatory capital represents the net assets of a banking organization available to absorb losses. Because of the risks attendant to their business, FDIC-insured institutions are generally required to hold more capital than other businesses, which directly affects the Company’s earnings capabilities. While capital has historically been one of the key measures of the financial health of both bank holding companies and banks, its role became fundamentally more important in the wake of the global financial crisis, as the banking regulators recognized that the amount and quality of capital held by banks prior to the crisis was insufficient to absorb losses during periods of severe stress. Certain provisions of the Dodd-Frank Act and Basel III, discussed below, establish strengthened capital standards for banks and bank holding companies that are meaningfully more stringent than those in place previously.
Minimum Required Capital Levels. Banks have been required to hold minimum levels of capital based on guidelines established by the bank regulatory agencies since 1983. The minimums have been expressed in terms of ratios of capital divided by total assets. As discussed below, bank capital measures have become more sophisticated over the years and have focused more on the quality of capital and the risk of assets. Bank holding companies have historically had to comply with less stringent capital standards than their bank subsidiaries and have been able to raise capital with hybrid instruments such as trust preferred securities. The Dodd-Frank Act mandated the Federal Reserve to establish minimum capital levels for holding companies on a consolidated basis as stringent as those required for FDIC-insured institutions.
The Basel International Capital Accords. The risk-based capital guidelines for U.S. banks since 1989 were based upon the 1988 capital accord known as “Basel I” adopted by the international Basel Committee on Banking Supervision, a committee of central banks and bank supervisors that acts as the primary global standard-setter for prudential regulation, as implemented by the U.S. bank regulatory agencies on an interagency basis. The accord recognized that bank assets for the purpose of the capital ratio calculations needed to be risk weighted (the theory being that riskier assets should require more capital) and that off-balance sheet exposures needed to be factored in the calculations. Basel I had a very simple formula for assigning risk weights to bank assets from 0% to 100% based on four categories. In 2008, the banking agencies collaboratively began to phase-in capital standards based on a second capital accord, referred to as “Basel II,” for large or “core” international banks (generally defined for U.S. purposes as having total assets of $250 billion or more, or consolidated foreign exposures of $10 billion or more) known as “advanced approaches” banks. The primary focus of Basel II was on the calculation of risk weights based on complex models developed by each advanced approaches bank. Because most banks were not subject to Basel II, the U.S. bank regulators worked to improve the risk sensitivity of Basel I standards without imposing the complexities of Basel II. This “standardized approach” increased the number of risk-weight categories and recognized risks well above the original 100% risk weighting. The standardized approach is institutionalized by the Dodd-Frank Act for all banking organizations as a floor.
On September 12, 2010, the Group of Governors and Heads of Supervision, the oversight body of the Basel Committee on Banking Supervision, announced agreement on a strengthened set of capital requirements for banking organizations around the world, known as Basel III, to address deficiencies recognized in connection with the global financial crisis.
The Basel III Rule. In July of 2013, the U.S. federal banking agencies approved the implementation of the Basel III regulatory capital reforms in pertinent part, and, at the same time, promulgated rules effecting certain changes required by the
6
Dodd-Frank Act (the “Basel III Rule”). In contrast to capital requirements historically, which were in the form of guidelines, Basel III was released in the form of enforceable regulations by each of the regulatory agencies. The Basel III Rule is applicable to all banking organizations that are subject to minimum capital requirements, including federal and state banks and savings and loan associations, as well as to bank and savings and loan holding companies, other than “small bank holding companies” (generally holding companies with consolidated assets of less than $1 billion that do not have securities registered with the SEC).
The Basel III Rule required higher capital levels, increased the required quality of capital, and required more detailed categories of risk weighting of riskier, more opaque assets. For nearly every class of assets, the Basel III Rule requires a more complex, detailed and calibrated assessment of credit risk and calculation of risk weightings.
Not only did the Basel III Rule increase most of the required minimum capital ratios in effect prior to January 1, 2015, but it introduced the concept of Common Equity Tier 1 Capital, which consists primarily of common stock, related surplus (net of Treasury stock), retained earnings, and Common Equity Tier 1 minority interests subject to certain regulatory adjustments. The Basel III Rule also changed the definition of capital by establishing more stringent criteria that instruments must meet to be considered Additional Tier 1 Capital (primarily non-cumulative perpetual preferred stock that meets certain requirements) and Tier 2 Capital (primarily other types of preferred stock and subordinated debt, subject to limitations). A number of instruments that qualified as Tier 1 Capital under Basel I do not qualify, or their qualifications changed. For example, noncumulative perpetual preferred stock, which qualified as simple Tier 1 Capital under Basel I, does not qualify as Common Equity Tier 1 Capital, but qualifies as Additional Tier 1 Capital. The Basel III Rule also constrained the inclusion of minority interests, mortgage-servicing assets, and deferred tax assets in capital and requires deductions from Common Equity Tier 1 Capital in the event that such assets exceed a certain percentage of a banking institution’s Common Equity Tier 1 Capital.
The Basel III Rule required minimum capital ratios as of January 1, 2015, as follows:
• | A ratio of minimum Common Equity Tier 1 Capital equal to 4.5% of risk-weighted assets; |
• | An increase in the minimum required amount of Tier 1 Capital from 4% to 6% of risk-weighted assets; |
• | A continuation of the minimum required amount of Total Capital (Tier 1 plus Tier 2) at 8% of risk-weighted assets; and |
• | A minimum leverage ratio of Tier 1 Capital to total quarterly average assets equal to 4% in all circumstances. |
In addition, institutions that seek the freedom to make capital distributions (including for dividends and repurchases of stock) and pay discretionary bonuses to executive officers without restriction must also maintain 2.5% in Common Equity Tier 1 Capital attributable to a capital conservation buffer being phased in over three years beginning in 2016 (which, as of January 1, 2017, was phased in half-way to 1.25%). The purpose of the conservation buffer is to ensure that banking institutions maintain a buffer of capital that can be used to absorb losses during periods of financial and economic stress. Factoring in the fully phased-in conservation buffer increases the minimum ratios depicted above to 7% for Common Equity Tier 1 Capital, 8.5% for Tier 1 Capital and 10.5% for Total Capital.
Banking organizations (except for large, internationally active banking organizations) became subject to the new rules on January 1, 2015. However, there are separate phase-in/phase-out periods for: (i) the capital conservation buffer; (ii) regulatory capital adjustments and deductions; (iii) nonqualifying capital instruments; and (iv) changes to the prompt corrective action rules discussed below. The phase-in periods commenced on January 1, 2016 and extend until 2019.
Well-Capitalized Requirements. The ratios described above are minimum standards in order for banking organizations to be considered “adequately capitalized.” Bank regulatory agencies uniformly encourage banks to hold more capital and be “well-capitalized” and, to that end, federal law and regulations provide various incentives for banking organizations to maintain regulatory capital at levels in excess of minimum regulatory requirements. For example, a banking organization that is well-capitalized may: (i) qualify for exemptions from prior notice or application requirements otherwise applicable to certain types of activities; (ii) qualify for expedited processing of other required notices or applications; and (iii) accept, roll-over or renew brokered deposits. Higher capital levels could also be required if warranted by the particular circumstances or risk profiles of individual banking organizations. For example, the Federal Reserve’s capital guidelines contemplate that additional capital may be required to take adequate account of, among other things, interest rate risk, or the risks posed by concentrations of credit, nontraditional activities or securities trading activities. Further, any banking organization experiencing or anticipating significant growth would be expected to maintain capital ratios, including tangible capital positions (i.e., Tier 1 Capital less all intangible assets), well above the minimum levels.
Under the capital regulations of the FDIC and Federal Reserve, in order to be well‑capitalized, a banking organization must maintain:
• | A Common Equity Tier 1 Capital ratio to risk-weighted assets of 6.5% or more; |
• | A ratio of Tier 1 Capital to total risk-weighted assets of 8% or more (6% under Basel I); |
• | A ratio of Total Capital to total risk-weighted assets of 10% or more (the same as Basel I); and |
• | A leverage ratio of Tier 1 Capital to total adjusted average quarterly assets of 5% or greater. |
7
It is possible under the Basel III Rule to be well-capitalized while remaining out of compliance with the capital conservation buffer discussed above.
As of December 31, 2016: (i) the Bank was not subject to a directive from the DFPR or FDIC to increase its capital and (ii) the Bank was well-capitalized, as defined by FDIC regulations. As of December 31, 2016, the Company had regulatory capital in excess of the Federal Reserve’s requirements and met the Basel III Rule requirements to be well-capitalized.
Prompt Corrective Action. An FDIC-insured institution’s capital plays an important role in connection with regulatory enforcement as well. Federal law provides the federal banking regulators with broad power to take prompt corrective action to resolve the problems of undercapitalized institutions. The extent of the regulators’ powers depends on whether the institution in question is “adequately capitalized,” “undercapitalized,” “significantly undercapitalized” or “critically undercapitalized,” in each case as defined by regulation. Depending upon the capital category to which an institution is assigned, the regulators’ corrective powers include: (i) requiring the institution to submit a capital restoration plan; (ii) limiting the institution’s asset growth and restricting its activities; (iii) requiring the institution to issue additional capital stock (including additional voting stock) or to sell itself; (iv) restricting transactions between the institution and its affiliates; (v) restricting the interest rate that the institution may pay on deposits; (vi) ordering a new election of directors of the institution; (vii) requiring that senior executive officers or directors be dismissed; (viii) prohibiting the institution from accepting deposits from correspondent banks; (ix) requiring the institution to divest certain subsidiaries; (x) prohibiting the payment of principal or interest on subordinated debt; and (xi) ultimately, appointing a receiver for the institution.
Regulation and Supervision of First Community
General. The Company, as the sole shareholder of the Bank, is a bank holding company. As a bank holding company, the Company is registered with, and subject to regulation, supervision and enforcement by, the Federal Reserve under the Bank Holding Company Act of 1956, as amended (the “BHCA”). The Company is legally obligated to act as a source of financial and managerial strength to the Bank and to commit resources to support the Bank in circumstances where the Company might not otherwise do so. Under the BHCA, the Company is subject to periodic examination by the Federal Reserve and is required to file with the Federal Reserve periodic reports of the Company’s operations and such additional information regarding the Company and the Bank as the Federal Reserve may require.
Acquisitions, Activities and Change in Control. The primary purpose of a bank holding company is to control and manage banks. The BHCA generally requires the prior approval of the Federal Reserve for any merger involving a bank holding company or any acquisition by a bank holding company of another bank or bank holding company. Subject to certain conditions (including deposit concentration limits established by the BHCA), the Federal Reserve may allow a bank holding company to acquire banks located in any state of the United States. In approving interstate acquisitions, the Federal Reserve is required to give effect to applicable state law limitations on the aggregate amount of deposits that may be held by the acquiring bank holding company and its FDIC-insured institution affiliates in the state in which the target bank is located (provided that those limits do not discriminate against out-of-state institutions or their holding companies) and state laws that require that the target bank have been in existence for a minimum period of time (not to exceed five years) before being acquired by an out-of-state bank holding company. Furthermore, in accordance with the Dodd-Frank Act, bank holding companies must be well-capitalized and examiners must rate them well-managed in order to effect interstate mergers or acquisitions. For a discussion of the capital requirements, see “Regulatory Emphasis on Capital” above.
The BHCA generally prohibits the Company from acquiring direct or indirect ownership or control of more than 5% of the voting shares of any company that is not a bank and from engaging in any business other than that of banking, managing and controlling banks or furnishing services to banks and their subsidiaries. This general prohibition is subject to a number of exceptions. The principal exception allows bank holding companies to engage in, and to own shares of companies engaged in, certain businesses found by the Federal Reserve prior to November 11, 1999 to be “so closely related to banking ... as to be a proper incident thereto.” This authority would permit the Company to engage in a variety of banking-related businesses, including the ownership and operation of a savings association, or any entity engaged in consumer finance, equipment leasing, the operation of a computer service bureau (including software development) and mortgage banking and brokerage services. The BHCA does not place territorial restrictions on the domestic activities of nonbank subsidiaries of bank holding companies.
Additionally, bank holding companies that meet certain eligibility requirements prescribed by the BHCA and elect to operate as financial holding companies may engage in, or own shares in companies engaged in, a wider range of nonbanking activities, including securities and insurance underwriting and sales, merchant banking and any other activity that the Federal Reserve, in consultation with the Secretary of the Treasury, determines by regulation or order is financial in nature or incidental to any such financial activity or that the Federal Reserve determines by order to be complementary to any such financial activity and does not pose a substantial risk to the safety or soundness of FDIC-insured institutions or the financial system generally. The Company has not elected to operate as a financial holding company.
Federal law also prohibits any person or company from acquiring “control” of an FDIC-insured depository institution or its holding company without prior notice to the appropriate federal bank regulator. “Control” is conclusively presumed to
8
exist upon the acquisition of 25% or more of the outstanding voting securities of a bank or bank holding company, but may arise under certain circumstances between 10% and 24.99% ownership.
Capital Requirements. Bank holding companies are required to maintain capital in accordance with Federal Reserve capital adequacy requirements. For a discussion of capital requirements, see “Regulatory Emphasis on Capital” above.
Dividend Payments. Our ability to pay dividends to our shareholders may be affected by both general corporate law considerations and policies of the Federal Reserve applicable to bank holding companies. As an Illinois corporation, we are subject to the Illinois Business Corporation Act, as amended, which prohibits us from paying a dividend if, after giving effect to the dividend: (i) First Community would be insolvent; (ii) the net assets of First Community would be less than zero; or (iii) the net assets of First Community would be less than the maximum amount then payable to shareholders of First Community who would have preferential distribution rights if we were liquidated.
As a general matter, the Federal Reserve has indicated that the board of directors of a bank holding company should eliminate, defer or significantly reduce dividends to shareholders if: (i) the company’s net income available to shareholders for the past four quarters, net of dividends previously paid during that period, is not sufficient to fully fund the dividends; (ii) the prospective rate of earnings retention is inconsistent with the company’s capital needs and overall current and prospective financial condition; or (iii) the company will not meet, or is in danger of not meeting, its minimum regulatory capital adequacy ratios. The Federal Reserve also possesses enforcement powers over bank holding companies and their non-bank subsidiaries to prevent or remedy actions that represent unsafe or unsound practices or violations of applicable statutes and regulations. Among these powers is the ability to proscribe the payment of dividends by banks and bank holding companies. In addition, under the Basel III Rule, institutions that seek the freedom to pay dividends will have to maintain 2.5% in Common Equity Tier 1 Capital attributable to the capital conservation buffer to be phased in over three years beginning in 2016. See “Regulatory Emphasis on Capital” above.
Incentive Compensation. There have been a number of developments in recent years focused on incentive compensation plans sponsored by bank holding companies and banks, reflecting recognition by the bank regulatory agencies and Congress that flawed incentive compensation practices in the financial industry were one of many factors contributing to the global financial crisis. Layered on top of that are the abuses in the headlines dealing with product cross-selling incentive plans. The result is interagency guidance on sound incentive compensation practices and proposed rulemaking by the agencies required under Section 956 of the Dodd-Frank Act.
The interagency guidance recognized three core principles: effective incentive plans should: (i) provide employees incentives that appropriately balance risk and reward; (ii) be compatible with effective controls and risk-management; and (iii) be supported by strong corporate governance, including active and effective oversight by the organization’s board of directors. Much of the guidance addresses large banking organizations and, because of the size and complexity of their operations, the regulators expect those organizations to maintain systematic and formalized policies, procedures, and systems for ensuring that the incentive compensation arrangements for all executive and non-executive employees covered by this guidance are identified and reviewed, and appropriately balance risks and rewards. Smaller banking organizations like the Company that use incentive compensation arrangements are expected to be less extensive, formalized, and detailed than those of the larger banks.
Section 956 of the Dodd-Frank Act required the banking agencies, the National Credit Union Administration, the SEC and the Federal Housing Finance Agency to jointly prescribe regulations that prohibit types of incentive-based compensation that encourage inappropriate risk taking and to disclose certain information regarding such plans. On June 10, 2016, the agencies released an updated proposed rule for comment. Section 956 will only apply to banking organizations with assets of greater than $1 billion. The Company has consolidated assets greater than $1 billion and less than $50 billion and the Company is considered a Level 3 banking organization under the proposed rules. The proposed rules contain mostly general principles and reporting requirements for Level 3 institutions so there are no specific prescriptions or limits, deferral requirements or claw-back mandates. Risk management and controls are required, as is board or committee level approval and oversight. Management expects to review its incentive plans in light of the proposed rulemaking and guidance and implement policies and procedures that mitigate unreasonable risk.
Monetary Policy. The monetary policy of the Federal Reserve has a significant effect on the operating results of financial or bank holding companies and their subsidiaries. Among the tools available to the Federal Reserve to affect the money supply are open market transactions in U.S. government securities, changes in the discount rate on bank borrowings and changes in reserve requirements against bank deposits. These means are used in varying combinations to influence overall growth and distribution of bank loans, investments and deposits, and their use may affect interest rates charged on loans or paid on deposits.
Federal Securities Regulation. Our common stock is registered with the SEC under the Securities Exchange Act of 1934, as amended (the “Exchange Act”). Consequently, we are subject to the information, proxy solicitation, insider trading and other restrictions and requirements of the SEC under the Exchange Act.
9
Corporate Governance. The Dodd-Frank Act addressed many investor protection, corporate governance and executive compensation matters that will affect most U.S. publicly traded companies. It increased stockholder influence over boards of directors by requiring companies to give stockholders a non-binding vote on executive compensation and so-called “golden parachute” payments, and authorizing the SEC to promulgate rules that would allow stockholders to nominate and solicit voters for their own candidates using a company’s proxy materials. The legislation also directed the Federal Reserve to promulgate rules prohibiting excessive compensation paid to executives of bank holding companies, regardless of whether such companies are publicly traded.
Supervision and Regulation of the Bank
General. The Bank is an Illinois-chartered bank. The deposit accounts of the Bank are insured by the FDIC’s Deposit Insurance Fund (“DIF”) to the maximum extent provided under federal law and FDIC regulations, currently $250,000 per insured depositor category. As an Illinois-chartered FDIC-insured bank, the Bank is subject to the examination, supervision, reporting and enforcement requirements of the DFPR, the chartering authority for Illinois banks, and the FDIC, designated by federal law as the primary federal regulator of insured state banks that, like the Bank, are not members of the Federal Reserve System (“nonmember banks”).
Deposit Insurance. As an FDIC-insured institution, the Bank is required to pay deposit insurance premium assessments to the FDIC. The FDIC has adopted a risk-based assessment system whereby FDIC-insured institutions pay insurance premiums at rates based on their risk classification. Effective July 1, 2016, the FDIC changed its pricing system for banks under $10 billion, like the Bank, so that minimum and maximum initial base assessment rates are established based on supervisory ratings. The initial base assessment rates currently range from three basis points to 30 basis points. At least semi-annually, the FDIC updates its loss and income projections for the DIF and, if needed, increases or decreases the assessment rates, following notice and comment on proposed rulemaking. The assessment base against which an FDIC-insured institution’s deposit insurance premiums paid to the DIF are calculated is based on its average consolidated total assets less its average tangible equity. This method shifts the burden of deposit insurance premiums toward those large depository institutions that rely on funding sources other than U.S. deposits.
The reserve ratio is the DIF balance divided by estimated insured deposits. The Dodd-Frank Act altered the minimum reserve ratio of the DIF, increasing the minimum from 1.15% to 1.35% of the estimated amount of total insured deposits, and eliminating the requirement that the FDIC pay dividends to FDIC-insured institutions when the reserve ratio exceeds certain thresholds. The reserve ratio reached 1.15% on June 30, 2016, when revised factors were put in place for calculating the assessment. If the reserve ratio does not reach 1.35% by December 31, 2018 (provided it is at least 1.15%), the FDIC will impose a shortfall assessment on March 31, 2019 on insured depository institutions with total consolidated assets of $10 billion or more. The FDIC will provide assessment credits to insured depository institutions, like the Bank, with total consolidated assets of less than $10 billion for the portion of their regular assessments that contribute to growth in the reserve ratio between 1.15% and 1.35%. The FDIC will apply the credits each quarter that the reserve ratio is at least 1.38% to offset the regular deposit insurance assessments of institutions with credits.
FICO Assessments. In addition to paying basic deposit insurance assessments, FDIC-insured institutions must pay Financing Corporation (“FICO”) assessments. FICO is a mixed-ownership governmental corporation chartered by the former Federal Home Loan Bank Board pursuant to the Competitive Equality Banking Act of 1987 to function as a financing vehicle for the recapitalization of the former Federal Savings and Loan Insurance Corporation. FICO issued 30-year noncallable bonds of approximately $8.1 billion that mature in 2017 through 2019. FICO’s authority to issue bonds ended on December 12, 1991. Since 1996, federal legislation has required that all FDIC-insured institutions pay assessments to cover interest payments on FICO’s outstanding obligations. The FICO assessment rate is adjusted quarterly and for the fourth quarter of 2016 was 0.560 basis points (56 cents per $100 dollars of assessable deposits).
Supervisory Assessments. All Illinois banks are required to pay supervisory assessments to the DFPR to fund the operations of that agency. The amount of the assessment is calculated on the basis of the Bank’s total assets. During the year ended December 31, 2016, the Bank paid supervisory assessments to the DFPR totaling approximately $115,000.
Capital Requirements. Banks are generally required to maintain capital levels in excess of other businesses. For a discussion of capital requirements, see “Regulatory Emphasis on Capital” above.
Liquidity Requirements. Liquidity is a measure of the ability and ease with which bank assets may be converted to cash. Liquid assets are those that can be converted to cash quickly if needed to meet financial obligations. To remain viable, FDIC-insured institutions must have enough liquid assets to meet their near-term obligations, such as withdrawals by depositors. Because the global financial crisis was in part a liquidity crisis, Basel III also includes a liquidity framework that requires FDIC-insured institutions to measure their liquidity against specific liquidity tests. One test, referred to as the Liquidity Coverage Ratio (“LCR”), is designed to ensure that the banking entity has an adequate stock of unencumbered high-quality liquid assets that can be converted easily and immediately in private markets into cash to meet liquidity needs for a 30-calendar day liquidity stress scenario. The other test, known as the Net Stable Funding Ratio (“NSFR”), is designed to promote
10
more medium- and long-term funding of the assets and activities of FDIC-insured institutions over a one-year horizon. These tests provide an incentive for banks and holding companies to increase their holdings in Treasury securities and other sovereign debt as a component of assets, increase the use of long-term debt as a funding source and rely on stable funding like core deposits (in lieu of brokered deposits).
In addition to liquidity guidelines already in place, the federal bank regulatory agencies implemented the Basel III LCR in 2014 and have proposed the NSFR. While the LCR only applies to the largest banking organizations in the country, as will the NSFR, certain elements are expected to filter down to all FDIC-insured institutions. The Company continues to review the Company’s liquidity risk management policies in light of the LCR and NSFR.
Dividend Payments. The primary source of funds for First Community is dividends from the Bank. Under the Illinois Banking Act, the Bank generally may not pay dividends in excess of its net profits. The payment of dividends by any FDIC-insured institution is affected by the requirement to maintain adequate capital pursuant to applicable capital adequacy guidelines and regulations, and an FDIC-insured institution generally is prohibited from paying any dividends if, following payment thereof, the institution would be undercapitalized. As described above, the Bank exceeded its minimum capital requirements under applicable guidelines as of December 31, 2016. Notwithstanding the availability of funds for dividends, however, the FDIC and the DFPR may prohibit the payment of dividends by the Bank if either or both determine such payment would constitute an unsafe or unsound practice. In addition, under the Basel III Rule, institutions that seek the freedom to pay dividends will have to maintain 2.5% in Common Equity Tier 1 Capital attributable to the capital conservation buffer to be phased in over three years beginning in 2016. See “Regulatory Emphasis on Capital” above.
State Bank Investments and Activities. The Bank is permitted to make investments and engage in activities directly or through subsidiaries as authorized by Illinois law. However, under federal law and FDIC regulations, FDIC-insured state banks are prohibited, subject to certain exceptions, from making or retaining equity investments of a type, or in an amount, that are not permissible for a national bank. Federal law and FDIC regulations also prohibit FDIC-insured state banks and their subsidiaries, subject to certain exceptions, from engaging as principal in any activity that is not permitted for a national bank unless the Bank meets, and continues to meet, its minimum regulatory capital requirements and the FDIC determines that the activity would not pose a significant risk to the DIF. These restrictions have not had, and are not currently expected to have, a material impact on the operations of the Bank.
Insider Transactions. The Bank is subject to certain restrictions imposed by federal law on “covered transactions” between the Bank and its “affiliates.” The Company is an affiliate of the Bank for purposes of these restrictions, and covered transactions subject to the restrictions include extensions of credit to the Company, investments in the stock or other securities of the Company and the acceptance of the stock or other securities of the Company as collateral for loans made by the Bank. The Dodd-Frank Act enhanced the requirements for certain transactions with affiliates, including an expansion of the definition of “covered transactions” and an increase in the amount of time for which collateral requirements regarding covered transactions must be maintained.
Certain limitations and reporting requirements are also placed on extensions of credit by the Bank to its directors and officers, to directors and officers of the Company and its subsidiaries, to principal shareholders of the Company and to “related interests” of such directors, officers and principal shareholders. In addition, federal law and regulations may affect the terms upon which any person who is a director or officer of the Company or the Bank, or a principal shareholder of the Company, may obtain credit from banks with which the Bank maintains a correspondent relationship.
Safety and Soundness Standards/Risk Management. The federal banking agencies have adopted guidelines that establish operational and managerial standards to promote the safety and soundness of FDIC-insured institutions. The guidelines set forth standards for internal controls, information systems, internal audit systems, loan documentation, credit underwriting, interest rate exposure, asset growth, compensation, fees and benefits, asset quality and earnings.
In general, the safety and soundness guidelines prescribe the goals to be achieved in each area, and each institution is responsible for establishing its own procedures to achieve those goals. If an institution fails to comply with any of the standards set forth in the guidelines, the FDIC-insured institution’s primary federal regulator may require the institution to submit a plan for achieving and maintaining compliance. If an FDIC-insured institution fails to submit an acceptable compliance plan, or fails in any material respect to implement a compliance plan that has been accepted by its primary federal regulator, the regulator is required to issue an order directing the institution to cure the deficiency. Until the deficiency cited in the regulator’s order is cured, the regulator may restrict the FDIC-insured institution’s rate of growth, require the FDIC-insured institution to increase its capital, restrict the rates the institution pays on deposits or require the institution to take any action the regulator deems appropriate under the circumstances. Noncompliance with the standards established by the safety and soundness guidelines may also constitute grounds for other enforcement action by the federal bank regulatory agencies, including cease and desist orders and civil money penalty assessments.
During the past decade, the bank regulatory agencies have increasingly emphasized the importance of sound risk management processes and strong internal controls when evaluating the activities of the FDIC-insured institutions they
11
supervise. Properly managing risks has been identified as critical to the conduct of safe and sound banking activities and has become even more important as new technologies, product innovation, and the size and speed of financial transactions have changed the nature of banking markets. The agencies have identified a spectrum of risks facing a banking institution including, but not limited to, credit, market, liquidity, operational, legal, and reputational risk. In particular, recent regulatory pronouncements have focused on operational risk, which arises from the potential that inadequate information systems, operational problems, breaches in internal controls, fraud, or unforeseen catastrophes will result in unexpected losses. New products and services, third-party risk and cybersecurity are critical sources of operational risk that FDIC-insured institutions are expected to address in the current environment. The Bank is expected to have active board and senior management oversight; adequate policies, procedures, and limits; adequate risk measurement, monitoring, and management information systems; and comprehensive internal controls.
Branching Authority. Illinois banks, such as the Bank, have the authority under Illinois law to establish branches anywhere in the State of Illinois, subject to receipt of all required regulatory approvals. Federal law permits state and national banks to merge with banks in other states subject to: (i) regulatory approval; (ii) federal and state deposit concentration limits; and (iii) state law limitations requiring the merging bank to have been in existence for a minimum period of time (not to exceed five years) prior to the merger. The Dodd-Frank Act permits well-capitalized and well-managed banks to establish new interstate branches or acquire individual branches of a bank in another state (rather than the acquisition of an out-of-state bank in its entirety) without impediments.
Transaction Account Reserves. Federal Reserve regulations require FDIC-insured institutions to maintain reserves against their transaction accounts (primarily NOW and regular checking accounts). For 2017: the first $15.5 million of otherwise reservable balances are exempt from reserves and have a zero percent reserve requirement; for transaction accounts aggregating more than $15.5 million to $115.1 million, the reserve requirement is 3% of total transaction accounts; and for net transaction accounts in excess of $115.1 million, the reserve requirement is 3% up to $115.1 million plus 10% of the aggregate amount of total transaction accounts in excess of $115.1 million. These reserve requirements are subject to annual adjustment by the Federal Reserve.
Federal Home Loan Bank System. The Bank is a member of the Federal Home Loan Bank of Chicago (the “FHLB”), which serves as a central credit facility for its members. The FHLB is funded primarily from proceeds from the sale of obligations of the FHLB system. It makes loans to member banks in the form of FHLB advances. All advances from the FHLB are required to be fully collateralized as determined by the FHLB.
Community Reinvestment Act Requirements. The Community Reinvestment Act requires the Bank to have a continuing and affirmative obligation in a safe and sound manner to help meet the credit needs of its entire community, including low- and moderate-income neighborhoods. Federal regulators regularly assess the Bank’s record of meeting the credit needs of its communities. Applications for additional acquisitions would be affected by the evaluation of the Bank’s effectiveness in meeting its Community Reinvestment Act requirements.
Anti-Money Laundering. The Uniting and Strengthening America by Providing Appropriate Tools Required to Intercept and Obstruct Terrorism Act of 2001 (the “Patriot Act”) is designed to deny terrorists and criminals the ability to obtain access to the U.S. financial system and has significant implications for FDIC-insured institutions, brokers, dealers and other businesses involved in the transfer of money. The Patriot Act mandates financial services companies to have policies and procedures with respect to measures designed to address any or all of the following matters: (i) customer identification programs; (ii) money laundering; (iii) terrorist financing; (iv) identifying and reporting suspicious activities and currency transactions; (v) currency crimes; and (vi) cooperation between FDIC-insured institutions and law enforcement authorities.
Concentrations in Commercial Real Estate. Concentration risk exists when FDIC-insured institutions deploy too many assets to any one industry or segment. A concentration in commercial real estate is one example of regulatory concern. The interagency Concentrations in Commercial Real Estate Lending, Sound Risk Management Practices guidance (“CRE Guidance”) provides supervisory criteria, including the following numerical indicators, to assist bank examiners in identifying banks with potentially significant commercial real estate loan concentrations that may warrant greater supervisory scrutiny: (i) commercial real estate loans exceeding 300% of capital and increasing 50% or more in the preceding three years; or (ii) construction and land development loans exceeding 100% of capital. The CRE Guidance does not limit banks’ levels of commercial real estate lending activities, but rather guides institutions in developing risk management practices and levels of capital that are commensurate with the level and nature of their commercial real estate concentrations. On December 18, 2015, the federal banking agencies issued a statement to reinforce prudent risk-management practices related to CRE lending, having observed substantial growth in many CRE asset and lending markets, increased competitive pressures, rising CRE concentrations in banks, and an easing of CRE underwriting standards. The federal bank agencies reminded FDIC-insured institutions to maintain underwriting discipline and exercise prudent risk-management practices to identify, measure, monitor, and manage the risks arising from CRE lending. In addition, FDIC-insured institutions must maintain capital commensurate with the level and nature of their CRE concentration risk.
12
Based on the Bank’s loan portfolio as of December 31, 2016, it did not exceed the 300% guideline for commercial real estate loans.
Consumer Financial Services. The historical structure of federal consumer protection regulation applicable to all providers of consumer financial products and services changed significantly on July 21, 2011, when the CFPB commenced operations to supervise and enforce consumer protection laws. The CFPB has broad rulemaking authority for a wide range of consumer protection laws that apply to all providers of consumer products and services, including the Bank, as well as the authority to prohibit “unfair, deceptive or abusive” acts and practices. The CFPB has examination and enforcement authority over providers with more than $10 billion in assets. FDIC-insured institutions with $10 billion or less in assets, like the Bank, continue to be examined by their applicable bank regulators.
Because abuses in connection with residential mortgages were a significant factor contributing to the global financial crisis, many new rules issued by the CFPB and required by the Dodd-Frank Act address mortgage and mortgage-related products, their underwriting, origination, servicing and sales. The Dodd-Frank Act significantly expanded underwriting requirements applicable to loans secured by 1-4 family residential real property and augmented federal law combating predatory lending practices. In addition to numerous disclosure requirements, the Dodd-Frank Act imposed new standards for mortgage loan originations on all lenders, including all FDIC-insured institutions, in an effort to strongly encourage lenders to verify a borrower’s “ability to repay,” while also establishing a presumption of compliance for certain “qualified mortgages.” In addition, the Dodd-Frank Act generally required lenders or securitizers to retain an economic interest in the credit risk relating to loans that the lender sells, and other asset-backed securities that the securitizer issues, if the loans have not complied with the ability-to-repay standards. We do not currently expect the CFPB’s rules to have a significant impact on our operations, except for higher compliance costs.
13
Item 1A. Risk Factors
RISK FACTORS
Various risks and uncertainties, some of which are difficult to predict and beyond First Community’s control, could negatively impact First Community or the Bank. As financial institutions, First Community and the Bank are exposed to interest rate risk, liquidity risk, credit risk, operational risk, risks from economic or market conditions, and general business risks among others. Adverse experience with these or other risks could have a material impact on the financial condition and results of operations of First Community or the Bank, as well as the value of First Community common stock.
The Agreement and Plan of Merger May Be Terminated in Accordance with Its Terms and the Merger May Not Be Completed.
The Agreement and Plan on Merger is subject to a number of conditions which must be fulfilled in order to complete the Merger. Those conditions include: approval of the Agreement and Plan on Merger and the transactions it contemplates by First Community stockholders, receipt of certain requisite regulatory approvals, absence of orders prohibiting completion of the Merger, effectiveness of the registration statement of which this proxy statement/prospectus is a part, approval of the issuance of First Busey common stock, as applicable, for listing on the NASDAQ Global Select Market, the accuracy of the representations and warranties by both parties (subject to the materiality standards set forth in the Agreement and Plan on Merger) and the performance by both parties of their covenants and agreements, and the receipt by both parties of legal opinions from their respective tax counsels. These conditions to the closing of the Merger may not be fulfilled in a timely manner or at all, and, accordingly, the Merger may not be completed. In addition, the parties can mutually decide to terminate the Agreement and Plan on Merger at any time, before or after stockholder approval, or First Busey or First Community may elect to terminate the Agreement and Plan on Merger in certain other circumstances.
Termination of the Agreement and Plan of Merger Could Negatively Impact First Community.
If the Merger is not completed for any reason, including as a result of First Community stockholders declining to approve the Agreement and Plan on Merger, the ongoing business of First Community may be adversely impacted and, without realizing any of the anticipated benefits of completing the Merger, First Community would be subject to a number of risks, including the following:
• | First Community may experience negative reactions from the financial markets, including negative impacts on its stock price (including to the extent that the current market price reflects a market assumption that the Merger will be completed); |
• | First Community may experience negative reactions from its customers, vendors and employees; |
• | First Community will have incurred substantial expenses and will be required to pay certain costs relating to the Merger, whether or not the Merger is completed; |
• | the Agreement and Plan on Merger places certain restrictions on the conduct of First Community’s businesses prior to completion of the Merger. Such restrictions, the waiver of which is subject to the consent of First Busey (not to be unreasonably withheld, conditioned or delayed), may prevent First Community from making certain acquisitions or taking certain other specified actions during the pendency of the Merger; and |
• | matters relating to the Merger (including integration planning) will require substantial commitments of time and resources by First Community management, which would otherwise have been devoted to other opportunities that may have been beneficial to First Community as an independent company. |
If the Agreement and Plan on Merger is terminated and First Community’s board of directors seeks another Merger or business combination, First Community stockholders cannot be certain that First Community will be able to find a party willing to offer equivalent or more attractive consideration than the consideration First Busey has agreed to provide in the Merger, or that such other Merger or business combination will be completed. If the Agreement and Plan on Merger is terminated under certain circumstances, First Community may be required to pay a termination fee of $9.0 million to First Busey.
First Community Will Be Subject to Business Uncertainties and Contractual Restrictions While the Merger Is Pending.
Uncertainty about the effect of the Merger on employees and customers may have an adverse effect on First Community and, consequently, on First Busey. These uncertainties may impair First Community’s ability to attract, retain and motivate key personnel until the Merger is completed, and could cause customers and others that deal with First Community to
14
seek to change existing business relationships with First Community. Retention of certain employees may be challenging during the pendency of the Merger, as certain employees may experience uncertainty about their future roles. If key employees depart because of issues relating to the uncertainty and difficulty of integration or a desire not to remain with the business, First Busey’s business following the Merger could be negatively impacted. In addition, the Agreement and Plan on Merger restricts First Community from making certain transactions and taking other specified actions without the consent of First Busey until the Merger occurs. These restrictions may prevent First Community from pursuing attractive business opportunities that may arise prior to the completion of the Merger.
The Agreement and Plan of Merger Contains Provisions that May Discourage Other Companies from Trying to Acquire First Community for Greater Merger Consideration.
The Agreement and Plan on Merger contains provisions that may discourage a third party from submitting a business combination proposal to First Community that might result in greater value to First Community’s stockholders than the proposed Merger with First Busey or may result in a potential competing acquirer proposing to pay a lower per share price to acquire First Community than it might otherwise have proposed to pay absent such provisions. These provisions include a general prohibition on First Community from soliciting, or, subject to certain exceptions relating to the exercise of fiduciary duties by First Community’s board of directors, entering into discussions with any third party regarding any acquisition proposal or offers for competing transactions. First Community also has an unqualified obligation to submit the proposal to approve the Merger to a vote by its stockholders, even if First Community receives an alternative acquisition proposal that its board of directors believes is superior to the Merger, unless the Agreement and Plan on Merger has been terminated in accordance with its terms. In addition, First Community may be required to pay First Busey a termination fee of $9.0 million upon termination of the Agreement and Plan on Merger in certain circumstances involving acquisition proposals for competing transactions.
Our business may be adversely affected by the highly regulated environment in which we operate.
The Company and the Bank are subject to extensive federal and state regulation, supervision and examination. Banking regulations are primarily intended to protect depositors’ funds, FDIC funds, customers and the banking system as a whole, rather than stockholders. These regulations affect the Company’s lending practices, capital structure, investment practices, dividend policy and growth, among other things.
As a bank holding company, we are subject to regulation and supervision primarily by the Federal Reserve. The Bank, as an Illinois-chartered bank, is subject to regulation and supervision by both the IDFPR and the FDIC. We and the Bank undergo periodic examinations by these regulators, which have extensive discretion and authority to prevent or remedy unsafe or unsound practices or violations of law by banks and bank holding companies.
The primary federal and state banking laws and regulations that affect us are described in Item 1. Business under the section captioned “Supervision and Regulation.” These laws, regulations, rules, standards, policies and interpretations are constantly evolving and may change significantly over time. For example, the Dodd-Frank Act was signed into law, which significantly changed the regulation of financial institutions and the financial services industry. In addition, the Federal Reserve has adopted numerous new regulations addressing banks’ overdraft and mortgage lending practices. Further, the BASEL III regulatory capital reforms increased both the amount and quality of capital that financial institutions must hold.
Such changes, including changes regarding interpretations and implementation, could affect the Company in substantial and unpredictable ways and could have a material adverse effect on the Company’s business, financial condition and results of operations. Further, such changes could subject the Company to additional costs, limit the types of financial services and products the Company may offer, and/or increase the ability of non-banks to offer competing financial services and products, among other things. Failure to comply with applicable laws, regulations or policies could result in sanctions by regulatory agencies, civil monetary penalties, and/or damage to the Company’s reputation, which could have a material adverse effect on the Company’s business, financial condition and results of operations.
The financial services industry, as well as the broader economy, may be subject to new legislation, regulation, and government policy.
At this time, it is difficult to predict the legislative and regulatory changes that will result from the combination of a new President of the United States and the first year since 2010 in which both Houses of Congress and the White House have majority memberships from the same political party. Recently, however, both the new President and senior members of the House of Representatives have advocated for significant reduction of financial services regulation, to include amendments to the Dodd-Frank Act and structural changes to the CFPB. The new Administration and Congress also may cause broader economic changes due to changes in governing ideology and governing style. New appointments to the Board of Governors of the Federal Reserve
15
could affect monetary policy and interest rates, and changes in fiscal policy could affect broader patterns of trade and economic growth. Future legislation, regulation, and government policy could affect the banking industry as a whole, including our business and results of operations, in ways that are difficult to predict. In addition, our results of operations also could be adversely affected by changes in the way in which existing statutes and regulations are interpreted or applied by courts and government agencies.
Competition from financial institutions and other financial services providers may adversely affect our growth and profitability and have a material adverse effect on us.
We operate in a highly competitive industry and experience intense competition from other financial institutions in our markets. We compete with these institutions in making loans, attracting deposits and recruiting and retaining talented people. We also compete with non-bank financial service providers, including mortgage companies, finance companies, online lenders, mutual funds and credit unions. Many of these competitors are not subject to the same regulatory restrictions that we are and may be able to compete more effectively as a result. We have observed that the competition in our market for making commercial loans has resulted in more competitive pricing and credit structure, as well as intense competition for qualified commercial lending officers. We also may face a competitive disadvantage as a result of our smaller size, limited branch network, narrower product offerings and lack of geographic diversification as compared to some of our larger competitors. Although our competitive strategy is to provide a distinctly superior customer and employee experience, this strategy could be unsuccessful. Our growth and profitability depend on our continued ability to compete effectively within our market area and our inability to do so could have a material adverse effect on us.
Our business is subject to the conditions of the local economy in which we operate and weakness in the local economy and the real estate markets may materially and adversely affect us.
Our success is dependent to a large extent upon the general economic conditions in the Illinois and Chicago area where the Bank provides banking and financial services. Accordingly, the local economic conditions in Chicago have a significant impact on the demand for our products and services as well as the ability of our customers to repay loans, the value of the collateral securing loans and the stability of our deposit funding sources.
The Company’s financial performance generally, and in particular the ability of customers to pay interest on and repay principal of outstanding loans and the value of collateral securing those loans, as well as demand for loans and other products and services the Company offers, is highly dependent upon the business environment in the markets where the Company operates, in the state of Illinois generally and in the United States as a whole. A favorable business environment is generally characterized by, among other factors: economic growth; efficient capital markets; low inflation; low unemployment; high business and investor confidence; and strong business earnings. Unfavorable or uncertain economic and market conditions can be caused by: declines in economic growth, business activity or investor or business confidence; limitations on the availability or increases in the cost of credit and capital; increases in inflation or interest rates; high unemployment; natural disasters; or a combination of these or other factors.
The financial condition of the State of Illinois, in which the largest portion of the Company’s customer base resides, is among the most troubled of any state in the United States with credit downgrade concerns, severe pension under-funding, budget deficits and political standoffs. State budget restructuring to improve its financial condition may have negative financial effects on local governments and businesses, their employees, and directly and indirectly the Company’s customers. Conversely, a lack of state budget restructuring to achieve budget balance and growing debt burden may also have negative financial effects on local governments and businesses, their employees, and directly and indirectly the Company’s customers.
The preparation of our consolidated financial statements requires us to make estimates and judgments, which are subject to an inherent degree of uncertainty and which may differ from actual results.
Our consolidated financial statements are prepared in accordance with U.S. generally accepted accounting principles and general reporting practices within the financial services industry, which require us to make estimates and judgments that affect the reported amounts of assets, liabilities, revenues and expenses and related disclosure of contingent assets and liabilities. Some accounting policies, such as those pertaining to our allowance for loan and lease losses and deferred tax assets and the necessity of any related valuation allowance, require the application of significant judgment by management in selecting the appropriate assumptions for calculating financial estimates. By their nature, these estimates and judgments are subject to an inherent degree of uncertainty and actual results may differ from these estimates and judgments under different assumptions or conditions, which may have a material adverse effect on our financial condition or results of operations in subsequent periods.
Our allowance for loan and lease losses may prove to be insufficient to absorb losses in our loan portfolio, which could have a material adverse effect on us.
Making loans is a substantial part of our business, and every loan we make is subject to the risk that it will not be repaid or that any underlying collateral in the case of secured loans will not be sufficient to assure full repayment. Among other things, the risk of non-payment is affected by:
16
Ÿ | changes in economic, market and industry conditions, | ||
Ÿ | the credit risks associated with the particular borrower and type of loan, | ||
Ÿ | cash flow of the borrower and/or the project being financed, | ||
Ÿ | the duration of the loan, and | ||
Ÿ | opportunities to identify potential loan repayment issues when remedial action may be most effective. | ||
We maintain an allowance for loan and lease losses, which is an accounting reserve established through a provision for loan losses charged to expense, which we believe is adequate to provide for probable losses inherent in our loan portfolio as of the corresponding balance sheet date. The determination of the appropriate level of the allowance for loan and lease losses involves a high degree of subjectivity and requires us to make significant estimates of current credit risks and future trends, all of which are subject to material changes. Deterioration in or stagnation of economic conditions affecting borrowers, new information regarding existing loans and any underlying collateral, identification of additional problem loans and other factors, both within and outside of our control, may require an increase in our allowance for loan and lease losses.
In addition, our federal and state regulators periodically review our allowance for loan and lease losses and, based on judgments that differ from those of our management, may require an increase in our provision for loan losses or the recognition of further loan charge-offs. Further, if loan charge-offs in future periods exceed our allowance for loan and lease losses, we will need additional provisions to increase the allowance. Any increases in our allowance for loan and lease losses will result in a decrease in net income, and possibly capital, and may have a material adverse effect on us.
We are subject to interest rate risk, including interest rate fluctuations, that could have a material adverse effect on us.
Our earnings and cash flows are largely dependent upon our net interest income. Net interest income is the difference between interest income earned on interest-earning assets such as loans and securities and interest expense paid on interest-bearing liabilities such as deposits and borrowed funds. Interest rates are highly sensitive to many factors that are beyond the Company’s control, including general economic conditions and policies of various governmental and regulatory agencies and, in particular, the Open Market Committee of the Federal Reserve.
Changes in monetary policy, including changes in interest rates, could influence not only the interest we receive on loans and securities and the amount of interest we pay on deposits and borrowings, but such changes could also affect:
Ÿ | the Company’s ability to originate loans and obtain deposits, | ||
Ÿ | the fair value of the Company’s financial assets and liabilities, and | ||
Ÿ | the average duration of the Company’s securities portfolio. | ||
If the interest rates paid on deposits and other borrowings increase at a faster rate than the interest rates received on loans and other investments, the Company’s net interest income, and therefore, earnings and cash flows, could be adversely affected. Earnings and cash flows could also be adversely affected if the interest rates received on loans and other investments fall more quickly than the interest rates paid on deposits and other borrowings.
Although management believes it has implemented effective asset and liability management strategies, to reduce the potential effects of changes in interest rates on the Company’s results of operations, if these strategies prove ineffective, or if any substantial, unexpected and prolonged change in market interest rates occurs, such events could have a material adverse effect on us.
We have counterparty risk and therefore we may be materially and adversely affected by the soundness of other financial institutions.
Our ability to engage in routine funding and other transactions could be materially and negatively affected by the actions and the soundness of other financial institutions. Financial services institutions are generally interrelated as a result of trading, clearing, counterparty, credit or other relationships. We have exposure to many different industries and counterparties and regularly engage in transactions with counterparties in the financial services industry, including commercial banks, brokers and dealers, investment banks and other institutional customers. Many of these transactions may expose us to credit or other risks if another financial institution experiences adverse circumstances. In certain circumstances, the collateral that we hold may be insufficient to fully cover the risk that a counterparty defaults on its obligations, which may cause us to experience losses that could have a material adverse affect on us.
17
We are subject to certain operational risks, including, but not limited to, data processing system failures and errors and customer or employee fraud. First Community’s controls and procedures may fail or be circumvented.
There have been a number of highly publicized cases involving fraud or other misconduct by employees of financial services firms in recent years. Misconduct by our employees could include hiding unauthorized activities from us, improper or unauthorized activities on behalf of our customers or improper use of confidential information. Employee fraud, errors and employee and customer misconduct could subject us to financial losses or regulatory sanctions and seriously harm our reputation. It is not always possible to prevent employee errors and misconduct, and the precautions we take to prevent and detect this activity may not be effective in all cases. Employee errors could also subject us to civil claims for negligence.
We maintain a system of internal controls and procedures designed to reduce the risk of loss from employee or customer fraud or misconduct, employee errors and operational risks, including data processing system failures and errors and customer or employee fraud. Any system of controls, however well designed and operated, is based in part on certain assumptions and can provide only reasonable, not absolute, assurances that the objectives of the system are met. Any failure or circumvention of the Company’s controls and procedures or failure to comply with regulations related to controls and procedures could have a material adverse effect on us.
We are dependent upon outside third parties for the processing and handling of our records and data.
We rely on software developed by third party vendors to process various Company transactions. In some cases, we have contracted with third parties to run their proprietary software on behalf of the Company. These systems include, but are not limited to, general ledger, payroll, employee benefits, loan and deposit processing, and securities portfolio management. While the Company performs a review of controls instituted by the applicable vendor over these programs in accordance with industry standards and performs its own testing of user controls, we must rely on the continued maintenance of controls by these third party vendors, including safeguards over the security of customer data. In addition, the Company maintains, or contracts with third parties to maintain, backups of key processing output daily in the event of a failure on the part of any of these systems. Nonetheless, we may incur a temporary disruption in our ability to conduct our business or process our transactions, or incur damage to our reputation, if the third party vendor fails to adequately maintain internal controls or institute necessary changes to systems. Such disruption or a breach of security may have a material adverse effect on us.
System failure or breaches of our network security, including with respect to our Internet banking activities, could subject us to increased operating costs as well as litigation and other liabilities.
The computer systems and network infrastructure we use in our operations and Internet banking activities could be vulnerable to unforeseen problems. Our operations are dependent upon our ability to protect our computer equipment against damage from physical theft, fire, power loss, telecommunications failure or a similar catastrophic event, as well as from security breaches, denial of service attacks, viruses, worms and other disruptive problems caused by hackers. Computer break-ins, “phishing” and other disruptions could also jeopardize the security of information stored in and transmitted through our computer systems and network infrastructure, as well as that of our customers engaging in Internet banking activities. In addition, advances in computer capabilities or other developments could result in a compromise or breach of our systems designed to protect customer data.
These risks have increased for all financial institutions as new technologies, the use of the Internet and telecommunications technologies (including mobile devices) to conduct financial and other business transactions and the sophistication and activities of organized crime, perpetrators of fraud, hackers, terrorists and others, have all increased. In addition to cyber-attacks or other security breaches involving the theft of sensitive and confidential information, hackers recently have engaged in attacks against large financial institutions, retailers and government agencies, particularly denial of service attacks, that are designed to disrupt key business or government services, such as customer-facing web sites.
The Company also faces risks related to cyber-attacks and other security breaches in connection with credit card and debit card transactions that typically involve the transmission of sensitive information regarding the Company’s customers through various third parties, including merchant acquiring banks, payment processors, payment card networks and its processors. Some of these parties have in the past been the target of security breaches and cyber-attacks, and because the transactions involve third parties and environments such as the point of sale that the Company does not control or secure, future security breaches or cyber-attacks affecting any of these third parties could impact the Company through no fault of its own, and in some cases it may have exposure and suffer losses for breaches or attacks relating to them. Further cyber-attacks or other breaches in the future, whether affecting the Company or others, could intensify consumer concern and regulatory focus and result in reduced use of payment cards and increased costs, all of which could have a material adverse effect on the Company’s business. To the extent we are involved in any future cyber-attacks or other breaches, the Company’s reputation could be affected, would could also have a material adverse effect on the Company’s business, financial condition or results of operations.
18
Although we have procedures in place to prevent or limit the effects of any of these potential problems and intend to continue to implement security technology and establish operational procedures to mitigate the risk of such occurrences, these measures could be unsuccessful. Any interruption in, or breach in security of, our computer systems and network infrastructure, or that of our Internet banking customers, could damage our reputation, result in a loss of customer business, subject us to additional regulatory scrutiny, or expose us to civil litigation and possible financial liability, any of which could have a material adverse effect on us.
We are subject to lending concentration risks.
As of December 31, 2016, 76.15% of the Bank’s loan portfolio consisted of commercial loans, of which approximately 47.73% were commercial real estate loans. Our commercial loans are typically larger in amount than loans to individual consumers and, therefore, have the potential for higher losses on an individual loan basis. Credit quality issues on larger commercial loans, if they were to occur, could cause greater volatility in reported credit quality performance measures, such as total impaired or non-performing loans, and the amount of charge-offs and recoveries between periods. The deterioration of any one or a few of these loans may cause a significant increase in uncollectible loans, which would have a material adverse impact on us. In such case, we may not be able to realize the amount of security that we anticipated at the time of originating the loan, which could cause us to increase our provision for loan losses and materially and adversely affect our operating results, financial condition or capital levels.
The Company is a bank holding company and its sources of funds are limited.
The Company is a bank holding company, and its operations are primarily conducted by the Bank, which is subject to significant federal and state regulation. The Company’s ability to receive dividends or loans from the Bank is restricted and therefore the ability to pay dividends to shareholders is restricted. Until June 30, 2015, the Bank was unable to pay dividends due to negative retained earnings. Dividend payments by the Bank to the Company in the future, if any, will require generation of future earnings by the Bank and could require regulatory approval if any proposed dividends are in excess of prescribed guidelines. Further, as a structural matter, the Company’s right to participate in the assets of the Bank in the event of a liquidation or reorganization of the Bank would be subject to the claims of the Bank’s creditors, including depositors, which would take priority except to the extent the Company may be a creditor with a recognized claim. As of December 31, 2016, the Bank had deposits and other liabilities of approximately $1.2 billion.
We may not be able to access sufficient and cost-effective sources of liquidity.
Liquidity is essential to our business and drives our ability to make new loans or invest in securities. In addition, the Company requires liquidity to meet its deposit and debt obligations as they come due. Our access to funding sources in amounts adequate to finance our activities or on terms that are acceptable to us could be impaired by factors that affect us specifically or the financial services industry or the economy generally. Factors that could reduce our access to liquidity sources include a downturn in the Chicago area market, difficult credit markets or adverse regulatory actions against us.
As part of our liquidity management, we use a number of funding sources in addition to what is provided by in-market deposit and repayments and maturities of loans and investments. Although we have recently increased our funding from our core customers to reduce our reliance on wholesale funding, we continue to use brokered money market accounts and certificates of deposits, out-of-local-market certificates of deposit, broker/dealer repurchase agreements, federal funds purchased and FHLB and Federal Reserve Bank advances as a source of liquidity.
Our liquidity position is affected by the amount of cash and other liquid assets on hand, payment of interest and dividends on our outstanding debt and equity instruments, capital we inject into the Bank, redemption of our previously issued debt, proceeds we raise through the issuance of debt and equity instruments, and dividends received from the Bank. Our future liquidity position may be materially adversely affected if, in the future, one or a combination of the following events occur:
Ÿ | the Bank reports net losses or its earnings are weak relative to our cash flow needs as a holding company, | ||
Ÿ | we deem it advisable or are required by our regulators to use cash at the holding company level to support loan growth of the Bank or address other capital needs of the Bank through downstream capital injections, or | ||
Ÿ | we have difficulty raising cash at the holding company level through the issuance of debt or equity securities or accessing additional sources of credit. | ||
Our usual liquidity management challenges include responding to potential volatility in our customers’ deposit balances. We primarily use advances from the FHLB, broker/dealer repurchase agreements and federal funds purchased to meet our immediate liquidity needs. We maintain stable client deposits, which allows us to not heavily rely on wholesale funding sources. However, our client deposits may not remain at current levels and we may not be able to maintain the recent reduced reliance on wholesale deposits. Increased customer confidence in general economic conditions, higher expected rates of return
19
on other investments (including a rise in interest rates) or additional restrictions on the availability of FDIC coverage could each cause our customers to move all or a portion of their deposits to other investment options, thus causing a reduction in our deposits and increasing our reliance on wholesale or other funding sources.
Given the losses recorded by our legacy bank subsidiaries and affiliates from 2008 through 2011, the negative retained earnings at the Bank until June 30, 2015, and the resulting limitations on the ability of the Bank to pay dividends to First Community, we have historically been dependent upon our current cash position and cash proceeds generated by capital raises to meet liquidity needs at the holding company level. If we foresee that we face diminished liquidity, we may, to the extent possible, seek to issue additional debt or securities which could cause ownership or economic dilution to our current shareholders.
Changes in our credit ratings could increase our financing costs or make it more difficult for us to obtain funding or capital on commercially acceptable terms.
We are rated by several different rating agencies, including International Data Corporation and Bankrate.com. Many factors, both within and out of our control, may cause these agencies to downgrade their ratings related to the Company, which could subject us to negative publicity, adversely impact our ability to acquire or retain deposits and increase our cost of borrowing or limit our asset growth. Also, our credit ratings are an important factor to the institutions that provide our sources of liquidity, and reductions in our credit ratings could adversely affect our liquidity, increase our borrowing costs, limit our access to the capital markets or trigger unfavorable contractual obligations.
Our business strategy is dependent on our continued ability to attract, develop and retain highly qualified and experienced personnel in senior management and customer relationship positions.
We believe our future success is dependent, in part, on our ability to attract and retain highly qualified and experienced personnel in key senior management and other positions. Our competitive strategy is to provide each of our commercial customers with a highly qualified relationship manager that will serve as the customer’s key point of contact with us. Achieving the status of a “trusted advisor” for our customers also requires that we minimize relationship manager turnover and provide stability to our customer relationships. Competition for experienced personnel in our industry is intense, and we may not be able to successfully attract and retain such personnel.
Our reputation could be damaged by negative publicity.
Reputational risk, or the risk to us from negative publicity, is inherent in our business. Negative publicity can result from actual or alleged conduct in a number of areas, including legal and regulatory compliance, lending practices, corporate governance, litigation, inadequate protection of customer data, ethical behavior of our employees, and from actions taken by regulators, ratings agencies and others as a result of that conduct. Damage to our reputation could impact our ability to attract new or maintain existing loan and deposit customers, employees and business relationships.
New lines of business or new products and services may subject us to certain additional risks.
From time to time, we will consider and may enter into new lines of business or offer new products or services. These activities can involve a number of uncertainties, risks and expenses, including the investment of significant time and resources, and our projected price and profitability targets may not be attainable or our efforts may not be successful. These initiatives have required and will continue to require us to enter geographical markets that are new to us. In addition, new lines of business and new products and services could significantly impact the effectiveness of our system of internal controls, and present requirements for legal compliance with which we were previously unfamiliar. Failure to successfully manage these risks could have a material adverse affect on us.
Consumers and businesses are increasingly using non-banks to complete their financial transactions, which could adversely affect our business and results of operations.
Technology and other changes are allowing consumers and businesses to complete financial transactions that historically have involved banks through alternative methods. For example, the wide acceptance of Internet-based commerce has resulted in a number of alternative payment processing systems and lending platforms in which banks play only minor roles. Customers can now maintain funds in prepaid debit cards or digital currencies, and pay bills and transfer funds directly without the direct assistance of banks. The diminishing role of banks as financial intermediaries has resulted and could continue to result in the loss of fee income, as well as the loss of customer deposits and the related income generated from those deposits. The loss of these revenue streams and the potential loss of lower cost deposits as a source of funds could have a material adverse effect on our business, financial condition and results of operations.
We may experience difficulties in managing our growth.
20
Our future success, in part, depends on our achieving growth in commercial banking relationships that results in increased commercial loans at yields that are profitable to us. Achieving our growth targets requires us to attract customers who currently bank at other financial institutions in our market, thereby increasing our share of the market. Although we believe that we have the necessary resources in place to successfully manage our future growth, our growth strategy exposes us to certain risks and expenses, including adversely affecting our results of operations and placing a significant strain on our management, personnel, systems and resources. In addition, maintaining credit quality while growing our loan portfolio is critical to achieving and sustaining profitable growth. We may not be able to manage our growth effectively. If we fail to do so, we would be materially harmed.
Regulatory requirements, growth plans or operating results may require us to raise additional capital, which may not be available on favorable terms or at all.
We are required by federal and state regulatory authorities to maintain adequate levels of capital to support our operations. At December 31, 2016, the Bank was categorized as “well-capitalized” under the applicable regulatory capital framework. To the extent regulatory requirements change, our future operating results erode capital or we seek to expand through loan growth, we may be required to raise additional capital. Our ability to raise capital in any such event would depend on conditions in the capital markets, which are outside of our control, and on our financial condition and performance. Accordingly, our ability to raise capital when needed or on favorable terms is uncertain. The inability to attract new capital investment, or to attract capital on terms acceptable to us, could have a material adverse impact on us.
We have not paid a dividend on our common stock since the Company’s formation in 2006. In addition, regulatory restrictions and liquidity constraints at the holding company level could impair our ability to make distributions on our outstanding securities.
Historically, our primary source of funds at the holding company level has been debt and equity issuances. The Bank and its predecessor banks had not paid dividends to the Company until 2015, and the Company has not paid dividends to our common shareholders, since the Company’s formation in 2006. Current and future liquidity constraints at the holding company level could continue to impair our ability to declare and pay dividends on our common stock or pay interest on our outstanding debt securities in the future. If we are unable to pay dividends or interest on our outstanding securities in the future, the market value of such securities may be materially adversely affected.
We are an emerging growth company and we cannot be certain if the reduced disclosure requirements applicable to emerging growth companies will make our common stock less attractive to investors. In addition, our election not to opt out of JOBS Act extended accounting transition period may make our financial statements less easily comparable to the financial statements of other companies.
We are an “emerging growth company,” as defined in the JOBS Act, and we may take advantage of certain exemptions from various reporting requirements that are applicable to other public companies that are not emerging growth companies, including, but not limited to, not being required to comply with the auditor attestation requirements of Section 404 of the Sarbanes-Oxley Act, reduced disclosure obligations regarding executive compensation in our periodic reports and proxy statements, and exemptions from the requirements of holding a nonbinding advisory vote on executive compensation and shareholder approval of any golden parachute payments not previously approved. We will remain an emerging growth company for up to five years, though we may cease to be an emerging growth company earlier under certain circumstances, including if, before the end of such five years, we are deemed to be a large accelerated filer under the rules of the SEC (which depends on, among other things, having a market value of common stock held by non-affiliates in excess of $700 million). We cannot predict if investors will find our common stock less attractive because we will rely on these exemptions. If some investors find our common stock less attractive as a result, there may be a less active trading market for our common stock and our stock price may be more volatile.
Further, Section 102(b)(1) of the JOBS Act exempts emerging growth companies from being required to comply with new or revised financial accounting standards until private companies (that is, those that have not had a Securities Act registration statement declared effective or do not have a class of securities registered under the Securities Exchange Act of 1934, as amended (the “Exchange Act”) are required to comply with the new or revised financial accounting standards. The JOBS Act provides that a company can elect to opt out of the extended transition period and comply with the requirements that apply to non-emerging growth companies but any such an election to opt out is irrevocable. We have elected not to opt out of such extended transition period which means that when a standard is issued or revised and it has different application dates for public or private companies, we, as an emerging growth company, can adopt the new or revised standard at the time private companies adopt the new or revised standard. This may make comparison of our financial statements with another public company which is neither an emerging growth company nor an emerging growth company which has opted out of using the extended transition period difficult or impossible because of the potential differences in accountant standards used.
21
The market price of our common stock may be volatile, which could cause the value of an investment in our common stock to decline.
The market price of our common stock may fluctuate substantially due to a variety of factors, many of which are beyond our control, including:
Ÿ | general market conditions; |
Ÿ | domestic and international economic factors unrelated to our performance; |
Ÿ | actual or anticipated fluctuations in our quarterly operating results; |
Ÿ | changes in or failure to meet publicly disclosed expectations as to our future financial performance; |
Ÿ | downgrades in any securities analysts’ estimates of our financial performance or lack of research and reports by industry analysts; |
Ÿ | changes in market valuations or earnings of similar companies; |
Ÿ | any future sales of our common stock or other securities; and |
Ÿ | additions or departures of key personnel. |
The stock markets in general have experienced substantial volatility that has often been unrelated to the operating performance of particular companies. These types of broad market fluctuations may adversely affect the trading price of our common stock. In the past, shareholders have sometimes instituted securities class action litigation against companies following periods of volatility in the market price of their securities. Any similar litigation against us could result in substantial costs, divert management’s attention and resources and harm our business or results of operations.
Our stock is relatively thinly traded.
Although our common stock is quoted on the NASDAQ Capital Market, the average daily trading volume of our common stock is relatively small compared to many public companies. The desired market characteristics of depth, liquidity, and orderliness require the substantial presence of willing buyers and sellers in the marketplace at any given time. In our case, this presence depends on the individual decisions of a relatively small number of investors and general economic and market conditions over which we have no control. Due to the relatively small trading volume of our common stock, significant sales of our common stock, or the expectation of these sales, could cause the stock price to fall more than would be justified by the inherent worth of the Company. Conversely, attempts to purchase a significant amount of our stock could cause the market price to rise above the reasonable inherent worth of the Company.
22
Item 1B. Unresolved Staff Comments
Not applicable.
23
Item 2. Properties
As of December 31, 2016, the net book value of our properties was $22.2 million. The following is a list of our offices:
Location | Address | Ownership | Square Footage | |
Joliet Branch | 2801 Black Road, Joliet, Illinois, 60435 | Owned | 11,048 | |
Channahon Branch | 25407 South Bell Road, Channahon, Illinois 60410 | Owned | 8,880 | |
Naperville Branch | 24 West Gartner Road, Suite 104, Naperville, Illinois 60540 | Leased | 4,100 | |
Plainfield Branch | 14150 S. Rt. 30, Plainfield, Illinois 60544 | Owned | 12,000 | |
Homer Glen Branch | 13901 S. Bell Road, Homer Glen, Illinois 60491 | Owned | 4,000 | |
Burr Ridge Branch | 7020 County Line Road, Burr Ridge, Illinois 60527 | Owned | 18,863 | |
Mazon Branch | 606 Depot Street, Mazon, Illinois 60444 | Owned | 9,711 | |
Diamond Branch | 2315 East Division Street, Coal City, Illinois 60416 | Owned | 2,458 | |
Braidwood Branch | 130 North Washington Street, Braidwood, Illinois 60408 | Owned | 4,073 | |
Item 3. Legal Proceedings
The Company is involved from time to time in various legal actions arising in the normal course of business. While the outcome of the pending proceedings cannot be predicted with certainty, it is the opinion of management that the resolution of these proceedings should not have a material adverse effect on our consolidated financial position or results of operation.
Item 4. Mine Safety Disclosures
Not applicable.
24
PART II
Item 5. Market for Registrant’s Common Equity, Related Stockholder Matters and Issuer Purchases of Equity Securities
First Community’s common stock was quoted on the OTCQB marketplace under the symbol “FCMP” for the first two quarters of 2015. As of July 17, 2015, the Company began trading on NASDAQ Capital Market under the symbol “FCFP.” There were approximately 808 holders of record of our common stock as of March 1, 2017. Additionally, there were 630 estimated beneficial holders whose stock was held in street name by brokerage and other nominees as of that date.
The following table presents:
• | Quarterly high and low sales prices per share for our common stock for 2016 and for the quarters ended September 30 and December 31, 2015. |
• | Quarterly high and low bid prices per share for our common stock for the quarters ended March 31 and June 30, 2015 as reported on the OTCQX. These quotations represent inter-dealer prices without retail mark-ups, mark-downs or commissions and may not necessarily represent actual transactions. |
Market Price Range | |||||||
High | Low | ||||||
2016 | |||||||
Quarter ended December 31 | $ | 12.15 | $ | 9.10 | |||
Quarter ended September 30 | 9.52 | 8.50 | |||||
Quarter ended June 30 | 9.10 | 8.18 | |||||
Quarter ended March 31 | 8.84 | 7.00 | |||||
2015 | |||||||
Quarter ended December 31 | $ | 7.31 | $ | 6.26 | |||
Quarter ended September 30 | 7.00 | 6.25 | |||||
Quarter ended June 30 | 6.55 | 5.47 | |||||
Quarter ended March 31 | 5.75 | 5.14 | |||||
First Community has not paid cash dividends on its common stock since its formation in 2006. The timing and amount of any future cash dividends paid on our common stock depends on our earnings, capital requirements, financial condition and other relevant factors including the ability of the Bank to pay dividends to the Company. See Item 1. Business for more information.
There were no purchases of common stock by First Community for the years ended December 31, 2016, 2015 and 2014.
25
Performance Graph
The following graph compares First Community’s performance, as measured by the change in price of its common stock plus reinvested dividends, with the SNL Midwest U.S. Bank, and the NASDAQ Composite Index for the five years ended December 31, 2016.
First Community Financial Partners, Inc.
Stock Price Performance
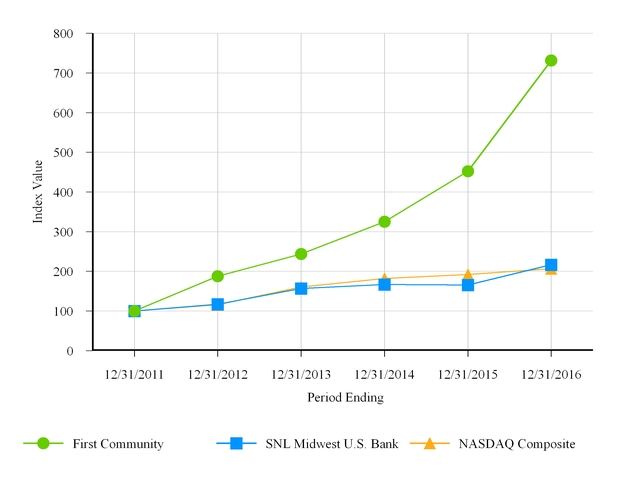
12/31/2011 | 12/31/2012 | 12/31/2013 | 12/31/2014 | 12/31/2015 | 12/31/2016 | |
First Community | $100.00 | $187.50 | $243.75 | $325.00 | $452.50 | $731.25 |
SNL Midwest U.S. Bank | $100.00 | $117.33 | $156.99 | $167.02 | $165.82 | $216.44 |
NASDAQ Composite | $100.00 | $115.91 | $160.32 | $181.80 | $192.21 | $206.63 |
The banks in the SNL Midwest Bank Index represent all publicly traded banks, thrifts or financial service companies located in Iowa, Illinois, Indiana, Kansas, Kentucky, Michigan, Minnesota, Missouri, North Dakota, Nebraska, Ohio, South Dakota and Wisconsin.
26
Item 6. Selected Financial Data
Selected Consolidated Financial Information
The following selected financial data as of year-end and for each of the five years in the period ended December 31, 2016, have been derived from First Community’s audited Consolidated Financial Statements and the results of operations for each period. This financial data should be read in conjunction with the Consolidated Financial Statements and the related Notes to the Consolidated Financial Statements included in this Annual Report.
2016 | 2015 | 2014 | 2013 | 2012 | |||||||||||||||
(dollars in thousands except per share data) | |||||||||||||||||||
Balance Sheet Items | |||||||||||||||||||
Securities available for sale | $ | 202,198 | $ | 205,604 | $ | 168,687 | $ | 141,316 | $ | 108,961 | |||||||||
Gross loans, including loans held for sale | 993,933 | 772,719 | 689,193 | 654,750 | 637,114 | ||||||||||||||
Allowance for loan and lease losses | 11,684 | 11,741 | 13,905 | 15,820 | 22,878 | ||||||||||||||
Total assets | 1,268,210 | 1,040,652 | 924,075 | 867,576 | 902,600 | ||||||||||||||
Tangible assets(1) | 1,267,058 | 1,040,652 | 924,075 | 867,576 | 902,600 | ||||||||||||||
Total deposits | 1,083,156 | 865,991 | 769,410 | 725,401 | 780,662 | ||||||||||||||
Other borrowed funds(2) | 51,153 | 53,015 | 29,529 | 25,563 | 25,695 | ||||||||||||||
Subordinated debt | 15,300 | 15,300 | 29,133 | 19,305 | 4,060 | ||||||||||||||
Stockholders’ equity | 113,715 | 103,041 | 92,053 | 84,979 | 87,931 | ||||||||||||||
Common stockholders’ equity | 113,715 | 103,041 | 92,053 | 85,519 | 50,467 | ||||||||||||||
Tangible common stockholders’ equity(3) | 112,563 | 103,041 | 92,053 | 85,519 | 50,467 | ||||||||||||||
Results of Operations | |||||||||||||||||||
Interest income | $ | 42,777 | $ | 36,725 | $ | 35,248 | $ | 34,898 | $ | 38,522 | |||||||||
Interest expense | 5,701 | 5,938 | 6,348 | 6,206 | 8,299 | ||||||||||||||
Net interest income | 37,076 | 30,787 | 28,900 | 28,692 | 30,223 | ||||||||||||||
Provision for loan losses | 1,066 | (2,077 | ) | 3,000 | 8,002 | 7,062 | |||||||||||||
Net income available for common stockholders | 11,107 | 9,819 | 5,362 | 20,638 | 104 | ||||||||||||||
Per Share Data | |||||||||||||||||||
Diluted earnings | $ | 0.64 | $ | 0.57 | $ | 0.32 | $ | 1.29 | $ | 0.01 | |||||||||
Book value(4) | 6.59 | 6.05 | 5.52 | 5.24 | 4.14 | ||||||||||||||
Tangible book value(5) | 6.53 | 6.05 | 5.52 | 5.24 | 4.14 | ||||||||||||||
Closing stock price | 11.70 | 7.24 | 5.20 | 3.00 | 1.60 | ||||||||||||||
Other Information | |||||||||||||||||||
Return on average assets | 1.00 | % | 0.99 | % | 0.60 | % | 2.34 | % | 0.01 | % | |||||||||
Return on average common equity | 10.17 | % | 10.08 | % | 5.68 | % | 26.20 | % | 0.14 | % | |||||||||
Net interest margin(6) | 3.50 | % | 3.26 | % | 3.39 | % | 3.37 | % | 3.55 | % | |||||||||
Equity to assets ratio(7) | 9.79 | % | 9.80 | % | 10.48 | % | 7.44 | % | 7.59 | % | |||||||||
(1) Total assets less goodwill and intangible assets.
(2) Includes federal funds purchased, securities sold under agreements to repurchase, and short-term borrowings.
(3) Common equity less intangible assets.
(4) Total common equity divided by shares outstanding as of period end.
(5) Total common equity less intangible assets divided by shares outstanding as of period end.
(6) Net interest income divided by average earning assets.
(7) Average common equity divided by average total assets.
27
Item 7. Management’s Discussion and Analysis of Financial Condition and Results of Operations
The following discussion should be read in conjunction with our financial statements and related notes thereto included elsewhere in this report. This report may contain certain forward-looking statements, such as discussions of the Company’s pricing and fee trends, credit quality and outlook, liquidity, new business results, expansion plans, anticipated expenses and planned schedules. The Company intends such forward-looking statements to be covered by the safe harbor provisions for forward-looking statements contained in the Private Securities Litigation Reform Act of 1995. Forward-looking statements, which are based on certain assumptions and describe future plans, strategies and expectations of the Company, are identified by use of the words “believe,” “expect,” “intend,” “anticipate,” “estimate,” “project,” or similar expressions. Actual results could differ materially from the results indicated by these statements because the realization of those results is subject to many risks and uncertainties, including those described in Item 1A. Risk Factors and other sections of the Company’s December 31, 2016 Annual Report on Form 10-K and the Company’s other filings with the SEC, and other risks and uncertainties, including unexpected results of the Merger, including possible termination of the Agreement and Plan of Merger, changes in interest rates, general economic conditions and those in the Company’s market area, legislative/regulatory changes, including the rules adopted by the U.S. Federal banking authorities to implement the Basel III capital accords, monetary and fiscal policies of the U.S. Government, including policies of the U.S. Department of the Treasury and the Board of Governors of the Federal Reserve System, the Company’s success in raising capital, demand for loan products, deposit flows, competition, demand for financial services in the Company’s market area and accounting principles, policies and guidelines. Furthermore, forward-looking statements speak only as of the date they are made. Except as required under the federal securities laws or the rules and regulations of the SEC, we do not undertake any obligation to update or review any forward-looking information, whether as a result of new information, future events or otherwise.
Overview
First Community, an Illinois corporation, is the holding company for the Bank. Through the Bank, we provide a full range of financial services to individuals and corporate clients.
The Bank has banking centers located at 2801 Black Road, Joliet, Illinois, 24 West Gartner Road, Suite 104, Naperville, Illinois, 25407 South Bell Road, Channahon, Illinois, 14150 South U.S. Route 30, Plainfield, Illinois, 13901 South Bell Road, Homer Glen, Illinois, 7020 South County Line Road, Burr Ridge, Illinois, 606 Depot Street, Mazon, Illinois, 130 North Washington Street, Braidwood, Illinois, and 2315 East Division, Coal City, Illinois.
Through these banking centers the Bank offers a full range of deposit products and services, as well as credit and operational services. Depository services include: Individual Retirement Accounts (IRAs), tax depository and payment services, automatic transfers, bank by mail, direct deposits, money market accounts, savings accounts, and various forms and terms of certificates of deposit (CDs), both fixed and variable rate. The Bank attracts deposits through advertising and by pricing depository services competitively. Credit services include: commercial and industrial loans, real estate construction and land development loans, conventional and adjustable rate real estate loans secured by residential properties, real estate loans secured by commercial properties, customer loans for items such as home improvements, vehicles, boats and education offered on installment and single payment bases, as well as government guaranteed loans including Small Business Administration (SBA) loans, and letters of credit. The Bank’s operation services include: cashier’s checks, traveler’s checks, collections, currency and coin processing, wire transfer services, deposit bag rentals, and stop payments. Other services include servicing of secondary market real estate loans, notary services, and signature guarantees. The Bank does not offer trust services at this time.
On July 1, 2016, the Company completed its acquisition of Mazon State Bank through the merger of Mazon State Bank with and into the Bank. In connection with the merger, the Company paid aggregate merger consideration of $8.5 million in cash. For additional information on this merger, see Note 3. “Acquisition” to our Consolidated Financial Statements.
28
FINANCIAL SUMMARY | ||||||
December 31, 2016 | December 31, 2015 | |||||
Period-End Balance Sheet | ||||||
(In thousands) | ||||||
Assets | ||||||
Cash and due from banks | $ | 16,225 | $ | 10,699 | ||
Interest-bearing deposits in banks | 8,548 | 7,406 | ||||
Securities available for sale | 202,198 | 205,604 | ||||
Mortgage loans held for sale | 1,230 | 400 | ||||
Loans held for sale | 1,085 | — | ||||
Commercial real estate | 425,910 | 381,098 | ||||
Commercial | 281,804 | 179,623 | ||||
Residential 1-4 family | 175,978 | 135,864 | ||||
Multifamily | 36,703 | 34,272 | ||||
Construction and land development | 47,338 | 22,082 | ||||
Farmland and agricultural production | 12,628 | 9,989 | ||||
Consumer and other | 7,967 | 9,391 | ||||
Leases | 3,290 | — | ||||
Total loans and leases | 991,618 | 772,319 | ||||
Allowance for loan and lease losses | 11,684 | 11,741 | ||||
Net loans and leases | 979,934 | 760,578 | ||||
Other assets | 58,990 | 55,965 | ||||
Total Assets | $ | 1,268,210 | $ | 1,040,652 | ||
Liabilities and Shareholders' Equity | ||||||
Noninterest bearing deposits | $ | 247,856 | $ | 196,063 | ||
Savings deposits | 64,695 | 36,207 | ||||
NOW accounts | 160,862 | 102,882 | ||||
Money market accounts | 282,865 | 233,315 | ||||
Time deposits | 326,878 | 297,524 | ||||
Total deposits | 1,083,156 | 865,991 | ||||
Total borrowings | 66,453 | 68,315 | ||||
Other liabilities | 4,886 | 3,305 | ||||
Total Liabilities | 1,154,495 | 937,611 | ||||
Shareholders’ equity | 113,715 | 103,041 | ||||
Total Shareholders’ Equity | 113,715 | 103,041 | ||||
Total Liabilities and Shareholders’ Equity | $ | 1,268,210 | $ | 1,040,652 | ||
29
Years Ended December 31, | ||||||
2016 | 2015 | |||||
Interest income: | (in thousands, except share data) | |||||
Loans, including fees | $ | 38,424 | $ | 32,525 | ||
Securities | 4,217 | 4,134 | ||||
Federal funds sold and other | 136 | 66 | ||||
Total interest income | 42,777 | 36,725 | ||||
Interest expense: | ||||||
Deposits | 4,128 | 3,923 | ||||
Federal funds purchased and other borrowed funds | 385 | 215 | ||||
Subordinated debt | 1,188 | 1,800 | ||||
Total interest expense | 5,701 | 5,938 | ||||
Net interest income | 37,076 | 30,787 | ||||
Provision for loan losses | 1,066 | (2,077 | ) | |||
Net interest income after provision for loan losses | 36,010 | 32,864 | ||||
Noninterest income: | ||||||
Service charges on deposit accounts | 985 | 756 | ||||
Gain on sale of loans | 16 | — | ||||
Gain on sale of securities | 617 | 484 | ||||
Mortgage fee income | 570 | 531 | ||||
Bargain purchase gain | 1,920 | — | ||||
Other | 1,359 | 726 | ||||
5,467 | 2,497 | |||||
Noninterest expenses: | ||||||
Salaries and employee benefits | 14,688 | 11,538 | ||||
Occupancy and equipment expense | 1,982 | 1,977 | ||||
Data processing | 1,914 | 912 | ||||
Professional fees | 1,422 | 1,201 | ||||
Advertising and business development | 1,050 | 853 | ||||
Losses on sale and writedowns of foreclosed assets, net | 48 | 187 | ||||
Foreclosed assets expenses, net of rental income | 40 | 130 | ||||
Other expense | 4,902 | 3,744 | ||||
26,046 | 20,542 | |||||
Income before income taxes | 15,431 | 14,819 | ||||
Income taxes | 4,324 | 5,000 | ||||
Net income | $ | 11,107 | $ | 9,819 | ||
Common share data | ||||||
Basic earnings per common share | $ | 0.65 | $ | 0.58 | ||
Diluted earnings per common share | 0.64 | 0.57 | ||||
Weighted average common shares outstanding for basic earnings per common share | 17,184,432 | 16,939,010 | ||||
Weighted average common shares outstanding for diluted earnings per common share | 17,630,600 | 17,085,752 | ||||
30
ASSET QUALITY DATA | ||||||
December 31, 2016 | December 31, 2015 | |||||
(Dollars in thousands) | ||||||
Loans identified as nonperforming | $ | 5,856 | $ | 1,411 | ||
Other nonperforming loans | — | 67 | ||||
Total nonperforming loans | 5,856 | 1,478 | ||||
Foreclosed assets | 725 | 5,487 | ||||
Total nonperforming assets | $ | 6,581 | $ | 6,965 | ||
Allowance for loan and lease losses | $ | 11,684 | $ | 11,741 | ||
Nonperforming assets to total assets | 0.52 | % | 0.67 | % | ||
Nonperforming loans to total assets | 0.46 | % | 0.14 | % | ||
Allowance for loan and lease losses to nonperforming loans | 199.52 | % | 794.38 | % | ||
ALLOWANCE FOR LOAN AND LEASE LOSSES ROLLFORWARD | |||||||||
(Dollars in thousands) | Year ended December 31, | ||||||||
2016 | 2015 | 2014 | |||||||
Beginning balance | $ | 11,741 | $ | 13,905 | $ | 15,820 | |||
Charge-offs | 2,400 | 1,859 | 6,633 | ||||||
Recoveries | 1,277 | 1,772 | 1,718 | ||||||
Net charge-offs | 1,123 | 87 | 4,915 | ||||||
Provision for loan losses | 1,066 | (2,077 | ) | 3,000 | |||||
Ending balance | $ | 11,684 | $ | 11,741 | $ | 13,905 | |||
Net chargeoff percentage annualized | 0.13 | % | 0.01 | % | 0.73 | % | |||
31
OTHER DATA | ||||
Year ended December 31, | ||||
2016 | 2015 | |||
Return on average assets | 1.00 | % | 0.99 | % |
Return on average equity | 10.17 | % | 10.08 | % |
Net interest margin | 3.50 | % | 3.26 | % |
Average loans to assets | 75.58 | % | 87.68 | % |
Average loans to deposits | 91.38 | % | 87.62 | % |
Average noninterest bearing deposits to total deposits | 25.00 | % | 20.45 | % |
COMPANY CAPITAL RATIOS | ||||
December 31, 2016 | December 31, 2015 | |||
Tier 1 leverage ratio | 9.10 | % | 9.36 | % |
Common equity tier 1 capital ratio | 10.51 | % | 11.62 | % |
Tier 1 capital ratio | 10.51 | % | 11.62 | % |
Total capital ratio | 12.99 | % | 14.69 | % |
Tangible common equity to tangible assets | 8.88 | % | 10.07 | % |
NON-GAAP MEASURES | |||||||||
Pre-tax pre-provision core income (1) | |||||||||
(In thousands) | |||||||||
For the year ended December 31, | |||||||||
2016 | 2015 | 2014 | |||||||
Income before income taxes | $ | 15,431 | $ | 14,819 | $ | 8,620 | |||
Provision for loan losses | 1,066 | (2,077 | ) | 3,000 | |||||
Gain on sale of securities | (617 | ) | (484 | ) | (912 | ) | |||
Gain on sale of foreclosed assets | — | (19 | ) | ||||||
Merger related expenses included in professional fees | 150 | — | — | ||||||
Merger related expenses included in data processing fees | 787 | — | — | ||||||
Severances paid in relation to the merger | 92 | — | — | ||||||
Stock options included in other expense | 165 | — | |||||||
Bargain purchase gain | (1,920 | ) | — | — | |||||
Bank owned life insurance gain | — | — | (483 | ) | |||||
Losses on sale and writedowns of foreclosed assets, net | 48 | 187 | 434 | ||||||
Foreclosed assets expense, net of rental income | 40 | 130 | 219 | ||||||
Pre-tax pre-provision core income | $ | 15,242 | $ | 12,575 | $ | 10,859 | |||
(1) This is a non-GAAP financial measure. In compliance with applicable rules of the SEC, this non-GAAP measure is reconciled to pre-tax net income, which is the most directly comparable GAAP financial measure. The Company’s management believes the presentation of pre-tax pre-provision core income provides investors with a greater understanding of the Company’s operating results, in addition to the results measured in accordance with GAAP. |
32
Results of Operations
Net income
Net income for the year ended December 31, 2015 was $9.8 million, or $0.57 per diluted share, compared with $5.4 million, or $.32 per diluted share, for the year ended December 31, 2014. Earnings for the year ended December 31, 2015 reflected year-over-year growth in net interest income and a negative loan loss provision of $2.1 million compared with a $3.0 million loan loss provision for the year ended December 31, 2014. Income for the year was offset by the related income taxes of $5.0 million for the year ended December 31, 2015, up from $2.7 million for the year ended December 31, 2014.
Net income for the year ended December 31, 2016 was $11.1 million, or $0.64 per diluted share, compared with $9.8 million, or $0.57 per diluted share, for the year ended December 31, 2015. Earnings for 2016 compared to 2015 reflected growth in net interest income. Growth in noninterest expenses also reflects merger costs and additional staffing expenses in connection with the acquisition of Mazon State Bank as well as the addition of a commercial banking team. Net income for the 2016 was also positively impacted by a $1.9 million bargain purchase gain related to the acquisition of Mazon State Bank.
Net Interest Income
Net interest income is the largest component of our income, and is affected by the interest rate environment and the volume and the composition of interest-earning assets and interest-bearing liabilities. Our interest-earning assets include loans, interest-bearing deposits in other banks, investment securities, and federal funds sold. Our interest-bearing liabilities include deposits, advances from the FHLB, subordinated debentures, repurchase agreements and other short-term borrowings.
33
The following tables reflect the components of net interest income for the years ended December 31, 2016, 2015 and 2014:
Year ended December 31, | ||||||||||||||||||||||||
2016 | 2015 | 2014 | ||||||||||||||||||||||
(Dollars in thousands) | Average Balances | Income/ Expense | Yields/ Rates | Average Balances | Income/ Expense | Yields/ Rates | Average Balances | Income/ Expense | Yields/ Rates | |||||||||||||||
Assets | ||||||||||||||||||||||||
Loans (1) | $ | 842,580 | $ | 38,424 | 4.56 | % | $ | 728,276 | $ | 32,525 | 4.47 | % | $ | 675,866 | $ | 32,066 | 4.74 | % | ||||||
Investment securities (2) | 198,867 | 4,217 | 2.12 | % | 197,427 | 4,134 | 2.09 | % | 155,914 | 3,104 | 1.99 | % | ||||||||||||
Interest-bearing deposits with other banks | 17,256 | 136 | 0.79 | % | 18,087 | 66 | 0.36 | % | 21,737 | 78 | 0.36 | % | ||||||||||||
Total earning assets | $ | 1,058,703 | $ | 42,777 | 4.04 | % | $ | 943,790 | $ | 36,725 | 3.89 | % | $ | 853,517 | $ | 35,248 | 4.13 | % | ||||||
Other assets | 56,124 | 49,879 | 47,199 | |||||||||||||||||||||
Total assets | $ | 1,114,827 | $ | 993,669 | $ | 900,716 | ||||||||||||||||||
Liabilities | ||||||||||||||||||||||||
NOW accounts | $ | 112,221 | $ | 360 | 0.32 | % | $ | 91,410 | $ | 204 | 0.22 | % | $ | 73,256 | $ | 108 | 0.15 | % | ||||||
Money market accounts | 242,890 | 716 | 0.29 | % | 224,640 | 620 | 0.28 | % | 182,264 | 498 | 0.27 | % | ||||||||||||
Savings accounts | 46,357 | 53 | 0.11 | % | 33,815 | 56 | 0.17 | % | 26,799 | 41 | 0.15 | % | ||||||||||||
Time deposits | 304,138 | 2,999 | 0.99 | % | 303,668 | 3,043 | 1.00 | % | 337,068 | 3,792 | 1.12 | % | ||||||||||||
Total interest bearing deposits | 705,606 | 4,128 | 0.59 | % | 653,533 | 3,923 | 0.60 | % | 619,387 | 4,439 | 0.72 | % | ||||||||||||
Securities sold under agreements to repurchase | 22,966 | 38 | 0.17 | % | 30,849 | 39 | 0.13 | % | 29,081 | 30 | 0.10 | % | ||||||||||||
Secured borrowings | 9,175 | 221 | 2.41 | % | 6,662 | 160 | 2.40 | % | — | — | — | % | ||||||||||||
Mortgage payable | — | — | — | % | 180 | 13 | 7.22 | % | 572 | 36 | 6.29 | % | ||||||||||||
FHLB borrowings | 33,058 | 126 | 0.38 | % | 1,686 | 3 | 0.18 | % | 1,017 | 2 | 0.20 | % | ||||||||||||
Subordinated debentures | 15,300 | 1,188 | 7.76 | % | 22,124 | 1,800 | 8.14 | % | 20,984 | 1,841 | 8.77 | % | ||||||||||||
Total interest bearing liabilities | 786,105 | $ | 5,701 | 0.73 | % | 715,034 | 5,938 | 0.83 | % | 671,041 | 6,348 | 0.95 | % | |||||||||||
Noninterest bearing deposits | 216,430 | 177,085 | 130,515 | |||||||||||||||||||||
Other liabilities | 3,113 | 4,157 | 4,794 | |||||||||||||||||||||
Total liabilities | $ | 1,005,648 | $ | 896,276 | $ | 806,350 | ||||||||||||||||||
Total shareholders' equity | $ | 109,179 | $ | 97,393 | $ | 94,366 | ||||||||||||||||||
Total liabilities and equity | $ | 1,114,827 | $ | 993,669 | $ | 900,716 | ||||||||||||||||||
Net interest income | $ | 37,076 | $ | 30,787 | $ | 28,900 | ||||||||||||||||||
Interest rate spread | 3.31 | % | 3.06 | % | 3.18 | % | ||||||||||||||||||
Net interest margin | 3.50 | % | 3.26 | % | 3.39 | % | ||||||||||||||||||
Footnotes: | ||||
(1) Average loans include nonperforming loans | ||||
(2) No tax-equivalent adjustments were made, as the effect therof was not material | ||||
The net interest income increase and margin increases in 2016 compared to 2015 were primarily due to the increase in prime rate which increased the rates on variable rate commercial loans. In addition, interest expense was lower in 2016 compared to 2015 as a result of reduced subordinated debt interest expense.
34
The net interest income increase and margin decrease from 2014 to 2015 was primarily due to the changes in loans. Loans booked during 2015 were at lower yields as compared to 2014 due to the competetive market conditions during that time, which was offset by the volume of loans booked during 2015.
Rate/Volume Analysis
The following table sets forth certain information regarding changes in our interest income and interest expense for the years noted (dollars in thousands):
Year Ended December 31, | ||||||||||||||||||||||||
2016 compared to 2015 | 2015 compared to 2014 | |||||||||||||||||||||||
Average Volume | Average Rate | Mix | Net Increase (Decrease) | Average Volume | Average Rate | Mix | Net Increase (Decrease) | |||||||||||||||||
Interest Income | ||||||||||||||||||||||||
Loans | $ | 5,141 | $ | 655 | $ | 103 | $ | 5,899 | $ | 2,426 | $ | (1,825 | ) | $ | (142 | ) | $ | 459 | ||||||
Investment securities | 30 | 53 | — | 83 | 832 | 156 | 42 | 1,030 | ||||||||||||||||
Interest bearing deposits with other banks | (3 | ) | 77 | (4 | ) | 70 | (12 | ) | — | — | (12 | ) | ||||||||||||
Total interest income | 5,168 | 785 | 99 | 6,052 | 3,246 | (1,669 | ) | (100 | ) | 1,477 | ||||||||||||||
Interest expense | ||||||||||||||||||||||||
NOW accounts | $ | 46 | $ | 89 | $ | 21 | $ | 156 | $ | 27 | $ | 56 | $ | 13 | $ | 96 | ||||||||
Money market accounts | 72 | 22 | 2 | 96 | 100 | 18 | 4 | 122 | ||||||||||||||||
Savings accounts | 25 | (20 | ) | (8 | ) | (3 | ) | 9 | 5 | 1 | 15 | |||||||||||||
Time deposits | 5 | (49 | ) | — | (44 | ) | (374 | ) | (415 | ) | 40 | (749 | ) | |||||||||||
Term borrowings | 60 | 1 | — | 61 | — | — | 160 | 160 | ||||||||||||||||
Securities sold under agreements to repurchase | (10 | ) | 12 | (3 | ) | (1 | ) | 2 | 6 | 1 | 9 | |||||||||||||
FHLB advances | 57 | 3 | 63 | 123 | 1 | — | — | 1 | ||||||||||||||||
Mortgage payable | (13 | ) | (13 | ) | 13 | (13 | ) | (24 | ) | 5 | (4 | ) | (23 | ) | ||||||||||
Subordinated debentures | (554 | ) | (84 | ) | 26 | (612 | ) | 100 | (134 | ) | (7 | ) | (41 | ) | ||||||||||
Total interest expense | (312 | ) | (39 | ) | 114 | (237 | ) | (159 | ) | (459 | ) | 208 | (410 | ) | ||||||||||
Change in net interest income | $ | 5,480 | $ | 824 | $ | (15 | ) | $ | 6,289 | $ | 3,405 | $ | (1,210 | ) | $ | (308 | ) | $ | 1,887 | |||||
Provision for Loan Losses
The Company had a provision for loan losses of $1.1 million and a negative provision for loan losses of $2.1 million for the years ended December 31, 2016 and 2015, respectively. The Company had net charge-offs of $1.1 million and of $87,000 for the years ended December 31, 2016 and 2015, respectively. Nonperforming loans increased 296.21% from $1.5 million at December 31, 2015 to $5.9 million at December 31, 2016. The increase in nonperforming loans related to a few specific relationships which were downgraded during 2016 offset by charge-offs and sold loans.
The Company had a negative provision for loan losses of $2.1 million and a provision for loan losses of $3.0 million for the years ended December 31, 2015 and 2014, respectively. The Company had net charge-offs of $87,000 and of $4.9 million for the years ended December 31, 2015 and 2014, respectively. Nonperforming loans decreased 78.88% from $7.0 million at December 31, 2014 to $1.5 million at December 31, 2015. The decrease in nonperforming loans during this period was the result of management’s focus on improving asset quality and cleaning up the loan portfolio in addition to foreclosure activity.
35
Noninterest Income
The following table sets forth the components of noninterest income for the periods indicated:
For the year ended December 31, | |||||||||
(Dollars in thousands) | 2016 | 2015 | 2014 | ||||||
Service charges on deposit accounts | $ | 985 | $ | 756 | $ | 677 | |||
Gain on sale of loans | 16 | — | 39 | ||||||
Gain on foreclosed assets, net | — | — | 19 | ||||||
Gain on sale of securities | 617 | 484 | 912 | ||||||
Mortgage fee income | 570 | 531 | 402 | ||||||
Bargain purchase gain | 1,920 | — | — | ||||||
Other | 1,359 | 726 | 1,244 | ||||||
Total noninterest income | $ | 5,467 | $ | 2,497 | $ | 3,293 | |||
Service charges on deposits increased for the twelve months ended December 31, 2016 due to continued growth in noninterest bearing accounts. In addition there was an increase in overdraft fees during 2016 related to this increase in noninterest bearing accounts. Noninterest bearing accounts were up $51.8 million at December 31, 2016 since December 31, 2015. Service charges on deposit accounts increased from December 31, 2014 to 2015, primarily due to overdraft fees charged as the result of increases in overdraft balances as compared to the same period in 2014.
Gain on sale of securities for the twelve months ended December 31, 2016 was higher than the same period in 2015, as a result of securities sold during the year in order to fund loan growth. Gain on sale of securities was higher in 2014 as a result of changes in the investment strategy that took place in the third quarter of 2014.
Mortgage fee income was up for the twelve months ended December 31, 2016 compared to the same period in 2015 as a result of increased mortgage sale volumes in 2016. The year ended December 31, 2015 had higher mortgage loan sales volumes than in 2014, and in turn, higher mortgage fee income.
The bargain purchase gain of $1.9 million for the year ended December 31, 2016 was related to the acquisition of Mazon State Bank.
Other noninterest income increased for the year ended December 31, 2016 compared to the same period in 2015 driven primarily by additional ATM fee income from the acquisition of Mazon State Bank and additional bank owned life insurance (“BOLI”) income. Other noninterest income was down for the year ended December 31, 2015 as compared to the same period in 2014. There was a decrease in other noninterest income for the year ended December 31, 2015, which was primarily due to the recognition of income in 2014 related to proceeds received from a BOLI policy in the amount of $483,000.
Noninterest Expense
The following table sets forth the components of noninterest expense for the periods indicated:
For the year ended December 31, | |||||||||
(Dollars in thousands) | 2016 | 2015 | 2014 | ||||||
Salaries and employee benefits | 14,688 | 11,538 | 11,191 | ||||||
Occupancy and equipment expense | 1,982 | 1,977 | 2,111 | ||||||
Data processing | 1,914 | 912 | 959 | ||||||
Professional fees | 1,422 | 1,201 | 1,283 | ||||||
Advertising and business development | 1,050 | 853 | 845 | ||||||
Losses on sale and writedowns of foreclosed assets, net | 48 | 187 | 434 | ||||||
Foreclosed assets, net of rental income | 40 | 130 | 219 | ||||||
Other expense | 4,902 | 3,744 | 3,531 | ||||||
Total noninterest expense | $ | 26,046 | $ | 20,542 | $ | 20,573 | |||
Salaries and employee benefit expenses were higher for the year ended December 31, 2016 as compared to 2015 as a result of new hires primarily in the lending area and the addition of staff from the acquisition of Mazon State Bank. Salaries and employee benefits were slightly higher for the year ended December 31, 2015 compared to the same period in
36
2014. This was the result of new hires during 2015 primarily related to the lending area.
Occupancy and equipment expense was consistent for the years ended December 31, 2016 and 2015. Occupancy and equipment expense was down for the year ended 2015 as compared to the same period in 2014 as we continued to see cost savings resulting from the purchase of the Channahon branch building.
Data processing expense increased $1.0 million for the year ended December 31, 2016, as compared to 2015 as a part of the costs related to the acquisition of Mazon State Bank. Data processing expense was consistent for the years ended December 31, 2015 and 2014.
Professional fees increased $221,000 for the year ended December 31, 2016, as compared to 2015, primarily due to the acquisition of Mazon State Bank. Professional fees remained consistent for the year ended December 31, 2015, compared to the same period in 2014.
Advertising and business development expenses were up for the twelve months ended December 31, 2016 as new advertising was conducted for new products and as a result of the acquisition. Advertising and business development costs were consistent for the years ended December 31, 2015 and 2014.
Losses on sale and writedowns of foreclosed assets, net, were lower in the current year, as a result of lower writedowns taken on the properties sold during 2016. Losses on sale and writedowns of foreclosed assets, net, were down for the year ended December 31, 2015 as compared to December 31, 2014, as a result of larger writedowns on foreclosed assets taken during 2014.
Foreclosed asset expenses were lower for the year ended December 31, 2016, as a result of reversals of real estate tax accruals related to foreclosed assets in addition to less assets held during 2016 and lower property related expenses. Foreclosed assets expenses were lower in 2015 as compared to 2014 as a result of less assets held during the 2015.
The increase in other expenses was a result of loan officer recruitment expenses as well as stock option expense related to the acquisition of Mazon State Bank. During the first quarter of 2014, we reversed the accrual for a contingent liability of approximately $210,000, which lowered other expense for the 2014 period as compared to 2015. In addition, in 2015 there were some smaller increases in expense as compared to 2014, such as correspondent fees, restricted stock and stock option expenses for directors.
Income Taxes
The Company realized income tax expense of $4.3 million and $5.0 million for the years ended December 31, 2016 and 2015, respectively. Net deferred tax assets were $6.6 million and $9.2 million at December 31, 2016 and December 31, 2015, respectively. The Company realized income tax expense of $2.7 million for the year ended December 31, 2014. Net deferred tax assets were $14.2 million at December 31, 2014.
Under U.S. GAAP, a valuation allowance against a net deferred tax asset is required to be recognized if it is more-likely-than-not that a deferred tax asset will not be realized. The determination of the realizability of the deferred tax asset is highly subjective and dependent upon judgment concerning management’s evaluation of both positive and negative evidence, forecasts of future income, applicable tax planning strategies and assessments of current and future economic and business conditions. As of December 31, 2016 and 2015, the Company did not have a valuation allowance against the net deferred tax assets.
The Company had a federal net operating loss carryforward of $0 and $9.3 million at December 31, 2016 and December 31, 2015, respectively. The Company had an Illinois net operating loss carryforward of $0 and $11.1 million at December 31, 2016 and December 31, 2015, respectively. The Company had a federal net operating loss carryforward of $20.3 million at December 31, 2014, which could be used to offset future regular corporate federal income tax.
37
Financial Condition
Our assets totaled $1.3 billion at December 31, 2016 as compared to $1.0 billion at December 31, 2015, an increase of $227.6 million, or 21.87%. Total loans at December 31, 2016 and December 31, 2015 were $991.6 million and $772.3 million, respectively, an increase of $219.3 million, or 28.39%. Total deposits were $1.1 billion and $866.0 million at December 31, 2016 and December 31, 2015, respectively, an increase of $217.2 million, or 25.08%.
Our assets totaled $1.0 billion at December 31, 2015 as compared to $924.1 million at December 31, 2014, an increase of
$116.6 million, or 12.62%. Total loans at December 31, 2015 and December 31, 2014 were $772.3 million and $689.2 million,
respectively, an increase of $83.1 million, or 12.06%. Total deposits were $866.0 million and $769.4 million at December 31,
2015 and December 31, 2014, respectively, an increase of $96.6 million, or 12.55%.
Loans
The loan portfolio consists principally of loans to individuals and small- and medium-sized businesses within our primary market area. The table below shows our loan portfolio composition (dollars in thousands):
December 31, 2016 | December 31, 2015 | December 31, 2014 | December 31, 2013 | December 31, 2012 | |||||||||||||||||||||
Amount | % of Total | Amount | % of Total | Amount | % of Total | Amount | % of Total | Amount | % of Total | ||||||||||||||||
Construction and Land Development | $ | 47,338 | 5 | % | $ | 22,082 | 3 | % | $ | 18,700 | 3 | % | $ | 20,745 | 3 | % | $ | 30,494 | 5 | % | |||||
Farmland and Agricultural Production | 12,628 | 1 | % | 9,989 | 1 | % | 9,350 | 1 | % | 8,505 | 1 | % | 7,211 | 1 | % | ||||||||||
Residential 1-4 Family | 175,978 | 18 | % | 135,864 | 18 | % | 100,773 | 15 | % | 86,770 | 13 | % | 77,567 | 12 | % | ||||||||||
Multifamily | 36,703 | 4 | % | 34,272 | 5 | % | 24,426 | 4 | % | 21,939 | 3 | % | 19,149 | 3 | % | ||||||||||
Commercial Real Estate | 425,985 | 43 | % | 381,098 | 49 | % | 353,973 | 51 | % | 344,750 | 53 | % | 347,752 | 55 | % | ||||||||||
Commercial and Industrial | 281,804 | 28 | % | 179,623 | 23 | % | 171,452 | 25 | % | 159,427 | 25 | % | 140,895 | 22 | % | ||||||||||
Leases, net | 3,290 | — | % | — | — | % | — | — | % | — | — | % | — | — | % | ||||||||||
Consumer and other | 7,967 | 1 | % | 9,417 | 1 | % | 10,706 | 1 | % | 10,315 | 2 | % | 14,361 | 2 | % | ||||||||||
Gross Loans | $ | 991,693 | 100 | % | $ | 772,345 | 100 | % | $ | 689,380 | 100 | % | $ | 652,451 | 100 | % | $ | 637,429 | 100 | % | |||||
Total loans increased by $219.3 million during the year ended December 31, 2016 as a result of new loan originations in addition to the loans acquired from Mazon State Bank. Total loans increased by $83.1 million during the year ended December 31, 2015 as a result of new loan originations. New loans originated during the year ended December 31, 2015 were primarily in the commercial real estate, multifamily, commercial and industrial, and residential 1-4 family categories.
The contractual maturity distributions of our loan portfolio as of December 31, 2016 are indicated in the tables below:
Loans Maturities December 31, 2016 | ||||||||||||
(Dollars in thousands) | Within One Year | One Year to Five Years | After Five Years | Total | ||||||||
Construction and Land Development | $ | 25,389 | $ | 18,278 | $ | 3,671 | $ | 47,338 | ||||
Farmland and Agricultural Production | 2,928 | 7,020 | 2,680 | 12,628 | ||||||||
Residential 1-4 Family | 23,657 | 61,792 | 90,529 | 175,978 | ||||||||
Multifamily | 478 | 22,117 | 14,108 | 36,703 | ||||||||
Commercial Real Estate | 57,172 | 142,456 | 226,357 | 425,985 | ||||||||
Commercial and Industrial | 118,460 | 99,894 | 63,450 | 281,804 | ||||||||
Leases, net | 66 | 3,224 | — | 3,290 | ||||||||
Consumer and other | 3,803 | 3,260 | 904 | 7,967 | ||||||||
Total | $ | 231,953 | $ | 358,041 | $ | 401,699 | $ | 991,693 | ||||
38
December 31, 2016 | |||
(Dollars in thousands) | Due After One Year | ||
Loans with: | |||
Predetermined interest rates | $ | 586,172 | |
Floating or adjustable rates | 173,568 | ||
$ | 759,740 | ||
Allowance for Loan and Lease Losses
Management reviews the level of the allowance for loan and lease losses on a quarterly basis. The methodology used to assess the adequacy of the allowance includes the allocation of specific and general reserves. The specific component relates to loans that are impaired. For such loans that are classified as impaired, an allowance is established when the collateral value, discounted cash flows or observable market price of the impaired loan is lower than the carrying value of that loan. The general component covers non-impaired loans and is based on historical loss experience adjusted for qualitative factors. These qualitative factors include local economic trends, concentrations, management experience, and other elements of the Company’s lending operations.
At December 31, 2016 and December 31, 2015, the allowance for loan and lease losses was $11.7 million and $11.7 million, respectively. Over the past year, we have seen a reduction in the allowance to total loan percentage from 1.52% at December 31, 2015, to 1.18% at December 31, 2016. In addition, the allowance for loan and lease losses to nonperforming loans decreased from 794.38% at December 31, 2015, to 199.52% at December 31, 2016. Despite the decline in the allowance for loan and lease losses to total loans ratio, management believes that the allowance for loan losses is adequate.
At December 31, 2015 and December 31, 2014, the allowance for loan and lease losses was $11.7 million and $13.9 million,
respectively. During 2015, we saw a reduction in the allowance to total loan percentage from 2.02% at
December 31, 2014, to 1.52% at December 31, 2015. This decrease has been the result of the reduction in nonperforming
assets and an improving net charge-off history, which is the starting point for the Company’s allowance for loan and lease losses calculation. In addition, the allowance for loan and lease losses to nonperforming loans increased from 198.72% at December 31, 2014 to 794.38% at December 31, 2015.
For the years ended December 31, 2016, 2015, and 2014, the Company had net charge-offs of $1.1 million, $87,000, and $4.9 million, respectively. Increases in charge-offs during 2016 as compared to the same period in 2015 were the result of increases in nonaccrual loans during 2016. Overall decreases in charge-offs during 2015 as compared to 2014 were the result of improvement in asset quality during that year.
Charge-offs and recoveries for each major loan category are shown in the table below:
39
Year ended December 31, | |||||||||||||||
(Dollars in thousands) | 2016 | 2015 | 2014 | 2013 | 2012 | ||||||||||
Balance at beginning of period | $ | 11,741 | $ | 13,905 | $ | 15,820 | $ | 22,878 | $ | 26,991 | |||||
Charge-offs: | |||||||||||||||
Construction and Land Development | — | — | 1,186 | 1,295 | 1,762 | ||||||||||
Farmland and Agricultural Production | — | — | — | — | 1,353 | ||||||||||
Residential 1-4 Family | 15 | 195 | 264 | 1,192 | 946 | ||||||||||
Multifamily | — | — | — | — | — | ||||||||||
Commercial Real Estate | 471 | 548 | 2,836 | 8,511 | 8,027 | ||||||||||
Commercial and Industrial | 1,905 | 1,106 | 2,321 | 6,229 | 1,452 | ||||||||||
Consumer and other | 9 | 10 | 26 | 604 | — | ||||||||||
Total charge-offs | $ | 2,400 | $ | 1,859 | $ | 6,633 | $ | 17,831 | $ | 13,540 | |||||
Recoveries: | |||||||||||||||
Construction and Land Development | 68 | 71 | 73 | 1,470 | 605 | ||||||||||
Farmland and Agricultural Production | — | — | — | 5 | — | ||||||||||
Residential 1-4 Family | 33 | 254 | 32 | 266 | 84 | ||||||||||
Multifamily | — | — | — | — | — | ||||||||||
Commercial Real Estate | 47 | 1,235 | 1,292 | 394 | 1,123 | ||||||||||
Commercial and Industrial | 1,125 | 202 | 315 | 627 | 547 | ||||||||||
Consumer and other | 4 | 10 | 6 | 9 | 6 | ||||||||||
Total recoveries | $ | 1,277 | $ | 1,772 | $ | 1,718 | $ | 2,771 | $ | 2,365 | |||||
Net charge-offs | 1,123 | 87 | 4,915 | 15,060 | 11,175 | ||||||||||
Provision for loan losses | 1,066 | (2,077 | ) | 3,000 | 8,002 | 7,062 | |||||||||
Allowance for loan and lease losses at end of period | $ | 11,684 | $ | 11,741 | $ | 13,905 | $ | 15,820 | $ | 22,878 | |||||
Selected loan quality ratios: | |||||||||||||||
Net charge-offs to average loans | 0.13 | % | 0.01 | % | 0.73 | % | 2.28 | % | 1.70 | % | |||||
Allowance to total loans | 1.18 | % | 1.52 | % | 2.02 | % | 2.42 | % | 3.59 | % | |||||
Allowance to nonperforming loans | 199.52 | % | 794.38 | % | 198.73 | % | 68.21 | % | 81.88 | % | |||||
40
The following table provides additional detail of the balance of the allowance for loan and lease losses by portfolio segment:
At December 31, (dollars in thousands) | |||||||||||||||||||||||||
2016 | 2015 | 2014 | 2013 | 2012 | |||||||||||||||||||||
Balance at end of period applicable to: | Amount | % of Total Allowance | Amount | % of Total Allowance | Amount | % of Total Allowance | Amount | % of Total Allowance | Amount | % of Total Allowance | |||||||||||||||
Construction and Land Development | $ | 1,549 | 13 | % | $ | 813 | 7 | % | $ | 758 | 5 | % | $ | 2,711 | 17 | % | $ | 4,755 | 21 | % | |||||
Farmland and Agricultural Production | 43 | — | % | 43 | — | % | 459 | 3 | % | 427 | 3 | % | 472 | 2 | % | ||||||||||
Residential 1-4 Family | 948 | 8 | % | 1,370 | 12 | % | 1,199 | 9 | % | 1,440 | 9 | % | 2,562 | 11 | % | ||||||||||
Multifamily | 254 | 2 | % | 141 | 1 | % | 67 | 1 | % | 97 | 1 | % | 209 | 1 | % | ||||||||||
Commercial Real Estate | 4,496 | 39 | % | 4,892 | 42 | % | 6,828 | 49 | % | 7,812 | 49 | % | 11,655 | 51 | % | ||||||||||
Commercial and Industrial | 4,343 | 38 | % | 4,286 | 37 | % | 4,296 | 31 | % | 3,183 | 20 | % | 3,075 | 13 | % | ||||||||||
Leases, net | 17 | — | % | — | — | % | — | — | % | — | — | — | — | % | |||||||||||
Consumer and other | 34 | — | % | 196 | 1 | % | 298 | 2 | % | 150 | 1 | % | 150 | 1 | % | ||||||||||
Total | $ | 11,684 | 100 | % | $ | 11,741 | 100 | % | $ | 13,905 | 100 | % | $ | 15,820 | 100 | % | $ | 22,878 | 100 | % | |||||
Impaired Loans
A loan is considered impaired when, based on current information and events, it is probable that the Company will be unable to collect the scheduled payments of principal or interest when due according to the contractual terms of the loan agreement. Factors considered by management in determining the impairment include payment status, collateral value, and the probability of collecting scheduled principal and interest payments when due. Loans that experience insignificant payment delays and payment shortfalls generally are not classified as impaired.
Management determines the significance of payment delays and payment shortfalls on a case by case basis, taking into consideration all of the circumstances surrounding the loan and the borrower, including the length of the delay, the reasons for the delay, the borrower’s prior payment record, and the amount of the shortfall in relation to the principal and interest owed. Impairment is measured on a loan-by-loan basis using the fair value of collateral if the loan is collateral dependent, the present value of expected future cash flows discounted at the loan’s effective interest rate, or the loan’s obtainable market price due to financial difficulties of the borrower.
Residential 1-4 family and consumer loans are collectively evaluated for impairment since they are not individually risk rated. Accordingly, the Company does not separately identify individual consumer loans for impairment disclosures, unless such loans are the subject of a restructuring agreement.
There were approximately $5.9 million of nonperforming loans at December 31, 2016, which was an increase from $1.5 million at December 31, 2015. There were $1.5 million of nonperforming loans at December 31, 2015, which were down from $7.0 million at
December 31, 2014.
Impaired loans were $12.5 million and $9.8 million at December 31, 2016 and December 31, 2015, respectively. Included in impaired loans at December 31, 2016 were $1.3 million in loans with valuation allowances totaling $444,000, and $11.1 million in loans without valuation allowances. Included in impaired loans at December 31, 2015 were $1.1 million in loans with valuation allowances totaling $471,000, and $8.7 million in loans without valuation allowances.
Impaired loans were $9.8 million and $15.6 million at December 31, 2015 and December 31, 2014, respectively. Included in impaired loans at December 31, 2015 were $1.1 million in loans with valuation allowances totaling $471,000, and $8.7 million in loans without valuation allowances. Included in impaired loans at December 31, 2014 were $1.4 million in loans with valuation allowances totaling $590,000, and $14.2 million in loans without valuation allowances.
41
The following presents the recorded investment in nonaccrual loans and loans past due over 90 days and still accruing:
At December 31, | |||||||||||||||
2016 | 2015 | 2014 | 2013 | 2012 | |||||||||||
Nonaccrual loans | $ | 5,856 | $ | 1,411 | $ | 6,947 | $ | 22,843 | $ | 27,941 | |||||
Accruing loans delinquent 90 days or more | — | 67 | 50 | 351 | — | ||||||||||
Nonperforming loans | 5,856 | 1,478 | 6,997 | 23,194 | 27,941 | ||||||||||
Troubled debt restructurings accruing interest | 2,228 | 2,738 | 2,814 | 3,167 | 12,817 | ||||||||||
We define potential problem loans as loans rated substandard which are still accruing interest. We do not necessarily expect to realize losses on all potential problem loans, but we recognize potential problem loans carry a higher probability of default and require additional attention by management. The aggregate principal amounts of potential problem loans as of December 31, 2016, 2015, and 2014 were approximately $19.1 million, $11.8 million, and $4.9 million, respectively. Management believes it has established an adequate allowance for probable loan losses, as appropriate under U.S. GAAP and applicable regulatory guidance.
Investment Securities
Investment securities serve to enhance the overall yield on interest earning assets while supporting interest rate sensitivity and liquidity positions, and as collateral on public funds and securities sold under agreements to repurchase. All securities are classified as “available for sale” as the Company intends to hold the securities for an indefinite period of time, but not necessarily to maturity. Securities available for sale are reported at fair value with unrealized gains or losses reported as a separate component of other comprehensive income, net of the related deferred tax effect. Purchase premiums and discounts are recognized in interest income using the interest method over the terms of the securities.
The amortized cost and fair value of securities available for sale (in thousands) are as follows:
December 31, 2016 | December 31, 2015 | December 31, 2014 | ||||||||||||||||
Amortized Cost | Fair Value | Amortized Cost | Fair Value | Amortized Cost | Fair Value | |||||||||||||
Government sponsored enterprises | $ | — | $ | — | $ | 16,284 | $ | 16,409 | $ | 30,904 | $ | 30,951 | ||||||
Residential collateralized mortgage obligations | 62,081 | 61,417 | 62,701 | 62,364 | 44,095 | 44,274 | ||||||||||||
Residential mortgage backed securities | 33,701 | 33,241 | 28,494 | 28,291 | 27,208 | 27,217 | ||||||||||||
State and political subdivisions | 108,403 | 107,540 | 96,480 | 98,540 | 65,240 | 66,245 | ||||||||||||
Total securities available for sale | $ | 204,185 | $ | 202,198 | $ | 203,959 | $ | 205,604 | $ | 167,447 | $ | 168,687 | ||||||
Available for sale securities decreased $3.4 million to $202.2 million at December 31, 2016 from $205.6 million at December 31, 2015, as the Company sold securities in order to fund loan growth during 2016. Available for sale securities increased $36.9 million to $205.6 million at December 31, 2015 from $168.7 million at December 31, 2014, as the Company continued to invest its excess cash, generated as a result of core deposit growth, in investment securities during 2015 in order to generate additional interest income.
Securities with a fair value of $121.1 million, $82.2 million and $40.5 million were pledged as collateral on public funds, securities sold under agreements or for other purposes as required or permitted by law, as of December 31, 2016, 2015 and 2014, respectively. The increase in pledged securities is a result of increases in public funds deposits, in addition to securities sold under agreements to repurchase.
The amortized cost of debt securities available for sale as of December 31, 2016, by contractual maturity are shown below (in thousands). Maturities may differ from contractual maturities in residential collateralized mortgage obligations and residential mortgage backed securities because the mortgages underlying the securities may be called or repaid without any penalties. Therefore these securities are segregated in the following maturity summary.
42
Within One Year | After One Year Within Five Years | After Five Years Within Ten Years | After Ten Years | Other Securities | |||||||||||||||||||||||
Amount | Yield | Amount | Yield | Amount | Yield | Amount | Yield | Amount | |||||||||||||||||||
Residential collateralized mortgage obligations and residential mortgage backed securities | $ | — | — | % | $ | — | — | % | $ | — | — | % | $ | — | — | % | $ | 95,782 | |||||||||
State and political subdivisions | 3,818 | 1.99 | % | 27,827 | 1.84 | % | 60,118 | 2.54 | % | 16,640 | 3.30 | % | — | ||||||||||||||
$ | 3,818 | 1.99 | % | $ | 27,827 | 1.84 | % | $ | 60,118 | 2.54 | % | $ | 16,640 | 3.30 | % | $ | 95,782 | ||||||||||
No tax-equivalent yield adjustments were made as the effect thereof was not material.
Deposits
Deposits, which include noninterest-bearing demand deposits, NOW and money market accounts, savings deposits and time deposits, are the primary source of the Bank’s funds. The Bank offers a variety of products designed to attract and retain customers, with a primary focus on building and expanding relationships. The Bank continues to focus on establishing comprehensive relationships with business borrowers, seeking deposit as well as lending relationships.
The following table sets forth the composition of our deposits at the dates indicated (dollars in thousands):
December 31, 2016 | December 31, 2015 | December 31, 2014 | |||||||||||||
Amount | Percent | Amount | Percent | Amount | Percent | ||||||||||
Noninterest bearing demand deposits | $ | 247,856 | 22.88 | % | $ | 196,063 | 22.64 | % | $ | 158,329 | 20.58 | % | |||
NOW and money market accounts | 443,727 | 40.98 | % | 336,197 | 38.82 | % | 269,977 | 35.09 | % | ||||||
Savings | 64,695 | 5.97 | % | 36,207 | 4.18 | % | 30,211 | 3.93 | % | ||||||
Time deposit certificates of $250,000 or more | 96,421 | 8.90 | % | 69,961 | 8.08 | % | 50,682 | 6.59 | % | ||||||
Time deposit certificates, $100,000 to $250,000 | 125,807 | 11.61 | % | 127,091 | 14.68 | % | 145,506 | 18.91 | % | ||||||
Other time deposit certificates | 104,650 | 9.66 | % | 100,472 | 11.60 | % | 114,705 | 14.90 | % | ||||||
Total | $ | 1,083,156 | 100.00 | % | $ | 865,991 | 100.00 | % | $ | 769,410 | 100.00 | % | |||
Total deposits increased $217.2 million to $1.1 billion at December 31, 2016, from $866.0 million at December 31, 2015. The increase was primarily related to the increased focus from lenders on core deposit generation, in addition to the acquisition of Mazon State Bank. Moreover, in 2016, there were increases in brokered deposits in response to funding needs to support the current year’s loan growth.
Total deposits increased $96.6 million to $866.0 million at December 31, 2015, from $769.4 million at December 31, 2014. The
increase was primarily related to the increase in noninterest bearing demand deposits and NOW and money market accounts, which helped to improve the Bank’s core deposits and lower the Company’s overall cost of funds. Moreover, in 2015, there were increases in brokered deposits in response to funding needs to support the current year’s loan growth.
The composition of brokered deposits included in deposits was as follows (in thousands):
December 31, 2016 | December 31, 2015 | December 31, 2014 | |||||||
NOW and money market accounts | $ | 54,971 | $ | 35,271 | $ | — | |||
Time deposit certificates | 41,169 | 11,874 | 9,145 | ||||||
$ | 96,140 | $ | 47,145 | $ | 9,145 | ||||
43
The following table sets forth our time deposits segmented by months to maturity and deposit amount (dollars in thousands):
December 31, 2016 | ||||||||||||
Time Deposits $250 and Greater | Time Deposits of $100 - $250 | Time Deposits of Less than $100 | Total | |||||||||
Months to maturity: | ||||||||||||
Three or less | $ | 26,439 | $ | 18,716 | $ | 17,044 | $ | 62,199 | ||||
Over three to six | 24,082 | 21,513 | 16,144 | 61,739 | ||||||||
Over six to twelve | 17,013 | 29,456 | 27,684 | 74,153 | ||||||||
Over twelve | 28,887 | 56,122 | 43,778 | 128,787 | ||||||||
Total | $ | 96,421 | $ | 125,807 | $ | 104,650 | $ | 326,878 | ||||
Impact of Inflation and Changing Prices
The Consolidated Financial Statements of the Company and the accompanying notes have been prepared in accordance with U.S. GAAP, which requires the measurement of financial position and operating results in terms of historical dollar amounts without considering the changes in the relative purchasing power of money over time due to inflation. The impact of inflation is reflected in the increased cost of the Company’s operations. Unlike industrial companies, nearly all of the assets and liabilities of the Company are monetary in nature. As a result, interest rates have a greater impact on the Company’s performance than do the effects of general levels of inflation. Interest rates do not necessarily move in the same direction or to the same extent as the price of goods and services.
Off-Balance Sheet Arrangements
Refer to Note 13 of our Consolidated Financial Statements for a description of off-balance sheet arrangements.
Contractual Obligations
We have entered into certain contractual obligations and other commitments. Such obligations generally relate to funding of operations through deposits, debt issuance, and property and equipment leases. The following table summarizes significant contractual obligations and other commitments as of December 31, 2016:
Certificates of Deposit | Subordinated Debt | Operating Leases | Total | |||||||||
2017 | $ | 197,883 | $ | — | $ | 103 | $ | 197,986 | ||||
2018 | 96,129 | — | 103 | 96,232 | ||||||||
2019 | 21,282 | — | 103 | 21,385 | ||||||||
2020 | 4,304 | — | 103 | 4,407 | ||||||||
2021 | 7,280 | 5,500 | 103 | 12,883 | ||||||||
Thereafter | — | 9,800 | 485 | 10,285 | ||||||||
$ | 326,878 | $ | 15,300 | $ | 1,000 | $ | 343,178 | |||||
Commitments to extend credit and standby letters of credit | $ | 276,825 | ||||||||||
44
Liquidity and Capital Resources
Our goal in liquidity management is to satisfy the cash flow requirements of depositors and borrowers as well as our operating cash needs with cost-effective funding. Our Board of Directors has established an Asset/Liability Policy in order to achieve and maintain earnings performance consistent with long-term goals while maintaining acceptable levels of interest rate risk, a “well-capitalized” balance sheet, and adequate levels of liquidity. This policy designates the Bank’s Asset/Liability Committee (“ALCO”) as the body responsible for meeting these objectives. The ALCO, which includes members of management, reviews liquidity on a periodic basis and approves significant changes in strategies that affect balance sheet or cash flow positions.
Overall deposit levels are monitored on a constant basis as are liquidity policy levels. Primary sources of liquidity include cash and due from banks, short-term investments such as federal funds sold, securities sold under agreements to repurchase, and our investment portfolio, which can also be used as collateral on public funds. Alternative sources of funds include unsecured federal funds lines of credit through correspondent banks, brokered deposits, and FHLB advances. The Bank has established contingency plans in the event of extraordinary fluctuations in cash resources.
The following table reflects the average daily outstanding, year-end outstanding, maximum month-end outstanding and weighted average rates paid for each of the categories of short-term borrowings:
December 31, | |||||||||
2016 | 2015 | 2014 | |||||||
(Dollars in thousands) | |||||||||
Securities sold under agreements to repurchase: | |||||||||
Balance: | |||||||||
Average daily outstanding | $ | 22,966 | $ | 30,849 | $ | 29,081 | |||
Outstanding at end of period | 24,153 | 25,069 | 29,059 | ||||||
Maximum month-end outstanding | 25,488 | 374,474 | 32,668 | ||||||
Rate: | |||||||||
Weighted average interest rate during the year | 0.17 | % | 0.15 | % | 0.10 | % | |||
Weighted average interest rate at end of the period | 0.16 | % | 0.16 | % | 0.10 | % | |||
FHLB borrowings: | |||||||||
Balance: | |||||||||
Average daily outstanding | $ | 33,058 | $ | 1,686 | $ | 1,017 | |||
Outstanding at end of period | 27,000 | 16,000 | — | ||||||
Maximum month-end outstanding | 72,100 | 16,000 | 5,000 | ||||||
Rate: | |||||||||
Weighted average interest rate during the year | 0.38 | % | 0.18 | % | 0.13 | % | |||
Weighted average interest rate at end of the period | 0.70 | % | 0.24 | % | — | % | |||
Provisions of the Illinois banking laws place restrictions upon the amount of dividends that can be paid to the Company by the Bank. The availability of dividends may be further limited because of the need to maintain capital ratios satisfactory to applicable regulatory agencies. As of December 31, 2016, the Bank was permitted to pay dividends due to having retained earnings of $13.9 million. Dividends of $11.3 million were paid by the Bank to the Company during the year ended December 31, 2016 and were used to pay down outstanding secured borrowings.
The Company and Bank are subject to various regulatory capital requirements administered by the federal banking agencies. Failure to meet minimum capital requirements can initiate certain mandatory and possibly additional discretionary actions by regulators that, if undertaken, could have a direct material effect on the Company’s and Bank’s financial results and condition. Under capital adequacy guidelines and the regulatory framework for prompt corrective action, the Company and the Bank must meet specific capital guidelines that involve quantitative measures of assets, liabilities, and certain off-balance-sheet items as calculated under regulatory accounting practices. The capital amounts and classifications are also subject to qualitative judgments by the regulators about components, risk weightings, and other factors. Prompt corrective action provisions are not applicable to bank holding companies.
Quantitative measures established by regulation to ensure capital adequacy require the Company and the Bank to maintain minimum amounts and ratios of total, common equity, Tier 1 capital and Tier 1 capital to risk-weighted assets, and Tier 1 capital to average assets, each as defined in the applicable regulations. Management believes that as of December 31, 2016 and
45
December 31, 2015, the Company and the Bank each met all of their respective capital adequacy requirements. See Note 14 to our Consolidated Financial Statements for more information.
Critical Accounting Policies and Estimates
Business Combinations and Valuations of Loans Acquired in Business Combinations
We account for acquisitions under Financial Accounting Standards Board (“FASB”) Accounting Standards Codification (“ASC”) Topic 805, Business Combinations, which requires the use of the acquisition method of accounting. Assets acquired and liabilities assumed in a business combination are recorded at estimated fair value on their purchase date. As provided for under GAAP, management has up to 12 months following the date of acquisition to finalize any provisional fair values of acquired assets and assumed liabilities, where it was not possible to estimate the acquisition date fair value upon consummation. No such provisional fair values were made at the acquisition of Mazon State Bank.
The valuation of acquired loans involves significant estimates, assumptions and judgments based on information available as of the acquisition date. Substantially all loans acquired in the transaction are evaluated either individually or in pools of loans with similar characteristics; since the estimated fair value of acquired loans includes a credit consideration, no carryover of any previously recorded allowance for loan losses is recorded at acquisition. A number of factors are considered in determining the estimated fair value of purchased loans including, among other things, the remaining life of the acquired loans, estimated prepayments, estimated loss ratios, estimated value of the underlying collateral, estimated holding periods, contractual interest rates compared to market interest rates, and net present value of cash flows expected to be received.
In assessing the credit quality of the acquired loans, management determined that no loans met the definition of purchased credit impaired as of the acquisition date of Mazon State Bank. Accordingly, the difference between the principal balance of loans outstanding and the fair value of acquired loans is accreted into income using the effective yield method over the life of the loans.
Core Deposit Intangible
Core deposit base premiums represent the value of the acquired customer core deposit bases and are included in as an asset on the consolidated balance sheets. The core deposit intangible has an estimated finite life, is amortized on a straight line basis over a 84-month period, and is subject to periodic impairment evaluation. Management will periodically review the carrying value of its long-lived and intangible assets to determine if any impairment has occurred or whether changes in circumstances have occurred that would require a revision to the remaining useful life, in which case an impairment charge would be recorded as an expense in the period of impairment. In making such determination, management evaluates whether there are any adverse qualitative factors indicating that an impairment may exist, as well as the performance, on an undiscounted basis, of the underlying operations or assets which give rise to the intangible. Given that the acquisition of Mazon State Bank took place during the third quarter of 2016, there was no impairment charge to the Company’s core deposit intangible at December 31, 2016. The net book value of core deposit intangible was $759,000 and $0 at December 31, 2016 and 2015, respectively and is included in other assets on the consolidated balance sheets.
Allowance for Loan and Lease Losses
The allowance for loan and lease losses is established as losses are estimated to have occurred through a provision for loan losses charged to earnings. Loan losses are charged against the allowance when management believes the uncollectibility of a loan balance is confirmed. Subsequent recoveries, if any, are credited to the allowance. When establishing the allowance for loan and lease losses, management categorizes loans into risk categories generally based on the nature of the collateral and the basis of repayment.
The allowance for loan and lease losses is evaluated on a regular basis by management and is based upon management’s periodic review of the collectibility of the loans in light of historical experience, the nature and volume of the loan portfolio, adverse situations that may affect the borrower’s ability to repay, estimated value of any underlying collateral and prevailing economic conditions. This evaluation is inherently subjective as it requires estimates that are susceptible to significant revision as more information becomes available. In addition, regulatory agencies, as an integral part of their examination process, periodically review the Company’s allowance for loan and lease losses, and may require the Company to recognize adjustments to its allowance based on their judgments of information available to them at the time of their examinations.
46
The allowance consists of specific and general components. The specific component relates to loans that are classified as either doubtful or substandard. For such loans that are classified as impaired, an allowance is established when the collateral value, discounted cash flows or observable market price of the impaired loan is lower than the carrying value of that loan. The general component covers nonclassified loans and is based on historical loss experience adjusted for qualitative factors. These qualitative factors consider local economic trends, concentrations, management experience, and other elements of the Company’s lending operations.
Foreclosed Assets
Assets acquired through loan foreclosure or other proceedings are initially recorded at fair value less estimated selling costs at the date of foreclosure, establishing a new cost basis. After foreclosure, foreclosed assets are held for sale and are carried at the lower of cost or fair value less estimated costs of disposal. Any valuation adjustments required at the date of transfer are charged to the allowance for loan and lease losses. Subsequently, unrealized losses and realized gains and losses on sales are included in other noninterest income. Operating results from foreclosed assets are recorded in other noninterest expense.
Income taxes
Deferred taxes are provided using the liability method. Deferred tax assets are recognized for deductible temporary differences, operating loss and tax credit carryforwards while deferred tax liabilities are recognized for taxable temporary differences. Temporary differences are the differences between the reported amounts of assets and liabilities and their tax basis. Deferred tax assets are reduced by a valuation allowance when, in the opinion of management, it is more-likely-than-not that some portion or all of the deferred tax assets will not be realized. Deferred tax assets and liabilities are adjusted for the effects of changes in tax laws and rates on the date of enactment.
The Company follows the accounting guidance related to accounting for uncertainty in income taxes, which sets out a consistent framework to determine the appropriate level of tax reserves to maintain for uncertain tax positions. There were no uncertain tax positions as of December 31, 2016 and December 31, 2015.
Deferred income tax expense results from changes in deferred tax assets and liabilities between periods. Deferred tax assets are recognized or sustained upon examination. The term more-likely-than-not means a likelihood of more than 50 percent; the terms examined and upon examination also include resolution of the related appeals or litigation processes, if any. A tax position that meets the more-likely-than-not recognition threshold is initially and subsequently measured as the largest amount of taxing authority that has full knowledge of all relevant information. The determination of whether or not a tax position has met the more-likely-than-not recognition threshold considers the facts, circumstances, and information available at the reporting date and is subject to management’s judgment. Deferred tax assets are reduced by a valuation allowance if, based on the weight of evidence available, it is more-likely-than-not that some portion or all of a deferred tax asset will not be realized.
47
Item 7A. Quantitative and Qualitative Disclosures about Market Risk
Market risk refers to potential losses arising from changes in interest rates. We are exposed to interest rate risk inherent in our lending and deposit taking activities as a financial institution. We offer an extensive variety of financial products to meet the diverse needs of our clients. These products sometimes contribute to interest rate risk for us when product groups do not complement one another. For example, depositors may want short-term deposits while borrower desire long-term loans. Changes in market interest rates may also result in changes in the fair value of our financial instruments, cash flows, and net interest income.
Interest rate risk is comprised of repricing risk, basis risk, yield curve risk and options risk. Repricing risk arises from
differences in the cash flow or repricing between asset and liability portfolios. Basis risk arises when asset and liability
portfolios are related to different market rate indexes, which do not always change by the same amount. Yield curve risk arises
when assets and liability portfolios are related to different maturities on a given yield curve; when the yield curve changes shape, the risk position is altered. Options risk arises from “embedded options” within asset and liability products because some borrowers have the option to prepay their loans when rates fall while some depositors can redeem their certificates of deposit early when rates rise.
We have established an ALCO for the Bank, which is responsible for the Bank's interest rate risk management. We have implemented a sophisticated asset/liability model at the Bank to measure interest rate risk. Interest rate risk measures include earnings simulation, economic value of equity (“EVE”) and gap analysis.
Gap analysis and EVE are static measures that do not incorporate assumptions regarding future business. Gap analysis, while a helpful diagnostic tool, displays cash flows for only a single rate environment. EVE's long-term horizon helps identify changes in optionality and longer-term positions. However, EVE's liquidation perspective does not translate into the earnings-based measures that are the focus of managing and valuing a going concern. Net interest income simulations explicitly measure the exposure to earnings from changes in market rates of interest. Our current financial position is combined with assumptions regarding future business to calculate net interest income under various hypothetical rate scenarios. The Bank's ALCO reviews earnings simulations over the ensuing 12 and 24 months under various interest rate scenarios. Reviewing these various measures provides us with a reasonably comprehensive view of our interest rate risk profile.
The following gap analysis compares the difference between the amount of interest earning assets and interest bearing liabilities subject to repricing over a period of time. A ratio of more than one indicates a higher level of repricing assets over repricing liabilities for the time period. Conversely, a ratio of less than one indicates a higher level of repricing liabilities over repricing assets for the time period.
48
The table below does not include unrealized gains on investment securities of $657,000 at December 31, 2016, in rate sensitive assets.
December 31, 2016 | |||||||||||||||
0-3 Months | 3-12 Months | 12-60 Months | > 60 Months | Total | |||||||||||
Rate Sensitive Assets | |||||||||||||||
Interest-Bearing Deposits with Bank | $ | 8,548 | $ | — | $ | — | $ | — | $ | 8,548 | |||||
Investment Securities | 5,035 | 11,177 | 75,610 | 112,362 | 204,184 | ||||||||||
Loans | 378,124 | 165,901 | 326,443 | 124,579 | 995,047 | ||||||||||
Non-Marketable Equity Securities | 3,297 | — | — | — | 3,297 | ||||||||||
Total Rate Sensitive Assets | $ | 395,004 | $ | 177,078 | $ | 402,053 | $ | 236,941 | $ | 1,211,076 | |||||
Rate Sensitive Liabilities | |||||||||||||||
NOW Accounts | $ | 5,677 | $ | 17,032 | $ | 68,130 | $ | 70,022 | $ | 160,861 | |||||
Money Market Accounts | 85,037 | 80,930 | 116,898 | — | 282,865 | ||||||||||
Savings | 7,763 | 23,290 | 33,641 | — | 64,694 | ||||||||||
Time Deposits | 62,186 | 135,698 | 121,714 | 7,280 | 326,878 | ||||||||||
Total Interest Bearing Deposits | 160,663 | 256,950 | 340,383 | 77,302 | 835,298 | ||||||||||
Borrowed Funds | 27,818 | 2,557 | 16,442 | 19,602 | 66,419 | ||||||||||
Total Rate Sensitive Liabilities | $ | 188,481 | $ | 259,507 | $ | 356,825 | $ | 96,904 | $ | 901,717 | |||||
Cumulative Gap Report Summary Information | |||||||||||||||
Rate Sensitive Assets (RSA) | $ | 395,004 | $ | 572,082 | $ | 974,135 | $ | 1,211,076 | $ | 1,211,076 | |||||
Rate Sensitive Liabilities (RSL) | 188,481 | 447,988 | 804,813 | 901,717 | 901,717 | ||||||||||
Cumulative Gap (GAP=RSA-RSL) | 206,523 | 124,094 | 169,322 | 309,359 | 309,359 | ||||||||||
Total Assets | $ | 1,268,210 | |||||||||||||
RSA/RSL | 2.10 | 1.28 | 1.21 | 1.34 | 1.34 | ||||||||||
RSA/Assets | 31.15 | % | 45.11 | % | 76.81 | % | 95.49 | % | 95.49 | % | |||||
RSL/Assets | 14.86 | % | 35.32 | % | 63.46 | % | 71.10 | % | 71.10 | % | |||||
Gap/Assets | 16.28 | % | 9.78 | % | 13.35 | % | 24.39 | % | 24.39 | % | |||||
Gap/RSA | 52.28 | % | 21.69 | % | 17.38 | % | 25.54 | % | 25.54 | % | |||||
49
Item 8. Financial Statements and Supplementary Data
FIRST COMMUNITY FINANCIAL PARTNERS, INC.
CONSOLIDATED FINANCIAL STATEMENTS
December 31, 2016, 2015 and 2014
INDEX
Page | |
REPORT OF INDEPENDENT REGISTERED PUBLIC ACCOUNTING FIRM | |
FINANCIAL STATEMENTS | |
50
51
PART I. FINANCIAL INFORMATION
Item 1. Financial Statements
First Community Financial Partners, Inc. and Subsidiaries | ||||||
Consolidated Balance Sheets | December 31, | |||||
2016 | 2015 | |||||
Assets | (in thousands, except per share data) | |||||
Cash and due from banks | $ | 16,225 | $ | 10,699 | ||
Interest-bearing deposits in banks | 8,548 | 7,406 | ||||
Securities available for sale | 202,198 | 205,604 | ||||
Non-marketable equity securities | 3,297 | 1,367 | ||||
Mortgage loans held for sale | 1,230 | 400 | ||||
Loans held for sale | 1,085 | — | ||||
Loans, net of allowance for loan and lease losses of $11,684 in 2016; $11,741 in 2015 | 979,934 | 760,578 | ||||
Premises and equipment, net | 22,214 | 18,529 | ||||
Foreclosed assets | 725 | 5,487 | ||||
Cash surrender value of life insurance | 19,476 | 16,561 | ||||
Deferred tax asset, net | 6,613 | 9,191 | ||||
Accrued interest receivable and other assets | 6,665 | 4,830 | ||||
Total assets | $ | 1,268,210 | $ | 1,040,652 | ||
Liabilities and Shareholders’ Equity | ||||||
Liabilities | ||||||
Deposits | ||||||
Noninterest bearing | $ | 247,856 | $ | 196,063 | ||
Interest bearing | 835,300 | 669,928 | ||||
Total deposits | 1,083,156 | 865,991 | ||||
Other borrowed funds | 51,153 | 53,015 | ||||
Subordinated debt | 15,300 | 15,300 | ||||
Accrued interest payable and other liabilities | 4,886 | 3,305 | ||||
Total liabilities | 1,154,495 | 937,611 | ||||
Concentrations, Commitments and Contingencies (Note 13) | ||||||
First Community Financial Partners, Inc. Shareholders’ Equity | ||||||
Common stock, $1.00 par value; 60,000,000 shares authorized; 17,242,645 issued and outstanding at December 31, 2016 and 17,026,941 issued and outstanding at December 31, 2015 | 17,243 | 17,027 | ||||
Additional paid-in capital | 83,777 | 82,211 | ||||
Retained earnings | 13,907 | 2,800 | ||||
Accumulated other comprehensive income (loss) | (1,212 | ) | 1,003 | |||
Total shareholders' equity | 113,715 | 103,041 | ||||
Total liabilities and shareholders' equity | $ | 1,268,210 | $ | 1,040,652 | ||
See Notes to Consolidated Financial Statements. | ||||||
52
First Community Financial Partners, Inc. and Subsidiaries | |||||||||
Consolidated Statements of Operations | |||||||||
Years Ended December 31, | |||||||||
2016 | 2015 | 2014 | |||||||
Interest income: | (in thousands, except share data) | ||||||||
Loans, including fees | $ | 38,424 | $ | 32,525 | $ | 32,066 | |||
Securities | 4,217 | 4,134 | 3,104 | ||||||
Federal funds sold and other | 136 | 66 | 78 | ||||||
Total interest income | 42,777 | 36,725 | 35,248 | ||||||
Interest expense: | |||||||||
Deposits | 4,128 | 3,923 | 4,439 | ||||||
Federal funds purchased and other borrowed funds | 385 | 215 | 68 | ||||||
Subordinated debt | 1,188 | 1,800 | 1,841 | ||||||
Total interest expense | 5,701 | 5,938 | 6,348 | ||||||
Net interest income | 37,076 | 30,787 | 28,900 | ||||||
Provision for loan losses | 1,066 | (2,077 | ) | 3,000 | |||||
Net interest income after provision for loan losses | 36,010 | 32,864 | 25,900 | ||||||
Noninterest income: | |||||||||
Service charges on deposit accounts | 985 | 756 | 677 | ||||||
Gain on sale of loans | 16 | — | 39 | ||||||
Gain on sale of securities | 617 | 484 | 912 | ||||||
Gain on foreclosed assets, net | — | — | 19 | ||||||
Mortgage fee income | 570 | 531 | 402 | ||||||
Bargain purchase gain | 1,920 | — | — | ||||||
Other | 1,359 | 726 | 1,244 | ||||||
5,467 | 2,497 | 3,293 | |||||||
Noninterest expenses: | |||||||||
Salaries and employee benefits | 14,688 | 11,538 | 11,191 | ||||||
Occupancy and equipment expense | 1,982 | 1,977 | 2,111 | ||||||
Data processing | 1,914 | 912 | 959 | ||||||
Professional fees | 1,422 | 1,201 | 1,283 | ||||||
Advertising and business development | 1,050 | 853 | 845 | ||||||
Losses on sale and writedowns of foreclosed assets, net | 48 | 187 | 434 | ||||||
Foreclosed assets expenses, net of rental income | 40 | 130 | 219 | ||||||
Other expense | 4,902 | 3,744 | 3,531 | ||||||
26,046 | 20,542 | 20,573 | |||||||
Income before income taxes | 15,431 | 14,819 | 8,620 | ||||||
Income taxes | 4,324 | 5,000 | 2,737 | ||||||
Net income | 11,107 | 9,819 | 5,883 | ||||||
Dividends and accretion on preferred shares | — | — | (526 | ) | |||||
Gain on redemption of preferred shares | — | — | 5 | ||||||
Net income attributable to First Community Financial Partners, Inc. | $ | 11,107 | $ | 9,819 | $ | 5,362 | |||
Common share data | |||||||||
Basic earnings per common share | $ | 0.65 | $ | 0.58 | $ | 0.32 | |||
Diluted earnings per common share | 0.64 | 0.57 | 0.32 | ||||||
Weighted average common shares outstanding for basic earnings per common share | 17,184,432 | 16,939,010 | 16,515,489 | ||||||
Weighted average common shares outstanding for diluted earnings per common share | 17,630,600 | 17,085,752 | 16,741,215 | ||||||
See Notes to Consolidated Financial Statements. | |||||||||
53
First Community Financial Partners, Inc. and Subsidiaries | |||||||||
Consolidated Statements of Comprehensive Income | |||||||||
Years Ended December 31, | |||||||||
2016 | 2015 | 2014 | |||||||
(in thousands) | |||||||||
Net income | $ | 11,107 | $ | 9,819 | $ | 5,883 | |||
Unrealized holding gains on investment securities | (3,015 | ) | 889 | 1,619 | |||||
Reclassification adjustments for gains included in net income | (617 | ) | (484 | ) | (912 | ) | |||
Tax effect of realized and unrealized gains and losses on investment securities | 1,417 | (158 | ) | (276 | ) | ||||
Other comprehensive income (loss), net of tax | (2,215 | ) | 247 | 431 | |||||
Comprehensive income | $ | 8,892 | $ | 10,066 | $ | 6,314 | |||
See Notes to Consolidated Financial Statements. | |||||||||
54
First Community Financial Partners, Inc. and Subsidiaries | ||||||||||||||||||||||
Consolidated Statements of Shareholders’ Equity | ||||||||||||||||||||||
Years Ended December 31, 2016, 2015 and 2014 | ||||||||||||||||||||||
Series B Preferred Stock | Series C Preferred Stock | Common Stock | Additional Paid-In Capital | Retained earnings (accumulated deficit) | Accumulated Other Comprehensive Income (loss) | Total | ||||||||||||||||
(in thousands, except share data) | ||||||||||||||||||||||
Balance, December 31, 2013 | $ | 5,176 | $ | 892 | $ | 16,334 | $ | 81,241 | $ | (12,381 | ) | $ | 325 | $ | 91,587 | |||||||
Net income | — | — | — | — | 5,883 | — | 5,883 | |||||||||||||||
Other comprehensive income, net of tax | — | — | — | — | — | 431 | 431 | |||||||||||||||
Repurchase of preferred shares | (5,176 | ) | (1,093 | ) | — | — | 5 | — | (6,264 | ) | ||||||||||||
Discount accretion on preferred shares | — | 201 | — | — | (201 | ) | — | |||||||||||||||
Dividends on preferred shares | — | — | — | (325 | ) | (325 | ) | |||||||||||||||
Issuance of 334,420 shares of common stock for restricted stock awards and amortization | — | — | 334 | (421 | ) | — | (87 | ) | ||||||||||||||
Stock based compensation expense | — | — | — | 828 | — | 828 | ||||||||||||||||
Balance, December 31, 2014 | — | — | 16,668 | 81,648 | (7,019 | ) | 756 | 92,053 | ||||||||||||||
Net income | — | — | — | — | 9,819 | — | 9,819 | |||||||||||||||
Other comprehensive income, net of tax | — | — | — | — | — | 247 | 247 | |||||||||||||||
Issuance of 306,189 shares of common stock for restricted stock awards and amortization | — | — | 306 | (310 | ) | — | — | (4 | ) | |||||||||||||
Issuance of 52,750 shares of common stock for exercise of warrants | — | — | 53 | 178 | — | — | 231 | |||||||||||||||
Reclass of warrants upon redemption of subordinated debt, net of amortization | — | — | — | (214 | ) | — | — | (214 | ) | |||||||||||||
Stock based compensation expense | — | — | — | 909 | — | — | 909 | |||||||||||||||
Balance, December 31, 2015 | — | — | 17,027 | 82,211 | 2,800 | 1,003 | 103,041 | |||||||||||||||
Net income | — | — | — | — | 11,107 | — | 11,107 | |||||||||||||||
Other comprehensive loss, net of tax | — | — | — | — | — | (2,215 | ) | (2,215 | ) | |||||||||||||
Issuance of 139,684 shares of common stock for restricted stock awards and amortization | — | — | 140 | (173 | ) | — | — | (33 | ) | |||||||||||||
Issuance of 27,500 shares of common stock for exercise of warrants | — | — | 27 | 88 | — | — | 115 | |||||||||||||||
Reclass of warrants upon redemption of subordinated debt, net of amortization | — | — | 49 | 310 | — | — | 359 | |||||||||||||||
Tax windfall benefit | — | — | — | 64 | — | — | 64 | |||||||||||||||
Stock based compensation expense | — | — | — | 1,277 | — | — | 1,277 | |||||||||||||||
Balance, December 31, 2016 | $ | — | $ | — | $ | 17,243 | $ | 83,777 | $ | 13,907 | $ | (1,212 | ) | $ | 113,715 | |||||||
See Notes to Consolidated Financial Statements. | ||||||||||||||||||||||
55
First Community Financial Partners, Inc. and Subsidiaries | |||||||||
Consolidated Statements of Cash Flows | |||||||||
For the years ended December 31, 2016, 2015 and 2014 | Years Ended December 31, | ||||||||
2016 | 2015 | 2014 | |||||||
(in thousands) | |||||||||
Cash Flows From Operating Activities | |||||||||
Net income applicable to First Community Financial Partners, Inc. | $ | 11,107 | $ | 9,819 | $ | 5,883 | |||
Adjustments to reconcile net income to net cash provided by operating activities: | |||||||||
Net amortization of securities | 2,082 | 1,929 | 737 | ||||||
Provision for loan losses | 1,066 | (2,077 | ) | 3,000 | |||||
Bargain purchase gain | (1,920 | ) | — | — | |||||
Gain on sale of foreclosed assets, net | — | (13 | ) | (19 | ) | ||||
Writedown of foreclosed assets | 48 | 200 | 434 | ||||||
Net accretion (amortization) of deferred loan fees | 205 | 87 | (75 | ) | |||||
Warrant accretion | — | 6 | 28 | ||||||
Depreciation and amortization of premises and equipment | 1,183 | 1,293 | 1,250 | ||||||
Realized gains on sales of available for sale securities, net | (617 | ) | (484 | ) | (912 | ) | |||
Proceeds from life insurance | — | — | 412 | ||||||
Increase in cash surrender value of life insurance | (598 | ) | (12,238 | ) | (222 | ) | |||
Amortization of core deposit intangible | 58 | — | — | ||||||
Deferred income taxes | 2,723 | 4,884 | 2,273 | ||||||
Proceeds from sale of loans | 169 | — | 9,446 | ||||||
Gain on sale of loans | (16 | ) | — | (39 | ) | ||||
Net decrease (increase) in mortgage loans held for sale | (830 | ) | 338 | (738 | ) | ||||
Net decrease (increase) in loans held for sale | (1,085 | ) | — | 2,619 | |||||
Increase in accrued interest receivable and other assets | (423 | ) | (286 | ) | (378 | ) | |||
Decrease in accrued interest payable and other liabilities | 1,253 | (411 | ) | (1,858 | ) | ||||
Restricted stock compensation expense | 936 | 838 | 828 | ||||||
Stock option compensation expense | 341 | 71 | — | ||||||
Net cash provided by operating activities | 15,682 | 3,956 | 22,669 | ||||||
Cash Flows From Investing Activities | |||||||||
Acquisition payment, net of cash acquired | (2,746 | ) | — | — | |||||
Net change in interest bearing deposits in banks | (1,142 | ) | 12,261 | 9,625 | |||||
Net change in fed funds sold | 550 | — | — | ||||||
Activity in available for sale securities: | |||||||||
Purchases | (26,544 | ) | (88,757 | ) | (126,494 | ) | |||
Maturities, prepayments and calls | 14,796 | 20,350 | 28,408 | ||||||
Sales | 49,234 | 30,450 | 71,597 | ||||||
Purchases of non-marketable equity securities | (1,796 | ) | — | (400 | ) | ||||
Net increase in loans | (188,761 | ) | (86,591 | ) | (51,405 | ) | |||
Purchases of premises and equipment | (675 | ) | (453 | ) | (4,239 | ) | |||
Proceeds from sale of foreclosed assets | 4,723 | 147 | 1,567 | ||||||
Net cash used in investing activities | (152,361 | ) | (112,593 | ) | (71,341 | ) | |||
Cash Flows From Financing Activities | |||||||||
Net increase in deposits | 144,067 | 96,581 | 44,009 | ||||||
Cash paid on redemption of subordinated debt | — | (14,060 | ) | — | |||||
Net increase (decrease) in other borrowings | (1,862 | ) | 23,486 | 3,966 | |||||
Proceeds from issuance of subordinated debt | — | — | 9,800 | ||||||
Dividends paid on preferred shares | — | — | (325 | ) | |||||
Repurchase of preferred shares | — | — | (6,264 | ) | |||||
Net cash provided by financing activities | 142,205 | 106,007 | 51,186 | ||||||
Net change in cash and due from banks | 5,526 | (2,630 | ) | 2,514 | |||||
Cash and due from banks: | |||||||||
Beginning | 10,699 | 13,329 | 10,815 | ||||||
Ending | $ | 16,225 | $ | 10,699 | $ | 13,329 | |||
56
Supplemental Disclosures of Cash Flow Information | |||||||||
Cash payments for interest | $ | 5,680 | $ | 6,421 | $ | 6,428 | |||
Supplemental Schedule of Noncash Investing and Financing Activities | |||||||||
Transfer of loans to foreclosed assets | — | 3,291 | 96 | ||||||
See Notes to Consolidated Financial Statements. | |||||||||
57
Notes to Consolidated Financial Statements
Note 1. | Summary of Significant Accounting Policies |
Principles of consolidation: The consolidated financial statements include the accounts of First Community Financial Partners, Inc. (the “Company” or “First Community”) and its subsidiaries, including its wholly-owned bank subsidiary, First Community Financial Bank (the “Bank”), based in Joliet, Illinois, and other wholly-owned real estate holding entities.
All significant intercompany balances and transactions have been eliminated in consolidation.
Nature of operations: First Community is a bank holding company providing a full range of financial services to individuals and corporate clients through the Bank.
Use of estimates: In preparing consolidated financial statements in conformity with accounting principles generally accepted in the United States of America, management is required to make estimates and assumptions that affect the reported amounts of assets and liabilities as of the date of the balance sheet and reported amounts of revenues and expenses during the reporting period. Actual results could differ from those estimates. Material estimates that are particularly susceptible to significant change in the near term relate to the determination of the allowance for loan and lease losses, valuation of foreclosed assets, and the valuation of deferred tax assets.
Presentation of cash flows: For purposes of the statements of cash flows, cash and cash equivalents include cash on hand, cash items and balances due from banks. Cash flows from federal funds sold, interest bearing deposits in banks, loans originated by the Company, deposits and other borrowings are reported as net increases or decreases.
Interest-bearing deposits in banks: Interest bearing deposits in banks mature within one year and are carried at cost.
Securities: All securities are classified as available for sale as the Company intends to hold the securities for an indefinite period of time, but not necessarily to maturity. Securities available for sale are reported at fair value with unrealized gains or losses reported as a separate component of other comprehensive income, net of the related deferred tax effect. Purchase premiums and discounts are recognized in interest income using the interest method over the terms of the securities.
Declines in the fair value of individual securities available for sale below their cost that are related to credit losses are deemed to be other-than-temporary and reflected in earnings as realized losses. In determining whether other-than-temporary impairment exists, management considers many factors, including (1) the length of time and the extent to which the fair value has been less than cost, (2) the financial condition and near-term prospects of the issuer, and (3) the intent or requirement of the Company to sell its investment in the issuer prior to any anticipated recovery in fair value. Gains and losses on the sale of securities are recorded on the trade date and are determined using the specific identification method.
Non-marketable equity securities: The Company owns common stock issued by the FHLB. No ready market exists for these stocks, and they have no quoted market values. The Bank, as a member of the FHLB, is required to maintain an investment in the capital stock of the FHLB. The stock is redeemable at par value by the FHLB, and is therefore, carried at cost and periodically evaluated for impairment. The Company records dividends in income on the date received.
Loans held for sale: Loans held for sale consists of loans the Company has identified for sale. The loans are transferred from the portfolio to held for sale once the determination is made and they are carried at fair value less any costs to sell with charges being taken through the allowance for loan and lease losses.
Loans: The Company grants commercial, commercial and residential mortgage and consumer loans to clients. A substantial portion of the loan portfolio is represented by commercial and commercial mortgage loans throughout communities in Will, Grundy, DuPage, Cook, and Kane counties in Illinois. The ability of the Company’s loan clients to honor their contracts is dependent upon general economic conditions and real estate values in this area.
Loans that management has the intent and ability to hold for the foreseeable future or until maturity or pay-off generally are reported at their outstanding unpaid principal balances adjusted for charge-offs, the allowance for loan and lease losses, and any deferred fees or costs on originated loans. Interest income is accrued on the unpaid principal balance. Loan origination fees, net of certain direct origination costs, are deferred and recognized as an adjustment of the related loan yield.
58
The accrual of interest is discontinued at the time the loan is 90 days past due unless the credit is well-secured and in process of collection. Past due status is based on contractual terms of the loan. In all cases, loans are placed on non-accrual or charged-off at an earlier date if collection of principal or interest is considered doubtful.
All interest accrued but not collected for loans that are placed on non-accrual or charged-off is reversed against interest income. The interest on these loans is accounted for on the cash-basis or cost-recovery method until qualifying for return to accrual. Loans are returned to accrual status when all the principal and interest amounts contractually due are brought current and future payments are reasonably assured.
Troubled debt restructurings: Loans are accounted for as troubled debt restructurings (“TDRs”) when a borrower is experiencing financial difficulties that leads to a restructuring of the loan, and the Company grants a “concession” to the borrower that they would not otherwise consider. These concessions include a modification of terms such as a reduction of the stated interest rate or loan balance, a reduction of accrued interest, an extension of the maturity date at an interest rate lower than a current market rate for a new loan with similar risk, or some combination thereof to facilitate repayment.
TDRs are classified as impaired loans. TDRs are reviewed at the time of modification and on a quarterly basis to determine if a specific reserve is needed. The carrying amount of the loan is compared to the expected payments to be received, discounted at the loan’s original rate, or for collateral dependent loans, to the fair value of the collateral. Any shortfall is recorded as a specific reserve. Payment performance prior and subsequent to the restructuring is taken into account in assessing whether it is likely that the borrower can meet the new terms. A period of sustained repayment for at least six months generally is required for return to accrual status. This may result in the loan being returned to accrual at the time of restructuring. A loan that is modified at a market rate of interest will not be classified as a TDR in the calendar year subsequent to the restructuring if it is in compliance with the modified terms.
Allowance for loan and lease losses: The allowance for loan and lease losses is established as losses are estimated to have occurred through a provision for loan losses charged to earnings. Loan losses are charged against the allowance when management believes the uncollectibility of a loan balance is confirmed. Subsequent recoveries, if any, are credited to the allowance.
When establishing the allowance for loan and lease losses, management categorizes loans into risk categories generally based on the nature of the collateral and the basis of repayment. These risk categories and the relevant risk characteristics are as follows:
Construction and land development loans are underwritten utilizing feasibility studies, independent appraisal reviews, sensitivity analyses of absorption and lease rates, and financial analyses of the developers and property owners. Construction and land development loans are generally based upon estimates of costs and value associated with the completed project. Construction and land development loans often involve the disbursement of substantial funds with repayment primarily dependent upon the success of the completed project. Sources of repayment for these types of loans may be permanent loans from long-term lenders, sales of developed property, or an interim loan commitment until permanent financing is obtained. Generally, these loans have a higher risk profile than other real estate loans due to their repayment being sensitive to real estate values, interest rate changes, governmental regulation of real property, demand and supply of alternative real estate, the availability of long-term financing, and changes in general economic conditions.
Commercial loans are underwritten after evaluating and understanding the borrower’s ability to operate profitably and prudently expand its business. Underwriting standards are designed to ensure repayment of loans and mitigate loss exposure. As part of the underwriting process, the Company examines current and projected cash flows to determine the ability of the borrower to repay its obligation as agreed. Commercial loans are primarily made based on the identified cash flows of the borrower and secondarily on the underlying collateral provided by the borrower. The cash flows of the borrower, however, may not be as expected, and the collateral securing these loans may fluctuate in value. Most commercial loans are secured by the assets being financed or other business assets, such as accounts receivable or inventory, and usually incorporate a personal guarantee. However, some short-term loans may be made on an unsecured basis. In the case of loans secured by accounts receivable, the availability of funds for the repayment of these loans may be substantially dependent upon the ability of the borrower to collect amounts due from its customers. Agricultural production loans are subject to underwriting standards and processes similar to commercial loans.
Commercial real estate loans are subject to underwriting standards and processes similar to commercial loans, in addition to those standards and processes specific to real estate loans. These loans are viewed primarily as cash flow loans and secondarily as loans secured by real estate. Commercial real estate lending typically involves higher loan principal amounts, and the repayment of these loans is largely dependent upon the successful operation of the property securing the loan or the business
59
conducted on the property securing the loan. Commercial real estate loans may be more adversely affected by conditions in the real estate market or in the general economy. The properties securing the Company’s commercial real estate portfolio are diverse in terms of type and geographic location within Will, Grundy, Dupage, Cook and Kane counties and their surrounding communities. Management monitors and evaluates commercial real estate loans based on cash flow, collateral, geography, and risk grade criteria. Farmland loans are subject to underwriting standards and processes similar to commercial real estate loans.
Residential 1-4 family and consumer loans are underwritten by evaluating the credit history of the borrower, the ability of the borrower to meet the debt service requirements of the loan and total debt obligations, as well as the underlying collateral and the loan to collateral value. Underwriting standards for home equity loans are heavily influenced by statutory requirements, which include, but are not limited to, loan-to-value and affordability ratios, risk-based pricing strategies, and documentation requirements. Included in the Company’s residential 1-4 family loans are loans made to investors. These loans are underwritten using the same criteria as other residential 1-4 family loans.
The allowance for loan and lease losses is evaluated on a regular basis by management and is based upon management’s periodic review of the collectibility of the loans in light of historical experience, the nature and volume of the loan portfolio, adverse situations that may affect the borrower’s ability to repay, estimated value of any underlying collateral and prevailing economic conditions. This evaluation is inherently subjective as it requires estimates that are susceptible to significant revision as more information becomes available. In addition, regulatory agencies, as an integral part of their examination process, periodically review the Company’s allowance for loan and lease losses, and may require the Company to recognize adjustments to its allowance based on their judgments of information available to them at the time of their examinations.
The allowance consists of specific and general components. The specific component relates to impaired loans. For loans classified as impaired, an allowance is established when the collateral value, discounted cash flows or observable market price of the impaired loan is lower than the carrying value of that loan. The general component covers non-classified loans and is based on historical loss experience adjusted for qualitative factors. These qualitative factors consider local economic trends, concentrations, management experience, and other elements of the Company’s lending operations.
A loan is considered impaired when, based on current information and events, it is probable that the Company will be unable to collect the scheduled payments of principal or interest when due according to the contractual terms of the loan agreement. Factors considered by management in determining the impairment include payment status, collateral value, and the probability of collecting scheduled principal and interest payments when due. Loans that experience insignificant payment delays and payment shortfalls generally are not classified as impaired.
Management determines the significance of payment delays and payment shortfalls on a case-by-case basis, taking into consideration all of the circumstances surrounding the loan and the borrower, including the length of the delay, the reasons for the delay, the borrower’s prior payment record, and the amount of the shortfall in relation to the principal and interest owed. Impairment is measured on a loan-by-loan basis by either the fair value of collateral if the loan is collateral dependent, the present value of expected future cash flows discounted at the loan’s effective interest rate, or the loan’s obtainable market price.
Residential 1-4 family and consumer loans are collectively evaluated for impairment. Accordingly, the Company does not separately identify individual consumer loans for impairment disclosures, unless such loans are the subject of a restructuring agreement.
Premises and equipment: Land is carried at cost. Premises and equipment are stated at cost less accumulated depreciation. Depreciation is computed over the lesser of the remaining lease term, including renewal options controlled by the Company or the assets’ useful lives using the straight-line method.
Foreclosed assets: Assets acquired through loan foreclosure or other proceedings are initially recorded at fair value less estimated selling costs at the date of foreclosure establishing a new cost basis. After foreclosure, foreclosed assets are held for sale and are carried at the lower of cost or fair value less estimated costs of disposal. Any valuation adjustments required at the date of transfer are charged to the allowance for loan and lease losses. Subsequently, unrealized losses and realized losses on sales are included in noninterest expense, while realized gains on sales are included in noninterest income. Operating results from foreclosed assets are recorded in noninterest expense.
Cash surrender value of life insurance: The Bank has purchased bank-owned life insurance policies on certain executives. Bank-owned life insurance is recorded at its cash surrender value. Changes in the cash surrender values and death proceeds after recovery of cash surrender values are included in non-interest income.
60
Transfers of financial assets: Transfers of financial assets are accounted for as sales when control over the assets has been surrendered. Control over transferred assets is deemed to be surrendered when (1) the assets have been isolated from the Company, put presumptively beyond the reach of the transferor and its creditors, even in bankruptcy or other receivership, (2) the transferee obtains the right (free of conditions that constrain it from taking advantage of that right) to pledge or exchange the transferred assets, and (3) the Company does not maintain effective control over the transferred assets through an agreement to repurchase them before their maturity or the ability to unilaterally cause the holder to return specific assets.
The transfer of a participating interest in an entire financial asset must also meet the definition of a participating interest. A participating interest in a financial asset has all of the following characteristics: (1) from the date of transfer, it must represent a proportionate (pro rata) ownership interest in the financial asset, (2) from the date of transfer, all cash flows received, except any cash flows allocated as any compensation for servicing or other services performed, must be divided proportionately among participating interest holders in the amount equal to their share ownership, (3) the rights of each participating interest holder must have the same priority, (4) no party has the right to pledge or exchange the entire financial asset unless all participating interest holders agree to do so.
Income taxes: Deferred taxes are provided using the liability method. Deferred tax assets are recognized for deductible temporary differences and operating loss and tax credit carryforwards and deferred tax liabilities are recognized for taxable temporary differences. Temporary differences are the differences between the reported amounts of assets and liabilities and their tax basis. Deferred tax assets are reduced by a valuation allowance when, in the opinion of management, it is more-likely- -than-not that some portion or all of the deferred tax assets will not be realized. Deferred tax assets and liabilities are adjusted for the effects of changes in tax laws and rates on the date of enactment.
The Company follows the accounting guidance related to accounting for uncertainty in income taxes, which sets out a consistent framework to determine the appropriate level of tax reserves to maintain for uncertain tax positions. There are no uncertain tax positions as of December 31, 2016 and 2015.
Deferred income tax expense results from changes in deferred tax assets and liabilities between periods. Deferred tax assets are recognized or sustained upon examination. The term more-likely-than-not means a likelihood of more than 50 percent; the terms examined and upon examination also include resolution of the related appeals or litigation processes, if any. A tax position that meets the more-likely-than-not recognition threshold is initially and subsequently measured as the largest amount of taxing authority that has full knowledge of all relevant information. The determination of whether or not a tax position has met the more-likely-than-not recognition threshold considers the facts, circumstances, and information available at the reporting date and is subject to management’s judgment.
The Company would recognize interest and penalties on income taxes as a component of income tax expense.
The Company is no longer subject to U.S. federal or state and local income tax examinations by tax authorities for years before 2013.
Stock compensation plans: The Company recognizes compensation cost relating to share-based payment transactions (stock options and restricted stock units) in the consolidated financial statements. That cost will be measured based on the grant date fair value of the equity or liability instruments issued.
The Company calculates and recognizes compensation cost for all stock awards over the employees’ service period, generally defined as the vesting period. For awards with graded-vesting, compensation cost is recognized on a straight-line basis over the requisite service period for the entire award. The Company uses a Black-Sholes model to estimate the fair value of stock options, while the market price of the Company’s common stock at the date of grant is used for restricted stock awards.
Comprehensive income: Accounting principles generally require that recognized revenue, expenses, gains and losses be included in net income. Although certain changes in assets and liabilities, such as unrealized gains and losses on securities available for sale net of deferred taxes, are reported as a separate component of the equity section of the balance sheets, such items, along with net income, are components of comprehensive income. The amounts reclassified from accumulated other comprehensive income are included in “gain on sale of securities” in the consolidated statements of operations.
Basic and diluted earnings per common share: Earnings per common share is computed using the two-class method. Basic earnings per common share is computed by dividing net income by the weighted-average number of common shares outstanding during the applicable period. Diluted earnings per share is computed using the weighted-average number of shares determined for the basic earnings per common share computation plus the dilutive effect of stock compensation and warrants using the treasury stock method.
61
The following table presents a reconciliation of the number of shares used in the calculation of basic and diluted earnings per common share (amounts in thousands, except common share data).
Years Ended December 31, | |||||||||
2016 | 2015 | 2014 | |||||||
Undistributed earnings allocated to common stock | $ | 11,107 | $ | 9,819 | $ | 5,883 | |||
Less: preferred stock dividends and discount accretion | — | — | (526 | ) | |||||
Redemption of preferred shares | — | — | 5 | ||||||
Net income allocated to common stock | $ | 11,107 | $ | 9,819 | $ | 5,362 | |||
Weighted average shares outstanding for basic earnings per common share | 17,184,432 | 16,939,010 | 16,515,489 | ||||||
Dilutive effect of stock-based compensation and warrants | 446,168 | 146,742 | 225,726 | ||||||
Weighted average shares outstanding for diluted earnings per common share | 17,630,600 | 17,085,752 | 16,741,215 | ||||||
Basic income per common share | $ | 0.65 | $ | 0.58 | $ | 0.32 | |||
Diluted income per common share | 0.64 | 0.57 | 0.32 | ||||||
Segment: The Company’s operations consist of one segment called community banking.
Reclassifications: Certain prior period amounts have been reclassified to conform to current period presentation. These reclassifications did not result in any changes to previously reported net income or shareholders’ equity.
Emerging Growth Company Critical Accounting Policy Disclosure
The Company qualifies as an “emerging growth company” under the Jumpstart Our Business Startups Act (the “JOBS Act”). Section 107 of the JOBS Act provides that an emerging growth company can take advantage of the extended transition period provided in Section 7(a)(2)(B) of the Securities Act of 1933 for complying with new or revised accounting standards. As an emerging growth company, the Company can delay the adoption of certain accounting standards until those standards would otherwise apply to private companies. The Company elected to take advantage of the benefits of this extended transition period.
Management anticipates that the Company will no longer be considered an emerging growth company, and thus will no longer be eligible to use this extended transition period, after the fiscal year ending December 31, 2018.
Subsequent Events
The Company has evaluated subsequent events for potential recognition and/or disclosure through the date the Consolidated Financial Statements included in this Annual Report on Form 10-K were issued.
Refer to Note 2 of our Consolidated Financial Statements for a description subsequent events.
New Accounting Pronouncements
In February 2016, the FASB issued Accounting Standards Update (“ASU”) No. 2016-02, Leases (Topic 842). The ASU requires a lessee to recognize on the balance sheet assets and liabilities for leases with lease terms of more than 12 months. Consistent with current U.S. GAAP, the recognition, measurement, and presentation of expenses and cash flows arising from a lease by a lessee primarily will depend on its classification as a finance or operating lease. Unlike U.S. GAAP, which requires that only capital leases be recognized on the balance sheet, the ASU requires that both types of leases be recognized on the balance sheet. For public companies, this update will be effective for interim and annual periods beginning after December 15, 2018. Early application is permitted. The adoption of this guidance is not expected to have a material impact on the Company’s consolidated financial statements.
In February 2016, the FASB issued Accounting Standards Update No. 2016-01, Financial Instruments-Overall (Subtopic 825-10): Recognition and Measurement of Financial Assets and Financial Liabilities. Among other items, the ASU, requires public business entities to use the exit price notion when measuring the fair value of financial instruments for disclosure purposes. For public
62
companies, this update will be effective for interim and annual periods beginning after December 15, 2018. The effect of the adoption of this guidance is being evaluated by the Company.
In June 2016, the FASB issued ASU 2016-13, Financial Instruments-Credit Losses (Topic 326): Measurement of Credit Losses on Financial Instruments. The ASU requires an organization to measure all expected credit losses for financial assets held at the reporting date based on historical experience, current conditions, and reasonable and supportable forecasts. Financial institutions and other organizations will now use forwardlooking information to better inform their credit loss estimates. Many of the loss estimation techniques applied today will still be permitted, although the inputs to those techniques will change to reflect the full amount of expected credit losses. Additionally, the ASU amends the accounting for credit losses on available-for-sale debt securities and purchased financial assets with credit deterioration. For the Company, this update will be effective for interim and annual periods beginning after December 15, 2019. The Company has not yet determined the impact the adoption of ASU 2016-13 will have on the consolidated financial statements.
63
Note 2. Subsequent Events
On February 6, 2017, First Community entered into an Agreement and Plan of Merger with First Busey, pursuant to which First Community will merge into First Busey, with First Busey as the surviving corporation. It is anticipated that the Bank will be merged with and into First Busey’s bank subsidiary, Busey Bank, at a date following the completion of the Merger. At the time of the bank merger, the Bank’s banking offices will become branches of Busey Bank. The Merger is anticipated to be completed in mid-2017, and is subject to the satisfaction of customary closing conditions contained in the Agreement and Plan of Merger, including the approval of the appropriate regulatory authorities and the stockholders of First Community. The Agreement and Plan of Merger and the press release and investor presentation related to the Merger can be found on the Form 8-K filed with the SEC by First Community on February 6, 2017.
Note 3. | Acquisition |
On July 1, 2016, the Company completed its acquisition of Mazon State Bank, an Illinois state-chartered commercial bank, pursuant to that certain Agreement and Plan of Merger dated March 14, 2016 (the “Mazon Merger Agreement”) by and among the Company, the Bank, Mazon State Bank and First Mazon Bancorp, Inc., a Delaware corporation and the former parent company of Mazon State Bank. Under the terms of the Mazon Merger Agreement, the Company acquired Mazon State Bank, through the merger of Mazon State Bank with and into the Bank, for aggregate consideration of $8.5 million in cash. The three branches of Mazon State Bank opened on July 1, 2016 as branches of the Bank. The system integration was completed during the third quarter of 2016.
The Company accounted for the transaction under the acquisition method of accounting under FASB ASC Topic 805, Business Combinations, and thus, the financial position and results of operations of Mazon State Bank prior to the closing date were not included in the accompanying consolidated financial statements. The accounting required assets purchased and liabilities assumed to be recorded at their respective fair values at the date of acquisition. The Company determined the fair value with the assistance of third-party valuations, appraisals, and third-party advisors. The estimated fair values may be subject to refinement as additional information relative to the closing date fair values becomes available through the measurement period of approximately one year from consummation of the acquisition.
During the year ended December 31, 2016, the Company incurred $1.2 million of merger related costs.
The fair value of the assets acquired and liabilities assumed on July 1, 2016 were as follows (in thousands):
As Recorded by Mazon State Bank | Fair Value Adjustments | As Recorded by the Company | ||||||||
Cash and due from banks | $ | 5,754 | $ | — | $ | 5,754 | ||||
Federal funds sold | 550 | — | 550 | |||||||
Securities available for sale | 39,177 | — | 39,177 | |||||||
Nonmarketable equity securities | 134 | — | 134 | |||||||
Loans, net of allowance of $243 | 32,381 | (362 | ) | 32,019 | ||||||
Premises and equipment, net | 899 | 3,294 | 4,193 | |||||||
Foreclosed assets | 9 | — | 9 | |||||||
Cash surrender value of life insurance | 2,317 | — | 2,317 | |||||||
Other assets | 540 | 823 | 1,363 | |||||||
$ | 81,761 | $ | 3,755 | $ | 85,516 | |||||
Deposits | $ | 73,040 | $ | (49 | ) | $ | 72,991 | |||
Deferred tax liability, net | — | 1,272 | 1,272 | |||||||
Other liabilities | 833 | — | 833 | |||||||
$ | 73,873 | $ | 1,223 | $ | 75,096 | |||||
Excess of assets acquired over liabilities assumed | $ | 7,888 | $ | 2,532 | $ | 10,420 | ||||
Less: Purchase price paid in cash | 8,500 | |||||||||
Bargain purchase gain | $ | 1,920 | ||||||||
64
Note 4. | Securities Available for Sale |
All securities are classified as “available for sale” as the Company intends to hold the securities for an indefinite period of time, but not necessarily to maturity. Securities available for sale are reported at fair value with unrealized gains or losses reported as a separate component of other comprehensive income, net of the related deferred tax effect. Purchase premiums and discounts are recognized in interest income using the interest method over the terms of the securities. The amortized cost and fair value of securities available for sale, with gross unrealized gains and losses, follows (in thousands):
December 31, 2016 | Amortized Cost | Gross Unrealized Gains | Gross Unrealized Losses | Fair Value | ||||||||
Residential collateralized mortgage obligations | $ | 62,081 | $ | 45 | $ | 709 | $ | 61,417 | ||||
Residential mortgage backed securities | 33,701 | 97 | 557 | 33,241 | ||||||||
State and political subdivisions | 108,403 | 515 | 1,378 | 107,540 | ||||||||
$ | 204,185 | $ | 657 | $ | 2,644 | $ | 202,198 | |||||
December 31, 2015 | ||||||||||||
Government sponsored enterprises | $ | 16,284 | $ | 125 | $ | — | $ | 16,409 | ||||
Residential collateralized mortgage obligations | 62,701 | 138 | 475 | 62,364 | ||||||||
Residential mortgage backed securities | 28,494 | 65 | 268 | 28,291 | ||||||||
State and political subdivisions | 96,480 | 2,178 | 118 | 98,540 | ||||||||
$ | 203,959 | $ | 2,506 | $ | 861 | $ | 205,604 | |||||
Securities with a fair value of $121.1 million and $82.2 million were pledged as collateral on public funds, securities sold under agreements to repurchase or for other purposes as required or permitted by law as of December 31, 2016 and December 31, 2015, respectively.
The amortized cost and fair value of debt securities available for sale as of December 31, 2016, by contractual maturity are shown below (in thousands). Maturities may differ from contractual maturities in residential collateralized mortgage obligations and residential mortgage backed securities because the mortgages underlying the securities may be called or repaid without any penalties. Therefore, these securities are segregated in the following maturity summary:
Amortized | Fair | |||||
Cost | Value | |||||
Within 1 year | $ | 3,818 | $ | 3,830 | ||
Over 1 year through 5 years | 32,499 | 32,376 | ||||
Over 5 years through 10 years | 25,911 | 25,716 | ||||
Over 10 years | 46,175 | 45,618 | ||||
Residential collateralized mortgage obligations and mortgage backed securities | 95,782 | 94,658 | ||||
$ | 204,185 | $ | 202,198 | |||
Realized gains on the sales of securities were $617,000, $484,000, and $912,000 during the years ended December 31, 2016, 2015, and 2014, respectively.
65
There were $140.9 million and $85.7 million in securities with unrealized losses at December 31, 2016 and December 31, 2015, respectively. Unrealized losses and fair value aggregated by investment category and length of time that individual securities have been in a continuous unrealized loss position are summarized as of December 31, 2016 and December 31, 2015 are as follows (in thousands):
Less than 12 Months | 12 Months or More | Total | ||||||||||||||||
December 31, 2016 | Fair Value | Unrealized Losses | Fair Value | Unrealized Losses | Fair Value | Unrealized Losses | ||||||||||||
Residential collateralized mortgage obligations | $ | 52,811 | $ | 709 | $ | — | $ | — | $ | 52,811 | $ | 709 | ||||||
Residential mortgage backed securities | 16,217 | 557 | — | — | 16,217 | 557 | ||||||||||||
State and political subdivisions | 71,904 | 1,378 | — | — | 71,904 | 1,378 | ||||||||||||
$ | 140,932 | $ | 2,644 | $ | — | $ | — | $ | 140,932 | $ | 2,644 | |||||||
Less than 12 Months | 12 Months or More | Total | ||||||||||||||||
December 31, 2015 | Fair Value | Unrealized Losses | Fair Value | Unrealized Losses | Fair Value | Unrealized Losses | ||||||||||||
Residential collateralized mortgage obligations | $ | 46,373 | $ | 475 | $ | — | $ | — | $ | 46,373 | $ | 475 | ||||||
Residential mortgage backed securities | 27,012 | 268 | — | — | 27,012 | 268 | ||||||||||||
State and political subdivisions | 12,283 | 118 | — | — | 12,283 | 118 | ||||||||||||
$ | 85,668 | $ | 861 | $ | — | $ | — | $ | 85,668 | $ | 861 | |||||||
There were no securities with material unrealized losses existing longer than 12 months, and no securities with unrealized losses which management believed were other-than-temporarily impaired, at December 31, 2016 or 2015.
66
Note 5. | Loans |
A summary of the balances of loans follows (in thousands):
December 31, 2016 | December 31, 2015 | |||||
Construction and Land Development | $ | 47,338 | $ | 22,082 | ||
Farmland and Agricultural Production | 12,628 | 9,989 | ||||
Residential 1-4 Family | 175,978 | 135,864 | ||||
Multifamily | 36,703 | 34,272 | ||||
Commercial Real Estate | 425,985 | 381,098 | ||||
Commercial and Industrial | 281,804 | 179,623 | ||||
Leases, net | 3,290 | — | ||||
Consumer and other | 7,967 | 9,417 | ||||
991,693 | 772,345 | |||||
Net deferred loan fees | (75 | ) | (26 | ) | ||
Allowance for loan and lease losses | (11,684 | ) | (11,741 | ) | ||
$ | 979,934 | $ | 760,578 | |||
The following table presents the contractual aging of the recorded investment in past due and non-accrual loans by class of loans as of December 31, 2016 and December 31, 2015 (in thousands):
December 31, 2016 | Current | 30-59 Days Past Due | 60-89 Days Past Due | 90+ Days Past Due and Still Accruing | Total Accruing Loans | Non-accrual Loans | Total Loans | ||||||||||||||
Construction and Land Development | $ | 47,338 | $ | — | $ | — | $ | — | $ | 47,338 | $ | — | $ | 47,338 | |||||||
Farmland and Agricultural Production | 12,628 | — | — | — | 12,628 | — | 12,628 | ||||||||||||||
Residential 1-4 Family | 175,178 | 27 | — | — | 175,205 | 773 | 175,978 | ||||||||||||||
Multifamily | 36,703 | — | — | — | 36,703 | — | 36,703 | ||||||||||||||
Commercial Real Estate | |||||||||||||||||||||
Retail | 89,525 | — | — | — | 89,525 | 3,525 | 93,050 | ||||||||||||||
Office | 62,876 | — | — | — | 62,876 | — | 62,876 | ||||||||||||||
Industrial and Warehouse | 75,351 | — | — | — | 75,351 | — | 75,351 | ||||||||||||||
Health Care | 30,232 | — | — | — | 30,232 | — | 30,232 | ||||||||||||||
Other | 163,732 | 92 | 584 | — | 164,408 | 68 | 164,476 | ||||||||||||||
Commercial and Industrial | 280,282 | 32 | — | — | 280,314 | 1,490 | 281,804 | ||||||||||||||
Leases, net | 3,290 | — | — | — | 3,290 | — | 3,290 | ||||||||||||||
Consumer and other | 7,957 | 10 | — | — | 7,967 | — | 7,967 | ||||||||||||||
Total | $ | 985,092 | $ | 161 | $ | 584 | $ | — | $ | 985,837 | $ | 5,856 | $ | 991,693 | |||||||
December 31, 2015 | Current | 30-59 Days Past Due | 60-89 Days Past Due | 90+ Days Past Due and Still Accruing | Total Accruing Loans | Non-accrual Loans | Total Loans | ||||||||||||||
Construction and Land Development | $ | 21,885 | $ | — | $ | 197 | $ | — | $ | 22,082 | $ | — | $ | 22,082 | |||||||
Farmland and Agricultural Production | 9,989 | — | — | — | 9,989 | — | 9,989 | ||||||||||||||
Residential 1-4 Family | 135,632 | 182 | — | — | 135,814 | 50 | 135,864 | ||||||||||||||
Multifamily | 34,272 | — | — | — | 34,272 | — | 34,272 | ||||||||||||||
Commercial Real Estate | |||||||||||||||||||||
Retail | 95,570 | — | — | — | 95,570 | — | 95,570 | ||||||||||||||
Office | 55,151 | — | — | — | 55,151 | — | 55,151 | ||||||||||||||
Industrial and Warehouse | 65,536 | — | — | — | 65,536 | — | 65,536 | ||||||||||||||
Health Care | 29,985 | — | — | — | 29,985 | — | 29,985 | ||||||||||||||
Other | 134,762 | — | — | — | 134,762 | 94 | 134,856 | ||||||||||||||
Commercial and Industrial | 178,289 | — | — | 67 | 178,356 | 1,267 | 179,623 | ||||||||||||||
Consumer and other | 9,417 | — | — | — | 9,417 | — | 9,417 | ||||||||||||||
Total | $ | 770,488 | $ | 182 | $ | 197 | $ | 67 | $ | 770,934 | $ | 1,411 | $ | 772,345 | |||||||
67
As part of the on-going monitoring of the credit quality of the Company’s loan portfolio, management categorizes loans into risk categories based on relevant information about the ability of borrowers to service their debt and comply with various terms of their loan agreements. The Company considers current financial information, historical payment experience, credit documentation, public information and current economic trends. Generally, all sizable credits receive a financial review no less than annually to monitor and adjust, if necessary, the credit’s risk profile. Credits classified as watch generally receive a review more frequently than annually. For special mention, substandard, and doubtful credit classifications, the frequency of review is increased to no less than quarterly in order to determine potential impact on credit loss estimates.
The Company categorizes loans into the following risk categories based on relevant information about the ability of borrowers to service their debt:
Pass - A pass asset is well protected by the current worth and paying capacity of the borrower (or guarantors, if any) or by the fair value, less cost to acquire and sell, of any underlying collateral in a timely manner. Pass assets also include certain assets considered watch, which are still protected by the worth and paying capacity of the borrower but deserve closer attention and a higher level of credit monitoring.
Special Mention - A special mention asset, or risk rating of 5, has potential weaknesses that deserve management’s close attention. If left uncorrected, these potential weaknesses may result in deterioration of the repayment prospects for the asset or in the Company’s credit position at some future date. Special mention assets are not adversely classified and do not expose the Company to sufficient risk to warrant adverse classification.
Substandard - A substandard asset, or risk rating of 6 or 7, is an asset with a well-defined weakness that jeopardizes repayment, in whole or in part, of the debt. These credits are inadequately protected by the current sound worth and paying capacity of the obligor or of the collateral pledged. These assets are characterized by the distinct possibility that the Company will or has sustained some loss of principal and/or interest if the deficiencies are not corrected.
Doubtful - An asset that has all the weaknesses, or risk rating of 8, inherent in the substandard classification, with the added characteristic that the weaknesses make collection or liquidation in full, on the basis of currently existing facts, conditions and values, highly questionable and improbable. These credits have a high probability for loss, yet because certain important and reasonably specific pending factors may work toward the strengthening of the asset, its classification of loss is deferred until its more exact status can be determined.
Loss - An asset, or portion thereof, classified as loss, or risk rated 9, is considered uncollectible and of such little value that its continuance as a bankable asset is not warranted. This classification does not necessarily mean that an asset has no recovery or salvage value but that it is not practical or desirable to defer writing off this basically worthless asset even though a partial recovery may occur in the future. There was no balance to report at December 31, 2016 and December 31, 2015.
Residential 1-4 family, consumer and other loans are assessed for credit quality based on the contractual aging status of the loan and payment activity. In certain cases, based upon payment performance, the loan being related with another commercial type loan or for other reasons, a loan may be categorized into one of the risk categories noted above. Such assessment is completed at the end of each reporting period.
68
The following tables present the risk category of loans evaluated by internal asset classification based on the most recent analysis performed and the contractual aging as of December 31, 2016 and December 31, 2015 (in thousands):
December 31, 2016 | Pass | Special Mention | Substandard | Doubtful | Total | ||||||||||
Construction and Land Development | $ | 44,862 | $ | 2,476 | $ | — | $ | — | $ | 47,338 | |||||
Farmland and Agricultural Production | 12,628 | — | — | — | 12,628 | ||||||||||
Multifamily | 35,934 | 769 | — | — | 36,703 | ||||||||||
Commercial Real Estate | |||||||||||||||
Retail | 81,821 | — | 9,148 | 2,081 | 93,050 | ||||||||||
Office | 59,384 | — | 3,492 | — | 62,876 | ||||||||||
Industrial and Warehouse | 74,669 | 682 | — | — | 75,351 | ||||||||||
Health Care | 30,232 | — | — | — | 30,232 | ||||||||||
Other | 157,618 | 2,898 | 3,953 | 7 | 164,476 | ||||||||||
Commercial and Industrial | 274,578 | 2,321 | 3,503 | 1,402 | 281,804 | ||||||||||
Leases, net | $ | 3,290 | $ | — | $ | — | $ | — | $ | 3,290 | |||||
Total | $ | 775,016 | $ | 9,146 | $ | 20,096 | $ | 3,490 | $ | 807,748 | |||||
December 31, 2016 | Performing | Non-performing* | Total | ||||||
Residential 1-4 Family | $ | 175,205 | $ | 773 | $ | 175,978 | |||
Consumer and other | 7,967 | — | 7,967 | ||||||
Total | $ | 183,172 | $ | 773 | $ | 183,945 | |||
December 31, 2015 | Pass | Special Mention | Substandard | Doubtful | Total | |||||||||
Construction and Land Development | $ | 19,450 | $ | 2,632 | $ | — | — | $ | 22,082 | |||||
Farmland and Agricultural Production | 9,989 | — | — | — | 9,989 | |||||||||
Multifamily | 33,598 | 674 | — | — | 34,272 | |||||||||
Commercial Real Estate | — | |||||||||||||
Retail | 87,665 | — | 7,905 | — | 95,570 | |||||||||
Office | 55,151 | — | — | — | 55,151 | |||||||||
Industrial and Warehouse | 64,699 | 837 | — | — | 65,536 | |||||||||
Health Care | 29,985 | — | — | — | 29,985 | |||||||||
Other | 128,988 | 2,664 | 3,192 | 12 | 134,856 | |||||||||
Commercial and Industrial | 173,324 | 4,714 | 355 | 1,230 | 179,623 | |||||||||
Total | $ | 602,849 | $ | 11,521 | $ | 11,452 | 1,242 | $ | 627,064 | |||||
December 31, 2015 | Performing | Non-performing* | Total | ||||||
Residential 1-4 Family | $ | 135,814 | $ | 50 | $ | 135,864 | |||
Consumer and other | 9,417 | — | 9,417 | ||||||
Total | $ | 145,231 | $ | 50 | $ | 145,281 | |||
* Non-performing loans include those on non-accrual status and those past due 90 days or more and still on accrual.
69
The following table provides additional detail of the activity in the allowance for loan and lease losses, by portfolio segment, for the twelve months ended December 31, 2016 and 2015 (in thousands):
December 31, 2016 | Construction and Land Development | Farmland and Agricultural Production | Residential 1-4 Family | Multifamily | Commercial Real Estate | Commercial and Industrial | Leases | Consumer and other | Total | ||||||||||||||||||
Allowance for loan and lease losses: | |||||||||||||||||||||||||||
Beginning balance | $ | 813 | $ | 43 | $ | 1,370 | $ | 141 | $ | 4,892 | $ | 4,286 | $ | — | $ | 196 | $ | 11,741 | |||||||||
Provision for loan losses | 668 | — | (440 | ) | 113 | 28 | 837 | 17 | (157 | ) | 1,066 | ||||||||||||||||
Loans charged-off | — | — | (15 | ) | — | (471 | ) | (1,905 | ) | — | (9 | ) | (2,400 | ) | |||||||||||||
Recoveries of loans previously charged-off | 68 | — | 33 | — | 47 | 1,125 | — | 4 | 1,277 | ||||||||||||||||||
Ending balance | $ | 1,549 | $ | 43 | $ | 948 | $ | 254 | $ | 4,496 | $ | 4,343 | $ | 17 | $ | 34 | $ | 11,684 | |||||||||
December 31, 2015 | |||||||||||||||||||||||||||
Allowance for loan and lease losses: | |||||||||||||||||||||||||||
Beginning balance | $ | 758 | $ | 459 | $ | 1,199 | $ | 67 | $ | 6,828 | $ | 4,296 | $ | — | $ | 298 | $ | 13,905 | |||||||||
Provision for loan losses | (16 | ) | (416 | ) | 112 | 74 | (2,623 | ) | 894 | — | (102 | ) | (2,077 | ) | |||||||||||||
Loans charged-off | — | — | (195 | ) | — | (548 | ) | (1,106 | ) | — | (10 | ) | (1,859 | ) | |||||||||||||
Recoveries of loans previously charged-off | 71 | — | 254 | — | 1,235 | 202 | — | 10 | 1,772 | ||||||||||||||||||
Ending balance | $ | 813 | $ | 43 | $ | 1,370 | $ | 141 | $ | 4,892 | $ | 4,286 | $ | — | $ | 196 | $ | 11,741 | |||||||||
December 31, 2014 | |||||||||||||||||||||||||||
Allowance for loan and lease losses: | |||||||||||||||||||||||||||
Beginning balance | $ | 2,711 | $ | 427 | $ | 1,440 | $ | 97 | $ | 7,812 | $ | 3,183 | $ | — | $ | 150 | $ | 15,820 | |||||||||
Provision for loan losses | (840 | ) | 32 | (9 | ) | (30 | ) | 560 | 3,119 | — | 168 | 3,000 | |||||||||||||||
Loans charged-off | (1,186 | ) | — | (264 | ) | — | (2,836 | ) | (2,321 | ) | — | (26 | ) | (6,633 | ) | ||||||||||||
Recoveries of loans previously charged-off | 73 | — | 32 | — | 1,292 | 315 | — | 6 | 1,718 | ||||||||||||||||||
Ending balance | $ | 758 | $ | 459 | $ | 1,199 | $ | 67 | $ | 6,828 | $ | 4,296 | $ | — | $ | 298 | $ | 13,905 | |||||||||
70
The following table presents the balance in the allowance for loan and lease losses and the unpaid principal balance of loans by portfolio segment and based on impairment method as of December 31, 2016 and December 31, 2015 (in thousands):
December 31, 2016 | Construction and Land Development | Farmland and Agricultural Production | Residential 1-4 Family | Multifamily | Commercial Real Estate | Commercial and Industrial | Leases | Consumer and other | Total | ||||||||||||||||||
Period-ended allowance amount allocated to: | |||||||||||||||||||||||||||
Individually evaluated for impairment | $ | — | $ | — | $ | 27 | $ | — | $ | — | $ | 417 | $ | — | $ | — | $ | 444 | |||||||||
Collectively evaluated for impairment | 1,549 | 43 | 921 | 254 | 4,496 | 3,926 | 17 | 34 | 11,240 | ||||||||||||||||||
Ending balance | $ | 1,549 | $ | 43 | $ | 948 | $ | 254 | $ | 4,496 | $ | 4,343 | $ | 17 | $ | 34 | $ | 11,684 | |||||||||
Loans: | |||||||||||||||||||||||||||
Individually evaluated for impairment | $ | — | $ | — | $ | 1,285 | $ | — | $ | 7,267 | $ | 3,912 | $ | — | $ | — | $ | 12,464 | |||||||||
Collectively evaluated for impairment | 47,338 | 12,628 | 174,693 | 36,703 | 418,718 | 277,892 | 3,290 | 7,967 | 979,229 | ||||||||||||||||||
Ending balance | $ | 47,338 | $ | 12,628 | $ | 175,978 | $ | 36,703 | $ | 425,985 | $ | 281,804 | $ | 3,290 | $ | 7,967 | $ | 991,693 | |||||||||
December 31, 2015 | |||||||||||||||||||||||||||
Period-ended allowance amount allocated to: | |||||||||||||||||||||||||||
Individually evaluated for impairment | $ | — | — | $ | 30 | $ | — | $ | — | $ | 441 | $ | — | $ | — | $ | 471 | ||||||||||
Collectively evaluated for impairment | 813 | 43 | 1,340 | 141 | 4,892 | 3,845 | — | 196 | 11,270 | ||||||||||||||||||
Ending balance | $ | 813 | $ | 43 | $ | 1,370 | $ | 141 | $ | 4,892 | $ | 4,286 | $ | — | $ | 196 | $ | 11,741 | |||||||||
Loans: | |||||||||||||||||||||||||||
Individually evaluated for impairment | $ | — | — | $ | 1,661 | $ | — | $ | 4,381 | $ | 3,777 | $ | — | $ | — | $ | 9,819 | ||||||||||
Collectively evaluated for impairment | 22,082 | 9,989 | 134,203 | 34,272 | 376,717 | 175,846 | — | 9,417 | 762,526 | ||||||||||||||||||
Ending balance | $ | 22,082 | $ | 9,989 | $ | 135,864 | $ | 34,272 | $ | 381,098 | $ | 179,623 | $ | — | $ | 9,417 | $ | 772,345 | |||||||||
71
The following tables present additional detail regarding impaired loans, segregated by class, as of and for the year ended December 31, 2016 and year ended December 31, 2015 (dollars in thousands). The unpaid principal balance represents the recorded balance prior to any partial charge-offs. The recorded investment represents customer balances net of any partial charge-offs recognized on the loans. The interest income recognized column represents all interest income reported after the loan became impaired.
December 31, 2016 | |||||||||||||||
Unpaid Principal Balance | Recorded Investment | Allowance for Loan and Lease Losses Allocated | Average Recorded Investment | Interest Income Recognized | |||||||||||
With no related allowance recorded: | |||||||||||||||
Construction and Land Development | $ | — | $ | — | $ | — | $ | 217 | $ | — | |||||
Residential 1-4 Family | 865 | 826 | — | 1,278 | 61 | ||||||||||
Commercial Real Estate | |||||||||||||||
Retail | 3,995 | 3,524 | — | 1,362 | — | ||||||||||
Other | 3,808 | 3,743 | — | 3,808 | 127 | ||||||||||
Commercial and Industrial | 4,504 | 3,054 | — | 3,532 | 130 | ||||||||||
With an allowance recorded: | |||||||||||||||
Residential 1-4 Family | 459 | 459 | 27 | 463 | 23 | ||||||||||
Commercial and Industrial | 1,058 | 858 | 417 | 1,319 | — | ||||||||||
Total | $ | 14,689 | $ | 12,464 | $ | 444 | $ | 12,078 | $ | 341 | |||||
December 31, 2015 | |||||||||||||||
Unpaid Principal Balance | Recorded Investment | Allowance for Loan and Lease Losses Allocated | Average Recorded Investment | Interest Income Recognized | |||||||||||
With no related allowance recorded: | |||||||||||||||
Residential 1-4 Family | $ | 1,232 | $ | 1,193 | $ | — | $ | 1,280 | $ | 61 | |||||
Commercial Real Estate | |||||||||||||||
Office | 494 | 494 | — | 502 | 26 | ||||||||||
Industrial and Warehouse | — | — | — | 1,441 | — | ||||||||||
Other | 3,952 | 3,887 | — | 5,015 | 127 | ||||||||||
Commercial and Industrial | 3,331 | 3,131 | — | 3,640 | 130 | ||||||||||
Consumer and other | — | — | — | 4 | — | ||||||||||
With an allowance recorded: | |||||||||||||||
Residential 1-4 Family | 468 | 468 | 30 | 473 | 23 | ||||||||||
Multifamily | — | — | — | — | — | ||||||||||
Commercial Real Estate | |||||||||||||||
Office | — | — | — | 64 | — | ||||||||||
Commercial and Industrial | 1,109 | 646 | 441 | 491 | — | ||||||||||
Total | $ | 10,586 | $ | 9,819 | $ | 471 | $ | 12,910 | $ | 367 | |||||
During the year ended December 31, 2016, there were three troubled debt restructurings added as a result of the Bank making payment of real estate taxes. During the year ended December 31, 2015, there were no troubled debt restructurings added.
Troubled debt restructurings that were accruing were $2.2 million and $2.8 million as of December 31, 2016 and 2015, respectively. Troubled debt restructurings that were non-accruing were $2.2 million and $94,000 as of December 31, 2016 and December 31, 2015.
72
The following presents a rollfoward activity of troubled debt restructurings (in thousands, except number of loans):
Years ended December 31, | |||||||||||
2016 | 2015 | ||||||||||
Recorded Investment | Number of Loans | Recorded Investment | Number of Loans | ||||||||
Balance, beginning | $ | 2,832 | 6 | $ | 5,621 | $ | 10 | ||||
Additions to troubled debt restructurings | 2,460 | 3 | — | — | |||||||
Removal of troubled debt restructurings | (519 | ) | (2 | ) | (309 | ) | (1 | ) | |||
Transfers to other real estate owned | — | — | (1,486 | ) | (1 | ) | |||||
Repayments and other reductions | (396 | ) | — | (994 | ) | (2 | ) | ||||
Balance, ending | $ | 4,377 | 7 | $ | 2,832 | 6 | |||||
Restructured loans are evaluated for impairment at each reporting date as part of the Company’s determination of the allowance for loan and lease losses.
Executive officers, directors and principal shareholders of the Company, including their families and companies of which they are principal owners, are considered to be related parties. These related parties were loan clients of the Company in the ordinary course of business. Transfers from related party status are loans to directors who have resigned. Loans to related parties totaled as follows (in thousands):
Years ended December 31, | ||||||
2016 | 2015 | |||||
Balance, beginning | $ | 39,176 | $ | 35,583 | ||
New loans | 4,763 | 5,313 | ||||
Repayments and other reductions | (5,821 | ) | (1,720 | ) | ||
Balance, ending | $ | 38,118 | $ | 39,176 | ||
No loans to executive officers, directors, and their affiliates were past due greater than 90 days at December 31, 2016 or 2015.
Note 6. | Premises and Equipment |
Premises and equipment are summarized as follows (in thousands):
December 31, | ||||||
2016 | 2015 | |||||
Land | $ | 5,078 | $ | 4,226 | ||
Building and building improvements | 21,487 | 18,044 | ||||
Furniture and equipment | 4,867 | 4,238 | ||||
31,432 | 26,508 | |||||
Less: accumulated depreciation | 9,218 | 7,979 | ||||
$ | 22,214 | $ | 18,529 | |||
Depreciation and amortization expense was $1.2 million, $1.3 million, and $1.3 million for the years ended December 31, 2016, 2015, and 2014, respectively.
Rent expense for banking facilities was $172,000, $169,000, and $301,000 for the years ended December 31, 2016, 2015, and 2014, respectively.
The Company leases office space for one of its branches as well as additional back office space. The future minimum annual rental commitments for the noncancelable leases of these spaces are as follows (in thousands):
73
2017 | 103 | ||
2018 | 103 | ||
2019 | 103 | ||
2020 | 103 | ||
2021 | 103 | ||
Thereafter | 485 | ||
$ | 1,000 | ||
Under the terms of these leases, the Company is required to pay its pro rata share of the cost of maintenance and real estate taxes. Certain leases also provide for increased rental payments up to 3%.
Note 7. | Foreclosed Assets |
Foreclosed assets are presented net of an allowance for losses. An analysis of the foreclosed assets and the related provision for losses is as follows (in thousands):
Years ended December 31, | ||||||
2016 | 2015 | |||||
Beginning balance | $ | 5,487 | $ | 2,530 | ||
Transfers of loans | — | 3,291 | ||||
Acquired through Mazon acquisition | 9 | — | ||||
Writedown to realizable value | (47 | ) | (200 | ) | ||
Gain (loss) on sale of foreclosed assets | (3 | ) | 13 | |||
Proceeds on sale | (4,721 | ) | (147 | ) | ||
Ending balance | $ | 725 | $ | 5,487 | ||
Expenses applicable to foreclosed assets include the following:
Years ended December 31, | |||||||||
2016 | 2015 | 2014 | |||||||
Writedown to realizable value | $ | 48 | $ | 200 | $ | 434 | |||
Operating expenses, net of rental income | 40 | 130 | 219 | ||||||
$ | 88 | $ | 330 | $ | 653 | ||||
74
Note 8. | Deposits |
The composition of interest-bearing deposits was as follows (in thousands):
December 31, 2016 | December 31, 2015 | |||||
NOW and money market accounts | $ | 443,727 | $ | 336,197 | ||
Savings | 64,695 | 36,207 | ||||
Time deposit certificates of $250,000 or more | 96,421 | 69,961 | ||||
Time deposit certificates of $100,000 to $250,000 | 125,807 | 127,091 | ||||
Other time deposit certificates | 104,650 | 100,472 | ||||
$ | 835,300 | $ | 669,928 | |||
The composition of brokered deposits included in deposits was as follows (in thousands):
December 31, 2016 | December 31, 2015 | |||||
NOW and money market accounts | $ | 54,971 | $ | 35,271 | ||
Time deposit certificates | 41,169 | 11,874 | ||||
$ | 96,140 | $ | 47,145 | |||
At December 31, 2016, maturities of certificates of deposit are summarized as follows (in thousands):
2017 | 197,883 | ||
2018 | 96,129 | ||
2019 | 21,282 | ||
2020 | 4,304 | ||
2021 | 7,280 | ||
$ | 326,878 | ||
Deposits from related parties held by the Bank at December 31, 2016 and 2015 amounted to approximately $41.4 million and $38.5 million, respectively.
Note 9. | Subordinated Debt |
The following table summarizes subordinated debt outstanding at December 31, 2016 and 2015 (dollars in thousands):
Date of issuance | Call date | Maturity Date | Interest rate | 2016 | 2015 | ||||
September 30, 2013 | September 30, 2018 | September 30, 2021 | 8.625% | $ | 5,500 | $ | 5,500 | ||
October 31, 2014 | October 31, 2019 | October 31, 2022 | 7.00% | 9,800 | 9,800 | ||||
Total subordinated debt | $ | 15,300 | $ | 15,300 | |||||
On September 30, 2013, the Company completed a private placement offering of $5.5 million of subordinated indebtedness. These securities were offered in denominations of $1,000 per note. The subordinated notes will mature on the eighth anniversary of the issuance of the notes. The Company will have the option to redeem the notes in whole or part, upon the occurrence of certain events affecting the regulatory capital or tax treatment of the notes prior to the fifth anniversary of the issuance. The holders of the notes are entitled to interest at 8.625% payable quarterly, in arrears. On or after the fifth anniversary of the effective date of the subordinated notes, the Company may redeem the notes, in whole or in part. The outstanding balance was $5.5 million at December 31, 2016 and 2015.
On October 31, 2014, the Company completed a private placement offering of $9.8 million of subordinated indebtedness. These securities were offered in denominations of $10,000 per note. The subordinated notes will mature on the eighth
75
anniversary of the issuance of the notes. The Company will have the option to redeem the notes in whole or part, upon the occurrence of certain events affecting the regulatory capital or tax treatment of the notes prior to the fifth anniversary of the issuance. The holders of the notes are entitled to interest at 7.0% payable semi-annually, in arrears. On or after the fifth anniversary of the effective date of the subordinated notes, the Company may redeem the notes, in whole or in part. The outstanding balance was $9.8 million at December 31, 2016 and 2015.
Approximately $2.8 million of the Company’s subordinated debt is held by related parties, as of December 31, 2016 and 2015.
Note 10. | Other Borrowed Funds |
The composition of other borrowed funds was as follows (in thousands):
December 31, 2016 | December 31, 2015 | |||||
Securities sold under agreements to repurchase | $ | 24,153 | $ | 25,069 | ||
Federal Home Loan Bank Advances | ||||||
Maturity dates, fixed interest rate | ||||||
Matures January 20, 2017, 0.70% | 17,000 | 11,000 | ||||
Matures January 23, 2017, 0.70% | 10,000 | 5,000 | ||||
Secured borrowings | — | 11,946 | ||||
$ | 51,153 | $ | 53,015 | |||
Securities sold under agreements to repurchase are agreements in which the Bank acquires funds by selling securities to another party under a simultaneous agreement to repurchase the same securities at a specified price and date. These agreements represent a demand deposit account product to clients that sweep their balances in excess of an agreed upon target amount into overnight repurchase agreements.
Information pertaining to securities sold under agreements to repurchase as of December 31, 2016 and 2015 is as follows:
December 31, 2016 | December 31, 2015 | |||||
Sweep repurchase agreements | $ | 24,153 | $ | 25,069 | ||
Weighted average rate | 0.16 | % | 0.16 | % | ||
Securities underlying the agreements: | ||||||
Carrying value | $ | 27,082 | $ | 40,101 | ||
Fair value | $ | 26,943 | $ | 39,949 | ||
The securities underlying the agreements as of December 31, 2016 and 2015 were under the Company’s control in safekeeping at third-party financial institutions. The sweep agreements generally mature within one day from the transaction date.
A collateral pledge agreement exists whereby at all times, the Bank must keep on hand, free of all other pledges, liens, and encumbrances, commercial real estate loans, first mortgage loans, and home equity loans with unpaid principal balances aggregating no less than 133% for first mortgage loans and 200% for home equity loans of the outstanding secured advances from the FHLB. The Bank had $409.4 million and $338.0 million of loans pledged as collateral for FHLB advances as of December 31, 2016 and December 31, 2015, respectively. There were $27.0 million and $16.0 million in advances outstanding at December 31, 2016 and December 31, 2015, respectively. All FHLB advances were repaid upon maturity in January 2017.
On June 29, 2015, the Company entered into a credit facility with an unaffiliated bank for two credit facilities (secured borrowings). The credit facilities include a $4.0 million revolving line of credit, which had a balance of $0 and $1.9 million, at December 31, 2016 and 2015, respectively, and a term loan which had a balance of $0 and $10.1 million at December 31, 2016 and 2015, respectively. The revolving line matures in 2020 and the term loan matures in 2021. The credit facilities have an annual interest rate of 2.25% plus LIBOR, which was 2.95% at December 31, 2016. The credit facilities are collateralized by the stock of the Company’s wholly-owned subsidiary, the Bank.
76
The Bank has entered into collateral pledge agreements whereby the Bank pledges commercial, commercial real estate, agricultural and consumer loans to the Federal Reserve Bank of Chicago Discount Window which allows the Bank to borrow on a short term basis, typically overnight. The Bank had $203.7 million and $100.1 million of loans pledged as collateral under these agreements as of December 31, 2016 and December 31, 2015, respectively. There were no borrowings outstanding at December 31, 2016 and December 31, 2015.
Note 11. | Income Taxes |
Income tax expense recognized is as follows (in thousands):
For years ended December 31, | |||||||||
2016 | 2015 | 2014 | |||||||
Current | $ | 1,601 | $ | 116 | $ | 464 | |||
Deferred | 2,723 | 4,884 | 2,273 | ||||||
$ | 4,324 | $ | 5,000 | $ | 2,737 | ||||
The table below presents a reconciliation of the amount of income taxes determined by applying the U.S. federal income tax rate to pretax income (in thousands):
For years ended December 31, | |||||||||
2016 | 2015 | 2014 | |||||||
Federal income tax at statutory rate | $ | 5,399 | $ | 5,187 | $ | 3,017 | |||
Increase (decrease) due to: | |||||||||
Federal tax exempt | (769 | ) | (606 | ) | (331 | ) | |||
State income tax, net of federal benefit | 789 | 758 | 541 | ||||||
Benefit of income taxed at lower rate | (154 | ) | (148 | ) | (86 | ) | |||
Tax exempt income | (13 | ) | (29 | ) | (25 | ) | |||
Cash surrender value of life insurance | (208 | ) | (81 | ) | (186 | ) | |||
Bargain purchase gain | (652 | ) | — | — | |||||
Other | (68 | ) | (81 | ) | (193 | ) | |||
$ | 4,324 | $ | 5,000 | $ | 2,737 | ||||
Deferred tax assets and liabilities consist of (in thousands):
77
December 31, 2016 | December 31, 2015 | |||||
Deferred tax assets: | ||||||
Allowance for loan and lease losses | $ | 4,570 | $ | 4,169 | ||
Merger expenses | 182 | 140 | ||||
Organization expenses | 198 | 226 | ||||
Net operating losses | 5 | 3,774 | ||||
Contribution carryforward | 5 | 5 | ||||
Non-qualified stock options | 726 | 644 | ||||
Restricted stock | 362 | — | ||||
Foreclosed assets | 282 | 315 | ||||
Tax credits | — | 334 | ||||
Unrealized losses on securities available for sale | — | — | ||||
Other | 945 | 135 | ||||
7,275 | 9,742 | |||||
Deferred tax liabilities: | ||||||
Depreciation | (1,140 | ) | (186 | ) | ||
Core deposit intangible | (297 | ) | — | |||
Unrealized gains on securities available for sale | 775 | (642 | ) | |||
Other | — | 277 | ||||
(662 | ) | (551 | ) | |||
Net deferred tax asset | $ | 6,613 | $ | 9,191 | ||
Under U.S. GAAP, a valuation allowance against a net deferred tax asset is required to be recognized if it is more-likely-than-not that a deferred tax asset will not be realized. The determination of the realizability of the deferred tax asset is highly subjective and dependent upon judgment concerning management’s evaluation of both positive and negative evidence, forecasts of future income, applicable tax planning strategies and assessments of current and future economic and business conditions. As of December 31, 2016 and 2015, the Company did not have a valuation allowance against the net deferred tax assets.
The Company had a federal net operating loss carryforward of $0 and $9.3 million at December 31, 2016 and December 31, 2015, respectively. The Company had an Illinois net operating loss carryforward of $0 and $11.1 million at December 31, 2016 and December 31, 2015, respectively.
Note 12. | Stock Compensation Plans |
The Company maintains the First Community Financial Partners, Inc. Amended and Restated 2008 Equity Incentive Plan (the “2008 Equity Incentive Plan”), which assumed and incorporated all outstanding awards under previously adopted Company equity incentive plans. The 2008 Equity Incentive Plan allows for the granting of awards including stock options, restricted stock, restricted stock units, stock appreciation rights, stock awards and cash incentive awards. This plan was amended in December 2011 to increase the number of shares authorized for delivery by 1,000,000 shares. As a result, under the 2008 Equity Incentive Plan, 2,430,000 shares of Company common stock have been reserved for the granting of awards.
On August 15, 2013, the Company adopted the First Community Financial Partners, Inc. 2013 Equity Incentive Plan (the “2013 Equity Incentive Plan”). The 2013 Equity Incentive Plan allows for the granting of awards including stock options, restricted stock, restricted stock units, stock appreciation rights, stock awards and cash incentive awards. This plan was amended in December 2014 to increase the number of shares authorized for delivery by 900,000 shares. As a result, under this plan, 1,000,000 shares of Company common stock have been reserved for the granting of awards.
On May 19, 2016, the Company adopted the First Community Financial Partners, Inc. 2016 Equity Incentive Plan (the “2016 Equity Incentive Plan”). The 2016 Equity Incentive Plan allows for the grant of awards including nonqualified stock options, incentive stock options, stock appreciation rights, stock awards, and cash incentive awards. Under this plan 2,000,000 shares of the Company common stock have been reserved for the granting of awards. The 2016 Equity Incentive Plan replaced the 2008
78
Equity Incentive Plan and the 2013 Equity Incentive Plan, and the Company may not make any new award grants under the prior plans.
The following table summarizes data concerning stock options (aggregate intrinsic value in thousands):
December 31, 2016 | December 31, 2015 | |||||||||||||||
Shares | Weighted Average Exercise Price | Aggregate Intrinsic Value | Shares | Weighted Average Exercise Price | Aggregate Intrinsic Value | |||||||||||
Outstanding at beginning of year | 1,305,504 | $ | 6.69 | $ | 1,308 | 1,089,404 | $ | 7.00 | $ | — | ||||||
Granted | 539,950 | 8.68 | 1,629 | 217,500 | 5.20 | 444 | ||||||||||
Exercised | (48,520 | ) | 7.12 | 222 | — | — | — | |||||||||
Canceled | — | — | — | — | — | — | ||||||||||
Expired | — | — | — | — | — | — | ||||||||||
Forfeited | — | — | — | (1,400 | ) | 8.25 | — | |||||||||
Outstanding at end of period | 1,796,934 | $ | 7.28 | $ | 7,942 | 1,305,504 | $ | 6.69 | $ | 1,308 | ||||||
Exercisable at end of period | 1,238,434 | $ | 7.05 | $ | 5,764 | 1,088,004 | $ | 6.99 | $ | 864 | ||||||
The aggregate intrinsic value of a stock option in the table above represents the total pre-tax amount by which the current market value of the underlying stock exceeds the price of the option that would have been received by the option holders had all option holders exercised their options on December 31, 2016. There was $7.9 million and $1.3 million in intrinsic value of the stock options outstanding at December 31, 2016 and December 31, 2015. The intrinsic value will change when the market value of the Company’s stock changes. The fair value (present value of the estimated future benefit to the option holder) of each option grant is estimated on the date of grant using the Black-Scholes option pricing model.
The Company recognized $341,000, $71,000, and $0 of compensation expense related to the stock options for the twelve months ended December 31, 2016, 2015, and 2014. At December 31, 2016, there was $532,000 in compensation expense to be recognized related to outstanding stock options.
Information pertaining to options outstanding at December 31, 2016 is as follows:
Exercise Prices | Number Outstanding | Weighted Average Remaining Life (yrs) | Number Exercisable | ||
$5.00 | 364,376 | 2.54 | 364,376 | ||
$5.20 | 217,500 | 8.01 | 72,500 | ||
$5.53 | 6,000 | 3.34 | 6,000 | ||
$6.25 | 25,000 | 3.78 | 25,000 | ||
$7.24 | 217,500 | 9.01 | — | ||
$7.50 | 400,580 | 0.58 | 400,580 | ||
$8.00 | 4,000 | 2.71 | 4,000 | ||
$8.58 | 126,450 | 9.50 | 126,450 | ||
$9.25 | 239,528 | 1.38 | 239,528 | ||
$10.35 | 196,000 | 9.88 | — | ||
1,796,934 | 1,238,434 | ||||
198,950 of options vested during the year ended December 31, 2016.
The Company grants restricted stock units to select officers and directors within the organization under all of its equity incentive plans, which entitle the holder to receive shares of Company common stock in the future, subject to certain terms, conditions and restrictions. Holders of restricted stock units are also entitled to receive additional units equal in value to any dividends paid with respect to the restricted stock units during the vesting period. Compensation expense for the restricted stock units equals the market price of the related stock at the date of grant and is amortized on a straight-line basis over the vesting period.
79
In 2016 and 2015, restricted stock units were issued with certain performance conditions for a minimum of 52,301 and 33,600 shares, respectively, and up to a maximum of 131,948 and 170,549 shares, respectively. These performance conditions were expected to be met by the end of 2016 and 2015 and the expense related to these awards was recognized over the year.
The Company recognized compensation expense of $936,000 and $731,000, respectively, for the twelve months ended December 31, 2016 and 2015, related to restricted stock units granted under the 2008 Equity Incentive Plan, the 2013 Equity Incentive Plan, and the 2016 Equity Incentive Plan. Total unrecognized compensation expense related to restricted stock grants was approximately $52,000 as of December 31, 2016.
The following is a summary of nonvested restricted stock units:
December 31, 2016 | December 31, 2015 | |||||||||
Number of Shares | Weighted Average Grant Date Fair Value | Number of Shares | Weighted Average Grant Date Fair Value | |||||||
Outstanding at beginning of year | 25,000 | $ | 5.14 | 212,020 | $ | 3.95 | ||||
Granted | 132,975 | 6.64 | 151,059 | 5.24 | ||||||
Vested | (144,641 | ) | 6.49 | (338,079 | ) | 4.44 | ||||
Canceled | — | — | — | — | ||||||
Forfeited | — | — | — | — | ||||||
Nonvested shares, end of year | 13,334 | $ | 5.50 | 25,000 | $ | 5.14 | ||||
Note 13. | Concentrations, Commitments and Contingencies |
Concentrations of credit risk: In addition to financial instruments with off-balance-sheet risk, the Company, to a certain extent, is exposed to varying risks associated with concentrations of credit. Concentrations of credit risk generally exist if a number of borrowers are engaged in similar activities and have similar economic characteristics that would cause their ability to meet contractual obligations to be similarly affected by economic or other conditions.
The Company conducts substantially all of its lending activities in Will, Grundy, DuPage, Cook and Kane counties in Illinois and their surrounding communities. Loans granted to businesses are primarily secured by business assets, investment real estate, owner-occupied real estate or personal assets of commercial borrowers. Loans to individuals are primarily secured by personal residences or other personal assets. Since the Company’s borrowers and its loan collateral have geographic concentration in its primary market area, the Company could have exposure to declines in the local economy and real estate market. However, management believes that the diversity of its customer base and local economy, its knowledge of the local market, and its proximity to customers limits the risk of exposure to adverse economic conditions.
Credit related financial instruments: The Company is party to credit related financial instruments with off-balance-sheet risk in the normal course of business to meet the financing needs of its customers. These financial instruments include commitments to extend credit and standby letters of credit. Such commitments involve, to varying degrees, elements of credit and interest rate risk in excess of the amount recognized in the consolidated balance sheets.
The Company’s exposure to credit loss is represented by the contractual amount of these commitments. The Company follows the same credit policies in making commitments as it does for on-balance-sheet instruments.
A summary of the Company’s commitments is as follows (in thousands):
December 31, 2016 | December 31, 2015 | |||||
Commitments to extend credit | $ | 262,408 | $ | 179,517 | ||
Standby letters of credit | 12,164 | 10,353 | ||||
Performance letters of credit | 2,253 | 1,088 | ||||
$ | 276,825 | $ | 190,958 | |||
Commitments to extend credit are agreements to lend to a customer as long as there is no violation of any condition established in the contract. Commitments generally have fixed expiration dates or other termination clauses and may require payment of a fee. Because many of the commitments are expected to expire without being drawn upon, the total commitment amounts do not necessarily represent future cash requirements. The Company evaluates each customer’s creditworthiness on a case-by-case basis. The amount of collateral obtained, if deemed necessary by the Company, is based on management’s credit evaluation of the party.
Standby letters of credit are conditional commitments issued by the Company to guarantee the performance of a customer to a third party. Those guarantees are primarily issued to support public and private borrowing arrangements and, generally, have terms of one year or less. The credit risk involved in issuing letters of credit is essentially the same as that involved in extending loan facilities to customers. The Company holds collateral, which may include accounts receivable, inventory, property and equipment or, income producing properties, supporting those commitments if deemed necessary. In the event the customer does not perform in accordance with the terms of the agreement with the third party, the Company would be required to fund the commitment. The maximum potential amount of future payments the Company could be required to make is represented by the contractual amount shown in the summary above. If the commitment were funded, the Company would be entitled to seek recovery from the customer.
Contingencies: In the normal course of business, the Company is involved in various legal proceedings. In the opinion of management, any liability resulting from such pending proceedings would not be expected to have a material adverse effect on the Company’s consolidated financial statements.
80
Note 14. | Capital and Regulatory Matters |
The Company and Bank are subject to various regulatory capital requirements administered by the federal banking agencies. Failure to meet minimum capital requirements can initiate certain mandatory and possibly additional discretionary actions by regulators that, if undertaken, could have a direct material effect on the Company’s and Bank’s financial results and condition. Under capital adequacy guidelines and the regulatory framework for prompt corrective action, the Company and the Bank must meet specific capital guidelines that involve quantitative measures of assets, liabilities, and certain off-balance-sheet items as calculated under regulatory accounting practices. The capital amounts and classifications are also subject to qualitative judgments by the regulators about components, risk weightings, and other factors. Prompt corrective action provisions are not applicable to bank holding companies.
As of December 31, 2016, the Bank was well capitalized under the regulatory framework for prompt corrective action. Currently, to be categorized as well capitalized, the Bank must maintain minimum total risk-based, Tier I risk-based, common equity tier 1 capital, and Tier 1 leverage ratios as set forth in the following table. Bank regulators can modify capital requirements as part of their examination process.
In July 2013, the U.S. federal banking authorities approved the implementation of the Basel III regulatory capital reforms and issued rules effecting certain changes required by the Dodd-Frank Act (the “Basel III Rules”). The Basel III Rules are applicable to all U.S. banks that are subject to minimum capital requirements, as well as to bank and savings and loan holding companies other than “small bank holding companies” (generally non-public bank holding companies with consolidated assets of less than $1 billion). The Basel III Rules not only increased most of the required minimum regulatory capital ratios, but they introduced a new common equity tier 1 capital ratio and the concept of a capital conservation buffer. The capital conservation buffer is subject to a three year phase-in period that began on January 1, 2016, and will be fully phased-in on January 1, 2019, at 2.5%. The required phased-in capital conservation buffer during 2016 was 0.62%. A banking organization with a conservation buffer of less than the required phased-in amount will be subject to limitations on capital distributions, including dividend payments and certain discretionary bonus payments to executive officers. As of December 31, 2016, the regulatory capital ratios for the Company and the Bank were sufficient to meet the fully phased-in conversation buffer.
The Basel III Rules also expanded the definition of capital by establishing criteria that instruments must meet to be considered additional Tier 1 capital (Tier 1 capital in addition to common equity) and Tier 2 capital. A number of instruments that generally qualified as Tier 1 capital will not qualify, or their qualifications will change when the Basel III rules are fully implemented. The Basel III Rules also permitted banking organizations with less than $15.0 billion in assets to retain, through a one-time election, the existing treatment for accumulated other comprehensive income, which currently does not affect regulatory capital. The Company made this one time election in the first quarter of 2015. The Basel III Rules have maintained the general structure of the current prompt corrective action framework, while incorporating the increased requirements. The prompt corrective action guidelines were also revised to add the common equity Tier 1 capital ratio. In order to be a “well-capitalized” depository institution under the new regime, a bank and holding company must maintain a common equity Tier 1 capital ratio of 6.5% or more; a Tier 1 capital ratio of 8% or more; a total capital ratio of 10% or more; and a leverage ratio of 5% or more. The Company and Bank became subject to the new Basel III Rules on January 1, 2015, with phase-in periods for many of the changes. Management believes, as of December 31, 2016 and December 31, 2015, the Company and the Bank met all capital adequacy requirements to which they were subject.
81
2016 | 2015 | For Capital Adequacy Purposes With Capital Conservation buffer | Regulatory Minimum To Be Well Capitalized under Prompt Corrective Action Provisions | |||||||||||||||||
Ratio | Amount | Ratio | Amount | Ratio | Amount | Ratio | Amount | |||||||||||||
Bank capital ratios: | ||||||||||||||||||||
Total capital to risk-weighted assets | 12.77 | % | $ | 138,772 | 15.79 | % | $ | 133,247 | 8.625 | % | $ | 93,751 | 10.00 | % | $ | 108,697 | ||||
Tier 1 capital to risk weighted assets | 11.69 | % | 127,088 | 14.54 | % | 122,664 | 6.625 | % | 72,012 | 8.00 | % | 86,958 | ||||||||
Tier 1 common equity to risk-weighted assets | 11.69 | % | 127,088 | 14.54 | % | 122,664 | 5.125 | % | 55,707 | 6.50 | % | 70,653 | ||||||||
Tier 1 leverage to average assets | 10.10 | % | 127,088 | 11.71 | % | 122,664 | 4.00 | % | 50,340 | 5.00 | % | 62,925 | ||||||||
Company capital ratios: | ||||||||||||||||||||
Total capital to risk-weighted assets | 12.99 | % | 141,451 | 14.69 | % | 124,159 | 8.625 | % | 93,892 | N/A | N/A | |||||||||
Tier 1 capital to risk weighted assets | 10.51 | % | 114,467 | 11.62 | % | 98,276 | 6.625 | % | 72,120 | N/A | N/A | |||||||||
Tier 1 common equity to risk-weighted assets | 10.51 | % | 114,467 | 11.62 | % | 98,276 | 5.125 | % | 55,791 | N/A | N/A | |||||||||
Tier 1 leverage to average assets | 9.10 | % | 114,467 | 9.36 | % | 98,276 | 4.00 | % | 50,323 | N/A | N/A | |||||||||
Under the Illinois Banking Act, Illinois-chartered banks generally may not pay dividends in excess of their net profits, after first deducting their losses (including any accumulated deficit) and provision for loan losses. The payment of dividends by any bank is affected by the requirement to maintain adequate capital pursuant to applicable capital adequacy guidelines and regulations, and a financial institution generally is prohibited from paying any dividends if, following payment thereof, the institution would be undercapitalized. Moreover, the Federal Deposit Insurance Corporation (“FDIC”) prohibits the payment of any dividends by a bank if the FDIC determines such payment would constitute an unsafe or unsound practice.
Note 15. | Fair Value Measurements |
ASC Topic 820 defines fair value as the price that would be received to sell an asset or paid to transfer a liability in an orderly transaction between market participants. A fair value measurement assumes that the transaction to sell the asset or transfer the liability occurs in the principal market for the asset or liability or, in the absence of a principal market, the most advantageous market for the asset or liability. The price in the principal (or most advantageous) market used to measure the fair value of the asset or liability shall not be adjusted for transaction costs. An orderly transaction is a transaction that assumes exposure to the market for a period prior to the measurement date to allow for marketing activities that are usual and customary for transactions involving such assets and liabilities; it is not a forced transaction. Market participants are buyers and sellers in the principal market that are (i) independent, (ii) knowledgeable, (iii) able to transact and (iv) willing to transact.
ASC Topic 820 requires the use of valuation techniques that are consistent with the market approach, the income approach and/or the cost approach. The market approach uses prices and other relevant information generated by market transactions involving identical or comparable assets and liabilities. The income approach uses valuation techniques to convert expected future amounts, such as cash flows or earnings, to a single present value amount on a discounted basis. The cost approach is based on the amount that currently would be required to replace the service capacity of an asset (replacement cost). Valuation techniques should be consistently applied. Inputs to valuation techniques refer to the assumptions that market participants would use in pricing the asset or liability. Inputs may be observable, meaning those that reflect the assumptions market participants would use in pricing the asset or liability developed based on market data obtained from independent sources, or unobservable, meaning those that reflect the reporting entity’s own assumptions about the assumptions market participants would use in pricing the asset or liability developed based on the best information available in the circumstances. In that regard, ASC Topic 820 establishes a fair value hierarchy for valuation inputs that gives the highest priority to quoted prices in active markets for identical assets or liabilities and the lowest priority to unobservable inputs. The fair value hierarchy is as follows:
Level 1: Quoted prices (unadjusted) for identical assets or liabilities in active markets that the entity has the ability to access as of the measurement date.
82
Level 2: Significant other observable inputs other than Level 1 prices such as quoted prices for similar assets or liabilities; quoted prices in markets that are not active; or other inputs that are observable or can be corroborated by observable market data.
Level 3: Significant unobservable inputs that reflect a reporting entity’s own assumptions about the assumptions that market participants would use in pricing an asset or liability.
In general, fair value is based upon quoted market prices, where available. If such quoted market prices are not available, fair value is based upon internally developed models that primarily use, as inputs, observable market-based parameters. Valuation adjustments may be made to ensure that financial instruments are recorded at fair value. These adjustments may include amounts to reflect counterparty credit quality, the Company’s creditworthiness, among other things, as well as unobservable parameters. Any such valuation adjustments are applied consistently over time. Our valuation methodologies may produce a fair value calculation that may not be indicative of net realizable value or reflective of future fair values. While management believes the Company’s valuation methodologies are appropriate and consistent with other market participants, the use of different methodologies or assumptions to determine the fair value of certain financial instruments could result in a different estimate of fair value at the reporting date. Transfers between levels of the fair value hierarchy are recognized on the actual date of the event or circumstances that caused the transfer, which generally coincides with the Company’s monthly and/or quarterly valuation process.
Financial Instruments Recorded at Fair Value on a Recurring Basis
Securities Available for Sale: The fair value of the Company’s securities available for sale is determined using Level 2 inputs from independent pricing services. Level 2 inputs consider observable data that may include dealer quotes, market spread, cash flows, treasury yield curve, trading levels, credit information and terms, among other factors. Certain state and political subdivision securities are not valued based on observable transactions and are, therefore, classified as Level 3.
Derivatives: The Bank provides clients with interest rate swap transactions and offset the transactions with interest rate swap transactions with another financial institution as a means of providing loan terms agreeable to both parties. The valuation of these instruments is determined using widely accepted valuation techniques including discounted cash flow analysis on the expected cash flows of each derivative and classified as Level 2. This analysis reflects the contractual terms of the derivatives, including the period to maturity, and uses observable market-based inputs, including LIBOR rate curves.
The following table summarizes financial assets and financial liabilities measured at fair value on a recurring basis as of December 31, 2016 and December 31, 2015, segregated by the level of the valuation inputs within the fair value hierarchy utilized to measure fair value (in thousands):
83
December 31, 2016 | Total | Quoted Prices in Active Markets for Identical Assets (Level 1) | Significant Other Observable Inputs (Level 2) | Significant Unobservable Inputs (Level 3) | ||||||||
Financial Assets | ||||||||||||
Securities Available for Sale: | ||||||||||||
Residential collateralized mortgage obligations | $ | 61,417 | $ | — | $ | 61,417 | $ | — | ||||
Residential mortgage backed securities | 33,241 | — | 33,241 | — | ||||||||
State and political subdivisions | 107,540 | — | 106,036 | 1,504 | ||||||||
Derivative financial instruments | 62 | — | 62 | — | ||||||||
Financial Liabilities | ||||||||||||
Derivative financial instruments | 62 | — | 62 | — | ||||||||
December 31, 2015 | ||||||||||||
Financial Assets | ||||||||||||
Securities Available for Sale: | ||||||||||||
Government sponsored enterprises | $ | 16,409 | $ | — | $ | 16,409 | $ | — | ||||
Residential collateralized mortgage obligations | 62,364 | — | 62,364 | — | ||||||||
Residential mortgage backed securities | 28,291 | — | 28,291 | — | ||||||||
State and political subdivisions | 98,540 | — | 97,036 | 1,504 | ||||||||
Derivative financial instruments | 95 | — | 95 | — | ||||||||
Financial Liabilities | ||||||||||||
Derivative financial instruments | 95 | — | 95 | — | ||||||||
The significant unobservable inputs used in the Level 3 fair value measurements of the Company’s state and political subdivisions in the table above primarily relate to the discounted cash flows including the bond’s coupon, yield and expected maturity date.
The Company did not have any transfers between Level 1 and Level 2 of the fair value hierarchy during the twelve months ended December 31, 2016. The Company’s policy for determining transfers between levels occurs at the end of the reporting period when circumstances in the underlying valuation criteria change and result in transfer between levels.
84
The following tables present additional information about assets and liabilities measured at fair value on a recurring basis for which the Company has utilized Level 3 inputs to determine fair value (in thousands):
Fair Value Measurements Using Significant Unobservable Inputs (Level 3) | |||
State and political subdivisions | |||
Beginning balance, December 31, 2015 | $ | 1,504 | |
Total gains or losses (realized/unrealized) included in other comprehensive income | — | ||
Included in earnings | — | ||
Purchases | — | ||
Paydowns and maturities | — | ||
Transfers in and/or out of Level 3 | — | ||
Ending balance, December 31, 2016 | $ | 1,504 | |
Beginning balance, December 31, 2014 | $ | 1,514 | |
Total gains or losses (realized/unrealized) included in other comprehensive income | (10 | ) | |
Included in earnings | — | ||
Purchases | — | ||
Paydowns and maturities | — | ||
Transfers in and/or out of Level 3 | — | ||
Ending balance, December 31, 2015 | $ | 1,504 | |
Financial Instruments Recorded at Fair Value on a Nonrecurring Basis
The Company may be required, from time to time, to measure certain assets and liabilities at fair value on a nonrecurring basis in accordance with generally accepted accounting principles. These include assets that are measured at the lower of cost or market that were recognized at fair value below cost at the end of the period. Assets measured at fair value on a nonrecurring basis are set forth below:
December 31, 2016 | Total | Quoted Prices in Active Markets for Identical Assets (Level 1) | Significant Other Observable Inputs (Level 2) | Significant Unobservable Inputs (Level 3) | ||||||||
Financial Assets | ||||||||||||
Mortgage loans held for sale | $ | 1,230 | $ | — | $ | — | $ | 1,230 | ||||
Impaired loans | 12,020 | — | — | 12,020 | ||||||||
Loans held for sale | 1,085 | — | — | 1,085 | ||||||||
Foreclosed assets | 725 | — | — | 725 | ||||||||
December 31, 2015 | ||||||||||||
Financial Assets | ||||||||||||
Mortgage loans held for sale | $ | 400 | $ | — | $ | — | $ | 400 | ||||
Impaired loans | 9,348 | — | — | 9,348 | ||||||||
Foreclosed assets | 5,487 | — | — | 5,487 | ||||||||
85
The following table presents additional quantitative information about assets measured at fair value on a non-recurring basis for which the Company has utilized Level 3 inputs to determine fair value:
Quantitative Information about Level 3 Fair Value Measurements | ||||||
Fair Value Estimate | Valuation Techniques | Unobservable Input | Discount Range | |||
December 31, 2016 | ||||||
Mortgage loans held for sale | $ | 1,230 | Secondary market pricing | Selling costs | — | |
Impaired loans | 12,020 | Appraisal of Collateral | Appraisal adjustments Selling costs | 10% to 25% | ||
Loans held for sale | 1,085 | Secondary market pricing | Selling costs | 10% to 25% | ||
Foreclosed assets | 725 | Appraisal of Collateral | Selling costs | 10.00% | ||
December 31, 2015 | ||||||
Mortgage loans held for sale | $ | 400 | Secondary market pricing | Selling costs | — | |
Impaired loans | 9,348 | Appraisal of Collateral | Appraisal adjustments Selling costs | 10% to 25% | ||
Foreclosed assets | 5,487 | Appraisal of Collateral | Selling costs | 10.00% | ||
Impaired loans: Impaired loans are evaluated and valued at the time the loan is identified as impaired, at the lower of cost or fair value. Fair value is measured based on the value of the collateral securing these loans and is classified at a Level 3 in the fair value hierarchy. The fair value for an impaired loan is generally determined utilizing appraisals for real estate loans and value guides or consultants for commercial and industrial loans and other loans secured by items such as equipment, inventory, accounts receivable or vehicles. In substantially all instances, a 10% discount is utilized for selling costs which includes broker fees and closing costs. It is our general practice to obtain updated values on impaired loans every twelve to eighteen months. In instances where the appraisal is greater than one year old, an additional discount is considered ranging from 5% to 15%. Any adjustment is based on either comparisons from other recent appraisals obtained by the Company on like properties or using third party resources such as real estate brokers or Reis, Inc., a nationally recognized provider of commercial real estate information including real estate values.
As of December 31, 2016 and December 31, 2015, approximately $3.1 million, or 32%, and $10.8 million, or 69%, of impaired loans were evaluated for impairment using appraisals performed within twelve months of these dates, respectively.
Loans Held for Sale: The fair value of loans held for sale is determined using quoted secondary market prices and classified as Level 2.
Foreclosed assets: Foreclosed assets upon initial recognition are measured and reported at fair value through a charge-off to the allowance for loan and lease losses based upon the fair value of the foreclosed asset. Fair values are generally based on third party appraisals of the property resulting in Level 3 classification. The appraised value is discounted by 10% for estimated selling costs which includes broker fees and closing costs and appraisals are obtained annually.
Disclosures about Fair Value of Financial Instruments, requires disclosure of fair value information about financial instruments, whether or not recognized in the balance sheet. Fair value is determined under the framework established by Fair Value Measurements, based upon criteria noted above. Certain financial instruments and all non-financial instruments are excluded from the disclosure requirements. Accordingly, the aggregate fair value amounts presented may not necessarily represent the underlying fair value at the Company. The methodologies for measuring fair value of financial assets and financial liabilities that are measured at fair value on a recurring or nonrecurring basis are discussed above. The methodologies for other financial assets and financial liabilities are discussed below.
The following methods and assumptions were used by the Company in estimating the fair value disclosures of its other financial instruments:
Cash and due from banks: The carrying amounts reported in the consolidated balance sheets for cash and due from banks and approximate their fair values.
Interest-bearing deposits in banks: The carrying amounts of interest-bearing deposits maturing within one year approximate their fair values.
86
Nonmarketable equity securities: These securities are either redeemable at par or current redemption values; therefore, market value equals cost.
Loans: For those variable-rate loans that reprice frequently and with no significant change in credit risk, fair values are based on carrying values. The fair values for fixed rate and all other loans are estimated using discounted cash flow analyses, using interest rates currently being offered for loans with similar terms to borrowers with similar credit quality.
Deposits: The fair values disclosed for deposits with no defined maturities are equal to their carrying amounts, which represent the amount payable on demand. The carrying amounts for variable-rate certificates of deposit approximate their fair value at the reporting date. Fair values for fixed-rate certificates of deposit are estimated using a discounted cash flow calculation that applies interest rates currently being offered on certificates to a schedule of aggregated expected monthly maturities on time deposits.
Subordinated debt: The fair values of the Company’s subordinated debt are estimated using discounted cash flows based on the Company’s current incremental borrowing rates for similar types of borrowing arrangements.
Other borrowed funds: The carrying amounts of securities sold under repurchase agreements, term notes, revolving lines of credit and mortgage notes payable approximate their fair values.
Accrued interest receivable and payable: The carrying amounts of accrued interest approximate their fair values.
Off-balance-sheet instruments: Fair values for the Company’s off-balance-sheet lending commitments (standby letters of credit and commitments to extend credit) are based on fees currently charged to enter into similar agreements taking into account the remaining term of the agreements and the counterparties’ credit standing. The fair value of these commitments is not material.
The estimated fair values of the Company’s financial instruments are as follows as of December 31, 2016 (in thousands):
Carrying Amount | Estimated Fair Value | Quoted Prices in Active Markets for Identical Assets (Level 1) | Significant Other Observable Inputs (Level 2) | Significant Unobservable Inputs (Level 3) | |||||||||||
Financial assets: | |||||||||||||||
Cash and due from banks | $ | 16,225 | $ | 16,225 | $ | 16,225 | $ | — | $ | — | |||||
Interest-bearing deposits in banks | 8,548 | 8,548 | 8,548 | — | — | ||||||||||
Securities available for sale | 202,198 | 202,198 | — | 200,694 | 1,504 | ||||||||||
Nonmarketable equity securities | 3,297 | 3,297 | — | — | 3,297 | ||||||||||
Mortgage loans held for sale | 1,230 | 1,230 | — | — | 1,230 | ||||||||||
Loans held for sale | 1,085 | 1,085 | — | — | 1,085 | ||||||||||
Loans, net | 979,934 | 980,290 | — | — | 980,290 | ||||||||||
Accrued interest receivable | 3,521 | 3,521 | 3,521 | — | — | ||||||||||
Derivative financial instruments | 62 | 62 | — | 62 | — | ||||||||||
Financial liabilities: | |||||||||||||||
Non-interest bearing deposits | 247,856 | 247,856 | 247,856 | — | — | ||||||||||
Interest-bearing deposits | 835,300 | 836,103 | 508,422 | — | 327,681 | ||||||||||
Other borrowed funds | 51,153 | 51,110 | — | — | 51,110 | ||||||||||
Subordinated debt | 15,300 | 16,182 | — | — | 16,182 | ||||||||||
Accrued interest payable | 566 | 566 | 566 | — | — | ||||||||||
Derivative financial instruments | 62 | 62 | — | 62 | — | ||||||||||
87
The estimated fair values of the Company’s financial instruments are as follows as of December 31, 2015 (in thousands):
Carrying Amount | Estimated Fair Value | Quoted Prices in Active Markets for Identical Assets (Level 1) | Significant Other Observable Inputs (Level 2) | Significant Unobservable Inputs (Level 3) | |||||||||||
Financial assets: | |||||||||||||||
Cash and due from banks | $ | 10,699 | $ | 10,699 | $ | 10,699 | $ | — | $ | — | |||||
Interest-bearing deposits in banks | 7,406 | 7,406 | 7,406 | — | — | ||||||||||
Securities available for sale | 205,604 | 205,604 | — | 204,100 | 1,504 | ||||||||||
Nonmarketable equity securities | 1,367 | 1,367 | — | — | 1,367 | ||||||||||
Mortgage loans held for sale | 400 | 400 | — | — | 400 | ||||||||||
Loans, net | 760,578 | 760,159 | — | — | 760,159 | ||||||||||
Accrued interest receivable | 3,106 | 3,106 | 3,106 | — | — | ||||||||||
Derivative financial instruments | 319 | 319 | — | 319 | — | ||||||||||
Financial liabilities: | |||||||||||||||
Non-interest bearing deposits | 196,063 | 196,063 | 196,063 | — | — | ||||||||||
Interest-bearing deposits | 669,928 | 668,835 | 372,404 | — | 296,431 | ||||||||||
Other borrowed funds | 53,015 | 52,566 | 52,566 | — | — | ||||||||||
Subordinated debt | 15,300 | 15,164 | — | — | 15,164 | ||||||||||
Accrued interest payable | 545 | 545 | 545 | — | — | ||||||||||
Derivative financial instruments | 319 | 319 | — | 319 | — | ||||||||||
Note 16. | Derivatives and Hedging Activities |
Derivative contracts entered into by the Bank are limited to those that do not qualify for hedge accounting treatment. The Bank provides clients with interest rate swap transactions and offsets the transactions with interest rate swap transactions with another financial institution as a means of providing loan terms agreeable to both parties. As of December 31, 2016 and December 31, 2015, there were $1.2 million and $1.3 million, respectively, outstanding notional values of swaps where the Bank receives a variable rate of interest and the client receives a fixed rate of interest. This is offset with counterparty contracts where the Bank pays a floating rate of interest and receives a fixed rate of interest. The estimated fair value of interest rate swaps was $62,000 and $95,000 as of December 31, 2016 and December 31, 2015, respectively, and was recorded gross as an asset and a liability. Swaps with clients and third-party financial institutions are carried at fair value with adjustments recorded in other income. The gross amount of the adjustments to the income statement were $33,000, $219,000, and $10,000 during the years ended December 31, 2016, December 31, 2015, and December 31, 2014, respectively.
88
Note 17. | Unaudited Interim Financial Data |
The following table reflects summarized unaudited quarterly data fro the periods described (dollars in thousands, except per share data):
2016 | ||||||||||||
December | September | June | March | |||||||||
Total interest income | $ | 11,749 | $ | 11,313 | $ | 10,087 | $ | 9,628 | ||||
Total interest expense | 1,508 | 1,490 | 1,373 | 1,330 | ||||||||
Net interest income | 10,241 | 9,823 | 8,714 | 8,298 | ||||||||
Provision for loan losses | 183 | 383 | 500 | — | ||||||||
Total noninterest income | 898 | 2,773 | 1,241 | 555 | ||||||||
Total noninterest expense | 6,919 | 7,059 | 6,132 | 5,936 | ||||||||
Income before income taxes | 4,037 | 5,154 | 3,323 | 2,917 | ||||||||
Income taxes | 1,358 | 1,019 | 1,058 | 889 | ||||||||
Net income | $ | 2,679 | $ | 4,135 | $ | 2,265 | $ | 2,028 | ||||
Basic earnings per share | $ | 0.16 | $ | 0.24 | $ | 0.13 | $ | 0.12 | ||||
Diluted earnings per share | $ | 0.15 | $ | 0.24 | $ | 0.13 | $ | 0.12 | ||||
2015 | ||||||||||||
December | September | June | March | |||||||||
Total interest income | $ | 9,539 | $ | 9,340 | $ | 9,067 | $ | 8,779 | ||||
Total interest expense | 1,369 | 1,368 | 1,607 | 1,594 | ||||||||
Net interest income | 8,170 | 7,972 | 7,460 | 7,185 | ||||||||
Provision for loan losses | (516 | ) | (812 | ) | (749 | ) | — | |||||
Total noninterest income | 762 | 769 | 521 | 445 | ||||||||
Total noninterest expense | 5,050 | 5,136 | 5,199 | 5,157 | ||||||||
Income before income taxes | 4,398 | 4,418 | 3,531 | 2,437 | ||||||||
Income taxes | 1,475 | 1,471 | 1,189 | 867 | ||||||||
Net income | $ | 2,923 | $ | 2,947 | $ | 2,342 | $ | 1,606 | ||||
Basic earnings per share | $ | 0.17 | $ | 0.17 | $ | 0.14 | $ | 0.10 | ||||
Diluted earnings per share | $ | 0.17 | $ | 0.17 | $ | 0.14 | $ | 0.09 | ||||
89
Item 9. Changes in and Disagreements with Accountants on Accounting and Financial Disclosure
Not applicable.
Item 9A. Controls and Procedures
Disclosure Controls and Procedures
The Company’s management carried out an evaluation, under the supervision and with the participation of the chief executive officer and the chief financial officer, of the effectiveness of the design and operation of the Company’s disclosure controls and procedures (as such term is defined in Rule 15d-15(e) and Rule 15d-15(e) under the Securities Exchange Act of 1934) as of December 31, 2016. Based upon that evaluation, the chief executive officer along with the chief financial officer concluded that the Company’s disclosure controls and procedures as of December 31, 2016, were effective.
Management’s Annual Report on Internal Control over Financial Reporting
Management is responsible for establishing and maintaining adequate internal control over financial reporting (as defined by Rule 13a-15(f) and 15d-15(f) promulgated under the Exchange Act). The Company’s internal control over financial reporting is a process designed under the supervision of the chief executive officer and the chief financial officer to provide reasonable assurance regarding the reliability of financial reporting and the preparation of the Company’s financial statements for external purposes in accordance with U.S. GAAP.
Because of its inherent limitations, internal control over financial reporting may not prevent or detect misstatements. Also, projections of any evaluation of effectiveness to future periods are subject to the risk that controls may become inadequate because of changes in conditions, or that the degree of compliance with the policies or procedures may deteriorate.
Management has made a comprehensive review, evaluation, and assessment of the Company’s internal control over financial reporting as of December 31, 2016. In making its assessment of the effectiveness of the Company’s internal control over financial reporting, management used the framework issued by the Committee of Sponsoring Organizations of the Treadway Commission in Internal Control-Integrated Framework in 2013. Based on that assessment, management concluded that, as of December 31, 2016, the Company’s internal control over financial reporting was effective.
This Annual Report on Form 10-K does not include an attestation report of the Company’s independent registered public accounting firm regarding internal control over financial reporting. Management’s report was not subject to attestation by the Company’s independent registered public accounting firm pursuant to the rules of the SEC permitting the Company to provide only a management’s report in this Annual Report on Form 10-K.
Changes in Internal Control over Financial Reporting
There were no changes in the Company’s internal control over financial reporting that occurred during the Company’s fourth fiscal quarter that have materially affected, or are reasonably likely to materially affect, the Company’s internal control over financial reporting.
Item 9B. Other Information
Not applicable.
90
PART III
Item 10. Directors, Executive Officers and Corporate Governance.
The information required by this item will be provided in a subsequent amendment to this Annual Report on Form 10-K, which will be filed with the SEC not later than 120 days after the end of our fiscal year.
Item 11. Executive Compensation
The information required by this item is will be provided in a subsequent amendment to this Annual Report on Form 10-K, which will be filed with the SEC not later than 120 days after the end of our fiscal year.
Item 12. Security Ownership of Certain Beneficial Owners and Management and Related Stockholder Matters.
Except as provided below, the information required by this item will be provided in a subsequent amendment to this Annual Report on Form 10-K, which will be filed with the SEC no later than 120 days after the end of our fiscal year.
Equity Compensation Plan Information
All shares authorized for issuance under our compensation plans as of December 31, 2016 were authorized under the First Community Financial Partners, Inc. Amended and Restated 2008 Equity Incentive Plan (our “2008 Equity Incentive Plan”), the First Community Financial Partners, Inc. 2013 Equity Incentive Plan (our “2013 Equity Incentive Plan”), or the First Community Financial Partners, Inc. 2016 Equity Incentive Plan (our “2016 Equity Incentive Plan” and together with our 2013 Equity Incentive Plan and our 2008 Equity Incentive Plan, our “Equity Plans”).
Our 2008 Equity Incentive Plan was amended and restated effective May 20, 2009, which amendment and restatement was approved by our shareholders. Our 2008 Equity Incentive Plan was subsequently amended, effective December 21, 2011, to increase the number of shares of our common stock available by 1,000,000 (from 1,430,000 to 2,430,000). Our shareholders did not approve this amendment. Our 2008 Equity Incentive Plan was further amended, effective June 19, 2014, to allow certain awards to expire more than 10 years after the date of grant where provided by the Board of Directors. Our shareholders did not approve this amendment. Our 2008 Equity Incentive Plan has not been amended further.
Our 2013 Equity Incentive Plan was adopted by the Board of Directors on August 15, 2013 and was not approved by our shareholders. On December 18, 2014, the Board of Directors approved an amendment to the 2013 Equity Incentive Plan to increase the maximum number of shares from 100,000 shares to 1,000,000 shares.
Our 2016 Equity Incentive Plan was adopted by the Board of Directors and became effective upon approval by our shareholders on May 19, 2016. Under our 2016 Equity Incentive Plan, the maximum number of shares of our common stock that may be issued to participants is 2,000,000. Following the effective date of our 2016 Equity Incentive Plan no additional awards may be granted from our 2008 Equity Incentive Plan or our 2013 Equity Incentive Plan.
Our Equity Plans permit awards of stock options, stock appreciation rights, other stock awards (including without limitation restricted stock units and restricted stock awards) and cash incentive awards to our employees, directors and other service providers. Each Equity Plan will remain in effect as long as any awards under the respective plan are outstanding. However, no awards may be granted after the 10-year anniversary of the respective plan’s effective date. The Company generally reserves the right to amend or terminate our Equity Plans at any time. Awards under our Equity Plans may also be amended by the Company, but the participant generally must consent to the change if it impairs the participant’s rights under the award. Our Compensation Committee currently administers our Equity Plans.
Stock options are granted at the fair market value of our common stock at the grant date, generally vest in three equal annual increments beginning on the first anniversary of the grant date unless the Board of Directors provides otherwise, and must be exercised within 10 years after the grant date. Restricted stock units entitle the holder to a specified number of shares of our common stock at a specified future date, subject to the continued service of the holder.
91
The following table provides certain summary information as of December 31, 2016 concerning our compensation plans under which shares of our common stock may be issued.
Number of Securities to Be Issued upon Exercise of Outstanding Options, Warrants and Rights (a)(#) | Weighted-Average Exercise Price Of Outstanding Options, Warrants And Rights($) (b) | Number Of Securities Remaining Available For Future Issuance Under Equity Compensation Plans (Excluding Securities Reflected in Column (a))(#) (c) | |||||
Equity Compensation Plans Approved By Security Holders (1) | 1,361,934 (3) | $ | 7.62 | 1,677,550 | |||
Equity Compensation Plans Not Approved By Security Holders (2) | 448,334 (4) | 6.22 | — | ||||
Total | 1,810,268 | $7.28 (5) | 1,677,550 | ||||
(1) Reflects amounts related to our 2008 Equity Incentive and 2016 Equity Incentive Plan. Our shareholders approved an amendment and restatement of our 2008 Equity Incentive Plan, effective May 20, 2009, at which time 1,430,000 shares of our common stock were available for issuance. Our 2008 Equity Incentive Plan was subsequently amended, effective December 21, 2011 (the “Amendment”), to increase the number of shares of our common stock available for issuance by 1,000,000 (from 1,430,000 to 2,430,000). Our shareholders did not approve the Amendment. Of the amounts reflected in this row, none of the 1,361,934 securities issuable upon exercise of outstanding options, warrants and rights relate to awards authorized pursuant to the Amendment.
(2) Reflects amounts related to our 2013 Equity Incentive Plan. Our shareholders did not approve our 2013 Equity Incentive Plan.
(3) Reflects 1,361,934 outstanding stock options under our 2008 Equity Incentive Plan and our 2016 Equity Incentive Plan.
(4) Reflects 13,334 outstanding restricted stock units and 435,000 outstanding stock options granted under our 2013 Equity Incentive Plan.
(5) The weighted average exercise price in this column (b) does not take into account the 13,334 restricted stock units issued under the 2013 Equity Incentive Plan.
Item 13. Certain Relationships and Related Transactions, and Director Independence.
The information required by this item will be provided in a subsequent amendment to this Annual Report on Form 10-K, either of which will be filed with the SEC not later than 120 days after the end of our fiscal year.
Item 14. Principal Accountant Fees and Services
The information required by this item is incorporated herein by reference from our definitive proxy statement for our 2017 Annual Meeting of Stockholders, or in a subsequent amendment to this Annual Report on Form 10-K, either of which will be filed with the SEC not later than 120 days after the end of our fiscal year.
92
Part IV
Item 15. Exhibits and Financial Statement Schedules
(a)(1) Financial Statements: See Item 8. Financial Statements and Supplementary Data.
(a)(2) Financial Statement Schedules: All financial statement schedules have been omitted as the information is not required under the related instructions or is not applicable.
(a)(3) Exhibits: See Exhibit Index.
(b) Exhibits: See Exhibit Index.
Item 16. Form 10-K Summary
None.
93
SIGNATURES
Pursuant to the requirements of Section 13 or 15(d) of the Securities Exchange Act of 1934, the registrant has duly caused this report to be signed on its behalf by the undersigned, thereunto duly authorized.
First Community Financial Partners, Inc.
(registrant)
By: /s/ Glen L. Stiteley
Glen L. Stiteley
Executive Vice President and Chief Financial Officer
Date: March 8, 2017
94
Pursuant to the requirements of the Securities Exchange Act of 1934, this report has been signed below on March 8, 2017 by the following persons on behalf of the Registrant and in the capacities indicated:
Signature | Title |
/s/ Roy C. Thygesen Roy C. Thygesen | Chief Executive Officer and Director (Principal Executive Officer) |
/s/ Glen L. Stiteley Glen L. Stiteley | Executive Vice President and Chief Financial Officer (Principal Financial and Accounting Officer) |
/s/ Patrick Roe Patrick Roe | President, Chief Operating Officer and Director |
/s/ George Barr George Barr | Chairman of the Board and Director |
/s/ Peter Coules, Jr. Peter Coules, Jr. | Director |
/s/ Terrence O. D’Arcy Terrence O. D’Arcy | Director |
/s/ John J. Dollinger John J. Dollinger | Director |
/s/ Rex D. Easton Rex D. Easton | Director |
/s/ Colleen Graham Dow Colleen Graham Dow | Director |
/s/ Vincent E. Jackson Vincent E. Jackson | Director |
/s/ Patricia L. Lambrecht Patricia L. Lambrecht | Director |
/s/ Stephen G. Morrissette Stephen G. Morrissette | Director |
/s/ Daniel Para Daniel Para | Director |
/s/ Michael F. Pauritsch Michael F. Pauritsch | Director |
/s/ William L. Pommerening William L. Pommerening | Director |
/s/ Robert L. Sohol Robert L. Sohol | Director |
/s/ Dennis G. Tonelli Dennis G. Tonelli | Director |
/s/ Scott A. Wehrli Scott A. Wehrli | Director |
95
Exhibit Index
3.1 | Articles of Incorporation, as amended (incorporated herein by reference to Exhibit 3.1 to First Community Financial Partners, Inc.’s Registration Statement on Form S-4 (Registration No. 333-185041)). | |
3.2 | Amended and Restated Bylaws (incorporated herein by reference to Exhibit 3.2 to First Community Financial Partners, Inc.’s Registration Statement on Form S-4 (Registration No. 333-185041)). | |
4.1 | Specimen of common stock certificate (incorporated herein by reference to Exhibit 4.1 to First Community Financial Partners, Inc.’s Registration Statement on Form S-4 (Registration No. 333-185041)). | |
4.2 | Specimen of preferred stock certificate (incorporated herein by reference to Exhibit 4.1 to First Community Financial Partners, Inc.’s Registration Statement on Form S-4 (Registration No. 333-185041)). | |
4.3 | Form of warrant (incorporated by reference to Exhibit 4.1 of our current report on Form 8-K filed March 13, 2013). | |
4.4 | In accordance with Item 601(b)(4)(iii)(A) of Regulation S-K, certain instruments respecting long-term debt of the registrant have been omitted but will be furnished to the SEC upon request. | |
10.1 | Employment Agreement, dated as of March 12, 2013, between First Community Financial Partners, Inc., First Community Financial Bank and Roy C. Thygesen (incorporated herein by reference to Exhibit 10.1 to First Community Financial Partners, Inc.’s Form 8-K filed March 13, 2013 (Registration No. 333-185044)). | |
10.2 | Employment Agreement, dated as of March 12, 2013, between First Community Financial Partners, Inc., First Community Financial Bank and Patrick J. Roe (incorporated herein by reference to Exhibit 10.2 to First Community Financial Partners, Inc.’s Form 8-K filed March 13, 2013 (Registration No. 333-185044)). | |
10.3 | Employment Agreement, dated as of March 12, 2013, between First Community Financial Partners, Inc., First Community Financial Bank and Glen L. Stiteley (incorporated herein by reference to Exhibit 10.3 to First Community Financial Partners, Inc.’s Form 8-K filed March 13, 2013 (Registration No. 333-185044)). | |
10.4 | Employment Agreement, dated as of March 12, 2013, between First Community Financial Partners, Inc., First Community Financial Bank and Donn P. Domico (incorporated herein by reference to Exhibit 10.4 to First Community Financial Partners, Inc.’s Form 8-K filed March 13, 2013 (Registration No. 333-185044)). | |
10.5 | Employment Agreement, dated as of March 12, 2013, between First Community Financial Partners, Inc., First Community Financial Bank and Steven Randich (incorporated herein by reference to Exhibit 10.5 to First Community Financial Partners, Inc.’s Form 8-K filed March 13, 2013 (Registration No. 333-185044)). | |
10.6 | First Community Financial Partners, Inc. Amended and Restated 2008 Equity Incentive Plan (incorporated herein by reference to Exhibit 10.11 to First Community Financial Partners Inc.’s Registration Statement on Form S-4 (Registration No. 333-185041)). | |
10.7 | First Community Financial Partners, Inc. First Amendment of the Amended and Restated 2008 Equity Incentive Plan (incorporated herein by reference to Exhibit 10.12 to First Community Financial Partners, Inc.’s Registration Statement on Form S-4 (Registration No. 333-185041)). | |
10.8 | First Community Financial Partners, Inc. Second Amendment of the Amended and Restated 2008 Equity Incentive Plan (incorporated herein by reference to Exhibit 10.8 to First Community Financial Partners, Inc.’s Annual Report on Form 10-K for the fiscal year ended December 31, 2015 (Registration No. 001-37505)). | |
10.9 | Form of First Community Financial Partners, Inc. Amended and Restated 2008 Equity Incentive Plan Restricted Stock Unit Award Agreement (incorporated herein by reference to Exhibit 10.13 to First Community Financial Partners, Inc.’s Registration Statement on Form S-4 (Registration No. 333-185041)). | |
10.10 | Form of First Community Financial Partners, Inc. Amended and Restated 2008 Equity Incentive Plan Incentive Stock Option Award Terms (incorporated herein by reference to Exhibit 10.14 to First Community Financial Partners, Inc.’s Registration Statement on Form S-4 (Registration No. 333-185041)). | |
10.11 | Form of First Community Financial Partners, Inc. Amended and Restated 2008 Equity Incentive Plan Non-Qualified Stock Option Award Terms (incorporated herein by reference to Exhibit 10.15 to First Community Financial Partners, Inc.’s Registration Statement on Form S-4 (Registration No. 333-185041)). | |
10.12 | First Community Financial Partners, Inc. 2013 Equity Incentive Plan (incorporated herein by reference to Exhibit 4.4 to First Community Financial Partners, Inc.’s Registration Statement on Form S-8 (Registration No. 333-190691)). | |
10.13 | First Community Financial Partners, Inc. First Amendment of the 2013 Equity Incentive Plan (incorporated herein by reference to Exhibit 10.13 to First Community Financial Partners, Inc.’s Annual Report on Form 10-K for the fiscal year ended December 31, 2015 (Registration No. 001-37505)). | |
10.14 | Form of First Community Financial Partners, Inc. 2013 Equity Incentive Plan Restricted Stock Unit Award Agreement (incorporated herein by reference to Exhibit 4.5 to First Community Financial Partners, Inc.’s Registration Statement on Form S-8 (Registration No. 333-190691)). | |
10.15 | Form of First Community Financial Partners, Inc. 2013 Equity Incentive Plan Restricted Stock Award Agreement (incorporated herein by reference to Exhibit 4.6 to First Community Financial Partners, Inc.’s Registration Statement on Form S-8 (Registration No. 333-190691)). | |
96
10.16 | Form of First Community Financial Partners, Inc. 2013 Equity Incentive Plan Nonqualified Stock Option Award Agreement (incorporated herein by reference to Exhibit 4.7 to First Community Financial Partners, Inc.’s Registration Statement on Form S-8 (Registration No. 333-190691)). | |
10.17 | Form of First Community Financial Partners, Inc. 2013 Equity Incentive Plan Employee Performance Unit Award Agreement (incorporated herein by reference to Exhibit 10.17 to First Community Financial Partners, Inc.’s Annual Report on Form 10-K for the fiscal year ended December 31, 2015 (Registration No. 001-37505)). | |
10.18 | Form of First Community Financial Bank Executive Pre-Retirement Split Dollar Agreement Adopted and Dated October 1, 2015 (incorporated herein by reference to Exhibit 10.18 to First Community Financial Partners, Inc.’s Annual Report on Form 10-K for the fiscal year ended December 31, 2015 (Registration No. 001-37505)). | |
10.19 | First Community Financial Partners, Inc. 2016 Equity Incentive Plan (incorporated herein by reference to Exhibit 4.4 to First Community Financial Partners, Inc.’s Registration Statement on Form S-8 (Registration No. 333-211811)). | |
10.20 | Form of First Community Financial Partners, Inc. 2016 Equity Incentive Plan Restricted Stock Unit Award Agreement (incorporated herein by reference to Exhibit 4.5 to First Community Financial Partners, Inc.’s Registration Statement on Form S-8 (Registration No. 333-211811)). | |
10.21 | Form of First Community Financial Partners, Inc. 2016 Equity Incentive Plan Restricted Stock Award Agreement (incorporated herein by reference to Exhibit 4.6 to First Community Financial Partners, Inc.’s Registration Statement on Form S-8 (Registration No. 333-211811)). | |
10.22 | Form of First Community Financial Partners, Inc. 2016 Equity Incentive Plan Nonqualified Stock Option Award Agreement (incorporated herein by reference to Exhibit 4.7 to First Community Financial Partners, Inc.’s Registration Statement on Form S-8 (Registration No. 333-211811)). | |
10.23 | Form of First Community Financial Partners, Inc. 2016 Equity Incentive Plan Incentive Stock Option Award Agreement (incorporated herein by reference to Exhibit 4.8 to First Community Financial Partners, Inc.’s Registration Statement on Form S-8 (Registration No. 333-211811)). | |
10.24 | First Amendment of Employment Agreement, dated as of December 18, 2014, between First Community Financial Partners, Inc., First Community Financial Bank and Roy C. Thygesen (filed herewith). | |
10.25 | Second Amendment of Employment Agreement, dated as of January 1, 2016, between First Community Financial Partners, Inc., First Community Financial Bank and Roy C. Thygesen (filed herewith). | |
10.26 | Third Amendment of Employment Agreement, dated as of December 17, 2016, between First Community Financial Partners, Inc., First Community Financial Bank and Roy C. Thygesen (filed herewith). | |
10.27 | First Amendment of Employment Agreement, dated as of December 18, 2014, between First Community Financial Partners, Inc., First Community Financial Bank and Patrick J. Roe (filed herewith). | |
10.28 | First Amendment of Employment Agreement, dated as of December 18, 2014, between First Community Financial Partners, Inc., First Community Financial Bank and Donn P. Domico (filed herewith). | |
10.29 | Second Amendment of Employment Agreement, dated as of January 1, 2016, between First Community Financial Partners, Inc., First Community Financial Bank and Donn P. Domico (filed herewith). | |
10.30 | First Amendment of Employment Agreement, dated as of December 18, 2014, between First Community Financial Partners, Inc., First Community Financial Bank and Steven Randich (filed herewith). | |
21.1 | Subsidiaries of First Community Financial Partners, Inc. (filed herewith). | |
23.1 | Consent of Independent Registered Public Accounting Firm (filed herewith). | |
31.1 | Certification of Chief Executive Officer Pursuant to Rule 13a-14(a) or Rule 15d-14(a), as adopted pursuant to Section 302 of the Sarbanes-Oxley Act of 2002 (filed herewith). | |
31.2 | Certification of Chief Financial Officer Pursuant to Rule 12a-14(a) or Rule 15d-14(a), as adopted pursuant to Section 302 of the Sarbanes-Oxley Act of 2002 (filed herewith). | |
32.1 | Certification of Chief Executive Officer Pursuant to 18 U.S.C. Section 1350, as Adopted Pursuant to Section 906 of the Sarbanes-Oxley Act of 2002 (filed herewith). | |
32.2 | Certification of Chief Financial Officer Pursuant to 18 U.S.C. Section 1350, as Adopted Pursuant to Section 906 of the Sarbanes-Oxley Act of 2002 (filed herewith). | |
101 | Interactive data files pursuant to Rule 405 of Regulation S-T: (i) Consolidated Balance Sheets as of December 31, 2016 and December 31, 2015; (ii) Consolidated Statements of Operations for the years ended December 31, 2016, December 31, 2015, and December 31, 2014 and ; (iii) Consolidated Statements of Comprehensive Income for the years ended December 31, 2016, December 31, 2015 and December 31, 2014; (iv) Consolidated Statements of Changes in Shareholders’ Equity for the years ended December 31, 2016, December 31, 2015, and December 31, 2014; (v) Consolidated Statements of Cash Flows for the years ended December 31, 2016, December 31, 2015, and December 31, 2014; and (vi) Notes to Unaudited Consolidated Financial Statements. | |
97