Attached files
| file | filename |
|---|---|
| EX-31.A - EXHIBIT 31.A - ISABELLA BANK Corp | isba_20161231xex31a.htm |
| EX-32 - EXHIBIT 32 - ISABELLA BANK Corp | isba_20161231xex32.htm |
| EX-31.B - EXHIBIT 31.B - ISABELLA BANK Corp | isba_20161231xex31b.htm |
| EX-23 - EXHIBIT 23 - ISABELLA BANK Corp | isba_20161231xex23.htm |
| EX-21 - EXHIBIT 21 - ISABELLA BANK Corp | isba_20161231xex21.htm |
SECURITIES AND EXCHANGE COMMISSION
Washington, D.C. 20549
FORM 10-K
x | ANNUAL REPORT PURSUANT TO SECTION 13 OR 15(d) OF THE SECURITIES EXCHANGE ACT OF 1934. |
For the fiscal year ended December 31, 2016
OR
¨ | TRANSITION REPORT PURSUANT TO SECTION 13 OR 15(d) OF THE SECURITIES EXCHANGE ACT OF 1934. |
For the transition period from to
Commission File Number: 0-18415
Isabella Bank Corporation
(Exact name of registrant as specified in its charter)
Michigan | 38-2830092 | |
(State or other jurisdiction of incorporation or organization) | (I.R.S. Employer identification No.) | |
401 North Main Street, Mount Pleasant, Michigan 48858
(Address of principal executive offices) (Zip Code)
Registrant’s telephone number, including area code (989) 772-9471
Securities registered pursuant to Section 12(b) of the Act:
Title of each class | Name of each exchange on which registered | |
Securities registered pursuant to Section 12(g) of the Act:
Common Stock - No Par Value
(Title of Class)
Indicated by check mark if the registrant is a well-known seasoned issuer, as defined in Rule 405 of the Securities Act. ¨ Yes x No
Indicated by check mark if the registrant is not required to file reports pursuant to Section 13 or Section 15(d) of the Act. ¨ Yes x No
Indicate by check mark whether the registrant (1) has filed all reports required to be filed by Section 13 or 15(d) of the Securities Exchange Act of 1934 during the preceding 12 months (or for such shorter period that the registrant was required to file such reports), and (2) has been subject to such filing requirements for the past 90 days. x Yes ¨ No
Indicate by check mark whether the registrant has submitted electronically and posted on its corporate Web site, if any, every Interactive Data File required to be submitted and posted pursuant to Rule 405 of Regulation S-T (Section 232.405 of this chapter) during the preceding 12 months (or for such shorter period that the registrant was required to submit and post such files). x Yes ¨ No
Indicate by check mark if disclosure of delinquent filers pursuant to Item 405 of Regulation S-K is not contained herein, and will not be contained, to the best of registrant’s knowledge, in definitive proxy or information statements incorporated by reference in Part III of this Form 10-K or any amendment to this Form 10-K. ¨
Indicate by check mark whether the registrant is a large accelerated filer, an accelerated filer, a non-accelerated filer, or a smaller reporting company. See definition of “accelerated filer”, “large accelerated filer” and “smaller reporting company” in Rule 12b-2 of the Exchange Act (Check One).
Large accelerated filer | ¨ | Accelerated filer | x | |||
Non-accelerated filer | ¨ (Do not check if a smaller reporting company) | Smaller reporting company | ¨ | |||
Indicate by check mark whether the registrant is a shell company (as defined in Rule 12b-2 of the Exchange Act). ¨ Yes x No
The aggregate market value of the voting stock held by non-affiliates of the registrant was $218,637,000 as of the last business day of the registrant’s most recently completed second fiscal quarter.
The number of common shares outstanding of the registrant’s Common Stock (no par value) was 7,831,404 as of March 3, 2017.
DOCUMENTS INCORPORATED BY REFERENCE
(Such documents are incorporated herein only to the extent specifically set forth in response to an item herein.)
Documents | Part of Form 10-K Incorporated into | |
Portions of the Isabella Bank Corporation Proxy Statement for its Annual Meeting of Shareholders to be held May 2, 2017 | Part III | |
1
ISABELLA BANK CORPORATION
ANNUAL REPORT ON FORM 10-K
Table of Contents
PART I | ||||
Item 1. | ||||
Item 1A. | ||||
Item 1B. | ||||
Item 2. | ||||
Item 3. | ||||
Item 4. | ||||
PART II | ||||
Item 5. | ||||
Item 6. | ||||
Item 7. | ||||
Item 7A. | ||||
Item 8. | ||||
Item 9. | ||||
Item 9A. | ||||
Item 9B. | ||||
PART III | ||||
Item 10. | ||||
Item 11. | ||||
Item 12. | ||||
Item 13. | ||||
Item 14. | ||||
PART IV | ||||
Item 15. | ||||
Item 16. | ||||
SIGNATURES | ||||
2
Forward Looking Statements
This report contains certain forward looking statements within the meaning of Section 27A of the Securities Act of 1933, as amended, and Section 21E of the Securities Exchange Act of 1934, as amended. We intend such forward looking statements to be covered by the safe harbor provisions for forward looking statements contained in the Private Securities Litigation Reform Act of 1995, and are included in this statement for purposes of these safe harbor provisions. Forward looking statements, which are based on certain assumptions and describe future plans, strategies and expectations, are generally identifiable by use of the words “believe,” “expect,” “intend,” “anticipate,” “estimate,” “project,” or similar expressions. Our ability to predict results or the actual effect of future plans or strategies is inherently uncertain. Factors which could have a material adverse effect on the operations and future prospects include, but are not limited to, changes in: interest rates, general economic conditions, monetary and fiscal policy, the quality or composition of the loan or investment portfolios, demand for loan products, fluctuation in the value of collateral securing our loan portfolio, deposit flows, competition, demand for financial services in our market area, and accounting principles, policies and guidelines. These risks and uncertainties should be considered in evaluating forward looking statements and undue reliance should not be placed on such statements. Further information concerning our business, including additional factors that could materially affect our consolidated financial results, is included in our filings with the SEC.
Glossary of Acronyms and Abbreviations
The acronyms and abbreviations identified below may be used throughout this Annual Report on Form 10-K or in our other SEC filings. You may find it helpful to refer back to this page while reading this report.
AFS: Available-for-sale | GAAP: U.S. generally accepted accounting principles | |
ALLL: Allowance for loan and lease losses | GLB Act: Gramm-Leach-Bliley Act of 1999 | |
AOCI: Accumulated other comprehensive income | IFRS: International Financial Reporting Standards | |
ASC: FASB Accounting Standards Codification | IRR: Interest rate risk | |
ASU: FASB Accounting Standards Update | ISDA: International Swaps and Derivatives Association | |
ATM: Automated Teller Machine | JOBS Act: Jumpstart our Business Startups Act | |
BHC Act: Bank Holding Company Act of 1956 | LIBOR: London Interbank Offered Rate | |
CFPB: Consumer Financial Protection Bureau | N/A: Not applicable | |
CIK: Central Index Key | N/M: Not meaningful | |
CRA: Community Reinvestment Act | NASDAQ: NASDAQ Stock Market Index | |
DIF: Deposit Insurance Fund | NASDAQ Banks: NASDAQ Bank Stock Index | |
DIFS: Department of Insurance and Financial Services | NAV: Net asset value | |
Directors Plan: Isabella Bank Corporation and Related Companies Deferred Compensation Plan for Directors | NOW: Negotiable order of withdrawal | |
Dividend Reinvestment Plan: Isabella Bank Corporation Stockholder Dividend Reinvestment Plan and Employee Stock Purchase Plan | NSF: Non-sufficient funds | |
Dodd-Frank Act: Dodd-Frank Wall Street Reform and Consumer Protection Act of 2010 | OCI: Other comprehensive income (loss) | |
ESOP: Employee Stock Ownership Plan | OMSR: Originated mortgage servicing rights | |
Exchange Act: Securities Exchange Act of 1934 | OREO: Other real estate owned | |
FASB: Financial Accounting Standards Board | OTTI: Other-than-temporary impairment | |
FDI Act: Federal Deposit Insurance Act | PBO: Projected benefit obligation | |
FDIC: Federal Deposit Insurance Corporation | PCAOB: Public Company Accounting Oversight Board | |
FFIEC: Federal Financial Institutions Examinations Council | Rabbi Trust: A trust established to fund the Directors Plan | |
FRB: Federal Reserve Bank | SEC: U.S. Securities & Exchange Commission | |
FHLB: Federal Home Loan Bank | SOX: Sarbanes-Oxley Act of 2002 | |
Freddie Mac: Federal Home Loan Mortgage Corporation | TDR: Troubled debt restructuring | |
FTE: Fully taxable equivalent | XBRL: eXtensible Business Reporting Language | |
3
PART I
Item 1. Business. (Dollars in thousands)
General
Isabella Bank Corporation is a registered financial services holding company that was incorporated in September 1988 under Michigan law. The Corporation's sole subsidiary, Isabella Bank, has 29 banking offices located throughout Clare, Gratiot, Isabella, Mecosta, Midland, Montcalm, and Saginaw counties and a loan production office located in Saginaw county. The area includes significant agricultural production, manufacturing, retail, gaming and tourism, and several colleges and universities.
As used in Item 7. Management's Discussion and Analysis of Financial Condition and Results of Operations as well as in Item 8. Financial Statements and Supplementary Data, references to "the Corporation," “Isabella,” “we,” “our,” “us,” and similar terms refer to the consolidated entity consisting of Isabella Bank Corporation and its subsidiary. Isabella Bank Corporation refers solely to the parent holding company, and Isabella Bank or the “Bank” refer to Isabella Bank Corporation’s subsidiary, Isabella Bank.
Our reportable segments are based on legal entities that account for at least 10% of net operating results. Retail banking operations for 2016, 2015, and 2014 represent approximately 90% or greater of total assets and operating results. As such, we have only one reportable segment.
We are a community bank with a focus on providing high quality, personalized service at a fair price. We offer a broad array of banking services to businesses, institutions, and individuals. We compete with other commercial banks, savings and loan associations, mortgage brokers, finance companies, credit unions, and retail brokerage firms.
Lending activities include loans for commercial and agricultural operating and real estate purposes, residential real estate loans, and consumer loans. We limit lending activities primarily to local markets and have not purchased any loans from the secondary market. We do not make loans to fund leveraged buyouts, have no foreign corporate or government loans, and have limited holdings of corporate debt securities. Our general lending philosophy is to limit concentrations to individuals and business segments. For additional information related to our lending strategies and policies, see “Note 5 – Loans and ALLL” of the “Notes to Consolidated Financial Statements” in Item 8. Financial Statements and Supplementary Data.
Deposit services offered include checking accounts, savings accounts, certificates of deposit, direct deposits, cash management services, mobile and internet banking, electronic bill pay services, and automated teller machines. We also offer full service trust and brokerage services.
As of December 31, 2016, we had 372 full-time equivalent employees. We provide group life, health, accident, disability, and other insurance programs as well as a number of other employee benefit programs. None of our workforce is subject to collective bargaining agreements.
Available Information
Our SEC filings (including our Annual Report on Form 10-K, Quarterly Reports on Form 10-Q, Definitive Proxy Statements, Current Reports on Form 8-K and amendments to those reports) are available through our website (www.isabellabank.com). We will provide paper copies of our SEC reports free of charge upon request of a shareholder.
The SEC maintains a website (www.sec.gov) that contains reports, proxy and information statements and other information regarding Isabella Bank Corporation (CIK #0000842517) and other issuers.
Supervision and Regulation
The earnings and growth of the banking industry and, therefore, our earnings are affected by the credit policies of monetary authorities, including the FRB. An important function of the FRB is to regulate the national supply of bank credit in order to combat recessions and respond to inflationary pressures. Among the instruments of monetary policy used by the FRB to implement these objectives are open market operations in U.S. Treasury and U.S. Government Agency securities, changes in the discount rate on member bank borrowings, and changes in reserve requirements against member bank deposits. These methods are used in varying combinations to influence overall growth of bank loans, investments and deposits and also affect interest rates charged on loans or paid for deposits. The monetary policies of the FRB have had a significant effect on the operating results of commercial banks and related financial service providers in the past and are expected to continue to do so in the future. The effect of such policies upon our future business and earnings cannot be predicted.
We, as a financial holding company, are regulated under the BHC Act, and are subject to the supervision of the FRB. We are registered as a financial services holding company with the FRB and are subject to annual reporting requirements and
4
inspections and audits. Under FRB policy, we are expected to act as a source of financial strength to the Bank and to commit resources to support its subsidiaries. This support may be required at times when, in the absence of such FRB policy, it would not otherwise be required to provide support.
Under Michigan law, if the capital of a Michigan state chartered bank has become impaired by losses or otherwise, the Commissioner of the DIFS may require that the deficiency in capital be met by assessment upon the bank’s shareholders pro rata on the amount of capital stock held by each, and if any such assessment is not paid by any shareholder within 30 days of the date of mailing of notice thereof to such shareholder, cause the sale of the stock of such shareholder to pay such assessment and the costs of sale of such stock.
Any capital loans by a bank holding company to any of its subsidiary banks are subordinate in right of payment to deposits and to certain other indebtedness of such subsidiary bank. In the event of a bank holding company’s bankruptcy, any commitment by the bank holding company to a federal bank regulatory agency to maintain the capital of a subsidiary bank will be assumed by the bankruptcy trustee and entitled to a priority of payment. This priority would apply to guarantees of capital plans under the FDIC Improvement Act of 1991.
SOX contains important requirements for public companies in the area of financial disclosure and corporate governance. In accordance with Section 302(a) of SOX, written certifications by our principal executive, financial, and accounting officers are required. These certifications attest that our quarterly and annual reports filed with the SEC do not contain any untrue statement of a material fact (see the certifications filed as Exhibits 31 (a) and (b) to this Form 10-K for such certification of consolidated financial statements and other information for this 2016 Form 10-K). We have also implemented a program designed to comply with Section 404 of SOX, which included the identification of significant processes and accounts, documentation of the design of control effectiveness over process and entity level controls, and testing of the operating effectiveness of key controls. See Item 9A. Controls and Procedures for our evaluation of disclosure controls and procedures and internal control over financial reporting.
Certain additional information concerning regulatory guidelines for capital adequacy and other regulatory matters is presented herein under the caption “Capital” in Item 7. Management's Discussion and Analysis of Financial Condition and Results of Operations and in “Note 15 – Commitments and Other Matters” and “Note 16 – Minimum Regulatory Capital Requirements” of the Notes to Consolidated Financial Statements in Item 8. Financial Statements and Supplementary Data.
Isabella Bank
The Bank is supervised and regulated by DIFS and the FRB. The agencies and federal and state laws extensively regulate various aspects of the banking business including, among other things, permissible types and amounts of loans, investments and other activities, capital adequacy, branching, interest rates on loans and deposits, and the safety and soundness of banking practices.
Our deposits are insured up to applicable limits by the DIF of the FDIC and are subject to deposit insurance assessments to maintain the DIF. The FDIC assesses insurance premiums based upon a financial ratios method that takes into account assets and capital levels and supervisory ratings.
Banking laws and regulations restrict transactions by insured banks owned by a bank holding company, including loans to and certain purchases from the parent holding company, non-bank and bank subsidiaries of the parent holding company, principal shareholders, officers, directors and their affiliates, and investments by the subsidiary bank in the shares or securities of the parent holding company (or any of the other non-bank or bank affiliates), or acceptance of such shares or securities as collateral security for loans to any borrower.
The Bank is subject to legal limitations on the frequency and amount of dividends that can be paid to Isabella Bank Corporation. For example, a Michigan state chartered bank may not declare a cash dividend or a dividend in kind except out of net profits then on hand after deducting all losses and bad debts, and then only if it will have a surplus amounting to not less than 20% of its capital after the payment of the dividend. Moreover, a Michigan state chartered bank may not declare or pay any cash dividend or dividend in kind until the cumulative dividends on its preferred stock, if any, have been paid in full. Further, if the surplus of a Michigan state chartered bank is at any time less than the amount of its capital, before the declaration of a cash dividend or dividend in kind, it must transfer to surplus not less than 10% of its net profits for the preceding six months (in the case of quarterly or semi-annual dividends) or the preceding two consecutive six month periods (in the case of annual dividends).
The payment of dividends by Isabella Bank Corporation and the Bank is also affected by various regulatory requirements and policies, such as the requirement to keep adequate capital in compliance with regulatory guidelines. Federal laws impose further restrictions on the payment of dividends by insured banks that fail to meet specified capital levels. The FDIC may
5
prevent an insured bank from paying dividends if the bank is in default of payment of any assessment due to the FDIC. In addition, payment of dividends by a bank may be prevented by the applicable federal regulatory authority if such payment is determined, by reason of the financial condition of such bank, to be an unsafe and unsound banking practice. The FRB and the FDIC have issued policy statements providing that bank holding companies and insured banks should generally pay dividends only out of current operating earnings. Additionally, the FRB Board of Governors requires a bank holding company to notify the FRB prior to increasing its cash dividend by more than 10% over the prior year.
The aforementioned regulations and restrictions may limit our ability to obtain funds from the Bank for our cash needs, including payment of dividends and operating expenses.
The activities and operations of the Bank are also subject to various federal and state laws and regulations.
Item 1A. Risk Factors.
In the normal course of business we are exposed to various risks. These risks, if not managed correctly, could have a significant impact on our earnings, capital, share price, and ability to pay dividends. In order to effectively monitor and control the following risks, we utilize an enterprise risk model. We balance our strategic goals, including revenue and profitability objectives, with associated risks through the use of policies, systems, and procedures which have been adopted to identify, assess, control, monitor, and manage each risk area. We continually review the adequacy and effectiveness of these policies, systems, and procedures.
Our enterprise risk process covers each of the following areas.
Changes in credit quality and required allowance for loan and lease losses
To manage the credit risk arising from lending activities, our most significant source of credit risk, we maintain sound underwriting policies and procedures. We continuously monitor asset quality in order to manage our credit risk to determine the appropriateness of valuation allowances. These valuation allowances take into consideration various factors including, but not limited to, local, regional, and national economic conditions.
We maintain an ALLL to reserve for estimated incurred loan losses and risks within our loan portfolio. The level of the ALLL reflects our evaluation of industry concentrations; specific credit risks; loan loss experience; loan portfolio quality; and economic, political and regulatory conditions. The determination of the appropriate level of the ALLL inherently involves a high degree of subjectivity and requires us to make significant estimates, all of which may undergo material changes.
Changes in economic conditions
An economic downturn within our local markets, as well as downturns in the state, national, or global markets, could negatively impact household and corporate incomes. This could lead to decreased demand for both loan and deposit products and lead to an increase of customers who fail to pay interest or principal on their loans. We continually monitor key economic indicators in an effort to anticipate the possible effects of downturns in the local, regional, and national economies.
Our success depends primarily on the general economic conditions of the State of Michigan and the specific local markets in which we operate. Unlike larger national or other regional banks that are more geographically diversified, we provide banking and financial services to customers located primarily in the Clare, Gratiot, Isabella, Mecosta, Midland, Montcalm, and Saginaw counties in Michigan. The local economic conditions in these areas have a significant impact on the demand for our products and services, as well as the ability of our customers to repay loans, the value of the collateral securing loans, and the stability of our deposit funding sources. A significant decline in general economic conditions, caused by inflation, recession, acts of terrorism, outbreak of hostilities or other international or domestic occurrences, unemployment, changes in securities markets or other factors could impact these local economic conditions and, in turn, have a material adverse effect on our financial condition and results of operations.
Interest rate risk
IRR results from the timing differences in the maturity or repricing frequency of a financial institution’s interest earning assets and its interest bearing liabilities. We monitor the potential effects of changes in interest rates through simulations and gap analyses. To help mitigate the effects of changes in interest rates, we make significant efforts to stagger projected cash flows and maturities of interest sensitive assets and liabilities.
6
Liquidity risk
Liquidity risk is the risk to earnings or capital arising from our inability to meet our obligations when they come due without incurring unacceptable costs. Liquidity risk includes the inability to manage unplanned decreases or changes in funding sources, or failure to recognize or address changes in market conditions that affect the ability to liquidate assets quickly and with minimal loss in value. We have significant borrowing capacity through correspondent banks and the ability to sell certain investments to fund potential cash shortages, which we may use to help mitigate this risk.
The value of investment securities may be negatively impacted by fluctuations in the market
A volatile, illiquid market or decline in credit quality could require us to recognize an OTTI loss related to the investment securities held in our portfolio. We consider many factors in determining whether an OTTI exists including the length of time and extent to which fair value has been less than cost, the investment credit rating, and the probability that the issuer will be unable to pay the amount when due. The presence of these factors could lead to impairment charges. These risks are mitigated by the fact that we do not intend to sell the security in an unrealized loss position and it is more likely than not that we will not have to sell the security before recovery of its cost basis.
Operational risk
Operational risk is the risk of loss resulting from inadequate or failed internal processes, people, and systems, or external events and includes reputation risk and transaction risk. Reputation risk is developing and retaining marketplace confidence in handling customers’ financial transactions in an appropriate manner and protecting our safety and soundness. Transaction risk includes losses from fraud, error, the inability to deliver products or services, and loss or theft of information. Transaction risk also encompasses product development and delivery, transaction processing, information technology systems, and the internal control environment.
To minimize potential losses due to operational risks, we have established a robust system of internal controls that is regularly tested by our internal audit department in conjunction with the services of certified public accounting firms who assist in performing such internal audit work. The focus of these internal audit procedures is to verify the validity and appropriateness of various transactions, processes, and controls. The results of these procedures are reported to our Audit Committee.
The adoption of, violations of, or nonconformance with laws, rules, regulations, or prescribed practices
The financial services industry and public companies are extensively regulated and must meet regulatory standards set by the FDIC, DIFS, FRB, FASB, SEC, PCAOB, the CFPB, and other regulatory bodies. Federal and state laws and regulations are designed primarily to protect the deposit insurance funds and consumers, and not necessarily to benefit our shareholders. The nature, extent, and timing of the adoption of significant new laws, changes in existing laws, or repeal of existing laws may have a material impact on our business, results of operations, and financial condition, the effect of which is impossible to predict at this time.
Our compliance department annually assesses the adequacy and effectiveness of our processes for controlling and managing our principal compliance risks.
We may not adjust to changes in the financial services industry
Our financial performance depends in part on our ability to maintain and grow our core deposit customer base and expand our financial services to our existing and new customers. The increasingly competitive environment is, in part, a result of changes in technology and product delivery systems and the accelerating pace of consolidation among financial service providers. New competitors may emerge to increase the degree of competition for our products and services. Financial services and products are also constantly changing. Our financial performance is also dependent upon customer demand for our products and services and our ability to develop and offer competitive financial products and services.
We may be required to recognize an impairment of goodwill
Goodwill represents the excess of the amounts paid to acquire subsidiaries over the fair value of their net assets at the date of acquisition. The majority of the recorded goodwill is related to acquisitions of other banks, which were subsequently merged into Isabella Bank. If it is determined that the goodwill has been impaired, we must write-down the goodwill by the amount of the impairment.
7
We may face pressure from purchasers of our residential mortgage loans to repurchase loans sold or reimburse purchasers for losses related to such loans
We generally sell the fixed rate long term residential mortgage loans we originate to the secondary market. In response to the recent economic downturn, the purchasers of residential mortgage loans, such as government sponsored entities, increased their efforts to require sellers of residential mortgage loans to either repurchase loans previously sold, or reimburse the purchasers for losses incurred on foreclosed loans due to actual or alleged failure to strictly conform to the terms of the contract.
Consumers may decide not to use banks to complete their financial transactions
Technology and other changes are allowing customers to complete financial transactions without the involvement of banks. For example, consumers can now pay bills and transfer funds directly without banks. The process of eliminating banks as intermediaries in financial transactions could result in the loss of fee income, as well as the loss of customer deposits and income generated from those deposits.
Changes to the financial services industry as a result of regulatory changes or actions, or significant litigation
The financial services industry is extensively regulated by state and federal regulation that governs almost all aspects of our operations. Laws and regulations may change from time to time and are primarily intended for the protection of consumers, depositors, and the deposit insurance fund. The impact of any changes to laws and regulations or other actions by regulatory agencies may negatively impact us or our ability to increase the value of our business. Regulatory authorities have extensive discretion in connection with their supervisory and enforcement activities, including the imposition of restrictions on the operation of an institution, the classification of assets by the institution, and the appropriateness of an institution’s ALLL. Future regulatory changes or accounting pronouncements may increase our regulatory capital requirements or adversely affect our regulatory capital levels. Additionally, actions by regulatory agencies or significant litigation against us could require the dedication of significant time and resources to defending our business and may lead to penalties.
Unauthorized disclosure of sensitive or confidential client or customer information, whether through cyber attacks, breach of computer systems or other means
As part of our business, we collect and retain sensitive and confidential client and customer information on our behalf and on behalf of other third parties. Despite the security measures we have in place for our facilities and systems, and the security measures of our third party service providers, we may be vulnerable to cyber attacks, security breaches, acts of vandalism, computer viruses, misplaced or lost data, human errors or other similar events. Risks related to cybersecurity continue to evolve within the industry. We continually review and monitor information and data related to cybersecurity to detect and mitigate attacks. A cyber attack could disrupt our operations and have a material adverse effect on our business. Any security breach involving the misappropriation, loss or other unauthorized disclosure of confidential customer information, whether by us or by our vendors, could severely damage our reputation, expose us to the risks of litigation and liability, disrupt our operations and have a material adverse effect on our business.
Our estimates and assumptions may be incorrect
Our consolidated financial statements conform with GAAP, which require us to make estimates and assumptions that affect the amounts reported in the consolidated financial statements. These estimates are based on information available to us at the time the estimates are made. Actual results could differ from those estimates. For further discussion regarding significant accounting estimates, see “Note 1 – Nature of Operations and Summary of Significant Accounting Policies” of the Notes to Consolidated Financial Statements in Item 8. Financial Statements and Supplementary Data.
Disruption of infrastructure
Our operations depend upon our technological and physical infrastructure, including our equipment and facilities. Extended disruption of our vital infrastructure by fire, power loss, natural disaster, telecommunications failure, computer hacking and viruses, or other events outside of our control, could have a significant impact on our operations. We have developed and tested disaster recovery plans, which provide detailed instructions covering all significant aspects of our operations.
Anti-takeover provisions
Our articles of incorporation include anti-takeover provisions that require a two-thirds majority vote to approve a sale of the Corporation. Additionally, changes to our articles of incorporation must be approved by a two-thirds majority vote of our shareholders. These provisions may make our stock less attractive to potential shareholders.
8
Item 1B. Unresolved Staff Comments.
None.
Item 2. Properties.
Our executive offices are located at 401 North Main Street in Mount Pleasant, Michigan. In addition to this location, we own 29 branches, an operations center, a mortgage operations center, and our previous main office building. We also lease property in Saginaw, Michigan which serves as a loan production office. Our facilities' current, planned, and best use is for conducting our current activities, with the exception of approximately 75% of our previous main office location. We continually monitor and assess the need for expansion and/or improvement for all facilities. In our opinion, each facility has sufficient capacity and is in good condition.
Item 3. Legal Proceedings.
We are not involved in any material legal proceedings. We are involved in ordinary, routine litigation incidental to our business; however, no such routine proceedings are expected to result in any material adverse effect on our consolidated operations, earnings, financial condition, or cash flows.
Item 4. Mine Safety Disclosures.
Not applicable.
9
PART II
Item 5. Market for Registrant’s Common Equity, Related Stockholder Matters and Issuer Purchases of Equity Securities.
Common Stock and Dividend Information
Our authorized common stock consists of 15,000,000 shares, of which 7,821,069 shares are issued and outstanding as of December 31, 2016. As of that date, there were 3,082 shareholders of record.
Our common stock is traded in the over-the-counter market. Our common stock is quoted on the OTCQX market tier of the OTC Markets Group Inc.’s ("OTC Markets") electronic quotation system (www.otcmarkets.com) under the symbol “ISBA”. Other trades in our common stock occur in privately negotiated transactions from time-to-time of which we may have little or no information.
We have reviewed the information available as to the range of reported high and low bid quotations, including high and low bid information as reported by OTC Markets. The following table sets forth our compilation of that information for the periods indicated. Price information obtained from OTC Markets reflects inter-dealer prices, without retail mark-up, mark-down, or commissions and may not necessarily represent actual transactions. The following compiled data is provided for information purposes only and should not be viewed as indicative of the actual or market value of our common stock.
Number of Common Shares | Sale Price | |||||||||
Low | High | |||||||||
2016 | ||||||||||
First Quarter | 81,184 | $ | 27.25 | $ | 29.90 | |||||
Second Quarter | 47,680 | 27.63 | 28.25 | |||||||
Third Quarter | 71,614 | 27.60 | 28.08 | |||||||
Fourth Quarter | 53,496 | 27.60 | 28.35 | |||||||
253,974 | ||||||||||
2015 | ||||||||||
First Quarter | 81,754 | $ | 22.00 | $ | 23.50 | |||||
Second Quarter | 94,019 | 22.70 | 23.80 | |||||||
Third Quarter | 143,183 | 22.75 | 23.85 | |||||||
Fourth Quarter | 109,276 | 23.50 | 29.90 | |||||||
428,232 | ||||||||||
The following table sets forth the cash dividends paid for the following quarters:
Per Share | |||||||
2016 | 2015 | ||||||
First Quarter | $ | 0.24 | $ | 0.23 | |||
Second Quarter | 0.24 | 0.23 | |||||
Third Quarter | 0.25 | 0.24 | |||||
Fourth Quarter | 0.25 | 0.24 | |||||
Total | $ | 0.98 | $ | 0.94 | |||
We have adopted and publicly announced a common stock repurchase plan. The plan was last amended on December 21, 2016, to allow for the repurchase of an additional 200,000 shares of common stock after that date. These authorizations do not have expiration dates. As shares are repurchased under this plan, they are retired and revert back to the status of authorized, but unissued shares.
10
The following table provides information for the unaudited three month period ended December 31, 2016, with respect to our common stock repurchase plan:
Common Shares Repurchased | Total Number of Common Shares Purchased as Part of Publicly Announced Plan or Program | Maximum Number of Common Shares That May Yet Be Purchased Under the Plans or Programs | ||||||||||
Number | Average Price Per Common Share | |||||||||||
Balance, September 30 | 60,575 | |||||||||||
October 1 - 31 | 19,538 | $ | 27.79 | 19,538 | 41,037 | |||||||
November 1 - 30 | 19,821 | 27.80 | 19,821 | 21,216 | ||||||||
December 1-21 | 11,659 | 28.13 | 11,659 | 9,557 | ||||||||
Additional Authorization (200,000 shares) | 209,557 | |||||||||||
December 22 - 31 | 9,600 | 28.02 | 9,600 | 199,957 | ||||||||
Balance, December 31 | 60,618 | $ | 27.90 | 60,618 | 199,957 | |||||||
Information concerning securities authorized for issuance under equity compensation plans appears under Item 12. Security Ownership of Certain Beneficial Owners and Management and Related Stockholder Matters.
Stock Performance
The following graph compares the cumulative total shareholder return on our common stock for the last five years with the cumulative total return on (1) NASDAQ, which is comprised of all United States common shares traded on the NASDAQ and (2) the NASDAQ Banks, which is comprised of bank and bank holding company common shares traded on the NASDAQ over the same period. The graph assumes the value of an investment in the Corporation's common stock and each index was $100 at December 31, 2011 and all dividends are reinvested.
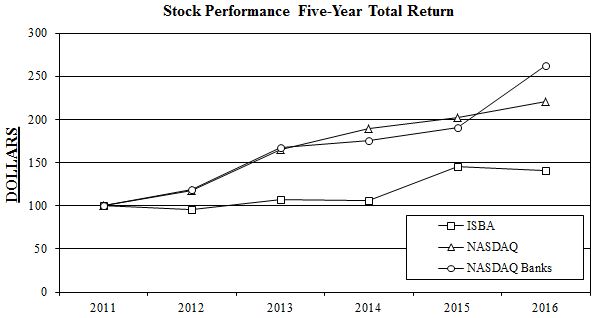
Year | ISBA | NASDAQ | NASDAQ Banks | |||||||||
12/31/2011 | $ | 100.00 | $ | 100.00 | $ | 100.00 | ||||||
12/31/2012 | 95.00 | 117.70 | 118.55 | |||||||||
12/31/2013 | 107.70 | 164.65 | 167.52 | |||||||||
12/31/2014 | 105.60 | 188.87 | 175.58 | |||||||||
12/31/2015 | 145.80 | 202.25 | 190.97 | |||||||||
12/31/2016 | 140.60 | 220.13 | 262.04 | |||||||||
11
Item 6. Selected Financial Data.
Results of Operations (Dollars in thousands except per share amounts)
The following table outlines the results of operations and provides certain key performance measures as of, and for the years ended, December 31:
2016 | 2015 | 2014 | 2013 | 2012 | |||||||||||||||
INCOME STATEMENT DATA | |||||||||||||||||||
Interest income | $ | 53,666 | $ | 51,502 | $ | 51,148 | $ | 50,418 | $ | 53,123 | |||||||||
Interest expense | 10,865 | 10,163 | 9,970 | 11,021 | 13,423 | ||||||||||||||
Net interest income | 42,801 | 41,339 | 41,178 | 39,397 | 39,700 | ||||||||||||||
Provision for loan losses | (135 | ) | (2,771 | ) | (668 | ) | 1,111 | 2,300 | |||||||||||
Noninterest income | 11,108 | 10,359 | 9,325 | 10,175 | 11,530 | ||||||||||||||
Noninterest expenses | 37,897 | 36,051 | 35,103 | 33,755 | 34,361 | ||||||||||||||
Federal income tax expense | 2,348 | 3,288 | 2,344 | 2,196 | 2,363 | ||||||||||||||
Net Income | $ | 13,799 | $ | 15,130 | $ | 13,724 | $ | 12,510 | $ | 12,206 | |||||||||
PER SHARE | |||||||||||||||||||
Basic earnings | $ | 1.77 | $ | 1.95 | $ | 1.77 | $ | 1.63 | $ | 1.61 | |||||||||
Diluted earnings | $ | 1.73 | $ | 1.90 | $ | 1.74 | $ | 1.59 | $ | 1.56 | |||||||||
Dividends | $ | 0.98 | $ | 0.94 | $ | 0.89 | $ | 0.84 | $ | 0.80 | |||||||||
Tangible book value* | $ | 18.16 | $ | 17.30 | $ | 16.59 | $ | 15.62 | $ | 14.72 | |||||||||
Quoted market value | |||||||||||||||||||
High | $ | 29.90 | $ | 29.90 | $ | 24.00 | $ | 26.00 | $ | 24.98 | |||||||||
Low | $ | 27.25 | $ | 22.00 | $ | 21.73 | $ | 21.12 | $ | 21.75 | |||||||||
Close* | $ | 27.85 | $ | 29.90 | $ | 22.50 | $ | 23.85 | $ | 21.75 | |||||||||
Common shares outstanding* | 7,821,069 | 7,799,867 | 7,776,274 | 7,723,023 | 7,671,846 | ||||||||||||||
PERFORMANCE RATIOS | |||||||||||||||||||
Return on average total assets | 0.82 | % | 0.95 | % | 0.90 | % | 0.86 | % | 0.88 | % | |||||||||
Return on average shareholders' equity | 7.12 | % | 8.33 | % | 8.06 | % | 7.67 | % | 7.60 | % | |||||||||
Return on average tangible shareholders' equity | 9.95 | % | 11.46 | % | 10.80 | % | 10.71 | % | 11.41 | % | |||||||||
Net interest margin yield (FTE) | 3.00 | % | 3.10 | % | 3.24 | % | 3.22 | % | 3.43 | % | |||||||||
BALANCE SHEET DATA* | |||||||||||||||||||
Gross loans | $ | 1,010,615 | $ | 850,492 | $ | 836,550 | $ | 810,777 | $ | 774,627 | |||||||||
AFS securities | $ | 558,096 | $ | 660,136 | $ | 567,534 | $ | 512,062 | $ | 504,010 | |||||||||
Total assets | $ | 1,732,151 | $ | 1,668,112 | $ | 1,549,543 | $ | 1,493,137 | $ | 1,430,639 | |||||||||
Deposits | $ | 1,195,040 | $ | 1,164,563 | $ | 1,074,484 | $ | 1,043,766 | $ | 1,017,667 | |||||||||
Borrowed funds | $ | 337,694 | $ | 309,732 | $ | 289,709 | $ | 279,326 | $ | 241,001 | |||||||||
Shareholders' equity | $ | 187,899 | $ | 183,971 | $ | 174,594 | $ | 160,609 | $ | 164,489 | |||||||||
Gross loans to deposits | 84.57 | % | 73.03 | % | 77.86 | % | 77.68 | % | 76.12 | % | |||||||||
ASSETS UNDER MANAGEMENT* | |||||||||||||||||||
Loans sold with servicing retained | $ | 272,882 | $ | 287,029 | $ | 288,639 | $ | 293,665 | $ | 303,425 | |||||||||
Assets managed by our Investment and Trust Services Department | $ | 427,693 | $ | 405,109 | $ | 383,878 | $ | 351,420 | $ | 319,301 | |||||||||
Total assets under management | $ | 2,432,726 | $ | 2,360,250 | $ | 2,222,060 | $ | 2,138,222 | $ | 2,053,365 | |||||||||
ASSET QUALITY* | |||||||||||||||||||
Nonperforming loans to gross loans | 0.17 | % | 0.09 | % | 0.50 | % | 0.42 | % | 1.00 | % | |||||||||
Nonperforming assets to total assets | 0.11 | % | 0.07 | % | 0.33 | % | 0.32 | % | 0.68 | % | |||||||||
ALLL to gross loans | 0.73 | % | 0.87 | % | 1.21 | % | 1.42 | % | 1.54 | % | |||||||||
CAPITAL RATIOS* | |||||||||||||||||||
Shareholders' equity to assets | 10.85 | % | 11.03 | % | 11.27 | % | 10.76 | % | 11.50 | % | |||||||||
Tier 1 leverage | 8.56 | % | 8.52 | % | 8.59 | % | 8.46 | % | 8.29 | % | |||||||||
Common equity tier 1 capital | 12.39 | % | 13.44 | % | N/A | N/A | N/A | ||||||||||||
Tier 1 risk-based capital | 12.39 | % | 13.44 | % | 14.08 | % | 13.68 | % | 13.24 | % | |||||||||
Total risk-based capital | 13.04 | % | 14.17 | % | 15.19 | % | 14.93 | % | 14.49 | % | |||||||||
* At end of year
12
The following table outlines our interim results of operations and key performance measures as of, and for the unaudited periods ended:
* At end of period
Quarter to Date | |||||||||||||||||||||||||||||||
December 31 2016 | September 30 2016 | June 30 2016 | March 31 2016 | December 31 2015 | September 30 2015 | June 30 2015 | March 31 2015 | ||||||||||||||||||||||||
Total interest income | $ | 13,760 | $ | 13,607 | $ | 13,218 | $ | 13,081 | $ | 13,023 | $ | 12,967 | $ | 12,759 | $ | 12,753 | |||||||||||||||
Total interest expense | 2,826 | 2,747 | 2,678 | 2,614 | 2,577 | 2,580 | 2,518 | 2,488 | |||||||||||||||||||||||
Net interest income | 10,934 | 10,860 | 10,540 | 10,467 | 10,446 | 10,387 | 10,241 | 10,265 | |||||||||||||||||||||||
Provision for loan losses | (320 | ) | 17 | 12 | 156 | (772 | ) | (738 | ) | (535 | ) | (726 | ) | ||||||||||||||||||
Noninterest income | 3,187 | 2,946 | 2,752 | 2,223 | 2,501 | 3,101 | 2,629 | 2,128 | |||||||||||||||||||||||
Noninterest expenses | 10,166 | 9,433 | 9,218 | 9,080 | 9,885 | 9,161 | 8,330 | 8,675 | |||||||||||||||||||||||
Federal income tax expense | 493 | 763 | 655 | 437 | 538 | 1,002 | 977 | 771 | |||||||||||||||||||||||
Net income | $ | 3,782 | $ | 3,593 | $ | 3,407 | $ | 3,017 | $ | 3,296 | $ | 4,063 | $ | 4,098 | $ | 3,673 | |||||||||||||||
PER SHARE | |||||||||||||||||||||||||||||||
Basic earnings | $ | 0.48 | $ | 0.46 | $ | 0.44 | $ | 0.39 | $ | 0.43 | $ | 0.52 | $ | 0.53 | $ | 0.47 | |||||||||||||||
Diluted earnings | 0.47 | 0.45 | 0.43 | 0.38 | 0.41 | 0.51 | 0.52 | 0.46 | |||||||||||||||||||||||
Dividends | 0.25 | 0.25 | 0.24 | 0.24 | 0.24 | 0.24 | 0.23 | 0.23 | |||||||||||||||||||||||
Quoted market value* | 27.85 | 27.70 | 27.90 | 28.25 | 29.90 | 23.69 | 23.75 | 22.90 | |||||||||||||||||||||||
Tangible book value* | 18.16 | 17.93 | 17.72 | 17.47 | 17.30 | 17.06 | 17.17 | 16.84 | |||||||||||||||||||||||
13
Item 7. Management's Discussion and Analysis of Financial Condition and Results of Operations.
ISABELLA BANK CORPORATION FINANCIAL REVIEW
(Dollars in thousands except per share amounts)
The following is management’s discussion and analysis of the financial condition and results of our operations. This discussion and analysis is intended to provide a better understanding of the consolidated financial statements and statistical data included elsewhere in this Annual Report on Form 10-K.
Executive Summary
We reported net income of $13,799 and earnings per common share of $1.77 for the year ended December 31, 2016. Our earnings have primarily been the result of increased interest income driven by outstanding loan growth during 2016. Our strong credit quality resulted in a decline in the level of the ALLL in both amount and as a percentage of gross loans, resulting in a reversal of provision for loan losses of $135 for the year ended December 31, 2016. Net loan recoveries during 2016 were $135 as compared to net loan recoveries of $71 in 2015.
During the year, total assets grew by 3.84% to $1,732,151, and assets under management increased to $2,432,726 which includes loans sold and serviced and assets managed by our Investment and Trust Services Department of $700,575. In 2016, we had total loan growth of $160,123 which was driven by commercial and agricultural loan growth of $137,864. Also contributing to this growth in 2016 were increases in both residential real estate and consumer loans of $22,259.
Our net yield on interest earning assets of 3.00% remains at historically low levels. While the FRB increased short term interest rates in December 2016 and projects increases in 2017, we do not anticipate significant improvements in our net yield on interest earning assets as the rates paid on interest bearing liabilities will likely increase faster than those of interest earning assets. Net interest income will increase only through continued strategic growth in loans, investments, and other income earning assets. We are committed to increasing earnings and shareholder value through growth in our loan portfolio, growth in our investment and trust services, and increasing our geographical presence while managing operating costs.
Recent Legislation
The Health Care and Education Act of 2010, the Patient Protection and Affordable Care Act, the Dodd-Frank Act, and the JOBS Act, have already had, and are expected to continue to have, a negative impact on our operating results. Of these four acts, the Dodd-Frank Act has had the most significant impact. The Dodd-Frank Act established the CFPB which has made significant changes in the regulation of financial institutions aimed at strengthening the oversight of the federal government over the operation of the financial services sector and increasing the protection of consumers. New regulations issued by the CFPB regarding consumer lending, including residential mortgage lending, have increased our compensation and outside advisor costs and this trend is expected to continue.
On July 2, 2013, the FRB published revised BASEL III Capital standards for banks. The rules redefine what is included or deducted from equity capital, changes risk weighting for certain on and off-balance sheet assets, increases the minimum required equity capital to be considered well capitalized, and introduces a capital cushion buffer. The rules, which will be gradually phased in between 2015 and 2019, are not expected to have a material impact on the Corporation but will require us to hold more capital than we have historically.
Reclassifications
Certain amounts reported in management's discussion and analysis of financial condition and results of operations for 2015 and 2014 have been reclassified to conform with the 2016 presentation.
Other
We have not received any notices of regulatory actions as of February 23, 2017.
14
CRITICAL ACCOUNTING POLICIES
Our significant accounting policies are set forth in “Note 1 – Nature of Operations and Summary of Significant Accounting Policies” of the “Notes to Consolidated Financial Statements” in Item 8. Financial Statements and Supplementary Data. Of these significant accounting policies, we consider our policies regarding the ALLL, acquisition intangibles and goodwill, and the determination of the fair value and assessment of OTTI of investment securities to be our most critical accounting policies.
The ALLL requires our most subjective and complex judgment. Changes in economic conditions can have a significant impact on the ALLL and, therefore, the provision for loan losses and results of operations. We have developed policies and procedures for assessing the appropriateness of the ALLL, recognizing that this process requires a number of assumptions and estimates with respect to our loan portfolio. Our assessments may be impacted in future periods by changes in economic conditions, and the discovery of information with respect to borrowers which is not known to us at the time of the issuance of the consolidated financial statements. For additional discussion concerning our ALLL and related matters, see the detailed discussion to follow under the caption “Allowance for Loan and Lease Losses” and “Note 5 – Loans and ALLL” of the “Notes to Consolidated Financial Statements” in Item 8. Financial Statements and Supplementary Data.
U.S. generally accepted accounting principles require that we determine the fair value of the assets and liabilities of an acquired entity, and record their fair value on the date of acquisition. We employ a variety of measures in the determination of the fair value, including the use of discounted cash flow analysis, market appraisals, and projected future revenue streams. For certain items that we believe we have the appropriate expertise to determine the fair value, we may choose to use our own calculations of the value. In other cases, where the value is not easily determined, we consult with outside parties to determine the fair value of the identified asset or liability. Once valuations have been adjusted, the net difference between the price paid for the acquired entity and the net value of assets acquired on our balance sheet, including identifiable intangibles, is recorded as goodwill. Acquisition intangibles and goodwill are qualitatively evaluated to determine if it is more likely than not that the carrying balance is impaired on at least an annual basis.
AFS securities are carried at fair value with changes in the fair value included as a component of other comprehensive income. Declines in the fair value of AFS securities below their cost that are other-than-temporary are reflected as realized losses in the consolidated statements of income. We evaluate AFS securities for indications of losses that are considered other-than-temporary, if any, on a regular basis. The market values for most AFS investment securities are typically obtained from outside sources and applied to individual securities within the portfolio. Municipal securities for which no readily determinable market values are available are priced using fair value curves which most closely match the security's credit ratings and maturities.
15
Average Balances, Interest Rate, and Net Interest Income
The following schedules present the daily average amount outstanding for each major category of interest earning assets, non-earning assets, interest bearing liabilities, and noninterest bearing liabilities for the last three years. These schedules also present an analysis of interest income and interest expense for the periods indicated. All interest income is reported on a FTE basis using a 34% federal income tax rate. Loans in nonaccrual status, for the purpose of the following computations, are included in the average loan balances. FRB and FHLB restricted equity holdings are included in accrued income and other assets.
Year Ended December 31 | ||||||||||||||||||||||||||||||||
2016 | 2015 | 2014 | ||||||||||||||||||||||||||||||
Average Balance | Tax Equivalent Interest | Average Yield / Rate | Average Balance | Tax Equivalent Interest | Average Yield / Rate | Average Balance | Tax Equivalent Interest | Average Yield / Rate | ||||||||||||||||||||||||
INTEREST EARNING ASSETS | ||||||||||||||||||||||||||||||||
Loans | $ | 922,333 | $ | 38,537 | 4.18 | % | $ | 829,903 | $ | 35,853 | 4.32 | % | $ | 816,105 | $ | 36,629 | 4.49 | % | ||||||||||||||
Taxable investment securities | 392,810 | 8,746 | 2.23 | % | 395,981 | 9,053 | 2.29 | % | 357,250 | 8,092 | 2.27 | % | ||||||||||||||||||||
Nontaxable investment securities | 205,450 | 9,351 | 4.55 | % | 205,242 | 9,870 | 4.81 | % | 194,751 | 9,877 | 5.07 | % | ||||||||||||||||||||
Other | 25,557 | 668 | 2.61 | % | 25,947 | 600 | 2.31 | % | 25,784 | 519 | 2.01 | % | ||||||||||||||||||||
Total earning assets | 1,546,150 | 57,302 | 3.71 | % | 1,457,073 | 55,376 | 3.80 | % | 1,393,890 | 55,117 | 3.95 | % | ||||||||||||||||||||
NONEARNING ASSETS | ||||||||||||||||||||||||||||||||
Allowance for loan losses | (7,638 | ) | (9,275 | ) | (10,973 | ) | ||||||||||||||||||||||||||
Cash and demand deposits due from banks | 18,178 | 17,925 | 18,552 | |||||||||||||||||||||||||||||
Premises and equipment | 28,670 | 26,968 | 25,957 | |||||||||||||||||||||||||||||
Accrued income and other assets | 101,995 | 98,805 | 94,754 | |||||||||||||||||||||||||||||
Total assets | $ | 1,687,355 | $ | 1,591,496 | $ | 1,522,180 | ||||||||||||||||||||||||||
INTEREST BEARING LIABILITIES | ||||||||||||||||||||||||||||||||
Interest bearing demand deposits | $ | 203,198 | 163 | 0.08 | % | $ | 195,260 | 155 | 0.08 | % | $ | 191,750 | 157 | 0.08 | % | |||||||||||||||||
Savings deposits | 336,859 | 663 | 0.20 | % | 293,703 | 449 | 0.15 | % | 260,469 | 374 | 0.14 | % | ||||||||||||||||||||
Time deposits | 429,731 | 5,010 | 1.17 | % | 433,409 | 5,246 | 1.21 | % | 448,971 | 5,764 | 1.28 | % | ||||||||||||||||||||
Borrowed funds | 319,049 | 5,029 | 1.58 | % | 295,641 | 4,313 | 1.46 | % | 274,080 | 3,675 | 1.34 | % | ||||||||||||||||||||
Total interest bearing liabilities | 1,288,837 | 10,865 | 0.84 | % | 1,218,013 | 10,163 | 0.83 | % | 1,175,270 | 9,970 | 0.85 | % | ||||||||||||||||||||
NONINTEREST BEARING LIABILITIES | ||||||||||||||||||||||||||||||||
Demand deposits | 194,892 | 181,939 | 165,860 | |||||||||||||||||||||||||||||
Other | 9,841 | 10,001 | 10,773 | |||||||||||||||||||||||||||||
Shareholders’ equity | 193,785 | 181,543 | 170,277 | |||||||||||||||||||||||||||||
Total liabilities and shareholders’ equity | $ | 1,687,355 | $ | 1,591,496 | $ | 1,522,180 | ||||||||||||||||||||||||||
Net interest income (FTE) | $ | 46,437 | $ | 45,213 | $ | 45,147 | ||||||||||||||||||||||||||
Net yield on interest earning assets (FTE) | 3.00 | % | 3.10 | % | 3.24 | % | ||||||||||||||||||||||||||
16
Net Interest Income
Net interest income is the amount by which interest income on earning assets exceeds the interest expenses on interest bearing liabilities. Net interest income, which includes loan fees, is influenced by changes in the balance and mix of assets and liabilities and market interest rates. We exert some control over these factors; however, FRB monetary policy and competition have a significant impact. For analytical purposes, net interest income is adjusted to an FTE basis by adding the income tax savings from interest on tax exempt loans, and nontaxable investment securities, thus making year to year comparisons more meaningful.
Volume and Rate Variance Analysis
The following table sets forth the effect of volume and rate changes on interest income and expense for the periods indicated. For the purpose of this table, changes in interest due to volume and rate were determined as follows:
Volume—change in volume multiplied by the previous period's FTE rate.
Rate—change in the FTE rate multiplied by the previous period's volume.
The change in interest due to both volume and rate has been allocated to volume and rate changes in proportion to the relationship of the absolute dollar amounts of the change in each.
2016 Compared to 2015 Increase (Decrease) Due to | 2015 Compared to 2014 Increase (Decrease) Due to | ||||||||||||||||||||||
Volume | Rate | Net | Volume | Rate | Net | ||||||||||||||||||
Changes in interest income | |||||||||||||||||||||||
Loans | $ | 3,892 | $ | (1,208 | ) | $ | 2,684 | $ | 612 | $ | (1,388 | ) | $ | (776 | ) | ||||||||
Taxable investment securities | (72 | ) | (235 | ) | (307 | ) | 885 | 76 | 961 | ||||||||||||||
Nontaxable investment securities | 10 | (529 | ) | (519 | ) | 518 | (525 | ) | (7 | ) | |||||||||||||
Other | (9 | ) | 77 | 68 | 3 | 78 | 81 | ||||||||||||||||
Total changes in interest income | 3,821 | (1,895 | ) | 1,926 | 2,018 | (1,759 | ) | 259 | |||||||||||||||
Changes in interest expense | |||||||||||||||||||||||
Interest bearing demand deposits | 6 | 2 | 8 | 3 | (5 | ) | (2 | ) | |||||||||||||||
Savings deposits | 72 | 142 | 214 | 50 | 25 | 75 | |||||||||||||||||
Time deposits | (44 | ) | (192 | ) | (236 | ) | (195 | ) | (323 | ) | (518 | ) | |||||||||||
Borrowed funds | 355 | 361 | 716 | 301 | 337 | 638 | |||||||||||||||||
Total changes in interest expense | 389 | 313 | 702 | 159 | 34 | 193 | |||||||||||||||||
Net change in interest margin (FTE) | $ | 3,432 | $ | (2,208 | ) | $ | 1,224 | $ | 1,859 | $ | (1,793 | ) | $ | 66 | |||||||||
Our net yield on interest earning assets remains at historically low levels. The persistent low interest rate environment coupled with a high concentration of AFS securities as a percentage of earning assets has also placed downward pressure on net interest margin. While the FRB increased short term interest rates in late 2016, we do not expect any significant change in our net yield on interest earning assets as the rates paid on interest bearing liabilities will likely increase faster than those of interest earning assets. Net interest income will increase only through continued balance sheet growth.
Average Yield / Rate for the Three Month Periods Ended: | ||||||||||||||
December 31 2016 | September 30 2016 | June 30 2016 | March 31 2016 | December 31 2015 | ||||||||||
Total earning assets | 3.73 | % | 3.76 | % | 3.66 | % | 3.67 | % | 3.73 | % | ||||
Total interest bearing liabilities | 0.87 | % | 0.86 | % | 0.83 | % | 0.82 | % | 0.83 | % | ||||
Net yield on interest earning assets (FTE) | 3.01 | % | 3.05 | % | 2.97 | % | 2.98 | % | 3.04 | % | ||||
17
Quarter to Date Net Interest Income (FTE) | |||||||||||||||||||
December 31 2016 | September 30 2016 | June 30 2016 | March 31 2016 | December 31 2015 | |||||||||||||||
Total interest income (FTE) | $ | 14,642 | $ | 14,508 | $ | 14,132 | $ | 14,020 | $ | 13,970 | |||||||||
Total interest expense | 2,826 | 2,747 | 2,678 | 2,614 | 2,577 | ||||||||||||||
Net interest income (FTE) | $ | 11,816 | $ | 11,761 | $ | 11,454 | $ | 11,406 | $ | 11,393 | |||||||||
Allowance for Loan and Lease Losses
The viability of any financial institution is ultimately determined by its management of credit risk. Loans represent our single largest concentration of risk. The ALLL is our estimation of incurred losses within the existing loan portfolio. We allocate the ALLL throughout the loan portfolio based on our assessment of the underlying risks associated with each loan segment. Our assessments include allocations based on specific impairment valuation allowances, historical charge-offs, internally assigned credit risk ratings, and past due and nonaccrual balances. A portion of the ALLL is not allocated to any one loan segment, but is instead a reflection of other qualitative risks that reflects the margin of imprecision inherent in the underlying assumptions used in the methodologies for estimating specific and general losses in the portfolio.
The following table summarizes our charge-offs, recoveries, provisions for loan losses, and ALLL balances as of, and for the unaudited three month periods ended:
December 31 2016 | September 30 2016 | June 30 2016 | March 31 2016 | December 31 2015 | |||||||||||||||
Total charge-offs | $ | 236 | $ | 131 | $ | 208 | $ | 341 | $ | 238 | |||||||||
Total recoveries | 156 | 314 | 296 | 285 | 210 | ||||||||||||||
Net loan charge-offs | 80 | (183 | ) | (88 | ) | 56 | 28 | ||||||||||||
Net loan charge-offs to average loans outstanding | 0.01 | % | (0.02 | )% | (0.01 | )% | 0.01 | % | — | ||||||||||
Provision for loan losses | $ | (320 | ) | $ | 17 | $ | 12 | $ | 156 | $ | (772 | ) | |||||||
Provision for loan losses to average loans outstanding | (0.03 | )% | — | — | 0.02 | % | (0.09 | )% | |||||||||||
ALLL | $ | 7,400 | $ | 7,800 | $ | 7,600 | $ | 7,500 | $ | 7,400 | |||||||||
ALLL as a % of loans at end of period | 0.73 | % | 0.79 | % | 0.83 | % | 0.86 | % | 0.87 | % | |||||||||
The following table summarizes our charge-off and recovery activity for the years ended December 31:
2016 | 2015 | 2014 | 2013 | 2012 | |||||||||||||||
ALLL at beginning of period | $ | 7,400 | $ | 10,100 | $ | 11,500 | $ | 11,936 | $ | 12,375 | |||||||||
Charge-offs | |||||||||||||||||||
Commercial and agricultural | 57 | 134 | 590 | 907 | 1,672 | ||||||||||||||
Residential real estate | 574 | 397 | 722 | 1,004 | 1,142 | ||||||||||||||
Consumer | 285 | 373 | 316 | 429 | 542 | ||||||||||||||
Total charge-offs | 916 | 904 | 1,628 | 2,340 | 3,356 | ||||||||||||||
Recoveries | |||||||||||||||||||
Commercial and agricultural | 540 | 549 | 550 | 363 | 240 | ||||||||||||||
Residential real estate | 287 | 220 | 197 | 181 | 122 | ||||||||||||||
Consumer | 224 | 206 | 149 | 249 | 255 | ||||||||||||||
Total recoveries | 1,051 | 975 | 896 | 793 | 617 | ||||||||||||||
Provision for loan losses | (135 | ) | (2,771 | ) | (668 | ) | 1,111 | 2,300 | |||||||||||
ALLL at end of period | 7,400 | 7,400 | 10,100 | 11,500 | 11,936 | ||||||||||||||
Net loan charge-offs | $ | (135 | ) | $ | (71 | ) | $ | 732 | $ | 1,547 | $ | 2,739 | |||||||
Net loan charge-offs to average loans outstanding | (0.01 | )% | (0.01 | )% | 0.09 | % | 0.20 | % | 0.36 | % | |||||||||
ALLL as a% of loans at end of period | 0.73 | % | 0.87 | % | 1.21 | % | 1.42 | % | 1.54 | % | |||||||||
18
As the level of net loans charged-off declines and credit quality indicators remain stable, we have reduced the ALLL in both amount and as a percentage of loans. While they can be more volatile, loans individually evaluated for impairment have been steadily declining since December 31, 2015. The decline in loans collectively impaired illustrates the downward trend we are experiencing in our overall level of ALLL to gross loans. The following table illustrates our changes within the two main components of the ALLL.
December 31 2016 | September 30 2016 | June 30 2016 | March 31 2016 | December 31 2015 | |||||||||||||||
ALLL | |||||||||||||||||||
Individually evaluated for impairment | $ | 2,371 | $ | 2,523 | $ | 2,602 | $ | 2,731 | $ | 2,820 | |||||||||
Collectively evaluated for impairment | 5,029 | 5,277 | 4,998 | 4,769 | 4,580 | ||||||||||||||
Total | $ | 7,400 | $ | 7,800 | $ | 7,600 | $ | 7,500 | $ | 7,400 | |||||||||
ALLL to gross loans | |||||||||||||||||||
Individually evaluated for impairment | 0.23 | % | 0.26 | % | 0.28 | % | 0.31 | % | 0.33 | % | |||||||||
Collectively evaluated for impairment | 0.50 | % | 0.53 | % | 0.55 | % | 0.55 | % | 0.54 | % | |||||||||
Total | 0.73 | % | 0.79 | % | 0.83 | % | 0.86 | % | 0.87 | % | |||||||||
For further discussion of the allocation of the ALLL, see “Note 5 – Loans and ALLL” of the “Notes to Consolidated Financial Statements” in Item 8. Financial Statements and Supplementary Data.
Loans Past Due and Loans in Nonaccrual Status
Fluctuations in past due and nonaccrual status loans can have a significant impact on the ALLL. To determine the potential impact, and corresponding estimated losses, we analyze our historical loss trends on loans past due greater than 30 days and nonaccrual status loans. We monitor all loans that are past due and in nonaccrual status for indications of additional deterioration.
Total Past Due and Nonaccrual Loans as of December 31 | |||||||||||||||||||
2016 | 2015 | 2014 | 2013 | 2012 | |||||||||||||||
Commercial and agricultural | $ | 4,598 | $ | 2,247 | $ | 4,805 | $ | 3,621 | $ | 7,271 | |||||||||
Residential real estate | 2,716 | 2,520 | 4,181 | 7,008 | 5,431 | ||||||||||||||
Consumer | 115 | 31 | 138 | 259 | 199 | ||||||||||||||
Total | $ | 7,429 | $ | 4,798 | $ | 9,124 | $ | 10,888 | $ | 12,901 | |||||||||
Total past due and nonaccrual loans to gross loans | 0.74 | % | 0.56 | % | 1.09 | % | 1.34 | % | 1.67 | % | |||||||||
Past due and nonaccrual status loans continue to be below historical norms and are the result of improved loan performance. A summary of loans past due and in nonaccrual status, including the composition of the ending balance of nonaccrual status loans by type, is included in “Note 5 – Loans and ALLL” of the “Notes to Consolidated Financial Statements” in Item 8. Financial Statements and Supplementary Data.
Troubled Debt Restructurings
We have taken a proactive approach to avoid foreclosures on borrowers who are willing to work with us in modifying their loans, thus making them more affordable. While this approach has allowed certain borrowers to develop a payment structure that will allow them to continue making payments in lieu of foreclosure, it has contributed to a significant level of loans classified as TDRs. The modifications have been successful for us and our customers as very few of the modified loans have resulted in foreclosures. At the time of the TDR, the loan is reviewed to determine whether or not to classify the loan as accrual or nonaccrual status. The majority of new modifications result in terms that satisfy our criteria for continued interest accrual. TDRs that have been placed on nonaccrual status may be placed back on accrual status after six months of continued performance.
We restructure debt with borrowers who due to temporary financial difficulties are unable to service their debt under the original terms. We may extend the amortization period, reduce interest rates, forgive principal, forgive interest, or a combination of these modifications. Typically, the modifications are for a period of five years or less. There were no TDRs that were Government sponsored as of December 31, 2016 or December 31, 2015.
Losses associated with TDRs, if any, are included in the estimation of the ALLL in the quarter in which a loan is identified as a TDR, and we review the analysis of the ALLL estimation each reporting period to ensure its continued appropriateness.
19
The following tables provide a roll-forward of TDRs for the years ended December 31, 2015 and 2016:
Accruing Interest | Nonaccrual | Total | ||||||||||||||||||
Number of Loans | Balance | Number of Loans | Balance | Number of Loans | Balance | |||||||||||||||
January 1, 2015 | 156 | $ | 20,931 | 13 | $ | 2,410 | 169 | $ | 23,341 | |||||||||||
New modifications | 28 | 6,490 | 4 | 491 | 32 | 6,981 | ||||||||||||||
Principal advances (payments) | — | (1,205 | ) | — | (1,002 | ) | — | (2,207 | ) | |||||||||||
Loans paid-off | (26 | ) | (5,227 | ) | (7 | ) | (597 | ) | (33 | ) | (5,824 | ) | ||||||||
Partial charge-offs | — | — | — | (87 | ) | — | (87 | ) | ||||||||||||
Balances charged-off | (2 | ) | (83 | ) | — | — | (2 | ) | (83 | ) | ||||||||||
Transfers to OREO | — | — | (6 | ) | (796 | ) | (6 | ) | (796 | ) | ||||||||||
Transfers to accrual status | 3 | 292 | (3 | ) | (292 | ) | — | — | ||||||||||||
Transfers to nonaccrual status | (4 | ) | (267 | ) | 4 | 267 | — | — | ||||||||||||
December 31, 2015 | 155 | 20,931 | 5 | 394 | 160 | 21,325 | ||||||||||||||
New modifications | 16 | 3,362 | 2 | 459 | 18 | 3,821 | ||||||||||||||
Principal advances (payments) | — | (1,036 | ) | — | (37 | ) | — | (1,073 | ) | |||||||||||
Loans paid-off | (15 | ) | (2,105 | ) | (1 | ) | (221 | ) | (16 | ) | (2,326 | ) | ||||||||
Partial charge-offs | — | — | — | (133 | ) | — | (133 | ) | ||||||||||||
Balances charged-off | (3 | ) | (197 | ) | — | — | (3 | ) | (197 | ) | ||||||||||
Transfers to OREO | — | — | (1 | ) | (35 | ) | (1 | ) | (35 | ) | ||||||||||
Transfers to accrual status | 5 | 340 | (5 | ) | (340 | ) | — | — | ||||||||||||
Transfers to nonaccrual status | (5 | ) | (702 | ) | 5 | 702 | — | — | ||||||||||||
December 31, 2016 | 153 | $ | 20,593 | 5 | $ | 789 | 158 | $ | 21,382 | |||||||||||
The following table summarizes our TDRs as of December 31:
2016 | 2015 | 2014 | |||||||||||||||||||||||||||||||||
Accruing Interest | Nonaccrual | Total | Accruing Interest | Nonaccrual | Total | Accruing Interest | Nonaccrual | Total | |||||||||||||||||||||||||||
Current | $ | 17,557 | $ | 559 | $ | 18,116 | $ | 20,550 | $ | 146 | $ | 20,696 | $ | 20,012 | $ | 272 | $ | 20,284 | |||||||||||||||||
Past due 30-59 days | 2,898 | 230 | 3,128 | 357 | — | 357 | 804 | 592 | 1,396 | ||||||||||||||||||||||||||
Past due 60-89 days | 138 | — | 138 | 24 | — | 24 | 115 | 3 | 118 | ||||||||||||||||||||||||||
Past due 90 days or more | — | — | — | — | 248 | 248 | — | 1,543 | 1,543 | ||||||||||||||||||||||||||
Total | $ | 20,593 | $ | 789 | $ | 21,382 | $ | 20,931 | $ | 394 | $ | 21,325 | $ | 20,931 | $ | 2,410 | $ | 23,341 | |||||||||||||||||
2013 | 2012 | ||||||||||||||||||||||
Accruing Interest | Nonaccrual | Total | Accruing Interest | Nonaccrual | Total | ||||||||||||||||||
Current | $ | 21,690 | $ | 1,189 | $ | 22,879 | $ | 16,301 | $ | 941 | $ | 17,242 | |||||||||||
Past due 30-59 days | 2,158 | 37 | 2,195 | 158 | 561 | 719 | |||||||||||||||||
Past due 60-89 days | 575 | — | 575 | 72 | 41 | 113 | |||||||||||||||||
Past due 90 days or more | — | 216 | 216 | — | 1,281 | 1,281 | |||||||||||||||||
Total | $ | 24,423 | $ | 1,442 | $ | 25,865 | $ | 16,531 | $ | 2,824 | $ | 19,355 | |||||||||||
Additional disclosures about TDRs are included in “Note 5 – Loans and ALLL” of the “Notes to Consolidated Financial Statements” in Item 8. Financial Statements and Supplementary Data.
20
Impaired Loans
The following is a summary of information pertaining to impaired loans as of December 31:
2016 | 2015 | ||||||||||||||||||||||
Outstanding Balance | Unpaid Principal Balance | Valuation Allowance | Outstanding Balance | Unpaid Principal Balance | Valuation Allowance | ||||||||||||||||||
TDRs | |||||||||||||||||||||||
Commercial real estate | $ | 6,264 | $ | 6,383 | $ | 713 | $ | 7,619 | $ | 7,858 | $ | 818 | |||||||||||
Commercial other | 1,444 | 1,455 | 25 | 188 | 199 | 11 | |||||||||||||||||
Agricultural real estate | 4,037 | 4,037 | — | 3,549 | 3,549 | — | |||||||||||||||||
Agricultural other | 1,380 | 1,380 | 1 | 519 | 519 | 2 | |||||||||||||||||
Residential real estate senior liens | 8,058 | 8,437 | 1,539 | 9,155 | 9,457 | 1,851 | |||||||||||||||||
Residential real estate junior liens | 71 | 71 | 13 | 133 | 133 | 28 | |||||||||||||||||
Home equity lines of credit | 102 | 402 | — | 127 | 427 | — | |||||||||||||||||
Consumer secured | 26 | 26 | — | 35 | 35 | — | |||||||||||||||||
Total TDRs | 21,382 | 22,191 | 2,291 | 21,325 | 22,177 | 2,710 | |||||||||||||||||
Other impaired loans | |||||||||||||||||||||||
Commercial real estate | 151 | 226 | 3 | 162 | 175 | — | |||||||||||||||||
Commercial other | — | — | — | — | — | — | |||||||||||||||||
Agricultural real estate | — | — | — | — | — | — | |||||||||||||||||
Agricultural other | 128 | 128 | — | — | — | — | |||||||||||||||||
Residential real estate senior liens | 406 | 612 | 76 | 841 | 1,308 | 108 | |||||||||||||||||
Residential real estate junior liens | 1 | 11 | 1 | 10 | 30 | 2 | |||||||||||||||||
Home equity lines of credit | — | — | — | — | 7 | — | |||||||||||||||||
Consumer secured | — | — | — | — | — | — | |||||||||||||||||
Total other impaired loans | 686 | 977 | 80 | 1,013 | 1,520 | 110 | |||||||||||||||||
Total impaired loans | $ | 22,068 | $ | 23,168 | $ | 2,371 | $ | 22,338 | $ | 23,697 | $ | 2,820 | |||||||||||
Additional disclosure related to impaired loans is included in “Note 5 – Loans and ALLL” of the “Notes to Consolidated Financial Statements” in Item 8. Financial Statements and Supplementary Data.
Nonperforming Assets
The following table summarizes our nonperforming assets as of December 31:
2016 | 2015 | 2014 | 2013 | 2012 | |||||||||||||||
Nonaccrual status loans | $ | 1,060 | $ | 792 | $ | 4,044 | $ | 3,244 | $ | 7,303 | |||||||||
Accruing loans past due 90 days or more | 633 | — | 148 | 142 | 428 | ||||||||||||||
Total nonperforming loans | 1,693 | 792 | 4,192 | 3,386 | 7,731 | ||||||||||||||
Foreclosed assets | 231 | 421 | 885 | 1,412 | 2,018 | ||||||||||||||
Total nonperforming assets | $ | 1,924 | $ | 1,213 | $ | 5,077 | $ | 4,798 | $ | 9,749 | |||||||||
Nonperforming loans as a % of total loans | 0.17 | % | 0.09 | % | 0.50 | % | 0.42 | % | 1.00 | % | |||||||||
Nonperforming assets as a % of total assets | 0.11 | % | 0.07 | % | 0.33 | % | 0.32 | % | 0.68 | % | |||||||||
After a loan is 90 days past due, it is placed on nonaccrual status unless it is well secured and in the process of collection. Upon transferring a loan to nonaccrual status, we perform an evaluation to determine the net realizable value of the underlying collateral. This evaluation is used to help determine if any charge-offs are necessary. Loans may be placed back on accrual status after six months months of continued performance. Current levels of nonperforming loans continue to reflect historic lows.
21
Included in the nonaccrual loan balances above were loans currently classified as TDRs as of December 31:
2016 | 2015 | 2014 | 2013 | 2012 | |||||||||||||||
Commercial and agricultural | $ | 405 | $ | 232 | $ | 1,995 | $ | 833 | $ | 2,325 | |||||||||
Residential real estate | 384 | 162 | 262 | 609 | 499 | ||||||||||||||
Consumer | — | — | 153 | — | — | ||||||||||||||
Total | $ | 789 | $ | 394 | $ | 2,410 | $ | 1,442 | $ | 2,824 | |||||||||
Additional disclosures about nonaccrual status loans are included in “Note 5 – Loans and ALLL”of the “Notes to Consolidated Financial Statements” in Item 8. Financial Statements and Supplementary Data.
We continue to devote considerable attention to identifying impaired loans and adjusting the net carrying value of these loans to their current net realizable values through the establishment of a specific reserve or the recording of a charge-off. We believe that we have identified all impaired loans as of December 31, 2016.
We believe that the level of the ALLL is appropriate as of December 31, 2016. We will continue to closely monitor overall credit quality indicators and our policies and procedures related to the analysis of the ALLL to ensure that the ALLL remains at the appropriate level.
22
Noninterest Income and Noninterest Expenses
Significant noninterest account balances are highlighted in the following table with additional descriptions of significant fluctuations for the years ended December 31:
Change | Change | ||||||||||||||||||||||||
2016 | 2015 | $ | % | 2014 | $ | % | |||||||||||||||||||
Service charges and fees | |||||||||||||||||||||||||
ATM and debit card fees | $ | 2,444 | $ | 2,411 | $ | 33 | 1.37 | % | $ | 2,084 | $ | 327 | 15.69 | % | |||||||||||
NSF and overdraft fees | 1,815 | 1,855 | (40 | ) | (2.16 | )% | 2,156 | (301 | ) | (13.96 | )% | ||||||||||||||
Freddie Mac servicing fee | 696 | 712 | (16 | ) | (2.25 | )% | 720 | (8 | ) | (1.11 | )% | ||||||||||||||
Service charges on deposit accounts | 349 | 345 | 4 | 1.16 | % | 354 | (9 | ) | (2.54 | )% | |||||||||||||||
Net OMSR income (loss) | (199 | ) | (14 | ) | (185 | ) | N/M | (36 | ) | 22 | 61.11 | % | |||||||||||||
All other | 125 | 128 | (3 | ) | (2.34 | )% | 133 | (5 | ) | (3.76 | )% | ||||||||||||||
Total service charges and fees | 5,230 | 5,437 | (207 | ) | (3.81 | )% | 5,411 | 26 | 0.48 | % | |||||||||||||||
Net gain on sale of mortgage loans | 651 | 573 | 78 | 13.61 | % | 514 | 59 | 11.48 | % | ||||||||||||||||
Earnings on corporate owned life insurance policies | 761 | 771 | (10 | ) | (1.30 | )% | 751 | 20 | 2.66 | % | |||||||||||||||
Net gains (losses) on sale of AFS securities | 245 | 163 | 82 | 50.31 | % | 97 | 66 | 68.04 | % | ||||||||||||||||
Other | |||||||||||||||||||||||||
Trust and brokerage advisory fees | 2,705 | 2,161 | 544 | 25.17 | % | 2,069 | 92 | 4.45 | % | ||||||||||||||||
Corporate Settlement Solutions joint venture | 415 | 463 | (48 | ) | (10.37 | )% | 76 | 387 | 509.21 | % | |||||||||||||||
Other | 1,101 | 791 | 310 | 39.19 | % | 407 | 384 | 94.35 | % | ||||||||||||||||
Total other | 4,221 | 3,415 | 806 | 23.60 | % | 2,552 | 863 | 33.82 | % | ||||||||||||||||
Total noninterest income | $ | 11,108 | $ | 10,359 | $ | 749 | 7.23 | % | $ | 9,325 | $ | 1,034 | 11.09 | % | |||||||||||
Significant changes in noninterest income are detailed below:
• | ATM and debit card fees fluctuate from period-to-period based on usage of ATM and debit cards. While we do not anticipate significant changes to our ATM and debit card fees, we do expect that fees will continue to increase in 2017 as the usage of ATM and debit cards continues to increase. |
• | NSF and overdraft fees fluctuate from period-to-period based on customer activity as well as the number of business days in the period. We anticipate NSF and overdraft fees in 2017 to approximate 2016 levels. |
• | Offering rates on residential mortgage loans and increased prepayment speeds have been the most significant drivers behind the fluctuations in net OMSR income (loss). We anticipate increases in our originations in purchase money mortgage activity as a result of our various initiatives to drive growth. Additionally, we anticipate increased mortgage rates; therefore, we anticipate net OMSR income to improve into 2017. |
• | We are continually analyzing our AFS securities for potential sale opportunities. Securities with unrealized gains and less than desirable yields may be sold for funding and profitability purposes. During the second quarter of 2016, we identified several mortgage-backed securities that were desirable to be sold and recognized gains with these sales. We will continue to analyze our AFS securities portfolio for potential sale opportunities in 2017 and sell AFS securities when appropriate. |
• | In recent periods, we have invested considerable efforts to increase our market share in trust and brokerage advisory services. These efforts have translated into increases in trust fees and brokerage and advisory fees. We anticipate that these fees in 2017 will approximate 2016 levels. |
• | Included in other income in 2016 is a $469 gain on a redemption of a bank owned life insurance policy. All other fluctuations in all other income is spread throughout various categories, none of which are individually significant. |
23
Significant noninterest expense account balances are highlighted in the following table with additional descriptions of significant fluctuations for the years ended December 31:
Change | Change | ||||||||||||||||||||||||
2016 | 2015 | $ | % | 2014 | $ | % | |||||||||||||||||||
Compensation and benefits | |||||||||||||||||||||||||
Employee salaries | $ | 13,941 | $ | 13,760 | $ | 181 | 1.32 | % | $ | 13,311 | $ | 449 | 3.37 | % | |||||||||||
Employee benefits | 5,541 | 5,309 | 232 | 4.37 | % | 5,191 | 118 | 2.27 | % | ||||||||||||||||
Total compensation and benefits | 19,482 | 19,069 | 413 | 2.17 | % | 18,502 | 567 | 3.06 | % | ||||||||||||||||
Furniture and equipment | |||||||||||||||||||||||||
Service contracts | 3,061 | 2,951 | 110 | 3.73 | % | 2,542 | 409 | 16.09 | % | ||||||||||||||||
Depreciation | 2,039 | 1,949 | 90 | 4.62 | % | 1,850 | 99 | 5.35 | % | ||||||||||||||||
ATM and debit card fees | 887 | 742 | 145 | 19.54 | % | 722 | 20 | 2.77 | % | ||||||||||||||||
All other | 175 | 244 | (69 | ) | (28.28 | )% | 223 | 21 | 9.42 | % | |||||||||||||||
Total furniture and equipment | 6,162 | 5,886 | 276 | 4.69 | % | 5,337 | 549 | 10.29 | % | ||||||||||||||||
Occupancy | |||||||||||||||||||||||||
Depreciation | 782 | 728 | 54 | 7.42 | % | 701 | 27 | 3.85 | % | ||||||||||||||||
Outside services | 740 | 701 | 39 | 5.56 | % | 718 | (17 | ) | (2.37 | )% | |||||||||||||||
Property taxes | 554 | 526 | 28 | 5.32 | % | 515 | 11 | 2.14 | % | ||||||||||||||||
Utilities | 551 | 528 | 23 | 4.36 | % | 524 | 4 | 0.76 | % | ||||||||||||||||
All other | 600 | 554 | 46 | 8.30 | % | 521 | 33 | 6.33 | % | ||||||||||||||||
Total occupancy | 3,227 | 3,037 | 190 | 6.26 | % | 2,979 | 58 | 1.95 | % | ||||||||||||||||
Other | |||||||||||||||||||||||||
Audit and related fees | 944 | 889 | 55 | 6.19 | % | 809 | 80 | 9.89 | % | ||||||||||||||||
Director fees | 851 | 827 | 24 | 2.90 | % | 775 | 52 | 6.71 | % | ||||||||||||||||
Consulting fees | 800 | 487 | 313 | 64.27 | % | 349 | 138 | 39.54 | % | ||||||||||||||||
OTTI on AFS securities | 770 | — | 770 | N/M | — | — | — | % | |||||||||||||||||
FDIC insurance premiums | 719 | 813 | (94 | ) | (11.56 | )% | 842 | (29 | ) | (3.44 | )% | ||||||||||||||
Marketing costs | 586 | 497 | 89 | 17.91 | % | 427 | 70 | 16.39 | % | ||||||||||||||||
Donations and community relations | 582 | 841 | (259 | ) | (30.80 | )% | 1,004 | (163 | ) | (16.24 | )% | ||||||||||||||
Education and travel | 536 | 343 | 193 | 56.27 | % | 461 | (118 | ) | (25.60 | )% | |||||||||||||||
Loan underwriting fees | 535 | 347 | 188 | 54.18 | % | 361 | (14 | ) | (3.88 | )% | |||||||||||||||
Postage and freight | 396 | 381 | 15 | 3.94 | % | 397 | (16 | ) | (4.03 | )% | |||||||||||||||
Printing and supplies | 391 | 461 | (70 | ) | (15.18 | )% | 367 | 94 | 25.61 | % | |||||||||||||||
Legal fees | 208 | 295 | (87 | ) | (29.49 | )% | 320 | (25 | ) | (7.81 | )% | ||||||||||||||
Amortization of deposit premium | 162 | 169 | (7 | ) | (4.14 | )% | 183 | (14 | ) | (7.65 | )% | ||||||||||||||
Other losses | 241 | 150 | 91 | 60.67 | % | 250 | (100 | ) | (40.00 | )% | |||||||||||||||
All other | 1,305 | 1,559 | (254 | ) | (16.29 | )% | 1,740 | (181 | ) | (10.40 | )% | ||||||||||||||
Total other | 9,026 | 8,059 | 967 | 12.00 | % | 8,285 | (226 | ) | (2.73 | )% | |||||||||||||||
Total noninterest expenses | $ | 37,897 | $ | 36,051 | $ | 1,846 | 5.12 | % | $ | 35,103 | $ | 948 | 2.70 | % | |||||||||||
24
Significant changes in noninterest expenses are detailed below:
• | We acquired two branches in mid-2015 which resulted in increased expenses in 2016 for most of the categories presented above. None of the increases are individually significant. |
• | Consulting fees in 2016 increased as a result of outsourced operational functions related to our investment and trust services, consulting services to streamline processes, and talent recruitment services. Fees in 2017 are expected to approximate 2016 levels. |
• | During the fourth quarter of 2016, we identified an AFS security that was impaired which resulted in an OTTI expense of $770. |
• | We have consistently been a strong supporter of the various communities, schools, and charities in the markets we serve. Included in donations and community relations were discretionary donations to The Isabella Bank Foundation, a non-controlled affiliated entity, of $258 and $500 for the years ended December 31, 2015, and 2014, respectively. Donations and community relations fluctuate from period-to-period with 2017 expenses expected to approximate 2016 levels. |
• | We place a strong emphasis on employee development through continuous education. Education and travel expenses vary from year to year based on the timing of various programs that our employees attend. Expenses in 2017 are expected to approximate 2016 levels. |
• | The increase in loan underwriting fees is related to the increase in loan volume throughout 2016. Loan underwriting fees are expected to approximate 2016 levels in 2017. |
• | Legal fees in 2015 include approximately $133 of legal service expense incurred as a result of two branch acquisitions during the third quarter of that year. Legal fees are expected to approximate 2016 levels in 2017. |
• | The fluctuations in all other expenses are spread throughout various categories, none of which are individually significant. |
25
Analysis of Changes in Financial Condition
The following table shows the composition and changes in our balance sheet as of December 31:
Change | ||||||||||||||
2016 | 2015 | $ | % | |||||||||||
ASSETS | ||||||||||||||
Cash and cash equivalents | $ | 22,894 | $ | 21,569 | $ | 1,325 | 6.14 | % | ||||||
AFS securities | ||||||||||||||
Amortized cost of AFS securities | 557,648 | 654,348 | (96,700 | ) | (14.78 | )% | ||||||||
Unrealized gains (losses) on AFS securities | 448 | 5,788 | (5,340 | ) | (92.26 | )% | ||||||||
AFS securities | 558,096 | 660,136 | (102,040 | ) | (15.46 | )% | ||||||||
Mortgage loans AFS | 1,816 | 1,187 | 629 | 52.99 | % | |||||||||
Loans | ||||||||||||||
Gross loans | 1,010,615 | 850,492 | 160,123 | 18.83 | % | |||||||||
Less allowance for loan and lease losses | 7,400 | 7,400 | — | — | ||||||||||
Net loans | 1,003,215 | 843,092 | 160,123 | 18.99 | % | |||||||||
Premises and equipment | 29,314 | 28,331 | 983 | 3.47 | % | |||||||||
Corporate owned life insurance policies | 26,300 | 26,423 | (123 | ) | (0.47 | )% | ||||||||
Accrued interest receivable | 6,580 | 6,269 | 311 | 4.96 | % | |||||||||
Equity securities without readily determinable fair values | 21,694 | 22,286 | (592 | ) | (2.66 | )% | ||||||||
Goodwill and other intangible assets | 48,666 | 48,828 | (162 | ) | (0.33 | )% | ||||||||
Other assets | 13,576 | 9,991 | 3,585 | 35.88 | % | |||||||||
TOTAL ASSETS | $ | 1,732,151 | $ | 1,668,112 | $ | 64,039 | 3.84 | % | ||||||
LIABILITIES AND SHAREHOLDERS’ EQUITY | ||||||||||||||
Liabilities | ||||||||||||||
Deposits | $ | 1,195,040 | $ | 1,164,563 | $ | 30,477 | 2.62 | % | ||||||
Borrowed funds | 337,694 | 309,732 | 27,962 | 9.03 | % | |||||||||
Accrued interest payable and other liabilities | 11,518 | 9,846 | 1,672 | 16.98 | % | |||||||||
Total liabilities | 1,544,252 | 1,484,141 | 60,111 | 4.05 | % | |||||||||
Shareholders’ equity | 187,899 | 183,971 | 3,928 | 2.14 | % | |||||||||
TOTAL LIABILITIES AND SHAREHOLDERS’ EQUITY | $ | 1,732,151 | $ | 1,668,112 | $ | 64,039 | 3.84 | % | ||||||
As shown above, total assets have increased $64,039 since December 31, 2015 which was primarily driven by loan growth of $160,123. This growth was funded by the sale of AFS securities and increases in both deposits and borrowed funds. While generating quality loans will continue to be competitive, we expect that loans will continue to grow in 2017.
A discussion of changes in balance sheet amounts by major categories follows:
Cash and cash equivalents
Included in cash and cash equivalents are funds held with FRB which fluctuate from period-to-period.
AFS investment securities
The primary objective of our investing activities is to provide for safety of the principal invested. Secondary considerations include the need for earnings, liquidity, and our overall exposure to changes in interest rates. The current interest rate environment has made it almost impossible to increase net interest income without increasing earning assets. As loan demand outpaced deposit growth in recent periods, we sold AFS securities to provide funding. We anticipate that future increases in our AFS securities will be in the form of mortgage-backed securities and collateralized mortgage obligations.
26
The following is a schedule of the carrying value of AFS investment securities as of December 31:
2016 | 2015 | 2014 | 2013 | 2012 | |||||||||||||||
Government sponsored enterprises | $ | 10,259 | $ | 24,345 | $ | 24,136 | $ | 23,745 | $ | 25,776 | |||||||||
States and political subdivisions | 212,919 | 232,217 | 215,345 | 201,988 | 182,743 | ||||||||||||||
Auction rate money market preferred | 2,794 | 2,866 | 2,619 | 2,577 | 2,778 | ||||||||||||||
Preferred stocks | 3,425 | 3,299 | 6,140 | 5,827 | 6,363 | ||||||||||||||
Mortgage-backed securities | 227,256 | 263,384 | 166,926 | 144,115 | 155,345 | ||||||||||||||
Collateralized mortgage obligations | 101,443 | 134,025 | 152,368 | 133,810 | 131,005 | ||||||||||||||
Total | $ | 558,096 | $ | 660,136 | $ | 567,534 | $ | 512,062 | $ | 504,010 | |||||||||
Excluding those holdings in government sponsored enterprises and municipalities within the State of Michigan, there were no investments in securities of any one issuer that exceeded 10% of shareholders’ equity. We have a policy prohibiting investments in securities that we deem are unsuitable due to their inherent credit or market risks. Prohibited investments include stripped mortgage backed securities, zero coupon bonds, nongovernment agency asset backed securities, and structured notes. Our holdings in mortgage-backed securities and collateralized mortgage obligations include only government agencies and government sponsored agencies as we hold no investments in private label mortgage-backed securities or collateralized mortgage obligations.
The following is a schedule of maturities of AFS investment securities and their weighted average yield as of December 31, 2016. Weighted average yields have been computed on an FTE basis using a tax rate of 34%. Our auction rate money market preferred is a long term floating rate instrument for which the interest rate is set at periodic auctions. At each successful auction, we have the option to sell the security at par value. Additionally, the issuers of auction rate securities generally have the right to redeem or refinance the debt. Because of their lack of contractual maturities, auction rate money market preferred and preferred stocks are not reported by a specific maturity group. Mortgage-backed securities and collateralized mortgage obligations are not reported by a specific maturity group due to their variable monthly payments. Expected maturities may differ from contractual maturities because issuers may have the right to call or prepay obligations.
Maturing | |||||||||||||||||||||||||||||
Within One Year | After One Year But Within Five Years | After Five Years But Within Ten Years | After Ten Years | Securities with Variable Monthly Payments or Noncontractual Maturities | |||||||||||||||||||||||||
Amount | Yield (%) | Amount | Yield (%) | Amount | Yield (%) | Amount | Yield (%) | Amount | Yield (%) | ||||||||||||||||||||
Government sponsored enterprises | $ | 32 | 7.91 | $ | 9,936 | 2.01 | $ | 291 | 2.05 | $ | — | — | $ | — | — | ||||||||||||||
States and political subdivisions | 27,672 | 2.25 | 72,622 | 4.52 | 84,408 | 4.18 | 28,217 | 4.72 | — | — | |||||||||||||||||||
Mortgage-backed securities | — | — | — | — | — | — | — | — | 227,256 | 2.34 | |||||||||||||||||||
Collateralized mortgage obligations | — | — | — | — | — | — | — | — | 101,443 | 2.38 | |||||||||||||||||||
Auction rate money market preferred | — | — | — | — | — | — | — | — | 2,794 | 6.29 | |||||||||||||||||||
Preferred stocks | — | — | — | — | — | — | — | — | 3,425 | 5.44 | |||||||||||||||||||
Total | $ | 27,704 | 2.26 | $ | 82,558 | 4.22 | $ | 84,699 | 4.17 | $ | 28,217 | 4.72 | $ | 334,918 | 2.42 | ||||||||||||||
27
Loans
Loans are the largest component of earning assets. The proper management of credit and market risk inherent in the loan portfolio is critical to our financial well-being. To control these risks, we have adopted strict underwriting standards which include lending limits to a single borrower, strict loan to collateral value limits, and a defined market area. We also monitor and limit loan concentrations to specific industries. We have no foreign loans and there were no concentrations greater than 10% of total loans that are not disclosed as a separate category in the following table.
The following table presents the composition of the loan portfolio for the years ended December 31:
2016 | 2015 | 2014 | 2013 | 2012 | |||||||||||||||
Commercial | $ | 575,664 | $ | 448,381 | $ | 433,270 | $ | 393,164 | $ | 372,332 | |||||||||
Agricultural | 126,492 | 115,911 | 104,721 | 92,589 | 83,606 | ||||||||||||||
Residential real estate | 266,050 | 251,501 | 266,155 | 291,499 | 285,070 | ||||||||||||||
Consumer | 42,409 | 34,699 | 32,404 | 33,525 | 33,619 | ||||||||||||||
Total | $ | 1,010,615 | $ | 850,492 | $ | 836,550 | $ | 810,777 | $ | 774,627 | |||||||||
The following table presents the change in the loan portfolio categories for the years ended December 31:
2016 | 2015 | 2014 | ||||||||||||||||||
$ Change | % Change | $ Change | % Change | $ Change | % Change | |||||||||||||||
Commercial | $ | 127,283 | 28.39 | % | $ | 15,111 | 3.49 | % | $ | 40,106 | 10.20 | % | ||||||||
Agricultural | 10,581 | 9.13 | % | 11,190 | 10.69 | % | 12,132 | 13.10 | % | |||||||||||
Residential real estate | 14,549 | 5.78 | % | (14,654 | ) | (5.51 | )% | (25,344 | ) | (8.69 | )% | |||||||||
Consumer | 7,710 | 22.22 | % | 2,295 | 7.08 | % | (1,121 | ) | (3.34 | )% | ||||||||||
Total | $ | 160,123 | 18.83 | % | $ | 13,942 | 1.67 | % | $ | 25,773 | 3.18 | % | ||||||||
While competition for commercial loans continues to be strong, we experienced significant growth in this segment of the portfolio during 2016 and anticipate strong growth in 2017. Residential real estate and consumer loans increased during 2016 and we anticipate continued growth in 2017 as a result of initiatives implemented during 2016 designed to increase loan volume.
Equity securities without readily determinable fair values
Included in equity securities without readily determinable fair values are restricted securities, which are carried at cost and investments in unconsolidated entities accounted for under the equity method of accounting (see “Note 1 – Nature of Operations and Summary of Significant Accounting Policies” and “Note 20 – Fair Value” of the “Notes to Consolidated Financial Statements” in Item 8. Financial Statements and Supplementary Data).
Deposits
Deposits are our primary source of funding. The following table presents the composition of the deposit portfolio as of December 31:
2016 | 2015 | 2014 | 2013 | 2012 | |||||||||||||||
Noninterest bearing demand deposits | $ | 205,071 | $ | 191,376 | $ | 181,826 | $ | 158,428 | $ | 143,735 | |||||||||
Interest bearing demand deposits | 209,325 | 212,666 | 190,984 | 192,089 | 181,259 | ||||||||||||||
Savings deposits | 347,230 | 337,641 | 261,412 | 243,237 | 228,338 | ||||||||||||||
Certificates of deposit | 321,914 | 324,101 | 339,824 | 362,473 | 376,790 | ||||||||||||||
Brokered certificates of deposit | 88,632 | 73,815 | 72,134 | 56,329 | 55,348 | ||||||||||||||
Internet certificates of deposit | 22,868 | 24,964 | 28,304 | 31,210 | 32,197 | ||||||||||||||
Total | $ | 1,195,040 | $ | 1,164,563 | $ | 1,074,484 | $ | 1,043,766 | $ | 1,017,667 | |||||||||
28
The following table presents the change in the deposit categories for the years ended December 31:
2016 | 2015 | 2014 | ||||||||||||||||||
$ Change | % Change | $ Change | % Change | $ Change | % Change | |||||||||||||||
Noninterest bearing demand deposits | $ | 13,695 | 7.16 | % | $ | 9,550 | 5.25 | % | $ | 23,398 | 14.77 | % | ||||||||
Interest bearing demand deposits | (3,341 | ) | (1.57 | )% | 21,682 | 11.35 | % | (1,105 | ) | (0.58 | )% | |||||||||
Savings deposits | 9,589 | 2.84 | % | 76,229 | 29.16 | % | 18,175 | 7.47 | % | |||||||||||
Certificates of deposit | (2,187 | ) | (0.67 | )% | (15,723 | ) | (4.63 | )% | (22,649 | ) | (6.25 | )% | ||||||||
Brokered certificates of deposit | 14,817 | 20.07 | % | 1,681 | 2.33 | % | 15,805 | 28.06 | % | |||||||||||
Internet certificates of deposit | (2,096 | ) | (8.40 | )% | (3,340 | ) | (11.80 | )% | (2,906 | ) | (9.31 | )% | ||||||||
Total | $ | 30,477 | 2.62 | % | $ | 90,079 | 8.38 | % | $ | 30,718 | 2.94 | % | ||||||||
Deposit demand continues to be driven by non-contractual deposits, such as demand and savings deposits, while certificates of deposit and Internet certificates of deposit have gradually declined. Our significant growth in savings deposits during 2015 was the result of branch acquisitions. We look to retain and attract new customers with the recent branch acquisitions to provide growth in deposits in future periods. Brokered certificates of deposit offer another source of funding and fluctuate from period-to-period based on our funding needs, including changes in assets such as loans and investments.
The remaining maturity of time certificates and other time deposits of $100 or more as of December 31, 2016 was as follows:
Maturity | |||
Within 3 months | $ | 39,898 | |
Within 3 to 6 months | 14,352 | ||
Within 6 to 12 months | 56,191 | ||
Over 12 months | 149,984 | ||
Total | $ | 260,425 | |
Borrowed Funds
Borrowed funds include FHLB advances and securities sold under agreements to repurchase. The balance of borrowed funds fluctuates from period-to-period based on our funding needs including changes in loans, investments, and deposits. To provide balance sheet growth, we utilize borrowings and brokered deposits to fund earning assets.
The following table presents borrowed funds balances for the years ended December 31:
2016 | 2015 | 2014 | 2013 | 2012 | |||||||||||||||
FHLB advances | $ | 270,000 | $ | 235,000 | $ | 192,000 | $ | 162,000 | $ | 152,000 | |||||||||
Securities sold under agreements to repurchase without stated maturity dates | 60,894 | 70,532 | 95,070 | 106,025 | 66,147 | ||||||||||||||
Securities sold under agreements to repurchase with stated maturity dates | — | — | 439 | 11,301 | 16,284 | ||||||||||||||
Federal funds purchased | 6,800 | 4,200 | 2,200 | — | 6,570 | ||||||||||||||
Total | $ | 337,694 | $ | 309,732 | $ | 289,709 | $ | 279,326 | $ | 241,001 | |||||||||
For additional disclosure related to borrowed funds, see “Note 10 – Borrowed Funds” of “Notes to Consolidated Financial Statements” in Item 8. Financial Statements and Supplementary Data.
Accrued interest payable and other liabilities
Included in accrued interest payable and other liabilities are obligations related to our defined benefit pension plan and obligations related to other employee benefits. For more information on the defined benefit pension plan and other employee benefits, see "Note 17 – Benefit Plans" of the “Notes to Consolidated Financial Statements” in Item 8. Financial Statements and Supplementary Data.
29
Contractual Obligations and Loan Commitments
We have various financial obligations, including contractual obligations and commitments, which may require future cash payments. The following schedule summarizes our non-cancelable obligations and future minimum payments as of December 31, 2016:
Minimum Payments Due by Period | |||||||||||||||||||
Due in One Year or Less | After One Year But Within Three Years | After Three Years But Within Five Years | After Five Years | Total | |||||||||||||||
Deposits | |||||||||||||||||||
Deposits with no stated maturity | $ | 761,626 | $ | — | $ | — | $ | — | $ | 761,626 | |||||||||
Certificates of deposit with stated maturities | 196,467 | 127,159 | 84,907 | 24,881 | 433,414 | ||||||||||||||
Total deposits | 958,093 | 127,159 | 84,907 | 24,881 | 1,195,040 | ||||||||||||||
Borrowed funds | |||||||||||||||||||
Short-term borrowings | 67,694 | — | — | — | 67,694 | ||||||||||||||
Long-term borrowings | 70,000 | 110,000 | 70,000 | 20,000 | 270,000 | ||||||||||||||
Total borrowed funds | 137,694 | 110,000 | 70,000 | 20,000 | 337,694 | ||||||||||||||
Total contractual obligations | $ | 1,095,787 | $ | 237,159 | $ | 154,907 | $ | 44,881 | $ | 1,532,734 | |||||||||
We also have loan commitments that may impact liquidity. The following schedule summarizes our loan commitments and expiration dates by period as of December 31, 2016. Commitments to grant loans include residential mortgage loans with the majority being loans committed to be sold to the secondary market. Since many of these commitments historically have expired without being drawn upon, the total amount of these commitments does not necessarily represent our future cash requirements.
Expiration Dates by Period | |||||||||||||||||||
Due in One Year or Less | After One Year But Within Three Years | After Three Years But Within Five Years | After Five Years | Total | |||||||||||||||
Unused commitments under lines of credit | $ | 85,112 | $ | 55,992 | $ | 16,749 | $ | 10,987 | $ | 168,840 | |||||||||
Commitments to grant loans | 29,339 | — | — | — | 29,339 | ||||||||||||||
Commercial and standby letters of credit | 1,223 | — | — | — | 1,223 | ||||||||||||||
Total loan commitments | $ | 115,674 | $ | 55,992 | $ | 16,749 | $ | 10,987 | $ | 199,402 | |||||||||
For additional disclosure related to Contractual Obligations and Loan Commitments, see “Note 13 – Off-Balance-Sheet Activities” of the “Notes to Consolidated Financial Statements” in Item 8. Financial Statements and Supplementary Data.
Capital
Capital consists solely of common stock, retained earnings, and accumulated other comprehensive income (loss). We are authorized to raise capital through dividend reinvestment, employee and director stock purchases, and shareholder stock purchases. Pursuant to these authorizations, we issued 179,903 shares or $5,023 of common stock during 2016, and 216,700 shares or $5,201 of common stock in 2015. We also offer the Directors Plan in which participants either directly purchase stock or purchase stock units through deferred fees, in lieu of cash payments. Pursuant to this plan, we increased shareholders’ equity by $573 and $550 during 2016 and 2015, respectively.
We have a publicly announced common stock repurchase plan. Pursuant to this plan, we repurchased 158,701 shares or $4,440 of common stock during 2016 and 193,107 shares or $4,590 during 2015. As of December 31, 2016, we were authorized to repurchase up to an additional 199,957 shares of common stock.
The FRB has established minimum risk based capital guidelines. Pursuant to these guidelines, a framework has been established that assigns risk weights to each category of on and off-balance-sheet items to arrive at risk adjusted total assets. Regulatory capital is divided by the risk adjusted assets with the resulting ratio compared to the minimum standard to determine whether a corporation has adequate capital. On July 2, 2013, the FRB published revised BASEL III Capital standards for banks. The final rules redefine what is included or deducted from equity capital, changes risk weighting for certain on and
30
off-balance sheet assets, increases the minimum required equity capital to be considered well capitalized, and introduces a capital conservation buffer. The rules, which are being gradually phased in between 2015 and 2019, are not expected to have a material impact on the Corporation but will require us to hold more capital than we have historically.
There are no significant regulatory constraints placed on our capital. The FRB’s current recommended minimum primary capital to assets requirement is 6.00%. Our primary capital to adjusted average assets, or tier 1 leverage ratio, was 8.56% as of December 31, 2016.
Effective January 1, 2015, the minimum standard for primary, or Tier 1, capital increased from 4.00% to 6.00%. The minimum standard for total capital remained at 8.00%. Also effective January 1, 2015 was the new common equity tier 1 capital ratio which had a minimum requirement of 4.50%. Beginning on January 1, 2016, the capital conservation buffer went into effect which further increased the required levels. The following table sets forth the percentages required under the Risk Based Capital guidelines and our values as of December 31:
2016 | 2015 | ||||||||||
Actual | Required | Actual | Required | ||||||||
Common equity tier 1 capital | 12.39 | % | 5.125 | % | 13.44 | % | 4.50 | % | |||
Tier 1 capital | 12.39 | % | 6.625 | % | 13.44 | % | 6.00 | % | |||
Tier 2 capital | 0.65 | % | 2.000 | % | 0.73 | % | 2.00 | % | |||
Total Capital | 13.04 | % | 8.625 | % | 14.17 | % | 8.00 | % | |||
Tier 2 capital, or secondary capital, includes only the ALLL. The percentage for the secondary capital under the required column is the maximum amount allowed from all sources.
The FRB and FDIC also prescribe minimum capital requirements for Isabella Bank. At December 31, 2016, the Bank exceeded these minimum capital requirements. For further information regarding the Bank’s capital requirements, see “Note 16 – Minimum Regulatory Capital Requirements” of the “Notes to Consolidated Financial Statements” in Item 8. Financial Statements and Supplementary Data.
Fair Value
We utilize fair value measurements to record fair value adjustments to certain assets and liabilities and to determine fair value disclosures. AFS securities and certain liabilities are recorded at fair value on a recurring basis. Additionally, from time-to-time, we may be required to record at fair value other assets on a nonrecurring basis, such as mortgage loans AFS, impaired loans, foreclosed assets, OMSR, and certain other assets and liabilities. These nonrecurring fair value adjustments typically involve the application of lower of cost or market accounting or write-downs of individual assets.
For further information regarding fair value measurements, see “Note 1 – Nature of Operations and Summary of Significant Accounting Policies” and “Note 20 – Fair Value” of the “Notes to Consolidated Financial Statements” in Item 8. Financial Statements and Supplementary Data.
Interest Rate Sensitivity
Interest rate sensitivity is determined by the amount of earning assets and interest bearing liabilities repricing within a specific time period, and their relative sensitivity to a change in interest rates. We strive to achieve reasonable stability in the net interest margin through periods of changing interest rates. One tool we use to measure interest rate sensitivity is gap analysis. As shown in the following table, the gap analysis depicts our position for specific time periods and the cumulative gap as a percentage of total assets.
Fixed interest rate AFS securities are scheduled according to their contractual maturity. Fixed rate loans are included in the appropriate time frame based on their scheduled amortization. Variable rate loans, which totaled $212,240 as of December 31, 2016, are included in the time frame of their earliest repricing. Time deposit liabilities are scheduled based on their contractual maturity except for variable rate time deposits in the amount of $2,988 that are included in the 0 to 3 month time frame.
Savings and NOW accounts have no contractual maturity date and are believed by us to be predominantly noninterest rate sensitive. These accounts have been classified in the gap table according to their estimated withdrawal rates based upon our analysis of deposit decay over the past five years. We believe this decay experience is consistent with our expectation for the future. As of December 31, 2016, we had a positive cumulative gap within one year. A positive gap position results when more assets, within a specified time frame, have the potential to mature or reprice than liabilities.
31
The following table shows the time periods and the amount of assets and liabilities available for interest rate repricing as of December 31, 2016. The interest rate sensitivity information for investment securities is based on the expected prepayments and call dates versus stated maturities. For purposes of this analysis, nonaccrual loans and the ALLL are excluded.
0 to 3 Months | 4 to 12 Months | 1 to 5 Years | Over 5 Years | ||||||||||||
Interest sensitive assets | |||||||||||||||
AFS securities | $ | 27,546 | $ | 86,701 | $ | 266,277 | $ | 177,572 | |||||||
Loans | 279,954 | 91,190 | 439,251 | 199,160 | |||||||||||
Total | $ | 307,500 | $ | 177,891 | $ | 705,528 | $ | 376,732 | |||||||
Interest sensitive liabilities | |||||||||||||||
Borrowed funds | $ | 97,694 | $ | 40,000 | $ | 180,000 | $ | 20,000 | |||||||
Time deposits | 68,705 | 129,672 | 210,156 | 24,881 | |||||||||||
Savings | 46,418 | 26,878 | 105,675 | 168,259 | |||||||||||
NOW | 2,919 | 8,757 | 40,325 | 157,324 | |||||||||||
Total | $ | 215,736 | $ | 205,307 | $ | 536,156 | $ | 370,464 | |||||||
Cumulative gap | $ | 91,764 | $ | 64,348 | $ | 233,720 | $ | 239,988 | |||||||
Cumulative gap as a % of assets | 5.30 | % | 3.71 | % | 13.49 | % | 13.85 | % | |||||||
The following table shows the maturity of commercial and agricultural loans outstanding at December 31, 2016. Also provided are the amounts due after one year, classified according to the sensitivity to changes in interest rates.
1 Year or Less | 1 to 5 Years | Over 5 Years | Total | ||||||||||||
Commercial and agricultural | $ | 115,973 | $ | 363,221 | $ | 222,962 | $ | 702,156 | |||||||
Interest sensitivity | |||||||||||||||
Loans maturing after one year that have: | |||||||||||||||
Fixed interest rates | $ | 300,999 | $ | 215,298 | |||||||||||
Variable interest rates | 62,222 | 7,664 | |||||||||||||
Total | $ | 363,221 | $ | 222,962 | |||||||||||
32
Liquidity
Liquidity is monitored regularly by our Market Risk Committee, which consists of members of senior management. The committee reviews projected cash flows, key ratios, and liquidity available from both primary and secondary sources.
Our primary sources of liquidity are cash and cash equivalents and unencumbered AFS securities. These categories totaled $307,112 or 17.73% of assets as of December 31, 2016 as compared to $387,707 or 23.24% as of December 31, 2015. Liquidity is important for financial institutions because of their need to meet loan funding commitments, depositor withdrawal requests, and various other commitments including expansion of operations, investment opportunities, and payment of cash dividends. Liquidity varies significantly daily, based on customer activity.
Our primary source of funds is deposit accounts. We also have the ability to borrow from the FHLB, the FRB, and through various correspondent banks in the form of federal funds purchased and a line of credit. These funding methods typically carry a higher interest rate than traditional market deposit accounts. Some borrowed funds, including FHLB advances, FRB Discount Window advances, and repurchase agreements, require us to pledge assets, typically in the form of AFS securities or loans as collateral. As of December 31, 2016, we had available lines of credit of $99,118.
The following table summarizes our sources and uses of cash for the years ended December 31:
2016 | 2015 | $ Variance | |||||||||
Net cash provided by (used in) operating activities | $ | 19,162 | $ | 12,090 | $ | 7,072 | |||||
Net cash provided by (used in) investing activities | (68,831 | ) | (113,499 | ) | 44,668 | ||||||
Net cash provided by (used in) financing activities | 50,994 | 103,072 | (52,078 | ) | |||||||
Increase (decrease) in cash and cash equivalents | 1,325 | 1,663 | (338 | ) | |||||||
Cash and cash equivalents January 1 | 21,569 | 19,906 | 1,663 | ||||||||
Cash and cash equivalents December 31 | $ | 22,894 | $ | 21,569 | $ | 1,325 | |||||
Market Risk
Our primary market risks are interest rate risk and liquidity risk. We have no significant foreign exchange risk, except for interest rate locks and forward loan commitments, in the management of IRR. Any changes in foreign exchange rates or commodity prices would not have a significant impact on our interest income and cash flows.
IRR is the exposure of our net interest income to changes in interest rates. IRR results from the difference in the maturity or repricing frequency of a financial institution's interest earning assets and its interest bearing liabilities. IRR is the fundamental method by which financial institutions earn income and create shareholder value. Excessive exposure to IRR could pose a significant risk to our earnings and capital.
The FRB has adopted a policy requiring us to effectively manage the various risks that can have a material impact on our safety and soundness. The risks include credit, interest rate, liquidity, operational, and reputational. We have policies, procedures, and internal controls for measuring and managing these risks. Specifically, our Funds Management policy and procedures include defining acceptable types and terms of investments and funding sources, liquidity requirements, limits on investments in long term assets, limiting the mismatch in repricing opportunity of assets and liabilities, and the frequency of measuring and reporting to our Board.
The primary technique to measure IRR is simulation analysis. Simulation analysis forecasts the effects on the balance sheet structure and net interest income under a variety of scenarios that incorporate changes in interest rates, the shape of yield curves, interest rate relationships, loan prepayments, and changes in funding sources. These forecasts are compared against net interest income projected in a stable interest rate environment. While many assets and liabilities reprice either at maturity or in accordance with their contractual terms, several balance sheet components demonstrate characteristics that require an evaluation to more accurately reflect their repricing behavior. Key assumptions in the simulation analysis include prepayments on loans, probable calls of investment securities, changes in market conditions, loan volumes and loan pricing, deposit sensitivity, and customer preferences. These assumptions are inherently uncertain as they are subject to fluctuation and revision in a dynamic environment. As a result, the simulation analysis cannot precisely forecast the impact of rising and falling interest rates on net interest income. Actual results will differ from simulated results due to many other factors, including changes in balance sheet components, interest rate changes, changes in market conditions, and management strategies.
33
Our interest rate sensitivity is estimated by first forecasting the next 12 and 24 months of net interest income under an assumed environment of a constant balance sheet and constant market interest rates (base case). We then compare the results of various simulation analyses to the base case. At December 31, 2016, we projected the change in net interest income during the next 12 and 24 months assuming market interest rates were to immediately decrease by 100 basis points and increase by 100, 200, 300, and 400 basis points in a parallel fashion over the entire yield curve during the same time period. We did not project scenarios showing decreases in interest rates beyond 100 basis points as this is considered extremely unlikely given current interest rate levels. These projections were based on our assets and liabilities remaining static over the next 12 and 24 months, while factoring in probable calls and prepayments of certain investment securities and real estate residential and consumer loans. While it is extremely unlikely that interest rates would immediately increase to these levels, we feel that these extreme scenarios help us identify potential gaps and mismatches in the repricing characteristics of assets and liabilities. We regularly monitor our projected net interest income sensitivity to ensure that it remains within established limits. As of December 31, 2016, our interest rate sensitivity results were within Board approved limits.
The following tables summarize our interest rate sensitivity for 12 and 24 months as of:
December 31, 2016 | |||||||||||||||||||||||||||||
12 Months | 24 Months | ||||||||||||||||||||||||||||
Immediate basis point change assumption (short-term) | -100 | +100 | +200 | +300 | +400 | -100 | +100 | +200 | +300 | +400 | |||||||||||||||||||
Percent change in net interest income vs. constant rates | (4.49 | )% | 2.19 | % | 4.31 | % | 5.68 | % | 6.67 | % | (5.32 | )% | 2.64 | % | 5.01 | % | 6.33 | % | 6.75 | % | |||||||||
December 31, 2015 | |||||||||||||||||||||||||||||
12 Months | 24 Months | ||||||||||||||||||||||||||||
Immediate basis point change assumption (short-term) | -100 | +100 | +200 | +300 | +400 | -100 | +100 | +200 | +300 | +400 | |||||||||||||||||||
Percent change in net interest income vs. constant rates | (2.08 | )% | 1.27 | % | 2.00 | % | 2.11 | % | 2.23 | % | (1.77 | )% | 2.00 | % | 3.47 | % | 4.02 | % | 4.39 | % | |||||||||
Gap analysis, the secondary method to measure IRR, measures the cash flows and/or the earliest repricing of our interest bearing assets and liabilities. This analysis is useful for measuring trends in the repricing characteristics of the balance sheet. Significant assumptions are required in this process because of the embedded repricing options contained in assets and liabilities. Residential real estate and consumer loans allow the borrower to repay the balance prior to maturity without penalty, while commercial and agricultural loans have prepayment penalties. The amount of prepayments is dependent upon many factors, including the interest rate of a given loan in comparison to the current offering rates, the level of sales of used homes, and the overall availability of credit in the market place. Generally, a decrease in interest rates will result in an increase in cash flows from these assets. A significant portion of our securities are callable or have prepayment options. The call and prepayment options are more likely to be exercised in a period of decreasing interest rates. Savings and demand accounts may generally be withdrawn on request without prior notice. The timing of cash flows from these deposits is estimated based on historical experience. Certificates of deposit have penalties that discourage early withdrawals.
34
The following tables provide information about assets and liabilities that are sensitive to changes in interest rates as of December 31, 2016 and December 31, 2015. The principal amounts of investments, loans, other interest earning assets, borrowings, and time deposits maturing were calculated based on the contractual maturity dates. Estimated cash flows for savings and NOW accounts are based on our estimated deposit decay rates.
December 31, 2016 | |||||||||||||||||||||||||||||||
2017 | 2018 | 2019 | 2020 | 2021 | Thereafter | Total | Fair Value | ||||||||||||||||||||||||
Rate sensitive assets | |||||||||||||||||||||||||||||||
Other interest bearing assets | $ | 2,727 | $ | — | $ | — | $ | — | $ | — | $ | — | $ | 2,727 | $ | 2,727 | |||||||||||||||
Average interest rates | 0.34 | % | — | — | — | — | — | 0.34 | % | ||||||||||||||||||||||
AFS securities | $ | 114,247 | $ | 71,220 | $ | 64,931 | $ | 63,150 | $ | 66,976 | $ | 177,572 | $ | 558,096 | $ | 558,096 | |||||||||||||||
Average interest rates | 2.35 | % | 2.38 | % | 2.45 | % | 2.64 | % | 2.57 | % | 2.50 | % | 2.47 | % | |||||||||||||||||
Fixed interest rate loans (1) | $ | 159,964 | $ | 115,741 | $ | 103,514 | $ | 107,185 | $ | 112,811 | $ | 199,160 | $ | 798,375 | $ | 778,769 | |||||||||||||||
Average interest rates | 4.15 | % | 4.25 | % | 4.34 | % | 4.16 | % | 4.15 | % | 4.10 | % | 4.18 | % | |||||||||||||||||
Variable interest rate loans (1) | $ | 69,024 | $ | 29,179 | $ | 38,248 | $ | 16,179 | $ | 23,632 | $ | 35,978 | $ | 212,240 | $ | 212,240 | |||||||||||||||
Average interest rates | 4.83 | % | 4.32 | % | 4.16 | % | 3.62 | % | 3.74 | % | 3.86 | % | 4.26 | % | |||||||||||||||||
Rate sensitive liabilities | |||||||||||||||||||||||||||||||
Fixed rate borrowed funds | $ | 137,694 | $ | 50,000 | $ | 60,000 | $ | 10,000 | $ | 50,000 | $ | 20,000 | $ | 327,694 | $ | 326,975 | |||||||||||||||
Average interest rates | 0.83 | % | 2.16 | % | 1.99 | % | 1.98 | % | 1.91 | % | 2.54 | % | 1.55 | % | |||||||||||||||||
Variable rate borrowed funds | $ | — | $ | — | $ | — | $ | — | $ | 10,000 | $ | — | $ | 10,000 | $ | 10,000 | |||||||||||||||
Average interest rates | — | — | — | — | 1.21 | % | — | 1.21 | % | ||||||||||||||||||||||
Savings and NOW accounts | $ | 84,972 | $ | 42,596 | $ | 38,220 | $ | 34,326 | $ | 30,858 | $ | 325,583 | $ | 556,555 | $ | 556,555 | |||||||||||||||
Average interest rates | 0.57 | % | 0.12 | % | 0.11 | % | 0.11 | % | 0.11 | % | 0.11 | % | 0.18 | % | |||||||||||||||||
Fixed interest rate certificates of deposit | $ | 195,389 | $ | 80,139 | $ | 45,110 | $ | 33,929 | $ | 50,978 | $ | 24,881 | $ | 430,426 | $ | 427,100 | |||||||||||||||
Average interest rates | 0.86 | % | 1.18 | % | 1.35 | % | 1.58 | % | 1.68 | % | 1.84 | % | 1.18 | % | |||||||||||||||||
Variable interest rate certificates of deposit | $ | 1,078 | $ | 1,910 | $ | — | $ | — | $ | — | $ | — | $ | 2,988 | $ | 2,988 | |||||||||||||||
Average interest rates | 0.62 | % | 0.99 | % | — | — | — | — | 0.85 | % | |||||||||||||||||||||
December 31, 2015 | |||||||||||||||||||||||||||||||
2016 | 2017 | 2018 | 2019 | 2020 | Thereafter | Total | Fair Value | ||||||||||||||||||||||||
Rate sensitive assets | |||||||||||||||||||||||||||||||
Other interest bearing assets | $ | 2,659 | $ | 100 | $ | — | $ | — | $ | — | $ | — | $ | 2,759 | $ | 2,758 | |||||||||||||||
Average interest rates | 0.23 | % | 0.35 | % | — | — | — | — | 0.24 | % | |||||||||||||||||||||
AFS securities | $ | 148,692 | $ | 120,692 | $ | 81,726 | $ | 73,541 | $ | 71,083 | $ | 164,402 | $ | 660,136 | $ | 660,136 | |||||||||||||||
Average interest rates | 2.16 | % | 2.11 | % | 2.18 | % | 2.25 | % | 2.37 | % | 2.43 | % | 2.25 | % | |||||||||||||||||
Fixed interest rate loans (1) | $ | 116,143 | $ | 130,873 | $ | 103,265 | $ | 83,457 | $ | 91,436 | $ | 156,784 | $ | 681,958 | $ | 670,864 | |||||||||||||||
Average interest rates | 4.56 | % | 4.42 | % | 4.27 | % | 4.36 | % | 4.18 | % | 4.28 | % | 4.35 | % | |||||||||||||||||
Variable interest rate loans (1) | $ | 61,672 | $ | 24,289 | $ | 24,359 | $ | 14,398 | $ | 16,842 | $ | 26,974 | $ | 168,534 | $ | 168,534 | |||||||||||||||
Average interest rates | 4.08 | % | 4.12 | % | 4.19 | % | 3.45 | % | 3.40 | % | 3.69 | % | 3.92 | % | |||||||||||||||||
Rate sensitive liabilities | |||||||||||||||||||||||||||||||
Fixed rate borrowed funds | $ | 104,732 | $ | 50,000 | $ | 50,000 | $ | 40,000 | $ | 10,000 | $ | 40,000 | $ | 294,732 | $ | 297,495 | |||||||||||||||
Average interest rates | 0.47 | % | 1.56 | % | 2.16 | % | 2.35 | % | 1.98 | % | 2.67 | % | 1.55 | % | |||||||||||||||||
Variable rate borrowed funds | $ | 15,000 | $ | — | $ | — | $ | — | $ | — | $ | — | $ | 15,000 | $ | 15,000 | |||||||||||||||
Average interest rates | 0.62 | % | — | — | — | — | — | 0.62 | % | ||||||||||||||||||||||
Savings and NOW accounts | $ | 80,242 | $ | 42,064 | $ | 37,773 | $ | 33,950 | $ | 30,548 | $ | 325,730 | $ | 550,307 | $ | 550,307 | |||||||||||||||
Average interest rates | 0.59 | % | 0.11 | % | 0.11 | % | 0.11 | % | 0.11 | % | 0.11 | % | 0.18 | % | |||||||||||||||||
Fixed interest rate certificates of deposit | $ | 190,500 | $ | 89,689 | $ | 63,167 | $ | 23,883 | $ | 33,012 | $ | 21,028 | $ | 421,279 | $ | 419,828 | |||||||||||||||
Average interest rates | 0.92 | % | 1.26 | % | 1.27 | % | 1.50 | % | 1.59 | % | 1.84 | % | 1.18 | % | |||||||||||||||||
Variable interest rate certificates of deposit | $ | 1,358 | $ | 243 | $ | — | $ | — | $ | — | $ | — | $ | 1,601 | $ | 1,601 | |||||||||||||||
Average interest rates | 0.49 | % | 0.40 | % | — | — | — | — | 0.48 | % | |||||||||||||||||||||
(1) The fair value reported is exclusive of the allocation of the ALLL.
We do not believe that there has been a material change in the nature or categories of our primary market risk exposure, or the particular markets that present the primary risk of loss. As of the date of this report, we do not know of or expect there to be any material change in the general nature of our primary market risk exposure in the near term. As of the date of this report, we
35
do not expect to make material changes in those methods in the near term. We may change those methods in the future to adapt to changes in circumstances or to implement new techniques.
Item 7A. Quantitative and Qualitative Disclosures About Market Risk.
The information presented in the section captioned “Market Risk” in Item 7. Management's Discussion and Analysis of Financial Condition and Results of Operations is incorporated herein by reference.
Item 8. Financial Statements and Supplementary Data.
The following consolidated financial statements accompanied by the report of our independent registered public accounting firm are set forth beginning on page 37 of this report:
Report of Independent Registered Public Accounting Firm |
Consolidated Balance Sheets |
Consolidated Statements of Changes in Shareholders’ Equity |
Consolidated Statements of Income |
Consolidated Statements of Comprehensive Income (Loss) |
Consolidated Statements of Cash Flows |
Notes to Consolidated Financial Statements |
Supplementary data regarding quarterly results of operations is included in Item 6. Selected Financial Data.
36
Report of Independent Registered Public Accounting Firm
Shareholders and Board of Directors
Isabella Bank Corporation
Mount Pleasant, Michigan
We have audited the accompanying consolidated balance sheets of Isabella Bank Corporation as of December 31, 2016 and 2015, and the related consolidated statements of changes in shareholders’ equity, income, comprehensive income, and cash flows for each of the years in the three-year period ended December 31, 2016. We also have audited Isabella Bank Corporation’s internal control over financial reporting as of December 31, 2016, based on criteria established in the Internal Control-Integrated Framework issued by the Committee of Sponsoring Organizations of the Treadway Commission (2013 framework) (the COSO criteria). Isabella Bank Corporation’s management is responsible for these consolidated financial statements, for maintaining effective internal control over financial reporting, and for its assessment of the effectiveness of internal control over financial reporting. Our responsibility is to express an opinion on these consolidated financial statements and an opinion on the effectiveness of Isabella Bank Corporation’s internal control over financial reporting, based on our audits.
We conducted our audits in accordance with the standards of the Public Company Accounting Oversight Board (United States). Those standards require that we plan and perform the audits to obtain reasonable assurance about whether the consolidated financial statements are free of material misstatement and whether effective internal control over financial reporting was maintained in all material respects. Our audits of the consolidated financial statements included examining, on a test basis, evidence supporting the amounts and disclosures in the consolidated financial statements, assessing the accounting principles used and significant estimates made by management, and evaluating the overall financial statement presentation. Our audit of internal control over financial reporting included obtaining an understanding of internal control over financial reporting, assessing the risk that a material misstatement exists, and testing and evaluating the design and operating effectiveness of internal control based on the assessed risk. We believe that our audits provide a reasonable basis for our opinion.
A corporation’s internal control over financial reporting is a process designed to provide reasonable assurance regarding the reliability of financial reporting and the preparation of consolidated financial statements for external purposes in accordance with generally accepted accounting principles. A corporation’s internal control over financial reporting includes those policies and procedures that (1) pertain to the maintenance of records that, in reasonable detail, accurately and fairly reflect the transactions and dispositions of the assets of the corporation; (2) provide reasonable assurance that transactions are recorded as necessary to permit preparation of consolidated financial statements in accordance with generally accepted accounting principles, and that receipts and expenditures of the corporation are being made only in accordance with authorizations of management and directors of the corporation; and (3) provide reasonable assurance regarding prevention or timely detection of unauthorized acquisition, use, or disposition of the corporation’s assets that could have a material effect on the consolidated financial statements.
Because of its inherent limitations, internal control over financial reporting may not prevent or detect misstatements. Also, projections of any evaluation of effectiveness to future periods are subject to the risk that controls may become inadequate because of changes in conditions, or that the degree of compliance with the policies or procedures may deteriorate.
In our opinion, the consolidated financial statements referred to above present fairly, in all material respects, the consolidated financial position of Isabella Bank Corporation as of December 31, 2016 and 2015, and the consolidated results of their operations and their cash flows for each of the years in the three-year period ended December 31, 2016 in conformity with accounting principles generally accepted in the United States of America. Also, in our opinion Isabella Bank Corporation maintained, in all material respects, effective internal control over financial reporting as of December 31, 2016, based on the COSO criteria.
/s/Rehmann Robson LLC
Saginaw, Michigan
March 7, 2017
37
CONSOLIDATED BALANCE SHEETS
(Dollars in thousands)
December 31 | |||||||
2016 | 2015 | ||||||
ASSETS | |||||||
Cash and cash equivalents | |||||||
Cash and demand deposits due from banks | $ | 20,167 | $ | 18,810 | |||
Interest bearing balances due from banks | 2,727 | 2,759 | |||||
Total cash and cash equivalents | 22,894 | 21,569 | |||||
AFS securities (amortized cost of $557,648 in 2016 and $654,348 in 2015) | 558,096 | 660,136 | |||||
Mortgage loans AFS | 1,816 | 1,187 | |||||
Loans | |||||||
Commercial | 575,664 | 448,381 | |||||
Agricultural | 126,492 | 115,911 | |||||
Residential real estate | 266,050 | 251,501 | |||||
Consumer | 42,409 | 34,699 | |||||
Gross loans | 1,010,615 | 850,492 | |||||
Less allowance for loan and lease losses | 7,400 | 7,400 | |||||
Net loans | 1,003,215 | 843,092 | |||||
Premises and equipment | 29,314 | 28,331 | |||||
Corporate owned life insurance policies | 26,300 | 26,423 | |||||
Accrued interest receivable | 6,580 | 6,269 | |||||
Equity securities without readily determinable fair values | 21,694 | 22,286 | |||||
Goodwill and other intangible assets | 48,666 | 48,828 | |||||
Other assets | 13,576 | 9,991 | |||||
TOTAL ASSETS | $ | 1,732,151 | $ | 1,668,112 | |||
LIABILITIES AND SHAREHOLDERS’ EQUITY | |||||||
Deposits | |||||||
Noninterest bearing | $ | 205,071 | $ | 191,376 | |||
NOW accounts | 209,325 | 212,666 | |||||
Certificates of deposit under $100 and other savings | 520,219 | 521,793 | |||||
Certificates of deposit over $100 | 260,425 | 238,728 | |||||
Total deposits | 1,195,040 | 1,164,563 | |||||
Borrowed funds | 337,694 | 309,732 | |||||
Accrued interest payable and other liabilities | 11,518 | 9,846 | |||||
Total liabilities | 1,544,252 | 1,484,141 | |||||
Shareholders’ equity | |||||||
Common stock — no par value 15,000,000 shares authorized; issued and outstanding 7,821,069 shares (including 26,042 shares held in the Rabbi Trust) in 2016 and 7,799,867 shares (including 19,401 shares held in the Rabbi Trust) in 2015 | 139,525 | 139,198 | |||||
Shares to be issued for deferred compensation obligations | 5,038 | 4,592 | |||||
Retained earnings | 46,114 | 39,960 | |||||
Accumulated other comprehensive income (loss) | (2,778 | ) | 221 | ||||
Total shareholders’ equity | 187,899 | 183,971 | |||||
TOTAL LIABILITIES AND SHAREHOLDERS’ EQUITY | $ | 1,732,151 | $ | 1,668,112 | |||
The accompanying notes are an integral part of these consolidated financial statements.
38
CONSOLIDATED STATEMENTS OF CHANGES IN SHAREHOLDERS’ EQUITY
(Dollars in thousands except per share amounts)
Common Stock | ||||||||||||||||||||||
Common Shares Outstanding | Amount | Common Shares to be Issued for Deferred Compensation Obligations | Retained Earnings | Accumulated Other Comprehensive Income (Loss) | Totals | |||||||||||||||||
Balance, January 1, 2014 | 7,723,023 | $ | 137,580 | $ | 4,148 | $ | 25,222 | $ | (6,341 | ) | $ | 160,609 | ||||||||||
Comprehensive income (loss) | — | — | — | 13,724 | 5,835 | 19,559 | ||||||||||||||||
Issuance of common stock | 182,755 | 4,227 | — | — | — | 4,227 | ||||||||||||||||
Common stock issued for deferred compensation obligations | 6,126 | 143 | (143 | ) | — | — | — | |||||||||||||||
Common stock transferred from the Rabbi Trust to satisfy deferred compensation obligations | — | 258 | (258 | ) | — | — | — | |||||||||||||||
Share-based payment awards under equity compensation plan | — | — | 495 | — | — | 495 | ||||||||||||||||
Common stock purchased for deferred compensation obligations | — | (331 | ) | — | — | — | (331 | ) | ||||||||||||||
Common stock repurchased pursuant to publicly announced repurchase plan | (135,630 | ) | (3,122 | ) | — | — | — | (3,122 | ) | |||||||||||||
Cash dividends paid ($0.89 per common share) | — | — | — | (6,843 | ) | — | (6,843 | ) | ||||||||||||||
Balance, December 31, 2014 | 7,776,274 | 138,755 | 4,242 | 32,103 | (506 | ) | 174,594 | |||||||||||||||
Comprehensive income (loss) | — | — | — | 15,130 | 727 | 15,857 | ||||||||||||||||
Issuance of common stock | 216,700 | 5,201 | — | — | — | 5,201 | ||||||||||||||||
Common stock issued for deferred compensation obligations | — | — | — | — | — | — | ||||||||||||||||
Common stock transferred from the Rabbi Trust to satisfy deferred compensation obligations | — | 200 | (200 | ) | — | — | — | |||||||||||||||
Share-based payment awards under equity compensation plan | — | — | 550 | — | — | 550 | ||||||||||||||||
Common stock purchased for deferred compensation obligations | — | (368 | ) | — | — | — | (368 | ) | ||||||||||||||
Common stock repurchased pursuant to publicly announced repurchase plan | (193,107 | ) | (4,590 | ) | — | — | — | (4,590 | ) | |||||||||||||
Cash dividends paid ($0.94 per common share) | — | — | — | (7,273 | ) | — | (7,273 | ) | ||||||||||||||
Balance, December 31, 2015 | 7,799,867 | 139,198 | 4,592 | 39,960 | 221 | 183,971 | ||||||||||||||||
Comprehensive income (loss) | — | — | — | 13,799 | (2,999 | ) | 10,800 | |||||||||||||||
Issuance of common stock | 179,903 | 5,023 | — | — | — | 5,023 | ||||||||||||||||
Common stock issued for deferred compensation obligations | — | — | — | — | — | — | ||||||||||||||||
Common stock transferred from the Rabbi Trust to satisfy deferred compensation obligations | — | 127 | (127 | ) | — | — | — | |||||||||||||||
Share-based payment awards under equity compensation plan | — | — | 573 | — | — | 573 | ||||||||||||||||
Common stock purchased for deferred compensation obligations | — | (383 | ) | — | — | — | (383 | ) | ||||||||||||||
Common stock repurchased pursuant to publicly announced repurchase plan | (158,701 | ) | (4,440 | ) | — | — | — | (4,440 | ) | |||||||||||||
Cash dividends paid ($0.98 per common share) | — | — | — | (7,645 | ) | — | (7,645 | ) | ||||||||||||||
Balance, December 31, 2016 | 7,821,069 | $ | 139,525 | $ | 5,038 | $ | 46,114 | $ | (2,778 | ) | $ | 187,899 | ||||||||||
The accompanying notes are an integral part of these consolidated financial statements.
39
CONSOLIDATED STATEMENTS OF INCOME
(Dollars in thousands except per share amounts)
Year Ended December 31 | |||||||||||
2016 | 2015 | 2014 | |||||||||
Interest income | |||||||||||
Loans, including fees | $ | 38,537 | $ | 35,853 | $ | 36,629 | |||||
AFS securities | |||||||||||
Taxable | 8,746 | 9,053 | 8,092 | ||||||||
Nontaxable | 5,715 | 5,996 | 5,911 | ||||||||
Federal funds sold and other | 668 | 600 | 516 | ||||||||
Total interest income | 53,666 | 51,502 | 51,148 | ||||||||
Interest expense | |||||||||||
Deposits | 5,836 | 5,850 | 6,295 | ||||||||
Borrowings | 5,029 | 4,313 | 3,675 | ||||||||
Total interest expense | 10,865 | 10,163 | 9,970 | ||||||||
Net interest income | 42,801 | 41,339 | 41,178 | ||||||||
Provision for loan losses | (135 | ) | (2,771 | ) | (668 | ) | |||||
Net interest income after provision for loan losses | 42,936 | 44,110 | 41,846 | ||||||||
Noninterest income | |||||||||||
Service charges and fees | 5,230 | 5,437 | 5,411 | ||||||||
Net gain on sale of mortgage loans | 651 | 573 | 514 | ||||||||
Earnings on corporate owned life insurance policies | 761 | 771 | 751 | ||||||||
Net gains on sale of AFS securities | 245 | 163 | 97 | ||||||||
Other | 4,221 | 3,415 | 2,552 | ||||||||
Total noninterest income | 11,108 | 10,359 | 9,325 | ||||||||
Noninterest expenses | |||||||||||
Compensation and benefits | 19,482 | 19,069 | 18,502 | ||||||||
Furniture and equipment | 6,162 | 5,886 | 5,337 | ||||||||
Occupancy | 3,227 | 3,037 | 2,979 | ||||||||
Other | 9,026 | 8,059 | 8,285 | ||||||||
Total noninterest expenses | 37,897 | 36,051 | 35,103 | ||||||||
Income before federal income tax expense | 16,147 | 18,418 | 16,068 | ||||||||
Federal income tax expense | 2,348 | 3,288 | 2,344 | ||||||||
NET INCOME | $ | 13,799 | $ | 15,130 | $ | 13,724 | |||||
Earnings per common share | |||||||||||
Basic | $ | 1.77 | $ | 1.95 | $ | 1.77 | |||||
Diluted | $ | 1.73 | $ | 1.90 | $ | 1.74 | |||||
Cash dividends per common share | $ | 0.98 | $ | 0.94 | $ | 0.89 | |||||
The accompanying notes are an integral part of these consolidated financial statements.
40
CONSOLIDATED STATEMENTS OF COMPREHENSIVE INCOME
(Dollars in thousands)
Year Ended December 31 | |||||||||||
2016 | 2015 | 2014 | |||||||||
Net income | $ | 13,799 | $ | 15,130 | $ | 13,724 | |||||
Unrealized gains (losses) on AFS securities | |||||||||||
Unrealized gains (losses) arising during the period | (5,865 | ) | 310 | 11,290 | |||||||
Reclassification adjustment for net realized (gains) losses included in net income | (245 | ) | (163 | ) | (97 | ) | |||||
Reclassification adjustment for impairment loss included in net income | 770 | — | — | ||||||||
Comprehensive income (loss) before income tax (expense) benefit | (5,340 | ) | 147 | 11,193 | |||||||
Tax effect (1) | 1,834 | 87 | (3,684 | ) | |||||||
Unrealized gains (losses) on AFS securities, net of tax | (3,506 | ) | 234 | 7,509 | |||||||
Unrealized gains (losses) on derivative instruments | |||||||||||
Unrealized gains (losses) on derivative instruments arising during the period | 248 | — | — | ||||||||
Tax effect | (84 | ) | — | — | |||||||
Unrealized gains (losses) on AFS securities, net of tax | 164 | — | — | ||||||||
Change in unrecognized pension cost on defined benefit pension plan | |||||||||||
Change in unrecognized pension cost arising during the period | 282 | 255 | (2,836 | ) | |||||||
Reclassification adjustment for net periodic benefit cost included in net income | 238 | 492 | 300 | ||||||||
Net change in unrecognized pension cost | 520 | 747 | (2,536 | ) | |||||||
Tax effect | (177 | ) | (254 | ) | 862 | ||||||
Change in unrealized pension cost, net of tax | 343 | 493 | (1,674 | ) | |||||||
Other comprehensive income (loss), net of tax | (2,999 | ) | 727 | 5,835 | |||||||
Comprehensive income (loss) | $ | 10,800 | $ | 15,857 | $ | 19,559 | |||||
(1) | See “Note 18 – Accumulated Other Comprehensive Income (Loss)” in the accompanying notes to consolidated financial statements for tax effect reconciliation. |
The accompanying notes are an integral part of these consolidated financial statements.
41
CONSOLIDATED STATEMENTS OF CASH FLOWS
(Dollars in thousands)
Year Ended December 31 | |||||||||||
2016 | 2015 | 2014 | |||||||||
OPERATING ACTIVITIES | |||||||||||
Net income | $ | 13,799 | $ | 15,130 | $ | 13,724 | |||||
Reconciliation of net income to net cash provided by operating activities: | |||||||||||
Provision for loan losses | (135 | ) | (2,771 | ) | (668 | ) | |||||
Impairment of foreclosed assets | 10 | 99 | 123 | ||||||||
Depreciation | 2,821 | 2,677 | 2,551 | ||||||||
Amortization of OMSR | 394 | 340 | 265 | ||||||||
Amortization of acquisition intangibles | 162 | 169 | 183 | ||||||||
Net amortization of AFS securities | 2,747 | 2,074 | 1,830 | ||||||||
AFS security impairment loss | 770 | — | — | ||||||||
Net (gains) losses on sale of AFS securities | (245 | ) | (163 | ) | (97 | ) | |||||
Net gain on sale of mortgage loans | (651 | ) | (573 | ) | (514 | ) | |||||
Increase in cash value of corporate owned life insurance policies | (761 | ) | (771 | ) | (751 | ) | |||||
Gains from redemption of corporate owned life insurance policies | (469 | ) | — | — | |||||||
Share-based payment awards under equity compensation plan | 573 | 550 | 495 | ||||||||
Deferred income tax (benefit) expense | (282 | ) | 1,692 | 207 | |||||||
Origination of loans held-for-sale | (33,089 | ) | (42,887 | ) | (28,135 | ) | |||||
Proceeds from loan sales | 33,111 | 43,174 | 28,852 | ||||||||
Net changes in operating assets and liabilities which provided (used) cash: | |||||||||||
Accrued interest receivable | (311 | ) | (418 | ) | (409 | ) | |||||
Other assets | (954 | ) | (5,322 | ) | (1,392 | ) | |||||
Accrued interest payable and other liabilities | 1,672 | (910 | ) | 1,298 | |||||||
Net cash provided by (used in) operating activities | 19,162 | 12,090 | 17,562 | ||||||||
INVESTING ACTIVITIES | |||||||||||
Activity in AFS securities | |||||||||||
Sales | 35,664 | 1,319 | 13,362 | ||||||||
Maturities, calls, and principal payments | 137,278 | 90,036 | 68,188 | ||||||||
Purchases | (79,514 | ) | (185,721 | ) | (127,562 | ) | |||||
Net loan principal (originations) collections | (160,294 | ) | (15,029 | ) | (27,876 | ) | |||||
Proceeds from sales of foreclosed assets | 486 | 1,523 | 1,775 | ||||||||
Purchases of premises and equipment | (3,804 | ) | (5,127 | ) | (2,713 | ) | |||||
Purchases of corporate owned life insurance policies | — | (500 | ) | — | |||||||
Proceeds from redemption of corporate owned life insurance policies | 1,353 | — | — | ||||||||
Net cash provided by (used in) investing activities | (68,831 | ) | (113,499 | ) | (74,826 | ) | |||||
42
CONSOLIDATED STATEMENTS OF CASH FLOWS (continued)
(Dollars in thousands)
Year Ended December 31 | |||||||||||
2016 | 2015 | 2014 | |||||||||
FINANCING ACTIVITIES | |||||||||||
Net increase (decrease) in deposits | 30,477 | 90,079 | 30,718 | ||||||||
Net increase (decrease) in borrowed funds | 27,962 | 20,023 | 10,383 | ||||||||
Cash dividends paid on common stock | (7,645 | ) | (7,273 | ) | (6,843 | ) | |||||
Proceeds from issuance of common stock | 5,023 | 5,201 | 4,227 | ||||||||
Common stock repurchased | (4,440 | ) | (4,590 | ) | (3,122 | ) | |||||
Common stock purchased for deferred compensation obligations | (383 | ) | (368 | ) | (331 | ) | |||||
Net cash provided by (used in) financing activities | 50,994 | 103,072 | 35,032 | ||||||||
Increase (decrease) in cash and cash equivalents | 1,325 | 1,663 | (22,232 | ) | |||||||
Cash and cash equivalents at beginning of period | 21,569 | 19,906 | 42,138 | ||||||||
Cash and cash equivalents at end of period | $ | 22,894 | $ | 21,569 | $ | 19,906 | |||||
SUPPLEMENTAL CASH FLOWS INFORMATION: | |||||||||||
Interest paid | $ | 10,836 | $ | 10,176 | $ | 10,045 | |||||
Income taxes paid | 1,415 | 3,493 | 1,454 | ||||||||
SUPPLEMENTAL NONCASH INFORMATION: | |||||||||||
Transfers of loans to foreclosed assets | $ | 306 | $ | 1,158 | $ | 1,371 | |||||
The accompanying notes are an integral part of these consolidated financial statements.
43
NOTES TO CONSOLIDATED FINANCIAL STATEMENTS
(Dollars in thousands except per share amounts)
Note 1 – Nature of Operations and Summary of Significant Accounting Policies
BASIS OF PRESENTATION AND CONSOLIDATION: The consolidated financial statements include the accounts of Isabella Bank Corporation, a financial services holding company, and its wholly owned subsidiary, Isabella Bank. All intercompany balances and accounts have been eliminated in consolidation. References to "the Corporation," “Isabella,” “we,” “our,” “us,” and similar terms refer to the consolidated entity consisting of Isabella Bank Corporation and its subsidiary. Isabella Bank Corporation refers solely to the parent holding company, and Isabella Bank or the “Bank” refer to Isabella Bank Corporation’s subsidiary, Isabella Bank.
For additional information, see “Note 19 – Related Party Transactions.”
NATURE OF OPERATIONS: Isabella Bank Corporation is a financial services holding company offering a wide array of financial products and services in several mid-Michigan counties. Our banking subsidiary, Isabella Bank, offers banking services through 29 locations and a loan production office, 24 hour banking services locally and nationally through shared automatic teller machines, 24 hour online banking, mobile banking, and direct deposits to businesses, institutions, and individuals. Lending services offered include commercial loans, agricultural loans, residential real estate loans, and consumer loans. Deposit services include interest and noninterest bearing checking accounts, savings accounts, money market accounts, and certificates of deposit. Other related financial products include trust and investment services, safe deposit box rentals, and credit life insurance. Active competition, principally from other commercial banks, savings banks and credit unions, exists in all of our principal markets. Our results of operations can be significantly affected by changes in interest rates and changes in the local economic environment.
USE OF ESTIMATES: In preparing consolidated financial statements in conformity with accounting principles generally accepted in the United States of America, we make estimates and assumptions that affect the reported amounts of assets and liabilities as of the date of the consolidated balance sheet and reported amounts of revenues and expenses during the reporting year. Actual results could differ from those estimates.
Material estimates that are particularly susceptible to significant change in the near term relate to the determination of the ALLL, the fair value of AFS investment securities, and the valuation of goodwill and other intangible assets.
FAIR VALUE MEASUREMENTS: Fair value refers to the price that would be received to sell an asset or paid to transfer a liability (an exit price) in an orderly transaction between market participants in the market in which the reporting entity transacts such sales or transfers based on the assumptions market participants would use when pricing an asset or liability. Assumptions are developed based on prioritizing information within a fair value hierarchy that gives the highest priority to quoted prices in active markets and the lowest priority to unobservable data, such as the reporting entity’s own data. We may choose to measure eligible items at fair value at specified election dates.
For assets and liabilities recorded at fair value, it is our policy to maximize the use of observable inputs and minimize the use of unobservable inputs when developing fair value measurements for those financial instruments for which there is an active market. In cases where the market for a financial asset or liability is not active, we include appropriate risk adjustments that market participants would make for nonperformance and liquidity risks when developing fair value measurements. Fair value measurements for assets and liabilities for which limited or no observable market data exists are accordingly based primarily upon estimates, are often calculated based on the economic and competitive environment, the characteristics of the asset or liability and other factors. Therefore, the results cannot be determined with precision and may not be realized in an actual sale or immediate settlement of the asset or liability. Additionally, there may be inherent weaknesses in any calculation technique, and changes in the underlying assumptions used, including discount rates and estimates of future cash flows, could significantly affect the results of current or future values.
We utilize fair value measurements to record fair value adjustments to certain assets and liabilities and to determine fair value disclosures. Investment securities AFS are recorded at fair value on a recurring basis. Additionally, from time-to-time, we may be required to record other assets and liabilities at fair value on a nonrecurring basis, such as mortgage loans AFS, impaired loans, foreclosed assets, OMSR, goodwill, and certain other assets and liabilities. These nonrecurring fair value adjustments typically involve the application of lower of cost or market accounting or write-downs of individual assets.
44
Fair Value Hierarchy
Under fair value measurement and disclosure authoritative guidance, we group assets and liabilities measured at fair value into three levels, based on the markets in which the assets and liabilities are traded, and the reliability of the assumptions used to determine fair value, based on the prioritization of inputs in the valuation techniques. These levels are:
Level 1: | Valuation is based upon quoted prices for identical instruments traded in active markets. |
Level 2: | Valuation is based upon quoted prices for similar instruments in active markets, quoted prices for identical or similar instruments in markets that are not active and model based valuation techniques for which all significant assumptions are observable in the market. |
Level 3: | Valuation is generated from model based techniques that use at least one significant assumption not observable in the market. These unobservable assumptions reflect estimates of assumptions that market participants would use in pricing the asset or liability. |
The asset’s or liability’s fair value measurement level within the fair value hierarchy is based on the lowest level of any input that is significant to the fair value measurement. Valuation techniques maximize the use of observable inputs and minimize the use of unobservable inputs. Transfers between measurement levels are recognized at the end of reporting periods.
For further discussion of fair value considerations, refer to “Note 20 – Fair Value.”
SIGNIFICANT GROUP CONCENTRATIONS OF CREDIT RISK: Most of our activities conducted are with customers located within the central Michigan area. A significant amount of our outstanding loans are secured by commercial and residential real estate. Other than these types of loans, there is no significant concentration to any other industry or any one customer.
CASH AND CASH EQUIVALENTS: For purposes of the consolidated statements of cash flows, cash and cash equivalents include cash and balances due from banks, federal funds sold, and other deposit accounts. Generally, federal funds sold are for a one day period. We maintain deposit accounts in various financial institutions which generally exceed federally insured limits or are not insured. We do not believe we are exposed to any significant interest, credit or other financial risk as a result of these deposits.
AFS SECURITIES: Purchases of investment securities are generally classified as AFS. However, we may elect to classify securities as either held to maturity or trading. Securities classified as AFS are recorded at fair value, with unrealized gains and losses, net of the effect of deferred income taxes, excluded from earnings and reported in other comprehensive income. Included in AFS securities are auction rate money market preferreds and preferred stocks. These investments are considered equity securities for federal income tax purposes, and as such, no estimated federal income tax impact is expected or recorded. Auction rate money market preferred securities and preferred stocks are recorded at fair value, with unrealized gains and losses excluded from earnings and reported in other comprehensive income. Purchase premiums and discounts are recognized in interest income using the interest method over the terms of the securities. Realized gains and losses on the sale of AFS securities are determined using the specific identification method.
AFS securities are reviewed quarterly for possible OTTI. In determining whether an OTTI exists for debt securities, we assert that: (a) we do not have the intent to sell the security; and (b) it is more likely than not we will not have to sell the security before recovery of its cost basis. If these conditions are not met, we recognize an OTTI charge through earnings for the difference between the debt security’s amortized cost basis and its fair value, and such amount is included in noninterest income. For debt securities that do not meet the above criteria, and we do not expect to recover the security’s amortized cost basis, the security is considered other-than-temporarily impaired. For these debt securities, we separate the total impairment into the credit risk loss component and the amount of the loss related to market and other risk factors. In order to determine the amount of the credit loss for a debt security, we calculate the recovery value by performing a discounted cash flow analysis based on the current cash flows and future cash flows we expect to recover. The amount of the total OTTI related to the credit risk is recognized in earnings and is included in noninterest income. The amount of the total OTTI related to other risk factors is recognized as a component of other comprehensive income. For debt securities that have recognized an OTTI through earnings, if through subsequent evaluation there is a significant increase in the cash flow expected, the difference between the amortized cost basis and the cash flows expected to be collected is accreted as interest income.
AFS equity securities are reviewed for OTTI at each reporting date. This evaluation considers a number of factors including, but not limited to, the length of time and extent to which the fair value has been less than cost, the financial condition and near term prospects of the issuer, and our ability and intent to hold the securities until fair value recovers. If it is determined that we do not have the ability and intent to hold the securities until recovery or that there are conditions that indicate that a security may not recover in value then the difference between the fair value and the cost of the security is recognized in earnings and is included in noninterest income.
45
LOANS: Loans that we have the intent and ability to hold for the foreseeable future or until maturity or payoff are reported at their outstanding principal balance adjusted for any charge-offs, the ALLL, and any deferred fees or costs on originated loans. Interest income on loans is accrued over the term of the loan based on the principal amount outstanding. Loan origination fees and certain direct loan origination costs are capitalized and recognized as a component of interest income over the term of the loan using the level yield method.
The accrual of interest on agricultural, commercial and mortgage loans is discontinued at the time the loan is 90 days or more past due unless the credit is well secured and in the process of collection. Consumer loans are typically charged-off no later than 180 days past due. Past due status is based on contractual terms of the loan. In all cases, loans are placed on nonaccrual or charged-off at an earlier date if collection of principal or interest is considered doubtful. For loans that are placed on nonaccrual status or charged-off, all interest accrued in the current calendar year, but not collected, is reversed against interest income while interest accrued in prior calendar years, but not collected is charged against the ALLL. The interest on these loans is accounted for on the cash-basis, until qualifying for return to accrual status. Loans are returned to accrual status when all principal and interest amounts contractually due are brought current and future payments are reasonably assured. For impaired loans not classified as nonaccrual, interest income continues to be accrued over the term of the loan based on the principal amount outstanding.
ALLOWANCE FOR LOAN AND LEASE LOSSES: The ALLL is established as losses are estimated to have occurred through a provision for loan losses charged to earnings. Loan losses are charged against the allowance when we believe the uncollectability of the loan balance is confirmed. Subsequent recoveries, if any, are credited to the allowance.
We evaluate the ALLL on a regular basis which is based upon our periodic review of the collectability of the loans in light of historical experience, the nature and volume of the loan portfolio, adverse situations that may affect the borrower’s ability to repay, estimated value of any underlying collateral and prevailing economic conditions. This evaluation is inherently subjective as it requires estimates that are susceptible to significant revision as more information becomes available.
The ALLL consists of specific, general, and unallocated components. The specific component relates to loans that are deemed to be impaired. For such loans that are also analyzed for specific allowance allocations, an allowance is established when the discounted cash flows, collateral value or observable market price of the impaired loan is lower than the carrying value of that loan. The general component covers non classified loans and is based on historical loss experience. An unallocated component is maintained to cover uncertainties that we believe affect our estimate of probable losses based on qualitative factors. The unallocated component of the allowance reflects the margin of imprecision inherent in the underlying assumptions used in the methodologies for estimating specific and general losses in the portfolio.
Loans may be classified as impaired if they meet one or more of the following criteria:
1. | There has been a charge-off of its principal balance; |
2. | The loan has been classified as a TDR; or |
3. | The loan is in nonaccrual status. |
Impairment is measured on a loan by loan basis by either the present value of expected future cash flows discounted at the loan’s effective interest rate, the loan’s obtainable market price, or the fair value of the collateral, less cost to sell, if the loan is collateral dependent. Large groups of smaller balance homogeneous loans are collectively evaluated for impairment.
LOANS HELD FOR SALE: Mortgage loans held for sale on the secondary market are carried at the lower of cost or fair value as determined by aggregating outstanding commitments from investors or current investor yield requirements. Net unrealized losses, if any, would be recognized as a component of other noninterest expenses.
Mortgage loans held for sale are sold with the mortgage servicing rights retained by us. The carrying value of mortgage loans sold is reduced by the cost allocated to the associated mortgage servicing rights. Gains or losses on sales of mortgage loans are recognized based on the difference between the selling price and the carrying value of the related mortgage loans sold.
TRANSFERS OF FINANCIAL ASSETS: Transfers of financial assets, including mortgage loans and participation loans, are accounted for as sales when control over the assets has been surrendered. Control over transferred assets is determined to be surrendered when 1) the assets have been legally isolated from us, 2) the transferee obtains the right (free of conditions that constrain it from taking advantage of the right) to pledge or exchange the transferred assets, and 3) we do not maintain effective control over the transferred assets through an agreement to repurchase them before their maturity. Other than servicing, we have no substantive continuing involvement related to these loans.
SERVICING: Servicing assets are recognized as separate assets when rights are acquired through purchase or through sale of financial assets. We have no purchased servicing rights. For sales of mortgage loans, a portion of the cost of originating the
46
loan is allocated to the servicing right based on relative fair value. Fair value is based on market prices for comparable mortgage servicing contracts, when available, or alternatively, is based on a valuation model that calculates the present value of estimated future net servicing income. The valuation model incorporates assumptions that market participants would use in estimating future net servicing income, such as the cost to service, the discount rate, the custodial earnings rate, an inflation rate, ancillary income, prepayment speeds and default rates and losses.
Servicing assets are evaluated for impairment based upon the fair value of the rights as compared to amortized cost. Impairment is determined by stratifying rights into tranches based on predominant risk characteristics, such as interest rate, loan type, and investor type. Impairment is recognized through a valuation allowance for an individual tranche, to the extent that fair value is less than the capitalized amount for the tranche. If we later determine that all or a portion of the impairment no longer exists for a particular tranche, a reduction of the valuation allowance may be recorded as an increase to income. Capitalized servicing rights are reported in other assets and are amortized into noninterest income in proportion to, and over the period of, the estimated future net servicing income of the underlying financial assets. The unpaid principal balance of mortgages serviced for others was $272,882 and $287,029 with capitalized servicing rights of $2,306 and $2,505 at December 31, 2016 and 2015, respectively.
Servicing fee income is recorded for fees earned for servicing loans for others. The fees are based on a contractual percentage of the outstanding principal; or a fixed amount per loan and are recorded as income when earned. We recorded servicing fee revenue of $696, $712, and $720 related to residential mortgage loans serviced for others during 2016, 2015, and 2014, respectively, which is included in other noninterest income.
FORECLOSED ASSETS: Assets acquired through, or in lieu of, loan foreclosure are held for sale and are initially recorded at the lower of our carrying amount or fair value less estimated selling costs at the date of transfer, establishing a new cost basis. Any write-downs based on the asset’s fair value at the date of acquisition are charged to the ALLL. After foreclosure, property held for sale is carried at the lower of the new cost basis or fair value less costs to sell. Impairment losses on property to be held and used are measured at the amount by which the carrying amount of property exceeds its fair value. Costs relating to holding these assets are expensed as incurred. We periodically perform valuations and any subsequent write-downs are recorded as a charge to operations, if necessary, to reduce the carrying value of a property to the lower of our carrying amount or fair value less costs to sell. Foreclosed assets of $231 and $421 as of December 31, 2016 and 2015, respectively, are included in other assets.
PREMISES AND EQUIPMENT: Land is carried at cost. Buildings and equipment are carried at cost, less accumulated depreciation which is computed principally by the straight-line method based upon the estimated useful lives of the related assets, which range from 3 to 40 years. Major improvements are capitalized and appropriately amortized based upon the useful lives of the related assets or the expected terms of the leases, if shorter, using the straight-line method. Maintenance, repairs and minor alterations are charged to current operations as expenditures occur. We annually review these assets to determine whether carrying values have been impaired.
EQUITY SECURITIES WITHOUT READILY DETERMINABLE FAIR VALUES: Included in equity securities without readily determinable fair values are our holdings in FHLB stock and FRB stock as well as our ownership interests in Corporate Settlement Solutions, LLC and Valley Financial Corporation. Our investment in Corporate Settlement Solutions, LLC, a title insurance company, was made in the 1st quarter of 2008. We are not the managing entity of Corporate Settlement Solutions, LLC, and account for our investment in that entity under the equity method of accounting. Valley Financial Corporation is the parent company of 1st State Bank in Saginaw, Michigan, which is a bank that opened in 2005. We made investments in Valley Financial Corporation in 2004 and in 2007. In 2016, we sold all shares of Valley Financial Corporation common stock.
Equity securities without readily determinable fair values consist of the following as of December 31:
2016 | 2015 | ||||||
FHLB Stock | $ | 11,900 | $ | 11,700 | |||
Corporate Settlement Solutions, LLC | 7,461 | 7,249 | |||||
FRB Stock | 1,999 | 1,999 | |||||
Valley Financial Corporation | — | 1,000 | |||||
Other | 334 | 338 | |||||
Total | $ | 21,694 | $ | 22,286 | |||
EQUITY COMPENSATION PLAN: At December 31, 2016, the Directors Plan had 213,470 shares eligible to be issued to participants, for which the Rabbi Trust held 26,042 shares. We had 200,017 shares to be issued in 2015, with 19,401 shares held in the Rabbi Trust. Compensation costs relating to share based payment transactions are recognized as the services are
47
rendered, with the cost measured based on the fair value of the equity or liability instruments issued (see “Note 17 – Benefit Plans”). We have no other equity-based compensation plans.
CORPORATE OWNED LIFE INSURANCE: We have purchased life insurance policies on key members of management. In the event of death of one of these individuals, we would receive a specified cash payment equal to the face value of the policy. Such policies are recorded at their cash surrender value, or the amount that can be realized on the balance sheet dates. Increases in cash surrender value in excess of single premiums paid are reported as other noninterest income.
As of December 31, 2016 and 2015, the present value of the post retirement benefits payable by us to the covered employees was estimated to be $2,174 and $2,853, respectively, and is included in accrued interest payable and other liabilities. The periodic policy maintenance costs were $(8), $71, and $83 for 2016, 2015, and 2014, respectively and are included in other noninterest expenses.
ACQUISITION INTANGIBLES AND GOODWILL: We previously acquired branch facilities and related deposits in business combinations accounted for as a purchase. The acquisitions included amounts related to the valuation of customer deposit relationships (core deposit intangibles). Core deposit intangibles arising from acquisitions are included in goodwill and other intangible assets are being amortized over their estimated lives and evaluated for potential impairment on at least an annual basis. Goodwill, which represents the excess of the purchase price over identifiable assets, is not amortized but is evaluated for impairment on at least an annual basis. Acquisition intangibles and goodwill are typically qualitatively evaluated to determine if it is more likely than not that the carrying balance is impaired. If it is determined that the carrying balance is more likely than not to be impaired, we perform a cash flow valuation to determine the extent of the potential impairment. This valuation method requires a significant degree of our judgment. In the event the projected undiscounted net operating cash flows for these intangible assets are less than the carrying value, the asset is recorded at fair value as determined by the valuation model.
OFF BALANCE SHEET CREDIT RELATED FINANCIAL INSTRUMENTS: In the ordinary course of business, we have entered into commitments to extend credit, including commitments under credit card arrangements, home equity lines of credit, commercial letters of credit, and standby letters of credit. Such financial instruments are recorded only when funded.
FEDERAL INCOME TAXES: Deferred income tax assets and liabilities are determined using the liability (or balance sheet) method. Under this method, the net deferred tax assets or liability is determined based on the tax effects of the temporary differences between the book and tax basis on the various balance sheet assets and liabilities and gives current recognition to changes in tax rates and laws. Valuation allowances are established, where necessary, to reduce deferred tax assets to the amount expected to be realized. Income tax expense is the tax payable or refundable for the year plus or minus the change during the year in deferred tax assets and liabilities.
We analyze our filing positions in the jurisdictions where we are required to file income tax returns, as well as all open tax years in these jurisdictions. We have also elected to retain our existing accounting policy with respect to the treatment of interest and penalties attributable to income taxes, and continue to reflect any charges for such, to the extent they arise, as a component of our noninterest expenses.
DEFINED BENEFIT PENSION PLAN: We maintain a noncontributory defined benefit pension plan, which was curtailed effective March 1, 2007. Defined benefit pension plan expenses are included in “compensation and benefits" on the consolidated statements of income and are funded consistent with the requirements of federal laws and regulations. The current benefit obligation is included in "accrued interest payable and other liabilities" on the consolidated balance sheets. Inherent in the determination of defined benefit pension costs are assumptions concerning future events that will affect the amount and timing of required benefit payments under the plan. These assumptions include demographic assumptions such as mortality, a discount rate used to determine the current benefit obligation and a long-term expected rate of return on plan assets. Net periodic benefit cost includes interest cost based on the assumed discount rate, an expected return on plan assets based on an actuarially derived market-related value of assets, and amortization of unrecognized net actuarial gains or losses. Actuarial gains and losses result from experience different from that assumed and from changes in assumptions (excluding asset gains and losses not yet reflected in market-related value). Amortization of actuarial gains and losses is included as a component of net periodic defined benefit pension cost.
For additional information, see "Note 17 – Benefit Plans."
MARKETING COSTS: Marketing costs are expensed as incurred (see “Note 11 – Other Noninterest Expenses”).
RECLASSIFICATIONS: Certain amounts reported in the 2015 and 2014 consolidated financial statements have been reclassified to conform with the 2016 presentation.
48
Note 2 – Computation of Earnings Per Common Share
Basic earnings per common share represents income available to common shareholders divided by the weighted average number of common shares outstanding during the period. Diluted earnings per common share reflects additional common shares that would have been outstanding if dilutive potential common shares had been issued. Potential common shares that may be issued relate solely to outstanding shares in the Directors Plan, see "Note 17 – Benefit Plans."
Earnings per common share have been computed based on the following:
2016 | 2015 | 2014 | |||||||||
Average number of common shares outstanding for basic calculation | 7,813,739 | 7,775,988 | 7,734,161 | ||||||||
Average potential effect of common shares in the Directors Plan (1) | 185,611 | 177,988 | 171,393 | ||||||||
Average number of common shares outstanding used to calculate diluted earnings per common share | 7,999,350 | 7,953,976 | 7,905,554 | ||||||||
Net income | $ | 13,799 | $ | 15,130 | $ | 13,724 | |||||
Earnings per common share | |||||||||||
Basic | $ | 1.77 | $ | 1.95 | $ | 1.77 | |||||
Diluted | $ | 1.73 | $ | 1.90 | $ | 1.74 | |||||
(1) | Exclusive of shares held in the Rabbi Trust |
Note 3 – Accounting Standards Updates
Pending Accounting Standards Updates
ASU No. 2016-01: “Financial Instruments - Overall (Subtopic 825-10): Recognition and Measurement of Financial Assets and Liabilities”
In January 2016, ASU No. 2016-01 set forth the following: 1) requires equity investments, with certain exceptions, to be measured at fair value with changes in fair value recognized in net income; 2) simplifies the impairment assessment of equity investments without readily determinable fair values by requiring a qualitative assessment to identify impairment and when an impairment exists, an entity is required to measure the investment at fair value; 3) for public entities, eliminates the requirement to disclose the method(s) and significant assumptions used to estimate the fair value that is required to be disclosed for financial instruments measured at amortized cost on the balance sheet; 4) for public entities, requires the use of exit price notion when measuring the fair value of financial instruments for disclosure purposes; 5) requires an entity to present separately in other comprehensive income, the portion of the total change in the fair value of a liability resulting from a change in the instrument-specific credit risk when the entity has elected to measure the liability at fair value in accordance with the fair value option for financial instruments; 6) requires separate presentation of financial assets and financial liabilities by measurement category and form of financial asset on the balance sheet or the accompanying notes to the financial statements; and 7) clarifies that an entity should evaluate the need for a valuation allowance on a deferred tax asset related to available-for-sale securities in combination with the entity's other deferred tax assets. The new authoritative guidance is effective for interim and annual periods beginning after December 15, 2017 and is not expected to have a significant impact on our operations or financial statement disclosures.
ASU No. 2016-02: “Leases (Topic 842)”
In February 2016, ASU No. 2016-02 was issued to create Topic 842 - Leases which will require recognition of lease assets and lease liabilities on the balance sheet for leases previously classified as operating leases. Accounting guidance is set forth for both lessee and lessor accounting. Under lessee accounting, a lessee should recognize in the statement of financial position a liability to make lease payments (the lease liability) and a right-of-use asset representing its right to use the underlying asset for the lease term.
For finance leases, a lessee is required to do the following: 1) recognize a right-of-use asset and a lease liability, initially measured at the present value of the lease payments, in the statement of financial position; 2) recognize interest on the lease liability separately from amortization of the right-of-use asset in the statement of comprehensive income; and 3) classify repayments of the principal portion of the lease liability within financing activities and payments of interest on the lease liability and variable lease payments within operating activities in the statement of cash flows. For operating leases, a lessee is required to do the following: 1) recognize a right-of-use asset and a lease liability, initially measured at the present value of the lease payments, in the statement of financial position; 2) recognize a single lease cost, calculated so that the cost of the lease is
49
allocated over the lease term on a generally straight-line basis; and 3) classify all cash payments within operating activities in the statement of cash flows.
The accounting applied by a lessor is largely unchanged from that applied under previous GAAP. The new authoritative guidance is effective for interim and annual periods beginning after December 15, 2018 and is not expected to have a significant impact on our operations or financial statement disclosures.
ASU No. 2016-05: “Derivatives and Hedging (Topic 815): Effect of Derivative Contract Novations on Existing Hedge Accounting Relationships”
In March 2016, ASU No. 2016-05 was issued to clarify designation of a hedging instrument when there is a change in counterparty. A change in the counterparty to a derivative instrument that has been designated as the hedging instrument under Topic 815 does not, in and of itself, require dedesignation of that hedging relationship provided that all other hedge accounting criteria continue to be met. The new authoritative guidance is effective for interim and annual periods beginning after December 15, 2016 and is not expected to have a significant impact on our operations or financial statement disclosures.
ASU No. 2016-07: “Investments - Equity Method and Joint Ventures (Topic 323): Simplifying the Transition of the Equity Method of Accounting”
In March 2016, ASU No. 2016-07 was issued and eliminates the requirement that when an investment qualifies for use of the equity method as a result of an increase in the level of ownership interest or degree of influence, an investor must adjust the investment, results of operations, and retained earnings retroactively on a step-by-step basis as if the equity method had been in effect during all previous periods that the investment had been held. Additionally, the update requires that the equity method investor add the cost of acquiring the additional interest in the investee to the current basis of the investor’s previously held interest and adopt the equity method of accounting as of the date the investment becomes qualified for equity method accounting. Therefore, upon qualifying for the equity method of accounting, no retroactive adjustment of the investment is required. The new authoritative guidance is effective for interim and annual periods beginning after December 15, 2016 and is not expected to have a significant impact on our operations or financial statement disclosures.
ASU No. 2016-09: “Compensation - Stock Compensation (Topic 718): Improvements to Employee Share-Based Payment Accounting”
In March 2016, ASU No. 2016-09 updated several aspects of the accounting for share-based payment transactions, including the income tax consequences, classification of awards as either equity or liabilities, and classification on the statement of cash flows. The new authoritative guidance is effective for interim and annual periods beginning after December 15, 2016 and is not expected to have a significant impact on our operations or financial statement disclosures.
ASU No. 2016-13: “Financial Instruments - Credit Losses (Topic 326): Measurement of Credit Losses on Financial Instruments”
In June 2016, ASU No. 2016-13 updated the measurement for credit losses for AFS debt securities and assets measured at amortized cost which include loans, trade receivables, and any other financial assets with the contractual right to receive cash. Current GAAP requires an “incurred loss” methodology for recognizing credit losses that delays recognition until it is probable a loss has been incurred. Under the incurred loss approach, entities are limited to a probable initial recognition threshold when credit losses are measured under GAAP; an entity generally only considers past events and current conditions in measuring the incurred loss.
In the new guidance, the incurred loss impairment methodology in current GAAP is replaced with a methodology that reflects expected credit losses. This methodology requires consideration of a broader range of reasonable and supportable information to calculate credit loss estimates. The measurement of expected credit losses is based on relevant information about past events, including historical experience, current conditions, and reasonable and supportable forecasts that affect the collectability of the reported amount. An entity must use judgment in determining the relevant information and estimation methods that are appropriate in its circumstances which applies to assets measured either collectively or individually.
The update allows an entity to revert to historical loss information that is reflective of the contractual term (considering the effect of prepayments) for periods that are beyond the time frame for which the entity is able to develop reasonable and supportable forecasts. In addition, the disclosures of credit quality indicators in relation to the amortized cost of financing receivables, a current disclosure requirement, are further disaggregated by year of origination (or vintage). The vintage information will be useful for financial statement users to better assess changes in underwriting standards and credit quality trends in asset portfolios over time and the effect of those changes on credit losses.
50
Overall, the update will allow entities the ability to measure expected credit losses without the restriction of incurred or probable losses that exist under current GAAP. For users of the financial statements, the update provides decision-useful information about the expected credit losses on financial instruments and other commitments to extend credit held by a reporting entity at each reporting date. The new authoritative guidance is effective for interim and annual periods beginning after December 15, 2019 and is expected to have a significant impact on our operations and financial statement disclosures as well as that of the banking industry as a whole.
ASU No. 2016-15: “Statement of Cash Flows (Topic 230): Classification of Certain Cash Receipts and Cash Payments”
In August 2016, ASU No. 2016-15 was issued to provide guidance on eight specific cash flow issues: 1) debt prepayment or debt extinguishment costs; 2) settlement of zero-coupon debt instruments or other debt instruments with coupon interest rates that are insignificant in relation to the effective interest rate of the borrowing; 3) contingent consideration payments made after a business combination; 4) proceeds from the settlement of insurance claims; 5) proceeds from the settlement of corporate-owned life insurance policies; 6) including bank-owned life insurance policies; 7) distributions received from equity method investees, beneficial interests in securitization transactions; and 8) separately identifiable cash flows and application of the predominance principle. The new authoritative guidance is effective for interim and annual periods beginning after December 15, 2017 and is not expected to have a significant impact on our operations or financial statement disclosures.
ASU No. 2016-16: “Income Taxes (Topic 740): Intra-Entity Transfers of Assets Other Than Inventory”
In October 2016, ASU No. 2016-16 was issued to improve the accounting for the income tax consequences of intra-entity transfers of assets other than inventory. The new guidance eliminates the requirement of the sale of the asset to recognize current and deferred income taxes. Instead, current and deferred income taxes will be recognized on an intra-entity transfer of an asset other than inventory when the transfer occurs. The new authoritative guidance is effective for interim and annual periods beginning after December 15, 2017 and is not expected to have a significant impact on our operations or financial statement disclosures.
ASU No. 2016-17: “Consolidation (Topic 810): Interests Held through Related Parties That Are under Common Control”
In October 2016, ASU No. 2016-17 was issued to amend the previous consolidation guidance on how a reporting entity that is the single decision maker of a variable interest entity (VIE) should treat indirect interests in the entity held through related parties that are under common control with the reporting entity when determining whether it is the primary beneficiary of that VIE. In the amendment, a single decision maker is not required to consider indirect interests held through related parties that are under common control with the single decision maker to be the equivalent of direct interests in their entirety. Instead, a single decision maker is required to include those interests on a proportionate basis consistent with indirect interests held through other related parties. The new authoritative guidance is effective for interim and annual periods beginning after December 15, 2016 and is not expected to have an impact on our operations or financial statement disclosures.
ASU No. 2016-18: “Statement of Cash Flows (Topic 230): Restricted Cash”
In November 2016, ASU No. 2016-18 was issued to provide guidance on the classification and presentation of changes in restricted cash on the statement of cash flows under Topic 230. The new guidance requires that a statement of cash flows explain the change during the period in the total of cash, cash equivalents, and amounts generally described as restricted cash or restricted cash equivalents. Additionally, amounts generally described as restricted cash and restricted cash equivalents should be included with cash and cash equivalents when reconciling the beginning-of-period and end-of-period total amounts shown on the statement of cash flows. The new authoritative guidance is effective for interim and annual periods beginning after December 15, 2017 and is not expected to have an impact on our operations or financial statement disclosures.
51
Note 4 – AFS Securities
The amortized cost and fair value of AFS securities, with gross unrealized gains and losses, are as follows as of December 31:
2016 | |||||||||||||||
Amortized Cost | Gross Unrealized Gains | Gross Unrealized Losses | Fair Value | ||||||||||||
Government sponsored enterprises | $ | 10,258 | $ | 3 | $ | 2 | $ | 10,259 | |||||||
States and political subdivisions | 208,977 | 4,262 | 320 | 212,919 | |||||||||||
Auction rate money market preferred | 3,200 | — | 406 | 2,794 | |||||||||||
Preferred stocks | 3,800 | — | 375 | 3,425 | |||||||||||
Mortgage-backed securities | 229,593 | 581 | 2,918 | 227,256 | |||||||||||
Collateralized mortgage obligations | 101,820 | 600 | 977 | 101,443 | |||||||||||
Total | $ | 557,648 | $ | 5,446 | $ | 4,998 | $ | 558,096 | |||||||
2015 | |||||||||||||||
Amortized Cost | Gross Unrealized Gains | Gross Unrealized Losses | Fair Value | ||||||||||||
Government sponsored enterprises | $ | 24,407 | $ | 13 | $ | 75 | $ | 24,345 | |||||||
States and political subdivisions | 224,752 | 7,511 | 46 | 232,217 | |||||||||||
Auction rate money market preferred | 3,200 | — | 334 | 2,866 | |||||||||||
Preferred stocks | 3,800 | — | 501 | 3,299 | |||||||||||
Mortgage-backed securities | 264,109 | 1,156 | 1,881 | 263,384 | |||||||||||
Collateralized mortgage obligations | 134,080 | 1,136 | 1,191 | 134,025 | |||||||||||
Total | $ | 654,348 | $ | 9,816 | $ | 4,028 | $ | 660,136 | |||||||
The amortized cost and fair value of AFS securities by contractual maturity at December 31, 2016 are as follows:
Maturing | Securities with Variable Monthly Payments or Noncontractual Maturities | ||||||||||||||||||||||
Due in One Year or Less | After One Year But Within Five Years | After Five Years But Within Ten Years | After Ten Years | Total | |||||||||||||||||||
Government sponsored enterprises | $ | 32 | $ | 9,938 | $ | 288 | $ | — | $ | — | $ | 10,258 | |||||||||||
States and political subdivisions | 27,633 | 71,126 | 82,468 | 27,750 | — | 208,977 | |||||||||||||||||
Auction rate money market preferred | — | — | — | — | 3,200 | 3,200 | |||||||||||||||||
Preferred stocks | — | — | — | — | 3,800 | 3,800 | |||||||||||||||||
Mortgage-backed securities | — | — | — | — | 229,593 | 229,593 | |||||||||||||||||
Collateralized mortgage obligations | — | — | — | — | 101,820 | 101,820 | |||||||||||||||||
Total amortized cost | $ | 27,665 | $ | 81,064 | $ | 82,756 | $ | 27,750 | $ | 338,413 | $ | 557,648 | |||||||||||
Fair value | $ | 27,704 | $ | 82,558 | $ | 84,699 | $ | 28,217 | $ | 334,918 | $ | 558,096 | |||||||||||
Expected maturities for government sponsored enterprises and states and political subdivisions may differ from contractual maturities because issuers may have the right to call or prepay obligations.
As the auction rate money market preferred and preferred stocks have continual call dates, they are not reported by a specific maturity group. Because of their variable monthly payments, mortgage-backed securities and collateralized mortgage obligations are not reported by a specific maturity group.
52
A summary of the sales activity of AFS securities was as follows during the years ended December 31:
2016 | 2015 | 2014 | |||||||||
Proceeds from sales of AFS securities | $ | 35,664 | $ | 1,319 | $ | 13,362 | |||||
Gross realized gains (losses) | $ | 245 | $ | 163 | $ | 97 | |||||
Applicable income tax expense (benefit) | $ | 83 | $ | 55 | $ | 33 | |||||
The cost basis used to determine the realized gains or losses of AFS securities sold was the amortized cost of the individual investment security as of the trade date.
The following information pertains to AFS securities with gross unrealized losses at December 31 aggregated by investment category and length of time that individual securities have been in a continuous loss position.
2016 | |||||||||||||||||||
Less Than Twelve Months | Twelve Months or More | ||||||||||||||||||
Gross Unrealized Losses | Fair Value | Gross Unrealized Losses | Fair Value | Total Unrealized Losses | |||||||||||||||
Government sponsored enterprises | $ | 2 | $ | 9,936 | $ | — | $ | — | $ | 2 | |||||||||
States and political subdivisions | 311 | 21,800 | 9 | 355 | 320 | ||||||||||||||
Auction rate money market preferred | — | — | 406 | 2,794 | 406 | ||||||||||||||
Preferred stocks | — | — | 375 | 3,425 | 375 | ||||||||||||||
Mortgage-backed securities | 2,918 | 175,212 | — | — | 2,918 | ||||||||||||||
Collateralized mortgage obligations | 628 | 51,466 | 349 | 11,381 | 977 | ||||||||||||||
Total | $ | 3,859 | $ | 258,414 | $ | 1,139 | $ | 17,955 | $ | 4,998 | |||||||||
Number of securities in an unrealized loss position: | 104 | 9 | 113 | ||||||||||||||||
2015 | |||||||||||||||||||
Less Than Twelve Months | Twelve Months or More | ||||||||||||||||||
Gross Unrealized Losses | Fair Value | Gross Unrealized Losses | Fair Value | Total Unrealized Losses | |||||||||||||||
Government sponsored enterprises | $ | — | $ | — | $ | 75 | $ | 4,925 | $ | 75 | |||||||||
States and political subdivisions | 14 | 3,355 | 32 | 2,623 | 46 | ||||||||||||||
Auction rate money market preferred | — | — | 334 | 2,866 | 334 | ||||||||||||||
Preferred stocks | — | — | 501 | 3,299 | 501 | ||||||||||||||
Mortgage-backed securities | 882 | 131,885 | 999 | 37,179 | 1,881 | ||||||||||||||
Collateralized mortgage obligations | 415 | 53,441 | 776 | 26,717 | 1,191 | ||||||||||||||
Total | $ | 1,311 | $ | 188,681 | $ | 2,717 | $ | 77,609 | $ | 4,028 | |||||||||
Number of securities in an unrealized loss position: | 36 | 26 | 62 | ||||||||||||||||
As of December 31, 2016 and 2015, we conducted an analysis to determine whether any securities currently in an unrealized loss position, should be other-than-temporarily impaired. Such analyses considered, among other factors, the following criteria:
• | Has the value of the investment declined more than what is deemed to be reasonable based on a risk and maturity adjusted discount rate? |
• | Is the investment credit rating below investment grade? |
• | Is it probable the issuer will be unable to pay the amount when due? |
• | Is it more likely than not that we will have to sell the security before recovery of its cost basis? |
• | Has the duration of the investment been extended? |
During the fourth quarter of 2016, we identified one municipal bond as other-than-temporarily impaired. While management estimated the OTTI to be realized, we also engaged the services of an independent investment valuation firm to estimate the
53
amount of impairment as of December 31, 2016. The valuation calculated the estimated market value utilizing two different approaches:
1) Market - Appraisal and Comparable Investments
2) Income - Discounted Cash Flow Method
The two methods were then weighted, with a higher weighting applied to the Market approach, to determine the estimated impairment. As a result of this analysis, we recognized an OTTI of $770 in earnings for the year ended December 31, 2016. The following table provides a roll-forward of credit related impairment recorded in earnings for the years ended December 31:
2016 | 2015 | 2014 | |||||||||
Balance at beginning of year | $ | — | $ | 282 | $ | 282 | |||||
Additions to credit losses for which no previous OTTI was recognized | 770 | — | — | ||||||||
Reductions for credit losses realized on securities sold during the quarter | — | (282 | ) | — | |||||||
Balance at end of year | $ | 770 | $ | — | $ | 282 | |||||
Based on our analyses, the fact that we have asserted that we do not have the intent to sell AFS securities in an unrealized loss position, and considering it is unlikely that we will have to sell any AFS securities in an unrealized loss position before recovery of their cost basis, we do not believe that the values of any other AFS securities are other-than-temporarily impaired as of December 31, 2016, or December 31, 2015, with the exception of the one municipal bond discussed above.
Note 5 – Loans and ALLL
We grant commercial, agricultural, residential real estate, and consumer loans to customers situated primarily in Clare, Gratiot, Isabella, Mecosta, Midland, Montcalm, and Saginaw counties in Michigan. The ability of the borrowers to honor their repayment obligations is often dependent upon the real estate, agricultural, manufacturing, retail, gaming, tourism, higher education, and general economic conditions of this region. Substantially all of our consumer and residential real estate loans are secured by various items of property, while commercial loans are secured primarily by real estate, business assets, and personal guarantees; a portion of loans are unsecured.
Loans that we have the intent and ability to hold in our portfolio are reported at their outstanding principal balance adjusted for any charge-offs, the ALLL, and any deferred fees or costs. Interest income is accrued over the term of the loan based on the principal amount outstanding. Loan origination fees and certain direct loan origination costs are capitalized and recognized as a component of interest income over the term of the loan using the level yield method.
The accrual of interest on commercial, agricultural, and residential real estate loans is discontinued at the time the loan is 90 days or more past due unless the credit is well-secured and in the process of collection. Upon transferring the loans to nonaccrual status, we perform an evaluation to determine the net realizable value of the underlying collateral. This evaluation is used to help determine if any charge-offs are necessary. Consumer loans are typically charged-off no later than 180 days past due. Past due status is based on contractual terms of the loan. In all cases, loans are placed on nonaccrual status or charged-off at an earlier date if collection of principal or interest is considered doubtful.
For loans that are placed on nonaccrual status or charged-off, all interest accrued in the current calendar year, but not collected, is reversed against interest income while interest accrued in prior calendar years, but not collected, is charged against the ALLL. Loans may be returned to accrual status after six months of continuous performance.
Commercial and agricultural loans include loans for commercial real estate, commercial operating loans, advances to mortgage brokers, farmland and agricultural production, and states and political subdivisions. Repayment of these loans is dependent upon the successful operation and management of a business. We minimize our risk by limiting the amount of direct credit exposure to any one borrower to $15,000. Borrowers with direct credit needs of more than $15,000 are serviced through the use of loan participations with other commercial banks. Commercial and agricultural real estate loans commonly require loan-to-value limits of 80% or less. Depending upon the type of loan, past credit history, and current operating results, we may require the borrower to pledge accounts receivable, inventory, and property and equipment. Personal guarantees are generally required from the owners of closely held corporations, partnerships, and sole proprietorships. In addition, we require annual financial statements, prepare cash flow analyses, and review credit reports.
We entered into a mortgage purchase program in 2016 with a financial institution where we participate in advances to mortgage brokers ("advances"). The mortgage brokers originate residential mortgage loans with the intent to sell on the secondary market. We participate in the advance to the mortgage broker, which is secured by the underlying mortgage loan, until it is ultimately sold on the secondary market. As such, the average life of each participated advance is approximately 20-30 days.
54
Funds from the sale of the loan are used to payoff our participation in the advance to the mortgage broker. We classify these advances as commercial loans and include the outstanding balance in commercial loans on our balance sheet. Under the participation agreement, we committed to a maximum outstanding aggregate amount of $30,000. The difference between our outstanding balances and the maximum outstanding aggregate amount are classified as “Unfunded commitments under lines of credit” in the “Contractual Obligations and Loan Commitments” section of the Management's Discussion and Analysis of Financial Condition and Results of Operations of this report.
We offer adjustable rate mortgages, construction loans, and fixed rate residential real estate loans which have amortization periods up to a maximum of 30 years. We consider the anticipated direction of interest rates, balance sheet duration, the sensitivity of our balance sheet to changes in interest rates, and overall loan demand to determine whether or not to sell fixed rate loans to Freddie Mac.
Our lending policies generally limit the maximum loan-to-value ratio on residential real estate loans to 97% of the lower of the appraised value of the property or the purchase price, with the condition that private mortgage insurance is required on loans with loan-to-value ratios in excess of 80%.
Underwriting criteria for residential real estate loans include:
• | Evaluation of the borrower’s ability to make monthly payments. |
• | Evaluation of the value of the property securing the loan. |
• | Ensuring the payment of principal, interest, taxes, and hazard insurance does not exceed 28% of a borrower’s gross income. |
• | Ensuring all debt servicing does not exceed 36% of income. |
• | Verification of acceptable credit reports. |
• | Verification of employment, income, and financial information. |
Appraisals are performed by independent appraisers and reviewed for appropriateness. All mortgage loan requests are reviewed by our mortgage loan committee or through a secondary market underwriting system; loans in excess of $500 require the approval of our Internal Loan Committee, the Executive Loan Committee, the Board of Directors’ Loan Committee, or the Board of Directors.
Consumer loans include secured and unsecured personal loans. Loans are amortized for a period of up to 12 years based on the age and value of the underlying collateral. The underwriting emphasis is on a borrower’s perceived intent and ability to pay rather than collateral value. No consumer loans are sold to the secondary market.
The ALLL is established as losses are estimated to have occurred through a provision for loan losses charged to earnings. Loan losses are charged against the ALLL when we believe the uncollectability of the loan balance is confirmed. Subsequent recoveries, if any, are credited to the ALLL.
The appropriateness of the ALLL is evaluated on a quarterly basis and is based upon a periodic review of the collectability of the loans in light of historical experience, the nature and volume of the loan portfolio, adverse situations that may affect the borrower’s ability to repay, estimated value of any underlying collateral, and prevailing economic conditions. This evaluation is inherently subjective as it requires estimates that are susceptible to significant revision as more information becomes available.
The primary factors behind the determination of the level of the ALLL are specific allocations for impaired loans, historical loss percentages, as well as unallocated components. Specific allocations for impaired loans are primarily determined based on the difference between the loan’s outstanding balance to the present value of expected future cash flows discounted at the loan’s effective interest rate, the loan’s obtainable market price, or the fair value of the collateral, less cost to sell. Historical loss allocations are calculated at the loan class and segment levels based on a migration analysis of the loan portfolio, with the exception of advances to mortgage brokers, over the preceding five years. With no historical losses on advances to mortgage brokers, there is no allocation in the commercial segment displayed below based on historical loss factors. The unallocated component of the allowance reflects the margin of imprecision inherent in the underlying assumptions used in the methodologies for estimating specific and general losses in the portfolio.
55
A summary of changes in the ALLL and the recorded investment in loans by segments follows:
Allowance for Loan Losses | |||||||||||||||||||||||
Year Ended December 31, 2016 | |||||||||||||||||||||||
Commercial | Agricultural | Residential Real Estate | Consumer | Unallocated | Total | ||||||||||||||||||
January 1, 2016 | $ | 2,171 | $ | 329 | $ | 3,330 | $ | 522 | $ | 1,048 | $ | 7,400 | |||||||||||
Charge-offs | (57 | ) | — | (574 | ) | (285 | ) | — | (916 | ) | |||||||||||||
Recoveries | 448 | 92 | 287 | 224 | — | 1,051 | |||||||||||||||||
Provision for loan losses | (748 | ) | 463 | (379 | ) | 163 | 366 | (135 | ) | ||||||||||||||
December 31, 2016 | $ | 1,814 | $ | 884 | $ | 2,664 | $ | 624 | $ | 1,414 | $ | 7,400 | |||||||||||
Allowance for Loan Losses | |||||||||||||||||||||||
Year Ended December 31, 2015 | |||||||||||||||||||||||
Commercial | Agricultural | Residential Real Estate | Consumer | Unallocated | Total | ||||||||||||||||||
January 1, 2015 | $ | 3,821 | $ | 216 | $ | 4,235 | $ | 645 | $ | 1,183 | $ | 10,100 | |||||||||||
Charge-offs | (89 | ) | (45 | ) | (397 | ) | (373 | ) | — | (904 | ) | ||||||||||||
Recoveries | 477 | 72 | 220 | 206 | — | 975 | |||||||||||||||||
Provision for loan losses | (2,038 | ) | 86 | (728 | ) | 44 | (135 | ) | (2,771 | ) | |||||||||||||
December 31, 2015 | $ | 2,171 | $ | 329 | $ | 3,330 | $ | 522 | $ | 1,048 | $ | 7,400 | |||||||||||
Allowance for Loan Losses and Recorded Investment in Loans | |||||||||||||||||||||||
As of December 31, 2016 | |||||||||||||||||||||||
Commercial | Agricultural | Residential Real Estate | Consumer | Unallocated | Total | ||||||||||||||||||
ALLL | |||||||||||||||||||||||
Individually evaluated for impairment | $ | 741 | $ | 1 | $ | 1,629 | $ | — | $ | — | $ | 2,371 | |||||||||||
Collectively evaluated for impairment | 1,073 | 883 | 1,035 | 624 | 1,414 | 5,029 | |||||||||||||||||
Total | $ | 1,814 | $ | 884 | $ | 2,664 | $ | 624 | $ | 1,414 | $ | 7,400 | |||||||||||
Loans | |||||||||||||||||||||||
Individually evaluated for impairment | $ | 7,859 | $ | 5,545 | $ | 8,638 | $ | 26 | $ | 22,068 | |||||||||||||
Collectively evaluated for impairment | 567,805 | 120,947 | 257,412 | 42,383 | 988,547 | ||||||||||||||||||
Total | $ | 575,664 | $ | 126,492 | $ | 266,050 | $ | 42,409 | $ | 1,010,615 | |||||||||||||
Allowance for Loan Losses and Recorded Investment in Loans | |||||||||||||||||||||||
As of December 31, 2015 | |||||||||||||||||||||||
Commercial | Agricultural | Residential Real Estate | Consumer | Unallocated | Total | ||||||||||||||||||
ALLL | |||||||||||||||||||||||
Individually evaluated for impairment | $ | 829 | $ | 2 | $ | 1,989 | $ | — | $ | — | $ | 2,820 | |||||||||||
Collectively evaluated for impairment | 1,342 | 327 | 1,341 | 522 | 1,048 | 4,580 | |||||||||||||||||
Total | $ | 2,171 | $ | 329 | $ | 3,330 | $ | 522 | $ | 1,048 | $ | 7,400 | |||||||||||
Loans | |||||||||||||||||||||||
Individually evaluated for impairment | $ | 7,969 | $ | 4,068 | $ | 10,266 | $ | 35 | $ | 22,338 | |||||||||||||
Collectively evaluated for impairment | 440,412 | 111,843 | 241,235 | 34,664 | 828,154 | ||||||||||||||||||
Total | $ | 448,381 | $ | 115,911 | $ | 251,501 | $ | 34,699 | $ | 850,492 | |||||||||||||
56
The following table displays the credit quality indicators for commercial and agricultural credit exposures based on internally assigned credit risk ratings as of December 31:
2016 | |||||||||||||||||||||||||||||||
Commercial | Agricultural | ||||||||||||||||||||||||||||||
Real Estate | Other | Advances to Mortgage Brokers | Total | Real Estate | Other | Total | Total | ||||||||||||||||||||||||
Rating | |||||||||||||||||||||||||||||||
1 - Excellent | $ | 28 | $ | 438 | $ | — | $ | 466 | $ | — | $ | — | $ | — | $ | 466 | |||||||||||||||
2 - High quality | 11,821 | 12,091 | 19,688 | 43,600 | 3,566 | 1,426 | 4,992 | 48,592 | |||||||||||||||||||||||
3 - High satisfactory | 103,529 | 41,982 | — | 145,511 | 21,657 | 11,388 | 33,045 | 178,556 | |||||||||||||||||||||||
4 - Low satisfactory | 299,317 | 74,432 | — | 373,749 | 48,955 | 22,715 | 71,670 | 445,419 | |||||||||||||||||||||||
5 - Special mention | 3,781 | 1,178 | — | 4,959 | 6,009 | 3,085 | 9,094 | 14,053 | |||||||||||||||||||||||
6 - Substandard | 5,901 | 1,474 | — | 7,375 | 3,650 | 3,508 | 7,158 | 14,533 | |||||||||||||||||||||||
7 - Vulnerable | 4 | — | — | 4 | — | 533 | 533 | 537 | |||||||||||||||||||||||
8 - Doubtful | — | — | — | — | — | — | — | — | |||||||||||||||||||||||
Total | $ | 424,381 | $ | 131,595 | $ | 19,688 | $ | 575,664 | $ | 83,837 | $ | 42,655 | $ | 126,492 | $ | 702,156 | |||||||||||||||
2015 | |||||||||||||||||||||||||||||||
Commercial | Agricultural | ||||||||||||||||||||||||||||||
Real Estate | Other | Advances to Mortgage Brokers | Total | Real Estate | Other | Total | Total | ||||||||||||||||||||||||
Rating | |||||||||||||||||||||||||||||||
1 - Excellent | $ | — | $ | 499 | $ | — | $ | 499 | $ | — | $ | — | $ | — | $ | 499 | |||||||||||||||
2 - High quality | 7,397 | 11,263 | — | 18,660 | 4,647 | 2,150 | 6,797 | 25,457 | |||||||||||||||||||||||
3 - High satisfactory | 99,136 | 29,286 | — | 128,422 | 28,886 | 13,039 | 41,925 | 170,347 | |||||||||||||||||||||||
4 - Low satisfactory | 222,431 | 62,987 | — | 285,418 | 37,279 | 22,166 | 59,445 | 344,863 | |||||||||||||||||||||||
5 - Special mention | 4,501 | 473 | — | 4,974 | 3,961 | 1,875 | 5,836 | 10,810 | |||||||||||||||||||||||
6 - Substandard | 9,941 | 256 | — | 10,197 | 1,623 | 139 | 1,762 | 11,959 | |||||||||||||||||||||||
7 - Vulnerable | 211 | — | — | 211 | 146 | — | 146 | 357 | |||||||||||||||||||||||
8 - Doubtful | — | — | — | — | — | — | — | — | |||||||||||||||||||||||
Total | $ | 343,617 | $ | 104,764 | $ | — | $ | 448,381 | $ | 76,542 | $ | 39,369 | $ | 115,911 | $ | 564,292 | |||||||||||||||
Internally assigned credit risk ratings are reviewed, at a minimum, when loans are renewed or when management has knowledge of improvements or deterioration of the credit quality of individual credits. Descriptions of the internally assigned credit risk ratings for commercial and agricultural loans are as follows:
1. EXCELLENT – Substantially Risk Free
Credit has strong financial condition and solid earnings history, characterized by:
• | High liquidity, strong cash flow, low leverage. |
• | Unquestioned ability to meet all obligations when due. |
• | Experienced management, with management succession in place. |
• | Secured by cash. |
2. HIGH QUALITY – Limited Risk
Credit with sound financial condition and a positive trend in earnings supplemented by:
• | Favorable liquidity and leverage ratios. |
• | Ability to meet all obligations when due. |
• | Management with successful track record. |
• | Steady and satisfactory earnings history. |
57
• | If loan is secured, collateral is of high quality and readily marketable. |
• | Access to alternative financing. |
• | Well defined primary and secondary source of repayment. |
• | If supported by guaranty, the financial strength and liquidity of the guarantor(s) are clearly evident. |
3. HIGH SATISFACTORY – Reasonable Risk
Credit with satisfactory financial condition and further characterized by:
• | Working capital adequate to support operations. |
• | Cash flow sufficient to pay debts as scheduled. |
• | Management experience and depth appear favorable. |
• | Loan performing according to terms. |
• | If loan is secured, collateral is acceptable and loan is fully protected. |
4. LOW SATISFACTORY – Acceptable Risk
Credit with bankable risks, although some signs of weaknesses are shown:
• | Would include most start-up businesses. |
• | Occasional instances of trade slowness or repayment delinquency – may have been 10-30 days slow within the past year. |
• | Management’s abilities are apparent, yet unproven. |
• | Weakness in primary source of repayment with adequate secondary source of repayment. |
• | Loan structure generally in accordance with policy. |
• | If secured, loan collateral coverage is marginal. |
• | Adequate cash flow to service debt, but coverage is low. |
To be classified as less than satisfactory, only one of the following criteria must be met.
5. SPECIAL MENTION – Criticized
Credit constitutes an undue and unwarranted credit risk but not to the point of justifying a classification of substandard. The credit risk may be relatively minor yet constitute an unwarranted risk in light of the circumstances surrounding a specific loan:
• | Downward trend in sales, profit levels, and margins. |
• | Impaired working capital position. |
• | Cash flow is strained in order to meet debt repayment. |
• | Loan delinquency (30-60 days) and overdrafts may occur. |
• | Shrinking equity cushion. |
• | Diminishing primary source of repayment and questionable secondary source. |
• | Management abilities are questionable. |
• | Weak industry conditions. |
• | Litigation pending against the borrower. |
• | Collateral or guaranty offers limited protection. |
• | Negative debt service coverage, however the credit is well collateralized and payments are current. |
6. SUBSTANDARD – Classified
Credit where the borrower’s current net worth, paying capacity, and value of the collateral pledged is inadequate. There is a distinct possibility that we will implement collection procedures if the loan deficiencies are not corrected. In addition, the following characteristics may apply:
• | Sustained losses have severely eroded the equity and cash flow. |
• | Deteriorating liquidity. |
58
• | Serious management problems or internal fraud. |
• | Original repayment terms liberalized. |
• | Likelihood of bankruptcy. |
• | Inability to access other funding sources. |
• | Reliance on secondary source of repayment. |
• | Litigation filed against borrower. |
• | Collateral provides little or no value. |
• | Requires excessive attention of the loan officer. |
• | Borrower is uncooperative with loan officer. |
7. VULNERABLE – Classified
Credit is considered “Substandard” and warrants placing on nonaccrual status. Risk of loss is being evaluated and exit strategy options are under review. Other characteristics that may apply:
• | Insufficient cash flow to service debt. |
• | Minimal or no payments being received. |
• | Limited options available to avoid the collection process. |
• | Transition status, expect action will take place to collect loan without immediate progress being made. |
8. DOUBTFUL – Workout
Credit has all the weaknesses inherent in a “Substandard” loan with the added characteristic that collection and/or liquidation is pending. The possibility of a loss is extremely high, but its classification as a loss is deferred until liquidation procedures are completed, or reasonably estimable. Other characteristics that may apply:
• | Normal operations are severely diminished or have ceased. |
• | Seriously impaired cash flow. |
• | Original repayment terms materially altered. |
• | Secondary source of repayment is inadequate. |
• | Survivability as a “going concern” is impossible. |
• | Collection process has begun. |
• | Bankruptcy petition has been filed. |
• | Judgments have been filed. |
• | Portion of the loan balance has been charged-off. |
59
Our primary credit quality indicator for residential real estate and consumer loans is the individual loan’s past due aging. The following tables summarize the past due and current loans as of December 31:
2016 | |||||||||||||||||||||||||||
Accruing Interest and Past Due: | Total Past Due and Nonaccrual | ||||||||||||||||||||||||||
30-59 Days | 60-89 Days | 90 Days or More | Nonaccrual | Current | Total | ||||||||||||||||||||||
Commercial | |||||||||||||||||||||||||||
Commercial real estate | $ | 1,580 | $ | — | $ | 35 | $ | 4 | $ | 1,619 | $ | 422,762 | $ | 424,381 | |||||||||||||
Commercial other | 1,693 | 35 | — | — | 1,728 | 129,867 | 131,595 | ||||||||||||||||||||
Advances to mortgage brokers | — | — | — | — | — | 19,688 | 19,688 | ||||||||||||||||||||
Total commercial | 3,273 | 35 | 35 | 4 | 3,347 | 572,317 | 575,664 | ||||||||||||||||||||
Agricultural | |||||||||||||||||||||||||||
Agricultural real estate | 191 | — | 508 | — | 699 | 83,138 | 83,837 | ||||||||||||||||||||
Agricultural other | 19 | — | — | 533 | 552 | 42,103 | 42,655 | ||||||||||||||||||||
Total agricultural | 210 | — | 508 | 533 | 1,251 | 125,241 | 126,492 | ||||||||||||||||||||
Residential real estate | |||||||||||||||||||||||||||
Senior liens | 1,638 | 174 | 22 | 498 | 2,332 | 216,681 | 219,013 | ||||||||||||||||||||
Junior liens | 15 | — | — | 25 | 40 | 8,317 | 8,357 | ||||||||||||||||||||
Home equity lines of credit | 270 | 6 | 68 | — | 344 | 38,336 | 38,680 | ||||||||||||||||||||
Total residential real estate | 1,923 | 180 | 90 | 523 | 2,716 | 263,334 | 266,050 | ||||||||||||||||||||
Consumer | |||||||||||||||||||||||||||
Secured | 110 | — | — | — | 110 | 38,582 | 38,692 | ||||||||||||||||||||
Unsecured | 5 | — | — | — | 5 | 3,712 | 3,717 | ||||||||||||||||||||
Total consumer | 115 | — | — | — | 115 | 42,294 | 42,409 | ||||||||||||||||||||
Total | $ | 5,521 | $ | 215 | $ | 633 | $ | 1,060 | $ | 7,429 | $ | 1,003,186 | $ | 1,010,615 | |||||||||||||
60
2015 | |||||||||||||||||||||||||||
Accruing Interest and Past Due: | Total Past Due and Nonaccrual | ||||||||||||||||||||||||||
30-59 Days | 60-89 Days | 90 Days or More | Nonaccrual | Current | Total | ||||||||||||||||||||||
Commercial | |||||||||||||||||||||||||||
Commercial real estate | $ | 505 | $ | 281 | $ | — | $ | 211 | $ | 997 | $ | 342,620 | $ | 343,617 | |||||||||||||
Commercial other | 18 | — | — | — | 18 | 104,746 | 104,764 | ||||||||||||||||||||
Advances to mortgage brokers | — | — | — | — | — | — | — | ||||||||||||||||||||
Total commercial | 523 | 281 | — | 211 | 1,015 | 447,366 | 448,381 | ||||||||||||||||||||
Agricultural | |||||||||||||||||||||||||||
Agricultural real estate | 196 | 890 | — | 146 | 1,232 | 75,310 | 76,542 | ||||||||||||||||||||
Agricultural other | — | — | — | — | — | 39,369 | 39,369 | ||||||||||||||||||||
Total agricultural | 196 | 890 | — | 146 | 1,232 | 114,679 | 115,911 | ||||||||||||||||||||
Residential real estate | |||||||||||||||||||||||||||
Senior liens | 1,551 | 261 | — | 429 | 2,241 | 199,622 | 201,863 | ||||||||||||||||||||
Junior liens | 40 | 8 | — | 6 | 54 | 9,325 | 9,379 | ||||||||||||||||||||
Home equity lines of credit | 225 | — | — | — | 225 | 40,034 | 40,259 | ||||||||||||||||||||
Total residential real estate | 1,816 | 269 | — | 435 | 2,520 | 248,981 | 251,501 | ||||||||||||||||||||
Consumer | |||||||||||||||||||||||||||
Secured | 27 | — | — | — | 27 | 30,839 | 30,866 | ||||||||||||||||||||
Unsecured | 4 | — | — | — | 4 | 3,829 | 3,833 | ||||||||||||||||||||
Total consumer | 31 | — | — | — | 31 | 34,668 | 34,699 | ||||||||||||||||||||
Total | $ | 2,566 | $ | 1,440 | $ | — | $ | 792 | $ | 4,798 | $ | 845,694 | $ | 850,492 | |||||||||||||
Impaired Loans
Loans may be classified as impaired if they meet one or more of the following criteria:
1. | There has been a charge-off of its principal balance (in whole or in part); |
2. | The loan has been classified as a TDR; or |
3. | The loan is in nonaccrual status. |
Impairment is measured on a loan-by-loan basis for commercial and agricultural loans by comparing the loan’s outstanding balance to the present value of expected future cash flows discounted at the loan’s effective interest rate, the loan’s obtainable market price, or the fair value of the collateral, less cost to sell, if the loan is collateral dependent. Large groups of smaller balance homogeneous loans are collectively evaluated for impairment. Impairment is measured on a loan-by-loan basis for residential real estate and consumer loans by comparing the loan’s unpaid principal balance to the present value of expected future cash flows discounted at the loan’s effective interest rate.
61
We do not recognize interest income on impaired loans in nonaccrual status. For impaired loans not classified as nonaccrual, interest income is recognized daily, as earned, according to the terms of the loan agreement and the principal amount outstanding. The following summarizes information pertaining to impaired loans as of, and for the years ended, December 31:
2016 | |||||||||||||||||||
Outstanding Balance | Unpaid Principal Balance | Valuation Allowance | Average Outstanding Balance | Interest Income Recognized | |||||||||||||||
Impaired loans with a valuation allowance | |||||||||||||||||||
Commercial real estate | $ | 5,811 | $ | 5,992 | $ | 716 | $ | 5,746 | $ | 343 | |||||||||
Commercial other | 1,358 | 1,358 | 25 | 568 | 27 | ||||||||||||||
Agricultural real estate | — | — | — | 91 | 6 | ||||||||||||||
Agricultural other | 134 | 134 | 1 | 92 | 2 | ||||||||||||||
Residential real estate senior liens | 8,464 | 9,049 | 1,615 | 9,214 | 362 | ||||||||||||||
Residential real estate junior liens | 72 | 82 | 14 | 113 | 3 | ||||||||||||||
Home equity lines of credit | — | — | — | — | — | ||||||||||||||
Consumer secured | — | — | — | — | — | ||||||||||||||
Total impaired loans with a valuation allowance | 15,839 | 16,615 | 2,371 | 15,824 | 743 | ||||||||||||||
Impaired loans without a valuation allowance | |||||||||||||||||||
Commercial real estate | 604 | 617 | 895 | 69 | |||||||||||||||
Commercial other | 86 | 97 | 87 | 8 | |||||||||||||||
Agricultural real estate | 4,037 | 4,037 | 3,515 | 182 | |||||||||||||||
Agricultural other | 1,374 | 1,374 | 708 | 42 | |||||||||||||||
Home equity lines of credit | 102 | 402 | 115 | 16 | |||||||||||||||
Consumer secured | 26 | 26 | 32 | 3 | |||||||||||||||
Total impaired loans without a valuation allowance | 6,229 | 6,553 | 5,352 | 320 | |||||||||||||||
Impaired loans | |||||||||||||||||||
Commercial | 7,859 | 8,064 | 741 | 7,296 | 447 | ||||||||||||||
Agricultural | 5,545 | 5,545 | 1 | 4,406 | 232 | ||||||||||||||
Residential real estate | 8,638 | 9,533 | 1,629 | 9,442 | 381 | ||||||||||||||
Consumer | 26 | 26 | — | 32 | 3 | ||||||||||||||
Total impaired loans | $ | 22,068 | $ | 23,168 | $ | 2,371 | $ | 21,176 | $ | 1,063 | |||||||||
62
2015 | |||||||||||||||||||
Outstanding Balance | Unpaid Principal Balance | Valuation Allowance | Average Outstanding Balance | Interest Income Recognized | |||||||||||||||
Impaired loans with a valuation allowance | |||||||||||||||||||
Commercial real estate | $ | 5,659 | $ | 5,777 | $ | 818 | $ | 7,221 | $ | 376 | |||||||||
Commercial other | 8 | 8 | 11 | 362 | 19 | ||||||||||||||
Agricultural real estate | — | — | — | 22 | 1 | ||||||||||||||
Agricultural other | 335 | 335 | 2 | 126 | 8 | ||||||||||||||
Residential real estate senior liens | 9,996 | 10,765 | 1,959 | 10,610 | 425 | ||||||||||||||
Residential real estate junior liens | 143 | 163 | 30 | 183 | 16 | ||||||||||||||
Home equity lines of credit | — | — | — | 31 | — | ||||||||||||||
Consumer secured | — | — | — | 39 | 3 | ||||||||||||||
Total impaired loans with a valuation allowance | 16,141 | 17,048 | 2,820 | 18,594 | 848 | ||||||||||||||
Impaired loans without a valuation allowance | |||||||||||||||||||
Commercial real estate | 2,122 | 2,256 | 2,170 | 201 | |||||||||||||||
Commercial other | 180 | 191 | 106 | 11 | |||||||||||||||
Agricultural real estate | 3,549 | 3,549 | 1,903 | 95 | |||||||||||||||
Agricultural other | 184 | 184 | 290 | 15 | |||||||||||||||
Home equity lines of credit | 127 | 434 | 144 | 18 | |||||||||||||||
Consumer secured | 35 | 35 | 6 | 1 | |||||||||||||||
Total impaired loans without a valuation allowance | 6,197 | 6,649 | 4,619 | 341 | |||||||||||||||
Impaired loans | |||||||||||||||||||
Commercial | 7,969 | 8,232 | 829 | 9,859 | 607 | ||||||||||||||
Agricultural | 4,068 | 4,068 | 2 | 2,341 | 119 | ||||||||||||||
Residential real estate | 10,266 | 11,362 | 1,989 | 10,968 | 459 | ||||||||||||||
Consumer | 35 | 35 | — | 45 | 4 | ||||||||||||||
Total impaired loans | $ | 22,338 | $ | 23,697 | $ | 2,820 | $ | 23,213 | $ | 1,189 | |||||||||
We had committed to advance $117 and $0 in connection with impaired loans, which include TDRs, as of December 31, 2016 and 2015, respectively.
Troubled Debt Restructurings
Loan modifications are considered to be TDRs when the modification includes terms outside of normal lending practices to a borrower who is experiencing financial difficulties.
Typical concessions granted include, but are not limited to:
• | Agreeing to interest rates below prevailing market rates for debt with similar risk characteristics. |
• | Extending the amortization period beyond typical lending guidelines for loans with similar risk characteristics. |
• | Forgiving principal. |
• | Forgiving accrued interest. |
To determine if a borrower is experiencing financial difficulties, factors we consider include:
• | The borrower is currently in default on any of their debt. |
• | The borrower would likely default on any of their debt if the concession was not granted. |
• | The borrower’s cash flow was insufficient to service all of their debt if the concession was not granted. |
• | The borrower has declared, or is in the process of declaring, bankruptcy. |
• | The borrower is unlikely to continue as a going concern (if the entity is a business). |
63
The following is a summary of information pertaining to TDRs granted in the years ended December 31:
2016 | 2015 | ||||||||||||||||||||
Number of Loans | Pre-Modification Recorded Investment | Post-Modification Recorded Investment | Number of Loans | Pre-Modification Recorded Investment | Post-Modification Recorded Investment | ||||||||||||||||
Commercial other | 6 | $ | 2,066 | $ | 2,066 | 13 | $ | 3,073 | $ | 3,073 | |||||||||||
Agricultural other | 7 | 1,610 | 1,610 | 11 | 3,106 | 3,106 | |||||||||||||||
Residential real estate | |||||||||||||||||||||
Senior liens | 4 | 143 | 143 | 6 | 678 | 678 | |||||||||||||||
Junior liens | — | — | — | 1 | 30 | 30 | |||||||||||||||
Home equity lines of credit | — | — | — | 1 | 94 | 94 | |||||||||||||||
Total residential real estate | 4 | 143 | 143 | 8 | 802 | 802 | |||||||||||||||
Consumer unsecured | 1 | 2 | 2 | — | — | — | |||||||||||||||
Total | 18 | $ | 3,821 | $ | 3,821 | 32 | $ | 6,981 | $ | 6,981 | |||||||||||
The following tables summarize concessions we granted to borrowers in financial difficulty in the years ended December 31:
2016 | 2015 | ||||||||||||||||||||||||||
Below Market Interest Rate | Below Market Interest Rate and Extension of Amortization Period | Below Market Interest Rate | Below Market Interest Rate and Extension of Amortization Period | ||||||||||||||||||||||||
Number of Loans | Pre-Modification Recorded Investment | Number of Loans | Pre-Modification Recorded Investment | Number of Loans | Pre-Modification Recorded Investment | Number of Loans | Pre-Modification Recorded Investment | ||||||||||||||||||||
Commercial other | — | $ | — | 6 | $ | 2,066 | 11 | $ | 2,742 | 2 | $ | 331 | |||||||||||||||
Agricultural other | 2 | 419 | 5 | 1,191 | 9 | 1,360 | 2 | 1,746 | |||||||||||||||||||
Residential real estate | |||||||||||||||||||||||||||
Senior liens | 2 | 27 | 2 | 116 | 3 | 280 | 3 | 398 | |||||||||||||||||||
Junior liens | — | — | — | — | — | — | 1 | 30 | |||||||||||||||||||
Home equity lines of credit | — | — | — | — | — | — | 1 | 94 | |||||||||||||||||||
Total residential real estate | 2 | 27 | 2 | 116 | 3 | 280 | 5 | 522 | |||||||||||||||||||
Consumer unsecured | — | — | 1 | 2 | — | — | — | — | |||||||||||||||||||
Total | 4 | $ | 446 | 14 | $ | 3,375 | 23 | $ | 4,382 | 9 | $ | 2,599 | |||||||||||||||
We did not restructure any loans by forgiving principal or accrued interest during 2016 or 2015.
Based on our historical loss experience, losses associated with TDRs are not significantly different than other impaired loans within the same loan segment. As such, TDRs, including TDRs that have been modified in the past 12 months that subsequently defaulted, are analyzed in the same manner as other impaired loans within their respective loan segment.
We had no loans that defaulted in the year ended December 31, 2016 which were modified within 12 months prior to the default date. Following is a summary of loans that defaulted in the year ended December 31, 2015, which were modified within 12 months prior to the default date:
Number of Loans | Pre- Default Recorded Investment | Charge-Off Recorded Upon Default | Post- Default Recorded Investment | |||||||||||
Commercial other | 1 | $ | 216 | $ | 25 | $ | 191 | |||||||
Residential real estate junior liens | 1 | 39 | 39 | — | ||||||||||
Total | 2 | $ | 255 | $ | 64 | $ | 191 | |||||||
64
The following is a summary of TDR loan balances as of December 31:
2016 | 2015 | ||||||
TDRs | $ | 21,382 | $ | 21,325 | |||
Note 6 – Premises and Equipment
A summary of premises and equipment at December 31 follows:
2016 | 2015 | ||||||
Land | $ | 6,336 | $ | 6,190 | |||
Buildings and improvements | 28,941 | 27,580 | |||||
Furniture and equipment | 33,125 | 31,568 | |||||
Total | 68,402 | 65,338 | |||||
Less: accumulated depreciation | 39,088 | 37,007 | |||||
Premises and equipment, net | $ | 29,314 | $ | 28,331 | |||
Depreciation expense amounted to $2,821, $2,677, and $2,551 in 2016, 2015, and 2014, respectively.
Note 7 – Goodwill and Other Intangible Assets
The carrying amount of goodwill was $48,282 at December 31, 2016 and 2015.
Identifiable intangible assets were as follows as of December 31:
2016 | |||||||||||
Gross Intangible Assets | Accumulated Amortization | Net Intangible Assets | |||||||||
Core deposit premium resulting from acquisitions | $ | 5,579 | $ | 5,195 | $ | 384 | |||||
2015 | |||||||||||
Gross Intangible Assets | Accumulated Amortization | Net Intangible Assets | |||||||||
Core deposit premium resulting from acquisitions | $ | 5,579 | $ | 5,033 | $ | 546 | |||||
Amortization expense associated with identifiable intangible assets was $162, $169, and $183 in 2016, 2015, and 2014, respectively.
Estimated amortization expense associated with identifiable intangibles for each of the next five years succeeding December 31, 2016, and thereafter is as follows:
Estimated Amortization Expense | |||
2017 | $ | 119 | |
2018 | 96 | ||
2019 | 71 | ||
2020 | 48 | ||
2021 | 29 | ||
Thereafter | 21 | ||
Total | $ | 384 | |
65
Note 8 – Foreclosed Assets
Foreclosed assets are included in other assets in the consolidated balance sheets and consist of other real estate owned and repossessed assets. The following is a summary of foreclosed assets as of December 31:
2016 | 2015 | ||||||
Consumer mortgage loans collateralized by residential real estate foreclosed as a result of obtaining physical possession | $ | 18 | $ | — | |||
All other foreclosed assets | 213 | 421 | |||||
Total | $ | 231 | $ | 421 | |||
Below is a summary of changes in foreclosed assets during the years ended December 31:
2016 | 2015 | ||||||
Balance, January 1 | $ | 421 | $ | 885 | |||
Properties transferred | 306 | 1,158 | |||||
Impairments | (10 | ) | (99 | ) | |||
Proceeds from sale | (486 | ) | (1,523 | ) | |||
Balance, December 31 | $ | 231 | $ | 421 | |||
There were $18 and $56 consumer mortgage loans collateralized by residential real estate in the process of foreclosure as of December 31, 2016 and 2015.
Note 9 – Deposits
Scheduled maturities of time deposits for the next five years, and thereafter, are as follows:
Scheduled Maturities of Time Deposits | |||
2017 | $ | 196,467 | |
2018 | 82,049 | ||
2019 | 45,110 | ||
2020 | 33,929 | ||
2021 | 50,978 | ||
Thereafter | 24,881 | ||
Total | $ | 433,414 | |
Interest expense on time deposits greater than $100 was $2,937 in 2016, $2,806 in 2015 and $2,920 in 2014.
Note 10 – Borrowed Funds
Borrowed funds consist of the following obligations at December 31:
2016 | 2015 | ||||||||||||
Amount | Rate | Amount | Rate | ||||||||||
FHLB advances | $ | 270,000 | 1.82 | % | $ | 235,000 | 1.93 | % | |||||
Securities sold under agreements to repurchase without stated maturity dates | 60,894 | 0.13 | % | 70,532 | 0.12 | % | |||||||
Federal funds purchased | 6,800 | 1.00 | % | 4,200 | 0.75 | % | |||||||
Total | $ | 337,694 | 1.50 | % | $ | 309,732 | 1.50 | % | |||||
FHLB advances are collateralized by a blanket lien on all qualified 1-4 family residential real estate loans, specific AFS securities, and FHLB stock.
66
The following table lists the maturities and weighted average interest rates of FHLB advances as of December 31:
2016 | 2015 | ||||||||||||
Amount | Rate | Amount | Rate | ||||||||||
Fixed rate due 2016 | $ | — | — | $ | 30,000 | 1.25 | % | ||||||
Variable rate due 2016 | — | — | 15,000 | 0.62 | % | ||||||||
Fixed rate due 2017 | 70,000 | 1.39 | % | 50,000 | 1.56 | % | |||||||
Fixed rate due 2018 | 50,000 | 2.16 | % | 50,000 | 2.16 | % | |||||||
Fixed rate due 2019 | 60,000 | 1.99 | % | 40,000 | 2.35 | % | |||||||
Fixed rate due 2020 | 10,000 | 1.98 | % | 10,000 | 1.98 | % | |||||||
Fixed rate due 2021 | 50,000 | 1.91 | % | 30,000 | 2.26 | % | |||||||
Variable rate due 2021 1 | 10,000 | 1.21 | % | — | — | ||||||||
Fixed rate due 2023 | 10,000 | 3.90 | % | 10,000 | 3.90 | % | |||||||
Fixed rate due 2026 | 10,000 | 1.17 | % | — | — | ||||||||
Total | $ | 270,000 | 1.82 | % | $ | 235,000 | 1.93 | % | |||||
(1) | Hedged advance (see "Derivative Instruments" section below) |
Securities sold under agreements to repurchase are classified as secured borrowings and are reflected at the amount of cash received in connection with the transaction. The securities underlying the agreements have a carrying value and a fair value of $60,918 and $70,555 at December 31, 2016 and 2015, respectively. Such securities remain under our control. We may be required to provide additional collateral based on the fair value of underlying securities.
Securities sold under repurchase agreements without stated maturity dates, federal funds purchased, and FRB Discount Window advances generally mature within one to four days from the transaction date. The following table provides a summary of securities sold under repurchase agreements without stated maturity dates and federal funds purchased. We had no FRB Discount Window advances for the years ended December 31, 2016 and 2015.
December 31, 2016 | December 31, 2015 | ||||||||||||||||||||
Maximum Month End Balance | Average Balance | Weighted Average Interest Rate During the Period | Maximum Month End Balance | Average Balance | Weighted Average Interest Rate During the Period | ||||||||||||||||
Securities sold under agreements to repurchase without stated maturity dates | $ | 61,783 | $ | 57,702 | 0.09 | % | $ | 84,859 | $ | 70,368 | 0.13 | % | |||||||||
Federal funds purchased | 27,300 | 8,546 | 0.60 | % | 13,100 | 5,783 | 0.50 | % | |||||||||||||
We had pledged AFS securities and 1-4 family residential real estate loans in the following amounts at December 31:
2016 | 2015 | ||||||
Pledged to secure borrowed funds | $ | 363,427 | $ | 339,078 | |||
Pledged to secure repurchase agreements | 60,918 | 70,555 | |||||
Pledged for public deposits and for other purposes necessary or required by law | 33,916 | 39,038 | |||||
Total | $ | 458,261 | $ | 448,671 | |||
AFS securities pledged to repurchase agreements without stated maturity dates consisted of the following at December 31:
2016 | 2015 | ||||||
States and political subdivisions | $ | 5,676 | $ | 3,639 | |||
Mortgage-backed securities | 11,383 | 23,075 | |||||
Collateralized mortgage obligations | 43,859 | 43,841 | |||||
Total | $ | 60,918 | $ | 70,555 | |||
AFS securities pledged to repurchase agreements are monitored to ensure the appropriate level is collateralized. In the event of maturities, calls, significant principal repayments, or significant decline in market values, we have adequate levels of AFS securities available to pledge to satisfy required collateral.
67
As of December 31, 2016, we had the ability to borrow up to an additional $99,118, based on assets pledged as collateral. We had no investment securities that are restricted to be pledged for specific purposes.
Derivative Instruments
During the second quarter of 2016, we began to enter into interest rate swaps to manage exposure to interest rate risk and variability in cash flows. The interest rate swaps, associated with our variable rate borrowings, are designated upon inception as cash flow hedges of forecasted interest payments. We enter into LIBOR-based interest rate swaps that involve the receipt of variable amounts in exchange for fixed rate payments, in effect converting variable rate debt to fixed rate debt.
Cash flow hedges are assessed for effectiveness using regression analysis. The effective portion of changes in fair value are recorded in OCI and subsequently reclassified into interest expense in the same period in which the related interest on the variable rate borrowings affects earnings. In the event that a portion of the changes in fair value were determined to be ineffective, the ineffective amount would be recorded in earnings.
The following table provides information on derivatives related to variable rate borrowings as of December 31, 2016.
Pay Rate | Receive Rate | Remaining Life (Years) | Notional Amount | Balance Sheet Location | Fair Value | |||||||||||
Derivatives designated as hedging instruments | ||||||||||||||||
Cash Flow Hedges: | ||||||||||||||||
Interest rate swaps | 1.56 | % | 3-Month LIBOR | 4.3 | $ | 10,000 | Other Assets | $ | 248 | |||||||
Derivatives contain an element of credit risk which arises from the possibility that we will incur a loss as a result of a counterparty failing to meet its contractual obligations. Credit risk is minimized through counterparty collateral, transaction limits and monitoring procedures. We also manage dealer credit risk by entering into interest rate derivatives only with primary and highly rated counterparties, the use of ISDA master agreements and counterparties limits. We do not anticipate any losses from failure of interest rate derivative counterparties to honor their obligations.
Note 11 – Other Noninterest Expenses
A summary of expenses included in other noninterest expenses is as follows for the years ended December 31:
2016 | 2015 | 2014 | |||||||||
Audit and related fees | $ | 944 | $ | 889 | $ | 809 | |||||
Director fees | 851 | 827 | 775 | ||||||||
Consulting fees | 800 | 487 | 349 | ||||||||
OTTI on AFS securities | 770 | — | — | ||||||||
FDIC insurance premiums | 719 | 813 | 842 | ||||||||
Marketing costs | 586 | 497 | 427 | ||||||||
Donations and community relations | 582 | 841 | 1,004 | ||||||||
Education and travel | 536 | 343 | 461 | ||||||||
Loan underwriting fees | 535 | 347 | 361 | ||||||||
Postage and freight | 396 | 381 | 397 | ||||||||
Printing and supplies | 391 | 461 | 367 | ||||||||
Legal fees | 208 | 295 | 320 | ||||||||
Amortization of deposit premium | 162 | 169 | 183 | ||||||||
Other losses | 241 | 150 | 250 | ||||||||
All other | 1,305 | 1,559 | 1,740 | ||||||||
Total other | $ | 9,026 | $ | 8,059 | $ | 8,285 | |||||
68
Note 12 – Federal Income Taxes
Components of the consolidated provision for federal income taxes are as follows for the years ended December 31:
2016 | 2015 | 2014 | |||||||||
Currently payable | $ | 2,630 | $ | 1,596 | $ | 2,159 | |||||
Deferred expense (benefit) | (282 | ) | 1,692 | 185 | |||||||
Income tax expense | $ | 2,348 | $ | 3,288 | $ | 2,344 | |||||
The reconciliation of the provision for federal income taxes and the amount computed at the federal statutory tax rate of 34% of income before federal income tax expense is as follows for the year ended December 31:
2016 | 2015 | 2014 | |||||||||
Income taxes at 34% statutory rate | $ | 5,490 | $ | 6,262 | $ | 5,463 | |||||
Effect of nontaxable income | |||||||||||
Interest income on tax exempt municipal securities | (1,938 | ) | (2,026 | ) | (1,999 | ) | |||||
Earnings on corporate owned life insurance policies | (419 | ) | (262 | ) | (255 | ) | |||||
Other | (154 | ) | (88 | ) | (263 | ) | |||||
Total effect of nontaxable income | (2,511 | ) | (2,376 | ) | (2,517 | ) | |||||
Effect of nondeductible expenses | 143 | 157 | 156 | ||||||||
Effect of tax credits | (774 | ) | (755 | ) | (758 | ) | |||||
Federal income tax expense | $ | 2,348 | $ | 3,288 | $ | 2,344 | |||||
Deferred income taxes reflect the net tax effects of temporary differences between the carrying amounts of assets and liabilities for financial reporting purposes and the amounts used for federal income tax purposes. Significant components of our deferred tax assets and liabilities, included in other assets in the accompanying consolidated balance sheets, are as follows as of December 31:
2016 | 2015 | ||||||
Deferred tax assets | |||||||
Allowance for loan losses | $ | 1,576 | $ | 1,582 | |||
Deferred directors’ fees | 2,758 | 2,549 | |||||
Employee benefit plans | 115 | 229 | |||||
Core deposit premium and acquisition expenses | 1,157 | 1,098 | |||||
Net unrecognized actuarial losses on pension plan | 1,531 | 1,708 | |||||
Life insurance death benefit payable | 804 | 804 | |||||
Alternative minimum tax | 717 | 650 | |||||
Other | 618 | 53 | |||||
Total deferred tax assets | 9,276 | 8,673 | |||||
Deferred tax liabilities | |||||||
Prepaid pension cost | 809 | 890 | |||||
Premises and equipment | 115 | 166 | |||||
Accretion on securities | 58 | 55 | |||||
Core deposit premium and acquisition expenses | 1,403 | 1,289 | |||||
Net unrealized gains on available-for-sale securities | 418 | 2,252 | |||||
Net unrealized gains on derivative instruments | 84 | — | |||||
Other | 1,502 | 989 | |||||
Total deferred tax liabilities | 4,389 | 5,641 | |||||
Net deferred tax assets | $ | 4,887 | $ | 3,032 | |||
69
We are subject to U.S. federal income tax; however, we are no longer subject to examination by taxing authorities for years before 2013. There are no material uncertain tax positions requiring recognition in our consolidated financial statements. We do not expect the total amount of unrecognized tax benefits to significantly increase in the next twelve months.
We recognize interest and/or penalties related to income tax matters in income tax expense. We do not have any amounts accrued for interest and penalties at December 31, 2016 and 2015 and we not aware of any claims for such amounts by federal income tax authorities.
Note 13 – Off-Balance-Sheet Activities
Credit-Related Financial Instruments
We are party to credit related financial instruments with off-balance-sheet risk. These financial instruments are entered into in the normal course of business to meet the financing needs of our customers. These financial instruments, which include commitments to extend credit and standby letters of credit, involve, to varying degrees, elements of credit and IRR in excess of the amounts recognized in the consolidated balance sheets. The contract or notional amounts of these instruments reflect the extent of involvement we have in a particular class of financial instrument.
The following table summarizes our credit related financial instruments with off-balance-sheet risk as of:
December 31 | |||||||
2016 | 2015 | ||||||
Unfunded commitments under lines of credit | $ | 168,840 | $ | 134,412 | |||
Commercial and standby letters of credit | 1,223 | 915 | |||||
Commitments to grant loans | 29,339 | 53,946 | |||||
Unfunded commitments under lines of credit are commitments for possible future extensions of credit to existing customers. These commitments may expire without being drawn upon and do not necessarily represent future cash requirements. Advances to mortgage brokers are also included in unfunded commitments under lines of credit. The balance is the difference between our outstanding balances and maximum outstanding aggregate amount.
Commitments to grant loans are agreements to lend to a customer as long as there is no violation of any condition established in the contract. Commitments generally have fixed expiration dates or other termination clauses and may require payment of a fee. The amount of collateral obtained, if we deem necessary, is based on management's credit evaluation of the customer. Commitments to grant loans include residential mortgage loans with the majority being loans committed to be sold to the secondary market.
Commercial and standby letters of credit are conditional commitments we issued to guarantee the performance of a customer to a third party. Those guarantees are primarily issued to support private borrowing arrangements, including commercial paper, bond financing, and similar transactions. These commitments to extend credit and letters of credit generally mature within one year. The credit risk involved in these transactions is essentially the same as that involved in extending loans to customers. We evaluate each customer’s credit worthiness on a case-by-case basis. The amount of collateral obtained, if we deem necessary upon the extension of credit, is based on our credit evaluation of the borrower. While we consider standby letters of credit to be guarantees, the amount of the liability related to such guarantees on the commitment date is not significant and a liability related to such guarantees is not recorded on the consolidated balance sheets.
Our exposure to credit-related loss in the event of nonperformance by the counter parties to the financial instruments for commitments to extend credit and standby letters of credit could be up to the contractual notional amount of those instruments. We use the same credit policies in deciding to make these commitments as we do for extending loans to customers. No significant losses are anticipated as a result of these commitments.
Note 14 – On-Balance Sheet Activities
Derivative Loan Commitments
Mortgage loan commitments are referred to as derivative loan commitments if the loan that will result from exercise of the commitment will be held for sale upon funding. We enter into commitments to fund residential mortgage loans at specific times in the future, with the intention that these loans will subsequently be sold in the secondary market. A mortgage loan commitment binds us to lend funds to a potential borrower at a specified interest rate within a specified period of time, generally up to 60 days after inception of the rate lock.
70
Outstanding derivative loan commitments expose us to the risk that the price of the loans arising from the exercise of the loan commitment might decline from the inception of the rate lock to funding of the loan due to increases in mortgage interest rates. If interest rates increase, the value of these loan commitments decreases. Conversely, if interest rates decrease, the value of these loan commitments increase. The notional amount of undesignated interest rate lock commitments was $750 and $234 at December 31, 2016 and 2015, respectively.
Forward Loan Sale Commitments
To protect against the price risk inherent in derivative loan commitments, we utilize both “mandatory delivery” and “best efforts” forward loan sale commitments to mitigate the risk of potential decreases in the values of loan that would result from the exercise of the derivative loan commitments.
With a “mandatory delivery” contract, we commit to deliver a certain principal amount of mortgage loans to an investor at a specified price on or before a specified date. If we fail to deliver the amount of mortgages necessary to fulfill the commitment by the specified date, we are obligated to pay a “pair-off” fee, based on then current market prices, to the investor to compensate the investor for the shortfall.
With a “best efforts” contract, we commit to deliver an individual mortgage loan of a specified principal amount and quality to an investor if the loan to the underlying borrower closes. Generally, the price the investor will pay the seller for an individual loan is specified prior to the loan being funded (e.g. on the same day the lender commits to lend funds to a potential borrower).
We expect that these forward loan sale commitments will experience changes in fair value opposite to the change in fair value of derivative loan commitments. The notional amount of undesignated forward loan sale commitments was $1,877 and $1,421 at December 31, 2016 and 2015, respectively.
The fair values of the rate lock loan commitments related to the origination of mortgage loans that will be held for sale and the forward loan sale commitments are deemed insignificant by management and, accordingly, are not recorded in our consolidated financial statements.
Note 15 – Commitments and Other Matters
Banking regulations require us to maintain cash reserve balances in currency or as deposits with the FRB. At December 31, 2016 and 2015, the reserve balances amounted to $1,273 and $1,169, respectively.
Banking regulations limit the transfer of assets in the form of dividends, loans, or advances from the Bank to the Corporation. At December 31, 2016, substantially all of the Bank’s assets were restricted from transfer to the Corporation in the form of loans or advances. Consequently, Bank dividends are the principal source of funds for the Corporation. Payment of dividends without regulatory approval is limited to the current year’s retained net income plus retained net income for the preceding two years, less any required transfers to common stock. At January 1, 2017, the amount available to the Corporation for dividends from the Bank, without regulatory approval, was approximately $25,600.
Note 16 – Minimum Regulatory Capital Requirements
The Corporation (on a consolidated basis) and the Bank are subject to various regulatory capital requirements administered by the FRB and the FDIC. Failure to meet minimum capital requirements can initiate mandatory and possibly additional discretionary actions by the FRB and the FDIC that if undertaken, could have a material effect on our financial statements. Under regulatory capital adequacy guidelines and the regulatory framework for prompt corrective action, we must meet specific capital guidelines that include quantitative measures of assets, liabilities, capital, and certain off-balance-sheet items, as calculated under regulatory accounting standards. Our capital amounts and classifications are also subject to qualitative judgments by the FRB and the FDIC about components, risk weightings, and other factors. Prompt corrective action provisions are not applicable to bank holding companies.
Quantitative measures established by regulation to ensure capital adequacy require us to maintain minimum amounts and ratios (set forth in the following table) of total, tier 1 capital, and common equity tier 1 capital (as defined in the regulations) to risk-weighted assets (as defined) and tier 1 capital to average assets (as defined). We believe, as of December 31, 2016 and 2015, that we met all capital adequacy requirements.
The FRB has established minimum risk based capital guidelines. Pursuant to these guidelines, a framework has been established that assigns risk weights to each category of on and off-balance-sheet items to arrive at risk adjusted total assets. Regulatory capital is divided by the risk adjusted assets with the resulting ratio compared to the minimum standard to determine whether a corporation has adequate capital. On July 2, 2013, the FRB published revised BASEL III Capital standards for banks. The final rules redefine what is included or deducted from equity capital, changes risk weighting for certain on and
71
off-balance sheet assets, increases the minimum required equity capital to be considered well capitalized, and introduces a capital cushion buffer. The rules, which are being gradually phased in between 2015 and 2019, are not expected to have a material impact on the Corporation but will require us to hold more capital than we have historically.
Effective January 1, 2015, the minimum standard for primary, or tier 1, capital increased from 4.00% to 6.00%. The minimum standard for total capital remained at 8.00%. Also effective January 1, 2015 was the new common equity tier 1 capital ratio which had a minimum requirement of 4.50%. The capital conservative buffer requirement began on January 1, 2016 which required a 0.625% addition to the tier 1, minimum, and common equity tier 1 capital ratio. The capital conservative buffer will continue to increase capital ratios each year through 2019.
As of December 31, 2016 and 2015, the most recent notifications from the FRB and the FDIC categorized us as well capitalized under the regulatory framework for prompt corrective action. To be categorized as well capitalized, an institution must maintain total risk-based, Tier 1 risk-based, Common Equity Tier 1, and Tier 1 leverage ratios as set forth in the following tables. There are no conditions or events since the notifications that we believe have changed our categories. Our actual capital amounts and ratios are also presented in the table.
Actual | Minimum Capital Requirement | Minimum To Be Well Capitalized Under Prompt Corrective Action Provisions | ||||||||||||||||||
Amount | Ratio | Amount | Ratio | Amount | Ratio | |||||||||||||||
December 31, 2016 | ||||||||||||||||||||
Common equity Tier 1 capital to risk weighted assets | ||||||||||||||||||||
Isabella Bank | $ | 132,900 | 11.69 | % | $ | 45,462 | 5.125 | % | $ | 68,193 | 6.50 | % | ||||||||
Consolidated | 142,165 | 12.39 | % | 45,881 | 5.125 | % | N/A | N/A | ||||||||||||
Tier 1 capital to risk weighted assets | ||||||||||||||||||||
Isabella Bank | 132,900 | 11.69 | % | 45,462 | 6.625 | % | 68,193 | 8.00 | % | |||||||||||
Consolidated | 142,165 | 12.39 | % | 45,881 | 6.625 | % | N/A | N/A | ||||||||||||
Total capital to risk weighted assets | ||||||||||||||||||||
Isabella Bank | 140,300 | 12.34 | % | 90,923 | 8.625 | % | 113,654 | 10.00 | % | |||||||||||
Consolidated | 149,565 | 13.04 | % | 91,761 | 8.625 | % | N/A | N/A | ||||||||||||
Tier 1 capital to average assets | ||||||||||||||||||||
Isabella Bank | 132,900 | 8.06 | % | 65,972 | 4.00 | % | 82,465 | 5.00 | % | |||||||||||
Consolidated | 142,165 | 8.56 | % | 66,449 | 4.00 | % | N/A | N/A | ||||||||||||
72
Actual | Minimum Capital Requirement | Minimum To Be Well Capitalized Under Prompt Corrective Action Provisions | ||||||||||||||||||
Amount | Ratio | Amount | Ratio | Amount | Ratio | |||||||||||||||
December 31, 2015 | ||||||||||||||||||||
Common equity Tier 1 capital to risk weighted assets | ||||||||||||||||||||
Isabella Bank | $ | 124,917 | 12.50 | % | $ | 39,985 | 4.50 | % | $ | 59,977 | 6.50 | % | ||||||||
Consolidated | 135,250 | 13.44 | % | 40,282 | 4.50 | % | N/A | N/A | ||||||||||||
Tier 1 capital to risk weighted assets | ||||||||||||||||||||
Isabella Bank | 124,917 | 12.50 | % | 39,985 | 6.00 | % | 59,977 | 8.00 | % | |||||||||||
Consolidated | 135,250 | 13.44 | % | 40,282 | 6.00 | % | N/A | N/A | ||||||||||||
Total capital to risk weighted assets | ||||||||||||||||||||
Isabella Bank | 132,317 | 13.24 | % | 79,970 | 8.00 | % | 99,962 | 10.00 | % | |||||||||||
Consolidated | 142,650 | 14.17 | % | 80,564 | 8.00 | % | N/A | N/A | ||||||||||||
Tier 1 capital to average assets | ||||||||||||||||||||
Isabella Bank | 124,917 | 7.93 | % | 63,032 | 4.00 | % | 78,790 | 5.00 | % | |||||||||||
Consolidated | 135,250 | 8.52 | % | 63,524 | 4.00 | % | N/A | N/A | ||||||||||||
73
Note 17 – Benefit Plans
401(k) Plan
We have a 401(k) plan in which substantially all employees are eligible to participate. Employees may contribute up to 100% of their compensation subject to certain limits based on federal tax laws. The plan was amended in 2013 to provide a matching safe harbor contribution for all eligible employees equal to 100% of the first 5.0% of an employee's compensation contributed to the Plan during the year. Employees are 100% vested in the safe harbor matching contributions.
For 2012, we made a 3.0% safe harbor contribution for all eligible employees and matching contributions equal to 50% of the first 4.0% of an employee’s compensation contributed to the Plan during the year. Employees were 100% vested in the safe harbor contributions and were 0% vested through their first two years of employment and were 100% vested after 6 years of service for matching contributions.
For 2016, 2015 and 2014, expenses attributable to the Plan were $686, $664, and $655, respectively.
Defined Benefit Pension Plan
We maintain a noncontributory defined benefit pension plan, which was curtailed effective March 1, 2007. As a result of the curtailment, future salary increases are no longer considered (the projected benefit obligation is equal to the accumulated benefit obligation), and plan benefits are based on years of service and the individual employee’s five highest consecutive years of compensation out of the last ten years of service through March 1, 2007.
Changes in the projected benefit obligation and plan assets during each year, the funded status of the plan, and the net amount recognized in our consolidated balance sheets using an actuarial measurement date of December 31, are summarized as follows during the years ended December 31:
2016 | 2015 | ||||||
Change in benefit obligation | |||||||
Benefit obligation, January 1 | $ | 11,977 | $ | 13,250 | |||
Interest cost | 485 | 494 | |||||
Actuarial (gain) loss | (328 | ) | (744 | ) | |||
Benefits paid, including plan expenses | (686 | ) | (1,023 | ) | |||
Benefit obligation, December 31 | 11,448 | 11,977 | |||||
Change in plan assets | |||||||
Fair value of plan assets, January 1 | 9,572 | 10,390 | |||||
Investment return | 439 | 5 | |||||
Contributions | — | 200 | |||||
Benefits paid, including plan expenses | (686 | ) | (1,023 | ) | |||
Fair value of plan assets, December 31 | 9,325 | 9,572 | |||||
Deficiency in funded status at December 31, included on the consolidated balance sheets in accrued interest payable and other liabilities | $ | (2,123 | ) | $ | (2,405 | ) | |
2016 | 2015 | ||||||
Change in accrued pension benefit costs | |||||||
Accrued benefit cost at January 1 | $ | (2,405 | ) | $ | (2,860 | ) | |
Contributions | — | 200 | |||||
Net periodic benefit cost | (238 | ) | (492 | ) | |||
Net change in unrecognized actuarial loss and prior service cost | 520 | 747 | |||||
Accrued pension benefit cost at December 31 | $ | (2,123 | ) | $ | (2,405 | ) | |
We have recorded the funded status of the plan in our consolidated balance sheets. We adjust the underfunded status in a liability account to reflect the current funded status of the plan. Any gains or losses that arise during the year but are not recognized as components of net periodic benefit cost are recognized as a component of other comprehensive income (loss).
74
The components of net periodic benefit cost are as follows for the years ended December 31:
2016 | 2015 | 2014 | |||||||||
Interest cost on benefit obligation | $ | 485 | $ | 494 | $ | 486 | |||||
Expected return on plan assets | (560 | ) | (607 | ) | (615 | ) | |||||
Amortization of unrecognized actuarial net loss | 313 | 355 | 169 | ||||||||
Settlement loss | — | 250 | 260 | ||||||||
Net periodic benefit cost | $ | 238 | $ | 492 | $ | 300 | |||||
During 2016, 2015 and 2014, additional settlement loss of $0, $250 and $260 were recognized in connection with lump-sum benefits distributions. Many plan participants elect to receive their retirement benefit payments in the form of lump-sum settlements. Pro rata settlement losses, which can occasionally occur as a result of these lump sum distributions, are recognized only in years when the total of such distributions exceed the sum of the service and interest expense components of net periodic benefit cost.
Accumulated other comprehensive income at December 31, 2016 includes net unrecognized pension costs before income taxes of $4,503, of which $178 is expected to be amortized into benefit cost during 2017.
The actuarial assumptions used in determining the benefit obligation are as follows for the years ended December 31:
2016 | 2015 | 2014 | ||||||
Discount rate | 3.96 | % | 4.13 | % | 3.80 | % | ||
Expected long-term rate of return | 6.00 | % | 6.00 | % | 6.00 | % | ||
The actuarial weighted average assumptions used in determining the net periodic pension costs are as follows for the years ended December 31:
2016 | 2015 | 2014 | ||||||
Discount rate | 4.13 | % | 3.80 | % | 4.64 | % | ||
Expected long-term return on plan assets | 6.00 | % | 6.00 | % | 6.00 | % | ||
As a result of the curtailment of the Plan, there is no rate of compensation increase considered in the above assumptions.
The expected long term rate of return is an estimate of anticipated future long term rates of return on plan assets as measured on a market value basis. Factors considered in arriving at this assumption include:
• | Historical long term rates of return for broad asset classes. |
• | Actual past rates of return achieved by the plan. |
• | The general mix of assets held by the plan. |
• | The stated investment policy for the plan. |
The selected rate of return is net of anticipated investment related expenses.
Plan Assets
Our overall investment strategy is to moderately grow the portfolio by investing 50% of the portfolio in equity securities and 50% in fixed income securities. This strategy is designed to generate a long term rate of return of 6.00%. Equity securities primarily consist of the S&P 500 Index with a smaller allocation to the Small Cap and International Index. Fixed income securities are invested in the Bond Market Index. The Plan has appropriate assets invested in short term investments to meet near-term benefit payments.
The asset mix and the sector weighting of the investments are determined by our pension committee, which is comprised of members of our management. To manage the Plan, we retain a third party investment advisor to conduct consultations. We review the performance of the advisor at least annually.
75
The fair values of our pension plan assets by asset category were as follows as of December 31:
2016 | 2015 | ||||||||||||||
Total | (Level 2) | Total | (Level 2) | ||||||||||||
Short-term investments | $ | 130 | $ | 130 | $ | 157 | $ | 157 | |||||||
Common collective trusts | |||||||||||||||
Fixed income | 4,579 | 4,579 | 4,662 | 4,662 | |||||||||||
Equity investments | 4,616 | 4,616 | 4,753 | 4,753 | |||||||||||
Total | $ | 9,325 | $ | 9,325 | $ | 9,572 | $ | 9,572 | |||||||
The following is a description of the valuation methodologies used for assets measured at fair value. There have been no changes in the methodologies used at December 31, 2016 and 2015:
• | Short-term investments: Shares of a money market portfolio, which is valued using amortized cost, which approximates fair value. |
• | Common collective trusts: These investments are public investment securities valued using the NAV provided by a third party investment advisor. The NAV is quoted on a private market that is not active; however, the unit price is based on underlying investments which are traded on an active market. |
We anticipate contributions to the Plan in 2017 to approximate net contribution costs.
The components of projected net periodic benefit cost are as follows for the year ending:
December 31, 2017 | |||
Interest cost on projected benefit obligation | $ | 444 | |
Expected return on plan assets | (545 | ) | |
Amortization of unrecognized actuarial net loss | 279 | ||
Net periodic benefit cost | $ | 178 | |
Estimated future benefit payments are as follows for the next ten years:
Estimated Benefit Payments | ||||
2017 | $ | 460 | ||
2018 | 462 | |||
2019 | 505 | |||
2020 | 551 | |||
2021 | 605 | |||
2022 - 2026 | 3,059 | |||
Equity Compensation Plan
Pursuant to the terms of the Directors Plan, our directors are required to invest at least 25% of their board fees in our common stock. These stock investments can be made either through deferred fees or through the purchase of shares through the Dividend Reinvestment Plan. Deferred fees, under the Directors Plan, are converted on a quarterly basis into shares of our common stock based on the fair value of a share of common stock as of the relevant valuation date. Stock credited to a participant’s account is eligible for stock and cash dividends as declared. Dividend Reinvestment Plan shares are purchased on a monthly basis pursuant to the Dividend Reinvestment Plan.
Distribution of deferred fees from the Directors Plan occurs when the participant retires from the Board or upon the occurrence of certain other events. The participant is eligible to receive a lump-sum, in-kind, distribution of all of the stock that is then in his or her account, and any unconverted cash will be converted to and rounded up to whole shares of stock and distributed, as well. The Directors Plan does not allow for cash settlement, and therefore, such share-based payment awards qualify for classification as equity. We may use authorized but unissued shares or purchase shares of common stock on the open market to meet our obligations under the Directors Plan.
We maintain the Rabbi Trust to fund the Directors Plan. The Rabbi Trust is an irrevocable grantor trust to which we may contribute assets for the limited purpose of funding a nonqualified deferred compensation plan. Although we may not reach the
76
assets of the Rabbi Trust for any purpose other than meeting our obligations under the Directors Plan, the assets of the Rabbi Trust remain subject to the claims of our creditors and are included in the consolidated financial statements. We may contribute cash or common stock to the Rabbi Trust from time-to-time for the sole purpose of funding the Directors Plan. The Rabbi Trust will use any cash that we contributed to purchase shares of our common stock on the open market through our brokerage services department. Shares held in the Rabbi Trust are included in the calculation of earnings per share.
The components of shares eligible to be issued under the Directors Plan were as follows as of December 31:
2016 | 2015 | ||||||||||||
Eligible Shares | Market Value | Eligible Shares | Market Value | ||||||||||
Unissued | 187,428 | $ | 5,220 | 180,616 | $ | 5,400 | |||||||
Shares held in Rabbi Trust | 26,042 | 725 | 19,401 | 580 | |||||||||
Total | 213,470 | $ | 5,945 | 200,017 | $ | 5,980 | |||||||
Other Employee Benefit Plans
We maintain two nonqualified supplementary employee retirement plans to provide supplemental retirement benefits to specified participants. Expenses related to these programs for 2016, 2015 and 2014 were $430, $379, and $372, respectively, and are being recognized over the participants’ expected years of service.
We maintain a non-leveraged ESOP which was frozen to new participants on December 31, 2006. Contributions to the plan are discretionary and are approved by the Board of Directors and recorded as compensation expense. We made no contributions to the ESOP in 2016, 2015 and 2014. Compensation cost related to the plan for 2016, 2015 and 2014 was $33, $32, and $23, respectively. Total allocated shares outstanding related to the ESOP at December 31, 2016, 2015, and 2014 were 204,669, 217,064, and 241,958, respectively. Such shares are included in the computation of dividends and earnings per share in each of the respective years. On December 21, 2016, the Board approved the termination of the ESOP effective December 31, 2016. Actual dissolution of the ESOP is anticipated to occur in mid-2017.
We maintain a self-funded medical plan under which we are responsible for the first $75 per year of claims made by a covered family. Expenses are accrued based on estimates of the aggregate liability for claims incurred and our experience. Expenses were $2,150 in 2016, $1,695 in 2015 and $1,786 in 2014.
77
Note 18 – Accumulated Other Comprehensive Income (Loss)
AOCI includes net income as well as unrealized gains and losses, net of tax, on AFS investment securities owned and changes in the funded status of our defined benefit pension plan, which are excluded from net income. Unrealized AFS securities gains and losses and changes in the funded status of the pension plan, net of tax, are excluded from net income, and are reflected as a direct charge or credit to shareholders’ equity. Comprehensive income (loss) and the related components are disclosed in the consolidated statements of comprehensive income.
The following table summarizes the changes in AOCI by component for the years ended December 31 (net of tax):
Unrealized Holding Gains (Losses) on AFS Securities | Unrealized Gains (Losses) on Derivative Instruments | Change in Unrecognized Pension Cost on Defined Benefit Pension Plan | Total | ||||||||||||
Balance, January 1, 2014 | $ | (4,207 | ) | $ | — | $ | (2,134 | ) | $ | (6,341 | ) | ||||
OCI before reclassifications | 11,290 | — | (2,836 | ) | 8,454 | ||||||||||
Amounts reclassified from AOCI | (97 | ) | — | 300 | 203 | ||||||||||
Subtotal | 11,193 | — | (2,536 | ) | 8,657 | ||||||||||
Tax effect | (3,684 | ) | — | 862 | (2,822 | ) | |||||||||
OCI, net of tax | 7,509 | — | (1,674 | ) | 5,835 | ||||||||||
Balance, December 31, 2014 | 3,302 | — | (3,808 | ) | (506 | ) | |||||||||
OCI before reclassifications | 310 | — | 255 | 565 | |||||||||||
Amounts reclassified from AOCI | (163 | ) | — | 492 | 329 | ||||||||||
Subtotal | 147 | — | 747 | 894 | |||||||||||
Tax effect | 87 | — | (254 | ) | (167 | ) | |||||||||
OCI, net of tax | 234 | — | 493 | 727 | |||||||||||
Balance, December 31, 2015 | 3,536 | — | (3,315 | ) | 221 | ||||||||||
OCI before reclassifications | (5,865 | ) | 248 | 282 | (5,335 | ) | |||||||||
Amounts reclassified from AOCI | 525 | — | 238 | 763 | |||||||||||
Subtotal | (5,340 | ) | 248 | 520 | (4,572 | ) | |||||||||
Tax effect | 1,834 | (84 | ) | (177 | ) | 1,573 | |||||||||
OCI, net of tax | (3,506 | ) | 164 | 343 | (2,999 | ) | |||||||||
Balance, December 31, 2016 | $ | 30 | $ | 164 | $ | (2,972 | ) | $ | (2,778 | ) | |||||
Included in OCI for the years ended December 31, 2016 and 2015 are changes in unrealized holding gains and losses related to auction rate money market preferred and preferred stocks. For federal income tax purposes, these securities are considered equity investments. As such, no deferred federal income taxes related to unrealized holding gains or losses are expected or recorded.
78
A summary of the components of unrealized holding gains on AFS securities included in OCI follows for the years ended December 31:
2016 | 2015 | 2014 | |||||||||||||||||||||||||||||||||
Auction Rate Money Market Preferred and Preferred Stocks | All Other AFS Securities | Total | Auction Rate Money Market Preferred and Preferred Stocks | All Other AFS Securities | Total | Auction Rate Money Market Preferred and Preferred Stocks | All Other AFS securities | Total | |||||||||||||||||||||||||||
Unrealized gains (losses) arising during the period | $ | 54 | $ | (5,919 | ) | $ | (5,865 | ) | $ | 406 | $ | (96 | ) | $ | 310 | $ | 355 | $ | 10,935 | $ | 11,290 | ||||||||||||||
Reclassification adjustment for net realized (gains) losses included in net income | — | (245 | ) | (245 | ) | — | (163 | ) | (163 | ) | — | (97 | ) | (97 | ) | ||||||||||||||||||||
Reclassification adjustment for impairment loss included in net income | — | 770 | 770 | — | — | — | — | — | — | ||||||||||||||||||||||||||
Net unrealized gains (losses) | 54 | (5,394 | ) | (5,340 | ) | 406 | (259 | ) | 147 | 355 | 10,838 | 11,193 | |||||||||||||||||||||||
Tax effect | — | 1,834 | 1,834 | — | 87 | 87 | — | (3,684 | ) | (3,684 | ) | ||||||||||||||||||||||||
Unrealized gains (losses), net of tax | $ | 54 | $ | (3,560 | ) | $ | (3,506 | ) | $ | 406 | $ | (172 | ) | $ | 234 | $ | 355 | $ | 7,154 | $ | 7,509 | ||||||||||||||
The following table details reclassification adjustments and the related affected line items in our consolidated statements of income for the years ended December 31:
Details about AOCI components | Amount Reclassified from AOCI | Affected Line Item in the Consolidated Statements of Income | |||||||||||
2016 | 2015 | 2014 | |||||||||||
Unrealized holding gains (losses) on AFS securities | |||||||||||||
$ | 245 | $ | 163 | $ | 97 | Net gains on sale of AFS securities | |||||||
(770 | ) | — | — | Other noninterest expenses | |||||||||
(525 | ) | 163 | 97 | Income before federal income tax expense | |||||||||
(179 | ) | 55 | 33 | Federal income tax expense (benefit) | |||||||||
$ | (346 | ) | $ | 108 | $ | 64 | Net income | ||||||
Change in unrecognized pension cost on defined benefit pension plan | |||||||||||||
$ | 238 | $ | 492 | $ | 300 | Compensation and benefits | |||||||
81 | 167 | 102 | Federal income tax expense | ||||||||||
$ | 157 | $ | 325 | $ | 198 | Net income | |||||||
79
Note 19 – Related Party Transactions
In the ordinary course of business, we grant loans to principal officers and directors and their affiliates (including their families and companies in which they have 10% or more ownership). Annual activity consisted of the following for the years ended December 31:
2016 | 2015 | ||||||
Balance, January 1 | $ | 4,021 | $ | 3,822 | |||
New loans | 1,097 | 2,779 | |||||
Repayments | (1,172 | ) | (2,580 | ) | |||
Balance, December 31 | $ | 3,946 | $ | 4,021 | |||
Total deposits of these principal officers and directors and their affiliates amounted to $5,770 and $5,625 at December 31, 2016 and 2015, respectively. In addition, the ESOP held deposits with the Bank aggregating $290 and $143, respectively, at December 31, 2016 and 2015.
From time-to-time, we make charitable donations to The Isabella Bank Foundation (the “Foundation”), which is a non-controlled affiliated nonprofit entity formed for the purpose of distributing charitable donations to recipient organizations generally located in the communities we service. Our donations are expensed when committed to the Foundation. The assets and transactions of the Foundation are not included in our consolidated financial statements.
Assets of the Foundation include cash and cash equivalents, certificates of deposit, and shares of Isabella Bank Corporation common stock. The Foundation owned 44,350 and 44,350 shares of our common stock as of December 31, 2016 and 2015, respectively. Such shares are included in the computation of dividends and earnings per share.
The following table displays total asset balances of, and our donations to, the Foundation as of, and for the years ended, December 31:
2016 | 2015 | 2014 | |||||||||
Total assets | $ | 2,213 | $ | 2,435 | $ | 2,090 | |||||
Donations | $ | — | $ | 258 | $ | 500 | |||||
Note 20 – Fair Value
Following is a description of the valuation methodologies, key inputs, and an indication of the level of the fair value hierarchy in which the assets or liabilities are classified.
Cash and cash equivalents: The carrying amounts of cash and demand deposits due from banks and interest bearing balances due from banks approximate fair values. As such, we classify cash and cash equivalents as Level 1.
AFS securities: AFS securities are recorded at fair value on a recurring basis. Level 1 fair value measurement is based upon quoted prices for identical instruments. Level 2 fair value measurement is based upon quoted prices for similar instruments. If quoted prices are not available, fair values are measured using independent pricing models or other model based valuation techniques such as the present value of future cash flows, adjusted for the security’s credit rating, prepayment assumptions and other factors such as credit loss and liquidity assumptions. The values for Level 1 and Level 2 investment securities are generally obtained from an independent third party. On a quarterly basis, we compare the values provided to alternative pricing sources.
Mortgage loans AFS: Mortgage loans AFS are carried at the lower of cost or fair value. The fair value of mortgage loans AFS are based on the price secondary markets are currently offering for portfolios with similar characteristics. As such, we classify mortgage loans AFS subject to nonrecurring fair value adjustments as Level 2.
Loans: For variable rate loans with no significant change in credit risk, fair values are based on carrying values. Fair values for fixed rate loans are estimated using discounted cash flow analyses, using interest rates currently being offered for loans with similar terms to borrowers of similar credit quality. The resulting amounts are adjusted to estimate the effect of changes in the credit quality of borrowers since the loans were originated. As such, we classify loans as Level 3 assets.
We do not record loans at fair value on a recurring basis. However, from time-to-time, loans are classified as impaired and a specific allowance for loan losses may be established. Loans for which it is probable that payment of interest and principal will be significantly different than the contractual terms of the original loan agreement are considered impaired. Once a loan is
80
identified as impaired, we measure the estimated impairment. The fair value of impaired loans is estimated using one of several methods, including the present value of expected future cash flows discounted at the loan’s effective interest rate, the loan’s obtainable market price, or the fair value of the collateral, less cost to sell, if the loan is collateral dependent. Those impaired loans not requiring an allowance represent loans for which the fair value of the expected repayments or collateral exceed the recorded investments in such loans.
We review the net realizable values of the underlying collateral for collateral dependent impaired loans on at least a quarterly basis for all loan types. To determine the collateral value, we utilize independent appraisals, broker price opinions, or internal evaluations. We review these valuations to determine whether an additional discount should be applied given the age of market information that may have been considered as well as other factors such as costs to sell an asset if it is determined that the collateral will be liquidated in connection with the ultimate settlement of the loan. We use these valuations to determine if any specific reserves or charge-offs are necessary. We may obtain new valuations in certain circumstances, including when there has been significant deterioration in the condition of the collateral, if the foreclosure process has begun, or if the existing valuation is deemed to be outdated.
The following tables list the quantitative fair value information about impaired loans as of December 31:
2016 | ||||
Valuation Technique | Fair Value | Unobservable Input | Range | |
Discount applied to collateral appraisal: | ||||
Real Estate | 20% - 30% | |||
Discounted appraisal value | $9,166 | Equipment | 20% - 45% | |
Cash crop inventory | 30% - 40% | |||
Liquor license | 75% | |||
Furniture, fixtures & equipment | 45% | |||
2015 | ||||
Valuation Technique | Fair Value | Unobservable Input | Range | |
Discount applied to collateral appraisal: | ||||
Real Estate | 20% - 30% | |||
Equipment | 20% - 35% | |||
Discounted appraisal value | $9,301 | Cash crop inventory | 40% | |
Other inventory | 50% | |||
Accounts receivable | 50% | |||
Liquor license | 75% | |||
Furniture, fixtures & equipment | 35% - 45% | |||
Discount factors with ranges are based on the age of the independent appraisal, broker price opinion, or internal evaluation.
Accrued interest receivable: The carrying amounts of accrued interest receivable approximate fair value. As such, we classify accrued interest receivable as Level 1.
Equity securities without readily determinable fair values: Included in equity securities without readily determinable fair values are FHLB stock and FRB stock as well as our minority ownership interests in Corporate Settlement Solutions, LLC and Valley Financial Corporation. The investment in Corporate Settlement Solutions, LLC, a title insurance company, was made in the first quarter 2008 and we account for our investment under the equity method of accounting. Valley Financial Corporation is the parent company of 1st State Bank in Saginaw, Michigan, which is a community bank that opened in 2005. We made investments in Valley Financial Corporation in 2004 and in 2007 and sold all shares in 2016. We accounted for our investment under the equity method of accounting.
The lack of an active market, or other independent sources to validate fair value estimates coupled with the impact of future capital calls and transfer restrictions, is an inherent limitation in the valuation process. As the fair values of these investments are not readily determinable, they are not disclosed under a specific fair value hierarchy; however, they are reviewed quarterly for impairment. If we were to record an impairment adjustment related to these securities, it would be classified as a nonrecurring Level 3 fair value adjustment. During 2016 and 2015, there were no impairments recorded on equity securities without readily determinable fair values.
81
Foreclosed assets: Upon transfer from the loan portfolio, foreclosed assets (which are included in other assets) are adjusted to and subsequently carried at the lower of carrying value or fair value less costs to sell. Net realizable value is based upon independent market prices, appraised values of the collateral, or management’s estimation of the value of the collateral. Due to the inherent level of estimation in the valuation process, we classify foreclosed assets as nonrecurring Level 3.
The table below lists the quantitative fair value information related to foreclosed assets as of:
December 31, 2016 | |||||||
Valuation Technique | Fair Value | Unobservable Input | Range | ||||
Discount applied to collateral appraisal: | |||||||
Discounted appraisal value | $ | 231 | Real Estate | 20% - 30% | |||
December 31, 2015 | |||||||
Valuation Technique | Fair Value | Unobservable Input | Range | ||||
Discount applied to collateral appraisal: | |||||||
Discounted appraisal value | $ | 421 | Real Estate | 20% - 30% | |||
Discount factors with ranges are based on the age of the independent appraisal, broker price opinion, or internal evaluations.
Goodwill and other intangible assets: Acquisition intangibles and goodwill are evaluated for potential impairment on at least an annual basis. Acquisition intangibles and goodwill are typically qualitatively evaluated to determine if it is more likely than not that the carrying balance is impaired. If it is determined that the carrying balance of acquisition intangibles or goodwill is more likely than not to be impaired, we perform a cash flow valuation to determine the extent of the potential impairment. If the testing resulted in impairment, we would classify goodwill and other acquisition intangibles subjected to nonrecurring fair value adjustments as Level 3. During 2016 and 2015, there were no impairments recorded on goodwill and other acquisition intangibles.
OMSR: OMSR (which are included in other assets) are subject to impairment testing. To test for impairment, we utilize a discounted cash flow analysis using interest rates and prepayment speed assumptions currently quoted for comparable instruments and discount rates. If the valuation model reflects a value less than the carrying value, OMSR are adjusted to fair value through a valuation allowance as determined by the model. As such, we classify OMSR subject to nonrecurring fair value adjustments as Level 2.
Deposits: The fair value of demand, savings, and money market deposits are equal to their carrying amounts and are classified as Level 1. Fair values for variable rate certificates of deposit approximate their carrying value. Fair values for fixed rate certificates of deposit are estimated using a discounted cash flow calculation that applies interest rates currently being offered on certificates to a schedule of aggregated expected monthly maturities on time deposits. As such, fixed rate certificates of deposit are classified as Level 2.
Borrowed funds: The carrying amounts of federal funds purchased, borrowings under overnight repurchase agreements, and other short-term borrowings maturing within ninety days approximate their fair values. The fair values of other borrowed funds are estimated using discounted cash flow analyses based on current incremental borrowing arrangements. As such, borrowed funds are classified as Level 2.
Accrued interest payable: The carrying amounts of accrued interest payable approximate fair value. As such, we classify accrued interest payable as Level 1.
Derivative instruments: Derivative instruments, consisting solely of interest rate swaps, are recorded at fair value on a recurring basis. Derivatives qualifying as cash flow hedges, when highly effective, are reported at fair value in other assets or other liabilities on our Consolidated Balance Sheets with changes in value recorded in OCI. Should the hedge no longer be considered effective, the ineffective portion of the change in fair value is recorded directly in earnings in the period in which the change occurs. The fair value of a derivative is determined by quoted market prices and model based valuation techniques. As such, we classify derivative instruments as Level 2.
Commitments to extend credit, standby letters of credit, and undisbursed loans: Our commitments to extend credit, standby letters of credit, and undisbursed funds have no carrying amount and are estimated to have no realizable fair value. Historically, a majority of the unused commitments to extend credit have not been drawn upon and, generally, we do not receive fees in connection with these commitments other than standby letter of credit fees, which are not significant.
82
The preceding methods described may produce a fair value calculation that may not be indicative of net realizable value or reflective of future fair values. Although we believe our valuation methods are appropriate and consistent with other market participants, the use of different methodologies or assumptions to determine the fair value of certain financial instruments could result in a different fair value measurement.
Estimated Fair Values of Financial Instruments Not Recorded at Fair Value in their Entirety on a Recurring Basis
Disclosure of the estimated fair values of financial instruments, which differ from carrying values, often requires the use of estimates. In cases where quoted market values in an active market are not available, we use present value techniques and other valuation methods to estimate the fair values of our financial instruments. These valuation methods require considerable judgment and the resulting estimates of fair value can be significantly affected by the assumptions made and methods used.
The carrying amount and estimated fair value of financial instruments not recorded at fair value in their entirety on a recurring basis were as follows as of December 31:
2016 | |||||||||||||||||||
Carrying Value | Estimated Fair Value | (Level 1) | (Level 2) | (Level 3) | |||||||||||||||
ASSETS | |||||||||||||||||||
Cash and cash equivalents | $ | 22,894 | $ | 22,894 | $ | 22,894 | $ | — | $ | — | |||||||||
Mortgage loans AFS | 1,816 | 1,836 | — | 1,836 | — | ||||||||||||||
Gross loans | 1,010,615 | 991,009 | — | — | 991,009 | ||||||||||||||
Less allowance for loan and lease losses | 7,400 | 7,400 | — | — | 7,400 | ||||||||||||||
Net loans | 1,003,215 | 983,609 | — | — | 983,609 | ||||||||||||||
Accrued interest receivable | 6,580 | 6,580 | 6,580 | — | — | ||||||||||||||
Equity securities without readily determinable fair values (1) | 21,694 | N/A | — | — | — | ||||||||||||||
OMSR | 2,306 | 2,306 | — | 2,306 | — | ||||||||||||||
LIABILITIES | |||||||||||||||||||
Deposits without stated maturities | 761,626 | 761,626 | 761,626 | — | — | ||||||||||||||
Deposits with stated maturities | 433,414 | 430,088 | — | 430,088 | — | ||||||||||||||
Borrowed funds | 337,694 | 326,975 | — | 326,975 | — | ||||||||||||||
Accrued interest payable | 574 | 574 | 574 | — | — | ||||||||||||||
83
2015 | |||||||||||||||||||
Carrying Value | Estimated Fair Value | (Level 1) | (Level 2) | (Level 3) | |||||||||||||||
ASSETS | |||||||||||||||||||
Cash and cash equivalents | $ | 21,569 | $ | 21,569 | $ | 21,569 | $ | — | $ | — | |||||||||
Mortgage loans AFS | 1,187 | 1,210 | — | 1,210 | — | ||||||||||||||
Gross loans | 850,492 | 839,398 | — | — | 839,398 | ||||||||||||||
Less allowance for loan and lease losses | 7,400 | 7,400 | — | — | 7,400 | ||||||||||||||
Net loans | 843,092 | 831,998 | — | — | 831,998 | ||||||||||||||
Accrued interest receivable | 6,269 | 6,269 | 6,269 | — | — | ||||||||||||||
Equity securities without readily determinable fair values (1) | 22,286 | N/A | — | — | — | ||||||||||||||
OMSR | 2,505 | 2,518 | — | 2,518 | — | ||||||||||||||
LIABILITIES | |||||||||||||||||||
Deposits without stated maturities | 741,683 | 741,683 | 741,683 | — | — | ||||||||||||||
Deposits with stated maturities | 422,880 | 421,429 | — | 421,429 | — | ||||||||||||||
Borrowed funds | 309,732 | 297,495 | — | 297,495 | — | ||||||||||||||
Accrued interest payable | 545 | 545 | 545 | — | — | ||||||||||||||
(1) | Due to the characteristics of equity securities without readily determinable fair values, they are not disclosed under a specific fair value hierarchy. If we were to record an impairment adjustment related to these securities, such amount would be classified as a nonrecurring Level 3 fair value adjustment. |
Financial Instruments Recorded at Fair Value
The table below presents the recorded amount of assets and liabilities measured at fair value on December 31:
2016 | 2015 | ||||||||||||||||||||||||||||||
Total | (Level 1) | (Level 2) | (Level 3) | Total | (Level 1) | (Level 2) | (Level 3) | ||||||||||||||||||||||||
Recurring items | |||||||||||||||||||||||||||||||
AFS securities | |||||||||||||||||||||||||||||||
Government-sponsored enterprises | $ | 10,259 | $ | — | $ | 10,259 | $ | — | $ | 24,345 | $ | — | $ | 24,345 | $ | — | |||||||||||||||
States and political subdivisions | 212,919 | — | 212,919 | — | 232,217 | — | 232,217 | — | |||||||||||||||||||||||
Auction rate money market preferred | 2,794 | — | 2,794 | — | 2,866 | — | 2,866 | — | |||||||||||||||||||||||
Preferred stocks | 3,425 | 3,425 | — | — | 3,299 | 3,299 | — | — | |||||||||||||||||||||||
Mortgage-backed securities | 227,256 | — | 227,256 | — | 263,384 | — | 263,384 | — | |||||||||||||||||||||||
Collateralized mortgage obligations | 101,443 | — | 101,443 | — | 134,025 | — | 134,025 | — | |||||||||||||||||||||||
Total AFS securities | 558,096 | 3,425 | 554,671 | — | 660,136 | 3,299 | 656,837 | — | |||||||||||||||||||||||
Derivative instruments | 248 | — | 248 | — | — | — | — | — | |||||||||||||||||||||||
Nonrecurring items | |||||||||||||||||||||||||||||||
Impaired loans (net of the ALLL) | 9,166 | — | — | 9,166 | 9,301 | — | — | 9,301 | |||||||||||||||||||||||
Foreclosed assets | 231 | — | — | 231 | 421 | — | — | 421 | |||||||||||||||||||||||
Total | $ | 567,741 | $ | 3,425 | $ | 554,919 | $ | 9,397 | $ | 669,858 | $ | 3,299 | $ | 656,837 | $ | 9,722 | |||||||||||||||
Percent of assets and liabilities measured at fair value | 0.60 | % | 97.74 | % | 1.66 | % | 0.49 | % | 98.06 | % | 1.45 | % | |||||||||||||||||||
84
The following table provides a summary of the changes in fair value of assets and liabilities recorded at fair value, for which gains or losses were recognized through earnings on a nonrecurring basis, in the years ended December 31:
2016 | 2015 | ||||||
Nonrecurring items | |||||||
Foreclosed assets | $ | (10 | ) | $ | (99 | ) | |
We had no assets or liabilities recorded at fair value with changes in fair value recognized through earnings, on a recurring basis, as of December 31, 2016.
Note 21 – Parent Company Only Financial Information
Condensed Balance Sheets
December 31 | |||||||
2016 | 2015 | ||||||
ASSETS | |||||||
Cash on deposit at the Bank | $ | 1,297 | $ | 4,125 | |||
AFS securities | 251 | 257 | |||||
Investments in subsidiaries | 138,549 | 133,883 | |||||
Premises and equipment | 1,991 | 2,014 | |||||
Other assets | 52,846 | 53,396 | |||||
TOTAL ASSETS | $ | 194,934 | $ | 193,675 | |||
LIABILITIES AND SHAREHOLDERS’ EQUITY | |||||||
Other liabilities | $ | 7,035 | $ | 9,704 | |||
Shareholders' equity | 187,899 | 183,971 | |||||
TOTAL LIABILITIES AND SHAREHOLDERS’ EQUITY | $ | 194,934 | $ | 193,675 | |||
Condensed Statements of Income
Year Ended December 31 | |||||||||||
2016 | 2015 | 2014 | |||||||||
Income | |||||||||||
Dividends from subsidiaries | $ | 7,400 | $ | 8,000 | $ | 7,000 | |||||
Interest income | 14 | 78 | 150 | ||||||||
Management fee and other | 6,574 | 6,331 | 3,665 | ||||||||
Total income | 13,988 | 14,409 | 10,815 | ||||||||
Expenses | |||||||||||
Compensation and benefits | 4,898 | 5,110 | 3,688 | ||||||||
Occupancy and equipment | 1,696 | 1,634 | 1,082 | ||||||||
Audit and related fees | 536 | 452 | 404 | ||||||||
Other | 2,120 | 2,160 | 1,395 | ||||||||
Total expenses | 9,250 | 9,356 | 6,569 | ||||||||
Income before income tax benefit and equity in undistributed earnings of subsidiaries | 4,738 | 5,053 | 4,246 | ||||||||
Federal income tax benefit | 1,058 | 991 | 940 | ||||||||
Income before equity in undistributed earnings of subsidiaries | 5,796 | 6,044 | 5,186 | ||||||||
Undistributed earnings of subsidiaries | 8,003 | 9,086 | 8,538 | ||||||||
Net income | $ | 13,799 | $ | 15,130 | $ | 13,724 | |||||
85
Condensed Statements of Cash Flows
Year Ended December 31 | |||||||||||
2016 | 2015 | 2014 | |||||||||
Operating activities | |||||||||||
Net income | $ | 13,799 | $ | 15,130 | $ | 13,724 | |||||
Adjustments to reconcile net income to cash provided by operations | |||||||||||
Undistributed earnings of subsidiaries | (8,003 | ) | (9,086 | ) | (8,538 | ) | |||||
Undistributed earnings of equity securities without readily determinable fair values | 791 | (310 | ) | 37 | |||||||
Share-based payment awards under equity compensation plan | 573 | 550 | 495 | ||||||||
Depreciation | 156 | 154 | 144 | ||||||||
Net amortization of AFS securities | — | — | 1 | ||||||||
Deferred income tax expense (benefit) | 147 | 131 | (159 | ) | |||||||
Changes in operating assets and liabilities which provided (used) cash | |||||||||||
Other assets | (44 | ) | 506 | 145 | |||||||
Accrued interest and other liabilities | (2,669 | ) | 142 | 1,516 | |||||||
Net cash provided by (used in) operating activities | 4,750 | 7,217 | 7,365 | ||||||||
Investing activities | |||||||||||
Maturities, calls, principal payments, and sales of AFS securities | — | 3,000 | 250 | ||||||||
Purchases of premises and equipment | (133 | ) | (186 | ) | (81 | ) | |||||
Net (advances to) repayments from subsidiaries | — | 300 | 641 | ||||||||
Net cash provided by (used in) investing activities | (133 | ) | 3,114 | 810 | |||||||
Financing activities | |||||||||||
Net increase (decrease) in borrowed funds | — | (211 | ) | (1,600 | ) | ||||||
Cash dividends paid on common stock | (7,645 | ) | (7,273 | ) | (6,843 | ) | |||||
Proceeds from the issuance of common stock | 5,023 | 5,201 | 4,227 | ||||||||
Common stock repurchased | (4,440 | ) | (4,590 | ) | (3,122 | ) | |||||
Common stock purchased for deferred compensation obligations | (383 | ) | (368 | ) | (331 | ) | |||||
Net cash provided by (used in) financing activities | (7,445 | ) | (7,241 | ) | (7,669 | ) | |||||
Increase (decrease) in cash and cash equivalents | (2,828 | ) | 3,090 | 506 | |||||||
Cash and cash equivalents at beginning of period | 4,125 | 1,035 | 529 | ||||||||
Cash and cash equivalents at end of period | $ | 1,297 | $ | 4,125 | $ | 1,035 | |||||
Note 22 – Operating Segments
Our reportable segments are based on legal entities that account for at least 10% of net operating results. The operations of the Bank as of December 31, 2016, 2015, and 2014 represent approximately 90% or more of our consolidated total assets and operating results. As such, no additional segment reporting is presented.
86
Item 9. Changes in and Disagreements With Accountants on Accounting and Financial Disclosure.
None.
Item 9A. Controls and Procedures.
DISCLOSURE CONTROLS AND PROCEDURES
We carried out an evaluation, under the supervision and with the participation of the Principal Executive Officer and Principal Financial Officer, of the effectiveness of the design and operation of our disclosure controls and procedures (as such term is defined in Rules 13a-15(e) and 15(d)-15(e) under the Exchange Act) as of December 31, 2016, pursuant to Exchange Act Rule 13a-15. Based upon that evaluation, the Principal Executive Officer and Principal Financial Officer concluded that our disclosure controls and procedures as of December 31, 2016, were effective to ensure that information required to be disclosed in reports that we file or submit under the Exchange Act are recorded, processed, summarized and reported within the time periods specified in SEC rules and forms.
CHANGES IN INTERNAL CONTROL OVER FINANCIAL REPORTING
We also conducted an evaluation of internal control over financial reporting to determine whether any changes occurred during the quarter ended December 31, 2016, that have materially affected, or are reasonably likely to materially affect, our internal control over financial reporting. Based on this evaluation, we have concluded that there have been no such changes during the quarter ended December 31, 2016.
Management’s Report on Internal Control Over Financial Reporting
We are responsible for the preparation and integrity of our published consolidated financial statements. The consolidated financial statements have been prepared in accordance with accounting principles generally accepted in the United States of America and, accordingly, include amounts based on judgments and estimates. We also prepared the other information included in the Annual Report on Form 10-K and are responsible for the accuracy and consistency with the consolidated financial statements.
We are responsible for establishing and maintaining a system of internal control over financial reporting, which is intended to provide reasonable assurance to our management and Board of Directors regarding the reliability of our consolidated financial statements. The system includes but is not limited to:
• | A documented organizational structure and division of responsibility; |
• | Established policies and procedures, including a code of conduct to foster a strong ethical climate which is communicated throughout our Corporation; |
• | Internal auditors that monitor the operation of the internal control system and report findings and recommendations to management and the Audit Committee; |
• | Procedures for taking action in response to an internal audit finding or recommendation; |
• | Regular reviews of our consolidated financial statements by qualified individuals; and |
• | The careful selection, training and development of our people. |
There are inherent limitations in the effectiveness of any system of internal control, including the possibility of human error and the circumvention or overriding of controls. Also, the effectiveness of an internal control system may change over time. We have implemented a system of internal control that was designed to provide reasonable assurance regarding the reliability of financial reporting and the preparation of consolidated financial statements for external purposes in accordance with generally accepted accounting principles.
We have assessed our internal control system in relation to criteria for effective internal control over financial reporting described in “Internal Control-Integrated Framework” issued by the Committee of Sponsoring Organizations (2013 framework) of the Treadway Commission.
Based upon these criteria, we believe that, as of December 31, 2016, our system of internal control over financial reporting was effective.
Our independent registered public accounting firm, Rehmann Robson LLC ("Rehmann"), has audited our 2016 consolidated financial statements and internal control over financial reporting as of December 31, 2016. Rehmann was given unrestricted access to all financial records and related data, including minutes of all meetings of stockholders, the Board of Directors and committees of the Board. Rehmann has issued an unqualified audit opinion on our 2016 consolidated financial statements as a result of the integrated audit and an unqualified opinion on the effectiveness of our internal controls as of December 31, 2016.
87
Isabella Bank Corporation
By: |
/s/ Jae A. Evans |
Jae A. Evans |
Chief Executive Officer |
(Principal Executive Officer) |
March 7, 2017 |
/s/ Dennis P. Angner |
Dennis P. Angner |
President and Chief Financial Officer |
(Principal Financial Officer, Principal Accounting Officer) |
March 7, 2017 |
Item 9B. Other Information.
None.
88
PART III
Item 10. Directors, Executive Officers and Corporate Governance.
For information concerning our directors and certain executive officers, see “Election of Directors” and “Section 16(a) Beneficial Ownership Reporting Compliance” in our Proxy Statement for the Annual Meeting of Shareholders to be held May 2, 2017 (“Proxy Statement”) which is incorporated herein by reference.
For Information concerning our Audit Committee financial experts, see “Committees of the Board of Directors and Meeting Attendance” in the Proxy Statement which is incorporated herein by reference.
We have adopted a Code of Business Conduct and Ethics that applies to our Chief Executive Officer and Chief Financial Officer. We shall provide to any person without charge upon request, a copy of our Code of Business Conduct and Ethics. Written requests should be sent to: Secretary, Isabella Bank Corporation, 401 North Main Street, Mount Pleasant, Michigan 48858.
Item 11. Executive Compensation.
For information concerning executive compensation, see “Executive Officers,” “Compensation Committee Report,” “Compensation Committee Interlocks and Insider Participation,” “Compensation Discussion and Analysis,” and “Remuneration of Directors” in the Proxy Statement which is incorporated herein by reference.
Item 12. Security Ownership of Certain Beneficial Owners and Management and Related Stockholder Matters.
For information concerning the security ownership of certain owners and management, see “Security Ownership of Certain Beneficial Owners and Management” in the Proxy Statement which is incorporated herein by reference.
Equity Compensation Plan Information
The following table provides information as of December 31, 2016, with respect to compensation plans under which our common shares are authorized for issuance to directors, officers or employees in exchange for consideration in the form of goods or services.
Plan Category | Number of Securities to be Issued Upon Exercise of Outstanding Options, Warrants, and Rights (A) | Weighted Average Exercise Price of Outstanding Options, Warrants, and Rights (B) | Number of Securities Remaining Available for Future Issuance Under Equity Compensation Plans (Excluding Securities Reflected in Column (A)) (C) | |||||||
Equity compensation plans approved by | ||||||||||
shareholders: None | — | — | — | |||||||
Equity compensation plans not approved by shareholders (1) (2): | ||||||||||
Deferred director compensation plan | 187,428 | (1 | ) | (2) | (1 | ) | (2) | |||
Total | 187,428 | |||||||||
(1) | Pursuant to the terms of the Directors Plan, our directors are required to invest at least 25% of their board fees in our common stock. These stock investments can be made either through deferred fees or through the purchase of shares through the Dividend Reinvestment Plan. Deferred fees, under the Directors Plan, are converted on a quarterly basis into stock units of our common stock based on the fair value of a share of common stock as of the relevant valuation date. Stock credited to a participant’s account is eligible for stock and cash dividends as declared. Dividend Reinvestment Plan shares are purchased on a monthly basis pursuant to the Dividend Reinvestment Plan. |
Distribution of deferred fees from the Directors Plan occurs when the participant retires from the board or upon the occurrence of certain other events. The participant is eligible to receive a lump-sum, in-kind, distribution of all of the stock that is then in his or her account, and any unconverted cash will be converted to and rounded up to whole shares of stock and distributed, as well. The Directors Plan does not allow for cash settlement, and therefore, such share based payment awards qualify for classification as equity. We may use authorized but unissued shares or purchase shares of common stock on the open market to meet our obligations under the Directors Plan. As of December 31, 2016, the Directors Plan had 213,470 shares eligible to be distributed under the Directors Plan.
89
(2) | The Rabbi Trust holds 26,042 shares for the benefit of participants pursuant to the Directors Plan. Accordingly, such shares are not included in the number of securities issuable in column (A) or the weighted average price calculation in column (B), nor are potential future contributions included in column (C). |
Item 13. Certain Relationships and Related Transactions, and Director Independence.
For information, see “Indebtedness of and Transactions with Management” and “Election of Directors” in the Proxy Statement, which is incorporated herein by reference.
Item 14. Principal Accountant Fees and Services.
For information concerning the principal accountant fees and services see “Fees for Professional Services Provided by Rehmann Robson LLC” and “Pre-approval Policies and Procedures” in the Proxy Statement which is incorporated herein by reference.
90
PART IV
Item 15. Exhibits and Financial Statement Schedules.
(a) | (1) | Financial Statements: The following documents are filed as part of Item 8 of this report: | |
Report of Independent Registered Public Accounting Firm | |||
Consolidated Balance Sheets | |||
Consolidated Statements of Changes in Shareholders’ Equity | |||
Consolidated Statements of Income | |||
Consolidated Statements of Comprehensive Income (Loss) | |||
Consolidated Statements of Cash Flows | |||
Notes to Consolidated Financial Statements | |||
(2) | Financial Statement Schedules: All schedules are omitted because they are neither applicable nor required, or because the required information is included in the consolidated financial statements or related notes. | ||
(3) | See the exhibits listed below under Item 15(b): | ||
(b) | The following exhibits required by Item 601 of Regulation S-K are filed as part of this report: | ||
3(a) | Amended Articles of Incorporation (1) | ||
3(b) | Amendment to the Articles of Incorporation (2) | ||
3(c) | Amendment to the Articles of Incorporation (3) | ||
3(d) | Amendment to the Articles of Incorporation (4) | ||
3(e) | Amendment to the Articles of Incorporation (8) | ||
3(f) | Amended Bylaws (6) | ||
3(g) | Amendment to Bylaws (7) | ||
3(h) | Amendment to Bylaws (10) | ||
3(i) | Amendment to Bylaws (11) | ||
10(a) | Isabella Bank Corporation and Related Companies Deferred Compensation Plan for Directors (9)* | ||
10(b) | Amendment to Isabella Bank Corporation and Related Companies Deferred Compensation Plan for Directors (12)* | ||
10(c) | Isabella Bank Corporation Split Dollar Plan (13)* | ||
10(d) | Isabella Bank Corporation Retirement Bonus Plan (9)* | ||
10(e) | Isabella Bank Corporation Supplemental Executive Retirement Plan (14)* | ||
10(f) | Isabella Bank Corporation Stock Award Incentive Plan (15)* | ||
14 | Code of Business Conduct and Ethics (5) | ||
21 | Subsidiaries of the Registrant | ||
23 | Consent of Rehmann Robson LLC, Independent Registered Public Accounting Firm | ||
31(a) | Certification pursuant to section 302 of the Sarbanes-Oxley Act of 2002 by the Chief Executive Officer | ||
31(b) | Certification pursuant to section 302 of the Sarbanes-Oxley Act of 2002 by the Chief Financial Officer | ||
32 | Section 1350 Certification of Chief Executive Officer and Chief Financial Officer | ||
101.INS | XBRL Interactive Data File** | ||
101.SCH | XBRL Interactive Data File** | ||
101.CAL | XBRL Interactive Data File** | ||
101.LAB | XBRL Interactive Data File** | ||
101.PRE | XBRL Interactive Data File** | ||
101.DEF | XBRL Interactive Data File** | ||
91
* | Management Contract or Compensatory Plan or Arrangement. | |
** | As provided by Rule 406T in Regulation S-T, this information is furnished and not filed for purposes of Sections 11 and 12 of the Securities Act of 1933 and Section 18 of the Exchange Act | |
(1) | Previously filed as an Exhibit to the Isabella Bank Corporation Form 10-K, filed March 12, 1991, and incorporated herein by reference | |
(2) | Previously filed as an Exhibit to the Isabella Bank Corporation Form 10-K, filed March 26, 1994, and incorporated herein by reference. | |
(3) | Previously filed as an Exhibit to Isabella Bank Corporation Form 10-K, filed March 22, 2000, and incorporated herein by reference. | |
(4) | Previously filed as an Exhibit to Isabella Bank Corporation Form 10-K, filed March 27, 2001, and incorporated herein by reference. | |
(5) | Previously filed as an Exhibit to Isabella Bank Corporation Form 8-K, filed April 25, 2006, and incorporated herein by reference. | |
(6) | Previously filed as an Exhibit to Isabella Bank Corporation Form 10-K, filed March 16, 2005, and incorporated herein by reference. | |
(7) | Previously filed as an Exhibit to Isabella Bank Corporation Form 8-K, filed November 22, 2006, and incorporated herein by reference. | |
(8) | Previously filed as an Exhibit to Isabella Bank Corporation Form 8-K, filed May 16, 2008, and incorporated herein by reference. | |
(9) | Previously filed as an Exhibit to Isabella Bank Corporation Form 8-K, filed December 19, 2008, and incorporated herein by reference. | |
(10) | Previously filed as an Exhibit to Isabella Bank Corporation Form 8-K, filed August 28, 2009, and incorporated herein by reference. | |
(11) | Previously filed as an Exhibit to Isabella Bank Corporation Form 8-K, filed December 23, 2009, and incorporated herein by reference. | |
(12) | Previously filed as an Exhibit to Isabella Bank Corporation Form 8-K, filed August 30, 2013, and incorporated herein by reference. | |
(13) | Previously filed as an Exhibit to Isabella Bank Corporation Form 8-K, filed March 31, 2015, and incorporated herein by reference. | |
(14) | Previously filed as an Exhibit to Isabella Bank Corporation Form 8-K, filed April 27, 2015, and incorporated herein by reference. | |
(15) | Previously filed as an Exhibit to Isabella Bank Corporation Form 8-K, filed May 6, 2015, and incorporated herein by reference. | |
Item 16. Form 10-K Summary.
Not applicable.
92
SIGNATURES
Pursuant to the requirements of the Securities Exchange Act of 1934, the registrant has duly caused this report to be signed on its behalf by the undersigned thereunto duly authorized.
ISABELLA BANK CORPORATION
(Registrant)
By: | /s/ Jae A. Evans | Date: | March 7, 2017 | |||
Jae A. Evans | ||||||
Chief Executive Officer | ||||||
(Principal Executive Officer) | ||||||
Pursuant to the requirements of the Exchange Act, this report has been signed below by the following persons on behalf of the registrant and in the capacities and on the dates indicated.
Signatures | Capacity | Date | ||
/s/ Dennis P. Angner | Chief Financial Officer (Principal Financial Officer, Principal Accounting Officer) and Director | March 7, 2017 | ||
Dennis P. Angner | ||||
/s/ Dr. Jeffrey J. Barnes | Director | March 7, 2017 | ||
Dr. Jeffrey J. Barnes | ||||
/s/ Richard J. Barz | Director | March 7, 2017 | ||
Richard J. Barz | ||||
/s/ Jae A. Evans | Chief Executive Officer and Director | March 7, 2017 | ||
Jae A. Evans | ||||
/s/ G. Charles Hubscher | Director | March 7, 2017 | ||
G. Charles Hubscher | ||||
/s/ Thomas L. Kleinhardt | Director | March 7, 2017 | ||
Thomas L. Kleinhardt | ||||
/s/ Joseph LaFramboise | Director | March 7, 2017 | ||
Joseph LaFramboise | ||||
/s/ David J. Maness | Director | March 7, 2017 | ||
David J. Maness | ||||
/s/ W. Joseph Manifold | Director | March 7, 2017 | ||
W. Joseph Manifold | ||||
/s/ W. Michael McGuire | Director | March 7, 2017 | ||
W. Michael McGuire | ||||
/s/ Sarah R. Opperman | Director | March 7, 2017 | ||
Sarah R. Opperman | ||||
/s/ Gregory V. Varner | Director | March 7, 2017 | ||
Gregory V. Varner | ||||
93