Attached files
| file | filename |
|---|---|
| 8-K - FORM 8-K - FIFTH THIRD BANCORP | d299482d8k.htm |
 RBC
Capital Markets Financial Institutions Conference 2017
Greg D. Carmichael President & Chief Executive Officer March 7, 2017 Exhibit 99.1 |
 2 © Fifth Third Bank | All Rights Reserved Cautionary statement This presentation contains statements that we believe are “forward-looking statements” within the meaning of Section 27A of the
Securities Act of 1933, as amended, and Rule 175 promulgated thereunder,
and Section 21E of the Securities Exchange Act of 1934, as amended, and Rule 3b-6 promulgated thereunder. These statements relate to our financial condition, results of operations, plans, objectives, future performance or business. They usually can be identified
by the use of forward-looking language such as “will likely result,” “may,” “are expected to,” “anticipates,” “potential,” “estimate,”
“forecast,” “projected,” “intends to,” or may include other similar words or phrases such as “believes,” “plans,” “trend,” “objective,” “continue,” “remain,” or similar expressions, or future or
conditional verbs such as “will,” “would,” “should,” “could,” “might,” “can,” or similar verbs. You should not place undue reliance on these statements, as they are subject to risks and uncertainties, including but not limited to the risk
factors set forth in our most recent Annual Report on Form 10-K as
updated from time to time by our Quarterly Reports on Form 10-Q. When considering these forward-looking statements, you should keep in mind these risks and uncertainties, as well as any cautionary statements we may make. Moreover, you should treat these statements as speaking
only as of the date they are made and based only on information then
actually known to us. There is a risk that additional information may become known during the company’s quarterly closing process or as a result of subsequent events that could affect the accuracy of the statements and financial information contained herein.
There are a number of important factors that could cause future results to differ
materially from historical performance and these forward-looking statements. Factors that might cause such a difference include, but are not limited to: (1) general economic or real estate market conditions, either nationally or in the
states in which Fifth Third, one or more acquired entities and/or the
combined company do business, weaken or are less favorable than expected; (2) deteriorating credit quality; (3) political developments, wars or other hostilities may disrupt or increase volatility in securities markets or other economic conditions; (4) changes in the interest rate
environment reduce interest margins; (5) prepayment speeds, loan
origination and sale volumes, charge-offs and loan loss provisions; (6) Fifth Third’s ability to maintain required capital levels and adequate sources of funding and liquidity; (7) maintaining capital requirements and adequate sources of funding and liquidity may limit Fifth Third’s operations
and potential growth; (8) changes and trends in capital markets; (9)
problems encountered by larger or similar financial institutions may adversely affect the banking industry and/or Fifth Third; (10) competitive pressures among depository institutions increase significantly; (11) changes in customer preferences or information technology systems; (12)
effects of critical accounting policies and judgments; (13) changes in
accounting policies or procedures as may be required by the Financial Accounting Standards Board (FASB) or other regulatory agencies; (14) legislative or regulatory changes or actions, or significant litigation, adversely affect Fifth Third, one or more acquired
entities and/or the combined company or the businesses in which Fifth
Third, one or more acquired entities and/or the combined company are engaged, including the Dodd-Frank Wall Street Reform and Consumer Protection Act; (15) ability to maintain favorable ratings from rating agencies; (16) failure of models or risk management systems or controls;
(17) fluctuation of Fifth Third’s stock price; (18) ability to
attract and retain key personnel; (19) ability to receive dividends from its subsidiaries; (20) potentially dilutive effect of future acquisitions on current shareholders’ ownership of Fifth Third; (21) declines in the value of Fifth Third’s goodwill or other intangible assets;
(22) effects of accounting or financial results of one or more
acquired entities; (23) difficulties from Fifth Third’s investment
in, relationship with, and nature of the operations of Vantiv Holding,
LLC; (24) loss of income from any sale or potential sale of businesses
(25) difficulties in separating the operations of any branches or other assets divested; (26) losses or adverse impacts on the carrying values of branches and long-lived assets in connection with their sales or anticipated sales; (27) inability to achieve expected benefits from branch
consolidations and planned sales within desired timeframes, if at all;
(28) ability to secure confidential information and deliver products and services through the use of computer systems and telecommunications networks; and (29) the impact of reputational risk created by these developments on such matters as business generation and retention, funding
and liquidity. You should refer to our periodic and current reports filed
with the Securities and Exchange Commission, or “SEC,” for further information on other factors, which could cause actual results to be significantly different from those expressed or implied by these forward-looking statements.
In this presentation, we may sometimes provide non-GAAP financial information.
Please note that although non-GAAP financial measures provide useful insight to analysts, investors and regulators, they should not be considered in isolation or relied upon as a substitute for analysis using GAAP measures. We provide
GAAP reconciliations for non- GAAP measures in a later slide in this
presentation as well as in our earnings release, both of which are available in the investor relations section of our website, www.53.com. Management has provided forward-looking guidance on certain non-GAAP measures in connection with this presentation in order to facilitate
comparability with the Bancorp’s historical performance and
financial condition as reflected in these non-GAAP measures. Such forward-looking non-GAAP measures include return on tangible common equity; net interest margin (FTE); net interest income (FTE); adjusted noninterest income excluding mortgage banking net revenue; and adjusted
noninterest income, excluding certain transactions and adjustments
related to the Bancorp’s investment in Vantiv, Visa total return swap, and branch sales, closures and consolidations. Bancorp’s management does not estimate on a forward-looking basis the impact of items similar to those that it has excluded to generate these non-GAAP measures on
a historical basis because the occurrence and amounts of items such as
these are difficult to predict. As a result, the Bancorp has not provided reconciliations of its forward-looking non-GAAP measures. |
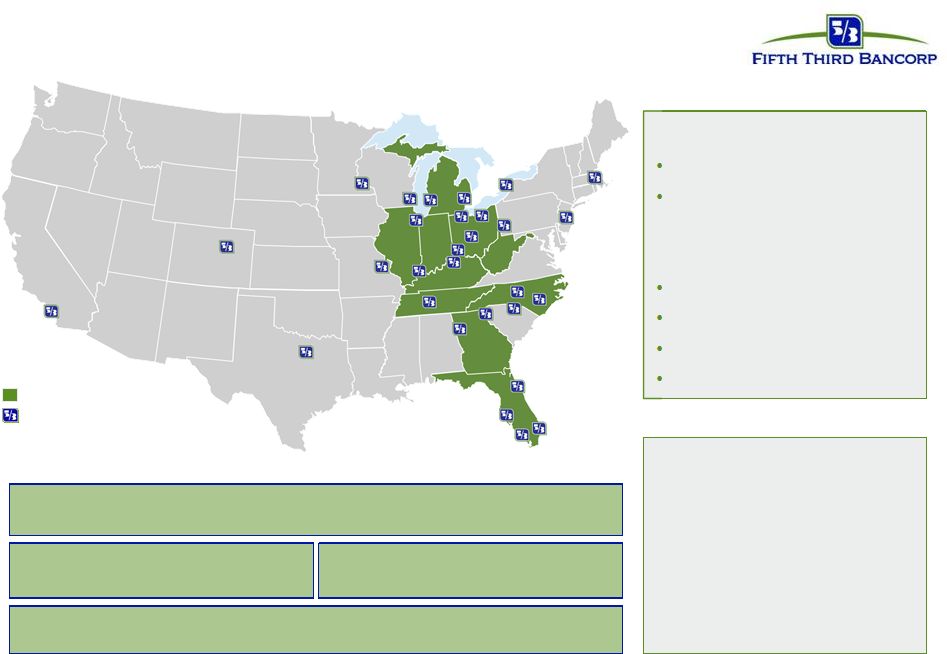 3 © Fifth Third Bank | All Rights Reserved • $142B Total Assets (#13) 1 • $93B Total Loans 2 - 61% Commercial - 39% Consumer • $101B Core Deposits • $31B AUM • 128% LCR • CET 1: 10.4% 1 SNL Financial; regulatory filing as of 4Q16, 2 2016 10-K; EOP loans including loans HFS 3 EY 2016 Cash Management Services Surveys, 4 Oliver Wyman 2016 Survey of Consumers, 5 The 2015 Monitor Top Bank 50 & Technology Issue, 6 Ponemon Institute 12 th annual Privacy Trust Study for Retail Banking, 7 University of Michigan American Customer Satisfaction (ASCI) Index, 8 Mitek 2016 Mobile Deposits Benchmark Report, and 9 FDIC 2016 Summary of Deposits; ranking by MSA Well-positioned franchise and focused footprint In footprint markets National commercial hub cities 4Q16 Bancorp Overview #10 Equipment Finance 5 Treasury Management 3 #7 #9 Commercial & Industrial Lending #9 Retail Bank 4 Franchise Rankings #2 - Most Trusted Companies for Retail Banking #4 - Mobile Deposit Customer Experience Rankings #3 - Banking Industry Customer Satisfaction Rating Top 5 deposit share in 11 of our 15 largest markets 6 7 8 9 1 |
 4 © Fifth Third Bank | All Rights Reserved Fintech is in our DNA 1973 FITB enters the fintech space with its payments processing business Midwest Payment Systems (MPS) 1980’s Money transfer volume exceeds telegraph service for the first time, Fifth Third joins SWIFT 2009 Fifth Third sold 51% of FTPS, remaining invested in the business, later rebranded as Vantiv 1977 Fifth Third introduced an online automated teller system – JEANIE®
– the first shared ATM network in the United States 2003 MPS is rebranded as Fifth Third
Processing Solutions (FTPS) 1990’s Fifth Third launches a debit card program, the Master Money card for
processing online credit
card sales 2004 Check 21 -
Fifth Third takes an industry leadership position by enabling the back office for check image capture and is one of the initial owner banks of the SVPCO Image Exchange Network 2017 Partnership with leading fintech venture capital firm QED
Investors 2007 Fifth Third evolved the “smart safe” technology with the first provisional credit offering 2016 Partnerships and strategic investments with GreenSky,
ApplePie,
AvidXchange, Transactis, and
Zelle 1970
FITB becomes a member of the association National
BankAmericard Inc., which later becomes Visa |
 5 © Fifth Third Bank | All Rights Reserved The economic backdrop is more positive • The unemployment rate remains low and economic indicators are positive We are benefiting from higher interest rates The Fed has indicated the need to possibly accelerate tightening • The government is expected to take steps that should be positive for banks Overall: Potential tax breaks and fiscal stimulus related to infrastructure and defense
spending Banking: Fiduciary rule, CFPB, regulatory relief, additional Fed rate hikes • But there is still some uncertainty Source: Bloomberg; data as of 03/1/2017 9.4% 16.7% 9.8% 4.8% 0.44 1.23 2.16 0.81 2.10 2.69 1ML 3ML 6ML 12ML 2YS 3YS 4YS 5YS 7YS 10YS 15YS 20YS 30YS 3/1/2016 3/1/2017 Interest rates have risen Fed funds rate 2017 expectations continue to increase Overall strong employment numbers 98% 85% 55% 1+ 2+ 3+ 9/30/2016 11/30/2016 12/31/2016 3/1/2017 2017 2016 2015 2014 2013 2012 2011 2010 Unemployment Underemployment |
 6 © Fifth Third Bank | All Rights Reserved Our strong balance sheet is allowing us to capitalize on opportunities • Strong capital ratios; CET1 up 57 bps since the end of 2015 • Balanced interest rate risk profile well-positioned to benefit from rising rate environment
• Vantiv ownership with sizeable unrecognized value • Continue to reduce auto exposure with balances down $1.5 billion since 2015 • Our criticized asset ratio improved 154 bps in 2016; lowest level since Q3 2007 • Growing loans that meet return hurdles while maintaining credit discipline 1 SNL Financial; regulatory filing as of 4Q16, 2 Peer 4Q16 earnings releases 1 1 Also have additional upside potential from unrecognized Vantiv ownership ZION PNC BBT RF MTB FITB CFG CMA USB KEY HBAN STI Common Equity Tier 1 Ratio Tier 1 Ratio 0% 2% 4% 6% 8% 10% 12% 14% 3% 4% 5% 6% 7% 8% 9% 10% 11% 2012 2013 2014 2015 2016 Criticized assets as a percentage of total commercial loans -15% -10% -5% 0% 5% 10% 15% 20% HBAN PNC STI RF CFG BBT FITB Change in auto loan balances (4Q16 vs. 4Q15) Balanced capital ratios while still deploying capital to shareholders Our criticized assets have continued to decline Auto loans have declined relative to peers due to strategic positioning 2 |
 7 © Fifth Third Bank | All Rights Reserved • Generating positive operating leverage is a top priority in 2017 • NorthStar long-term financial targets: ROTCE 1 : 12% - 14% ROA: 1.1% - 1.3% Efficiency ratio: < 60% • We plan to achieve our profitability targets regardless of the interest rate environment
• We took a number of actions in 2016 to improve profitability We are committed to improved profitability • Black Knight mortgage loan operating system • Operations automation • Omni-channel strategies • Branch closures and consolidations • Re-design of commercial client experience • Contract renegotiations • Launch of new credit card products • Non-branch rationalization and workspace management 1 Forward-looking Non-GAAP measure: See cautionary statement on slide 2 of the presentation and page 32 of the 4Q16 earnings release for
use of certain forward-looking non-GAAP measures
NorthStar strategies implemented or initiated in 2016 |
 8 © Fifth Third Bank | All Rights Reserved 1 Optimizing the balance sheet 2 Driving fee income growth 3 Strategic expense management Consumer Payments Commercial Wealth & Asset 4 Positive operating leverage from the core Personal lending GreenSky partnership Credit card Advanced analytics capabilities Wholesale payments Industry-focused commerce solutions Capital markets FRM ‘2020’; Advisory Insurance P&C, employee benefits Commercial relationships Middle market, industry verticals, specialty lending expansion Wealth advisory Expanding distribution (M&A, digital) & retirement offerings Strategic expense programs Real Estate: Branch network optimization, corporate facilities IT & Ops: Intelligent automation, workforce management, network infrastructure & sourcing optimization
Credit: End-to-end credit process redesign
Consumer households Omni-channel capabilities Continuous focus on core operating leverage and prior years’ initiatives Mortgage LOS replacement & channel expansion Exiting assets that do not meet our risk-return profile NorthStar initiatives |
 9 The investment • Integrated new lead management platform in late 2016 • Implement new LOS • Home equity process modernization • Workflow optimization and a fully digitized customer experience Target outcomes • Industry leading experience • Channel, product, and geographic expansion with profitable market share increase
• Configurable and integrated workflow to reduce fulfillment costs by 10%-15% with cycle time reduction
• Integrated risk management and controls Financial impact • Pre-tax income benefit: $10-$12 million in 2018; $25-$30 million in 2019; $55-$60 million in 2020
• After-tax internal rate of return: 70%-80% Mortgage loan origination system (LOS) Clear path to implementation Empower - retail & direct Empower - home equity Lead management platform Lending space - correspondent 2016 2017 2018 2019 Partner selection Implement Pilot & rollout Integration to empower Configuration & testing Pilot Rollout Configuration & testing Pilot Rollout Implement Workflow optimization and fully digitized customer experience Workflow optimization and fully digitized customer experience Pilot & rollout Workflow optimization and fully digitized customer experience © Fifth Third Bank | All Rights Reserved |
 © Fifth Third Bank | All Rights Reserved 10 Digitize branch operations • Digitize 40 million signatures annually • Digital acceptance of disclosures & terms • Preventative compliance controls Electronic signature Platform branch scanning • Digitize 10 million documents annually • Reduce transportation & operations costs Self service transactions • Digitizing basic transactions • Driven by customers’ channel preference • Digitize 650 million pieces of paper annually • Improve customer experience • Reduce transportation & operations costs Teller automation Benefits & financial impact • $10 million annual pre-tax benefit • ~700 million pages digitized Platform branch scanning Self service transactions Teller automation Electronic signature |
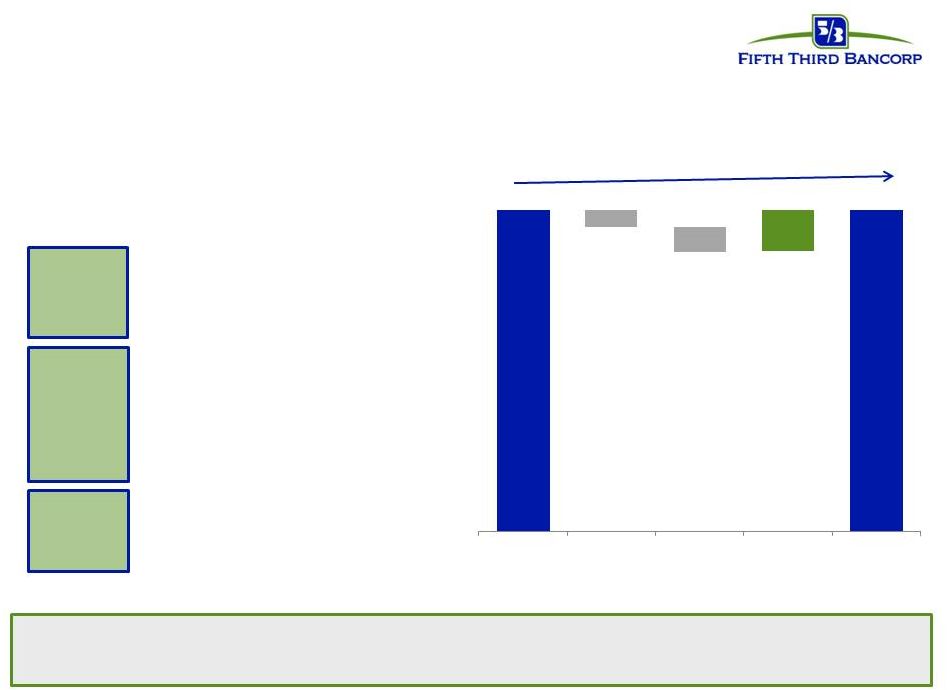 11 © Fifth Third Bank | All Rights Reserved $0.3 billion / 0.5% growth $56.2 $1.5 $2.0 $3.8 $56.5 Balance sheet optimization Objective • Redeploy capital from portfolios that do not fit our strategy/return/credit profile to strategic segments Impact of 2016 actions Continued focus on optimization and investment in strategic segments Expect to exit another $1.5 billion of loans 2017 focus: • Exited $1.5 billion of loans with low-mid single digit ROEs or in non-strategic segments Strategy/ return- related exits Credit- related exits Strategic growth • Exited $2.0 billion of loans • Drove ~100 bps of 154 bps improvement in criticized loans • Loans exited charge-off at ~3-4x the rate of overall portfolio • Redeployed $3.8 billion to enable ~7% growth of industry verticals and specialty products Commercial loan & lease balances ($ billions) 1 Represents balances from Fifth Third’s Commercial line of business on an end of period basis, including HFS loans
Strategy/ return – related exits 2015 Credit – related exits Strategic growth 2016 1 |
 12 © Fifth Third Bank | All Rights Reserved Targeting growth in strategic areas within risk appetite Committed to higher profitability and attractive returns relative to peer-group Well-positioned to achieve long-term targets under various economic conditions In summary Will create additional shareholder value Growth Profitability Stability |
 13 © Fifth Third Bancorp | All Rights Reserved Appendix |
 14 © Fifth Third Bank | All Rights Reserved • Adjusted 1 NII of $925 million, up $12 million sequentially; adjusted 1 NIM of 2.91%, up 3 bps sequentially Reported NII decreased $4 million vs. 3Q16; NIM (FTE) decreased 2 bps to 2.86% 1 vs. 3Q16 • Adjusted 1 noninterest income up 2% vs. 3Q16 Reported noninterest income down 26% vs. 3Q16 primarily driven by Vantiv-related items • Tightly-managed operating expenses; adjusted 1 noninterest expenses down 2% vs. 3Q16 Reported noninterest expenses down 1% vs. 3Q16 • Improving charge-offs and criticized assets; commercial full year NCO ratio at 15 year low • Executing on North Star initiatives • Overall solid credit quality in-line with expectations Fourth quarter 2016 Diluted EPS $0.49 Included $0.01 net positive impact for certain items Net income $395 million Fourth quarter 2016 highlights 1 Non-GAAP measure: See Reg G reconciliation on pages 21 and 22 of this presentation and use of non-GAAP measures on page 32 of the 4Q16 earnings release 2 See page 15 of the presentation for impact of certain items Full year 2016 Diluted EPS
$1.93
Net Income $1.6 billion 2 |
 15 © Fifth Third Bank | All Rights Reserved Pre-tax items included in 4Q16 results had a net positive $0.01 EPS impact: – A $16 million pre-tax (~$10 million after-tax ) reduction to net interest income for refunds offered to certain card customers – A $9 million pre-tax (~$6 million after-tax ) gain from the net exercise of the Vantiv warrant – A $6 million pre-tax (~$4 million after-tax ) benefit related to the valuation of the Visa total return swap – A $6 million tax benefit from the early adoption of an accounting standard Credit trends – NCO ratio of 31 bps; down 14 bps vs. 3Q16 – Portfolio NPA ratio of 80 bps; up 5 bps vs. 3Q16 4Q16 in review 1 Non-GAAP measure: See Reg G reconciliation on pages 21 and 22 of this presentation and use of non-GAAP measures on page 32 of the 4Q16 earnings release 2 Assumes a 35% tax rate ($ millions) 4Q16 Seq. YOY Average Balances Loans & leases (ex. HFS) $92,964 (1%) (1%) Core deposits $100,949 2% 1% Income Statement Data Net interest income $903 - - Taxable equivalent adjustment 6 - 20% Net interest income (taxable equivalent) 909 - 1% Provision for loan and lease losses 54 (33%) (41%) Noninterest income 620 (26%) (44%) Noninterest expense 960 (1%) - Net income attributable to Bancorp $395 (23%) (40%) Net income available to common shareholders $372 (26%) (41%) Financial Ratios Earnings per share, diluted 0.49 (25%) (38%) Net interest margin (FTE) 2.86% (2bps) 1bp Efficiency ratio (FTE) 62.8% 730bps 1480bps Return on average assets 1.11% (33bps) (72bps) Return on average common equity 9.7% (310bps) (750bps) Return on average tangible common equity 11.6% (360bps) (900bps) Tangible book value per share $16.60 (4%) 8% 1 1 1 1 2 2 2 2 |
 16 © Fifth Third Bank | All Rights Reserved PPNR and efficiency ratio trends 1 1 Non-GAAP measures: See Reg G reconciliation on pages 21 and 22 of this presentation and use of non-GAAP measures on page 32 of the 4Q16 earnings release
2 Prior quarters include similar adjustments • Adjusted PPNR up 7% vs. 3Q16 driven by: Improvements in NII, noninterest income and noninterest expense resulted in ~200 bps decline in adjusted efficiency ratio • Adjusted PPNR up 1% YoY Improvement in NII and flat expenses, partially offset by lower noninterest income resulted in ~20 bps decline in adjusted efficiency ratio $576 $516 $539 $543 $582 $0 $100 $200 $300 $400 $500 $600 $700 $800 $900 $1,000 $1,100 4Q15 1Q16 2Q16 3Q16 4Q16 PPNR trend ($ millions) 48.0% 63.8% 65.3% 55.5% 62.8% 62.2% 65.3% 64.3% 64.0% 62.0% 4Q15 1Q16 2Q16 3Q16 4Q16 Efficiency ratio Efficiency Ratio Adjusted Efficiency Ratio Adjusted PPNR Reported PPNR ($ in millions) 4Q15 1Q16 2Q16 3Q16 4Q16 Net interest income (FTE) $904 $909 $908 $913 $909 Add: Noninterest income 1,104 637 599 840 620 Less: Noninterest expense 963 986 983 973 960 Pre-provision net revenue $1,045 $560 $524 $780 $569 Adjustments to remove (benefit) / detriment : 2 In net interest income: Bankcard refunds - - - - 16 In noninterest income: Gain on sale of Vantiv shares (331) - - - - Gain on Vantiv warrant actions (89) - - - (9) Vantiv TRA settlement payment (49) - - - - Gain from termination and settlement of Vantiv TRA - - - (280) - Gain on sale from the sale of a non-branch facility - - - (11) - Branch and land valuation adjustments - - - 28 - Valuation of 2009 Visa total return swap 10 (1) 50 12 (6) Transfer of nonconforming investments under Volcker to HFS - - - 9 - Vantiv warrant valuation (21) (47) (19) 2 - Gain on sale of certain branches - (8) (11) - - Gain on sale of the agented bankcard loan portfolio - - (11) - - Securities (gains) / losses (1) (3) (6) (4) 3 In noninterest expense: Contribution to Fifth Third Foundation 10 - - 3 5 Severance expense 2 15 3 4 4 Retirement eligibility changes - - 9 - - Adjusted PPNR $576 $516 $539 $543 $582 PPNR reconciliation |
 17 © Fifth Third Bank | All Rights Reserved Strong liquidity profile 1 Available and contingent borrowing capacity (4Q16): – FHLB ~$10.8B available, ~$14.7B total – Federal Reserve ~$31.5B Holding Company: Modified LCR of 128% Holding Company cash at 12/31/16: $2.4B Cash currently sufficient to satisfy all fixed obligations in a stressed environment for ~24 months (debt maturities, common and preferred dividends, interest and other expenses) without accessing capital markets, relying on dividends from subsidiaries or any other actions $500MM maturity in 1Q17 Bank Entity: $250MM of debt matured in 4Q16 The Bank did not issue any additional debt in 4Q16 2017 Funding Plans: The $650MM debt maturity at the Bank will take place in 2Q17 Fifth Third would not be required to replace 2017 debt maturities to maintain our current senior debt ratings under the Moody’s LGF methodology Any additional debt issuance in 2017 would result from general balance sheet management and prudent liquidity risk management S-T wholesale 5% $500 $500 $500 $1,100 $2,312 2017 2018 2019 2020 2021 2022 on Fifth Third Bancorp Fifth Third Capital Trust (Bancorp) Holding company unsecured debt maturities ($ millions) $650 $1,850 $2,600 $2,100 $750 2017 2018 2019 2020 2021 2022 on Bank unsecured debt maturities ($ millions – excl. Retail Brokered & Institutional CDs) Demand 25% Interest checking 19% Savings/ MMDA 24% Consumer time 3% Foreign Office 0% Non-Core Deposits 2% S-T borrowings 3% Other liabilities 3% Equity 11% L-T debt 10% Heavily core funded as of 12/31/2016 |
 18 © Fifth Third Bank | All Rights Reserved Balance sheet positioning Commercial Loans 1,2 Investment Portfolio Consumer Loans 1 Data as of 12/31/16 1 Includes HFS Loans & Leases 2 Fifth Third had $4.48B 1ML receive-fix swaps outstanding against C&I loans, which are being included in fixed
3 Fifth Third had $3.46B 3ML receive-fix swaps outstanding against long-term debt, which are being included in floating, long-term debt with swaps outstanding reflected at fair value • Fixed: $14.0B 1, 2 • Float: $42.5B 1, 2 • 1ML based: 62% (of total commercial) • 3ML based: 8% (of total
commercial) • Prime based: 4% (of total
commercial) • Weighted avg. life: 1.65 years • 50% allocation to bullet/locked-out cash flow securities • Investment portfolio yield: 3.17% • Duration: 4.9 years • Net unrealized pre-tax gain: $159MM • 99% AFS • Fixed: $25.1B 1 • Float: $11.3B 1 • 12ML based: 3% (of total
consumer) • Prime based: 24% (of total consumer) • Weighted avg. life: 3.76 years • Auto weighted avg. life: 1.39 years Long-term Debt 3 Key Characteristics Balance Sheet Mix Fixed vs. Floating Level 1 100% Fix / 0% Float Level 2A 100% Fix / 0% Float Non-HQLA /Other 78% Fix / 28% Float C&I 20% Fix / 80% Float Commercial Mortgage 24% Fix / 76% Float 2% Fix / 98% Float Commercial Construction 100% Fix / 0% Float Commercial Lease Resi Mtg & Construction 88% Fix / 12% Float Auto 99% Fix / 1% Float 8% Fix / 92% Float Home Equity 30% Fix / 70% Float Credit Card 100% Fix / 0% Float Other • Fixed: $10.3B 3 • Float: $4.0B 3 • 1ML based: <1% (of total
long term debt) • 3ML based: 28% (of total long
term debt) •
Weighted avg. life: 4.38 years
Senior Debt 76% Fix / 24% Float Sub Debt 55% Fix / 45% Float 97% Fix / 3% Float Auto Securiz. Proceeds 0% Fix / 100% Float TRUPS 100% Fix / 0% Float Other 21% 43% 28% 2% 6% 74% 12% 7% 7% 34% 46% 20% <1% 1% 64% 27% 8% |
 19 © Fifth Third Bank | All Rights Reserved Interest rate risk management Data as of 12/31/16 1 Actual results may vary from these simulated results due to differences between forecasted and actual balance sheet composition, timing, magnitude, and frequency of interest rate changes, as well as other changes in market conditions and management strategies.
2 Re-pricing percentage or “beta” is the estimated change in yield over 12 months as a result of a shock or ramp 100 bps parallel shift in the yield curve • NII benefits from asset rate reset in a rising rate environment – 58% of total loans are floating rate considering impacts of interest rate swaps (75% of
total commercial and 31% of total consumer) – Investment portfolio duration of 4.9 years – Short-term borrowings represent approximately 18% of total wholesale funding, or 3% of total funding
– Approximately $12 billion in non-core funding matures beyond one year • Interest rate sensitivity tables are based on conservative deposit assumptions – 70% beta on all interest-bearing deposit and sweep balances (~50% betas experienced in 2004 –
2006 Fed tightening cycle) – No modeled re-pricing lag – Modeled non-interest bearing commercial DDA runoff of approximately $2.5 billion (about 10%) for each 100
bps increase in rates – DDA runoff rolls into an interest bearing product with a 100% beta Change in Interest Rates (bps) +200 Shock Change in Interest Rates (bps) +100 Shock +200 Ramp over 12 months 1.88% 6.78% (4.00%) +25 Shock +100 Ramp over 12 months 1.13% 4.32% - -75 Shock -75 Ramp over 6 months (5.77%) (10.62%) - Betas 25% Higher Betas 25% Lower Change in Interest Rates (bps) 12 Months 13-24 Months 12 Months Change in Interest Rates (bps) 12 Months 13-24 Months 12 Months 13-24 Months +200 Ramp over 12 months 1.61% 6.24% 2.15% +200 Ramp over 12 months (1.56%) (0.10%) 5.32% 13.66% +100 Ramp over 12 months 1.00% 4.05% 1.27% +100 Ramp over 12 months (0.59%) 0.88% 2.85% 7.76% 7.31% 4.58% - Estimated NII Sensitivity with Demand Deposit Balance Changes % Change in NII (FTE) (12.00%) % Change in NII (FTE) $1B Balance Decrease $1B Balance Increase 13-24 Months (4.96%) - - - Estimated NII Sensivity with Deposit Beta Changes (2.00%) (6.00%) (0.36%) - (0.14%) 12 Months 13-24 Months 12 Months 13-24 Months Estimated NII Sensitivity Profile and ALCO Policy Limits Estimated EVE Sensitivity Profile and ALCO Policy Limits % Change in NII (FTE) ALCO Policy Limits Change in EVE ALCO Policy Limit |
 20 © Fifth Third Bank | All Rights Reserved Credit trends Residential Mortgage Commercial & Industrial Home Equity & Automobile Commercial Real Estate * Excludes loans held-for-sale |
  21 © Fifth Third Bancorp | All Rights Reserved Regulation G non-GAAP reconciliation See page 32 of the 4Q16 earnings release for a discussion on the use of non-GAAP financial measures
Fifth Third Bancorp and Subsidiaries
Regulation G Non-GAAP Reconciliation
$ and shares in millions
(unaudited) December September June March December 2016 2016 2016 2016 2015 Net interest income (U.S. GAAP) $903 $907 $902 $903 $899 Add: Noninterest income 620 840
599 637
1,104 Less: Noninterest expense (960) (973)
(983) (986)
(963) Pre-provision net revenue
$563 $774 $518 $554 $1,040 Net income available to common shareholders (U.S. GAAP) $372 $501 $305 $311 $634 Add: Intangible amortization, net of tax - -
- -
- Tangible net income available to common
shareholders $372
$501 $305 $311 $634 Tangible net income available to common shareholders (annualized) (a) $1,480 $1,993 $1,227 $1,251 $2,515 Average Bancorp shareholders' equity (U.S. GAAP) $16,545 $16,883 $16,584 $16,376 $15,982 Less: Average preferred stock (1,331) (1,331)
(1,331) (1,331)
(1,331) Average goodwill
(2,416) (2,416)
(2,416) (2,416)
(2,416) Average intangible assets and other servicing rights
(10) (10)
(11) (12)
(13) Average tangible common equity
(b) $12,788
$13,126 $12,826 $12,617 $12,222 Total Bancorp shareholders' equity (U.S. GAAP) $16,205 $16,776 $16,726 $16,323 $15,839 Less: Preferred stock (1,331) (1,331)
(1,331) (1,331)
(1,331) Goodwill
(2,416) (2,416)
(2,416) (2,416)
(2,416) Intangible assets and other servicing rights
(10) (10)
(11) (12)
(13) Tangible common equity, including
unrealized gains / losses (c) $12,448
$13,019 $12,968 $12,564 $12,079 Less: Accumulated other comprehensive income (59) (755)
(889) (684)
(197) Tangible common equity, excluding unrealized gains / losses
(d) $12,389
$12,264 $12,079 $11,880 $11,882 Total assets (U.S. GAAP) $142,177 $143,279 $143,625 $142,430 $141,048 Less: Goodwill (2,416) (2,416)
(2,416) (2,416)
(2,416) Intangible assets and other servicing rights
(10) (10)
(11) (12)
(13) Tangible assets, including unrealized gains
/ losses (e) $139,751
$140,853 $141,198 $140,002 $138,619 Less: Accumulated other comprehensive income / loss, before tax (91) (1,162)
(1,368) (1,052)
(303)
Tangible assets, excluding unrealized gains / losses (f)
$139,660 $139,691 $139,830 $138,950 $138,316 Common shares outstanding (g) 750 756
766 770
785 Ratios: Return on average tangible common equity (a) / (b) 11.6% 15.2% 9.6% 9.9% 20.6% Tangible common equity (excluding unrealized gains/losses) (d) / (f) 8.87% 8.78% 8.64% 8.55% 8.59% Tangible common equity (including unrealized gains/losses) (c) / (e) 8.91% 9.24% 9.18% 8.97% 8.71% Tangible book value per share (c) / (g) $16.60 $17.22 $16.93 $16.32 $15.39 For the Three Months Ended |
 22 © Fifth Third Bancorp | All Rights Reserved Regulation G non-GAAP reconciliation See page 32 of the 4Q16 earnings release for a discussion on the use of non-GAAP financial measures
Fifth Third Bancorp and Subsidiaries
Regulation G Non-GAAP Reconciliation
$ and shares in millions
(unaudited) December September June March December 2016 2016 2016 2016 2015 Net interest income (U.S. GAAP) $903 $907 $902 $903 $899 Add: FTE adjustment 6 6
6 6
5 Net interest income on an
FTE basis (c) $909
$913 $908 $909 $904 Net interest income on an FTE basis (annualized) (d) $3,616 $3,632 $3,652 $3,656 $3,587 Net interest income on an FTE basis excluding certain items Net interest income on an FTE basis $909 $913 $908 $909 $904 Add: Bankcard refunds 16 -
- -
- Adjusted net interest income on an FTE basis
(e) $925
$913 $908 $909 $904 Adjusted net interest income on an FTE basis (annualized) (f) $3,680 $3,632 $3,652 $3,656 $3,587 Noninterest income excluding certain items Noninterest income (U.S. GAAP) (g) $620 $840 $599 $637 $1,104 Gain on sale of Vantiv shares - -
- -
(331) Gain on Vantiv warrant actions
(9) -
- -
(89) Vantiv TRA-related
transactions -
(280) -
- (49)
Gain from the sale of a non-branch facility - (11)
- -
- Branch / land
impairment charge -
28 -
- -
Valuation of 2009 Visa total return swap (6) 12
50 (1)
10 Transfer of certain nonconforming
investments under Volcker to held-for-sale -
9 -
- -
Vantiv warrant valuation - 2 (19)
(47) (21)
Gain on sale of certain branches - -
(11) (8)
- Gain on sale of the
non-strategic agented bankcard loan portfolio -
- (11)
- -
Gain from sales of troubled debt restructurings - -
- -
- Impairment
associated with aircraft leases -
- -
- -
Securities (gains) / losses 3 (4)
(6) (3)
(1) Adjusted noninterest income
(h) $608
$596 $602 $578 $623 Mortgage banking net revenue 65 66
75 78
74 Adjusted noninterest income, excluding
mortgage banking net revenue $543
$530 $527 $500 $549 Noninterest expense excluding certain items Noninterest expense (U.S. GAAP) (i) $960 $973 $983 $986 $963 Contribution for Fifth Third Foundation (5) (3)
- -
(10) Severance expense
(4) (4)
(3) (15)
(2) Retirement eligibility
changes -
- (9)
- -
Executive retirements - -
- -
- Adjusted noninterest
expense (j) $951
$966 $971 $971 $951 Average interest-earning assets (k) $126,548 $126,092 $126,847 $125,651 $125,843 Net interest margin (d) / (k) 2.86% 2.88% 2.88% 2.91% 2.85% Adjusted net interest margin (f) / (k) 2.91% 2.88% 2.88% 2.91% 2.85% Efficiency ratio (i) / [(c) + (g)] 62.8% 55.5% 65.3% 63.8% 48.0% Adjusted efficiency ratio (j) / [(e) + (h)] 62.0% 64.0% 64.3% 65.3% 62.2% PPNR (FTE) (c) + (g) - (i) $569 $780 $524 $560 $1,045 Adjusted PPNR (e) + (h) - (j) $582 $543 $539 $516 $576 For the Three Months Ended |