Attached files
| file | filename |
|---|---|
| 8-K - FORM 8-K - Summit Hotel Properties, Inc. | v461174_8k.htm |
Exhibit 99.1

Investor Presentation March 2017 • NYSE: INN
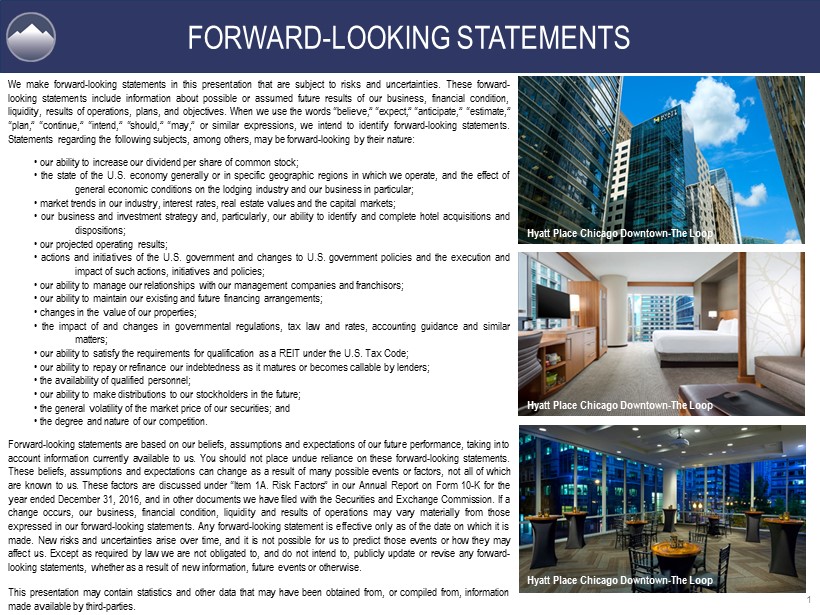
FORWARD - LOOKING STATEMENTS We make forward - looking statements in this presentation that are subject to risks and uncertainties . These forward - looking statements include information about possible or assumed future results of our business, financial condition, liquidity, results of operations, plans, and objectives . When we use the words “believe,” “expect,” “anticipate,” “estimate,” “plan,” “continue,” “intend,” “should,” “may,” or similar expressions, we intend to identify forward - looking statements . Statements regarding the following subjects, among others, may be forward - looking by their nature : • our ability to increase our dividend per share of common stock ; • the state of the U . S . economy generally or in specific geographic regions in which we operate, and the effect of general economic conditions on the lodging industry and our business in particular ; • market trends in our industry, interest rates, real estate values and the capital markets ; • our business and investment strategy and, particularly, our ability to identify and complete hotel acquisitions and dispositions ; • our projected operating results ; • actions and initiatives of the U . S . government and changes to U . S . government policies and the execution and impact of such actions, initiatives and policies ; • our ability to manage our relationships with our management companies and franchisors ; • our ability to maintain our existing and future financing arrangements ; • changes in the value of our properties ; • the impact of and changes in governmental regulations, tax law and rates, accounting guidance and similar matters ; • our ability to satisfy the requirements for qualification as a REIT under the U . S . Tax Code ; • our ability to repay or refinance our indebtedness as it matures or becomes callable by lenders ; • the availability of qualified personnel ; • our ability to make distributions to our stockholders in the future ; • the general volatility of the market price of our securities ; and • the degree and nature of our competition . Forward - looking statements are based on our beliefs, assumptions and expectations of our future performance, taking into account information currently available to us . You should not place undue reliance on these forward - looking statements . These beliefs, assumptions and expectations can change as a result of many possible events or factors, not all of which are known to us . These factors are discussed under “Item 1 A . Risk Factors” in our Annual Report on Form 10 - K for the year ended December 31 , 2016 , and in other documents we have filed with the Securities and Exchange Commission . If a change occurs, our business, financial condition, liquidity and results of operations may vary materially from those expressed in our forward - looking statements . Any forward - looking statement is effective only as of the date on which it is made . New risks and uncertainties arise over time, and it is not possible for us to predict those events or how they may affect us . Except as required by law we are not obligated to, and do not intend to, publicly update or revise any forward - looking statements, whether as a result of new information, future events or otherwise . This presentation may contain statistics and other data that may have been obtained from, or compiled from, information made available by third - parties . Hyatt Place Chicago Downtown - The Loop 1 Hyatt Place Chicago Downtown - The Loop Hyatt Place Chicago Downtown - The Loop

Summit Hotel Properties, Inc. is a publicly - traded real estate investment trust focused on owning premium - branded hotels with efficient operating models primarily in the Upscale segment of the lodging industry. Our Company 81 hotels 10,964 premium guestrooms 23 states 87% of our portfolio is positioned in the top 50 MSAs (2) 3.5 year average effective age (3) Portfolio Overview (1) Pro forma RevPAR grew to $113 in 2016, a CAGR of 11.1% over the last three years. (4) Pro forma hotel EBITDA per key grew to $16,800 in 2016, a CAGR of 17.3% over the last three years. (4) Adjusted FFO per diluted share grew to $1.41 in 2016, a CAGR of 20.3% over the last three years. (5) Key Financial Metrics COMPANY OVERVIEW (1) As of January 1, 2017. (2) Based on the pro forma hotel EBITDA as of December 31 , 2016. (3) Based on most recent renovation date weighted by guestroom count as of March 1, 2017. (4) Pro forma financial data as of December 31, 2013, and December 31, 2016, for the hotels owned as of those dates. (5) Based on Adjusted FFO per diluted share as of December 31, 2013, and December 31, 2016. Courtyard New Orleans Downtown Near the French Quarter Hyatt Place Portland Airport/Cascade Station 2 Hampton Inn Boston/Norwood

DIFFERENTIATED INVESTMENT STRATEGY 3 INDUSTRY LEADING BRAND PARTNERS FOCUSED AND EFFICIENT OPERATING MODEL UNCONFLICTED AND BEST - IN - CLASS OPERATORS BROAD GEOGRAPHIC EBITDA DIVERSIFICATION TARGETED CAPITAL RECYCLING AND REINVESTMENT

Executive Lodging Experience Operations Experience REIT Experience Background Daniel P. Hansen Chairman, President & Chief Executive Officer 13 years 11 years 6 years Prior to joining Summit, Mr . Hansen spent 11 years with Merrill Lynch in various leadership positions . Mr . Hansen was previously the President and Chief Financial Officer of the Company’s predecessor, Summit Hotel Properties, LLC, after serving as Chief Development Officer . Mr . Hansen holds a B . A . in Economics from South Dakota State University and serves on boards and advisory councils for the lodging industry and hotel brands . Craig J. Aniszewski Executive Vice President & Chief Operating Officer 33 years 33 years 6 years Prior to joining Summit, Mr . Aniszewski spent 13 years with Marriott International, Inc . (NYSE : MAR) , holding sales and operations positions in both select - service and full - service convention and resort hotels . Mr . Aniszewski joined The Summit Group in January of 1997 . Mr . Aniszewski then served as Executive Vice President and Chief Operating Officer overseeing the 1 , 800 employee management company and was responsible for all facets of owning and operating US hotels in 19 states . Greg A. Dowell Executive Vice President & Chief Financial Officer 2 years 18 years 13 years Prior to joining Summit, Mr . Dowell held the position of Senior Executive Vice President and Chief Operating Officer at American Campus Communities (NYSE : ACC) . During his 13 - year tenure, Mr . Dowell managed all aspects of operations, facilities management, human resources, information technology and various aspects of accounting and systems development . He played a key role in the development of ACC’s specialized operating platform which facilitated American Campus Communities becoming the first student housing REIT to be publicly traded in 2004 . Prior to joining ACC, Mr . Dowell spent ten years in progressive capacities with Century Development . EXPERIENCED LEADERSHIP DRIVING SUCCESS 4

VALUE OF BRAND PARTNERS Premium Standards Exceptional service, ample amenities, and attractive design demonstrate award - winning quality. Global Brands With more than two million rooms globally, our partners enable us to serve both domestic and international travel. Reservation Systems Global booking systems enable guests to easily find and reserve accommodations. Brand Segmentation Our partners operate a diverse portfolio with many offerings across multiple chain scales. Customer Loyalty Each brand maintains strong customer loyalty programs that incentivize recurring visits. We believe that brand recognition and adherence to standards drives guest loyalty which increases occupancy, improves rates, and creates greater value. JD Power and Associates Upscale Segment Guest Satisfaction Rankings (1) Brands Guests Trust Brand Ranking # of Hotels 16 12 1 (1) JD Power and Associates 2016 North America Guest Satisfaction Rankings. (2) Based on total number of hotels as of December 31 , 2016. #1 #2 #3 #4 #5 Over 50% of our portfolio is concentrated in brands that rank in the top five for guest satisfaction. (2) 5 9 6

$71 $102 $55 $80 $105 2000 2016 + 43 % STR Upscale RevPAR (1) STR Upper - Upscale RevPAR (1) $101 $133 $55 $105 $155 2000 2016 + 32 % (1) Smith Travel Research Quarterly/Monthly Hotel Review as of those dates. UPSCALE OUTPERFORMANCE We believe the outperformance of the Upscale segment is a direct result of an enhanced guest experience through continuous product evolution. Despite new supply, we expect a continuing shift in guest preference to Upscale hotels. 6 Courtyard Atlanta Downtown Hyatt Place Chicago Downtown - The Loop DoubleTree by Hilton San Francisco

9.7% 5.7% 10.9% 7.3% 3.8% 6.7% 5.3% 8.4% 5.6% 2.1% 0.0% 2.0% 4.0% 6.0% 8.0% 10.0% 12.0% 2012 2013 2014 2015 2016 Summit Pro Forma STR Upscale Summit Pro Forma Average STR Upscale Average TRACK RECORD OF OUTPERFORMANCE RevPAR Performance: Summit Pro Forma Portfolio vs. STR Upscale (1) Summit’s pro forma portfolio RevPAR growth has exceeded the STR Upscale RevPAR growth benchmark every year for the past five years. Over this five - year span, Summit’s average margin of RevPAR growth outperformance has been 186 basis points. 7 (1) Smith Travel Research Lodging Review. 186 bps Denotes Summit Pro Forma exceeding STR Upscale

8 TOP TIER HOTEL EBITDA MARGIN 41.2% 37.6% 37.6% 35.9% 35.7% 34.5% 33.8% 33.1% 32.2% 32.1% 31.1% 30.6% 30.2% 30.2% 29.5% 27.6% 0% 10% 20% 30% 40% 50% CLDT INN APLE HT RLJ PEB LHO CHSP XHR AHT DRH RHP SHO AHP FCH HST Select-Service Full-Service Our strategy of investing in high - quality hotels with efficient operating models and lower cost structures continues to drive top tier hotel EBITDA margins relative to the overall industry. FYE 2016 Hotel EBITDA Margin (1) (1) Includes data reported as of December 31, 2016, from each company’s Form 10 - K. “Hotel EBITDA” is defined as total hotel revenu es less hotel operating expenses, which include real estate taxes, insurance, and other expenses as applicable. Excludes Park Hotels & Resorts (“PK”).

24% 34% 29% 13% 0% 20% 40% 60% 80% 100% 1 Top 10 Top 25 Top 50 Other 43% 26% 22% 9% DIVERSE PORTFOLIO (1) As of December 31, 2016. (2) Based on pro forma hotel EBITDA for the twelve months ended December 31, 2016. Our portfolio consists of 81 premium - branded hotels, primarily in the Upscale segment of the lodging industry, located in top markets which exhibit multiple demand drivers and barriers to entry. By Franchisor By MSA Tier Other Hotel EBITDA Diversification 87% of our portfolio is positioned in the top 50 MSAs (2) (2) 9

Atlanta, GA 8.1% New Orleans, LA 7.9% San Francisco, CA 7.7% Minneapolis, MN 7.3% Nashville, TN 6.8% Chicago, IL 4.5% Phoenix, AZ 4.4% Dallas, TX 4.4% Denver, CO 4.2% Indianapolis, IN 3.7% Portland, OR 3.5% Austin, TX 3.0% Louisville, KY 2.8% Boulder, CO 2.6% New York, NY 2.5% Orlando, FL 2.4% 18 Others 24.2% (1) Pro forma hotel EBITDA for the twelve months ended December 31, 2016. DIVERSIFIED EBITDA CONTRIBUTION No single market makes up more than 10% of our portfolio EBITDA and no single hotel makes up more than 5% of our portfolio EBITDA. EBITDA Diversification by MSA (1) 10
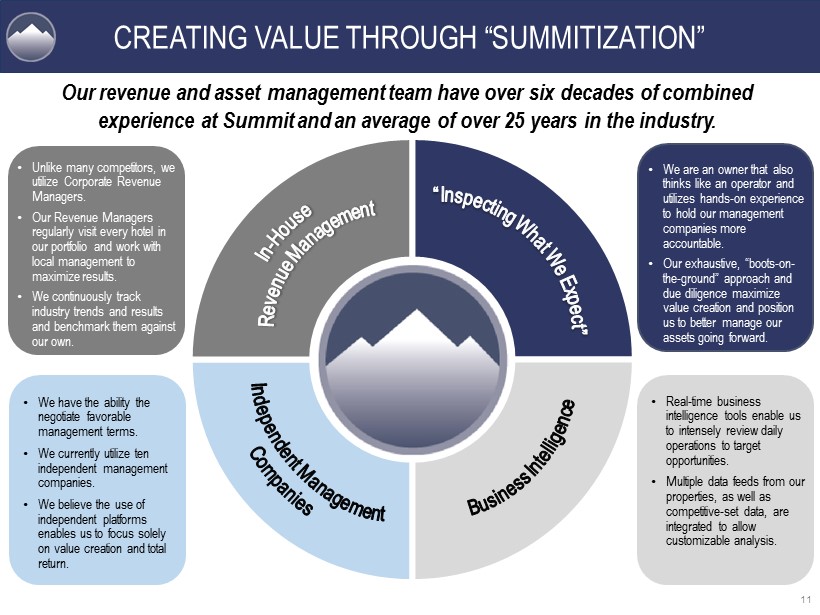
Our revenue and asset management team have over six decades of combined experience at Summit and an average of over 25 years in the industry. CREATING VALUE THROUGH “SUMMITIZATION” • Unlike many competitors, we utilize Corporate Revenue Managers. • Our Revenue Managers regularly visit every hotel in our portfolio and work with local management to maximize results. • We continuously track industry trends and results and benchmark them against our own. • We are an owner that also thinks like an operator and utilizes hands - on experience to hold our management companies more accountable. • Our exhaustive, “boots - on - the - ground” approach and due diligence maximize value creation and position us to better manage our assets going forward. • Real - time business intelligence tools enable us to intensely review daily operations to target opportunities. • Multiple data feeds from our properties, as well as competitive - set data, are integrated to allow customizable analysis. • We have the ability the negotiate favorable management terms. • We currently utilize ten independent management companies. • We believe the use of independent platforms enables us to focus solely on value creation and total return. 11

ART OF UNLOCKING VALUE Capital Recycling Execution of dispositions and acquisitions that continue to improve our overall portfolio quality and growth potential. Strategic Renovation Revitalizations that modernize the property resulting in improved guest experience and satisfaction. Brand Conversion Conversion of existing hotels to stronger brands to provide higher quality guest experiences and greater value. Capturing Value Continuous evaluation of assets and market trends to identify possible opportunities to capitalize on changing guest preferences. Courtyard New Orleans Downtown/Convention Center Holiday Inn Express & Suites San Francisco/Fisherman’s Wharf Hyatt Place – Chicago, IL 12 Courtyard Atlanta/Decatur Downtown/Emory

(1) Amount in thousands. (2) Represents a post - renovation capitalization rate including a 4.0% reserve for the year ended December 31, 2015. (3) Represents a post - renovation capitalization rate including a 4.0% reserve for the year ended December 31, 2016. (4) Represents a weighted average 2016 RevPAR growth based on room revenue contribution. We recycled capital from six dispositions to acquire two high - quality hotels in a match - funded transaction that we believe will deliver greater long - term value to shareholders. CAPITAL RECYCLING Dispositions Acquisitions Transaction Date February 2016 January 2016 Number of Hotels 6 hotels 2 hotels Number of Guestrooms 707 rooms 386 rooms RevPAR $ 94 $ 128 Transaction Amount (1) $ 108,300 $ 109,000 NTM Renovation Est. (1) $ 5,784 $ 0 Capitalization Rate (2) 7.5 % 7.7 % Residence Inn Atlanta Midtown 13 Prior Owner Summit Year 1 Growth RevPAR $ 128 $ 142 10.6 % Total Revenues (1) $ 20,289 $ 22,533 11.1 % Hotel EBITDA % 45.1 % 47.7 % +257 bps NOI (1) $ 8,347 $ 9,850 18.0 % NOI Yield 7.7 % (2) 9.0 % (3) +138 bps Courtyard Nashville Vanderbilt RevPAR Growth Nashville, TN Atlanta, GA Total (4) INN Acquisitions 11.9 % 8.3 % 10.6 % Overall Market 8.0 % 6.0 % 7.3 % Summit outperforms by 330 bps

We reconfigured public space and guestrooms to meet the higher expectations of today’s guests. $74.20 $81.13 $79.67 $95.70 $102.95 $109.59 25% 28% 31% 34% 37% 40% $60 $70 $80 $90 $100 $110 2011 2012 2013 2014 2015 2016 Hotel EBITDA Margin RevPAR RevPAR Hotel EBITDA Margin Hyatt Place Orlando, Florida (Universal Studios & Convention Center) STRATEGIC RENOVATIONS (1) Operating results from the prior owner are presented for 2011 and 2012; the Company’s results are presented for 2013 through 2016. Renovation Since the renovation in 2013, RevPAR has increased 38% compared to the Orlando MSA RevPAR increase of only 22% 38% RevPAR growth 691 bps margin growth Upside From Renovation (1) Hyatt Place Orlando/Convention Center Hyatt Place Orlando/Universal 14 Hyatt Place Orlando/Convention Center Hyatt Place Orlando/Universal

(1) SNL Financial is based on the 2017E FactSet consensus EBITDA and Summit’s total enterprise value as of December 31, 2016. (2) Represents 2017E forecasted performance. CAPTURING EMBEDDED VALUE We converted six two - bedroom suites into six one - bedroom suites and six standalone queen guestrooms. A seventh guestroom was added by converting an existing fitness center while at the same time repurposing a vacant outbuilding into a newly renovated fitness center. Before – 1 Two - Bedroom Suite – Hyatt House Miami After – 1 Studio and 1 Standard Room – Hyatt House Miami Implied Value Creation Miami Hyatt House H otel EBITDA per Key (2) $21,200 Implied INN 2017E EBITDA Multiple (1) 13.8x Implied Value per Key $291,800 Guestrooms Added 7 rooms Implied V alue Creation $2,042,600 15 Return on Investment Miami Hyatt House Hotel EBITDA per Key (2) $21,200 Renovation Cost per Key $99,600 Implied Cash - on - Cash Return 21.3%
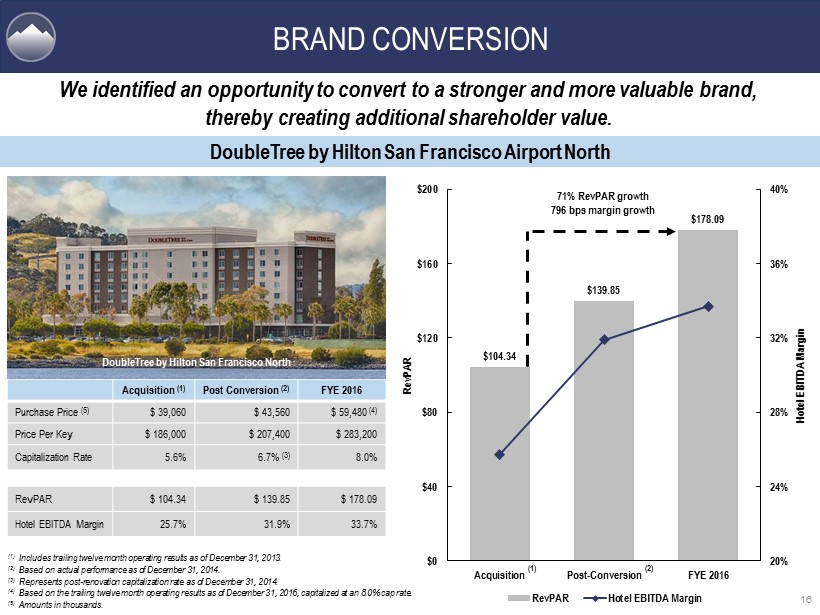
DoubleTree by Hilton San Francisco Airport North (1) Includes trailing twelve month operating results as of December 31, 2013. (2) Based on actual performance as of December 31, 2014. (3) Represents post - renovation capitalization rate as of December 31, 2014. (4) Based on the trailing twelve month operating results as of December 31, 2016, capitalized at an 8.0% cap rate. (5) Amounts in thousands. BRAND CONVERSION Acquisition (1) Post Conversion (2) FYE 2016 Purchase Price (5) $ 39,060 $ 43,560 $ 59,480 (4) Price Per Key $ 186,000 $ 207,400 $ 283,200 Capitalization Rate 5.6% 6.7% (3) 8.0% RevPAR $ 104.34 $ 139.85 $ 178.09 Hotel EBITDA Margin 25.7% 31.9% 33.7% We identified an opportunity to convert to a stronger and more valuable brand, thereby creating additional shareholder value. DoubleTree by Hilton San Francisco North 16 $104.34 $139.85 $178.09 20% 24% 28% 32% 36% 40% $0 $40 $80 $120 $160 $200 Acquisition Post-Conversion FYE 2016 Hotel EBITDA Margin RevPAR RevPAR Hotel EBITDA Margin 71% RevPAR growth 796 bps margin growth (1) (2)

EXCEPTIONAL EXECUTION OF STRATEGY Our relentless attention to detail and aggressive approach towards proactive management enable us to deliver significant value to shareholders. $0.81 $0.97 $1.25 $1.41 $0.50 $0.75 $1.00 $1.25 $1.50 2013 2014 2015 2016 Adjusted FFO per Diluted Share 17 $10,400 $12,900 $14,600 $16,800 $8,000 $10,500 $13,000 $15,500 $18,000 2013 2014 2015 2016 Hotel EBITDA per Key $1.28 $1.48 $1.76 $1.90 $1.00 $1.25 $1.50 $1.75 $2.00 2013 2014 2015 2016 Adjusted EBITDA per Diluted Share 108.6 108.7 110.2 113.7 100 103 106 109 112 115 2013 2014 2015 2016 STR RevPAR Index

18 $71 $113 $50 $60 $70 $80 $90 $100 $110 $120 Dispositions Pro forma Portfolio RevPAR 98 135 70 85 100 115 130 145 Dispositions Pro forma Portfolio Average Guestrooms per Hotel 32.1% 38.0% 30% 32% 34% 36% 38% 40% Dispositions Pro forma Portfolio Hotel EBITDA Margin $8,600 $16,800 $4,000 $6,000 $8,000 $10,000 $12,000 $14,000 $16,000 $18,000 Dispositions Pro forma Portfolio Hotel EBITDA per Key (1) Disposition data is for the trailing twelve months prior to sale for the 44 hotels sold since IPO in February 2011 as of December 31 , 2016. (2) Pro forma information includes trailing twelve - month operating results as of December 31, 2016, for hotels owned as of December 31 , 2016, as if each hotel had been owned by the Company since January 1, 2016. As a result, these pro forma operating measures may include operating results for certain hotels for period s prior to the Company’s ownership. CONTINUOUS PORTFOLIO TRANSFORMATION We continue to upgrade the quality of our portfolio by acquiring hotels in stronger markets while completing the disposition of less strategic hotels. +59% (1) +593 bps (1) (2) +95% +38% (2) (1) (1) (2) (2)

$7 $8 $119 $48 $11 $126 $150 $140 $35 $0 $50 $100 $150 $200 2017 2018 2019 2020 2021 2022 2023+ Unsecured Revolving Credit Facility Unsecured Term Loan (7YR) Unsecured Term Loan (5YR) Secured Non-Recourse Loans Secured Recourse Loans 100% 90% 58% 48% 42% 25% 25% 21% 18% 13% 6% 6% 2% 0% 0% 0% 0% 20% 40% 60% 80% 100% CONSERVATIVE CAPITAL STRUCTURE Summit’s Credit Statistics and Debt Overview Total Debt (1) $641.2 million Total Debt / Total Enterprise Value 27.4% Net Debt / 2017E EBITDA (2) 3.5x Weighted Average Term Debt Maturity (5) 4.3 years Weighted Average Interest Rate (5) 3.72% Interest Coverage Ratio (3) 7.2x 2017E FFO Payout Ratio (4) 47% (1) Debt balances as of February 15, 2017. (2) Calculated using 2017E FactSet consensus EBITDA of $171.5 million as of March 1, 2017. (3) The interest coverage ratio is calculated by dividing 2017E FactSet consensus EBITDA by total debt multiplied by the weighted a verage interest rate. (4) 2017E based on $1.41 FactSet Mean FFO per share estimate, and assumes an annual common dividend of $0.65 per share. (5) SNL Financial data and company filings as of December 31, 2016. INN data as of February 15, 2017. Excludes PK. Debt Maturing Through 2018 (% of Total Debt) (5) *in millions Debt Maturity Schedule (1) 19

Dividend Payout Ratio (2) (1) SNL data based on closing price on February 15, 2017. (2) SNL data based on 2017E FactSet Mean FFO per Share estimates. (3) SHO 2016 annual dividend based on the full - year dividend of $0.68 per share, which includes the special dividend. WELL - COVERED DIVIDEND Price per Key Valuation 3 Current Dividend Yield (1) 20 6.4% 6.2% 6.2% 6.2% 6.0% 5.9% 5.8% 5.6% 5.2% 5.1% 4.6% 4.4% 4.4% 4.3% 4.0% 3.5% 3.2% 0% 2% 4% 6% 8% CLDT CHSP PK AHT XHR APLE LHO RLJ HT PEB RHP SHO DRH HST INN AHP FCH 72% 66% 66% 61% 60% 60% 57% 54% 54% 53% 52% 48% 48% 47% 32% 27% 25% 0% 20% 40% 60% 80% CHSP APLE LHO PK CLDT PEB SHO XHR RLJ RHP DRH HST HT INN AHT FCH AHP (3) (3) Our portfolio of high - quality hotels continues to generate strong free cash flow, which has afforded us the opportunity to increase our dividend by 44% over the last three years while still maintaining a conservative payout ratio.

101.9% 75.8% 36.6% 28.7% 19.7% 17.4% 16.5% 16.3% 13.1% 10.4% 10.2% 8.3% 4.3% - 19.5% 26.6% -20% 15% 50% 85% 120% INN RHP SHO AHT CHSP CLDT LHO RLJ DRH HST HT PEB FCH AHP Total Shareholder Return SNL U.S. REIT Hotel Index 21 SUPERIOR TOTAL SHAREHOLDER RETURN Total Shareholder Return by Year (2) 3 - Year Total Shareholder Return (1) (1) SNL Total Shareholder Return for the three years ending December 31, 2016. APLE, XHR, and PK are not included at this time. (2) SNL Total Shareholder Return for the year ended December 31, 2014, 2015, and 2016, respectively. 40.2% 23.9% 20% 30% 40% 50% Total Return FYE 2016 - 0.4% - 22.6% -25% -15% -5% 5% Total Shareholder Return FYE 2015 INN SNL U.S. REIT Hotel Index 44.6% 32.0% 20% 30% 40% 50% Total Return FYE 2014 We have delivered an industry - leading total shareholder return of 101.9% over the past three years through consistent execution, thoughtful capital allocation, and a prudent capital structure. +12.6% +22.2% +16.3%

PORTFOLIO DISPOSITION – RECENT NEWS TRANSACTION HIGHLIGHTS Seller: Summit Hotel OP, LP (and affiliates) Buyer: American Realty Capital Hospitality Trust, Inc. Hotels: 26 Guestrooms: 2,793 Sales Price: $347.4 million Sales Price per Key: $124,400 Estimated Capital Improvements: $20.4 million • On June 2 , 2015 , Summit entered into purchase and sale agreements to sell 26 hotels for a total price of $ 351 . 4 million and subsequently modified the purchase and sale agreements resulting in a total sales price of $ 347 . 4 million . • On October 15 , 2015 , Summit completed the sale of tranche one to affiliates of American Realty Capital Hospitality Trust, Inc . (“ARCH”), which included 10 hotels containing 1 , 090 guestrooms, for a combined price of $ 150 . 1 million . • On December 29 , 2015 , the purchase and sale agreement related to tranche two was terminated . As a result of the termination, ARCH forfeited, and Summit retained, $ 9 . 1 million in earnest money . • On February 11 , 2016 , Summit completed the sale of tranche three to affiliates of ARCH, which included six hotels containing 707 guestrooms, for a combined price of $ 108 . 3 million . As part of the transaction, Summit also provided $ 27 . 5 million in seller financing to ARCH and entered into a reinstated, non - exclusive purchase and sale agreement for tranche two, with ARCH depositing $ 7 . 5 million in non - refundable earnest money . • In June 2016 , the Aloft Jacksonville and Holiday Inn Express Vernon Hills were sold to buyers unaffiliated with ARCH for a combined price of $ 14 . 5 million . • In January 2017 , Summit granted ARCH an extension until April 2017 . As consideration for the extension, ARCH entered into a $ 3 . 0 million loan to allow them time to close on their $ 400 million convertible preferred investment commitment from an affiliate of Brookfield Asset Management . • Since the portfolio disposition was announced in June 2015 , Summit has redeployed all $ 297 . 3 million of disposition proceeds into high - growth hotels located in attractive markets . 22
NYSE: INN 23