Attached files
| file | filename |
|---|---|
| 8-K - FORM 8-K - PUBLIC SERVICE ENTERPRISE GROUP INC | d356165d8k.htm |
 We have the energy to make things better … for you, for our investors and for our stakeholders. EXHIBIT 99 We have the energy to make things better … for you, for our investors and for our stakeholders. |
 2 Forward-Looking Statements Certain of the matters discussed in this presentation about our and our subsidiaries’ future performance, including,
without limitation, future revenues, earnings, strategies, prospects, consequences and all other statements that are not purely historical constitute “forward-looking statements”
within the meaning of the Private Securities Litigation Reform Act of 1995. Such forward-looking statements are subject to risks and uncertainties, which could cause actual results to differ
materially from those anticipated. Such statements are based on management’s beliefs as well as assumptions made by and information currently available to management. When used herein, the words
“anticipate,” “intend,” “estimate,” “believe,” “expect,” “plan,” “should,” “hypothetical,” “potential,” “forecast,” “project,” variations of such words and
similar expressions are intended to identify forward-looking statements. Factors that may cause actual results to differ are often presented with the forward-looking statements themselves. Other factors that could cause actual results to
differ materially from those contemplated in any forward-looking statements made by us herein are discussed in filings we make with the United States Securities and Exchange Commission (SEC) including our Annual Report on Form 10-K and subsequent reports on Form 10-Q and Form 8-K and available on our website: http://www.pseg.com. These factors include, but are not limited
to: •
fluctuations in wholesale power and natural gas markets,
including the potential impacts on the economic viability of our generation units; • our ability to obtain adequate fuel supply;
• any inability to manage our
energy obligations with available supply;
• increases in competition in
wholesale energy and capacity markets;
• changes in technology related to
energy generation, distribution and consumption and customer usage patterns; • economic downturns; • third party credit risk relating to our sale of generation output and purchase of
fuel; • adverse
performance of our decommissioning and defined benefit plan trust fund investments and changes in funding requirements; • changes in state and federal legislation and regulations;
• the impact of pending rate case
proceedings; •
regulatory, financial, environmental, health and safety risks associated with our ownership and operation of nuclear facilities; • adverse changes in energy industry laws, policies and regulations, including market
structures and transmission planning;
• changes in federal and state
environmental regulations and enforcement;
• delays in receipt of, or an
inability to receive, necessary licenses and permits;
• adverse outcomes of any legal,
regulatory or other proceeding, settlement, investigation or claim applicable to us and/or the energy industry; • changes in tax laws and regulations;
• the impact of our holding company
structure on our ability to meet our corporate funding needs, service debt and pay dividends; • lack of growth or slower growth in the number of customers or changes in customer
demand; • any
inability of Power to meet its commitments under forward sale obligations; • reliance on transmission facilities that we do not own or control and the impact on our
ability to maintain adequate transmission capacity;
• any inability to successfully
develop or construct generation, transmission and distribution projects; • any equipment failures, accidents, severe weather events or other incidents that impact our
ability to provide safe and reliable service to our customers;
• our inability to exercise control over the operations of generation facilities in which we do not maintain a controlling interest; • any inability to maintain sufficient liquidity;
• any inability to realize
anticipated tax benefits or retain tax credits;
• challenges associated with
recruitment and/or retention of key executives and a qualified workforce; • the impact of our covenants in our debt instruments on our operations; and
• the impact of acts of terrorism,
cybersecurity attacks or intrusions. All of the
forward-looking statements made in this presentation are qualified by these cautionary statements and we cannot assure you that the results or developments anticipated by management
will be realized or even if realized, will have the expected
consequences to, or effects on, us or our business, prospects, financial condition, results of operations or cash flows. Readers are cautioned not to place undue reliance on these forward-looking statements in making any investment decision.
Forward-looking statements made in this presentation apply only as of the date of this presentation. While we may elect to update forward-looking statements from time to time, we specifically disclaim
any obligation to do so, even in light of new information or future events, unless otherwise required by applicable securities laws.
The forward-looking statements contained in this
presentation are intended to qualify for the safe harbor provisions of Section 27A of the Securities Act of 1933, as amended, and Section 21E of the Securities Exchange Act of 1934, as amended. |
 3 GAAP Disclaimer PSEG presents Operating Earnings and Adjusted Earnings Before Interest, Taxes, Depreciation and Amortization (EBITDA) in
addition to its Net Income reported in accordance
with accounting principles generally accepted in the United States (GAAP). Operating Earnings and Adjusted EBITDA are non-GAAP financial measures that differ from Net Income. Non-GAAP
Operating Earnings exclude the impact of returns
(losses) associated with the Nuclear Decommissioning Trust (NDT), Mark-to-Market (MTM) accounting and material one-time items. Non-GAAP Adjusted EBITDA excludes the same items as our non-GAAP
Operating Earnings measure as well as income tax
expense, interest expense and depreciation and amortization. The last two slides in this presentation (Slides A and B) include a list of items excluded from Net Income to reconcile to non-GAAP Operating
Earnings and non-GAAP Adjusted EBITDA with a
reference to those slides included on each of the slides where the non-GAAP information appears. Management uses non-GAAP Operating Earnings in its internal analysis, and in communications with investors and
analysts, as a consistent measure for comparing
PSEG’s financial performance to previous financial results. Management believes non-GAAP Adjusted EBITDA is useful to investors and other users of our financial statements in evaluating operating performance
because it provides them with an additional tool
to compare business performance across companies and across periods. Management also believes that non-GAAP Adjusted EBITDA is widely used by investors to measure operating performance without regard to
items such as income tax expense, interest expense
and depreciation and amortization, which can vary substantially from company to company depending upon, among other things, the book value of assets, capital structure and whether assets were
constructed or acquired. Non-GAAP Adjusted
EBITDA also allows investors and other users to assess the underlying financial performance of our fleet before management’s decision to deploy capital. The presentation of non-GAAP Operating Earnings and
non-GAAP Adjusted
EBITDA is intended to complement, and should not be considered
an alternative to, the presentation of Net Income, which is an indicator of financial performance determined in accordance with GAAP. In addition, non-GAAP Operating Earnings and
non-GAAP Adjusted EBITDA as presented in this
release may not be comparable to similarly titled measures used by other companies. Due to the forward looking nature of non-GAAP Operating Earnings and non-GAAP Adjusted EBITDA guidance, PSEG is
unable to reconcile these non-GAAP financial
measures to the most directly comparable GAAP financial measure. Management is unable to project certain reconciling items, in particular MTM and NDT gains (losses), for future periods due to market
volatility. These materials and other financial
releases can be found on the PSEG website at www.pseg.com , under the Investors tab. From time to time, PSEG, PSE&G and PSEG Power
release important information via postings on their corporate
website at http://investor.pseg.com. Investors and other interested parties are encouraged to visit the corporate website to review new postings. The “email alerts” link at
http://investor.pseg.com may be used to enroll to receive automatic email alerts and/or really
simple syndication (RSS) feeds regarding new postings at http://investor.pseg.com/rss . |
 4 2017 PSEG Conference Agenda Presentation Presenter Welcome and Introductions Kathleen Lally PSEG Ralph Izzo Regulatory & Policy Overview Tamara Linde PSE&G Ralph LaRossa Q&A Session Break PSEG Power William Levis Q&A Session Financial Review & Outlook Dan Cregg Summary and Q&A Conference Conclusion |
 PSEG STRATEGY: GROWING A HIGH-QUALITY, FINANCIALLY SOUND ENERGY INFRASTRUCTURE COMPANY CHAIRMAN, PRESIDENT AND CHIEF EXECUTIVE OFFICER Ralph Izzo |
 6 Operational Excellence: Improving reliability
and customer service as we control costs in
a low price environment
Financial
Strength: Strong
financial position supports investment
program Disciplined Investment:
• Program focused on achieving objectives through infrastructure investment that meets customer and shareholder needs • Robust pipeline of opportunities Results: • Double digit growth in rate base and net income at PSE&G • Reconfiguration of Power’s generating fleet: higher quality, more efficient • Annual growth in common dividend • Strong credit metrics DISCIPLINED INVESTMENT OPERATIONAL EXCELLENCE FINANCIAL STRENGTH ENGAGED WORKFORCE PSEG Strategy - Delivering Value |
 7 Two strong businesses A stable platform, each with growth opportunities Strategy: Investment program enhances competitive position with addition of efficient, clean, reliable CCGT capacity Value Proposition: Provides substantial free cash flow and upside from market rule improvements Assets $12B Net Income $18M Non-GAAP Operating Earnings* $514M Regional Competitive Generation Strategy: Investments aligned with public policy and customer needs Value Proposition: A $12 - $14 billion infrastructure program with opportunities to expand, producing high single digit rate base growth through 2021 Assets $26B Net Income $889M Electric & Gas Delivery and Transmission 2016 2016 ASSETS AND NET INCOME ARE FOR THE YEAR ENDED 12/31/2016. PSE&G AND POWER DO NOT ADD TO TOTAL DUE TO ENTERPRISE /
OTHER ACTIVITY. *SEE SLIDE A FOR A RECONCILIATION
OF NET INCOME TO NON-GAAP OPERATING EARNINGS AND SLIDE B FOR RECONCILIATIONS FOR PSEG POWER AND ENTERPRISE/OTHER. |
 8 Focus on building a reliable, efficient, clean energy infrastructure 2012 2013 2014 2015 2016 • Gas System Modernization Program (GSMP) and Energy Efficiency Extension II approved • New generation build starts Power fleet transformation • Award winning Superstorm Sandy storm response restoring 2.1M customers • Final federal approval for Susquehanna- Roseland transmission project • 400 MW of new peaker capacity * • Expanded Solar investment • 90% nuclear capacity factor for 9 th straight year • Record output from Linden CCGT and Salem 2 nuclear unit • Energy Strong program approved • Advanced Gas Path uprates (through 2018) • PSEG Long Island management contract effective Selected Accomplishments *KEARNY AND NEW HAVEN. ** AS OF FEBRUARY 2017; INCLUDES 70 MW DC OF PV SOLAR GENERATION IN CONSTRUCTION. Cost Control • Solar 4 All Extension Approved • Continued new generation build and transforming fleet to be more efficient, clean, and higher quality • Solar Source grew to 396 MW DC ** |
 9 Delivering on commitments and realizing growth Operational Excellence • PSE&G: 15 consecutive years of recognition as the most reliable utility in the Mid-
Atlantic region
• PSEG Power: Lowest CCGT EFORd in last 5 years, while moving the fleet towards
improved efficiency and environmental position
• PSEG Long Island: Improved customer service and reliability while managing costs
• PSEG: Maintaining focus on efficiency, resiliency,
and customer satisfaction
Financial
Strength
• Non-GAAP Operating Earnings for 2016 at midpoint of original guidance range and upper end of revised guidance range • Cash flows and business mix support strong credit ratings and ability to fully fund
robust investment pipeline without issuing new
equity •
Increased dividend in February 2017 –
13
th
increase in last 14 years
Disciplined
Investment
• PSE&G capital program drives continued rate base growth over the 5-year period
(2017-2021) with increased investment in Gas System
Modernization Program, Electric and Gas
distribution, and Energy Efficiency •
Potential for additional investments in Renewables, Expanded
Energy Efficiency and integration of
Infrastructure with Customer Access •
Power capital program focusing on growth investments including
Keys Energy Center, Sewaren and Bridgeport
Harbor |
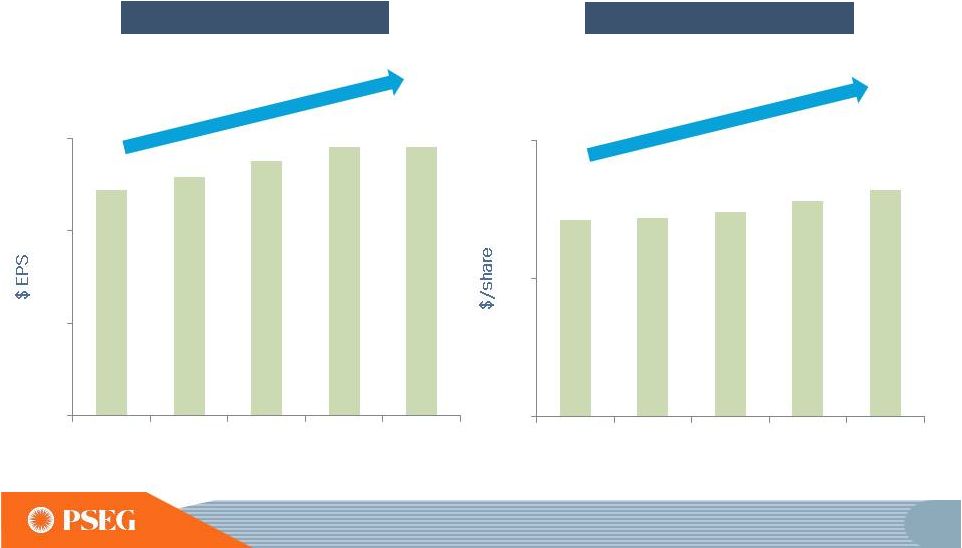
 10 PSEG 5 -- Year Results *SEE SLIDE A FOR ITEMS EXCLUDED FROM NET INCOME TO RECONCILE TO NON-GAAP OPERATING EARNINGS.
GAAP: Contribution to
PSEG Net Income ($
Millions) and Net Income per share ($/Share)
2012
2013 2014 2015 2016
2012
2013 2014 2015 2016
Non-GAAP*: Contribution to
PSEG Operating Earnings ($
Millions) and Operating Earnings per share ($/Share) |
 11 Focus on earning our cost of capital has provided for growth in operating earnings* and dividends Non-GAAP Operating Earnings* 2012-2016 CAGR ~4% *SEE SLIDE A FOR ITEMS EXCLUDED FROM NET INCOME TO RECONCILE TO NON-GAAP OPERATING EARNINGS.
Dividends
2012-2016 CAGR
~4%
$2.44
$2.58
$2.76
$2.91
$2.90
0.0
1.0
2.0
3.0
2012
2013
2014
2015
2016
$1.42
$1.44
$1.48
$1.56
$1.64
0.0
1.0
2.0
2012
2013
2014
2015
2016 |
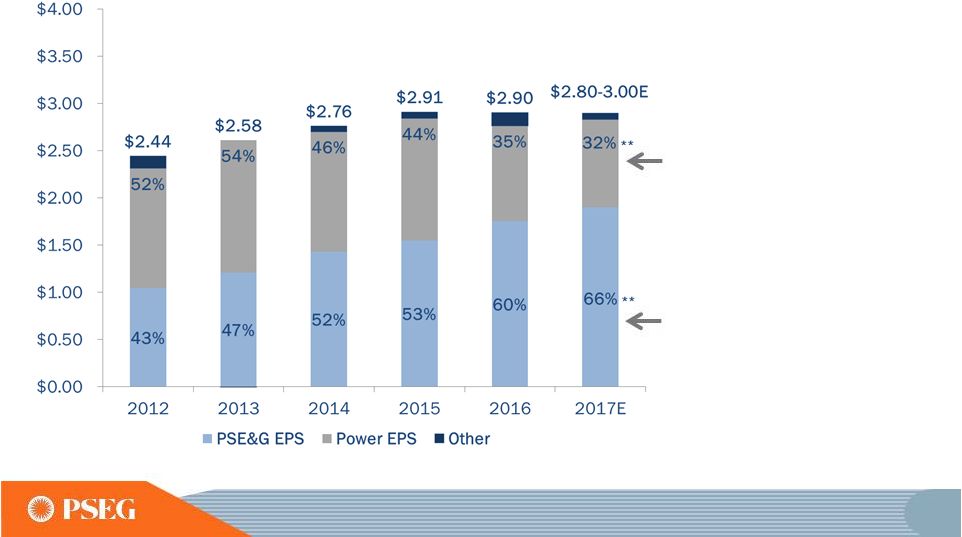 12 Earnings profile with growth at PSE&G has been transformed *SEE SLIDE A FOR ITEMS EXCLUDED FROM NET INCOME TO RECONCILE TO NON-GAAP OPERATING EARNINGS AND SLIDE B FOR A
RECONCILIATION OF NET INCOME TO NON-GAAP
OPERATING EARNINGS FOR PSEG POWER AND ENTERPRISE/OTHER. E=ESTIMATE ** 2017 PERCENTS USE MID-POINT OF 2017 NON-GAAP OPERATING EARNINGS GUIDANCE OF $2.80--$3.00 PER SHARE.
Non-GAAP Operating Earnings*
Contribution by Subsidiary
Power’s
locational
and fuel cost
advantage generate
free cash flow in low
price environment
PSE&G’s
earnings
contribution has
increased with growth
in capital program |
 13 Baseline programs yield 7% compound annual
growth in rate base
E
=
ESTIMATE.
DATA
AS
OF
MARCH
2017.
CAGR
=
COMPOUND
ANNUAL
GROWTH
RATE.
INCLUDES
AFUDC.
2017-2021E PSE&G Capital Spending
$12.3 Billion Baseline Investment
0
500
1,000
1,500
2,000
2,500
3,000
3,500
4,000
2017E
2018E
2019E
2020E
2021E
Transmission
Distribution
Solar
Energy Efficiency
2016 Annual Financial Conf.
|
 14 PSE&G has a track record of identifying
opportunities for capital
investment PSE&G 2017 Forecasted Capital
E = ESTIMATE.
0
500
1,000
1,500
2,000
2,500
3,000
3,500
4,000
2017 in 2013
2017 in 2014
2017 in 2015
2017 in 2016
2017E
Annual Financial Conference Forecast
|
 15 Expansion/Extension of existing baseline programs enhances reliability for our
customers E = ESTIMATE. DATA AS
OF MARCH 2017. CAGR = COMPOUND ANNUAL GROWTH RATE. INCLUDES AFUDC. 2017-2021E PSE&G Capital Spending $13.8 Billion; 9% Rate Base CAGR - ESMP - GSMP Expansion - Energy Efficiency Extension 0 500 1,000 1,500 2,000 2,500 3,000 3,500 4,000 2017E 2018E 2019E 2020E 2021E Transmission Distribution Solar Energy Efficiency Potential growth 2016 Annual Financial Conf. |
 16 PSE&G’s investment program provides for
7%–9% growth in rate base
Year-end Rate Base
with extension / expansion
of current programs
E = ESTIMATE. |
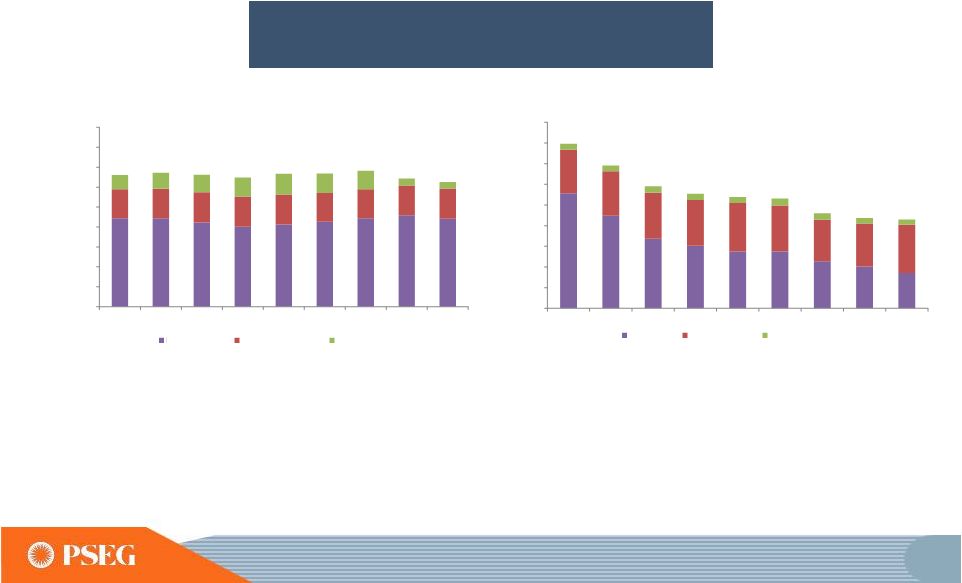 17 Executing on investment program and continuing to manage the total costs to customers • PSE&G customers’ combined electric and gas bills declined 28% over the period
• Low gas prices and elimination of transition charges drove rate decreases
• Continued recent bill reductions include 2017 gas credits and recent BGS auction results
• Tax reform has the potential to reduce rates further PSE&G Typical Residential Customer Bills 2009-2017E* *FOR ALL YEARS THE BILLING ASSUMES 7,200 KWH FOR ELECTRIC AND 1,010 THERMS FOR GAS ANNUALLY. E = ESTIMATE
Gas
Electric
$0 $200 $400 $600 $800 $1,000 $1,200 $1,400 $1,600 $1,800 2009 2010 2011 2012 2013 2014 2015 2016 2017E Electric Supply Electric Distribution Other Charges $0 $200 $400 $600 $800 $1,000 $1,200 $1,400 $1,600 $1,800 2009 2010 2011 2012 2013 2014 2015 2016 2017E Gas Supply Gas Distribution Other Charges |
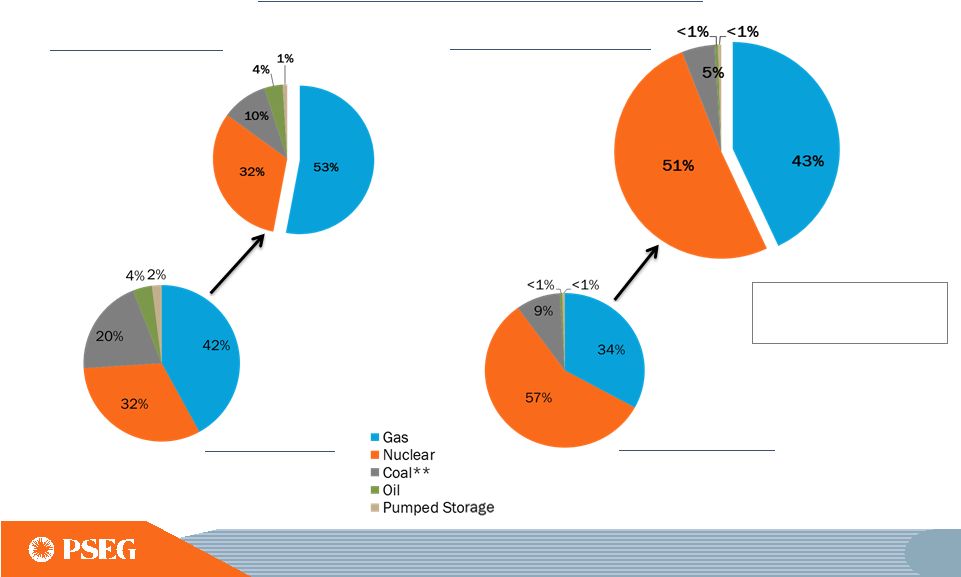
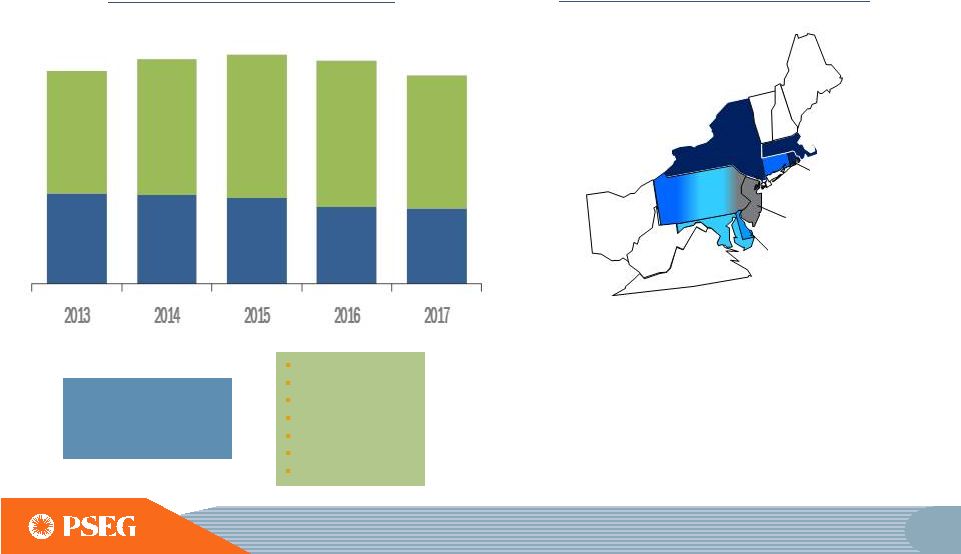
 18 Power’s fleet to be
transformed with new investment
and improvement in efficiency
2021E
Fuel
Diversity
1
Total MW: 11,900
Projected Fleet Comparison 2016 to 2021E
2016 Energy Produced
Total GWh: 51,510
1
REFLECTS ANNOUNCED EARLY RETIREMENT OF HUDSON AND MERCER UNITS
IN MID-2017 ALL
PERIODS
EXCLUDE
SOLAR
(326
MW
DC
/257MW
AC
)
CAPACITY
AND
KALAELOA
(104MW)
CAPACITY
/
ENERGY
PRODUCED
**2016 COAL INCLUDES NEW JERSEY UNITS THAT FUEL SWITCH TO
GAS. E= ESTIMATE.
2021E
Energy
Produced
1
Total GWh: 61,000
2016 Fuel Diversity
Total MW: 11,577
At
conclusion
of
Power’s
construction
program
in
2018,
capital
to
maintain
the
business
declines
to
~$200M
per
year |
 19 Nuclear outlook is increasingly challenged PSEG Nuclear is not currently earning its cost of capital National New Jersey 6 plant closures 2 state interventions Legislation pending in CT PJM Grid 2020 study No sustainable wind resource Lack of open space for solar fields; RPS Standards; Marcellus gas supply New Jersey Impacts Economy/Jobs Emissions Cost to replace Fuel diversity Reliability |
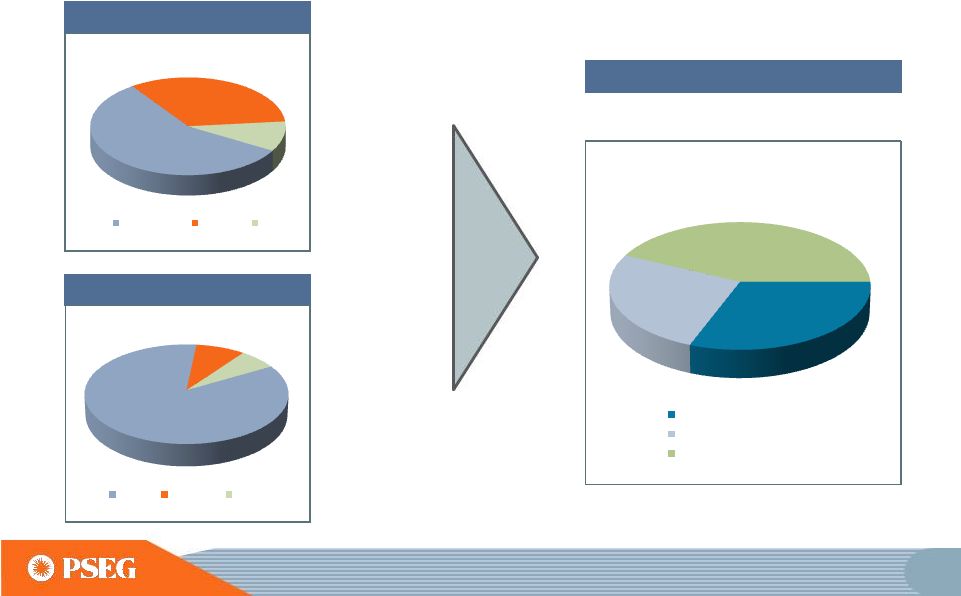
 20 Power 32% PSE&G 66% 2017E Non-GAAP Operating Earnings Guidance Contribution* 2017-2021E Total Capital** ~$13.8B ~$2.6B 9% annual growth in rate base with expansion/extension of existing programs ~18% GWh growth from efficient, low cost capacity *BASED ON THE MIDPOINT OF NON-GAAP OPERATING EARININGS GUIDANCE OF $2.80 TO $3.00 PER SHARE.
**INCLUDES ALL PLANNED AND POTENTIAL SPENDING. E =
ESTIMATE. INCLUDES AFUDC AND IDC.
Investment programs provide opportunity
for growth
Enterprise/
Other
2% |
 Long-term opportunities to invest in the
grid supports performance and enables customer access 2012-2016 Transmission Expansion Storm Hardening Resiliency Efficient Generation 2017-2021 Upgrade of Aging Infrastructure Utility of the Future Integration of Infrastructure with Customer Access Renewables Expanded Energy Efficiency 13% rate base growth 7% - 9% rate base growth Opportunity for a continuation of PSE&G’s rate of growth 21 |
 22 PSEG ranked #1 in financial performance (2016) PA Consulting Mid-Atlantic Region award – for the 15th consecutive year (2016) Utility of the Year (2015) Named to DJSI North America for the 9th consecutive year (2016) Commerce & Industry Association of NJ award recognizing commitment to veterans, PSEG Foundation’s STEM program, and other volunteer programs (2016) Ranked 8th among electric and gas companies in the United States (2017) Equal opportunity employers, ranked # 40 (2015) Linden CCGT for embracing advanced digital monitoring and analytics (2016) America’s Best Employers List (2015) Top 100 military- friendly employers, ranked # 19 (2016) Star of Energy Efficiency Award (2015) Industry Business Employer Partner of the Year Award - PSEGLI (2015) Utility Customer Champion for Second Year (2016) America's 100 Best Corporate Citizens (2016) Our commitment to customers, community, employees, the environment, innovation and operational excellence is widely recognized |
 23 PSEG’s Value Proposition • A stable platform with a robust investment pipeline providing
opportunity for growth
• PSE&G – Delivering on promise for rate base growth through disciplined investment, customer satisfaction and safety • PSEG Power – Efficient, low-cost, clean fleet advantaged by asset diversity, fuel mix and location • Focus on providing strong, sustainable returns of invested capital
through operational excellence, regulatory and legislative
mechanisms
• Strong balance sheet – Financial strength supported by stable credit rating and investment profile supporting the potential for
consistent and sustainable dividend growth
|
 PSEG REGULATORY & POLICY REVIEW EXECUTIVE VICE PRESIDENT AND GENERAL COUNSEL Tamara Linde |
 25 Regulatory & Policy Review - Agenda • PSE&G Investment Program Recap • PSE&G 2017 Base Rate Case Filing • Regulatory Reform in NJ • Preserving Nuclear Generation • Federal Regulatory Framework • Summary |
 26 PSE&G has received approval for 15 multi-year investment programs that advance state energy goals 2008/ 2009 2011 2013 2015 2016 • Energy Strong • Capital Infrastructure I • Energy Efficiency • Solar Loan I • Carbon Abatement • Solar Loan II • Solar 4 All • Demand Response • Energy Efficiency Extension • Capital Infrastructure II • Solar Loan III • Solar 4 All Extension Selected Accomplishments • Solar 4 All Extension II 2014 • Energy Efficiency Extension II • Gas System Modernization Infrastructure investment programs with near contemporaneous recovery mechanisms |
 27 PSE&G plans to file Distribution Base Rate Case proceeding no later than November 1, 2017 Support • Requirement of 2014 Energy Strong settlement • Update for known changes in sales growth forecast, O&M and taxes since 2010 rate case • Get recovery of distribution investment not covered by clause mechanisms • Get recovery of approved storm costs Opportunity • Establish/update rate design, capital structure and depreciation • Pursue decoupling • Pursue interim rates • Improve alignment with customer • New E&G rates effective at start of 2019, or earlier Supports need for moderate base rate increase |
 28 Months 1 2 3 4 5 6 7 8 9 10 11 12 13 14 15 16 17 Rate Case Filing is Made Discovery Commences Settlement Conferences Rate Counsel Intervenor Testimony Evidentiary Hearing Initial Brief – One month after Hearing Reply Brief – 20 days after Initial Brief Initial decision – 45 days after reply brief Exceptions – 13 days after initial decision Replies to Exceptions – 5 days later Board Order 45 days after initial decision NJ Distribution Base Rate Case Timeline Company Rebuttal and Company Updates For Latest Test Year Results |
 29 New Jersey – Long-term Infrastructure Regulatory Reform with Customer Focus Support • Alignment with community and customer needs • NJ Energy Master Plan • Support extension of investment program horizon from 3 to 7 years using review process established by the BPU in Energy Strong and Gas System Modernization Program as template Opportunity • PSE&G will be seeking approval of multi-year programs that extend existing efforts to improve our system resiliency and broaden investment focus on Energy Efficiency and Utility of the Future services at the lowest cost to our customers |
 30 Preserving Existing Nuclear Power Plants as Part of a Resilient Energy System Support • Generation from Power’s nuclear units produces ~40% of NJ supply and provides 97% of NJ’s carbon free energy • Preservation of nuclear energy consistent with NJ policy goal: 70% clean resources by 2050 • Competitive wholesale markets not designed to value fuel diversity, resiliency and desirable attributes of nuclear generation Opportunity • Preserve highly reliable, clean resources as part of a diverse energy portfolio • Preserve local jobs and economic base • Keep prices lower than they otherwise would be, as current replacement options are more expensive • Maintain system reliability |
 31 What are other states doing to preserve at-risk nuclear generation? Future Energy Jobs Bill enacted establishing a Zero Emission Credit (ZEC) portfolio standard. ZEC contract payments available for 10 years Illinois November 2016 New York April 2016 Clean Energy Standard approved by NYPSC provides support for at-risk nuclear. Zero Emission Credit standard established. Contract payments available for up to 12 years Connecticut 2017? Connecticut Legislature currently debating clean energy procurement process in recognition of nuclear capacity role as provider of clean energy Ohio 2017? Legislative action under consideration to preserve at-risk nuclear generation State Regulatory/Legislative actions recognize value of nuclear energy
in meeting clean energy standards and supporting local
economy |
 32 Federal Regulatory Framework – Ensuring market structures recognize the value of reliable, diverse and clean dispatchable generation Support • FERC is driving ISOs to improve market constructs and rules on energy pricing • Higher payments for enhanced reliability (Capacity Performance); first purely CP capacity auction to be held by PJM in May 2017 Opportunity • Advocate for market solutions that fairly compensate generators for the cost of meeting demand • Seek recognition of environmental attributes of existing resources • Seek integration of state public policy objectives for clean energy with grid reliability and efficient market signals |
 33 PSEG Regulatory and Policy focus on mechanisms that provide customers clean, affordable, resilient energy supply NJ Distribution Base Rate Proceeding • True-up data from 2010 base rate case for known changes in customers usage,
taxes, O&M and investments
Long-Term Infrastructure Investment Platform
• Seek extension of existing infrastructure programs, e.g., GSMP, and broaden
investment platform
Preserve the Value of Nuclear Supply
• Pursuing legislative strategy to recognize the value of nuclear energy under terms and
conditions that are affordable for customers and provide the
proper incentives for long-term
operation Ensure Federal Regulatory and Policy
Framework •
Advocate for rules that preserve benefits of competitive markets
while also recognizing the value of clean energy,
supply diversity and grid reliability |
 PSE&G PRESIDENT AND CHIEF OPERATING OFFICER PUBLIC SERVICE ELECTRIC & GAS Ralph LaRossa |
 35 Discussion topics • Overview of PSE&G - Strategy and delivering results • Operational excellence • Capital investment program • 2017 Distribution rate case filing • Customer rates |
 36 Electric Gas Customers Growth (2012 – 2016) 2.2 Million 0.5% 1.8 Million 0.4% 2016 Electric and Gas Sales 41,580 GWh 2,360M Therms* Projected Annual Sales Growth (2017 – 2019)** 0.3% 0.7% Sales Mix (2016) Residential 33% 59% Commercial 58% 37% Industrial 9% 4% * GAS FIRM SALES ONLY. ** ESTIMATED ANNUAL GROWTH PER YEAR, ASSUMES NORMAL WEATHER.
PSE&G –New Jersey’s largest:
• Electric and Gas Distribution utility • Transmission business • Investor in renewables and energy efficiency • Appliance service provider 44% 52% 4% PSE&G 2016 Rate Base $15.2B Distribution Transmission Solar & EE |
 37 PSE&G strategy Building a sustainable platform that balances reliability, customer rates and public policy to ensure growth at reasonable returns DISCIPLINED INVESTMENT OPERATIONAL EXCELLENCE FINANCIAL STRENGTH ENGAGED WORKFORCE |
 38 Delivering on Our Promises Operational Excellence • Strong safety, reliability and customer service record • Cost control efforts have led to flat O&M Financial Strength • Achieved 5-year annual growth in net income of 11% • Achieved 5-year annual growth in rate base of 13% • Maintaining solid investment grade credit ratings Disciplined Investment • 15 investment programs approved over past eight years Infrastructure focused Supportive regulatory mechanisms providing for clause recovery Policy alignment – across administrations – Solar and Energy Efficiency • Programs creating jobs and providing environmental benefits, in a low-rate environment benefiting from low commodity prices and federal tax benefits from current bonus depreciation rules |
 39 Operational Excellence - Safety • Management focus and collaboration with unions resulted in top decile safety performance in 2016 SOURCE: PSE&G |
 40 Operational Excellence - Reliability Our system performance, as measured by System Average Interruption Duration Index (SAIDI), has consistently been among the best performers Named most reliable electric utility in the Mid-Atlantic region for 15th
consecutive year
Consistently recognized for customer reliability
SOURCE: PSE&G |
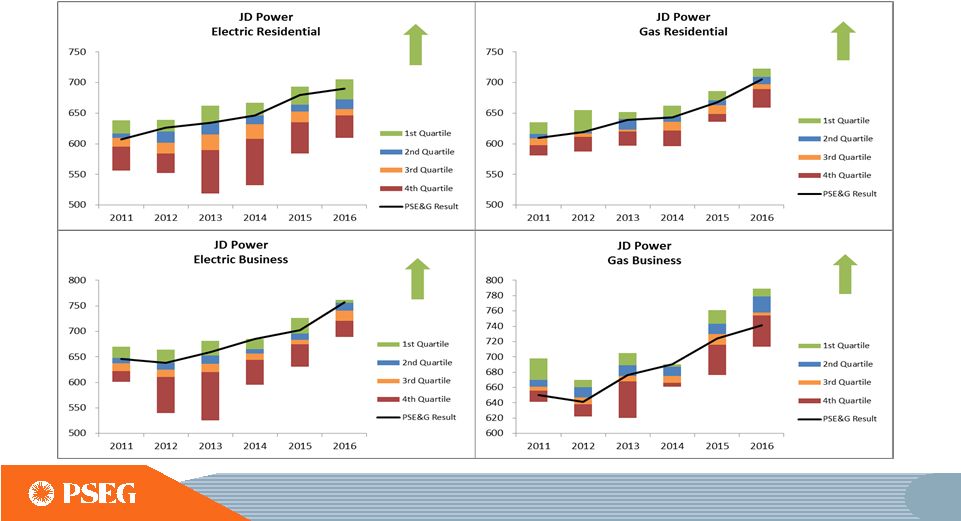 41 Operational Excellence - Customer satisfaction PSE&G has improved on an absolute and relative basis compared to its peers over the past five years JD Power Residential and Business Scores |
 42 - 200 400 600 800 1,000 1,200 2012 2013 2014 2015 2016 2017E Distribution Transmission Cost control actions: • PSE&G is utilizing the Lean Six Sigma discipline to achieve costs savings and
process improvements
• Regular organizational refinement to streamline processes
• Continued focus on vendor and inventory practices ensuring maximum value
• Successful management of pension 2012 to 2017E CAGR = 0.5% PSE&G O&M Expense Operational Excellence – O&M costs Demonstrated ability to control O&M, preserving earnings and returns in a low sales growth environment E = ESTIMATE. |
 43 Disciplined Investment – Delivering annual growth Rate Base and Net Income CAGR 13% and 11% $ Millions $ Millions Our rate base is now roughly balanced between federal and state jurisdictions - 100 200 300 400 500 600 700 800 900 - 2,000 4,000 6,000 8,000 10,000 12,000 14,000 16,000 2012 2013 2014 2015 2016 Distribution Transmission Renewables Net Income |
 44 Disciplined Investment – Continued growth in robust capital program 2017-2021E PSE&G Capital Spending with extension / expansion of current programs $12.3B Rate Base CAGR 7% . E = ESTIMATE. INCLUDES AFUDC Gas Distribution Transmission Solar and Energy Efficiency Electric Distribution With current returns on ~70% of capital investments Base Capital, including GSMP extension $13.8B Rate Base CAGR 9% 22% 26% 50% 2% 26% 26% 44% 4% |
 45 Transmission -
~$6 billion, 5-year investment program
focusing on reliability and replacing aging
infrastructure •
Formula rate recovery of capital
and expenses •
PJM’s Regional Transmission Expansion Plan (RTEP) identifies system enhancements needed for reliability • Portfolio transitioning – completing remaining major lines and moving to steady state investments to maintain reliability and stay ahead of asset end of life
• 69kV system upgrades improve system reliability and add capacity for future
growth •
Transmission Lifecycle to
manage asset life and improve system integrity and reliability • Transmission Hardening projects focus on increasing system resiliency
|
 Electric Distribution –
~$3 billion, 5-year
investment program focused on reliability and resiliency
• Energy Strong -
Completion of currently approved program
• Future growth efforts • Hardening – Extend program for critical system infrastructure • Aging infrastructure – Life cycle investments to ensure continued top quartile reliability performance • Over 65 substations > 60 years old; Over 30 substations > 80 years old • ~115 substations 26kV to 4kV • Risk assessment model to eliminate / replace • Technology – Next generation to enhance grid performance 46 |
 47 Electric Distribution - Technology • Making the grid smarter • Deployment of hundreds of microprocessor relays • A new state of the art distribution SCADA system to facilitate
full communication and control • Ability to integrate Distributed Energy Resources into the grid
while enhancing grid reliability and resiliency
• Improving customer service - continue to enhance delivery of information and communication 47 47 |
 48 Gas Distribution –
~$3 billion, 5-year investment
program focused on modernizing and upgrading cast
iron and unprotected steel main
• Cost efficiency of broad replacement approach
• Customer service – conversion from low pressure to high pressure • Environmental Collaboration with EDF and
Google to consider methane leaks in work
prioritization
• Replaced >200 miles in 2016 • Exceeding run rate of 30 year program, demonstrating ability to accelerate program • ~4,800 miles of cast iron and unprotected steel main remaining in the system • More cast iron than any other US utility 48 |
 Solar and Energy Efficiency
– ~$250 million, 5-year investment supports New Jersey policy objectives
• Solar – • Grid-connected solar on landfills and brownfields provides clean energy for all customers • 210 MW installed of the 300 MW total approved programs • Energy efficiency – Continuing programs with a focus on hospitals, multi- family housing and our direct install program which includes municipalities,
non-profits and small businesses in Urban Enterprise
Zones •
State
Policy
-
Programs
are
aligned
with
policy
goals
• Opportunity to expand – Potential for significant opportunity to expand energy efficiency and related customer services in the future
49 |
 50 Traditional Recovery Mechanisms Distribution Base Rates FERC Formula Rates Transmission Developing investment opportunities with
near-contemporaneous recovery
mechanisms Clause Recovery
Mechanisms Infrastructure / Solar / Energy
Efficiency E
=
ESTIMATE.
DATA
AS
OF
MARCH
2017.
INCLUDES
AFUDC.
Plan to increase current five year, $12.3B
capital plan by ~$1.5B through program
extensions and expansions:
• GSMP acceleration • Electric distribution – hardening extension and modernization investment program • Energy Efficiency and Solar programs – extensions and expansion With broad opportunity set of additional investment potential driven by customer expectations and public policy 23% 44% 33% 2017-2021E PSE&G Capital with Program extensions by Recovery Method $13.8B |
 PSE&G Investment Evolution: System needs, customer expectations and public policy objectives drive need for continued and increasing
Distribution investments
Utility of the Future represents potential investment
opportunity to sustain annual rate base growth
rate 51 |
 0 5,000 10,000 15,000 20,000 25,000 30,000 35,000 2016 2017E 2018E 2019E 2020E 2021E 2026E Distribution Transmission Solar & EE Total Utility Year-end Rate Base with extension / expansion of current programs Investment program supports strong rate base growth -- off a higher base $ Millions Rate Base CAGRs - 2016-2021E Base capital with extension and expansion of current programs 7% 9% E = ESTIMATE. 52 |
 53 Distribution – 2017 base rate case filing • Obligated to file rate case no later than November 1, 2017 • Last rate case – 2009 test year, settled in 2010 Since last rate case • Sales growth – flat, customer growth offset by energy efficiency • O&M – held flat, with increased regulatory requirements • Capital Investments – Growth in rate base beyond clauses, consists of: • GSMP annual stipulated base • Energy Strong • Other Distribution base investments beyond depreciation levels
• Customer rates since last rate case • Electric decreased 5%; Gas decreased 46% Supports need for moderate base rate increase |
 54 Optimal time for extension and expansion of investment programs • 2017 investment program filings • GSMP - extension and acceleration • Electric infrastructure - resiliency and modernization • Energy efficiency – extension, potential future expansion • Seeking long-term programs to optimize planning and cost • Programs improve system reliability and meet customer expectations
• System need as infrastructure reaches end of life • Increasing customer and public policy expectations • Optimal timing • Potential rate impact of program extensions - ~2%/year* Job creation Environmental benefits Federal tax benefits Low commodity prices *ASSUMES TYPICAL COMBINED RESIDENTIAL CUSTOMER WITH 7,200 KWH FOR ELECTRIC AND 1,010 THERMS FOR GAS ANNUALLY.
|
 55 Customer’s bills are materially lower, supporting needed investment in the system • Combined electric and gas bills declined ~28% over the 2009-2017 period
• Also provided BGSS bill credits totaling ~$590 per customer since 2012 • Low gas prices and elimination of transition charges drove rate decreases • Regional price comparison ** Gas is 2 nd lowest and Electric is lower than average • Investing at the Utility of the Future level – would take about a decade to equal the 2009 bill rates (adjusted for growth in CPI/disposable income)
*FOR ALL YEARS THE BILLING ASSUMES 7,200 KWH FOR ELECTRIC AND
1,010 THERMS FOR GAS ANNUALLY. E = ESTIMATE **
COMPARED AGAINST 12 REGIONAL UTILITIES AS OF SEPTEMBER 1, 2016, FOR A CUSTOMER THAT USES 500 KILOWATT- HOURS AND 100 THERMS IN A MONTH. PSE&G Typical Residential Customer Bills* |
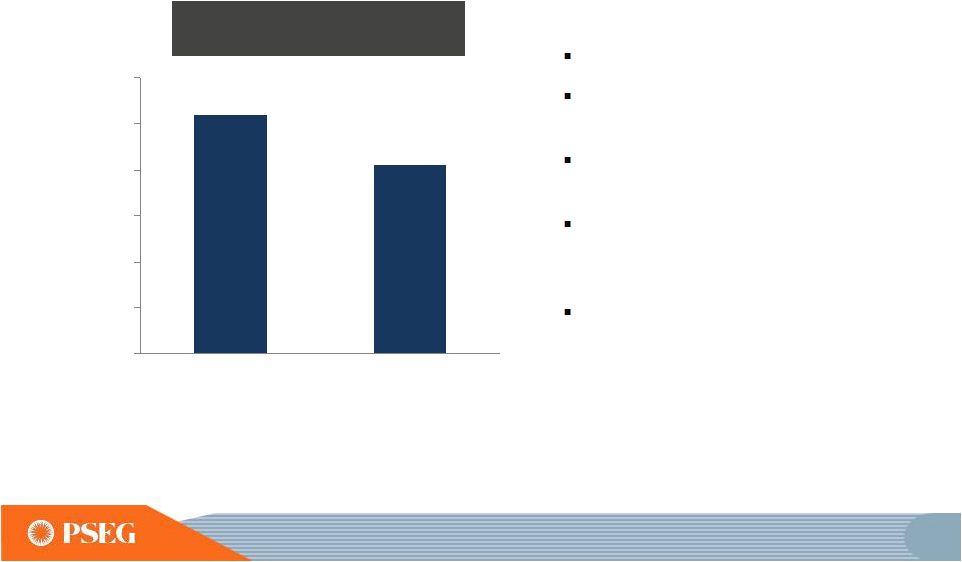
 56 PSE&G’s 2017 net income to benefit
from investment programs and cost control $787 $889 2015 2016 2017 Guidance PSE&G Net Income ($ Millions) $945 -- $985E E =ESTIMATE. |
 PSEG LONG ISLAND |
 58 • 4 th year of 12 year contract (with option to extend 8 years) • 2016 - Earned $0.08 per share* • Fixed fee of $65 million / year, escalated for CPI • Incentive opportunity of 15% • Power has $20 million / year energy management and fuel supply contract • Focused efforts on safety, reliability, customer satisfaction and
stakeholder relationships
• Meeting Operational and Financial expectations • Realized >95% of incentive payment in 2014, 2015 and 2016
*OVERALL ENTERPRISE IMPACT
PSEG Long Island
-
Focused on improving
customer service and reliability while managing
costs |
 59 PSEG Long Island continues to drive improvement
in performance metrics
2.8
2.3
1.5
0.0
0.5
1.0
1.5
2.0
2.5
3.0
2014
2015
2016
OSHA
532
584
610
675
0
100
200
300
400
500
600
700
800
2014
2015
2016
2017
JD Power -
Residential
0.72
0.84
1.11
0.00
0.20
0.40
0.60
0.80
1.00
1.20
2014
2015
2016
SAIFI
82
79
68
0
30
60
90
2014
2015
2016
CAIDI
OSA
2.3
OSA
588
OSA
0.92
OSA
85
OSA = AMENDED OPERATING SERVICES AGREEMENT BETWEEN PSEG-LI
AND LIPA SETTING BENCHMARK INCENTIVE LEVELS * JD
POWER 2017 REPRESENTS FIRST WAVE DATA
* |
 We have the energy to make things better … for you, for our investors and for our stakeholders. |
 PSEG POWER William Levis P S E G P O W E R P R E S I D E N T A N D C H I E F O P E R A T I N G O F F I C E R |
 62 PSEG Power strategy Excellence in operating our units safely, reliably, cost- competitively and in an environmentally responsible manner DISCIPLINED INVESTMENT DISCIPLINED INVESTMENT OPERATIONAL EXCELLENCE OPERATIONAL EXCELLENCE FINANCIAL STRENGTH FINANCIAL STRENGTH ENGAGED WORKFORCE ENGAGED WORKFORCE |
 63 Power is transforming its portfolio to be newer, more efficient and flexible • Continued growth with 1,300 MW new CCGT’s announced • Keys • Sewaren 7 • Projects Completed: • Peach Bottom EPU, 130 MW • Bergen 2 AGP uprate, 31 MW • Retired HEDD Units • Solar portfolio reaches 277 MW DC • Initiated Hope Creek uprate, 18 MW • Additional 400 MW of new peaker capacity at Kearny and New Haven • Bethlehem Energy Center, 2 gas pipeline connection added • CCGT Advanced Gas Path (AGP) uprate completed at Linden 1 & 2, 63 MW • Energy / Fuel management contract for LIPA Selected Accomplishments Towards Transformation Cost Control • Bridgeport Harbor 5 485 MW CCGT cleared ISO-NE auction • Hudson & Mercer early retirement announced • Kearny 13 & 14 uprate, 14.5 MW increased capacity • Initiated electric & gas retail business in NJ, PA • Solar reaches ~326 MW DC in operation 2012 2013 2014 2015 2016 nd |
 64 Power has generating assets in three competitive markets ISO New England New Haven Bethlehem Energy Center (Albany) Conemaugh Keystone Peach Bottom Bergen Kearny Essex Sewaren (incl. Sewaren 7,
CCGT under construction)
Linden + Linden VFT
Mercer*
Burlington
Hudson*
Hope Creek Salem Yards Creek New York ISO PJM Keys Energy Center (CCGT under construction) Bridgeport (incl. Bridgeport Harbor 5,
CCGT under construction)
• Major assets located near key load centers • Constructing three new, efficient combined-cycle units • Positioned to benefit from market volatility • Additional generation assets: • Solar (326 MW DC /257 MW AC ) • Kalaeloa, HI (104
MW)
*POWER ANNOUNCED RETIREMENTS OF HUDSON AND MERCER GENERATING
STATIONS AS OF JUNE 1, 2017. |
 Power has a diverse fleet of generating assets
which enables it to respond to market
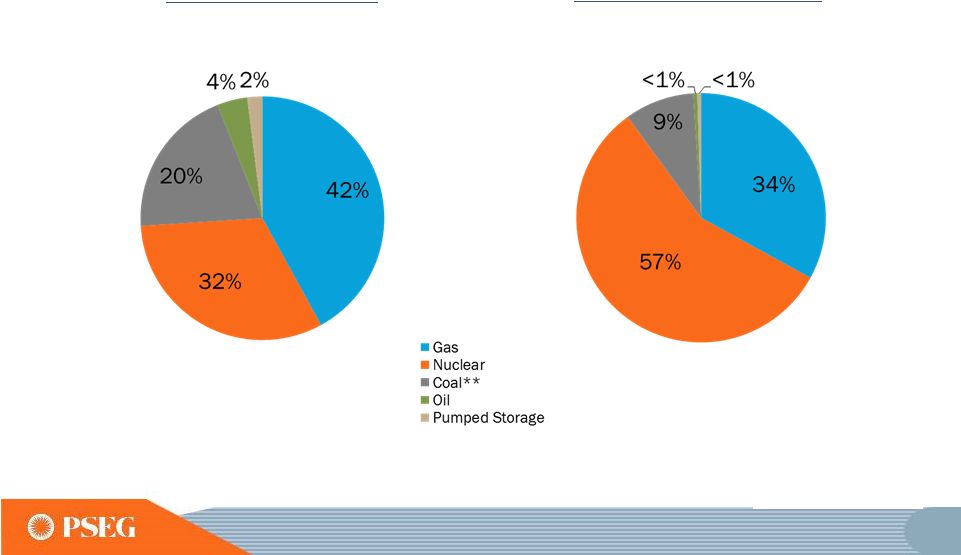
needs Fuel Diversity 2016*
Total MW: 11,577
Energy Produced 2016*
Total GWh: 51,510
65
*
EXCLUDES
SOLAR
(326
MW
DC
/257MW
AC
)
AND
KALAELOA
(104MW)
.
** INCLUDES NEW JERSEY UNITS THAT FUEL SWITCH TO
GAS. |
 66 Power’s Fossil Fleet maintains solid
performance in a challenging environment
• Generation records at BEC and Bergen 2 combined-cycle units • Combined-cycle EFORd * and EFORp lowest in five years • Start Success Rate: • Peaking: 99.7% • Coal/Steam: 93% *EFORd EXCLUDES EVENTS OUTSIDE OF MANAGEMENT CONTROL. 0% 20% 40% 60% 80% 100% 2012 2013 2014 2015 2016 Combined Cycle Availability Factor |
 Nuclear is vital to New Jersey with Salem and
Hope Creek providing ~40% of the
State’s energy consumption
Hope Creek
• Operated by PSEG Nuclear • PSEG Ownership: 100% • Boiling Water Reactor • Total Capacity: 1,172 MW • Owned Capacity: 1,172 MW • License Expiration: 2046 • 18 MW Uprate Spring 2018 • Next Scheduled Refueling Spring 2018 Salem Units 1 and 2 • Operated by PSEG Nuclear • PSEG Ownership: 57% • Pressurized Water Reactor • Total Capacity: 2,296 MW • Owned Capacity: 1,318 MW • License Expiration: 2036 and 2040 • Next Scheduled Refueling Unit 1 – Fall 2017 Unit 2 – Spring 2017 Peach Bottom Units 2 and 3 • Operated by Exelon • PSEG Ownership: 50% • Boiling Water Reactor • Total Capacity: 2,450 MW • Owned Capacity: 1,225 MW • License Expiration: 2033 and 2034 • Next Scheduled Refueling Unit 2 – Fall 2018 Unit 3 – Fall 2017 67 |
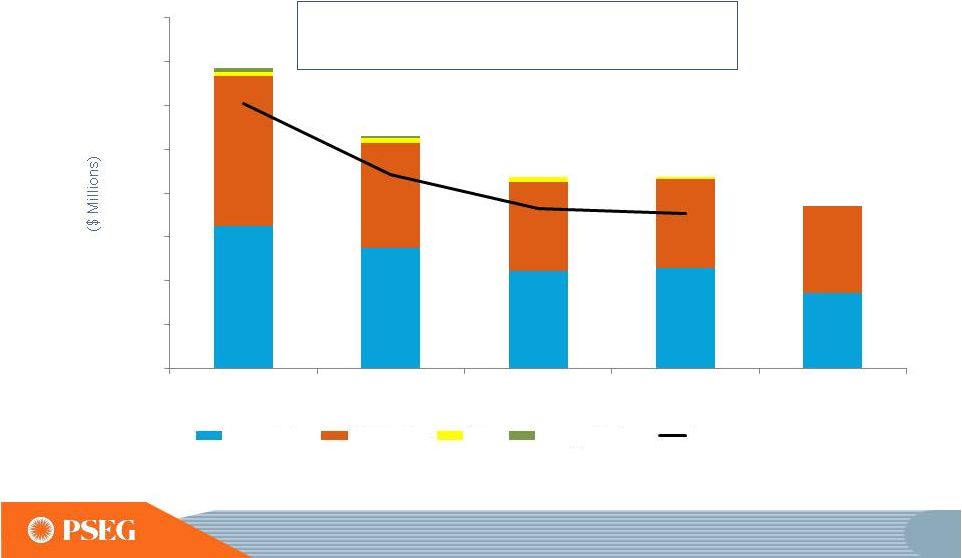
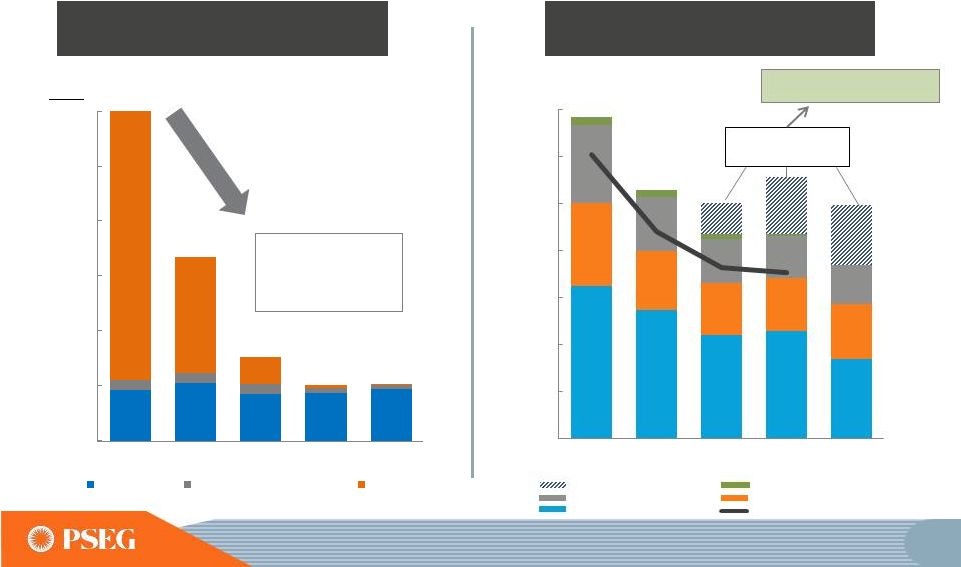
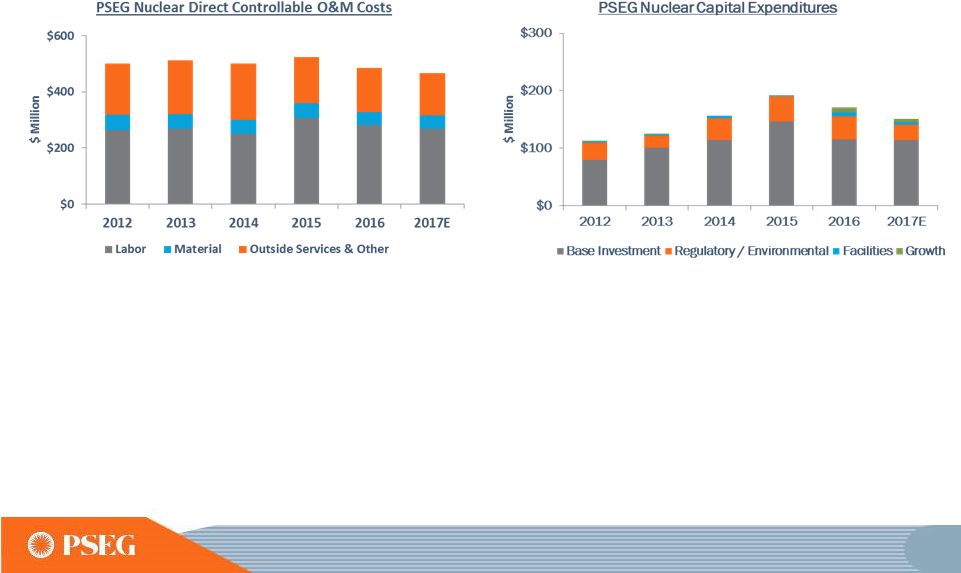 68 • 2012 to 2017E CAGR: --1.4% • The 2015 Labor increase / outside services decrease is due to bringing security force employees in-house • Material and outside service cost reductions CAGR: -- 4% NOTE: LABOR INCLUDES BASE WAGES, OVERTIME AND FRINGE BENEFITS. ALL YEARS EXCLUDE EXPENDITURES FOR NUCLEAR
FUEL (APPROXIMATELY $6.50/MWH).
E=ESTIMATE PSEG Nuclear has been addressing the economic challenges in the current low gas price environment • Fukushima-related compliance drove $198 M of Regulatory/Environmental spend • 2016 and 2017E capital driven by Baffle Bolt replacement • Going forward capital approximately $100M/year to maintain reliability to end of license life |
 PSEG Nuclear is leading the industry in
efforts to ensure economic viability of
fleet Goals
• Industry goal to achieve reductions in O&M, fuel and capital costs by 2018
• The three-year program to examine and implement opportunities to:
Advance safety,
Improve operations, and
Prevent premature reactor closures
• Concurrently, we continue to work with NEI and other industry partners to gain greater
compensation for nuclear plants in competitive market
policies PSEG Nuclear progress to date
• 46 Efficiency Bulletins issued, 21 implemented to date • Cost reductions achieved: 185 FTE reduction; 2017 direct O&M reduction of 5% from plan
target while funding equipment reliability
improvement •
Implemented changes to focus on eliminating vs. mitigating
equipment reliability issues to ensure generation
is not negatively impacted PSEG Nuclear is not
currently earning its cost of capital
69 |
 70 2012 to 2017E CAGR: -- 0.3% Power O&M Expense* *EXCLUDES IMPACTS FROM STORM RECOVERY COSTS AND THE HUDSON/MERCER EARLY RETIREMENT.
E=ESTIMATE
Power
has demonstrated its ability to control O&M
$0 $500 $1,000 $1,500 2012 2013 2014 2015 2016 2017E |
 Power is developing ~1,800 MW of new,
efficient CCGT capacity in MD, NJ and
CT SEWAREN 7 SITE
KEYS ENERGY CENTER SITE
BRIDGEPORT HARBOR 5 SITE
71 |
 72 Growth Project Update
- Keys Energy Center • 755 MW plant in Prince George’s County, MD • 2x1 natural gas-fired combined cycle • Greenfield site • Estimated Costs $825 to $870 million • Major Milestones • Combustion turbines and generators, steam turbine and generator and all three generator step-up transformers have been set in place • Construction is 35% complete as of February 2017 • Commence training / start-up support in 2017 • Expected to be in service in mid-2018 • Outlook • Expands geographic footprint to the SWMAAC* load pocket Keys Energy Center – Aerial View *SWMAAC – SOUTHWEST/EMAAC = EASTERN MID-ATLANTIC AREA COUNCIL E = ESTIMATE SNC Notice to Proceed 6/18/15 Commence Site Clearing 8/25/15 Full Site Mobilization 3/2/16 Begin HRSG Erection 11/10/16 Back Feed Switchyard 8/3/17(E) First Fire 2/9/18(E) Target Substantial Completion 4/30/18(E) Guaranteed Substantial Completion 5/1/18(E) |
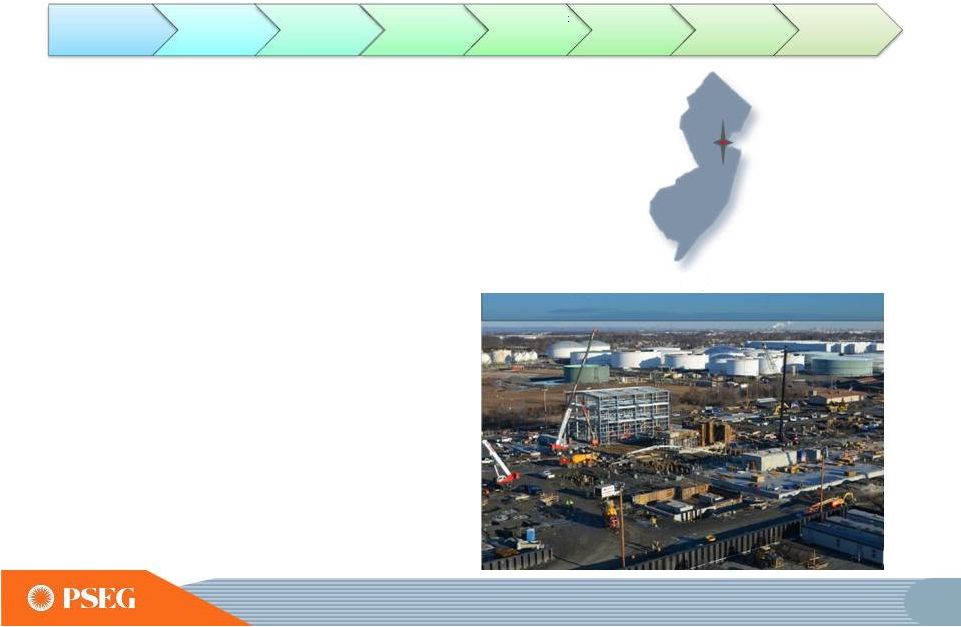 73 Sewaren 7 – Aerial View Growth Project Update
– Sewaren 7 • 540 MW plant in Sewaren , New Jersey • 1x1 dual fuel (natural gas & ultra low sulfur diesel) combined cycle • Estimated Costs $625 to $675 million • Major Milestones • Combustion steam turbine generator, combustion turbine and main transformers have been set in place • Construction is 29% complete as of February 2017 • Expected to be in service in mid-2018 • Outlook • Leverages existing infrastructure • Existing Sewaren units will retire upon completion • Located in the PS Zone load pocket E = ESTIMATE 73 Full Site Mobilization 3/14/16 Begin HRSG Erection 1/23/17 Backfeed Plant Substation 8/15/17(E) CTG First Fire 12/19/17(E) Target Substantial Completion 4/1/18(E) Guaranteed Substantial Completion 6/1/18(E) Sewaren Clears Auction 8/21/15 Commence Site Clearing 11/30/15 |
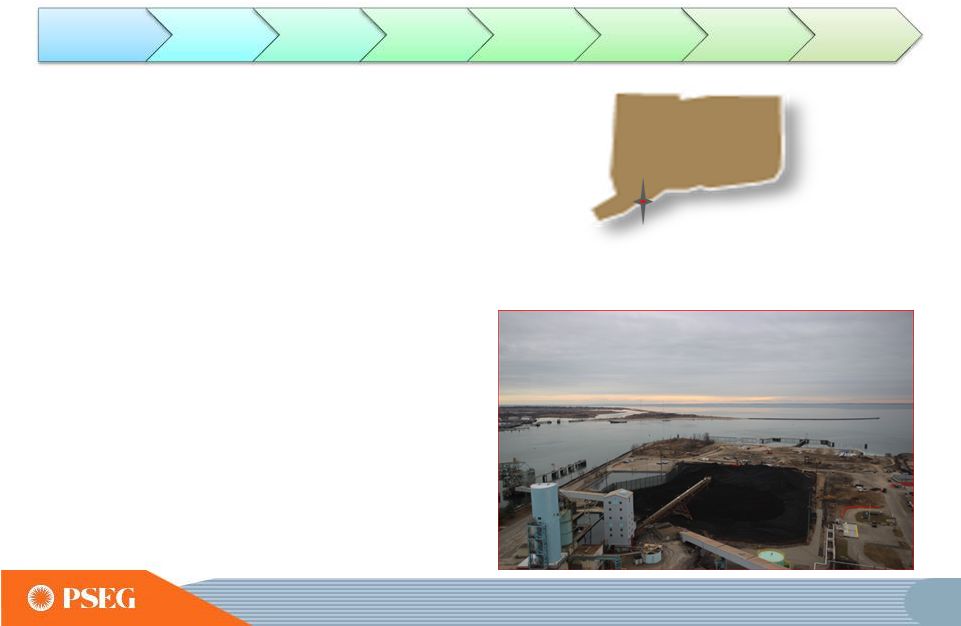 74 Growth Project Update
– Bridgeport 5 • 485 MW plant in Bridgeport, Connecticut • 1x1 dual fuel (natural gas & ultra low sulfur diesel) combined cycle • Estimated Costs $525 to $575 million • Major Milestones • New Source Review Air Permit is expected to be issued by April 15, 2017 • Expected to be in-service in mid-2019 • Outlook • To be constructed on the existing PSEG Bridgeport Harbor site; Bridgeport Harbor 3 will retire in 2021 • Located in the SW Connecticut load pocket • Seven year capacity price lock Bridgeport 5 – Aerial View BHS Unit 5 Clears Auction 2/10/16 Commence Site Prep 10/17/16 Full Site Mobilization 4/1/17(E) Begin HRSG Erection 1/2/18(E) Backfeed Plant Substation 3/1/18(E) CTG First Fire 11/15/18(E) Target Substantial Completion 5/1/19(E) Plant Commences Operations 6/1/19(E) E = ESTIMATE |
 75 2021E Fuel Diversity 1 Total MW: 11,900 Projected Fleet Comparison 2016 to 2021E 2016 Fuel Diversity Total MW: 11,577 Energy Produced increases by >18% Power’s fleet is being transformed with focus on improvement in efficiency 2021E Energy Produced 1 Total GWh: 61,000 2016 Energy Produced Total GWh: 51,510 REFLECTS ANNOUNCED EARLY RETIREMENT OF HUDSON AND MERCER UNITS IN MID-2017. ALL PERIODS EXCLUDE SOLAR (257MW AC ) CAPACITY AND KALAELOA (104 MW) CAPACITY / ENERGY PRODUCED. ** 2016 COAL INCLUDES NEW JERSEY UNITS THAT FUEL SWITCH TO GAS. E = ESTIMATE 1 |
 76 Power’s fleet is transitioning to become
more efficient, productive and
clean E = ESTIMATE.
E
E
E
E
SO2
lbs/MWh
CO2
lbs/MWh
NO
X
lbs/MWh |
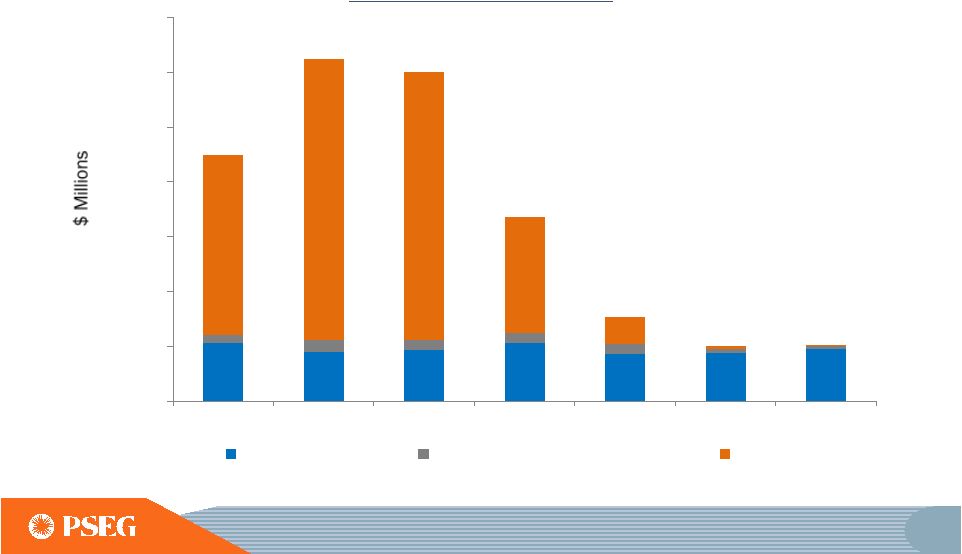 77 Power’s capital needs decline following construction of new capacity, enhancing free cash flow E=ESTIMATE. DATA AS OF FEBRUARY 2017. EXCLUDES NUCLEAR FUEL. INCLUDES IDC. Power Capital Investment $0 $200 $400 $600 $800 $1,000 $1,200 $1,400 2015 2016 2017E 2018E 2019E 2020E 2021E Maintenance Environmental / Regulatory Growth |
 78 Power’s fleet is well-located with access to shale gas production • PSEG Power procured approximately 400 BCF in 2016 with almost 50% going to PSE&G’s utility gas customers • PSEG Power’s gas for PJM generation was ~100 BCF in 2016, of which >80% was supplied by Northeast Shale gas PSEG’s Total PJM Gas Procurement New England 1.2 bcf/d Southeast 6.1 bcf/d Midwest 4.9 bcf/d Gulf Coast 5.4 bcf/d NJ/NY 1.7 bcf/d Pipeline capacity grows significantly by 2018 • Significant amount of new pipelines have already been built and more are in construction / development • Gas production and pipeline takeaway capacity expected to be more balanced in 2018 timeframe |
 79 With additional pipeline capacity, some price
convergence is beginning to appear in the
gas markets Electric basis for the PSEG Zone is
also showing improvement in the forward markets $0
$1 $2 $3 $4 2015A 2016A 2017E 2018E Natural Gas Actual and Forward Prices Henry Hub (12/30/2016) Leidy (12/30/2016) Henry Hub (2/15/2017) Leidy (2/15/2017) $20 $30 $40 2015A 2016A 2017E 2018E Western Hub and PS Zone RTC Actual and Forward LMPs WH RTC (12/30/2016) PS Zone RTC (12/30/2016) WH RTC (2/15/2017) PS Zone RTC (2/15/2017) E = ESTIMATE |
 80 Retail Electric / Gas Marketing • Retail sales to support generation • Focus on Commercial and Industrial customers • Target: • Year 3: ~4 - 5,000 GWh • Year 5: ~8 - 10,000 GWh Capacity Load shape Transmission Congestion Ancillary services Risk premium Green 3 Year Average Round the Clock PJM West Forward Energy Price NJ BGS RSCP Supply Pricing + New Jersey BGS accounts for ~11 TWh of our
hedging –
Retail marketing will complement BGS
$/MWH;
BGS
PRICES
REFLECT
PSE&G
ZONE;
RESULTS
FOR
2015-2017
WILL
BE
THE
NEW
BLENDED
PRICES
BEGINNING
JUNE
1,
2017.
$97.39 $92.18 $99.54 $96.38 $90.78 ~ $53 ~ $62 ~ $59 ~ $63 ~ $58 - $40 $38 - $39 $33 - $34 $32 - - $33 $38 OH VA WV NH RI MA DE NJ PA NY VT ME CT MD $37 $39 |
 81 HEDGE PERCENTAGES AND PRICES AS OF FEBRUARY 9, 2017, UPDATED WITH 2017 BGS AUCTION RESULTS. REVENUES OF FULL REQUIREMENT
LOAD DEALS BASED ON CONTRACT PRICE, INCLUDING
RENEWABLE ENERGY CREDITS, ANCILLARY, AND TRANSMISSION COMPONENTS BUT EXCLUDING CAPACITY. HEDGES INCLUDE POSITIONS WITH MTM ACCOUNTING TREATMENT AND OPTIONS.
Our Hedging Strategy is designed to secure gross margin while leveraging the portfolio 2017 2018 2019 Volume TWh 34 34 34 Base Load % Hedged 100% 80-85% 35-40% (Nuclear and Base Load Coal) Price $/MWh $46 $43 $43 Volume TWh 16 21 26 Intermediate Coal, Combined % Hedged 45-50% 0% 0% Cycle, Peaking Price $/MWh $46 - - Volume TWh 49-51 54-56 59-61 Total % Hedged 80-85% 50-55% 15-20% Price $/MWh $46 $43 $43 |
 82 2020 Onward, RPM Auctions include 100% Capacity Performance and will be impacted by changes in:
• Net CONE
• Demand Response Rules
• PJM Parameters
• Environmental Retirements
• Load Forecasts
*PSEG POWER’S AVERAGE PRICES AND CLEARED CAPACITY (MW)
REFLECT BASE AND INCREMENTAL AUCTIONS. DELIVERY
YEARS RUN FROM JUNE 1 TO MAY 31 OF THE NEXT CALENDAR YEAR. PJM’s RPM Auction Results* Delivery Year 2015/2016 2016/2017 2017/2018 2018/2019 2019/2020 Power’s Average Prices
($/MW-day) $168 $172 $177 $215 $116 Rest of Pool Prices ($/MW-day)
$136
$59
$120
$165/$150
(CP/Base)
$100/$80
(CP/Base)
Power’s Cleared
Capacity (MW)
8,750
8,700
8,700
8,650
8,900
ISO New England’s Forward Capacity Market Auction
Results Delivery Year
2015/2016
2016/2017
2017/2018
2018/2019
2019/2020
2020/2021
Power’s Average
Prices ($/MW-day) $113 $104 $232 $315 $231 $195 Power’s Cleared Capacity (MW) 773 777 848 831 1,333 1,333 Capacity Markets provide a solid and continuing
revenue stream
Bridgeport Harbor 5 cleared the 2019/2020 auction and receives
$231/MW-day for seven years |
 83 Solar has grown to 326 MW DC in operations with 70 MW DC under construction PORTFOLIO CONSISTs OF 326 MW DC /257 MW AC IN OPERATIONS, 70 MW DC /55 MW AC IN CONSTRUCTION. 0 100 200 300 400 500 2014 2015 2016 Operating In Construction Solar in Operation / Construction at Year-End |
 84 Gas Supply and Asset Optimization Wholesale provider to PSE&G and others Storage capacity of approximately 78 Bcf (in the Gulf and market regions)
Firm transportation of 1.3 Bcf/day on seven
pipelines Off-system sales margins shared with
residential customers Commercial & Industrial
gas sales Ancillary Services – Black start,
reactive power, area regulation LIPA Fuel and
Energy Dispatch Management – contract through 2024 Kalaeloa, HI – 50% equity interest in a 208 MW oil-fired combined cycle unit
Other attractive sources of revenues
round out a robust portfolio
|
 Power’s 2017 non-GAAP Operating Earnings reflect efforts being taken in challenging market conditions
*SEE SLIDE B FOR ITEMS EXCLUDED FROM NET INCOME TO RECONCILE TO
OPERATING EARNINGS (NON-GAAP). E = ESTIMATE. PSEG Power non-GAAP Operating Earnings* ($ Millions) Net Income $856 Net Income $18 |
 PSEG Power’s Value Proposition • Well-positioned, well-run fleet of merchant generating assets in
competitive markets
• Early retirement of Hudson and Mercer coal stations in mid-2017
improves fleet efficiency and returns
• Addition of 1,800 MWs of new, efficient, flexible CCGTs transforms the
portfolio
• Low capital requirements post-construction • Hedging strategy to protect value of assets in declining price
environment and provide stable returns and cash
flow Efficient fleet
Advantaged locations
Investing to grow |
 PSEG FINANCIAL REVIEW & OUTLOOK Dan Cregg EXECUTIVE VICE PRESIDENT AND CHIEF FINANCIAL OFFICER |
 88 Strong financial position driven by PSE&G with meaningful contribution from Power 2016 Financial Position Earnings Delivered on 2016 guidance under challenging conditions
Increased PSE&G earnings contribution
Investment
Executed major PSE&G capital program balanced between
Transmission and Distribution
Focused on optimizing Power’s generation portfolio
Cash Flow and
Credit Metrics
Produced stable and strong PSE&G cash from operations
Generated significant cash flow at Power to
fund growth investments
Maintained strong credit metrics
Dividends
Increased common dividend by 5% or $0.08 per
share |
 89 We consistently deliver our earnings guidance by executing our growth plans, managing O&M, and optimizing assets PSEG Non-GAAP Operating Earnings* $ Millions (except EPS) 2012 2013 2014 2015 2016 Initial Operating Earnings Guidance $2.25 – $2.50 $2.25 – $2.50 $2.55 – $2.75 $2.75 – $2.95 $2.80 – $3.00 Non-GAAP Operating EPS* $2.44 $2.58 $2.76 $2.91 $2.90 Upper End of Guidance Exceeded Guidance Exceeded Guidance Upper End of Guidance Mid-Point of Guidance Producing strong results in challenging conditions, including a
low commodity price environment and unfavorable
weather *SEE
SLIDE A FOR ITEMS EXCLUDED FROM NET INCOME TO RECONCILE TO NON-GAAP OPERATING EARNINGS. . E= ESTIMATE. 89 |
 90 PSE&G forecasted to be 66% of PSEG’s 2017 non-GAAP Operating Earnings Non-GAAP Operating Earnings * Contribution by Subsidiary PSEG Non-GAAP Operating Earnings $ Millions (except EPS) 2017E Guidance PSE&G $945 - $985 PSEG Power $435 - $510 Enterprise/Other $35 Operating Earnings* $1,415 - $1,530 Operating EPS* $2.80 - $3.00E *SEE SLIDE A FOR ITEMS EXCLUDED FROM NET INCOME TO RECONCILE TO NON-GAAP OPERATING EARNINGS. **BASED ON MIDPOINT
OF 2017 NON-GAAP OPERATING EARNINGS GUIDANCE OF $2.80 - $3.00 PER SHARE.
E= ESTIMATE. |
 91 Distribution Transmission PSE&G’s capital spending drives high single-digit growth in rate base ~$15.2B ~$8.5B ~$6.7B ~$10.4B ~$11.2B 2016 Rate Base 2021E Rate Base with Program Extensions & Expansion 2021E Rate Base ~$21.6B 2016 – 2021E Rate Base CAGR Growth of ~7% 2016 – 2019E Rate Base CAGR Growth of ~9% Transmission ~48% Transmission ~44% ~$19.6B ~$10.4B ~$9.2B Transmission ~47% 2019E Rate Base 2016 – 2021E Rate Base with Program Extensions & Expansion CAGR Growth of ~9% Utility of the Future • Electric Infrastructure • Gas Infrastructure • Distributed Energy Resources • Energy Efficiency ~$22.9B E = ESTIMATE |
 92 Power’s hedging program has secured 55% - 60% of its estimated gross margin for the next 3 years 3 Year Average - Gross Margin (%) 51,510 GWh 2017E-2019E . E = ESTIMATE. 57% 33% 10% Nuclear Gas Coal Capacity Available in 2016 85% 8% 7% 11,577 MW Energy Produced in 2016 PJM NEISO NYISO Capacity Margin (hedged) Energy Margin (hedged) Unhedged Margin |
 93 ~$1.2B ~$1.5B ~$2.9B ~$3.3B ~$6.1B ~$16.5B ~$1.5B ~$15.0B PSEG 2017E – 2021E Capital Investment PSEG capital program focused on growth Power & Other Maintenance PSE&G Distribution Maintenance Power Growth PSE&G Transmission Growth PSE&G Distribution Growth Identified Growth Investment ~$10.9B PSEG Planned Spend Maintenance ~$4.1B Program Extensions & Expansion PSEG Planned Spend with Extensions & Expansion Program Extensions & Expansion ~$1.5B ESMP ~$0.8B GSMP Expansion ~$0.3B EE Extension ~$0.4B PSE&G Growth represents ~75% of its total spend E = ESTIMATE; CAPITAL INCLUDES AFUDC AND IDC |
 94 $2.1 $2.8 $1.5 $3.9 $2.0 $4.3 0.0 1.0 2.0 3.0 4.0 5.0 2011 Est. 2014 2014 Actual 2012 Est. 2015 2015 Actual 2013 Est. 2016 2016 Actual We have demonstrated an ability to identify opportunities to deploy our balance sheet PSEG Capital Spending (1) Forecast vs Actual (1) CAPITAL INCLUDES IDC AND AFUDC. 94 |
 95 - 500 1,000 1,500 2,000 2,500 3,000 3,500 2017E 2018E 2019E 2020E 2021E - 200 400 600 800 1,000 1,200 2017E 2018E 2019E 2020E 2021E Maintenance Enviornmental/Regulatory Growth Power’s free cash flow improves as construction program ends, providing funding for growth $MM Free cash flow to improve as capital spending declines by $1 billion from 2017 PSEG Power 2017E – 2021E Capital Spending (1) $MM Utility of the Future PSE&G 2017E – 2021E Capital Spending (1) Program Extensions & Expansion Transmission Gas Distribution Electric Distribution Solar and Energy Efficiency Program Extensions & Expansion 2016 Forecast (1) CAPITAL INCLUDES IDC AND AFUDC E = ESTIMATE |
 96 Sources Uses PSE&G Cash from Operations PSE&G Maintenance Investment Power Growth Investment Shareholder Dividend PSE&G Net Debt (2) Power Cash from Operations Parent Net Debt (1) PSEG Consolidated 2017E – 2021E Sources and Uses Other Net Cash Flow (3) Growth in PSE&G results in a more regulated cash flow profile Adding incremental growth projects with near contemporaneous returns increases both sources and uses of cash Significant free cash flow after completion of Power’s $1.5B growth program PSE&G Growth Investment Power Maintenance Investment (1) INCLUDES ISSUANCES, REDEMPTIONS, INTERCOMPANY LENDING, AND TREASURY SHARES
(2) INCLUDES ISSUANCES, REDEMPTIONS, AND CASH
POSITION (3) INCLUDES OTHER PSEG NET CASH FLOW E =
ESTIMATE |
 97 Total Incremental Investment Capacity $0.0 $2.0 $4.0 Power Parent Total ($ Billions) Power PSEG Estimate ~40% Low – 20’s Minimum Threshold 30% High - teens Average Funds From Operations / Debt 2017E – 2019E Strong credit metrics provide substantial investment capacity for increased utility investment E=ESTIMATE. Incremental capacity invested in utility would be matched with utility debt |
 98 0 20 40 60 80 100 120 2016 2017E Manageable Pension and OPEB Expense with a reduction of ~$22 million in 2017 2016 Pension funded ratio ~90% Historical 5-year annualized pension returns exceeded 10% No qualified pension contributions planned Merger of three pension plans contribute to reduction in pension expense Pension expense expected to decline beyond 2017 $ Millions E = ESTIMATE. (1) Post-Capitalization and Pre-tax expense Post-Capitalization Pension and OPEB Expense (1) |
 99 $0 $500 $1,000 $1,500 $2,000 $2,500 2012 2013 2014 2015 2016 2017E 2012 - 2017E CAGR: ~0.0% 2012 – 2017E CAGR Transmission ~5.6% (Formula Rate Treatment) Distribution ~(0.2%) Power ~(0.3%) Other PSEG O&M Expense (1) PSEG has demonstrated an ability to control O&M, with plans to reduce in 2017 99 (1) POWER EXCLUDES IMPACTS FROM STORM RECOVERY COSTS AND THE HUDSON/MERCER EARLY RETIREMENT WRITE-DOWN.
DISTRIBUTION EXCLUDES ELECTRIC AND GAS BAD DEBT. E =
ESTIMATE. |
 100 2017 Federal Tax Reform – PSEG is well positioned Assumption PSE&G PSEG Power PSEG Parent Reduction of Corporate Tax Rate Customer rates lowered with reduction in tax rate Return of excess deferred tax liability – impact on cash and rate base growth dependent on payback period After-tax earnings and cash flow increase One-time non-cash earnings benefit from reduction in deferred tax liability After-tax earnings and cash flow improve 100% Expensing of Capital Expenditures Impact on rate base growth comparable to existing bonus depreciation rules Cash flow improves Elimination of Deductibility of Interest Expense and Border Adjustment Tax Change in cost anticipated to be passed through to customers Well positioned given low debt balance Uncertainty on Border Adjustment Tax Well positioned given low debt balance Given positive non-utility contribution to earnings and a strong balance sheet,
PSEG is well positioned for potential tax reform
100 |
 101 $0.60 $0.80 $1.00 $1.20 $1.40 $1.60 $1.80 $2.00 2011 2012 2013 2014 2015 2016 2017E PSE&G EPS Annual Dividend Per Share (2011-2017E CAGR: 3.9%) Opportunity for meaningful and sustainable dividend growth Payout Ratio 50% 58% 56% 54% 54% 57% 59% (1) 1.37 1.42 1.44 1.48 1.56 1.64 1.72 1.94 1.86 (1) THE 2017 PAYOUT RATIO IS BASED ON THE MIDPOINT OF PSEG’S 2017 NON-GAAP OPERATING EARNINGS GUIDANCE OF $2.80 - $3.00 PER SHARE SEE SLIDE A FOR ITEMS EXCLUDED FROM INCOME FROM CONTINUING OPERATIONS/NET INCOME TO RECONCILE TO OPERATING EARNINGS. E =
ESTIMATE |
 102 PSEG’s longer-term outlook is influenced by Power’s hedge position and investment at PSE&G
2017E
2018E
Each $0.75/mcf Change in Natural Gas
Each $2/MWh Change in Spark Spread
Each $5/MWh Change in Dark Spread
Each 1% Change in Nuclear Capacity Factor
Segment EPS Drivers
Each $100 Million of Incremental Investment
Each 1% Change in Sales
Electric
Gas
Each 1% Change in O&M
Each 20 basis point Change in Distribution ROE
Each 20 basis point Change in Transmission ROE
$0.01
$0.01
$0.01
$0.01
$0.02
$0.02
$0.02 -
$0.05
$0.05
$0.02
$0.01
$0.00 -
$0.02
$0.03
$0.00
$0.01
$0.01
$0.01
$0.01
$0.01
$0.02
$0.02
Sensitivities derived from typical annual market variability
E = ESTIMATE. POWER EARNINGS
SENSITIVITIES UPDATED FOR DECEMBER 31, 2016 PRICE CURVES. PSE&G DISTRIBUTION ROE SENSITIVITIES EXCLUDE ENERGY STRONG AND GSMP.
2019E
$0.08 -
$0.12
$0.06
$0.02
$0.01
$0.01
$0.01
$0.01
$0.01
$0.02
$0.02
102 |
 103 PSEG Summary • 2016 Operating Earnings (non-GAAP) at upper end of revised guidance of
$2.80 -
$2.95 per share
• 2017 guidance for Operating Earnings (non-GAAP) of $2.80 to $3.00 per share
supported by PSE&G growth
• PSE&G capital spending provides high single-digit rate base growth for foreseeable
future balanced between Transmission and Distribution
• Power expected to generate significant free cash flow following CCGT construction
program and transformation to a more efficient generation
fleet •
Strong balance sheet and cash flow support current capital
program and new investment opportunities without
the need for equity •
Our indicative $0.08 dividend per share increase for 2017
demonstrates meaningful and sustainable dividend
growth given significant contribution from PSE&G earnings and Power’s strong financial profile |
 PSEG EXECUTIVE PROFILES |
 105 CHAIRMAN, PRESIDENT AND CHIEF EXECUTIVE OFFICER PUBLIC SERVICE ENTERPRISE GROUP INCORPORATED Ralph Izzo Ralph Izzo was elected chairman and chief executive officer of Public
Service Enterprise Group Incorporated (PSEG) in April 2007. He
was named as the company’s president and
chief operating officer and a member of the board
of directors of PSEG in October 2006. Previously,
Mr. Izzo was president and chief operating officer of Public
Service Electric and Gas Company
(PSE&G). Since joining PSE&G in 1992, Mr.
Izzo was elected to several executive positions
within PSEG’s family of companies, including PSE&G senior vice president – utility operations; PSE&G vice president – appliance service; PSEG vice president - corporate planning; and PSE&G vice president - electric ventures. In these capacities he broadened his experience in the
areas of general management, strategic planning and
finance. Mr. Izzo is a well-known leader within
the utility industry, as well as the public policy
arena. He is frequently asked to testify before Congress and speak to organizations on matters pertaining to national energy policy.
Mr. Izzo’s career began as a research scientist at the
Princeton Plasma Physics Laboratory, performing
numerical simulations of fusion energy
experiments. He has published or presented over 35 papers
on magnetohydrodynamic
modeling. Mr. Izzo received his Bachelor of
Science and Master of Science degrees in mechanical engineering
and his Doctor of Philosophy degree in applied
physics from Columbia University. He also
received a Master of Business Administration degree, with a concentration in finance from the Rutgers Graduate School of
Management. He is listed in numerous editions of Who’s Who
and has been the recipient of national
fellowships and awards. Mr. Izzo has
received honorary degrees from the New Jersey Institute of
Technology (Doctor of Science), Thomas Edison
State University (Doctor of Humane Letters),
Bloomfield College (Doctor of Humane Letters), Rutgers University (Doctor of Humane Letters), and Raritan Valley Community
College (Associate of Science).
Mr. Izzo serves as nominating committee chairman of the New
Jersey Chamber of Commerce, and is on the board
of directors for the New Jersey Utilities
Association, the Edison Electric Institute (EEI), and the Nuclear Energy Institute (NEI). He is also a member of the Board of
Trustees of Peddie School, Columbia University School of
Engineering Board of Visitors and the Princeton
University Andlinger Center for Energy
and the Environment Advisory Council, as well as
a member of the Visiting Committee for the
Department of Nuclear Engineering at MIT. Mr. Izzo is a former member of the board of directors of The Williams Companies. In
addition, he is a former chair of the Rutgers University Board
of Governors and the New Jersey Chamber of
Commerce. |
 106 EXECUTIVE VICE PRESIDENT AND GENERAL COUNSEL PUBLIC SERVICE ENTERPRISE GROUP INCORPORATED, PUBLIC SERVICE
ELECTRIC AND GAS COMPANY, PSEG POWER, PSEG SERVICES
CORPORATION Tamara L. Linde
Tamara Linde was named executive vice president and general
counsel for Public Service Enterprise Group
Incorporated (PSEG) in July 2014. She is also the
executive vice president and general counsel of Public Service Electric and Gas Company (PSE&G), PSEG Power and PSEG
Services Corporation.
As PSEG’s chief legal officer, Ms. Linde has responsibility
for all legal and regulatory functions, and has
general supervisory responsibilities for the
office of corporate secretary, business assurance and resilience
and federal affairs and sustainability. Ms. Linde
is a member of PSEG’s Executive Officer
Group. Previously
Ms.
Linde
was
vice
president
–
regulatory,
PSEG.
She
has
led
the company’s federal and state regulatory functions, as
well as managed corporate, environmental and
labor/employment practices within the company. Ms.
Linde has served as regulatory counsel on many of
the company’s most important initiatives in recent years. Ms. Linde joined the law department of Public Service Electric and Gas
Company (PSE&G), as an attorney in 1990 handling a variety
of natural gas and electric regulatory and
transactional matters. After holding several
other legal positions at PSE&G she became general solicitor, in 2000. In that position she was responsible for the regulatory affairs of
the PSEG companies including electric, gas and nuclear
matters. She has had significant experience
working on regulatory matters before various
state and federal regulatory agencies on industry issues relating to electric transmission and distribution and energy markets.
Ms. Linde is a member of the New Jersey, New York, District of
Columbia and Texas bars. She currently serves on
the Board of the PSEG Foundation, the Community
Foundation of New Jersey and the Mater Dei Prep
High School Board. In addition, Ms. Linde is a member of the General Counsel Steering Committee of the National Association of
Corporate Directors (NACD). She is past President of the
Northeast Chapter of the Energy Bar Association
and served as chair of the Energy Bar Association
Electricity Regulation and Compliance Committee. Ms. Linde graduated from Seton Hall University School of Law with a Juris
Doctorate and from Seton Hall University with a bachelor’s
degree. |
 107 Ralph A. LaRossa PRESIDENT AND CHIEF OPERATING OFFICER PUBLIC SERVICE ELECTRIC AND GAS COMPANY Ralph A. LaRossa was named president and chief operating officer
of Public Service Electric and Gas Company (PSE&G) in
October 2006. PSE&G is New Jersey’s
oldest and largest regulated gas and electric
delivery utility, serving approximately 2.4 million customers, nearly three-quarters of the state’s population. Prior to this position
he
was
vice
president
-
electric
delivery
for
PSE&G.
In addition, on January 1, 2014, Mr. LaRossa became Chairman of
the Board of PSEG Long Island, a subsidiary of
Public Service Enterprise Group (PSEG), which
manages the electric transmission and distribution
systems on Long Island and in the Rockaways.
PSEG Long Island serves 1.1 million customers.
Mr. LaRossa joined PSE&G in 1985 as an
associate engineer and advanced through a variety
of management positions in the utility’s gas
and electric operations. In 1998, he received Gas Industry Magazine’s Outstanding Manager of the Year Award.
He is a graduate of Stevens Institute of Technology and has
completed the Harvard Business School’s
Program for Management Development.
Mr. LaRossa is Chairman of Choose New Jersey, Inc. and serves
on its board of directors. In addition, he is a
member of the board of directors for the New
Jersey Utilities Association (NJUA), New Jersey
Performing Arts Center (NJPAC) and Montclair State University,
for which he is past chair of the university. Mr.
LaRossa is also the immediate past chair of the
American Gas Association (AGA). |
 108 William Levis PRESIDENT AND CHIEF OPERATING OFFICER PSEG POWER William Levis is president and chief operating officer of PSEG Power, a
position he’s held since June 2007. PSEG Power is a
major, unregulated independent power producer in
the U.S. with four main subsidiaries: PSEG
Nuclear, PSEG Fossil, PSEG Energy Resources and Trade (ER&T)
and PSEG Power Ventures.
PSEG Power operates one of the most balanced portfolios in the
country, both in terms of fuel mix and market
segment (based load units, load following units
and peaking units). Its low-cost, load following fleet is geographically well positioned in competitive markets. Its 11,681 MWs
represent a diverse fuel mix with different plant
types. Before coming to PSEG, Mr. Levis was Exelon
Nuclear’s vice-president
– Mid-Atlantic operations. Prior to
joining Exelon, Mr. Levis worked at Ontario
Hydro’s Pickering Plant and held several positions over a
five-year period with Carolina Power and
Light’s Brunswick facility. Mr. Levis has a
Bachelor of Science degree in marine engineering from the U.S. Naval Academy and holds an SRO (senior reactor operator)
certification. He retired as a commander in the Naval
Reserves and attained his professional engineer
license in 1985. Mr. Levis is a member of the
Executive Committee of Nuclear Energy
Institute’s (NEI) Board of Directors, the Nuclear Electric
Insurance Limited (NEIL) Board of Directors, and
serves as a member of the Institute of Nuclear
Power Operations (INPO) National Nuclear Accrediting Board. He is a member of the Philadelphia Archdiocese Catholic Charities Appeals
Board and is a member of the CEO Council for Growth based in
Philadelphia.
. |
 109 EXECUTIVE VICE PRESIDENT AND CHIEF FINANCIAL OFFICER PUBLIC SERVICE ENTERPRISE GROUP INCORPORATED, PUBLIC SERVICE ELECTRIC
AND GAS COMPANY, PSEG POWER LLC AND PSEG SERVICES CORPORATION
Daniel Cregg
Daniel J. Cregg was named executive vice president and chief financial officer
for Public Service Enterprise Group Incorporated (PSEG) and its
subsidiaries in October 2015.
Mr. Cregg is responsible for all financial functions, including Internal Audit
Services, Investor Relations and Corporate Development. Given the array
of financial instruments which serve as the primary means of selling
wholesale energy to customers, Mr. Cregg also has responsibility for the
Risk Management function, which provides independent oversight of the
PSEG Power trading organization. In addition to finance, Mr. Cregg
is responsible for the Strategy and Planning function. He is a
member of PSEG’s Executive Officer Group.
Prior to his current position, Mr. Cregg was vice president – finance for PSE&G, a role he assumed in June 2013. In 2006, Mr. Cregg was named vice president – finance for PSEG Power. In that capacity and in previous financial roles for Power, Mr. Cregg held leadership positions related to financial reporting and forecasting, investor communications, financings, rating agency interactions, external reporting, cash forecasting, financial valuations, competitive intelligence, and fundamental market modeling, with critical responsibilities in Power’s development and strategic planning activities.
Previously, Mr. Cregg was director of PSEG corporate development. He
joined PSEG in 1991 with overall responsibility for tax planning,
strategy and compliance for PSEG Energy Holdings, including domestic and
international tax structuring work for PSEG Global and PSEG
Resources. Before joining PSEG, Mr. Cregg spent five years with
the accounting and consulting firm of Deloitte and Touche, providing
consulting services to a wide range of clients with an emphasis on the
energy industry. Mr. Cregg holds a Master of Business Administration
degree from the Wharton School of the University of Pennsylvania and is
a graduate of Lehigh University, where he received a bachelor’s
degree in accounting. |
 110 Derek M. Di Risio PRESIDENT PSEG SERVICES CORPORATION Derek M. Di Risio was named President, PSEG Services Corporation, in
July 2014. He is responsible for the coordination and
delivery of several centralized services currently
residing within PSEG Services Corporation
including corporate communications, corporate citizenship,
corporate real estate, information technology,
procurement, payroll and other transactional
services. Prior to his current role, Mr. Di Risio
was vice president and controller of Public
Service Enterprise Group (PSEG), Public Service Electric and Gas Company (PSE&G), PSEG Services Corporation, PSEG Energy Holdings
(Holdings) and PSEG Power, a position he assumed in December
2006. He was previously vice president and
assistant controller, since July 2004. Mr.
Di Risio had been vice president – planning
and analysis of Holdings since March 2004, and
vice president – controller for Holdings
since July 1998. Prior to that he was
director – accounting services and
responsible for several accounting and planning
functions for Holdings, including overall
coordination of the business planning process, accounting research and policy development, financial forecasts and analysis.
Mr. Di Risio was also responsible for the budgeting, analysis
and reporting process for PSE&G.
Mr. Di Risio joined PSE&G in September 1991 and has held a
variety of positions, including assignments with
the internal auditing, electric business, and
corporate planning departments. He was instrumental in reengineering the Enterprise business planning process, and advancing
the use of performance metrics and balanced scorecard measures
to improve business results. Prior to joining
PSE&G he worked for several firms, including
Chase Manhattan Bank. Mr. Di Risio graduated from
Rutgers University with a degree in
accounting/computer science, and received a Master of Business
Administration degree from the same
university. He is a certified public
accountant (inactive). Mr. Di Risio also completed the
Program for Management Development at the
Graduate School of Business Administration of
Harvard University. He serves on the Drumthwacket Foundation Board of Trustees, the Board of the Military Park Partnership
and is currently a co-chairman of the Board of Directors of
the New Jersey All Stars Project Inc. In
addition, Mr. Di Risio previously served on the
Drew University Board of Trustees.
|
 111 Shahid Malik PRESIDENT PSEG ENERGY RESOURCES & TRADE Shahid Malik was appointed President of PSEG Energy Resources & Trade
(ER&T) in 2011. PSEG operates one of the most balanced
generation and marketing portfolios in the
country, both in terms of fuel mix and market
segment (base load units, load following units and peaking
units), and Mr. Malik is essentially responsible
for managing these assets and taking them to
market. He oversees PSEG’s generation portfolio and the purchase, sale and risk management of all energy commodities. He is also
responsible for Business Development of new power generation
projects. Mr. Malik has an extensive background in
the energy industry across the oil, gas, electric
and renewable energy sectors in Europe and the United States. Previously, he was with Pittiglio, Rabin, Todd & McGrath (PRTM) in
Pittsburgh, PA and was responsible for all aspects of the global
energy business, with a primary focus on the North
American utility sector. Prior to that he
served as President & CEO of Strategic Energy, Great Plains Energy’s retail marketing subsidiary and a provider of energy and services
to business clients in North America. He was accountable
for the company’s strategy and operations
and led a successful turnaround of the company,
achieving significant growth in products and services while reducing costs. Mr. Malik’s career has included Executive Leadership positions with several
energy companies in the US and Europe. In addition, he served
on the Board of Directors of South Jersey
Industries (NYSE: SJI) immediately prior to
joining PSEG. Mr. Malik has been in the energy
business for more than 20 years, since receiving
his Economics degree from Manchester University in England and an MBA from Rice University, Houston. He sits on the Executive Committee
of the Board of Trustees of Newark Museum.
111 |
 112 Margaret M. Pego, SPHR SENIOR VICE PRESIDENT – HUMAN RESOURCES AND CHIEF HUMAN RESOURCES OFFICER PSEG SERVICES CORPORATION Margaret M. Pego was named senior vice president – human resources and chief human resources officer of PSEG Services Corporation in
December 2006. Prior, she had been vice president
– human
resources. Ms. Pego joined PSEG in 1974, and has held a
variety of management positions in the human
resources department. Ms. Pego holds a Bachelor of
Arts degree in business administration from
William Paterson College, and a Master of Business
Administration degree with a concentration in management and
labor relations from Seton Hall University. In
addition, she holds a certificate in EEO studies
from Cornell University, and has completed the Human
Resources Executive Program at the University of Michigan. She
is also certified as a senior professional in
human resources. Ms. Pego was named one of
2013’s HR Top 10 Breakaway Leaders by Evanta,
a leading organization that fosters leadership development and collaborative exchange among North America’s top executives.
Ms. Pego is active in several local and national organizations,
including the EEI Chief HR Executive Advisory
Committee; the American Gas Association HR Policy
Committee; the Conference Board Advisory Council
of HR Management – Council of HR Executives;
and the Society for Human Resources
Management. In addition, she is immediate past chair of the Children’s Specialized Hospital Board, a former member of
the Children’s Specialized Hospital Foundation Board and
RWJ Health Care Corporation Board. She is
the former Chair of the Center for Energy
Workforce Development (CEWD) Executive Council and is currently a board member. She is a former member of the Supreme
Court of New Jersey Attorney Ethics Committee. Ms. Pego is a
2002 Leadership New Jersey fellow, 1997 TWIN
Honoree, 2006 Executive Woman of New Jersey
Honoree and 2008 NJ Best 50 Women in Business
Honoree. |
 113 Peter P. Sena III Peter P. Sena III was named president of PSEG Nuclear (Nuclear) in February 2016 and Chief Nuclear Officer in July 2016. Most recently, he was Senior Vice President of Operations, Chief Operating Officer at NextEra Energy. Mr. Sena was named Chief Nuclear Officer of First Energy in 2012, having held a variety of leadership roles at First Energy nuclear operations spanning 15 years. Mr. Sena joined First Energy in 1996 as a control room supervisor and obtained his first SRO license at Beaver Valley Power Station Unit 2. His second SRO license was obtained in 1999 for Beaver Valley Unit 1. Following a rotational assignment with the Institute of Nuclear Power Operations, Mr. Sena was named the Operations Manager and helped lead the station to the “Most Improved Plant” Award in 2003. In 2005, he was named the Director of Engineering and the station completed the first extended power uprate for a Westinghouse 3 Loop Pressurized Water Reactor. As the Site Vice President of Beaver Valley, Mr. Sena led the station to its first INPO Excellence Award in 2009. The Davis Besse Nuclear Power Plant returned to the Excellence category under Mr. Sena’s watch as the Chief Operating Officer in 2011. Prior to joining FirstEnergy, Mr. Sena was employed by the Nuclear Regulatory Commission as a resident inspector in Region 1. Mr. Sena’s nuclear training began as an officer with the US Naval Nuclear Propulsion program and he served on board a ballistic missile submarine during the Cold War. Mr. Sena earned a Bachelor of Science degree with high honors in Fuel Science from the Pennsylvania State University in 1985. He currently serves on the advisory board for the Penn State Nuclear Engineering Program and is a member of EPRI’s research advisory committee. He currently serves on the Auburn University’s Advisory Board. In addition, he has recently served on the INPO Executive Advisory Committee and the Nuclear Energy Institute (NEI) Nuclear Strategic Issues Advisory Committee where he was the Industry Executive Sponsor of the NEI post Fukushima flooding response initiative. PRESIDENT & CHIEF NUCLEAR OFFICER PSEG NUCLEAR |
 Reconciliation of Non-GAAP Operating Earnings PLEASE SEE PAGE 3 FOR AN EXPLANATION OF PSEG’S USE OF OPERATING EARNINGS AS A NON-GAAP FINANCIAL MEASURE AND HOW
IT DIFFERS FROM NET INCOME.
2016 2015 2014 2013 2012 Net Income (Loss) 887 $ 1,679 $ 1,518 $ 1,243 $ 1,275 $ (Gain) Loss on Nuclear Decommissioning Trust (NDT) Fund Related Activity, pre-tax (PSEG Power) (5) (24) (138) (86) (104) (Gain) Loss on Mark-to-Market (MTM), pre-tax (a) (PSEG Power) 168 (157) (111) 125 18 Storm O&M, net of insurance recoveries, pre-tax (PSEG Power)
- (172) 27 54 66 Hudson/Mercer Early Retirement, pre-tax (PSEG Power)
669 - - - - Lease Related Activity, pre-tax (PSEG Enterprise/Other)
147 - - - (61) Income Taxes related to Operating Earnings (non-GAAP) reconciling items (b) (391) 150 104 (27) 42 Operating Earnings (non-GAAP)
1,475 $ 1,476 $ 1,400 $ 1,309 $ 1,236 $ Fully Diluted Average Shares Outstanding (in millions) 508 508 508 508 507 Net Income (Loss) 1.75 $ 3.30 $ 2.99 $ 2.45 $ 2.51 $ (Gain) Loss on NDT Fund Related Activity, pre-tax (PSEG Power) (0.01) (0.05) (0.27) (0.17) (0.21) (Gain) Loss on MTM, pre-tax (a) (PSEG Power) 0.33 (0.31) (0.22) 0.25 0.04 Storm O&M, net of insurance recoveries, pre-tax (PSEG Power) - (0.34) 0.05 0.11 0.13 Hudson/Mercer Early Retirement, pre-tax (PSEG Power) 1.32 - - - - Lease Related Activity, pre-tax (PSEG Enterprise/Other) 0.29 - - - (0.12) Income Taxes related to Operating Earnings (non-GAAP) reconciling items (b) (0.78) 0.31 0.21 (0.06) 0.09 Operating Earnings (non-GAAP) 2.90 $ 2.91 $ 2.76 $ 2.58 $ 2.44 $ (a) Includes the financial impact from positions with forward delivery months. Reconciling Items Year Ended December 31, ($ millions, Unaudited) ($ Per Share Impact - Diluted, Unaudited) (b) Income tax effect calculated at 40.85% statutory rate, except for lease related activity which is calculated at a combined leveraged lease
effective tax rate and NDT related activity which is calculated at the
40.85% statutory rate plus a 20% tax on income (losses) from qualified NDT funds. Public Service Enterprise Group Incorporated -- Consolidated Operating Earnings (non-GAAP) Reconciliation
A |
 PLEASE SEE PAGE 3 FOR AN EXPLANATION OF PSEG’S USE OF OPERATING EARNINGS AS A NON-GAAP FINANCIAL MEASURE AND HOW
IT DIFFERS FROM NET INCOME.
B Reconciliation of non-GAAP Operating Earnings for PSEG
Power and Enterprise/Other
2016 2015 2014 2013 2012 Net Income (Loss) 18 $ 856 $ 760 $ 644 $ 666 $ (Gain) Loss on Nuclear Decommissioning Trust (NDT) Fund Related Activity, pre-tax (PSEG Power) (5) (24) (138) (86) (104) (Gain) Loss on Mark-to-Market (MTM), pre-tax (a) (PSEG Power) 168 (157) (111) 125 18 Storm O&M, net of insurance recoveries, pre-tax (PSEG Power) - (172) 27 54 66 Hudson/Mercer Early Retirement, pre-tax (PSEG Power) 669 - - - - Income Taxes related to Operating Earnings (non-GAAP) reconciling items (b) (336) 150 104 (27) 17 Operating Earnings (non-GAAP) 514 $ 653 $ 642 $ 710 $ 663 $ PSEG Fully Diluted Average Shares Outstanding (in millions) 508 508 508 508 507 (a) Includes the financial impact from positions with forward delivery months. 2016 2015 2014 2013 2012 Net Income (Loss) (20) $ 36 $ 33 $ (13) $ 81 $ Lease Related Activity, pre-tax (PSEG Enterprise/Other) 147 - - - (61) Income Taxes related to Operating Earnings (non-GAAP) reconciling items (a) (55) - - - 25 Operating Earnings (non-GAAP) 72 $ 36 $ 33 $ (13) $ 45 $ PSEG Fully Diluted Average Shares Outstanding (in millions) 508 508 508 508 507 (a) Income tax effect calculated at a combined leveraged lease effective tax rate.
Reconciling Items Year Ended December 31, ($ millions, Unaudited) PSEG Power Reconciliation PSEG Enterprise/Other Reconciliation (b) Income tax effect calculated at 40.85% statutory rate, except for NDT related activity which is calculated at the 40.85% statutory rate plus a
20% tax on income (losses) from qualified NDT funds.
Reconciling Items Year Ended December 31, ($ millions, Unaudited) |