Attached files
| file | filename |
|---|---|
| EX-99.4 - EXHIBIT 99.4 - New Enterprise Stone & Lime Co., Inc. | exhibit994pressreleaseoffe.htm |
| EX-99.3 - EXHIBIT 99.3 - New Enterprise Stone & Lime Co., Inc. | exhibit993pressreleaseforc.htm |
| EX-99.2 - EXHIBIT 99.2 - New Enterprise Stone & Lime Co., Inc. | exhibit992additionalselect.htm |
| EX-10.1 - EXHIBIT 10.1 - New Enterprise Stone & Lime Co., Inc. | exhibit101amendmentno1toth.htm |
| 8-K - 8-K - NESL PRESS RELESE OFFERING - New Enterprise Stone & Lime Co., Inc. | a8-kpressrelease.htm |
Exhibit 99.1
Disclosure in Connection with the Distribution of the
Offering Circular
OFFERING CIRCULAR SUMMARY
The following summary should be read in conjunction with, and is qualified in its entirety by, the more detailed information and financial statements and related notes included in this offering circular. You should carefully read this offering circular, including the section entitled “Risk Factors” and our audited and consolidated financial statements and related notes included elsewhere in this offering circular.
Unless otherwise indicated or the context otherwise requires, references in this offering circular to “NESL,” “the Company,” “we,” “us” and “our” refer to New Enterprise Stone & Lime Co., Inc. and its subsidiaries.
Our Company
We are a leading privately held, vertically integrated construction materials supplier and heavy/highway construction contractor in Pennsylvania and western New York and a national traffic safety services and equipment provider. Founded in 1924, we are one of the top 20 crushed stone producers based on tonnage of crushed stone produced in the United States, according to industry surveys.
We operate in three segments based upon the nature of our products and services: construction materials, heavy/highway construction and traffic safety services and equipment. Our construction materials operations are comprised of: aggregate production, including crushed stone and construction sand and gravel; hot mix asphalt production; and ready mixed concrete production. Our heavy/highway construction segment includes heavy construction, blacktop paving and other site preparation services. Our heavy/highway construction operations are primarily supplied with construction materials from our construction materials operation. Our third business segment, traffic safety services and equipment, consists primarily of sales of work zone safety equipment and devices primarily to distributors to industrial construction end‑users.
We operate primarily in Pennsylvania and western New York, except for our traffic safety services and equipment business, which sells our traffic safety products nationally.
Our revenue is derived from sales to customers that serve multiple end‑use markets. The diversity of our construction materials and services offerings and our local market knowledge enables us to simultaneously meet the wide ranging requirements of, and efficiently distribute to, our customer base. We may not always know the end use for our materials due to the diversity of our product offerings and the fact that our customers serve various end use markets, such as public or private sector. However, we believe based upon assumptions and knowledge of our customers and the possible end‑use of particular materials and services, that in the fiscal year ended February 29, 2016 approximately 50% to 55% of our revenue was derived from public sector end‑use markets with the balance of our revenue derived from private sector end‑use markets, with approximately three‑fourths of our private sector revenue from non‑residential construction.
Through four generations of family management, we have grown both organically and by acquisitions and operate, own or lease, 57 quarries and sand deposits (44 active), 30 hot mix asphalt plants, 19 fixed and portable ready mixed concrete plants, three lime distribution centers and three construction supply centers. Our traffic safety services and equipment business operates three manufacturing facilities. We believe our extensive operating history and industry expertise, combined with strategically located operations and substantial aggregate reserves throughout Pennsylvania and western New York, positions us to be a low‑cost supplier that is able to respond quickly to customer needs and benefit from favorable macro and local trends.
For the last twelve months ended November 30, 2016, we generated revenue of $604.1 million, Adjusted EBITDA of $121.0 million and Further Adjusted EBITDA of $125.4 million. See “Summary Historical Consolidated Financial and Other Data” for a reconciliation of EBITDA, Adjusted EBITDA and Further Adjusted EBITDA, in each case to net (loss) income.
Our Markets
Our vertically integrated construction materials and heavy/highway construction businesses operate in competitive regional markets. Many of our contracts are awarded based on a “sealed bid” process, which dictates that the lowest price bidder must be chosen. This dynamic allows major, national suppliers and smaller, local operators to compete with one another on new business. We believe that our extensive operational footprint and local market knowledge allow us to bid effectively on jobs, to obtain a unique understanding of our customers’ evolving needs and, most critically, to maintain favorable positions in the markets for our products and services, enabling us to submit lower price bids without sacrificing profitability.
Our strategically located construction materials operations span across Pennsylvania and western New York. We also provide heavy/highway construction services, primarily in Pennsylvania and, to a lesser degree, into Maryland, West Virginia and Virginia. We operate traffic safety equipment manufacturing facilities and sell these products throughout the United States and we provide and maintain technology‑based traffic safety equipment throughout the United States.
Our Competitive Strengths
The following characteristics provide us with competitive advantages relative to others that operate in our markets. While our competitors may possess one or more of these strengths, we believe we are a leader in our markets because of our full complement of these attributes. Our strengths include:
Leading Market Positions
We are one of the top 20 crushed stone producers based on tonnage of crushed stone produced in the United States, according to a national industry survey published by Aggregates Managers. Our leading market positions are driven by our regionally focused operational footprint and extensive experience, which facilitates efficient, low‑cost product delivery and responsiveness to customer demands, which are essential to maintaining existing customers and securing new business.
Vertically Integrated Business Model
We generate revenue across a spectrum of related products and services. We mine our quarries to extract aggregates that we use to produce ready mixed concrete and hot mix asphalt materials, which may serve customers of our heavy/highway construction business. We often operate as a single source provider of materials and construction capabilities, creating economic, convenience and reliability advantages for our customers, while at the same time creating significant cross‑marketing opportunities among our interrelated businesses. Our vertically integrated delivery model, combined with the breadth of our construction materials offerings, enhances our competitive position as a construction materials supplier and as a bidder on complex multi‑discipline construction projects. In instances where we do not win a local construction contract, for example, we often serve as a subcontractor or significant supplier to the winning bidder, creating additional revenue opportunities.
Favorable Market Fundamentals
We work extensively for PennDOT and other governmental entities within Pennsylvania which are responsible for the Commonwealth’s roads and highways. Pennsylvania’s diversified economy is heavily reliant on the Commonwealth’s approximately 120,000 miles of interstate, state and local roads, and approximately 32,000 Commonwealth and local bridges. Pennsylvania has the nation’s fifteenth largest gross state product and the nation’s eleventh largest road network, which serves as a critical highway transportation route connecting Midwestern manufacturing centers and the eastern consumer markets. The Pennsylvania State Transportation Advisory Committee, in its most recent study, identified over $3.5 billion of annual unmet state and local highway and bridge funding needs in excess of currently available funding levels. We believe our construction materials locations, understanding of various specifications, project management and skilled labor position us to take advantage of these favorable dynamics and provide competitive bids on most public sector projects in Pennsylvania.
Substantial Reserve Base
We estimate that we currently own or have under lease approximately 2.0 billion tons of permitted proven recoverable and probable recoverable aggregate reserves with an estimated useful life of approximately 127 years at current production levels.
High Barriers to Entry
We benefit from barriers to entry that affects both potential new market entrants and existing competitors operating within or near our markets. The high weight‑to‑value ratio of aggregates and concrete products and the time in which hot mix asphalt and ready mixed concrete begin to set limit the efficient distribution range for these products to roughly a one‑hour haul time. Our regionally focused operational footprint allows us to maintain lower transportation costs and compete effectively against large and small players in our local markets.
Quarry and construction operations are inherently asset intensive and require significant investments in land, high‑cost equipment and machinery, resulting in significant start‑up costs for a new business. We own most of the equipment and machinery used at our facilities, creating an advantage over potential market entrants. The complex regulatory environment and time‑consuming permitting process, especially for opening new quarries, add further start‑up costs and uncertainty for new market entrants.
The complex regulatory environment and time‑consuming permitting process, especially for opening quarries, and further start‑up costs and uncertainty for new market entrants. We have historically been successful at extending the permit boundaries at our existing quarries.
Experienced and Dedicated Management Team
Our senior management team includes certain third and fourth generation members of the Company’s founding family, the Detwiler family, who have spent a significant portion of their professional careers in the aggregate and heavy construction businesses and are complemented and supported by highly trained and experienced senior managers who came to the Company through various acquisitions and internal advancement. Accordingly, we believe our management team has served and will continue to serve a critical role in our growth and profitability. Management remains dedicated to continuing to develop our operations and executing our business strategy as we continue to grow the business. Members of the Detwiler family, who control all of the voting equity of New Enterprise, have demonstrated a commitment to continued reinvestment in the Company. With the exception of certain tax‑related dividends, we have not issued a dividend to any of our equity holders in over 20 years.
Our Business Strategy
We are focused on growing our sales, profitability and cash flow and strengthening our balance sheet by capitalizing on our competitive strengths and reinvesting in our core businesses. Key elements of our business strategy include:
Leverage Our Vertically Integrated Business Model
We generate revenue across a spectrum of related products and services, many of which comprise a vertically integrated business that provides both raw materials and construction services. By maintaining both production and cost control over the supply chain, we believe we are better able to serve our customers and be a low‑cost supplier. We intend to leverage this vertical integration to continue to minimize our costs, improve our customer service and win new business and projects to increase our profitability.
Maintain a Competitive Position in Our Markets
We believe that our vertically integrated model, including our network of operational facilities, as well as our tightly managed costs, project management, safety and educational training, technological improvements and value engineering focus are key to maintaining our competitive position. We are competitive in the areas we serve due to our extensive network of quarries and related operations that facilitate efficient distribution throughout our geographical market area. We continuously work to exploit new technologies, such as implementing improved global positioning systems to monitor truck delivery activity and increase precision in construction projects. These technological improvements, coupled with our comprehensive employee training program and health and safety training programs and policies, allow us to make optimal use of our employees and equipment, operate safely and lower our insurance claims. Our extensive operating experience allows us to identify value engineering opportunities on certain projects, and propose enhancements to project specifications which we believe will ultimately save our customers money and enhance our profitability. The mechanics of the “sealed bid” process that govern many of our contract awards require that we submit a bid that is low enough to win the business, but also includes a margin sufficient to maintain profitability. We will continue to manage our business aggressively to minimize costs to ensure that we are positioned to continue to win competitive, profitable new business in our markets.
Capitalize on Our Strategically Located Operations to Expand Market Share
We believe our existing operational footprint places us in proximity to some of the strongest market opportunities in the mid‑Atlantic and western New York regions. Our proximity to areas of high construction activity, including the extensive Pennsylvania and western New York road networks and the Pennsylvania coal and gas industries, creates attractive revenue opportunities for which we are particularly well positioned relative to both major, national and smaller, local competitors. We believe our strategically situated construction materials locations create an inherent competitive advantage for us in our markets. We intend to continue to capitalize on these advantages to increase revenue and drive profitability. In those instances where our construction materials locations do not create an inherent competitive advantage, we remain competitive through our local knowledge of required specifications and industry expertise.
Drive Profitable Growth Through Reinvestment and Strategic Acquisitions
Through over 90 years of operations, we have developed significant experience and expertise in identifying and executing new growth opportunities. We expect to enhance our overall competitive position and customer base by reinvesting in our business. In the past, we have made acquisitions to strengthen our existing locations, expand our operations, grow our reserves and grow our market share. In February 2017, we completed the acquisition of the assets of Berks Products Corporation and EJB Paving & Materials Co. See “Recent Developments” below for a more detailed discussion of these recent acquisitions. We believe that the relative fragmentation of our industry creates an environment in which we can make additional acquisitions at attractive valuations and increase scale and diversity over time within or adjacent to our existing markets. We expect to opportunistically pursue selective acquisitions in contiguous locations and geographic markets or other business arrangements we believe will help our company.
Our Industry
Our core construction materials and heavy/highway construction businesses and our traffic safety services and equipment business are organized to deliver customers products and services from several interrelated industry sectors:
aggregates;
hot mix asphalt;
ready mixed concrete;
heavy/highway construction; and
traffic safety services and equipment.
Competitors in these industries range from small, privately held firms that produce a single product, to multinational corporations that offer a comprehensive suite of construction materials and services, including design, engineering, construction and installation. However, day‑to‑day execution for construction materials for all competitors remains local or regional in nature because of value‑to‑weight ratios which limit the distance construction materials can be transported in a cost effective manner.
The Fixing America’s Surface Transportation Act, which we refer to as the FAST Act, released December 1, 2015, by the conference committee appointed to reconcile the different surface transportation reauthorization bills passed by the House and Senate, reauthorized federal highway and public transportation programs and stabilize the Highway Trust Fund for fiscal years 2016‑2020. The FAST Act will provide stability as it relates to funding and should allow states to let an increased number of multi‑year projects.
The FAST Act will provide $207.4 billion of funding to be apportioned to the states by formula. Transit capital investment grants will remain at $2.3 billion through 2020. Meaningful impact from the FAST Act is expected in fiscal year 2018.Allocations for Pennsylvania and New York for 2017 are estimated to be $1.7 billion for each state.
The FAST Act provides spending authorizations, which represent the maximum financial obligation that will result from the immediate or future outlays of federal funds for highway and transit programs. The federal government’s surface transportation programs are financed mostly through the receipts of highway user taxes placed in the Highway Trust Fund, which is divided into the Highway Account and the Mass Transit Account. Revenues credited to the Highway Trust Fund are primarily derived from a federal gas tax, a federal tax on certain other motor fuels and interest on the accounts’ accumulated
balances. Moving Ahead for Progress, or MAP‑21 extended federal motor fuel taxes and heavy vehicle use taxes through September 30, 2023. Of the currently imposed federal gas tax of $0.184 per gallon, which has been static since 1993, $0.15 is allocated to the Highway Account of the Highway Trust Fund.
In addition to federal funding, highway construction and maintenance funding is also available through state agencies. In Pennsylvania, new highway and bridge construction and maintenance is coordinated by PennDOT. During its fiscal year ended June 30, 2016, PennDOT spent approximately $7.3 billion on transportation projects and administration. Typically the federal government funds a portion of PennDOT’s annual budget, while Pennsylvania funds the balance through the Motor License Fund, which we refer to as MLF. MLF funds are mandated per the state constitution to fund expenditures on highways and bridges and may not be reallocated to other state funding needs in the annual budgeting process. The Pennsylvania Turnpike Commission has a budget that is currently separate from PennDOT. The Pennsylvania Turnpike Commission’s Ten‑Year Capital Plan for the fiscal year ending May 31, 2017 is $5.8 billion, approximately 81% of the amount is allocated to the cost of resurfacing, replacing or reconstructing the existing turnpike system.
In 2013, Governor Tom Corbett signed into law Act 89, also known as the Transportation Bill, which we believe is one of the most significant transportation funding packages the Commonwealth of Pennsylvania has enacted in recent times. In summary, the Transportation Bill provides an additional $2.3 billion per year by fiscal year 2017/2018, for the Commonwealth’s highway, bridge, public transit and local government’s infrastructure. By 2018, the Transportation Bill will enable the Commonwealth to generate an additional $1.3 billion a year to be used for state road and bridge improvement projects, in addition to the $1.5 billion of federal funding that it provides.
PennDOT and the Pennsylvania Turnpike Commission have historically provided consistent demand for construction materials and projects in our markets. In addition, we also bid on purchase order contracts for hot mix asphalt and aggregates supplied directly to PennDOT maintenance districts and municipalities.
Construction Materials
Aggregates
The aggregates industry generated over $13.8 billion in sales through the production and shipment of 1.3 billion metric tons in 2015 in the United States, according to the United States Geological Survey, which we refer to as USGS. Aggregates include materials such as gravel, crushed stone, limestone and sand, which are primarily incorporated into construction materials, such as hot mix asphalt, cement and ready mixed concrete. Aggregates are also used for various applications and products, such as railroad ballast, filtration, roofing granules and in solutions for snow and ice control. The U.S. aggregate industry is highly fragmented with numerous participants operating in localized markets. The USGS reported that a total of 1,430 companies operating 3,700 quarries and 82 underground mines produced or sold crushed stone valued at $13.8 billion in 2015 in the United States.
Hot Mix Asphalt
Hot mix asphalt is the most commonly utilized pavement surface. Hot mix asphalt is produced by mixing asphalt cement and aggregate. The asphalt cement is heated to increase its viscosity and the aggregate is dried to remove moisture from it prior to mixing. Paving and compaction must be performed while the asphalt is sufficiently hot, typically within a one‑hour haul from the production facility. In many parts of the country, including the market in which we operate, paving is generally not performed in the winter months because of cold temperatures. The United States has approximately 3,500 asphalt plants in operation. Each year, these plants produce 500 million tons of asphalt pavement material worth in excess of $30 billion.
Ready Mixed Concrete
Demand for ready mixed concrete is driven by its highly versatile end use applications. The ready mixed concrete industry generates approximately $35 billion of revenues annually, according to the National Ready Mixed Concrete Association. Ready mixed concrete is created through the combination of coarse and fine aggregates with water, various chemical admixtures and cement. Given the high weight‑to‑value ratio, delivery of ready mixed concrete is typically limited to a one‑hour haul from a production plant location and is further limited by a 90 - minute window in which newly mixed concrete must be poured to maintain quality and desired performance characteristics. Most industry participants produce ready mixed concrete in batch plants and use concrete mixer trucks to deliver the concrete to customers’ job sites. Ready mixed concrete, which is poured in place at a construction site, can compete with other precast concrete products and concrete masonry block products.
Heavy/Highway Construction
Heavy/highway construction businesses provide a broad range of transportation and site preparation construction services, including grading and drainage, building bridge structures and concrete and blacktop paving services. While we provide services for a range of projects from driveway construction to the construction of new interstate highways, our business is primarily focused on structures, road construction and maintenance and blacktop/concrete paving. We focus on contracts that maximize the pull through on construction materials. In general, the highway construction industry’s growth rate is directly related to federal and state transportation agencies’ funding of road, highway and bridge maintenance and construction. Pennsylvania Turnpike Commission and PennDOT spending on third‑party highway construction for 2017 is budgeted at approximately $3.2 billion.
We believe that we stand to benefit from the multi‑year federal investments of the FAST Act in our core Pennsylvania and western New York markets as municipal, state, and federal agencies represent our largest customer base. We believe we will also benefit from the renewed emphasis on investments in Pennsylvania’s transportation and highway systems provided by the Transportation Bill at the state level. Along with the rest of the country, Pennsylvania has increased its highway construction, but it has not kept pace with its growing investment needs.
With the 2013 enactment of the Transportation Bill there is reason to see increased lettings. Act 89, which will implement a $2.3 billion comprehensive transportation funding plan over the next five years, will result in PennDOT exceeding the $2 billion construction letting mark for years to come. The 2015 year end total was $2.549 billion. PennDOT reported at the annual meeting of the Associated Pennsylvania Constructors that 2017 lettings are expected to be $2.4 billion.
Traffic Safety Services and Equipment
The traffic safety services and equipment industry comprises companies that produce, sell and set up traffic safety services and equipment in the United States. Traffic safety products generally consist of portable products such as message boards, arrow boards and speed awareness monitors, as well as traffic cones, barrels and signs. Demand for traffic safety services and equipment is particularly sensitive to changes in activity in the highway construction end‑market. While significant challenges to the traffic safety services and equipment industry remain due to the recent economic downturn, we believe that the long‑term growth prospects for the industry are favorable, given increasingly stringent highway and workplace safety regulations and standards, in addition to an anticipated cyclical recovery in highway spending.
Recent Developments
Preliminary Results for Fiscal Year 2017
Although our results of operations for the fiscal year ended February 28, 2017 are not yet final, the following unaudited information reflects our preliminary expectations with respect to such results based on information currently available to management.
Based on the preliminary results, we estimate that net revenue will be within a range of $600 million to $610 million for fiscal year 2017, as compared to $651.9 million for fiscal year 2016.
We had approximately $7.5 million of borrowings outstanding on the Revolving Credit Facility with $47.9 million (after consideration of outstanding letters of credit) available as of February 28, 2017. While neither the Berks Acquisition nor the EJB Acquisition, each of which closed on February 10, 2017, will contribute significant revenue to fiscal year 2017 operating results as a result of both timing and seasonality, we nevertheless expect to have several cash and non‑cash adjustments to Adjusted EBITDA in fiscal year 2017 as a result of these acquisitions related to transaction expenses of approximately $1.5 million and fair value accounting standards. Excluding the impact of these acquisitions and the related adjustments, we expect that our Adjusted EBITDA for the fourth quarter of fiscal year 2017 will be substantially similar to the Adjusted EBITDA for the fourth quarter of fiscal year 2016. See footnote 1 to the table set forth in “Summary Historical Financial and Other Data” below for a description of the calculation of our historical Adjusted EBITDA and the reconciliation of our historical Adjusted EBITDA to net (loss) income. As a result of financing the Berks Acquisition and the EJB Acquisition with $40.8 million in cash, our net working capital declined by approximately $32.9 million in February 2017, net of $7.9 million in working capital received.
The preliminary financial information included in this Offering Circular reflects management’s estimates based solely upon information available to us as of the date of this submission and is the responsibility of management. The preliminary financial results presented above are not a comprehensive statement of our financial results for fiscal year 2017. In addition,
the preliminary financial results presented above have not been audited, reviewed, or compiled by our independent registered public accounting firm BDO USA, LLP. Accordingly, BDO USA, LLP does not express an opinion or any other form of assurance with respect thereto and assumes no responsibility for, and disclaims any association with, this information. The preliminary financial results presented above are subject to the completion of our financial closing procedures, which have not yet been completed. Our actual results for fiscal year 2017 are not available and may differ materially from these estimates. Therefore, you should not place undue reliance upon these preliminary financial results. For instance, during the course of the preparation of the respective financial statements and related notes, additional items that would require material adjustments to be made to the preliminary estimated financial results presented above may be identified. There can be no assurance that these estimates will be realized, and estimates are subject to risks and uncertainties, many of which are not within our control. Accordingly, the revenue, operating income, net income (loss) and Adjusted EBITDA for any particular period may not be indicative of future results. See “Disclosure Regarding Forward‑Looking Statements.”
Recent Acquisitions
On February 10, 2017, the Company acquired the core assets of Berks Products Corporation, which we refer to as Berks, consisting primarily of two aggregate plants, four ready mixed concrete plants and a construction supply center. On the same date, in a separate acquisition, the Company acquired the core assets of EJB Paving & Materials Co., which we refer to as EJB, consisting of two hot mix asphalt plants and a paving laydown business. We refer to these acquisitions as the Berks Acquisition and the EJB Acquisition, respectively. The facilities which we acquired in these acquisitions are situated between our existing Lehigh Valley and Lancaster locations, allowing us to expand our operating footprint and market scope into the Reading, Pennsylvania market.
The aggregate purchase price for the Berks Acquisition and the EJB Acquisition was approximately $46.3 million, net of a working capital adjustment, which we funded using existing cash and our Senior Secured Credit Facilities. We intend to leverage our new shared service center and the scalability of our infrastructure to seamlessly integrate the nine acquired facilities into the Company’s broader operations. We have commenced selling, producing and accounting for all from the newly acquired facilities and expect minimal additional selling, administrative and general expenses relating to these acquisitions, outside of the costs associated with maintaining a portion of the salesforce of the acquired businesses.
Sale of Protection Services Business
On October 31, 2016, the Company and its wholly‑owned subsidiary Protection Services Inc., which we refer to as PSI, entered into an Asset Purchase Agreement with Roadsafe Traffic Systems, Inc., which we refer to as the Buyer, and the Buyer’s parent company, pursuant to which the Buyer purchased substantially all of the assets of the PSI business, which we refer to as the PSI Sale, which constituted a component of the Company’s traffic safety services and equipment business. The Company disposed of these assets in furtherance of its goal to emphasize businesses that are vertically integrated with its aggregates segment.
The cash purchase price for the PSI assets, net of certain assumed liabilities, was $36.3 million, of which $2.8 million was deposited into escrow to secure any indemnity obligations. The escrow will be retained for up to one year after closing, subject to extension in certain circumstances. We utilized the net proceeds of the sale of the PSI assets to repurchase $31.5 million of Existing Notes, which are currently in Treasury and will be cancelled upon consummation of this offering and the use of proceeds therefrom.
The PSI assets sold in the PSI Sale accounted for $41.3 million of revenue, $5.1 million of operating profit and $8.1 million of EBITDA for the nine‑month period ending November 30, 2016, $7.3 million of EBITDA for the twelve‑month period ending November 30, 2016, and $41.4 million of revenue, $1.6 million of operating profit and $6.0 million of EBITDA for the fiscal year ended February 29, 2016.
We have retained and will continue to manufacture and sell a complete line of traffic control devices, including traffic cones, plastic drums, channelizers, barricades, arrow boards, crash attenuators, construction/permanent signs and posts, message boards, speed awareness monitors and strobe/warning lights, traffic control signs and solar powered traffic safety devices under our Work Area Protection Corp., ASTI Transportation Systems, Inc., SCI Products Inc. and Precision Solar Controls Inc. businesses. We sell our manufactured traffic safety products predominantly through distributors and, to a lesser extent, directly to industrial and construction end‑users. We also retained a technology‑based traffic safety services business. In connection with the PSI Sale, we entered into a distribution agreement with the purchaser of the PSI business. For purposes of this offering circular, the historic description of our traffic safety business, including in “Management’s Discussion and Analysis of Financial Condition and Results of Operations,” includes the PSI business while the current description of our traffic safety services and equipment business does not include the PSI business.
Revolving Credit Facility
On March 3, 2016, the Company entered into Amendment No. 1 to its Revolving Credit Facility. Pursuant to such amendment, at the Company’s election in calendar year 2017 and calendar year 2018, the minimum liquidity threshold for triggering the Fixed Charge Coverage Ratio covenant will be reduced from $20.0 million to $10.5 million for a 90 day period commencing no earlier than March 1 and ending no later than August 31 of each of the applicable fiscal years.
Existing Notes Tender Offer and Redemption
We intend to use a portion of the proceeds from the sale of the notes to (i) repurchase any and all of our Existing Notes in the Tender Offer (as defined below), and to pay any related fees and expenses and (ii) fund the redemption of any Existing Notes not otherwise purchased in the Tender Offer, and to pay any related fees and expenses.
Concurrently with this offering, we commenced a tender offer for any and all of our outstanding Existing Notes, which we refer to in this offering circular as the Tender Offer. Under the terms of the Tender Offer, each holder who validly tenders and does not withdraw its notes prior to 5:00 p.m., New York City time, on March 10, 2017, will be eligible to receive total consideration of $1,006 for every $1,000 principal amount of Existing Notes tendered by such holder. The Tender Offer is made only by and pursuant to the terms of the Offer to Purchase, dated March 3, 2017, as the same may be amended or supplemented. The Tender Offer is subject to the satisfaction or waiver of various conditions, including a condition that the proceeds of an unsecured debt financing (including this offering), together with cash on hand and available borrowings under our credit facilities is sufficient to consummate the Tender Offer and other customary conditions. We may amend, extend or terminate the Tender Offer in our sole discretion.
Concurrent with the closing of this offering, we expect to issue a notice of redemption to the holders of our Existing Notes not otherwise purchased in the Tender Offer, at a redemption price of 100.000% of the principal amount redeemed, plus any interest that has accrued but has not been paid until, but not including, the date of redemption, specifying a redemption date that is 30 days after the date of such notice, and to satisfy and discharge our obligations under such Existing Notes and the related indenture at the time we deliver such notice by depositing with the trustee sufficient funds to pay the principal of, and premium and interest on, such Existing Notes to the redemption date.
This offering circular shall not constitute an offer to purchase or a notice of redemption of the Existing Notes. Any such offer to purchase or redemption notice shall be made only pursuant to and in accordance with the applicable Tender Offer documents or the indenture for the Existing Notes, as applicable.
Corporate Information
New Enterprise Stone & Lime Co., Inc. is a Delaware corporation initially formed as a partnership in 1924. Our principal executive offices are located at 3912 Brumbaugh Road, P.O. Box 77, New Enterprise, PA 16664, and our telephone number is (814) 766‑2211. Our website address is http://www.NESL.com. Our website and the information contained therein or connected thereto shall not be deemed to be incorporated into this offering circular.
The chart below illustrates a summary of our current corporate structure. The notes will be guaranteed on a senior unsecured basis by all of our existing and future domestic subsidiaries, with the exception of certain subsidiaries. For a description of our Senior Secured Credit Facilities and existing borrowing arrangements, see “Description of Other Indebtedness
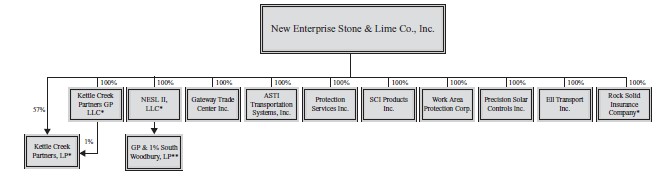
* | Rock Solid Insurance Company, NESL II, LLC, Kettle Creek Partners GP LLC and Kettle Creek Partners L.P. are not guarantors. |
** | Minority owned and therefore does not qualify as a subsidiary under the indenture. |
SUMMARY HISTORICAL CONSOLIDATED FINANCIAL AND OTHER DATA
The following table sets forth a summary of our historical consolidated financial and other data as of and for the periods presented. The summary historical financial information, except for “Other Financial Data,” as of February 29, 2016 and February 28, 2015 and for our three fiscal years 2016, 2015 and 2014, have been derived from our audited consolidated financial statements included elsewhere in this offering circular. We have derived the summary historical consolidated balance sheet as of February 28, 2014 from our consolidated balance sheet as of February 28, 2014, which is not presented in this offering circular. The summary historical financial information, except for “Other Financial Data,” for the nine month periods ended November 30, 2016 and November 30, 2015, have been derived from unaudited interim condensed financial statements included elsewhere in this offering circular. The summary historical financial information, except for “Other Financial Data,” for the twelve month period ended November 30, 2016, has been derived by adding our consolidated financial and operating data for the fiscal year ended February 29, 2016 to our consolidated financial and operating data for the nine months ended November 30, 2016 and subtracting our consolidated financial and operating data for the nine months ended November 30, 2015. In the opinion of our management, the unaudited interim financial data includes all adjustments, consisting only of normal non‑recurring adjustments considered, necessary for a fair presentation of this information. Our historical results included below and elsewhere in this offering circular are not necessarily indicative of our future performance. In addition, the results of operations for the interim periods are not necessarily indicative of the results that may be expected for the entire year. The following summary historical consolidated financial and other data are qualified in their entirety by reference to, and should be read in conjunction with, our audited consolidated financial statements and the accompanying notes, included elsewhere in this offering circular, and the information under “Selected Historical Consolidated Financial Data,” “Management’s Discussion and Analysis of Financial Condition and Results of Operations” and other financial information included in this offering circular.
(dollars in thousands) | Fiscal Year Ended | Nine Months Ended | Twelve Months Ended | |||||||||||||||
February 29, 2016 | February 28, 2015 | February 28, 2014 | November 30, 2016 | November 30, 2015 | November 30, 2016 | |||||||||||||
Consolidated Statements of Operations: | ||||||||||||||||||
Net sales and other revenues | $ | 651,931 | $ | 661,830 | $ | 681,645 | $ | 541,450 | $ | 589,300 | $ | 604,081 | ||||||
Operating costs and expenses: | ||||||||||||||||||
Cost of products sold | 505,075 | 540,743 | 562,577 | 381,513 | 437,466 | 449,122 | ||||||||||||
Depreciation, depletion and amortization | 41,886 | 44,741 | 48,792 | 30,963 | 30,701 | 42,148 | ||||||||||||
Asset impairment | 193 | 5,249 | 7,636 | 64 | 193 | 64 | ||||||||||||
Selling, administrative and general expenses | $ | 50,709 | $ | 57,887 | $ | 78,309 | $ | 29,506 | $ | 38,846 | $ | 41,369 | ||||||
Gain on disposals of property, equipment and software | (5,097 | ) | (1,065 | ) | (891 | ) | (2,858 | ) | (3,796 | ) | (4,159 | ) | ||||||
Total operating costs and expenses | 592,766 | 647,555 | 696,423 | 439,188 | 503,410 | 528,544 | ||||||||||||
Operating income (loss) | 59,165 | 14,275 | (14,778 | ) | 102,262 | 85,890 | 75,537 | |||||||||||
Other income (expense): | ||||||||||||||||||
Interest income | 185 | 189 | 407 | 60 | 125 | 120 | ||||||||||||
Interest expense | (85,552 | ) | (81,828 | ) | (86,871 | ) | (82,050 | ) | (63,572 | ) | (104,030 | ) | ||||||
Total other expense | (85,367 | ) | (81,639 | ) | (86,464 | ) | (81,990 | ) | (63,447 | ) | (103,910 | ) | ||||||
(Loss) income before income taxes | (26,202 | ) | (67,364 | ) | (101,242 | ) | 20,272 | 22,443 | (28,373 | ) | ||||||||
Income tax (benefit) expense | (5,131 | ) | (4,886 | ) | (9,099 | ) | 202 | 1,263 | (6,192 | ) | ||||||||
Net (loss) income | $ | (21,071 | ) | $ | (62,478 | ) | $ | (92,143 | ) | $ | 20,070 | $ | 21,180 | $ | (22,181 | ) | ||
Less: Net Income attributable to noncontrolling interest | (552 | ) | (713 | ) | (1,256 | ) | (481 | ) | (411 | ) | (622 | ) | ||||||
Net loss attributable to New Enterprise Stone & Lime Co., Inc | (21,623 | ) | (63,191 | ) | (93,399 | ) | 19,589 | 20,769 | (22,803 | ) | ||||||||
Other comprehensive income (loss) | ||||||||||||||||||
Unrealized actuarial (losses) gains and amortization of prior service costs, net of income taxes | $ | (77 | ) | $ | (144 | ) | $ | 447 | $ | 124 | $ | 118 | $(71) | |||||
Comprehensive loss | $ | (21,148 | ) | $ | (62,622 | ) | $ | (91,696 | ) | $ | 20,194 | $ | 21,298 | (22,252 | ) | |||
Less: Comprehensive income attributable to noncontrolling interest | (552 | ) | (713 | ) | (1,256 | ) | (481 | ) | (411 | ) | (622 | ) | ||||||
Net income (loss) attributable to stockholders | $ | (21,700 | ) | $ | (63,335 | ) | $ | (92,952 | ) | $ | 19,713 | $ | 20,887 | $ | (22,874 | ) | ||
(dollars in thousands) | Fiscal Year Ended | Nine Months Ended | Twelve Months Ended | |||||||||||||||
February 29, 2016 | February 28, 2015 | February 28, 2014 | November 30, 2016 | November 30, 2015 | November 30, 2016 | |||||||||||||
Consolidated Balance Sheet Data (end of period): | ||||||||||||||||||
Cash, restricted cash and cash equivalents | $ | 63,272 | $ | 30,470 | $ | 51,576 | $ | 8,873 | $ | 39,335 | $ | 8,873 | ||||||
Accounts receivable, net | 48,296 | 49,901 | 61,319 | 95,663 | 117,984 | 95,663 | ||||||||||||
Inventories | 103,363 | 102,206 | 107,313 | 114,027 | 108,484 | 114,027 | ||||||||||||
Property, plant, and equipment | 307,421 | 310,274 | 333,819 | 296,814 | 300,930 | 296,814 | ||||||||||||
Total assets | 653,083 | 650,370 | 721,938 | 639,407 | 712,182 | 639,407 | ||||||||||||
Long‑term debt, including current portion | $ | 667,672 | $ | 658,795 | $ | 659,966 | $ | 651,812 | $ | 676,904 | $ | 651,812 | ||||||
Total liabilities | 838,481 | 814,328 | 823,274 | 805,011 | 855,134 | 805,011 | ||||||||||||
Total (deficit) equity and redeemable common stock | (185,398 | ) | (163,958 | ) | (101,336 | ) | (165,604 | ) | (142,952 | ) | (165,604 | ) | ||||||
Consolidated Statement of Cash Flows: | ||||||||||||||||||
Net cash provided by (used in): | ||||||||||||||||||
Operating activities | 50,961 | 20,727 | 1,564 | (7,502 | ) | 21,343 | 22,116 | |||||||||||
Investing activities | (14,017 | ) | (6,204 | ) | (28,613 | ) | 16,305 | (11,960 | ) | 14,248 | ||||||||
Financing activities | (9,676 | ) | (25,122 | ) | 41,407 | (44,631 | ) | (8,809 | ) | (45,498 | ) | |||||||
Cash paid for capital expenditures and capitalized software | (28,351 | ) | (25,215 | ) | (17,207 | ) | (36,945 | ) | (19,329 | ) | (45,967 | ) | ||||||
Segment Revenue: | ||||||||||||||||||
Construction materials | $ | 452,973 | $ | 464,245 | $ | 507,957 | $ | 393,095 | $ | 415,548 | $ | 430,520 | ||||||
Heavy / highway construction | 255,301 | 253,804 | 252,310 | 205,889 | 241,649 | 219,541 | ||||||||||||
Traffic safety services & equipment | 93,631 | 88,058 | 88,834 | 81,290 | 77,339 | 97,582 | ||||||||||||
Segment totals | 801,905 | 806,107 | 849,101 | 680,274 | 734,536 | 747,643 | ||||||||||||
Eliminations | (149,974 | ) | (144,277 | ) | (167,456 | ) | (138,824 | ) | (145,236 | ) | (143,562) | |||||||
Total revenue | $ | 651,931 | $ | 661,830 | $ | 681,645 | $ | 541,450 | $ | 589,300 | $ | 604,081 | ||||||
Other Financial Data: | ||||||||||||||||||
EBITDA(1) | $ | 101,244 | $ | 64,265 | $ | 41,650 | $ | 133,289 | $ | 116,784 | $ | 117,749 | ||||||
Adjusted EBITDA(1)(2) | $107,645 | $74,384 | $42,195 | $135,128 | $121,767 | $121,006 | ||||||||||||
Further Adjusted EBITDA(1)(2) | $125,429 | |||||||||||||||||
Financial Ratios: | ||||||||||||||||||
Ratio of Total Debt to Further Adjusted EBITDA | 5.4x | |||||||||||||||||
Ratio of Total Debt to Further Adjusted EBITDA, As Adjusted for Offering | 5.5x | |||||||||||||||||
Ratio of Secured Debt to Further Adjusted EBITDA, As Adjusted for Offering | 3.9x | |||||||||||||||||
(1) | We define EBITDA as earnings before interest expense, income taxes, depreciation, cost depletion and amortization. We define Adjusted EBITDA as EBITDA adjusted to exclude certain non‑cash items or unusual items which we believe are not indicative of future performance. More specifically, we define Adjusted EBITDA in accordance with the requirements of our Revolving Credit Facility (excluding the add‑back for operating losses from four construction jobs entered into in 2012/2013 and completed in the second quarter of fiscal year 2017), as EBITDA before any (a) extraordinary, unusual or non‑recurring expenses or losses (including (i) the costs and expenses of consultants and financial advisors, subject to a $2,500,000 cap, (ii) losses on sales of assets outside of the ordinary course of business and (iii) severance costs, subject to a $1,000,000 cap), (b) all non‑cash charges in connection with the granting of, or accretion on, options, warrants or other equity interests, (c) all other non‑cash charges, (d) purchase accounting adjustments including in connection with any permitted acquisition, and (e) any costs, fees and expenses incurred in connection with any permitted issuance, refinancing or amendment of indebtedness, and any permitted equity issuance, acquisition, disposition or investment (in each case including payments in connection with such permitted transactions, payment of agency fees, payment of success/transition bonuses to employees and directors of the Company or its subsidiaries in connection therewith), minus the sum of (x) any extraordinary, unusual or |
non‑recurring income or gains (including gains on the sales of assets outside of the ordinary course of business), and (y) non‑cash income, all as determined on a consolidated basis.
We define Further Adjusted EBITDA as Adjusted EBITDA adjusted to (i) exclude EBITDA of divested businesses or assets constituting a business and (ii) include EBITDA of acquired businesses or assets constituting a business, including the anticipated cost savings resulting from such acquisitions. We caution investors that amounts presented in accordance with our definitions of EBITDA, Adjusted EBITDA, Further Adjusted EBITDA may not be comparable to similar measures disclosed by other issuers, because not all issuers and analysts calculate EBITDA, Adjusted EBITDA or Further Adjusted EBITDA in the same manner. We present EBITDA because we consider it an important supplemental measure of our performance and believe it is frequently used by securities analysts, investors and other interested parties in the evaluation of companies in our industry.
We present Adjusted EBITDA and Further Adjusted EBITDA as further supplemental measures of our performance. EBITDA, Adjusted EBITDA and Further Adjusted EBITDA have several limitations that are discussed under “Non‑GAAP Financial Measures.” Some adjustments to EBITDA, Adjusted EBITDA and Further Adjusted EBITDA are not in accordance with current SEC practice or with regulations adopted by the SEC that apply to registration statements filed under the Exchange Act of 1934, which we refer to as the Exchange Act. See “Non‑GAAP Financial Measures.” The following table presents our calculation of EBITDA, Adjusted EBITDA and Further Adjusted EBITDA reconciled to net income (loss), including noncontrolling interest:
(dollars in thousands) | Fiscal Year Ended | Nine Months Ended | Twelve Months Ended | |||||||||||||||
February 29, 2016 | February 28, 2015 | February 28, 2014 | November 30, 2016 | November 30, 2015 | November 30, 2016 | |||||||||||||
EBITDA Reconciliation: | ||||||||||||||||||
Net (loss) income | $ | (21,071 | ) | $ | (62,478 | ) | $ | (92,143 | ) | $ | 20,070 | $ | 21,180 | $ | (22,181 | ) | ||
Interest expense, net | 85,367 | 81,639 | 86,464 | 81,990 | 63,447 | 103,910 | ||||||||||||
Income tax (benefit) expense | (5,131 | ) | (4,886 | ) | (9,099 | ) | 202 | 1,263 | (6,192 | ) | ||||||||
Asset impairment | 193 | 5,249 | 7,636 | 64 | 193 | 64 | ||||||||||||
Depreciation, cost depletion and | 41,886 | 44,741 | 48,792 | 30,963 | 30,701 | 42,148 | ||||||||||||
amortization | $ | 101,244 | $ | 64,265 | $ | 41,650 | $ | 133,289 | $ | 116,784 | $ | 117,749 | ||||||
EBITDA | ||||||||||||||||||
Adjustments: | (552 | ) | (713 | ) | (1,256 | ) | (481 | ) | (411 | ) | (622 | ) | ||||||
Noncontrolling interest in net loss | 2,586 | 5,349 | (3,045 | ) | 3,313 | 1,553 | 4,346 | |||||||||||
PF Construction Contract Roll‑off | 3,000 | 3,000 | 3,000 | — | 3,000 | — | ||||||||||||
Consultant and Fin. Advisors | 580 | 1,000 | 1,000 | 114 | 467 | 227 | ||||||||||||
Severance | ||||||||||||||||||
Other adjustments | 1,538 | 1,483 | 846 | 1,057 | 1,130 | 1,465 | ||||||||||||
Accretion of ARO | (632 | ) | — | — | (1,801 | ) | (637 | ) | (1,796 | ) | ||||||||
(A) Unusual / Non‑recurring Income | (119 | ) | — | — | (363 | ) | (119 | ) | (363 | ) | ||||||||
(B) Non‑cash Income | $ | 107,645 | $ | 74,384 | $ | 42,195 | $ | 135,128 | $ | 121,767 | $ | 121,006 | ||||||
Adjusted EBITDA | ||||||||||||||||||
Estimated EBITDA attributable to | ||||||||||||||||||
PSI Asset Divestiture | (7,374 | ) | ||||||||||||||||
Estimated EBITDA attributable to | ||||||||||||||||||
Berks | 3,710 | |||||||||||||||||
EJB | 4,728 | |||||||||||||||||
Estimated Cost Saving | 3,359 | |||||||||||||||||
Further Adjusted EBITDA(a) | $ | 125,429 | ||||||||||||||||
(a) | In calculating Further Adjusted EBITDA, we have included $3.4 million of anticipated cost savings as a result of the acquisitions, which consists of approximately $2.4 million attributable to the number of employees at the acquired businesses, approximately $0.8 million attributable to duplicate offices and services and the elimination of approximately $0.2 million of compensation. While some actions have already been taken to realize these cost savings, including the reduction of employees, we cannot be certain that we will realize all of the anticipated cost savings. |
(2) | We define Further Adjusted EBITDA as Adjusted EBITDA adjusted to account for the PSI Sale, the Berks Acquisition and the EJB Acquisition, including the anticipated cost savings discussed below resulting from such acquisitions. See footnote 1 above for a reconciliation of Further Adjusted EBITDA to net income (loss), including noncontrolling interest. The fiscal year end for each of Berks and EJB is December 31, while our fiscal year 2017 ends on February 28, 2017. Accordingly, in calculating Acquisition Adjusted EBITDA for the last twelve months ended November 30, 2016, we have included the estimated EBITDA for the twelve months ended December 31, 2016 related to the assets acquired in the Berks Acquisition and the EJB Acquisition based on certain financial information supplied by the sellers. The financial information concerning assets acquired in the Berks Acquisition and the EJB Acquisition did not consist of annual or interim financial statements prepared in accordance with GAAP that had been audited or reviewed by independent auditors. We have not subsequently prepared separate financial statements for the Berks Acquisition and the EJB Acquisition. The presentation of Further Adjusted EBITDA is subject to all of the same cautions relating to Adjusted EBITDA discussed in footnote 1 above. Further Adjusted EBITDA has not been audited, reviewed, or compiled by our independent registered public accounting firm BDO USA, LLP. Accordingly, BDO USA, LLP does not express an opinion or any other form of assurance with respect thereto and assumes no responsibility for, and disclaims any association with, this information. |