Attached files
| file | filename |
|---|---|
| EX-32.2 - EXHIBIT 32.2 - Neff Corp | neff-2016x12x31x16xex322.htm |
| EX-32.1 - EXHIBIT 32.1 - Neff Corp | neff-2016x12x31x16xex321.htm |
| EX-31.2 - EXHIBIT 31.2 - Neff Corp | neff-2016x12x31x16xex312.htm |
| EX-31.1 - EXHIBIT 31.1 - Neff Corp | neff-2016x12x31x16xex311.htm |
| EX-23.1 - EXHIBIT 23.1 - Neff Corp | neff-2016x12x31x16xex231.htm |
| EX-21.1 - EXHIBIT 21.1 - Neff Corp | neff-2016x12x31x16xex211.htm |
UNITED STATES
SECURITIES AND EXCHANGE COMMISSION
Washington, D.C. 20549
FORM 10-K
(Mark One)
ý | ANNUAL REPORT PURSUANT TO SECTION 13 OR 15(d) OF THE SECURITIES EXCHANGE ACT OF 1934 FOR THE FISCAL YEAR ENDED DECEMBER 31, 2016 |
or
¨ | TRANSITION REPORT PURSUANT TO SECTION 13 OR 15(d) OF THE SECURITIES EXCHANGE ACT OF 1934 |
For the transition period from ____ to ____
Commission File No. 001-36752
Neff Corporation
(Exact name of registrant as specified in its charter)
Delaware | 37-1773826 | |||
(State or other jurisdiction of incorporation or organization) | (I.R.S. Employer Identification No.) | |||
3750 N.W. 87th Avenue, Suite 400 Miami, FL 33178 |
(Address of principal executive offices) (zip code) |
(305) 513-3350 |
(Registrant’s telephone number, including area code) |
Securities registered pursuant to Section 12(b) of the Act:
Title of each class Name of each exchange on which registered
Class A Common Stock, par value $.01 per share New York Stock Exchange
Securities registered pursuant to section 12(g) of the Act: None
Indicate by check mark if the registrant is a well-known seasoned issuer, as defined in Rule 405 of the Securities Act. Yes ¨ No ý
Indicate by check mark if the registrant is not required to file reports pursuant to Section 13 or Section 15(d) of the Act. Yes ¨ No ý
Indicate by check mark whether the registrant (1) has filed all reports required to be filed by Section 13 or 15(d) of the Securities Exchange Act of 1934 during the preceding 12 months (or for such shorter period that the registrant was required to file such reports), and (2) has been subject to such filing requirements for the past 90 days. Yes ý No ¨
Indicate by check mark whether the registrant has submitted electronically and posted on its corporate Web site, if any, every Interactive Data File required to be submitted and posted pursuant to Rule 405 of Regulation S-T (§ 232.405 of this chapter) during the preceding 12 months (or for such shorter period that the registrant was required to submit and post such files). Yes ý No ¨
Indicate by check mark if disclosure of delinquent filers pursuant to Item 405 of Regulation S-K (§ 229.405 of this chapter) is not contained herein, and will not be contained, to the best of registrant’s knowledge, in definitive proxy or information statements incorporated by reference in Part III of this Form 10-K or any amendment to this Form 10-K. ¨
Indicate by check mark whether the registrant is a large accelerated filer, an accelerated filer, a non-accelerated filer, or a smaller reporting company. See the definitions of “large accelerated filer,” “accelerated filer” and “smaller reporting company” in Rule 12b-2 of the Exchange Act.
Large accelerated filer | ¨ | Accelerated filer | ý | |
Non-accelerated filer | ¨ | (Do not check if a smaller reporting company) | Smaller reporting company | ¨ |
Indicate by check mark whether the registrant is a shell company (as defined in Rule 12b-2 of the Act). Yes ¨ No ý
As of June 30, 2016, the number of shares of Class A common stock outstanding was 9,025,714. The aggregate market value of common stock held by non-affiliates (defined as other than directors, executive officers and 10 percent beneficial owners) at June 30, 2016 was approximately $97.7 million, calculated by using the closing price of the common stock on such date on the New York Stock Exchange of $10.93.
As of February 23, 2017, the number of shares of Class A common stock outstanding was 8,859,662 and the number of shares of Class B common stock outstanding was 14,951,625.
DOCUMENTS INCORPORATED BY REFERENCE: | |
Related Section | DOCUMENTS |
Part III | Portions of the registrant's definitive proxy statement to be issued in connection with the registrant's 2017 Annual Meeting of Stockholders are incorporated by reference into Part III of this Form 10-K. |
NEFF CORPORATION | ||
TABLE OF CONTENTS | ||
10-K Part and Item No. | Page No. | |
PART I | ||
PART II | ||
PART III | ||
PART IV | ||
CAUTIONARY NOTE REGARDING FORWARD-LOOKING STATEMENTS
This annual report on Form 10-K contains "forward-looking statements" within the meaning of the federal securities laws. These forward-looking statements include statements regarding industry outlook, our expectations regarding the performance of our business, liquidity, our expected tax rate and benefits and estimated payments under our tax receivable agreement, expected capital expenditures, anticipated future indebtedness or financings and other non-historical statements. We use words such as "could," "may," "might," "will," "expect," "likely," "believe," "continue," "anticipate," "estimate," "intend," "plan," "project" and other similar expressions to identify some but not all forward-looking statements. Forward-looking statements involve estimates and uncertainties that could cause actual results to differ materially from those expressed in the forward-looking statements. Accordingly, any such statements are qualified in their entirety by reference to the information described under the caption "Risk Factors" and elsewhere in this annual report on Form 10-K.
The forward-looking statements contained in this annual report on Form 10-K are based on assumptions that we have made in light of our industry experience and our perceptions of historical trends, current conditions, expected future developments and other important factors we believe are appropriate under the circumstances. As you read and consider this annual report on Form 10-K, you should understand that these statements are not guarantees of performance or results. They involve risks, uncertainties (many of which are beyond our control) and assumptions. Although we believe that these forward-looking statements are based on reasonable assumptions, you should be aware that many important factors could affect our actual operating and financial performance and cause our performance to differ materially from the performance anticipated in the forward-looking statements. We believe these important factors include, but are not limited to, those described under the captions "Risk Factors" and "Management's Discussion and Analysis of Financial Condition and Results of Operations" in this annual report on Form 10-K.
3
Should one or more of these risks or uncertainties materialize, or should any of these assumptions prove incorrect, our actual operating and financial performance may vary in material respects from the performance projected in these forward-looking statements.
Further, any forward-looking statement speaks only as of the date on which it is made, and except as required by law, we undertake no obligation to update any forward-looking statement contained in this annual report on Form 10-K to reflect events or circumstances after the date on which it is made or to reflect the occurrence of anticipated or unanticipated events or circumstances. New important factors that could cause our business not to develop as we expect, emerge from time to time, and it is not possible for us to predict all of them.
4
PART I
Item 1. BUSINESS
Our Company
We are a leading regional equipment rental company in the United States, focused on the fast-growing Sunbelt states. We offer a broad array of equipment rental solutions for our diverse customer base, including infrastructure, non-residential construction, oil and gas and residential construction customers. Our broad fleet of equipment includes earthmoving, material handling, aerial and other rental equipment, which we package together to meet the specific needs of our customers.
Our Branch Network and Fleet
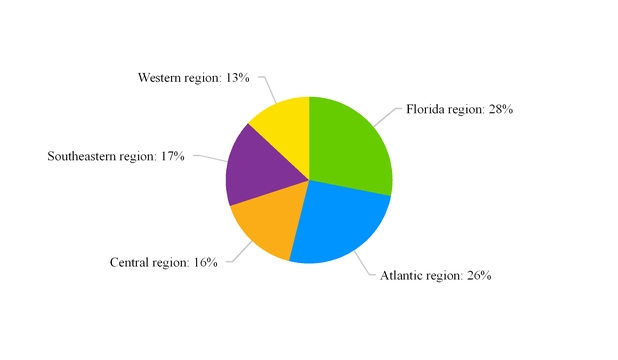
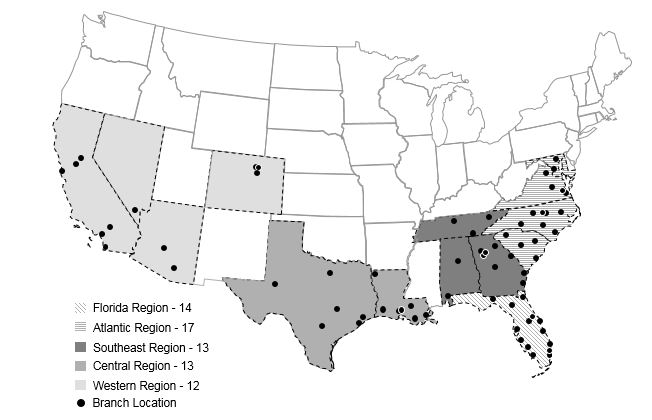
As of December 31, 2016, we operated 69 branches organized into operating clusters in five regions in the United States: Florida, Atlantic, Central, Southeastern and Western. We are strategically located in markets that we believe feature high levels of population growth as well as high levels of construction activity over the near term. We believe that our clustering approach enables us to establish a strong local presence in targeted markets and meet the needs of our customers that have multiple projects within a specific region.
Revenues by Region for the year ended December 31, 2016
5
Our Five Regions
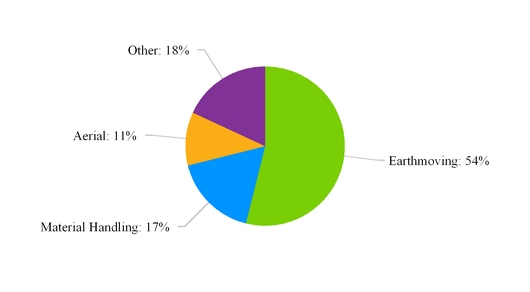
As of December 31, 2016, our rental fleet consisted of approximately 15,000 major units of equipment with an original equipment cost, or OEC, of approximately $824.7 million and an average age of approximately 48 months. Our earthmoving fleet represented approximately 54% of OEC and had an average age of approximately 42 months. We believe that our focus on earthmoving equipment positions us to take advantage of future growth opportunities in our key end-markets.
Rental Fleet by Equipment Category as a Percentage of OEC as of December 31, 2016
6
Segment Reporting
We have one reportable segment. For financial information regarding our reportable segments, refer to our financial statements and notes thereto included in Item 8 of this annual report on Form 10-K and "Management's Discussion and Analysis of Financial Condition and Results of Operations" included in this annual report on Form 10-K.
Our Business Strengths
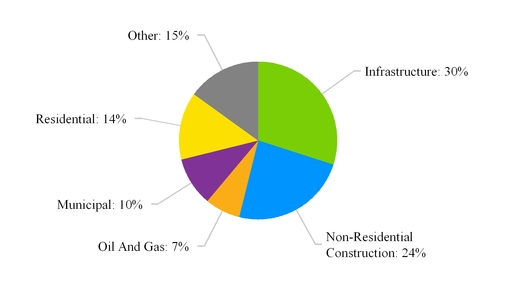
End-Market Growth. For the year ended December 31, 2016, approximately 85% of our rental revenues were derived from five key end-markets: infrastructure, non-residential construction, oil and gas, municipal and residential construction. We believe that our current business is well aligned with these end-markets, and that we will continue to benefit from macroeconomic growth.
Our Rental Revenues by End-Market for the Year Ended December 31, 2016
Prominent Position in Fast-Growing Sunbelt States. 64 of our 69 branches are located in the Sunbelt states of Virginia, North Carolina, South Carolina, Florida, Georgia, Alabama, Tennessee, Louisiana, Texas, Arizona, Nevada and California. Our Sunbelt state locations benefit from favorable climate conditions that facilitate year-round construction activity and reduce seasonality in our business. According to the American Rental Association, construction and industrial equipment rental revenue in the states where we have branch locations is expected to grow approximately 5% annually from 2016 to 2020, compared to an average growth rate of approximately 4% for all other states. By clustering our operations and concentrating our branches in these strategic regional markets, we have established a strong local presence and developed significant brand recognition in those markets.
High-Quality Fleet Focused on Earthmoving Equipment. We offer our customers a broad array of rental equipment with a focus on the earthmoving category. We believe that we are well positioned to benefit from additional penetration in the earthmoving equipment category, which had a penetration rate of approximately 51% in 2016, compared to approximately 92% for the aerial and 84% for the material handling categories, respectively. As of December 31, 2016, we had approximately 5,800 units of earthmoving equipment, accounting for 54% of the OEC of our rental fleet.
Disciplined Sales Culture Drives Strong Customer Relationships. We have a diverse base of customers who we believe value our knowledge and expertise. Our customer base includes large and mid-sized construction firms, municipalities, utilities and industrial users. We serve approximately 15,400 customers annually. For the year ended December 31, 2016, no single customer accounted for more than 1% of our total rental revenues and our ten largest customers accounted for approximately 6% of our total rental revenues, collectively. Our culture is built around the disciplined use of our customer relationship management system, or "CRM system," at every level of our organization, which we believe provides our employees with the tools and information to efficiently provide customized solutions to our existing and potential customers. In addition, our CRM system automatically notifies our sales force of new construction projects within their territories and provides them with the names and contact information of key contractors.
Strong Operating Trends. We have experienced substantial earnings momentum since 2011, driven by the rebound in our end-markets and supported by significant investment in our fleet, which has resulted in an increase in OEC from $471.1 million at December 31, 2011 to $824.7 million at December 31, 2016. In addition, our time utilization, which we define as the daily
7
average OEC of equipment on rent, divided by the OEC of all equipment in the rental fleet during the relevant period, has increased from 65.0% for the year ended December 31, 2011 to 67.1% for the year ended December 31, 2016. We believe that the combination of favorable industry dynamics, significant investments in our fleet and our focus on operating leverage (which has seen our Adjusted EBITDA margin increase from 35.4% for the year ended December 31, 2011 to 48.8% for the year ended December 31, 2016) have driven our Adjusted EBITDA from $86.7 million to $193.8 million over this period. For additional discussion on Adjusted EBITDA and Adjusted EBITDA margin see Management's Discussion and Analysis of Financial Conditions and Results of Operations.
Experienced Management Team. Our senior management team has significant operating experience in the equipment rental industry and has worked together at our company for over a decade. Graham Hood, our Chief Executive Officer, has 39 years of rental industry experience and Mark Irion, our Chief Financial Officer, has 18 years of rental industry experience. Our regional Vice Presidents, with an average of 20 years with our company and 33 years of industry experience, provide us with a stable base of operating management with long-term, local relationships and deep equipment rental industry expertise. This industry expertise, combined with our disciplined sales culture and CRM system, enables our regional management team to respond quickly to changing market conditions.
Our Business Strategy
Focus on Premium Customer Service to Create Strong Customer Relationships. We are committed to providing our customers with premium service. We believe that our customers value our strong regional presence, well established local relationships and full-service branches, which offer 24/7 customer support. Our regional presence is supplemented by a national account focus that allows us to differentiate our brand and product offering to our larger customer accounts. We intend to continue to leverage our national accounts program, our customer service capabilities and our advanced CRM system to retain our existing customers and further penetrate our target customer base.
Emphasis on Active Asset Management. We have invested significantly in both customized technologies and the development of our personnel to ensure that we manage our fleet efficiently. Our equipment clustering strategy allows us to share and deploy equipment among our branches as demand for equipment shifts throughout our branch network. Over time, we have demonstrated our ability to both increase and decrease the age of our fleet in response to changing market conditions. We actively monitor the market environment to determine where investment in fleet assets should be made or when fleet asset divestitures should occur. Our emphasis on active asset management, combined with our rigorous repair and maintenance program, allows us to increase time utilization, extend the useful life of our fleet and also results in higher resale values for our equipment.
Focus on Growing Markets. We believe that our focus on the infrastructure, non-residential construction and residential construction end-markets positions us to benefit from favorable industry and macroeconomic trends. We believe that all of these end-markets are currently experiencing significant growth and will continue to benefit from investment spending driven by the economic recovery in the United States. FMI Construction Outlook predicts that from 2016 through 2020, U.S. infrastructure spending will grow approximately 4.6% annually, U.S. non-residential construction spending will grow 4.7% annually, and U.S. residential construction will grow 3.5% annually. We believe that our focus on these end-markets will position us to achieve significant growth in revenues.
Capitalize on Operating Leverage. We have a highly scalable business model constructed around our network of 69 full-service branch locations. We believe that our current network can support significant additions to our rental fleet without substantial additional investment in infrastructure, personnel or information technology. We intend to capitalize on anticipated growth opportunities primarily by increasing our fleet size within our existing branch network, using our active asset management capabilities to increase time utilization and improve pricing levels and serving customers who value our equipment mix and service capabilities. We regularly evaluate new branch opportunities based on stringent investment return criteria to identify promising new branch locations and will continue to monitor opportunities to expand our strategic branch network.
History and Structure
Neff Corporation was formed as a Delaware corporation on August 18, 2014 by Wayzata Opportunities Fund II, L.P. and Wayzata Opportunities Fund Offshore II, L.P., private investment funds (the "Wayzata Funds") managed by Wayzata Investment Partners LLC (and together with the Wayzata Funds, "Wayzata"). On November 26, 2014, Neff Corporation completed an Initial Public Offering (the "IPO") of 10,476,190 shares of Class A common stock in exchange for net proceeds of approximately $146.1 million. A portion of the net proceeds received by Neff Corporation from the IPO were used to purchase 10,476,190 common units in Neff Holdings, which was wholly owned by Wayzata Funds prior to the IPO.
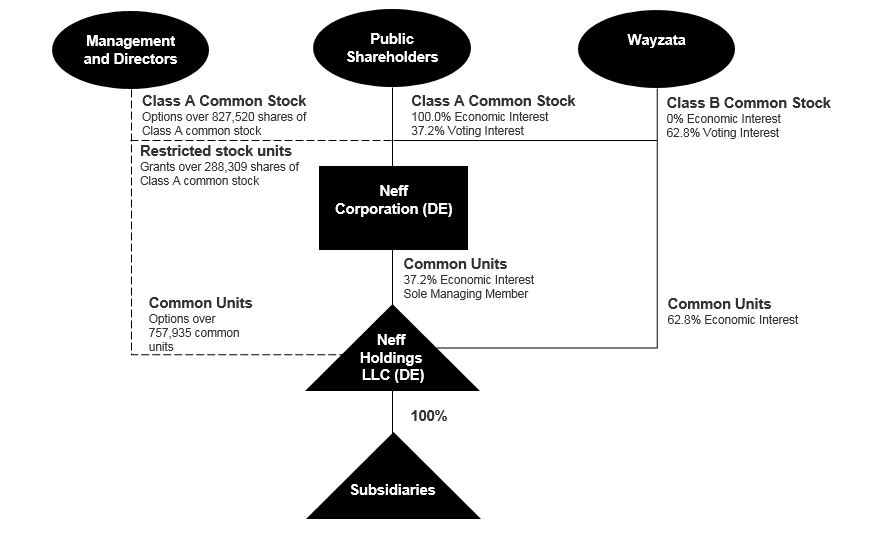
Neff Corporation is the sole managing member of Neff Holdings and as of December 31, 2016, subsequent to common unit repurchases and other equity transactions, owns 8,859,662 common units of Neff Holdings representing approximately 37.2% of the combined voting power of all of Neff Corporation's common stock and through Neff Corporation's ownership of Neff
8
Holdings' common units, indirectly holds approximately 37.2% of the economic interest in the business of Neff Holdings and its subsidiaries. As the sole managing member of Neff Holdings, we control its business and affairs and therefore, we consolidate its financial results within ours. Neff Holdings is a holding company that conducts no operations and, as of the consummation of the IPO, its only material asset is the equity interests of its direct and indirect subsidiaries.
As of December 31, 2016, Wayzata Funds through its ownership of Neff Corporation's Class B common stock, owns 14,951,625 common units of Neff Holdings representing a collective 62.8% of the combined voting power of all of Neff Corporation's common stock and through its ownership of Neff Holdings' common units, holds approximately 62.8% of the economic interest in the business of Neff Holdings and its subsidiaries. Each common unit held by Wayzata Funds or acquired by individuals upon exercise of existing options granted by Neff Holdings will be redeemable, at the election of such member, for, at Neff Corporation's option, newly-issued shares of Class A common stock on a one-for-one basis or a cash payment equal to a volume-weighted average market price of one share of Class A common stock for each common unit redeemed (subject to customary adjustments, including for stock splits, stock dividends and reclassifications) in accordance with the terms of the Neff Holdings LLC Agreement; provided that, at Neff Corporation's election, Neff Corporation may effect a direct exchange of such Class A common stock or such cash for such common units.
The following diagram sets forth our ownership structure and percentages of voting power and common unit ownership, as of December 31, 2016:
Operations
Through our 69 branches, located primarily in the Sunbelt states of Virginia, North Carolina, South Carolina, Florida, Georgia, Alabama, Tennessee, Louisiana, Texas, Arizona, Nevada and California, we generate revenues primarily through the rental of a broad array of construction and industrial equipment, the sale of used and new equipment and the sale of parts, supplies and related merchandise.
Rental Fleet. Our broad fleet of equipment includes earthmoving, material handling, aerial and other rental equipment. As of December 31, 2016, we had over 5,800 units of earthmoving equipment, accounting for 54% of the OEC of our rental fleet. We generate revenue under leases for our rental equipment as well as from fees we charge for the pickup and delivery of equipment, damage waivers and other surcharges.
9
We purchase our equipment from vendors who we believe have reputations for good product quality and support. We identify original equipment manufacturers, or "OEMs" who can supply quality, reliable products and provide value added support services.
As of December 31, 2016, our rental fleet is comprised of the following equipment categories and respective primary OEM suppliers:
Equipment Category | Primary Fleet Equipment | Primary OEM Suppliers | Percentage of OEC | ||||
Earthmoving | Excavators, backhoes, loaders, bulldozers, mini-excavators, trenchers, sweepers and tractors, track loaders and skid steers | Komatsu, John Deere, Kobelco, IHI, Doosan, Bobcat, Link-Belt, Case, Kubota and Takeuchi | 54 | % | |||
Material Handling | Reach forklifts, industrial forklifts and straight-mast forklifts | JLG, Gehl, Genie, JCB, Caterpillar, Case, Doosan, Komatsu, Skytrak and Heli | 17 | % | |||
Aerial | Personnel lifts, electric scissor lifts, dual fuel scissor lifts, articulating boom lifts and straight boom lifts | JLG, Genie and Skyjack | 11 | % | |||
Other Rental Equipment | Compaction and concrete, trucks and trailers, sweepers, air equipment, generators, welders, lighting, pumps and other small equipment and tools | Hamm, International, Wacker, Ford, Bomag, Magnum, EPI, Freightliner, Atlas Copco and Doosan | 18 | % | |||
Rental Revenues. We offer our equipment for rent on a daily, weekly and monthly basis and our customers typically execute written rental agreements, which we account for as leases under generally accepted accounting principles in the United States ("US GAAP"). The majority of our written rental agreements are short-term and do not include specific provisions for early termination. We determine rental rates for each type of equipment based on the cost and expected time utilization of the equipment and adjust rental rates at each location based on demand, length of rental, volume of equipment rented and other competitive considerations.
Equipment Sales. We maintain a regular program of selling used equipment in order to adjust the size and composition of our rental fleet to changing market conditions and to maintain the quality and average age of our rental fleet. We attempt to balance the objective of obtaining acceptable prices from used equipment sales against the recurring revenues obtainable from equipment rentals. Our proactive management of our rental fleet allows us to adjust the rate and timing of new equipment purchases and used equipment sales to improve time utilization rates, take advantage of attractive disposition opportunities and respond to changing economic conditions.
To a much lesser extent, we also generate revenue through the sale of ancillary new equipment.
Parts and Service. We sell complementary parts, supplies, fuel and merchandise to our customers in conjunction with our equipment rental and sales businesses. We maintain an inventory of fuel, maintenance and replacement parts and related products, which are important for timely parts and service support and helps reduce downtime for both our customers and us.
For additional financial information regarding revenues for our rental fleet, equipment sales and parts and service as well as our consolidated net income and total assets, please refer to our financial statements and the notes to the financial statements.
Fleet Management
Our branches are often within close geographic proximity to each other and are all connected through a centralized system which allows any other branch to view rental equipment availability throughout our entire branch network. As a result, we can respond quickly to the needs of our customers and increase the time utilization rates of our equipment, thereby improving profitability and reducing capital expenditures.
We actively monitor fleet purchases to maintain appropriate inventory levels and to manage capital expenditures. At times, we may selectively increase or decrease the age of our fleet in response to changing market conditions. We actively monitor the market environment to determine where investment in fleet assets should be made or when fleet asset divestitures should be made.
We provide transportation of our rental equipment to and from the customer's location and our payroll expenses reflect the cost of providing such transportation. Once our drivers have delivered rental equipment to the customer, the customer takes
10
complete control of operating the equipment. All customers are expected to provide insurance coverage of the rental equipment under their control during the period of utilization of such rental equipment.
Customers
Our large customer base, which included approximately 15,400 customers for the year ended December 31, 2016, is diversified among various industries, including infrastructure, non-residential construction, oil and gas, municipal and residential construction. In particular within these industries, we serve industrial and civil construction, manufacturing, public utilities, offshore oil exploration and drilling, refineries and petrochemical facilities, municipalities, golf course construction, shipping and the military. We target mid-sized, regional and local construction companies that value customer service. Our customer base includes both large Fortune 500 companies who have elected to outsource some of their equipment needs and small construction contractors, subcontractors and machine operators whose equipment needs are job-based. Our top ten customers accounted for approximately 6% of our total rental revenues for the year ended December 31, 2016 collectively, and no single customer accounted for more than 1% of our total rental revenues for the year ended December 31, 2016.
We largely conduct our business on account with customers who are screened through a credit application process. Credit account customers are our core customers, accounting for approximately 98% of our total revenues for the year ended December 31, 2016.
Sales and Marketing
We maintain a strong sales and marketing orientation throughout our organization, which we believe helps us to increase our customer base and better understand and serve our customers. Managers develop relationships with local customers and assist them in planning their equipment rental requirements. They are also responsible for managing the mix of equipment at their locations, keeping current on local construction activity and monitoring competitors in their respective markets. To stay informed about their local markets, salespeople track rental opportunities and construction projects in the area through Equipment Data Reports, F.W. Dodge Reports, PEC (Planning, Engineering and Construction) Reports and local contacts.
Our national accounts are serviced by a core team of dedicated managers to provide continuity and customized solutions to our national account customers.
Our sales training program emphasizes customer service and focuses on sales generation.
Management Information Systems
In addition to our CRM system, we have developed customized management information systems, capable of monitoring our branch operations and sales force productivity on a real-time basis, which management believes can support our current and future needs. These systems link all of our rental locations and allow management to track customer and sales information, as well as the location, rental status and maintenance history of every major piece of equipment in the rental fleet. By using these systems, branch managers can search our entire rental fleet for needed equipment, quickly determine the closest location of such equipment and arrange for delivery of equipment to the customer's work site.
Employees
As of December 31, 2016, we had approximately 1,160 full-time employees. None of our employees are represented by a union or covered by a collective bargaining agreement. We believe we have satisfactory relations with our employees.
Our sales force is divided into salaried sales coordinators and field sales professionals. Our sales professionals receive monthly sales commissions based on rental revenue and a percentage of the gross profit from the sale of used and new equipment.
Seasonality and Cyclicality
Our Sunbelt locations benefit from favorable climate conditions that facilitate year round construction activity and reduce seasonality in our business. Our operating results are subject to annual and seasonal fluctuations resulting from a variety of factors, including:
• | the seasonality of rental activity by our customers, with lower activity levels during the winter; |
• | the cyclicality of the construction industry; |
• | the number of our significant competitors and the competitive supply of rental equipment; |
• | general economic conditions; and |
11
• | the price of oil and other commodities and other general economic trends impacting the industries in which our customers and end users operate. |
In addition, our operating results may be affected by severe weather events and seismic conditions (such as hurricanes, tornadoes, flooding and earthquakes) in the regions we serve. Severe weather events can result in short-term reductions in construction activity levels, but after these periods of reduced construction activity, repair and reconstruction efforts have historically resulted in periods of increased demand for rental equipment.
Competition
The equipment industry is highly fragmented and we believe that competition tends to be based on geographic proximity and availability of products. While the competitive landscape also includes small, independent businesses with only a few rental locations, we believe that we mostly compete against regional competitors which operate in one or more states, public companies and equipment vendors and dealers who both sell and rent equipment directly to customers. Some of these competitors include United Rentals, Herc Rentals, Ahern Rentals, H&E Equipment Services, CAT Rental, Sunstate Equipment and Sunbelt Rentals.
We believe that, in general, large companies may enjoy competitive advantages compared to smaller operators, including greater purchasing power, a lower cost of capital, the ability to provide customers with a broader range of equipment and services, and greater flexibility to transfer equipment among locations in response to customer demand. See "Risk Factors—Risks Relating to Our Business—The equipment rental industry is highly competitive, and competitive pressures could lead to a decrease in our market share or in rental rates and our ability to sell equipment at favorable prices."
Environmental and Safety Regulations
We and our facilities and operations are subject to comprehensive and frequently changing federal, state and local environmental and safety and health requirements, including those relating to discharges of substances to the air, water and land, the handling, storage, transport, use and disposal of hazardous materials and wastes and the cleanup of properties affected by pollutants. In connection with our vehicle and equipment fueling and maintenance, repair and washing operations, we use regulated substances such as petroleum products and solvents and we generate small quantities of regulated waste such as used oil, radiator fluid and spent solvents. All of our properties currently have above ground and/or underground storage tanks and oil-water separators (or equivalent wastewater collection/treatment systems). Although we have made, and will continue to make capital expenditures to comply with environmental requirements, we do not anticipate that compliance with such requirements will have a material adverse effect on our business or financial condition or competitive position. However, in the future, new or more stringent laws or regulations could be adopted. Accordingly, we cannot assure you that we will not have to make significant capital or other expenditures in the future in order to comply with applicable laws and regulations or that we will be able to remain in compliance at all times.
Most, but not all, of our current properties have been the subject of an environmental site assessment conducted with the goal of identifying conditions that may cause us to incur costs under applicable environmental laws. In addition, all but one of our properties are leased and certain of our lease agreements provide that the site owner has responsibility for the preexisting environmental contamination at the property and that we are liable for contamination caused by us or that occurs during the term of the lease. However, given the nature of our operations and the historical operations conducted at these properties, and inherent limits on the information from the environmental site assessments mentioned above, we cannot be sure that all potential instances of contamination have been identified, that our operations have not caused contamination or that our landlords will be able or willing to hold us harmless for preexisting contamination at the relevant sites. Future events, such as changes in laws or policies, the discovery of previously unknown contamination, or the failure of another party to honor an obligation it may have to indemnify us for remediation costs or liabilities, may give rise to remediation costs which may be material. See "Risk Factors—Risks Relating to Our Business—We are subject to numerous environmental and health and safety laws and regulations that may result in our incurring liabilities, which could have a material adverse effect on our operating performance."
Other Information
We maintain a website with the address www.neffrental.com. We are not including the information contained in our website as part of, or incorporating it by reference into, this annual report on Form 10-K. We make available, free of charge through our website, our annual reports on Form 10-K, quarterly reports on Form 10-Q, current reports on Form 8-K, and amendments to these reports as soon as reasonably practicable after we electronically file these materials with, or otherwise furnish them to, the Securities and Exchange Commission (the “SEC”).
12
Item 1A. RISK FACTORS
Neff Corporation and its consolidated subsidiaries, including Neff Holdings and Neff Holdings' subsidiaries, Neff LLC and Neff Rental LLC, (collectively, the "Company," "we," "our" or "us") face significant risks and uncertainties. Certain important factors may have a material adverse effect on our business, financial condition, results of operations or cash flows. Accordingly, in evaluating our business, you should carefully consider the following discussion of risk factors in addition to other information contained in or incorporated by reference into this annual report on Form 10-K and our other public filings with the SEC.
Risks Relating to Our Business
The equipment rental industry is highly cyclical. Decreases in construction or industrial activities could materially adversely affect our revenues and operating results by decreasing the demand for our equipment or the rental rates or prices we can charge.
The equipment rental industry is highly cyclical and its revenues are closely tied to general economic conditions and to conditions in the non-residential construction industry in particular. Our products and services are used primarily in non-residential construction and oil and gas end-markets and, to a lesser extent, in industrial activity and residential construction end-markets. These are cyclical businesses that are sensitive to changes in general economic conditions. Weakness in our end-markets, such as a decline in non-residential construction, oil and gas end-markets or industrial activity, have led, and may in the future lead, to a decrease in the demand for our equipment or the rental rates or prices we can charge. For example, in 2009 and 2010, there were significant decreases in non-residential construction activity compared to prior periods, which materially adversely affected our results for those periods. Recently, we have observed a significant slowdown in activity in the oil and gas industry, which has materially adversely affected our rentals to participants in this industry. Factors that may cause weakness in our end-markets include:
• | weakness in the economy, decreases in the market value of real estate or the onset of a new recession; |
• | slowdowns in residential construction and/or non-residential construction in the geographic regions in which we operate; |
• | continued decline and/or volatility in oil and gas prices as well as slowdowns in the oil and gas industry in the geographic regions in which we operate; |
• | reductions in spending levels by customers; |
• | unfavorable credit markets affecting end-user access to capital; |
• | adverse changes in the federal and local government infrastructure spending; |
• | an increase in the cost of construction materials; |
• | adverse weather conditions which may affect a particular region; |
• | oversupply of available commercial real estate in the markets we serve; |
• | increases in interest rates; and |
• | terrorism or hostilities involving the United States. |
Future declines in non-residential construction and industrial activity could materially adversely affect our operating results by decreasing our revenues and gross profit margins. Because of our focus on the earthmoving equipment category, which represented approximately 54% of our OEC as of December 31, 2016, any such declines may affect us more than our competitors.
In addition, the cyclicality of our industry makes it more difficult for us to forecast trends. Uncertainty regarding future product demand could cause us to maintain excess equipment inventory and increase our equipment inventory costs. Alternatively, during periods of increased demand, we may not have enough rental equipment to satisfy demand, which could result in a loss of market share.
Our substantial indebtedness could materially adversely affect our business, financial condition, results of operations and cash flows.
We have a significant amount of indebtedness. As of December 31, 2016, we had total indebtedness of approximately $702.1 million (of which $475.7 million consisted of borrowings under our second lien credit agreement (the "Second Lien Loan")
13
and $226.4 million consisted of borrowings under our Revolving Credit Facility (as defined below)). As of December 31, 2016, we had borrowing capacity under our senior secured revolving credit facility (the "Revolving Credit Facility"), net of approximately $4.1 million in outstanding letters of credit, of $223.0 million, subject to certain conditions. In addition, subject to certain conditions, our Second Lien Loan can be increased by an additional $75.0 million under an uncommitted incremental facility. Under the terms of the agreements governing our indebtedness, we may be able to incur substantial indebtedness in the future.
Our substantial indebtedness could have important consequences to you. For example, it could:
• | make it more difficult for us to satisfy our obligations with respect to our indebtedness or refinance our indebtedness as they become due; |
• | increase our vulnerability to general adverse economic and industry conditions; |
• | require us to dedicate a substantial portion of our cash flow from operations to payments on our indebtedness, thereby reducing the availability of our cash flow to fund working capital, capital expenditures, strategic growth efforts and other general corporate purposes; |
• | decrease our profitability or cash flow; |
• | limit our flexibility in planning for, or reacting to, changes in our business and the industry in which we operate; |
• | limit our ability to attract acquisition candidates or to complete future acquisitions; |
• | place us at a competitive disadvantage compared to our competitors who have less indebtedness; and |
• | limit our ability to obtain additional financing for working capital, capital expenditures, acquisitions or general corporate purposes. |
In addition, the agreements governing our indebtedness contain restrictive covenants that limit our ability to engage in activities that may be in our long-term best interests. Our failure to comply with those covenants could result in an event of default which, if not cured or waived, could result in the acceleration of all of our indebtedness. In the past, we have had to seek waivers and amendments to certain covenants from our lenders which we obtained. There can be no assurance that we will not be required to seek waivers and amendments in the future or that, if sought, our lenders would grant such waivers or amendments.
To service our indebtedness, we will require a significant amount of cash. Our ability to generate cash depends on many factors beyond our control and any failure to meet our debt service obligations could harm our business, financial condition and results of operations.
As a result of our significant indebtedness, we have substantial debt service requirements. Our ability to satisfy our debt service requirements and to meet our other capital and liquidity needs will depend on our ability to generate sufficient cash flow. Our ability to generate sufficient cash flow to satisfy our debt service requirements is subject to numerous factors, many of which are beyond our control, such as general economic conditions and changes in our industry. Also, we are dependent on the ability of our subsidiaries to distribute their operating cash flow to the borrower under our indebtedness to satisfy our debt service requirements. If our subsidiaries are restricted from distributing cash, whether by reason of contractual limitations, legal restrictions or otherwise, we may not be able to cause such cash to be distributed.
We cannot assure you that our business will generate sufficient cash flow from operations or that future borrowings will be available to us under our Revolving Credit Facility in an amount sufficient to enable us to pay our indebtedness or to fund our other liquidity needs. We may need to refinance all or a portion of our indebtedness on or before maturity. Our ability to refinance our indebtedness will depend on the capital markets and our financial condition at such time. Any refinancing of our indebtedness could be at high interest rates and may require us to comply with more onerous covenants, which could further restrict our business operations. We cannot assure you that we will be able to refinance any of our indebtedness, including our Revolving Credit Facility and the Second Lien Loan, on commercially reasonable terms or at all. Our inability to refinance our indebtedness or to do so upon attractive terms could materially and adversely affect our business, results of operations, financial condition, cash flows and make us vulnerable to adverse industry and general economic conditions.
Without a refinancing, we could be forced to implement alternative actions, including to reduce or delay capital expenditures, limit our growth, seek additional capital, or sell assets to make up for any shortfall in our payment obligations under unfavorable circumstances. The Revolving Credit Facility and the documentation governing the Second Lien Loan limit our ability to sell assets and also restrict the use of proceeds from such a sale. Moreover, the Revolving Credit Facility is secured on a first-priority basis by substantially all of our assets and the Second Lien Loan and the guarantees are secured on a second-priority basis
14
by substantially the same assets. We may not be able to sell assets quickly enough or for sufficient amounts to enable us to meet our obligations.
Variable rate indebtedness subjects us to interest rate risk, which could cause our debt service obligations to increase significantly.
Borrowings under our Revolving Credit Facility and the Second Lien Loan are at variable rates of interest and expose us to interest rate risk. While we have generally not entered into hedging arrangements in the ordinary course of our business, in March 2015, we did enter into an interest rate swap in the notional amount of $200.0 million to hedge the variable rate on a portion of the Revolving Credit Facility for the period between April 8, 2015 and April 8, 2020. Since our hedging arrangements only cover a portion of our indebtedness, our results of operations are still sensitive to movements in interest rates. There are many economic factors outside our control that have in the past and may, in the future, impact rates of interest including publicly announced indices that underlie the interest obligations related to a certain portion of our debt. Factors that impact interest rates include governmental monetary policies, inflation, recession, changes in unemployment, the money supply, international disorder and instability in domestic and foreign financial markets. If interest rates increase, our debt service obligations on the variable rate indebtedness would increase even though the amount borrowed remained the same.
The terms of our Revolving Credit Facility and the Second Lien Loan may restrict our current and future operations, particularly our ability to respond to changes in our business or to take certain actions.
Our Revolving Credit Facility and the documentation governing the Second Lien Loan contain, and the terms of any future indebtedness of ours would likely contain, a number of restrictive covenants that will impose significant operating and other restrictions on us. These restrictions will affect, and in many respects will limit or prohibit, among other things, our ability to:
• | incur additional indebtedness; |
• | pay dividends and make distributions; |
• | issue stock of subsidiaries; |
• | make certain investments, acquisitions or capital expenditures; |
• | repurchase stock; |
• | create liens; |
• | enter into affiliate transactions; |
• | enter into sale-leaseback transactions; |
• | merge or consolidate; and |
• | transfer and sell assets. |
In addition, our Revolving Credit Facility includes other more restrictive covenants and limits us from prepaying our other indebtedness, including the Second Lien Loan, while borrowings under the Revolving Credit Facility are outstanding.
The operating and financial restrictions and covenants in our existing debt agreements and any future financing agreements may adversely affect our ability to finance future operations or capital needs or to engage in other business activities. In addition, a failure to comply with the covenants contained in the credit agreements governing our Revolving Credit Facility or the Second Lien Loan could result in an event of default under the applicable facility which, if not cured or waived, could have a material adverse effect on our business, financial condition and results of operations. If we default under our Revolving Credit Facility or the Second Lien Loan, the lenders thereunder:
• | will not be required to lend any additional amounts to us; |
• | could elect to declare all of our outstanding borrowings, together with accrued and unpaid interest and fees, to be immediately due and payable; and |
• | could effectively require us to apply all of our available cash to repay these borrowings even if they do not accelerate the borrowings. |
Any of these actions under one of our credit facilities could result in an event of default under the other facility or a future debt facility.
15
If the indebtedness under our Revolving Credit Facility or the Second Lien Loan were to be accelerated, there can be no assurance that our assets would be sufficient to repay such indebtedness in full and we could be forced into bankruptcy or liquidation.
If we are unable to obtain additional capital as required, we may be unable to fund the capital outlays required for the success of our business, including those relating to purchasing equipment, opening new rental locations, making acquisitions and refinancing existing indebtedness.
Our business has significant capital requirements. Our ability to remain competitive, sustain our growth and expand our operations through start-up locations and acquisitions largely depends on our access to capital. If the cash that we generate from our business, together with cash on hand and borrowings under our Revolving Credit Facility, to the extent available, is not sufficient to meet our capital needs and implement our growth strategy, we will require additional financing. However, we may not succeed in obtaining additional financing on terms that are satisfactory to us or at all. In addition, our ability to obtain additional financing will be restricted by the terms of our Revolving Credit Facility and by the terms of the Second Lien Loan. If we are unable to obtain sufficient additional capital in the future, we may be unable to fund the capital outlays required for the success and growth of our business, including those relating to purchasing equipment, opening new rental locations and completing acquisitions. Any additional indebtedness that we do incur will make us more vulnerable to economic downturns and may limit our ability to withstand competitive pressures.
Past economic downturns have had, and future economic downturns could have, a material adverse impact on our business.
Economic downturns in the areas we do business adversely affect us as our end-markets are in the highly cyclical construction area. A slowdown in the economic recovery or worsening of economic conditions, in particular with respect to U.S. construction and industrial activities, could have a material adverse effect on our overall business, results of operations and financial condition in a number of ways, including the following:
• | a decrease in expected levels of infrastructure spending, including lower than expected government funding for economic stimulus projects; |
• | a decrease in expected levels of capital projects; |
• | a lack of availability of credit or an increase in interest rates due to deterioration or volatility of the banking system or financial markets; |
• | a delay or inability to pay for equipment rentals or fulfill other terms of rental agreements by customers; |
• | a delay or decrease in equipment rentals by existing or potential customers; and |
• | an increase in our equipment inventory costs. |
Our revenues and operating results will fluctuate, which could affect the volatility of the trading of our Class A common stock.
Our revenues and operating results fluctuate from quarter to quarter due to various factors, including:
• | changes in rental rates or changes in demand for our equipment due to economic conditions, competition, weather or other factors; |
• | seasonal rental and purchasing patterns of our customers, with rental and purchasing activity tending to be lower in the winter due to weather and the holiday season; |
• | the cyclical nature of the businesses of our construction customers; |
• | the timing of capital expenditures for rental fleet expansion; |
• | changes in the cost and availability of equipment we purchase, including changes in manufacturer incentive programs; |
• | changes in corporate spending for plants and facilities or changes in government spending for infrastructure projects; |
• | severe weather and seismic conditions temporarily affecting the regions we serve (such as hurricanes, tornadoes, flooding and earthquakes) or the suppliers that supply us with equipment; |
16
• | cost fluctuations, including fuel costs and other raw material costs (such as the price of steel); |
• | other cost fluctuations, such as costs for employee related compensation and healthcare benefits; |
• | potential enactment of new legislation affecting our operations, rental equipment or labor relations; |
• | the timing and cost of opening new rental or customer repair center locations or acquiring new locations; and |
• | our effectiveness in integrating new or acquired rental or customer repair center locations and branch locations, in integrating acquisitions with existing operations, or in achieving the anticipated benefits of such integrations, expansions and acquisitions. |
Any of these factors could increase the volatility, or materially adversely affect, the trading price of our Class A common stock.
The equipment rental industry is highly competitive, and competitive pressures could lead to a decrease in our market share or in rental rates and our ability to sell equipment at favorable prices.
The equipment rental industry is highly fragmented and very competitive. Our competitors include:
• | a few large national companies, including public companies and divisions of public companies; |
• | several regional competitors that operate in multiple states; |
• | thousands of small, independent businesses with only one or a few rental locations; and |
• | hundreds of equipment manufacturers and dealers that both sell and rent equipment directly to customers. |
Some of our competitors are significantly larger than we are and have greater financial and marketing resources than we have. In addition, some of our competitors have a more diversified offering than us. Some of our competitors also have greater technical resources, longer operating histories, lower cost structures and better relationships with equipment manufacturers than we have. In addition, certain of our competitors are more geographically diverse than we are and have greater name recognition among customers than we do. As a result, our competitors that have the advantages identified above may be able to provide their products and services at lower costs or may be able to capture a greater market share. We may in the future encounter increased competition in the equipment rental market, equipment sales market or in the equipment repair and services market from existing competitors or from new market entrants.
We believe that rental rates, fleet size and quality are the primary competitive factors in the equipment rental industry. From time to time, we or our competitors may attempt to compete aggressively by lowering rental rates or prices. Competitive pressures could materially adversely affect our revenues and operating results by decreasing our market share or depressing the rental rates. To the extent we lower rental rates or increase our fleet in order to retain or increase market share, our operating margins would be adversely impacted. In addition, we may not be able to match a larger competitor's price reductions or fleet investment because of its greater financial resources, all of which could adversely impact our operating results through a combination of a decrease in our market share and revenues.
We are exposed to various risks relating to legal proceedings or claims that could materially adversely affect our operating results. The nature of our business exposes us to various liability claims which may exceed the level of our insurance coverage and thereby not fully protect us, or not be covered by our insurance at all, and this could have a material adverse effect on our operating performance.
We are a party to lawsuits in the normal course of our business. Litigation in general can be expensive, lengthy and disruptive to normal business operations. Moreover, the results of complex legal proceedings are difficult to predict. Responding to lawsuits brought against us, or legal actions that we may initiate, can often be expensive and time consuming. Unfavorable outcomes from these claims and/or lawsuits could materially adversely affect our business, results of operations and financial condition, and we could incur substantial monetary liability and/or be required to change our business practices.
Our business exposes us to claims for personal injury, death or property damage resulting from the use of the equipment we rent, sell, service or repair and from injuries caused in motor vehicle accidents in which our personnel are involved and other employee related matters. Additionally, we could be subject to potential litigation associated with compliance with various laws and governmental regulations at the federal, state or local levels, such as those relating to the protection of persons with disabilities, employment, health, safety, security and other regulations under which we operate.
17
We carry comprehensive insurance, subject to deductibles, at levels we believe are sufficient to cover existing and future claims made during the respective policy periods. However, we may be exposed to multiple claims, including workers compensation claims, that do not exceed our deductibles, and, as a result, we could incur significant out-of-pocket costs that could materially adversely affect our business, financial condition and results of operations. In addition, the cost of such insurance policies may increase significantly upon renewal of those policies as a result of general rate increases for the type of insurance we carry as well as our historical experience and experience in our industry. Our existing or future claims may exceed the coverage level of our insurance, and such insurance may not continue to be available on economically reasonable terms, or at all. If we are required to pay significantly higher premiums for insurance, are not able to maintain insurance coverage at affordable rates or if we must pay amounts in excess of claims covered by our insurance, we could experience higher costs that could materially adversely affect our business, financial condition, results of operations and cash flows. In addition, we may be subject to various legal proceedings and claims, such as claims for punitive damages or damages arising from intentional misconduct, either asserted or unasserted, that may not be covered by our insurance. Any such claims, whether with or without merit, could be time consuming and expensive to defend and could divert management's attention and resources.
We depend on key personnel whom we may not be able to retain.
Our operations are managed by a small number of key executive officers, and our future performance depends on the continued contributions of those management personnel. A loss of one or more of these key people could harm our business and prevent us from implementing our business strategy. We do not maintain "key man" life insurance on the lives of any members of our senior management. We have existing employment agreements with certain key executives. However, each of the employment agreements is of limited duration. We cannot assure you that these executives will remain employed with us for the full term of their agreements or that the term of their agreements will be extended beyond the current term.
The success of our operations also depends in part on our ability to attract, hire, train and retain qualified managerial, sales and marketing personnel. Competition for these types of personnel is high. We may be unsuccessful in attracting and retaining the personnel we require to conduct our operations successfully and, in such an event, our business could be materially adversely affected.
We may recognize significantly higher maintenance costs in connection with increases in the weighted average age of our rental fleet.
As our fleet of rental equipment ages, the cost of maintaining such equipment, if not replaced, will likely increase. We manage the average age of different types of equipment according to the expected wear and tear that a specific type of equipment is expected to experience over its useful life. As of December 31, 2016, the average age of our rental equipment fleet was approximately 48 months. As of December 31, 2016, approximately 54% (based on OEC) of our rental fleet consisted of earthmoving equipment, which generally has higher maintenance costs than similar-sized aerial or material handling equipment. It is possible that we may allow the average age of our rental equipment fleet to increase, which would require an increase in the amounts we invest in maintenance, parts and repair. We cannot assure you that costs of maintenance, parts or repair will not materially increase in the future. Any material increase in such costs could have a material adverse effect on our business, financial condition and results of operations.
We are subject to numerous environmental and health and safety laws and regulations that may result in our incurring liabilities, which could have a material adverse effect on our operating performance.
Our facilities and operations are subject to comprehensive and frequently changing federal, state and local laws and regulations relating to environmental protection and health and safety. These laws and regulations govern, among other things, the discharge of substances into the air, water and land, the handling, storage, transport, use and disposal of hazardous materials and wastes and the cleanup of properties affected by pollutants. If we violate environmental laws or regulations, we may be required to implement corrective actions and could be subject to civil or criminal fines or penalties or other sanctions. Although expenses related to environmental compliance have not been material to date, we cannot assure you that we will not have to make significant capital or operating expenditures in the future in order to comply with applicable laws and regulations or that we will comply with applicable environmental laws at all times. Such violations or liability could have a material adverse effect on our business, financial condition and results of operations.
Environmental laws also impose obligations and liability for the investigation and cleanup of properties affected by hazardous substance spills or releases. These liabilities are often joint and several (which could result in an entity paying for more than its fair share), and may be imposed on the parties generating or disposing of such substances or on the owner or operator of affected property, often without regard to whether the owner or operator knew of, or was responsible for, the presence of hazardous substances. We may also have liability for past contamination as successors-in-interest for companies which were acquired or where there was a merger. Accordingly, we may become liable, either contractually or by operation of law, for investigation, remediation, monitoring and other costs even if the contaminated property is not presently owned or operated by us, or if the
18
contamination was caused by third parties during or prior to our ownership or operation of the property. Contamination and exposure to hazardous substances can also result in claims for damages, including personal injury, property damage, and natural resources damage claims.
All of our properties currently have above ground and/or underground storage tanks and oil-water separators (or equivalent wastewater collection/treatment systems). Given the nature of our operations (which involve the use of diesel and other petroleum products, solvents and other hazardous substances) for fueling, washing and maintaining our rental equipment and vehicles, and the historical operations at some of our properties, we may incur material costs associated with soil or groundwater contamination. Future events, such as changes in existing laws or policies or their enforcement, or the discovery of currently unknown contamination, may give rise to remediation liabilities or other claims or costs that may be material.
Various U.S. and international authorities continue to consider legislation and regulations related to greenhouse gas emissions. Should legislation or regulations be adopted imposing significant limitations on greenhouse gas emissions or costs on entities deemed to be responsible for such emissions, demand for our services could be affected, our costs could increase, and our business, financial condition and results of operations could be materially adversely affected.
We are dependent on our relationships with our key equipment manufacturers and the termination of one or more of our relationships with any of these key equipment manufacturers or their inability to fulfill the terms of their agreements with us could have a material adverse effect on our business.
We purchase most of our rental and sales equipment from a limited number of OEMs. For example, as of December 31, 2016, equipment from JLG Industries, Komatsu, John Deere and Kobelco represented approximately 14.4%, 10.9%, 8.1% and 7.9%, respectively, of our total OEC. Termination of one or more of our relationships with any of these or other major suppliers or insolvency, financial difficulties or other factors may result in our equipment manufacturers not being able to fulfill the terms of their agreement with us or may force our suppliers to seek to renegotiate existing contracts with us. Although we believe we have alternative sources of supply for the equipment we need, termination of our relationship with any of our key suppliers could have a material adverse effect on our business, financial condition and results of operations if we were unable to obtain adequate equipment for rental and sale from other sources in a timely manner, on favorable terms or at all. Because our major suppliers also sell equipment to our competitors, our relationships with our suppliers do not provide us any particular competitive advantage.
Our rental fleet is subject to residual value risk upon disposition.
The market value of any given piece of rental equipment could be less than its depreciated value at the time it is sold. The market value of used rental equipment depends on several factors, including:
• | the market price for new equipment of a like kind; |
• | wear and tear on the equipment relative to its age; |
• | the age of the equipment at the time it is sold; |
• | the time of year that it is sold (generally prices are higher during the peak construction season for any given area); |
• | worldwide and domestic supply of and demand for used equipment; |
• | inventory levels at OEMs; and |
• | general economic conditions. |
We include in income from operations the difference between the sales price and the depreciated value of an item of equipment sold. Changes in our assumptions regarding depreciation could change our depreciation expense, as well as the gain or loss realized upon disposal of equipment. If prices we are able to obtain for our used rental equipment decline or fall below our projections or if we sell our equipment in lesser quantities as a result of the above or other factors, our operating results may be materially adversely affected.
The cost of new equipment we use in our rental fleet may increase, which may cause us to spend significantly more for replacement equipment, and in some cases we may not be able to procure equipment at all due to supplier constraints.
We operate in a capital intensive business. Price increases could materially adversely affect our business, financial condition and results of operations.
While we can manage the size and aging of our fleet generally over time, eventually we must retire older equipment and either allow our fleet to shrink or replace the older equipment in our fleet with newer models. We anticipate that we will need to
19
purchase additional equipment in 2017 in order to supplement our current fleet. We may be at a competitive disadvantage if the average age of our fleet increases compared to the age of our competitors' fleets.
In some cases, we may not be able to procure replacement equipment on a timely basis to the extent that manufacturers for the equipment we need are not able to produce sufficient inventory on schedules that meet our timing demands. If demand for new equipment increases significantly, manufacturers may not be able to meet customer orders on a timely basis. As a result, we at times may experience long lead times for certain types of new equipment and we cannot assure you that we will be able to acquire the types or sufficient numbers of the equipment we need to replace older equipment as quickly as we would like. Consequently, we may have to age our fleet longer than we would consider optimal or shrink our fleet, either of which could restrict our ability to grow our business.
Trends in oil and gas prices could adversely affect the level of exploration, development and production activity of certain of our customers and the demand for our services and products.
Demand for our services and products is sensitive to the level of exploration, development and production activity of, and the corresponding capital spending by, oil and gas companies, including national oil companies, regional exploration and production providers, and related service providers. The level of exploration, development and production activity is directly affected by trends in oil and gas prices, which historically have been volatile and are likely to continue to be volatile.
Prices for oil and gas are subject to large fluctuations in response to relatively minor changes in the supply of and demand for oil and gas, market uncertainty, and a variety of other economic factors that are beyond our control. Factors affecting the prices of oil and gas include:
• | the level of supply and demand for oil and gas; |
• | governmental regulations, including the policies of governments regarding the exploration for, and production and development of, oil and gas reserves; |
• | weather conditions and natural disasters; |
• | worldwide political, military and economic conditions; |
• | the level of oil production by non-Organization of the Petroleum Exporting Countries ("OPEC") countries and the available excess production capacity within OPEC; |
• | oil refining capacity and shifts in customer preferences toward fuel efficiency and the use of gas; |
• | the cost of producing and delivering oil and gas; and |
• | potential acceleration of the development of alternative fuels. |
Any prolonged reduction in oil and gas prices will depress the immediate levels of exploration, development and production activity, which could have an adverse effect on our business, results of operations and financial condition. Even the perception of longer-term lower oil and gas prices by oil and gas companies and related service providers can similarly reduce or defer major expenditures by these companies and service providers given the long-term nature of many large scale development projects.
Disruptions in or threats to the security of our information technology and customer relationship management systems could materially adversely affect our operating results by limiting our capacity to effectively monitor and control our operations.
Our information technology systems facilitate our ability to monitor and control our operations to adjust to changing market conditions, including management of our rental fleet. Our CRM system allows our sales force to access comprehensive information about customer activity relating to specific accounts to assist their sales efforts. The effectiveness of our sales force depends upon the continuous availability and reliability of our CRM system. Consequently, any disruptions in our information technology or customer relationship management systems or the failure of these systems, including our redundant systems, to operate as expected could, depending on the magnitude of the problem, impair our ability to effectively monitor and control our existing operations and improve our future sales efforts, and thereby materially adversely affect our operating results.
Additionally, we collect and store data in the ordinary course of our business that is sensitive to our company and our customers. Operating our information technology systems and networks in a manner that maintains this data in a secure manner is critical to our business. Potential security threats, including cybersecurity attacks to gain unauthorized access to our systems, networks and data are increasing in frequency and sophistication and have impacted a number of companies, including companies much larger than us. While we actively manage information technology security risks within our control, we cannot assure you that such actions will be sufficient to prevent or mitigate all potential risks to our systems, networks and data. If we were to
20
experience a material cybersecurity attack, such attack may materially adversely affect our operating results, and may result in reputational damage, litigation with third parties, and increased cybersecurity protection and remediation costs.
Potential acquisitions and expansions into new markets may result in significant transaction expenses and expose us to risks associated with entering new markets and integrating new or acquired operations.
We may encounter risks associated with entering new markets in which we have limited or no experience. Startup rental locations, in particular, require significant capital expenditures and may initially have a negative impact on our short-term cash flow, net income and results of operations. New startup locations may not become profitable when projected or ever. Acquisitions may impose significant strains on our management, operating systems and financial resources and could experience unanticipated integration issues. The pursuit and integration of acquisitions will require substantial attention from our senior management, which will limit the amount of time they have available to devote to our existing operations. Our ability to realize the expected benefits from any future acquisitions depends in large part on our ability to integrate and consolidate the new operations with our existing operations in a timely and effective manner. Future acquisitions also could result in the incurrence of substantial amounts of indebtedness and contingent liabilities (including potentially environmental, employee benefits and safety and health liabilities), accumulation of goodwill that may become impaired, and an increase in amortization expenses related to intangible assets. Any significant diversion of management's attention from our existing operations, the loss of key employees or customers of any acquired business, any major difficulties encountered in the opening of startup locations or the integration of acquired operations or any associated increases in indebtedness, liabilities or expenses could have a material adverse effect on our business, financial condition and results of operations, which could decrease our cash flows and make it more difficult for us to make payments on our indebtedness.
We have operations throughout the United States, which exposes us to multiple state and local regulations. Changes in applicable law, regulations or requirements, or our material failure to comply with any of them, can increase our costs and have other negative impacts on our business.
Our 69 branch locations are located in 14 states and we must comply with many different state and local regulations. These laws and requirements address multiple aspects of our operations, such as worker safety, consumer rights, privacy, employee benefits and more, and can often have different requirements in different jurisdictions. Changes in these requirements, or any material failure by our branches to comply with them, can increase our costs, affect our reputation, limit our business, consume management time and attention and otherwise impact our operations in adverse ways.
If we determine that our goodwill has become impaired, we may incur impairment charges, which would negatively impact our operating results.
At December 31, 2016, we had $60.6 million of goodwill on our consolidated balance sheet. Goodwill represents the excess of cost over the fair value of identifiable net assets of businesses acquired. We assess potential impairment of our goodwill at least annually. Impairment may result from significant changes in the manner of use of the acquired assets, negative industry or economic trends and/or significant underperformance relative to historic or projected operating results. A material impairment charge may occur in a future period. Such a charge could materially adversely affect our financial condition and results of operations.
Labor disputes could disrupt our ability to serve our customers and/or lead to higher labor costs.
Although none of our employees are currently represented by unions or covered by collective bargaining agreements, union organizing activity may take place in the future. Union organizing efforts or collective bargaining negotiations could potentially lead to work stoppages and/or slowdowns or strikes by certain of our employees, which could materially adversely affect our ability to serve our customers. Further, settlement of actual or threatened labor disputes or an increase in the number of our employees covered by collective bargaining agreements can have unknown effects on our labor costs, productivity and flexibility.
Risks Relating to Our Organizational Structure
The Wayzata Funds have substantial control over us including over decisions that require the approval of stockholders, and its interest in our business may conflict with yours.
As of December 31, 2016, the Wayzata Funds held a majority of the combined voting power of our common stock through its ownership of 100% of our outstanding Class B common stock.
Accordingly, the Wayzata Funds, acting alone, have the ability to approve or disapprove substantially all transactions and other matters submitted to a vote of our stockholders, such as a merger, consolidation, dissolution or sale of all or substantially all of our assets, the issuance or redemption of certain additional equity interests, and the election of directors. These voting and class approval rights may enable the Wayzata Funds to consummate transactions that may not be in the best interests of holders
21
of our Class A common stock or, conversely, prevent the consummation of transactions that may be in the best interests of holders of our Class A common stock. In addition, although the Wayzata Funds have voting control of us, the Wayzata Funds' entire economic interest in us is in the form of its direct interest in Neff Holdings through the ownership of Neff Holdings' common units, the payments it may receive from us under the tax receivable agreement (the "Tax Receivable Agreement") and the proceeds it may receive upon any redemption of its common units in Neff Holdings, including issuance of shares of our Class A common stock upon any such redemption and any subsequent sale of such Class A common stock. As a result, the Wayzata Funds' interests may conflict with the interests of our Class A common stockholders. For example, the Wayzata Funds may have different tax positions from us which could influence their decisions regarding whether and when to dispose of assets, whether and when to incur new or refinance existing indebtedness, especially in light of the existence of a Tax Receivable Agreement that we entered into in connection with our initial public offering, and whether and when we should terminate the Tax Receivable Agreement and accelerate our obligations thereunder. In addition, the structuring of future transactions may take into consideration tax or other considerations of the Wayzata Funds or other certain members of management of Neff Holdings and certain non-executive members of its board of managers (collectively, the "Prior LLC Owners") even in situations where no similar considerations are relevant to us.
In addition, Wayzata is in the business of making or advising on investments in companies and may hold, and may from time to time in the future acquire interests in or provide advice to businesses that directly or indirectly compete with certain portions of our business or are suppliers or customers of ours. Our amended and restated certificate of incorporation provides that, to the fullest extent permitted by law, none of Wayzata or any director who is not employed by us or his or her affiliates will have any duty to refrain from engaging in a corporate opportunity in the same or similar lines of business as us. Wayzata may also pursue acquisitions that may be complementary to our business, and, as a result, those acquisition opportunities may not be available to us.
Our only asset is our interest in Neff Holdings, and accordingly we depend on distributions from Neff Holdings to pay taxes and expenses, including payments under the Tax Receivable Agreement. Neff Holdings' ability to make such distributions may be subject to various limitations and restrictions.
We are a holding company and have no material assets other than our ownership of common units of Neff Holdings. We have no independent means of generating revenue or cash flow, and our ability to pay dividends in the future, if any, is dependent upon the financial results and cash flows of Neff Holdings and its subsidiaries and distributions we receive from Neff Holdings. There can be no assurance that our subsidiaries will generate sufficient cash flow to pay dividends or distribute funds to us or that applicable state law and contractual restrictions, including negative covenants in our debt instruments, will permit such dividends or distributions.
Neff Holdings is treated as a partnership for U.S. federal income tax purposes and, as such, is not subject to any entity-level U.S. federal income tax. Instead, taxable income is allocated to holders of its common units, including us. As a result, we incur income taxes on our allocable share of any net taxable income of Neff Holdings. Under the terms of Neff Holdings' second amended and restated limited liability company agreement (the "Neff Holdings LLC Agreement"), Neff Holdings is obligated to make tax distributions to holders of its common units, including us. In addition to tax expenses, we also incur expenses related to our operations, including expenses under the Tax Receivable Agreement, which could be significant. We intend, as its managing member, to cause Neff Holdings to make distributions in an amount sufficient to allow us to pay our taxes and operating expenses, including any payments due under the Tax Receivable Agreement. However, Neff Holdings' ability to make such distributions is subject to various limitations and restrictions including, but not limited to, restrictions on distributions that would either violate any contract or agreement to which Neff Holdings LLC is then a party, including debt agreements, or any applicable law, or that would have the effect of rendering Neff Holdings insolvent. If Neff Holdings does not have sufficient funds to pay tax or other liabilities to fund our operations, we may have to borrow funds, which could materially adversely affect our liquidity and financial condition and subject us to various restrictions imposed by any such lenders. To the extent that we are unable to make payments under the Tax Receivable Agreement for any reason, such payments will be deferred and will accrue interest until paid. If Neff Holdings does not have sufficient funds to make distributions, our ability to declare and pay cash dividends in the future may also be restricted or impaired.
Our Tax Receivable Agreement with our Prior LLC Owners requires us to make cash payments to them in respect of certain tax benefits to which we may become entitled, and the amounts that we may be required to pay could be significant.
Pursuant to the Tax Receivable Agreement, we will be required to make cash payments to our Prior LLC Owners equal to 85% of the tax benefits, if any, that we actually realize, or in some circumstances are deemed to realize as a result of (i) increases in tax basis resulting from any redemptions or exchanges of common units, (ii) certain allocations in connection with our initial public offering and as a result of the application of the principles of Section 704(c) of the Internal Revenue Code to take into account the difference between the fair market value and the adjusted tax basis of certain assets of Neff Holdings on the date that we purchased Neff Holdings common units directly from Neff Holdings with a portion of the proceeds from our initial public
22
offering and (iii) certain other tax benefits related to our entering into the Tax Receivable Agreement, including tax benefits attributable to payments under the Tax Receivable Agreement.
The amount of the cash payments that we may be required to make under the Tax Receivable Agreement could be significant. Payments under the Tax Receivable Agreement will be based on the tax reporting positions that we determine, which tax reporting positions will be based on the advice of our tax advisors. Any payments made by us to our Prior LLC Owners under the Tax Receivable Agreement will generally reduce the amount of overall cash flow that might have otherwise been available to us. To the extent that we are unable to make timely payments under the Tax Receivable Agreement for any reason, the unpaid amounts will be deferred and will accrue interest until paid by us. Furthermore, our future obligation to make payments under the Tax Receivable Agreement could make us a less attractive target for an acquisition, particularly in the case of an acquirer that cannot use some or all of the tax benefits that may be deemed realized under the Tax Receivable Agreement. The payments under the Tax Receivable Agreement are also not conditioned upon our Prior LLC Owners maintaining a continued ownership interest in either Neff Holdings or us.
We expect that the payments we will be required to make under the Tax Receivable Agreement will be substantial. Assuming that the holders of the common units of Neff Holdings would have sold all of their common units to us as of December 30, 2016, there are no material changes in the relevant tax law, Neff Holdings is able to fully depreciate or amortize its assets, we earn sufficient taxable income to realize full tax benefit of the increased depreciation and amortization of our assets, and the market value of one share of Class A common stock is equal to the price per share on December 30, 2016, we expect that the payments under the Tax Receivable Agreement associated with (i) the purchase of common units from Neff Holdings with proceeds from our IPO on November 26, 2014 and (ii) future redemptions or exchanges of common units as described above could aggregate approximately $310.0 million and range from approximately $11.0 million to $45.0 million per year, over a 15 year period.
The amounts that we may be required to pay to our Prior LLC Owners under the Tax Receivable Agreement may be accelerated in certain circumstances and may also significantly exceed the actual tax benefits that we ultimately realize.
The Tax Receivable Agreement provides that if certain mergers, asset sales, other forms of business combination, or other changes of control were to occur, or that if, at any time, we elect an early termination of the Tax Receivable Agreement, then the Tax Receivable Agreement will terminate and our obligations, or our successor's obligations, to make payments under the Tax Receivable Agreement would accelerate and become immediately due and payable. The amount due and payable in that circumstance is determined based on certain assumptions, including an assumption that we would have sufficient taxable income to fully utilize all potential future tax benefits that are subject to the Tax Receivable Agreement.
As a result of a change in control or our election to terminate the Tax Receivable Agreement early, (i) we could be required to make cash payments to our Prior LLC Owners that are greater than the specified percentage of the actual benefits we ultimately realize in respect of the tax benefits that are subject to the Tax Receivable Agreement and (ii) we would be required to make an immediate cash payment equal to the present value of the anticipated future tax benefits that are the subject of the Tax Receivable Agreement, which payment may be made significantly in advance of the actual realization, if any, of such future tax benefits. In these situations, our obligations under the Tax Receivable Agreement could have a substantial negative impact on our liquidity and could have the effect of delaying, deferring or preventing certain mergers, asset sales, other forms of business combination, or other changes of control. There can be no assurance that we will be able to finance our obligations under the Tax Receivable Agreement.
We will not be reimbursed for any payments made to our existing investors under the Tax Receivable Agreement in the event that any tax benefits are disallowed.
We will not be reimbursed for any cash payments previously made to our Prior LLC Owners pursuant to the Tax Receivable Agreement if any tax benefits initially claimed by us are subsequently challenged by a taxing authority and are ultimately disallowed. Instead, any excess cash payments made by us to a Prior LLC Owner will be netted against any future cash payments that we might otherwise be required to make under the terms of the Tax Receivable Agreement. However, we might not determine that we have effectively made an excess cash payment to our Prior LLC Owners for a number of years following the initial time of such payment. As a result, it is possible that we could make cash payments under the Tax Receivable Agreement that are substantially greater than our actual cash tax savings.
Unanticipated changes in effective tax rates or adverse outcomes resulting from examination of our income or other tax returns could adversely affect our operating results and financial condition.
We are subject to income taxes in the United States, and our domestic tax liabilities will be subject to the allocation of expenses in differing jurisdictions. Our future effective tax rates could be subject to volatility or adversely affected by a number of factors, including:
23
• | changes in the valuation of our deferred tax assets and liabilities; |
• | expected timing and amount of the release of any tax valuation allowances; |
• | changes in the Tax Receivable Agreement liability; |
• | tax effects of stock-based compensation; |
• | costs related to intercompany restructurings; or |
• | changes in tax laws, regulations or interpretations thereof. |
In addition, we may be subject to audits of our income, sales and other transaction taxes by U.S. federal and state authorities. Outcomes from these audits could have an adverse effect on our operating results and financial condition.
If we were deemed to be an investment company under the Investment Company Act of 1940, as amended (the "1940 Act"), as a result of our ownership of Neff Holdings, applicable restrictions could make it impractical for us to continue our business as contemplated and could have a material adverse effect on our business.
Under Sections 3(a)(1)(A) and (C) of the 1940 Act, a company generally will be deemed to be an "investment company" for purposes of the 1940 Act if (i) it is, or holds itself out as being, engaged primarily, or proposes to engage primarily, in the business of investing, reinvesting or trading in securities or (ii) it engages, or proposes to engage, in the business of investing, reinvesting, owning, holding or trading in securities and it owns or proposes to acquire investment securities having a value exceeding 40% of the value of its total assets (exclusive of U.S. government securities and cash items) on an unconsolidated basis. We do not believe that we are an "investment company," as such term is defined in either of those sections of the 1940 Act.
As the sole managing member of Neff Holdings, we will control and operate Neff Holdings. On that basis, we believe that our interest in Neff Holdings is not an "investment security" as that term is used in the 1940 Act. However, if we were to cease participation in the management of Neff Holdings, our interest in Neff Holdings could be deemed an "investment security" for purposes of the 1940 Act.
We and Neff Holdings intend to conduct our operations so that we will not be deemed an investment company. However, if we were to be deemed an investment company, restrictions imposed by the 1940 Act, including limitations on our capital structure and our ability to transact with affiliates, could make it impractical for us to continue our business as contemplated and could have a material adverse effect on our business.
Risks Relating to Ownership of Our Class A Common Stock
The Wayzata Funds directly (through Class B common stock) and indirectly (through ownership of Neff Holdings common units) own interests in us, and the Wayzata Funds have the right to redeem such interests pursuant to the terms of the Neff Holdings LLC Agreement.
As of December 31, 2016, we had an aggregate of 91,140,338 shares of Class A common stock authorized but unissued, including approximately 15,709,560 shares of Class A common stock issuable, at our election, in Class A common stock or a cash payment equal to the volume - weighted average market price of the Class A common stock upon redemption of Neff Holdings common units held by the Wayzata Funds and the Prior LLC Owners upon the exercise of options in Neff Holdings. Neff Holdings has entered into the Neff Holdings LLC Agreement and, subject to certain restrictions set forth therein and as described elsewhere in this annual report on Form 10-K, the Wayzata Funds and Prior LLC Owners are entitled thereunder to redeem its common units for an aggregate of up to 15,709,560 shares of our Class A common stock, subject to customary adjustments.
We have also entered into a registration rights agreement (the "Registration Rights Agreement") with the Wayzata Funds and the Prior LLC Owners pursuant to which the shares of Class A common stock issued upon such redemption will be eligible for resale, subject to certain limitations set forth therein. Any sales in connection with the Registration Rights Agreement, or the prospect of any such sales, could materially impact the market price of our Class A common stock and could impair our ability to raise capital through future sales of equity securities.
We cannot predict whether future issuances of our Class A common stock or the availability of shares of our Class A common stock for resale in the open market will affect the market price of our Class A common stock. The issuance of substantial numbers of shares of our Class A common stock in the public market, or upon exchange of common units redeemed by the selling stockholders, or the perception that such issuances might occur, could adversely affect the per share trading price of our Class A common stock. Sales of substantial amounts of our Class A common stock in the public market, or upon exchange of the common
24
units owned by the selling stockholders or others, or speculation that such sales might occur, could adversely affect the liquidity of the market of our Class A common stock or the prevailing market price of our Class A common stock.
You may be diluted by future issuances of additional Class A common stock in connection with any redemption of the common units, our incentive plans, acquisitions or otherwise; future sales of such shares in the public market, or the expectations that such sales may occur, could lower our stock price.
Our amended and restated certificate of incorporation, which we refer to as the "Certificate of Incorporation" authorizes us to issue shares of Class A common stock and options, rights, warrants and appreciation rights relating to Class A common stock for the consideration and on the terms and conditions established by our board of directors in its sole discretion, whether in connection with acquisitions or otherwise. In addition, we and the Wayzata Funds are party to the Neff Holdings LLC Agreement under which the members of Neff Holdings (or certain permitted transferees thereof) have the right (subject to the terms of the Neff Holdings LLC Agreement) to have their common units redeemed by Neff Holdings in exchange for, at Neff Corporation's election, shares of our Class A common stock on a one-for-one basis or a cash payment equal to the volume-weighted average market price of one share of our Class A common stock for each common unit (subject to customary adjustments, including for stock splits, stock dividends and reclassifications); provided that, at Neff Corporation's election, Neff Corporation may effect a direct exchange of such Class A common stock or such cash for such common units. The market price of shares of our Class A common stock could decline as a result of these redemptions or the perception that a redemption could occur. These redemptions, or the possibility that these redemptions may occur, also might make it more difficult for holders of our Class A common stock to sell such stock in the future at a time and at a price that they deem appropriate.
We have reserved shares for issuance under the Neff Corporation 2014 Incentive Award Plan (the “2014 Incentive Award Plan") in an amount equal to 1,500,000 shares of Class A common stock, and we granted options and restricted stock units under the 2014 Incentive Award Plan covering a total of 355,504 shares of Class A common stock concurrently with the consummation of our initial public offering and we granted options and restricted stock units under the 2014 Incentive Award Plan covering a total of 822,534 shares of Class A common stock subsequent to our initial public offering. Any Class A common stock that we issue, including under our 2014 Incentive Award Plan or other equity incentive plans that we may adopt in the future, would dilute the percentage ownership of holders of our Class A common stock. In addition, each common unit received upon the exercise by the Prior LLC Owners of outstanding options to acquire membership units in Neff Holdings will be redeemable for, at Neff Corporation's option, newly-issued shares of Class A common stock on a one-for-one basis or a cash payment equal to the market price of one share of Class A common stock (subject to customary adjustments, including for stock splits, stock dividends and reclassifications) in accordance with the terms of the Neff Holdings LLC Agreement; provided that, at Neff Corporation's election, Neff Corporation may effect a direct exchange of such Class A common stock or such cash for such common units. In addition, we may issue equity in future offerings to fund acquisitions and other expenditures, which may further decrease the value for our stockholders' investment in us.
Since May 20, 2015, we and our officers and directors and Prior LLC Owners are no longer subject to lock-up agreements entered into with Morgan Stanley & Co. LLC and Jefferies LLC which had previously limited the ability of these parties to (i) offer, pledge, sell, contract to sell, sell any option or contract to purchase, purchase any option or contract to sell, grant any option, right or warrant to purchase, lend or otherwise transfer or dispose of, directly or indirectly, any shares of Class A common stock or any securities convertible into or exercisable or exchangeable for shares of Class A common stock; (ii) file any registration statement with the SEC relating to the offering of any shares of Class A common stock or any securities convertible into or exercisable or exchangeable for Class A common stock; or (iii) enter into any swap or other arrangement that transfers to another, in whole or in part, any of the economic consequences of ownership of Class A common stock.
The market price of our Class A common stock has declined subsequent to the restrictions in resale by our existing stockholders lapsing and may continue to decline as a result of sales of our Class A common stock or the expectation that such sales may occur. A decline in the price of our Class A common stock might impede our ability to raise capital through the issuance of additional shares of Class A common stock or other equity securities.
Our Class A common stock price may be volatile or may decline regardless of our operating performance and you may not be able to resell your shares at or above the price you paid for them.
Prior to our initial public offering, there was no public market for our Class A common stock. As a public company, the market price for our Class A common stock is likely to be volatile, in part because our shares were not previously traded publicly. Volatility in the market price of our Class A common stock may prevent you from being able to sell your shares at or above the price you paid for them. Many factors, which are outside our control, may cause the market price of our Class A common stock to fluctuate significantly, including those described elsewhere in this "Risk Factors" section and this annual report on Form 10-K, as well as the following:
25
• | issuances, exchanges or sales, or expected issuances, exchanges or sales of our capital stock; |
• | our operating and financial performance and prospects; |
• | our quarterly or annual earnings or those of other companies in our industry compared to market expectations; |
• | conditions that impact demand for our services; |
• | future announcements concerning our business or our competitors' businesses; |
• | the public's reaction to our press releases, other public announcements and filings with the SEC; |
• | the size of our public float; |
• | changes in market valuations of similar companies; |
• | coverage by or changes in financial estimates by securities analysts or failure to meet their expectations; |
• | market and industry perception of our success, or lack thereof, in pursuing our growth strategy; |
• | strategic actions by us or our competitors, such as acquisitions or restructurings; |
• | adverse market reaction to any increased indebtedness we incur in the future; |
• | changes in laws or regulations which adversely affect our industry or us; |
• | changes in accounting standards, policies, guidance, interpretations or principles; |
• | changes in senior management or key personnel; |
• | changes in our dividend policy; |
• | adverse resolution of new or pending litigation against us; and |
• | changes in general market, economic and political conditions in the United States and global economies or financial markets, including those resulting from natural disasters, terrorist attacks, acts of war and responses to such events. |
As a result, volatility in the market price of our Class A common stock may prevent our stockholders from being able to sell their Class A common stock at or above the price paid for them or at all. These broad market and industry factors may materially reduce the market price of our Class A common stock, regardless of our operating performance. In addition, price volatility may be greater if the public float and trading volume of our Class A common stock is low. As a result, you may suffer a loss on your investment.
We do not intend to pay dividends on our Class A common stock for the foreseeable future.
We currently have no intention to pay dividends on our Class A common stock at any time in the foreseeable future. Any decision to declare and pay dividends in the future will be made at the discretion of our board of directors and will depend on, among other things, our results of operations, financial conditions, cash requirements, contractual restrictions and other factors that our board of directors may deem relevant. Certain of our debt instruments contain covenants that restrict the ability of our subsidiaries to pay dividends to us. In addition, we are permitted under the terms of our debt instruments to incur additional indebtedness, which may restrict or prevent us from paying dividends on our Class A common stock. Furthermore, our ability to declare and pay dividends may be limited by instruments governing future outstanding indebtedness we may incur.
We may issue shares of preferred stock in the future, which could make it difficult for another company to acquire us or could otherwise adversely affect holders of our Class A common stock, which could depress the price of our Class A common stock.
Our Certificate of Incorporation authorizes us to issue one or more series of preferred stock. Our board of directors has the authority to determine the preferences, limitations and relative rights of the shares of preferred stock and to fix the number of shares constituting any series and the designation of such series, without any further vote or action by our stockholders. Our preferred stock could be issued with voting, liquidation, dividend and other rights superior to the rights of our Class A common stock. The potential issuance of preferred stock may delay or prevent a change in control of us, discouraging bids for our Class A
26
common stock at a premium to the market price, and materially and adversely affect the market price and the voting and other rights of the holders of our Class A common stock.
If securities analysts do not publish research or reports about our company, or if they issue unfavorable commentary about us or our industry or downgrade our Class A common stock, the price of our Class A common stock could decline.
The trading market for our Class A common stock depends in part on the research and reports that third-party securities analysts publish about our company and our industry. We may be unable or slow to attract research coverage and if one or more analysts cease coverage of our company, we could lose visibility in the market. In addition, one or more of these analysts could downgrade our Class A common stock or issue other negative commentary about our company or our industry. As a result of one or more of these factors, the trading price of our Class A common stock could decline.
We cannot assure our stockholders that our share repurchase program will enhance long-term stockholder value. Share repurchases, if any, could increase the volatility of the price of our Class A common stock and could increase our debt.
In November 2015, our board of directors authorized a share repurchase program. Under the program, we are authorized to repurchase shares of our Class A common stock in open market or privately negotiated transactions for an aggregate purchase price not to exceed $25 million. As of December 31, 2016, approximately $13.2 million remains available for repurchases under the current repurchase program. Although the board of directors has authorized a share repurchase program, the share repurchase program does not obligate the Company to repurchase any specific dollar amount or to acquire any specific number of shares. The existence of a share repurchase program could cause our stock price to be higher than it would be in the absence of such a program and could potentially reduce the market liquidity for our stock. The timing and actual number of shares repurchased, if any, will depend on a variety of factors including market and business conditions, the trading price of the Company's Class A common stock, the nature of other investment or strategic opportunities, the rate of dilution of our equity compensation program, the availability of adequate funds, and other factors.
Any repurchases of our Class A common stock pursuant to our share repurchase program could affect our stock price and increase its volatility. Additionally, repurchases under our share repurchase program may increase our debt, which could impact our ability to pursue possible future strategic opportunities and acquisitions and could result in lower overall returns on our cash balances. There can be no assurance that any share repurchases will enhance stockholder value because the market price of our Class A common stock may decline below the levels at which we repurchased shares of stock. Although our share repurchase program is intended to enhance long-term stockholder value, short-term stock price fluctuations could reduce the program’s effectiveness. The repurchase program may in the future be limited, suspended or discontinued at any time without prior notice and any such limitation, suspension or discontinuation could cause the market price of our Class A common stock to decline. There can be no assurance that we will repurchase shares of our Class A common stock under our share repurchase program or that any future repurchases will have a positive impact on the trading price of our Class A common stock or earnings per share.
Delaware law and certain provisions in our Certificate of Incorporation may prevent efforts by our stockholders to change the direction or management of our Company.
We are a Delaware corporation, and the anti-takeover provisions of Delaware law impose various impediments to the ability of a third party to acquire control of us, even if a change of control would be beneficial to our existing stockholders. In addition, our Amended and Restated Certificate of Incorporation and our Amended and Restated By-laws contain provisions that may make the acquisition of our company more difficult without the approval of our board of directors, including, but not limited to, the following:
• | our board of directors is classified into three classes, each of which serves for a staggered three year term; |
• | only our board of directors may call special meetings of our stockholders; |
• | we have authorized undesignated preferred stock, the terms of which may be established and shares of which may be issued as authorized by our board of directors without stockholder approval; |
• | our stockholders have only limited rights to amend our by-laws; and |
• | we require advance notice and duration of ownership requirements for stockholder proposals. |
These provisions could discourage, delay or prevent a transaction involving a change in control of our company. These provisions could also discourage proxy contests and make it more difficult for you and other stockholders to elect directors of your choosing and cause us to take other corporate actions you desire. In addition, because our board of directors is responsible
27
for appointing the members of our management team, these provisions could in turn affect any attempt by our stockholders to replace current members of our management team.
For as long as we are an emerging growth company, we will not be required to comply with certain reporting requirements, including those relating to accounting standards and disclosure about our executive compensation, that apply to other public companies.
We are an "emerging growth company," as defined in Section 2(a) of the Securities Act of 1933, as amended ("Securities Act"), as modified by the Jumpstart our Business Startups Act of 2012 (the "JOBS Act"). As such, we are eligible to take advantage of certain exemptions from various reporting requirements that are applicable to other public companies that are not "emerging growth companies," including, but not limited to, (i) not being required to comply with the auditor attestation requirements of Section 404(b) of the Sarbanes-Oxley Act of 2002 (the "Sarbanes-Oxley Act"), (ii) reduced disclosure obligations regarding executive compensation in our periodic reports and proxy statements and (iii) exemptions from the requirements of holding a non-binding advisory vote on executive compensation and of stockholder approval of any golden parachute payments not previously approved. We have elected to adopt these reduced disclosure requirements. We cannot predict if investors will find our Class A common stock less attractive as a result of our taking advantage of these exemptions and as a result, there may be a less active trading market for our Class A common stock and our stock price may be more volatile.
In addition, Section 107 of the JOBS Act also provides that an "emerging growth company" can take advantage of the extended transition period provided in Section 7(a)(2)(B) of the Securities Act for complying with new or revised accounting standards. In other words, an "emerging growth company" can delay the adoption of certain accounting standards until those standards would otherwise apply to private companies. We intend to take advantage of the benefits of this extended transition period. As a result, our financial statements may not be comparable to companies that comply with public company effective dates.
We could remain an "emerging growth company" through December 31, 2019 or until the earliest of (a) the last day of the first fiscal year in which our annual gross revenues exceed $1 billion, (b) the date that we become a "large accelerated filer" as defined in Rule 12b-2 under the Exchange Act, which would occur if the market value of our common stock that is held by non-affiliates exceeds $700 million as of the last business day of our most recently completed second fiscal quarter and (c) the date on which we have issued more than $1 billion in non-convertible debt securities during the preceding three-year period.
The obligations associated with being a public company require significant resources and management attention, which may divert from our business operations.
We are subject to the reporting requirements of the Securities Exchange Act of 1934, as amended ("Exchange Act") and the Sarbanes-Oxley Act. The Exchange Act requires that we file annual, quarterly and current reports with respect to our business and financial condition. The Sarbanes-Oxley Act requires, among other things, that we establish and maintain effective internal controls and procedures for financial reporting. As a result, we incur significant legal, accounting and other expenses that we did not previously incur as a private company.
In addition, the need to maintain the corporate infrastructure demanded of a public company may divert management's attention from implementing our business strategy, which could prevent us from improving our business, results of operations and financial condition. We have made, and will continue to make, changes to our internal controls, including information technology controls, and procedures for financial reporting and accounting systems to meet our reporting obligations as a public company. However, the measures we take may not be sufficient to satisfy our obligations as a public company. If we do not continue to develop and implement the right processes and tools to manage our changing enterprise and maintain our culture, our ability to compete successfully and achieve our business objectives could be impaired, which could negatively impact our business, financial condition and results of operations. We anticipate that these costs will materially increase our general and administrative expenses.
Furthermore, as a public company, we incur additional legal, accounting and other expenses that have not been reflected in our predecessor's historical financial statements. In addition, rules implemented by the SEC and the NYSE have imposed various requirements on public companies, including establishment and maintenance of effective disclosure and financial controls and certain corporate governance practices. Our management and other personnel have devoted, and will continue to devote a substantial amount of time to these compliance initiatives. These rules and regulations result in our incurring legal and financial compliance costs and will make some activities more time-consuming and costly. As a result, it may be more difficult for us to attract and retain qualified people to serve on our board of directors, our board committees or as executive officers.
Our failure to achieve and maintain effective internal control over financial reporting in accordance with Section 404 of the Sarbanes-Oxley Act as a public company could have a material adverse effect on our business and share price.
Prior to our initial public offering, we had not operated as a public company and were not required to independently comply with Section 404(a) of the Sarbanes-Oxley Act. Section 404(a) of the Sarbanes-Oxley Act requires annual management
28
assessments of the effectiveness of our internal control over financial reporting, starting with the second annual report that we file with the SEC. We were required to meet these standards in the course of preparing our financial statements as of and for the year ended December 31, 2015, and our management was required to report on the effectiveness of our internal control over financial reporting for such year. Additionally, once we are no longer an emerging growth company, as defined by the JOBS Act, our independent registered public accounting firm will be required pursuant to Section 404(b) of the Sarbanes-Oxley Act to attest to the effectiveness of our internal control over financial reporting on an annual basis. The rules governing the standards that must be met for our management to assess our internal control over financial reporting are complex and require significant documentation, testing and possible remediation.
Internal control over financial reporting is a process designed to provide reasonable assurance regarding the reliability of financial reporting and the preparation of financial statements in accordance with US GAAP. We are currently in the process of reviewing, documenting and testing our internal control over financial reporting. We may encounter problems or delays in implementing any changes necessary to make a favorable assessment of our internal control over financial reporting. In addition, we may encounter problems or delays in completing the implementation of any requested improvements and receiving a favorable attestation in connection with the attestation to be provided by our independent registered public accounting firm after we cease to be an emerging growth company. If we cannot favorably assess the effectiveness of our internal control over financial reporting, or if our independent registered public accounting firm is unable to provide an unqualified attestation report on our internal controls after we cease to be an emerging growth company, investors could lose confidence in our financial information and the price of our Class A common stock could decline.
Additionally, the existence of any material weakness or significant deficiency may require management to devote significant time and incur significant expense to remediate any such material weaknesses or significant deficiencies and management may not be able to remediate any such material weaknesses or significant deficiencies in a timely manner. The existence of any material weakness in our internal control over financial reporting could also result in errors in our financial statements that could require us to restate our financial statements, cause us to fail to meet our reporting obligations and cause stockholders to lose confidence in our reported financial information, all of which could materially and adversely affect our business and share price.
29
Item 1B. UNRESOLVED STAFF COMMENTS
None.
Item 2. PROPERTIES
As of December 31, 2016, we operated in 69 rental locations in 14 states. We lease approximately 18,000 square feet for our corporate headquarters in an office building in Miami, Florida. We own the buildings and the land at our Texas City, Texas location. All other sites are leased, generally for terms of five years with renewal options. Owned and leased sites range from approximately 4,000 to 40,000 square feet and typically include: (1) offices for sales, administration and management, (2) a customer showroom displaying equipment and parts, (3) an equipment service area and (4) outdoor and indoor storage facilities for equipment. Each location offers a full range of rental equipment, with the mix of equipment available designed to meet the anticipated needs of the customers in each location.
30
The following table lists our rental facilities by location.
Florida Region | Central Region | |
Miami, FL | Houston, TX | |
West Palm Beach, FL | Ft. Worth, TX | |
Port St. Lucie, FL | Texas City, TX | |
Ft. Myers, FL | Austin, TX | |
Pompano, FL | Odessa, TX | |
Tampa, FL | Houma, LA | |
Venice, FL | Lafayette, LA | |
Jacksonville, FL | New Iberia, LA | |
Tallahassee, FL | St. Rose, LA | |
South Orlando, FL | Baton Rouge, LA | |
Sanford, FL | Bossier City, LA | |
Merritt Island, FL | San Antonio, TX | |
Naples, FL | Lake Charles, LA | |
Gainesville, FL | ||
Atlantic Region | Western Region | |
Charlotte, NC | Las Vegas, NV | |
Raleigh, NC | Phoenix, AZ | |
Charleston, SC | Denver, CO | |
Wilmington, NC | Tucson, AZ | |
Durham, NC | Denver (Central), CO | |
Fayetteville, NC | Littleton (South), CO | |
Florence, SC | San Bernardino, CA | |
Columbia, SC | Anaheim, CA | |
Greenville, NC | San Diego, CA | |
Greer, SC | Sacramento, CA | |
Richmond, VA | Roseville, CA | |
Norfolk, VA | San Lorenzo, CA | |
Newport News, VA | ||
Manassas, VA | ||
Greensboro, NC | ||
Landover, MD | ||
Baltimore, MD | ||
Southeastern Region | ||
Doraville, GA | ||
Forest Park, GA | ||
Brunswick, GA | ||
Nashville, TN | ||
Marietta, GA | ||
Athens, GA | ||
Augusta, GA | ||
Macon, GA | ||
Knoxville, TN | ||
Mobile, AL | ||
Birmingham, AL | ||
Savannah, GA | ||
Chattanooga, TN | ||
31
Item 3. LEGAL PROCEEDINGS
We are party to various litigation matters in the ordinary course of our business. We cannot estimate with certainty our ultimate legal and financial liability with respect to our pending litigation matters. However, we believe, based on our examination of such matters, that our ultimate liability with respect to these matters will not have a material adverse effect on our financial position, results of operations or cash flows.
Item 4. MINE SAFETY DISCLOSURES
None.
32
PART II
Item 5. MARKET FOR REGISTRANT'S COMMON EQUITY, RELATED STOCKHOLDER MATTERS
AND ISSUER PURCHASES OF EQUITY SECURITIES
PRICE RANGE OF COMMON STOCK
Shares of our Class A common stock trade on the NYSE under the symbol "NEFF". There is no established public trading market for our Class B common stock. The following table sets forth, for the periods indicated, the intra-day high and low sale prices for our common stock, as reported by the NYSE.
High | Low | |||||||
2016: | ||||||||
First Quarter | $ | 7.86 | $ | 3.62 | ||||
Second Quarter | 11.68 | 7.01 | ||||||
Third Quarter | 11.05 | 8.05 | ||||||
Fourth Quarter | 15.20 | 8.50 | ||||||
2015: | ||||||||
First Quarter | $ | 11.58 | $ | 6.91 | ||||
Second Quarter | 12.25 | 9.56 | ||||||
Third Quarter | 10.93 | 5.31 | ||||||
Fourth Quarter | 8.70 | 5.45 | ||||||
HOLDERS
As of the close of business on February 23, 2017, there was 3 holders of record of our Class A common stock and 2 holders of record of our Class B common stock. Since many of the shares of Class A common stock are registered in “nominee” or “street” names, we believe that the total number of beneficial owners is considerably higher.
DIVIDEND AND DISTRIBUTION POLICY
The Company has not paid any cash dividend on its common stock since inception. We do not anticipate declaring or paying any cash dividends on our capital stock in the foreseeable future. Any future determination as to the declaration and payment of dividends, if any, will be at the discretion of our board of directors and will depend on then existing conditions, including our operating results, financial condition, contractual restrictions, capital requirements, business prospects and other factors our board of directors may deem relevant. See "Risk Factors—Risks Relating to Ownership of Our Class A Common Stock—We do not intend to pay dividends on our Class A common stock for the foreseeable future." In addition, we are a holding company and have no direct operations, and therefore we will only be able to pay dividends from our available cash on hand and any funds we receive from our subsidiaries. The terms of indebtedness of our subsidiaries restrict our subsidiaries from paying dividends to us. See the Liquidity and Capital Resources section in "Management's Discussion and Analysis of Financial Condition and Results of Operations" and Note 10 - Debt of our financial statements included in this annual report on Form 10-K for a description of these restrictions.
Neff Holdings paid cash distributions to our Prior LLC Owners during the year ended December 31, 2014 of $329.9 million. No cash distributions were made during the year ended December 31, 2015. During the year ended December 31, 2016, Neff Holdings paid cash distributions of $0.3 million for a tax liability attributable to a Wayzata fund. Neff Holdings will continue to make tax distributions to its members in accordance with the Neff Holdings LLC agreement.
33
PURCHASES OF EQUITY SECURITIES BY THE ISSUER
The following table provides information about acquisitions of Neff Corporation's Class A common stock by Neff Corporation during the fourth quarter of 2016:
Period | Total Number of Shares Purchased | Average Price Paid Per Share | Total Number of Shares Purchased as Part of Publicly Announced Plans or Programs (1) | Maximum Dollar Amount of Shares That May Yet Be Purchased Under the Program (1) | ||||||||||
October 1, 2016 to October 31, 2016 | 600 | $ | 9.00 | 600 | $ | 13,693,123 | ||||||||
November 1, 2016 to November 30, 2016 | 51,703 | 8.75 | 51,703 | 13,240,868 | ||||||||||
December 1, 2016 to December 31, 2016 | — | — | — | 13,240,868 | ||||||||||
Total | 52,303 | $ | 8.75 | 52,303 | $ | 13,240,868 | ||||||||
(1) | On November 11, 2015, we announced that our Board approved on November 10, 2015, a share repurchase program authorizing up to $25 million in share repurchases of Neff Corporation's Class A common stock in open market and negotiated purchases from time to time, dependent on market conditions. |
UNREGISTERED SALES OF EQUITY SECURITIES
None.
Stock Performance Graph
This performance graph shall not be deemed “soliciting material” or to be “filed” with the SEC for purposes of Section 18 of the Exchange Act of 1934, or otherwise subject to the liabilities under that section, and shall not be deemed to be incorporated by reference into any filing of ours under the Securities Act or the Exchange Act.
The following stock performance graph illustrates the cumulative total shareholder return on our Class A common stock for the period from November 21, 2014 (the first day of trading for our Class A common stock on the NYSE) to December 31, 2016, as compared to the Russell 2000 Index and an industry peer group selected by us. The peer group we selected is comprised of the following companies: United Rentals, Inc., Hertz Global Holdings, Inc., H&E Equipment Services Inc., and The Ashtead Group, PLC.
The comparison assumes (i) a hypothetical investment of $100 in our Class A common stock and the two above mentioned indices on November 21, 2014 and (ii) the full reinvestment of all dividends. The comparisons in the graph and table are required by the SEC and are not intended to be indicative of possible future performance of our Class A common stock.
34
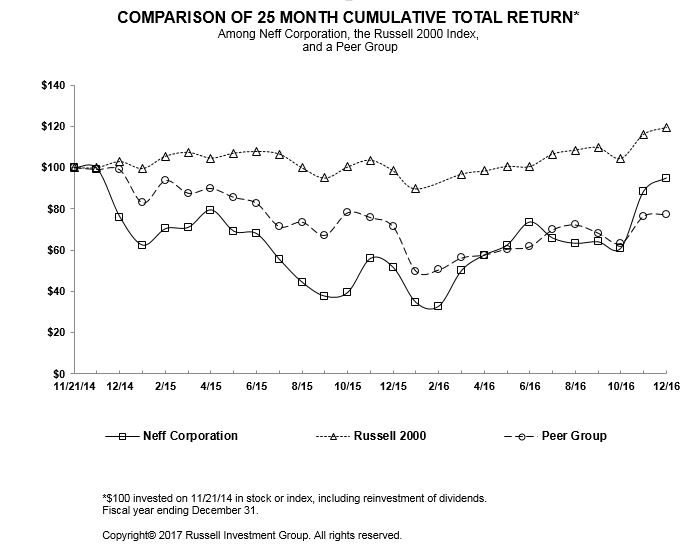
Item 6. SELECTED FINANCIAL DATA
The following tables present the selected financial data of Neff Holdings and its consolidated subsidiaries prior to the IPO and Neff Corporation and its consolidated subsidiaries, including Neff Holdings, subsequent to the IPO, as of the dates and for the periods indicated.
We have derived the selected financial data as of and for the years ended December 31, 2016 and 2015 from the audited consolidated financial statements of Neff Corporation included elsewhere in this annual report on Form 10-K. We have derived the selected financial data as of and for the years ended December 31, 2014, 2013 and 2012 from the audited consolidated financial statements of Neff Holdings not included in this annual report on Form 10-K.
The results of operations for the periods presented below are not necessarily indicative of the results to be expected for any future period. The following selected financial data should be read in conjunction with, and is qualified by reference to, "Management's Discussion and Analysis of Financial Condition and Results of Operations" and the financial statements and the notes thereto included elsewhere in this annual report on Form 10-K.
35
Year Ended December 31, | |||||||||||||||||||
2016 | 2015 | 2014 | 2013 | 2012 | |||||||||||||||
(in thousands of dollars) | |||||||||||||||||||
Statement of Operations Data: | |||||||||||||||||||
Revenues | |||||||||||||||||||
Rental revenues | $ | 360,125 | $ | 335,990 | $ | 324,099 | $ | 281,038 | $ | 234,609 | |||||||||
Equipment sales | 23,303 | 34,772 | 34,479 | 33,487 | 44,828 | ||||||||||||||
Parts and service | 13,556 | 13,099 | 13,382 | 12,682 | 11,540 | ||||||||||||||
Total revenues | 396,984 | 383,861 | 371,960 | 327,207 | 290,977 | ||||||||||||||
Cost of revenues | |||||||||||||||||||
Cost of equipment sold | 14,728 | 23,061 | 19,147 | 19,204 | 25,528 | ||||||||||||||
Depreciation of rental equipment | 88,720 | 83,943 | 73,274 | 70,768 | 66,017 | ||||||||||||||
Cost of rental revenues | 87,810 | 80,007 | 81,040 | 74,482 | 69,337 | ||||||||||||||
Cost of parts and service | 7,592 | 7,598 | 8,180 | 7,677 | 6,982 | ||||||||||||||
Total cost of revenues | 198,850 | 194,609 | 181,641 | 172,131 | 167,864 | ||||||||||||||
Gross profit | 198,134 | 189,252 | 190,319 | 155,076 | 123,113 | ||||||||||||||
Other operating expenses | |||||||||||||||||||
Selling, general and administrative expenses | 96,888 | 90,531 | 81,990 | 78,617 | 71,621 | ||||||||||||||
Other depreciation and amortization | 9,672 | 10,498 | 9,591 | 8,968 | 9,041 | ||||||||||||||
Transaction bonus(1) | — | — | 24,506 | — | — | ||||||||||||||
Total other operating expenses | 106,560 | 101,029 | 116,087 | 87,585 | 80,662 | ||||||||||||||
Income from operations | 91,574 | 88,223 | 74,232 | 67,491 | 42,451 | ||||||||||||||
Other expenses (income) | |||||||||||||||||||
Interest expense(2) | 43,844 | 44,572 | 43,542 | 26,527 | 24,682 | ||||||||||||||
Loss on extinguishment of debt(3) | — | — | 20,241 | — | — | ||||||||||||||
Adjustment to tax receivable agreement | 372 | (2,424 | ) | — | — | — | |||||||||||||
Other non-operating expenses, net(4) | 1,287 | 2,265 | — | — | 102 | ||||||||||||||
Total other expenses (income) | 45,503 | 44,413 | 63,783 | 26,527 | 24,784 | ||||||||||||||
Income before income taxes | 46,071 | 43,810 | 10,449 | 40,964 | 17,667 | ||||||||||||||
(Provision for) benefit from income taxes | (6,829 | ) | (3,625 | ) | 5,359 | (471 | ) | (159 | ) | ||||||||||
Net income | 39,242 | 40,185 | 15,808 | 40,493 | 17,508 | ||||||||||||||
Less: net income attributable to non-controlling interest | 28,502 | 24,594 | 14,209 | 40,493 | 17,508 | ||||||||||||||
Net income attributable to Neff Corporation | $ | 10,740 | $ | 15,591 | $ | 1,599 | $ | — | $ | — | |||||||||
Weighted average shares of Class A common stock outstanding: | |||||||||||||||||||
Basic | 9,358 | 10,477 | 10,476 | ||||||||||||||||
Diluted | 9,667 | 12,069 | 12,011 | ||||||||||||||||
Net income attributable to Neff Corporation per share of Class A common stock(5): | |||||||||||||||||||
Basic | $ | 1.15 | $ | 1.49 | $ | 0.15 | |||||||||||||
Diluted | $ | 1.11 | $ | 1.29 | $ | 0.13 | |||||||||||||
Balance Sheet Data (as of period end): | |||||||||||||||||||
Cash and cash equivalents | $ | 900 | $ | 289 | $ | 207 | $ | 190 | $ | 586 | |||||||||
Rental equipment: | |||||||||||||||||||
Rental equipment at cost | 782,406 | 713,916 | 628,387 | 514,520 | 440,810 | ||||||||||||||
Accumulated depreciation | (320,322 | ) | (256,446 | ) | (208,142 | ) | (167,264 | ) | (124,930 | ) | |||||||||
Rental equipment, net | 462,084 | 457,470 | 420,245 | 347,256 | 315,880 | ||||||||||||||
Total assets(6) | 648,421 | 644,826 | 600,917 | 512,611 | 473,093 | ||||||||||||||
Total indebtedness, net(6)(7) | 691,391 | 721,665 | 711,464 | 465,109 | 336,655 | ||||||||||||||
Stockholders' deficit / members' surplus | (79,208 | ) | (94,614 | ) | (110,331 | ) | 3,082 | 71,365 | |||||||||||
Cash Flow Data: | |||||||||||||||||||
Cash flow from operating activities | 148,916 | 122,214 | 94,086 | 108,410 | 68,331 | ||||||||||||||
Cash flow from investing activities | (101,167 | ) | (129,409 | ) | (127,713 | ) | (125,332 | ) | (131,022 | ) | |||||||||
Cash flow from financing activities | (47,138 | ) | 7,277 | 33,644 | 16,526 | 63,115 | |||||||||||||
36
(1) | Represents payments to management and certain members of Neff Holdings' board of managers made in connection with the consummation of the refinancing of the senior secured notes. |
(2) | Interest expense includes the amortization of debt issue costs (see footnote (4)). |
(3) | Loss on extinguishment of debt includes $8.7 million in unamortized debt issue costs and $7.2 million in call premiums related to the repayment of the senior secured notes and $1.7 million in unamortized debt issue costs and write-off of original issue discount and $2.6 million in prepayment premiums and expenses related to the prepayment of the Second Lien Loan. |
(4) | Other, non-operating expenses, net also includes $1.3 million, $2.3 million and $0.1 million for loss on interest rate swaps for the years ended December 31, 2016, 2015 and 2012, respectively. Amortization of debt issue costs of $1.5 million, $3.1 million, $1.9 million and $1.5 million for the years ended December 31, 2015, 2014, 2013 and 2012, respectively, were reclassified to interest expense (see footnote (2)) in accordance with the Financial Accounting Standards Board's Accounting Standards Update 2015-03, Interest-Imputation of Interest (Subtopic 835-30). Refer to Note 2 of the Notes to Consolidated Financial Statements for further discussion. |
(5) | For the years ended December 31, 2016 and 2015 and the period November 26, 2014 through December 31, 2014. |
(6) | Unamortized debt issuance costs of $8.9 million, $10.4 million, $14.1 million and $6.0 million for the years ended December 31, 2015, 2014, 2013, and 2012, respectively, were reclassified from prepaid expenses and other assets to total liabilities as a direct deduction to the related debt liability in accordance with the Financial Accounting Standards Board's Accounting Standards Update 2015-03, Interest-Imputation of Interest (Subtopic 835-30). Refer to Note 2 of the Notes to Consolidated Financial Statements for further discussion. |
(7) | As of December 31, 2016, our outstanding indebtedness consisted of borrowings under the Revolving Credit Facility and the Second Lien Loan. |
37
Item 7. | MANAGEMENT'S DISCUSSION AND ANALYSIS OF FINANCIAL CONDITION AND RESULTS OF OPERATIONS |
The following discussion and analysis should be read together with the sections titled "Risk Factors," "Selected Financial Data" and the financial statements and the notes thereto included elsewhere in this annual report on Form 10-K. The historical financial data discussed below reflects the historical results of operations and financial condition of Neff Holdings and its consolidated subsidiaries prior to Neff Corporation's IPO completed on November 26, 2014 and Neff Corporation and its consolidated subsidiaries, Neff Holdings and Neff Holdings' subsidiaries, Neff LLC and Neff Rental LLC, subsequent to the IPO. See "Organizational Transactions" included in Note 11 - Capital Structure in this annual report on Form 10-K for a description of the Organizational Transactions and their effect on our historical results of operations. In addition, the statements in this discussion and analysis regarding industry outlook, our expectations regarding the performance of our business, our expected tax rate and benefits and estimated amounts payable pursuant to the Tax Receivable Agreement, liquidity, expected capital expenditures, anticipated future indebtedness or financings and the other non-historical statements are forward-looking statements. These forward-looking statements are subject to numerous risks and uncertainties, including, but not limited to, the risks and uncertainties described in "Risk Factors" and "Forward-Looking Statements." Our actual results may differ materially from those contained in or implied by any forward-looking statements.
Overview
We are a leading regional equipment rental company in the United States, focused on the fast-growing Sunbelt states. We offer a broad array of equipment rental solutions for our diverse customer base, including infrastructure, non-residential construction, oil and gas, municipal and residential construction customers. Our broad fleet of equipment includes earthmoving, material handling, aerial and other related rental equipment, which we package together to meet the specific needs of our customers. We consider the earthmoving equipment category to be a core competency of our Company and a key differentiator of our business.
Our revenues are affected primarily by the time utilization of the equipment in our rental fleet, the rental rates we can charge for that equipment and the amount of equipment we have in our fleet available for rent. See "—Key Performance Measures" for definitions of time utilization and rental rates. We generate revenues from the following three sources:
• | Rental revenues—this consists of rental revenues and related revenues such as the fees we charge for the pickup and delivery of equipment, damage waivers and other surcharges. |
• | Equipment sales—this consists primarily of revenues from the sale of our used rental equipment and also includes sales of ancillary new equipment to our customers. |
• | Parts and service—this includes revenues from customers for fuel and the repair of damaged rental equipment as well as from the sale of complementary parts, supplies and merchandise to our customers in conjunction with our equipment rental business. |
Outlook
We operate in a competitive and capital intensive environment. The participants in our industry consist of national, regional and local rental companies, certain original equipment manufacturers, or OEMs, and their dealers. The equipment rental industry is highly cyclical and its revenues are closely tied to general economic conditions and to conditions in the construction industry in particular. Time utilization and rental rates are a function of market demand, which in turn is tied to the general economic conditions in the geographic regions in which we operate, particularly conditions affecting the non-residential construction industry.
Beginning in the second half of 2011 and continuing through the present, the U.S. construction industry has been growing, which in turn has had a positive impact on the equipment rental industry. We believe that the rental industry will continue to benefit from improving macroeconomic and construction industry conditions. Industry research sources have recently provided optimistic outlooks for U.S. construction spending, including FMI Construction Outlook, which estimates total U.S. construction spending to grow by more than 4.2% from 2016 through 2020. We believe that part of this industry growth will be driven by the ongoing secular shift in North America toward reliance on equipment rental instead of ownership, as evidenced by the increasing penetration rate. According to the American Rental Association Equipment Rental Penetration Index, the penetration rate increased from 51% in 2011 to 53% in 2016. We believe that the shift from owning to renting equipment in North America will continue as construction and industrial firms recognize the advantages of renting rather than owning equipment, and that this trend will continue to result in increased penetration rates in the future. We believe that these trends should continue to support increased rental demand and will result in continued improvement in our business. However, these macroeconomic factors are outside of our control, and we cannot assure you that the improvement in our operating results that we have experienced will continue in future periods. See "Risk Factors—Risks Relating to Our Business—The equipment rental industry is highly cyclical. Decreases in construction or
38
industrial activities could materially adversely affect our revenues and operating results by decreasing the demand for our equipment or the rental rates or prices we can charge."
Seasonality and Other External Factors That Affect Our Business
Our operating results are subject to annual and seasonal fluctuations resulting from a variety of factors, including:
• | the seasonality of rental activity by our customers, with lower activity levels during the winter; |
• | the cyclicality of the construction industry; |
• | the number of our significant competitors and the competitive supply of rental equipment; |
• | general economic conditions; and |
• | the price of oil and other commodities and other general economic trends impacting the industries in which our customers and end users operate. |
In addition, our operating results may be affected by severe weather events and seismic conditions (such as hurricanes, tornadoes, flooding and earthquakes) in the regions we serve. Severe weather events can result in short-term reductions in construction activity levels, but after these periods of reduced construction activity, repair and reconstruction efforts have historically resulted in periods of increased demand for rental equipment.
Financial Highlights
For the year ended December 31, 2016, our rental revenues increased 7.2% to $360.1 million as compared to the prior year and our total revenues increased 3.4% to $397.0 million. The increase in our rental revenues was driven by a 6.8% increase in the average OEC (as defined in Key Performance Measures) of our rental fleet to $813.6 million and an increase of 30 basis points in time utilization to 67.1%, with an offsetting decrease in our rental rates of 0.5%. Net income decreased 2.3% to $39.2 million for the year ended December 31, 2016 as compared to the prior year, and our Adjusted EBITDA (as defined below) increased 4.1% to $193.8 million for the year ended December 31, 2016 as compared to the prior year.
"EBITDA" is defined as net income plus interest expense, provision for (benefit from) income taxes, depreciation of rental equipment and other depreciation and amortization. "Adjusted EBITDA" is defined as EBITDA further adjusted to give effect to other items that we do not consider to be indicative of our ongoing operations, including for the periods presented loss on extinguishment of debt, the transactions bonuses, rental split expense, equity-based compensation expense, adjustment to tax receivable agreement and loss on interest rate swap. EBITDA and Adjusted EBITDA are not measures of performance in accordance with US GAAP and should not be considered as an alternative to net income or operating cash flows determined in accordance with US GAAP. Additionally, EBITDA and Adjusted EBITDA are not intended to be measures of cash flow for management's discretionary use, as they exclude certain cash requirements such as interest payments, tax payments and debt service requirements. We believe that the inclusion of EBITDA and Adjusted EBITDA in this annual report on Form 10-K is appropriate because securities analysts, investors and other interested parties use these non-US GAAP financial measures as important measures of assessing our operating performance across periods on a consistent basis. EBITDA and Adjusted EBITDA have limitations as analytical tools and should not be considered in isolation or as a substitute for analysis of our results as reported under US GAAP. Some of these limitations are:
• | although depreciation and amortization are non-cash charges, the assets being depreciated and amortized will often have to be replaced in the future and EBITDA and Adjusted EBITDA do not reflect any cash requirements for such replacements; |
• | they do not reflect our cash expenditures, or future requirements for capital expenditures or contractual commitments; |
• | they do not reflect changes in, or cash requirements for, our working capital needs; |
• | they do not reflect the significant interest expense, or the cash requirements necessary to service interest or principal payments, on our significant amount of indebtedness; and |
• | they do not reflect the impact of earnings or charges resulting from matters we do not consider to be indicative of our ongoing operations but may nonetheless have a material impact on our results of operations. |
In addition, because not all companies use identical calculations, these presentations of EBITDA and Adjusted EBITDA may not be comparable to similarly titled measures of other companies, including companies in our industry.
The following table reconciles EBITDA and Adjusted EBITDA to our net income for the periods indicated:
39
Year Ended December 31, | |||||||||||
2016 | 2015 | 2014 | |||||||||
(in thousands of dollars) | |||||||||||
Net income | $ | 39,242 | $ | 40,185 | $ | 15,808 | |||||
Interest expense | 43,844 | 44,572 | 43,542 | ||||||||
Provision for (benefit from) income taxes | 6,829 | 3,625 | (5,359 | ) | |||||||
Depreciation of rental equipment | 88,720 | 83,943 | 73,274 | ||||||||
Other depreciation and amortization | 9,672 | 10,498 | 9,591 | ||||||||
EBITDA | 188,307 | 182,823 | 136,856 | ||||||||
Loss on extinguishment of debt(a) | — | — | 20,241 | ||||||||
Transaction bonus(b) | — | — | 24,506 | ||||||||
Rental split expense(c) | 1,852 | 2,300 | 3,658 | ||||||||
Equity based compensation expense(d) | 2,000 | 1,249 | 883 | ||||||||
Adjustment to tax receivable agreement(e) | 372 | (2,424 | ) | — | |||||||
Loss on interest rate swap(f) | 1,287 | 2,265 | — | ||||||||
Adjusted EBITDA | $ | 193,818 | $ | 186,213 | $ | 186,144 | |||||
(a) | Represents expenses and realized losses that were incurred in connection with the redemption of the senior secured notes and the prepayment made in connection with the IPO. |
(b) | Represents payments to management and certain members of Neff Holdings' board of managers made in connection with the consummation of the refinancing of the senior secured notes. |
(c) | Represents cash payments made to suppliers of equipment in connection with rental split expense, which payments are credited against the purchase price of the applicable equipment if the Company elects to purchase that equipment. See "—Results of Operations" for a discussion of rental split expense. |
(d) | Represents non-cash equity-based compensation expense recorded in the periods presented in accordance with US GAAP. |
(e) | Represents adjustments to tax receivable agreement related to changes in estimates used in the calculation of the tax receivable agreement. |
(f) | Represents loss on interest rate swap related to adjustments to fair value. |
For more information regarding our calculation and inclusion of Adjusted EBITDA, see "Key Performance Measures."
Company Structure
Neff Corporation was formed as a Delaware corporation on August 18, 2014. On November 26, 2014, Neff Corporation completed an IPO of 10,476,190 shares of Class A common stock at a public offering price of $15.00 per share. A portion of the gross proceeds received by Neff Corporation from the IPO were used to purchase common membership units (the "Common Units") in Neff Holdings which was wholly owned by private investment funds managed by the Wayzata Funds prior to the IPO. In November 2015, the Company's board of directors authorized a share repurchase program pursuant to which the Company may purchase shares of its Class A common stock in open market and privately negotiated purchases from time to time, dependent upon market conditions. Since the authorization of the share repurchase program, the Company has repurchased 1.7 million shares of Class A common stock for a total cost of $11.8 million, including commissions. As of December 31, 2016, the number of shares of Class A common stock outstanding was 8,859,662.
The historical results of operations discussed in this "Management's Discussion and Analysis of Financial Condition and Results of Operations" includes the consolidated results of the Company.
Neff Corporation, is the sole managing member of Neff Holdings and owns Common Units of Neff Holdings representing a 37.2% equity interest in Neff Holdings, as of December 31, 2016. As the sole managing member of Neff Holdings, we control its business and affairs and, therefore, we consolidate its financial results with ours.
The Wayzata Funds retain Common Units in Neff Holdings representing a collective 62.8% economic interest and a non-controlling interest in Neff Holdings, and we reflect the Wayzata Funds' collective economic interest as a non-controlling interest in our consolidated financial statements. As a result, our net income attributable to us represents 37.2% of Neff Holdings' net income and our only material asset is our corresponding 37.2% economic interest and controlling interest in Neff Holdings. Neff
40
Corporation is a holding company that conducts no operations and, as of the consummation of the IPO, its only material asset is the equity interests of its direct and indirect subsidiaries.
Neff Holdings has historically been and will continue to be treated as a partnership for U.S. federal income tax purposes and, as such, is not subject to any entity-level U.S. federal income tax. Rather, taxable income or loss is included in the respective U.S. federal income tax returns of Neff Holdings' members. Neff Corporation will be subject to income taxes as follows:
• | Provision For (Benefit From) Income Tax—We are a taxpayer subject to income taxes at rates generally applicable to C corporations, and therefore our results of operations are affected by the amount of accruals for tax benefits or payments that Neff Holdings (as a partnership for U.S. federal income tax purposes) historically has not reflected in its results of operations. Our combined statutory federal and state income tax rate for all periods presented in this Form 10-K is approximately 39.0%. |
• | Potential Tax Benefit Due to Special Allocations in connection with the IPO and Future Step-up In Basis—As a result of the organizational transactions (Note 11) and pursuant to U.S. Treasury regulations governing the purchase of an equity interest in a partnership (including a limited liability company such as Neff Holdings that is taxed as a partnership) at a time when the assets of the partnership have a fair market value in excess of tax basis, our purchase of Neff Holdings' Common Units directly from Neff Holdings with a portion of the proceeds from the IPO result in certain special allocations of Neff Holdings' items of loss or deduction to us over time that are in excess of our pro rata share of such items of loss or deduction pursuant to Section 704(c) of the Internal Revenue Code. The principles of Section 704(c) may also serve to allocate items of income or gain to the Wayzata Funds as a result of subsequent dispositions of assets to take into account the difference between the fair market value and basis difference at the time of the organizational transactions (Note 11). We may obtain an increase in our share of the tax basis of the assets of Neff Holdings in the future, when each Prior LLC Owner receives shares of our Class A common stock or cash at our election in connection with an exercise of such Prior LLC Owner's right to have Common Units in Neff Holdings held by such Prior LLC Owner redeemed by Neff Holdings or, at the election of Neff Corporation, exchanged (which we intend to treat as our direct purchase of Common Units from such Prior LLC Owner for U.S. federal income and other applicable tax purposes, regardless of whether such Common Units are surrendered by a Prior LLC Owner to Neff Holdings for redemption or sold to us upon the exercise of our election to acquire such Common Units directly). The special allocations and step-up in tax basis described above may result in a reduction in the amount of taxes that we are required to pay relative to the amount of taxes payable by other members of Neff Holdings who are similarly situated but who do not receive a similar step-up in basis or special allocations. |
• | Tax Receivable Agreement—Under the Tax Receivable Agreement with our Prior LLC Owners, we are obligated to pay to our Prior LLC Owners 85.0% of the amount of tax benefits, if any, that we actually realize (or in some circumstances are deemed to realize) as a result of the step-up in basis and special allocations discussed above. We account for the effects of these increases in tax basis and associated payments under the Tax Receivable Agreement arising from future redemptions or exchanges as follows: |
• | we will record a change in the deferred tax accounts for the estimated income tax effects of the increases in tax basis based on enacted federal and state tax rates at the date of the redemption or exchange; |
• | to the extent we estimate that we will not realize the full benefit of a resulting deferred tax asset, based on an analysis that will consider, among other things, our expectation of future earnings, we will reduce the deferred tax asset with a valuation allowance; and |
• | we will record 85% of the estimated realizable tax benefit as an increase to the liability associated with the future payments due under the Tax Receivable Agreement and the remaining 15.0% of the estimated realizable tax benefit as an increase to additional paid-in capital. |
All of the effects of changes in any of our estimates after the date of the exchange will be included in net income for the period in which those changes occur. Similarly, the effect of subsequent changes in the enacted tax rates will be included in net income for the period in which the change occurs.
41
Key Performance Measures
From time to time, we use certain key performance measures in evaluating our business and results of operations and we may refer to one or more of these key performance measures in this "Management's Discussion and Analysis of Financial Condition and Results of Operations." These key performance measures, in addition to Adjusted EBITDA, include:
• | OEC—we present OEC, defined as the first cost of acquiring the equipment, or in the case of used equipment purchases and rental splits, an estimate of the first cost that would have been paid to acquire the equipment if it had been purchased new in its year of manufacture. |
• | Rental rates—we define rental rates as the rates charged to our customers on rental contracts that typically are for a daily, weekly or monthly term. Rental rates change over time based on a combination of pricing, the mix of equipment on rent and the mix of rental terms with customers. Period over period changes in rental rates are calculated on a weighted average with the weighting based on prior period revenue mix. |
• | Time utilization—we define time utilization as the daily average OEC of equipment on rent, divided by the OEC of all equipment in the rental fleet during the relevant period. |
Results of Operations
The following summary highlights the key elements of certain line items discussed further below in the period-over-period analysis of our results of operations:
• | Total Revenues: |
• | Rental Revenues: relates primarily to revenues received from customers under leases for our rental equipment and includes related revenues such as the fees we charge for the pickup and delivery of equipment, damage waivers and other surcharges. |
• | Equipment Sales: relates primarily to revenues received from third parties upon the sale of used equipment from our rental fleet, which generally increases in the winter months when customer activity and time utilization are comparatively lower. To a much lesser extent, this line item also includes revenues received upon the sale to customers of ancillary new equipment. |
• | Parts and Service: relates primarily to revenues received from sales of complementary parts, supplies and merchandise in conjunction with our equipment rental business, as well as from services provided to repair rental equipment damaged by customers, which is billable to our customers, and fuel costs charged to customers. |
• | Cost of Equipment Sold: relates primarily to the net book value of our used rental fleet that is sold in the ordinary course of our active fleet management. To a much lesser extent, this line item also includes net book value of ancillary new equipment that is sold. |
• | Depreciation of Rental Equipment: relates to the depreciation of the cost of equipment in our rental fleet and is generally calculated on a straight-line basis over the estimated service life of the asset (generally two to eight years with a 10% to 20% residual value). |
• | Cost of Rental Revenues: relates primarily to the delivery and retrieval of rental equipment (including fuel), maintenance and repairs to our rental equipment fleet (including parts), and labor costs and related payroll expenses (such as insurance, benefits and overtime) for drivers and mechanics. This line item also includes the portion of rental revenues paid over to OEMs under rental splits, described below, that we may have in place from time to time. |
• | Cost of Parts and Service: relates primarily to costs attributable to the sale of parts and fuel directly to customers and service provided for the maintenance and repair of our equipment damaged by customers, which is billable to our customers. |
• | Selling, General and Administrative Expenses: relates primarily to general selling, general overhead and administrative costs such as branch management and sales, accounting, finance, legal and marketing expenses. This line item also includes payments under leases for our headquarters and branch locations, expenses associated with software licenses, property taxes payable on our rental equipment and payroll, sales commission, bonus and benefits expenses allocable to executive, regional and branch management. This line item also includes provisions for bad debt expense and any ordinary course litigation expense. |
42
• | Other Depreciation and Amortization: relates primarily to depreciation of non-rental property, plant and equipment, such as trucks and trailers used to transport rental equipment as well as office equipment and amortization of intangibles such as customer lists. |
• | Interest Expense: relates primarily to interest expense incurred in connection with our long-term debt facilities and the amortization of the related original issue discount and debt issue costs, in each case for the periods in which those debt obligations were outstanding. |
We utilize rental splits in our operations. Rental splits are a consignment arrangement of new equipment by OEMs in which we hold their equipment in our rental fleet for a period of time (typically between three and 12 months) and agree to share with the OEM a percentage of the rental revenue we receive on the rental of that unit. We do not take title to the unit under this arrangement and we can return the unit to the OEM at any time at no additional cost to us. We also can elect to purchase the unit from the OEM from time to time. The revenue we pay to the OEM under rental splits is expensed in cost of rental revenues on our statement of operations, but added back to Adjusted EBITDA in order to maintain comparability to our results from period to period. If we exercise the option to purchase the unit, the unit becomes part of our rental fleet and is depreciated, with depreciation added back to Adjusted EBITDA. Before we exercise the option to purchase a unit, we count the unit as part of our rental fleet for OEC calculations but do not depreciate the unit. As of December 31, 2016, rental splits accounted for approximately 0.9% of our average OEC.
43
Year Ended December 31, 2016 Compared to Year Ended December 31, 2015
The following table illustrates our operating activity for the years ended December 31, 2016 and 2015.
For the Year Ended December 31, | ||||||||||
2016 | 2015 | % Change | ||||||||
(in thousands of dollars) | ||||||||||
Revenues | ||||||||||
Rental revenues | $ | 360,125 | $ | 335,990 | 7.2 | |||||
Equipment sales | 23,303 | 34,772 | (33.0 | ) | ||||||
Parts and service | 13,556 | 13,099 | 3.5 | |||||||
Total revenues | 396,984 | 383,861 | 3.4 | |||||||
Cost of revenues | ||||||||||
Cost of equipment sold | 14,728 | 23,061 | (36.1 | ) | ||||||
Depreciation of rental equipment | 88,720 | 83,943 | 5.7 | |||||||
Cost of rental revenues | 87,810 | 80,007 | 9.8 | |||||||
Cost of parts and service | 7,592 | 7,598 | (0.1 | ) | ||||||
Total cost of revenues | 198,850 | 194,609 | 2.2 | |||||||
Gross profit | 198,134 | 189,252 | 4.7 | |||||||
Other operating expenses | ||||||||||
Selling, general and administrative expenses | 96,888 | 90,531 | 7.0 | |||||||
Other depreciation and amortization | 9,672 | 10,498 | (7.9 | ) | ||||||
Total other operating expenses | 106,560 | 101,029 | 5.5 | |||||||
Income from operations | 91,574 | 88,223 | 3.8 | |||||||
Other expenses (income) | ||||||||||
Interest expense | 43,844 | 44,572 | (1.6 | ) | ||||||
Adjustment to tax receivable agreement | 372 | (2,424 | ) | nm | ||||||
Loss on interest rate swap | 1,287 | 2,265 | (43.2 | ) | ||||||
Total other expenses (income) | 45,503 | 44,413 | 2.5 | |||||||
Income before income taxes | 46,071 | 43,810 | 5.2 | |||||||
Provision for income taxes | (6,829 | ) | (3,625 | ) | 88.4 | |||||
Net income | 39,242 | 40,185 | (2.3 | ) | ||||||
Less: net income attributable to non-controlling interest | 28,502 | 24,594 | 15.9 | |||||||
Net income attributable to Neff Corporation | $ | 10,740 | $ | 15,591 | (31.1 | ) | ||||
______________________________
"nm"—means not meaningful
Total Revenues. Total revenues for the year ended December 31, 2016 increased 3.4% to $397.0 million from $383.9 million for the year ended December 31, 2015. The components of our revenues are rental revenues, equipment sales, and parts and service and the changes between periods in each of these components are discussed below.
Rental Revenues. Rental revenues for the year ended December 31, 2016 increased 7.2% to $360.1 million from $336.0 million for the year ended December 31, 2015. The increase in rental revenues was due to the following: approximately 73% was attributable to an increase in the amount of equipment on rent as a result of an increase in the size of our rental fleet and the remaining 27% was attributable to an increase in time utilization. For the year ended December 31, 2016, the average OEC of our rental fleet increased by 6.8% to $813.6 million from $761.9 million at December 31, 2015, as a result of increased capital expenditures. Time utilization for the year ended December 31, 2016 increased to 67.1% from 66.8% for the year ended December 31, 2015. For the year ended December 31, 2016, we estimate that our rental rates decreased 0.5% as compared to the year ended December 31, 2015.
44
Equipment Sales. Equipment sales for the year ended December 31, 2016 decreased 33% to $23.3 million from $34.8 million for the year ended December 31, 2015. The decrease in equipment sales revenues was primarily due to decreased volume of sales of used equipment.
Parts and Service. Revenues from the sales of parts and service for the year ended December 31, 2016 increased 3.5% to $13.6 million from $13.1 million for the year ended December 31, 2015. The increase in these revenues for the year ended December 31, 2016 was primarily due to increased parts, repair and fuel costs charged to customers.
Cost of Equipment Sold. Costs associated with the sale of rental equipment decreased by $8.3 million to $14.7 million for the year ended December 31, 2016 from $23.1 million for the year ended December 31, 2015. The decrease in costs associated with the sale of rental equipment was due primarily to the decrease in equipment sales. This decrease was partially offset by an increase in used equipment sales gross profit. Gross profit margin on used equipment sales for the year ended December 31, 2016 increased to 36.8% for the year ended December 31, 2016 from 33.7% for the year ended December 31, 2015, primarily as a result of the mix of equipment sold.
Depreciation of Rental Equipment. Depreciation of rental equipment increased 5.7% to $88.7 million for the year ended December 31, 2016 from $83.9 million for the year ended December 31, 2015. The increased depreciation expense of rental equipment was primarily due to the increase in the number of units in our rental fleet and the related increase in the cost of our rental equipment. As a percentage of rental revenues, depreciation of rental equipment decreased to 24.6% for the year ended December 31, 2016 from 25.0% for the year ended December 31, 2015.
Cost of Rental Revenues. Costs associated with our rental revenues increased 9.8% to $87.8 million for the year ended December 31, 2016 from $80.0 million for the year ended December 31, 2015. The increase in cost of rental revenues was primarily a result of increased payroll and payroll related expenses and repair costs, partially offset by decreases in fuel and rental split expenses. As a percentage of rental revenues, cost of rental revenues increased to 24.4% for the year ended December 31, 2016 from 23.8% for the year ended December 31, 2015.
Cost of Parts and Service. Costs associated with generating our parts and service revenues remained relatively consistent at $7.6 million for the year ended December 31, 2016.
Selling, General and Administrative Expenses. Selling, general and administrative expenses for the year ended December 31, 2016 increased $6.4 million, or 7%, to $96.9 million from $90.5 million for the year ended December 31, 2015. The net increase in selling, general and administrative expenses was attributable to several factors. Employee salaries, benefits and related employee expenses increased $4.9 million primarily as a result of higher headcount, salaries and payroll taxes. Rent and bad debt expenses also increased while public company expenses decreased $1.5 million year over year. As a percentage of total revenues, selling, general and administrative expenses increased to 24.4% for the year ended December 31, 2016 from 23.6% for the year ended December 31, 2015.
Other Depreciation and Amortization. Other depreciation and amortization expense decreased to $9.7 million for the year ended December 31, 2016 from $10.5 million for the year ended December 31, 2015. The decrease was primarily due to a decrease in depreciation expense for property and equipment as well as a decrease in amortization expense compared to prior year.
Interest Expense. Interest expense for the year ended December 31, 2016 decreased 1.6% to $43.8 million from $44.6 million for the year ended December 31, 2015. The decrease in interest expense was primarily due to a decrease in the weighted average interest rate of our Revolving Credit Facility in addition to a decrease in the balance outstanding on our Second Lien Loan.
Adjustment to Tax Receivable Agreement. Adjustment to Tax Receivable Agreement for the year ended December 31, 2016 consisted of a $0.4 million increase in the liability primarily due to changes in estimated future payments. The Adjustment to Tax Receivable Agreement for the year ended December 31, 2015 was a $2.4 million decrease in the liability due to the tax receivable agreement amendment and changes in estimated future payments.
Loss on Interest Rate Swap. Loss on interest rate swap for the year ended December 31, 2016 was $1.3 million and included $0.3 million of unrealized losses on the interest rate swap related to the change in fair value and $1.0 million of settlement payments made. In March 2015, the Company entered into and recorded the interest rate swap on its consolidated balance sheet. The interest rate swap is not accounted for as a hedge and changes in fair value are included directly in the consolidated statement of operations. Loss on interest rate swap for the year ended December 31, 2015 was $2.3 million and included $1.9 million of unrealized losses on the interest rate swap related to the change in fair value and $0.4 million of settlement payments made.
45
Year Ended December 31, 2015 Compared to Year Ended December 31, 2014
The following table illustrates our operating activity for the years ended December 31, 2015 and 2014.
For the Year Ended December 31, | ||||||||||
2015 | 2014 | % Change | ||||||||
(in thousands of dollars) | ||||||||||
Revenues | ||||||||||
Rental revenues | $ | 335,990 | $ | 324,099 | 3.7 | |||||
Equipment sales | 34,772 | 34,479 | 0.8 | |||||||
Parts and service | 13,099 | 13,382 | (2.1 | ) | ||||||
Total revenues | 383,861 | 371,960 | 3.2 | |||||||
Cost of revenues | ||||||||||
Cost of equipment sold | 23,061 | 19,147 | 20.4 | |||||||
Depreciation of rental equipment | 83,943 | 73,274 | 14.6 | |||||||
Cost of rental revenues | 80,007 | 81,040 | (1.3 | ) | ||||||
Cost of parts and service | 7,598 | 8,180 | (7.1 | ) | ||||||
Total cost of revenues | 194,609 | 181,641 | 7.1 | |||||||
Gross profit | 189,252 | 190,319 | (0.6 | ) | ||||||
Other operating expenses | ||||||||||
Selling, general and administrative expenses | 90,531 | 81,990 | 10.4 | |||||||
Other depreciation and amortization | 10,498 | 9,591 | 9.5 | |||||||
Transaction bonus | — | 24,506 | nm | |||||||
Total other operating expenses | 101,029 | 116,087 | (13.0 | ) | ||||||
Income from operations | 88,223 | 74,232 | 18.8 | |||||||
Other expenses (income) | ||||||||||
Interest expense | 44,572 | 43,542 | 2.4 | |||||||
Loss on extinguishment of debt | — | 20,241 | nm | |||||||
Adjustment to tax receivable agreement | (2,424 | ) | — | nm | ||||||
Loss on interest rate swap | 2,265 | — | nm | |||||||
Total other expenses (income) | 44,413 | 63,783 | (30.4 | ) | ||||||
Income before income taxes | 43,810 | 10,449 | nm | |||||||
(Provision for) benefit from income taxes | (3,625 | ) | 5,359 | nm | ||||||
Net income | 40,185 | 15,808 | nm | |||||||
Less: net income attributable to non-controlling interest | 24,594 | 14,209 | 73.1 | |||||||
Net income attributable to Neff Corporation | $ | 15,591 | $ | 1,599 | nm | |||||
_____________________________
"nm"—means not meaningful
Total Revenues. Total revenues for the year ended December 31, 2015 increased 3.2% to $383.9 million from $372.0 million for the year ended December 31, 2014. The components of our total revenues are rental revenues, equipment sales and parts and service, and the changes between periods in each of these components are discussed below.
Rental Revenues. Rental revenues for the year ended December 31, 2015 increased 3.7% to $336.0 million from $324.1 million for the year ended December 31, 2014. Approximately 80% of the increase in rental revenues was due to an increase in the amount of equipment on rent as a result of an increase in the size of our rental fleet. The remaining portion of the increase was attributable to an increase in rental rates which was partially offset by a decline in time utilization. For the year ended December 31, 2015, the average OEC of our rental fleet increased by 10.6% to $761.9 million at December 31, 2015 from $688.7 million at December 31, 2014, as a result of increased capital expenditures. For the year ended December 31, 2015, we estimate that our rental rates increased 1.0% as compared to the year ended December 31, 2014. Time utilization for the year ended December 31, 2015 decreased to 66.8% from 69.7% for the
46
year ended December 31, 2014 primarily due to decreased activity among our customers operating in the oil and gas markets combined with extreme weather conditions in several of our regions during the second quarter of 2015.
Equipment Sales. Equipment sales for the year ended December 31, 2015 increased 0.8% to $34.8 million from $34.5 million for the year ended December 31, 2014. The slight increase in equipment sales revenues was primarily due to increased volume of sales of used equipment.
Parts and Service. Revenues from the sales of parts and service for the year ended December 31, 2015 decreased 2.1% to $13.1 million from $13.4 million for the year ended December 31, 2014. The decrease in these revenues for the year ended December 31, 2015 was primarily due to decreased parts, fuel and repair costs charged to customers.
Cost of Equipment Sold. Costs associated with the sale of rental equipment increased by $3.9 million to $23.1 million for the year ended December 31, 2015 from $19.1 million for the year ended December 31, 2014. The increase in costs associated with the sale of rental equipment was due primarily to the increase in equipment sales and a decrease in used equipment sales gross profit. Gross profit margin on used equipment sales for the year ended December 31, 2015 decreased to 33.7% for the year ended December 31, 2015 from 44.5% for the year ended December 31, 2014, primarily as a result of lower margins on sales of used material handling equipment and earthmoving trade packages.
Depreciation of Rental Equipment. Depreciation of rental equipment increased 14.6% to $83.9 million for the year ended December 31, 2015 from $73.3 million for the year ended December 31, 2014. The increased depreciation expense of rental equipment was primarily due to the increase in the number of units in our rental fleet and the related increase in the cost of our rental equipment. As a percentage of rental revenues, depreciation of rental equipment increased to 25.0% for the year ended December 31, 2015 from 22.6% for the year ended December 31, 2014. This increase in depreciation of rental equipment as a percentage of rental revenues was primarily due to increases in the size of our rental fleet and a lack of a corresponding increase in rental revenues which was impacted by decreased rental activity among our customers operating in the oil and gas markets and extreme weather.
Cost of Rental Revenues. Costs associated with our rental revenues decreased 1.3% to $80.0 million for the year ended December 31, 2015 from $81.0 million for the year ended December 31, 2014. The decrease in cost of rental revenues was primarily a result of decreases in fuel and insurance expenses and rental splits, partially offset by increased payroll and payroll related expenses. As a percentage of rental revenues, cost of rental revenues decreased to 23.8% for the year ended December 31, 2015 from 25.0% for the year ended December 31, 2014. This decrease was primarily attributable to the increase in comparative rental revenues, since cost of rental revenues includes fixed costs that generally do not increase at the same rate as the increase in rental revenue.
Cost of Parts and Service. Costs associated with generating our parts and service revenues decreased 7.1% to $7.6 million for the year ended December 31, 2015 from $8.2 million for the year ended December 31, 2014 due primarily to decreased fuel costs.
Selling, General and Administrative Expenses. Selling, general and administrative expenses for the year ended December 31, 2015 increased $8.5 million, or 10.4%, to $90.5 million from $82.0 million for the year ended December 31, 2014. The net increase in selling, general and administrative expenses was attributable to several factors. Employee salaries, benefits and related employee expenses increased $1.7 million primarily as a result of higher salaries, payroll taxes and increased commissions. Public company expenses in the form of professional fees, investor relations and director and officer expenses also increased $4.3 million. As a percentage of total revenues, selling, general and administrative expenses were 23.6% for the year ended December 31, 2015, an increase of 7.3% from 22.0% for the year ended December 31, 2014, primarily as a result of the increase in public company expenses.
Other Depreciation and Amortization. Other depreciation and amortization expense increased to $10.5 million for the year ended December 31, 2015 from $9.6 million for the year ended December 31, 2014.
Transaction Bonus. Transaction bonus expense for the year ended December 31, 2014 was $24.5 million. This amount reflects payments made in connection with the consummation of the refinancing of the senior secured notes on June 9, 2014. There was no transaction bonus expense for the year ended December 31, 2015.
Interest Expense. Interest expense for the year ended December 31, 2015 increased 2.4% to $44.6 million from $43.5 million for the year ended December 31, 2014. The increase in interest expense was primarily due to the increase in outstanding debt as a result of the refinancing of the senior secured notes. Additionally, amortization of debt issue costs decreased $1.5 million
47
over the period. The decrease was primarily due to debt costs related to the Second Lien Loan being amortized over a longer term than the debt issue costs related to the senior secured notes.
Adjustment to Tax Receivable Agreement. Adjustment to Tax Receivable Agreement for the year ended December 31, 2015 was $2.4 million. The adjustment was primarily due to the Tax Receivable Agreement amendment and to changes in estimated future payments. There was no adjustment to the Tax Receivable Agreement for the year ended December 31, 2014.
Loss on Extinguishment of Debt. There was no loss on extinguishment of debt for the year ended December 31, 2015. Loss on extinguishment of debt was $20.2 million for the year ended December 31, 2014. The loss on extinguishment of debt included the write-off of $8.7 million in unamortized debt issue costs on the senior secured notes, as well as $7.2 million paid in call premiums, paid in connection with the redemption of the senior secured notes. The loss on extinguishment of debt also included $2.6 million of prepayment premiums and expenses and the write-off of $1.7 million in unamortized debt issue and original issue discount costs, due to the IPO repayments.
Loss on Interest Rate Swap. Loss on interest rate swap for the year ended December 31, 2015 was $2.3 million and included $1.9 million of unrealized losses on the interest rate swap related to the change in fair value and $0.4 million of settlement payments made. In March 2015, the Company entered into and recorded the interest rate swap on its consolidated balance sheet. The interest rate swap is not accounted for as a hedge and changes in fair value are included directly in the consolidated statement of operations. There was no gain or loss on the interest rate swap for the year ended December 31, 2014.
Liquidity and Capital Resources
Overview
Our principal needs for liquidity historically have been the purchase of rental fleet equipment, other capital expenditures, including delivery vehicles, funding startup costs for new branch locations and debt service. These will be our principal liquidity needs going forward, in addition to payments under the Tax Receivable Agreement, potential cash payments made at our election to the Prior LLC Owners for the redemption of Common Units for Class A common stock and any share repurchases we make in the future under our share repurchase program.
Our largest use of liquidity has been and will continue to be the acquisition of equipment for our rental fleet. Our large rental fleet requires a substantial ongoing commitment of capital. While we can manage the size and aging of our fleet generally over time, eventually we must retire older equipment and either allow our fleet to shrink or replace the older equipment in our fleet with newer models. For the years ended December 31, 2016 and 2015, our net capital expenditures totaled approximately $89.6 million and $112.7 million, respectively. We have historically financed these net additions to our rental fleet using cash flow from operations and borrowings under our Revolving Credit Facility and we expect that to continue in the future.
We also use our liquidity to finance other non-rental equipment capital expenditures, typically consisting of delivery vehicles, property, plant and equipment and funding startup costs for new branch locations. The liquidity required to open a new branch location typically ranges from $5.0 million to $10.0 million, the majority of which consists of acquisitions of rental fleet equipment for the new branch location.
For each of the years ended December 31, 2016 and 2015, our net other purchases of property and equipment totaled approximately $11.5 million and $13.1 million, respectively. We have historically financed these net other capital expenditures using cash flow from operations and borrowings under our Revolving Credit Facility and we expect that to continue in the future.
In November 2015, the Company's board of directors authorized a share repurchase program pursuant to which the Company may purchase shares of its Class A common stock. Under the share repurchase program, the Company may acquire up to $25 million of shares of Class A common stock in open market and privately negotiated purchases from time to time, dependent upon market conditions. Since the authorization of the share repurchase program, the Company has purchased 1.7 million shares of Class A common stock for a total cost of $11.8 million, including commissions.
We may use liquidity going forward to make payments under the Tax Receivable Agreement. For the year ended December 31, 2016, we did not make any payments under the Tax Receivable Agreement. We expect the actual payments under the Tax Receivable Agreement could vary depending on a number of factors (see Tax Receivable Agreement under the Company Structure and Effects of the Organizational Transactions in the "Management's Discussions and Analysis of Financial Condition and Results of Operations").
As of December 31, 2016, our total leverage ratio is 3.60. Under the terms of the Second Lien Loan, if the total leverage ratio is less than 4.00 to 1.00 but greater than 3.00 to 1.00 at the end of each fiscal year, we must make a mandatory prepayment
48
equal to 25% of our excess cash flow. A mandatory prepayment of $11.8 million will be made during 2017. Other than mandatory prepayments under the terms of our Second Lien Loan as of December 31, 2016, we are not required to make any additional principal payments prior to the stated maturity of June 9, 2021. We expect to satisfy our debt service going forward, which will consist primarily of interest payments and mandatory prepayments under the current terms of the Second Lien Loan, out of cash flow from operations.
As of December 31, 2016, our principal sources of liquidity consisted of $148.9 million of cash generated from operations, $0.9 million of cash and cash equivalents and availability of $223.0 million under our Revolving Credit Facility, subject to customary borrowing conditions. We believe that our cash flow from operations, available cash and cash equivalents and available borrowing capacity under the Revolving Credit Facility will be sufficient to meet our liquidity needs for at least the next 12 months; however, there can be no assurance that this will be the case. The borrowing capacity under our Revolving Credit Facility will depend on the amount of outstanding borrowings and letters of credit issued and will also depend on us remaining in compliance with the covenants under our Revolving Credit Facility and Second Lien Loan. We were in compliance with the covenants under our Revolving Credit Facility and Second Lien Loan as of December 31, 2016.
We may from time to time seek to retire or purchase our Class A common stock or retire or repurchase our outstanding debt through cash purchases and/or exchanges for equity securities, in open market purchases, privately negotiated transactions, tender offers or otherwise. Such repurchases or exchanges, if any, will depend on prevailing market conditions, our liquidity requirements, contractual restrictions and other factors.
To the extent we require additional liquidity, we anticipate that it will be funded through the incurrence of other indebtedness (which may include capital markets indebtedness, the incremental facility under the credit agreement for the Second Lien Loan or indebtedness under other credit facilities), equity financings or a combination thereof; however, there can be no assurance that we will be able to fund such additional liquidity needs on commercially acceptable terms or at all. Although we have no specific current plans to do so, if we decide to pursue one or more significant acquisitions, we may incur additional debt or sell additional equity to finance such acquisitions.
Cash Flows for the Years Ended December 31, 2016 and 2015
Net cash provided by operating activities of $148.9 million as compared to $122.2 million for the year ended December 31, 2015. Net income of $39.2 million when adjusted by various non-cash items, such as the gain on sale of equipment of $8.6 million, unrealized loss on interest rate swap of $0.3 million, adjustment to the tax receivable agreement of $0.4 million and depreciation of $97.3 million, resulted in net cash provided by operating activities of $148.9 million.
Net cash used in investing activities was $101.2 million for the year ended December 31, 2016 as compared to $129.4 million for the year ended December 31, 2015. Cash used for the purchase of rental equipment was $112.9 million for the year ended December 31, 2016 compared to $147.5 million for the year ended December 31, 2015. We received $23.3 million in cash proceeds from the sale of equipment for the year ended December 31, 2016 compared to $34.8 million for the year ended December 31, 2015.
Cash used in financing activities was $47.1 million for the year ended December 31, 2016 compared to cash provided by activities of $7.3 million for the year ended December 31, 2015. The decrease in cash provided by financing activities was primarily due to a reduction in borrowings from the Revolving Credit Facility, an increase in debt payments for the Revolving Credit Facility and Second Lien Loan, additional repurchases of Class A common stock made during the year ended December 31, 2016 and payments for Neff Holdings LLC stock option exercises as compared to prior year.
Cash Flows for the Years Ended December 31, 2015 and 2014
For the year ended December 31, 2015, our operating activities provided net cash flow of $122.2 million as compared to $94.1 million for the year ended December 31, 2014. The increase in cash flows from operating activities was due primarily to the payment of the Transaction Bonus to management and certain members of Neff Holdings' board of managers, earned in connection with the consummation of the refinancing of the senior secured notes, which was paid in the year ended December 31, 2014 and was not paid in the year ended December 31, 2015.
Cash used in investing activities was $129.4 million for the year ended December 31, 2015 as compared to $127.7 million for the year ended December 31, 2014. Cash used for the purchase of rental equipment was $147.5 million for the year ended December 31, 2015 compared to $149.2 million for the year ended December 31, 2014. We received $34.8 million in cash proceeds from the sale of equipment for the year ended December 31, 2015 compared to $34.5 million for the year ended December 31, 2014.
49
Net cash provided by financing activities was $7.3 million for the year ended December 31, 2015 compared to $33.6 million for the year ended December 31, 2014. As part of the refinancing of the senior secured notes in the year ended December 31, 2014, we received $572.1 million in net proceeds from the Second Lien Loan which was offset partially by prepayment of our senior secured notes totaling $207.2 million (including call premiums), payment of a $329.9 million distribution in June 2014 and other refinancing related fees and expenses. As part of the IPO in the year ended December 31, 2014, we received $146.1 million in net proceeds from the sale of Class A common stock which was used to prepay $96.0 million in Second Lien Loans, to pay Second Lien Loan prepayment penalties and expenses of $2.6 million, to repay $40.0 million in borrowings under the Revolving Credit Facility and to pay other IPO expenses of $7.5 million.
Revolving Credit Facility
On October 1, 2010, certain of our subsidiaries entered into the Revolving Credit Facility with a syndicate of banks and financial institutions including Bank of America, N.A. and Wells Fargo Capital Finance, LLC as the co-collateral agents. Bank of America, N.A. is the agent, swing-line lender and letter of credit issuer. The Revolving Credit Facility was amended and restated on November 20, 2013, and further amended on June 9, 2014 as part of the refinancing of the senior secured notes.
The Revolving Credit Facility provides $475.0 million in commitments for revolving borrowings, including a $30.0 million sublimit for the issuance of letters of credit, and a $42.5 million sublimit for swing-line loans, subject to certain availability conditions. The aggregate amount of all borrowings available to us under the Revolving Credit Facility is the lesser of the aggregate commitments and the "borrowing base", which is a formula that applies certain advance rates against our eligible accounts receivable and our eligible rental equipment and, as a result of which, could result in us not being able to borrow all of the available commitments at any given time. As of December 31, 2016, the borrowing base under the Revolving Credit Facility was $475.0 million. As of December 31, 2016, we had $222.5 million in borrowings under the Revolving Credit Facility, net of unamortized debt issue costs of $3.9 million. The Revolving Credit Facility matures on February 25, 2021. Borrowings under the Revolving Credit Facility bear interest, at our option, at either a LIBOR rate or base rate, in each case plus an applicable margin. LIBOR loans bear interest at the LIBOR rate plus (a) 200 basis points if the average availability for the period is less than $125.0 million, (b) 175 basis points if the average availability for the period is equal to or greater than $125.0 million but less than $225.0 million or (c) 150 basis points if the average availability for the period is greater than $225.0 million. The base rate loans bear interest at the sum of (a) (i) 100 basis points if the average availability for the period is less than $125.0 million, (ii) 75 basis points if the average availability for the period is equal to or greater than $125.0 million but less than $225.0 million or (iii) 50 basis points if the average availability for the period is greater than $225.0 million plus (b) the greatest of (i) the prime rate, (ii) the federal funds rate plus 50 basis points and (iii) LIBOR plus 100 basis points. The applicable margin for LIBOR loans and base rate loans will be subject to quarterly performance pricing adjustments based on our average availability and our consolidated total leverage ratio under the Revolving Credit Facility for the most recently completed quarter. The Revolving Credit Facility provides for the payment to the lenders of an unused line fee of 0.375% if less than 0.50% of the daily average unused portion under the Revolving Credit Facility is utilized and 0.250% if 50% or more is utilized. The unused line fee is payable on the daily average unused portion of the commitments under the Revolving Credit Facility (whether or not then available).
Neff Holdings and each of its subsidiaries is a borrower or a credit party under the Revolving Credit Facility. Neff Corporation is not a party to the Revolving Credit Facility. The Revolving Credit Facility is secured by first-priority liens on substantially all of the assets of the borrower and the guarantors. The credit agreement for the Revolving Credit Facility contains customary restrictive covenants applicable to each credit party, including, among others, restrictions on the ability to incur additional indebtedness, create liens, make investments and declare or pay dividends. In addition, the Revolving Credit Facility contains financial covenants, applicable at any time excess availability is less than the greater of $35.0 million and 10% of the aggregate commitments of all lenders, or $47.5 million as of December 31, 2016, which require us to maintain (i) a consolidated total leverage ratio of not more than 5.00 to 1.00 for each fiscal quarter ended during the period from February 25, 2016 through and including December 31, 2016, stepping down to 4.75 to 1.00 for each fiscal quarter ended during the period from January 1, 2017 through and including December 31, 2017, stepping down to 4.50 to 1.00 for each fiscal quarter ended during the period from January 1, 2018 and thereafter, and (ii) a fixed charge coverage ratio of not less than 1.00 to 1.00, in each case, until such time as excess availability exceeds the threshold described above for a period of at least 30 consecutive days. As of December 31, 2016, we had availability based on our borrowing base as of such date under the Revolving Credit Facility of $223.0 million and were in compliance with the applicable covenants in the Revolving Credit Facility.
Second Lien Loan
Our subsidiary, Neff Rental LLC, became a party to the Second Lien Loan under a senior secured credit facility with Credit Suisse AG, as administrative agent and collateral agent, and the other lenders and agents thereto, on June 9, 2014. The credit agreement for the Second Lien Loan provides for (a) a $575.0 million term loan facility, all of which was drawn on June 9, 2014, and (b) an uncommitted incremental term loan facility not to exceed (together with any incremental equivalent debt) $75.0 million plus additional amounts that may be incurred subject to a pro forma total leverage ratio of 5.25:1.00 and certain
50
other customary conditions. As of December 31, 2016, we had $468.9 million in borrowings under the Second Lien Loan, net of unamortized original issue discount of $1.7 million and unamortized debt issue costs of $5.1 million. The Second Lien Loan matures on June 9, 2021. The Second Lien Loan bears interest, at our option, at either a LIBOR rate or base rate, in each case plus an applicable margin. LIBOR loans bear interest at the LIBOR rate plus 625 basis points and base rate loans bear interest at the sum of (a) 525 basis points plus (b) the greatest of (i) the prime rate, (ii) the federal funds rate plus 50 basis points and (iii) LIBOR plus 100 basis points. The LIBOR rate margin is subject to a "floor" of 100 basis points. We generally elect the LIBOR rate, and given LIBOR currently is less than 1.00%, our interest rate as of December 31, 2016 under the Second Lien Loan was 7.25% per annum. We must make mandatory prepayments of principal on the Second Lien Loan if our total leverage ratio for any fiscal year, commencing with the fiscal year ending December 15, 2015, exceeds 3.00 to 1.00. These prepayment provisions require us to prepay an amount equal to (i) either 25% of our excess cash flow (if our total leverage ratio is equal to or less than 4.00 to 1.00 but greater than 3.00 to 1.00) or 50% of our excess cash flow (if our total leverage ratio is greater than 4.00 to 1.00) over (ii) the optional prepayment amount for such excess cash flow period. Additionally, we must make mandatory prepayments of principal on the Second Lien Loan if we receive net cash proceeds from asset sales (as defined in the Second Lien Loan) or the issuance or incurrence of indebtedness (except for permitted refinancing debt as defined in the Second Lien Loan). We prepaid $96.0 million of the principal amount of the Second Lien Loan with the net proceeds from the IPO on November 26, 2014 and paid approximately $1.9 million in prepayment premiums in connection with that prepayment. On March 17, 2016, we paid a mandatory prepayment of $3.3 million, equal to 25% of our excess cash flow for the year ended December 31, 2015. A mandatory prepayment of $11.8 million, equal to 25% of our excess cash flow for the year ended December 31, 2016, will be paid during 2017.
Neff Holdings and each of its subsidiaries is a borrower or a credit party under the Second Lien Loan. Neff Corporation is not a party to the Second Lien Loan. The Second Lien Loan is secured by second-priority liens on substantially all of the assets of the borrower and the guarantors. The credit agreement for the Second Lien Loan contains customary incurrence-based restrictive covenants applicable to each credit party, including, among other things, restrictions on the ability to incur additional indebtedness, create liens, make investments and declare or pay dividends.
Certain Information Concerning Off-Balance Sheet Arrangements
As part of our ongoing business, we do not participate in transactions that generate relationships with unconsolidated entities or financial partnerships, such as entities referred to as structured finance or variable interest entities, which would have been established for the purpose of facilitating off-balance sheet arrangements or other contractually narrow or limited purposes. As of December 31, 2016, we are not involved in any variable interest entities transactions and do not otherwise have any off-balance sheet arrangements.
In the normal course of our business activities, we lease real estate for our headquarters and branch locations and we may from time to time lease rental equipment and non-rental equipment under operating leases. See "—Contractual and Commercial Commitments."
Contractual and Commercial Commitments
Our contractual obligations and commercial commitments principally include obligations associated with our outstanding indebtedness and interest payments. The following table summarizes our contractual and commercial obligations at December 31, 2016 on an actual basis:
Payments Due by Period | |||||||||||||||||||
Total | Less than 1 year | 1 - 3 years | 3 - 5 years | More than 5 years | |||||||||||||||
Contractual Obligations | (in thousands of dollars) | ||||||||||||||||||
Revolving Credit Facility(1) | $ | 226,400 | $ | — | $ | — | $ | 226,400 | $ | — | |||||||||
Interest on Revolving Credit Facility(2) | 25,135 | 6,068 | 12,135 | 6,932 | — | ||||||||||||||
Second Lien Loan(3) | 475,651 | 11,832 | — | 463,819 | — | ||||||||||||||
Interest on Second Lien Loan(2) | 149,249 | 33,627 | 67,254 | 48,368 | — | ||||||||||||||
Due to non-controlling interest holders in connection with Tax Receivable Agreement(4) | 29,505 | 3,927 | 13,309 | 10,424 | 1,846 | ||||||||||||||
Operating leases(5) | 29,260 | 7,717 | 11,636 | 5,901 | 4,006 | ||||||||||||||
Total | $ | 935,200 | $ | 63,171 | $ | 104,334 | $ | 761,844 | $ | 5,852 | |||||||||
51
(1) | Includes approximately $4.1 million in outstanding letters of credit as of December 31, 2016. For purposes of this table, we treat revolving balances outstanding under our Revolving Credit Facility as due at maturity. |
(2) | Future interest payments are calculated based on the assumption that (a) all debt outstanding as of December 31, 2016 remains outstanding until maturity, (b) the per annum rate of interest applicable to the indebtedness as of December 31, 2016 remains constant until maturity, (c) any accrued and unpaid interest prior to December 31, 2016 is excluded and (d) the unused line commitment fee, if applicable, is included at a constant rate per annum against the amount of the unused line as of December 31, 2016 through maturity. |
(3) | We incurred our $575.0 million Second Lien Loan as part of the refinancing of the senior secured notes on June 9, 2014. The Second Lien Loan matures on June 9, 2021, does not have any scheduled amortization and bears interest at a variable rate based, at our election, on either a Eurodollar rate or a base rate. As of December 31, 2016, the rate on the Second Lien Loan was 7.25% per annum, resulting in annualized interest of approximately $33.6 million per year. We applied $96.0 million of the net proceeds from the IPO to prepay a portion of the Second Lien Loan. As of December 31, 2016, our total leverage ratio is 3.60. Under the terms of the Second Lien Loan, if the total leverage ratio is less than 4.00 to 1.00 but greater than 3.00 to 1.00, we must make a mandatory prepayment equal to 25% of our excess cash flow. A mandatory prepayment of $11.8 million will be made during 2017. |
(4) | The timing of the payments due in connection with the Tax Receivable Agreement are subject to certain contingencies including Neff Corporation having sufficient taxable income to utilize tax benefits defined in the Tax Receivable Agreement. |
(5) | Represents total operating lease rental payments having initial or remaining non-cancelable lease terms longer than one year. Amounts principally are related to payments required under our leases for our headquarters and branch locations. As of December 31, 2016, we did not have any capital leases. For more information, see Note 16 to our consolidated financial statements included in Item 8 of this annual report on Form 10-K. |
From time to time we may also enter into capital leases with respect to equipment, but as of December 31, 2016 and December 31, 2015 we did not have any capital leases. In addition, from time to time we may incur contractual payment obligations under the Tax Receivable Agreement.
Inflation
Although we cannot accurately anticipate the effect of inflation on our operations, we believe that inflation has not had and is not likely in the foreseeable future to have, a material impact on our results of operations.
Critical Accounting Policies and Estimates
This "Management's Discussion and Analysis of Financial Condition and Results of Operations" discusses our consolidated financial statements, which have been prepared in accordance with US GAAP. The preparation of these financial statements requires management to make estimates and judgments that affect the reported amounts of assets and liabilities and the disclosure of contingent assets and liabilities at the date of the financial statements and the reported amounts of revenues and expenses during the reporting period. On an ongoing basis, management evaluates its estimates and judgments, including those related to bad debts, intangible assets, income taxes, self-insurance, contingencies and reserves for claims. Management bases its estimates and judgments on historical experience and on various other factors that are believed to be reasonable under the circumstances, the results of which form the basis for making judgments about operating results and the carrying values of assets and liabilities that are not readily apparent from other sources. Actual results may differ from these estimates under different assumptions or conditions. Management believes the following critical accounting policies, among others, involve its more significant estimates and judgments and are therefore particularly important to an understanding of our results of operations and financial position.
Useful Lives and Salvage Value of Rental Equipment
Rental equipment is initially recorded at cost and is stated less accumulated depreciation. Depreciation is recorded using the straight-line method over the estimated useful life of the related equipment (generally two to eight years with estimated 10-20% residual values).
We routinely review the assumptions utilized in computing rates of depreciation of our rental equipment. Changes to the assumptions (such as the length of service lives and/or the amount of residual values) are made when, in the opinion of management, such changes are necessary to more appropriately allocate asset costs to operations over the service life of the assets. Management utilizes, among other factors, historical experience and industry comparisons in determining the propriety of any such changes. We may be required to change these estimates based on changes in our industry, end-markets or other circumstances. If these estimates change in the future, we may be required to recognize increased or decreased depreciation expense for these assets.
Goodwill and Intangibles with Indefinite Useful Lives
Goodwill represents the excess of cost over the fair value of identifiable net assets of businesses acquired.
Goodwill is not amortized, but instead is reviewed for impairment annually, or more frequently if events indicate a decline in fair value below its carrying value. To perform an impairment test we must first determine whether the fair value of the reporting
52
units is at least equal to the recorded value on our balance sheet. If the fair value of the reporting unit is less than the recorded value, we are required to write-off the excess goodwill as an operating expense.
We perform our goodwill impairment testing annually. We tested our goodwill on October 1 of 2016, 2015 and 2014 and in each case determined that the estimated fair value of our reporting units were substantially in excess of their carrying value and our goodwill was not impaired at any such time.
We use an equally weighted combination of the income and market approaches to determine the fair value of our reporting units when performing our impairment test of goodwill. We assign an equal weight to the respective methods as they are both acceptable valuation approaches in determining the fair value of a business.
The income approach establishes fair value by methods which discount or capitalize earnings and/or cash flow by a discount or capitalization rate that reflects market rate of return expectations, market conditions and the risk of the relative investment. We use a discounted cash flow method when applying the income approach. The market approach was based on the market price data of shares of our Company.
Our trademarks and tradenames are intangible assets with indefinite useful lives. We test our trademarks and tradenames using the royalty savings method for impairment at least annually or as of an interim date if circumstances suggest that assets may be impaired. The fair value of the trademarks and tradenames is measured using a multi-period royalty savings method which includes inputs such as revenue, a royalty rate and a discount rate, to reflect the savings realized by owning the trademarks and tradenames, and thus not having to pay a royalty fee to a third party. We expense costs to renew or extend the term of a recognized intangible asset.
Valuation of Long-Lived Assets and Intangibles with Finite Useful Lives
Long-lived assets on our balance sheet consist primarily of rental equipment, property and equipment and our customer list. We periodically review the carrying value of all of these assets. Long-lived assets and intangibles with finite useful lives are evaluated for impairment if events or circumstances suggest that assets may be impaired. An assessment of recoverability is performed prior to any write-down of assets based on the undiscounted cash flows of the assets. An impairment charge is recorded on those assets considered impaired for which the estimated fair value is below the carrying amount. While we believe that the estimates we use to value these assets are reasonable, different assumptions regarding items such as future cash flows and the volatility inherent in markets which we serve could affect our evaluations and result in impairment charges against the carrying value of these assets. Any impairment charge that we record would reduce our earnings.
There were no events or circumstances that triggered an impairment test for our long-lived assets and intangibles with finite useful lives at December 31, 2016 and 2015.
Income Taxes
We are required to file federal and applicable state corporate income tax returns and recognize income taxes on our pre-tax income, which to date has consisted primarily of our share of Neff Holdings' pre-tax income. Neff Holdings is a limited liability company that is treated as a partnership for federal and state income tax purposes. Neff Holdings is not subject to income taxes for federal and state purposes. Rather, taxable income or loss is included in the respective federal and state income tax returns of Neff Holdings' members.
We account for income taxes under the asset and liability method which requires the recognition of deferred tax assets and liabilities for the expected future tax consequences of events that have been included in the financial statements. Under this method, we determine deferred tax assets and liabilities on the basis of the differences between the financial statement and tax bases of assets and liabilities by using enacted tax rates in effect for the year in which the differences are expected to reverse. The effect of a change in tax rates on deferred tax assets and liabilities is recognized in income in the period that includes the enactment date.
We recognize deferred tax assets to the extent that we believe that these assets are more likely than not to be realized. In making such a determination, we consider all available positive and negative evidence, including future reversals of existing taxable temporary differences, projected future taxable income, tax-planning strategies and results of recent operations. If we determine that we would be able to realize our deferred tax assets in the future in excess of their net recorded amount, we would make an adjustment to the deferred tax asset valuation allowance, which would reduce the provision for income taxes.
There were no uncertain tax positions as of December 31, 2016 and 2015.
53
Payable Pursuant to Tax Receivable Agreement
Our liability of $29.5 million as of December 31, 2016 represents the payments due to the Wayzata Funds and the Prior LLC Owners under the Tax Receivable Agreement. Payments are anticipated to be made under the Tax Receivable Agreement when Neff Corporation utilizes a benefit. The payments are to be made in accordance with the terms of the Tax Receivable Agreement. The timing of the payments is subject to certain contingencies including Neff Corporation having sufficient taxable income to utilize all of the tax benefits defined in the Tax Receivable Agreement.
Recent Accounting Pronouncements
See Note 2 of our audited condensed consolidated financial statements included elsewhere in this annual report on Form 10-K for recently issued accounting pronouncements applicable to us and the effect of those standards on our consolidated financial statements and related disclosures.
Implications of Being an Emerging Growth Company
We qualify as an emerging growth company as defined in the JOBS Act. An emerging growth company may take advantage of specified reduced reporting and other burdens that are otherwise applicable generally to public companies. Among other things, these provisions include:
•being permitted to have less than five years of selected financial data;
•an exemption from the auditor attestation requirement in the assessment of our internal control over financial
reporting pursuant to the Sarbanes-Oxley Act;
•an exemption from new or revised financial accounting standards until they would apply to private companies
and compliance with any new requirements adopted by the Public Company Accounting Oversight Board
requiring mandatory audit firm rotation;
•reduced disclosure about the emerging growth company's executive compensation arrangements; and
•no requirement to seek non-binding advisory votes on executive compensation or golden parachute arrangements.
The JOBS Act permits emerging growth companies to take advantage of an extended transition period to comply with new or revised accounting standards applicable to public companies. We have irrevocably elected to avail ourselves of this exemption from adopting new or revised accounting standards and, therefore, will not be subject to new or revised accounting standards until such time as those standards apply to private companies.
We have elected to adopt the reduced disclosure requirements available to emerging growth companies. As a result of these elections, the information that we provided in this annual report on Form 10-K may be different than the information that you may receive from other public companies. Additionally, it is possible that some investors will find our Class A common stock less attractive as a result of our elections, which may cause a less active trading market for our common stock and more volatility in our stock price.
We could remain an "emerging growth company" through December 31, 2019 or until the earliest of (a) the last day of the first fiscal year in which our annual gross revenues exceed $1 billion, (b) the date that we become a "large accelerated filer" as defined in Rule 12b-2 under the Exchange Act, which would occur if the market value of our common stock that is held by non-affiliates exceeds $700 million as of the last business day of our most recently completed second fiscal quarter and (c) the date on which we have issued more than $1 billion in non-convertible debt securities during the preceding three-year period. We may choose to take advantage of some but not all of these reduced burdens.
54
Item 7A. QUANTITATIVE AND QUALITATIVE DISCLOSURES ABOUT MARKET RISK
Interest Rate Risk
We are subject to interest rate risk in connection with our long-term indebtedness. Our principal interest rate exposure relates to loans outstanding under our Revolving Credit Facility and Second Lien Loan. All outstanding indebtedness under the Revolving Credit Facility and Second Lien Loan (subject to LIBOR floor) bears interest at a variable rate based on LIBOR. Each quarter point change in interest rates on the variable portion of indebtedness under our Revolving Credit Facility and Second Lien Loan would result in a change of $0.6 million and $1.2 million, respectively, to our interest expense on an annual basis.
The variable nature of our obligations under the Revolving Credit Facility and Second Lien Loan creates interest rate risk. In order to mitigate this risk, in March 2015, we entered into the interest rate swap in the notional amount of $200.0 million to effectively converting a portion of its variable rate debt into fixed rate debt on the Revolving Credit Facility for the period between April 8, 2015 and April 8, 2020.
All transactions in derivative financial instruments are authorized and executed pursuant to regularly reviewed policies and procedures, which prohibit the use of derivative financial instruments for trading or speculative purposes.
55
Item 8. FINANCIAL STATEMENTS AND SUPPLEMENTARY DATA
INDEX TO CONSOLIDATED FINANCIAL STATEMENTS
Page Number | |
56
REPORT OF INDEPENDENT REGISTERED PUBLIC ACCOUNTING FIRM
To the Board of Directors and Stockholders of
Neff Corporation
We have audited the accompanying consolidated balance sheets of Neff Corporation and subsidiaries (combined and consolidated with Neff Holdings LLC and subsidiaries) (the "Company") as of December 31, 2016 and 2015, and the related consolidated statements of operations, stockholders’ deficit/members' deficit, and cash flows for each of the three years in the period ended December 31, 2016. These financial statements are the responsibility of the Company's management. Our responsibility is to express an opinion on these consolidated financial statements based on our audits.
We conducted our audits in accordance with the standards of the Public Company Accounting Oversight Board (United States). Those standards require that we plan and perform the audit to obtain reasonable assurance about whether the consolidated financial statements are free of material misstatement. The Company is not required to have, nor were we engaged to perform, an audit of its internal control over financial reporting. Our audits included consideration of internal control over financial reporting as a basis for designing audit procedures that are appropriate in the circumstances, but not for the purpose of expressing an opinion on the effectiveness of the Company's internal control over financial reporting. Accordingly, we express no opinion. An audit also includes examining, on a test basis, evidence supporting the amounts and disclosures in the financial statements, assessing the accounting principles used and significant estimates made by management, as well as evaluating the overall financial statement presentation. We believe that our audits provide a reasonable basis for our opinion.
In our opinion, such consolidated financial statements present fairly, in all material respects, the financial position of Neff Corporation and subsidiaries (combined and consolidated with Neff Holdings LLC and subsidiaries) as of December 31, 2016 and 2015 and the results of their operations and their cash flows for each of the three years in the period ended December 31, 2016 in conformity with accounting principles generally accepted in the United States of America.
The consolidating schedules on pages 83-90 have been subjected to audit procedures performed in conjunction with the audit of the Company's consolidating financial statements. The consolidating schedules are the responsibility of the Company's management. Our audit procedures included determining whether the consolidating schedules reconcile to the consolidated financial statements or the underlying accounting and other records, as applicable, and performing procedures to test the completeness and accuracy of the information presented in the consolidating schedules. In our opinion, such schedules are fairly stated, in all material respects, in relation to the consolidated financial statements as a whole.
/s/ Deloitte & Touche LLP
Certified Public Accountants
Miami, Florida
March 3, 2017
57
NEFF CORPORATION AND SUBSIDIARIES
CONSOLIDATED BALANCE SHEETS
(in thousands, except share and per share data)
December 31, 2016 | December 31, 2015 | ||||||
ASSETS | |||||||
Cash and cash equivalents | $ | 900 | $ | 289 | |||
Accounts receivable, net of allowance for doubtful accounts of $2,481 in 2016 and $2,508 in 2015 | 64,943 | 70,328 | |||||
Inventories | 1,867 | 1,766 | |||||
Rental equipment, net | 462,084 | 457,470 | |||||
Property and equipment, net | 35,534 | 33,473 | |||||
Prepaid expenses and other assets | 8,203 | 5,587 | |||||
Goodwill | 60,644 | 60,599 | |||||
Intangible assets, net | 14,246 | 15,314 | |||||
Total assets | $ | 648,421 | $ | 644,826 | |||
LIABILITIES AND STOCKHOLDERS' DEFICIT | |||||||
Liabilities | |||||||
Accounts payable | $ | 15,851 | $ | 18,948 | |||
Accrued expenses and other liabilities | 35,074 | 31,412 | |||||
Revolving credit facility, net of debt issue costs | 222,531 | 250,472 | |||||
Second lien loan, net of debt issue costs and original issue discount | 468,860 | 471,193 | |||||
Payable pursuant to tax receivable agreement | 29,505 | 29,133 | |||||
Deferred tax liability, net | 8,325 | 9,458 | |||||
Total liabilities | 780,146 | 810,616 | |||||
Commitments and contingencies (Note 16) | |||||||
Stockholders' deficit | |||||||
Class A Common Stock; $.01 par value, 100,000,000 shares authorized, 8,859,662 and 10,380,781 shares issued and outstanding as of December 31, 2016 and 2015, respectively | 88 | 104 | |||||
Class B Common Stock; $.01 par value, 15,000,000 shares authorized, 14,951,625 shares issued and outstanding as of December 31, 2016 and 2015 | 150 | 150 | |||||
Additional paid-in capital | (102,216 | ) | (112,058 | ) | |||
Retained earnings | 22,770 | 17,190 | |||||
Total stockholders' deficit | (79,208 | ) | (94,614 | ) | |||
Non-controlling interest | (52,517 | ) | (71,176 | ) | |||
Total stockholders' deficit and non-controlling interest | (131,725 | ) | (165,790 | ) | |||
Total liabilities and stockholders' deficit and non-controlling interest | $ | 648,421 | $ | 644,826 | |||
The accompanying notes are an integral part of these consolidated financial statements.
58
NEFF CORPORATION AND SUBSIDIARIES
CONSOLIDATED STATEMENTS OF OPERATIONS
(in thousands, except per share amounts)
For the Year Ended December 31, 2016 | For the Year Ended December 31, 2015 | For the Year Ended December 31, 2014 | |||||||||
Revenues | |||||||||||
Rental revenues | $ | 360,125 | $ | 335,990 | $ | 324,099 | |||||
Equipment sales | 23,303 | 34,772 | 34,479 | ||||||||
Parts and service | 13,556 | 13,099 | 13,382 | ||||||||
Total revenues | 396,984 | 383,861 | 371,960 | ||||||||
Cost of revenues | |||||||||||
Cost of equipment sold | 14,728 | 23,061 | 19,147 | ||||||||
Depreciation of rental equipment | 88,720 | 83,943 | 73,274 | ||||||||
Cost of rental revenues | 87,810 | 80,007 | 81,040 | ||||||||
Cost of parts and service | 7,592 | 7,598 | 8,180 | ||||||||
Total cost of revenues | 198,850 | 194,609 | 181,641 | ||||||||
Gross profit | 198,134 | 189,252 | 190,319 | ||||||||
Other operating expenses | |||||||||||
Selling, general and administrative expenses | 96,888 | 90,531 | 81,990 | ||||||||
Other depreciation and amortization | 9,672 | 10,498 | 9,591 | ||||||||
Transaction bonus | — | — | 24,506 | ||||||||
Total other operating expenses | 106,560 | 101,029 | 116,087 | ||||||||
Income from operations | 91,574 | 88,223 | 74,232 | ||||||||
Other expenses (income) | |||||||||||
Interest expense | 43,844 | 44,572 | 43,542 | ||||||||
Loss on extinguishment of debt | — | — | 20,241 | ||||||||
Adjustment to tax receivable agreement | 372 | (2,424 | ) | — | |||||||
Loss on interest rate swap | 1,287 | 2,265 | — | ||||||||
Total other expenses (income) | 45,503 | 44,413 | 63,783 | ||||||||
Income before income taxes | 46,071 | 43,810 | 10,449 | ||||||||
(Provision for) benefit from income taxes | (6,829 | ) | (3,625 | ) | 5,359 | ||||||
Net income | 39,242 | 40,185 | 15,808 | ||||||||
Less: net income attributable to non-controlling interest | 28,502 | 24,594 | 14,209 | ||||||||
Net income attributable to Neff Corporation | $ | 10,740 | $ | 15,591 | $ | 1,599 | |||||
November 26, 2014 through December 31, 2014 | |||||||||||
Net income attributable to Neff Corporation per share of Class A common stock | |||||||||||
Basic | $ | 1.15 | $ | 1.49 | $ | 0.15 | |||||
Diluted | $ | 1.11 | $ | 1.29 | $ | 0.13 | |||||
Weighted average shares of Class A common stock outstanding | |||||||||||
Basic | 9,358 | 10,477 | 10,476 | ||||||||
Diluted | 9,667 | 12,069 | 12,011 | ||||||||
The accompanying notes are an integral part of these consolidated financial statements.
59
NEFF CORPORATION AND SUBSIDIARIES
CONSOLIDATED STATEMENTS OF STOCKHOLDERS' DEFICIT / MEMBERS' DEFICIT
FOR THE YEARS ENDED DECEMBER 31, 2016, 2015 AND 2014
(in thousands)
Neff Holdings | Neff Corporation | ||||||||||||||||||||||||||||||||||||
Class A Common Stock | Class B Common Stock | ||||||||||||||||||||||||||||||||||||
Members' Deficit | Accumulated (Deficit) Surplus | Shares | Amount | Shares | Amount | Additional Paid-in Capital | Retained Earnings | Non-controlling interest | Total stockholders' deficit / members' deficit and non-controlling interest | ||||||||||||||||||||||||||||
BALANCE—January 1, 2014 | $ | (5,688 | ) | $ | 8,770 | — | $ | — | — | $ | — | $ | — | $ | — | $ | — | $ | 3,082 | ||||||||||||||||||
Return of capital to members (Note 11) | (329,885 | ) | — | — | — | — | — | — | — | — | (329,885 | ) | |||||||||||||||||||||||||
Equity-based compensation expense through November 26, 2014 | 819 | — | — | — | — | — | — | — | — | 819 | |||||||||||||||||||||||||||
Net income through November 26, 2014 | — | 10,429 | — | — | — | — | — | — | — | 10,429 | |||||||||||||||||||||||||||
BALANCE prior to organizational transactions and IPO (Note 11) | (334,754 | ) | 19,199 | — | — | — | — | — | — | — | (315,555 | ) | |||||||||||||||||||||||||
Sale of Class A common stock in IPO, net of $6,204 in issuance costs and underwriters' discount | — | — | 10,476 | 105 | 14,952 | 150 | 139,684 | — | — | 139,939 | |||||||||||||||||||||||||||
Purchase of Neff Holdings units by Neff Corporation | 146,143 | — | — | — | — | — | (146,143 | ) | — | — | — | ||||||||||||||||||||||||||
Record deferred tax assets and liabilities and tax receivable liability | — | — | — | — | — | — | (35,928 | ) | — | — | (35,928 | ) | |||||||||||||||||||||||||
Initial allocation of non-controlling interest | 188,611 | (19,199 | ) | — | — | — | — | (69,798 | ) | — | (99,614 | ) | — | ||||||||||||||||||||||||
Equity-based compensation expense | — | — | — | — | — | — | — | — | 64 | 64 | |||||||||||||||||||||||||||
Net income from IPO to December 31, 2014 | — | — | — | — | — | — | — | 1,599 | 3,780 | 5,379 | |||||||||||||||||||||||||||
BALANCE—December 31, 2014 | — | — | 10,476 | 105 | 14,952 | 150 | (112,185 | ) | 1,599 | (95,770 | ) | (206,101 | ) | ||||||||||||||||||||||||
Payment of costs directly associated with the issuance of Class A common stock | — | — | — | — | — | — | (283 | ) | — | — | (283 | ) | |||||||||||||||||||||||||
Equity-based compensation expense | — | — | — | — | — | — | 1,249 | — | — | 1,249 | |||||||||||||||||||||||||||
Stock issued for restricted stock units | — | — | 18 | — | — | — | — | — | — | — | |||||||||||||||||||||||||||
Stock repurchased and canceled | — | — | (113 | ) | (1 | ) | — | — | (839 | ) | — | — | (840 | ) | |||||||||||||||||||||||
Net income | — | — | — | — | — | — | — | 15,591 | 24,594 | 40,185 | |||||||||||||||||||||||||||
BALANCE—December 31, 2015 | — | — | 10,381 | 104 | 14,952 | 150 | (112,058 | ) | 17,190 | (71,176 | ) | (165,790 | ) | ||||||||||||||||||||||||
Equity-based compensation expense | — | — | — | — | — | — | 2,000 | — | — | 2,000 | |||||||||||||||||||||||||||
Stock issued for restricted stock units | — | — | 44 | — | — | — | — | — | — | — | |||||||||||||||||||||||||||
Neff Holdings LLC stock option exercises | — | — | — | — | — | — | — | (3,770 | ) | — | (3,770 | ) | |||||||||||||||||||||||||
Stock repurchased and canceled | — | — | (1,565 | ) | (16 | ) | — | — | — | (10,885 | ) | — | (10,901 | ) | |||||||||||||||||||||||
Adjustment for change in ownership interest | — | — | — | — | — | — | — | 9,495 | (9,495 | ) | — | ||||||||||||||||||||||||||
Tax impact of common unit repurchases | — | — | — | — | — | — | 7,842 | — | — | 7,842 | |||||||||||||||||||||||||||
Distributions to member | — | — | — | — | — | — | — | — | (348 | ) | (348 | ) | |||||||||||||||||||||||||
Net income | — | — | — | — | — | — | — | 10,740 | 28,502 | 39,242 | |||||||||||||||||||||||||||
BALANCE—December 31, 2016 | $ | — | $ | — | 8,860 | $ | 88 | 14,952 | $ | 150 | $ | (102,216 | ) | $ | 22,770 | $ | (52,517 | ) | $ | (131,725 | ) | ||||||||||||||||
The accompanying notes are an integral part of these consolidated financial statements.
60
NEFF CORPORATION AND SUBSIDIARIES
CONSOLIDATED STATEMENTS OF CASH FLOWS
(in thousands)
For the Year Ended December 31, 2016 | For the Year Ended December 31, 2015 | For the Year Ended December 31, 2014 | |||||||||
Cash Flows from Operating Activities | |||||||||||
Net income | $ | 39,242 | $ | 40,185 | $ | 15,808 | |||||
Adjustments to reconcile net income to net cash provided by operating activities: | |||||||||||
Depreciation | 97,322 | 93,155 | 81,355 | ||||||||
Amortization of debt issue costs | 1,537 | 1,547 | 3,061 | ||||||||
Amortization of intangible assets | 1,070 | 1,286 | 1,510 | ||||||||
Amortization of original issue discount | 308 | 253 | 126 | ||||||||
Gain on sale of equipment | (8,575 | ) | (11,711 | ) | (15,332 | ) | |||||
Provision for bad debt | 2,877 | 2,526 | 2,705 | ||||||||
Equity-based compensation expense | 2,000 | 1,249 | 883 | ||||||||
Deferred income taxes | 6,709 | 4,053 | 1,034 | ||||||||
Adjustment to tax receivable agreement | 372 | (2,424 | ) | — | |||||||
Unrealized loss on interest rate swap | 319 | 1,880 | — | ||||||||
Loss on extinguishment of debt | — | — | 20,241 | ||||||||
Changes in operating assets and liabilities: | |||||||||||
Accounts receivable | 2,508 | (6,316 | ) | (13,482 | ) | ||||||
Inventories, prepaid expenses and other assets | (2,764 | ) | 1,205 | (2,399 | ) | ||||||
Accounts payable | 451 | (1,362 | ) | 1,139 | |||||||
Accrued expenses and other liabilities | 5,540 | (3,312 | ) | (2,563 | ) | ||||||
Net cash provided by operating activities | 148,916 | 122,214 | 94,086 | ||||||||
Cash Flows from Investing Activities | |||||||||||
Purchases of rental equipment | (112,925 | ) | (147,483 | ) | (149,174 | ) | |||||
Proceeds from sale of equipment | 23,303 | 34,772 | 34,479 | ||||||||
Purchases of property and equipment | (11,545 | ) | (13,134 | ) | (13,018 | ) | |||||
Cash paid for acquisitions | — | (3,564 | ) | — | |||||||
Net cash used in investing activities | (101,167 | ) | (129,409 | ) | (127,713 | ) | |||||
Cash Flows from Financing Activities | |||||||||||
Repayments under revolving credit facility | (156,037 | ) | (151,539 | ) | (549,240 | ) | |||||
Borrowings under revolving credit facility | 128,837 | 159,939 | 515,240 | ||||||||
Debt issue costs | (1,570 | ) | — | (9,397 | ) | ||||||
Common stock repurchases | (10,901 | ) | (840 | ) | — | ||||||
Second Lien Loan prepayment | (3,349 | ) | — | — | |||||||
Neff Holdings LLC stock option exercises | (3,770 | ) | — | — | |||||||
Proceeds from second lien loan, net | — | — | 572,125 | ||||||||
Repayment of second lien loan | — | — | (96,000 | ) | |||||||
Prepayment premium on second lien loan | — | — | (1,920 | ) | |||||||
Distribution to member | (348 | ) | — | (329,885 | ) | ||||||
Repayments of senior secured notes | — | — | (200,000 | ) | |||||||
Call premiums | — | — | (7,218 | ) | |||||||
Proceeds from issuance of Class A common stock | — | — | 146,143 | ||||||||
Payment of costs directly associated with the issuance of Class A common stock | — | (283 | ) | (6,204 | ) | ||||||
Net cash (used in) provided by financing activities | (47,138 | ) | 7,277 | 33,644 | |||||||
Net increase in cash and cash equivalents | 611 | 82 | 17 | ||||||||
Cash and cash equivalents, beginning of year | 289 | 207 | 190 | ||||||||
Cash and cash equivalents, end of year | $ | 900 | $ | 289 | $ | 207 | |||||
The accompanying notes are an integral part of these consolidated financial statements.
61
NEFF CORPORATION AND SUBSIDIARIES
NOTES TO CONSOLIDATED FINANCIAL STATEMENTS
NOTE 1—BUSINESS AND ORGANIZATION
Neff Corporation was formed as a Delaware corporation on August 18, 2014. On November 26, 2014, Neff Corporation completed an IPO of 10,476,190 shares of Class A common stock at a public offering price of $15.00 per share. A portion of the gross proceeds received by Neff Corporation from the IPO were used to purchase Common Units in Neff Holdings which was wholly owned by private investment funds managed by the Wayzata Funds prior to the IPO. We refer to these transactions as the "Organizational Transactions" (as described in Note 11). Neff Corporation's only business is to act as the sole managing member of Neff Holdings. As a result, Neff Corporation consolidates Neff Holdings for all periods presented (See Supplemental Condensed Consolidating Financial Statements). Neff Corporation and its consolidated subsidiaries, including Neff Holdings and Neff Holdings' subsidiaries, Neff LLC and Neff Rental LLC, are referred to as the "Company".
The Company owns and operates equipment rental locations in the United States. The Company also sells used equipment, parts and merchandise and provides ongoing repair and maintenance services.
All intercompany transactions and balances have been eliminated in consolidation.
Tax Receivable Agreement
Neff Corporation entered into a tax receivable agreement (the "Tax Receivable Agreement") with Neff Holdings, the Wayzata Funds and the holders of existing options to acquire Common Units in Neff Holdings that will provide for the payment by Neff Corporation to such persons of 85% of the amount of tax benefits, if any, that Neff Corporation actually realizes (or in some circumstances is deemed to realize) as a result of (i) increases in tax basis resulting from any redemptions or exchanges of Common Units (ii) certain allocations in connection with the organizational transactions (Note 11) and as a result of the application of the principles of Section 704(c) of the Internal Revenue Code to take into account the difference between the fair market value and the adjusted tax basis of certain assets of Neff Holdings on the date that we purchased Neff Holdings Common Units directly from Neff Holdings with the proceeds from the IPO and (iii) certain other tax benefits related to our entering into the Tax Receivable Agreement, as amended (Note 3), including tax benefits attributable to payments under the Tax Receivable Agreement.
NOTE 2—BASIS OF PRESENTATION
Consolidated Financial Statements
• | Balance Sheets - The assets, liabilities and equity of Neff Corporation and Neff Holdings have been consolidated and carried forward at historical values; |
• | Statements of Operations - The consolidated statements of operations include the historical consolidated statements of operations of Neff Holdings consolidated with the statements of operations of Neff Corporation; |
• | Statements of Stockholders' Equity/Members' Deficit and Non-Controlling Interest - Prior to the organizational transactions and the IPO (Note 11), Neff Holdings and its subsidiaries were organized as a group of limited liability companies. The Wayzata Funds' ownership interest in Neff Holdings is reflected as members' deficit prior to the IPO. As a result of the organizational transactions (Note 11), the Wayzata Funds retained a portion of their economic interest in Neff Holdings directly through the ownership of Neff Holdings Common Units and these interests are included within the non-controlling interest subsequent to the IPO; and |
• | Statements of Cash Flows - The statements of cash flows include the historical consolidated statements of cash flows of Neff Holdings consolidated with the statements of cash flows of Neff Corporation. |
Use of Estimates
The preparation of financial statements in conformity with US GAAP requires management to make estimates and assumptions that affect the reported amounts of assets and liabilities and disclosure of contingent assets and liabilities at the date of the financial statements and the reported amounts of revenues and expenses during the reporting period. The Company considers critical accounting policies to be those that require more significant judgments and estimates in the preparation of the consolidated financial statements including those related to depreciation, income taxes, self-insurance reserves, goodwill and intangible assets, and amounts payable pursuant to the Tax Receivable Agreement. Management relies on historical experience and other
62
NEFF CORPORATION AND SUBSIDIARIES
NOTES TO CONSOLIDATED FINANCIAL STATEMENTS (Continued)
NOTE 2—BASIS OF PRESENTATION (Continued)
assumptions, believed to be reasonable under the circumstances, in making its judgments and estimates. Actual results could differ from those judgments and estimates.
Recognition of Revenue
The Company recognizes revenue when all of the following criteria are met: (1) persuasive evidence of an arrangement exists, (2) delivery has occurred, (3) the price is fixed or determinable and (4) collectability is probable.
Rental revenues in the consolidated statements of operations include revenues earned on equipment rentals and related revenues such as the fees the Company charges for the pickup and delivery of equipment, damage waivers and other surcharges. Revenues earned on equipment rentals are recognized as earned over the contract period which may be daily, weekly or monthly. Revenues earned on pickup and delivery fees, damage waivers and other surcharges, are recognized at the time the services are provided.
Revenues from the sale of equipment and parts are recognized at the time of delivery to, or pickup by the customer and when all obligations under the sales contract have been fulfilled. Service revenues are recognized at the time the services are provided.
Sales taxes collected are not included in reported sales.
Delivery Costs
Depreciation of delivery vehicles is included in other operating expenses in the consolidated statements of operations and amounted to approximately $5.9 million, $6.9 million and $6.2 million for the years ended December 31, 2016, 2015 and 2014, respectively. All other delivery related costs are included in cost of revenues.
Cash Equivalents
The Company considers all highly liquid investments purchased with an original maturity of three months or less to be cash equivalents.
Inventories
Inventories, which consist principally of parts and supplies, are stated at the lower of cost or market, with cost determined on the first-in, first-out basis.
Property and Equipment
Property and equipment is initially recorded at original cost and is stated net of accumulated depreciation. Depreciation is recorded using the straight-line method over the estimated useful lives of the related assets. Significant improvements are capitalized at cost. Repairs and maintenance are expensed as incurred. Leasehold improvements are amortized using the straight-line method over their useful lives or the life of the lease, whichever is shorter.
The Company assigns the following estimated useful lives to these categories:
Category | |
Buildings | 30 years |
Office equipment | 2-8 years |
Service equipment and vehicles | 2-8 years |
Shop equipment | 7 years |
Rental Equipment
Rental equipment is initially recorded at original cost and is stated net of accumulated depreciation. Depreciation is recorded using the straight-line method over the estimated useful life of the related equipment (generally two to eight years with estimated 10-20% residual values).
63
NEFF CORPORATION AND SUBSIDIARIES
NOTES TO CONSOLIDATED FINANCIAL STATEMENTS (Continued)
NOTE 2—BASIS OF PRESENTATION (Continued)
The Company routinely reviews the assumptions utilized in computing rates of depreciation of its rental equipment. Changes to the assumptions (such as the length of service lives and/or the amount of residual values) are made when, in the opinion of management, such changes are necessary to more appropriately allocate asset costs to operations over the service life of the assets.
Management utilizes, among other factors, historical experience and industry comparisons in determining the propriety of any such changes. The Company may be required to change these estimates based on changes in its industry, end markets or other circumstances. If these estimates change in the future, the Company may be required to recognize increased or decreased depreciation expense for these assets.
Valuation of Long-lived Assets
Long-lived assets and intangibles with finite useful lives (customer list) are evaluated for impairment if events or circumstances suggest that assets may be impaired. An assessment of recoverability is performed prior to any write-down of assets based on the undiscounted cash flows of the assets. An impairment charge is recorded on those assets considered impaired for which the estimated fair value is below the carrying amount.
Insurance
The Company is insured against general liability claims, workers' compensation claims and automobile liability claims up to specified limits per claim and in the aggregate, subject to deductibles per occurrence of up to $0.3 million. Insured losses within these deductible amounts are accrued based upon the aggregate liability for reported claims incurred as well as an estimated liability for claims incurred but not reported. These liabilities are not discounted and are classified in accrued expenses and other liabilities. The Company is self-insured for group medical and dental claims. The Company has accrued a liability net of expected insurance recoveries for unpaid claims, including incurred but not reported claims, totaling $3.0 million and $3.1 million, for insurance as of December 31, 2016 and 2015, respectively. The Company had $3.9 million in outstanding letters of credit at December 31, 2016 that were associated with its insurance coverage.
Income Taxes
The Company is a taxpayer subject to income taxes at rates generally applicable to C corporations, and therefore its results of operations are affected by the amount of accruals for tax benefits or payments that Neff Holdings (as a partnership for U.S. federal income tax purposes) historically has not reflected in its results of operations.
Goodwill and Intangible Assets
Goodwill and trademarks and tradenames are reviewed at least annually for impairment. The Company conducts annual impairment tests on October 1 of each fiscal year or whenever an indicator of impairment exists. The customer list is amortized over its useful life (Note 8). The Company expenses costs to renew or extend the term of a recognized intangible asset.
Fair Value of Financial Instruments
The fair value of financial instruments held by the Company is based on a variety of factors and assumptions and may not necessarily be representative of the actual gains or losses that will be realized in the future and does not include expenses that could be incurred in an actual sale or settlement of such assets or liabilities.
The carrying value of accounts receivable, accounts payable and accrued liabilities approximate fair value due to the short term maturities of these instruments unless otherwise disclosed in these consolidated financial statements (Note 17).
Advertising
Advertising costs are expensed as incurred. Advertising expense totaled approximately $0.6 million for each of the years ended December 31, 2016, 2015 and 2014.
Segment Reporting
The Company's operations consist of the rental and sale of equipment, and parts and services in five regions in the United States: Florida, Atlantic, Central, Southeastern and Western. The five regions are the Company's operating segments and are
64
NEFF CORPORATION AND SUBSIDIARIES
NOTES TO CONSOLIDATED FINANCIAL STATEMENTS (Continued)
NOTE 2—BASIS OF PRESENTATION (Continued)
aggregated into one reportable segment because they rent similar products and have similar economic characteristics. The Company operates in the United States and had minimal international sales for each of the periods presented.
Comprehensive Income (Loss)
The Company had no items of other comprehensive income (loss) in any of the periods presented.
Recently Issued Accounting Pronouncements
Under the JOBS Act, the Company meets the definition of an emerging growth company. Under the JOBS Act, emerging growth companies can delay adopting new or revised accounting standards issued subsequent to the enactment of the JOBS Act until such time as those standards apply to private companies. The Company has irrevocably elected to avail itself of this exemption from adopting new or revised accounting standards and, therefore, will not be subject to new or revised accounting standards until such time as those standards apply to private companies.
In May 2014, the Financial Accounting Standards Board (the "FASB") issued Accounting Standards Update ("ASU") No. 2014-09, Revenues for Contracts with Customers (Topic 606), ("ASU 2014-09") which provides guidance on recognizing revenue. The guidance includes steps an entity should apply to achieve the core principle that an entity should recognize revenue to depict the transfer of promised goods or services to customers in an amount that reflects the consideration to which the entity expects to be entitled in exchange for those goods or services. The FASB has agreed to a one-year deferral of the original effective date of this guidance and as a result it will be effective for private companies for annual periods beginning after December 15, 2018 and interim periods beginning after December 15, 2019. The FASB's update allows entities to apply the new guidance as of the original effective date. The Company expects to adopt this guidance when effective for private companies and the impact on our financial statements is not currently estimable.
In February 2016, the FASB issued ASU No. 2016-02, Leases (Topic 842), ("ASU 2016-02") to increase transparency and comparability among organizations by recognizing lease assets and lease liabilities on the balance sheet and disclosing key information about leasing arrangements. This guidance is effective for private companies for fiscal years beginning after December 15, 2019, and interim periods within fiscal years beginning after December 15, 2020 and requires application on a modified retrospective basis. The modified retrospective basis includes a number of optional practical expedients that entities may elect to apply. The Company expects to adopt this guidance when effective for private companies and is currently evaluating the impact of ASU 2016-02 on the Company's financial statements and disclosures.
In August 2016, the FASB issued ASU No. 2016-15, Statement of Cash Flows (Topic 230): Classification of Certain Cash Receipts and Cash Payments (a consensus of Emerging Issues Task Force), ("ASU 2016-15") to reduce the existing diversity in practice in how certain cash receipts and cash payments are presented and classified in the statement of cash flows under Topic 230, Statement of Cash Flows, and other topics. This guidance is effective for private companies for fiscal years beginning after December 15, 2018, and interim periods within fiscal years beginning after December 15, 2019 and requires application on a retrospective transition method to each period presented. If it is impracticable to apply the amendments retrospectively for some of the issues, the amendments for those issues would be applied prospectively as of the earliest date practicable. The Company expects to adopt this guidance when effective for private companies and does not expect this guidance to have a significant impact on the Company's financial statements.
In January 2017, the FASB issued ASU No. 2017-04, Intangibles-Goodwill and Other (Topic 350): Simplifying the Test for Goodwill Impairment, ("ASU 2017-04") which removes the step 2 requirement to perform a hypothetical purchase price allocation to measure goodwill impairment. Goodwill impairment will now be the amount by which a reporting unit's carrying value exceeds its fair value, not to exceed the carrying amount of goodwill. This guidance is effective for public companies for annual or any interim goodwill impairment tests in fiscal years beginning after December 15, 2019. As ASU 2017-04 will become effective after the expiration of the period potentially covered by the JOBS Act, the Company expect to adopt this guidance when effective for public companies. The Company does not expect this guidance to have a significant impact on the Company's financial statements.
65
NEFF CORPORATION AND SUBSIDIARIES
NOTES TO CONSOLIDATED FINANCIAL STATEMENTS (Continued)
NOTE 2—BASIS OF PRESENTATION (Continued)
Recently Adopted Accounting Pronouncements
In April 2015, the FASB issued ASU No. 2015-03, Interest-Imputation of Interest (Subtopic 835-30) - Simplifying the Presentation of Debt Issuance Costs, ("ASU 2015-03") which provides guidance on the presentation of debt issuance costs. This guidance requires that debt issuance costs related to a recognized debt liability be presented in the balance sheet as a direct deduction from the carrying amount of that debt liability and amortization of debt issuance costs will be reported as interest expense. This guidance became effective for the Company as of the year ended December 31, 2016 and requires application on a retrospective basis. As a result of adopting this guidance, total assets and total liabilities as of December 31, 2015 changed as shown below (in thousands):
Prepaid expenses and other assets | Total assets | Revolving credit facility | Second lien loan | Total liabilities | ||||||||||||||||
Previously reported | $ | 14,488 | $ | 653,727 | $ | 253,600 | $ | 476,966 | $ | 819,517 | ||||||||||
Reclassification of debt issue costs | (8,901 | ) | (8,901 | ) | (3,128 | ) | (5,773 | ) | (8,901 | ) | ||||||||||
Current presentation | $ | 5,587 | $ | 644,826 | $ | 250,472 | $ | 471,193 | $ | 810,616 | ||||||||||
Additionally, interest expense for the years ended December 31, 2015 and 2014 changed as shown below (in thousands):
For the year ended December 31, 2015 | For the year ended December 31, 2014 | |||||||
Interest expense as previously reported | $ | 43,025 | $ | 40,481 | ||||
Reclassification of amortization of debt issue costs | 1,547 | 3,061 | ||||||
Current presentation of interest expense | $ | 44,572 | $ | 43,542 | ||||
NOTE 3—NON-CONTROLLING INTEREST
Neff Corporation is the sole managing member of Neff Holdings. As a result, Neff Corporation operates and controls all of the business and affairs of Neff Holdings while owning a 37.2% minority economic interest in Neff Holdings. Neff Corporation
consolidates the financial results of Neff Holdings and its subsidiaries and records a non-controlling interest for the remaining 62.8% economic interest in Neff Holdings held by the Wayzata Funds. On a stand alone basis, Neff Corporation's only sources of cash flow from operations are distributions from Neff Holdings. Net income attributable to the non-controlling interest on the consolidated statements of operations represents the portion of earnings attributable to the economic interest in Neff Holdings held by the non-controlling unitholders. The non-controlling interest on the consolidated balance sheets represents the carryover basis of the Wayzata Funds' capital accounts in Neff Holdings. Non-controlling interest is adjusted to reflect the distributions to and income allocated to the non-controlling unitholders. The ownership of the Common Units is summarized as follows:
Non-controlling ownership of Common Units in Neff Holdings | Neff Corporation ownership of Common Units in Neff Holdings | Total | ||||||
As of December 31, 2016 | 14,951,625 | 8,859,662 | 23,811,287 | |||||
62.8 | % | 37.2 | % | 100.0 | % | |||
Non-controlling ownership of Common Units in Neff Holdings | Neff Corporation ownership of Common Units in Neff Holdings | Total | ||||||
As of December 31, 2015 | 14,951,625 | 10,380,781 | 25,332,406 | |||||
59.0 | % | 41.0 | % | 100.0 | % | |||
66
NEFF CORPORATION AND SUBSIDIARIES
NOTES TO CONSOLIDATED FINANCIAL STATEMENTS (Continued)
NOTE 3—NON-CONTROLLING INTEREST (Continued)
The following table summarizes the activity in the non-controlling interest from December 31, 2015 to December 31, 2016 (in thousands):
Balance of non-controlling interest as of December 31, 2015 | $ | (71,176 | ) |
Net income attributable to non-controlling interest | 28,502 | ||
Distributions to member (see Distributions for Taxes below) | (348 | ) | |
Adjustment for change in ownership interest | (9,495 | ) | |
Balance of non-controlling interest as of December 31, 2016 | $ | (52,517 | ) |
Distributions for Taxes
As a limited liability company (treated as a partnership for income tax purposes), Neff Holdings does not incur significant federal or state and local income taxes, as these taxes are primarily the obligations of the members of Neff Holdings. As authorized by the Neff Holdings LLC agreement, Neff Holdings is required to distribute cash, generally, on a pro rata basis, to its members to the extent necessary to cover the members’ tax liabilities, if any, with respect to their share of Neff Holdings' earnings. During the year ended December 31, 2016, Neff Holdings' distributed $0.3 million for a tax liability attributable to a Wayzata fund.
Payments Pursuant to the Tax Receivable Agreement
As of December 31, 2016, the Company recorded a liability of $29.5 million, representing the estimated payments due to the Prior LLC Owners under the Tax Receivable Agreement with the Prior LLC Owners as a result of the special allocation of depreciation and amortization deductions in excess of our pro rata share of such items. The liability as of December 31, 2016 increased by $0.4 million from December 31, 2015, due to changes in estimated future payments as a result of the tax benefit Neff Corporation will obtain as a result of the special allocation of gain, to the Wayzata Funds, resulting from the sale of equipment that existed at the date of the IPO, in accordance with Section 704(c) of the Internal Revenue Code. The Company expects these changes from the special allocation of gain will likely occur quarterly.
On June 2, 2015, the Company, the Wayzata Funds and the Prior LLC Owners entered into an amendment to the Tax Receivable Agreement (the "Tax Receivable Agreement Amendment"), dated as of May 27, 2015. The Tax Receivable Agreement Amendment amended the Tax Receivable Agreement to eliminate any benefit to the Wayzata Funds and the Prior LLC Owners relating to tax adjustments arising from state, local or foreign taxes in order to relieve the substantial burden on the Company to calculate such benefit.
Payments are anticipated to be made under the Tax Receivable Agreement when Neff Corporation utilizes a benefit. The payments are to be made in accordance with the terms of the Tax Receivable Agreement. The timing of the payments is subject to certain contingencies including Neff Corporation having sufficient taxable income to utilize all of the tax benefits defined in the Tax Receivable Agreement.
Obligations pursuant to the Tax Receivable Agreement are obligations of Neff Corporation and are not obligations of Neff Holdings. They do not impact the non-controlling interest. These obligations are not income tax obligations and have no impact on the tax provision or the allocation of taxes. In general, items of income, gain, loss and deduction are allocated on the basis of member’s ownership interests pursuant to the Neff Holdings LLC agreement after taking into consideration all relevant sections of the Internal Revenue Code.
No amounts were paid pursuant to the terms of the Tax Receivable Agreement during the twelve months ended December 31, 2016 and 2015.
NOTE 4 - EARNINGS PER SHARE
Basic earnings per share is computed by dividing net income available to common stockholders by the weighted-average number of common shares outstanding during the period, including vested restricted stock units ("RSUs"). Diluted earnings per share is computed by dividing net income available to common stockholders by the weighted-average number of
common shares plus the dilutive effect of potential common shares outstanding during the period. For RSUs with performance-based vesting, no common equivalent shares are included in the computation of diluted earnings per share until the related
67
NEFF CORPORATION AND SUBSIDIARIES
NOTES TO CONSOLIDATED FINANCIAL STATEMENTS (Continued)
NOTE 4 - EARNINGS PER SHARE (Continued)
performance criteria have been met. The following table sets forth the computation of basic and diluted earnings per share (in thousands, except per share amounts):
For the Year Ended December 31, 2016 | For the Year Ended December 31, 2015 | November 26, 2014 through December 31, 2014 | |||||||||
Numerator: | |||||||||||
Net income attributable to Neff Corporation | $ | 10,740 | $ | 15,591 | $ | 1,599 | |||||
Denominator for basic net income per share of Class A common stock: | |||||||||||
Weighted average shares of Class A common stock outstanding | 9,358 | 10,477 | 10,476 | ||||||||
Denominator for diluted net income per share of Class A common stock: | |||||||||||
Weighted average shares of Class A common stock outstanding, diluted | 9,667 | 12,069 | 12,011 | ||||||||
Earnings per share of Class A common stock: | |||||||||||
Net income attributable to Neff Corporation per share of Class A common stock, basic | $ | 1.15 | $ | 1.49 | $ | 0.15 | |||||
Net income attributable to Neff Corporation per share of Class A common stock, diluted | $ | 1.11 | $ | 1.29 | $ | 0.13 | |||||
Basic and diluted earnings per share information is not applicable for reporting periods prior to the completion of the IPO which became effective on November 26, 2014. The shares of Class B common stock outstanding do not participate in the earnings of Neff Corporation and are therefore not participating securities. Accordingly, basic and diluted net income per share of Class B common stock have not been presented.
Potentially dilutive stock options representing a total of 0.8 million shares of Class A common stock for the year ended December 31, 2016 were excluded from the computation of diluted weighted average shares outstanding due to their anti-dilutive effect.
In November 2015, the Company's board of directors authorized a share repurchase program pursuant to which the Company may purchase shares of its Class A common stock. Under the share repurchase program, the Company may acquire up to $25 million of shares of Class A common stock in open market and privately negotiated purchases from time to time, dependent on market conditions. During the years ended December 31, 2016 and 2015, the Company repurchased 1.6 million and 0.1 million shares of Class A common stock for $10.9 million and $0.8 million, including commissions, respectively. At December 31, 2016, there were approximately $13.2 million in remaining funds authorized under this program.
NOTE 5—ACCOUNTS RECEIVABLE
The Company extends credit to its customers and evaluates collectability of accounts receivable based upon an evaluation of the customer's financial condition and credit history. For receivables from customers on certain types of construction projects, the Company's policy is to secure its accounts receivable by obtaining liens on the customer's projects and issuing notices of the liens to the project's owners and general contractors. All other receivables are generally unsecured.
68
NEFF CORPORATION AND SUBSIDIARIES
NOTES TO CONSOLIDATED FINANCIAL STATEMENTS (Continued)
NOTE 5—ACCOUNTS RECEIVABLE (Continued)
The following table summarizes activity for allowance for doubtful accounts (in thousands):
For the Year Ended December 31, | |||||||||||
2016 | 2015 | 2014 | |||||||||
Beginning balance | $ | 2,508 | $ | 2,125 | $ | 1,639 | |||||
Provision for bad debt | 2,877 | 2,526 | 2,705 | ||||||||
Charge offs | (2,904 | ) | (2,143 | ) | (2,219 | ) | |||||
Ending balance | $ | 2,481 | $ | 2,508 | $ | 2,125 | |||||
NOTE 6—RENTAL EQUIPMENT
Rental equipment consisted of the following as of December 31, 2016 and 2015 (in thousands):
December 31, 2016 | December 31, 2015 | ||||||
Rental equipment | $ | 782,406 | $ | 713,916 | |||
Less: accumulated depreciation | (320,322 | ) | (256,446 | ) | |||
Rental equipment, net | $ | 462,084 | $ | 457,470 | |||
Depreciation expense for rental equipment was $88.7 million, $83.9 million and $73.3 million for the years ended December 31, 2016, 2015 and 2014, respectively.
NOTE 7—PROPERTY AND EQUIPMENT
Property and equipment consist of the following as of December 31, 2016 and 2015 (in thousands):
December 31, 2016 | December 31, 2015 | ||||||
Land | $ | 25 | $ | 25 | |||
Buildings | 55 | 55 | |||||
Leasehold improvements | 6,970 | 5,520 | |||||
Office equipment | 5,183 | 3,923 | |||||
Service equipment and vehicles | 59,511 | 54,908 | |||||
Shop equipment | 3,875 | 3,193 | |||||
75,619 | 67,624 | ||||||
Less: accumulated depreciation | (40,085 | ) | (34,151 | ) | |||
Property and equipment, net | $ | 35,534 | $ | 33,473 | |||
Depreciation expense for property and equipment was $8.6 million, $9.2 million and $8.1 million for the years ended December 31, 2016, 2015 and 2014, respectively.
NOTE 8—INTANGIBLE ASSETS
The Company's trademarks and tradenames are intangible assets with indefinite useful lives. The Company tests its trademarks and tradenames for impairment annually or as of an interim date if circumstances suggest that assets may be impaired. As part of its annual impairment testing of intangible assets, the Company may perform a qualitative or quantitative assessment. If a quantitative test is performed, the fair value of the trademarks and tradenames is measured using the royalty savings method which includes inputs such as revenue, a royalty rate and a discount rate, to reflect the savings realized by owning the trademarks and tradenames, and thus not having to pay a royalty fee to a third party. The Company tested its trademarks and tradenames as of October 1, 2016, 2015 and 2014 and determined that its trademarks and tradenames were not impaired.
69
NEFF CORPORATION AND SUBSIDIARIES
NOTES TO CONSOLIDATED FINANCIAL STATEMENTS (Continued)
NOTE 8—INTANGIBLE ASSETS (Continued)
The Company reviews its customer list for indicators of impairment at least annually and tests for impairment if indicators exist.
The carrying amount and accumulated amortization of intangible assets as of December 31, 2016 and 2015, consisted of the following (in thousands, except as noted):
December 31, 2016 | |||||||||||||
Average Useful Life (in years) | Gross Carrying Amount | Accumulated Amortization | Net Book Value | ||||||||||
Indefinite life: | |||||||||||||
Trademarks and tradenames | N/A | $ | 10,854 | $ | — | $ | 10,854 | ||||||
Finite life: | |||||||||||||
Customer list | 12 | 13,987 | (10,595 | ) | 3,392 | ||||||||
Total intangible assets | $ | 24,841 | $ | (10,595 | ) | $ | 14,246 | ||||||
December 31, 2015 | |||||||||||||
Average Useful Life (in years) | Gross Carrying Amount | Accumulated Amortization | Net Book Value | ||||||||||
Indefinite life: | |||||||||||||
Trademarks and tradenames | N/A | $ | 10,854 | $ | — | $ | 10,854 | ||||||
Finite life: | |||||||||||||
Customer list | 12 | 13,987 | (9,527 | ) | 4,460 | ||||||||
Total intangible assets | $ | 24,841 | $ | (9,527 | ) | $ | 15,314 | ||||||
The customer list is amortized on an accelerated basis, based on estimated cash flows over the useful life of the customer list. Accumulated amortization and expected future annual amortization expense are as follows (in thousands):
Accumulated amortization at December 31, 2016 | $ | 10,595 | |
Estimated amortization expense | |||
2017 | 877 | ||
2018 | 719 | ||
2019 | 589 | ||
2020 | 483 | ||
2021 | 396 | ||
2022 | 328 | ||
Total | $ | 13,987 | |
Amortization expense related to the customer list was $1.1 million, $1.3 million and $1.5 million for the years ended December 31, 2016, 2015 and 2014, respectively.
NOTE 9—GOODWILL
Goodwill represents the excess of cost over the fair value of identifiable net assets of businesses acquired. Goodwill is not amortized, but instead is tested for impairment annually or, if necessary, more frequently if events indicate a decline in fair value below its carrying value. As part of its annual impairment testing of goodwill, the Company may perform a qualitative or quantitative assessment. Should the qualitative assessment indicate that the two-step impairment test must be performed, the Company must first determine whether the fair value of the reporting unit exceeds the carrying value. If the fair value of the reporting unit is less than the implied value, the Company is required to write-off the excess goodwill as an operating expense.
70
NEFF CORPORATION AND SUBSIDIARIES
NOTES TO CONSOLIDATED FINANCIAL STATEMENTS (Continued)
NOTE 9—GOODWILL (Continued)
The Company uses an equally weighted combination of the income and market approaches when performing its two-step impairment test of goodwill. The Company assigns an equal weight to the respective methods as they are both acceptable valuation approaches in determining the fair value of a business.
The income approach establishes fair value by methods which discount or capitalize earnings and/or cash flow by a discount or capitalization rate that reflects market rate of return expectations, market conditions and the risk of the relative investment. The Company uses a discounted cash flow method when applying the income approach. The market approach was based on market price data of shares of the Company.
The Company tested its goodwill as of October 1, 2016, 2015 and 2014 and determined that its goodwill was not impaired. The balance of goodwill as of December 31, 2016 was $60.6 million. There were no material changes in the carrying amount of goodwill for the year ended December 31, 2016. On October 1, 2015, the Company acquired the assets of Lewis Rents, Inc. which resulted in $1.8 million of additional goodwill and a balance of goodwill as of December 31, 2015 of $60.6 million.
NOTE 10—DEBT
Debt consisted of the following as of December 31, 2016 and 2015 (in thousands, except percent data):
December 31, 2016 | December 31, 2015 | ||||||
Revolving Credit Facility with interest ranging from the lender's prime rate plus up to 1.0% to LIBOR plus up to 2.0%, net of unamortized debt issue costs of $3,869 in 2016 and $3,128 in 2015 (2.68% at December 31, 2016) | $ | 222,531 | $ | 250,472 | |||
Second Lien Loan with interest of LIBOR plus 6.25%, with 1.0% LIBOR floor, net of unamortized debt issue costs of $5,065 in 2016 and $5,773 in 2015 and unamortized discount of $1,726 in 2016 and $2,034 in 2015 (7.25% at December 31, 2016) | 468,860 | 471,193 | |||||
Total indebtedness | $ | 691,391 | $ | 721,665 | |||
On October 1, 2010, Neff Rental LLC and Neff LLC (subsidiaries of Neff Holdings) entered into the Revolving Credit Facility as co-borrowers. The obligations under the Revolving Credit Facility are guaranteed by Neff Holdings LLC. The Revolving Credit Facility is secured by a first priority security interest in substantially all of the Company’s assets. Interest on any base rate loans under the Revolving Credit Facility is due quarterly and interest on any LIBOR rate loans under the Revolving Credit Facility is due at three month intervals or, if shorter, at the end of the selected LIBOR period. Availability under the Revolving Credit Facility is subject to a borrowing base formula consisting of eligible accounts receivable and eligible rental fleet.
Following a series of amendments and restatements in 2012 and 2013, the Revolving Credit Facility (i) allowed a total maximum borrowing capacity of $375.0 million, (ii) provided a mechanism whereby the Company could request (but lenders under the Revolving Credit Facility have no obligation to provide) up to $100.0 million of incremental revolving loan commitments under the Revolving Credit Facility, (iii) reduced applicable margins applicable to loans and other credit extensions, (iv) permitted the 2013 payment of a $110.0 million cash distribution to members of Neff Holdings LLC; and (v) provided a maturity date of November 20, 2018.
On June 9, 2014, Neff Rental LLC entered into a second lien credit agreement (the “Second Lien Credit Agreement”) as borrower. Under the terms of the Second Lien Credit Agreement, Neff Rental LLC borrowed $575.0 million of second lien term loans (the “Second Lien Loan”).
The obligations under the Second Lien Credit Agreement are guaranteed by Neff Holdings LLC and Neff LLC and are secured by a second priority security interest in substantially all of the Company’s assets. The Second Lien Loan included a $2.9 million original issue discount that will be amortized as interest expense over the term of the Second Lien Loan. The Second Lien Loan has a maturity date of June 9, 2021.
The Company used the net proceeds from the Second Lien Loan to redeem the previously outstanding $200.0 million aggregate principal amount of 9.625% senior secured notes, to pay a $329.9 million cash distribution to the members of Neff Holdings LLC (the “June 2014 Distribution”), to pay incentive bonuses earned in connection with consummation of the refinancing to management and certain members of Neff Holdings’ board of managers (the “Transaction Bonus”) and to pay fees and expenses.
71
NEFF CORPORATION AND SUBSIDIARIES
NOTES TO CONSOLIDATED FINANCIAL STATEMENTS (Continued)
NOTE 10—DEBT (Continued)
As a result of the repayment of the senior secured notes, the Company recorded a loss on extinguishment of debt of $15.9 million (including $8.7 million of unamortized debt issue costs and $7.2 million for call premiums).
On June 9, 2014, in connection with entering into the Second Lien Credit Agreement and repayment of the senior secured notes, the Revolving Credit Facility was further amended (the “June 2014 Amendment”). Among other things, the June 2014 Amendment increased total maximum borrowing capacity from $375.0 million to $425.0 million, permitted the payment of the June 2014 Distribution, permitted the payment of the Transaction Bonus, permitted the repayment of the senior secured notes and modified the consolidated total leverage ratio covenant.
On October 14, 2014, the Revolving Credit Facility and Second Lien Loan were amended in anticipation of and conditional upon completion of the IPO (the "October 2014 Amendments"). The October 2014 Amendments, among other things, reflected the changes in the Company's structure as a result of the organizational transactions (Note 11) and the IPO. The Company also prepaid $96.0 million of the principal amount of the Second Lien Loan with the net proceeds from the IPO.
On February 25, 2016, Neff Holdings, Neff LLC and Neff Rental LLC (collectively, the “Credit Parties”), amended and restated the revolving credit facility (the “2016 Amendment and Restatement”). The 2016 Amendment and Restatement, among other things, increased total maximum borrowing capacity from $425.0 million to $475.0 million, extended the maturity from November 20, 2018 to February 25, 2021, increased the amount that the Company could request (but the lenders under the revolving credit agreement have no obligation to provide) from $25.0 million to $100.0 million of incremental revolving loan commitments, reduced applicable margins applicable to loans and other credit extensions, modified excess availability requirements relating to cash dominion, and modified certain baskets, thresholds and ratios, including the consolidated total leverage ratio.
The Revolving Credit Facility and Second Lien Credit Agreement contain various affirmative, negative and financial reporting covenants. The covenants, among other things, place restrictions on the Company’s ability to acquire and sell assets, incur additional indebtedness and prepay other indebtedness other than the Revolving Credit Facility. The Company is subject to certain financial covenants under its Revolving Credit Facility if availability declines below $47.5 million. The Company was in compliance with all financial covenants under the Revolving Credit Facility and the Second Lien Credit Agreement as of December 31, 2016.
As of December 31, 2016, our total leverage ratio is 3.60. Under the terms of the Second Lien Loan, if the total leverage ratio is equal to or less than 4.00 to 1.00 but greater than 3.00 to 1.00 at the end of the fiscal year, the Company must make a mandatory prepayment equal to 25% of its excess cash flow. A mandatory prepayment of $11.8 million will be made during 2017.
The Company had $3.9 million and $3.7 million in outstanding letters of credit at December 31, 2016 and 2015, respectively, that were primarily associated with its insurance coverage. As of December 31, 2016, total availability under the Revolving Credit Facility was $223.0 million.
NOTE 11—CAPITAL STRUCTURE
Organizational Transactions
In connection with the completion of the IPO, the following organizational transactions were consummated:
• | The preexisting Neff Holdings LLC agreement was amended to, among other things (i) provide for a new class of Common Units, (ii) convert the Wayzata Funds' existing membership interest in Neff Holdings into Common Units and (iii) appoint Neff Corporation as the sole managing member of Neff Holdings; |
• | Neff Corporation's certificate of incorporation was amended to, among other things (i) provide for Class A common stock and Class B common stock and (ii) convert the Wayzata Funds' equity interests in Neff Corporation into 14,951,625 shares of Class B common stock; |
• | 10,476,190 shares of Class A common stock were issued to the purchasers in the IPO for $157.1 million in gross proceeds, or $146.1 million after deducting $11.0 million of underwriting discounts and commissions; |
• | $146.1 million in proceeds were used to purchase 10,476,190 Common Units directly from Neff Holdings at a price per unit equal to the IPO price per share of Class A common stock, representing 41.2% of Neff Holdings' outstanding Common Units; |
72
NEFF CORPORATION AND SUBSIDIARIES
NOTES TO CONSOLIDATED FINANCIAL STATEMENTS (Continued)
NOTE 11—CAPITAL STRUCTURE (Continued)
• | Neff Holdings used the net proceeds from the sale of Common Units to Neff Corporation to (i) repay or prepay certain indebtedness (including any prepayment premium) and (ii) pay the other fees and expenses from the IPO; |
• | Stock options and restricted stock units covering a total of 355,504 shares of our Class A common stock were granted to certain of our directors and certain of our employees (Note 12); and |
• | Neff Corporation entered into the Registration Rights Agreement with the Wayzata Funds and the Prior LLC Owners and the Tax Receivable Agreement with the Prior LLC Owners. |
Initial Public Offering
The IPO closed on November 26, 2014, and Neff Corporation raised a total of $157.1 million in gross proceeds from the sale of 10,476,190 shares of Class A common stock at $15.00 per share, or $146.1 million after deducting $11.0 million of underwriting discounts and commissions.
Of the $146.1 million received by Neff Holdings, $40.0 million was used to repay borrowings under the Revolving Credit Facility, $96.0 million was used to prepay a portion of the outstanding principal amount of the Second Lien Loan, $2.6 million was used to pay prepayment penalties and other expenses and $7.5 million was used to pay accrued interest and other expenses related to the IPO.
Neff Corporation Capital Structure
Subsequent to the Organizational Transactions and IPO as described above, Neff Corporation has two classes of common stock, Class A common stock and Class B common stock, which are described as follows:
Class A Common Stock
Holders of shares of our Class A common stock are entitled to one vote for each share held of record on all matters submitted to a vote of stockholders. The holders of our Class A common stock do not have cumulative voting rights in the election of directors.
Holders of shares of our Class A common stock are entitled to receive dividends when and if declared by our board of directors out of funds legally available therefor, subject to any statutory or contractual restrictions on the payment of dividends and to any restrictions on the payment of dividends imposed by the terms of any outstanding preferred stock. Upon our dissolution or liquidation or the sale of all or substantially all of our assets, after payment in full of all amounts required to be paid to creditors and to the holders of preferred stock having liquidation preferences, if any, the holders of shares of our Class A common stock will be entitled to receive pro rata our remaining assets available for distribution. Holders of shares of our Class A common stock do not have preemptive, subscription, redemption or conversion rights. There will be no redemption or sinking fund provisions applicable to the Class A common stock. As of December 31, 2016, Neff Corporation had not paid nor had it declared any dividends.
Class B Common Stock
Each holder of Class B common stock shall be entitled to one vote for each share held of record on all matters submitted to a vote of stockholders. The holders of our Class B common stock do not have cumulative voting rights in the election of directors. Holders of shares of our Class B common stock will vote together with holders of our Class A common stock as a single class on all matters presented to our stockholders for their vote or approval, except as otherwise required by applicable law. Holders of our Class B common stock do not have any right to receive dividends or to receive a distribution upon a dissolution or liquidation or the sale of all or substantially all of our assets. Additionally, holders of shares of our Class B common stock do not have preemptive, subscription, redemption or conversion rights. There will be no redemption or sinking fund provisions applicable to the Class B common stock.
Preferred Stock
The total of our authorized shares of preferred stock is 10,000,000 shares. As of December 31, 2016, we have no shares of preferred stock outstanding.
73
NEFF CORPORATION AND SUBSIDIARIES
NOTES TO CONSOLIDATED FINANCIAL STATEMENTS (Continued)
NOTE 11—CAPITAL STRUCTURE (Continued)
Neff Holdings Capital Structure
Subsequent to the Organizational Transactions and the IPO as described above, Neff Holdings has one class of Common Units (Class A common units and Class B common units were converted for common units on a 1-for-1.625 basis).
Common Units
Prior to the Organizational Transactions, the total number of authorized Neff Holdings Class A common units outstanding was 9,200,000.
Prior to the Organizational Transactions, the total number of authorized Neff Holdings Class B common units was 1,000,000. As of November 20, 2014, the Company had granted options to purchase 778,374 Class B common units under its 2010 Equity Plan to certain employees and directors of Neff Holdings. The Class B common units were subordinate to the Class A preferred units, to the extent of the preference associated with such Class A preferred units, with respect to distributions and rights upon liquidation, winding up and dissolution of the Company.
In connection with the Organizational Transactions, all outstanding Neff Holdings Class A common units were converted into newly issued common units on 1-for-1.625 basis, subject to rounding, so that one common unit could be acquired with the net proceeds received in the IPO from the sale of one share of Neff Corporation Class A common stock, after the deduction of underwriting discounts and commissions (the "Class A common unit Conversion"). After the Class A common unit Conversion, there were 14,951,625 common units outstanding. Previously outstanding and unexercised options to acquire Class B common units of Neff Holdings were then substituted for options to acquire 1,264,985 shares of common units.
On November 26, 2014, Neff Corporation used the proceeds it received from the IPO to purchase 10,476,190 newly issued common units from Neff Holdings at a price per common unit equal to the public offering price per share of Neff Corporation Class A common stock, less underwriting discounts, totaling $146.1 million. Each common unit of Neff Holdings can be redeemed for, at Neff Corporation's option, newly issued shares of Neff Corporation's Class A common stock on a one-for-one basis or for a cash payment equal to the market price of one share of Neff Corporation’s Class A common stock. As of December 31, 2016, subsequent to common unit repurchases and other equity transactions, there were 23,811,287 Common Units outstanding for Neff Holdings.
NOTE 12—EQUITY—BASED COMPENSATION
Equity-based compensation expense relating to the Company's equity-based compensation awards was $2.0 million, $1.2 million and $0.9 million for the years ended December 31, 2016, 2015 and 2014, respectively.
Neff Corporation 2014 Incentive Award Plan
On November 7, 2014, the Company's board of directors adopted the Neff Corporation 2014 Incentive Award Plan (the "2014 Incentive Plan") and reserved 1,500,000 shares of Class A common stock for issuance. The 2014 Incentive Plan became effective on November 7, 2014 and provides for the grant of options, restricted stock awards, performance awards, dividend equivalent awards, deferred stock awards, deferred stock unit awards, stock payment awards or stock appreciation rights to employees, consultants and directors of the Company. At December 31, 2016, there were 321,962 remaining shares of Class A common stock available for future issuance under the 2014 Incentive Plan.
Neff Corporation Restricted Stock Units
The Company issues time-based and performance-based RSUs issuable in Class A common stock to directors (the "Director RSUs") and certain employees (the "Employee RSUs"). The Director RSUs are time-based RSUs which typically vest on the earliest of (i) the first anniversary of the grant date, (ii) the day immediately before the first annual meeting following the grant date and (iii) the date of a change in control. The Employee RSUs are performance-based RSUs. Half of the Employee RSUs will become vested on the third anniversary of the grant date if the Company's stock price is equal to or greater than a comparison group of other companies. The other half of the Employee RSUs will vest on the third anniversary of the grant date if the Company's return on invested capital exceeds the Company's weighted average cost of capital. The Company measures the value of RSUs at fair value based on the closing price of the underlying common stock on the grant date. The Company amortizes the fair value of outstanding RSUs as stock-based compensation expense over the requisite service period on a straight-line basis. For performance-
74
NEFF CORPORATION AND SUBSIDIARIES
NOTES TO CONSOLIDATED FINANCIAL STATEMENTS (Continued)
NOTE 12—EQUITY—BASED COMPENSATION (Continued)
based RSUs, compensation expense is recognized to the extent that the satisfaction of the performance condition is considered probable.
The following table summarizes the RSUs granted (RSUs in thousands):
For the Year Ended December 31, | ||||||||||||
2016 | 2015 | 2014 | ||||||||||
RSUs granted | 90 | 176 | 85 | |||||||||
Weighted-average grant date price per unit | $ | 14.75 | $ | 8.08 | $ | 15.00 | ||||||
Equity-based compensation expense for the RSUs was approximately $1.0 million, $0.7 million and $36.0 thousand for the years ended December 31, 2016, 2015 and 2014, respectively. Additionally, approximately $2.2 million of total unrecognized compensation cost, related to non-vested RSUs is expected to be recognized over a weighted-average period of 2 years.
The following table summarizes the RSU activity for the year ended December 31, 2016 (RSUs in thousands):
Stock Units | Weighted-Average Grant Date Fair Value | ||||||
Nonvested at December 31, 2015 | 243 | $ | 10.00 | ||||
Granted | 90 | $ | 14.75 | ||||
Vested | (44 | ) | 8.03 | ||||
Forfeited | — | — | |||||
Nonvested at December 31, 2016 | 289 | $ | 11.73 | ||||
Neff Corporation Options
The Company issues stock options to purchase shares of Class A common stock of Neff Corporation to certain employees of the Company. The stock options will vest over time on each of the first four anniversaries of the grant date.
The following table summarizes the stock options granted (options in thousands):
For the Year Ended December 31, | ||||||||||||
2016 | 2015 | 2014 | ||||||||||
Options granted | 131 | 426 | 270 | |||||||||
Weighted-average grant date price per unit | $ | 14.75 | $ | 8.12 | $ | 15.00 | ||||||
The weighted average grant date fair value of stock options granted in 2016, 2015 and 2014 was $7.68, $3.93 and $7.76, respectively. The fair value of the stock options at grant date was estimated using the Black-Scholes multiple option model. The following table summarizes the range of assumptions used to value stock options granted:
For the Year Ended December 31, | |||||||||
2016 | 2015 | 2014 | |||||||
Expected volatility | 52.5 | % | 48.3% - 52.0% | 52.0 | % | ||||
Risk-free interest rate | 2.0 | % | 1.8% - 2.1% | 2.1 | % | ||||
Dividend yield | — | % | — | % | — | % | |||
Expected term (in years) | 6 | 6 | 6 | ||||||
75
NEFF CORPORATION AND SUBSIDIARIES
NOTES TO CONSOLIDATED FINANCIAL STATEMENTS (Continued)
NOTE 12—EQUITY—BASED COMPENSATION (Continued)
The following table summarizes the stock option activity for the years ended December 31, 2014, 2015 and 2016 (options in thousands):
Shares | Weighted Average Exercise Price | ||||||
Outstanding at December 31, 2013 | — | $ | — | ||||
Granted | 270 | 15.00 | |||||
Exercised | — | — | |||||
Forfeited | — | — | |||||
Outstanding at December 31, 2014 | 270 | 15.00 | |||||
Granted | 426 | 8.12 | |||||
Exercised | — | — | |||||
Forfeited | — | — | |||||
Outstanding at December 31, 2015 | 696 | 10.79 | |||||
Granted | 131 | 14.75 | |||||
Exercised | — | — | |||||
Forfeited | — | — | |||||
Outstanding at December 31, 2016 | 827 | $ | 11.42 | ||||
Vested and exercisable at December 31, 2014 | — | $ | — | ||||
Vested and exercisable at December 31, 2015 | 68 | $ | 15.00 | ||||
Vested and exercisable at December 31, 2016(1) | 242 | $ | 11.97 | ||||
(1) The weighted average remaining contractual life of the vested and exercisable options as of December 31, 2016 is 8 years.
As of December 31, 2016 (options in thousands):
Options Outstanding | Options Exercisable | |||||||||||||||
Range of Exercise Prices | Amount Outstanding | Weighted Average Remaining Contractual Life (Years) | Weighted Average Exercise Price | Amount Exercisable | Weighted Average Exercise Price | |||||||||||
$0.01 - $8.03 | 406 | 8.9 | $ | 8.03 | 102 | $ | 8.03 | |||||||||
$8.04 - $14.75 | 151 | 9.7 | 14.13 | 5 | 9.94 | |||||||||||
$14.76 - $16.00 | 270 | 7.9 | 15.00 | 135 | 15.00 | |||||||||||
827 | $ | 11.42 | 242 | $ | 11.97 | |||||||||||
The following table presents information associated with options as of December 31, 2016 and 2015, and for the years ended December 31, 2016, 2015 and 2014 (in thousands):
2016 | 2015 | 2014 | ||||||||||
Intrinsic value of options outstanding as of December 31 | $ | 2,548 | $ | — | $ | — | ||||||
Intrinsic value of options exercisable as of December 31 | 637 | — | — | |||||||||
Intrinsic value of options exercised | — | — | — | |||||||||
Weighted-average grant date fair value per option | $ | — | $ | — | $ | — | ||||||
Equity-based compensation expense for the options was approximately $1.0 million, $0.6 million and $18.0 thousand for the years ended December 31, 2016, 2015 and 2014, respectively. Additionally, approximately $3.2 million of total unrecognized compensation cost, related to non-vested stock options, is expected to be recognized over a weighted-average period of 3 years.
76
NEFF CORPORATION AND SUBSIDIARIES
NOTES TO CONSOLIDATED FINANCIAL STATEMENTS (Continued)
NOTE 12—EQUITY—BASED COMPENSATION (Continued)
Neff Holdings LLC Management Equity Plan
A summary of the Neff Holdings Options granted follows:
Originally issued | As converted (see below) | |||||||||||||
Options | Weighted-Average Exercise Price | Options | Weighted-Average Exercise Price | |||||||||||
Outstanding at December 31, 2014 and 2015 | 778,374 | $ | 10.82 | 1,264,985 | $ | 6.66 | ||||||||
Outstanding at December 31, 2016 | 466,375 | 10.82 | 757,935 | 6.66 | ||||||||||
Vested and exercisable at December 31, 2014 | 775,718 | $ | 10.82 | 1,260,679 | $ | 6.66 | ||||||||
Vested and exercisable at December 31, 2015 | 778,374 | 10.82 | 1,264,985 | 6.66 | ||||||||||
Vested and exercisable at December 31, 2016(1) | 466,375 | 10.82 | 757,935 | 6.66 | ||||||||||
(1) The weighted average remaining contractual life of the vested and exercisable options as of December 31, 2016 is 4 years.
As part of the Organizational Transactions (Note 11), in connection with the IPO, the Neff Holdings LLC Agreement was amended to convert previously issued and outstanding options for Class B common units into options for Common Units on a 1-for-1.625 basis, subject to rounding.
In December 2016, 507,050 2010 Employee Options were exercised and redeemed for $3.8 million.
NOTE 13—RETIREMENT PLAN
The Company has a 401(k) plan for its employees (the "401(k) Plan"). Participating employees may contribute to the 401(k) Plan through salary deductions. Neff Rental LLC is the sponsor of the 401(k) Plan. The Company made $1.7 million, $1.4 million and $1.2 million in matching contributions to the 401(k) Plan for the years ended December 31, 2016, 2015 and 2014, respectively.
NOTE 14—DERIVATIVE FINANCIAL INSTRUMENTS
On March 24, 2015, the Company entered into an interest rate swap (the "Interest Rate Swap"), effectively converting a portion of its variable rate debt into fixed rate debt. The Interest Rate Swap is not accounted for as a hedge and changes in fair value are included directly in the consolidated statement of operations. The Company adjusts the accrued swap asset or liability by the amount of the monthly net settlement as settlements are made. Under the terms of the Interest Rate Swap, a monthly net settlement is made on approximately the 8th of each month for the difference between the fixed rate (see the fixed rate schedule below) and the variable rate, based upon the one month LIBOR rate on the notional amount of the Interest Rate Swap. The Interest Rate Swap has a notional amount of $200.0 million through April 8, 2020.
The fixed rate follows the schedule below:
April 8, 2016 to April 9, 2017 | 1.15700 | % |
April 10, 2017 to April 8, 2018 | 1.68100 | % |
April 9, 2018 to April 7, 2019 | 1.96100 | % |
April 8, 2019 to April 8, 2020 | 2.14300 | % |
The Company's transactions in derivative financial instruments are authorized and executed pursuant to its regularly reviewed policies and procedures, which prohibit the use of derivative financial instruments for trading or speculative purposes.
For the year ended December 31, 2016, the Company recognized a loss on Interest Rate Swap of $1.3 million which consisted of $0.3 million of unrealized losses related to the change in fair value of the Interest Rate Swap and a $1.0 million realized loss for the settlement payments made. For the year ended December 31, 2015, the Company recognized a loss on Interest Rate Swap of $2.3 million which consisted of $1.9 million of unrealized losses related to the change in fair value of the Interest Rate
77
NEFF CORPORATION AND SUBSIDIARIES
NOTES TO CONSOLIDATED FINANCIAL STATEMENTS (Continued)
NOTE 14—DERIVATIVE FINANCIAL INSTRUMENTS (Continued)
Swap and a $0.4 million realized loss for the settlement payments made. The Company did not record a gain or loss on the Interest Rate Swap for the year ended December 31, 2014.
The following tables provide details regarding the Company's derivative financial instruments (in thousands):
For the year ended December 31, | ||||||||||||
2016 | 2015 | 2014 | ||||||||||
Loss Recognized in Earnings (a) | Loss Recognized in Earnings (a) | Loss Recognized in Earnings | ||||||||||
Interest Rate Swap | $ | 1,287 | $ | 2,265 | $ | — | ||||||
December 31, 2016 | December 31, 2015 | |||||||
Fair Value of Derivative Liability (b) | Fair Value of Derivative Liability (b) | |||||||
Interest Rate Swap (Note 17) | $ | 2,199 | $ | 1,880 | ||||
(a) | Classified in Other expenses (income)—Loss on interest rate swap |
(b) | Classified in Liabilities - Accrued expenses and other liabilities |
NOTE 15—INCOME TAXES
Neff Corporation is required to file federal and applicable state corporate income tax returns and recognizes income taxes on its pre-tax income, which to date has consisted primarily of its share of Neff Holdings' pre-tax income. Neff Holdings is a limited liability company that is treated as a partnership for federal and state income tax purposes. Neff Holdings is not subject to income taxes for federal and state purposes. Rather, taxable income or loss is included in the respective federal and state income tax returns of Neff Holdings' members.
The components of (provision for) benefit from income taxes included in the consolidated statements of operations for the years ended December 31, 2016, 2015 and 2014 were as follows (dollars in thousands):
For the Year Ended December 31, | |||||||||||
2016 | 2015 | 2014 | |||||||||
Current expense | |||||||||||
Federal | $ | — | $ | — | $ | — | |||||
State and local | 120 | (428 | ) | (6,393 | ) | ||||||
Total current expense (benefit) | 120 | (428 | ) | (6,393 | ) | ||||||
Deferred expense | |||||||||||
Federal | $ | 6,068 | $ | 3,901 | $ | 933 | |||||
State and local | 641 | 152 | 101 | ||||||||
Total deferred expense | 6,709 | 4,053 | 1,034 | ||||||||
Total | $ | 6,829 | $ | 3,625 | $ | (5,359 | ) | ||||
78
NEFF CORPORATION AND SUBSIDIARIES
NOTES TO CONSOLIDATED FINANCIAL STATEMENTS (Continued)
NOTE 15—INCOME TAXES (Continued)
The following table summarizes the differences between the statutory federal income tax rate and the Company’s effective income tax rate (percent data):
For the Year Ended December 31, | ||||||||
2016 | 2015 | 2014 | ||||||
U.S. federal statutory income tax rate | 35.00 | % | 35.00 | % | 35.00 | % | ||
Increase (decrease) in tax rate resulting from: | ||||||||
State and local income taxes, net of federal benefit | 1.20 | 0.60 | 0.70 | |||||
Uncertain tax positions | — | (1.30 | ) | (58.90 | ) | |||
Permanent book/tax differences | (0.45 | ) | (7.10 | ) | 0.10 | |||
Non-controlling interests | (21.76 | ) | (19.30 | ) | (28.60 | ) | ||
Other | 0.84 | 0.39 | 0.40 | |||||
Effective tax rate | 14.83 | % | 8.29 | % | (51.30 | )% | ||
The components of deferred income tax assets (liabilities) are as follows (in thousands):
2016 | 2015 | ||||||
Deferred Tax Assets | |||||||
Net operating loss carryforwards | $ | 24,387 | $ | 17,835 | |||
Provision for bad debt | 353 | 393 | |||||
Accrued liabilities | 696 | 733 | |||||
Equity-based compensation | 167 | 293 | |||||
Loss on interest rate swap | 313 | 295 | |||||
Insurance/parts reserves | 463 | 534 | |||||
Straight-line rent adjustment | 137 | 106 | |||||
Uncertain tax position | — | — | |||||
Gain on redemption of common units | — | 100 | |||||
Subtotal | 26,516 | 20,289 | |||||
Less: valuation allowance | — | — | |||||
Total deferred tax assets | $ | 26,516 | $ | 20,289 | |||
Deferred Tax Liabilities | |||||||
Intangible assets | $ | (3,765 | ) | $ | (3,454 | ) | |
Deferred debt costs | (394 | ) | (367 | ) | |||
Depreciation | (30,682 | ) | (25,926 | ) | |||
Total deferred tax liabilities | $ | (34,841 | ) | $ | (29,747 | ) | |
Deferred Tax Liability, net | $ | (8,325 | ) | $ | (9,458 | ) | |
The Company has a federal income tax net operating loss ("NOL") carryforward totaling $62.7 million and state NOL carryforwards totaling $54.1 million. The Company has recorded a deferred tax asset of $24.4 million reflecting the benefit of the federal and state NOLs. The federal deferred tax asset expires in 2034 and the state deferred tax assets expire over the next five years to twenty years.
Management periodically assesses the recoverability of its deferred tax assets based upon expected future earnings, future deductibility of the asset and changes in applicable tax laws and other factors. If management determines that it is not probable that the deferred tax asset will be fully recoverable in the future, a valuation allowance may be established for the difference between the asset balance and the amount expected to be recoverable in the future. The allowance will result in a charge to the Company’s consolidated statements of operations. Based on management’s assessment of the available positive and negative evidence, including future reversal of taxable temporary differences, we believe it is more likely than not that the deferred tax assets will be realized.
On October 1, 2010, Neff Holdings purchased substantially all of the assets of Neff Holdings Corp. and certain of its affiliates (collectively, the "Predecessor") in connection with the Predecessor's bankruptcy cases under chapter 11 of title 11 of the United States Code (the "Acquisition").
79
NEFF CORPORATION AND SUBSIDIARIES
NOTES TO CONSOLIDATED FINANCIAL STATEMENTS (Continued)
NOTE 15—INCOME TAXES (Continued)
In connection with the Acquisition, uncertain tax liabilities were assumed by Neff Holdings and are recorded in the Company's accrued expenses as of December 31, 2014. As a taxable entity, the Company recognizes tax benefits for uncertain tax positions only if it is more likely than not that the position is sustainable based on its technical merits. At December 31, 2014, the amount of uncertain tax positions recorded in accrued expenses was approximately $0.4 million. There were no uncertain tax positions as of December 31, 2016 and 2015.
The Company's practice is to recognize interest and penalties on uncertain tax positions in income tax expense. The Company recognized $0.2 million for interest and penalties during the year ended December 31, 2014. The Company recognized accrued interest and penalties of $0.3 million as of December 31, 2014. During the year ended December 31, 2015, as a result of the expiration of statute of limitations, the Company reversed $0.4 million and $0.3 million in uncertain tax positions and interest and penalties, respectively. During the year ended December 31, 2014, the Company reversed $4.3 million in uncertain tax positions and $2.3 million in interest and penalties.
Tax years 2013 through 2015 are open to examination by federal and state taxing authorities.
A reconciliation of the beginning and ending amounts of uncertain tax positions is as follows (in thousands):
Ending balance—December 31, 2013 | $ | 4,750 | |
Additions based on tax positions related to the current year | — | ||
Additions for tax positions of prior years | — | ||
Reductions for tax positions of prior years | — | ||
Reductions as a result of lapse of applicable statute of limitations | (4,347 | ) | |
Ending balance—December 31, 2014 | 403 | ||
Additions based on tax positions related to the current year | — | ||
Additions for tax positions of prior years | — | ||
Reductions for tax positions of prior years | — | ||
Reductions as a result of lapse of applicable statute of limitations | (403 | ) | |
Ending balance—December 31, 2015 | $ | — | |
Additions based on tax positions related to the current year | — | ||
Additions for tax positions of prior years | — | ||
Reductions for tax positions of prior years | — | ||
Reductions as a result of lapse of applicable statute of limitations | — | ||
Ending balance—December 31, 2016 | $ | — | |
NOTE 16—RELATED-PARTY TRANSACTIONS AND OTHER COMMITMENTS
Related Party Transactions
For the years ended December 31, 2016 and 2015, the Company had no material related party transactions.
Operating Leases
The Company leases real estate, rental equipment and other equipment under operating leases. Certain real estate leases require the Company to pay maintenance, insurance, taxes and certain other expenses in addition to the stated rental amounts. For leases with step rent provisions, under which the rental payments increase incrementally over the life of the lease, the Company recognizes the total minimum lease payments on a straight-line basis over the lease term.
80
NEFF CORPORATION AND SUBSIDIARIES
NOTES TO CONSOLIDATED FINANCIAL STATEMENTS (Continued)
NOTE 16—RELATED-PARTY TRANSACTIONS AND OTHER COMMITMENTS (Continued)
As of December 31, 2016, future minimum rental payments under non-cancelable operating lease arrangements are as follows for the years ending December 31 (in thousands):
2017 | $ | 7,717 | |
2018 | 6,566 | ||
2019 | 5,070 | ||
2020 | 3,901 | ||
2121 | 1,999 | ||
Thereafter | 4,006 | ||
$ | 29,259 | ||
Rental expense under operating lease arrangements amounted to approximately $7.9 million, $7.4 million and $7.1 million for the years ended December 31, 2016, 2015 and 2014, respectively.
Litigation Matters
The Company is party to legal proceedings and potential claims arising in the ordinary course of business. The Company's management does not believe that these matters will have a material effect on the Company's financial position, results of operations or cash flows.
NOTE 17—FAIR VALUE DISCLOSURES
The carrying amounts for accounts receivable, accounts payable and accrued expenses and other liabilities approximate fair value due to their immediate to short-term maturity. The fair value of the Revolving Credit Facility and the Second Lien Loan approximate carrying value as of December 31, 2016 and 2015, as variable interest rates approximate market rates. The Company has classified these instruments in Level 2 of the fair value hierarchy as described below.
The Company used the following methods to measure the fair value of certain assets and liabilities:
Interest Rate Swap. The Interest Rate Swap is valued utilizing pricing models taking into account inputs such as interest rates and notional amounts.
The FASB has established a framework for measuring fair value and requires that assets and liabilities measured at fair value be classified and disclosed in one of the following three categories:
Level 1: Quoted market prices in active markets for identical assets or liabilities
Level 2: Observable market based inputs or unobservable inputs that are corroborated by market data
Level 3: Unobservable inputs that are not corroborated by market data
The following table provides fair value measurement information of the Company's financial liability measured on a recurring basis (in thousands):
Fair Value Measurements Using: | ||||||||||||
Quoted Prices in Active Markets | Observable Inputs | Unobservable Inputs | ||||||||||
(Level 1) | (Level 2) | (Level 3) | ||||||||||
Interest Rate Swap: | ||||||||||||
December 31, 2016 | $ | — | $ | 2,199 | $ | — | ||||||
December 31, 2015 | $ | — | $ | 1,880 | $ | — | ||||||
There were no transfers into or out of Level 1, 2 or 3 during the years ended December 31, 2016, 2015 and 2014.
81
NEFF CORPORATION AND SUBSIDIARIES
NOTES TO CONSOLIDATED FINANCIAL STATEMENTS (Continued)
NOTE 18—SUPPLEMENTAL DISCLOSURES OF CASH FLOW INFORMATION
For the Year Ended December 31, 2016 | For the Year Ended December 31, 2015 | For the Year Ended December 31, 2014 | |||||||||
(in thousands) | |||||||||||
Supplemental Disclosures of Cash Flow Information | |||||||||||
Cash paid for interest | $ | 42,378 | $ | 42,860 | $ | 40,401 | |||||
Cash paid for interest rate swap settlements | 968 | 385 | — | ||||||||
Cash paid for income taxes | 130 | 139 | 108 | ||||||||
Non-cash investing activities | |||||||||||
Purchases of rental equipment included in accounts payable and other accrued liabilities at year end | $ | 13,758 | $ | 19,503 | $ | 24,977 | |||||
NOTE 19—SUMMARY OF QUARTERLY FINANCIAL INFORMATION (UNAUDITED)
A summary of the quarterly operating results during 2016 and 2015 is as follows (in thousands):
2016 | |||||||||||||||
1st | 2nd | 3rd | 4th | ||||||||||||
Revenues | $ | 89,584 | $ | 99,660 | $ | 105,467 | $ | 102,273 | |||||||
Gross profit | 42,570 | 50,462 | 54,025 | 51,077 | |||||||||||
Income from operations | 15,307 | 24,481 | 26,930 | 24,856 | |||||||||||
Total other expenses | 16,112 | 12,936 | 11,174 | 5,281 | |||||||||||
Net (loss) income | (420 | ) | 9,939 | 13,422 | 16,301 | ||||||||||
Less: net (loss) income attributable to non-controlling interest | (269 | ) | 7,319 | 10,558 | 10,894 | ||||||||||
Net (loss) income attributable to Neff Corporation | $ | (151 | ) | $ | 2,620 | $ | 2,864 | $ | 5,407 | ||||||
Net (loss) income attributable to Neff Corporation per share of Class A common stock: | |||||||||||||||
Basic | $ | (0.01 | ) | $ | 0.29 | $ | 0.32 | $ | 0.61 | ||||||
Diluted | $ | (0.01 | ) | $ | 0.28 | $ | 0.31 | $ | 0.59 | ||||||
2015 | |||||||||||||||
1st | 2nd | 3rd | 4th | ||||||||||||
Revenues | $ | 84,086 | $ | 94,227 | $ | 99,424 | $ | 106,124 | |||||||
Gross profit | 40,618 | 47,638 | 51,247 | 49,749 | |||||||||||
Income from operations | 15,867 | 22,513 | 25,717 | 24,126 | |||||||||||
Total other expenses | 12,294 | 6,719 | 15,926 | 9,474 | |||||||||||
Net income | 3,328 | 14,694 | 9,444 | 12,719 | |||||||||||
Less: net income attributable to non-controlling interest | 2,399 | 7,275 | 6,238 | 8,682 | |||||||||||
Net income attributable to Neff Corporation | $ | 929 | $ | 7,419 | $ | 3,206 | $ | 4,037 | |||||||
Net income attributable to Neff Corporation per share of Class A common stock: | |||||||||||||||
Basic | $ | 0.09 | $ | 0.71 | $ | 0.31 | $ | 0.38 | |||||||
Diluted | $ | 0.08 | $ | 0.62 | $ | 0.27 | $ | 0.33 | |||||||
82
SUPPLEMENTAL CONDENSED CONSOLIDATING BALANCE SHEET
DECEMBER 31, 2016
(in thousands)
Neff Rental LLC | Neff LLC | Neff Holdings LLC | Neff Corporation Stand Alone | Eliminations | Neff Corporation | ||||||||||||||||||
ASSETS | |||||||||||||||||||||||
Cash and cash equivalents | $ | 900 | $ | — | $ | — | $ | — | $ | — | $ | 900 | |||||||||||
Accounts receivable, net | 64,943 | — | — | — | — | 64,943 | |||||||||||||||||
Inventories | 1,867 | — | — | — | — | 1,867 | |||||||||||||||||
Rental equipment, net | 462,084 | — | — | — | — | 462,084 | |||||||||||||||||
Property and equipment, net | 35,534 | — | — | — | — | 35,534 | |||||||||||||||||
Prepaid expenses and other assets | 8,203 | — | — | — | — | 8,203 | |||||||||||||||||
Goodwill | 60,644 | — | — | — | — | 60,644 | |||||||||||||||||
Investment in subsidiary | — | 113,750 | 113,750 | 179,096 | (406,596 | ) | — | ||||||||||||||||
Intercompany | 10,258 | — | — | (10,258 | ) | — | — | ||||||||||||||||
Intangible assets, net | 14,246 | — | — | — | — | 14,246 | |||||||||||||||||
Total assets | $ | 658,679 | $ | 113,750 | $ | 113,750 | $ | 168,838 | $ | (406,596 | ) | $ | 648,421 | ||||||||||
LIABILITIES AND STOCKHOLDERS' DEFICIT / MEMBERS' DEFICIT | |||||||||||||||||||||||
Liabilities | |||||||||||||||||||||||
Accounts payable | $ | 15,851 | $ | — | $ | — | $ | — | $ | — | $ | 15,851 | |||||||||||
Accrued expenses and other liabilities | 35,074 | — | — | — | — | 35,074 | |||||||||||||||||
Revolving credit facility, net | 222,531 | — | — | — | — | 222,531 | |||||||||||||||||
Second lien loan, net | 468,860 | — | — | — | — | 468,860 | |||||||||||||||||
Payable pursuant to tax receivable agreement | — | — | — | 29,505 | — | 29,505 | |||||||||||||||||
Deferred tax liability, net | — | — | — | 8,325 | — | 8,325 | |||||||||||||||||
Total liabilities | $ | 742,316 | $ | — | $ | — | $ | 37,830 | $ | — | $ | 780,146 | |||||||||||
Stockholders' deficit / members' deficit | |||||||||||||||||||||||
Class A Common Stock | $ | — | $ | — | $ | — | $ | 88 | $ | — | $ | 88 | |||||||||||
Class B Common Stock | — | — | — | 150 | 150 | ||||||||||||||||||
Additional paid-in capital | — | — | — | 43,927 | (146,143 | ) | (102,216 | ) | |||||||||||||||
Retained earnings | — | — | — | 26,540 | (3,770 | ) | 22,770 | ||||||||||||||||
Members' deficit | (197,387 | ) | — | — | — | 197,387 | — | ||||||||||||||||
Accumulated surplus | 113,750 | 113,750 | 113,750 | — | (341,250 | ) | — | ||||||||||||||||
Total stockholders' deficit / members' deficit | (83,637 | ) | 113,750 | 113,750 | 70,705 | (293,776 | ) | (79,208 | ) | ||||||||||||||
Non-controlling interest | — | — | — | 60,303 | (112,820 | ) | (52,517 | ) | |||||||||||||||
Total stockholders' deficit / members' deficit and non-controlling interest | (83,637 | ) | 113,750 | 113,750 | 131,008 | (406,596 | ) | (131,725 | ) | ||||||||||||||
Total liabilities and stockholders' deficit / members' deficit and non-controlling interest | $ | 658,679 | $ | 113,750 | $ | 113,750 | $ | 168,838 | $ | (406,596 | ) | $ | 648,421 | ||||||||||
83
SUPPLEMENTAL CONDENSED CONSOLIDATING STATEMENT OF OPERATIONS
FOR THE YEAR ENDED DECEMBER 31, 2016
(in thousands)
Neff Rental LLC | Neff LLC | Neff Holdings LLC | Neff Corporation Stand Alone | Eliminations | Neff Corporation | ||||||||||||||||||
Revenues | |||||||||||||||||||||||
Rental revenues | $ | 360,125 | $ | — | $ | — | $ | — | $ | — | $ | 360,125 | |||||||||||
Equipment sales | 23,303 | — | — | — | — | 23,303 | |||||||||||||||||
Parts and service | 13,556 | — | — | — | — | 13,556 | |||||||||||||||||
Total revenues | 396,984 | — | — | — | — | 396,984 | |||||||||||||||||
Cost of revenues | |||||||||||||||||||||||
Cost of equipment sold | 14,728 | — | — | — | — | 14,728 | |||||||||||||||||
Depreciation of rental equipment | 88,720 | — | — | — | — | 88,720 | |||||||||||||||||
Cost of rental revenues | 87,810 | — | — | — | — | 87,810 | |||||||||||||||||
Cost of parts and service | 7,592 | — | — | — | — | 7,592 | |||||||||||||||||
Total cost of revenues | 198,850 | — | — | — | — | 198,850 | |||||||||||||||||
Gross profit | 198,134 | — | — | — | — | 198,134 | |||||||||||||||||
Other operating expenses | |||||||||||||||||||||||
Selling, general and administrative expenses | 96,888 | — | — | — | — | 96,888 | |||||||||||||||||
Other depreciation and amortization | 9,672 | — | — | — | — | 9,672 | |||||||||||||||||
Total other operating expenses | 106,560 | — | — | — | — | 106,560 | |||||||||||||||||
Income from operations | 91,574 | — | — | — | — | 91,574 | |||||||||||||||||
Other expenses | |||||||||||||||||||||||
Interest expense | 43,844 | — | — | — | — | 43,844 | |||||||||||||||||
Adjustment to tax receivable agreement | — | — | — | 372 | — | 372 | |||||||||||||||||
Loss on interest rate swap | 1,287 | — | — | — | — | 1,287 | |||||||||||||||||
Total other expenses | 45,131 | — | — | 372 | — | 45,503 | |||||||||||||||||
Income (loss) before income taxes | 46,443 | — | — | (372 | ) | — | 46,071 | ||||||||||||||||
Equity earnings in subsidiaries | — | 46,323 | 46,323 | 17,821 | (110,467 | ) | — | ||||||||||||||||
Provision for income taxes | (120 | ) | — | — | (6,709 | ) | — | (6,829 | ) | ||||||||||||||
Net income | 46,323 | 46,323 | 46,323 | 10,740 | (110,467 | ) | 39,242 | ||||||||||||||||
Less: net income attributable to non-controlling interest | — | — | 28,502 | — | — | 28,502 | |||||||||||||||||
Net income attributable to Neff Corporation | $ | 46,323 | $ | 46,323 | $ | 17,821 | $ | 10,740 | $ | (110,467 | ) | $ | 10,740 | ||||||||||
84
SUPPLEMENTAL CONSOLIDATING STATEMENT OF CASH FLOWS
FOR THE YEAR ENDED DECEMBER 31, 2016
(in thousands)
Neff Rental LLC | Neff LLC | Neff Holdings LLC | Neff Corporation Stand Alone | Eliminations | Neff Corporation | ||||||||||||||||||
Cash Flows from Operating Activities | |||||||||||||||||||||||
Net income | $ | 46,323 | $ | 46,323 | $ | 46,323 | $ | 10,740 | $ | (110,467 | ) | $ | 39,242 | ||||||||||
Adjustments to reconcile net income to net cash provided by operating activities: | |||||||||||||||||||||||
Depreciation | 97,322 | — | — | — | — | 97,322 | |||||||||||||||||
Amortization of debt issue costs | 1,537 | — | — | — | — | 1,537 | |||||||||||||||||
Amortization of intangible assets | 1,070 | — | — | — | — | 1,070 | |||||||||||||||||
Amortization of original issue discount | 308 | — | — | — | — | 308 | |||||||||||||||||
Gain on sale of equipment | (8,575 | ) | — | — | — | — | (8,575 | ) | |||||||||||||||
Provision for bad debt | 2,877 | — | — | — | — | 2,877 | |||||||||||||||||
Equity-based compensation expense | 2,000 | — | — | — | — | 2,000 | |||||||||||||||||
Deferred income taxes | — | — | — | 6,709 | — | 6,709 | |||||||||||||||||
Adjustment to tax receivable agreement | — | — | — | 372 | — | 372 | |||||||||||||||||
Unrealized loss on interest rate swap | 319 | — | — | — | — | 319 | |||||||||||||||||
Equity earnings in subsidiaries | — | (46,323 | ) | (46,323 | ) | (17,821 | ) | 110,467 | — | ||||||||||||||
Changes in operating assets and liabilities: | |||||||||||||||||||||||
Accounts receivable | 2,508 | — | — | — | — | 2,508 | |||||||||||||||||
Inventories, prepaid expenses and other assets | (2,764 | ) | — | — | — | — | (2,764 | ) | |||||||||||||||
Accounts payable | 451 | — | — | — | — | 451 | |||||||||||||||||
Accrued expenses and other liabilities | 5,540 | — | — | — | — | 5,540 | |||||||||||||||||
Net cash provided by operating activities | 148,916 | — | — | — | — | 148,916 | |||||||||||||||||
Cash Flows from Investing Activities | |||||||||||||||||||||||
Purchases of rental equipment | (112,925 | ) | — | — | — | — | (112,925 | ) | |||||||||||||||
Proceeds from sale of equipment | 23,303 | — | — | — | — | 23,303 | |||||||||||||||||
Purchases of property and equipment | (11,545 | ) | — | — | — | — | (11,545 | ) | |||||||||||||||
Net cash used in investing activities | (101,167 | ) | — | — | — | — | (101,167 | ) | |||||||||||||||
Cash Flows from Financing Activities | |||||||||||||||||||||||
Repayments under revolving credit facility | (156,037 | ) | — | — | — | — | (156,037 | ) | |||||||||||||||
Borrowings under revolving credit facility | 128,837 | — | — | — | — | 128,837 | |||||||||||||||||
Debt issue costs | (1,570 | ) | — | — | — | — | (1,570 | ) | |||||||||||||||
Common stock repurchases | — | — | — | (10,901 | ) | — | (10,901 | ) | |||||||||||||||
Common unit sales/repurchases | (10,901 | ) | — | — | 10,901 | — | — | ||||||||||||||||
Second Lien Loan prepayment | (3,349 | ) | — | — | — | — | (3,349 | ) | |||||||||||||||
Distribution to member | (348 | ) | — | — | — | — | (348 | ) | |||||||||||||||
Neff Holdings LLC stock option exercises | — | — | — | (3,770 | ) | — | (3,770 | ) | |||||||||||||||
Intercompany | (3,768 | ) | — | — | 3,768 | — | — | ||||||||||||||||
Net cash used in financing activities | (47,136 | ) | — | — | (2 | ) | — | (47,138 | ) | ||||||||||||||
Net increase (decrease) in cash and cash equivalents | 613 | — | — | (2 | ) | — | 611 | ||||||||||||||||
Cash and cash equivalents, beginning of year | 287 | — | — | 2 | — | 289 | |||||||||||||||||
Cash and cash equivalents, end of year | $ | 900 | $ | — | $ | — | $ | — | $ | — | $ | 900 | |||||||||||
85
SUPPLEMENTAL CONDENSED CONSOLIDATING BALANCE SHEET
DECEMBER 31, 2015
(in thousands)
Neff Rental LLC | Neff LLC | Neff Holdings LLC | Neff Corporation Stand Alone | Eliminations | Neff Corporation | ||||||||||||||||||
ASSETS | |||||||||||||||||||||||
Cash and cash equivalents | $ | 287 | $ | — | $ | — | $ | 2 | $ | — | $ | 289 | |||||||||||
Accounts receivable, net | 70,328 | — | — | — | — | 70,328 | |||||||||||||||||
Inventories | 1,766 | — | — | — | — | 1,766 | |||||||||||||||||
Rental equipment, net | 457,470 | — | — | — | — | 457,470 | |||||||||||||||||
Property and equipment, net | 33,473 | — | — | — | — | 33,473 | |||||||||||||||||
Prepaid expenses and other assets | 5,587 | — | — | — | — | 5,587 | |||||||||||||||||
Goodwill | 60,599 | — | — | — | — | 60,599 | |||||||||||||||||
Investment in subsidiary | — | 67,427 | 67,427 | 166,406 | (301,260 | ) | — | ||||||||||||||||
Intercompany | 6,490 | — | — | (6,490 | ) | — | — | ||||||||||||||||
Intangible assets, net | 15,314 | — | — | — | — | 15,314 | |||||||||||||||||
Total assets | $ | 651,314 | $ | 67,427 | $ | 67,427 | $ | 159,918 | $ | (301,260 | ) | $ | 644,826 | ||||||||||
LIABILITIES AND STOCKHOLDERS' DEFICIT / MEMBERS' DEFICIT | |||||||||||||||||||||||
Liabilities | |||||||||||||||||||||||
Accounts payable | $ | 18,948 | $ | — | $ | — | $ | — | $ | — | $ | 18,948 | |||||||||||
Accrued expenses and other liabilities | 31,412 | — | — | — | — | 31,412 | |||||||||||||||||
Revolving credit facility, net | 250,472 | — | — | — | — | 250,472 | |||||||||||||||||
Second lien loan, net | 471,193 | — | — | — | — | 471,193 | |||||||||||||||||
Payable pursuant to tax receivable agreement | — | — | — | 29,133 | — | 29,133 | |||||||||||||||||
Deferred tax liability, net | — | — | — | 9,458 | — | 9,458 | |||||||||||||||||
Total liabilities | $ | 772,025 | $ | — | $ | — | $ | 38,591 | $ | — | $ | 810,616 | |||||||||||
Stockholders' deficit / members' deficit | |||||||||||||||||||||||
Class A Common Stock | $ | — | $ | — | $ | — | $ | 104 | $ | — | $ | 104 | |||||||||||
Class B Common Stock | — | — | — | 150 | — | 150 | |||||||||||||||||
Additional paid-in capital | — | — | — | 34,085 | (146,143 | ) | (112,058 | ) | |||||||||||||||
Retained earnings | — | — | — | 17,190 | — | 17,190 | |||||||||||||||||
Members' deficit | (188,138 | ) | — | — | — | 188,138 | — | ||||||||||||||||
Accumulated surplus | 67,427 | 67,427 | 67,427 | — | (202,281 | ) | — | ||||||||||||||||
Total stockholders' deficit / members' deficit | (120,711 | ) | 67,427 | 67,427 | 51,529 | (160,286 | ) | (94,614 | ) | ||||||||||||||
Non-controlling interest | — | — | — | 69,798 | (140,974 | ) | (71,176 | ) | |||||||||||||||
Total stockholders' deficit / members' deficit and non-controlling interest | (120,711 | ) | 67,427 | 67,427 | 121,327 | (301,260 | ) | (165,790 | ) | ||||||||||||||
Total liabilities and stockholders' deficit / members' deficit and non-controlling interest | $ | 651,314 | $ | 67,427 | $ | 67,427 | $ | 159,918 | $ | (301,260 | ) | $ | 644,826 | ||||||||||
86
SUPPLEMENTAL CONDENSED CONSOLIDATING STATEMENT OF OPERATIONS
FOR THE YEAR ENDED DECEMBER 31, 2015
(in thousands)
Neff Rental LLC | Neff LLC | Neff Holdings LLC | Neff Corporation Stand Alone | Eliminations | Neff Corporation | ||||||||||||||||||
Revenues | |||||||||||||||||||||||
Rental revenues | $ | 335,990 | $ | — | $ | — | $ | — | $ | — | $ | 335,990 | |||||||||||
Equipment sales | 34,772 | — | — | — | — | 34,772 | |||||||||||||||||
Parts and service | 13,099 | — | — | — | — | 13,099 | |||||||||||||||||
Total revenues | 383,861 | — | — | — | — | 383,861 | |||||||||||||||||
Cost of revenues | |||||||||||||||||||||||
Cost of equipment sold | 23,061 | — | — | — | — | 23,061 | |||||||||||||||||
Depreciation of rental equipment | 83,943 | — | — | — | — | 83,943 | |||||||||||||||||
Cost of rental revenues | 80,007 | — | — | — | — | 80,007 | |||||||||||||||||
Cost of parts and service | 7,598 | — | — | — | — | 7,598 | |||||||||||||||||
Total cost of revenues | 194,609 | — | — | — | — | 194,609 | |||||||||||||||||
Gross profit | 189,252 | — | — | — | — | 189,252 | |||||||||||||||||
Other operating expenses | |||||||||||||||||||||||
Selling, general and administrative expenses | 90,531 | — | — | — | — | 90,531 | |||||||||||||||||
Other depreciation and amortization | 10,498 | — | — | — | — | 10,498 | |||||||||||||||||
Total other operating expenses | 101,029 | — | — | — | — | 101,029 | |||||||||||||||||
Income from operations | 88,223 | — | — | — | — | 88,223 | |||||||||||||||||
Other expenses (income) | |||||||||||||||||||||||
Interest expense | 44,572 | — | — | — | — | 44,572 | |||||||||||||||||
Adjustment to tax receivable agreement | — | — | — | (2,424 | ) | — | (2,424 | ) | |||||||||||||||
Loss on interest rate swap | 2,265 | — | — | — | — | 2,265 | |||||||||||||||||
Total other expenses (income) | 46,837 | — | — | (2,424 | ) | — | 44,413 | ||||||||||||||||
Income before income taxes | 41,386 | — | — | 2,424 | — | 43,810 | |||||||||||||||||
Equity earnings in subsidiaries | — | 41,800 | 41,800 | 17,206 | (100,806 | ) | — | ||||||||||||||||
Benefit from (provision for) income taxes | 414 | — | — | (4,039 | ) | — | (3,625 | ) | |||||||||||||||
Net income | 41,800 | 41,800 | 41,800 | 15,591 | (100,806 | ) | 40,185 | ||||||||||||||||
Less: net income attributable to non-controlling interest | — | — | 24,594 | — | — | 24,594 | |||||||||||||||||
Net income attributable to Neff Corporation | $ | 41,800 | $ | 41,800 | $ | 17,206 | $ | 15,591 | $ | (100,806 | ) | $ | 15,591 | ||||||||||
87
SUPPLEMENTAL CONSOLIDATING STATEMENT OF CASH FLOWS
FOR THE YEAR ENDED DECEMBER 31, 2015
(in thousands)
Neff Rental LLC | Neff LLC | Neff Holdings LLC | Neff Corporation Stand Alone | Eliminations | Neff Corporation | ||||||||||||||||||
Cash Flows from Operating Activities | |||||||||||||||||||||||
Net income | $ | 41,800 | $ | 41,800 | $ | 41,800 | $ | 15,591 | $ | (100,806 | ) | $ | 40,185 | ||||||||||
Adjustments to reconcile net income to net cash provided by (used in) operating activities: | |||||||||||||||||||||||
Depreciation | 93,155 | — | — | — | — | 93,155 | |||||||||||||||||
Amortization of debt issue costs | 1,547 | — | — | — | — | 1,547 | |||||||||||||||||
Amortization of intangible assets | 1,286 | — | — | — | — | 1,286 | |||||||||||||||||
Amortization of original issue discount | 253 | — | — | — | — | 253 | |||||||||||||||||
Gain on sale of equipment | (11,711 | ) | — | — | — | — | (11,711 | ) | |||||||||||||||
Provision for bad debt | 2,526 | — | — | — | — | 2,526 | |||||||||||||||||
Equity-based compensation expense | 1,249 | — | — | — | — | 1,249 | |||||||||||||||||
Deferred income taxes | — | — | — | 4,053 | — | 4,053 | |||||||||||||||||
Adjustment to tax receivable agreement | — | — | — | (2,424 | ) | — | (2,424 | ) | |||||||||||||||
Unrealized loss on interest rate swap | 1,880 | — | — | — | — | 1,880 | |||||||||||||||||
Equity earnings in subsidiaries | — | (41,800 | ) | (41,800 | ) | (17,206 | ) | 100,806 | — | ||||||||||||||
Changes in operating assets and liabilities: | — | ||||||||||||||||||||||
Accounts receivable | (6,316 | ) | — | — | — | — | (6,316 | ) | |||||||||||||||
Inventories, prepaid expenses and other assets | 1,205 | — | — | — | — | 1,205 | |||||||||||||||||
Accounts payable | (1,362 | ) | — | — | — | — | (1,362 | ) | |||||||||||||||
Accrued expenses and other liabilities | (3,297 | ) | — | — | (15 | ) | — | (3,312 | ) | ||||||||||||||
Net cash provided by (used in) operating activities | 122,215 | — | — | (1 | ) | — | 122,214 | ||||||||||||||||
Cash Flows from Investing Activities | |||||||||||||||||||||||
Purchases of rental equipment | (147,483 | ) | — | — | — | — | (147,483 | ) | |||||||||||||||
Proceeds from sale of equipment | 34,772 | — | — | — | — | 34,772 | |||||||||||||||||
Purchases of property and equipment | (13,134 | ) | — | — | — | — | (13,134 | ) | |||||||||||||||
Cash paid for acquisitions | (3,564 | ) | — | — | — | — | (3,564 | ) | |||||||||||||||
Net cash used in investing activities | (129,409 | ) | — | — | — | — | (129,409 | ) | |||||||||||||||
Cash Flows from Financing Activities | |||||||||||||||||||||||
Repayments under revolving credit facility | (151,539 | ) | — | — | — | — | (151,539 | ) | |||||||||||||||
Borrowings under revolving credit facility | 159,939 | — | — | — | — | 159,939 | |||||||||||||||||
Payment of costs directly associated with the issuance of Class A common stock | — | — | — | (283 | ) | — | (283 | ) | |||||||||||||||
Common stock repurchases | — | — | — | (840 | ) | — | (840 | ) | |||||||||||||||
Common unit sales/repurchases | (840 | ) | — | — | 840 | — | — | ||||||||||||||||
Intercompany | (284 | ) | — | — | 284 | — | — | ||||||||||||||||
Net cash provided by financing activities | 7,276 | — | — | 1 | — | 7,277 | |||||||||||||||||
Net increase in cash and cash equivalents | 82 | — | — | — | — | 82 | |||||||||||||||||
Cash and cash equivalents, beginning of year | 205 | — | — | 2 | — | 207 | |||||||||||||||||
Cash and cash equivalents, end of year | $ | 287 | $ | — | $ | — | $ | 2 | $ | — | $ | 289 | |||||||||||
88
SUPPLEMENTAL CONDENSED CONSOLIDATING STATEMENT OF OPERATIONS
FOR THE YEAR ENDED DECEMBER 31, 2014
(in thousands)
Neff Rental LLC | Neff LLC | Neff Holdings LLC | Neff Corporation Stand Alone | Eliminations | Neff Corporation | ||||||||||||||||||
Revenues | |||||||||||||||||||||||
Rental revenues | $ | 324,099 | $ | — | $ | — | $ | — | $ | — | $ | 324,099 | |||||||||||
Equipment sales | 34,479 | — | — | — | — | 34,479 | |||||||||||||||||
Parts and service | 13,382 | — | — | — | — | 13,382 | |||||||||||||||||
Total revenues | 371,960 | — | — | — | — | 371,960 | |||||||||||||||||
Cost of revenues | |||||||||||||||||||||||
Cost of equipment sold | 19,147 | — | — | — | — | 19,147 | |||||||||||||||||
Depreciation of rental equipment | 73,274 | — | — | — | — | 73,274 | |||||||||||||||||
Cost of rental revenues | 81,040 | — | — | — | — | 81,040 | |||||||||||||||||
Cost of parts and service | 8,180 | — | — | — | — | 8,180 | |||||||||||||||||
Total cost of revenues | 181,641 | — | — | — | — | 181,641 | |||||||||||||||||
Gross profit | 190,319 | — | — | — | — | 190,319 | |||||||||||||||||
Other operating expenses | |||||||||||||||||||||||
Selling, general and administrative expenses | 81,990 | — | — | — | — | 81,990 | |||||||||||||||||
Other depreciation and amortization | 9,591 | — | — | — | — | 9,591 | |||||||||||||||||
Transaction bonus | 24,506 | — | — | — | — | 24,506 | |||||||||||||||||
Total other operating expenses | 116,087 | — | — | — | — | 116,087 | |||||||||||||||||
Income from operations | 74,232 | — | — | — | — | 74,232 | |||||||||||||||||
Other expenses | |||||||||||||||||||||||
Interest expense | 43,542 | — | — | — | — | 43,542 | |||||||||||||||||
Loss on extinguishment of debt | 20,241 | — | — | — | — | 20,241 | |||||||||||||||||
Total other expenses | 63,783 | — | — | — | — | 63,783 | |||||||||||||||||
Income before income taxes | 10,449 | — | — | — | — | 10,449 | |||||||||||||||||
Equity earnings in subsidiaries | — | 16,857 | 16,857 | 2,648 | (36,362 | ) | — | ||||||||||||||||
Benefit from (provision for) income taxes | 6,408 | — | — | (1,049 | ) | — | 5,359 | ||||||||||||||||
Net income | 16,857 | 16,857 | 16,857 | 1,599 | (36,362 | ) | 15,808 | ||||||||||||||||
Less: net income attributable to non-controlling interest | 16,857 | 16,857 | 14,209 | — | (33,714 | ) | 14,209 | ||||||||||||||||
Net income attributable to to Neff Corporation | $ | — | $ | — | $ | 2,648 | $ | 1,599 | $ | (2,648 | ) | $ | 1,599 | ||||||||||
89
SUPPLEMENTAL CONSOLIDATING STATEMENT OF CASH FLOWS
FOR THE YEAR ENDED DECEMBER 31, 2014
(in thousands)
Neff Rental LLC | Neff LLC | Neff Holdings LLC | Neff Corporation Stand Alone | Eliminations | Neff Corporation | ||||||||||||||||||
Cash Flows from Operating Activities | |||||||||||||||||||||||
Net income | $ | 16,857 | $ | 16,857 | $ | 16,857 | $ | 1,599 | $ | (36,362 | ) | $ | 15,808 | ||||||||||
Adjustments to reconcile net income to net cash provided by operating activities: | |||||||||||||||||||||||
Depreciation | 81,355 | — | — | — | — | 81,355 | |||||||||||||||||
Amortization of debt issue costs | 3,061 | — | — | — | — | 3,061 | |||||||||||||||||
Amortization of intangible assets | 1,510 | — | — | — | — | 1,510 | |||||||||||||||||
Amortization of original issue discount | 126 | — | — | — | — | 126 | |||||||||||||||||
Gain on sale of equipment | (15,332 | ) | — | — | — | — | (15,332 | ) | |||||||||||||||
Provision for bad debt | 2,705 | — | — | — | — | 2,705 | |||||||||||||||||
Equity-based compensation expense | 883 | — | — | — | — | 883 | |||||||||||||||||
Deferred income taxes | — | — | — | 1,034 | — | 1,034 | |||||||||||||||||
Loss on extinguishment of debt | 20,241 | — | — | — | — | 20,241 | |||||||||||||||||
Equity earnings in subsidiaries | — | (16,857 | ) | (16,857 | ) | (2,648 | ) | 36,362 | — | ||||||||||||||
Changes in operating assets and liabilities: | — | ||||||||||||||||||||||
Accounts receivable | (13,482 | ) | — | — | — | — | (13,482 | ) | |||||||||||||||
Inventories, prepaid expenses and other assets | (2,399 | ) | — | — | — | — | (2,399 | ) | |||||||||||||||
Accounts payable | 1,139 | — | — | — | — | 1,139 | |||||||||||||||||
Accrued expenses and other liabilities | (2,578 | ) | — | — | 15 | — | (2,563 | ) | |||||||||||||||
Net cash provided by operating activities | 94,086 | — | — | — | — | 94,086 | |||||||||||||||||
Cash Flows from Investing Activities | |||||||||||||||||||||||
Purchases of rental equipment | (149,174 | ) | — | — | — | — | (149,174 | ) | |||||||||||||||
Proceeds from sale of equipment | 34,479 | — | — | — | — | 34,479 | |||||||||||||||||
Purchases of property and equipment | (13,018 | ) | — | — | — | — | (13,018 | ) | |||||||||||||||
Investment in subsidiary | — | — | — | (146,143 | ) | 146,143 | — | ||||||||||||||||
Net cash used in investing activities | (127,713 | ) | — | — | (146,143 | ) | 146,143 | (127,713 | ) | ||||||||||||||
Cash Flows from Financing Activities | |||||||||||||||||||||||
Repayments under revolving credit facility | (549,240 | ) | — | — | — | — | (549,240 | ) | |||||||||||||||
Borrowings under revolving credit facility | 515,240 | — | — | — | — | 515,240 | |||||||||||||||||
Proceeds from second lien loans, net of original issue discount | 572,125 | — | — | — | — | 572,125 | |||||||||||||||||
Repayment of second lien loans | (96,000 | ) | — | — | — | — | (96,000 | ) | |||||||||||||||
Prepayment premium on second lien loans | (1,920 | ) | — | — | — | — | (1,920 | ) | |||||||||||||||
Distribution to members | (329,885 | ) | — | — | — | — | (329,885 | ) | |||||||||||||||
Repayments of senior secured notes | (200,000 | ) | — | — | — | — | (200,000 | ) | |||||||||||||||
Call premiums | (7,218 | ) | — | — | — | — | (7,218 | ) | |||||||||||||||
Debt issue costs | (9,397 | ) | — | — | — | — | (9,397 | ) | |||||||||||||||
Proceeds from issuance of common units | 146,143 | — | — | — | (146,143 | ) | — | ||||||||||||||||
Proceeds from issuance of Class A common stock | — | — | — | 146,143 | — | 146,143 | |||||||||||||||||
Payment of costs directly associated with the issuance of Class A common stock | — | — | — | (6,204 | ) | — | (6,204 | ) | |||||||||||||||
Intercompany | (6,206 | ) | — | — | 6,206 | — | — | ||||||||||||||||
Net cash provided by financing activities | 33,642 | — | — | 146,145 | (146,143 | ) | 33,644 | ||||||||||||||||
Net increase in cash and cash equivalents | 15 | — | — | 2 | — | 17 | |||||||||||||||||
Cash and cash equivalents, beginning of year | 190 | — | — | — | — | 190 | |||||||||||||||||
Cash and cash equivalents, end of year | $ | 205 | $ | — | $ | — | $ | 2 | $ | — | $ | 207 | |||||||||||
90
Item 9. CHANGES IN AND DISAGREEMENTS WITH ACCOUNTANTS ON ACCOUNTING AND
FINANCIAL DISCLOSURE
None.
Item 9A. CONTROLS AND PROCEDURES
Limitations on Effectiveness of Controls and Procedures
In designing and evaluating our disclosure controls and procedures, management recognizes that any controls and procedures, no matter how well designed and operated, can provide only reasonable assurance of achieving the desired control objectives. In addition, the design of disclosure controls and procedures must reflect the fact that there are resource constraints and that management is required to apply judgment in evaluating the benefits of possible controls and procedures relative to their costs.
Evaluation of Disclosure Controls and Procedures
Our management, with the participation of our chief executive officer and chief financial officer, evaluated, as of the end of the period covered by this annual report on Form 10-K, the effectiveness of our disclosure controls and procedures (as defined in Rules 13a-15(e) and 15d-15(e) under the Securities Exchange Act of 1934, as amended (the “Exchange Act”)). Based on that evaluation, our chief executive officer and chief financial officer concluded that our disclosure controls and procedures were effective at the reasonable assurance level as of December 31, 2016.
Changes in Internal Control over Financial Reporting
There was no change in our internal control over financial reporting identified in connection with the evaluation required by Rule 13a-15(d) and 15d-15(d) of the Exchange Act that occurred during the three months ended December 31, 2016 that has materially affected, or is reasonably likely to materially affect, our internal control over financial reporting.
Management's Report on Internal Control over Financial Reporting
Our management is responsible for establishing and maintaining adequate internal control over financial reporting as defined in Rule 13a-15(f) under the Exchange Act. Our internal control over financial reporting is designed to provide reasonable assurance regarding the reliability of financial reporting and the preparation of consolidated financial statements for external purposes in accordance with generally accepted accounting principles.
Because of its inherent limitations, internal control over financial reporting may not prevent or detect misstatements. Also, projections of any evaluation of effectiveness to future periods are subject to the risk that controls may become inadequate because of changes in conditions, or that the degree of compliance with the policies or procedures may deteriorate.
Our management assessed the effectiveness of the Company's internal control over financial reporting as of December 31, 2016, using the criteria in Internal Control-Integrated Framework (2013) issued by the Committee of Sponsoring Organizations of the Treadway Commission (COSO). Based on this evaluation, our management believes that our internal control over financial reporting was effective as of December 31, 2016.
This annual report on Form 10-K does not include an attestation report of our independent registered public accounting firm regarding internal control over financial reporting. Management’s report was not subject to attestation by our independent registered public accounting firm pursuant to electing to defer compliance with Section 404(b) of the Sarbanes-Oxley Act as an “emerging growth company” under the JOBS Act.
Item 9B. OTHER INFORMATION
None.
91
PART III
Certain information required by Part III is omitted from this annual report on Form 10-K and is incorporated by reference to the Registrant’s Definitive Proxy Statement for the 2017 Annual Meeting of Stockholders, to be filed with the Securities and Exchange Commission.
Item 10. DIRECTORS, EXECUTIVE OFFICERS AND CORPORATE GOVERNANCE
Except as set forth below, information required by this Item 10 will be contained in the Definitive Proxy Statement for the Company’s 2017 Annual Meeting of Stockholders and is incorporated herein by reference.
Our board of directors has adopted a Code of Ethics applicable to our chief executive officer, chief financial officer, chief accounting officer or controller (or persons performing similar functions) and a Code of Ethics applicable to all directors, officers and employees of the Company, each of which is available on our website at www.neffrental.com in the “Investors” section. We intend to satisfy the disclosure requirement under New York Stock Exchange listing rules and Item 5.05 of Form 8-K regarding amendment to, or waiver from, a provision of our Codes of Ethics by posting such information on our website at the address and location specified above.
Item 11. EXECUTIVE COMPENSATION
Information required by this Item 11 will be contained in the Definitive Proxy Statement for the Company’s 2017 Annual Meeting of Stockholders and is incorporated herein by reference.
Item 12. SECURITY OWNERSHIP OF CERTAIN BENEFICIAL OWNERS AND MANAGEMENT AND
RELATED STOCKHOLDER MATTERS
The following table provides information as of December 31, 2016 with respect to shares of our Class A common stock issuable under our equity compensation plan:
Equity Compensation Plan Information | ||||||||||
Plan Category | Number of Securities to be Issued Upon Exercise of Outstanding Options, Warrants and Rights | Weighted-Average Exercise Price of Outstanding Options, Warrants and Rights | Number of Securities Remaining Available for Future Issuance Under Equity Compensation Plans (Excluding Securities Reflected in Column (a)) | |||||||
Equity compensation plans approved by security holders | ||||||||||
2010 Option Plan | 757,935 | (1) | $ | 6.66 | — | |||||
2014 Incentive Award Plan | 1,115,829 | (2) | 11.51 | (2) | 321,962 | |||||
Equity compensation plans not approved by security holders | — | — | — | |||||||
Total | 1,873,764 | $ | 9.14 | (2) | 321,962 | |||||
(1) Options to acquire common units of Neff Holdings are outstanding under the 2010 Option Plan. Such common units are redeemable, at the election
of the optionee, for an equal number of shares of the Company's Class A common stock or, at the election of the Company, cash equal to the
volume-weighted average market price of such shares. No future grants will be made under the 2010 Option Plan.
(2) Amount reflected includes 827,520 options to purchase shares of our common stock, 24,069 time-based restricted stock-units and 264,240
performance-based restricted stock units with respect to shares of our common stock awarded under the 2014 Incentive Award Plan. The weighted-
average exercise price of $9.14 applies only to the option grants and not to the time-based and performance-based restricted stock units, which do
not require payment of an exercise price. The total number of performance-based restricted stock units reflected herein assumes the achievement of
maximum performance under the terms of the respective grants.
The remaining information required by this Item 12 will be contained in the Definitive Proxy Statement for the Company’s 2017 Annual Meeting of Stockholders and is incorporated herein by reference.
92
Item 13. CERTAIN RELATIONSHIPS AND RELATED TRANSACTIONS, AND DIRECTOR
INDEPENDENCE
Information required by this Item 13 will be contained in the Definitive Proxy Statement for the Company’s 2017 Annual Meeting of Stockholders and is incorporated herein by reference.
Item 14. PRINCIPAL ACCOUNTING FEES AND SERVICES
Information required by this Item 14 will be contained in the Definitive Proxy Statement for the Company’s 2017 Annual Meeting of Stockholders and is incorporated herein by reference.
93
PART IV
Item 15. EXHIBITS, FINANCIAL STATEMENT SCHEDULES
(a) Documents filed as part of this report:
1. List of Financial Statements
The financial statements required by this item are listed in Item 8, “Financial Statements and Supplementary Data” herein.
2. List of Financial Statement Schedules
All schedules are omitted because they are not applicable, not required or the required information is shown in the consolidated financial statements or notes thereto.
3. List of Exhibits
94
EXHIBIT INDEX
Incorporated by reference | ||||||||||||
Exhibit Number | Exhibit Description | Form | File No. | Exhibit | Filing Date | Filed/ Furnished Herewith | ||||||
3.1 | Amended and Restated Certificate of Incorporation of Neff Corporation, dated as of November 26, 2014 | 8-K | 001-36752 | 3.1 | 12/2/2014 | |||||||
3.2 | Amended and Restated By-Laws of Neff Corporation, dated as of November 26, 2014 | 8-K | 001-36752 | 3.2 | 12/2/2014 | |||||||
4.1 | Form of Class A common stock certificate of Neff Corporation | S-1/A | 333-198559 | 4.1 | 11/13/2014 | |||||||
10.1 | Tax Receivable Agreement, dated November 26, 2014, by and among Neff Corporation, Wazyata Opportunities Fund II, L.P., Wayzata Opportunities Fund Offshore II, L.P., the several LLC Option Holders, the Management Representation and other members of Neff Holdings LLC from time to time a party to this agreement | 8-K | 001-36752 | 10.1 | 12/2/2014 | |||||||
10.1(a) | Amendment No. 1 to Tax Receivable Agreement, dated as of May 27, 2015 | 8-K | 001-36752 | 10.1 | 12/2/2014 | |||||||
10.2 | Registration Rights Agreement, dated November 26, 2014, by and among Neff Corporation, Wayzata Opportunities Fund II, L.P., and Wayzata Opportunities Fund Offshore II, L.P. | 8-K | 001-36752 | 10.2 | 6/4/2015 | |||||||
10.3 | Second Amended and Restated Limited Liability Company Agreement of Neff Holdings LLC, dated November 26, 2014 | 8-K | 001-36752 | 10.4 | 12/2/2014 | |||||||
10.4 | Second Lien Credit Agreement, dated as of June 9, 2014, among Neff Holdings LLC, Neff LLC, Neff Rental LLC, the Lenders Party thereto, Credit Suisse AG as Administrative Agent and Collateral Agent, Credit Suisse Securities (USA) LLC, as Joint Bookrunner and Joint Lead Arranger, and Jefferies Finance LLC, as Joint Bookrunner, Joint Lead Arranger and Syndication Agent | S-1/A | 333-198559 | 10.5 | 10/30/2014 | |||||||
10.4(a) | Amendment No. 1 to Second Lien Credit Agreement, dated as of October 14, 2014 | S-1/A | 333-198559 | 10.6 | 11/10/2014 | |||||||
10.5 | Second Amended and Restated Senior Secured Credit Agreement, dated as of October 1, 2010, as amended and restated as of November 20, 2013, as further amended and restated as of February 25, 2016, among Neff LLC, Neff Holdings LLC, the other Credit Parties party thereto, the Lenders party thereto from time to time, Bank of America, N.A., as Agent, Swing Line Lender and L/C Issuer, Bank of America, N.A., as Collateral Agent, Wells Fargo Capital Finance, LLC and SunTrust Bank, as Syndication Agents, Regions Bank, as Documentation Agent, and Merrill Lynch, Pierce, Fenner & Smith Incorporated, Wells Fargo Capital Finance, LLC and SunTrust Robinson Humphrey, Inc., as Joint Lead Arrangers and Book Runners. | 8-K | 001-36752 | 10.1 | 3/1/2016 | |||||||
10.6† | Neff Corporation 2014 Incentive Award Plan | 10-K | 001-36752 | 10.6 | 3/13/2015 | |||||||
10.7† | Neff Corporation 2014 Senior Executive Incentive Bonus Plan | 10-K | 001-36752 | 10.7 | 3/13/2015 | |||||||
10.8† | Neff Holdings LLC 2014 Management Special Bonus Plan | S-1/A | 333-198559 | 10.12 | 10/30/2014 | |||||||
10.9† | Neff Holdings LLC Amended and Restated Sale Transaction Bonus Plan | S-1/A | 333-198559 | 10.13 | 10/30/2014 | |||||||
10.10† | First Amendment to Neff Holdings LLC Amended and Restated Sale Transaction Bonus Plan | S-1/A | 333-198559 | 10.14 | 11/10/2014 | |||||||
10.10(a) † | Second Amendment to Neff Holdings LLC Amended and Restated Sale Transaction Bonus Plan | 10-K | 001-36752 | 10.10(a) | 3/13/2015 | |||||||
10.11† | Neff Holdings LLC 2014 Incentive Bonus Plan | 10-K | 001-36752 | 10.11 | 3/13/2015 | |||||||
10.12† | Amended and Restated Neff Holdings LLC Management Equity Plan | 10-K | 001-36752 | 10.12 | 3/13/2015 | |||||||
10.13† | Neff Corporation Executive Officer Stock Ownership Policy | 10-K | 001-36752 | 10.13 | 3/13/2015 | |||||||
10.14† | Form of Stock Option Agreement | S-1/A | 333-198559 | 10.19 | 11/13/2014 | |||||||
10.15† | Form of Director Restricted Stock Unit Award Agreement | S-1/A | 333-198559 | 10.20 | 11/13/2014 | |||||||
10.16† | Form of Restricted Stock Unit Award Agreement | S-1/A | 333-198559 | 10.21 | 11/13/2014 | |||||||
10.17† | Neff Corporation Director Stock Ownership Policy | S-1/A | 333-198559 | 10.22 | 11/13/2014 | |||||||
95
10.18† | Neff Corporation Non-Employee Director Compensation Policy | S-1/A | 333-198559 | 10.23 | 11/13/2014 | |||||||
10.19† | Amended and Restated Employment Agreement by and between Graham Hood and Neff Corporation, dated as of November 20, 2014 | 8-K | 001-36752 | 10.25 | 12/2/2014 | |||||||
10.20† | Amended and Restated Employment Agreement by and between Mark Irion and Neff Corporation, dated as of November 20, 2014 | 8-K | 001-36752 | 10.27 | 12/2/2014 | |||||||
10.21† | Employment Letter between Westley Parks and Neff Rental LLC, dated as of November 29, 2011 | S-1/A | 333-198559 | 10.16 | 10/14/2014 | |||||||
10.22† | Form of Indemnification Agreement | S-1/A | 333-198559 | 10.22 | 11/10/2014 | |||||||
21.1 | Listing of subsidiaries | * | ||||||||||
23.1 | Consent of Deloitte & Touche LLP | * | ||||||||||
31.1 | Rule 13a-14(a)/15d-14(a) Certification of Chief Executive Officer | * | ||||||||||
31.2 | Rule 13a-14(a)/15d-14(a) Certification of Chief Financial Officer | * | ||||||||||
32.1 | Section 1350 Certification of Chief Executive Officer | ** | ||||||||||
32.2 | Section 1350 Certification of Chief Financial Officer | ** | ||||||||||
101.INS | XBRL Instance Document | * | ||||||||||
101.SCH | XBRL Taxonomy Extension Schema Document | * | ||||||||||
101.CAL | XBRL Taxonomy Extension Calculation Linkbase Document | * | ||||||||||
101.DEF | XBRL Taxonomy Extension Definition Linkbase Document | * | ||||||||||
101.LAB | XBRL Taxonomy Extension Label Linkbase Document | * | ||||||||||
101.PRE | XBRL Taxonomy Extension Presentation Linkbase Document | * | ||||||||||
* | Filed herewith. |
** | Furnished herewith. |
† This exhibit constitutes a management contract, compensatory plan, or arrangement.
96
SIGNATURES
Pursuant to the requirements of Section 13 or 15(d) of the Securities Exchange Act of 1934, the registrant has duly caused this report to be signed on its behalf by the undersigned, thereunto duly authorized.
NEFF CORPORATION | ||||
Date: | March 3, 2017 | By: | /s/ Mark Irion | |
Mark Irion Chief Financial Officer | ||||
Pursuant to the requirements of the Securities Exchange Act of 1934, this report has been signed below by the following persons on behalf of the registrant and in the capacities and on the dates indicated.
Signature | Title | Date | ||
/s/ Graham Hood | Chief Executive Officer and Director (Principal Executive Officer) | March 3, 2017 | ||
Graham Hood | ||||
/s/ Mark Irion | Chief Financial Officer (Principal Accounting and Financial Officer) | March 3, 2017 | ||
Mark Irion | ||||
/s/ Robert Singer | Director | March 3, 2017 | ||
Robert Singer | ||||
/s/ James Continenza | Director | March 3, 2017 | ||
James Continenza | ||||
/s/ Joseph Deignan | Director | March 3, 2017 | ||
Joseph Deignan | ||||
/s/ Gerard E Holthaus | Director | March 3, 2017 | ||
Gerard E. Holthaus | ||||
/s/ Michael Sileck | Director | March 3, 2017 | ||
Michael Sileck | ||||
97