Attached files
| file | filename |
|---|---|
| 8-K - 8-K - NABORS INDUSTRIES LTD | a17-7693_18k.htm |
Exhibit 99.1
Raymond James 38th Annual Institutional Investors Conference March 6, 2017 Presented by: Denny Smith VP, Corporate Development & IR
This presentation discusses certain forward-looking statements including, but not limited to, EBITDA Net Debt, and Free Cash Flow projections on a consolidated and segment basis, new rig technology, rig margin improvement potential, job growth opportunities, cost savings, and expectations regarding the performance of our industry, our current and future markets and demand for our products and services, and other statements related to our future performance. Such statements, including statements relating to matters that are not historical facts, are “forward-looking statements” within the meaning of the safe harbor provisions of Section 27A of the Securities Act, as amended, and Section 21E of the Securities Exchange Act of 1934, as amended. These “forward-looking statements” are based on an analysis of currently available competitive, financial and economic data and our operating plans and expectations. They are inherently uncertain and investors should recognize that events and actual results could turn out to be significantly different from our expectations. By way of illustration, when used in this document, words such as “anticipate,” “believe,” “expect,” “plan,” “intend,” “forecast”, “estimate,” “project,” “will,” “should,” “could,” “may,” “predict,” “illustrative,” “hypothetical,” “target” and similar expressions are intended to identify forward-looking statements. You should consider the following key factors when evaluating these forward-looking statements: fluctuations and volatility in worldwide prices of and demand for oil and natural gas; fluctuations in levels of oil and natural gas exploration and development activities; fluctuations in the demand for our services; competitive and technological changes and other developments in the oil and gas and oilfield services industries; our ability to complete, and realize the expected benefits of, strategic transactions, including our joint venture with Saudi Aramco; the existence of operating risks inherent in the oil and gas and oilfield services industries; the possibility of changes in tax and other laws and regulations; the possibility of political or economic instability, civil disturbance, war or acts of terrorism in any of the countries in which we do business; general economic conditions, including the capital and credit markets; and our expectations regarding future trends of EBITDA, net debt and free cash flow. These statements are based on management’s current expectations and estimates; actual results may differ materially due in part to: risks related to fluctuations in oil and natural gas prices which adversely affect drilling activity and our revenues, cash flows and profitability; risks related to turmoil in the global economy and the impact on our results of operations and financial conditions; risks related to our highly competitive industry and inherent risks of loss inherent to the nature of our operations; the risk that we may record additional losses or impairment charges related to sold or idle rigs; the loss of one or a number of our large customers could have a material adverse effect on our business, financial condition and results of operations; the risk that our financial and operating flexibility could be affected by our long-term debt and other financial commitments; the risk that our long-term debt and other financial commitments could be affected by our long-term debt; and the risk of any unfavorable change in tax, environmental or other governmental regulation. The above description of risks and uncertainties is by no means all-inclusive, but is designed to highlight what we believe are important factors to consider. For a discussion of these factors and other risks and uncertainties, please refer to our filings with the Securities and Exchange Commission ("SEC"), including those contained in our Annual Reports of Form 10-K and Quarterly Reports on Form 10-Q, which are available at the SEC's website at www.sec.gov. 2 Forward-Looking Statements
3 Non-GAAP Financial Measures Disclaimer This presentation refers to certain non-GAAP financial measures, such as Adjusted EBITDA (or EBITDA), Free Cash Flow and Net Debt. Adjusted EBITDA is computed by subtracting the sum of direct costs, general and administrative expenses and research and engineering expenses from operating revenues. The EBITDA forecasts presented herein exclude certain non-cash charges as we are unable to estimate with reasonable certainty unusual or unanticipated charges, expenses or gains. Free Cash Flow is defined as net cash from operations less capital expenditures. Net Debt is calculated as Total Debt minus the sum of cash and cash equivalents and short term investments. Adjusted EBITDA, Free Cash Flow and Net Debt are non-GAAP financial measures and should not be used in isolation or as a substitute for the amounts reported in accordance with generally accepted accounting principles (“GAAP”). However, management evaluates the performance of our operating segments and the Company’s consolidated results based on several criteria, including adjusted EBITDA, because it believes that this financial measure accurately reflects our ongoing profitability and performance. Management uses free cash flow and net debt as measures of our overall liquidity. In addition, securities analysts and investors use these measures as some of the metrics on which they analyze our performance. In addition, you should not place undue reliance on our financial guidance and guidance related to rig margin improvement potential, job growth opportunities and cost savings because they are based on significant assumptions related to oil and gas prices and exploration activities and acceptance of our new technologies, all of which are subject to significant fluctuations and drivers that our outside of our control. For a reconciliation of historical adjusted EBITDA to income (loss) from continuing operations before income taxes, which is the most closely comparable GAAP measure, see the Investor Relations page on our website. We do not provide a reconciliation for non-GAAP estimates on a forward-looking basis where we are unable to predict with reasonable certainty the ultimate outcome of certain significant items without unreasonable effort. This is due to the uncertainty and variability of the nature and amount of certain charges, expenses or gains that would impact the most directly comparable forward-looking GAAP financial measure, that have not yet occurred, are out of the company’s control and/or cannot be reasonably predicted. However, we expect the variability of the above items to have a significant, and potentially unpredictable, impact on our future GAAP financial results.
4 Nabors Overview Macro Trends & Market Overview The SmartRig™ & iRigTM Nabors Drilling Solutions Return on Capital and Deleveraging
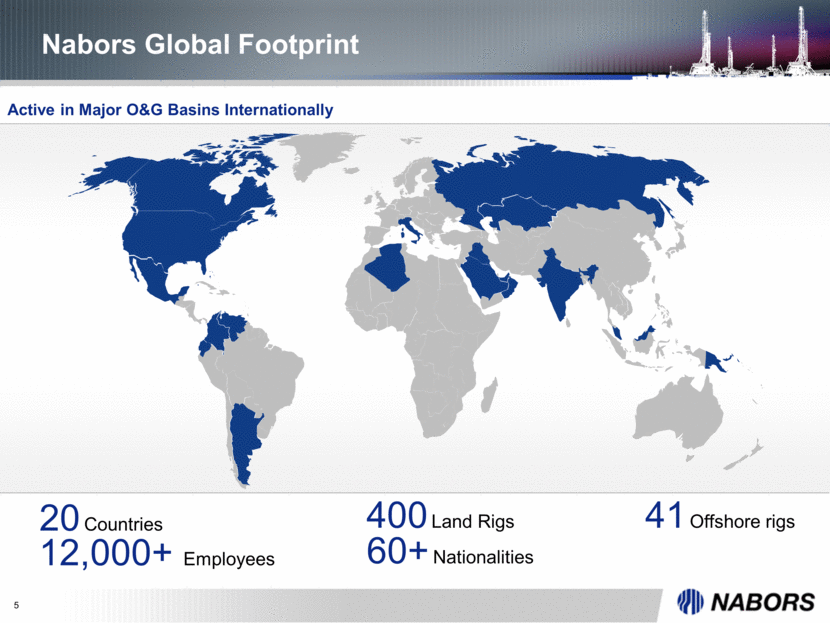
5 Nabors Global Footprint 400 Land Rigs 41 Offshore rigs 20 Countries 12,000+ Employees 60+ Nationalities Active in Major O&G Basins Internationally
6 Nabors Overview Macro Trends & Market Overview The SMARTRig™ & iRigTM Nabors Drilling Solutions Return on Capital and Deleveraging
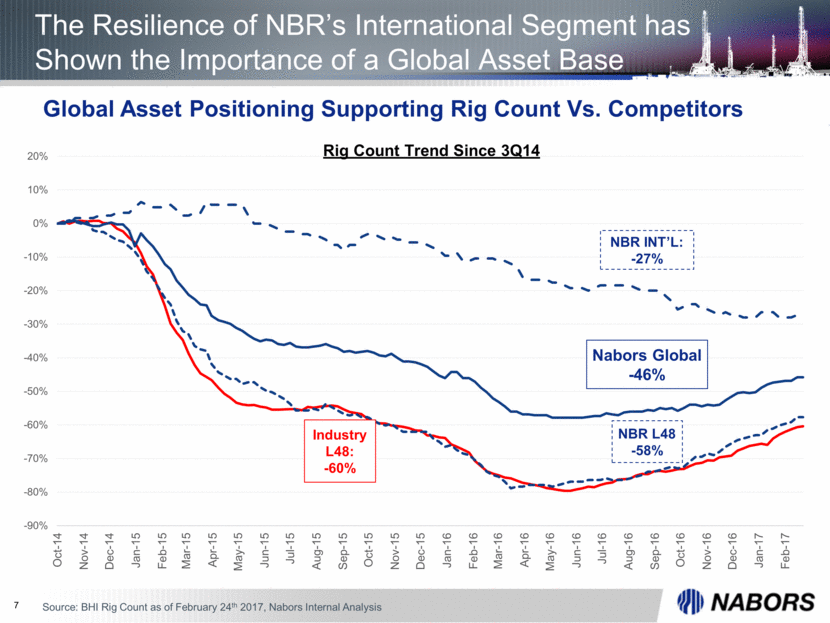
7 The Resilience of NBR’s International Segment has Shown the Importance of a Global Asset Base Source: BHI Rig Count as of February 24th 2017, Nabors Internal Analysis Global Asset Positioning Supporting Rig Count Vs. Competitors Rig Count Trend Since 3Q14 Industry L48: -60% NBR INT’L: -27% NBR L48 -58% Nabors Global -46% -90% -80% -70% -60% -50% -40% -30% -20% -10% 0% 10% 20% Oct-14 Nov-14 Dec-14 Jan-15 Feb-15 Mar-15 Apr-15 May-15 Jun-15 Jul-15 Aug-15 Sep-15 Oct-15 Nov-15 Dec-15 Jan-16 Feb-16 Mar-16 Apr-16 May-16 Jun-16 Jul-16 Aug-16 Sep-16 Oct-16 Nov-16 Dec-16 Jan-17 Feb-17
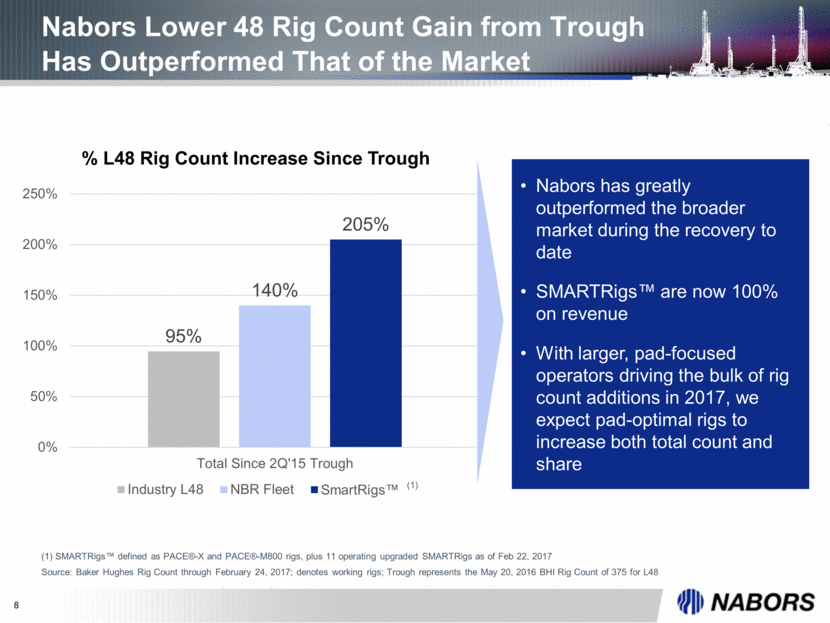
8 Nabors Lower 48 Rig Count Gain from Trough Has Outperformed That of the Market (1) SMARTRigs™ defined as PACE®-X and PACE®-M800 rigs, plus 11 operating upgraded SMARTRigs as of Feb 22, 2017 Source: Baker Hughes Rig Count through February 24, 2017; denotes working rigs; Trough represents the May 20, 2016 BHI Rig Count of 375 for L48 Nabors has greatly outperformed the broader market during the recovery to date SMARTRigs™ are now 100% on revenue With larger, pad-focused operators driving the bulk of rig count additions in 2017, we expect pad-optimal rigs to increase both total count and share (1) 95% 140% 205% 0% 50% 100% 150% 200% 250% Total Since 2Q'15 Trough % L48 Rig Count Increase Since Trough Industry L48 NBR Fleet SmartRigs™
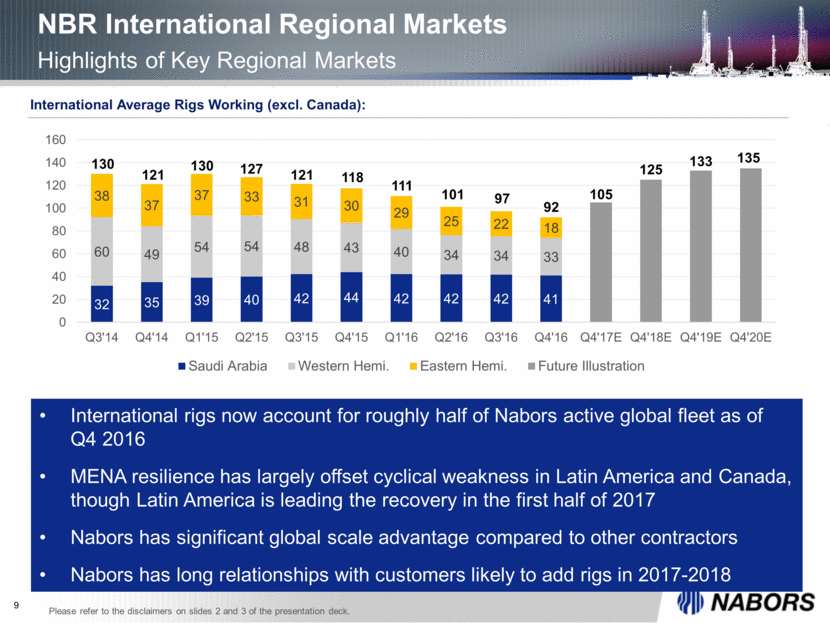
9 NBR International Regional Markets Highlights of Key Regional Markets International Average Rigs Working (excl. Canada): International rigs now account for roughly half of Nabors active global fleet as of Q4 2016 MENA resilience has largely offset cyclical weakness in Latin America and Canada, though Latin America is leading the recovery in the first half of 2017 Nabors has significant global scale advantage compared to other contractors Nabors has long relationships with customers likely to add rigs in 2017-2018 130 121 130 127 121 118 111 101 97 Please refer to the disclaimers on slides 2 and 3 of the presentation deck. 92 32 35 39 40 42 44 42 42 42 41 60 49 54 54 48 43 40 34 34 33 38 37 37 33 31 30 29 25 22 18 105 125 133 135 0 20 40 60 80 100 120 140 160 Q3'14 Q4'14 Q1'15 Q2'15 Q3'15 Q4'15 Q1'16 Q2'16 Q3'16 Q4'16 Q4'17E Q4'18E Q4'19E Q4'20E Saudi Arabia Western Hemi. Eastern Hemi. Future Illustration
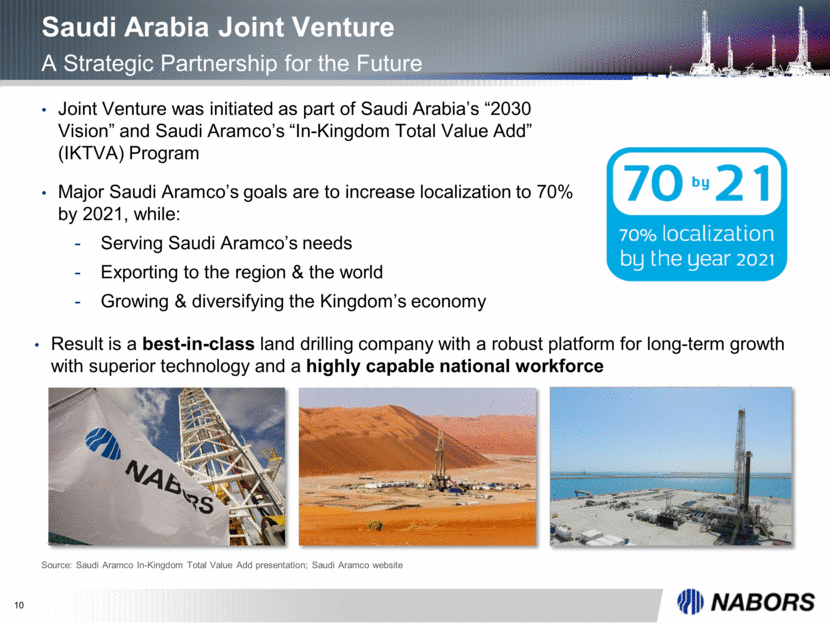
10 Joint Venture was initiated as part of Saudi Arabia’s “2030 Vision” and Saudi Aramco’s “In-Kingdom Total Value Add” (IKTVA) Program Major Saudi Aramco’s goals are to increase localization to 70% by 2021, while: Serving Saudi Aramco’s needs Exporting to the region & the world Growing & diversifying the Kingdom’s economy Saudi Arabia Joint Venture A Strategic Partnership for the Future Source: Saudi Aramco In-Kingdom Total Value Add presentation; Saudi Aramco website Result is a best-in-class land drilling company with a robust platform for long-term growth with superior technology and a highly capable national workforce
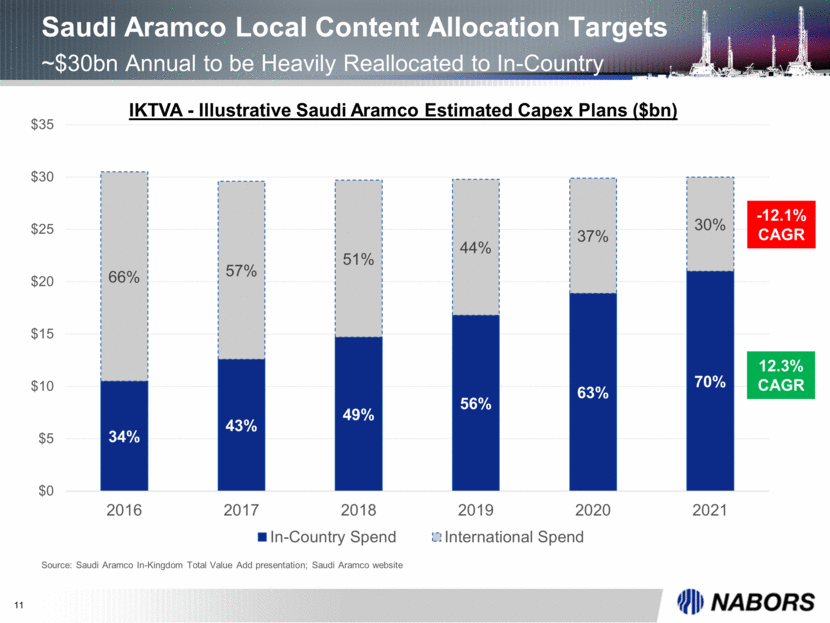
11 Saudi Aramco Local Content Allocation Targets ~$30bn Annual to be Heavily Reallocated to In-Country Source: Saudi Aramco In-Kingdom Total Value Add presentation; Saudi Aramco website 12.3% CAGR -12.1% CAGR 34% 43% 49% 56% 63% 70% 66% 57% 51% 44% 37% 30% $0 $5 $10 $15 $20 $25 $30 $35 2016 2017 2018 2019 2020 2021 IKTVA - Illustrative Saudi Aramco Estimated Capex Plans ($ bn ) In-Country Spend International Spend
12 Nabors Overview Macro Trends & Market Overview The SmartRig™ & iRigTM Nabors Drilling Solutions Return on Capital and Deleveraging
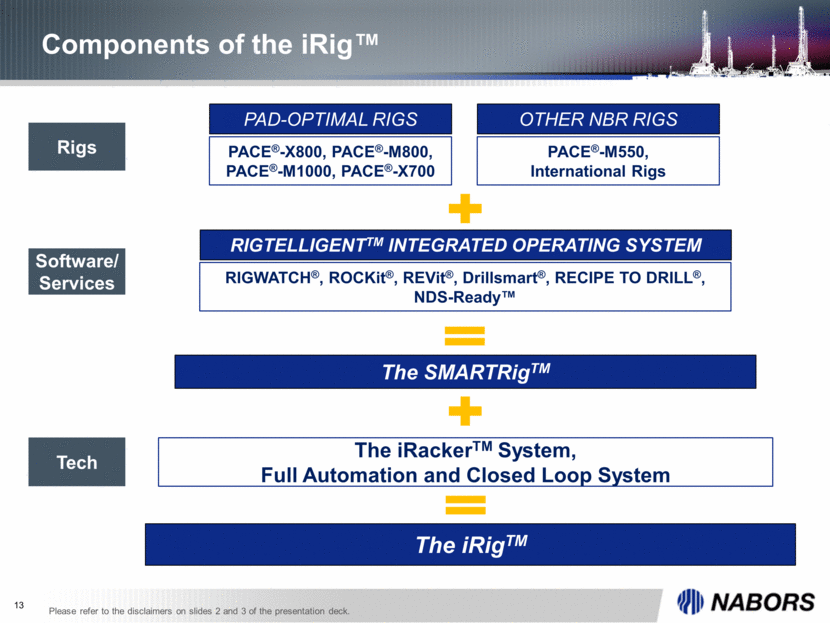
13 Rigs PAD-OPTIMAL RIGS PACE®-X800, PACE®-M800, PACE®-M1000, PACE®-X700 OTHER NBR RIGS PACE®-M550, International Rigs Software/ Services RIGTELLIGENTTM INTEGRATED OPERATING SYSTEM RIGWATCH®, ROCKit®, REVit®, Drillsmart®, RECIPE TO DRILL®, NDS-Ready™ The SMARTRigTM Tech The iRackerTM System, Full Automation and Closed Loop System The iRigTM Components of the iRig™ Please refer to the disclaimers on slides 2 and 3 of the presentation deck.
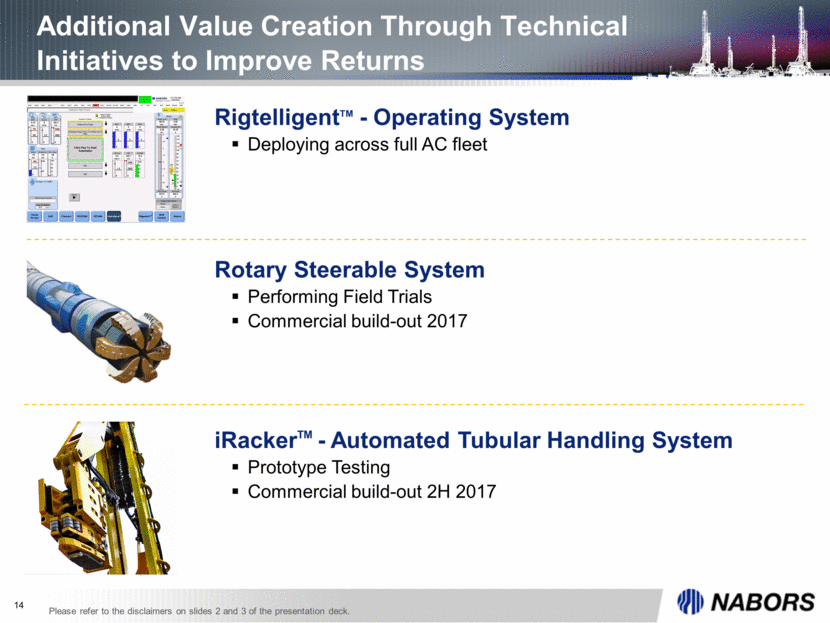
Additional Value Creation Through Technical Initiatives to Improve Returns RigtelligentTM - Operating System Deploying across full AC fleet iRackerTM - Automated Tubular Handling System Prototype Testing Commercial build-out 2H 2017 Rotary Steerable System Performing Field Trials Commercial build-out 2017 14 Please refer to the disclaimers on slides 2 and 3 of the presentation deck.
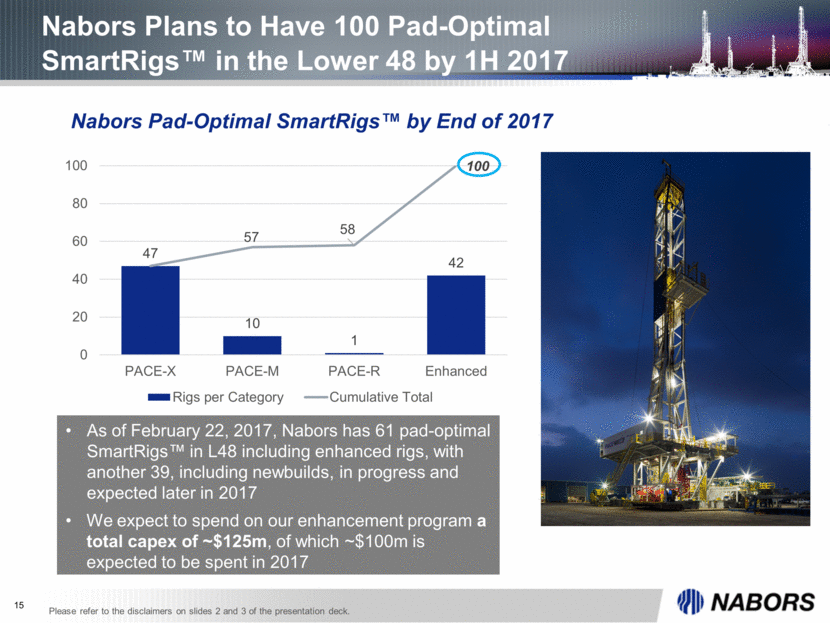
15 Nabors Plans to Have 100 Pad-Optimal SmartRigs™ in the Lower 48 by 1H 2017 As of February 22, 2017, Nabors has 61 pad-optimal SmartRigs™ in L48 including enhanced rigs, with another 39, including newbuilds, in progress and expected later in 2017 We expect to spend on our enhancement program a total capex of ~$125m, of which ~$100m is expected to be spent in 2017 Nabors Pad-Optimal SmartRigs™ by End of 2017 Please refer to the disclaimers on slides 2 and 3 of the presentation deck. 47 10 1 42 57 58 100 0 20 40 60 80 100 PACE-X PACE-M PACE-R Enhanced Rigs per Category Cumulative Total
16 Nabors Overview Macro Trends & Market Overview The SmartRig™ & iRigTM Nabors Drilling Solutions Return on Capital and Deleveraging
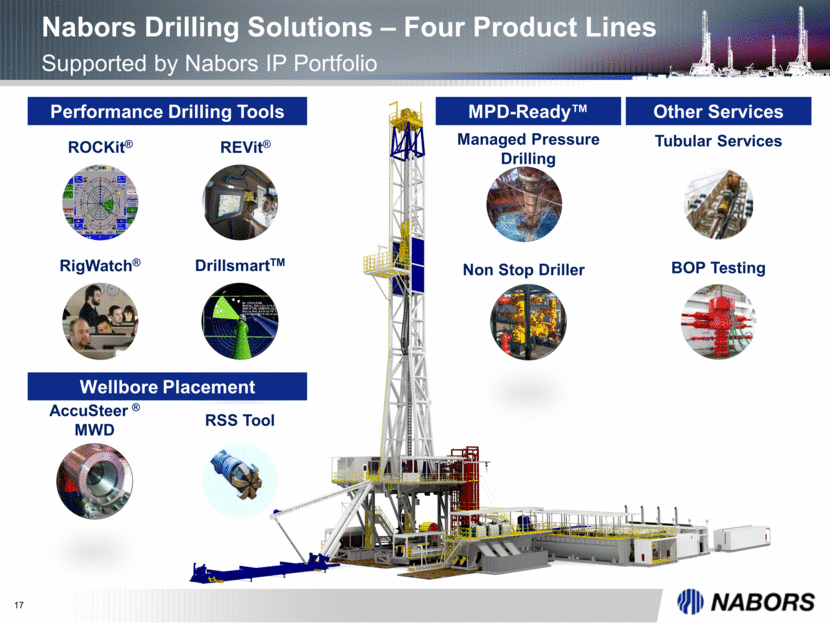
17 Nabors Drilling Solutions – Four Product Lines Supported by Nabors IP Portfolio Performance Drilling Tools ROCKit® REVit® DrillsmartTM RigWatch® AccuSteer ® MWD RSS Tool Wellbore Placement Managed Pressure Drilling Non Stop Driller BOP Testing Tubular Services MPD-Ready™ Other Services
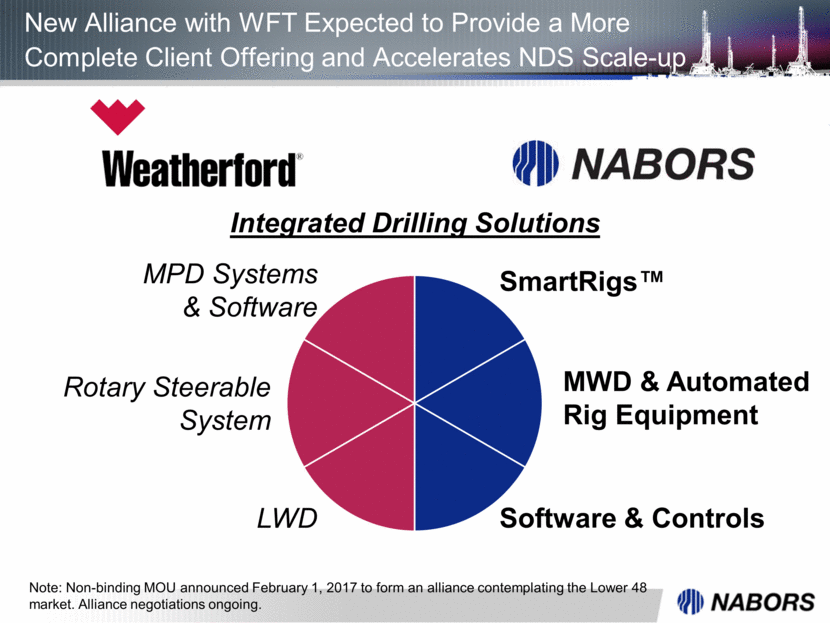
New Alliance with WFT Expected to Provide a More Complete Client Offering and Accelerates NDS Scale-up MPD Systems & Software Rotary Steerable System SmartRigs™ MWD & Automated Rig Equipment Software & Controls Note: Non-binding MOU announced February 1, 2017 to form an alliance contemplating the Lower 48 market. Alliance negotiations ongoing. Integrated Drilling Solutions LWD
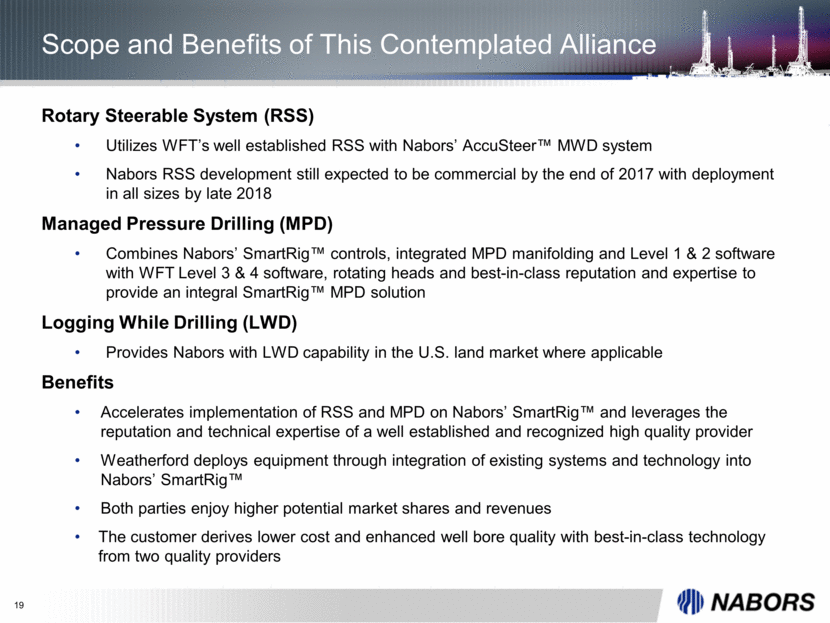
19 Rotary Steerable System (RSS) Utilizes WFT’s well established RSS with Nabors’ AccuSteer™ MWD system Nabors RSS development still expected to be commercial by the end of 2017 with deployment in all sizes by late 2018 Managed Pressure Drilling (MPD) Combines Nabors’ SmartRig™ controls, integrated MPD manifolding and Level 1 & 2 software with WFT Level 3 & 4 software, rotating heads and best-in-class reputation and expertise to provide an integral SmartRig™ MPD solution Logging While Drilling (LWD) Provides Nabors with LWD capability in the U.S. land market where applicable Benefits Accelerates implementation of RSS and MPD on Nabors’ SmartRig™ and leverages the reputation and technical expertise of a well established and recognized high quality provider Weatherford deploys equipment through integration of existing systems and technology into Nabors’ SmartRig™ Both parties enjoy higher potential market shares and revenues The customer derives lower cost and enhanced well bore quality with best-in-class technology from two quality providers Scope and Benefits of This Contemplated Alliance
20 Nabors Overview Macro Trends & Market Overview The SmartRig™ & iRigTM Nabors Drilling Solutions Return on Capital and Deleveraging
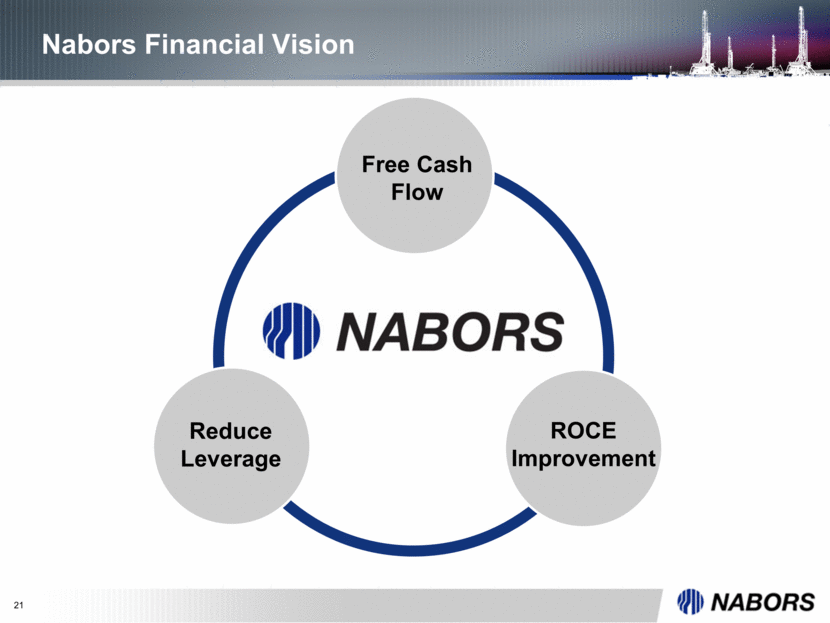
21 Nabors Financial Vision ROCE Improvement Free Cash Flow Reduce Leverage
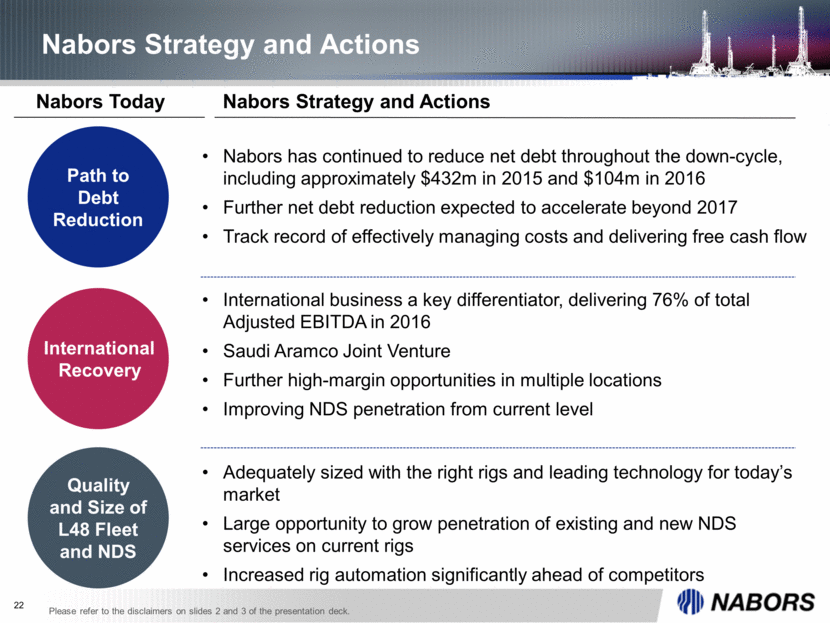
22 Nabors Strategy and Actions Path to Debt Reduction Quality and Size of L48 Fleet and NDS Nabors has continued to reduce net debt throughout the down-cycle, including approximately $432m in 2015 and $104m in 2016 Further net debt reduction expected to accelerate beyond 2017 Track record of effectively managing costs and delivering free cash flow Adequately sized with the right rigs and leading technology for today’s market Large opportunity to grow penetration of existing and new NDS services on current rigs Increased rig automation significantly ahead of competitors International business a key differentiator, delivering 76% of total Adjusted EBITDA in 2016 Saudi Aramco Joint Venture Further high-margin opportunities in multiple locations Improving NDS penetration from current level Nabors Today Nabors Strategy and Actions International Recovery Please refer to the disclaimers on slides 2 and 3 of the presentation deck.
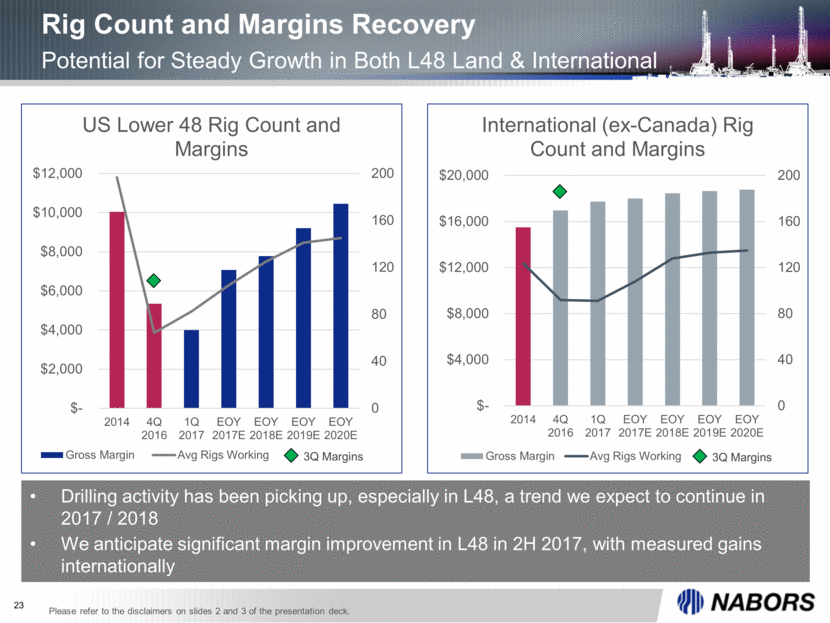
23 Rig Count and Margins Recovery Potential for Steady Growth in Both L48 Land & International Drilling activity has been picking up, especially in L48, a trend we expect to continue in 2017 / 2018 We anticipate significant margin improvement in L48 in 2H 2017, with measured gains internationally 3Q Margins 3Q Margins Please refer to the disclaimers on slides 2 and 3 of the presentation deck. 0 40 80 120 160 200 $- $2,000 $4,000 $6,000 $8,000 $10,000 $12,000 2014 4Q 2016 1Q 2017 EOY 2017E EOY 2018E EOY 2019E EOY 2020E US Lower 48 Rig Count and Margins Gross Margin Avg Rigs Working 0 40 80 120 160 200 $- $4,000 $8,000 $12,000 $16,000 $20,000 2014 4Q 2016 1Q 2017 EOY 2017E EOY 2018E EOY 2019E EOY 2020E International (ex - Canada) Rig Count and Margins Gross Margin Avg Rigs Working
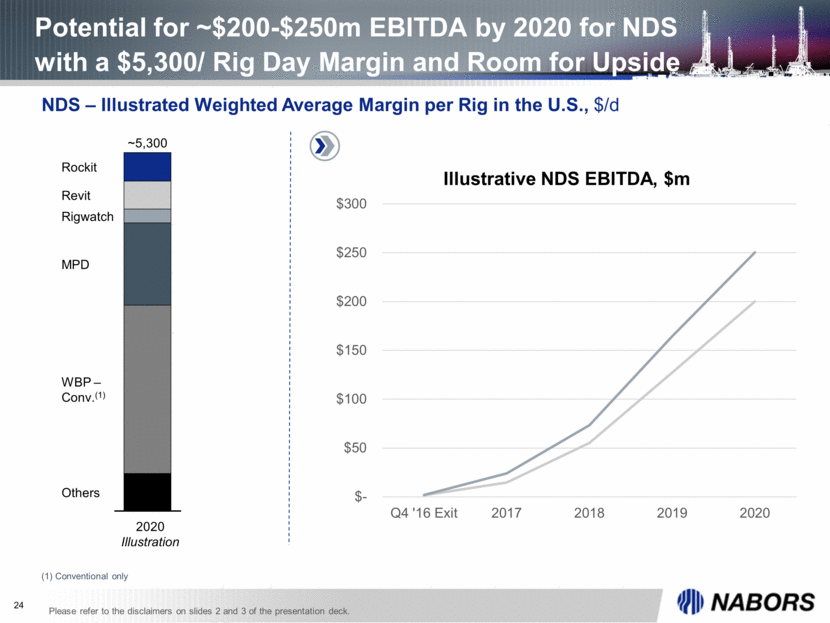
24 Potential for ~$200-$250m EBITDA by 2020 for NDS with a $5,300/ Rig Day Margin and Room for Upside (1) Conventional only NDS – Illustrated Weighted Average Margin per Rig in the U.S., $/d Revit Rigwatch Others WBP – Conv.(1) MPD Rockit 2020 Illustration ~5,300 Please refer to the disclaimers on slides 2 and 3 of the presentation deck. $- $50 $100 $150 $200 $250 $300 Q4 '16 Exit 2017 2018 2019 2020 Illustrative NDS EBITDA, $m
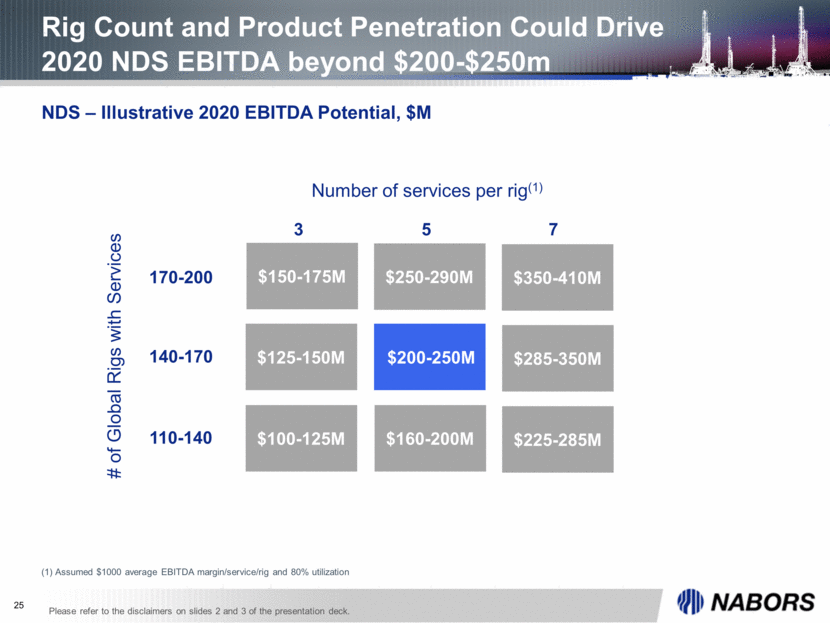
25 Rig Count and Product Penetration Could Drive 2020 NDS EBITDA beyond $200-$250m (1) Assumed $1000 average EBITDA margin/service/rig and 80% utilization $150-175M $250-290M $350-410M $125-150M $200-250M $285-350M $100-125M $160-200M $225-285M Number of services per rig(1) # of Global Rigs with Services 3 5 7 170-200 140-170 110-140 NDS – Illustrative 2020 EBITDA Potential, $M Please refer to the disclaimers on slides 2 and 3 of the presentation deck.
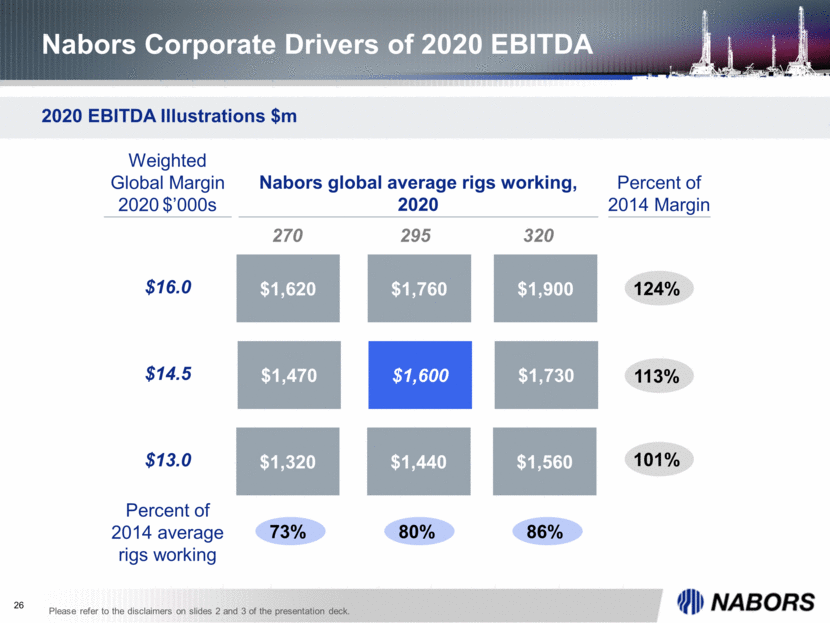
26 Nabors Corporate Drivers of 2020 EBITDA Nabors global average rigs working, 2020 2020 EBITDA Illustrations $m Percent of 2014 Margin Percent of 2014 average rigs working $1,760 $1,600 $1,440 $1,900 $1,730 $1,560 $1,620 $1,470 $1,320 124% 113% 101% 73% 80% 86% 270 295 320 $16.0 $14.5 $13.0 Weighted Global Margin 2020 $’000s Please refer to the disclaimers on slides 2 and 3 of the presentation deck.
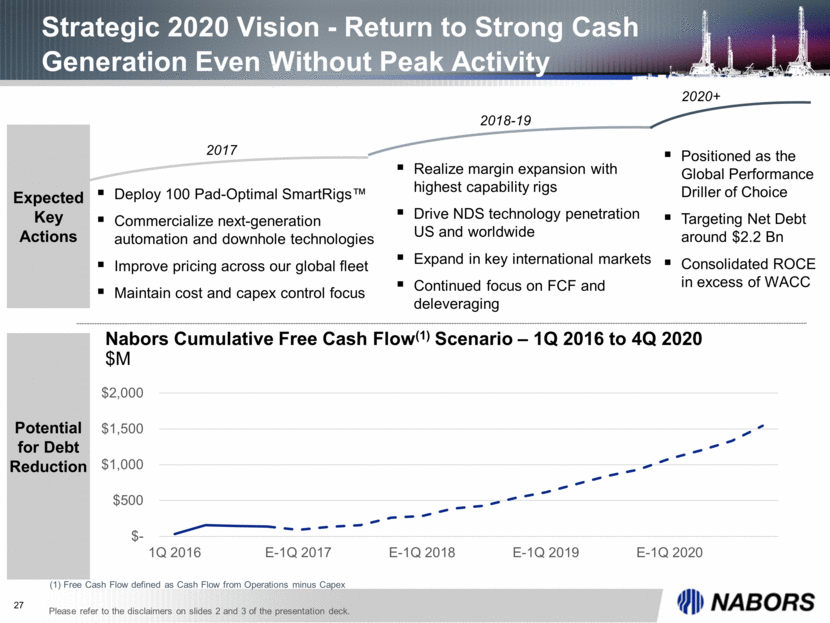
Nabors Cumulative Free Cash Flow(1) Scenario – 1Q 2016 to 4Q 2020 $M 7 Strategic 2020 Vision - Return to Strong Cash Generation Even Without Peak Activity Potential for Debt Reduction 2017 2018-19 2020+ Expected Key Actions Deploy 100 Pad-Optimal SmartRigs™ Commercialize next-generation automation and downhole technologies Improve pricing across our global fleet Maintain cost and capex control focus Realize margin expansion with highest capability rigs Drive NDS technology penetration US and worldwide Expand in key international markets Continued focus on FCF and deleveraging Positioned as the Global Performance Driller of Choice Targeting Net Debt around $2.2 Bn Consolidated ROCE in excess of WACC (1) Free Cash Flow defined as Cash Flow from Operations minus Capex Please refer to the disclaimers on slides 2 and 3 of the presentation deck. $- $500 $1,000 $1,500 $2,000 1Q 2016 E-1Q 2017 E-1Q 2018 E-1Q 2019 E-1Q 2020
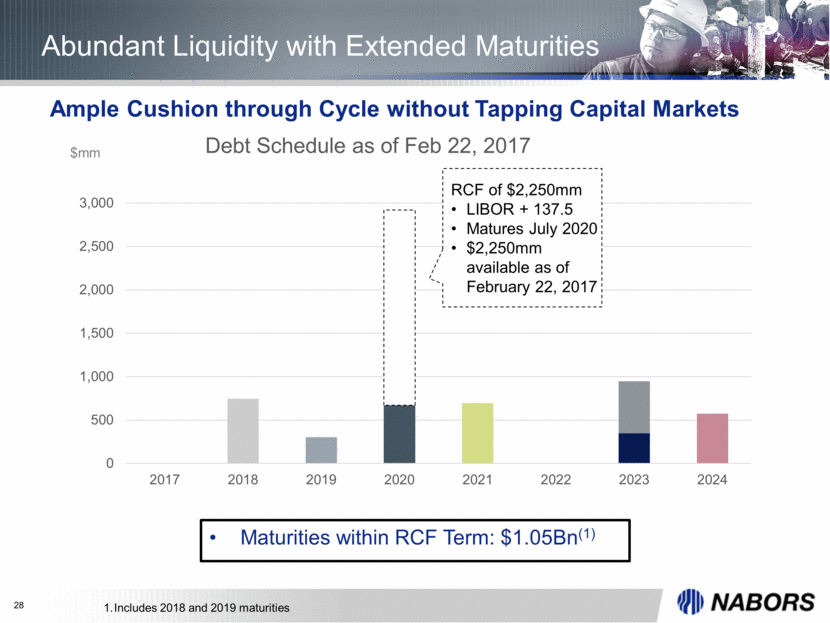
28 Abundant Liquidity with Extended Maturities Ample Cushion through Cycle without Tapping Capital Markets Maturities within RCF Term: $1.05Bn(1) RCF of $2,250mm LIBOR + 137.5 Matures July 2020 $2,250mm available as of February 22, 2017 Includes 2018 and 2019 maturities 0 500 1,000 1,500 2,000 2,500 3,000 2017 2018 2019 2020 2021 2022 2023 2024 Debt Schedule as of Feb 22, 2017 $mm
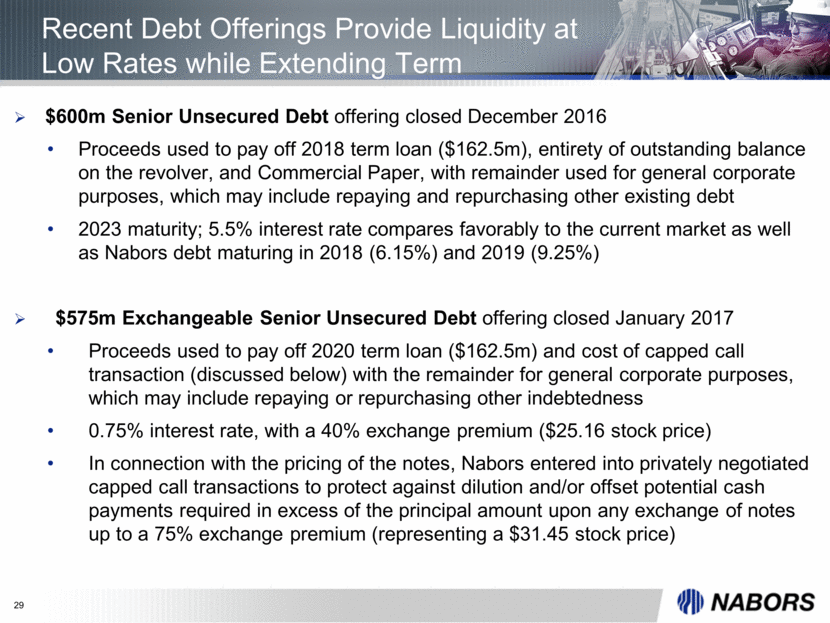
29 $600m Senior Unsecured Debt offering closed December 2016 Proceeds used to pay off 2018 term loan ($162.5m), entirety of outstanding balance on the revolver, and Commercial Paper, with remainder used for general corporate purposes, which may include repaying and repurchasing other existing debt 2023 maturity; 5.5% interest rate compares favorably to the current market as well as Nabors debt maturing in 2018 (6.15%) and 2019 (9.25%) $575m Exchangeable Senior Unsecured Debt offering closed January 2017 Proceeds used to pay off 2020 term loan ($162.5m) and cost of capped call transaction (discussed below) with the remainder for general corporate purposes, which may include repaying or repurchasing other indebtedness 0.75% interest rate, with a 40% exchange premium ($25.16 stock price) In connection with the pricing of the notes, Nabors entered into privately negotiated capped call transactions to protect against dilution and/or offset potential cash payments required in excess of the principal amount upon any exchange of notes up to a 75% exchange premium (representing a $31.45 stock price) Recent Debt Offerings Provide Liquidity at Low Rates while Extending Term
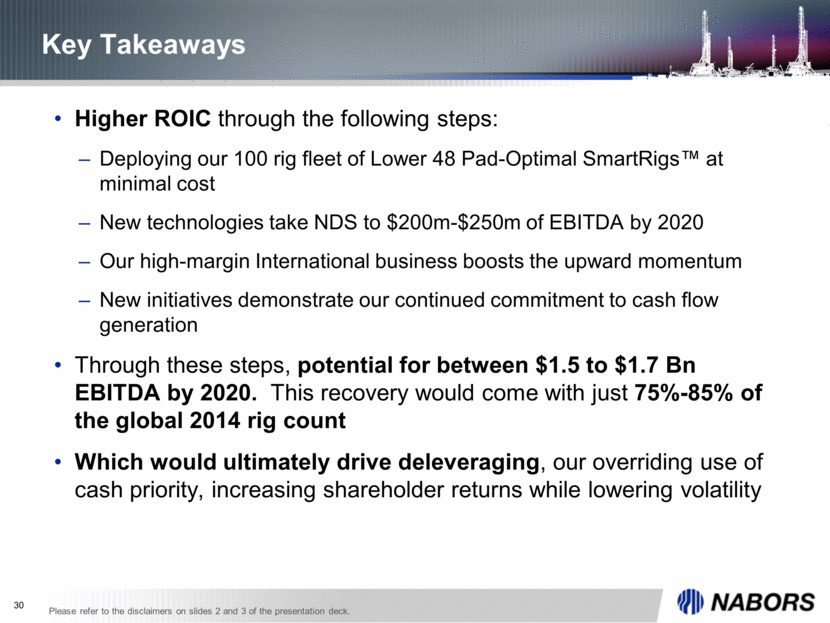
30 Higher ROIC through the following steps: Deploying our 100 rig fleet of Lower 48 Pad-Optimal SmartRigs™ at minimal cost New technologies take NDS to $200m-$250m of EBITDA by 2020 Our high-margin International business boosts the upward momentum New initiatives demonstrate our continued commitment to cash flow generation Through these steps, potential for between $1.5 to $1.7 Bn EBITDA by 2020. This recovery would come with just 75%-85% of the global 2014 rig count Which would ultimately drive deleveraging, our overriding use of cash priority, increasing shareholder returns while lowering volatility Key Takeaways Please refer to the disclaimers on slides 2 and 3 of the presentation deck.