Attached files
| file | filename |
|---|---|
| 8-K - 8-K - VORNADO REALTY TRUST | a17-7586_18k.htm |
Exhibit 99.1
March 2017
Certain statements contained in this investor presentation constitute forward-looking statements as such term is defined in Section 27A of the Securities Act of 1933, as amended, and Section 21E of the Securities Exchange Act of 1934, as amended. Forward-looking statements are not guarantees of performance. They represent our intentions, plans, expectations and beliefs and are subject to numerous assumptions, risks and uncertainties. Consequently, the future results, financial condition and business of Vornado Realty Trust (“Vornado”) and of the planned spin-off entity (“JBG SMITH”) may differ materially from those expressed in these forward-looking statements. You can find many of these statements by looking for words such as “approximates”, “believes”, “expects”, “anticipates”, “estimates”, “intends”, “plans”, “would”, “may” or similar expressions in this presentation. We also note the following forward-looking statements: in the case of our development and redevelopment projects, the estimated completion date, estimated project cost and cost to complete; and stabilized yields, estimates of future capital expenditures, dividends to common and preferred shareholders and operating partnership distributions. Many of the factors that will determine the outcome of these and our other forward-looking statements are beyond our ability to control or predict. These factors include, among others: uncertainties as to the timing of the spin-off and whether it will be completed, the possibility that various closing conditions to the spin-off may not be satisfied or waived, the expected tax treatment of the spin-off, the composition of the spin-off portfolio, the possibility that third-party consents required to transfer certain properties in the spin-off will not be received, the impact of the spin-off on the businesses of Vornado and JBG SMITH, the timing of and costs associated with property improvements, financing commitments, and general competitive factors. For further discussion of factors that could materially affect the outcome of our forward-looking statements and other risks and uncertainties, see “Risk Factors” in Vornado’s Annual Report on Form 10-K for the year ended December 31, 2016 and subsequent quarterly periodic reports filed with the SEC. For these statements, we claim the protection of the safe harbor for forward-looking statements contained in the Private Securities Litigation Reform Act of 1995. You are cautioned not to place undue reliance on our forward-looking statements. All subsequent written and oral forward-looking statements attributable to us or any person acting on our behalf are expressly qualified in their entirety by the cautionary statements contained or referred to in this section. We do not undertake any obligation to release publicly any revisions to our forward-looking statements to reflect events or circumstances occurring after the date of this presentation. Market Data Market data and industry forecasts are used in this presentation, including data obtained from publicly available sources. These sources generally state that the information they provide has been obtained from sources believed to be reliable but the accuracy and completeness of the information are not assured. Vornado has not independently verified any of such information. Non-GAAP Measures This presentation includes non-GAAP measures. Management uses these non-GAAP measures as supplemental performance measures for its assets and believes they provide useful information to investors, but they may not be comparable to other real estate companies’ similarly captioned measures. Additional information about these non-GAAP measures, including a reconciliation to the most comparable GAAP measure, can be found on pages I – II of this presentation. FORWARD LOOKING STATEMENTS General Disclaimer of JBG Information JBG information included in this presentation has been provided to Vornado by JBG in connection with the proposed transaction. Vornado has not verified the accuracy or completeness of the JBG information. Certain of the JBG information is based solely on JBG’s estimates using data available to JBG and assumptions made by JBG and JBG’s current business plans and may change. In certain instances, these estimates and assumptions have been used as a basis to derive asset values and potential future property-level NOI. As is the case with any estimate or assumption, there can be no assurance that the assumptions or estimates are correct or that the NOI will be achieved. You are cautioned not to place undue reliance on these estimates of assumptions or information derived therefrom.
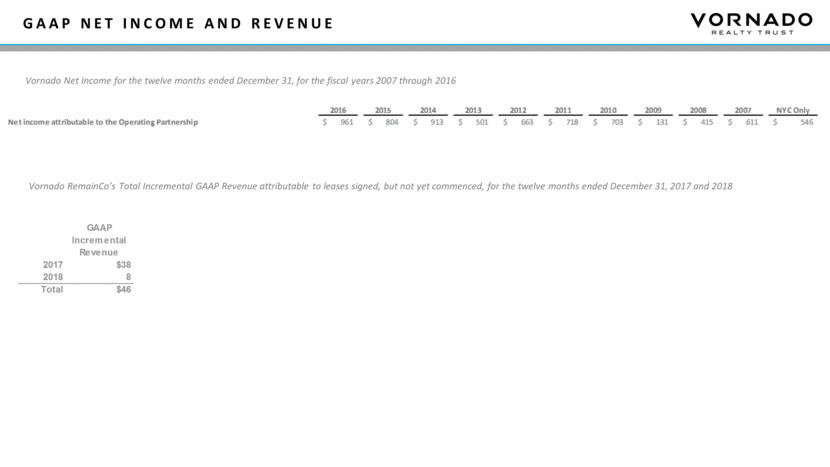
Non-GAAP Financial Measures Non-GAAP Measures This investor presentation contains certain non-GAAP financial measures, including earnings before interest, taxes, depreciation and amortization (“EBITDA”) and net operating income (“NOI”). EBITDA is earnings before interest, taxes, depreciation and amortization and is presented after net income attributable to non-controlling interests in the Operating Partnership. EBITDA, as adjusted is EBITDA adjusted by income from sold properties, gains on sale of real estate, impairment losses and other items. We consider EBITDA and EBITDA, as adjusted, to be supplemental measures for making decisions and assessing the unlevered performance of our segments as it relates to the total return on assets as opposed to the levered return on equity. As properties are bought and sold based on a multiple of EBITDA or EBITDA, as adjusted, we utilize these measures to make investment decisions as well as to compare the performance of our assets to that of our peers. EBITDA and EBITDA, as adjusted, should not be considered as substitutes for net income. EBITDA and EBITDA, as adjusted, may not be comparable to similarly titled measures employed by other companies. A reconciliation of EBITDA and EBITDA, as adjusted to Net Income, the most directly comparable GAAP measure, is provided on pages I – II. Vornado RemainCo EBITDA is EBITDA, as adjusted, calculated as described above, excluding interest and other investment income, net, earnings from Hotel Pennsylvania, our Real Estate Fund and our Washington, DC business. It is used in this presentation as an illustration of EBITDA, as adjusted, of Vornado following the completion of the spin-off and combination transactions described elsewhere in this presentation. NOI is calculated by adjusting GAAP operating income to add back depreciation and amortization expense, general and administrative expenses, real estate impairment losses and non-cash ground rent expense, and deducting non-cash rental income resulting from the straight-lining of rents and amortization of acquired below market leases net of above market leases. We believe NOI is a meaningful non-GAAP financial measure because real estate acquisitions and dispositions are evaluated based on, among other considerations, property NOI applied to market capitalization rates. We utilize these measures to make investment and capital allocation decisions and to compare the unlevered performance of our properties to our peers. NOI should not be considered as a substitute for operating income or net income and may not be comparable to similarly titled measures employed by others. A reconciliation of NOI to Net Income, the most directly comparable GAAP measure, is provided on pages I – II. Vornado RemainCo Cash NOI is Vornado RemainCo EBITDA calculated as described above, excluding equity compensation, equity earnings from Alexander’s Inc. (“ALX”) in excess of dividends and non-cash revenue from straight-line rentals and FAS 141 below market rentals. It is used in this presentation as an illustration of the expected Cash NOI of Vornado following the completion of the spin-off and combination transactions described elsewhere in this presentation. “Pro Rata Share” or “At Share” means Vornado’s ownership percentage of the applicable assets applied to the specific metric. “Noncontrolling Interests’ Share” means the noncontrolling interests’ ownership percentage of the applicable assets applied to the specific metric. We believe these forms of presentation offer insights into the financial performance and condition of our company as a whole, given the significance of our joint ventures that are accounted for either under the equity method or consolidated with the third parties’ share including noncontrolling interests, although the presentation of such information may not accurately depict the legal and economic implications of holding a noncontrolling interest in the joint venture. Other companies may calculate their proportionate interest differently than we do, limiting its usefulness as a comparative measure. Metrics provided at our Pro Rata Share should not be considered in isolation or as a substitute for our financials statements as reported under GAAP. Vornado Net Income for the twelve months ended December 31, for the fiscal years 2007 through 2016 Vornado RemainCo’s Total Incremental GAAP Revenue attributable to leases signed, but not yet commenced, for the twelve months ended December 31, 2017 and 2018 Vornado Net Income for the three months ended December 31,2016 2016 2015 2014 2013 2012 2011 2010 2009 2008 2007 NYC Only Net income attributable to the Operating Partnership 961 $ 804 $ 913 $ 501 $ 663 $ 718 $ 703 $ 131 $ 415 $ 611 $ 546 $ 2017 $38 2018 8 Total $46 GAAP Incremental Revenue $ 710 $ 113 $ 519 $ 77 Net income attributable to the Operating Partnership Three Months Ended December 31, 2016 Total New York Washington, DC Other 2016 2015 2014 2013 2012 2011 2010 2009 2008 2007 NYC Only Net income attributable to the Operating Partnership # 961 $ 804 $ 913 $ 501 $ 663 $ 718 $ 703 $ 131 $ 415 $ 611 $ 546 $
GAAP Net Income and revenue Non-GAAP Measures This investor presentation contains certain non-GAAP financial measures, including earnings before interest, taxes, depreciation and amortization (“EBITDA”) and net operating income (“NOI”). EBITDA is earnings before interest, taxes, depreciation and amortization and is presented after net income attributable to non-controlling interests in the Operating Partnership. EBITDA, as adjusted is EBITDA adjusted by income from sold properties, gains on sale of real estate, impairment losses and other items. We consider EBITDA and EBITDA, as adjusted, to be supplemental measures for making decisions and assessing the unlevered performance of our segments as it relates to the total return on assets as opposed to the levered return on equity. As properties are bought and sold based on a multiple of EBITDA or EBITDA, as adjusted, we utilize these measures to make investment decisions as well as to compare the performance of our assets to that of our peers. EBITDA and EBITDA, as adjusted, should not be considered as substitutes for net income. EBITDA and EBITDA, as adjusted, may not be comparable to similarly titled measures employed by other companies. A reconciliation of EBITDA and EBITDA, as adjusted to Net Income, the most directly comparable GAAP measure, is provided on pages I – II. Vornado RemainCo EBITDA is EBITDA, as adjusted, calculated as described above, excluding interest and other investment income, net, earnings from Hotel Pennsylvania, our Real Estate Fund and our Washington, DC business. It is used in this presentation as an illustration of EBITDA, as adjusted, of Vornado following the completion of the spin-off and combination transactions described elsewhere in this presentation. NOI is calculated by adjusting GAAP operating income to add back depreciation and amortization expense, general and administrative expenses, real estate impairment losses and non-cash ground rent expense, and deducting non-cash rental income resulting from the straight-lining of rents and amortization of acquired below market leases net of above market leases. We believe NOI is a meaningful non-GAAP financial measure because real estate acquisitions and dispositions are evaluated based on, among other considerations, property NOI applied to market capitalization rates. We utilize these measures to make investment and capital allocation decisions and to compare the unlevered performance of our properties to our peers. NOI should not be considered as a substitute for operating income or net income and may not be comparable to similarly titled measures employed by others. A reconciliation of NOI to Net Income, the most directly comparable GAAP measure, is provided on pages I – II. Vornado RemainCo Cash NOI is Vornado RemainCo EBITDA calculated as described above, excluding equity compensation, equity earnings from Alexander’s Inc. (“ALX”) in excess of dividends and non-cash revenue from straight-line rentals and FAS 141 below market rentals. It is used in this presentation as an illustration of the expected Cash NOI of Vornado following the completion of the spin-off and combination transactions described elsewhere in this presentation. “NAV” means Net Asset Value, which we calculate by dividing our assets’ expected pro-forma Cash NOI by management’s estimate of the capitalization rate applicable to such assets. We also present the non-GAAP measure NAV per share, which is Net Asset Value divided by the weighted average number of Vornado’s shares outstanding as of 12/31/16 on an OP basis. “Pro Rata Share” or “At Share” means Vornado’s ownership percentage of the applicable assets applied to the specific metric. “Noncontrolling Interests’ Share” means the noncontrolling interests’ ownership percentage of the applicable assets applied to the specific metric. We believe these forms of presentation offer insights into the financials performance and condition of our company as a whole, given the significance of our joint ventures that are accounted for either under the equity method or consolidated with the third parties’ share including noncontrolling interests, although the presentation of such information may not accurately depict the legal and economic implications of holding a noncontrolling interest in the joint venture. Other companies may calculate their proportionate interest differently than we do, limiting its usefulness as a comparative measure. Metrics provided at our Pro Rata Share should not be considered in isolation or as a substitute for our financials statements as reported under GAAP. Vornado Net Income for the twelve months ended December 31, for the fiscal years 2007 through 2016 Vornado RemainCo’s Total Incremental GAAP Revenue attributable to leases signed, but not yet commenced, for the twelve months ended December 31, 2017 and 2018 2016 2015 2014 2013 2012 2011 2010 2009 2008 2007 NYC Only Net income attributable to the Operating Partnership 961 $ 804 $ 913 $ 501 $ 663 $ 718 $ 703 $ 131 $ 415 $ 611 $ 546 $ 2017 $38 2018 8 Total $46 GAAP Incremental Revenue
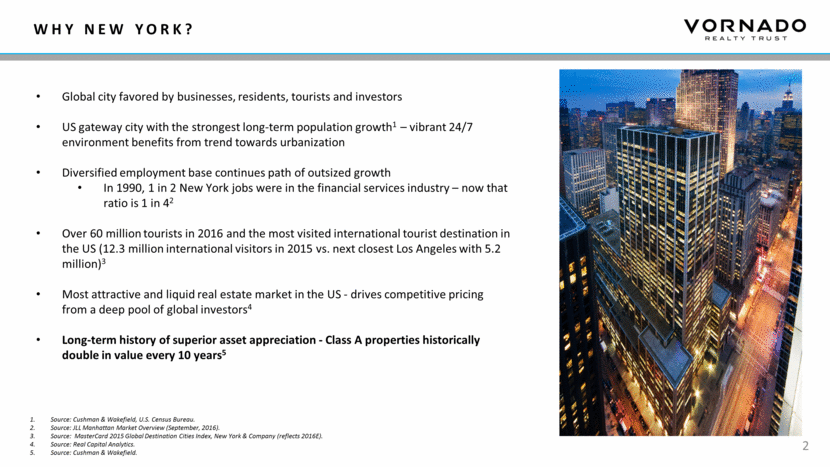
Relentless Focus on Shareholder Value Creation In the past few years, we have exited multiple business lines and non-core holdings - $15.7 Billion of total transactions Disposed of $6.1 Billion of non-core assets including regional malls, the Mart business (retaining theMART building in Chicago) and other non-core investments Spun off strip shopping centers into Urban Edge Properties (NYSE: UE) in a $3.6 Billion transaction Upon completion of the DC spin-merger ($6 Billion transaction value at share), we will have created three best-in-class, highly focused REITs Peerless NYC focused real estate company with premier office assets and the only publicly investable high street retail portfolio of unique quality and scale Trophy assets in best NYC submarkets Attractive built-in growth from recently signed leases Best-in-class management team, now with singular NYC focus, with proven record of value creation Fortress balance sheet Focused, pure-play Northeastern shopping center business with strong growth profile Irreplaceable portfolio of properties concentrated in dense, high barrier to entry markets with attractive demographics Embedded growth opportunities from redevelopment and anchor repositioning projects Proven management team Vornado to combine its Washington, DC business with The JBG Companies Vornado shareholders to own ~74% Largest1, pure-play, mixed-use operator focused solely on Washington, DC Best-in-class Washington, DC focused management team with proven record of success Premier portfolio of mixed-use (office, multifamily and retail) assets in Metro-served, urban infill submarkets Significant near-term embedded growth prospects as well as substantial pipeline of future development opportunities Upon completion of the DC spin-merger, we will have created three best-in-class, highly focused REITs Based on Commercial SF as reported per latest financial statements for public office REITs with Washington, DC exposure. 1
2 Why New York? Global city favored by businesses, residents, tourists and investors US gateway city with the strongest long-term population growth1 – vibrant 24/7 environment benefits from trend towards urbanization Diversified employment base continues path of outsized growth In 1990, 1 in 2 New York jobs were in the financial services industry – now that ratio is 1 in 42 Over 60 million tourists in 2016 and the most visited international tourist destination in the US (12.3 million international visitors in 2015 vs. next closest Los Angeles with 5.2 million)3 Most attractive and liquid real estate market in the US - drives competitive pricing from a deep pool of global investors4 Long-term history of superior asset appreciation - Class A properties historically double in value every 10 years5 Source: Cushman & Wakefield, U.S. Census Bureau. Source: JLL Manhattan Market Overview (September, 2016). Source: MasterCard 2015 Global Destination Cities Index, New York & Company (reflects 2016E). Source: Real Capital Analytics. Source: Cushman & Wakefield. 1290 Avenue of the Americas
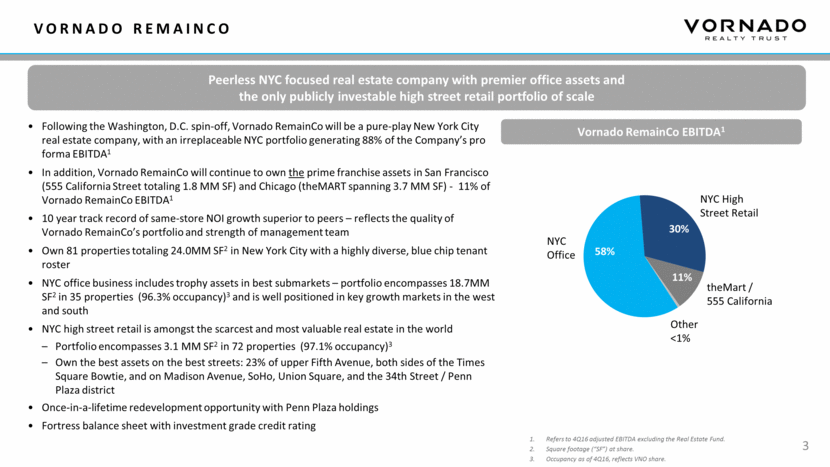
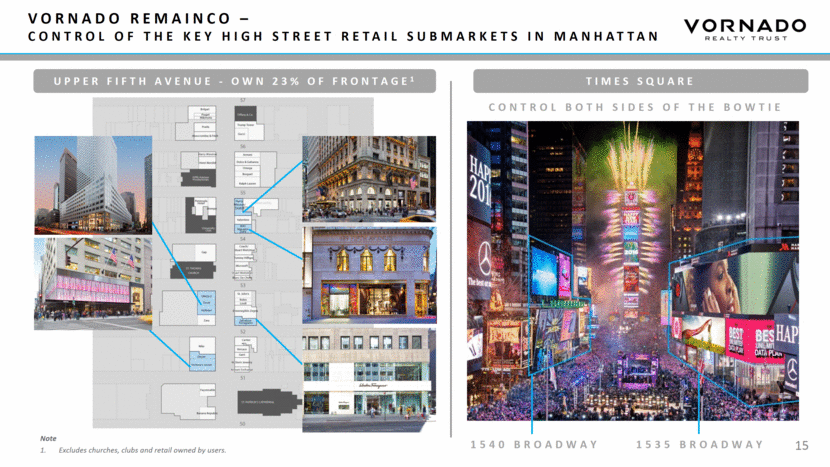
Following the Washington, D.C. spin-off, Vornado RemainCo will be a pure-play New York City real estate company, with an irreplaceable NYC portfolio generating 88% of the Company’s pro forma EBITDA1 In addition, Vornado RemainCo will continue to own the prime franchise assets in San Francisco (555 California Street totaling 1.8 MM SF) and Chicago (theMART spanning 3.7 MM SF) - 11% of Vornado RemainCo EBITDA1 10 year track record of same-store NOI growth superior to peers – reflects the quality of Vornado RemainCo’s portfolio and strength of management team Own 81 properties totaling 24.0MM SF2 in New York City with a highly diverse, blue chip tenant roster NYC office business includes trophy assets in best submarkets – portfolio encompasses 18.7MM SF2 in 35 properties (96.3% occupancy)3 and is well positioned in key growth markets in the west and south NYC high street retail is amongst the scarcest and most valuable real estate in the world Portfolio encompasses 3.1 MM SF2 in 72 properties (97.1% occupancy)3 Own the best assets on the best streets: 23% of upper Fifth Avenue, both sides of the Times Square Bowtie, and on Madison Avenue, SoHo, Union Square, and the 34th Street / Penn Plaza district Once-in-a-lifetime redevelopment opportunity with Penn Plaza holdings Fortress balance sheet with investment grade credit rating Peerless NYC focused real estate company with premier office assets and the only publicly investable high street retail portfolio of scale Vornado RemainCo EBITDA1 Refers to 4Q16 adjusted EBITDA excluding the Real Estate Fund. Square footage (“SF”) at share. Occupancy as of 4Q16, reflects VNO share. 3 Vornado Remainco 57% 31% 11% OLD NYC Office NYC High Street Retail theMART / 555 California Street Other <1% 58% 30% 11% NYC Office NYC High Street Retail theMart / 555 California Other <1%
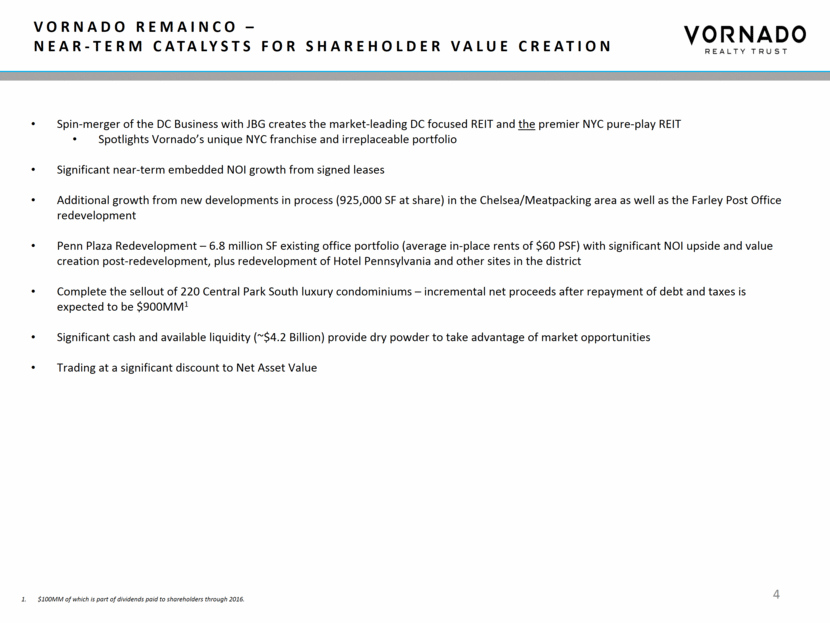
Vornado remainco – Near-Term Catalysts for shareholder value creation 4 Spin-merger of the DC Business with JBG creates the market-leading DC focused REIT and the premier NYC pure-play REIT Spotlights Vornado’s unique NYC franchise and irreplaceable portfolio Significant near-term embedded NOI growth from signed leases Additional growth from new developments in process (925,000 SF at share) in the Chelsea/Meatpacking area as well as the Farley Post Office redevelopment Penn Plaza Redevelopment – 6.8 million SF existing office portfolio (average in-place rents of $60 PSF) with significant NOI upside and value creation post-redevelopment, plus redevelopment of Hotel Pennsylvania and other sites in the district Complete the sellout of 220 Central Park South luxury condominiums – incremental net proceeds after repayment of debt and taxes is expected to be $900MM1 Significant cash and available liquidity (~$4.2 Billion) provide dry powder to take advantage of market opportunities Trading at a significant discount to Net Asset Value $100MM of which is part of dividends paid to shareholders through 2016. Incremental cash revenue (a surrogate for Cash NOI) is derived solely from signed leases not yet commenced; see p. II for GAAP reconciliation. The aggregate of the $153MM equates to the $114MM noted in page 5 because of the starting point (2016 TTM vs. 4Q16 annualized). $100MM was already part of dividends to shareholders.
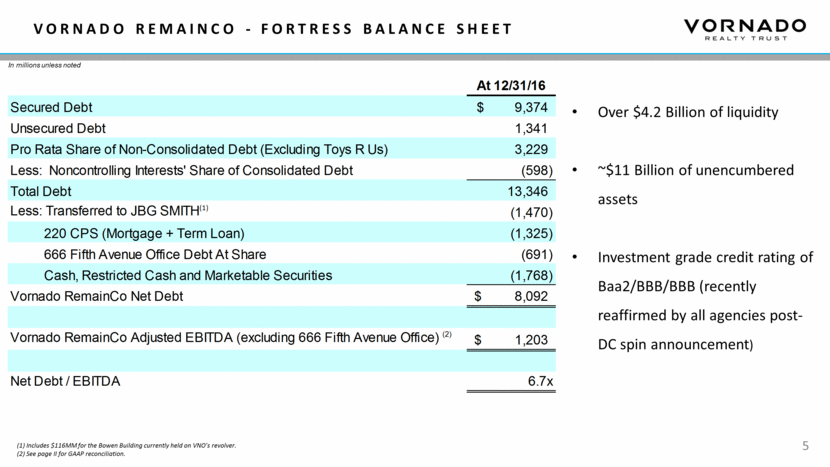
5 Vornado Remainco - Fortress Balance Sheet Conservative, Low Cost of Capital Financing Strategy Over $4.2 Billion of liquidity ~$11 Billion of unencumbered assets Investment grade credit rating of Baa2/BBB/BBB (recently reaffirmed by all agencies post-DC spin announcement) (1) Includes $116MM for the Bowen Building currently held on VNO’s revolver. (2) See page II for GAAP reconciliation. In millions unless noted VORNADO REMAINCO - FORTRESS BALANCE SHEET 12/31/2016 At 4Q16 Secured Debt 9,374 Unsecured Debt 1,341 Pro Rata Share of Non-Consolidated Debt (Excluding Toys R Us) 3,229 (666 5th (NYO POE) = 691) Less: Noncontrolling Interests' Share of Consolidated Debt (598) Total Debt 13,346 Less: Transferred to JBG SMITH(1) (1,470) 220 CPS (Mortgage + Term Loan) (1,325) 666 Fifth Avenue Office Debt (691) Less: Cash, Restricted Cash and Marketable Securities (1,803) Vornado RemainCo Net Debt 8,057 Vornado RemainCo Adjusted EBITDA (excluding 666 Fifth Avenue) (2) 1,203 (666 5th (NYO POE) = 28) Net Debt / EBITDA 6.7x (1) Includes $116MM for the Bowen building currently held at VNO's revolver. (2) See page __ for GAAP reconciliation NOT SHOWN: Unsecured Term Loan 375 Unsecured Credit Facilities 116 Vornado RemainCo Debt 9,860 VORNADO REMAINCO - FORTRESS BALANCE SHEET 12/31/2016 At 12/31/16 Secured Debt $ 9,374 Unsecured Debt 1,341 Pro Rata Share of Non-Consolidated Debt (Excluding Toys R Us) 3,229 (666 5th (NYO POE) = 691) Less: Noncontrolling Interests' Share of Consolidated Debt (598) Total Debt 13,346 Less: Transferred to JBG SMITH(1) (1,470) 220 CPS (Mortgage + Term Loan) (1,325) 666 Fifth Avenue Office Debt At Share (691) Cash, Restricted Cash and Marketable Securities (1,768) Vornado RemainCo Net Debt $ 8,092 Vornado RemainCo Adjusted EBITDA (excluding 666 Fifth Avenue Office) (2) $ 1,203 (666 5th (NYO POE) = 28) Net Debt / EBITDA 6.7x (1) Includes $116MM for the Bowen building currently held at VNO's revolver. (2) See page __ for GAAP reconciliation NOT SHOWN: Unsecured Term Loan 375 Unsecured Credit Facilities 116 Vornado RemainCo Debt 9,860 RemainCo Unencumbered EBITDA by Division (2Q16 Annualized) New York $436 Other 25 Total $461 Value @ 6.0% Cap Rate $7,683
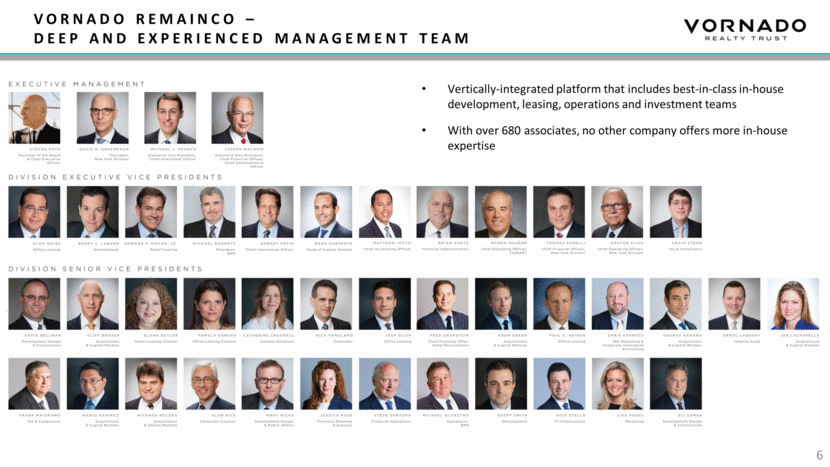
Vornado remainco – Deep and experienced management team 6 Vertically-integrated platform that includes best-in-class in-house development, leasing, operations and investment teams With over 680 associates, no other company offers more in-house expertise
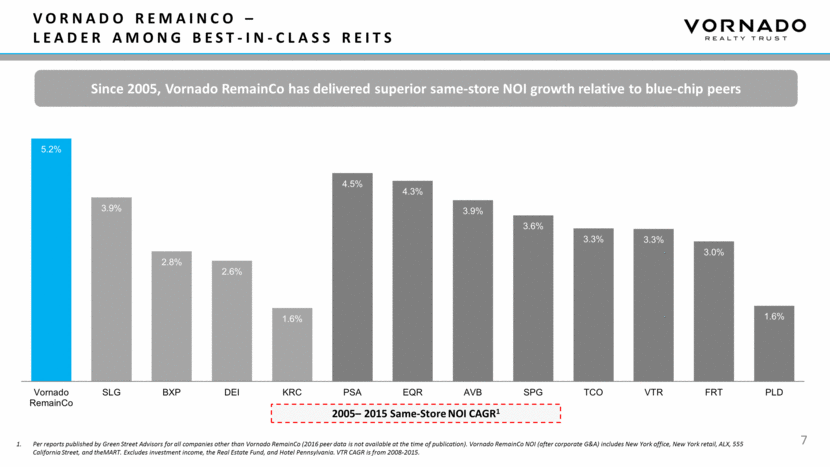
Vornado remainco – LEADER AMONG BEST-in-CLASS REITs Per reports published by Green Street Advisors for all companies other than Vornado RemainCo (2016 peer data is not available at the time of publication). Vornado RemainCo NOI (after corporate G&A) includes New York office, New York retail, ALX, 555 California Street, and theMART. Excludes investment income, the Real Estate Fund, and Hotel Pennsylvania. VTR CAGR is from 2008-2015. Since 2005, Vornado RemainCo has delivered superior same-store NOI growth relative to blue-chip peers 2005– 2015 Same-Store NOI CAGR1 7 5.2% 3.9% 2.8% 2.6% 1.6% 4.5% 4.3% 3.9% 3.6% 3.3% 3.3% 3.0% 1.6% Vornado RemainCo SLG BXP DEI KRC PSA EQR AVB SPG TCO VTR FRT PLD
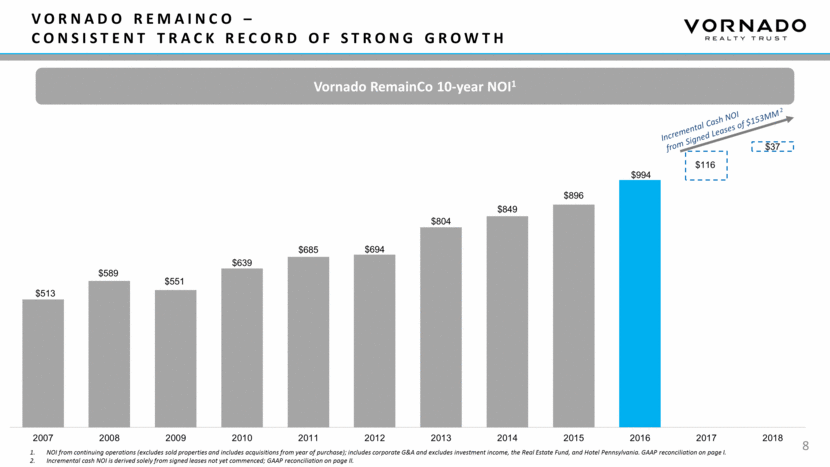
Vornado Remainco – consistent track record of strong growth 2006 – 2016 NOI CAGR (3) : 9.5% NOI from continuing operations (excludes sold properties and includes acquisitions from year of purchase); includes corporate G&A and excludes investment income, the Real Estate Fund, and Hotel Pennsylvania. GAAP reconciliation on page I. Incremental cash NOI is derived solely from signed leases not yet commenced; GAAP reconciliation on page II. Vornado RemainCo 10-year NOI1 Incremental Cash NOI from Signed Leases of $153MM 2 8 NOI from continuing operations (excludes sold properties and includes acquisitions from year of purchase); includes corporate G&A and excludes investment income, the Real Estate Fund, and Hotel Pennsylvania. GAAP reconciliation on page I. Incremental cash revenue is derived solely from signed leases not yet commenced; GAAP reconciliation on page II. The aggregate of the $153MM is the same as the $114MM shown on page 5 because the starting point is 2016 NOI vs. Q4 Annualized NOI on page 5. $396 $510 $585 $547 $635 $686 $689 $799 $874 $891 $959 $18 $117 $38 2006 2007 2008 2009 2010 2011 2012 2013 2014 2015 LTM as of 9/30/16 2017 2018 $513 $589 $551 $639 $685 $694 $804 $849 $896 $994 $116 $37 2007 2008 2009 2010 2011 2012 2013 2014 2015 2016 2017 2018
Vornado remainco – Premier New York city platform NYC Gross Office Rents (PSF)2 NYC Trophy Office Buildings Square Feet (in MM’s) of Buildings With Signed Office Leases >$100 PSF Since 20133 NYC Gross Asset Value (GAV) (in BN’s)1 (Per Green Street Advisors) Notes All company information per 1Q16 public filings (note that PGRE combines retail and office). VNO figure excludes Penn Plaza and includes 731 Lex (ALX) All company information per 1Q16 public filings. Boston Properties is based on % of Revenue For all companies, represents information based upon analysis completed by Green Street Advisors as of August 2016, pro forma for SLG announced JV on 11 Madison. For all companies, represents information based upon analysis completed by Green Street Advisors, prepared for VNO in August 2016, pro forma for SLG announced JV on 11 Madison; does not include structured finance / mezzanine loans. Information for all companies per 4Q16 public filings where available (BXP and PGRE include retail), square footage for all companies reflected at 100% share. Data based on brokerage reports. 9 $78 $60 $102 $76 $68 $51 Vornado excluding Penn Plaza Vornado Penn Plaza Boston Properties Paramount SL Green Empire State $25.0 $20.9 $10.7 $7.0 $6.4 Vornado SL Green Boston Properties Empire State Paramount 6.9 7.9 4.2 0.5 0.0 Vornado Boston Properties SL Green Paramount Empire State $79 $60 $102 $76 $69 $51 Vornado excluding Penn Plaza Vornado Penn Plaza Boston Properties Paramount SL Green Empire State
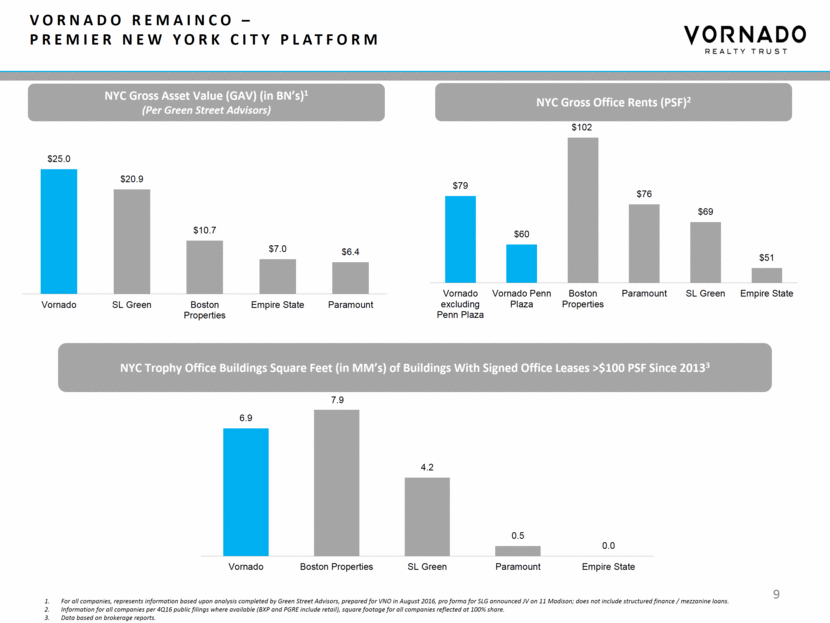
Vornado remainco – Premier New York city platform (continued) For all companies except Vornado, represents information based upon analysis by Green Street Advisors prepared for VNO in August 2016; residential NOI included in Office NOI; represents 2Q16 NOI annualized for all companies except VNO. VNO data based on brokerage reports. Represents the New York component of the $153MM incremental cash NOI from signed leases not yet commenced (as shown in the table on page 8), of which $99.3 million is attributable to New York Office and $35.3 million is attributable to New York Retail. FYE as of 12/31/2016; office NOI includes residential NOI and VNO’s share of ALX. GAAP reconciliation on page I. Pro forma for SLG announced JV on 11 Madison. BXP and PGRE do not break out office/retail NOI Number of Buildings with Signed Retail Leases >$1,000 PSF Since 20132 NYC NOI (Office / Retail, in MM’s )1 Vornado is the only REIT with significant NYC high street retail holdings and the only publicly investable high street retail portfolio of scale 4 5 10 Office NOI Retail NOI $911 $602 $669 $430 $209 $234 $309 $51 $99 $135 3 $720 $430 $308 $234 Vornado SL Green Boston Properties Empire State Paramount 6 6 15 8 2 1 0 Vornado SL Green Boston Properties Paramount Empire State
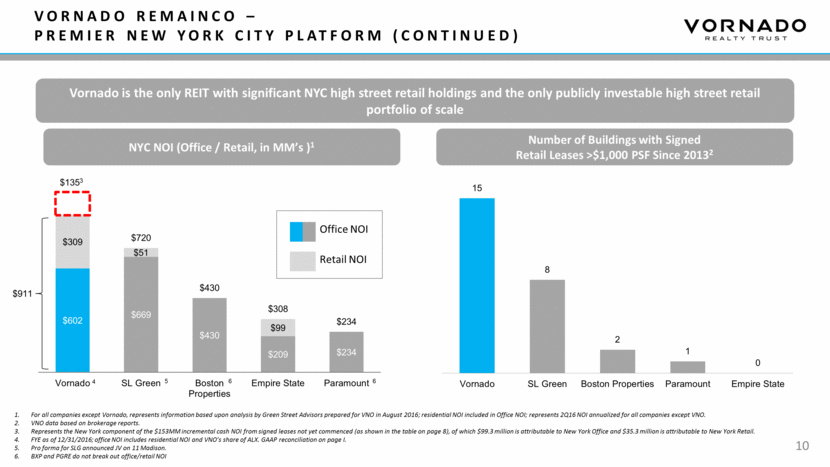
Vornado remainco – Select new York CITY office properties 11
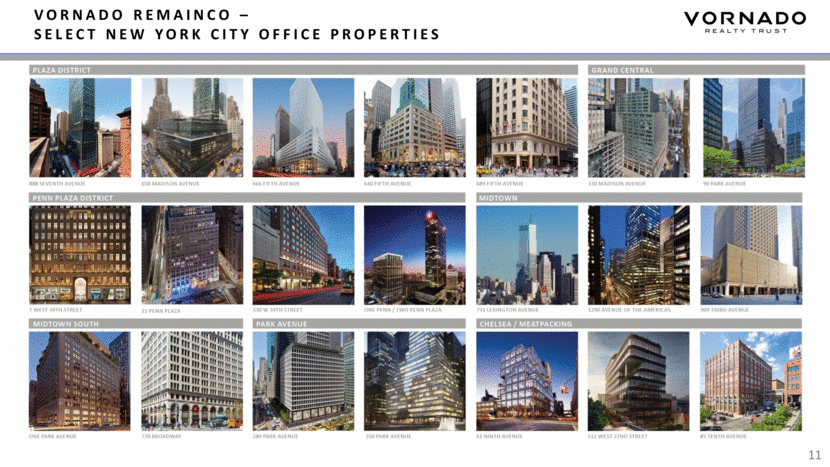
12 Vornado remainco – Blue-chip OFFICE tenant roster
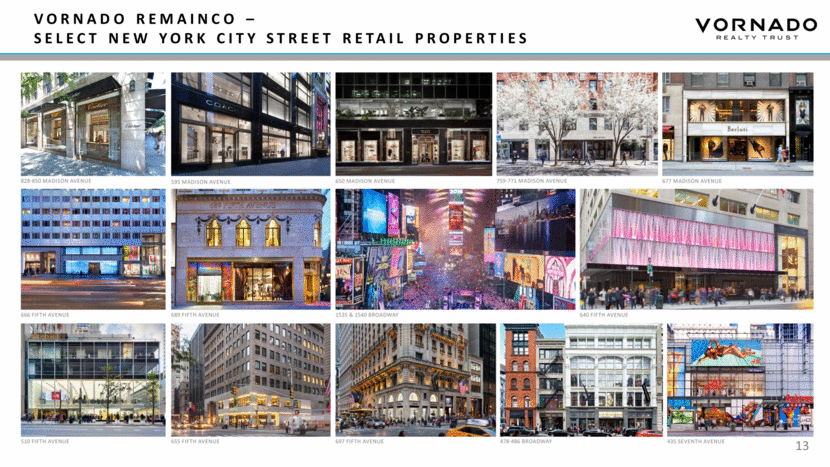
Vornado remainco – Select new York City street retail properties 13
14 Vornado remainco – Blue-chip retail tenant roster

15 Vornado remainco – Control of the key high Street RETAIL submarkets In Manhattan 1540 Broadway 1535 Broadway Control both sides of the bowtie UPPER FIFTH AVENUE - OWN 23% OF FRONTAGE1 TIMES SQUARE Note Excludes churches, clubs and retail owned by users.
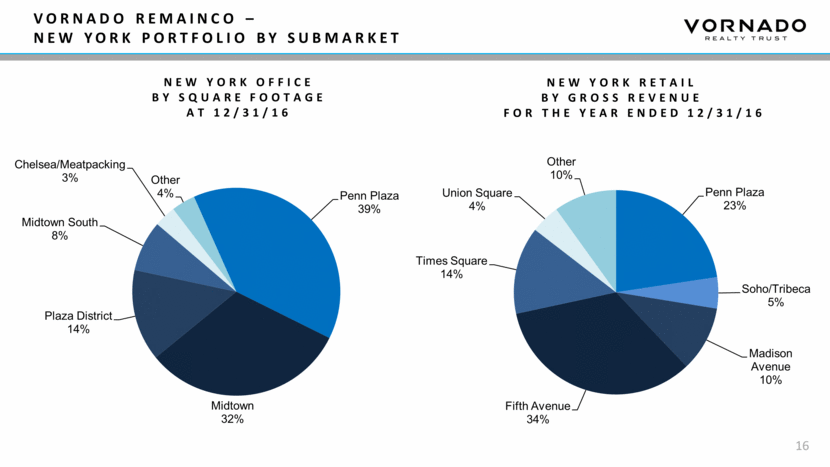
16 Vornado Remainco – New York Portfolio by Submarket New York Office By Square footage At 12/31/16 New York Retail By Gross revenue For the Year ended 12/31/16 Penn Plaza 39% Midtown 32% Plaza District 14% Midtown South 8% Chelsea/Meatpacking 3% Other 4% Penn Plaza 23% Soho/Tribeca 5% Madison Avenue 10% Fifth Avenue 34% Times Square 14% Union Square 4% Other 10%
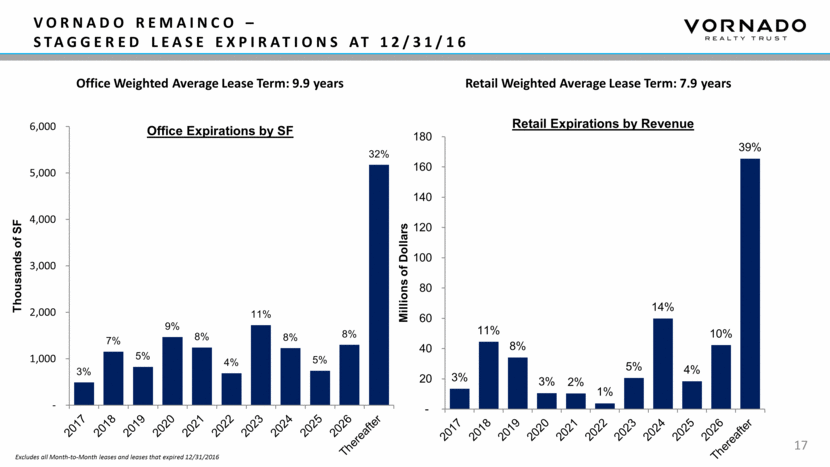
17 Vornado remainco – Staggered Lease expirations at 12/31/16 Backup for schedules & WALTS from “Supplemental ‘Q4 16 NYO – Residential Breakout (values) v6 Office Weighted Average Lease Term: 9.9 years Retail Weighted Average Lease Term: 7.9 years Excludes all Month-to-Month leases and leases that expired 12/31/2016 3% 4% 10% 8% 3% 3% 1% 5% 14% 4% 10% 37% 0 30 60 90 120 150 180 Millions of Dollars Retail Expirations by Revenue 1% 4% 7% 5% 9% 8% 4% 11% 8% 5% 8% 31% 0 1,000 2,000 3,000 4,000 5,000 6,000 Thousands of SF Office Expirations by SF 3% 7% 5% 9% 8% 4% 11% 8% 5% 8% 32% - 1,000 2,000 3,000 4,000 5,000 6,000 Thousands of SF Office Expirations by SF 3% 11% 8% 3% 2% 1% 5% 14% 4% 10% 39% - 20 40 60 80 100 120 140 160 180 Millions of Dollars Retail Expirations by Revenue
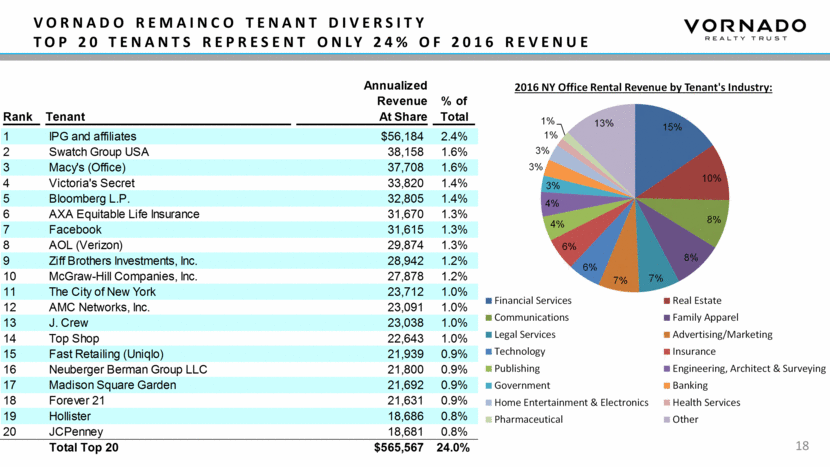
18 Vornado remainco Tenant Diversity Top 20 tenants represent only 24% of 2016 revenue Annualized Revenue % of Ties to Supp adj for DC? Office Industry Concentration – 10k pg 28 Rank Tenant At Share Total Industry % % Grossed Up 1 IPG and affiliates $56,184 2.4% Yes Financial Services 11% 15% 2 Swatch Group USA 38,158 1.6% Yes Real Estate 7% 10% 3 Macy's (Office) 37,708 1.6% Yes Communications 6% 8% 4 Victoria's Secret 33,820 1.4% Yes Family Apparel 6% 8% 5 Bloomberg L.P. 32,805 1.4% Yes Legal Services 5% 7% 6 AXA Equitable Life Insurance 31,670 1.3% Yes Advertising/Marketing 5% 7% 7 Facebook 31,615 1.3% Yes Technology 4% 6% 8 AOL (Verizon) 29,874 1.3% Yes Insurance 4% 6% 9 Ziff Brothers Investments, Inc. 28,942 1.2% Yes Publishing 3% 4% 10 McGraw-Hill Companies, Inc. 27,878 1.2% Yes Engineering, Architect & Surveying 3% 4% 11 The City of New York 23,712 1.0% Yes Government 2% 3% 12 AMC Networks, Inc. 23,091 1.0% Yes Banking 2% 3% 13 J. Crew 23,038 1.0% Yes Home Entertainment & Electronics 2% 3% 14 Top Shop 22,643 1.0% Yes Health Services 1% 1% 15 Fast Retailing (Uniqlo) 21,939 0.9% Yes Pharmaceutical 1% 1% 16 Neuberger Berman Group LLC 21,800 0.9% Yes Other 9% 13% 17 Madison Square Garden 21,692 0.9% Yes Total 71% 100% 18 Forever 21 21,631 0.9% Yes 19 Hollister 18,686 0.8% Yes 20 JCPenney 18,681 0.8% Yes Total Top 20 $565,567 24.0% Total Portfolio 2,352,356 21-39 21 Pricewaterhouse Coopers 16,884 Yes 22 Kmart Corporation 13,703 Ties to Top 30 Q4 POE N/A 23 Alston & Bird 13,564 Ties to Top 30 Q4 POE N/A 24 New York & Company 13,153 Ties to Top 30 Q4 POE N/A 25 Hennes & Mauritz 12,147 Ties to Top 30 New York 26 Bryan Cave 12,108 ASK MROSZKOWKI – doesn't tie to either N/A 27 Information Builders, Inc 10,771 ASK MROSZKOWKI – close tie to POE minus DC N/A 28 Cushman & Wakefield 11,086 Ties to Top 30 Q4 POE + Submeter N/A 29 Parsons Brinckerhoff Inc 10,561 Ties to Top 30 Q4 POE N/A 30 Forest Laboratories 9,870 ASK MROSZKOWKI - doesnt tie to either N/A Totals 123,848 N/A 15% 10% 8% 8% 7% 7% 6% 6% 4% 4% 3% 3% 3% 1% 1% 13% 2016 NY Office Rental Revenue by Tenant's Industry: Financial Services Real Estate Communications Family Apparel Legal Services Advertising/Marketing Technology Insurance Publishing Engineering, Architect & Surveying Government Banking Home Entertainment & Electronics Health Services Pharmaceutical Other
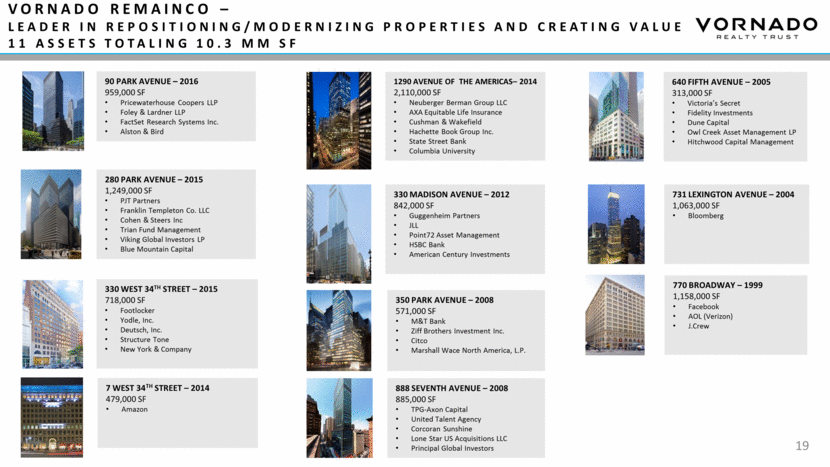
888 seventh avenue – 2008 885,000 SF TPG-Axon Capital United Talent Agency Corcoran Sunshine Lone Star US Acquisitions LLC Principal Global Investors 350 park avenue – 2008 571,000 SF M&T Bank Ziff Brothers Investment Inc. Citco Marshall Wace North America, L.P. 330 Madison avenue – 2012 842,000 SF Guggenheim Partners JLL Point72 Asset Management HSBC Bank American Century Investments 1290 Avenue OF the Americas– 2014 2,110,000 SF Neuberger Berman Group LLC AXA Equitable Life Insurance Cushman & Wakefield Hachette Book Group Inc. State Street Bank Columbia University 731 Lexington avenue – 2004 1,063,000 SF Bloomberg 280 park avenue – 2015 1,249,000 SF PJT Partners Franklin Templeton Co. LLC Cohen & Steers Inc Trian Fund Management Viking Global Investors LP Blue Mountain Capital 90 park avenue – 2016 959,000 SF Pricewaterhouse Coopers LLP Foley & Lardner LLP FactSet Research Systems Inc. Alston & Bird 640 fifth avenue – 2005 313,000 SF Victoria’s Secret Fidelity Investments Dune Capital Owl Creek Asset Management LP Hitchwood Capital Management 770 Broadway – 1999 1,158,000 SF Facebook AOL (Verizon) J.Crew Vornado remainco – Leader in repositioning/modernizing Properties and creating value 11 Assets totaling 10.3 MM SF 330 West 34th Street – 2015 718,000 SF Footlocker Yodle, Inc. Deutsch, Inc. Structure Tone New York & Company 7 West 34th Street – 2014 479,000 SF Amazon 19
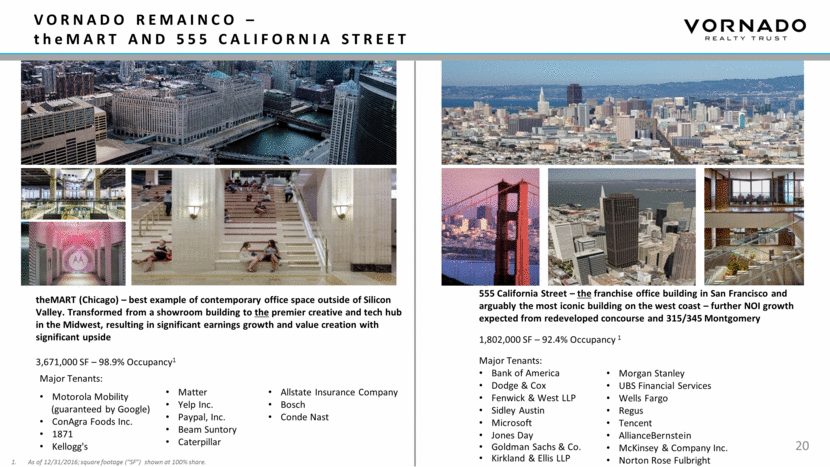
VORNADO REMAINCO – theMART and 555 CALIFORNIA Street As of 12/31/2016; square footage (“SF”) shown at 100% share. theMART (Chicago) – best example of contemporary office space outside of Silicon Valley. Transformed from a showroom building to the premier creative and tech hub in the Midwest, resulting in significant earnings growth and value creation with significant upside 3,671,000 SF – 98.9% Occupancy1 555 California Street – the franchise office building in San Francisco and arguably the most iconic building on the west coast – further NOI growth expected from redeveloped concourse and 315/345 Montgomery 1,802,000 SF – 92.4% Occupancy 1 Major Tenants: Bank of America Dodge & Cox Fenwick & West LLP Sidley Austin Microsoft Jones Day Goldman Sachs & Co. Kirkland & Ellis LLP Morgan Stanley UBS Financial Services Wells Fargo Regus Tencent AllianceBernstein McKinsey & Company Inc. Norton Rose Fulbright Matter Yelp Inc. Paypal, Inc. Beam Suntory Caterpillar 20 Major Tenants: Motorola Mobility (guaranteed by Google) ConAgra Foods Inc. 1871 Kellogg's Allstate Insurance Company Bosch Conde Nast
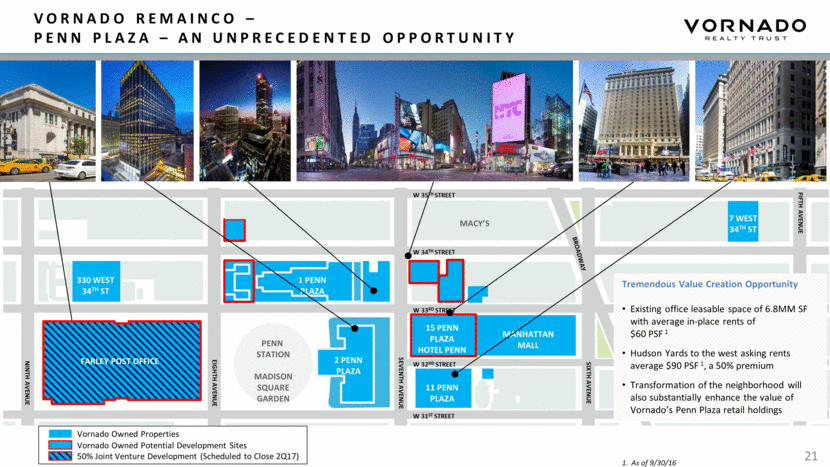
Vornado remainco – PENN PLAZA – an unprecedented opportunity As of 9/30/16 W 35TH STREET MACY’S W 34TH STREET W 33RD STREET W 32ND STREET W 31ST STREET SIXTH AVENUE FIFTH AVENUE SEVENTH AVENUE EIGHTH AVENUE NINTH AVENUE 330 WEST 34TH ST 1 PENN PLAZA 2 PENN PLAZA FARLEY POST OFFICE 11 PENN PLAZA 15 PENN PLAZA HOTEL PENN MANHATTAN MALL PENN STATION MADISON SQUARE GARDEN 7 WEST 34TH ST BROADWAY Tremendous Value Creation Opportunity Existing office leasable space of 6.8MM SF with average in-place rents of $60 PSF 1 Hudson Yards to the west asking rents average $90 PSF 1, a 50% premium Transformation of the neighborhood will also substantially enhance the value of Vornado’s Penn Plaza retail holdings Vornado Owned Properties Vornado Owned Potential Development Sites 50% Joint Venture Development (Scheduled to Close 2Q17) FARLEY POST OFFICE 21
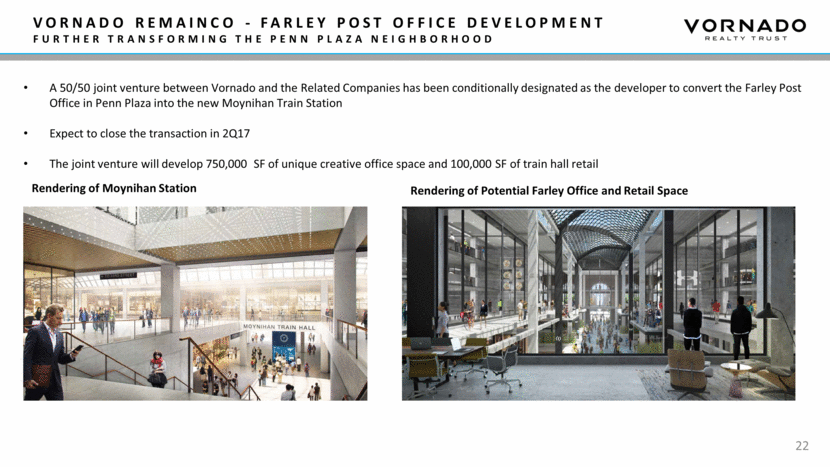
Vornado remainco - Farley post office development Further Transforming the penn plaza neighborhood 22 A 50/50 joint venture between Vornado and the Related Companies has been conditionally designated as the developer to convert the Farley Post Office in Penn Plaza into the new Moynihan Train Station Expect to close the transaction in 2Q17 The joint venture will develop 750,000 SF of unique creative office space and 100,000 SF of train hall retail Rendering of Moynihan Station Rendering of Potential Farley Office and Retail Space
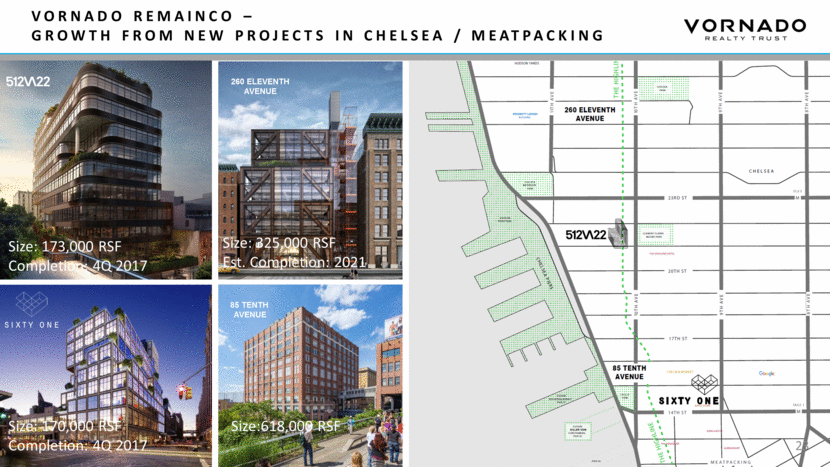
Vornado remainco – Growth from new Projects in Chelsea / meatpacking 85 TENTH AVENUE 23 Size: 173,000 RSF Completion: 4Q 2017 Size: 170,000 RSF Completion: 4Q 2017 Size:618,000 RSF 260 ELEVENTH AVENUE Size: 325,000 RSF Est. Completion: 2021
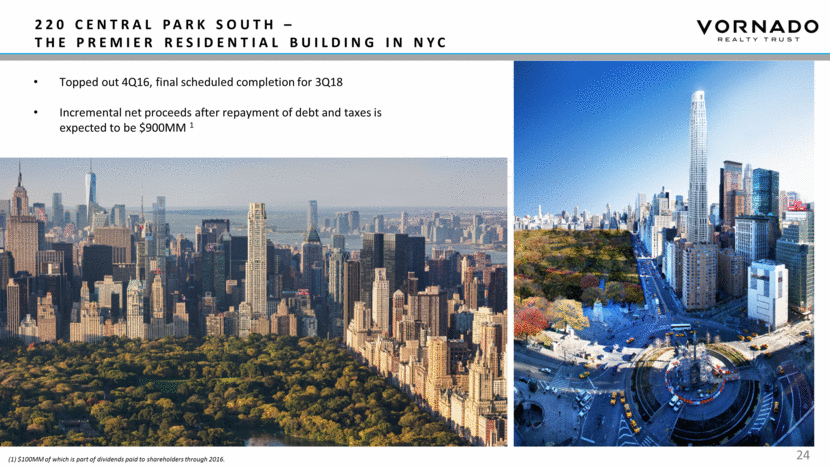
220 Central Park south – the premier residential building in NYC 24 Topped out 4Q16, final scheduled completion for 3Q18 Incremental net proceeds after repayment of debt and taxes is expected to be $900MM 1 (1) $100MM of which is part of dividends paid to shareholders through 2016.
Global Real Estate Sustainability Benchmark (GRESB) “Green Star” Achieved 2016 NAREIT Leader in the Light Award Recipient, 2010 through 2016 4.8% reduction in same-store energy use, 2015 to 2016, representing over 18,500 tons of carbon emissions 30 Million Square Feet of Owned and Managed LEED Certified Buildings Nationwide. Largest Landlord of LEED Certified Buildings in New York City with 13 Million Square Feet. All New Commercial Developments will be LEED Certified. 25 VORNADO REMAINCO – SUSTAINABILITY PROGRAMS AND POLICIES VORNADO REMAINCO – LEADER IN SUSTAINABILITY
Asset-specific carbon emissions reduction goals, ranging from 30-50% reduction of Landlord-controlled energy by 2026 below a 2009 baseline, measured in metric tons CO2e / SF, in partnership with New York City’s 80 x 50 Initiative. Energy Efficiency Capital Improvement Program, dedicating funds to projects with measurable utility cost savings. Projects have achieved cumulative annual savings of over $8.6 million since 2012. Industry-leading green cleaning program, utilizing a procurement and purchasing strategy that achieves over 80% of purchases with certifications designated by UL EcoLogo, Green Seal, and EPA procurement programs. Broad stakeholder engagement with our tenant base, including semi-annual Tenant Roundtables; interactive feedback on submetered tenant energy consumption through our Energy Information Portal; Landlord support for Tenant LEED and WELL certification efforts. 26 VORNADO REMAINCO – SUSTAINABILITY PROGRAMS AND POLICIES
Appendix
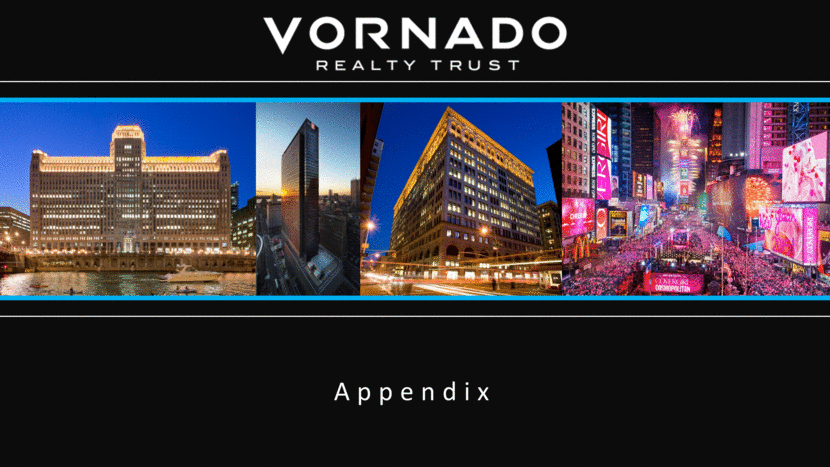
GAAP Reconciliation Includes income from sold properties, gains on sale of real estate, impairment losses, and other adjustments. Includes interest on mezzanine debt, dividends on marketable securities, income on corporate investments and other adjustments. Reconciliation of Vornado Net Income to EBITDA, EBITDA, as adjusted and Cash Net Operating Income for the twelve months ended December 31, for the fiscal years 2007 through 2016 I All #’s in MM’s 2016 2015 2014 2013 2012 2011 2010 2009 2008 2007 NYC Only Net income attributable to the Operating Partnership 961 $ 804 $ 913 $ 501 $ 663 $ 718 $ 703 $ 131 $ 415 $ 611 $ 546 $ Interest and debt expense 507 470 654 759 761 798 828 827 822 853 281 Depreciation and amortization 694 665 686 733 735 778 729 729 711 677 436 Income tax expense (benefit) 12 (85) 24 26 7 5 (23) 10 (142) 4 6 EBITDA 2,174 1,853 2,277 2,019 2,165 2,298 2,238 1,697 1,805 2,146 1,269 Adjustments, net (1) (653) (354) (859) (661) (954) (1,083) (1,077) (602) (665) (1,015) (163) EBITDA, as adjusted 1,521 1,499 1,418 1,357 1,211 1,216 1,161 1,095 1,139 1,131 1,106 Income from Real Estate Fund 21 (34) (70) (50) (25) (9) (1) 0 0 0 0 Hotel Pennsylvania (10) (23) (31) (30) (28) (30) (24) (15) (42) (38) (10) Interest and other investment income, net (2) (6) (7) (6) (24) (25) (41) (37) (66) (110) (179) 0 Washington, DC segment (291) (291) (290) (296) (304) (338) (337) (308) (287) (268) 0 VNO RemainCo EBITDA, as adjusted (excl. Real Estate Fund, Hotel Penn & DC segment) 1,236 1,145 1,020 958 829 797 764 707 700 645 1,096 Non-cash adjustments: Equity based compensation 29 34 30 29 25 22 25 12 25 20 6 Equity earnings on ALX in excess of dividend (20) (20) (23) (24) (22) (28) (28) (38) (28) (44) (20) Straight-line, FAS 141 and other (212) (237) (162) (136) (116) (83) (101) (130) (108) (107) (171) EBITDA of 85 Tenth Avenue (39) (26) (17) (22) (23) (22) (21) 0 0 0 0 VNO RemainCo NOI (excl. Real Estate Fund, Hotel Penn & DC segment) 994 $ 896 $ 849 $ 804 $ 694 $ 685 $ 639 $ 551 $ 589 $ 513 $ 911 $
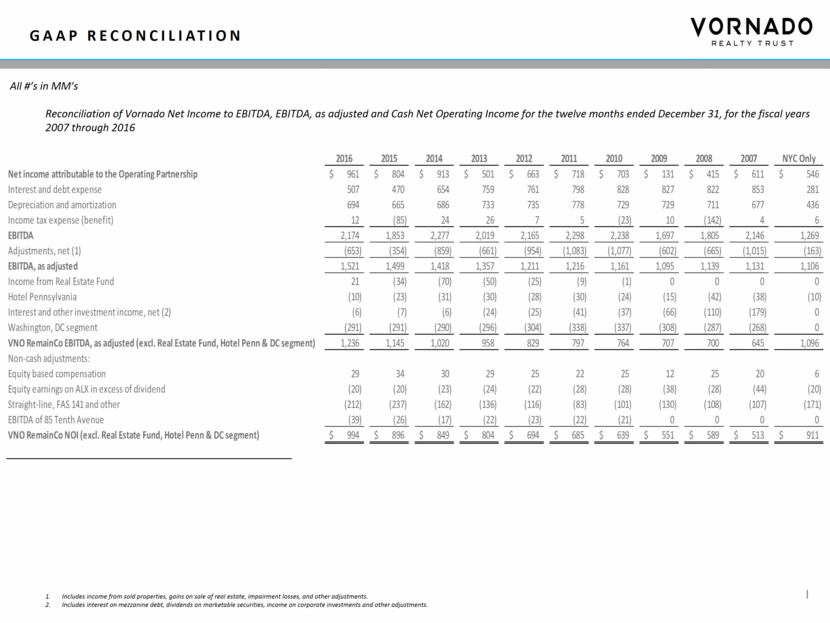
GAAP Reconciliation (Cont’d) Reconciliation of Vornado RemainCo’s Total Incremental Revenue to Cash Incremental Revenue attributable to leases signed, but not yet commenced, for the twelve months ended December 31, 2017 and 2018 Reconciliation of Vornado Net Income to EBITDA and EBITDA, as adjusted for the twelve months ended December 31, 2016 II Includes income from sold properties, gains on sale of real estate, impairment losses and other adjustments. All #’s in MM’s Total New York Other Net income (loss) attributable to Vornado 346,700 432,962 (86,262) Net income attributable to NCI in the Operating Partnership 11,410 - 11,410 Interest and debt expense 313,860 208,683 105,177 Depreciation and amortization 402,034 331,448 70,586 Income tax expense 10,287 4,424 5,863 EBITDA 1,084,291 977,517 106,774 Real estate impairment losses 5,536 - 5,536 Net gains on sale of real estate and residential condos (163,066) (159,511) (3,555) Acquisition and transaction related costs 11,319 - 11,319 EBITDA from discontinued operations and a sold property (9,293) (3,120) (6,173) Other - - - Adj. EBITDA 928,787 814,886 113,901 Total New York Other Net income (loss) attributable to Vornado 235,536 272,620 (37,084) Net income attributable to NCI in the Operating Partnership 15,042 - 15,042 Interest and debt expense 101,145 64,347 36,798 Depreciation and amortization 127,632 105,131 22,501 Income tax expense (276) 1,398 (1,674) EBITDA 479,079 443,496 35,583 Real estate impairment losses 4,141 - 4,141 Net gains on sale of real estate and residential condos (146,924) (142,693) (4,231) Acquisition and transaction related costs 4,951 - 4,951 EBITDA from discontinued operations and a sold property (20,735) (18,734) (2,001) Other (1,375) - (1,375) Adj. EBITDA 319,137 282,069 37,068 Total New York Other RemainCo Net income (loss) 582 706 (123) Net income attributable to NCI in the Operating Partnership 26 - 26 Interest and debt expense 415 273 142 Depreciation and amortization 530 437 93 Income tax expense 10 6 4 EBITDA 1,563 1,421 142 Real estate impairment losses 10 - 10 Net gains on sale of real estate and residential condos (310) (302) (8) Acquisition and transaction related costs 16 - 16 EBITDA from discontinued operations and a sold property (30) (22) (8) Other (1) - (1) RemainCo Adj. EBITDA 1,248 1,097 151 Nine Months Ended September 30, 2016 Three Months Ended 12/31/15 LTM Ended Sepember 30, 2016 ($MM) 2017 $38 $78 $116 2018 8 29 37 Total $46 $107 $153 Straight-Line Rent Adj. Cash Incremental GAAP Incremental Revenue 2016 Net income attributable to the Operating Partnership 961 Interest and debt expense 507 Depreciation and amortization 694 Income tax expense 12 EBITDA 2,174 Adjustments, net (1) (653) EBITDA, as adjusted 1,521 Washington, DC segment (291) 666 5th (NYO POE) (28) VNO RemainCo (excluding 666 Fifth Avenue Office) 1,203
March 2017

