Attached files
| file | filename |
|---|---|
| 8-K - FORM 8-K 03/03/2017 - KITE REALTY GROUP TRUST | form8k_03032017.htm |

INVESTOR UPDATE
MARCH 2017
City Center (White Plains, NY)
Eddy Street Commons (South Bend, IN)
© 2017 Kite Realty Group kiterealty.com Investor Update | 2
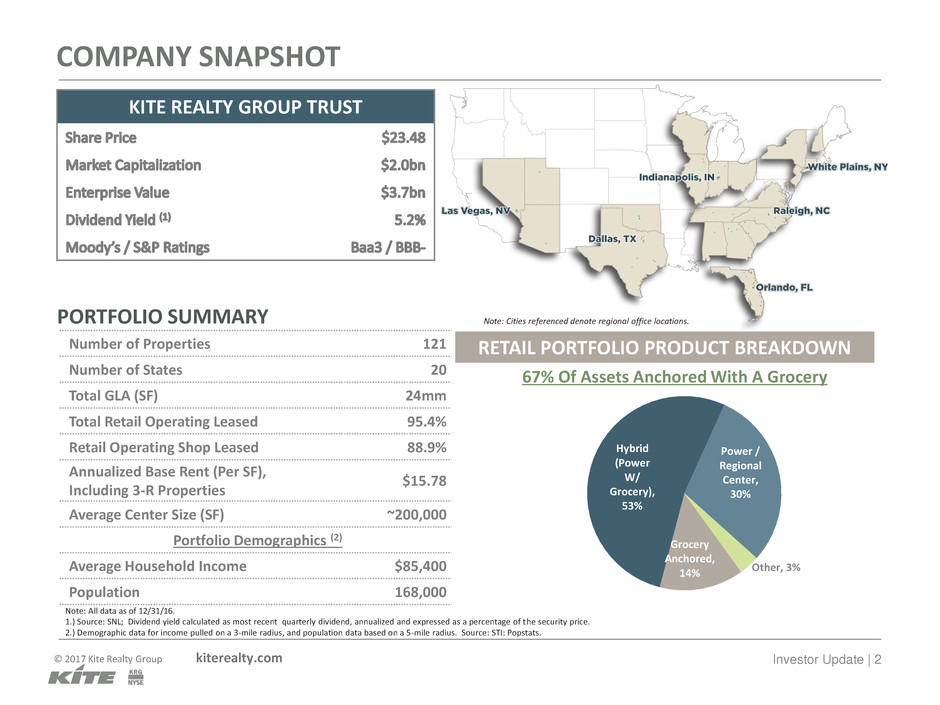
COMPANY SNAPSHOT
KITE REALTY GROUP TRUST
Note: All data as of 12/31/16.
1.) Source: SNL; Dividend yield calculated as most recent quarterly dividend, annualized and expressed as a percentage of the security price.
2.) Demographic data for income pulled on a 3-mile radius, and population data based on a 5-mile radius. Source: STI: Popstats.
Note: Cities referenced denote regional office locations.
Number of Properties 121
Number of States 20
Total GLA (SF) 24mm
Total Retail Operating Leased 95.4%
Retail Operating Shop Leased 88.9%
Annualized Base Rent (Per SF),
Including 3-R Properties
$15.78
Average Center Size (SF) ~200,000
Portfolio Demographics (2)
Average Household Income $85,400
Population 168,000
PORTFOLIO SUMMARY
RETAIL PORTFOLIO PRODUCT BREAKDOWN
67% Of Assets Anchored With A Grocery
Grocery
Anchored,
14%
Hybrid
(Power
W/
Grocery),
53%
Power /
Regional
Center,
30%
Other, 3%

© 2017 Kite Realty Group kiterealty.com Investor Update | 3
KITE’S CORE MODEL INTERTWINED IN ALL ASPECTS
CORPORATE IDENTITY
& OPERATIONS
HIGH-QUALITY
PORTFOLIO
PORTFOLIO
TRANSFORMATION
INVESTMENT GRADE
BALANCE SHEET
Long-serving,
experienced
management team
Community
involvement
Top-tier operating
metrics
Historical same-
property NOI
growth of ~4.2%
since 2013
92% internet
resistant / omni-
channel
Need-based and
value oriented
retailers
Over 70% ABR
coming from top
50 MSAs
Highly-trafficked
centers; over 67%
of assets grocery
anchored
History of creating
synergies, driving
growth
Expected net seller
in 2017 of $45-
$55mm
Enhancing assets
via the 3-Rs;
Redevelop,
Reposition,
Repurpose
~$45mm in annual
free cash flow
Only ~$90mm in
debt maturities
through 2020
7% floating rate
debt exposure
Fixed charge
coverage of 3.3x
Target net debt /
adjusted EBITDA of
low 6x
KITE’S CORE MODEL IS THE FOUNDATION FOR ACHIEVING SUCCESS IN THE FOLLOWING AREAS:

© 2017 Kite Realty Group kiterealty.com Investor Update | 4
KITE PROVIDES ATTRACTIVE INVESTMENT OPPORTUNITY
1.) Source: SNL Financial; Total Return (RMS Index) and implied dividend contribution (estimated as RMS less RMZ index) from December 2009 – December 2016.
2.) 2017E FFO per share refers to consensus estimate for companies as of February 2017 per FactSet, which may not reflect the Company’s or the applicable peer company’s estimates. FFO Payout Ratio calculated as most
recent dividends divided by 2017E FFO, on a per share basis. Dividends are determined solely by the Company’s Board of Trustees.
59.3%
BRX EQY REG KRG WRI RPAI DDR FRT ROIC KIM AKR
Peer Group Median 65.3%
DIVIDEND VS. 2017E FFO (2)
RELATIVELY MODEST FFO PAYOUT RATIO SUPPORTS FUTURE
DIVIDEND INCREASES
DISCOUNTED MULTIPLE SUPPORTS VALUATION THESIS
11.3x
KRG BRX DDR WRI RPAI KIM ROIC REG AKR EQY FRT
Peer Group Median 17.8x
PRICE VS. 2017E FFO (2)
40%
60% Dividend
ContributionPrice
Contribution
COMPONENTS OF TOTAL RETURN (1)
Historically, REITs’ total returns
have had an implied contribution
from dividends of ~40%

CORPORATE IDENTITY & OPERATIONS

© 2017 Kite Realty Group kiterealty.com Investor Update | 6
$1.70
$2.06
2010 2016
Transformed 82% of portfolio into higher-
quality assets since 2010 (1)
Obtained investment grade rating by Moody’s
and S&P (Baa3 / BBB-)
Increased free cash flow from less than
$10mm in 2010 to ~$45mm
Achieved cash dividend per share growth of
26% since 2010
Executed inaugural public debt offering in
2016
COMPANY AND PORTFOLIO TRANSFORMATION SINCE 2010
REVENUE GROWTH AND IMPROVED PORTFOLIO
QUALITY WHILE STRENGTHENING THE BALANCE SHEET
1.) Transformed defined as current portfolio GLA that has been acquired, recycled, redeveloped, or is currently being redeveloped since 2010.
2.) 2010 FFO adjusted for reverse stock split in 2014.
KITE MILESTONES
+~21%
FFO, As Adjusted (2)
9.1x
7.0x
2010 2016
~2x
lower
Small Shop Space Leased
$12.80
$15.78
2010 2016
Annualized Base Rent PSF (Including
3-R Properties)
+~23%
78.1%
88.9%
2010 2016
+ 1,080
bps
Net Debt / Adjusted EBITDA
© 2017 Kite Realty Group kiterealty.com Investor Update | 7
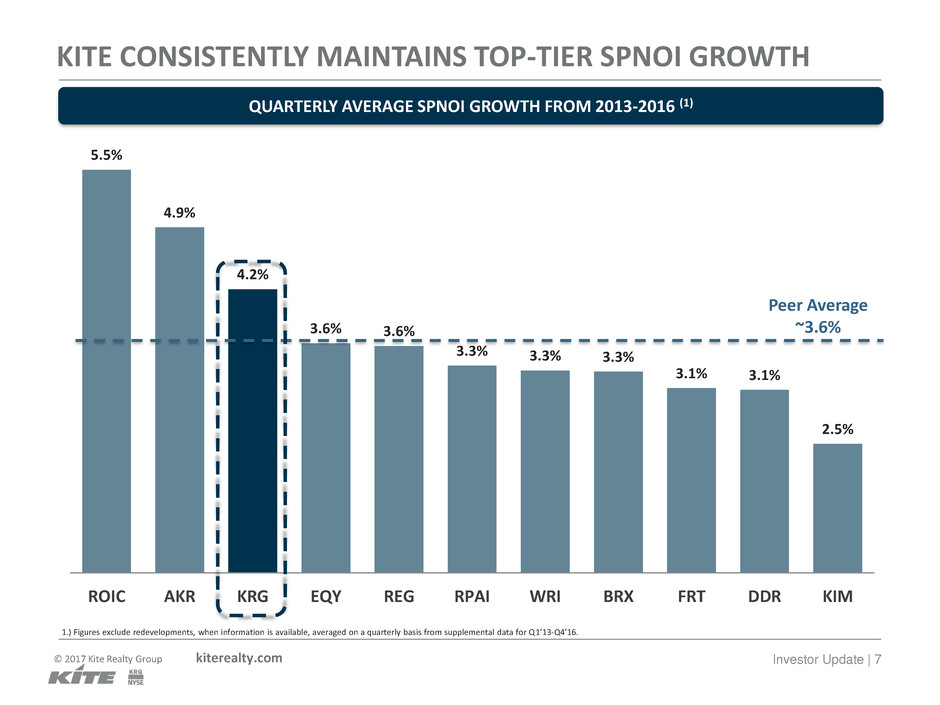
KITE CONSISTENTLY MAINTAINS TOP-TIER SPNOI GROWTH
5.5%
4.9%
4.2%
3.6% 3.6%
3.3% 3.3% 3.3%
3.1% 3.1%
2.5%
ROIC AKR KRG EQY REG RPAI WRI BRX FRT DDR KIM
QUARTERLY AVERAGE SPNOI GROWTH FROM 2013-2016 (1)
Peer Average
~3.6%
1.) Figures exclude redevelopments, when information is available, averaged on a quarterly basis from supplemental data for Q1’13-Q4’16.

© 2017 Kite Realty Group kiterealty.com Investor Update | 8
CONTINUED OPERATIONAL EFFICIENCIES WITHIN PORTFOLIO
83.4%
85.9%
89.5% 89.6%
89.0%
87.3%
90.1%
89.2%
95.4% 95.3% 95.2%
94.8% 94.9%
95.4% 95.2% 95.4%
Q2'13 Q4'13 Q2'14 Q4'14 Q2'15 Q4'15 Q2'16 Q4'16
% Recovery - Retail Portfolio % Leased - Retail Portfolio
1.) KRG Financial Supplementals 06/30/13 through 12/31/16.
INCREASE IN RETAIL PORTFOLIO RECOVERY RATIO A RESULT OF FAVORABLE LEASING ACTIVITY
AND EXPENSE CONTROL (1)
6.2%
12.0%

© 2017 Kite Realty Group kiterealty.com Investor Update | 9
SUSTAINABILITY AND CORPORATE RESPONSIBILITY
COMMITTED TO THE COMMUNITY
ENVIRONMENTALLY-CONSCIOUS INTIATIVES
TOTAL KITE ENVIRONMENTAL SAVINGS (1)
• Facilitate opportunities to meet the needs,
improve wellness, and enhance educational
experience for our community
• Surpassed 2016 goal of 2,560 hours of
employee volunteer time
• 30 employees on Community Commitment
and Wellness Committees
GOOD FOR THE ENVIRONMENT. GOOD FOR THE BUSINESS.
Mature Trees 202,210
Gallons of Oil 4,519,994
kWh’s of Energy 47,578,879
Cubic Yards Landfill Space 193,166
Gallons of H2O 83,263,040
Total Tons Recycled 11,894
SOLAR PANELS, BAYONNE CROSSING (NJ)
1.) Source: Deep Green Waste and Recycling and Keter Environmental statistics. Total environmental savings on a rolling 12-month period as of 12/31/16.

HIGH-QUALITY PORTFOLIO
© 2017 Kite Realty Group kiterealty.com Investor Update | 11
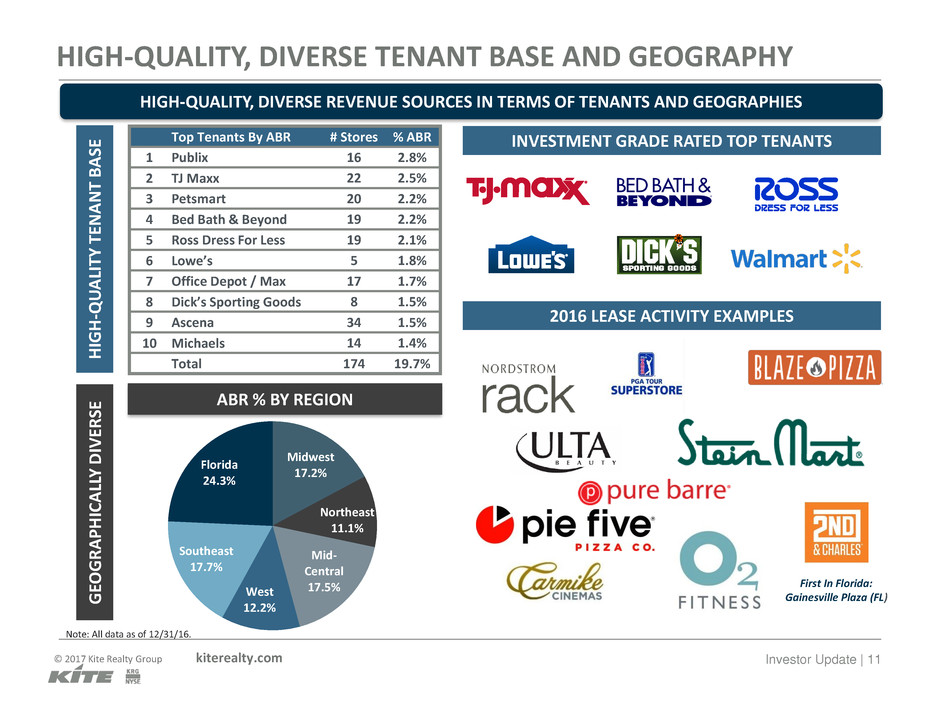
Midwest
17.2%
Northeast
11.1%
Mid-
Central
17.5%West
12.2%
Southeast
17.7%
Florida
24.3%
HIGH-QUALITY, DIVERSE TENANT BASE AND GEOGRAPHY
Top Tenants By ABR # Stores % ABR
1 Publix 16 2.8%
2 TJ Maxx 22 2.5%
3 Petsmart 20 2.2%
4 Bed Bath & Beyond 19 2.2%
5 Ross Dress For Less 19 2.1%
6 Lowe’s 5 1.8%
7 Office Depot / Max 17 1.7%
8 Dick’s Sporting Goods 8 1.5%
9 Ascena 34 1.5%
10 Michaels 14 1.4%
Total 174 19.7%
HI
G
H
-Q
U
A
LITY
TENANT
B
AS
E INVESTMENT GRADE RATED TOP TENANTS
G
EO
G
RAPHICA
LL
Y
DIVE
R
SE
2016 LEASE ACTIVITY EXAMPLES
First In Florida:
Gainesville Plaza (FL)
ABR % BY REGION
HIGH-QUALITY, DIVERSE REVENUE SOURCES IN TERMS OF TENANTS AND GEOGRAPHIES
Note: All data as of 12/31/16.

© 2017 Kite Realty Group kiterealty.com Investor Update | 12
ASSET QUALITY SUPPORTED BY MARKET DEMOGRAPHICS
ASSETS ACROSS THE TOP 5 MARKETS SUPERIORLY POSITIONED
Average Household Income ($000s)
Source: STI: Popstats; information based on a 3-mile radius for the KRG portfolio.
$75
$91
$87
$75
$84
$68
$65
$75
$69
$65
Florida Indiana Texas Nevada North Carolina
KRG Average Household Income State Average Household Income

© 2017 Kite Realty Group kiterealty.com Investor Update | 13
INTERNET RESISTANT 49.7%
SERVICES, ENTERTAINMENT 18.4%
GROCERY, SPECIALTY STORES 15.7%
RESTAURANTS 15.6%
OMNI-CHANNEL 42.1%
SOFT GOODS 18.1%
HOME IMPROVEMENT GOODS 10.6%
DISCOUNT RETAILERS 9.6%
SPORTING GOODS 3.8%
NON-RESISTANT 8.2%
ELECTRONICS / BOOKS 5.4%
OFFICE SUPPLIES 2.8%
NECESSITY DRIVEN AND INTERNET RESISTANT RETAILER BASE
1.) Data reflects Q4’16 Supplemental.
2.) Apparel tenants comprise just 56.7% of soft goods and 96.5% of discount retailers.
3.) Source: ICSC Article, June 2016: “In-Store vs. Online: Brick & Mortar is the Dominant Format.”
Internet
Resistant
49.7%
Omni-
channel
42.1%
Non-
Resistant
8.2%
TENANT TYPE COMPOSITION
KITE’S PORTFOLIO IS WELL-EQUIPPED TO MANAGE EVOLVING CONSUMER PREFERENCES (1)
CONSUMER TRENDS (3)
In-Store Online
Consumer Purchase / Month 7.5 times/mo. 2.2 times/mo.
Time Spent 54 min. 38 min.
Money Spent / Month $1,710 $247
Total Consumer Retail Purchases 87% 13%
Kite’s tenant base is 80% non-apparel (2) and
92% internet resistant / omni-channel

INVESTMENT GRADE BALANCE SHEET

© 2017 Kite Realty Group kiterealty.com Investor Update | 15
RESILIENT BALANCE SHEET
Moody’s / S&P Ratings: Baa3 / BBB-
Fixed Charge Coverage: 3.3x (1)
Net Debt / Adjusted EBITDA: 7.0x
Secured Debt / Undepreciated Total Assets: 16.9%
Unencumbered Assets / Total Assets: ~65%
Weighted Average Debt Maturity: 6.4 Years
1.) Fixed charge does not include capitalized interest.
2.) Excludes annual principal payments and net premiums on fixed rate debt.
ACTIONS TAKEN IN 2016
Repaid $400mm Term Loan maturing in 2020 with
new $200mm 5 year Term Loan and note proceeds
(see below)
Refinanced the $500mm Revolving Credit
Agreement, extending the maturity 2 years, reducing
interest rate and improving covenants
Repaid $165mm in CMBS debt and repaid the
Parkside Town Commons loan
Refinanced the Delray Marketplace construction
loan with a new 5 year loan
Issued an inaugural $300mm public offering of
Senior Unsecured Notes
Today, only ~$90mm debt maturing through 2020 (2)Cobblestone Plaza (FL)

© 2017 Kite Realty Group kiterealty.com Investor Update | 16
2010 2016
1.5x
higher
FURTHER ENHANCED FINANCIAL FLEXIBILITY
NET DEBT / ADJUSTED
EBITDA
2010 2016
FLOATING RATE EXPOSURE
21%
7%
-1,400 bps
FIXED CHARGE COVERAGE
2010 2016
7.0x
~2x
lower
9.1x
Continue to improve investment grade metrics
Continue to manage favorable debt maturity profile
Reduce leverage to low 6x by year-end 2018
Maintain floating rate debt exposure of 15% or less
BALANCE SHEET & OPERATIONAL INITIATIVES ON TRACK TO MEET STRATEGIC OBJECTIVES
1.8x
3.3x

© 2017 Kite Realty Group kiterealty.com Investor Update | 17
EFFICIENT FUNDING STRUCTURE RELATIVE TO PEERS
DDR BRX REG RPAI EQY ROIC WRI KRG RPT KIM
WEIGHTED AVERAGE MATURITIES SCHEDULE AND WEIGHTED AVERAGE INTEREST RATE
Weighted Average Interest Rate
6.4 Years
4.0%
Weighted Average Debt Maturity
Note: Peer data sourced from publicly available information as available as of 12/31/16 from each company’s supplemental.

© 2017 Kite Realty Group kiterealty.com Investor Update | 18
WELL-STAGGERED DEBT MATURITY PROFILE
SCHEDULE OF DEBT MATURITIES ($000s) (1)
7
39 45
170
215 215
11
80
200
200
95
80 75
300
2017 2018 2019 2020 2021 2022 2023 2024 2025 2026 2027+
Mortgage Debt Line of Credit Term Loan Private Placement Senior Unsecured Notes
1.) Data is as of 12/31/16. Chart excludes annual principal payments and net premiums on fixed rate debt.
Only ~$90mm of debt maturing through
2020

PORTFOLIO TRANSFORMATION

© 2017 Kite Realty Group kiterealty.com Investor Update | 20
3-R OPPORTUNITIES & IN-PROCESS REDEVELOPMENT PROJECTS
3-R PLATFORM
Redevelop: substantial renovations; e.g. teardowns,
remerchandising, exterior / interior improvements
Repurpose: substantial alterations including changing
the product-type
Reposition: less substantial asset enhancements,
generally $5mm or less of investment
10 3-R Opportunities; Est. Cost: ~$80mm-
$100mm
Redevelopment
Repurpose
3-R IN-PROCESS PROJECTS AND OPPORTUNITIES
2017
• Bolton Plaza, Phase II
• Castleton Crossing
• Centennial Gateway
• Market Street Village
• Northdale Promenade
• Portofino Shopping Center,
Phase I
• Trussville Promenade
2018
• Burnt Store Plaza
• City Center
• Portofino Shopping
Center, Phase II
62%
19%
19%Redevelopment
Reposition
Repurpose
Targeted Return: 9.0%-11.0%
10 In-Process Projects; Est. Cost: ~$62.3mm
EST. STABILIZATION PERIOD
Tarpon Bay Plaza (FL)

© 2017 Kite Realty Group kiterealty.com Investor Update | 21
PORTOFINO SHOPPING CENTER (HOUSTON, TX) CASE
STUDY: A TWO-PHASED PROJECT
PHASE I
Demolition/expansion of existing vacant space to
accommodate Nordstrom Rack and rightsizing
existing Old Navy store
Shop relocation and façade renovations to better
position existing space
Total Cost: $6.5-$7.5 million
% Total Cost Spent: 22%
Projected ROI: 8.0%-8.5%
Houston, TX
PHASE II
Addition of two small shop buildings on newly created
outparcels
Total Cost: $5.0-$6.0 million
% Total Cost Spent: 95%
Projected ROI: 8.5%-9.0%
3-Mile Demographics
Population: ~47,000
Average Household Income: ~$121,000
Tenant Lineup:

© 2017 Kite Realty Group kiterealty.com Investor Update | 22
CITY CENTER (WHITE PLAINS, NY): A CASE STUDY
Reactivating street-level retail and enhancing overall shopping experience
Located in a premier business district, ranked 5th in annual sales volume in New
York
Renovation complete in November 2016; anchor tenants were able to remain
open during the construction process
Total Cost: $17.0-$17.5 million
% Total Cost Spent: 71%
Projected ROI: 6.5%-7.0%
3-Mile Demographics
Population: ~109,000
Average Household Income: ~$146,000
Tenant Lineup:
SUMMARY
BEFORE
AFTER

© 2017 Kite Realty Group kiterealty.com Investor Update | 23
BOLTON PLAZA (JACKSONVILLE, FL): A CASE STUDY
Demolition of small shops to make way for a new Aldi
and a new Marshalls
Aldi construction set to commence and Marshalls
scheduled to open in Q1’17
Total Cost: $6.0-$7.0 million
% Total Cost Spent: 65%
Projected ROI: 9.0%-9.5%
3-Mile Demographics
Population: ~51,000
Average Household Income: ~$73,000
Tenant Lineup:
SUMMARY
COMPLETED MARSHALLSUNPRODUCTIVE SHOPS

© 2017 Kite Realty Group kiterealty.com Investor Update | 24
INTERNAL NOI GROWTH OPPORTUNITIES
2017 expected same-property NOI growth of 2-3% with additional growth from our current development
pipeline and future 3-R projects
Operating
Properties
Positive cash rent spread on renewals – goal of 8-10%
Lease-up opportunities
Increase shop occupancy to 90%
1% occupancy increase equates to ~$1mm of additional rent and recoveries
Operating expense savings
Overage rent increases
Ancillary income increases
Current
Development /
Redevelopment
Pipeline
Complete and stabilize development and 3-R projects in process
Projected annualized cash NOI of ~$9.9mm
Two current development projects totaling ~$90mm with ~$83mm incurred to date
Ten current 3-R projects totaling ~$60mm with a targeted yield of 9%-10%
Future 3-R
Projects
Ten future 3-R projects with a total cost of $80-$100mm
Projected annualized returns of 9%-11%

© 2017 Kite Realty Group kiterealty.com Investor Update | 25
FORWARD-LOOKING STATEMENTS
This supplemental information package contains certain forward-looking statements within the meaning of Section 27A of the Securities Act of 1933 and Section 21E of
the Securities Exchange Act of 1934. Such statements are based on assumptions and expectations that may not be realized and are inherently subject to risks,
uncertainties and other factors, many of which cannot be predicted with accuracy and some of which might not even be anticipated. Future events and actual results,
performance, transactions or achievements, financial or otherwise, may differ materially from the results, performance, transactions or achievements expressed or
implied by the forward-looking statements. Risks, uncertainties and other factors that might cause such differences, some of which could be material, include, but are not
limited to:
• national and local economic, business, real estate and other market conditions, particularly in light of low growth in the U.S. economy as well as economic uncertainty
caused by fluctuations in the prices of oil and other energy sources;
• financing risks, including the availability of and costs associated with sources of liquidity;
• the Company’s ability to refinance, or extend the maturity dates of, its indebtedness;
• the level and volatility of interest rates;
• the financial stability of tenants, including their ability to pay rent and the risk of tenant bankruptcies;
• the competitive environment in which the Company operates;
• acquisition, disposition, development and joint venture risks;
• property ownership and management risks;
• the Company’s ability to maintain its status as a real estate investment trust (“REIT”) for federal income tax purposes;
• potential environmental and other liabilities;
• impairment in the value of real estate property the Company owns;
• risks related to the geographical concentration of our properties in Florida, Indiana and Texas;
• insurance costs and coverage;
• risks related to cybersecurity attacks and the loss of confidential information and other business disruptions;
• other factors affecting the real estate industry generally; and
• other risks identified in reports the Company files with the Securities and Exchange Commission (“the SEC”) or in other documents that it publicly disseminates,
including, in particular, the section titled “Risk Factors” in our Annual Report on Form 10-K for the fiscal year ended December 31, 2016, and in our quarterly reports
on Form 10-Q.
The Company undertakes no obligation to publicly update or revise these forward-looking statements, whether as a result of new information, future events or
otherwise.
DISCLAIMER

© 2017 Kite Realty Group kiterealty.com Investor Update | 26
NON-GAAP FINANCIAL MEASURES
Funds from Operations
Funds from Operations (FFO) is a widely used performance measure for real estate companies and is provided here as a supplemental measure of operating performance.
We calculate FFO in accordance with the best practices described in the April 2002 National Policy Bulletin of the National Association of Real Estate Investment Trusts
(NAREIT), which we refer to as the White Paper. The White Paper defines FFO as net income (determined in accordance with generally accepted accounting principles
(GAAP)), excluding gains (or losses) from sales and impairments of depreciated property, plus depreciation and amortization, and after adjustments for unconsolidated
partnerships and joint ventures.
Considering the nature of our business as a real estate owner and operator, we believe that FFO is helpful to investors in measuring our operational performance because
it excludes various items included in net income that do not relate to or are not indicative of our operating performance, such as gains or losses from sales of depreciated
property and depreciation and amortization, which can make periodic and peer analyses of operating performance more difficult. For informational purposes, we have
also provided FFO adjusted for a severance charge, accelerated amortization of debt issuance costs, a debt extinguishment loss and transaction costs in 2016, a non-cash
adjustment for redemption of preferred shares in 2015, a gain on the resolution of an assumed contingency in 2015, and a gain on settlement and transaction costs in
2015. We believe this supplemental information provides a meaningful measure of our operating performance. We believe our presentation of FFO, as adjusted, provides
investors with another financial measure that may facilitate comparison of operating performance between periods and among our peer companies. FFO should not be
considered as an alternative to net income (determined in accordance with GAAP) as an indicator of our financial performance, is not an alternative to cash flow from
operating activities (determined in accordance with GAAP) as a measure of our liquidity, and is not indicative of funds available to satisfy our cash needs, including our
ability to make distributions. Our computation of FFO may not be comparable to FFO reported by other REITs that do not define the term in accordance with the current
NAREIT definition or that interpret the current NAREIT definition differently than we do. A reconciliation of net earnings (computed in accordance with GAAP) to FFO is
included elsewhere in this Financial Supplement.
Adjusted Funds from Operations
Adjusted Funds From Operations (“AFFO”) is a non-GAAP financial measure of operating performance used by many companies in the REIT industry. AFFO should not be
considered an alternative to net earnings, as an indication of the company's performance or to cash flow as a measure of liquidity or ability to make distributions.
Management considers AFFO a useful supplemental measure of the company’s performance. The company’s computation of AFFO may differ from the methodology for
calculating AFFO used by other REITs, and therefore, may not be comparable to such other REITs. A reconciliation of net earnings (computed in accordance with GAAP) to
AFFO is included elsewhere in this Financial Supplement.
Net Operating Income
The Company believes that Net Operating Income ("NOI") is helpful to investors as a measure of its operating performance because it excludes various items included in
net income that do not relate to or are not indicative of its operating performance, such as depreciation and amortization, interest expense, and impairment, if any. The
Company believes that Same Property NOI is helpful to investors as a measure of its operating performance because it includes only the NOI of properties that have been
owned for the full period presented, which eliminates disparities in net income due to the redevelopment, acquisition or disposition of properties during the particular
period presented and thus provides a more consistent metric for the comparison of the Company's properties. NOI and Same Property NOI should not, however, be
considered as alternatives to net income (calculated in accordance with GAAP) as indicators of the Company's financial performance. The Company’s computation of
Same Property NOI may differ from the methodology used by other REITs, and therefore, may not be comparable to such other REITs.
Free Cash Flow
Free Cash Flow reflected on an annual basis defined as Funds From Operations (FFO) as adjusted, less capital expenditures, capitalized internal costs, tenant
improvements, plus non-cash items, and after dividends paid.
© 2017 Kite Realty Group kiterealty.com Investor Update | 27
NON-GAAP FINANCIAL MEASURES
Earnings Before Interest Expense, Income Tax Expense, Depreciation and Amortization (EBITDA)
We define EBITDA, a non-GAAP financial measure, as net income before depreciation and amortization, interest expense and income tax expense of taxable REIT
subsidiary. For informational purposes, we have also provided Adjusted EBITDA, which we define as EBITDA less (i) EBITDA from unconsolidated entities, (ii) gains on sales
of operating properties or impairment charges, (iii) other income and expense, (iv) noncontrolling interest EBITDA and (v) other non-recurring activity or items impacting
comparability from period to period. Annualized Adjusted EBITDA is Adjusted EBITDA for the most recent quarter multiplied by four. Net Debt to Adjusted EBITDA is our
share of net debt divided by Annualized Adjusted EBITDA. EBITDA, Adjusted EBITDA, Annualized Adjusted EBITDA and Net Debt to Adjusted EBITDA, as calculated by us,
are not comparable to EBITDA and EBITDA-related measures reported by other REITs that do not define EBITDA and EBITDA-related measures exactly as we do. EBITDA,
Adjusted EBITDA and Annualized Adjusted EBITDA do not represent cash generated from operating activities in accordance with GAAP, and should not be considered
alternatives to net income as an indicator of performance or as alternatives to cash flows from operating activities as an indicator of liquidity.
Considering the nature of our business as a real estate owner and operator, we believe that EBITDA, Adjusted EBITDA and the ratio of Net Debt to Adjusted EBITDA are
helpful to investors in measuring our operational performance because they exclude various items included in net income that do not relate to or are not indicative of our
operating performance, such as gains or losses from sales of depreciated property and depreciation and amortization, which can make periodic and peer analyses of
operating performance more difficult. For informational purposes, we have also provided Annualized Adjusted EBITDA, adjusted as described above. We believe this
supplemental information provides a meaningful measure of our operating performance. We believe presenting EBITDA and the related measures in this manner allows
investors and other interested parties to form a more meaningful assessment of our operating results.
Net Operating Income (Cont.)
When evaluating the properties that are included in the same property pool, we have established specific criteria for determining the inclusion of properties acquired or
those recently under development. An acquired property is included in the same property pool when there is a full quarter of operations in both years subsequent to the
acquisition date. Development and redevelopment properties are included in the same property pool twelve months after construction is substantially complete and the
properties have been transferred to the operating portfolio. A redevelopment property is first excluded from the same property pool when the execution of a
redevelopment plan is likely and we begin recapturing space from tenants. For the quarter ended December 31, 2016, we excluded nine redevelopment properties from
the same property pool that met these criteria and were owned in both comparable periods.
© 2017 Kite Realty Group kiterealty.com Investor Update | 28
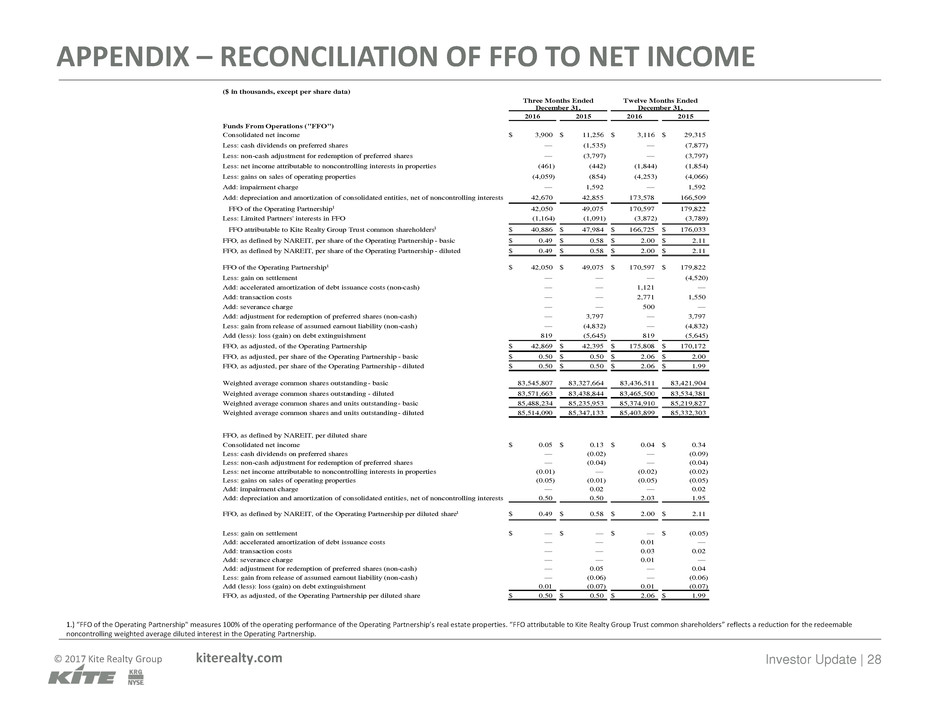
APPENDIX – RECONCILIATION OF FFO TO NET INCOME
1.) “FFO of the Operating Partnership" measures 100% of the operating performance of the Operating Partnership’s real estate properties. “FFO attributable to Kite Realty Group Trust common shareholders” reflects a reduction for the redeemable
noncontrolling weighted average diluted interest in the Operating Partnership.
($ in thousands, except per share data)
Three Months Ended
December 31,
Twelve Months Ended
December 31,
2016 2015 2016 2015
Funds From Operations ("FFO")
Consolidated net income $ 3,900 $ 11,256 $ 3,116 $ 29,315
Less: cash dividends on preferred shares — (1,535 ) — (7,877 )
Less: non-cash adjustment for redemption of preferred shares — (3,797 ) — (3,797 )
Less: net income attributable to noncontrolling interests in properties (461 ) (442 ) (1,844 ) (1,854 )
Less: gains on sales of operating properties (4,059 ) (854 ) (4,253 ) (4,066 )
Add: impairment charge — 1,592 — 1,592
Add: depreciation and amortization of consolidated entities, net of noncontrolling interests 42,670 42,855 173,578 166,509
FFO of the Operating Partnership1 42,050 49,075 170,597 179,822
Less: Limited Partners' interests in FFO (1,164 ) (1,091 ) (3,872 ) (3,789 )
FFO attributable to Kite Realty Group Trust common shareholders1 $ 40,886 $ 47,984 $ 166,725 $ 176,033
FFO, as defined by NAREIT, per share of the Operating Partnership - basic $ 0.49 $ 0.58 $ 2.00 $ 2.11
FFO, as defined by NAREIT, per share of the Operating Partnership - diluted $ 0.49 $ 0.58 $ 2.00 $ 2.11
FFO of the Operating Partnership1 $ 42,050 $ 49,075 $ 170,597 $ 179,822
Less: gain on settlement — — — (4,520 )
Add: accelerated amortization of debt issuance costs (non-cash) — — 1,121 —
Add: transaction costs — — 2,771 1,550
Add: severance charge — — 500 —
Add: adjustment for redemption of preferred shares (non-cash) — 3,797 — 3,797
Less: gain from release of assumed earnout liability (non-cash) — (4,832 ) — (4,832 )
Add (less): loss (gain) on debt extinguishment 819 (5,645 ) 819 (5,645 )
FFO, as adjusted, of the Operating Partnership $ 42,869 $ 42,395 $ 175,808 $ 170,172
FFO, as adjusted, per share of the Operating Partnership - basic $ 0.50 $ 0.50 $ 2.06 $ 2.00
FFO, as adjusted, per share of the Operating Partnership - diluted $ 0.50 $ 0.50 $ 2.06 $ 1.99
Weighted average common shares outstanding - basic 83,545,807 83,327,664 83,436,511 83,421,904
Weighted average common shares outstanding - diluted 83,571,663 83,438,844 83,465,500 83,534,381
Weighted average common shares and units outstanding - basic 85,488,234 85,235,953 85,374,910 85,219,827
Weighted average common shares and units outstanding - diluted 85,514,090 85,347,133 85,403,899 85,332,303
FFO, as defined by NAREIT, per diluted share
Consolidated net income $ 0.05 $ 0.13 $ 0.04 $ 0.34
Less: cash dividends on preferred shares — (0.02 ) — (0.09 )
Less: non-cash adjustment for redemption of preferred shares — (0.04 ) — (0.04 )
Less: net income attributable to noncontrolling interests in properties (0.01 ) — (0.02 ) (0.02 )
Less: gains on sales of operating properties (0.05 ) (0.01 ) (0.05 ) (0.05 )
Add: impairment charge — 0.02 — 0.02
Add: depreciation and amortization of consolidated entities, net of noncontrolling interests 0.50 0.50 2.03 1.95
FFO, as defined by NAREIT, of the Operating Partnership per diluted share1 $ 0.49
$ 0.58
$ 2.00
$ 2.11
Less: gain on settlement $ — $ — $ — $ (0.05 )
Add: accelerated amortization of debt issuance costs — — 0.01 —
Add: transaction costs — — 0.03 0.02
Add: severance charge — — 0.01 —
Add: adjustment for redemption of preferred shares (non-cash) — 0.05 — 0.04
Less: gain from release of assumed earnout liability (non-cash) — (0.06 ) — (0.06 )
Add (less): loss (gain) on debt extinguishment 0.01 (0.07 ) 0.01 (0.07 )
FFO, as adjusted, of the Operating Partnership per diluted share $ 0.50 $ 0.50 $ 2.06 $ 1.99

© 2017 Kite Realty Group kiterealty.com Investor Update | 29
APPENDIX – RECONCILIATION OF SAME PROPERTY NOI TO NET
INCOME
1.) Same property analysis excludes operating properties in redevelopment as well as office properties (Thirty South Meridian and Eddy Street Commons).
2.) Excludes leases that are signed but for which tenants have not yet commenced the payment of cash rent. Calculated as a weighted average based on the timing of cash rent commencement during the period.
3.) Same property net operating income excludes net gains from outlot sales, straight-line rent revenue, bad debt expense and recoveries, lease termination fees, amortization of lease intangibles and significant prior year expense recoveries and adjustments,
if any.
4.) See pages 27 and 28 of the Q4 Supplemental for further detail of the properties included in the 3-R initiative.
5.) Includes non-cash activity across the portfolio as well as net operating income from properties not included in the same property pool.
($ in thousands)
Three Months Ended December 31, Twelve Months Ended December 31,
2016 2015 %
Change
2016 2015 %
Change
Number of properties for the quarter1 106 106
Leased percentage 95.3 % 95.5 % 95.3 % 95.5 %
Economic Occupancy percentage2 93.4 % 92.9 % 93.4 % 92.9 %
Minimum rent $ 58,662 $ 57,150 $ 223,471 $ 219,305
Tenant recoveries 16,121 16,566 60,986 61,604
Other income 1,249 1,305 2,426 2,425
76,032 75,021 286,883 283,334
Property operating expenses (9,629 ) (10,237 ) (34,989 ) (37,754 )
Real estate taxes (9,441 ) (9,775 ) (36,564 ) (36,351 )
(19,070 ) (20,012 ) (71,553 ) (74,105 )
Net operating income - same properties3 $ 56,962 $ 55,009 3.6% $ 215,330 $ 209,229 2.9%
Net operating income - same properties excluding the
impact of the 3-R initiative4
4.5% 3.7%
Reconciliation of Same Property NOI to Most Directly
Comparable GAAP Measure:
Net operating income - same properties $ 56,962 $ 55,009 $ 215,330 $ 209,229
Net operating income - non-same activity5 8,932 9,752 48,031 46,899
Other expense, net (126 ) (113 ) (983 ) (281 )
General, administrative and other (5,375 ) (4,578 ) (20,603 ) (18,709 )
Transaction costs — — (2,771 ) (1,550 )
Depreciation expense (42,939 ) (43,116 ) (174,564 ) (167,312 )
Non-cash gain from release of assumed earnout liability — 4,832 — 4,832
Impairment charge — (1,592 ) — (1,592 )
Interest expense (17,613 ) (15,437 ) (65,577 ) (56,432 )
Gain on settlement — — — 4,520
Non-cash gain on debt extinguishment — 5,645 — 5,645
Gains on sales of operating properties 4,059 854 4,253 4,066
Net income attributable to noncontrolling interests (541 ) (571 ) (1,933 ) (2,198 )
Dividends on preferred shares — (1,535 ) — (7,877 )
Non-cash adjustment for redemption of preferred shares — (3,797 ) — (3,797 )
Net income attributable to common shareholders $ 3,359 $ 5,353 $ 1,183 $ 15,443
© 2017 Kite Realty Group kiterealty.com Investor Update | 30
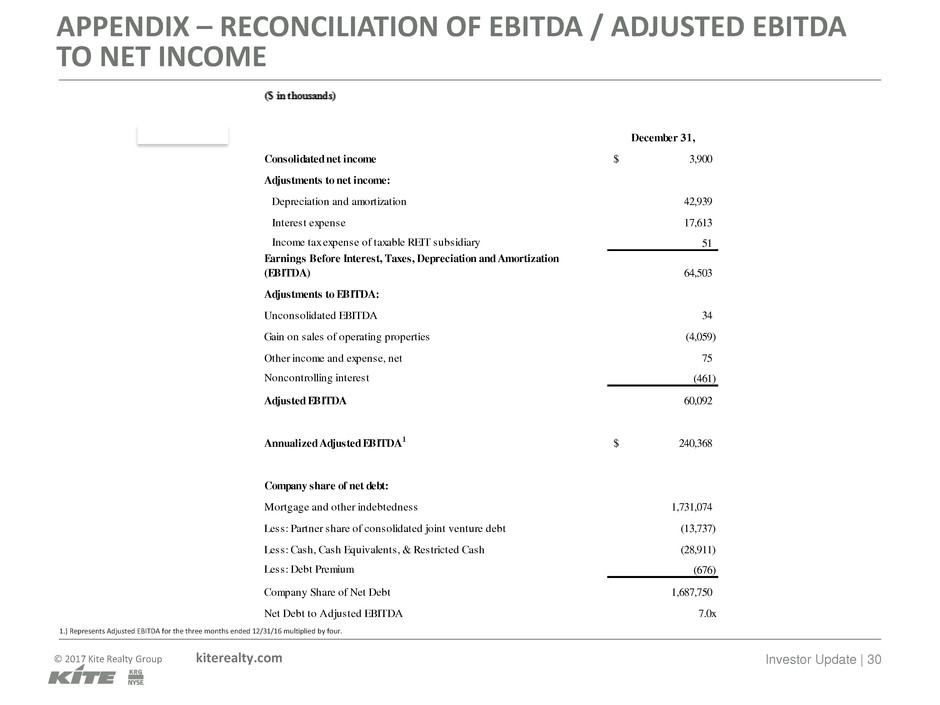
APPENDIX – RECONCILIATION OF EBITDA / ADJUSTED EBITDA
TO NET INCOME
1.) Represents Adjusted EBITDA for the three months ended 12/31/16 multiplied by four.
December 31,
Consolidated net income 3,900$
Adjustments to net income:
Depreciation and amortization 42,939
Interest expense 17,613
Income tax expense of taxable REIT subsidiary 51
Earnings Before Interest, Taxes, Depreciation and Amortization
(EBITDA) 64,503
Adjustments to EBITDA:
Unconsolidated EBITDA 34
Gain on sales of operating properties (4,059)
Other income and expense, net 75
Noncontrolling interest (461)
Adjusted EBITDA 60,092
Annualized Adjusted EBITDA1 240,368$
Company share of net debt:
Mortgage and other indebtedness 1,731,074
Less: Partner share of consolidated joint venture debt (13,737)
Less: Cash, Cash Equivalents, & Restricted Cash (28,911)
Less: Debt Premium (676)
Company Share of Net Debt 1,687,750
Net Debt to Adjusted EBITDA 7.0x
