Attached files
| file | filename |
|---|---|
| EX-4.2 - EXHIBIT 4.2 - JELD-WEN Holding, Inc. | exhibit42amendedandrestate.htm |
| EX-32.1 - EXHIBIT 32.1 - JELD-WEN Holding, Inc. | exhibit321906cert.htm |
| EX-31.2 - EXHIBIT 31.2 - JELD-WEN Holding, Inc. | exhibit312mallard302cert.htm |
| EX-31.1 - EXHIBIT 31.1 - JELD-WEN Holding, Inc. | exhibit311beck302cert.htm |
| EX-23.1 - EXHIBIT 23.1 - JELD-WEN Holding, Inc. | exhibit231.htm |
| EX-10.30 - EXHIBIT 10.30 - JELD-WEN Holding, Inc. | exhibit1030sellingsharehol.htm |
UNITED STATES
SECURITIES AND EXCHANGE COMMISSION
Washington, D.C. 20549
____________________________
FORM 10-K
____________________________
x ANNUAL REPORT PURSUANT TO SECTION 13 OR 15(d) OF THE SECURITIES EXCHANGE ACT OF 1934
For the fiscal year ended December 31, 2016
or
o TRANSITION REPORT PURSUANT TO SECTION 13 OR 15(d) OF THE SECURITIES EXCHANGE ACT OF 1934
For the transition period from _____ to _____
Commission File Number: 001-38000
____________________________
JELD-WEN Holding, Inc.
(Exact name of registrant as specified in its charter)
____________________________
Delaware (State or other jurisdiction of incorporation or organization) | 93-1273278 (I.R.S. Employer Identification No.) | |
440 S. Church Street, Suite 400
Charlotte, North Carolina 28202
(Address of principal executive offices, zip code)
(704) 378-5700
(Registrant’s telephone number, including area code)
____________________________
Securities Registered Pursuant to Section 12(b) of the Act:
Title of each class | Name of each exchange on which registered | |
Common Stock (par value $0.01 per share) | New York Stock Exchange | |
Securities Registered Pursuant to Section 12(g) of the Act: None
Indicate by check mark if the registrant is a well-known seasoned issuer, as defined in Rule 405 of the Securities Act. Yes o No x
Indicate by check mark if the registrant is not required to file reports pursuant to Section 13 or Section 15(d) of the Act. Yes o No x
Indicate by check mark whether the registrant: (1) has filed all reports required to be filed by Section 13 or 15(d) of the Securities Exchange Act of 1934 during the preceding 12 months (or for such shorter period that the registrant was required to file such reports), and (2) has been subject to such filing requirements for the past 90 days. Yes o No x
Indicate by check mark whether the registrant has submitted electronically and posted on its corporate Website, if any, every Interactive Data File required to be submitted and posted pursuant to Rule 405 of Regulation S-T (§232.405 of this chapter) during the preceding 12 months (or for such shorter period that the registrant was required to submit and post such files). Yes o No o
Indicate by check mark if disclosure of delinquent filers pursuant to Item 405 of Regulation S-K (§229.405 of this chapter) is not contained herein, and will not be contained, to the best of registrant’s knowledge, in definitive proxy or information statements incorporated by reference in Part III of this Form 10-K or any amendment to this Form 10-K. o
Indicate by check mark whether the registrant is a large accelerated filer, an accelerated filer, a non-accelerated filer or a smaller reporting company. See the definitions of “large accelerated filer,” “accelerated filer” and “smaller reporting company” in Rule 12b-2 of the Exchange Act.
Large accelerated filer | o | Accelerated filer | o | |||
Non-accelerated filer | x (Do not check if a smaller reporting company) | Smaller reporting company | o | |||
Indicate by check mark whether the registrant is a shell company (as defined in Rule 12b-2 of the Exchange Act). Yes o No x
The registrant had 104,889,272 shares of Common Stock , par value $0.01 per share, issued and outstanding as of March 1, 2017.
DOCUMENTS INCORPORATED BY REFERENCE
None
13109250.2
JELD-WEN HOLDING, Inc.
- Table of Contents –
Page No. | |
Part I. | |
Part II. | |
Item 5. Market for Registrant's Common Equity, Related Shareholder Matters and Issuer Purchases of Equity Securities | |
Part III. | |
Item 12. Security Ownership of Certain Beneficial Owners and Management and Related Shareholder Matters | |
Part IV. | |
Item 16. Form 10-K Summary | |
2
Glossary of Terms
When the following terms and abbreviations appear in the text of this report, they have the meaning indicated below:
2015 Incremental Term Loans | $480 million incremental term loans borrowed under the Term Loan Facility in July 2015 |
2018 Annual Meeting | 2018 Annual Meeting of Shareholders |
401(k) Plan | JELD-WEN 401(k) Retirement Savings Plan |
ABL Facility | Our $300 million asset-based revolving credit facility, dated as of October 15, 2014 and as amended from time to time, with JWI and JELD-WEN of Canada, Ltd., as borrowers, the guarantors party thereto, a syndicate of lenders, and Wells Fargo Bank, National Association, as administrative agent |
Adjusted EBITDA | A supplemental non-GAAP financial measure of operating performance not based on any standardized methodology prescribed by GAAP that we define as net income (loss), as adjusted for the following items: income (loss) from discontinued operations, net of tax; gain (loss) on sale of discontinued operations, net of tax; equity earnings (loss) of non-consolidated entities; income tax benefit (expense); depreciation and amortization; interest expense, net; impairment and restructuring charges; gain (loss) on sale of property and equipment; share-based compensation expense; non-cash foreign exchange transaction/translation income (loss); other non-cash items; other items; and costs related to debt restructuring, debt refinancing, and the Onex Investment |
AICPA Practice Aid | American Institute of Certified Public Accountants Accounting & Valuation Guide, Valuation of Privately-Held-Company Equity Securities Issued as Compensation |
Amended Term Loans | November 2016 amendment to the Term Loan Facility provided for an incremental $375 million under our Term Loan Facility and (i) permitted a $400 million distribution, (ii) reduced the interest rate on the outstanding term loans, and (iii) conformed the terms of all outstanding term loans under the Term Loan Facility |
Aneeta | Aneeta Window Systems Pty. Ltd. |
ASC | Accounting Standards Codification |
ASU | Accounting Standards Update |
AUD | Australian Dollar |
Australia Senior Secured Credit Facility | Our senior secured credit facility, dated as of October 6, 2015 and as amended from time to time, with certain of our Australian subsidiaries, as borrowers, and Australia and New Zealand Banking Group Limited, as lender |
BBSY | Bank Bill Swap Bide rate |
Board | Our board of directors |
Breezway | Breezway Australia Pty. Ltd. |
Brexit | Referendum vote by the U.K. to exit the E.U. |
CAP | Cleanup Action Plan |
CD&A | Compensation Discussion & Analysis |
CHF LIBOR | Swiss Franc LIBOR interest rate |
CIBOR | Copenhagen Interbank rate |
Class B-1 Common Stock | Shares of our Class B-1 Common Stock, par value $0.01 per share, all of which was converted into shares of our common stock on February 1, 2017 |
CMI | CraftMaster Manufacturing Inc. |
COA | Consent Order and Agreement |
Code | U.S. Internal Revenue Code of 1986, as amended |
CODM | Chief operating decision maker |
Corporate Credit Facilities | Collectively, our ABL Facility and our Term Loan Facility |
Credit Facilities | Collectively, our Corporate Credit Facilities, our Australia Senior Secured Credit Facility, and our Euro Revolving Facility |
DGCL | Delaware General Corporation Law |
DKK | Danish Krone |
Dooria | Dooria AS |
EPA | U.S. Environmental Protection Agency |
3
ERISA | Employee Retirement Income Security Act of 1974, as amended |
ERP | Enterprise Resource Planning |
ESOP | JELD-WEN, Inc. Employee Stock Ownership and Retirement Plan |
E.U. | European Union |
EURIBOR | Euro interbank offered rate |
Euro Revolving Facility | Our €39 million revolving credit facility, dated as of January 30, 2015 and as amended from time to time, with JELD-WEN A/S, as borrower, Danske Bank A/S and Nordea |
Exchange Act | Securities Exchange Act of 1934, as amended |
FASB | Financial Accounting Standards Board |
FCPA | United States Foreign Corrupt Practices Act |
FIFO | First-in, first-out |
Form 10-K | This Annual Report on Form 10-K |
GAAP | Generally accepted accounting principles in the United States |
GHG | Greenhouse gasses |
Initial Term Loans | $775 million term loans borrowed under the Term Loan Facility in October 2014 |
IPO | The initial public offering of our shares, as further described in this Form 10-K |
ISO | Incentive stock options |
JELD-WEN | JELD-WEN Holding, Inc., together with its subsidiaries where the context requires, including JWI |
JEM | JELD-WEN Excellence Model |
JWA | JELD-WEN of Australia Pty. Ltd. |
JWI | JELD-WEN, Inc. |
Karona | Karona, Inc. |
KSOP | JELD-WEN, Inc. KSOP |
LaCantina | LaCantina Doors, Inc. |
LIBOR | London Interbank Offered Rate |
LIFO | Last-in, first-out |
MD&A | Management’s discussion and analysis of financial condition and results of operations |
MIP | Management Incentive Plan |
NEO | Named Executive Officer |
NIBOR | Norwegian InterBank Offered Rate |
NM | Not meaningful |
NOL | Net operating loss |
NYSE | New York Stock Exchange |
Omnibus Equity Plan | JELD-WEN Holding, Inc. 2017 Omnibus Equity Plan |
PaDEP | Pennsylvania Department of Environmental Protection |
PBGC | U.S. Pension Benefit Guaranty Corporation |
PwC | PricewaterhouseCoopers LLC |
R&R | Repair and remodel |
RCW | Roderick C. Wendt |
RI/FS | Remedial Investigation and Feasibility Study |
RLW | Richard L. Wendt |
RLW Estate | The estate of Richard L. Wendt |
RLW Trust | The Richard Lester Wendt Revocable Living Trust |
RSU | Restricted stock units |
SAR | Stock appreciation rights |
Sarbanes-Oxley | Sarbanes-Oxley Act of 2002, as amended |
SEC | Securities and Exchange Commission |
4
Securities Act | Securities Act of 1933, as amended |
Series A Convertible Preferred Stock | Our Series A-1 Convertible Preferred Stock, par value $0.01 per share, Series A-2 Convertible Preferred Stock, par value $0.01 per share, Series A-3 Convertible Preferred Stock, par value $0.01 per share, and Series A-4 Convertible Preferred Stock, par value $0.01 per share, all of which was converted into shares of our common stock on February 1, 2017 |
SG&A | Selling, general, and administrative expenses |
Steves | Steves and Sons, Inc. |
STIBOR | Stockholm InterBank Offered Rate |
Stock Incentive Plan | Amended and Restated Stock Incentive Plan |
Term Loan Facility | Our term loan facility, dated as of October 15, 2014, with JWI, as borrower, the guarantors party thereto, a syndicate of lenders, and Bank of America, N.A., as administrative agent, under which we initially borrowed $775 million of term loans, as amended (i) on July 1, 2015 in connection with the borrowing of $480 million of incremental term loans and (ii) on November 1, 2016 in connection with the borrowing of $375 million of incremental term loans, and as further amended from time to time |
Trend | Trend Windows & Doors Pty. Ltd. |
U.K. | United Kingdom |
U.S. | United States of America |
WADOE | Washington State Department of Ecology |
CERTAIN TRADEMARKS, TRADE NAMES AND SERVICE MARKS
This Form 10-K includes trademarks, trade names, and service marks owned by us. Our U.S. window and door trademarks include JELD-WEN®, AuraLast®, MiraTEC®, Extira®, LaCANTINATM, KaronaTM, ImpactGard®, JW®, Aurora®, IWP®, and True BLUTM. Our trademarks are either registered or have been used as a common law trademark by us. The trademarks we use outside the United States include the Stegbar®, Regency®, William Russell Doors®, Airlite®, TrendTM, The Perfect FitTM, Aneeta®, Breezway®, and Corinthian® marks in Australia, and Swedoor®, Dooria®, DANA®, and Alupan® in Europe. ENERGY STAR® is a registered trademark of the United States Environmental Protection Agency. This Form 10-K contains additional trademarks, trade names, and service marks of others, which are, to our knowledge, the property of their respective owners. Solely for convenience, trademarks, trade names, and service marks referred to in this Form 10-K appear without the ®, ™ or SM symbols, but such references are not intended to indicate, in any way, that we will not assert, to the fullest extent under applicable law, our rights or the right of the applicable licensor to these trademarks, trade names, and service marks. We do not intend our use of other parties’ trademarks, trade names, or service marks to imply, and such use or display should not be construed to imply, a relationship with, or endorsement or sponsorship of us by, these other parties.
5
FORWARD-LOOKING STATEMENTS
In addition to historical information, this Form 10-K contains “forward-looking statements” within the meaning of Section 27A of the Securities Act and Section 21E of the Exchange Act, which are subject to the “safe harbor” created by those sections. All statements, other than statements of historical facts, included in this Form 10-K are forward-looking statements. You can generally identify forward-looking statements by our use of forward-looking terminology such as “anticipate”, “believe”, “continue”, “could”, “estimate”, “expect”, “intend”, “may”, “might”, “plan”, “potential”, “predict”, “seek”, or “should”, or the negative thereof or other variations thereon or comparable terminology. In particular, statements about the markets in which we operate, including growth of our various markets, and our expectations, beliefs, plans, strategies, objectives, prospects, assumptions, or future events or performance contained under the headings Item 1A- Risk Factors, Item 7- Management’s Discussion and Analysis of Financial Condition and Results of Operations, and Item 1- Business are forward-looking statements.
We have based these forward-looking statements on our current expectations, assumptions, estimates, and projections. While we believe these expectations, assumptions, estimates, and projections are reasonable, such forward-looking statements are only predictions and involve known and unknown risks and uncertainties, many of which are beyond our control. These and other important factors, including those discussed under the headings Item 1A- Risk Factors, Item 7- Management’s Discussion and Analysis of Financial Condition and Results of Operations, and Item 1- Business, may cause our actual results, performance or achievements to differ materially from any future results, performance or achievements expressed or implied by these forward-looking statements. Some of the factors that could cause actual results to differ materially from those expressed or implied by the forward-looking statements include:
• | negative trends in overall business, financial market and economic conditions, and/or activity levels in our end markets; |
•our highly competitive business environment;
•failure to timely identify or effectively respond to consumer needs, expectations or trends;
•failure to maintain the performance, reliability, quality, and service standards required by our customers;
•failure to implement our strategic initiatives, including JEM;
•acquisitions or investments in other businesses that may not be successful;
•declines in our relationships with and/or consolidation of our key customers;
• | increases in interest rates and reduced availability of financing for the purchase of new homes and home construction and improvements; |
•fluctuations in the prices of raw materials used to manufacture our products;
•delays or interruptions in the delivery of raw materials or finished goods;
•seasonal business and varying revenue and profit;
•changes in weather patterns;
•political, economic, and other risks that arise from operating a multinational business;
•exchange rate fluctuations;
•disruptions in our operations;
•manufacturing realignments and cost savings programs resulting in a decrease in short-term earnings;
•our new Enterprise Resource Planning system that we anticipate implementing in the future proving ineffective;
•security breaches and other cybersecurity incidents;
•increases in labor costs, potential labor disputes, and work stoppages at our facilities;
• | changes in building codes that could increase the cost of our products or lower the demand for our windows and doors; |
•compliance costs and liabilities under environmental, health, and safety laws and regulations;
•compliance costs with respect to legislative and regulatory proposals to restrict emission of GHGs;
6
• | lack of transparency, threat of fraud, public sector corruption, and other forms of criminal activity involving government officials; |
•product liability claims, product recalls, or warranty claims;
•inability to protect our intellectual property;
•loss of key officers or employees;
•pension plan obligations;
•our current level of indebtedness;
•risks associated with the material weaknesses that have been identified;
•Onex’ control of us; and
•other risks and uncertainties, including those listed under Item 1A- Risk Factors.
Given these risks and uncertainties, you are cautioned not to place undue reliance on such forward-looking statements. The forward-looking statements contained in this Form 10-K are not guarantees of future performance and our actual results of operations, financial condition, and liquidity, and the development of the industry in which we operate, may differ materially from the forward-looking statements contained in herein. In addition, even if our results of operations, financial condition, and liquidity, and events in the industry in which we operate, are consistent with the forward-looking statements contained in this Form10-K, they may not be predictive of results or developments in future periods.
Any forward-looking statement in this Form 10-K speaks only as of the date of this Form 10-K or as of the date such statement was made. We do not undertake any obligation to update or revise, or to publicly announce any update or revision to, any of the forward-looking statements, whether as a result of new information, future events or otherwise, except as required by law.
Unless the context requires otherwise, references in this Form 10-K to “we,” “us,” “our,” “the Company,” or “JELD-WEN” mean JELD-WEN Holding, Inc., together with our consolidated subsidiaries where the context requires, including our wholly owned subsidiary JWI.
7
Item 1 - Business.
Our Company
We are one of the world’s largest door and window manufacturers. We design, produce, and distribute an extensive range of interior and exterior doors, wood, vinyl, and aluminum windows, and related products for use in the new construction and R&R of residential homes and, to a lesser extent, non-residential buildings.
We market our products globally under the JELD-WEN brand, along with several market-leading regional brands such as Swedoor and DANA in Europe and Corinthian, Stegbar, and Trend in Australia. Our customers include wholesale distributors and retailers as well as individual contractors and consumers. As a result, our business is highly diversified by distribution channel, geography, and construction application, as illustrated in the charts below:
2016 Net Revenues $3,667 million |
Distribution Channel | Geography | Construction Application(1) | ||
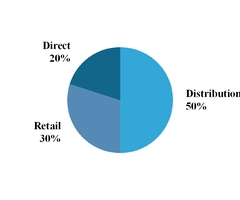
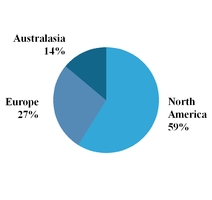
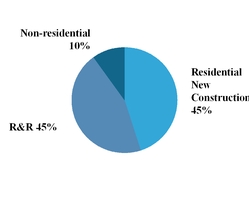
(1) | Percentage of net revenues by construction application is a management estimate based on the end markets into which our customers sell. |
We operate 115 manufacturing facilities in 19 countries, located primarily in North America, Europe, and Australia. Our global manufacturing footprint is strategically sized and located to meet the delivery requirements of our customers. For many product lines, our manufacturing processes are vertically integrated, enhancing our range of capabilities, our ability to innovate, and our quality control, as well as providing us with supply chain, transportation, and working capital savings. We believe that our manufacturing network allows us to deliver our broad portfolio of products to a wide range of customers across the globe, improves our customer service, and strengthens our market positions.
Our History
We were founded in 1960 by Richard L. Wendt, when he, together with four business partners, bought a millwork plant in Oregon. The subsequent decades were a time of successful expansion and growth as we added different businesses and product categories such as interior doors, exterior steel doors, and vinyl windows. Our first overseas acquisition was Norma Doors in Spain in 1992 and since then we acquired or established numerous businesses in Europe, Australia, Asia, Canada, Mexico, and Chile, making us a truly global company.
In October 2011, certain funds managed by an affiliate of Onex Partners Manager LP and/or Onex Corporation, acquired a majority of JELD-WEN’s voting interests.
On February 1, 2017, we closed an IPO of 28,750,000 shares of our common stock at a public offering price of $23.00 per share. We sold 22,272,727 shares and Onex sold 6,477,273 shares from which we did not receive any proceeds. We received $472.8 million in proceeds, net of underwriting discounts, fees and commissions, from the shares sold by us. We used a portion of the net proceeds to us from the offering to repay $375 million of indebtedness outstanding under our Term Loan Facility. We will use remaining net proceeds to us for working capital and other general corporate purposes, including sales and marketing activities, general and administrative matters, and capital expenditures. We may also use a portion of the net proceeds to invest in or acquire complementary businesses, products, services, technologies, or other assets.
8
After completion of the IPO, Onex owns 59.9% of our outstanding common stock.
Our Products
We provide a broad portfolio of interior and exterior doors, windows, and related products, manufactured from a variety of wood, metal, and composite materials and offered across a full spectrum of price points. In the year ended December 31, 2016, our door sales accounted for 67% of net revenues, our window sales accounted for 24% of net revenues, and our other ancillary products and services accounted for 9% of net revenues.
Doors
We are a leading global manufacturer of residential doors. We offer a full line of residential interior and exterior door products, including patio doors and folding or sliding wall systems. Our non-residential door product offering is concentrated in Europe, where we are a leading non-residential door provider by net revenues in Germany, Austria, Switzerland, and Scandinavia. In order to meet the style, design, and durability needs of our customers across a broad range of price points, our product portfolio encompasses many types of materials, including wood veneer, composite wood, steel, glass, and fiberglass. Our interior and exterior residential door models generally retail at prices ranging from $30 to $40 for our most basic products to several thousand dollars for our high-end exterior doors. Our highest volume products include molded interior doors, which are made from two composite molded door skins joined by a wooden frame and filled with a hollow honey-cell core or other solid core materials. These low-cost doors are the most popular choice for interior residential applications in North America and also are prevalent in France and the U.K. In Europe, we also sell highly engineered non-residential doors, with features such as soundproofing, fire resistance, radiation resistance, and added security. We also manufacture stile and rail doors in our Southeast Asia manufacturing facilities, as well as in the U.S. through our recent acquisition of Karona. Additionally, we offer profitable value-added services in all of our markets, including pre-hanging and pre-finishing. These services are valued by labor constrained customers and allow us to capture more profit from the sale of our door products. Our newest door product offering includes folding and sliding wall systems through our recent acquisition of LaCantina, which closed in October 2015.
We manufacture our own composite molded skins for our interior door business. In the last several years, we have added significant door skin capacity into the North America market, primarily as a result of the opening of our facility in Dodson, Louisiana.
Windows
We are a leading global manufacturer of residential windows. We manufacture wood, vinyl, and aluminum windows in North America, wood and aluminum windows in Australia, and wood windows in the U.K. Our window product lines comprise a full range of styles, features, and energy-saving options in order to meet the varied needs of our customers in each of our regional end markets. For example, our high performance wood and vinyl windows with multi-pane glazing and superior energy efficiency properties are in greater demand in Canada and the northern U.S. By contrast, our lower-cost aluminum framed windows are popular in some regions of the southern U.S., while in coastal Florida certain local building codes require windows that can withstand the impact of debris propelled by hurricane-force winds. Wood windows are prevalent as a high-end option in all of our markets because they possess both insulating qualities and the beauty of natural wood. In North America our wood windows and patio doors include our proprietary AuraLast treatment, which is a unique water-based wood protection process that provides protection against wood rot and decay. We believe AuraLast is unique in its ability to penetrate and protect the wood through to the core, as opposed to being a shallow or surface-only treatment. Our newest window product offerings include sashless window systems through our recent acquisition of Aneeta, which closed in August 2015 and louver window systems through our acquisition of Breezway which closed in August 2016. Our windows typically retail at prices ranging from $100 to $200 for a basic vinyl window to over $1,000 for a custom energy-efficient wood window. We believe that our innovative energy-efficient windows position us to benefit from increasing environmental awareness among consumers and from changes in local building codes. In recognition of our expansive energy-efficient product line, we have been an ENERGY STAR partner since 1998.
Other Ancillary Products and Services
In certain regions, we sell a variety of other products that are ancillary to our door and window offerings, which we do not classify as door or window sales. These products include shower enclosures and wardrobes, moldings, trim board, lumber, cutstock, glass, staircases, hardware and locks, cabinets, and screens. Molded door skins sold to certain third-party manufacturers, as well as miscellaneous installation and other services, are also included in this category.
We sell molded door skins to certain customers pursuant to long-term contracts, and these customers in turn use the molded door skins to manufacture interior doors and compete directly against us in the marketplace. We have given notice of
9
termination of one of these contracts, pursuant to which that contract will expire at the end of its term. The counterparty to this agreement has asserted various claims against us and has filed a complaint on purported antitrust, breach of contract, breach of warranty, and tort grounds. We believe their claims lack merit and intend to defend vigorously against this action. For additional information, see Item 3 - Legal Proceedings.
Our Segments
We operate within the global market for residential and non-residential doors and windows with sales spanning 76 countries. While we operate globally, the markets for doors and windows are regionally distinct with suppliers manufacturing finished goods in proximity to their customers. Finished doors and windows are generally bulky, expensive to ship, and, in the case of windows, fragile. Designs and specifications of doors and windows also vary from country to country due to differing construction methods, building codes, certification requirements, and consumer preferences. Customers also demand short delivery times and can require special order customizations. We believe that we are well-positioned to meet the global demands of our customers due to our market leadership, strong brands, broad product line, and strategically located manufacturing and distribution facilities.
Our operations are managed and reported in three reportable segments, organized and managed principally by geographic region. Our reportable segments are North America, Europe and Australasia. We report all other business activities in Corporate and unallocated costs. Factors considered in determining the three reportable segments include the nature of business activities, the management structure accountable directly to the CODM for operating and administrative activities, the discrete financial information available and the information presented to the CODM.
North America
In our North America segment, we primarily compete in the market for residential doors and windows in the U.S. and Canada. We are the only manufacturer that offers a full line of interior and exterior door and window products, allowing us to offer a more complete solution to our customer base. We believe that our total market opportunity in North America is significantly larger and includes non-residential applications, other related building products, and value-added services. We believe that our leading position in the North American market will enable us to benefit from continued recovery in residential construction activity over the next several years.
Europe
The European market for doors is highly fragmented, and we have the only platform in the industry capable of serving nearly all European countries. In our Europe segment, we primarily compete in the market for residential and non-residential doors in Germany, the U.K., France, Austria, Switzerland, and Scandinavia. We believe that our total market opportunity in Europe is significantly larger and includes other European countries, other door product lines, related building products, and value-added services. Although construction activity in Europe has been slower to recover compared to construction activity in North America, new construction and R&R activity is expected to increase across Europe over the next several years.
Australasia
In our Australasia segment, we primarily compete in the market for residential doors and windows in Australia, where we hold a leading position by net revenues. We believe that our total market opportunity in the Australasia region is significantly larger and includes non-residential applications and other countries in the region, as well as other related building products, and value-added services. For example, we also sell a full line of shower enclosures and wardrobes throughout Australia.
Financial information regarding our segments is included in Note 20- Segment Information to our financial statements included in this Form 10-K.
Materials
Historically our sourcing function operated primarily in a regional, decentralized model. With our recent leadership transformation, we have increased our focus on making global sourcing a competitive advantage, as evidenced by our hiring in early 2016 of an experienced procurement executive to lead our global sourcing function. Under his leadership, our focus has been and will continue be on minimizing material costs through strategic global sourcing and value-added re-engineering of components. We believe leveraging our significant spending and the global nature of our purchases will allow us to achieve these goals.
10
We generally maintain a diversified supply base for the materials used in our manufacturing operations. Materials represented approximately 51% of our cost of sales in the year ended December 31, 2016. The primary materials used for our door business include wood, wood veneers, wood composites, steel, glass, internally produced door skins, fiberglass compound, and hardware, as well as petroleum-based products such as resin and binders. The primary materials for our window business include wood, wood components, glass, hardware, aluminum extrusions, and vinyl extrusions. Wood components for our window operations are sourced primarily from our own manufacturing plants, which allow us to improve margins and take advantage of our proprietary technologies such as our AuraLast wood treatment process.
We track commodities in order to understand our vendors’ costs, realizing that our costs are determined by the broader competitive market as well as by increases in the inputs to our vendors. In order to manage the risk in material costs, we develop strategic relationships with suppliers, routinely evaluate substitute components, develop new products, vertically integrate where applicable and seek alternative sources of supply from multiple vendors and often from multiple geographies.
Seasonality
In a typical year, our operating results are impacted by seasonality. Historically, peak season for home construction and remodeling in our North America and Europe segments, which represent the substantial majority of our revenues, generally corresponds with the second and third calendar quarters, and therefore our sales volume is usually higher during those quarters. Seasonal variations in operating results may be impacted by inclement weather conditions, such as cold or wet weather, which can delay construction projects.
Sales and Marketing
We actively market and sell our products directly to our customers around the world through our global sales force and indirectly through our marketing and branding initiatives. Our global sales force, which is organized and managed regionally, includes over 1,000 sales professionals. Our sales force focuses on building and maintaining relationships with key customers as well as managing customer supply needs and arranging in-store promotional initiatives. In North America, we also have a dedicated team that focuses on our large home center customers. We have recently made significant investments in tools and technologies to enhance the effectiveness of our sales force and improve ease of doing business. For example, we are in the process of deploying Salesforce.com on a global basis, which will provide us with a common global customer relationship management platform. In addition, we are in the process of simplifying our order entry process by implementing online configuration tools. We have introduced an electronic ordering system for easy order placement, and we intend to expand our online retail sales. Our new strategy also includes initiatives focused on expanding our market through the use of social media. To date, these initiatives have included hosting videos and increasing our presence on Facebook.
Consistent with our new pricing strategies, we have restructured the commission and incentive plans of our sales team to drive focus on achieving profitable growth. We have also invested significantly in our architectural sales force by adding staff and tools to increase the frequency with which our products are specified by architects. We believe these investments will increase sales force effectiveness, create pull-through demand, and optimize sales force productivity.
We believe that our broad product portfolio of both doors and windows in North America and Australasia is a competitive advantage as it allows us to cross-sell our door and window products to our end customers, many of whom find it more efficient to choose one supplier for their door and window needs on a given project. None of our primary competitors in these regions offer a similarly complete range of windows as well as interior and exterior doors.
Research and Development
Following a number of years during and after the global financial crisis of limited investment in new product development, a core element of our strategy is a renewed focus on innovation and the development of new products and technologies. We believe that leading the market in innovation will enhance demand for our products and allow us to sell a higher margin product mix. Our research and development efforts encompass new product development, derivative product development, as well as value added re-engineering of components in our existing products leading to reduced costs and manufacturing efficiencies. We have also designed a new governance process that prioritizes the most impactful projects and is expected to improve the efficiency and quality of our research and development efforts. The governance process is currently being deployed globally, such that we can leverage best practices from region to region. Additionally, a substantial driver of our 2015 and 2016 acquisition activity was increasing access to new and innovative products.
Although product specifications and certifications vary from country to country, the global nature of our operations allows us to leverage our global innovation capabilities and share new product designs across our markets. We believe that the global nature of our research and development capabilities is unique among our door and window competition. An example of global
11
sharing of innovation is the “soft close” door system, which is based on hardware originally designed and manufactured by our European operations that is now being offered in North America and Australia. Additionally, we have successfully launched new door designs into our North American and Australian markets that were originally developed in our European operations.
Customers
We sell our products worldwide to more than 20,000 customer locations. We have well-established relationships with numerous customers throughout the door and window distribution chain in each of our end markets, including retail home centers, wholesale distributors, and building product dealers that supply homebuilders, contractors, and consumers. Our wholesale customers include such industry leaders as BMC/Stock Building Supply, ProBuild/Builders First Source, American Building Supply, Saint-Gobain, and the Holzring group. Our home center customers include, among others, The Home Depot, Lowes, and Menards in North America; B&Q, Howdens, and Bauhaus in Europe; and Bunnings Warehouse in Australia. We have maintained relationships with the majority of our top ten customers for over 18 years and believe that the strength and tenure of our customer relationships is based on our ability to produce and deliver high-quality products quickly and in the desired volumes for a reasonable cost. Our top ten customers together accounted for approximately 37% of our gross revenues in the year ended December 31, 2016, and our largest customer, The Home Depot, accounted for approximately 17% of our gross revenues in the year ended December 31, 2016.
Competition
The door and window industry is highly competitive and includes a number of regional and international competitors. Competition is largely based on the functional and aesthetic quality of products, service quality, distribution capability and price. We believe that we are well-positioned in our industry due to our leading brands, our broad product lines, our consistently high product quality and service, our global manufacturing and distribution capabilities, and our extensive multi-channel distribution. For North American interior doors, our major competitors include Masonite and several smaller independent door manufacturers. For North American exterior doors, competitors include Masonite, Therma-Tru (a division of Fortune Brands), and Plastpro. The North American window market is highly fragmented, with sizable competitors including Anderson, Pella, Marvin, Ply-Gem, and Milgard (a division of Masco). The door manufacturers that we primarily compete with in our European markets include Huga, Prüm/Garant, Viljandi, Masonite, Keyor, and Herholz. The competitive landscape in Australia is varied across the door and window markets. In the Australian door market, Hume Doors is our primary competitor, while in the window, shower screen, and wardrobe markets we largely compete against a fragmented set of smaller companies.
Intellectual Property
We rely primarily on patent, trademark, copyright, and trade secret laws and contractual commitments to protect our intellectual property and other proprietary rights. Generally, registered trademarks have a perpetual life, provided that they are renewed on a timely basis and continue to be used properly as trademarks. We intend to maintain the trademark registrations listed below so long as they remain valuable to our business.
Our U.S. window and door trademarks include JELD-WEN, AuraLast, MiraTEC, Extira, LaCANTINA, Karona, ImpactGard, JW, Aurora, and IWP. Our trademarks are either registered or have long been used as a common law trademark by the Company. The trademarks we use outside the U.S. include the Stegbar, Regency, William Russell Doors, Airlite, Trend, The Perfect Fit, Aneeta, Breezway, and Corinthian marks in Australia, and Swedoor, Dooria, DANA, and Alupan in Europe.
Employees
As of December 31, 2016, we employed approximately 20,600 people. Of our total number of employees, approximately 10,700 are employed in operations included in our North America segment, approximately 6,000 are employed in operations included in our Europe segment, and approximately 3,900 are employed in operations included in our Australasia segment.
Two facilities in the U.S. are covered by collective bargaining agreements, which represent approximately 470 employees. Approximately 21% of our employees in Canada work at facilities covered by collective bargaining agreements. In total, approximately 1,100, or 11%, of our employees in the U.S. and Canada are unionized workers. As is common in Europe and Australia, the majority of our facilities there are covered by work councils and/or labor agreements. We believe we have satisfactory relationships with our employees and, to the extent applicable, with our organized labor unions.
Environmental Matters
The geographic breadth of our facilities and the nature of our operations subject us to extensive environmental, health, and safety laws and regulations in jurisdictions throughout the world. Such laws and regulations relate to, among other things, air emissions, the treatment and discharge of wastewater, the discharge of hazardous materials into the environment, the handling, storage, use and disposal of solid, hazardous and other wastes, worker health and safety, or otherwise relate to health, safety, and
12
protection of the environment. Many of our products are also subject to various laws and regulations such as building and construction codes, product safety regulations, and regulations and mandates related to energy efficiency.
The nature of our operations, which involve the handling, storage, use, and disposal of hazardous wastes, exposes us to the risk of liability and claims associated with contamination at our current and former facilities or sites where we have disposed of or arranged for the disposal of waste, or with the impact of our products on human health and safety and the environment. Laws and regulations with respect to the investigation and remediation of contaminated sites can impose joint and several liability for releases or threatened releases of hazardous materials upon statutorily defined parties, including us, regardless of fault or the lawfulness of the original activity or disposal. We have been subject to claims, including having been named as a potentially responsible party, in certain proceedings initiated pursuant to the Comprehensive Environmental Response, Compensation, and Liability Act, or CERCLA, and similar state and foreign laws, regulations, and statutes, and may be named a potentially responsible party in other similar proceedings in the future. Unforeseen expenditures or liabilities may arise in connection with such matters.
We have also been the subject of certain environmental regulatory actions by the EPA and state regulatory agencies in the U.S. and foreign governmental authorities in jurisdictions in which we operate, and are obligated to make certain expenditures in settlement of those actions. We do not expect expenditures for compliance with environmental laws and regulations to have a material adverse effect on our results of operations or competitive position. However, the discovery of a presently unknown environmental condition, changes in environmental requirements or their enforcement, or other unanticipated events, may give rise to unforeseen expenditures and liabilities which could be material.
For more information, see Item 1A - Risk Factors-Risks Relating to Our Business and Industry- We may be subject to significant compliance costs as well as liabilities under environmental, health, and safety laws and regulations, Item 1A - Risk Factors- Risks Relating to Our Business and Industry, Item 1A - Risk Factors- We may be subject to significant compliance costs with respect to legislative and regulatory proposals to restrict emissions of GHGs, and Item 3 - Legal Proceedings- Environmental Regulatory Actions.
Environmental Sustainability
We strive to conduct our business in a manner that is environmentally sustainable and demonstrates environmental stewardship. Toward that end, we pursue processes that are designed to minimize waste, maximize efficient utilization of materials, and conserve resources, including using recycled and reused materials to produce portions of our products. We continue to evaluate and modify our manufacturing and other processes on an ongoing basis to further reduce our impact on the environment. We believe it is important for our employees to share our commitment and we strive to recruit, educate, and train our employees in these values on an ongoing basis throughout their careers with us.
Environmental Regulatory Actions
In 2008, we entered into an Agreed Order with the WADOE to assess historic environmental contamination and remediation feasibility at our former manufacturing site in Everett, Washington. As part of this agreement, we also agreed to develop a CAP arising from the feasibility assessment. We are currently working with WADOE to finalize our RI/FS, and, once final, we will develop the CAP. We estimate the remaining cost to complete our RI/FS and develop the CAP at $0.5 million, which we have fully accrued. However, because we cannot at this time reasonably estimate the cost associated with any remedial action we would be required to undertake, we have not provided accruals for any remedial actions in our consolidated financial statements. Non-Core Everett LLC, a subsidiary of the Company, also received notice of a natural resource damage claim from the Port Gardner and Snohomish River Trustee Council in connection with this site. In September 2015 we entered into a settlement agreement pursuant to which we will pay $1.2 million to settle the claim. Of the $1.2 million, a prior insurance carrier of the site has agreed to fund $1.0 million of the settlement. All amounts related to the settlement are fully accrued and we do not expect to incur any significant further loss related to the settlement of this matter. However, should extensive remedial action be required in the future (and if insurance coverage is unavailable or inadequate), the costs associated with this site could have a material adverse effect on our results of operations and cash flows.
In 2015, we entered into a COA with the PaDEP to remove a pile of wood fiber waste from our site in Towanda, Pennsylvania, which we acquired in connection with our acquisition of CMI in 2013, by using it as fuel for a boiler at that site. The COA replaced a 1995 Consent Decree between CMI’s predecessor Masonite, Inc. and PaDEP. Under the COA, we are required to achieve certain periodic removal objectives and ultimately remove the entire pile by August 31, 2022. There are currently $10.7 million in bonds posted in connection with these obligations. If we are unable to remove this pile by August 31, 2022, then the bonds will be forfeited and we may be subject to penalties by PaDEP. We currently anticipate meeting all applicable removal deadlines; however, if our operations at this site decrease and we burn less fuel than currently anticipated then we may not be able to meet such deadlines.
13
Available Information
Our Form 10-K, Quarterly Reports on Form 10-Q, Current Reports on Form 8-K, and amendments to reports filed pursuant to Sections 13(a) and 15(d) of the Exchange Act, are filed with the SEC. We are subject to the informational requirements of the Exchange Act and file or furnish reports, proxy statements and other information with the SEC. Such reports and other information filed by us with the SEC are available free of charge on our website at investors.jeld-wen.com when such reports are made available on the SEC’s website. The public may read and copy any materials filed by us with the SEC at the SEC’s Public Reference Room at 100 F Street, NE, Room 1580, Washington, DC 20549. The public may obtain information on the operation of the Public Reference Room by calling the SEC at 1-800-SEC-0330. The SEC maintains an Internet site that contains reports, proxy and information statements and other information regarding issuers that file electronically with the SEC at www.sec.gov. The contents of these websites are not incorporated into this filing. Further, our references to the URLs for these websites are intended to be inactive textual references only.
Item 1A - Risk Factors.
You should carefully consider each of the following risk factors, as well as other information contained in this Form 10-K in evaluating our Company and our business. If any of the following risks occur, our business, results of operations, and financial condition may be materially adversely affected.
Risks Relating to Our Business and Industry
Negative trends in overall business, financial market and economic conditions, and/or activity levels in our end markets may reduce demand for our products, which could have a material adverse effect on our business, financial condition, and results of operations.
Negative trends in overall business, financial market, and economic conditions globally or in the regions where we operate may reduce demand for our doors and windows, which is tied to activity levels in the R&R and new residential and non-residential construction end markets. In particular, the following factors may have a direct impact on our business in the regions where our products are marketed and sold:
• | the strength of the economy; |
• | employment rates and consumer confidence and spending rates; |
• | the availability and cost of credit; |
• | the amount and type of residential and non-residential construction; |
• | housing sales and home values; |
• | the age of existing home stock, home vacancy rates, and foreclosures; |
• | interest rate fluctuations for our customers and consumers; |
• | volatility in both debt and equity capital markets; |
• | increases in the cost of raw materials or any shortage in supplies or labor; |
• | the effects of governmental regulation and initiatives to manage economic conditions; |
• | geographical shifts in population and other changes in demographics; and |
• | changes in weather patterns. |
The global economy recently endured a significant and prolonged recession that had a substantial negative effect on sales across our end markets. In particular, beginning in mid-2006 and continuing through late-2011, the U.S. residential and non-residential construction industry experienced one of the most severe downturns of the last 40 years. While cyclicality in our new residential and non-residential construction end markets is moderated to a certain extent by R&R activity, much R&R spending is discretionary and can be deferred or postponed entirely when economic conditions are poor. We experienced sales declines in all of our end markets during this recent economic downturn.
Although conditions in the U.S. have improved in recent years, there can be no assurance that this improvement will be sustained in the near or long-term. Moreover, uncertain economic conditions continue in our Australasia segment and certain countries in our Europe segment. Negative business, financial market, and economic conditions globally or in the regions where
14
we operate may materially and adversely affect demand for our products, and our business, financial condition, and results of operations could be materially negatively impacted as a result.
We operate in a highly competitive business environment. Failure to compete effectively could cause us to lose market share and/or force us to reduce the prices we charge for our products. This competition could have a material adverse effect on our business, financial condition, and results of operations.
We operate in a highly competitive business environment. Some of our competitors may have greater financial, marketing, and distribution resources and may develop stronger relationships with customers in the markets where we sell our products. Some of our competitors may be less leveraged than we are, providing them with more flexibility to invest in new facilities and processes and also making them better able to withstand adverse economic or industry conditions.
In addition, some of our competitors, regardless of their size or resources, may choose to compete in the marketplace by adopting more aggressive sales policies, including price cuts, or by devoting greater resources to the development, promotion, and sale of their products. This could result in our loss of customers and/or market share to these competitors or being forced to reduce the prices at which we sell our products to remain competitive.
As a result of competitive bidding processes, we may have to provide pricing concessions to our significant customers in order for us to keep their business. Reduced pricing would result in lower product margins on sales to those customers. There is no guarantee that a reduction in prices would be offset by sufficient gains in market share and sales volume to those customers.
The loss of, or a reduction in orders from, any significant customers, or decreases in the prices of our products, could have a material adverse effect on our business, financial condition, and results of operations.
We may not identify or effectively respond to consumer needs, expectations, or trends in a timely fashion, which could adversely affect our relationship with customers, our reputation, the demand for our brands, products, and services, and our market share.
The quantity, type, and prices of products demanded by consumers and our customers have shifted over time. For example, demand has increased for multi-family housing units such as apartments and condominiums, which typically require fewer of our products, and we are experiencing growth in certain channels for products with lower price points. In certain cases, these shifts have negatively impacted our sales and/or our profitability. Also, we must continually anticipate and adapt to the increasing use of technology by our customers. Recent years have seen shifts in consumer preferences and purchasing practices and changes in the business models and strategies of our customers. Consumers are increasingly using the internet and mobile technology to research home improvement products and to inform and provide feedback on their purchasing and ownership experience for these products. Trends towards online purchases could impact our ability to compete as we currently sell a significant portion of our products through retail home centers, wholesale distributors, and building products dealers.
Accordingly, the success of our business depends in part on our ability to maintain strong brands, and identify and respond promptly to evolving trends in demographics, consumer preferences, and expectations and needs, while also managing inventory levels. It is difficult to successfully predict the products and services our customers will demand. Even if we are successful in anticipating consumer preferences, our ability to adequately react to and address those preferences will in part depend upon our continued ability to develop and introduce innovative, high-quality products and acquire or develop the intellectual property necessary to develop new products or improve our existing products. There can be no assurance that the products we develop, even those to which we devote substantial resources, will be successful. While we continue to invest in innovation, brand building, and brand awareness, and intend to increase our investments in these areas in the future, these initiatives may not be successful. Failure to anticipate and successfully react to changing consumer preferences could have a material adverse effect on our business, financial condition, and results of operations.
In addition, our competitors could introduce new or improved products that would replace or reduce demand for our products, or create new proprietary designs and/or changes in manufacturing technologies that may render our products obsolete or too expensive for efficient competition in the marketplace. Our failure to competitively respond to changing consumer and customer trends, demands, and preferences could cause us to lose market share, which could have a material adverse effect on our business, financial condition, and results of operations.
15
Failure to maintain the performance, reliability, quality, and service standards required by our customers, or to timely deliver our products, could have a material adverse effect on our business, financial condition, and results of operations.
If our products have performance, reliability, or quality problems, our reputation and brand equity, which we believe is a substantial competitive advantage, could be materially adversely affected. We may also experience increased and unanticipated warranty and service expenses. Furthermore, we manufacture a significant portion of our products based on the specific requirements of our customers, and delays in providing our customers the products and services they specify on a timely basis could result in reduced or canceled orders and delays in the collection of accounts receivable. Additionally, claims from our customers, with or without merit, could result in costly and time-consuming litigation that could require significant time and attention of management and involve significant monetary damages that could have a material adverse effect on our business, financial condition, and results of operations.
We are in the early stages of implementing strategic initiatives, including JEM. If we fail to implement these initiatives as expected, our business, financial condition, and results of operations could be adversely affected.
Our future financial performance depends in part on our management’s ability to successfully implement our strategic initiatives, including JEM. We have implemented many of these initiatives in North America and are beginning to implement them in Europe and Australasia. We cannot assure you that we will be able to continue to successfully implement these initiatives and related strategies throughout the geographic regions in which we operate or be able to continue improving our operating results. Similarly, these initiatives, even if implemented in all of our geographic regions, may not produce similar results. Any failure to successfully implement these initiatives and related strategies could adversely affect our business, financial condition, and results of operations. We may, in addition, decide to alter or discontinue certain aspects of our business strategy at any time.
We may make acquisitions or investments in other businesses which may involve risks or may not be successful.
Generally, we seek to acquire businesses that broaden our existing product lines and service offerings or expand our geographic reach. There can be no assurance that we will be able to identify suitable acquisition candidates or that our acquisitions or investments in other businesses will be successful. These acquisitions or investments in other businesses may also involve risks, many of which may be unpredictable and beyond our control, and which may have a material adverse effect on our business, financial condition, and results of operations, including risks related to:
• | the nature of the acquired company’s business; |
• | any acquired business not performing as well as anticipated; |
• | the potential loss of key employees of the acquired company; |
• | any damage to our reputation as a result of performance or customer satisfaction problems relating to an acquired business; |
• | the failure of our due diligence procedures to detect material issues related to the acquired business, including exposure to legal claims for activities of the acquired business prior to the acquisition; |
• | unexpected liabilities resulting from the acquisition for which we may not be adequately indemnified; |
• | our inability to enforce indemnification and non-compete agreements; |
• | the integration of the personnel, operations, technologies, and products of the acquired business, and establishment of internal controls, including the implementation of our enterprise resource planning system, into the acquired company’s operations; |
• | our failure to achieve projected synergies or cost savings; |
• | our inability to establish uniform standards, controls, procedures, and policies; |
• | the diversion of management attention and financial resources; and |
• | any unforeseen management and operational difficulties, particularly if we acquire assets or businesses in new foreign jurisdictions where we have little or no operational experience. |
Our inability to achieve the anticipated benefits of acquisitions and other investments could materially and adversely affect our business, financial condition, and results of operations.
16
In addition, the means by which we finance an acquisition may have a material adverse effect on our business, financial condition, and results of operations, including changes to our equity, debt, and liquidity position. If we issue convertible preferred or common stock to pay for an acquisition, the ownership percentage of our existing shareholders may be diluted. Using our existing cash may reduce our liquidity. Incurring additional debt to fund an acquisition may result in higher debt service and a requirement to comply with additional financial and other covenants, including potential restrictions on future acquisitions and distributions.
A decline in our relationships with our key customers or the amount of products they purchase from us, or a decline in our key customers’ financial condition, could have a material adverse effect on our business, financial condition, and results of operations.
Our business depends on our relationships with our key customers, which consist mainly of wholesale distributors and retail home centers. Our top ten customers together accounted for approximately 37% of our gross revenues in the year ended December 31, 2016, and our largest customer, The Home Depot, accounted for approximately 17% of our gross revenues in the year ended December 31, 2016. Although we have established and maintain significant long-term relationships with our key customers, we cannot assure you that all of these relationships will continue or will not diminish. We generally do not enter into long-term contracts with our customers and they generally do not have an obligation to purchase products from us. Accordingly, sales from customers that have accounted for a significant portion of our sales in past periods, individually or as a group, may not continue in future periods, or if continued, may not reach or exceed historical levels in any period. For example, certain of our large customers perform periodic line reviews to assess their product offering, which have, in the past and may in the future lead to loss of business and pricing pressures. Some of our large customers may also experience economic difficulties or otherwise default on their obligations to us. Furthermore, our pricing optimization strategy, which requires maintaining pricing discipline in order to improve profit margins, has in the past and may in the future lead to the loss of certain customers, including key customers, who do not agree to our pricing terms. The loss of, or a diminution in our relationship with any of our largest customers could lower our sales volumes, which could increase our costs and lower our profitability. This could have a material adverse effect on our business, financial condition, and results of operations.
Certain of our customers may expand through consolidation and internal growth, which may increase their buying power. The increased size of our customers could have a material adverse effect our business, financial condition, and results of operations.
Certain of our significant customers are large companies with strong buying power, and our customers may expand through consolidation or internal growth. Consolidation could decrease the number of potential significant customers for our products and increase our reliance on key customers. Further, the increased size of our customers could result in our customers seeking more favorable terms, including pricing, for the products that they purchase from us. Accordingly, the increased size of our customers may further limit our ability to maintain or raise prices in the future. This could have a material adverse effect our business, financial condition, and results of operations.
We are subject to the credit risk of our customers.
We are subject to the credit risk of our customers because we provide credit to our customers in the normal course of business. All of our customers are sensitive to economic changes and to the cyclical nature of the building industry. Especially during protracted or severe economic declines and cyclical downturns in the building industry, our customers may be unable to perform on their payment obligations, including their debts to us. Any failure by our customers to meet their obligations to us may have a material adverse effect on our business, financial condition, and results of operations. In addition, we may incur increased expenses related to collections in the future if we find it necessary to take legal action to enforce the contractual obligations of a significant number of our customers.
Increases in interest rates used to finance home construction and improvements, such as mortgage and credit card interest rates, and the reduced availability of financing for the purchase of new homes and home construction and improvements, could have a material adverse impact on our business, financial condition, and results of operations.
Our performance depends in part upon consumers having the ability to access third-party financing for the purchase of new homes and buildings and R&R of existing homes and other buildings. The ability of consumers to finance these purchases is affected by the interest rates available for home mortgages, credit card debt, lines of credit, and other sources of third-party financing. Currently, interest rates in the majority of the regions where we market and sell our products are near historic lows and will likely increase in the future. The U.S. Federal Reserve recently raised the federal funds rate for the first time in 10 years in December 2015 and again in December 2016, and has announced its intention to raise the federal funds rate three times in 2017. An increase in the federal funds rate could cause an increase in future interest rates applicable to mortgages, credit card debt, and
17
other sources of third-party financing. If interest rates increase and, consequently, the ability of prospective buyers to finance purchases of new homes or home improvement products is adversely affected, our business, financial condition, and results of operations may be materially and adversely affected.
In addition to increased interest rates, the ability of consumers to procure third-party financing is impacted by such factors as new and existing home prices, high unemployment levels, high mortgage delinquency and foreclosure rates, and lower housing turnover. Adverse developments affecting any of these factors could result in the imposition of more restrictive lending standards by financial institutions and reduce the ability of some consumers to finance home purchases or R&R expenditures.
Prices of the raw materials we use to manufacture our products are subject to fluctuations, and we may be unable to pass along to our customers the effects of any price increases.
We use wood, glass, vinyl and other plastics, fiberglass and other composites, aluminum, steel and other metals, as well as hardware and other components to manufacture our products. Materials represented approximately 51% of our cost of sales in the year ended December 31, 2016. Prices for our materials fluctuate for a variety of reasons beyond our control, many of which cannot be anticipated with any degree of reliability. Our most significant raw materials include vinyl extrusions, glass, and aluminum, each of which has been subject to periods of rapid and significant fluctuations in price. The reasons for these fluctuations include, among other things, variable worldwide supply and demand across different industries, speculation in commodities futures, general economic or environmental conditions, labor costs, competition, import duties, tariffs, worldwide currency fluctuations, freight, regulatory costs, and product and process evolutions that impact demand for the same materials.
For example, an increase in oil prices may affect the direct cost of materials derived from petroleum, most particularly vinyl. As another example, many consumers demand certified sustainably harvested wood products as concerns about deforestation have become more prevalent. Certified sustainably harvested wood historically has not been as widely available as non-certified wood, which results in higher prices for sustainably harvested wood. As more consumers demand certified sustainably harvested wood, the price of such wood may increase due to limited supply.
We have short-term supply contracts with certain of our largest suppliers that limit our exposure to short term fluctuations in prices of our materials, but we are susceptible to longer-term fluctuations in prices. We generally do not hedge against commodity price fluctuations. Significant increases in the prices of raw materials for finished goods, including as a result of significant or protracted material shortages, may be difficult to pass through to customers and may negatively impact our profitability and net revenues. We may attempt to modify products that use certain raw materials, but these changes may not be successful.
Our business may be affected by delays or interruptions in the delivery of raw materials, finished goods, and certain component parts. A supply shortage or delivery chain interruption could have a material adverse effect on our business, financial condition, and results of operations.
We rely upon regular deliveries of raw materials, finished goods, and certain component parts. For certain raw materials that are used in our products, we depend on a single or limited number of suppliers for our materials, and we typically do not have long-term contracts with our suppliers. If we are not able to accurately forecast our supply needs, our limited number of suppliers may make it difficult to quickly obtain additional raw materials to respond to shifting or increased demand. In addition, a supply shortage could occur as a result of unanticipated increases in market demand, difficulties in production or delivery, financial difficulties, or catastrophic events in the supply chain. Furthermore, because our products and the components of some of our products are subject to regulation, changes to these regulations could cause delays in delivery of raw materials, finished goods, and certain component parts.
Until we can make acceptable arrangements with alternate suppliers, any interruption or disruption could impact our ability to ship orders on time and could idle some of our manufacturing capability for those products. This could result in a loss of revenues, reduced margins, and damage to our relationships with customers, which could have a material adverse effect on our business, financial condition, and results of operations.
Our business is seasonal and revenue and profit can vary significantly throughout the year, which may adversely impact the timing of our cash flows and limit our liquidity at certain times of the year.
Our business is seasonal, and our net revenues and operating results vary significantly from quarter to quarter based upon the timing of the building season in our markets. Our sales typically follow seasonal new construction and R&R industry patterns. The peak season for home construction and R&R activity in the majority of the geographies where we market and sell our products generally corresponds with the second and third calendar quarters, and therefore our sales volume is typically higher during those
18
quarters. Our first and fourth quarter sales volumes are generally lower due to reduced R&R and new construction activity as a result of less favorable climate conditions in the majority of our geographic end markets. Failure to effectively manage our inventory in anticipation of or in response to seasonal fluctuations could negatively impact our liquidity profile during certain seasonal periods.
Changes in weather patterns, including as a result of global climate change, could significantly affect our financial results or financial condition.
Weather patterns may affect our operating results and our ability to maintain our sales volume throughout the year. Because our customers depend on suitable weather to engage in construction projects, increased frequency or duration of extreme weather conditions could have a material adverse effect on our financial results or financial condition. For example, unseasonably cool weather or extraordinary amounts of rainfall may decrease construction activity, thereby decreasing our sales. Also, we cannot predict the effects that global climate change may have on our business. In addition to changes in weather patterns, it might, for example, reduce the demand for construction, destroy forests (increasing the cost and reducing the availability of wood products used in construction), and increase the cost and reduce the availability of raw materials and energy. New laws and regulations related to global climate change may also increase our expenses or reduce our sales.
We are exposed to political, economic, and other risks that arise from operating a multinational business.
We have operations in North America, South America, Europe, Australia, and Asia. In the year ended December 31, 2016, our North America segment accounted for approximately 59% of net revenues, our Europe segment accounted for approximately 27% of net revenues, and our Australasia segment accounted for approximately 14% of our net revenues. Further, certain of our businesses obtain raw materials and finished goods from foreign suppliers. Accordingly, our business is subject to political, economic, and other risks that are inherent in operating in numerous countries.
These risks include:
• | the difficulty of enforcing agreements and collecting receivables through foreign legal systems; |
• | trade protection measures and import or export licensing requirements; |
• | the imposition of tariffs or other restrictions; |
• | required compliance with a variety of foreign laws and regulations, including the application of foreign labor regulations; |
• | tax rates in foreign countries and the imposition of withholding requirements on foreign earnings; |
• | difficulty in staffing and managing widespread operations; and |
• | changes in general economic and political conditions in countries where we operate, including as a result of the impact of Brexit. |
The success of our business depends in part on our ability to anticipate and effectively manage these and other risks. We cannot assure you that these and other factors will not have a material adverse effect on our international operations or ultimately on our global business, financial condition, and results of operations.
Brexit could have a material adverse effect on our business, financial condition, and results of operations.
The recent referendum vote by the U.K. to exit the E.U. has created volatility in the global financial markets. The referendum was advisory, and the terms of any withdrawal are subject to a negotiation period that could last up to two years after the government of the U.K. formally initiates a withdrawal process. The effects of the U.K.’s withdrawal from the E.U. on the global economy, and on our business in particular, will depend on agreements the U.K. makes to retain access to E.U. markets both during a transitional period and more permanently. Brexit could impair the ability of our operations in the E.U. to transact business in the future in the U.K., as well as the ability of our U.K. operations to transact business in the future in the E.U. If the U.K. and the E.U. are unable to negotiate acceptable withdrawal terms or if other E.U. member states pursue withdrawal, barrier-free access between the U.K. and other E.U. member states or among the European Economic Area overall could be diminished or eliminated.
Brexit is likely to continue to adversely affect European and worldwide economic conditions, and may contribute to greater instability in the global financial markets. Among other things, Brexit could reduce consumer spending in the U.K. and the E.U., which could result in decreased demand for our products. Similarly, housing sales and home values in the U.K. and in the E.U. could be negatively impacted and Brexit could also influence foreign currency exchange rates. For the year ended December
19
31, 2016, we derived 4% of our net revenues from our operations in the U.K., and we have moved our European headquarters to the U.K. As a result, the effects of Brexit could inhibit the growth of our business and have a material adverse effect on our business, financial condition, and results of operations.
Exchange rate fluctuations may impact our business, financial condition, and results of operations.
Our operations expose us to both transaction and translation exchange rate risks. In the year ended December 31, 2016, 48% of our net revenues came from sales outside of the U.S., and we anticipate that our operations outside of the U.S. will continue to represent a significant portion of our net revenues for the foreseeable future. In addition, the nature of our operations often requires that we incur expenses in currencies other than those in which we earn revenue. Because of the mismatch between revenues and expenses, we are exposed to significant currency exchange rate risk and we may not be successful in achieving balances in currencies throughout our operations. In addition, if the effective price of our products were to increase as a result of fluctuations in foreign currency exchange rates, demand for our products could decline, which could adversely affect our business, financial condition, and results of operations. Also, because our financial statements are presented in U.S. dollars, we must translate the financial statements of our foreign subsidiaries and affiliates into U.S. dollars at exchange rates in effect during or at the end of each reporting period, and increases or decreases in the value of the U.S. dollar against other major currencies will affect our reported financial results, including the amount of our outstanding indebtedness. Unfavorable exchange rates had a negative impact of 1% on our consolidated net revenues in the year ended December 31, 2016 as compared to the year ended December 31, 2015. We cannot assure you that fluctuations in foreign currency exchange rates, particularly the strengthening of the U.S. dollar against major currencies, such as the Euro, the Australian dollar, the Canadian dollar, the British pound, or the currencies of large developing countries, would not materially adversely affect our business, financial condition, and results of operations.
A disruption in our operations due to natural disasters or acts of war could have a material adverse effect on our business, financial condition, and results of operations.
We operate facilities worldwide. Many of our facilities are located in areas that are vulnerable to hurricanes, earthquakes, and other natural disasters. In the event that a hurricane, earthquake, natural disaster, fire, or other catastrophic event were to interrupt our operations for any extended period of time, it could delay shipment of merchandise to our customers, damage our reputation, or otherwise have a material adverse effect on our business, financial condition, and results of operations.
In addition, our operations may be interrupted by terrorist attacks or other acts of violence or war. These attacks may directly impact our suppliers’ or customers’ physical facilities. Furthermore, these attacks may make travel and the transportation of our supplies and products more difficult and more expensive and ultimately have a material adverse effect our business, financial condition, and results of operations. The U.S. has entered into armed conflicts, which could have an impact on our sales and our ability to deliver product to our customers. Political and economic instability in some regions of the world may also negatively impact the global economy and, therefore, our business. The consequences of any of these armed conflicts are unpredictable, and we may not be able to foresee events that could have an adverse effect on our business or your investment. More generally, any of these events could cause consumer confidence and spending to decrease or result in increased volatility in the worldwide financial markets. They could also result in economic recessions. Any of these occurrences could have a material adverse effect on our business, financial condition, and results of operations.
Manufacturing realignments and cost savings programs may result in a decrease in our short-term earnings.
We continually review our manufacturing operations. Effects of periodic manufacturing realignments and cost savings programs have in the past and could in the future result in a decrease in our short-term earnings until the expected results are achieved. Such programs may include the consolidation, integration, and upgrading of facilities, functions, systems, and procedures. Such programs involve substantial planning, often require capital investments, and may result in charges for fixed asset impairments or obsolescence and substantial severance costs. We also cannot assure you that we will achieve all of our cost savings. Our ability to achieve cost savings and other benefits within expected time frames is subject to many estimates and assumptions. These estimates and assumptions are subject to significant economic, competitive, and other uncertainties, some of which are beyond our control. If these estimates and assumptions are incorrect, if we experience delays, or if other unforeseen events occur, our business, financial condition, and results of operations could be materially and adversely affected.
We are highly dependent on information technology, the disruption of which could significantly impede our ability to do business.
Our operations depend on our network of information technology systems, which are vulnerable to damage from hardware failure, fire, power loss, telecommunications failure, and impacts of terrorism, natural disasters, or other disasters. We rely on our information technology systems to accurately maintain books and records, record transactions, provide information to
20
management and prepare our financial statements. We may not have sufficient redundant operations to cover a loss or failure in a timely manner. Any damage to our information technology systems could cause interruptions to our operations that materially adversely affect our ability to meet customers’ requirements, resulting in an adverse impact to our business, financial condition, and results of operations. Periodically, these systems need to be expanded, updated, or upgraded as our business needs change. We may not be able to successfully implement changes in our information technology systems without experiencing difficulties, which could require significant financial and human resources. Moreover, our increasing dependence on technology may exacerbate this risk.
We anticipate implementing a new ERP system in the future as part of our ongoing technology and process improvements. If this new system proves ineffective, we may be unable to timely or accurately prepare financial reports, make payments to our suppliers and employees, or invoice and collect from our customers.
We anticipate implementing a new ERP system in the future as part of our ongoing technology and process improvements. This ERP system will provide a standardized method of accounting for, among other things, order entry and inventory and should enhance our ability to implement our strategic initiatives. Any delay in the implementation, or disruption in the upgrade, of this system could adversely affect our ability to timely and accurately report financial information, including the filing of our quarterly or annual reports with the SEC. Such delay or disruption could also impact our ability to timely or accurately make payments to our suppliers and employees, and could also inhibit our ability to invoice and collect from our customers. Data integrity problems or other issues may be discovered which, if not corrected, could impact our business or financial results. In addition, we may experience periodic or prolonged disruption of our financial functions arising out of this conversion, general use of such systems, other periodic upgrades or updates, or other external factors that are outside of our control. If we encounter unforeseen problems with our financial system or related systems and infrastructure, our business, operations, and financial systems could be adversely affected. We may also need to implement additional systems or transition to other new systems that require further expenditures in order to function effectively as a public company. There can be no assurance that our implementation of additional systems or transition to new systems will be successful, or that such implementation or transition will not present unforeseen costs or demands on our management.
Our systems and IT infrastructure may be subject to security breaches and other cybersecurity incidents.
We rely on the accuracy, capacity, and security of our IT systems, some of which are managed or hosted by third parties, and the sale of our products may involve the transmission and/or storage of data, including in certain instances customers’ business and personally identifiable information. Maintaining the security of computers, computer networks, and data storage resources is a critical issue for us and our customers, as security breaches could result in vulnerabilities and loss of and/or unauthorized access to confidential information. We may face attempts by experienced hackers, cybercriminals, or others with authorized access to our systems to misappropriate our proprietary information and technology, interrupt our business, and/or gain unauthorized access to confidential information. The reliability and security of our information technology infrastructure and software, and our ability to expand and continually update technologies in response to our changing needs is critical to our business. To the extent that any disruptions or security breaches result in a loss or damage to our data, it could cause harm to our reputation or brand. This could lead some customers to stop purchasing our products and reduce or delay future purchases of our products or use competing products. In addition, we could face enforcement actions by U.S. states, the U.S. federal government, or foreign governments, which could result in fines, penalties, and/or other liabilities and which may cause us to incur legal fees and costs, and/or additional costs associated with responding to the cyberattack. Increased regulation regarding cybersecurity may increase our costs of compliance, including fines and penalties, as well as costs of cybersecurity audits. Any of these actions could materially adversely impact our business and results of operations. We do not currently have a specific insurance policy insuring us against losses caused by a cyberattack.
We have invested in industry-appropriate protections and monitoring practices for our data and information technology to reduce these risks and continue to monitor our systems on an ongoing basis for any current or potential threats. While we have not experienced any material breaches in security in our recent history, there can be no assurance that our efforts will prevent breakdowns or breaches to databases or systems that could have a material adverse effect on our business, financial condition, and results of operations.
Increases in labor costs, potential labor disputes, and work stoppages at our facilities or the facilities of our suppliers could have a material adverse effect on our business, financial condition, and results of operations.
Our financial performance is affected by the availability of qualified personnel and the cost of labor. As of December 31, 2016, we had approximately 20,600 employees worldwide, including approximately 10,100 employees in the U.S. and Canada. Approximately 1,100, or 11%, of our employees in the U.S. and Canada are unionized workers, and the majority of our workforce in other countries belong to work councils or are otherwise subject to labor agreements. U.S. and Canada employees represented
21
by these unions are subject to collective bargaining agreements that are subject to periodic negotiation and renewal. If we are unable to enter into new, satisfactory labor agreements with our unionized employees upon expiration of their agreements, we could experience a significant disruption of our operations, which could cause us to be unable to deliver products to customers on a timely basis. Such disruptions could result in a loss of business and an increase in our operating expenses, which could reduce our net revenues and profit margins. In addition, our non-unionized labor force may become subject to labor union organizing efforts, which could cause us to incur additional labor costs and increase the related risks that we now face.
We believe many of our direct and indirect suppliers also have unionized workforces. Strikes, work stoppages, or slowdowns experienced by suppliers could result in slowdowns or closures of facilities where components of our products are manufactured or delivered. Any interruption in the production or delivery of these components could reduce sales, increase costs, and have a material adverse effect on us.
Changes in building codes and standards (including ENERGY STAR standards) could increase the cost of our products, lower the demand for our windows and doors, or otherwise adversely affect our business.
Our products and markets are subject to extensive and complex local, state, federal, and foreign statutes, ordinances, rules, and regulations. These mandates, including building design and safety and construction standards and zoning requirements, affect the cost, selection, and quality requirements of building components like windows and doors.
These statutes, ordinances, rules, and regulations often provide broad discretion to governmental authorities as to the types and quality specifications of products used in new residential and non-residential construction and home renovations and improvement projects, and different governmental authorities can impose different standards. Compliance with these standards and changes in such statutes, ordinances, rules, and regulations may increase the costs of manufacturing our products or may reduce the demand for certain of our products in the affected geographical areas or product markets. Conversely, a decrease in product safety standards could reduce demand for our more modern products if less expensive alternatives that did not meet higher standards became available for use in that market. All or any of these changes could have a material adverse effect on our business, financial condition, and results of operations.
In addition, in order for our products to obtain the “ENERGY STAR” label, they must meet certain requirements set by the EPA. Changes in the energy efficiency requirements established by the EPA for the ENERGY STAR label could increase our costs, and a lapse in our ability to label our products as such or to comply with the new standards, may have a material adverse effect on our business, financial condition, and results of operations.
Domestic and foreign governmental regulations applicable to general business operations could increase the costs of operating our business and adversely affect our business.
We are subject to a variety of regulations from U.S. federal, state, and local governments, as well as foreign governmental authorities, relating to wage requirements, employee benefits, and other workplace matters. Changes in local minimum or living wage requirements, rights of employees to unionize, healthcare regulations, and other requirements relating to employee benefits could increase our labor costs, which would in turn increase our cost of doing business. In addition, our international operations are subject to laws applicable to foreign operations, trade protection measures, foreign labor relations, differing intellectual property rights, other legal and regulatory constraints, and currency regulations of the countries or regions in which we currently operate or where we may operate in the future. These factors may restrict the sales of, or increase costs of, manufacturing and selling our products.
We may be subject to significant compliance costs as well as liabilities under environmental, health, and safety laws and regulations.
Our past and present operations, assets, and products are subject to extensive environmental laws and regulations at the federal, state, and local level worldwide. These laws regulate, among other things, air emissions, the discharge or release of materials into the environment, the handling and disposal of wastes, remediation of contaminated sites, worker health and safety, and the impact of products on human health and safety and the environment. Under certain of these laws, liability for contaminated property may be imposed on current or former owners or operators of the property or on parties that generated or arranged for waste sent to the property for disposal. Liability under these laws may be joint and several and may be imposed without regard to fault or the legality of the activity giving rise to the contamination. Notwithstanding our compliance efforts we may still face material liability, limitations on our operations, fines, or penalties for violations of environmental, health, and safety laws and regulations, including releases of regulated materials and contamination by us or previous occupants at our current or former properties or at offsite disposal locations we use.
22
The applicable environmental, health, and safety laws and regulations, and any changes to them or in their enforcement, may require us to make material expenditures with respect to ongoing compliance with or remediation under these laws and regulations or require that we modify our products or processes in a manner that increases our costs and/or reduces our profitability. For example, additional pollution control equipment, process changes, or other environmental control measures may be needed at some of our facilities to meet future requirements. In addition, discovery of currently unknown or unanticipated soil or groundwater conditions at our properties could result in significant liabilities and costs. Accordingly, we are unable to predict the exact future costs of compliance with or liability under environmental, health, and safety laws and regulations.
We may be subject to significant compliance costs with respect to legislative and regulatory proposals to restrict emissions of GHGs.
Various legislative, regulatory, and inter-governmental proposals to restrict emissions of GHGs, such as CO2, are under consideration in governmental legislative bodies and regulators in the jurisdictions where we operate. In particular, the EPA has proposed regulations to reduce GHG emissions from new and existing power plants. These regulations, commonly referred to as the Clean Power Plan, require states to develop strategies to reduce GHG emissions within the states that may include reductions at other sources in addition to electric utilities. Some of our manufacturing facilities operate boilers or other process equipment that emit GHGs. In addition, many nations, including jurisdictions in which we operate, have committed to limiting emissions of GHGs worldwide, most recently through an agreement reached in Paris in December 2015 at the 21st Conference of the Parties to the United Nations Framework Convention on Climate Change. The Paris agreement sets out a new process for achieving global GHG reductions. Such regulatory and global initiatives may require us to modify our operating procedures or production levels, incur capital expenditures, change fuel sources, or take other actions that may adversely affect our financial results. However, given the high degree of uncertainty about the ultimate parameters of any such regulatory or global initiative, and because proposals like the Clean Power Plan are currently subject to legal challenges, we cannot predict at this time the ultimate impact of such initiatives on our operations or financial results.
A significant portion of our GHG emissions are from biomass-fired boilers, which emit biogenic CO2. Biogenic CO2 is generally considered carbon neutral. In November 2014, the EPA released its Framework for Assessing Biogenic CO2 Emissions From Stationary Sources, along with an accompanying memo that generally supports carbon neutrality for biomass combustion, but left open the possibility that it may not always be characterized as carbon neutral. This action leaves considerable uncertainty as to the future regulatory treatment of biogenic CO2 and the treatment of such GHG in the states in which we operate. The proposed Clean Power Plan also allows states to determine how biogenic CO2 will be characterized, so individual states in which we operate could determine that biogenic CO2 is not carbon neutral.
Certain of our purchased raw materials, including vinyl and resins derived from petroleum products, are also subject to significant regulation regarding production, processing, and sales. Increasing regulations to reduce GHG emissions are expected to increase energy costs, increase price volatility for petroleum, and reduce petroleum production levels, which in turn could impact the prices of those raw materials. In addition, laws and regulations relating to forestry practices limit the volume and manner of harvesting timber to mitigate environmental impacts such as deforestation, soil erosion, damage to riparian areas, and greenhouse gas levels. The extent of these regulations and related compliance costs has grown in recent years and will increase our materials costs and may increase other aspects of our production costs.
Changes to legislative and regulatory policies that currently promote home ownership may have a material adverse effect on our business, financial condition, and results of operations.
Our markets are also affected by legislative and regulatory policies, such as U.S. tax rules allowing for deductions of mortgage interest and the mandate of government-sponsored entities like Freddie Mac and Fannie Mae to promote home ownership through mortgage guarantees on certain types of home loans. In the U.S., as part of a housing reform initiative, proposals have been made at the federal government level to reduce or abolish certain tax benefits relating to home ownership and to dismantle government-sponsored mortgage insurance agencies. Any change to those policies may adversely impact demand for our products and have a material adverse effect on our business, financial condition, and results of operations.
Lack of transparency, threat of fraud, public sector corruption, and other forms of criminal activity involving government officials increases the risk of potential liability under anti-bribery or anti-fraud legislation, including the U.S. Foreign Corrupt Practices Act, the U.K. Bribery Act, and similar laws and regulations.
We operate manufacturing facilities in 19 countries and sell our products in approximately 76 countries around the world. As a result of these international operations, we may enter from time to time into negotiations and contractual arrangements with parties affiliated with foreign governments and their officials in the ordinary course of business. In connection with these activities, we may be subject to anti-corruption laws in various jurisdictions, including the FCPA, the U.K. Bribery Act and other anti-bribery
23
laws applicable to jurisdictions where we do business that prohibit improper payments or offers of payments to foreign governments and their officials and political parties for the purpose of obtaining or retaining business, or otherwise receiving discretionary favorable treatment of any kind, and require the maintenance of internal controls to prevent such payments. In particular, we may be held liable for actions taken by agents in foreign countries where we operate, even though such parties are not always subject to our control. We have established anti-bribery policies and procedures and offer several channels for raising concerns in an effort to comply with the laws and regulations applicable to us. However, there can be no assurance that our policies and procedures will effectively prevent us from violating these laws and regulations in every transaction in which we may engage. Any determination that we have violated the FCPA or other anti-bribery laws (whether directly or through acts of others, intentionally or through inadvertence) could result in sanctions that could have a material adverse effect on our business, financial condition, and results of operations.
As we continue to expand our business globally, including through foreign acquisitions, we may have difficulty anticipating and effectively managing these and other risks that our international operations may face, which may adversely impact our business outside of the U.S. and our financial condition and results of operations. In addition, any acquisition of businesses with operations outside of the U.S. may exacerbate this risk.
We may be the subject of product liability claims or product recalls and we may not accurately estimate costs related to warranty claims. Expenses associated with product liability claims and lawsuits and related negative publicity or warranty claims in excess of our reserves could have a material adverse effect on our business, financial condition, and results of operations.
Our products are used in a wide variety of residential, non-residential, and architectural applications. We face the risk of exposure to product liability or other claims, including class action lawsuits, in the event our products are alleged to be defective or have resulted in harm to others or to property. We may in the future incur liability if product liability lawsuits against us are successful. Moreover, any such lawsuits, whether or not successful, could result in adverse publicity to us, which could cause our sales to decline materially. In addition, it may be necessary for us to recall defective products, which would also result in adverse publicity, as well as resulting in costs connected to the recall and loss of sales. We maintain insurance coverage to protect us against product liability claims, but that coverage may not be adequate to cover all claims that may arise or we may not be able to maintain adequate insurance coverage in the future at an acceptable cost. Any liability not covered by insurance could have a material adverse effect on our business, financial condition, and results of operations.
In addition, consistent with industry practice, we provide warranties on many of our products and we may experience costs associated with warranty claims if our products have defects in manufacture or design or they do not meet contractual specifications. We estimate our future warranty costs based on historical trends and product sales, but we may fail to accurately estimate those costs and thereby fail to establish adequate warranty reserves for them. If warranty claims exceed our estimates, it may have a material adverse effect on our business, financial condition, and results of operations.
We may be unable to protect our intellectual property, and we may face claims of intellectual property infringement.
We rely on a combination of patent, copyright, trademark, and trade secret laws, as well as confidentiality agreements, nondisclosure agreements, and other contractual commitments, to protect our intellectual property rights. However, these measures may not be adequate or sufficient, and third parties may not always respect these legal protections even if they are aware of them. In addition, our competitors may develop similar technologies and know-how without violating our intellectual property rights. Furthermore, the laws of foreign countries may not protect our intellectual property rights to the same extent as the laws of the U.S. The failure to obtain worldwide patent and trademark protection may result in other companies copying and marketing products based on our technologies or under brand or trade names similar to ours outside the jurisdictions in which we are protected. This could impede our growth in existing regions, create confusion among consumers, and result in a greater supply of similar products that could erode prices for our protected products.
Litigation may be necessary to protect our intellectual property rights. Intellectual property litigation can result in substantial costs, could distract our management, and could impinge upon other resources. Our failure to enforce and protect our intellectual property rights may cause us to lose brand recognition and result in a decrease in sales of our products.
Moreover, while we are not aware that any of our products or brands infringes upon the proprietary rights of others, third parties may make such claims in the future. Any infringement claims, regardless of merit, could be time-consuming and result in costly litigation or damages, undermine the exclusivity and value of our brands, decrease sales, or require us to enter into royalty or licensing agreements that may not be on acceptable terms and that could have a material adverse effect on our business, financial condition, and results of operations.
24
Our business will suffer if certain key officers or employees discontinue employment with us or if we are unable to recruit and retain highly skilled staff at a competitive cost.
The success of our business depends upon the skills, experience, and efforts of our key officers and employees. In recent years, we have hired a large number of key executives who have and will continue to be integral in the continuing transformation of our business. The loss of key personnel could have a material adverse effect on our business, financial condition, and results of operations. We do not maintain key-man life insurance policies on any members of management. Our business also depends on our ability to continue to recruit, train, and retain skilled employees, particularly skilled sales personnel. The loss of the services of any key personnel, or our inability to hire new personnel with the requisite skills, could impair our ability to develop new products or enhance existing products, sell products to our customers or manage our business effectively. Should we lose the services of any member of our senior management team, our board of directors would have to conduct a search for a qualified replacement. This search may be prolonged, and we may not be able to locate and hire a qualified replacement. A significant increase in the wages paid by competing employers could result in a reduction of our qualified labor force, increases in the wage rates that we must pay, or both.
Our pension plan obligations are currently not fully funded, and we may have to make significant cash payments to these plans, which would reduce the cash available for our businesses.
Although we have closed our U.S. pension plan to new participants and have frozen future benefit accruals for
current participants, we continue to have unfunded obligations under that plan. The funded levels of our pension plan depend upon many factors, including returns on invested assets, certain market interest rates, and the discount rate used to determine pension obligations. The projected benefit obligation and unfunded liability included in our consolidated financial statements as of December 31, 2016, for our U.S. pension plan were approximately $405.3 million and $109.3 million, respectively. Unfavorable returns on the plan assets or unfavorable changes in applicable laws or regulations could materially change the timing and amount of required plan funding, which would reduce the cash available for our operations. In addition, a decrease in the discount rate used to determine pension obligations could increase the estimated value of our pension obligations, which would affect the reported funding status of our pension plans and would require us to increase the amounts of future contributions. Additionally, we have foreign defined benefit plans, some of which continue to be open to new participants. As of December 31, 2016, our foreign defined benefit plans had unfunded pension liabilities of approximately $16.7 million.
Under ERISA, the PBGC also has the authority to terminate an underfunded tax-qualified U.S. pension plan under certain circumstances. In the event our tax-qualified U.S. pension plans were terminated by the PBGC, we could be liable to the PBGC for an amount that exceeds the underfunding disclosed in our consolidated financial statements. In addition, because our U.S. pension plan has unfunded obligations, if we have a substantial cessation of operations at a U.S. facility and, as a result of such cessation of operations an event under ERISA Section 4062(e) is triggered, additional liabilities that exceed the amounts disclosed in our consolidated financial statements could arise, including an obligation for us to provide additional contributions or alternative security for a period of time after such an event occurs. Any such action could have a material adverse effect on our business, financial condition, and results of operations.
Changes in accounting standards, new interpretations of existing standards and subjective assumptions, estimates, and judgments by management related to complex accounting matters could significantly affect our financial results or financial condition.
Generally accepted accounting principles and related accounting pronouncements, implementation guidelines and interpretations with regard to a wide range of matters that are relevant to our business, such as revenue recognition, asset impairment, impairment of goodwill and other intangible assets, inventories, lease obligations, self-insurance, tax matters, and litigation, are highly complex and involve many subjective assumptions, estimates, and judgments. Changes in these rules or their interpretation or changes in underlying assumptions, estimates, or judgments could significantly change our reported results.
Risks Relating to our Indebtedness
Our indebtedness could adversely affect our financial flexibility and our competitive position.
We are a highly leveraged company. As of December 31, 2016, we had $1,611.6 million of term loans outstanding under the Term Loan Facility and no revolving borrowings outstanding under the ABL Facility. In February 2017, we repaid $375 million of such term loans. After giving effect to $37.0 million of letters of credit outstanding under the ABL Facility, we had $226.9 million available for borrowing under the ABL Facility. As of December 31, 2016, we had AUD $40.5 million ($33.3 million) available and no borrowings outstanding under the Australia Senior Secured Credit Facility, and €37.3 million ($39.3 million) available, after giving effect to €1.0 million ($1.0 million) of guarantees and letters of credit outstanding, and €0.7 million ($0.7 million) in borrowings outstanding under the Euro Revolving Facility. Our 2016 cash interest expense was $73.9 million. See
25
Item 7 - Management’s Discussion and Analysis of Financial Condition and Results of Operations- Lines of Credit and Long-Term Debt-Interest Rate Swaps for a description of when our various hedging agreements became effective.
Our level of indebtedness increases the risk that we may be unable to generate cash sufficient to pay amounts due in respect of our indebtedness and could have other material consequences, including:
• | limiting our ability to obtain financing in the future for working capital, capital expenditures, acquisitions, debt service, or other general corporate purposes; |
• | requiring us to use a substantial portion of our available cash flow to service our debt, which will reduce the amount of cash flow available for working capital, capital expenditures, acquisitions, and other general corporate purposes; |
• | increasing our vulnerability to general economic downturns and adverse industry conditions; |
• | limiting our flexibility in planning for, or reacting to, changes in our business and in our industry in general; |
• | limiting our ability to invest in and develop new products; |
• | placing us at a competitive disadvantage compared to our competitors that are not as highly leveraged, as we may be less capable of responding to adverse economic conditions, general economic downturns, and adverse industry conditions; |
• | restricting the way we conduct our business because of financial and operating covenants in the agreements governing our existing and future indebtedness; |
• | increasing the risk of our failing to satisfy our obligations with respect to borrowings outstanding under our Credit Facilities and/or being able to comply with the financial and operating covenants contained in our debt instruments, which could result in an event of default under the credit agreements governing our Credit Facilities and the agreements governing our other debt that, if not cured or waived, could have a material adverse effect on our business, financial condition, and results of operations; and |
• | increasing our cost of borrowing. |
The credit agreements governing our Credit Facilities impose significant operating and financial restrictions on us that may prevent us from capitalizing on business opportunities.
The credit agreements governing our Credit Facilities impose significant operating and financial restrictions on us. These restrictions limit our ability, among other things, to:
• | incur additional indebtedness; |
• | make certain loans or investments or restricted payments, including dividends to our shareholders; |
• | repurchase or redeem capital stock; |
• | engage in transactions with affiliates; |
• | sell certain assets (including stock of subsidiaries) or merge with or into other companies; |
• | guarantee indebtedness; and |
• | create or incur liens. |
Under the terms of the ABL Facility, we will at times be required to comply with a specified fixed charge coverage ratio when the amount of certain unrestricted cash balances of the U.S. and Canadian loan parties plus the amount available for borrowing by the U.S. borrowers and Canadian borrowers is less than a specified amount. The Australia Senior Secured Credit Facility and the Euro Revolving Facility also contain financial maintenance covenants. Our ability to meet the specified covenants could be affected by events beyond our control, and our failure to meet these covenants will result in an event of default as defined in the applicable facility.
In addition, our ability to borrow under the ABL Facility is limited by the amount of the borrowing base applicable to U.S. dollar and Canadian dollar borrowings. Any negative impact on the elements of our borrowing base, such as eligible accounts receivable and inventory, will reduce our borrowing capacity under the ABL Facility. Moreover, the ABL Facility provides discretion to the agent bank acting on behalf of the lenders to impose additional requirements on what accounts receivable and inventory may be counted toward the borrowing base availability and to impose other reserves, which could materially impair the
26
amount of borrowings that would otherwise be available to us. There can be no assurance that the agent bank will not impose such reserves or, were it to do so, that the resulting impact of this action would not materially and adversely impair our liquidity.
As a result of these covenants and restrictions, we are limited in how we conduct our business, and we may be unable to raise additional debt or equity financing to compete effectively or to take advantage of new business opportunities or engage in other activities that may be in our long-term best interests. The terms of any future indebtedness we may incur could include more restrictive covenants. We cannot assure you that we will be able to maintain compliance with these covenants in the future and, if we fail to do so, we may be unable to obtain waivers from the lenders or amend the covenants.
Our failure to comply with the credit agreements governing our Credit Facilities, including as a result of events beyond our control, could trigger events of default and acceleration of our indebtedness. Defaults under our debt agreements could have a material adverse effect on our business, financial condition, and results of operations.
If there were an event of default under the credit agreements governing our Credit Facilities, or other indebtedness that we may incur, the holders of the defaulted indebtedness could cause all amounts outstanding with respect to that indebtedness to be immediately due and payable. It is likely that our cash flows would not be sufficient to fully repay borrowings under our Credit Facilities, if accelerated upon an event of default. If we are unable to repay, refinance, or restructure our secured debt, the holders of such indebtedness may proceed against the collateral securing that indebtedness.
Furthermore, any event of default or declaration of acceleration under one debt instrument may also result in an event of default under one or more of our other debt instruments. In exacerbated or prolonged circumstances, one or more of these events could result in our bankruptcy or liquidation. Accordingly, any default by us on our debt could have a material adverse effect on our business, financial condition, and results of operations.
We require a significant amount of liquidity to fund our operations, and borrowing has increased our vulnerability to negative unforeseen events.
Our liquidity needs vary throughout the year. If our business experiences materially negative unforeseen events, we may be unable to generate sufficient cash flow from operations to fund our needs or maintain sufficient liquidity to operate and remain in compliance with our debt covenants, which could result in reduced or delayed purchases of raw materials, planned capital expenditures and other investments and adversely affect our financial condition or results of operations. Our ability to borrow under the ABL Facility may be limited due to decreases in the borrowing base as described above.
Despite our current debt levels, we may incur substantially more indebtedness. This could further exacerbate the risks associated with our substantial leverage.
We may incur substantial additional indebtedness in the future. Although the covenants under the credit agreements governing our Credit Facilities provide certain restrictions on our ability to incur additional debt, the terms of such credit agreements permit us to incur significant additional indebtedness. To the extent that we incur additional indebtedness, the risk associated with our substantial indebtedness described above, including our possible inability to service our indebtedness, will increase.
Risks Related to Ownership of Our Common Stock
The market price of our common stock may be highly volatile, and you may not be able to resell your shares at or above the price you paid.
Our common stock has only recently been listed for public trading. The trading price of our common stock may be volatile. Securities markets worldwide experience significant price and volume fluctuations. This market volatility, as well as other general economic, market or political conditions, could reduce the market price of our common shares in spite of our operating performance. The following factors, in addition to other factors described in this “Risk Factors” section and elsewhere in this Form 10-K, may have a significant impact on the market price of our common stock:
• | negative trends in global economic conditions and/or activity levels in our end markets; |
• | increases in interest rates used to finance home construction and improvements; |
• | our ability to compete effectively against our competitors; |
• | changes in consumer needs, expectations, or trends; |
27
• | our ability to maintain our relationships with key customers; |
• | our ability to implement our business strategy; |
• | our ability to complete and integrate new acquisitions; |
• | variations in the prices of raw materials used to manufacture our products; |
• | adverse changes in building codes and standards or governmental regulations applicable to general business operations; |
• | product liability claims or product recalls; |
• | any legal actions in which we may become involved, including disputes relating to our intellectual property; |
• | our ability to recruit and retain highly skilled staff; |
• | actual or anticipated fluctuations in our quarterly or annual operating results; |
• | trading volume of our common stock; |
• | sales of our common stock by us, our executive officers and directors, or our shareholders (including certain affiliates of Onex) in the future; and |
• | general economic and market conditions and overall fluctuations in the U.S. equity markets. |
In addition, broad market and industry factors may negatively affect the market price of our common stock, regardless of our actual operating performance, and factors beyond our control may cause our stock price to decline rapidly and unexpectedly. Furthermore, the stock market has experienced extreme volatility that, in some cases, has been unrelated or disproportionate to the operating performance of particular companies.
We may be subject to securities litigation, which is expensive and could divert management attention.
Our share price may be volatile and, in the past, companies that have experienced volatility in the market price of their stock have been subject to securities class action litigation. We may be the target of this type of litigation in the future. Litigation of this type could result in substantial costs and diversion of management’s attention and resources, which could have a material adverse effect on our business, financial condition, and results of operations. Any adverse determination in litigation could also subject us to significant liabilities.
Because Onex controls the majority of our common stock, it may control all major corporate decisions and its interests may conflict with the interests of other holders of our common stock.
Onex beneficially owns approximately 62,787,969 shares of our common stock, representing 59.9% of our outstanding common stock. Accordingly, for so long as Onex continues to hold the majority of our common stock, Onex will be able to influence or control matters requiring approval by our shareholders and/or our board of directors, including the election of directors and the approval of business combinations or dispositions and other extraordinary transactions. They may also have interests that differ from yours and may vote in a way with which you disagree and which may be adverse to your interests. The concentration of ownership may have the effect of delaying, preventing, or deterring a change of control of our company, could deprive our shareholders of an opportunity to receive a premium for their common stock as part of a sale of our company and may materially and adversely affect the market price of our common stock. In addition, Onex may in the future own businesses that directly compete with ours.
Our directors who have relationships with Onex may have conflicts of interest with respect to matters involving our Company.
Two of our ten directors are affiliated with Onex. These persons have fiduciary duties to both us and Onex. As a result, they may have real or apparent conflicts of interest on matters affecting both us and Onex, which in some circumstances may have interests adverse to ours. Onex is in the business of making or advising on investments in companies and may hold, and may from time to time in the future acquire, interests in, or provide advice to, businesses that directly or indirectly compete with certain portions of our business or that are suppliers or customers of ours. In addition, as a result of Onex’ ownership interest, conflicts of interest could arise with respect to transactions involving business dealings between us and Onex including potential acquisitions of businesses or properties, the issuance of additional securities, the payment of dividends by us, and other matters.
In addition, our restated certificate of incorporation provides that the doctrine of “corporate opportunity” will not apply with respect to us, to Onex or certain related parties or any of our directors who are employees of Onex or its affiliates in a manner
28
that would prohibit them from investing in competing businesses or doing business with our customers. To the extent they invest in such other businesses, Onex may have differing interests than our other shareholders.
We are a “controlled company” within the meaning of the rules of the NYSE and, as a result, will qualify for, and may rely on, exemptions from certain corporate governance requirements.
Onex owns the majority of our outstanding common stock. As a result, we are a “controlled company” within the meaning of the NYSE corporate governance standards. A company of which more than 50% of the voting power is held by an individual, a group or another company is a “controlled company” within the meaning of the rules of the NYSE and may elect not to comply with certain corporate governance requirements of the NYSE, including:
• | the requirement that a majority of our board consist of independent directors; |
• | the requirement that we have a nominating/corporate governance committee that is composed entirely of independent directors with a written charter addressing the committee’s purpose and responsibilities; |
• | the requirement that we have a compensation committee that is composed entirely of independent directors with a written charter addressing the committee’s purpose and responsibilities; and |
• | the requirement for an annual performance evaluation of the governance and nominating committee and compensation committee. |
We currently rely on certain of the exemptions listed above: we do not have a majority of independent directors, and our governance and nominating and compensation committees do not consist entirely of independent directors. The independence standards are intended to ensure that directors who meet those standards are free of any conflicting interest that could influence their actions as directors. Accordingly, our shareholders do not have the same protections afforded to shareholders of companies that are subject to all of the corporate governance requirements of the NYSE.
In addition, on June 20, 2012, the SEC adopted Rule 10C-1 under the Securities Exchange Act of 1934, as amended, or the Exchange Act, to implement provisions of the Dodd-Frank Act pertaining to compensation committee independence and the role and disclosure of compensation consultants and other advisers to the compensation committee. The national securities exchanges have since adopted amendments to their existing listing standards to comply with provisions of Rule 10C-1, and on January 11, 2013, the SEC approved such amendments. The amended listing standards require, among others, that
• | compensation committees be composed of fully independent directors, as determined pursuant to new and existing independence requirements; |
• | compensation committees be explicitly charged with hiring and overseeing compensation consultants, legal counsel and other committee advisers; and |
• | compensation committees are required to consider, when engaging compensation consultants, legal counsel or other advisers, certain independence factors, including factors that examine the relationship between the consultant or adviser’s employer and us. |
As a “controlled company”, we are not subject to these compensation committee independence requirements.
The requirements of being a public company, including compliance with the reporting requirements of the Exchange Act and the requirements of the Sarbanes-Oxley Act and the NYSE, may strain our resources, increase our costs and distract management, and we may be unable to comply with these requirements in a timely or cost-effective manner.
As a public company, we are subject to the reporting requirements of the Exchange Act and the corporate governance standards of the Sarbanes-Oxley Act of 2002, or the Sarbanes-Oxley Act, and the NYSE and SEC rules and requirements. As a result, we have incurred and will continue to incur significant legal, regulatory, accounting, investor relations, and other costs that we did not incur as a private company. These requirements may also place a strain on our management, systems, and resources. To maintain and improve the effectiveness of our disclosure controls and procedures and internal controls over financial reporting and comply with the Exchange Act and NYSE requirements, significant resources and management oversight will be required. As a public company we are required to:
• | expand the roles and duties of our board of directors and committees of the board; |
• | institute more formal comprehensive financial reporting and disclosure compliance functions; |
• | supplement our internal accounting and auditing function; |
29
• | enhance and formalize closing procedures for our accounting periods; |
• | enhance our investor relations function; |
• | establish new or enhanced internal policies, including those relating to disclosure controls and procedures; and |
• | involve and retain to a greater degree outside counsel and accountants in the activities listed above. |
These activities may divert management’s attention from revenue producing activities to management and administrative oversight. Any of the foregoing could have a material adverse effect on us and the price of our common stock. In addition, failure to comply with any laws or regulations applicable to us may result in legal proceedings and/or regulatory investigations.
Material weaknesses in our internal control over financial reporting or our failure to remediate such material weaknesses could result in a violation of Section 404 of the Sarbanes-Oxley Act, or in a material misstatement in our financial statements not being prevented or detected, and could affect investor confidence in the accuracy and completeness of our financial statements, as well as our common stock price.
As a public company, we are required to comply with Section 404 of the Sarbanes-Oxley Act. We will be required to make our first annual assessment of our internal control over financial reporting pursuant to Section 404 of the Sarbanes-Oxley Act with our Second Form 10-K for the fiscal year ending December 31, 2017 and to include an auditor attestation on management’s internal controls report with our third Form 10-K for the fiscal year ending December 31, 2018. If we fail to abide by the requirements of Section 404 at the time of our third Form 10-K, regulatory authorities, such as the SEC, might subject us to sanctions or investigation, and our independent registered public accounting firm may not be able to certify as to the effectiveness of our internal control over financial reporting pursuant to an audit of our controls. Even effective internal controls can provide only reasonable assurance with respect to the preparation and fair presentation of financial statements. Accordingly, our internal control over financial reporting may not prevent or detect misstatements because of their inherent limitations, including the possibility of human error, the circumvention or overriding of controls, or fraud.
During the preparation of our December 31, 2015 financial statements, we identified material weaknesses in our internal control over financial reporting. A material weakness is defined as a deficiency, or a combination of deficiencies, in internal control over financial reporting, such that there is a reasonable possibility that a material misstatement of our financial statements will not be prevented or detected on a timely basis. During 2015, we restructured how we manage our Europe business, which led to turnover in the accounting staff of our Europe operations. In addition, our tax department had significant turnover during 2015, leaving the department with recently hired personnel who were unfamiliar with our year-end closing process, which resulted in our tax department being unable to complete its standard fiscal year close work in a timely manner. As a result, our staff did not have adequate time to properly review the information provided to our registered public accounting firm as part of the audit. Our registered public accounting firm identified numerous errors in the schedules and disclosures provided to them during the audit process. While such errors were rectified prior to the completion of the 2015 audit, and there were no material misstatements identified in our disclosures or financial statements subsequent to year-end, management and our registered public accounting firm determined that (i) we did not operate controls to monitor the accuracy of income tax expense and related balance sheet accounts, including deferred income taxes, and (ii) we failed to operate controls to monitor the presentation and disclosure of income taxes. As a result of these material weaknesses, management determined that the ineffective controls over income tax accounting constituted material weaknesses and has begun the remediation process. See Item 9A - Controls and Procedures for additional information.
While we continue to address these material weaknesses and to strengthen our overall internal control over financial reporting, we may discover other material weaknesses going forward that could result in inaccurate reporting of our financial condition or results of operations. In addition, neither our management nor any independent registered public accounting firm has ever performed an evaluation of our internal control over financial reporting in accordance with the provisions of the Sarbanes-Oxley Act because no such evaluation has been required. Had we or our independent registered public accounting firm performed an evaluation of our internal control over financial reporting in accordance with the provisions of the Sarbanes-Oxley Act, additional material weaknesses may have been identified. Inadequate internal control over financial reporting may cause investors to lose confidence in our reported financial information. Any loss of confidence in the reliability of our financial statements or other negative reaction to our failure to develop timely or adequate disclosure controls and procedures or internal controls could result in a decline in the price of our common stock and may restrict access to the capital markets and may adversely affect the price of our common stock.
30
Future sales, or the perception of future sales, of shares of our common stock in the public market by us or our existing shareholders could cause our stock price to fall.
Upon completion of our IPO, we had 104,881,631 shares of common stock outstanding. Of these securities, 28,750,000 shares of common stock offered pursuant to the IPO became freely tradable without restriction or further registration under federal securities laws, except to the extent shares were purchased by our affiliates. The 66,673,123 shares of common stock owned by our executive officers, directors, and affiliates, as that term is defined in the Securities Act are “restricted securities” under the Securities Act. Restricted securities may not be sold in the public market unless the sale is registered under the Securities Act or an exemption from registration is available.
Our executive officers and directors, and our existing shareholders that own approximately 97% of our outstanding common stock prior to our IPO, including Onex, have entered into lock-up agreements that prevent the sale of shares of our common stock for up to 180 days after the date of our IPO, subject to waiver by Barclays Capital Inc. and Citigroup Global Markets Inc. Following the expiration of the lock-up period, Onex will have the right, subject to certain conditions, to require us to register the sale of these shares under the federal securities laws. If this right is exercised, holders of all shares subject to a registration rights agreement will be entitled to participate in such registration. By exercising their registration rights, and selling a large number of shares, these holders could cause the prevailing market price of our common stock to decline. Approximately 95% of the shares of our common stock outstanding prior to the IPO are subject to a registration rights agreement. In addition, shares issued or issuable upon exercise of options and vested RSUs will be eligible for sale from time to time.
Our employees, officers, and directors may elect to sell shares of our common stock in the public market. Sales of a substantial number of shares of our common stock in the public market could depress the market price of our common stock and impair our ability to raise capital through the sale of additional equity securities.
The ESOP was designed as a tax-qualified retirement plan and employee stock ownership plan under the Code. Under this plan, participants whose employment with us or our subsidiaries is terminated are entitled to receive distributions of accounts held under the ESOP at specified times and in specified forms. In order to fund cash distributions, the ESOP may sell shares of our common stock from time to time. In the years ended December 31, 2016, 2015, and 2014, the ESOP sold approximately zero, $12.1 million, and $14.8 million, respectively, of our common stock to fund required distributions.
In the future, we may issue securities to raise cash for acquisitions or otherwise. We may also acquire interests in other companies by using a combination of cash and our common stock or just our common stock. We may also issue securities convertible into our common stock. Any of these events may dilute your ownership interest in our company and have an adverse impact on the price of our common stock.
If securities or industry analysts do not publish or cease publishing research or reports about us, our business, or our market, or if they adversely change their recommendations or publish negative reports regarding our business or our stock, our stock price and trading volume could decline.
The trading market for our common stock will be influenced by the research and reports that industry or securities analysts may publish about us, our business, our market, or our competitors. We do not have any control over these analysts and we cannot provide any assurance that analysts will cover us or provide favorable coverage. If any of the analysts who may cover us adversely change their recommendation regarding our stock, or provide more favorable relative recommendations about our competitors, our stock price could decline. If any analyst who may cover us were to cease coverage of our company or fail to regularly publish reports on us, we could lose visibility in the financial markets, which in turn could cause our stock price or trading volume to decline.
Because we have no current plans to pay cash dividends on our shares of common stock, shareholders must rely on appreciation of the value of our common stock for any return on their investment.
We currently anticipate that we will retain future earnings for the development, operation, and expansion of our business and have no current plans to declare or pay any cash dividends in the foreseeable future. In addition, the terms of our Credit Facilities and any future debt agreements may preclude us from paying dividends. As a result, we expect that only appreciation of the price of our common stock, if any, will provide a return to shareholders for the foreseeable future.
31
Some provisions of our charter documents and Delaware law may have anti-takeover effects that could discourage an acquisition of us by others, even if an acquisition would be beneficial to our shareholders, and may prevent attempts by our shareholders to replace or remove our current management.
Provisions in our restated certificate of incorporation and our amended and restated bylaws, as well as provisions of the DGCL, could make it more difficult for a third party to acquire us or increase the cost of acquiring us, even if doing so would benefit our shareholders, including transactions in which shareholders might otherwise receive a premium for their shares. Among other things, our restated certificate of incorporation and amended and restated bylaws:
• | divide our board of directors into three classes with staggered three-year terms; |
• | limit the ability of shareholders to remove directors only “for cause” if Onex ceases to own more than 50% of the voting power of all our outstanding common stock; |
• | provide that our board of directors is expressly authorized to adopt, alter, or repeal our bylaws; |
• | authorize the issuance of blank check preferred stock that our board of directors could issue to increase the number of outstanding shares and to discourage a takeover attempt; |
• | prohibit shareholder action by written consent, which requires all shareholder actions to be taken at a meeting of our shareholders, if Onex ceases to own more than 50% of the voting power of all our outstanding common stock; |
• | prohibit our shareholders from calling a special meeting of shareholders if Onex ceases to own more than 50% of the voting power of all our outstanding common stock; |
• | establish advance notice requirements for nominations for election to our board of directors or for proposing matters that can be acted upon by shareholders at shareholder meetings; and |
• | require the approval of holders of at least two-thirds of the outstanding shares of common stock to amend our bylaws and certain provisions of our certificate of incorporation if Onex ceases to own more than 50% of the voting power of all our outstanding common stock. |
In addition, we have opted out of Section 203 of the DGCL, which, subject to some exceptions, prohibits business combinations between a Delaware corporation and an interested shareholder, which is generally defined as a shareholder who becomes a beneficial owner of 15% or more of a Delaware corporation’s voting stock for a three-year period following the date that the shareholder became an interested shareholder. At some time in the future, we may again be governed by Section 203. Section 203 could have the effect of delaying, deferring or preventing a change in control that our shareholders might consider to be in their best interests.
These anti-takeover defenses could discourage, delay or prevent a transaction involving a change in control of our company. These provisions could also discourage proxy contests and make it more difficult for you and other shareholders to elect directors of your choosing and cause us to take corporate actions other than those you desire.
Our restated certificate of incorporation provides, subject to limited exceptions, that the Court of Chancery of the State of Delaware is the exclusive forum for substantially all disputes between us and our shareholders, which could limit our shareholders’ ability to obtain a favorable judicial forum for disputes with us or our directors, officers or employees.
Our restated certificate of incorporation provides, unless we consent to an alternative forum, that the Court of Chancery of the State of Delaware (or, if such court does not have jurisdiction, the Superior Court of the State of Delaware, or, if such other court does not have jurisdiction, the U.S. District Court for the District of Delaware) shall be the exclusive forum for any claims, including claims on behalf of JWHI, brought by a shareholder (i) that are based upon a violation of a duty by a current or former director or officer or shareholder in such capacity or (ii) as to which the DGCL confers jurisdiction upon the Court of Chancery of the State of Delaware. This provision may limit a shareholder’s ability to bring a claim in a judicial forum that it finds favorable for disputes with us or our directors, officers or other employees, which may discourage such lawsuits against us and our directors, officers, and other employees. Alternatively, if a court were to find the provision contained in our restated certificate of incorporation to be inapplicable or unenforceable in an action, we may incur additional costs associated with resolving such action in other jurisdictions, which could adversely affect our business and financial condition.
Because we are a holding company with no operations of our own, we rely on dividends, distributions, and transfers of funds from our subsidiaries and we could be harmed if such distributions were not made in the future.
We are a holding company that conducts all of our operations through subsidiaries and the majority of our operating income is derived from our subsidiary JWI, our main operating subsidiary. Consequently, we rely on dividends or advances from
32
our subsidiaries. We have no current plans to declare or pay dividends on our common stock for the foreseeable future; however, to the extent that we determine in the future to pay dividends on our common stock, none of our subsidiaries will be obligated to make funds available to us for the payment of dividends. The ability of such subsidiaries to pay dividends to us is subject to applicable local law and may be limited due to terms of other contractual arrangements, including our indebtedness. Such laws and restrictions would restrict our ability to continue operations. In addition, Delaware law may impose requirements that may restrict our ability to pay dividends to holders of our common stock.
Item 1B - Unresolved Staff Comments.
None.
Item 2 - Properties.
We operate 115 manufacturing facilities, 25 distribution facilities, and 55 showrooms (which are often co-located with a manufacturing or distribution facility) located in 24 countries. In addition, we also own and lease other properties, including sales offices, closed facilities, and administrative office space in Klamath Falls, Oregon, which we own, as well as Charlotte, North Carolina; Birmingham, U.K.; and Sydney, Australia, each of which we lease. Our facilities in the U.S., Canada, St. Kitts, St. Maarten, Chile, Peru, and Mexico are used primarily for operations involving our North America segment; our facilities in the U.K., France, Austria, Switzerland, Hungary, Germany, Sweden, Denmark, Latvia, Estonia, Finland, and Russia are used primarily for operations involving our Europe segment; and our facilities in Australia, New Zealand, Malaysia, and Indonesia are used primarily for operations involving our Australasia segment. The following table provides certain information regarding our manufacturing, distribution, and showroom facilities.
Country | Facility Location | Operations | Status | |||
U.S. | Ozark, AL | Manufacturing (doors) | Leased | |||
Wedowee, AL | Manufacturing (doors) | Leased | ||||
Phoenix, AZ | Distribution | Owned | ||||
Oceanside, CA | Manufacturing (wall systems) | Leased | ||||
Rocklin, CA | Manufacturing (doors) | Owned | ||||
Vista, CA | Manufacturing (windows) | Leased | ||||
Coral Springs, FL | Distribution | Owned | ||||
Kissimmee, FL | Manufacturing (doors) | Owned | ||||
Venice, FL | Manufacturing (windows) | Leased | ||||
Aiea, HI | Manufacturing (windows) | Leased | ||||
Grinnell, IA | Manufacturing (multiple) | Owned | ||||
Rantoul, IL | Manufacturing (windows) | Owned | ||||
Ligonier, IN | Manufacturing (doors) | Owned | ||||
Dodson, LA | Manufacturing (door skins) | Owned | ||||
Caledonia, MI | Manufacturing (doors), Distribution | Leased | ||||
Grand Rapids, MI | Manufacturing (doors) | Owned | ||||
Lexington, NC | Manufacturing (doors) | Owned | ||||
North Wilkesboro, NC | Manufacturing (door skins) | Owned | ||||
Mt. Vernon, OH | Manufacturing (windows) | Owned | ||||
Pataskala, OH | Distribution | Leased | ||||
Bend, OR | Manufacturing (multiple) | Owned | ||||
Chiloquin, OR | Manufacturing (doors) | Owned | ||||
Klamath Falls, OR | Manufacturing (multiple) | Owned | ||||
Stayton, OR | Manufacturing (windows) | Owned | ||||
Pottsville, PA | Manufacturing (doors) | Owned | ||||
Ringtown, PA | Manufacturing (multiple) | Owned | ||||
Towanda, PA | Manufacturing (windows) | Owned | ||||
Garland, TX | Manufacturing (doors) | Leased | ||||
Grand Prairie, TX | Distribution | Leased | ||||
Sulphur Springs, TX | Manufacturing (doors) | Owned | ||||
33
Country | Facility Location | Operations | Status | |||
Ludlow, VT | Manufacturing (doors) | Owned | ||||
North Springfield, VT | Distribution | Leased | ||||
Kent, WA | Distribution | Leased | ||||
Tukwila, WA | Manufacturing (coatings) | Leased | ||||
Yakima, WA | Manufacturing (windows) | Owned | ||||
Hawkins, WI | Manufacturing (windows) | Owned | ||||
Craigsville, WV | Manufacturing (door skins) | Owned | ||||
Canada | Calgary, AB | Distribution (multiple) | Leased | |||
Edmonton, AB | Distribution | Leased | ||||
Abbottsford, BC | Distribution | Leased | ||||
Winnipeg, MB | Manufacturing (windows), Distribution | Owned | ||||
Amherst, NS | Distribution | Owned | ||||
Vaughn, ON | Manufacturing (windows) | Leased | ||||
St. Apollinaire, QC | Manufacturing (windows) | Owned | ||||
St. Henri, QC | Manufacturing (doors) | Owned | ||||
Saskatoon, SK | Distribution | Leased | ||||
St. Kitts | Basseterre | Distribution | Owned | |||
St. Maarten | Little Bay | Distribution | Leased | |||
Chile | Santiago | Manufacturing (doors) | Owned | |||
Peru | Lima | Manufacturing (doors) | Leased | |||
Mexico | Tijuana | Manufacturing (multiple) | Owned | |||
U.K. | Melton Mowbray | Manufacturing (multiple), Distribution | Both | |||
Penrith | Manufacturing (doors) | Owned | ||||
Sheffield | Manufacturing (doors) | Owned | ||||
France | Eauze | Manufacturing (doors) | Owned | |||
Ussel | Manufacturing (doors) | Owned | ||||
Austria | Linz | Showroom | Leased | |||
Pockstein | Manufacturing (doors) | Leased | ||||
Salzburg | Showroom | Leased | ||||
Vienna | Showroom | Leased | ||||
Spital am Pyhrn | Manufacturing (doors) | Owned | ||||
Croatia | Zagreb | Showroom | Leased | |||
Switzerland | Bremgarten | Manufacturing (doors) | Owned | |||
Chatel Saint Denis | Showroom | Leased | ||||
Rothrist | Showroom | Leased | ||||
Zurich | Showroom | Leased | ||||
Hungary | Lenti | Manufacturing (doors) | Owned | |||
Germany | Gutersloh | Distribution | Leased | |||
Mittweida | Manufacturing (frames) | Owned | ||||
Oettingen | Manufacturing (doors) | Owned | ||||
Sweden | Aastorp | Manufacturing (doors) | Owned | |||
Forserum | Manufacturing (doors) | Owned | ||||
Kungsater | Manufacturing (doors) | Owned | ||||
Vannas | Manufacturing (doors) | Owned | ||||
Denmark | Herning | Manufacturing (doors) | Owned | |||
Logstor | Manufacturing (doors) | Owned | ||||
Sdr. Felding | Manufacturing (doors) | Owned | ||||
Latvia | Aizkraukle | Manufacturing (multiple) | Owned | |||
Dobele | Manufacturing (doors) | Owned | ||||
Estonia | Rakvere | Manufacturing (multiple) | Owned | |||
34
Country | Facility Location | Operations | Status | |||
Finland | Kuopio | Manufacturing (doors) | Owned | |||
Vaasky | Manufacturing (doors) | Owned | ||||
Russia | St. Petersburg | Distribution | Leased | |||
Australia | Hume, ACT | Manufacturing (multiple) | Leased | |||
Alexandria, NSW | Showroom | Leased | ||||
Batemans Bay, NSW | Showroom | Leased | ||||
Brookvale, NSW | Manufacturing (windows), Showroom | Leased | ||||
Cardiff, NSW | Manufacturing (multiple), Showroom | Leased | ||||
Chatswood, NSW | Showrooms (multiple) | Leased | ||||
Coffs Harbor, NSW | Distribution | Leased | ||||
Dubbo, NSW | Showroom | Leased | ||||
Girraween, NSW | Manufacturing (windows) | Leased | ||||
Kotara, NSW | Showroom | Leased | ||||
Lansvale, NSW | Manufacturing (windows) | Owned | ||||
Moorebank, NSW | Manufacturing (showerscreens/wardrobes), Showroom | Leased | ||||
Ourimbah, NSW | Manufacturing (multiple), Showrooms (multiple) | Leased | ||||
Port Macquarie, NSW | Showroom | Leased | ||||
Queanbeyan, NSW | Manufacturing (multiple) | Owned | ||||
Tamworth, NSW | Manufacturing (windows), Showroom | Leased | ||||
Taren Point, NSW | Showroom | Leased | ||||
Thornleigh, NSW | Showroom | Leased | ||||
South Windsor, NSW | Manufacturing (windows), Showroom | Leased | ||||
St. Marys, NSW | Manufacturing (doors) | Owned | ||||
Wollongong, NSW | Showroom | Leased | ||||
Winnellie, NT | Distribution | Leased | ||||
Acacia Ridge, QLD | Manufacturing (doors) | Owned | ||||
Bundall, QLD | Showroom | Leased | ||||
Caboolture, QLD | Manufacturing (windows), Showroom | Leased | ||||
Cairns, QLD | Showroom | Leased | ||||
Coorparoo, QLD | Manufacturing (windows), Showrooms (multiple) | Leased | ||||
Currajong, QLD | Distribution | Leased | ||||
Helensvale, QLD | Manufacturing (windows) | Owned | ||||
Hervey Bay, QLD | Showroom | Leased | ||||
Kedron, QLD | Showroom | Leased | ||||
Maroochydore, QLD | Distribution, Showroom | Leased | ||||
Morningside, QLD | Manufacturing (windows) | Leased | ||||
Northgate, QLD | Manufacturing (glass) | Leased | ||||
Ormeau, QLD | Manufacturing (multiple), Showroom | Leased | ||||
Stones Corner, QLD | Showroom | Leased | ||||
Toowoomba, QLD | Showroom | Leased | ||||
Yatala, QLD | Manufacturing (multiple), Showroom | Owned | ||||
Edwardstown, SA | Showroom | Leased | ||||
Pooraka, SA | Manufacturing (windows), Showroom | Leased | ||||
Regency Park, SA | Manufacturing (multiple), Showrooms (multiple) | Both | ||||
Salisbury, SA | Manufacturing (windows) | Leased | ||||
Unley, SA | Showroom | Leased | ||||
Airport West, VIC | Showroom | Leased | ||||
Albury, VIC | Manufacturing (multiple), Showroom | Leased | ||||
Ballarat, VIC | Showrooms (multiple) | Leased | ||||
Bayswater, VIC | Manufacturing (windows), Showroom | Leased | ||||
35
Country | Facility Location | Operations | Status | |||
Bendigo, VIC | Showroom | Leased | ||||
Campbellfield, VIC | Showroom | Leased | ||||
Clayton, VIC | Manufacturing (multiple), Showroom | Leased | ||||
Dandenong, VIC | Manufacturing (doors) | Owned | ||||
Mitcham, VIC | Manufacturing (windows) | Leased | ||||
North Geelong, VIC | Showroom | Leased | ||||
Rowville, VIC | Manufacturing (multiple), Showroom | Owned | ||||
Seaford, VIC | Manufacturing (windows) | Leased | ||||
Shepparton, VIC | Showroom | Leased | ||||
South Geelong, VIC | Showroom | Leased | ||||
Canning Vale, WA | Manufacturing (doors) | Owned | ||||
Wangara, WA | Manufacturing (multiple), Showroom | Leased | ||||
Welshpool, WA | Distribution | Leased | ||||
New Zealand | East Tamaki | Distribution | Leased | |||
Malaysia | Klang | Manufacturing (multiple) | Owned | |||
Indonesia | Cicadas | Manufacturing (doors) | Owned | |||
Item 3 - Legal Proceedings
We are involved in various legal proceedings, claims, and government audits arising in the ordinary course of business. While the outcome of any pending matters is currently not determinable, management does not expect that the ultimate costs to resolve such matters will have a material adverse effect on our financial position, results of operations or cash flows.
We sell molded door skins to certain customers pursuant to long-term contracts, and these customers in turn use the molded door skins to manufacture interior doors and compete directly against us in the marketplace. We have given notice of termination of one of these contracts and, on June 29, 2016, the counterparty to the agreement, Steves filed a claim against JWI in the U.S. District Court for the Eastern District of Virginia, Richmond Division. The complaint alleges that our acquisition of CMI, together with subsequent price increases and termination of the contract, violated antitrust laws and constituted a breach of contract, breach of warranty, and tort. The complaint seeks injunctive relief, ordinary and treble damages, and declaratory relief. We believe Steves’ claims lack merit and intend to defend vigorously against this action.
Item 4 - Mine Safety Disclosures.
Not applicable.
36
Item 5 - Market for Registrant's Common Equity, Related Shareholder Matters and Issuer Purchases of Equity Securities.
MARKET INFORMATION
On February 1, 2017, we closed our IPO at an initial offering price of $23.00 per share. Prior to that time, there was no public market for our stock. Our common stock is traded on the NYSE under the symbol "JELD."
HOLDERS
As of February 17, 2017, there were 331 shareholders of record of our common stock. The number of record holders does not include persons who held shares of our common stock in nominee or "street name" accounts through brokers.
EQUITY COMPENSATION PLANS
See Item 12- Security Ownership of Certain Beneficial Owners and Management and Related Shareholder Matters for the information required by Item 5- Market for Registrant's Common Equity, Related Shareholder Matters and Issuer Purchases of Equity Securities of Form 10-K regarding equity compensation plans.
DIVIDENDS
In July 2015, we paid an aggregate cash dividend of approximately $84.5 million to holders of our outstanding common stock, approximately $0.4 million to holders of our outstanding Class B-1 Common Stock and approximately $335.2 million to holders of our outstanding Series A Convertible Preferred Stock. The payment to holders of our Series A Convertible Preferred Stock represented payment for (i) preferred dividends accrued from January 1, 2015 through July 31, 2015 and (ii) a dividend on an as-if-converted-to-common basis based on the original principal amount of the Series A Convertible Preferred Stock investment plus preferred dividends accrued through December 31, 2014.
In November 2016, we paid an aggregate cash dividend of approximately $73.8 million to holders of our outstanding common stock, approximately $0.9 million to holders of our outstanding Class B-1 Common Stock, and approximately $307 million to holders of our outstanding Series A Convertible Preferred Stock. The payment to holders of our outstanding Series A Convertible Preferred Stock represented payment for (i) preferred dividends accrued from May 31, 2016 through November 3, 2016 and (ii) a dividend on an as-if-converted-to common basis based on the original principal amount of the Series A Convertible Preferred Stock investment plus preferred dividends accrued through May 30, 2016.
We do not currently expect to pay any further cash dividends on our common stock for the foreseeable future. Instead, we intend to retain future earnings, if any, for the future operation and expansion of our business and the repayment of debt. Any determination to pay dividends in the future will be at the discretion of our board of directors and will depend upon our results of operations, cash requirements, financial condition, contractual restrictions, restrictions imposed by applicable laws and other factors that our board of directors may deem relevant.
The terms of our Corporate Credit Facilities were amended in July 2015 and November 2016 to permit the cash dividends described above, but the covenants of our existing or future indebtedness may limit our ability to further pay dividends and make distributions to our shareholders. Our business is conducted through our subsidiaries and dividends from, and cash generated by, our subsidiaries will be our principal sources of cash to repay indebtedness, fund operations, and pay any dividends. Accordingly, our ability to pay dividends to our shareholders is dependent on the earnings and distributions of funds from our subsidiaries (which distributions may be restricted by the terms of our Corporate Credit Facilities).
USE OF PROCEEDS FROM OUR PUBLIC OFFERING
On January 26, 2017, our Registration Statement on Form S-1 (File No. 333-211761) was declared effective by the SEC for our IPO pursuant to which we registered and sold an aggregate of 22,272,727 shares of our common stock at a price of $23.00 per share. The offering commenced on January 26, 2017 and did not terminate before all of the securities registered in the registration statement were sold. The offering closed on February 1, 2017, resulting in net proceeds of $472.8 million to us after deducting underwriters' discounts and commissions of $32.0 million and other offering expenses of $7.5 million. No payments were made by us to directors, officers or persons owning 10% or more of our common stock or to their associates, or to our affiliates. Barclays, Citigroup, Credit Suisse, J.P. Morgan, Deutsche Bank Securities, RBC Capital Markets, BofA Merrill Lynch, Goldman, Sachs & Co. and Wells Fargo acted as joint book-running managers in the offering. Baird, FBR, and SunTrust Robinson Humphrey acted as co-managers in the offering.
37
We used or will use the net proceeds to us from the IPO as follows: (i) to pay fees and expenses of approximately $7.5 million in connection with the IPO, (ii) to repay $375 million of indebtedness outstanding under our Term Loan Facility; and (iii) working capital and other general corporate purposes, including sales and marketing activities, general and administrative matters, capital expenditures, and to invest in or acquire complementary businesses, products, services, technologies, or other assets.
There has been no material change in the use of proceeds as described in the final prospectus filed on January 30, 2017.
RECENT SALES OF UNREGISTERED SECURITIES
All share numbers regarding recent sales of unregistered securities are presented after giving effect to the 11-for-1 stock split of our common stock and Class B-1 Common Stock that was effected on January 3, 2017.
Plan-Related Issuances
In 2016, we granted to our directors, officers, employees, consultants, and other service providers options to purchase 106,546 and 260,854 shares of our common stock and Class B-1 Common Stock, respectively, with per share exercise prices ranging from $24.45 to $47.43 under our Stock Incentive Plan, which excludes options to purchase 253,506 shares of our common stock which have been forfeited and are no longer outstanding. The exercise price range above represents the exercise prices at the date of grant and do not reflect the subsequent reduction in exercise price for certain options approved in connection with the 2016 distributions to shareholders.
In 2016, we issued to our directors, officers, employees, consultants, and other service providers an aggregate of 30,063 shares of our common stock at per share purchase prices ranging from $14.07 to $30.60 and an aggregate of 109,175 shares of our Class B-1 Common Stock at per share purchase prices ranging from $11.77 to $49.36 pursuant to exercises of options granted under our Stock Incentive Plan. The exercise price range above represents the exercise prices at the date of exercise, including the exercise prices of options with an exercise price reduced in connection with the 2016 distribution.
In 2016, we granted to our directors, officers, employees, consultants, and other service providers an aggregate of 76,912 RSUs to be settled in shares of our common stock under our Stock Incentive Plan We issued 35,090 shares of common stock upon settlement of RSUs previously granted under our Stock Incentive Plan.
None of these foregoing transactions involved any underwriters, underwriting discounts or commissions, or any public offering. The sales of the above securities were deemed to be exempt from registration under the Securities Act in reliance upon Section 4(2) of the Securities Act (or Regulation D or Regulation S promulgated thereunder), or Rule 701 promulgated under Section 3(b) of the Securities Act as transactions by an issuer not involving any public offering or pursuant to benefit plans and contracts relating to compensation as provided under Rule 701. The recipients of the securities in each of these transactions represented their intentions to acquire the securities for investment only and not with a view to or for sale in connection with any distribution thereof, and appropriate legends were placed upon the stock certificates issued in these transactions.
Item 6 - Selected Financial Data.
The following table presents selected consolidated financial data for the periods and at the dates indicated. The selected consolidated financial data as of December 31, 2016, 2015, 2014 and 2013 and for each of the four years ended December 31, 2016 have been derived from our audited consolidated financial statements. The selected consolidated financial data as of December 31, 2012 and the year ended December 31, 2012 were derived from our unaudited consolidated financial statements. In 2014, we changed our method of accounting for inventory from the LIFO method to the FIFO method and retrospectively adjusted prior periods to apply this new method of accounting; however, the year ended December 31, 2012 was not reaudited following such adjustment. Our historical results are not necessarily indicative of the results expected for any future period. Since the year ended December 31, 2012, we have completed several acquisitions. The results of these acquired entities are included in our consolidated statements of comprehensive income (loss) for the periods subsequent to the respective acquisition date. The selected historical consolidated data set forth below should be read in conjunction with Item 1A- Risk Factors, Item 7- Management's Discussion and Analysis of Financial and Results of Operations, and our audited consolidated financial statements included in Item 8- Financial Statements and Supplementary Data.
During the second quarter of 2015, we early adopted the FASB ASU No. 2015-03, Simplifying the Presentation of Debt Issuance Costs, which resulted in the reclassification of unamortized debt issuance costs in our consolidated balance sheets. See Note 1- Summary of Significant Accounting Policies in our financial statements for the year ended December 31, 2016. All prior periods presented have been adjusted to apply these new accounting standards and policies retrospectively. Certain prior year
38
balances have been reclassified to conform to the current year’s presentation for the items discussed above. Such reclassifications had no material impact on net revenues, operating income (loss), net income (loss), or net cash from operating activities.
Year Ended December 31, | ||||||||||||||||||||
2016 | 2015 | 2014 | 2013 | 2012 | ||||||||||||||||
(dollars in thousands, except per share data) | ||||||||||||||||||||
Net revenues | $ | 3,666,799 | $ | 3,381,060 | $ | 3,507,206 | $ | 3,456,539 | $ | 3,167,856 | ||||||||||
Cost of sales | 2,866,805 | 2,715,125 | 2,919,864 | 2,946,463 | 2,606,562 | |||||||||||||||
Gross margin | 799,994 | 665,935 | 587,342 | 510,076 | 561,294 | |||||||||||||||
Selling, general and administrative | 589,407 | 512,126 | 488,477 | 482,088 | 504,766 | |||||||||||||||
Impairment and restructuring charges | 13,847 | 21,342 | 38,388 | 42,004 | 38,836 | |||||||||||||||
Operating income (loss) | 196,740 | 132,467 | 60,477 | (14,016 | ) | 17,692 | ||||||||||||||
Interest expense | (77,590 | ) | (60,632 | ) | (69,289 | ) | (71,362 | ) | (59,534 | ) | ||||||||||
Other income (expense) | 12,825 | 14,120 | (50,521 | ) | 12,323 | 9,519 | ||||||||||||||
Income (loss) before taxes, equity earnings (loss) and discontinued operations | 131,975 | 85,955 | (59,333 | ) | (73,055 | ) | (32,323 | ) | ||||||||||||
Income tax benefit (expense) | 225,596 | 5,435 | (18,942 | ) | (1,142 | ) | 5,488 | |||||||||||||
Income (loss) from continuing operations, net of tax | 357,571 | 91,390 | (78,275 | ) | (74,197 | ) | (26,835 | ) | ||||||||||||
Equity earnings (loss) of non-consolidated entities | 3,264 | 2,384 | (447 | ) | 943 | (957 | ) | |||||||||||||
(Loss) income from discontinued operations, net of tax | (3,324 | ) | (2,856 | ) | (5,387 | ) | (5,863 | ) | 1,293 | |||||||||||
Gain (loss) on sale of discontinued operations, net of tax | — | — | — | 10,711 | (241 | ) | ||||||||||||||
Net income (loss) | $ | 357,511 | $ | 90,918 | $ | (84,109 | ) | $ | (68,406 | ) | $ | (26,740 | ) | |||||||
Net loss attributable to common shareholders | ||||||||||||||||||||
Basic and diluted | $ | (39,136 | ) | $ | (290,500 | ) | $ | (184,143 | ) | $ | (157,205 | ) | $ | (99,575 | ) | |||||
Weighted average common shares outstanding | ||||||||||||||||||||
Basic and diluted | 17,992,879 | 18,296,003 | 20,440,057 | 21,113,895 | 22,022,561 | |||||||||||||||
Loss per common share from continuing operations | ||||||||||||||||||||
Basic and diluted | $ | (1.99 | ) | $ | (15.72 | ) | $ | (8.75 | ) | $ | (7.68 | ) | $ | (4.57 | ) | |||||
Cash dividends per common share | $ | 4.09 | $ | 4.73 | — | — | — | |||||||||||||
Other financial data: | ||||||||||||||||||||
Capital expenditures | $ | 79,497 | $ | 77,687 | $ | 70,846 | $ | 85,689 | $ | 91,884 | ||||||||||
Depreciation and amortization | 106,790 | 95,196 | 100,026 | 104,650 | 92,337 | |||||||||||||||
Adjusted EBITDA(1) | 394,132 | 310,986 | 229,849 | 153,210 | 183,361 | |||||||||||||||
Consolidated balance sheet data: | ||||||||||||||||||||
Cash, cash equivalents | $ | 102,701 | $ | 113,571 | $ | 105,542 | $ | 37,666 | $ | 41,826 | ||||||||||
Working capital | 362,684 | 326,973 | 316,055 | 234,171 | 99,423 | |||||||||||||||
Total assets | 2,516,296 | 2,182,373 | 2,184,059 | 2,290,897 | 2,415,036 | |||||||||||||||
Total current liabilities | 513,126 | 487,445 | 524,301 | 593,938 | 741,164 | |||||||||||||||
Total debt | 1,620,035 | 1,260,320 | 806,228 | 667,152 | 670,757 | |||||||||||||||
Redeemable convertible preferred stock | 150,957 | 481,937 | 817,121 | 817,121 | 745,478 | |||||||||||||||
Total shareholders' equity (deficit) | 41,922 | (231,745 | ) | (168,826 | ) | 54,444 | 96,411 | |||||||||||||
Statement of cash flows data: | ||||||||||||||||||||
Net cash flow provided by (used in): | ||||||||||||||||||||
Operating activities | $ | 201,583 | $ | 172,339 | $ | 21,788 | $ | (49,372 | ) | $ | 77,850 | |||||||||
Investing activities | (156,782 | ) | (158,452 | ) | (56,738 | ) | 13,939 | (158,486 | ) | |||||||||||
Financing activities | (52,001 | ) | (1,072 | ) | 105,617 | 34,633 | 64,436 | |||||||||||||
___________________________
(1) | In addition to our consolidated financial statements presented in accordance with GAAP, we use Adjusted EBITDA to measure our financial performance. Adjusted EBITDA is a supplemental non-GAAP financial measure of operating performance and is not based on any standardized methodology prescribed by GAAP. Adjusted EBITDA should not be considered in isolation or as an alternative to net income (loss), cash flows from operating activities, or other measures determined in accordance with GAAP. Also, Adjusted EBITDA is not necessarily comparable to similarly titled measures presented by other companies. Adjusted EBITDA margin is defined as Adjusted EBITDA divided by net revenues. |
39
We define Adjusted EBITDA as net income (loss), as adjusted for the following items: income (loss) from discontinued operations, net of tax; gain (loss) on sale of discontinued operations, net of tax; equity earnings (loss) of non-consolidated entities; income tax benefit (expense); depreciation and amortization; interest expense, net; impairment and restructuring charges; gain (loss) on sale of property and equipment; share-based compensation expense; non-cash foreign exchange transaction/translation income (loss); other non-cash items; other items; and costs related to debt restructuring, debt refinancing, and the Onex Investment.
We use this non-GAAP measure in assessing our performance in addition to net income (loss) determined in accordance with GAAP. We believe Adjusted EBITDA is an important measure to be used in evaluating operating performance because it allows management and investors to better evaluate and compare our core operating results from period to period by removing the impact of our capital structure (net interest income or expense from our outstanding debt), asset base (depreciation and amortization), tax consequences, other non-operating items, and share-based compensation. Furthermore, the instruments governing our indebtedness use Adjusted EBITDA to measure our compliance with certain limitations and covenants. We reference this non-GAAP financial measure frequently in our decision-making because it provides supplemental information that facilitates internal comparisons to the historical operating performance of prior periods. In addition, executive incentive compensation is based in part on Adjusted EBITDA, and we base certain of our forward-looking estimates and budgets on Adjusted EBITDA.
We also believe Adjusted EBITDA is a measure widely used by securities analysts and investors to evaluate the financial performance of our company and other companies. Adjusted EBITDA has limitations as an analytical tool, and you should not consider it in isolation, or as a substitute for analysis of our results as reported under GAAP. Adjusted EBITDA eliminates the effect of certain items on net income and thus has certain limitations. Some of these limitations are: Adjusted EBITDA does not reflect the interest expense, or the cash requirements necessary to service interest or principal payments, on our debt; Adjusted EBITDA does not reflect any income tax payments we are required to make and although depreciation and amortization are non-cash charges, the assets being depreciated and amortized will often have to be replaced in the future; and Adjusted EBITDA does not reflect any cash requirements for such replacement. Other companies may calculate Adjusted EBITDA differently, and, therefore, our Adjusted EBITDA may not be comparable to similarly titled measures of other companies.
The following is a reconciliation of our net income (loss), the most directly comparable GAAP financial measure, to Adjusted EBITDA:
Year Ended December 31, | ||||||||||||||||||||
2016 | 2015 | 2014 | 2013 | 2012 | ||||||||||||||||
(dollars in thousands) | ||||||||||||||||||||
Net income (loss) | $ | 357,511 | $ | 90,918 | $ | (84,109 | ) | $ | (68,406 | ) | $ | (26,740 | ) | |||||||
Adjustments: | ||||||||||||||||||||
Loss (income) from discontinued operations, net of tax | 3,552 | 2,856 | 5,387 | 5,863 | (1,293 | ) | ||||||||||||||
(Gain) loss on sale of discontinued operations, net of tax | (228 | ) | — | — | (10,711 | ) | 241 | |||||||||||||
Equity (earnings) loss of non-consolidated entities | (3,264 | ) | (2,384 | ) | 447 | (943 | ) | 957 | ||||||||||||
Income tax (benefit) expense | (225,596 | ) | (5,435 | ) | 18,942 | 1,142 | (5,488 | ) | ||||||||||||
Depreciation and amortization | 106,790 | 95,196 | 100,026 | 104,650 | 92,337 | |||||||||||||||
Interest expense, net | 77,590 | 60,632 | 69,289 | 71,362 | 59,534 | |||||||||||||||
Impairment and restructuring charges(a) | 18,353 | 31,031 | 38,645 | 44,413 | 41,402 | |||||||||||||||
(Gain) loss on sale of property and equipment | (3,275 | ) | (416 | ) | (23 | ) | (3,039 | ) | 430 | |||||||||||
Share-based compensation expense | 22,464 | 15,620 | 7,968 | 5,665 | 7,485 | |||||||||||||||
Non-cash foreign exchange transaction/translation loss (income) | 5,734 | 2,697 | (528 | ) | (4,114 | ) | (1,093 | ) | ||||||||||||
Other non-cash items(b) | 2,843 | 1,141 | 2,334 | (68 | ) | 2,549 | ||||||||||||||
Other items(c) | 30,585 | 18,893 | 20,278 | 7,284 | 7,418 | |||||||||||||||
Costs relating to debt restructuring, debt refinancing, and the Onex investment(d) | 1,073 | 237 | 51,193 | 112 | 5,622 | |||||||||||||||
Adjusted EBITDA | $ | 394,132 | $ | 310,986 | $ | 229,849 | $ | 153,210 | $ | 183,361 | ||||||||||
____________________________
(a) | Impairment and restructuring charges consist of (i) impairment and restructuring charges that are included in our consolidated statements of operations plus (ii) additional charges of $4,506, $9,687, $257, $2,409, and $2,565 for the years ended December 31, 2016, 2015, 2014, 2013, and 2012, respectively. These additional charges are primarily comprised of non-cash changes in inventory valuation reserves, such as excess and obsolete reserves. For further explanation of impairment and restructuring charges that are included in our consolidated statements of operations, see Note 25- Impairment and Restructuring Charges of Continuing Operations in our financial statements for the year ended December 31, 2016 included elsewhere in this Form 10-K. |
(b) | Other non-cash items include, among other things, (i) charges of $357, $893, $2,496, $0, and $0 for the years ended December 31, 2016, 2015, 2014, 2013, and 2012, respectively, relating to (1) the fair value adjustment for inventory acquired as part of the acquisitions referred to in Item 7- Management’s Discussion and Analysis of Financial Condition and Results of Operations- Acquisitions and (2) the impact of a change in how we capitalize overhead expenses in our valuation of inventory. In addition, other non-cash items include charges of $2,153 |
40
for the out-of-period European warranty liability adjustment in the year ending December 31, 2016 and $6,045 in the year ending December 31, 2012 relating to reserve amounts for service-based employee bonuses for periods prior to 2012, which are partially offset by a $3,560 gain related to the bargain purchase treatment of our CMI acquisition.
(c) | Other items not core to business activity include: (i) in the year ended December 31, 2016, (1) $20,695 payment to holders of vested options and restricted shares in connection with the November 2016 dividend, (2) $3,721 of professional fees related to the IPO of our common stock, (3) $1,626 of acquisition costs, (4) $584 in legal costs associated with disposition of non-core properties, (5) $507 of dividend payout related costs, (6) $500 of recruitment costs related to the recruitment of executive management employees, (7) $450 in legal costs associated with Steves and Sons, Inc., (8) $346 in Dooria plant closure costs, and (9) $265 related to a legal settlement accrual for CMI; (ii) in the year ended December 31, 2015, (1) $11,446 payment to holders of vested options and restricted shares in connection with the July 2015 dividend, (2) $5,510 related to a U.K. legal settlement, (3) $1,825 in acquisition costs, (4) $1,833 of recruitment costs related to the recruitment of executive management employees, and (5) $1,082 of legal costs related to non-core property disposition, partially offset by (6) $5,678 of realized gain on foreign exchange hedges related to an intercompany loan; (iii) in the year ended December 31, 2014, (1) $5,000 legal settlement related to our ESOP, (2) $3,657 of legal costs associated with noncore property disposition, (3) $3,443 production rampdown costs, (4) $2,769 of consulting fees in Europe, and (5) $1,250 of costs related to a prior acquisition; (iv) in the year ended December 31, 2013, (1) $2,869 of cash costs related to the delayed opening of our new Louisiana facility, (2) $774 of legal costs associated with non-core property disposition, (3) $582 related to the closure of our Marion, North Carolina facility, and (4) $458 of acquisition-related costs; and (v) in the year ended December 31, 2012, (1) $3,621 in acquisition costs, (2) $1,252 of cash costs related to non-restructuring severance of a former executive, and (3) $1,247 of cash costs related to the delayed opening of our new Louisiana facility. |
(d) | Included in the year ended December 31, 2014 is a loss on debt extinguishment of $51,036 associated with the refinancing of our 12.25% secured notes. Included in the year ended December 31, 2012 is $5,277 of fees incurred with SOX implementation. |
Item 7 - Management's Discussion and Analysis of Financial Condition and Results of Operations.
This MD&A contains forward-looking statements that involve risks and uncertainties. Please see “Forward-Looking Statements” in Item 1- Business and Item 1A- Risk Factors in this Form 10-K for a discussion of the uncertainties, risks and assumptions associated with these statements. This discussion should be read in conjunction with our historical financial statements and related notes thereto and the other disclosures contained elsewhere in this Form 10-K. The results of operations for the periods reflected herein are not necessarily indicative of results that may be expected for future periods, and our actual results may differ materially from those discussed in the forward-looking statements as a result of various factors, including but not limited to those listed under Item 1A- Risk Factors and included elsewhere in this Form 10-K.
This MD&A is a supplement to our financial statements and notes thereto included elsewhere in this Form 10-K and is provided to enhance your understanding of our results of operations and financial condition. Our discussion of results of operations is presented in millions throughout the MD&A and due to rounding may not sum or calculate precisely to the totals and percentages provided in the tables. Our MD&A is organized as follows:
• | Overview and Background. This section provides a general description of our Company and operating segments, business and industry trends, our key business strategies and background information on other matters discussed in this MD&A. |
• | Consolidated Results of Operations and Operating Results by Business Segment. This section provides our analysis and outlook for the significant line items on our consolidated statements of operations, as well as other information that we deem meaningful to an understanding of our results of operations on both a consolidated basis and a business segment basis. |
• | Liquidity and Capital Resources. This section provides an analysis of trends and uncertainties affecting liquidity, cash requirements for our business, sources and uses of our cash and our financing arrangements. |
• | Critical Accounting Policies and Estimates. This section discusses the accounting policies that we consider important to the evaluation and reporting of our financial condition and results of operations, and whose application requires significant judgments or a complex estimation process. |
• | Recently Issued Accounting Pronouncements. This section provides a summary of the most recent authoritative accounting pronouncements that we will be required to adopt in a future period. |
41
Overview and Background
We are one of the world’s largest door and window manufacturers, and we hold a leading position by net revenues in the majority of the countries and markets we serve. We design, produce, and distribute an extensive range of interior and exterior doors, wood, vinyl, and aluminum windows, and related products for use in the new construction, R&R of residential homes and, to a lesser extent, non-residential buildings.
We operate 115 manufacturing facilities in 19 countries, located primarily in North America, Europe, and Australia. For many product lines, our manufacturing processes are vertically integrated, enhancing our range of capabilities, our ability to innovate, and our quality control as well as providing supply chain, transportation, and working capital savings.
In October 2011, Onex acquired a majority of the combined voting power in the Company through the acquisition of convertible debt and convertible preferred equity. Following our IPO, Onex continues to own the majority of our common stock, and Onex has appointed the majority of our board of directors.
Business Segments
Our business is organized in geographic regions to ensure integration across operations serving common end markets and customers. We have three reportable segments: North America (which includes limited activity in Chile and Peru), Europe, and Australasia. In the year ended December 31, 2016, our North American operations accounted for 59% of net revenues ($2,149 million), our European operations accounted for 27% of net revenues ($1,009 million), and our Australasian operations accounted for 14% of net revenues ($509 million). In the year ended December 31, 2015, our North American operations accounted for 60% of net revenues ($2,016 million), our European operations accounted for 29% of net revenues ($996 million), and our Australasian operations accounted for 11% of net revenues ($369 million). Financial information related to our business segments and geographic locations can be found in Note 20- Segment Information in our financial statements for the year ended December 31, 2016 included elsewhere in this Form 10-K.
Acquisitions
In October 2012, we acquired CMI, headquartered in Towanda, Pennsylvania. CMI is a manufacturer and marketer of doors, door facings and exterior composite trim and is now part of our North America segment. The acquisition of CMI expanded our molded door production capacity and product offering in our North America segment.
In August 2015, we acquired Dooria, headquartered in Oslo, Norway. Dooria offers a complete range of doors, including interior, exterior, and specialty rated doors, in a wide variety of styles and is known for its high quality and innovative door designs and options. Dooria is now part of our Europe segment. The acquisition of Dooria expanded our production capabilities and product offering in the Scandinavia region.
In August 2015, we acquired Aneeta, headquartered in Melbourne, Australia. Aneeta is an industry leading manufacturer and supplier of sashless windows in Australia and is now part of our Australasia segment. The acquisition of Aneeta expanded our product portfolio to include innovative window system offerings to customers in Australia as well as North America.
In September 2015, we acquired Karona, headquartered in Caledonia, Michigan. Karona offers a complete range of specialty stile and rail doors, including interior, exterior, and fire rated doors for both the residential and non-residential markets, and is known for its high quality and technical capabilities. Karona is now part of our North America segment. The acquisition of Karona fit our strategy to expand our capabilities and product offering in the North American specialty stile and rail market.
In October 2015, we acquired certain assets and liabilities of LaCantina, headquartered in Oceanside, California. LaCantina is a manufacturer of folding and multislide door systems and is now part of our North America segment. The acquisition of LaCantina improved our position in the popular and growing market for wall systems by giving us additional resources, capacity, and a leading brand in this growing segment of the market.
In February 2016, we acquired Trend, headquartered in Sydney, Australia. Trend is a leading manufacturer of doors and windows in Australia and is now part of our Australasia segment. The acquisition of Trend strengthened our market position in the Australian window market and expanded our product portfolio with new and innovative window designs.
In August 2016, we acquired the shares of Arcpac Building Products Limited, which includes its primary operating subsidiary Breezway, headquartered in Brisbane, Australia. Breezway is a manufacturer of louver window systems for the residential and commercial window markets. Breezway’s primary sales market is Australia and it also maintains a presence in
42
Malaysia and Hawaii. The acquisition of Breezway is expected to strengthen our position in the Australian window market and expand our product portfolio with new and innovative window designs as well as other complementary products.
We paid an aggregate of approximately $173 million in cash (net of cash acquired) for the six businesses we acquired in 2015 and 2016.
Factors and Trends Affecting Our Business
Drivers of Net Revenues
The key components of our net revenues include core net revenues (which we define to include the impact of pricing and volume/mix, as discussed further under the heading, “Product Pricing and Volume/Mix” below), contribution from acquisitions made within the prior twelve months, and the impact of foreign exchange. Since the year ended December 31, 2014, our core net revenue growth was consistently positive with period over period increases of 3% in each of the three years ended December 31, 2016, December 31, 2015 and December 31, 2014. During these same periods, the impact of our core growth on our net revenues was partially offset by the relative and fluctuating currency values in the geographies in which we operate, which we refer to as the impact of foreign exchange. Throughout this MD&A, percentage changes in pricing are based on management schedules and are not derived directly from our accounting records.
Product Demand
General business, financial market, and economic conditions globally and in the regions where we operate influence overall demand in our end markets and for our products. In particular, the following factors may have a direct impact on demand for our products in the countries and regions where our products are marketed and sold:
• | the strength of the economy; |
• | employment rates and consumer confidence and spending rates; |
• | the availability and cost of credit; |
• | the amount and type of residential and non-residential construction; |
• | housing sales and home values; |
• | the age of existing home stock, home vacancy rates, and foreclosures; |
• | interest rate fluctuations for our customers and consumers; |
• | increases in the cost of raw materials or any shortage in supplies or labor; |
• | the effects of governmental regulation and initiatives to manage economic conditions; |
• | geographical shifts in population and other changes in demographics; and |
• | changes in weather patterns. |
In addition, we seek to drive demand for our products through the implementation of various strategies and initiatives. We believe we can enhance demand for our new and existing products by:
• | innovating and developing new products and technologies; |
• | investing in branding and marketing strategies, including marketing campaigns in both print and social media, as well as our investments in new training centers and mobile training facilities; and |
• | implementing channel initiatives to enhance our relationships with key customers, including implementing the True BLU dealer management program in North America. |
Product Pricing and Volume/Mix
The price and mix of products that we sell are important drivers of our net revenues and net income. Under the heading “Results of Operations” references to (i) “pricing” refer to the impact of price increases or decreases, as applicable, for particular products between periods and (ii) “volume/mix” refer to the combined impact of both the number of products we sell in a particular period and the types of products sold, in each case, on net revenues and net income. While we operate in a competitive
43
market, pricing discipline is an important element of our strategy to achieve profitable growth through improved margins. Our strategies also include incentivizing our channel partners to sell our higher margin products and a renewed focus on innovation and the development of new technologies, which we believe will increase our sales volumes and the overall profitability of our product mix.
Changes in pricing trends for our products can have a material impact on our operations. During and immediately after the global financial crisis, our net revenues were negatively impacted by decreased demand and an increasingly competitive environment, resulting in unfavorable pricing trends, particularly in the North American door market. Furthermore, prior to our new senior executive team joining the Company, we often pursued a strategy in North America of pricing our products on an incremental contribution margin basis in an effort to grow volumes and generate operating leverage, which often led to competing on price and an inadequate return on our invested capital. In early 2014, our new management team began to strategically change our pricing strategy in several key areas. First, we focused on making strategic pricing decisions based on analysis of customer and product level profitability to restore profitability to underperforming lines of business. Second, we increased our emphasis on pricing optimization. As a result, our operations during 2014 and 2015 benefited from improved pricing, particularly in North America, where pricing returned to close to pre-crisis levels in some product lines across some market channels. Going forward, if the housing market continues to grow and economic factors remain positive, we believe that we will continue to benefit from a positive pricing environment. However, we do not believe the future benefits will be as significant as the pricing improvements we experienced during the 2013 to 2015 period.
Cost Reduction Initiatives
Prior to the ongoing operational transformation being executed by our new senior executive team, our operations were managed in a decentralized manner with varying degrees of emphasis on cost efficiency and limited focus on continuous improvement or strategic sourcing. Our new management team has a proven track record of implementing operational excellence programs at some of the world’s leading industrial manufacturing businesses, and we believe the same successes can be realized at JELD-WEN. Key areas of focus of our operational excellence program include:
• | reducing labor, overtime, and waste costs by optimizing manufacturing processes; |
• | reducing or minimizing increases in material costs through strategic global sourcing and value-added re-engineering of components, in part by leveraging our significant spend and the global nature of our purchases; and |
• | reducing warranty costs by improving quality. |
We are in the early stages of implementing our strategic initiatives, including JEM, to develop the culture and processes of operational excellence and continuous improvement. These cost reduction initiatives, as well as plant closures and consolidations, headcount reductions, and various initiatives aimed at lowering production and overhead costs may not produce the intended results within the intended timeframe.
Raw Material Costs
Commodities such as vinyl extrusions, glass, aluminum, wood, steel, plastics, fiberglass, and other composites are major components in the production of our products. Changes in the underlying prices of these commodities have a direct impact on the cost of products sold. While we attempt to pass on a substantial portion of such cost increases to our customers, we may not be successful in doing so. In addition, our results of operations for individual quarters may be negatively impacted by a delay between the time of raw material cost increases and a corresponding price increase. Conversely, our results of operations for individual quarters may be positively impacted by a delay between the time of a raw material price decrease and a corresponding competitive pricing decrease.
Working Capital and Seasonality
Working capital, which is defined as accounts receivable plus inventory less accounts payable, fluctuates throughout the year and is affected by seasonality of sales of our products and of customer payment patterns. The peak season for home construction and remodeling in our North America and Europe segments, which represent the substantial majority of our revenues, generally corresponds with the second and third calendar quarters, and therefore our sales volume is usually higher during those quarters. Typically, working capital increases at the end of the first quarter and beginning of the second quarter in conjunction with, and in preparation for, our peak season, and working capital decreases starting in the third quarter as inventory levels and accounts receivable decline. Inventories fluctuate for some raw materials with long delivery lead times, such as steel, as we work through prior shipments and take delivery of new orders.
44
Foreign Currency Exchange Rates
We report our consolidated financial results in U.S. dollars. Due to our international operations, the weakening or strengthening of foreign currencies against the U.S. dollar can affect our reported operating results and our cash flows as we translate our foreign subsidiaries’ financial statements from their reporting currencies into U.S. dollars. In the year ended December 31, 2016 compared to the year ended December 31, 2015, the appreciation of the U.S. dollar relative to the reporting currencies of our foreign subsidiaries resulted in lower reported results in such foreign reporting entities. In particular, the exchange rates used to translate our foreign subsidiaries’ financial results for the year ended December 31, 2016 compared to the year ended December 31, 2015 reflected, on average, the U.S. dollar strengthening against the Euro, Australian dollar, and Canadian dollar by less than 1%, 1%, and 4%, respectively. See Item 1A- Risk Factors- Risks Relating to Our Business and Industry, Item 1A- Risk Factors- Exchange rate fluctuations may impact our business, financial condition, and results of operations, and Item 7- Quantitative and Qualitative Disclosures About Market Risk- Exchange Rate Risk.
Public Company Costs
As a result of our IPO, we will incur additional legal, accounting, board compensation, and other expenses that we did not previously incur, including costs associated with SEC reporting and corporate governance requirements. These requirements include compliance with the Sarbanes-Oxley Act of 2002, as amended, as well as other rules implemented by the SEC and the national securities exchanges. Our financial statements following our IPO reflect the impact of these expenses.
Borrowings and Refinancings
Amounts outstanding under our prior credit facilities and 12.25% senior secured notes were repaid in October 2014. At such time, we entered into the Corporate Credit Facilities, which bear interest at substantially lower rates than the refinanced debt. In July 2015 and November 2016, we borrowed an additional $480 million and $375 million, respectively, under the Corporate Credit Facilities primarily to fund distributions to our shareholders. Accordingly, our results have been impacted by substantial changes in our net interest expense throughout the periods presented. On February 6, 2017, we repaid $375 million under our Corporate Credit Facilities. See “Liquidity and Capital Resources” below.
Components of our Operating Results
Net Revenues
Our net revenues are a function of sales volumes and selling prices, each of which is a function of product mix, and consist primarily of:
• sales of a wide variety of interior and exterior doors, including patio doors, for use in residential and non-residential applications, with and without frames, to a broad group of wholesale and retail customers in all of our geographic markets;
• sales of a wide variety of windows for both residential and certain non-residential uses, to a broad group of wholesale and retail customers primarily in North America, Australia, and the U.K.; and
• other sales, including sales of moldings, trim board, cut-stock, glass, stairs, hardware and locks, door skins, shower enclosures, wardrobes, window screens, and miscellaneous installation and other services revenue.
Net revenues do not include internal transfers of products between our component manufacturing, product manufacturing and assembly, and distribution facilities.
Cost of Sales
Cost of sales consists primarily of material costs, direct labor and benefit costs, including payroll taxes, repair and maintenance, depreciation, utility, rent and warranty expenses, outbound freight, and insurance and benefits, supervision and tax expenses. Detail for each of these items is provided below.
• | Material Costs. The single largest component of cost of sales is material costs, which include raw materials, components and finished goods purchased for use in manufacturing our products or for resale. Our most significant material costs include glass, wood, wood components, doors, door facings, door parts, hardware, vinyl extrusions, steel, fiberglass, packaging materials, adhesives, resins and other chemicals, core material, and aluminum extrusions. The cost of each of these items is impacted by global supply and demand trends, both within and outside |
45
our industry, as well as commodity price fluctuations, conversion costs, energy costs, and transportation costs. See Item 7A- Quantitative and Qualitative Disclosures About Market Risk- Raw Materials Risk.
• | Direct Labor and Benefit Costs. Direct labor and benefit costs reflect a combination of production hours, average headcount, general wage levels, payroll taxes, and benefits provided to employees. Direct labor and benefit costs include wages, overtime, payroll taxes, and benefits paid to hourly employees at our facilities that are involved in the production and/or distribution of our products. These costs are generally managed by each facility and headcount is adjusted according to overall and seasonal production demand. We run multi-shift operations in many of our facilities to maximize return on assets and utilization. Direct labor and benefit costs fluctuate with headcount, but generally tend to increase with inflation due to increases in wages and health benefit costs. |
• | Repair and Maintenance, Depreciation, Utility, Rent, and Warranty Expenses. |
◦ | Repairs and maintenance costs consist of equipment and facility maintenance expenses, purchases of maintenance supplies, and the labor costs involved in performing maintenance on our equipment and facilities. |
◦ | Depreciation includes depreciation expense associated with our production assets and plants. |
◦ | Rent is predominantly comprised of lease costs for facilities we do not own as well as vehicle fleet and equipment lease costs. Facility leases are typically multi-year and may include increases tied to certain measures of inflation. |
◦ | Warranty expenses represent all costs related to servicing warranty claims and product issues and are mostly related to our window products sold in the U.S. and Canada. |
• | Outbound Freight. Outbound freight includes payments to third-party carriers for shipments of orders to our customers, as well as driver, vehicle, and fuel expenses when we deliver orders to customers. The majority of our products are shipped by third-party carriers. |
• | Insurance and Benefits, Supervision, and Tax Expenses. |
◦ | Insurance and benefit costs are the expenses relating to our insurance programs, health benefits, retirement benefit programs (including the pension plan), and other benefits that are not included in direct labor and benefits costs. |
◦ | Supervision costs are the wages and bonus expenses related to plant managers. Both insurance and benefits and supervision expenses tend to be influenced by headcount and wage levels. |
◦ | Tax costs are mostly payroll taxes for employees not included in direct labor and benefit costs, and property taxes. Tax expenses are impacted by changes in tax rates, headcount and wage levels, and the number and value of properties owned. |
In addition, an appropriate portion of each of the insurance and benefits, supervision and tax expenses are allocated to selling, general, and administrative expenses.
Selling, general, and administrative expenses
SG&A consist primarily of research and development, sales and marketing, and general and administrative expenses.
Research and Development. Research and development expenses consist primarily of personnel expenses related to research and development, consulting and contractor expenses, tooling and prototype materials, and overhead costs allocated to such expenses. Substantially all of our research and development expenses are related to developing new products and services and improving our existing products and services. To date, research and development expenses have been expensed as incurred, because the period between achieving technological feasibility and the release of products and services for sale has been short and development costs qualifying for capitalization have been insignificant.
We expect our research and development expenses to increase in absolute dollars as we continue to make significant investments in developing new products and enhancing existing products.
46
Sales and Marketing. Sales and marketing expenses consist primarily of advertising and marketing promotions of our products and services and related personnel expenses, as well as sales incentives, trade show and event costs, sponsorship costs, consulting and contractor expenses, travel, display expenses, and related amortization. Sales and marketing expenses are generally variable expenses and not fixed expenses. We expect our sales and marketing expenses to increase in absolute dollars as we continue to actively promote our products and services.
General and Administrative. General and administrative expenses consist of personnel expenses for our finance, legal, human resources, and administrative personnel, as well as the costs of professional services, any allocated overhead, information technology, amortization of intangible assets acquired, and other administrative expenses. We expect our general and administrative expenses to increase in absolute dollars due to the anticipated growth of our business and related infrastructure as well as legal, accounting, insurance, investor relations, and other costs associated with becoming a public company.
Impairment and Restructuring Costs
Impairment and restructuring costs consist primarily of all salary-related severance benefits that are accrued and expensed when a restructuring plan has been put into place, the plan has received approval from the appropriate level of management and the benefit is probable and reasonably estimable. In addition to salary-related costs, we incur other restructuring costs when facilities are closed or capacity is realigned within the organization. Upon termination of an employment or commercial contract we record liabilities and expenses pursuant to the terms of the relevant agreement. For non-contractual restructuring activities, liabilities and expenses are measured and recorded at fair value in the period in which they are incurred.
Interest Expense, Net
Interest expense, net relates primarily to interest payments on our then-outstanding credit facilities (and debt securities in 2014). Debt issuance costs related to our indebtedness are included as an offset to long-term debt in the accompanying consolidated balance sheets and are amortized to interest expense over the life of the applicable facility using the effective interest method. See Note 17- Long-Term Debt in our financial statements for the year ended December 31, 2016 included elsewhere in this Form 10-K.
Other Income (Expense), Net
Other income (expense), net includes profit and losses related to various miscellaneous non-operating expenses.
Income Taxes
Income taxes are recorded using the asset and liability method of accounting for income taxes. Under the asset and liability method, deferred tax assets and liabilities are recognized for the deferred tax consequences attributable to differences between the financial statement carrying amounts of existing assets and liabilities and their respective tax bases. Deferred tax assets and liabilities are measured using enacted tax rates expected to apply to taxable income in the years in which those temporary differences are expected to be recovered or settled. The effect on deferred tax assets and liabilities due to a change in tax rates is recognized in income in the period that includes the date of enactment. We recognize the effect of income tax positions only if those positions are more likely than not of being sustained. Recognized income tax positions are measured at the largest amount that is greater than 50% likely of being realized. Changes in recognition or measurement are reflected in the period in which the change in judgment occurs. We record interest related to unrecognized tax benefits in income tax expense. As of December 31, 2016, our federal, state, and foreign NOL carryforwards were $1,566.1 million in the aggregate and $6.0 million of such NOL carryforwards do not expire. See Note 19- Income Taxes in our financial statements for the year ended December 31, 2016 included elsewhere in this Form 10-K.
47
Results of Operations
The tables in this section summarize key components of our results of operations for the periods indicated, both in U.S. dollars and as a percentage of our net revenues. All percentages presented in this section have been rounded to the nearest whole number. Accordingly, totals may not equal the sum of the line items in the tables below.
Year Ended December 31, | ||||||||||||
2016 | 2015 | 2014 | ||||||||||
(dollars in thousands) | ||||||||||||
Net revenues | $ | 3,666,799 | $ | 3,381,060 | $ | 3,507,206 | ||||||
Cost of sales | 2,866,805 | 2,715,125 | 2,919,864 | |||||||||
Gross margin | 799,994 | 665,935 | 587,342 | |||||||||
Selling, general and administrative | 589,407 | 512,126 | 488,477 | |||||||||
Impairment and restructuring charges | 13,847 | 21,342 | 38,388 | |||||||||
Operating income | 196,740 | 132,467 | 60,477 | |||||||||
Interest expense, net | (77,590 | ) | (60,632 | ) | (69,289 | ) | ||||||
Loss on extinguishment of debt | — | — | (51,036 | ) | ||||||||
Other income | 12,825 | 14,120 | 515 | |||||||||
Income (loss) before taxes, equity earnings (loss) and discontinued operations | 131,975 | 85,955 | (59,333 | ) | ||||||||
Income tax benefit (expense) | 225,596 | 5,435 | (18,942 | ) | ||||||||
Income (loss) from continuing operations, net of tax | 357,571 | 91,390 | (78,275 | ) | ||||||||
Equity earnings (loss) of non-consolidated entities | 3,264 | 2,384 | (447 | ) | ||||||||
Loss from discontinued operation, net of tax | (3,324 | ) | (2,856 | ) | (5,387 | ) | ||||||
Net income (loss) | $ | 357,511 | $ | 90,918 | $ | (84,109 | ) | |||||
Other financial data: | ||||||||||||
Adjusted EBITDA(1) | $ | 394,132 | $ | 310,986 | $ | 229,849 | ||||||
Adjusted EBITDA margin(1) | 10.7 | % | 9.2 | % | 6.6 | % | ||||||
____________________________
(1) | Adjusted EBITDA is a financial measure that is not calculated in accordance with GAAP. For a discussion of our presentation of Adjusted EBITDA, see footnote 1 to the table under the heading Item 6- Selected Financial Data. Adjusted EBITDA margin is defined as Adjusted EBITDA divided by net revenues. |
48
Comparison of the Year Ended December 31, 2016 to the Year Ended December 31, 2015
Consolidated Results
Year Ended December 31, | ||||||||||||||||
2016 | 2015 | |||||||||||||||
(dollars in thousands) | ||||||||||||||||
% of Net Revenues | % of Net Revenues | % Variance | ||||||||||||||
Net revenues | $ | 3,666,799 | 100.0 | % | $ | 3,381,060 | 100.0 | % | 8.5 | % | ||||||
Cost of sales | 2,866,805 | 78.2 | % | 2,715,125 | 80.3 | % | 5.6 | % | ||||||||
Gross margin | 799,994 | 21.8 | % | 665,935 | 19.7 | % | 20.1 | % | ||||||||
Selling, general and administrative | 589,407 | 16.1 | % | 512,126 | 15.1 | % | 15.1 | % | ||||||||
Impairment and restructuring charges | 13,847 | 0.4 | % | 21,342 | 0.6 | % | -35.1 | % | ||||||||
Operating income | 196,740 | 5.4 | % | 132,467 | 3.9 | % | 48.5 | % | ||||||||
Interest expense, net | (77,590 | ) | 2.1 | % | (60,632 | ) | 1.8 | % | 28.0 | % | ||||||
Other income | 12,825 | 0.3 | % | 14,120 | 0 | % | -9.2 | % | ||||||||
Income before taxes, equity earnings and discontinued operations | 131,975 | 3.6 | % | 85,955 | 2.5 | % | 53.5 | % | ||||||||
Income tax benefit | 225,596 | 6.2 | % | 5,435 | 0.2 | % | NM | |||||||||
Income from continuing operations, net of tax | 357,571 | 9.8 | % | 91,390 | 2.7 | % | NM | |||||||||
Loss from discontinued operations, net of tax | (3,324 | ) | 0.1 | % | (2,856 | ) | 0.1 | % | 16.4 | % | ||||||
Equity earnings of non-consolidated entities | 3,264 | 0.1 | % | 2,384 | 0.1 | % | 36.9 | % | ||||||||
Net income | $ | 357,511 | 9.7 | % | $ | 90,918 | 2.7 | % | NM | |||||||
Other financial data: | ||||||||||||||||
Adjusted EBITDA(1) | $ | 394,132 | 10.7 | % | $ | 310,986 | 9.2 | % | 26.7 | % | ||||||
___________________________
(1) | Adjusted EBITDA is a financial measure that is not calculated in accordance with GAAP. For a discussion of our presentation of Adjusted EBITDA, see footnote 1 to the table under the heading Item 6- Selected Financial Data. |
Consolidated Results
Net Revenues—Net revenues increased $285.7 million, or 8.5%, to $3,666.8 million in the year ended December 31, 2016 from $3,381.1 million in the year ended December 31, 2015. The increase in net revenues was primarily attributable to a 7% increase associated with our recent acquisitions described under the heading “Acquisitions” above. Our core net revenues increased 3%, comprised of an increase in pricing as a result of implementing our pricing optimization strategy and volume/mix. These increases were partially offset by an unfavorable foreign exchange impact of 1%.
Gross Margin—Gross margin increased $134.1 million, or 20.1%, to $800.0 million in the year ended December 31, 2016 from $665.9 million in the year ended December 31, 2015. Gross margin as a percentage of net revenues was 21.8% in the year ended December 31, 2016 and 19.7% in the year ended December 31, 2015. The increases in gross margin and gross margin percentage were due to acquisitions, price increases, and cost out initiatives, partially offset by the weakening of the British pound, Canadian dollar and the Australian dollar in the current period which resulted in an unfavorable translation impact of $3.7 million.
SG&A Expense—SG&A expense increased $77.3 million, or 15.1%, to $589.4 million in the year ended December 31, 2016 from $512.1 million in the year ended December 31, 2015. SG&A expense as a percentage of net revenues was 16.1% for the year ended December 31, 2016 and 15.1% for the year ended December 31, 2015. The increases in SG&A expense and SG&A expense percentage were primarily due to SG&A expense associated with our recent acquisitions, share based compensation expense and other payments related to our November 2016 dividend recapitalization transactions, and professional fees related to the IPO process. Partially offsetting these increases was a favorable translation impact of $5.8 million due to the weakening of the British pound, Canadian dollar and the Australian dollar in the current period.
Impairment and Restructuring Charges—Impairment and restructuring charges decreased $7.5 million, or 35.1%, to $13.8 million in the year ended December 31, 2016 from $21.3 million in the year ended December 31, 2015. The charges in the year ended December 31, 2016 consisted primarily of $6.2 million for restructuring and plant closures of recent acquisitions, $5.5 million for various personnel restructuring and severance costs and $2.1 million of other impairment and restructuring charges. The
49
charges for the year ended December 31, 2015 consisted primarily of $13.4 million of impairment and restructuring charges in Europe primarily due to the closure of one of our three French manufacturing facilities, $2.0 million of charges related to the consolidation of our fiber door skin designs, and $1.5 million of impairment charges related to a non-core equity investment and related notes receivable. The remaining charges of $4.4 million are primarily related to personnel restructuring.
Interest Expense, Net—Interest expense, net increased $17.0 million, or 28.0%, to an expense of $77.6 million in the year ended December 31, 2016 from an expense of $60.6 million in the year ended December 31, 2015. The increase was primarily due to the full period impact of the incremental interest expense associated with the $480 million and $375 million of incremental term loans borrowed in July 2015 and November 2016, respectively.
Income Taxes—Income tax benefit in the year ended December 31, 2016 was $225.6 million, compared to a benefit of $5.4 million in the year ended December 31, 2015. The effective tax rate in the year ended December 31, 2016 was (170.9)% compared to an effective tax rate of (6.3)% in the year ended December 31, 2015. The increased tax benefit of $220.2 million was due primarily to a release of a valuation allowance in the U.S. and U.K. totaling $272.3 million in the year ended December 31, 2016 compared to a $19.6 million release of certain foreign subsidiaries' valuation allowance in the year ended December 31, 2015. This increase in benefit was offset by an increase in current tax expense of $6.5 million attributable to the earnings mix.
50
Segment Results
We report our segment information in the same way management internally organizes the business in assessing performance and making decisions regarding allocation of resources in accordance with ASC 280-10- Segment Reporting. We determined that we have three reportable segments, organized and managed principally by geographic region. Our reportable segments are North America, Europe and Australasia. We report all other business activities in Corporate and unallocated costs. We define Adjusted EBITDA as net income (loss), as adjusted for the following items: income (loss) from discontinued operations, net of tax; gain (loss) on sale of discontinued operations, net of tax; equity earnings (loss) of non-consolidated entities; income tax benefit (expense); depreciation and intangible amortization; interest expense, net; impairment and restructuring charges; (gain) loss on sale of property and equipment; share-based compensation expense; non-cash foreign exchange transaction/translation income (loss); other non-cash items; other items; and costs related to debt restructuring, debt refinancing, and the Onex Investment. For additional information on segment Adjusted EBITDA, see Note 20- Segment Information to our financial statements included in this Form 10-K.
Year Ended December 31, | |||||||||||
2016 | 2015 | ||||||||||
(dollars in thousands) | |||||||||||
Net revenues from external customers | % Variance | ||||||||||
North America | $ | 2,149,168 | $ | 2,015,715 | 6.6 | % | |||||
Europe | 1,008,729 | 996,014 | 1.3 | % | |||||||
Australasia | 508,902 | 369,331 | 37.8 | % | |||||||
Total Consolidated | $ | 3,666,799 | $ | 3,381,060 | 8.5 | % | |||||
Percentage of total consolidated net revenues | |||||||||||
North America | 58.6 | % | 59.6 | % | |||||||
Europe | 27.5 | % | 29.5 | % | |||||||
Australasia | 13.9 | % | 10.9 | % | |||||||
Total Consolidated | 100.0 | % | 100.0 | % | |||||||
Adjusted EBITDA(1) | |||||||||||
North America | $ | 251,831 | $ | 201,660 | 24.9 | % | |||||
Europe | 122,574 | 99,540 | 23.1 | % | |||||||
Australasia | 59,519 | 40,453 | 47.1 | % | |||||||
Corporate and unallocated costs | (39,792 | ) | (30,667 | ) | 29.8 | % | |||||
Total Consolidated | $ | 394,132 | $ | 310,986 | 26.7 | % | |||||
Adjusted EBITDA as a percentage of segment net revenues | |||||||||||
North America | 11.7 | % | 10.0 | % | |||||||
Europe | 12.2 | % | 10.0 | % | |||||||
Australasia | 11.7 | % | 11.0 | % | |||||||
Total Consolidated | 10.7 | % | 9.2 | % | |||||||
____________________________
(1) | Adjusted EBITDA is a financial measure that is not calculated in accordance with GAAP. For a discussion of our presentation of Adjusted EBITDA, see footnote 1 to the table under the heading “Selected Financial Data”. |
North America
Net revenues in North America increased $133.5 million, or 6.6%, to $2,149.2 million in the year ended December 31, 2016 from $2,015.7 million in the year ended December 31, 2015. The increase in net revenues was primarily due to an increase in core net revenues of 5%, comprised of increases in volume/mix of 3% and pricing of 2%. The increase in volume/mix was the result of increased demand for our products driven by our profitable growth initiatives. The increase in pricing was the result of implementing our pricing optimization strategy. Additionally, the acquisitions of Karona and LaCantina provided a 2% increase in net revenues.
Adjusted EBITDA in North America increased $50.2 million, or 24.9%, to $251.8 million in the year ended December 31, 2016 from $201.7 million in the year ended December 31, 2015. The increase in Adjusted EBITDA was primarily due to increased pricing and productivity initiatives partially offset by labor costs associated with key productivity initiatives and increased marketing and advertising expenses.
51
Europe
Net revenues in Europe increased $12.7 million, or 1.3%, to $1,008.7 million in the year ended December 31, 2016 from $996.0 million in the year ended December 31, 2015. The increase in net revenues was primarily due to an increase in core net revenues of 1%, comprised of an increase in pricing of approximately 2%, partially offset by a decrease in volume/mix of approximately 1%. The increase in pricing was the result of implementing our pricing optimization strategy. The decrease in volume/mix was primarily a result of the realignment of our customer and product portfolio aimed at driving profitable growth. Additionally, the acquisition of Dooria provided a 3% increase in net revenues. These increases were partially offset by an unfavorable foreign exchange impact of 3%.
Adjusted EBITDA in Europe increased $23.0 million, or 23.1%, to $122.6 million in the year ended December 31, 2016 from $99.5 million in the year ended December 31, 2015. The increase in Adjusted EBITDA was primarily due to the increase in pricing, the closure of a facility in France in 2015, and productivity initiatives.
Australasia
Net revenues in Australasia increased $139.6 million, or 37.8%, to $508.9 million in the year ended December 31, 2016 from $369.3 million in the year ended December 31, 2015. The increase in net revenues was primarily due to an increase in core net revenues of 2%, comprised primarily of an increase in pricing. The increase in pricing was the result of implementing our pricing optimization strategy. Volume/mix was flat in the twelve months ended December 31, 2016 as organic growth in certain regions was offset by economic weakness in Western Australia. Additionally, the acquisitions of Trend, Aneeta, and Breezway provided a 37% increase in net revenues. These increases were partially offset by an unfavorable foreign exchange impact of 1%.
Adjusted EBITDA in Australasia increased $19.1 million, or 47.1%, to $59.5 million in the year ended December 31, 2016 from $40.5 million in the year ended December 31, 2015. The increase in Adjusted EBITDA was primarily due to the acquisitions of Trend, Aneeta, and Breezway and pricing initiatives, partially offset by the decrease in volume/mix and an unfavorable foreign exchange impact.
52
Comparison of the Year Ended December 31, 2015 to the Year Ended December 31, 2014
Consolidated Results
Year Ended December 31, | ||||||||||||||||
2015 | 2014 | |||||||||||||||
(dollars in thousands) | ||||||||||||||||
% of Net Revenues | % of Net Revenues | % Variance | ||||||||||||||
Net revenues | $ | 3,381,060 | 100.0 | % | $ | 3,507,206 | 100.0 | % | -3.6 | % | ||||||
Cost of sales | 2,715,125 | 80.3 | % | 2,919,864 | 83.3 | % | -7.0 | % | ||||||||
Gross margin | 665,935 | 19.7 | % | 587,342 | 16.7 | % | 13.4 | % | ||||||||
Selling, general and administrative | 512,126 | 15.1 | % | 488,477 | 13.9 | % | 4.8 | % | ||||||||
Impairment and restructuring charges | 21,342 | 0.6 | % | 38,388 | 1.1 | % | -44.4 | % | ||||||||
Operating income | 132,467 | 3.9 | % | 60,477 | 1.7 | % | 119.0 | % | ||||||||
Interest expense, net | (60,632 | ) | 1.8 | % | (69,289 | ) | 2.0 | % | -12.5 | % | ||||||
Loss on extinguishment of debt | — | 0.0 | % | (51,036 | ) | (1.5 | )% | -100.0 | % | |||||||
Other income | 14,120 | 0.4 | % | 515 | 0 | % | NM | |||||||||
Income (loss) before taxes, equity earnings (loss) and discontinued operations | 85,955 | 2.5 | % | (59,333 | ) | (1.7 | )% | NM | ||||||||
Income tax benefit (expense) | 5,435 | 0.2 | % | (18,942 | ) | (0.5 | )% | -128.7 | % | |||||||
Income (loss) from continuing operations, net of tax | 91,390 | 2.7 | % | (78,275 | ) | (2.2 | )% | NM | ||||||||
Loss from discontinued operations, net of tax | (2,856 | ) | 0.1 | % | (5,387 | ) | 0.2 | % | -47.0 | % | ||||||
Equity earnings (loss) of non-consolidated entities | 2,384 | 0.1 | % | (447 | ) | 0.0 | % | NM | ||||||||
Net income (loss) | $ | 90,918 | 2.7 | % | $ | (84,109 | ) | (2.4 | )% | NM | ||||||
Other financial data: | ||||||||||||||||
Adjusted EBITDA(1) | $ | 310,986 | 9.2 | % | $ | 229,849 | 6.6 | % | 35.3 | % | ||||||
____________________________
(1) | Adjusted EBITDA is a financial measure that is not calculated in accordance with GAAP. For a discussion of our presentation of Adjusted EBITDA, see footnote 1 to the table under the heading Item 6- Selected Financial Data. |
Consolidated Results
Net revenues—Net revenues decreased $126.1 million, or 3.6%, to $3,381.1 million in the year ended December 31, 2015 from $3,507.2 million in the year ended December 31, 2014. The decrease in net revenues was primarily due to an unfavorable foreign exchange impact of 8%, partially offset by a 3% increase in core net revenues, primarily comprised of an increase in pricing. The increase in pricing was the result of implementing our pricing optimization strategy. Volume/mix did not have a material impact on net revenues as increased demand in certain markets was offset by the strategic realignment of our customer and product portfolio in North America aimed at driving profitable growth. Additionally, acquisitions provided a 1% increase in net revenues.
Gross Margin—Gross margin increased $78.6 million, or 13.4%, to $665.9 million in the year ended December 31, 2015 from $587.3 million in the year ended December 31, 2014. Gross margin as a percentage of net revenues was 19.7% in the year ended December 31, 2015 and 16.7% in the year ended December 31, 2014. The increase in gross margin and gross margin percentage was primarily due to the increase in pricing in all of our segments, increased volume/mix in Europe and Australasia, and savings from cost reduction initiatives, partially offset by the unfavorable impact of foreign exchange.
SG&A Expense—SG&A expense increased $23.6 million, or 4.8%, to $512.1 million in the year ended December 31, 2015 from $488.5 million in the year ended December 31, 2014. SG&A expense as a percentage of net revenues was 15.1% in the year ended December 31, 2015 and 13.9% in the year ended December 31, 2014. The increases in SG&A expense and SG&A expense percentage were primarily due to our performance-based management incentive compensation, amortization of share-based compensation, a distribution to holders of our stock options related to the July 2015 cash distribution to our shareholders, and a legal settlement related to a former subsidiary, offset by the impact of foreign exchange.
53
Impairment and Restructuring Charges—Impairment and restructuring charges decreased $17.0 million, or 44.4%, to $21.3 million in the year ended December 31, 2015 from $38.4 million in the year ended December 31, 2014. The charges in the year ended December 31, 2015 consisted of $13.4 million of impairment and restructuring charges in Europe primarily due to the closure of one of our three French manufacturing facilities, $2.0 million of charges related to the consolidation of our fiber door skin designs, and $1.5 million of impairment charges related to a non-core equity investment and related notes receivable. The remaining charges of $4.4 million are primarily related to personnel restructuring. The charges in the year ended December 31, 2014 consisted of $7.1 million of impairment charges primarily related to facility closures, excess real estate, and manufacturing process changes, $13.7 million in severance costs primarily related to executive and other administrative management restructuring, $8.6 million for one-time payments related to the restructuring of our management incentive plan, which was revised to decrease the number of participants, $3.3 million for lease termination and other costs related to the relocation and downsizing of our aviation department, $2.0 million for process reengineering and $3.6 million in other individually immaterial charges across all regions.
Interest Expense, Net—Interest expense, net decreased $8.7 million, or 12.5%, to an expense of $60.6 million in the year ended December 31, 2015 from an expense of $69.3 million in the year ended December 31, 2014. The decrease was primarily due to lower interest rates in the year ended December 31, 2015 on outstanding debt as a result of refinancing certain debt in October 2014, partially offset by interest expense on the incremental term loan borrowings incurred in July 2015.
Loss on Debt Extinguishment—In the year ended December 31, 2014, we redeemed all of our outstanding 12.25% senior secured notes and incurred a loss of $51.0 million as a result of the redemption. The loss consisted of a redemption premium over face value of $28.4 million and the write-off of $22.6 million in unamortized fees associated with our former senior secured credit facility.
Other Income (Expense)—Total other income increased $13.6 million to $14.1 million in the year ended December 31, 2015 from $0.5 million in the year ended December 31, 2014. The increase was primarily due to gains on the settlement of foreign exchange contracts associated with our hedging program.
Income Taxes—Income tax benefit in the year ended December 31, 2015 was $5.4 million compared to an expense of $18.9 million in the year ended December 31, 2014. The effective income tax rate for our continuing operations was (6.3)% and 31.9% in the years ended December 31, 2015 and 2014, respectively. The reduction in tax expense of $24.4 million for the year ended December 31, 2015 was driven by an $86.2 million benefit from changes in valuation allowances in several countries as a result of improvements in our operating results in such countries, a significant improvement in our domestic results, and an $8.3 million benefit from the favorable settlement of various tax matters related to our 2007 and 2008 tax years, partially offset by a charge of $11.6 million for uncertain tax positions related to changes in how we run our business in Europe, a $4.0 million charge related to nontaxable/nondeductible items stemming from purchase accounting adjustments, and various other charges totaling $3.6 million.
54
Segment Results
Year Ended December 31, | |||||||||||
2015 | 2014 | ||||||||||
(dollars in thousands) | |||||||||||
Net revenues from external customers | % Variance | ||||||||||
North America | $ | 2,015,715 | $ | 1,989,621 | 1.3 | % | |||||
Europe | 996,014 | 1,108,390 | -10.1 | % | |||||||
Australasia | 369,331 | 409,195 | -9.7 | % | |||||||
Total Consolidated | $ | 3,381,060 | $ | 3,507,206 | -3.6 | % | |||||
Percentage of total consolidated net revenues | |||||||||||
North America | 59.6 | % | 56.7 | % | |||||||
Europe | 29.5 | % | 31.6 | % | |||||||
Australasia | 10.9 | % | 11.7 | % | |||||||
Total Consolidated | 100.0 | % | 100.0 | % | |||||||
Adjusted EBITDA(1) | |||||||||||
North America | $ | 201,660 | $ | 114,086 | 76.8 | % | |||||
Europe | 99,540 | 100,570 | -1.0 | % | |||||||
Australasia | 40,453 | 40,783 | -0.8 | % | |||||||
Corporate and unallocated costs | (30,667 | ) | (25,590 | ) | 19.8 | % | |||||
Total Consolidated | $ | 310,986 | $ | 229,849 | 35.3 | % | |||||
Adjusted EBITDA as a percentage of segment net revenues | |||||||||||
North America | 10.0 | % | 5.7 | % | |||||||
Europe | 10.0 | % | 9.1 | % | |||||||
Australasia | 11.0 | % | 10.0 | % | |||||||
Total Consolidated | 9.2 | % | 6.6 | % | |||||||
____________________________
(1) | Adjusted EBITDA is a financial measure that is not calculated in accordance with GAAP. For a discussion of our presentation of Adjusted EBITDA, see footnote 1 to the table under the heading Item 6- Selected Financial Data. |
North America
Net revenues in North America increased $26.1 million, or 1.3%, to $2,015.7 million in the year ended December 31, 2015 from $1,989.6 million in the year ended December 31, 2014. The increase in net revenues was primarily due to an increase in core net revenues of 2%, comprised of an increase in pricing of approximately 5%, partially offset by a decrease in volume/mix of approximately 3%. The increase in pricing was the result of implementing our pricing optimization strategy. The decrease in volume/mix was primarily a result of the realignment of our customer and product portfolio aimed at driving profitable growth. Additionally, the acquisitions of Karona and LaCantina provided a 1% increase in net revenues. These increases were partially offset by an unfavorable foreign exchange impact of 2%.
Adjusted EBITDA in North America increased $87.6 million, or 76.8%, to $201.7 million in the year ended December 31, 2015 from $114.1 million in the year ended December 31, 2014. The increase was primarily due to the increase in pricing and cost reduction initiatives, partially offset by increased investment in channel management and brand and marketing initiatives and the impact of unfavorable foreign exchange.
Europe
Net revenues in Europe decreased $112.4 million, or 10.1%, to $996.0 million in the year ended December 31, 2015 from $1,108.4 million in the year ended December 31, 2014. The decrease in net revenues was primarily due to an unfavorable foreign exchange impact of 16%, partially offset by an increase in core net revenues of 4%, comprised of an increase in volume/mix of approximately 2% and an increase in pricing of approximately 2%. The increase in volume/mix was the result of increased demand for our products driven by our profitable growth initiatives. The increase in pricing was the result of implementing our pricing optimization strategy. Additionally, the acquisition of Dooria provided a 2% increase in net revenues.
Adjusted EBITDA in Europe decreased $1.0 million, or 1.0%, to $99.5 million in the year ended December 31, 2015 from $100.6 million in the year ended December 31, 2014. The decrease was primarily due to the unfavorable impact of foreign exchange, partially offset by the increase in volume/mix and the increase in pricing.
55
Australasia
Net revenues in Australasia decreased $39.9 million, or 9.7%, to $369.3 million in the year ended December 31, 2015 from $409.2 million in the year ended December 31, 2014. The decrease in net revenues was primarily due to an unfavorable foreign exchange impact of 18%, partially offset by an increase in core net revenues of 7%, comprised of an increase in volume/mix of approximately 5% and an increase in pricing of approximately 2%. The increase in volume/mix was the result of increased demand for our products driven by our profitable growth initiatives. The increase in pricing was the result of implementing our pricing optimization strategy. Additionally, the acquisition of Aneeta provided a 1% increase in net revenues.
Adjusted EBITDA in Australasia decreased $0.3 million, or 0.8%, to $40.5 million in the year ended December 31, 2015 from $40.8 million in the year ended December 31, 2014. The decrease in Adjusted EBITDA was primarily due to the unfavorable impact of foreign exchange, partially offset by the increase in volume/mix and the increase in pricing.
Liquidity and Capital Resources
Overview
We have historically funded our operations through a combination of cash from operations, draws on our revolving credit facilities, and the issuance of non-revolving debt such as our Term Loan Facility. As of December 31, 2016, we had total liquidity (a non-GAAP measure) of $381.9 million, which included $102.7 million in cash, $226.9 million available for borrowing under the ABL Facility, AUD $18.0 million ($13.0 million) available for borrowing under the Australia Senior Secured Credit Facility, and €37.3 million ($39.3 million) available for borrowing under the Euro Revolving Facility. This compares to total liquidity of $352.9 million as of December 31, 2015. The increase in our total liquidity at December 31, 2016 compared to December 31, 2015 was primarily due to higher availability under our North American revolving credit facility, partially offset by lower cash balances.
Concurrent with the closing of the Onex Investment, we entered into a $300 million revolving credit facility and issued $460 million in aggregate principal amount of 12.25% senior secured notes. We utilized the proceeds from the Onex Investment and the issuance of the senior secured notes in October 2011 to repay in full the amounts owed under our then existing credit facilities, extinguishing those facilities, and to conduct a tender offer for $75 million of our common stock.
In October 2014, we entered into the Corporate Credit Facilities, consisting of $775 million in Initial Term Loans and a $300 million ABL Facility. The proceeds from the Initial Term Loans were primarily used to (i) repay amounts outstanding under, and extinguish, our former revolving credit facility, (ii) redeem all of the outstanding 12.25% senior secured notes at a premium over face value of $28.2 million, and (iii) satisfy our obligation under a guarantee of certain letters of credit supporting an industrial revenue bond. In connection with the debt extinguishment, we expensed unamortized fees of $22.6 million related to our former revolving credit facility and recognized this charge, as well as the $28.4 million in unamortized premium paid to the holders of the 12.25% senior secured notes, as a loss on extinguishment of debt in the consolidated statements of operations. We also incurred $15.4 million of debt issuance costs related to the Corporate Credit Facilities, which is included as a reduction of the corresponding debt liability in the accompanying consolidated balance sheets and will be amortized to interest expense over the life of the facilities using the effective interest method.
In July 2015, we amended our Term Loan Facility and borrowed an incremental $480 million in 2015 Incremental Term Loans. The proceeds were primarily used to make payments of approximately $431 million to holders of our then outstanding common stock, Series A Convertible Preferred Stock, Class B-1 Common Stock, options, and RSUs. We incurred $7.9 million of debt issuance costs related to the $480 million of incremental borrowings, which is included as an offset to long-term debt in the accompanying consolidated balance sheets and will be amortized to interest expense over the life of the facility using the effective interest method. See Note 17- Long-Term Debt in our financial statements for the year ended December 31, 2016.
On November 1, 2016 we increased borrowings under our existing Term Loan Facility and amended certain of its terms in the 2016 Term Loan Amendment. We borrowed an incremental $375 million and refinanced the previously outstanding principal loan amount of $1,236.6 million for a consolidated total of $1,611.6 million in principal amount outstanding under the Amended Term Loans. The proceeds from the incremental term loan borrowing, along with cash on hand, were used to fund a distribution to shareholders and holders of equity awards (See Note 21- Convertible Preferred Shares). The offering price of the incremental term loan debt was 99.75% of par. The Amended Term Loans bear interest at LIBOR (subject to a floor of 1.00%) plus a margin of up to 3.75%, depending on our net leverage ratio, and requires quarterly principal repayment beginning in March 2017. We incurred $8.1 million of debt issuance costs related to the 2016 Term Loan Amendment, which is included as an offset to long-term debt in the accompanying consolidated balance sheets. In connection with and using a portion of the proceeds from the IPO, we prepaid $375 million of the Amended Term Loans on February 6, 2017.
56
Based on our current level of operations, the seasonality of our business and anticipated growth, we believe that cash provided by operations and other sources of liquidity, including cash, cash equivalents and borrowings under our revolving credit facilities, will provide adequate liquidity for ongoing operations, planned capital expenditures and other investments, and debt service requirements for at least the next twelve months.
In the years ended December 31, 2016 and 2015, we had a net change in cash and cash equivalents of $10.9 million and $8.0 million, respectively.
We may, from time to time, refinance, reprice, extend, retire or otherwise modify our outstanding debt to lower our interest payments, reduce our debt or otherwise improve our financial position. These actions may include repricing amendments, extensions, and/or opportunistic refinancing of debt. The amount of debt that may be refinanced, repriced, extended, retired or otherwise modified, if any, will depend on market conditions, trading levels of our debt, our cash position, compliance with debt covenants and other considerations. Our affiliates may also purchase our debt from time to time, through open market purchases or other transactions. In such cases, our debt may not be retired, in which case we would continue to pay interest in accordance with the terms of the debt, and we would continue to reflect the debt as outstanding in our consolidated balance sheets.
Cash Flows
The following table summarizes the changes to our cash flows for the periods presented:
Year Ended December 31, | ||||||||||||
2016 | 2015 | 2014 | ||||||||||
(dollars in thousands) | ||||||||||||
Cash provided by (used in): | ||||||||||||
Operating activities | $ | 201,583 | $ | 172,339 | $ | 21,788 | ||||||
Investing activities | (156,782 | ) | (158,452 | ) | (56,738 | ) | ||||||
Financing activities | (52,001 | ) | (1,072 | ) | 105,617 | |||||||
Effect of changes in exchange rates on cash and cash equivalents | (3,670 | ) | (4,786 | ) | (2,791 | ) | ||||||
Net change in cash and cash equivalents | $ | (10,870 | ) | $ | 8,029 | $ | 67,876 | |||||
Cash Flow from Operations
Net cash provided by operating activities increased $29.3 million to $201.6 million in the year ended December 31, 2016 from $172.3 million provided by operations in the year ended December 31, 2015. This increase was primarily due to improved profitability, reductions in cash contributions to the U.S. pension plan and changes in working capital.
Net cash provided by operating activities increased $150.5 million to $172.3 million in the year ended December 31, 2015 from $21.8 million in the year ended December 31, 2014. This increase was primarily due to increased net income of $175.0 million in the year ended December 31, 2015 over the year ended December 31, 2014 partially offset by increased working capital usage and a decrease in non-cash expenses included in net income compared to the year ended December 31, 2014.
Cash Flow from Investing Activities
Net cash used in investing activities decreased $1.7 million to $156.8 million in the year ended December 31, 2016 from $158.5 million in the year ended December 31, 2015. The decrease was primarily due to an increase in sales of business units, property and equipment, partially offset by decreased capital expenditures.
Net cash used in investing activities increased $101.8 million to $158.5 million in the year ended December 31, 2015 from $56.7 million in the year ended December 31, 2014. This increase was primarily due to the use of $86.7 million of cash, net of the cash acquired, to complete the acquisitions completed in the year ended December 31, 2015 and $6.4 million in additional purchases of property and equipment in the year ended December 31, 2015 compared to the year ended December 31, 2014.
Cash Flow from Financing Activities
Net cash used in financing activities was $52.0 million in the year ended December 31, 2016 and was comprised primarily of $404.2 million of distributions to shareholders, $17.0 million in payments of short-term and long-term borrowings, and $8.1
57
million of debt issuance cost payments, partially offset by $374.1 million of net proceeds from the issuance of new debt and $2.3 million of employee and director note repayments.
Net cash used in financing activities in the year ended December 31, 2015 was $1.1 million and was comprised primarily of $419.2 million of distributions to shareholders, $44.6 million in common stock repurchases, $22.8 million of short-term and long-term borrowings, and $9.1 million of debt issuance cost payments, partially offset by $477.6 million of net proceeds from the issuance of new debt, $15.1 million of employee and director note repayments, and $2.0 million in common stock issuances.
As of December 31, 2016, our cash balances consisted of $5.4 million in the U.S. and $97.3 million in non-U.S. subsidiaries. We believe that our operations in the U.S. will be able to fund the majority of our near term cash requirements using cash flow from operations within the U.S. and availability under the ABL Facility.
Holding Company Status
We are a holding company that conducts all of our operations through subsidiaries. The majority of our operating income is derived from JWI, our main operating subsidiary. Consequently, we rely on dividends or advances from our subsidiaries. The ability of our subsidiaries to pay dividends to us is subject to applicable local law and may be limited due to the terms of other contractual arrangements, including our Credit Facilities.
The Euro Revolving Facility and Australia Senior Secured Credit Facility contain restrictions on dividends that limit the amount of cash that the obligors under these facilities can distribute to us. Obligors under the Euro Revolving Facility may pay dividends only out of available cash flow and only while no default is continuing under such agreement. Obligors under the Australia Senior Secured Credit Facility may pay dividends only to the extent they do not exceed 80% of after tax net profits (with a one-year carryforward of unused amounts) and only while no default is continuing under such agreement. The amount of our consolidated net assets that were available distributed under these financing arrangements as of December 31, 2016 was $404.0 million. For further information regarding the Euro Revolving Facility and the Australia Senior Secured Credit Facility, see "Euro Revolving Facility” and “Australia Senior Secured Credit Facility”.
Off-Balance Sheet Arrangements
We do not have any off-balance sheet arrangements that have or are reasonably likely to have a current or future material effect on our financial condition, changes in financial condition, revenues or expenses, results of operations, liquidity, capital expenditures, or capital resources.
Lines of Credit and Long-Term Debt
Corporate Credit Facilities
In October 2014, we entered into the Corporate Credit Facilities, which initially consisted of the Initial Term Loans and the ABL Facility. In July 2015, we entered the 2015 Incremental Term Loans and amended our Corporate Credit Facilities to, among other things, permit a distribution of approximately $420 million to holders of our common stock, our Series A Convertible Preferred Stock, and our Class B-1 Common Stock. In November 2016, we borrowed $375 million under our Term Loan Facility and entered the 2016 Term Loan Amendment to, among other things, (i) permit a $400 million distribution, (ii) reduce the interest rate on the initial term loans, and (iii) conform the terms (including providing for a maturity date of July 1, 2022) of all outstanding term loans under the Term Loan Facility. We incurred $8.1 million of debt issuance costs related to the 2016 Term Loan Amendment. In February 2017, we prepaid $375 million of outstanding principal under our Term Loan Facility and will record interest expense of approximately $6.1 million due to the write-off of a portion of the original issue discount and unamortized debt issuance costs associated with the Term Loan Facility. As of December 31, 2016, we were in compliance with the terms of the Corporate Credit Facilities.
Term Loan Facility
In connection with the 2016 Term Loan Amendment, we paid a fee of 0.25% on the principal amount of the Amended Term Loans. The Amended Term Loans bear interest at LIBOR (subject to a floor of 1.00%) plus a margin of 3.50% to 3.75% depending on a ratio of net debt to Adjusted EBITDA. We have entered into forward starting interest rate swap agreements in order to effectively change the interest rate on a substantial portion of our Term Loan Facility from a variable rate to a fixed rate. See Item 7A- Quantitative and Qualitative Disclosures About Market Risk- Interest Rate Risk. The Amended Term Loans amortize in nominal quarterly installments equal to 0.25% of the initial aggregate principal amount of the Amended Term Loans. The Term Loan Facility has various non-financial covenants, including restrictions on liens, indebtedness, and dividends, customary
58
representations and warranties, and customary events of defaults and remedies, but has no financial maintenance covenants. The Amended Term Loans mature on July 1, 2022.
The offering price of the Initial Term Loans was 99.00% of par and the offering price of the 2015 Incremental Term Loans was 99.50% of par. Prior to the 2016 Term Loan Amendment, the Initial Term Loans bore interest at LIBOR (subject to a floor of 1.00%) plus a margin of 4.25%. Prior to the 2016 Term Loan Amendment, the 2015 Incremental Term Loans bore interest at LIBOR (subject to a floor of 1.00%) plus a margin of 3.75% to 4.00% depending on our ratio of net debt to Adjusted EBITDA.
The Term Loan Facility permits us to add one or more incremental term loans up to the sum of: (i) an unlimited amount subject to compliance with a maximum total net first lien leverage ratio test of 4.35:1.00 plus (ii) voluntary prepayments of term loans plus (iii) a fixed amount of $285.0 million, in each case, subject to certain conditions.
ABL Facility
Extensions of credit under the ABL Facility are limited by a borrowing base calculated periodically based on specified percentages of the value of eligible accounts receivable, eligible inventory and certain other assets, subject to certain reserves and other adjustments. The borrowing base for U.S. and Canadian borrowers is calculated separately. U.S. borrowers may borrow up to $255 million under the ABL Facility and Canadian borrowers may borrow up to $45 million under the ABL Facility, in each case subject to periodic adjustments of such sub-limits and applicable borrowing base availability.
Borrowings under the ABL Facility bear interest primarily at LIBOR plus a margin that fluctuates from 1.50% to 2.00% depending on availability under the ABL Facility, although we may also borrow at other base rates plus a margin. We pay an annual commitment fee between 0.25% and 0.375% on the unused portion of the commitments under the ABL Facility. As of December 31, 2016, we had $226.9 million available under the ABL Facility. The ABL Facility has a minimum fixed charge coverage ratio that we are obligated to comply with under certain circumstances. The ABL Facility has various non-financial covenants, including restrictions on liens, indebtedness, and dividends, customary representations and warranties, and customary events of defaults and remedies. The ABL Facility matures on October 15, 2019.
The ABL Facility permits us to request increases in the amount of the commitments under the ABL Facility up to an aggregate maximum amount of $100 million, subject to certain conditions.
Australia Senior Secured Credit Facility
In September 2016, JWA amended and extended its credit agreement, the Australia Senior Secured Credit Facility, to provide for a AUD $18 million floating rate revolving loan facility, an AUD $5 million overdraft line of credit, and an $8 million AUD interchangeable facility for guarantees/letters of credit. The credit agreement matures in June 2019. At December 31, 2016, there were no borrowings under the revolving loan facility and the overdraft line of credit. Loans under the revolving loan facility bear interest at the Bank Bill Swap Bid rate (BBSY) plus a margin of 0.75%, and a commitment fee of 1.15% is also paid on the entire amount of the revolving loan facility. Overdraft balances bear interest at the bank’s reference rate minus a margin of 1.00%, and a commitment fee of 1.15% is paid on the entire amount of the overdraft facility. At December 31, 2016, we had $13.0 million available under the revolving loan facility and $3.6 million available under the overdraft line of credit. The credit facility is secured by guarantees of the subsidiaries of JWA, fixed and floating charges on the assets of the JWA group, and mortgages on certain real properties owned by the JWA group. The agreement requires that JWA maintain certain financial ratios, including a minimum consolidated interest coverage ratio and a maximum consolidated debt to EBITDA ratio. The agreement limits dividends and repayments of intercompany loans where the JWA group is the borrower and limits acquisitions without the bank’s consent. As of December 31, 2016, we were in compliance with the terms of the Australia Senior Secured Credit Facility.
Euro Revolving Facility
In January 2015, JELD-WEN of Europe B.V. (which was subsequently merged with JELD-WEN A/S, which survived the merger) entered into the Euro Revolving Facility, a €39 million revolving credit facility, which includes an option to increase the commitment by an amount of up to €10 million, with a syndicate of lenders and Danske Bank A/S, as agent. The Euro Revolving Facility matures on January 30, 2019. Loans under the Euro Revolving Facility bear interest at CIBOR, CHF LIBOR, EURIBOR, NIBOR, STIBOR or LIBOR, depending on the currency, plus a margin of 2.5%, and a commitment fee of 1% is also paid on the entire amount of the revolving credit facility calculated on a day-to-day basis. As of December 31, 2016, we had €0.7 million (or $0.7 million) in borrowings and €1.0 million (or $1.0 million) of bank guarantees outstanding, and €37.3 million (or $39.3 million) available under this facility. The Euro Revolving Facility requires JELD-WEN A/S to maintain certain financial ratios, including a maximum ratio of senior leverage to adjusted EBITDA (as calculated therein), and a minimum ratio of adjusted EBITDA (as calculated therein) to net finance charges. In addition, the Euro Revolving Facility has various non-financial covenants including
59
restrictions on liens, indebtedness, and dividends, customary representations and warranties, and customary events of default and remedies. As of December 31, 2016, we were in compliance with the terms of the Euro Revolving Facility.
Mortgage Note
In December 2007, JELD-WEN Danmark A/S entered into thirty-year mortgage notes secured by land and buildings with principal payments beginning in 2018 that will fully amortize the principal by the end of 2037. As of December 31, 2016, we had DKK 208.1 million (or $29.5 million) outstanding under these notes.
Installment Notes
We entered into installment notes representing insurance premium financing, miscellaneous capitalized equipment lease obligations, and a term loan secured by the related equipment with payments through 2022. As of December 31, 2016, we had $5.9 million outstanding under these notes.
Installment Notes for Stock
We entered into installment notes for stock representing amounts due to former or retired employees for repurchases of our stock that are payable over 5 or 10 years depending on the amount with payments through 2020. As of December 31, 2016, we had $3.3 million outstanding under these notes.
Interest Rate Swaps
We have eight outstanding interest rate swap agreements for the purpose of managing our exposure to changes in interest by effectively converting the interest rate on a portion of the Term Loan Facility to a fixed rate. Two such agreements became effective on September 30, 2015, two on June 30, 2016, two on September 30, 2016, and two on December 30, 2016.
For additional information on interest rate swaps, see Item 7- Management’s Discussion and Analysis of Financial Condition and Results of Operations, and Item 7A- Quantitative and Qualitative Disclosures About Market Risk- Interest Rate Risk”. The counterparties for these swap agreements are Royal Bank of Canada, Barclays Bank PLC, and Wells Fargo Bank, N.A. The aggregate notional amount covered under these agreements, which all expire on September 30, 2019, totals $914.3 million as of December 31, 2016. The table below sets forth the period, notional amount and fixed rates for our interest rate swaps:
Period | Notional | Average Fixed Rate | |
(dollars in thousands) | |||
September 2015 - September 2019 | $244,125 | 1.997% | |
June 2016 - September 2019 | $213,000 | 2.126% | |
September 2016 - September 2019 | $244,125 | 2.353% | |
December 2016 - September 2019 | $213,000 | 2.281% | |
Each of the swap agreements receives a floating rate based on three-month LIBOR and is settled every calendar quarter-end. The effect of these swap agreements is to lock in a fixed rate of interest on the aggregate notional amount hedged of approximately 2.1884% as of December 31, 2016, plus the applicable margin paid to lenders over three-month LIBOR. At December 31, 2016, the effective rate on the aggregate notional amount hedged (including the applicable margin paid to lenders over three-month LIBOR) was approximately 5.9384%. These swaps have been designated as cash flow hedges against variability in future interest rate payments on the Term Loan Facility and are marked to market through consolidated other comprehensive income (loss).
A hypothetical increase or decrease in interest rates of 1.0% (based on variable rate debt if revolving credit facilities were fully drawn and taking into account the eight interest rate swaps that were in effect on that date) would have increased or decreased our interest expense by $11.0 million for year ended December 31, 2016 and $13.8 million for the year ended December 31, 2015.
60
Repaid Long-Term Debt
Former Senior Secured Notes
In October 2011, JWI issued $460 million of senior secured notes. The interest rate on the senior secured notes was 12.25%, with interest payable semi-annually and all principal amounts due on October 15, 2017. All of our outstanding 12.25% senior secured notes were redeemed in October 2014 at a premium over face value of $28.2 million with a portion of the proceeds from the Initial Term Loans. In connection with the extinguishment of the notes, we expensed $28.4 million in unamortized premium paid to the bondholders and bank fees.
Former Senior Secured Credit Facility—U.S. and Europe
In October 2011, JWI and JELD-WEN of Europe B.V. entered into a senior secured credit agreement for up to $300 million of revolving credit loans with a $75 million sublimit for the issuance of letters of credit and a $100 million sublimit for borrowings by JELD-WEN of Europe B.V. The agreement required us to maintain certain financial ratios, including a minimum consolidated interest coverage ratio and a maximum consolidated total leverage ratio and limited certain investments, restricted payments, asset sales and our ability to incur additional debt and liens. The base interest rate was determined using the highest of the overnight Federal Funds rate plus 0.5%, the Eurodollar rate plus 1.0%, or the prime rate with a margin that varied based on our consolidated leverage ratio. Base rate loan margins ranged from 1.5% to 3.0%. Eurodollar based loans had margins ranging from 2.5% to 4.0% with a current margin of 3.0%. In October 2012, JWI and JELD-WEN of Europe B.V. amended and restated the senior secured credit agreement to add a $30 million term loan that bore interest at the Eurodollar rate plus 3.5% or the base rate plus 2.5%. In June 2013, JWI and JELD-WEN of Europe B.V. amended the senior secured credit agreement to add a $70 million term loan and also to provide for certain other amendments. Obligations outstanding under the $70 million term loan bore interest at the Eurodollar rate plus 3.5% or the base rate plus 2.50%, subject to a leverage-based step-down. All amounts outstanding under the former senior secured credit facilities were repaid in October 2014 with a portion of the proceeds from the Initial Term Loans and we expensed unamortized fees of $22.6 million in connection therewith.
As described above, in November 2016, the Amended Term Loans effectively replaced the Initial Term Loans and the 2015 Incremental Term Loans. On February 6, 2017, we prepaid $375 million of outstanding principal under our Term Loan Facility using a portion of the proceeds to us from our IPO.
Contractual Obligations
The following table summarizes our significant contractual obligations at December 31, 2016:
Payments Due By Period | ||||||||||||||||||||
Total | Less Than 1 Year | 1-3 Years | 3-5 Years | More Than 5 Years | ||||||||||||||||
(dollars in thousands) | ||||||||||||||||||||
Contractual Obligations(1) | ||||||||||||||||||||
Long-term debt obligations | $ | 1,645,349 | $ | 17,639 | $ | 37,599 | $ | 35,510 | $ | 1,554,601 | ||||||||||
Capital lease obligations | 5,880 | 2,399 | 2,374 | 1,088 | 19 | |||||||||||||||
Operating lease obligations | 184,343 | 34,979 | 52,326 | 42,398 | 54,640 | |||||||||||||||
Purchase obligations(2) | 439 | 439 | — | — | — | |||||||||||||||
Interest on long-term debt obligations(3) | 449,498 | 88,649 | 171,891 | 149,992 | 38,966 | |||||||||||||||
Totals: | $ | 2,285,509 | $ | 144,105 | $ | 264,190 | $ | 228,988 | $ | 1,648,226 | ||||||||||
____________________________
(1) | Not included in the table above are our unfunded pension liabilities totaling $126.0 million and uncertain tax position liabilities of $12.1 million as of December 31, 2016, for which the timing of payment is unknown. |
(2) | Purchase obligations are defined as purchase agreements that are enforceable and legally binding and that specify all significant terms, including quantity, price, and the approximate timing of the transaction. The obligation reflected in the table relates primarily to a sponsorship agreement. |
(3) | Interest on long-term debt obligations is calculated based on debt outstanding and interest rates in effect on December 31, 2016, taking into account scheduled maturities and amortizations and including the impact of our eight interest rate swaps that were in effect on that date. See Item 7- Management’s Discussion and Analysis of Financial Condition and Results of Operations- Lines of Credit and Long-Term Debt—Interest Rate Swaps for a description of when such swap agreements became effective. Interest on debt denominated in other currencies is calculated based on the exchange rate at December 31, 2016. |
61
Critical Accounting Policies and Estimates
Management’s discussion and analysis of its financial conditions and results of operations is based upon our consolidated financial statements, which have been prepared in accordance with GAAP. The preparation of these consolidated financial statements requires management to make estimates and judgments that affect the reported amounts of assets, liabilities, revenues and expenses, and related disclosure of contingent assets and liabilities. On an ongoing basis, management evaluates its estimates. Management bases its estimates on historical experience and on various other assumptions that are believed to be reasonable under the circumstances, the results of which may differ from these estimates. Our significant accounting policies are fully disclosed in our annual consolidated financial statements included elsewhere in this Form 10-K. The following discussion highlights the estimate we believe are critical and should be read in conjunction with the consolidated financial statements included in Part II, Item 8 of this Form 10-K.
Revenue Recognition
We recognize revenue when four basic criteria have been met: (i) persuasive evidence of a customer arrangement exists; (ii) the price is fixed or determinable; (iii) collectability is reasonably assured; and (iv) product delivery has occurred or services have been rendered. We recognize revenue based on the invoice price less allowances for sales returns, cash discounts, and other deductions as required under GAAP. Amounts billed for shipping and handling are included in net revenues, while costs incurred for shipping and handling are included in cost of sales. Incentive payments to customers that directly relate to future business are recorded as a reduction of net revenues over the periods during which such future benefits are realized.
Acquisitions
We allocate the fair value of purchase consideration to the tangible assets acquired, liabilities assumed and intangible assets acquired based on their acquisition date fair values. Goodwill as of the acquisition date is measured as the excess of consideration transferred over the net of the acquisition date fair values of the assets acquired and the liabilities assumed. If the fair value of the acquired assets exceeds the purchase price the difference is recorded as a bargain purchase in other income (expense). Such valuations require management to make significant estimates and assumptions, especially with respect to intangible assets. As a result, during the measurement period, which may be up to one year from the acquisition date, material adjustments must be reflected in the comparative consolidated financial statements in the period in which the adjustment amount will be determined. Upon the conclusion of the measurement period or final determination of the values of assets acquired or liabilities assumed, whichever comes first, any subsequent adjustments are recorded to our consolidated statements of operations. Newly acquired entities are included in our results from the date of their respective acquisitions.
Allowance for Doubtful Accounts
Substantially all accounts receivable arise from sales to customers in our manufacturing and distribution businesses and are recognized net of offered cash discounts. Credit is extended in the normal course of business under standard industry terms that normally reflect 60 day or less payment terms and do not require collateral. An allowance is recorded based on a variety of factors, including the length of time receivables are past due, the financial health of our customers, unusual macroeconomic conditions and historical experience. If the customer’s financial conditions were to deteriorate resulting in the inability to make payments, additional allowances may need to be recorded which would result in additional expenses being recorded for the period in which such determination was made.
Inventories
Inventories are valued at the lower of cost or market and are determined by the FIFO or average cost methods. We record provisions to write-down obsolete and excess inventory to estimated net realizable value. The process for evaluating obsolete and excess inventory requires us to make subjective judgments and estimates concerning future sales levels, quantities and prices at which such inventory will be able to be sold in the normal course of business. Accelerating the disposal process or incorrect estimates of future sales potential may cause actual results to differ from the estimates at the time such inventory is disposed or sold.
62
Intangible Assets
Definite lived intangible assets are amortized on a straight-line basis over their estimated useful lives that typically range from 5 to 40 years. The lives of definite lived intangible assets are reviewed and reduced if necessary whenever changes in their planned use occur. Legal and registration costs related to internally developed patents and trademarks are capitalized and amortized over the lesser of their expected useful life or the legal patent life. The carrying value of intangible assets is reviewed by management to assess the recoverability of the assets when facts and circumstances indicate that the carrying value may not be recoverable.
Long-Lived Assets
Long-lived assets, other than goodwill, are reviewed for impairment whenever events or changes in circumstances indicate the carrying amount of such assets may not be recoverable. Such events or circumstances include, but are not limited to, a significant decrease in the fair value of the underlying business or a change in utilization of property and equipment.
We group assets to test for impairment at the lowest level for which identifiable cash flows are largely independent of the cash flows of other groups of assets and liabilities. Recoverability of assets to be held and used is measured by a comparison of the carrying amount of an asset to estimated undiscounted future cash flows expected to be generated by the assets.
When evaluating long-lived assets and definite lived intangible assets for potential impairment, the first step to review for impairment is to forecast the expected undiscounted cash flows generated from the anticipated use and eventual disposition of the asset. If the expected undiscounted cash flows are less than the carrying value of the asset, then an impairment charge is required to reduce the carrying value of the asset to fair value. If we recognize an impairment loss, the carrying amount of the asset is adjusted to fair value based on the discounted estimated future net cash flows and will be its new cost basis. For a depreciable long-lived asset, the new cost basis will be depreciated over the remaining useful life of that asset. For an amortizable intangible asset, the new cost basis will be amortized over the remaining useful life of the asset. Our impairment loss calculations require management to apply judgments in estimating future cash flows to determine asset fair values, including forecasting useful lives of the assets and selecting the discount rate that represents the risk inherent in future cash flows.
Goodwill
Goodwill is tested for impairment on an annual basis during the fourth quarter and between annual tests if indicators of potential impairment exist, using a fair-value-based approach. Current accounting guidance provides an entity the option to perform a qualitative assessment to determine whether it is more likely than not that the fair value of a reporting unit is less than its carrying amount prior to performing the two-step goodwill impairment test. If this is the case, the two-step goodwill impairment test is required. If it is more likely than not that the fair value of a reporting is greater than its carrying amount, the two-step goodwill impairment test is not required.
If the two-step goodwill impairment test is required, first, the fair value of the reporting unit is compared with its carrying amount (including attributable goodwill). If the fair value of the reporting unit is less than its carrying amount, an indication of goodwill impairment exists for the reporting unit and the entity must perform step two of the impairment test (measurement). Under step two, an impairment loss is recognized for any excess of the carrying amount of the reporting unit’s goodwill over the implied fair value of that goodwill. The implied fair value of goodwill is determined by allocating the fair value of the reporting unit in a manner similar to a purchase price allocation and the residual fair value after this allocation is the implied fair value of the reporting unit goodwill. Fair value of the reporting unit is determined using a discounted cash flow analysis. If the fair value of the reporting unit exceeds its carrying amount, step two does not need to be performed.
We estimated the fair value of our reporting units using a discounted cash flow model (implied fair value measured on a non-recurring basis using level 3 inputs). Inherent in the development of the discounted cash flow projections are assumptions and estimates of our future revenue growth rates, profit margins, business plans, cost of capital and tax rates. Our judgments with respect to these metrics are based on historical experience, current trends, consultations with external specialists, and other information. Changes in assumptions or estimates used in our goodwill impairment testing could materially affect the determination of the fair value of a reporting unit, and therefore, could eliminate the excess of fair value over carrying value of a reporting unit and, in some cases, could result in impairment. Such changes in assumptions could be caused by items such as a loss of one or more significant customers, decline in the demand for our products due to changing economic conditions or failure to control cost increases above what can be recouped in sale price increases. These types of changes would negatively affect our profits, revenues and growth over the long term and such a decline could significantly affect the fair value assessment of our reporting units and cause our goodwill to become impaired.
63
As of December 31, 2016, the fair value of our North America, Europe and Australasia reporting units would have to decline by approximately 73%, 60% and 43%, respectively, to be considered for potential impairment.
Warranty Accrual
Warranty terms range primarily from one year to lifetime on certain window and door components. Warranties are normally limited to replacement or service of defective components for the original customer. Some warranties are transferable to subsequent owners and are generally limited to ten years from the date of manufacture or require pro-rata payments from the customer. A provision for estimated warranty costs is recorded at the time of sale based on historical experience and we periodically adjust these provisions to reflect actual experience.
Income Taxes
Income taxes are accounted for under the asset and liability method. Deferred tax assets and liabilities are recognized for the future tax consequences attributable to differences between the financial statement carrying amounts of existing assets and liabilities and their respective tax bases and operating loss and tax credit carryforwards. Deferred tax assets and liabilities are measured using enacted tax rates expected to apply to taxable income in the years in which those temporary differences are expected to be recovered or settled. The effect on the deferred tax assets and liabilities of a change in tax rates is recognized in income in the period that includes the enactment date. We evaluate both the positive and negative evidence that is relevant in assessing whether we will realize the deferred tax assets. A valuation allowance is recorded when it is more likely than not that some of the deferred tax assets will not be realized. Given our current earnings and anticipated future earnings, we believe that there is a reasonable possibility that within the next twelve months, sufficient positive evidence may become available to allow us to reach a conclusion that a significant portion of our valuation allowance will no longer be needed. The potential release of the valuation allowance is dependent on our ability to achieve sustained profitable operations from continued execution of our operating strategy. Release of the valuation allowance would result in the recognition of certain deferred tax assets and a decrease in the provision for income taxes for the period the release is recorded. Therefore, the exact timing and amount of the valuation allowance release and the ultimate impact on our financial statements are subject to change on the basis of the level of profitability that we are able to actually achieve.
The tax effects from an uncertain tax position can be recognized in the consolidated financial statements only if the position is more likely than not to be sustained, based on the technical merits of the position and the jurisdiction. We recognize the financial statement benefit of a tax position only after determining that the relevant tax authority would more likely than not sustain the position following an audit and the tax related to the position would be due to the entity and not the owners. For tax positions meeting the more likely than not threshold, the amount recognized in the consolidated financial statements is the largest benefit that has a greater than 50 percent likelihood of being realized, upon ultimate settlement with the relevant tax authority. We apply this accounting standard to all tax positions for which the statute of limitations remains open. Changes in recognition or measurement are reflected in the period in which the change in judgment occurs.
We file a consolidated federal income tax return in the U.S. and various states. For financial statement purposes, we calculate the provision for federal income taxes using the separate return method. Certain subsidiaries file separate tax returns in certain countries and states. Any state and foreign income taxes refundable and payable are reported in other current assets and accrued income taxes payable in the consolidated balance sheets. We record interest and penalties on amounts due to tax authorities as a component of income tax expense in the consolidated statements of operations.
Derivative Financial Instruments
We utilize derivative financial instruments to manage interest rate risk associated with our borrowings and foreign currency exposures related to subsidiaries that operate outside the U.S. and use their local currency as the functional currency. We record all derivative instruments in the consolidated balance sheets at fair value. Changes in a derivative’s fair value are recognized in earnings unless specific hedge criteria are met and we elect hedge accounting prior to entering into the derivative. If a derivative is designated as a fair value hedge, the changes in fair value of both the derivative and the hedged item attributable to the hedged risk are recognized in the results of operations. If the derivative is designated as a cash flow hedge, changes in the fair value of the derivative are recorded in consolidated other comprehensive income (loss) and subsequently classified to the consolidated statements of operations when the hedged item impacts earnings. At the inception of a fair value or cash flow hedge transaction, we formally document the hedge relationship and the risk management objective for undertaking the hedge. In addition, we assess both at inception of the hedge and on an ongoing basis, whether the derivative in the hedging transaction has been highly effective in offsetting changes in fair value or cash flows of the hedged item and whether the derivative is expected to continue to be highly effective. The impact of any ineffectiveness is recognized in our consolidated statements of operations.
64
Share-based Compensation Plan
We have share-based compensation plans that provide for compensation to employees through various grants of share-based instruments. We apply the fair value method of accounting using the Black-Scholes option pricing model to determine the compensation expense for stock appreciation rights. The compensation expense for restricted stock units awarded is based on the fair value of the restricted stock units at the date of grant. Compensation expense is recorded in the consolidated statements of comprehensive income (loss) and is recognized over the requisite service period. The determination of obligations and compensation expense requires the use of several mathematical and judgmental factors, including stock price, expected volatility, the anticipated life of the option, and estimated risk-free rate and the number of shares or share options expected to vest. Any difference in the number of shares or share options that actually vest can affect future compensation expense. Other assumptions are not revised after the original estimate. For stock options granted prior to our IPO, we prepared the valuations with the assistance of a third-party valuation firm, utilizing approaches and methodologies consistent with the AICPA Practice Aid, and information provided by our management, including historical and projected financial information, prospects and risks, our performance, various corporate documents, capitalization, and economic and financial market conditions. With our third-party valuation firm, we also utilized other economic, industry, and market information obtained from other resources considered reliable.
The Black-Scholes option-pricing model requires the use of weighted average assumptions for estimated expected volatility, estimated expected term of stock options, risk-free rate, estimated expected dividend yield, and the fair value of the underlying common stock at the date of grant. Because we do not have sufficient history following our IPO to estimate the expected volatility of our common stock price, expected volatility is based on a selection of public guideline companies. We estimate the expected term of all stock options based on previous history of exercises. The risk-free rate is based on the U.S. Treasury yield curve in effect at the time of grant for the expected term of the stock option. The expected dividend yield rate is 0.00% which is consistent with the expected dividends to be paid on common stock. The fair value of the underlying common stock at the date of grant is discussed below. We estimate forfeitures based on our historical analysis of actual stock option forfeitures. Actual forfeitures are recorded when incurred and estimated forfeitures are reviewed and adjusted at least annually.
Common Stock Valuations
Prior to our IPO, due to the absence of an active market for our common stock, the fair value of our common stock was determined in good faith by our Board, with the assistance and upon the recommendation of management, based on a number of objective and subjective factors consistent with the methodologies outlined in the AICPA Practice Aid.
The key assumptions we used in our valuations to determine the fair value of our common stock on each valuation date included forecasted financial performance, multiples of guideline public companies, and a lack of marketability discount.
Employee Retirement and Pension Benefits
The obligations under our defined benefit pension plans are calculated using actuarial models and methods. The most critical assumption and estimate used in the actuarial calculations is the discount rate for determining the current value of benefit obligations. Other assumptions and estimates used in determining benefit obligations and plan expenses include expected return on plan assets, inflation rates, and demographic factors such as retirement age, mortality, and turnover. These assumptions and estimates are evaluated periodically and are updated accordingly to reflect our actual experience and expectations.
The discount rate used to determine the benefit obligations was computed through a projected benefit cash flow model. This approach determines the discount rate as the rate that equates the present value of the cash flows (determined using that single rate) to the present value of the cash flows where each cash flows' present value is determined using the spot rates from the November 30, 2015 Citigroup Liability Discount Curve.
The discount rate utilized to calculate the projected benefit obligation at the measurement date for our U.S. pension plan decreased to 4.00% at December 31, 2016 from 4.25% at December 31, 2015. As the discount rate is reduced or increased, the pension and post retirement obligation would increase or decrease, respectively, and future pension and post-retirement expense would increase or decrease, respectively. Lowering the discount rate by 0.25% would increase the pension and post-retirement obligation at December 31, 2016 by approximately $14.4 million and would increase estimated fiscal year 2017 expense by approximately $1.3 million. Increasing the discount rate by 0.25% would decrease the pension and post-retirement obligation at December 31, 2016 by approximately $13.6 million and would decrease estimated fiscal year 2017 expense by approximately $1.2 million.
65
We determine the expected long-term rate of return on plan assets based on the plan assets’ historical long term investment performance, current asset allocation, and estimates of future long-term returns by asset class. Holding all other assumptions constant, a 1% increase or decrease in the assumed rate of return on plan assets would have decreased or increased, respectively, 2016 net periodic pension expense by approximately $2.9 million.
The actuarial assumptions we use in determining our pension benefits may differ materially from actual results because of changing market and economic conditions, higher or lower withdrawal rates, or longer or shorter life spans of participants. While we believe that the assumptions used are appropriate, differences in actual experience or changes in assumptions might materially affect our financial position or results of operations.
Capital Expenditures
We expect that the majority of our capital expenditures will be focused on supporting our cost reduction and efficiency improvement projects, certain growth initiatives, and to a lesser extent, on sustaining our current manufacturing operations. We are subject to health, safety, and environmental regulations that may require us to make capital expenditures to ensure our facilities are compliant with those various regulations.
Item 7A - Quantitative and Qualitative Disclosures About Market Risk
We are exposed to various types of market risks, including the effects of adverse fluctuations in foreign currency exchange rates, adverse changes in interest rates, and adverse movements in commodity prices for products we use in our manufacturing. To reduce our exposure to these risks, we maintain risk management controls and policies to monitor these risks and take appropriate actions to attempt to mitigate such forms of market risk.
Exchange Rate Risk
We have global operations and therefore enter into transactions denominated in various foreign currencies. To mitigate cross-currency transaction risk, we analyze significant forecast exposures where we expect receipts or payments in a currency other than the functional currency of our operations, and from time to time we may strategically enter into short-term foreign currency forward contracts to lock in some or all of the cash flows associated with these transactions. We also are subject to currency translation risk associated with converting our foreign operations’ financial statements into U.S. dollars. We use short-term foreign currency forward contracts and swaps to mitigate the impact of foreign exchange fluctuations on consolidated earnings. We use foreign currency derivative contracts, with a total notional amount of $70.2 million, in order to manage the effect of exchange fluctuations on forecasted sales, purchases, acquisitions, inventory and capital expenditures and certain intercompany transactions that are denominated in foreign currencies. We use foreign currency derivative contracts, with a total notional amount of $54.6 million, to hedge the effects of translation gains and losses on intercompany loans and interest. We also use foreign currency derivative contracts, with a total notional amount of $150.8 million, to mitigate the impact to the consolidated earnings of the Company from the effect of the translation of certain subsidiaries’ local currency results into U.S. dollars. We do not use derivative financial instruments for trading or speculative purposes.
Interest Rate Risk
We are subject to interest rate market risk in connection with our long-term debt, which is primarily floating rate. To manage our interest rate risk we enter into interest rate swaps where we deem it appropriate. We do not use financial instruments for trading or other speculative purposes and are not a party to any leveraged derivative instruments. Our net exposure to interest rate risk is based on the difference between outstanding variable rate debt and the notional amount of our designated interest rate swaps. We assess interest rate risk by continually identifying and monitoring changes in interest rate exposures that may adversely impact expected future cash flows and by evaluating hedging opportunities. We maintain risk management control systems to monitor interest rate risk attributable to both our outstanding or forecasted debt obligations as well as any offsetting hedge positions. The risk management control systems involve the use of analytical techniques, including cash flow sensitivity analysis, to estimate the expected impact of changes in interest rates on our future cash flows.
Our primary interest rate risk is associated with our credit facilities in the U.S., Canada, Australia, and Europe. A hypothetical 100 basis point increase in interest rates would result in an additional $20.2 million in interest expense per annum under our credit facilities, assuming fully-drawn utilization of each facility. Accordingly, we entered into forward starting interest rate swap agreements to effectively change the interest rate on a portion of our variable rate Term Loan Facility to a fixed rate. As of December 31, 2016 we had eight outstanding forward starting interest rate swaps that expire in 2019, two of which became effective September 30, 2015, two of which became effective on June 30, 2016, two of which became effective on September 30, 2016, and two of which became effective on December 30, 2016. These eight interest rate swaps hedge $914.3 million of floating rate debt. Accordingly, after giving
66
effect to such interest rate swaps, a hypothetical 100 basis point increase in interest rates would result in an additional $11.0 million in interest expense per annum under our credit facilities, assuming fully-drawn utilization of each facility. All eight interest rate swaps have been designated as cash flow hedges against variability in future interest rate payments on the Term Loan Facility and are marked to market through consolidated other comprehensive income (loss). Gains and losses are realized in other income (loss) at the time of settlement payment from or to the swap counterparty.
By using derivative financial instruments to hedge exposures to changes in interest rates and foreign currency fluctuations, we are exposed to credit risk and market risk. Credit risk is the failure of the counterparty to perform under the terms of the derivative contract. When the fair value of a derivative contract is positive, the counterparty owes us, which creates credit risk for us. When the fair value of a derivative contract is negative, we owe the counterparty and, therefore, we are not exposed to the counterparty’s credit risk in those circumstances. We attempt to minimize counterparty credit risk in derivative instruments by entering into transactions with high-quality counterparties whose credit rating is at least A. Our derivative instruments do not contain credit risk related contingent features.
Raw Materials Risk
Our major raw materials include glass, vinyl extrusions, aluminum, steel, wood, hardware, adhesives, and packaging. Prices of these commodities can fluctuate significantly in response to, among other things, variable worldwide supply and demand across different industries, speculation in commodities futures, general economic or environmental conditions, labor costs, competition, import duties, tariffs, worldwide currency fluctuations, freight, regulatory costs, and product and process evolutions that impact demand for the same materials. Increasing raw material prices directly impact our cost of sales, and our ability to maintain margins depends on implementing price increases in response to increasing raw material costs. The market for our products may or may not accept price increases, and as such there is no assurance that we can maintain margins in an environment of rising commodity prices. See Item 1A- Risk Factors- Risks Relating to Our Business and Industry- Prices of the raw materials we use to manufacture our products are subject to fluctuations, and we may be unable to pass along to our customers the effects of any price increases.
We have not historically used derivatives or similar instruments to hedge commodity price fluctuations. We purchase from multiple, geographically diverse companies in order to mitigate the adverse impact of higher prices for our raw materials. We also maintain other strategies to mitigate the impact of higher raw material, energy, and commodity costs, which typically offset only a portion of the adverse impact.
Item 8 - Financial Statements and Supplementary Data.
See Index to Consolidated Financial Statements beginning on page F-1 of this Form 10-K.
Item 9 - Changes in and Disagreements with Accountants on Accounting and Financial Disclosure.
None.
Item 9A. Controls and Procedures.
Evaluation of Disclosure Controls and Procedures: Our Chief Executive Officer and Chief Financial Officer conducted an evaluation of our disclosure controls and procedures as required by Exchange Act Rules 13a-15(e) and 15d-15(e) and concluded that, as of the end of the period covered by this report, our disclosure controls and procedures were not effective as a result of the material weaknesses in our internal control over financial reporting discussed below.
Material Weaknesses. A material weakness is a deficiency, or combination of deficiencies, in internal control over financial reporting, such that there is a reasonable possibility that a material misstatement in our annual or interim consolidated financial statements will not be prevented, or detected and corrected on a timely basis. As previously identified and disclosed in our Registration Statement on Form S-1 (File No. 333-211761) relating to our initial public offering, our management identified deficiencies in our internal control over financial reporting related to accounting for income tax for the period ended December 31, 2015 and determined the ineffective controls over income tax accounting and disclosure controls and procedures constituted material weaknesses in internal control over financial reporting. Management determined that (i) it failed to resource the tax department with the appropriate complement of people, skills, and training to adequately perform the controls in place as intended by their design; (ii) as a result, it did not operate controls to monitor the accuracy of income tax expense and related balance sheet accounts, including deferred income taxes; and (iii) it failed to operate controls to monitor the presentation and disclosure of income taxes. These control deficiencies resulted in numerous audit adjustments in the income tax accounts and disclosures which were rectified prior to the completion of the 2015 audit and there were no material misstatements identified in our disclosures or financial statements subsequent to year-end. However, these material weaknesses could result in a misstatement of the aforementioned account balances or disclosures
67
that would result in a material misstatement of our annual or interim consolidated financial statements that would not be prevented or detected.
Remediation Plan. Management has begun implementing a remediation plan to address the control deficiencies that led to the material weakness. The remediation plan includes the following:
• | Engagement of an external accounting firm to review our quarterly and annual tax calculations; |
• | Recruitment of and hiring experienced resources with backgrounds in accounting for income taxes as well as public company experience; |
• | Implementation of and training on a tax reporting software solution and enhancements of our related internal reporting requirements relating thereto; and |
• | Engagement of an external accounting firm to review our tax provision processes and recommend process enhancements. |
In accordance with our internal control compliance program, a material weakness is not considered remediated until the remediation processes have been operational for a sufficient period of time and successfully tested. However, we believe that full execution on the foregoing actions will remediate the material weaknesses and our goal is to remediate these material weaknesses by the end of 2017.
Management’s Report on Internal Control over Financial Reporting: This Form 10-K does not include a report of management’s assessment regarding internal control over financial reporting or an attestation report of our independent registered public accounting firm due to a transition period established by the rules of the SEC for newly public companies.
Changes in internal controls. The remediation actions described above are the only changes in our internal control over financial reporting as defined in Exchange Act Rules 13a-15(f) and 15d-15(f) that occurred during our most recently completed fiscal quarter that have materially affected, or are reasonably likely to materially affect, our internal control over financial reporting.
Item 9B - Other Information.
None.
68
Item 10 - Directors, Executive Officers and Corporate Governance
Executive Officers and Directors
The following table sets forth information about our executive officers and directors, including their ages as of February 23, 2017.
Name | Age | Position | |
Mark Beck | 51 | President, Chief Executive Officer, and Director | |
L. Brooks Mallard | 50 | Executive Vice President and Chief Financial Officer | |
Laura W. Doerre | 49 | Executive Vice President, General Counsel and Chief Compliance Officer | |
John Dinger | 51 | Executive Vice President and President, North America | |
Peter Farmakis | 49 | Executive Vice President and President, Australasia | |
Peter Maxwell | 54 | Executive Vice President and President, Europe | |
Timothy Craven | 48 | Executive Vice President, Human Resources | |
John Linker | 41 | Senior Vice President, Corporate Development and Investor Relations | |
Kirk Hachigian | 57 | Chairman and Director | |
Martha (Stormy) Byorum | 68 | Director | |
Greg G. Maxwell | 60 | Director | |
Anthony Munk | 56 | Director | |
Matthew Ross | 40 | Director | |
Bruce Taten | 61 | Director | |
Patrick Tolbert | 71 | Director | |
Roderick Wendt | 62 | Vice Chairman and Director | |
Steven Wynne | 64 | Director | |
Mark Beck, President, Chief Executive Officer, and Director. Mr. Beck joined the Company as Chief Executive Officer and President in November 2015 and joined our board of directors in May 2016. Mr. Beck joined the Company from Danaher Corporation, where he served as Executive Vice President of the Water Quality and Dental Platforms beginning in April 2014. Previously, Mr. Beck spent 18 years with Corning Incorporated in a series of management positions with increasing responsibility, culminating in his appointment as Executive Vice President of Corning Incorporated’s Environmental Technologies and Life Science units in July 2012. Earlier in his career, Mr. Beck spent six years in the residential construction industry. In addition, Mr. Beck served on the board of directors of Dow Corning Corporation, a private manufacturing company, from October 2011 to April 2014. Mr. Beck holds a B.A. in Business Management from Pacific University and an M.B.A. from Harvard Business School. Mr. Beck was selected to serve on our board of directors due to his business experience and current service as our Chief Executive Officer.
L. Brooks Mallard, Executive Vice President and Chief Financial Officer. Mr. Mallard has served as Executive Vice President and Chief Financial Officer of the Company since November 2014. Prior to joining the Company, Mr. Mallard served as Finance Director of the Global Braking Business at TRW Automotive Holdings Corporation from March 2013 to October 2014. From 2003 to February 2013 Mr. Mallard also worked at Cooper Industries plc, where he served in positions of increasing authority, including Vice President of Finance and Administration of Cooper Bussmann from 2007 to August 2011 and Vice President of Finance and Administration of Cooper Power Systems from August 2011 to February 2013. Earlier in his career, Mr. Mallard served in executive financial positions at Thomas & Betts Corporation, Briggs and Stratton Corporation, and GAF Materials Corporation. Mr. Mallard holds a B.B.A. and an M.B.A. from Georgia Southern University. He has also earned both the Certified Management Accountant and Certified Financial Management designations from the Institute of Management Accountants.
Laura W. Doerre, Executive Vice President, General Counsel and Chief Compliance Officer. Ms. Doerre joined the Company in September 2016 and is responsible for the Company’s global legal affairs and global risk and compliance functions. Prior to joining the Company, Ms. Doerre served as Vice President and General Counsel for Nabors Industries Ltd. from October 2008 to August 2016. From 1996 to 2008, she held positions of increasing responsibilities with Nabors. Prior to joining Nabors in 1996, Ms. Doerre practiced commercial litigation with the law firm Mayor, Day, Caldwell & Keeton LLP. Ms. Doerre received her B.S. with distinction in Accounting from the University of North Carolina at Chapel Hill and graduated with honors from the University of Texas School of Law. She is admitted to practice law in the state of Texas.
69
John Dinger, Executive Vice President and President, North America. Mr. Dinger joined the Company as Executive Vice President and President, North America in November 2015. Prior to joining the Company, Mr. Dinger served as Senior Vice President and General Manager of Americas of the Crouse-Hinds Division at Eaton Corporation (formerly Cooper Industries) from January 2012 to October 2015. Mr. Dinger also served as Vice President of Global Marketing at Cooper Industries from July 2006 through December 2011. During his more than 20 years at Eaton Corporation and Cooper Industries, Mr. Dinger also served in a number of operations positions, including Vice President of Global Operations. Mr. Dinger earned a B.S. in Industrial and Systems Engineering from Ohio University and holds an M.B.A. from Syracuse University.
Peter Farmakis, Executive Vice President and President, Australasia. Mr. Farmakis joined the Company as Chief Operating Officer, Australia in September 2013 and was promoted to Executive Vice President and President, Australasia in June 2014. Prior to joining the Company, Mr. Farmakis served as Chief Executive Officer of Dexion Limited (which was acquired by GUD Holdings Limited in 2012) from 2007 until August 2013. Mr. Farmakis also served in a variety of key leadership roles with numerous companies, including as Executive General Manager of Smorgon Steel Group Limited, Distribution Business; Global Vice President of Huntsman Corporation, Advanced Materials division; Americas Regional President of Vantico Inc.; and Strategy & Corporate Planning Manager for Ciba-Geigy AG in Switzerland. He began his career in research and development with ICI (Dulux) and Bayer AG. Mr. Farmakis earned a B.S. from the University of Wollongong and a postgraduate degree in Marketing and Finance from the University of Technology, Sydney in Australia.
Peter Maxwell, Executive Vice President and President, Europe. Mr. Maxwell joined the Company as Executive Vice President and President, Europe in September 2015. Prior to joining the Company, Mr. Maxwell served as a Vice President and General Manager at MTL Instruments Group, Eaton Corporation from September 2008 to August 2015. Previously, Mr. Maxwell worked for Cooper Industries (which was acquired by Eaton Corporation in 2012) for nearly 20 years and held various general management roles of increasing responsibility within Cooper Industries and Eaton Corporation serving the commercial and industrial building sector and the oil and gas sector as Vice President and General Manager in the Crouse-Hinds Division. He served as the Chief Financial Officer of Cooper Industries’ Safety Division based in Europe from 1998 to 2002. Mr. Maxwell graduated with a B.Sc. in Civil Engineering from the University of Edinburgh before qualifying as a Chartered Accountant with Coopers & Lybrand, now PricewaterhouseCoopers LLP.
Timothy Craven, Executive Vice President, Human Resources. Mr. Craven was appointed Vice President, Employee Relations of the Company in July 2015 and was promoted to his current role as Executive Vice President, Human Resources in February 2016. Mr. Craven is responsible for global human resources and employee relation activities. His duties include talent acquisition, training and development, wage and benefit reviews, and employee engagement. Previously, Mr. Craven was employed at Eaton Corporation (formerly Cooper Industries) where he held a number of senior-level human resources roles since 2007. Immediately prior to joining the Company, Mr. Craven served as Vice President, Human Resources at the Crouse-Hinds Division of Eaton Corporation in Syracuse, New York. Earlier in his career, Mr. Craven served in a number of human resources positions of increasing responsibility at both corporate and operating locations with Xerox’s Affiliated Computer Services Business and Honeywell, Inc. Mr. Craven earned a B.S. in human resource management from Western Illinois University.
John Linker, Senior Vice President, Corporate Development and Investor Relations. Mr. Linker joined the Company in December 2012 and currently holds the position of Senior Vice President, Corporate Development and Investor Relations. In this role, Mr. Linker has global responsibility for mergers, acquisitions, strategy, and investor relations. Previously, Mr. Linker was the Treasurer for the Company, where he was responsible for all capital markets, cash management, investor relations, credit, collections and risk management activities. Prior to joining the Company, Mr. Linker held the position of Director, Mergers and Acquisitions for the Aerospace Systems division of United Technologies Corporation and its predecessor, Goodrich Corporation, since 2008. Mr. Linker began his career in investment banking for Wells Fargo and consulting for Accenture PLC. Mr. Linker’s experience includes 16 years of corporate mergers and acquisitions and capital markets experience. Mr. Linker holds a B.A. in Economics and International Studies from Duke University and a M.B.A. from The Fuqua School of Business at Duke University.
Kirk Hachigian, Chairman and Director. Mr. Hachigian has served as a director of the Company since September 2013, as Executive Chairman from November 2015 to December 2016 and as Chairman since December 2016. Mr. Hachigian also served as Chief Executive Officer and President of the Company from March 2014 until his appointment as Executive Chairman. He served as Chairman, President, and Chief Executive Officer of Cooper Industries, a $5.8 billion global manufacturer of electrical products, from 2006 until its merger with Eaton Corporation in October 2012. Prior to joining Cooper Industries, Mr. Hachigian was President and Chief Executive Officer of Asia Pacific Operations for GE Lighting. He has served as lead director for Allegion plc since 2013, as a director of NextEra Energy Inc. since 2013 and chair of NextEra’s compensation committee since 2016, and a director of PACCAR Inc. since 2008. He earned a B.S. in mechanical engineering from the University of California at Berkeley and an M.B.A. from The Wharton School at the University of Pennsylvania. Mr. Hachigian brings to the Company extensive global experience in the residential and commercial construction end markets, including selling through both traditional distributors and major home centers. Mr. Hachigian was selected to serve on our board of directors due to his extensive business experience with leading industrial companies and his prior service as our Chief Executive Officer.
70
Martha (Stormy) Byorum, Director. Ms. Byorum has served on our board of directors since July 2014. She is the Founder and CEO of Cori Investment Advisors, LLC, a provider of alternative finance solutions for Latin American and U.S. Hispanic investors, which was spun off in 2003 from Violy, Byorum & Partners Holdings, LLC, a leading independent strategic advisory and investment banking firm specializing in Latin America. Previously Ms. Byorum was an Executive Vice President of Stephens, Inc., a private investment banking firm, from 2005 through 2013 and Senior Managing Director of Stephens Cori Capital Advisors, a division of Stephens, Inc., from 2005 to 2012. In 1996, prior to co-founding Violy, Byorum & Partners Holdings, LLC, Ms. Byorum ended a 24-year career at Citibank, where, among other roles, she served as Chief of Staff and Chief Financial Officer for Citibank’s Latin America Banking Group from 1986 to 1990, overseeing $15 billion of loans and coordinating activities in 22 countries. Ms. Byorum was later appointed head of Citibank’s U.S. Corporate Banking Business and a member of the bank’s Operating Committee and a Customer Group Head with global responsibilities. Ms. Byorum has served as a director of Tecnoglass Inc. since 2011, where she currently serves as chair of the audit committee, and as a director of Northwest Natural Gas Company since 2004, where she currently serves as chair of the finance committee and as a member of the audit and governances committees. She holds a B.B.A. from Southern Methodist University and an M.B.A. from The Wharton School at the University of Pennsylvania. Ms. Byorum brings to the board of directors expertise in finance and extensive management experience in a number of entities.
Greg G. Maxwell, Director. Mr. Maxwell has served on our board of directors since February 1, 2017. Mr. Maxwell previously served as Executive Vice President, Finance, and Chief Financial Officer for Phillips 66, a diversified energy manufacturing and logistics company, from April 2012 until his retirement in December 2015. From 2003 until 2012, Mr. Maxwell served as Senior Vice President, Chief Financial Officer and Controller for Chevron Phillips Chemical Company, a petrochemical company jointly owned by Chevron Corporation and Phillips 66. Mr. Maxwell also served as Vice President, Chief Financial Officer and a member of the board of directors of Phillips 66 Partners LP and on the board of directors of DCP Midstream LLC and Chevron Phillips Chemical Company until his retirement in 2015. He has served as a director and chairman of the audit committee of Range Resources Corporation since September 2015. He has over 37 years of experience in various financial roles within the petrochemical and oil and gas industries and, in addition, is a certified public accountant and a certified internal auditor. Mr. Maxwell earned a Bachelor of Accountancy degree from New Mexico State University in 1978. Mr. Maxwell brings to our board of directors expertise in accounting, finance, internal audit, information technology, and corporate and strategic planning.
Anthony Munk, Director. Mr. Munk is a Senior Managing Director at Onex and has been a member of our board of directors since October 2011. Since joining Onex in 1988, Mr. Munk has worked on numerous private equity transactions. These transactions include the acquisitions and realizations of Husky Injection Molding Systems Ltd., RSI Home Products, Tompkins plc, Vencap Equities Alberta Ltd., Imperial Parking Ltd., ProSource Inc., and Loews Cineplex; and the initial public offering of the Cineplex Galaxy Income Fund, which acquired the Canadian operations of Loews Cineplex, Cineplex Odeon, and the operations of Onex’ subsidiary, Galaxy Entertainment. More recently, Mr. Munk was involved in the acquisitions by Onex of Jack’s Family Restaurants and SAL HoldCo Corp. (“Save-A-Lot”). Mr. Munk also currently serves on the boards of directors of Cineplex Inc., Barrick Gold Corporation, Jack’s Family Restaurants, Save-A-Lot, and Clarivate Analytics. Mr. Munk previously served on the board of directors of RSI Home Products from 2008 to 2013 and the board of directors of Husky Injection Molding Systems Ltd. from 2007 to May 2011. Prior to joining Onex, Mr. Munk was a Vice President with First Boston Corporation in London, England and an Analyst with Guardian Capital in Toronto. Mr. Munk holds a B.A. from Queen’s University. Mr. Munk’s experience in a variety of strategic and financing transactions and investments qualifies him to serve as a member of our board of directors. His high level of financial expertise is a valuable asset to our board of directors. As an executive with Onex, our controlling shareholder, he has extensive knowledge of our business. His service on other boards of directors over the years allows him to provide our board of directors with a valuable perspective on corporate governance issues.
Matthew Ross, Director. Mr. Ross is a Managing Director of Onex and has been a member of our board of directors since October 2011. Mr. Ross joined Onex in 2006 and is responsible for Onex’ efforts in the building products, retail and restaurant industries. Since joining Onex, Mr. Ross has worked on Onex’ investments in RSI Home Products Inc., Tomkins plc, Husky Injection Molding Systems, Jack’s Family Restaurants and Save-A-Lot. Mr. Ross currently serves on the board of directors of Jack’s Family Restaurants and Save-A-Lot and previously served as a director of RSI Home Products Inc. from 2012 to 2013. Prior to joining Onex, Mr. Ross spent five years with the private equity funds of Brown Brothers Harriman & Co. as well as DB Capital Partners, the former private equity division of Deutsche Bank AG. Mr. Ross holds a B.A. from Amherst College and an M.B.A. from The Wharton School at the University of Pennsylvania. Mr. Ross’ experience in a variety of strategic and financing transactions and investments qualifies him to serve as a member of our board of directors. As an executive with Onex, our controlling shareholder, who has a specific focus on investments in the building products industry, Mr. Ross has extensive knowledge of our business as well as the markets in which we operate.
Bruce Taten, Director. Mr. Taten has served on our board of directors since April 2014. He previously served as Senior Vice President, General Counsel and Chief Compliance Officer for Cooper Industries from 2008 until its merger with Eaton Corporation in October 2012. Previously, Mr. Taten was Vice President and General Counsel at Nabors Industries from 2003 until 2008 and earlier practiced law with Simpson Thacher & Bartlett LLP and Sutherland Asbill & Brennan LLP. Before attending law school, he practiced
71
as a C.P.A. with Peat Marwick Mitchell & Co., which is now known as KPMG, in New York. Mr. Taten currently is a practicing attorney, private investor and owner of Battlefield Sports LLC (a specialty retailer of sporting goods and equipment). He currently serves on the board of directors of Save-A-Lot. Mr. Taten holds a B.S. and Master’s degree from Georgetown University and a J.D. from Vanderbilt University. Mr. Taten brings experience in corporate governance, mergers and acquisitions, tax, finance and securities offerings, and compliance to the board of directors.
Patrick Tolbert, Director. Mr. Tolbert has served on our board of directors since November 2011. Mr. Tolbert served as Sitel Worldwide Corporation’s Chief Financial Officer from November 2010 until his retirement in December 2016, as Sitel’s Chief Operating Officer from 2013 to 2015, as a member of Sitel’s board of directors from 2007 until his retirement in December 2016, and as Chairman of Sitel’s audit committee from 2007 through October 2010. Mr. Tolbert was charged with leading Sitel’s financial and operational planning, reporting, tax, real estate, and strategic planning on a global basis. Mr. Tolbert also served on the board of directors and as Chairman of the audit committee of Cano Petroleum, Inc. from 2006 to 2007, TMS International, Inc. from 2007 to 2014, and Husky International Ltd. from 2007 to 2011. From 2001 to 2004, Mr. Tolbert was Executive Vice President and Chief Financial and Administrative Officer for LSG Lufthansa Service Holding, AG. From 1992 to 2001, Mr. Tolbert was the Executive Vice President and Chief Financial and Administrative Officer for Onex Food Services, Inc. He received both a B.A. and a M.B.A. from Auburn University. Mr. Tolbert brings to the board of directors extensive management experience across a number of global businesses and expertise in strategy, mergers and acquisitions, information technology, finance, accounting, and tax.
Roderick Wendt, Vice Chairman and Director. Mr. Wendt has served as Vice Chairman since January 2014 and a director since June 1985. He joined the Company in 1980, working in various legal, marketing, window manufacturing, and sales positions of increasing authority culminating in his service as President and Chief Executive Officer from 1992 to August 2011. Mr. Wendt served as Executive Chairman and Chief Executive Officer from 2011 to March 2013. Mr. Wendt served as a Director of the Portland Branch at the Federal Reserve Bank of San Francisco from 2009 to 2014 and as its Chairman from 2013 to 2014. He has been a Managing Member of Spruce Street Ventures since 2013. He also served as a Member of the Economic Advisory Council at the Federal Reserve Bank of San Francisco from 2006 to 2008. Mr. Wendt serves on the board of directors of Brooks Resources Corporation, Roseburg Forest Products, and Sky Lake Medical Center, on the board of trustees of Willamette University, and is president of the board of the Wendt Family Foundation. He earned a B.A. from Stanford University, and a J.D. from Willamette University College of Law, and is a member of the Oregon State Bar. Mr. Wendt is the son of our late founder, Richard L. Wendt.
Steven Wynne, Director. Mr. Wynne has served on our board of directors since March 2012. Since July 2012, Mr. Wynne has served as an Executive Vice President of Health Services Group, a diversified health insurance company, where he previously served as Senior Vice President, from February 2010 to January 2011. From January 2011 through July 2012, he served as Executive Vice President of JWI. From March 2004 through March 2007, Mr. Wynne was President and Chief Executive Officer of SBI International, Ltd., the parent company of sports apparel and footwear company Fila. From August 2001 through March 2002, and from April 2003 through February 2004, Mr. Wynne was a partner in the Portland, Oregon law firm of Ater Wynne LLP. From April 2002 through March 2003, Mr. Wynne served as acting Senior Vice President and General Counsel of FLIR Systems, Inc., a publicly traded technology company. Mr. Wynne serves on the boards of directors of FLIR Systems, Inc., Pendleton Woolen Mills, and Lone Rock Resources, and he previously served as a director of Planar Systems Inc. from 1996 to 2013. Mr. Wynne received a B.A. and a J.D. from Willamette University. Mr. Wynne has developed a high degree of familiarity with the Company’s operations, risks, and opportunities through his experience as the Executive Vice President of JWI and his extensive management experience in a number of entities.
Board Composition
Our board of directors consists of ten directors divided into three classes with staggered three-year terms. At each annual meeting of shareholders, the successors to directors whose terms then expire will be elected to serve from the time of election and qualification until the third annual meeting following election.
Our directors are divided among the three classes as follows:
• | the Class I directors are Anthony Munk, Kirk Hachigian, Patrick Tolbert, and Steven Wynne, and their terms will expire at the annual meeting of shareholders to be held in 2018; |
• | the Class II directors are Martha (Stormy) Byorum, Greg G. Maxwell, and Matthew Ross, and their terms will expire at the annual meeting of shareholders to be held in 2019; and |
• | the Class III directors are Mark Beck, Bruce Taten, and Roderick Wendt, and their terms will expire at the annual meeting of shareholders to be held in 2020. |
The classification of the board of directors may have the effect of delaying or preventing changes in control of our company. We expect that additional directorships resulting from an increase in the number of directors, if any, will be distributed among the three classes so that, as nearly as possible, each class will consist of one-third of the directors.
72
Leadership Structure of the Board of Directors
Our board of directors currently separates the roles of Chief Executive Officer and Chairman. These positions are currently held by Mark Beck, our President and Chief Executive Officer, and Kirk Hachigian, the Chairman. We believe this leadership structure is appropriate for our company due to the differences between the two roles. The Chief Executive Officer is responsible for setting our strategic direction, providing day-to-day leadership, and managing our business, while the Chairman provides guidance to the Chief Executive Officer, chairs board meetings, and provides information to the members of our board of directors in advance of such meetings. In addition, separating the roles of Chief Executive Officer and Chairman allows the Chairman to provide oversight of our management.
Director Independence and Controlled Company Exception
Our board of directors has affirmatively determined that Bruce Taten, Martha (Stormy) Byorum, Steven Wynne, and Greg G. Maxwell are independent directors under the rules of the NYSE and independent directors as such term is defined in Rule 10A-3(b)(1) under the Exchange Act.
Onex controls the majority of our outstanding common stock. As a result, we are a "controlled company" within the meaning of corporate governance standards of the NYSE. Under the rules of the exchange, a "controlled company" may elect not to comply with certain corporate governance standards, including:
• | the requirement that a majority of our board of directors consist of independent directors; |
• | the requirement that we have a governance and nominating committee that is composed entirely of independent directors with a written charter addressing the committee’s purpose and responsibilities; |
• | the requirement that we have a compensation committee that is composed entirely of independent directors with a written charter addressing the committee’s purpose and responsibilities; and |
• | the requirement for an annual performance evaluation of the governance and nominating committee and compensation committee. |
We utilize certain of these exemptions, including: (a) our board of directors does not consist of a majority of independent directors, and (b) our governance and nominating committee and compensation committee do not consist entirely of independent directors. Accordingly, shareholders will not have the same protections afforded to shareholders of companies that are subject to all of the corporate governance requirements. See Item 1A- Risk Factors - Risks Related to Ownership of Our Common Stock - We are a ‘controlled company’ within the meaning of the rules of the NYSE and, as a result, will qualify for, and may rely on, exemptions from certain corporate governance requirements.
Committees of the Board of Directors
Our board of directors has three committees: the audit committee, the compensation committee, and the governance and nominating committee. Our board of directors may establish other committees to facilitate the management of our business. The composition and functions of the audit committee, compensation committee, and governance and nominating committee are described below. Members will serve on committees until their resignation or until otherwise determined by our board of directors.
Audit Committee
The members of the audit committee are Greg G. Maxwell, as Chairman, Martha (Stormy) Byorum, Patrick Tolbert, and Steven Wynne. Greg G. Maxwell and Patrick Tolbert qualify as “audit committee financial experts” within the meaning of regulations adopted by the SEC. Patrick Tolbert is not independent under Rule 10A-3 or the NYSE listing rules. Accordingly, we are relying on the phase-in provisions of the NYSE listing rules applicable to new public companies, and we plan to have an audit committee comprised solely of directors that are independent for purposes of serving on an audit committee within one year of our listing. The audit committee recommends the annual appointment and reviews independence of auditors and reviews the scope of audit and non-audit assignments and related fees, the results of the annual audit, accounting principles used in financial reporting, internal auditing procedures, the adequacy of our internal control procedures, and investigations into matters related to audit functions. The audit committee is also responsible for risk oversight on behalf of our board of directors. See Item 1A- Risk Factors- Risk Oversight.
Compensation Committee
The members of the compensation committee are Matthew Ross, as Chairman, Anthony Munk, and Bruce Taten. The principal responsibilities of the compensation committee are to review and approve matters involving executive and director compensation, recommend changes in employee benefit programs, authorize equity and other incentive arrangements, and authorize our company to enter into employment and other employee-related agreements.
73
Governance and Nominating Committee
The members of the governance and nominating committee are Kirk Hachigian, as Chairman, Anthony Munk, and Matthew Ross. The governance and nominating committee assists our board of directors in identifying individuals qualified to be board members, makes recommendations for nominees for committees, reviews related-party transactions, and develops, recommends to the board of directors, and reviews our corporate governance principles.
Compensation Committee Interlocks and Insider Participation
None of our executive officers serves, or in the past year has served, as a member of the board of directors or compensation committee (or other committee performing equivalent functions) of any entity that has one or more executive officers serving on our board of directors or compensation committee. No interlocking relationship exists between any member of the compensation committee (or other committee performing equivalent functions) and any executive, member of the board of directors or member of the compensation committee (or other committee performing equivalent functions) of any other company.
Risk Oversight
Our board of directors administers its risk oversight function primarily through the audit committee. To that end, our audit committee meets at least quarterly with our Chief Financial Officer, our head of internal audit, and our independent registered public accounting firm where it receives regular updates regarding our management’s assessment of risk exposures including liquidity, credit, and operational risks and the process in place to monitor such risks and review results of operations, financial reporting, and assessments of internal controls over financial reporting. Our board of directors believes that its oversight of risk management has not affected the board’s leadership structure, as described above.
Code of Ethics
We have adopted a code of ethics applicable to all of our directors, officers (including our principal executive officer, principal financial officer, and principal accounting officer), and employees, known as the Code of Business Conduct and Ethics. The Code of Business Conduct and Ethics is available on our website at investors.jeld-wen.com. In the event that we amend or waive certain provisions of the Code of Business Conduct and Ethics applicable to our principal executive officer, principal financial officer, or principal accounting officer that requires disclosure under applicable SEC rules, we intend to disclose the same on our website. Our website is not part of this Form 10-K.
Item 11 - Executive Compensation.
Compensation Discussion & Analysis
Introduction
This CD&A provides information about the material elements of compensation paid to, awarded, or earned by our NEOs in 2016, who were:
Name | Title | |
Mark Beck | President and Chief Executive Officer | |
Kirk Hachigian | Chairman (formerly Executive Chairman) | |
L. Brooks Mallard | Executive Vice President and Chief Financial Officer | |
John Dinger | Executive Vice President and President, North America | |
Laura Doerre | Executive Vice President, General Counsel and Chief Compliance Officer | |
This CD&A also provides a detailed description of our compensation philosophy and practices in place during 2016.
All share numbers presented in this CD&A and the tabular disclosure that follows are presented after giving effect to the 11-for-1 stock split of our common stock and Class B-1 Common Stock that was effected on January 3, 2017. Although not reflected in the disclosure below, effective upon the closing of our IPO, our Class B-1 Common Stock Options became options to acquire shares of common stock. See "Components of Executive Compensation- Stock Options" for additional information on the conversion.
74
History
Prior to January 27, 2017, we were a privately held company with a relatively small number of shareholders including our principal shareholder, Onex. As a result, we were not previously subject to any stock exchange listing or SEC rules requiring a majority of our Board to be independent or relating to the formation and functioning of Board Committees, including Audit, Compensation, and Governance and Nominating Committees. In 2014, our Board delegated responsibility for establishing compensation policies and making determinations regarding executive compensation to its Compensation Committee, or the “Committee”. Matthew Ross, as Chairman, Anthony Munk, and Bruce Taten currently serve as members of the Committee. Each of these Board members has served continuously on the Committee since his initial appointment in July 2014.
Executive Compensation Objectives and Philosophy
The Committee believes that our executive compensation program should be structured to reward the achievement of specific annual, long-term, and strategic performance goals of our Company. Accordingly, the executive compensation philosophy of the Committee is as follows:
• | to align the interests of our executive officers with those of our shareholders, thereby providing long term economic benefit to our shareholders; |
• | to provide competitive financial incentives in the form of salary, bonus and benefits, and long-term equity awards with the goal of attracting and retaining talented executive officers; |
• | to maintain a compensation program that includes at-risk, performance-based awards whereby executive officers who demonstrate exceptional performance will have the opportunity to realize appropriate economic rewards; and |
• | to develop an overall executive compensation program that strikes an appropriate balance between short-term and long-term performance, while incorporating risk-mitigation design features to discourage excessive risktaking. |
To achieve our objectives, we deliver executive compensation through a combination of the following components:
• | base salary; |
• | annual cash bonuses which are tied to our annual operating plan; |
• | long-term equity-based incentive compensation; |
• | broad-based employee benefits; and |
• | severance benefits. |
Our total executive compensation plan is inclusive of base salaries and other benefits, including severance benefits, that are designed to attract and retain senior management talent. We also use annual cash incentive compensation and long-term equity incentives to ensure a performance-based delivery of pay that aligns, as closely as possible, the rewards of our NEOs with the long-term interests of our shareholders while enhancing executive retention.
Components of Executive Compensation
Base Salary
We believe it is important to pay our senior managers, including our NEOs, a competitive base salary. Each NEO is party to an agreement that provides for an annual base salary, which was individually negotiated when the executive joined the Company and is subject to periodic review by the Committee. For each of Messrs. Beck, and Mallard, the annual base salary is subject only to upward adjustment from the initial base salary. In establishing the initial base salary, we considered a number of factors including market data for similar positions and salaries provided to our current executives by their previous employers, as well as the duties and responsibilities of the position. The base salary of our executive officers is generally reviewed annually by the Committee to determine whether an adjustment is appropriate; however, executive officers do not receive automatic merit increases to their base salaries. In making decisions regarding salary adjustments, the Committee takes into account numerous factors, none of which is dispositive or individually weighted, including the executive officer’s performance, our financial results, the relative significance of the executive officer’s business unit or function, the executive officer’s past performance and potential for advancement, and comparable salaries paid to other executive officers of similar skills and experience in our industry.
75
The following table shows the final 2016 annual base salary amounts for each NEO that continues to serve in such role in 2017. In the case of Messrs. Mallard and Dinger, the amounts below for 2016 reflect base salary changes approved by the Committee effective March 1, 2016. Mr. Hachigian was entitled to an annual base salary of $1,100,000 for the first three months of 2016 and, upon transitioning to Executive Chairman, to a base salary of $500,000 for the remainder of the year. However, effective December 31, 2016, he ceased to be an employee of the Company upon his transition to non-executive Chairman of the Board.
NEO | 2016 Base Salary | |
Mark Beck | $850,000 | |
L. Brooks Mallard | $460,000 | |
John Dinger | $410,000 | |
Laura Doerre | $500,000 | |
For 2017, the Committee approved increases in salary for Mr. Beck (to $875,000, an increase of 3%) and Mr. Mallard (to $505,000, an increase of 10%), effective March 13, 2017. In approving these increases, the Committee took into account these executives’ significant contributions, as well as their salaries relative to similarly situated executives within our peer group.
Annual Cash Incentives
We believe it is important to motivate our senior managers to achieve short-term performance goals by linking a portion of their annual cash compensation to the achievement of our approved operating plan. Toward that end, we provide an annual cash bonus award opportunity to key members of management, including our NEOs, under the terms and conditions of our MIP. The Committee establishes the target bonus opportunity and performance goals for the MIP, which are communicated to MIP participants. At the conclusion of each fiscal year, the Committee reviews our actual financial results relative to the established MIP performance goals and determines the earned bonus opportunity for all MIP participants. Based on this determination, the Committee then approves actual cash bonus awards for our NEOs.
2016 Management Incentive Plan
Under our 2016 MIP, participants were eligible to earn annual bonuses based on corporate and individual performance goals. In February 2016, the Committee established global corporate performance goals based on two financial measures under our 2016 operating plan: (i) Adjusted EBITDA and (ii) Free Cash Flow. For these purposes, we define Free Cash Flow as cash flow from operating activities minus (i) purchases of property and equipment and (ii) purchases of intangible assets, each as shown in our consolidated statements of cash flows, plus or minus other discrete items, to the extent such addition or subtraction is approved by the Compensation Committee of our board of directors. The Committee determined that equal weighting of the two performance goals was appropriate, as both goals are critical to our continued success.
For purposes of the 2016 MIP, achievement of the global corporate performance goals was measured against threshold, target, and maximum performance levels, which levels were set after the completion of our operating budgeting process and an examination of our underlying markets, customers, strategic initiatives, and the general economic outlook for 2016. The 2016 MIP global corporate performance goals established by the Committee, and applicable to Messrs. Beck, Hachigian, and Mallard and Ms. Doerre, are set forth in the table below.
Financial Performance Goal | Weighting | Threshold | Target | Maximum | ||||
(dollars in millions) | ||||||||
Adjusted EBITDA | 50% | $356.0 | $376.0 | $396.0 | ||||
Free Cash Flow | 50% | $109.0 | $121.0 | $133.0 | ||||
In addition, the Committee approved the use of regional corporate performance goals and associated weighting of each for certain eligible employees in our North America, Europe, and Australasia segments, including Mr. Dinger (with respect to the North America segment). Regional corporate performance goals for these employees are weighted in the aggregate at 75% and individually as follows: (i) Adjusted EBITDA (37.5%), (ii) Free Cash Flow (22.5%), and (iii) Revenue (15%). Such employees, including Mr. Dinger, were also subject to the corporate performance goals set forth in the table above, with each measure being weighted at 12.5%. In all instances, actual bonus payments under the 2016 MIP were subject to upward or downward adjustment by the Committee in its discretion based upon individual performance and achievement of individual performance goals. In addition, adjustments are permitted as deemed appropriate by the Committee to account for unanticipated or other significant events that warrant adjustment.
76
For 2016, each of our NEOs was eligible for an annual cash-based performance bonus under the 2016 MIP. Agreements with our NEOs establish minimum target bonus opportunities, and the Committee had discretion to assign target bonus opportunities above those levels. For 2016, the Committee established the target bonus opportunity for each of the NEOs as set forth in the table below, expressed as a percentage of the NEO’s year-end base salary. Each NEO was generally eligible for an annual cash bonus equal to 60% of target for achievement at the threshold performance levels and 200% of target at the maximum performance levels. Under the 2016 MIP, no bonus would be awarded with respect to a particular performance goal if financial results are below the threshold performance level for the applicable performance goal.
The 2016 MIP bonus opportunity for each of our NEOs, as a percentage of base salary, was as follows:
Name | Threshold | Target | Maximum | |||
Mark Beck | 75% | 125% | 250% | |||
Kirk Hachigian (1) | 60% | 100% | 200% | |||
L. Brooks Mallard | 45% | 75% | 150% | |||
John Dinger | 36% | 60% | 120% | |||
Laura Doerre (2) | 45% | 75% | 150% | |||
(1) | Mr. Hachigian’s MIP bonus was to be prorated from January 1, 2016 through March 31, 2016 pursuant to the terms of his employment agreement, as modified in March 2016. |
(2) | Ms. Doerre’s MIP bonus was to be prorated from September 1, 2016 through December 31, 2016 pursuant to the terms of her employment agreement. |
For 2016, global Adjusted EBITDA was $394 million (which yielded a corporate performance level for this metric of 190.5% of Target) and global Free Cash Flow was $122 million (which yielded a corporate performance level for this metric of 109.2% of Target). For purposes of calculating Mr. Dinger's MIP bonus for 2016, adjustments were made in the Free Cash Flow calculation for North America to add back certain accounts receivable for which collection was delayed due to a mid-year contractual amendment and, in the Adjusted EBITDA calculation for North America, to add back certain capital expenditures, both of which were unforeseen at the time initial targets were set. In addition, adjustments were made to net revenue to add back regional intersegment revenue. Following these adjustments, North America Adjusted EBITDA was $256 million (which yielded a corporate performance level for this metric of 62% of Target); North America Free Cash Flow was approximately $221 million (which yielded a corporate performance level for this metric of 74% of Target); and North America net revenues were $2,153 million (which yielded a corporate performance level for this metric of 153% of Target). The applicable formulas established by the Committee for the corporate performance of 2016 MIP payments to our NEOs yielded a performance level for each of Messrs, Beck, Hachigian, Mallard and Ms. Doerre of 149.9% of Target, and a performance level for Mr. Dinger of 101.0% of Target. Based upon each individual’s accomplishments and performance, as well as the Company’s overall financial results, the Committee awarded MIP bonuses to our NEOs as follows:
Name | Amount | % of Target | ||||
Mark Beck | $ | 2,125,000 | 200% | |||
Kirk Hachigian(1) | $ | 550,000 | 200% | |||
L. Brooks Mallard | $ | 690,000 | 200% | |||
John Dinger | $ | 492,000 | 200% | |||
Laura Doerre(2) | $ | 250,000 | 200% | |||
(1) | As noted above, Mr. Hachigian’s MIP bonus was prorated from January 1, 2016 through March 31, 2016. |
(2) | As noted above, Ms. Doerre’s MIP bonus was prorated from September 1, 2016 through December 31, 2016. Pursuant to the terms of her employment agreement, the Committee also awarded Ms. Doerre a cash bonus of $200,000 to replace incentive compensation forfeited upon resignation from her prior employer. |
The Committee based its determination on individual performance and achievement of individual performance goals, including overall financial performance, operational improvements in safety, quality, on-time delivery, and productivity, execution on acquisitions, and facilitating the successful launch of our IPO.
77
2017 Management Incentive Plan
In connection with our IPO, the Board adopted and our shareholders approved the JELD-WEN Holding, Inc. 2017 Management Incentive Plan, or the “Bonus Plan”.
Similar to the 2016 MIP, participants will be eligible to earn annual bonuses for 2017 pursuant to the terms of the Bonus Plan based on our actual financial results for each year measured against our annual operating plan and the achievement of individual performance goals. The Committee retained Adjusted EBITDA and Free Cash Flow as the global corporate performance goals for 2017, with each goal equally weighted in determining payouts to our NEOs under the Bonus Plan for 2017. Mr. Hachigian is no longer an employee of the company and is therefore not eligible for an annual bonus for 2017.
Long-Term Equity Incentives
We believe that long-term equity incentives are important to ensure that the interests of management remain aligned with those of our shareholders. Accordingly, all key management employees, including all of our NEOs, have been granted equity awards under our Stock Incentive Plan which was approved by our Board and our shareholders in 2011.
Equity awards granted under the Stock Incentive Plan have generally been granted only in connection with commencement of employment or significant changes in management responsibilities. From time to time, at the discretion of the Committee, equity awards have also been made to recognize performance and to assist with the retention of key members of our management team, including certain of our NEOs.
In connection with our IPO, the Board has adopted and our shareholders have approved the Omnibus Equity Plan. Future equity awards, including those granted in connection with our IPO, will be made under the Omnibus Equity Plan.
Stock Options
Since 2011, our principal form of long-term equity incentive has been in the form of stock options, which allow recipients the opportunity to participate in the long-term equity value creation of the Company. Prior to our IPO, we had two classes of stock options: (i) options to acquire common stock (“Common Stock Options”) and (ii) options to acquire Class B-1 Common Stock (“Class B-1 Common Stock Options”), which, together with the Common Stock Options, are referred to as the “Stock Options”. We have historically granted options in two classes of stock to align the interests of option holders with both holders of common stock and holders of Series A-1 Preferred Stock, which was the initial tranche of Series A Convertible Preferred Stock issued by the Company to Onex that earned an annual dividend that accrued over time until the conversion of those securities into common stock upon the closing of our initial public offering. Immediately prior to the closing of our IPO, all shares of Class B-1 Common Stock and all shares of Series A Convertible Preferred Stock converted into common stock. The Committee effectively approved the conversion of all Class B-1 Common Stock Options into Common Stock Options upon the conversion of the Series B-1 Common Stock. Therefore, on February 1, 2017, each Class B-1 Common Stock Options was effectively converted into 1.746 Common Stock Options and the exercise price of each option was reduced by the same ratio. The numbers presented in this CD&A and the tabular disclosure that follows reflect pre-conversion securities held by our NEOs at year end.
Pursuant to the terms of the Stock Incentive Plan and the historical form of award agreement, unvested stock options are forfeited immediately upon termination of employment or status as a “Key Non-Employee” (which includes a non-employee director, consultant, or independent contractor so designated by the Committee) subject to certain exceptions that may be granted at the discretion of the Committee. Except in the event of termination of employment for cause (determined in accordance with the Stock Incentive Plan), or by reason of death, disability, or retirement after 65, vested stock options remain exercisable for 90 days following termination of employment. Upon a termination of employment due to death, disability, or retirement after age 65, vested stock options remain exercisable for twelve months following termination of employment. Upon a termination for cause, all options, vested or unvested, are immediately forfeited.
The Board has adopted a form of option award agreement under the Omnibus Equity Plan which generally provides that awards will vest ratably on each anniversary of the date of grant over the specified multi-year period (typically three years) following the date of grant. It also provides for post-termination exercise periods generally consistent with those that were applicable to stock options granted under the Stock Incentive Plan, and that upon a termination for cause, all options, vested or unvested, are immediately forfeited.
78
Restricted Stock Units
In 2014, the Committee amended the Stock Incentive Plan to authorize the issuance of restricted stock units, or “RSUs”, for the purpose of providing additional flexibility in using long-term equity compensation awards to assist in attracting and retaining key leaders. Pursuant to the terms of the Stock Incentive Plan and the applicable form of award agreement, RSU grants vest ratably over a specified period (typically three to four years) or cliff vest on a specified anniversary (typically the second or third anniversary) of the date of grant. RSUs that are not vested at the time of termination of employment are forfeited.
The Board has adopted a form of RSU award agreement under the Omnibus Equity Plan which generally provides that awards will vest ratably on each anniversary of the date of grant over a specified period (typically three years) following the date of grant, and that RSUs which are not vested at the time of termination of employment are forfeited.
Cash Award & Option Repricing
On October 31, 2016, our Board approved a special distribution to holders of our common stock (including our then-outstanding Class B-1 Common Stock and Series A Convertible Preferred Stock) of record on November 1, 2016. The special distribution entitled each common stock, Class B-1 Common Stock, and Series A Convertible Preferred Stock holder of record to receive $4.09 per share of common stock on an as-converted basis. As a result, holders of Class B-1 Common Stock and holders of Series A Convertible Preferred Stock were entitled to receive $6.96 per share. In addition, pursuant to the terms of the Series A Convertible Preferred Stock, holders of that stock received amounts representing the accrual of dividends on the Series A Convertible Preferred Stock from May 31, 2016 (the date the Company converted to a Delaware corporation) to November 3, 2016 (the distribution date).
At the time of the special distribution to shareholders, and in recognition of the efforts of our management team in securing significant improvements in our operating and financial results, the Board and the Committee determined that, pursuant to the Stock Incentive Plan, it was appropriate to adjust the outstanding Stock Options and to compensate RSU holders to equitably reflect the economic terms of the special distribution. Accordingly, the Board and the Committee approved a cash award of $4.09 per vested Common Stock Option and $6.96 per vested Class B-1 Common Stock Option outstanding as of November 1, 2016. The Board and the Committee also approved a reduction in the exercise price of all outstanding but unvested Common Stock Options of $4.09 per share and approved either a reduction in the exercise price or deferred cash, depending on the pre-distribution exercise price, for all outstanding but unvested Class B-1 Common Stock Options of $6.96 per share. In addition, the Board and the Committee approved a cash award of $4.09 per unvested RSU. Each of our NEOs other than Ms. Doerre received cash Stock Option adjustments and/or deferred cash in accordance with the treatment described above, except that Mr. Hachigian received a cash payment equal to $4.09 per Common Stock Option and $6.96 per Class B-1 Common Stock Option for his Stock Options scheduled to vest in April 2017, in lieu of repricing or deferred cash.
Equity Awards to NEOs
The only equity award to a NEO in 2016 was a new hire grant to Ms. Doerre, as described more fully under “Employment Agreements” below. The Committee elected not to award any new equity grants to our other NEOs as a component of their 2016 compensation. In connection with the IPO, the Board adopted the Omnibus Equity Plan to be incorporated into our compensation program to further align the interests of NEOs and our shareholders and to drive the Company’s commitment to a strong pay-for-performance compensation program. Equity grants under this plan are expected to be made annually beginning in February 2018.
In recognition of the efforts of our senior management, including our NEOs, in guiding the Company through the processes necessary to become a public company, the Committee approved grants (IPO Grants) pursuant to the Omnibus Equity Plan to certain individuals, including our NEOs except for Mr. Hachigian, with a grant date of February 2, 2017. For Mr. Beck and Ms. Doerre, these grants were contractually required, in whole or in part, pursuant to the terms of their employment arrangements. Messrs. Beck, Mallard, and Dinger and Ms. Doerre were awarded 195,885, 53,358, 25,662, and 41,060 Common Stock Options, respectively, with an exercise price of $27.59 (the closing price on the date of grant), and 57,005, 15,528, 7,468, and 11,949 RSUs, respectively. The option component of the IPO Grants will vest ratably on each anniversary of the date of grant (February 2, 2017) over a three-year period and will expire ten years from the date of grant. The RSU component of the IPO Grants will vest in full three years from the date of grant.
Employee Benefits
Our NEOs generally participate in the same retirement program as other management employees assigned at their primary work location. NEOs participate in the Company’s 401(k) Plan, under which the Company will match contributions up to 4% of the lesser of base salary or the annual statutory maximum dollar amount.
79
Each of our NEOs is also eligible to participate in our medical, dental, and other insurance programs, and is entitled to vacation and holiday pay, all in accordance with the terms and provisions in effect from time to time, and on substantially the same terms, as those generally offered to other employees.
Perquisites
Prior to his relocation to Charlotte, North Carolina, Mr. Beck was entitled to relocation benefits, including Company-paid temporary housing in Charlotte, and a payment of $500,000 as reimbursement for any loss on the sale of his primary residence in Bethesda, Maryland. In addition, Mr. Beck and his immediate family members are entitled to personal use of the Company aircraft, with the value of such usage limited to $150,000 annually.
Pursuant to the terms of the employment agreements relating to his service in the role of Chief Executive Officer and his transition to the role of Executive Chairman, Mr. Hachigian was entitled to use of a Company-leased apartment in Charlotte through April 2016.
Pursuant to the terms of his employment agreement, Mr. Mallard was entitled to relocation benefits through February 2016, including Company-paid temporary housing in Charlotte. Pursuant to the terms of their respective agreements with the Company and the Company’s relocation policy, Mr. Dinger was entitled to relocation benefits (and associated tax gross-up) and a monthly temporary housing stipend, and Ms. Doerre is entitled to relocation benefits (and associated tax gross-up) and a monthly temporary housing and commuting stipend, for up to 12 months.
80
COMPENSATION COMMITTEE REPORT
This report of the Compensation Committee is required by the SEC and, in accordance with the SEC's rules, will not be deemed to be part of or incorporated by reference by any general statement incorporating by reference this Form 10-K into any filing under the Securities Act or under the Exchange Act, except to the extent that we specifically incorporate this information by reference, and will not otherwise be deemed “soliciting material” or “filed” under either the Securities Act or the Exchange Act.
Our Compensation Committee has reviewed and discussed the Compensation Discussion and Analysis required by Item 402(b) of Regulation S-K with management and based on such review and discussions, the Compensation Committee recommended to our board of directors that the Compensation Discussion and Analysis be included in this Form 10-K.
Submitted by the Compensation Committee
Matthew Ross, Chair
Anthony Munk
Bruce Taten
Summary Compensation Table
The following table sets forth the portion of compensation paid to our NEOs that is attributable to services performed during the years ended December 31, 2015 and 2016.
Name and Principal Position(1) | Year | Salary(2) | Bonus(3) | Stock Awards(4) | Option Awards(5) | Non-Equity Incentive Plan Compensation(6) | All Other Compensation(7) | Total | ||||||||||||||||||||||
Mark Beck | 2016 | $ | 850,000 | — | — | $ | 962,476 | $ | 2,125,000 | $ | 1,640,492 | $ | 5,577,968 | |||||||||||||||||
President & Chief Executive Officer | 2015 | $ | 81,731 | $ | 1,300,000 | $ | 3,906,150 | $ | 8,440,053 | — | $ | — | $ | 13,727,934 | ||||||||||||||||
Kirk Hachigian | 2016 | $ | 638,462 | — | — | — | $ | 550,000 | $ | 5,385,114 | $ | 6,573,576 | ||||||||||||||||||
Executive Chairman | 2015 | $ | 1,142,308 | — | — | $ | 1,778,379 | $ | 2,200,000 | $ | 2,180,382 | $ | 7,301,069 | |||||||||||||||||
L. Brooks Mallard | 2016 | $ | 450,769 | — | — | $ | 59,248 | $ | 690,000 | $ | 284,365 | $ | 1,484,382 | |||||||||||||||||
EVP & Chief Financial Officer | 2015 | $ | 415,385 | — | — | $ | 351,214 | $ | 600,000 | $ | 56,265 | $ | 1,422,864 | |||||||||||||||||
John Dinger | 2016 | $ | 405,769 | — | — | $ | 213,435 | $ | 492,000 | $ | 261,614 | $ | 1,372,818 | |||||||||||||||||
EVP & President, North America | 2015 | $ | 65,769 | $ | 225,000 | $ | 260,410 | $ | 1,883,479 | — | $ | 14,977 | $ | 2,449,635 | ||||||||||||||||
Laura Doerre | 2016 | $ | 161,538 | $ | 200,000 | $ | 1,427,108 | — | $ | 250,000 | $ | 63,387 | $ | 2,102,033 | ||||||||||||||||
EVP, General Counsel & Chief Compliance Officer | ||||||||||||||||||||||||||||||
____________________
(1) | This column includes the name and principal position of each NEO during the fiscal year ended December 31, 2016. Ms. Doerre commenced employment on September 6, 2016. |
(2) | The amounts in the salary column represent the dollar value paid to each NEO with respect to 2015 and 2016, as applicable. The salary reported for Ms. Doerre for 2016 and for Messrs. Beck and Dinger for 2015 reflect salary from the date of their employment through year-end. |
(3) | The bonus reflected for Ms. Doerre represents the guaranteed portion of her bonus that replaces incentive compensation and other payments forfeited upon resignation from her prior employer. |
(4) | Reflects the grant date fair value of RSUs granted to Messrs. Beck and Dinger in 2015 and to Ms. Doerre in 2016 provided upon each individual joining the Company to replace equity and other incentive compensation forfeited upon resignation from their prior employers. The grant date fair value is calculated in accordance with FASB ASC Topic 718 as described in Note 24 to the Company’s audited financial statements for the year ended December 31, 2015. |
(5) | For 2016, the amounts listed in this column reflect the incremental fair value attributable to the modification of stock options that were unvested as of November 1, 2016, which options were adjusted by a reduction in exercise price by (i) $4.09 for unvested Common Stock Options, and (ii) $6.96 for unvested Class B-1 Stock Options. The number of unvested Common Stock Options and Class B-1 Stock Options for which the exercise price was reduced for the applicable NEOs is as follows: Mr. Beck-95,700 Common Stock Options and 234,300 Class B-1 Stock Options; Mr. Mallard-21,120 Common Stock Options; and Mr. Dinger-20,416 Common Stock Options and 49,984 Class B-1 Stock Options. In addition, in respect of each of Mr. Mallard’s unvested Class B-1 Stock Options, he will receive deferred cash payment of $6.96, which amount will be paid on the date on which such Class B-1 Stock Options vest. Mr. Hachigian held an additional 92,664 Common Stock Options and 193,336 Class B-1 Stock Options scheduled to vest in April 2017. The Committee determined not to reprice these Stock Options. Instead, Mr. Hachigian received a cash payment equal to $4.09 per unvested Common Stock Option and $6.96 per unvested Class B-1 Common Stock Option, which cash payment is reported in the “All Other Compensation” column of this Summary Compensation Table. For 2015, amounts reflect the grant date fair value of Stock Options and RSUs granted to Messrs. Beck and Dinger and the increase in the grant date fair value attributable to a similar repricing of certain Stock Options held by Messrs. Hachigian and Mallard in connection with the special distribution to shareholders in July 2015. |
(6) | The amounts listed represent awards paid under our 2015 and 2016 MIP. Messrs. Beck, Dinger and Ms. Doerre did not participate in the 2015 MIP. |
81
(7) | The amounts in this column represent all other compensation for the covered fiscal year that were not reported in any other column of the Summary Compensation Table, as reported in detail in the table below. |
Name | 401(k) Match/ Pension(a) | Cash Awards(b) | Housing/ Relocation(c) | Airplane Usage(d) | Tax Gross-up | Total | |||||||||||||||||
Mark Beck | $ | 10,600 | $ | 675,000 | $ | 907,372 | $ | 47,520 | — | $ | 1,640,492 | ||||||||||||
Kirk Hachigian | $ | 10,600 | $ | 5,365,918 | $ | 8,596 | — | — | $ | 5,385,114 | |||||||||||||
L. Brooks Mallard | $ | 10,600 | $ | 265,870 | $ | 7,895 | — | — | $ | 284,365 | |||||||||||||
John Dinger | $ | 10,600 | $ | 152,864 | $ | 68,209 | — | $ | 29,941 | $ | 261,614 | ||||||||||||
Laura Doerre | $ | 4,615 | — | $ | 58,772 | — | — | $ | 63,387 | ||||||||||||||
____________________
(a) | Amounts listed are employer matching contributions for 2016 to the 401(k) Plan. |
(b) | On October 30, 2016, the Committee approved a special cash award to holders of record as of November 1, 2016 of vested Stock Options and RSUs equal to (x) $4.09 per vested Common Stock Option and RSU and (y) $6.96 per vested Class B-1 Common Stock Option. The number of vested Stock Options held by each of the NEOs eligible to receive such special cash awards were as follows: Mr. Beck-165,000 RSUs; Mr. Mallard-14,080 Common Stock Options and 29,920 Class B-1 Stock Options; and Mr. Dinger-5,104 Common Stock Options, 12,496 Class B-1 Stock Options, and 11,000 RSUs. As determined by the Committee, the cash award to Mr. Hachigian also included a cash payment equal to $1,724,874 in respect of 92,664 unvested Common Stock Options and 193,336 unvested Class B-1 Common Stock Options. In recognition of this payment, the original per share exercise prices applicable to these unvested Stock Options were not repriced. Mr. Hachigian’s cash award also included $191,295 in respect of 46,761 RSUs which were unvested as of November 1, 2016. |
(c) | The amount reported for Mr. Beck includes relocation expenses ($874,767, which includes payments to compensate Mr. Beck for amounts associated with the commission paid ($304,000) and the loss ($500,000) on the sale of his primary residence in Maryland and moving expenses ($47,060)), and temporary living expenses in North Carolina ($32,605). The amount reported for Mr. Dinger includes a stipend of $2,880 per pay period to defray relocation expenses ($30,545), including temporary living expenses in North Carolina, and reimbursement for the commission paid on the sale of his home in New York ($22,042). The amount reported for Ms. Doerre includes a stipend of $6,486 per pay period to defray temporary living expenses in North Carolina and commuting expenses ($58,377). |
(d) | Reflects the incremental variable operating cost to the Company associated with Mr. Beck’s personal use of the company aircraft. |
Grants of Plan-Based Awards
The following table summarizes the awards granted to each of our NEOs during the year ended December 31, 2016.
Name | Grant Date(1) | Estimated Possible Payouts Under Non-Equity Incentive Plan Awards(2) | Number of Securities Underlying Common Stock Options | Number of Securities Underlying B-1 Common Stock Options | Exercise or Base Price of Option Awards (per share)(3) | All Other Stock Awards(5) | Grant Date Fair Value of Stock Awards | |||||||||||||||||||||||||
Threshold | Target | Maximum | ||||||||||||||||||||||||||||||
Mark Beck | $ | 637,500 | $ | 1,062,500 | $ | 2,125,000 | — | — | — | — | — | |||||||||||||||||||||
11/1/2016 | — | — | — | 95,700 | — | $ | 19.58 | — | $ | 166,062 | (4) | |||||||||||||||||||||
11/1/2016 | — | — | — | — | 234,300 | $ | 27.77 | — | $ | 796,414 | (4) | |||||||||||||||||||||
Kirk Hachigian | $ | 165,000 | $ | 275,000 | $ | 550,000 | — | — | — | — | — | |||||||||||||||||||||
L. Brooks Mallard | $ | 207,000 | $ | 345,000 | $ | 690,000 | — | — | — | — | — | |||||||||||||||||||||
11/1/2016 | — | — | — | 21,200 | — | $ | 9.97 | — | $ | 59,248 | (4) | |||||||||||||||||||||
John Dinger | $ | 147,600 | $ | 246,000 | $ | 492,000 | — | — | — | — | — | |||||||||||||||||||||
11/1/2016 | — | — | — | 20,416 | — | $ | 19.58 | — | $ | 45,058 | (4) | |||||||||||||||||||||
11/1/2016 | — | — | — | — | 49,984 | $ | 27.77 | — | $ | 168,376 | (4) | |||||||||||||||||||||
Laura Doerre | $ | 75,000 | $ | 125,000 | $ | 250,000 | — | — | — | — | — | |||||||||||||||||||||
11/2/2016 | — | — | — | — | — | — | 49,412 | $ | 1,427,108 | (5) | ||||||||||||||||||||||
____________________
(1) | Equity awards with a grant date of November 1, 2016 report unvested Stock Options that were outstanding as of that date for which the Committee approved a reduction in the exercise price of $4.09 per Common Stock Option and $6.96 per Class B-1 Common Stock Option. For Ms. Doerre’s RSU award, the grant date is the effective date of the grant. |
(2) | Reflects potential payouts under the 2016 MIP. Amounts to be paid under our 2016 MIP to all NEOs are disclosed above in the Summary Compensation Table. Amounts for Mr. Hachigian are based on his prorated salary then in effect from January 1, 2016 through March 31, 2016. Amounts for Ms. Doerre are based on the prorated salary paid from the date of her employment through year-end. |
(3) | The amounts in this column reflect the per share exercise price of the Stock Options granted or repriced in 2016. |
(4) | The amounts in this column reflect only the incremental fair value attributable to the modification of the exercise price of unvested Stock Options approved by the Board on October 31, 2016, which amounts were computed in accordance with FASB ASC Topic 718. |
(5) | Represents RSUs granted to Ms. Doerre, which will vest in full on the third anniversary of the date of grant. |
82
Employment Agreements
The Company has entered into agreements with each of our NEOs, which agreements generally provide for indefinite employment terms that are terminable by either party on written notice, in most cases subject to post-employment severance obligations and restrictive covenants. For more information regarding the terms of these agreements and potential post-employment benefits for our NEOs, see the disclosure under the heading “Potential Payments upon Termination or Change In Control."
Mark Beck
In connection with his commencement of employment with the Company, Mr. Beck entered into an employment agreement effective November 30, 2015, which provides that he will serve in the role of President and Chief Executive Officer. Effective as of May 31, 2016, Mr. Beck also serves on our Board. Mr. Beck’s employment may be terminated at any time by either party upon not less than 30 days’ notice to the other party (except in the case of a termination by the Company for Cause or by the executive for Good Reason, as those terms are defined in his employment agreement). The employment agreement provides he is entitled to an initial annual base salary of $850,000 which may be increased at the discretion of the Committee, and that his target bonus opportunity under the MIP for 2016 is equal to 125% of his base salary. Pursuant to his employment agreement, Mr. Beck received a guaranteed payment of $1,300,000 to compensate him for bonus opportunity and other compensation forfeited upon his resignation from his prior employer. Mr. Beck, who has relocated to Charlotte, North Carolina, also received benefits under our relocation policy, including temporary housing in Charlotte at Company expense, and the payment of $500,000 as reimbursement for loss on the sale of his primary residence in Bethesda, Maryland. Mr. Beck and his family are permitted to use the Company aircraft for personal travel with a value limited to $150,000 annually.
On November 30, 2015, Mr. Beck was awarded 330,000 Stock Options (95,700 Common Stock Options, each with an exercise price of $23.67 and 234,300 Class B-1 Common Stock Options, each with an exercise price of $34.73 per share) which vest in equal annual installments on each of the first five anniversaries of the date of grant, subject to his continued employment. On February 1, 2017, the Class B-1 Common Stock Options converted to 409,085 common stock options with an exercise price of $15.90 per share. Concurrent with the grant of his Stock Options, Mr. Beck was granted 165,000 RSUs which vest in equal annual installments on each of the first four anniversaries of the date of grant, subject to his continued employment. In the event Mr. Beck is terminated by us without Cause or he resigns with Good Reason (as those terms are defined in his employment agreement), the Stock Options and RSUs scheduled to vest on the annual vesting date next following his date of termination will be deemed vested, and such vested Stock Options will remain exercisable for 90 days following the date of termination. Further, pursuant to the terms of his employment agreement, Mr. Beck elected to purchase 22,000 shares of common stock at a purchase price of $23.67 per share.
In the event Mr. Beck receives any payments or benefits under any agreement or arrangement with the Company that are paid in connection with a change in control of the Company such that he would be subject to an excise tax under the Code (a “Parachute Payment”), the Company shall pay to Mr. Beck whichever of the following would result in Mr. Beck’s receipt, on an after-tax basis, of the greater amount of Parachute Payment notwithstanding that an excise tax may be applied to all or some portion of such payment: (x) the payment in full of the entire amount of the Parachute Payment or (y) payment of only part of the Parachute Payment so that Mr. Beck receives the largest payment possible without the imposition of the excise tax.
Kirk Hachigian
In connection with his commencement of employment as Chief Executive Officer, Mr. Hachigian entered into an employment agreement effective March 31, 2014, which provided for an annual base salary of $750,000 and a target bonus opportunity equal to 100% of his base salary. Under the employment agreement, Mr. Hachigian was entitled to expense reimbursement for the costs associated with maintaining an office space in Houston, Texas and any costs associated with working remotely in Maine, and to use of a Company-leased apartment in Charlotte, North Carolina. In addition, Mr. Hachigian was entitled to use of the Company aircraft for business travel (including travel from his home in Houston, Texas to Charlotte, North Carolina) as well as for personal use at Mr. Hachigian’s own expense. Mr. Hachigian also was entitled to a tax gross-up payment to the extent the use of the apartment in Charlotte, North Carolina or the use of the Company aircraft results in taxable income to him.
Following a review of Mr. Hachigian’s overall compensation package in November 2014, the Committee increased Mr. Hachigian’s base annual salary to $1,100,000 and awarded him 70,136 RSUs which are scheduled to vest in equal annual installments on the first three anniversaries of the grant date. In November 2015, the Committee approved modifications to our employment agreement with Mr. Hachigian as part of the transition of his responsibilities as Chief Executive Officer to Mr. Beck. Pursuant to such modifications, Mr. Hachigian was named Executive Chairman effective December 1, 2015. These modifications provided that Mr. Hachigian would remain employed full-time through at least March 31, 2016 to assure an orderly transition and would be entitled to the same salary and benefits as previously in place. Mr. Hachigian continued to be eligible for medical and dental benefits whether or not he continued to provide services to the Company on a full-time basis.
83
Effective March 28, 2016, the Committee approved further modifications to Mr. Hachigian’s compensation recognizing that his role as Executive Chairman would result in a reduced commitment of Mr. Hachigian’s service and time. Accordingly, Mr. Hachigian’s annual base salary was reduced to $500,000 effective March 28, 2016 and his participation in the 2016 MIP terminated on March 31, 2016, provided that he will remain eligible for a pro rata award based on his three months of full-time service in 2016 pursuant to his termination agreement described below. He also continued to be eligible for standard employee benefits while an employee.
In a termination agreement dated December 30, 2016, the Company and Mr. Hachigian mutually agreed that his employment with the Company and any agreements relating thereto with the Company would terminate effective December 31, 2016 and that Mr. Hachigian will continue to serve as non-Executive Chairman. Pursuant to the termination agreement, Mr. Hachigian is entitled to (i) a pro rata annual bonus under the 2016 MIP (for January 1, 2016 through March 31, 2016), (ii) continued eligibility for himself and his dependents in the Company’s medical and dental plans until December 31, 2020, and (iii) continued rights to indemnification as an officer of the Company and any indemnification agreements in his favor. Pursuant to the termination agreement, Mr. Hachigian was also designated a Key Non-Employee under our Stock Incentive Plan such that all stock options and RSUs granted to him will remain outstanding in accordance with the terms and conditions of the original award agreement, including continued vesting.
L. Brooks Mallard
In connection with his commencement of employment with the Company, Mr. Mallard entered into a letter agreement effective October 30, 2014, which provides that he will serve in the role of Executive Vice President and Chief Financial Officer. Mr. Mallard’s employment may be terminated at any time by either party. The employment agreement provides he is entitled to an initial annual base salary of $400,000, which may be increased in the discretion of the Committee, and that his target bonus opportunity is equal to 75% of his base salary. Following a review of Mr. Mallard’s overall compensation package in February 2016, the Committee increased his base annual salary to $460,000 effective March 1, 2016.
On November 30, 2015, Mr. Mallard also entered into a Management Transition Agreement which provides that in the event he is terminated without Cause (as defined in the Management Transition Agreement) during the 24-month period between December 1, 2015 and November 30, 2017, he will be provided at least two weeks’ written notice before the effective date of termination. During the notice period, the Company and Mr. Mallard will discuss and agree on a transition plan to ensure a smooth transition of his duties and responsibilities. The Management Transition Agreement provides that the during the 12-month period following the end of the notice period Mr. Mallard shall (i) continue to assist in the orderly transition of his responsibilities on an “as requested basis”, (ii) continue to vest in his equity awards under the Stock Incentive Plan and (iii) receive separation benefits as described in greater detail below under the heading “Potential Payments upon Termination or Change In Control”.
John Dinger
In connection with his commencement of employment with the Company, Mr. Dinger entered into a letter agreement dated November 30, 2015, which provides that he will serve in the role of Executive Vice President and President, North America. Mr. Dinger’s employment may be terminated at any time by either party. The agreement provides he is entitled to an initial annual base salary of $380,000, which may be adjusted in the discretion of the Committee, and that his target bonus opportunity is equal to 60% of his base salary. Following a review of Mr. Dinger’s overall compensation package in February 2016, the Committee increased his base annual salary to $410,000 effective March 1, 2016.
On November 30, 2015, Mr. Dinger also entered into a Management Transition Agreement which provides that in the event he is terminated without Cause (as defined in the Management Transition Agreement) during the 24-month period between December 1, 2015 and November 30, 2017, he will be provided at least two weeks’ written notice before the effective date of termination. During the notice period, the Company and Mr. Dinger will discuss and agree on a transition plan to ensure a smooth transition of his duties and responsibilities. The Management Transition Agreement provides that the during the twelve-month period following the end of the notice period Mr. Dinger shall (i) continue to assist in the orderly transition of his responsibilities on an “as requested basis”, (ii) continue to vest in his equity awards under the Stock Incentive Plan and (iii) receive separation benefits as described in greater detail below under the heading “Potential Payments upon Termination or Change In Control”.
On November 11, 2015, pursuant to the terms of his agreement, Mr. Dinger was granted 11,000 RSUs, 25,520 Common Stock Options with an exercise price of $23.67 per share, and 62,480 Class B-1 Common Stock Options with an exercise price of $34.73 per share. On February 1, 2017, the Class B-1 Common Stock Options converted to 109,090 common stock options (21,818 with an exercise price of $19.89 per share and 87,272 with an exercise price of $15.90 per share).
84
Laura Doerre
In connection with her commencement of employment with the Company, Ms. Doerre entered into a letter agreement dated July 25, 2016, as supplemented by the management employment agreement dated September 6, 2016 (referred to herein as a single agreement), which provides that she will serve in the role of Executive Vice President, General Counsel and Chief Compliance Officer. Ms. Doerre’s employment may be terminated at any time by either party, provided that upon a termination without cause, she will be entitled to severance under the Company’s severance benefits policy as described in greater detail below under the heading “Potential Payments Upon Termination or Change in Control”. The agreement provides she is entitled to an initial annual base salary of $500,000, which may be adjusted in the discretion of the Committee, and that her target bonus opportunity is equal to 75% of her base salary. To replace incentive compensation forfeited upon resignation from her previous employer, Ms. Doerre also is entitled to deferred cash in the amount of $300,000 payable ratably in December 2017 and December 2018, equity valued at approximately $1.4 million upon her employment (which was satisfied by the Company’s grant to Ms. Doerre of 49,412 RSUs on November 2, 2016), and a guaranteed cash bonus for 2016 of $200,000. Ms. Doerre is also eligible for an additional prorated bonus under the 2016 MIP.
Outstanding Equity Awards at Fiscal Year-End
The following table summarizes the number of securities underlying the equity awards held by each of our NEOs as of December 31, 2016.
Option Awards | Stock Awards | ||||||||||||||||||||||||||||
Name | Initial Grant Date(1) | Modification Date(1) | Number of Common Stock Options underlying unexercised options exercisable | Number of Common Stock Options underlying unexercised options unexercisable(2) | Number of Class B-1 Common Stock Options underlying unexercised options exercisable | Number of Class B-1 Common Stock Options underlying unexercised options unexercisable(2) | Option exercise price | Option expiration date | Number of shares or units of restricted stock that have not vested(3) | Market value of shares or units of stock that have not vested(4) | |||||||||||||||||||
Mark Beck | 11/30/15 | — | — | — | — | — | — | — | 123,752 | $ | 3,574,125 | ||||||||||||||||||
11/30/15 | 11/1/16 | 19,140 | 76,560 | — | — | $ | 19.58 | 11/30/25 | — | — | |||||||||||||||||||
11/30/15 | 11/1/16 | — | — | 46,860 | 187,440 | $ | 27.77 | 11/30/25 | — | — | |||||||||||||||||||
Kirk Hachigian | 04/01/14 | — | 92,664 | — | 193,336 | — | $ | 18.79 | 04/01/24 | — | — | ||||||||||||||||||
11/10/14 | — | — | — | — | — | — | — | 23,386 | $ | 675,430 | |||||||||||||||||||
04/01/14 | 7/28/15 | 92,664 | 92,664 | — | — | $ | 14.07 | 04/01/24 | — | — | |||||||||||||||||||
04/01/14 | 7/28/15 | — | — | 193,336 | 193,336 | $ | 11.77 | 04/01/24 | — | — | |||||||||||||||||||
L. Brooks Mallard | 10/30/14 | 7/28/15 | 14,080 | — | — | — | $ | 14.07 | 10/30/24 | — | — | ||||||||||||||||||
10/30/14 | 7/28/15 | — | — | 29,920 | 44,880 | $ | 11.77 | 10/30/24 | — | — | |||||||||||||||||||
10/30/15 | 11/1/16 | — | 21,120 | — | — | $ | 9.97 | 10/30/24 | — | — | |||||||||||||||||||
John Dinger | 11/01/15 | — | 5,104 | — | — | — | $ | 23.67 | 11/01/25 | 11,000 | $ | 317,700 | |||||||||||||||||
11/01/15 | — | — | — | 12,496 | — | $ | 34.73 | 11/01/25 | — | — | |||||||||||||||||||
11/01/15 | 11/1/16 | — | 20,416 | — | — | $ | 19.58 | 11/01/25 | — | — | |||||||||||||||||||
11/01/15 | 11/1/16 | — | — | — | 49,984 | $ | 27.77 | 11/01/25 | — | — | |||||||||||||||||||
Laura Doerre | 11/02/16 | — | — | — | — | — | — | — | 49,412 | $ | 1,427,108 | ||||||||||||||||||
____________________
(1) | Equity awards with a modification date of July 28, 2015 represent unvested Stock Options that were outstanding as of June 30, 2015 for which the Committee approved a reduction in the exercise price of $4.73 per share of common stock and $7.02 per share of Class B-1 Common Stock. Equity awards with a modification date of November 1, 2016 represent unvested Stock Options that were outstanding as of November 1, 2016 for which the Committee approved a reduction in the exercise price of $4.09 per share of common stock and $6.96 per share of Class B-1 Common Stock. |
(2) | Mr. Beck’s Stock Options shown in these columns will vest in equal installments on each of November 30, 2017, November 30, 2018, November 30, 2019 and November 30, 2020. Mr. Hachigian’s Stock Options shown in these columns that were granted on April 1, 2014 vested on April 1, 2016. Mr. Hachigian’s Stock Options shown in these columns that were repriced on July 28, 2015 will vest on April 1, 2017. All of Mr. Hachigian’s Stock Options will vest in full upon a Change in Control (as defined in his award agreements). Mr. Mallard’s Class B-1 Stock Options shown in the columns that were repriced on July 28, 2015 are scheduled to vest in equal installments on each of October 30, 2017, October 30, 2018, and October 30, 2019. Mr. Mallard’s Common Stock Options shown that were repriced on November 1, 2016 will vest in equal installments on each of September 15, 2017, September 15, 2018, September 15, 2019, and September 15, 2020. Mr. Dinger’s Stock Options shown in these columns will vest in equal installments on each of November 1, 2017, November 1, 2018, November 1, 2019, and November 1, 2020. |
(3) | The amounts in this column represent the total number of RSUs that were not vested as of December 31, 2016. Mr. Beck’s RSUs will vest in equal installments on each of November 30, 2017, November 30, 2018, and November 30, 2019. Mr. Hachigian’s RSUs will vest on November 10, 2017. Mr. Dinger’s RSUs will vest in equal installments on November 1, 2017 and November 1, 2018. All of Ms. Doerre’s RSUs will vest on November 2, 2019. |
85
(4) | The amounts in this column represent the aggregate market value of RSUs based upon the valuation of our common stock in effect on December 31, 2016 of $28.88. |
Option Exercises and Stock Vested
The following table lists the options exercised and stock vested for each of the NEOs during the year ended December 31, 2016. In 2016, none of the NEOs exercised any Stock Options.
Stock Awards | ||||||
Name | Number of shares vested(1) | Market value of shares or units of stock that have vested(2) | ||||
Mark Beck | 41,250 | $ | 1,191,375 | |||
Kirk Hachigian | 23,375 | $ | 675,113 | |||
L. Brooks Mallard | — | — | ||||
John Dinger | — | — | ||||
Laura Doerre | — | — | ||||
____________________
(1) | Mr. Beck’s RSUs vested on November 30, 2016, and, in connection therewith, 21,527 shares were issued to Mr. Beck and 19,723 were withheld to cover applicable taxes. Mr. Hachigian’s RSUs vested on November 10, 2016, and, in connection therewith, 13,563 shares were issued to Mr. Hachigian, and 9,812 were withheld to cover applicable taxes. |
(2) | Represents the aggregate value of Mr. Hachigian’s and Mr. Beck’s RSUs, at a value of $28.88 per share, when settled in December 2016. |
Potential Payments upon Termination or Change In Control
Each of our NEOs would be entitled to certain payments and benefits following a termination of employment in certain circumstances. These potential benefits are summarized below and reflect obligations pursuant to agreements with the Company as well as other compensatory arrangements and policies. The amounts of potential payments and benefits for our NEOs reflected in the table below assume that the termination of employment in the circumstances noted occurred on December 31, 2016.
In the case of Mr. Hachigian, whose employment was terminated by mutual agreement without cause on December 31, 2016, the actual benefits provided under his termination agreement are described and quantified below.
Termination for Cause or Voluntary Resignation without Good Reason
Upon a termination by the Company for Cause (as defined in the relevant agreement or as determined in accordance with the Stock Incentive Plan) or due to a voluntary resignation without Good Reason (as defined in the relevant agreement), no severance benefits would be paid to the NEO. Pursuant to applicable employment and award agreements, Stock Options, whether vested or unvested, and unvested RSUs would in each case be forfeited immediately upon termination for Cause for no consideration. The NEO would receive a payment for unused vacation days accrued in the year of termination and would continue to be eligible for medical and dental benefits until the end of the month in which termination occurred. The NEO would forfeit the right to an annual bonus under the MIP in the year of termination, but would be paid for any bonus earned in the prior fiscal year if such bonus had not yet been paid prior to the date of termination.
Upon termination of employment for any reason other than death, disability, retirement on or after age 65, or termination for cause, all unvested Stock Options and RSUs are immediately forfeited and vested Stock Options remain exercisable for the 90-day period following termination.
Termination Due to Death, Disability or Retirement
Upon a termination due to death, disability or retirement after age 65, none of the NEOs would receive any benefits not ordinarily provided under our standard life insurance and disability benefit plans. Under the Company’s standard life insurance policy, in the event an NEO dies while actively employed, his or her beneficiary will receive a payment of $10,000 and base salary continuation (based on the annual base salary in effect at the time of death) for a period of one year. Under the Company’s disability benefit plan, if an NEO becomes disabled, he or she will be entitled to six months’ salary continuation. Because these benefits are generally available to all employees of the Company and are provided pursuant to policies that do not discriminate in favor of our NEOs in scope, terms or operation, the value of such benefits are not included in the table below.
86
Pursuant to the applicable award agreements, all unvested Stock Options and RSUs granted to a NEO would be forfeited immediately in the event of a termination of employment due to death, disability or retirement. Stock Options that are vested on the date of death, disability or retirement on or after age 65 will remain exercisable until the earlier to occur of (x) the expiration of the twelve-month period following termination and (y) the Stock Option expiration date.
Termination without Cause or Resignation for Good Reason
The agreements with Messrs. Beck, Hachigian, Mallard, and Dinger provide that if their employment is terminated by the Company without Cause (as defined in the applicable agreement) or in the case of Mr. Beck, if he resigns for “Good Reason” (as defined in the applicable agreement), they are entitled to the benefits described below.
Mr. Beck
Mr. Beck’s employment agreement provides that he will be entitled to base salary continuation and medical benefits for one year in the event his employment is terminated by us without Cause or he resigns for Good Reason (as defined in the agreement). Pursuant to the applicable award agreements, in the event Mr. Beck’s employment is terminated without Cause or he resigns for Good Reason, any Stock Options and RSUs scheduled to vest on the vesting date next following the date of termination will vest immediately upon termination. Vested Stock Options will remain available for exercise for 90 days following termination.
In order to receive these post-employment benefits, Mr. Beck must execute a binding waiver and release of all legal claims against the Company. Mr. Beck is also subject to non-competition and non-solicitation provisions for 18 months following his termination of employment.
Mr. Hachigian
In a termination agreement dated December 30, 2016, the Company and Mr. Hachigian mutually agreed that his employment with the Company and any agreements relating thereto with the Company would terminate effective December 31, 2016 and that Mr. Hachigian will continue to serve as non-Executive Chairman. Pursuant to the termination agreement, Mr. Hachigian is entitled to (i) a prorated annual bonus under the 2016 MIP (for January 1, 2016 through March 31, 2016), (ii) continued eligibility for himself and his dependents in the Company’s medical and dental plans until December 31, 2020, and (iii) continued rights to indemnification as an officer of the Company and any indemnification agreements in his favor. Pursuant to the termination agreement, Mr. Hachigian was also designated a Key Non-Employee under our Stock Incentive Plan such that all stock options and RSUs granted to him will remain outstanding in accordance with the terms and conditions of the original award agreement, including continued vesting.
In consideration for receiving these post-employment benefits, Mr. Hachigian executed a binding waiver and release of all legal claims against us. Mr. Hachigian is also subject to non-competition and non-solicitation provisions for 24 months following his termination of employment.
Messrs. Mallard and Dinger
Pursuant to their management transition agreements, each of Messrs. Mallard and Dinger will receive salary continuation for twelve months in the event his employment is terminated by the Company without Cause (as defined in the agreement) prior to December 1, 2017. The executive will be eligible for medical and dental benefits at the same cost as active employees for up to 18 months following termination. The executive will also receive a bonus under the MIP in the calendar year of termination as earned, based on actual performance under the terms of the MIP (subject to a minimum payment equal to his target annual bonus opportunity). In the calendar year following his termination, the executive will receive a pro rata target bonus under the MIP based on his target bonus opportunity at the time of his termination. For the twelve-month period following his termination, the executive will be required to assist with an orderly management transition. During this period, the executive will be designated a “Key Non-Employee” such that his equity awards will continue to vest, and following such period, his vested Stock Options will remain outstanding for 90 days. Unvested RSUs granted to Mr. Dinger will vest at the conclusion of the twelve-month transition period. Unvested Stock Options will be forfeited immediately upon the conclusion of the one-year transition period. The benefits under the management transition agreements are provided in lieu of any severance or separation benefits for which the executives may otherwise be eligible under any policy or other agreement.
In order to receive these post-employment benefits, the executive must execute a binding waiver and release of all legal claims against the Company. The executives are also subject to non-competition and non-solicitation restrictions for 18 months and 24 months, respectively, following the termination of employment.
87
Ms. Doerre
Pursuant to the Company’s severance benefits policy, in the event of a termination without cause, Ms. Doerre will be entitled to salary continuation based on her number of years of service (for up to six months) and Company-subsidized COBRA continuation coverage for up to 12 months.
Change in Control
The occurrence of a change in control of the Company alone (i.e., one that does not result in a termination of employment without Cause or resignation by the executive (as applicable)) will result neither in the payment of any severance or separation benefits to any of the NEOs, nor in the accelerated vesting of any Stock Options or RSUs, except with respect to the equity awards held by Mr. Beck and Mr. Hachigian. In the event of a Company Sale (as defined in his award agreements), all unvested Stock Options and RSUs granted to Mr. Beck would vest immediately provided he remained actively employed by us until the date of the Company Sale. In the event of a Change in Control (as defined in the award agreements), Mr. Hachigian’s then unvested Stock Option awards will become vested in full.
Estimated Potential Termination Payments and Benefits
The following table provides the estimated value of the payments and benefits that our NEOs would have been provided under the employment agreements, letter agreements, and other management agreements and policies described above in connection with certain termination scenarios, assuming such termination had occurred on December 31, 2016. The actual amounts that would be paid upon an NEO’s termination of employment can be determined only at the time of such event.
Name | Voluntary Separation or For Cause(1) | Without Cause or Good Reason(2) | Death | Disability | Retirement After Age 65 | Change In Control; No Termination(3) | ||||||||||||||
Mark Beck | — | $ | 3,156,784 | — | — | — | $ | 6,911,893 | ||||||||||||
Kirk Hachigian | — | $ | 55,340 | — | — | — | $ | 481,445 | ||||||||||||
L. Brooks Mallard | — | $ | 832,619 | — | — | — | — | |||||||||||||
John Dinger | — | $ | 683,618 | — | — | — | — | |||||||||||||
Laura Doerre | — | $ | 268,413 | — | — | — | — | |||||||||||||
____________________
(1) | None of the NEOs will receive any special benefits in the event of voluntary separation without Good Reason or termination for Cause. Under standard plan provisions, the NEOs will continue to be eligible for benefits under the Company’s medical and dental plans until the last day of the month in which termination occurs and for a payment for vacation days earned but not used in the year of termination, if any. The NEO would also receive payment for bonus earned in the fiscal year prior to termination if that bonus has not been paid prior to the termination date. Any bonus earned in the year of termination is forfeited. |
(2) | Amounts in this column represent the cash and benefits to be paid to the NEO in the event of termination by the Company without Cause (as defined in the relevant agreement) or, with respect to Mr. Beck, resignation with Good Reason (as defined in the relevant agreement). For Mr. Hachigian, the benefit includes only medical and dental benefits for himself and his dependents through December 31, 2020. For Mr. Beck, the severance benefits are one year of base salary ($850,000), a target bonus ($1,062,500), medical and dental benefits ($18,413), and accelerated vesting on 20% of his Common Stock Options and Class B-1 Common Stock Options and 25% of his RSUs ($1,225,871). For Mr. Mallard, the cash and benefits are based on one year of base salary ($460,000), a target bonus ($345,000), and medical and dental benefits for 18 months ($27,619). For Mr. Dinger, the cash and benefits are based on one year of base salary ($410,000), a target bonus ($246,000) and medical and dental benefits for 18 months ($27,619). For Ms. Doerre, the cash and benefits are based on six months of base salary ($250,000) and medical and dental benefits for 12 months ($18,413). |
(3) | The occurrence of a change in control of the Company without a termination of employment will not result in payments to the NEOs, other than with respect to Messrs. Beck and Hachigian. The amounts in this column represents the value of equity acceleration of all outstanding unvested equity awards for Mr. Beck and acceleration of all unvested Stock Options for Mr. Hachigian, which amounts were computed based upon a valuation of our common stock on December 31, 2016 of $28.88. |
Director Compensation
Members of the Board who are our employees or employees of Onex receive no additional compensation for their service on the Board. In 2016, our employee-directors were Messrs. Hachigian, Beck, and Wendt and the directors employed by Onex were Messrs. Munk and Ross. Mr. Beck joined the Board in May 2016. Each non-employee and non-Onex member of the Board received $125,000 annually for service on the Board, payable quarterly in arrears. The Chair of the Audit Committee was eligible to receive an additional $10,000 per year, payable quarterly in arrears. Mr. Tolbert was the Chair of the Audit Committee in 2016 and received the additional retainer for his services as such.
88
In 2017, following our IPO, each non-employee member of the Board will be entitled to receive an annual cash retainer of $90,000. In addition, the Chair of the Board will be entitled to receive an additional annual cash retainer of $100,000 and the Chair of the Audit Committee will be entitled to receive an additional annual cash retainer of $25,000. Amounts due to members of our Board that are employees of Onex will be paid directly to Onex.
Annual Stock Grant
We have not historically offered annual equity awards to our directors. Beginning in 2017, each non-employee director will receive an annual grant of $110,000 in RSUs under the Company’s Omnibus Equity Plan, which RSUs shall vest on the first anniversary of the date of the grant subject to continued service on the Board by the non-employee or non-Onex director through the earlier of the end of the director’s term or the vesting date. Directors who are appointed to the Board during the year will be entitled to a prorated RSU award. The value of awards due to members of our Board who are employees of Onex will be paid directly to Onex; however, such payments will be made in cash and not as equity awards. In accordance with this policy, on February 27, 2017, each non-employee director (other than those who are employees of Onex) received a grant of 3,533 RSUs.
2016 Compensation
The following table summarizes the compensation of the non-NEO directors in the year ended December 31, 2016. Directors who are our employees or employees of Onex received no compensation for their service as Board members. Mr. Beck’s and Mr. Hachigian’s compensation has been reported in the Summary Compensation Table and related compensation tables regarding our 2016 NEOs. Messrs, Carter and Patterson resigned as directors, effective October 31, 2016.
Name | Fees Earned or Paid in Cash(1) | Stock Awards | Option Awards($) | All Other Compensation | Total | |||||||||||||
Martha (Stormy) Byorum | $ | 125,000 | — | — | — | $ | 125,000 | |||||||||||
John D. Carter | $ | 125,000 | — | — | — | $ | 125,000 | |||||||||||
Anthony Munk | — | — | — | — | — | |||||||||||||
Christopher Patterson | $ | 125,000 | — | — | — | $ | 125,000 | |||||||||||
Matthew Ross | — | — | — | — | — | |||||||||||||
Bruce Taten(2) | $ | 125,000 | — | — | $ | 88,200 | $ | 213,200 | ||||||||||
Patrick Tolbert | $ | 135,000 | — | — | — | $ | 135,000 | |||||||||||
Roderick Wendt(3) | — | — | — | $ | 777,229 | $ | 777,229 | |||||||||||
Steven Wynne(4) | $ | 125,000 | — | — | $ | 182,267 | $ | 307,267 | ||||||||||
____________________
(1) | Non-employee directors received no compensation other than the annual retainer of $125,000, except for Mr. Tolbert who received an additional $10,000 retainer as Chair of the Audit Committee. |
(2) | Pursuant to an oral agreement with the Company, Mr. Taten was paid $88,200 for legal consulting services in 2016. |
(3) | Mr. Wendt, Vice Chairman, is an employee. In 2016, he received a salary of $200,000 and 401(k) matching contributions of $8,000. Mr. Wendt also received a cash award of $569,229 for 42,471 vested Common Stock Options and 56,815 vested Class B-1 Common Stock Options. |
(4) | Mr. Wynne is a former employee who, pursuant to the terms of his separation agreement, continues to hold 13,596 vested Common Stock Options and 18,194 Class B-1 Common Stock Options all with an exercise price of $21.77 per share. In November 2016, Mr. Wynne received a cash award on these vested Stock Options of $182,267 based on $4.09 per Common Stock Option and $6.96 per Class B-1 Common Stock Option. |
IRS Code Section 162(m)
Section 162(m) of the Code generally disallows publicly held companies a tax deduction for compensation in excess of $1,000,000 paid to their chief executive officer and the three other most highly compensated executive officers (other than the chief financial officer) unless such compensation qualifies for an exemption for certain compensation that is based on performance. Section 162(m) of the Code provides transition relief for privately held companies that become publicly held, pursuant to which the foregoing deduction limit does not apply to any remuneration paid pursuant to compensation plans or agreements in existence during the period in which the corporation was not publicly held if, in connection with an initial public offering, the prospectus accompanying the initial public offering discloses information concerning those plans or agreements that satisfies all applicable securities laws then in effect. If the transition requirements are met in connection with an initial public offering, the transition relief continues until the earliest of (i) the expiration of the plan or agreement, (ii) the material modification of the plan or agreement, (iii) the issuance of all employer stock and other compensation that has been allocated under the plan, or (iv) the first meeting of the shareholders at which directors are to be elected that occurs after the close of the third calendar year following the calendar year in
89
which the initial public offering occurs. Our intent generally is to design and administer executive compensation programs in a manner that will preserve the deductibility of compensation paid to our executive officers, and we believe that a substantial portion of our current executive compensation program will satisfy the requirements for exemption from the $1,000,000 deduction limitation, to the extent applicable. However, we reserve the right to design programs that recognize a full range of performance criteria important to our success, even where the compensation paid under such programs may not be deductible. The Committee will monitor the tax and other consequences of our executive compensation program as part of its primary objective of ensuring that compensation paid to our executive officers is reasonable, performance based and consistent with our goals and the goals of our shareholders.
Corporate Governance Information
Our Internet address is www.jeldwen.com. On our website, we make available, free of charge, our Annual Reports on Form 10-K, quarterly reports on Form 10-Q, current reports on Form 8-K, proxy statements, director and officer reports on Forms 3, 4, and 5, and any amendments to these reports, as soon as reasonably practicable after we electronically file such material with, or furnish it to, the SEC. Our SEC reports can be accessed through the investor relations section of our website. The information found on our website is not part of this or any other report we file with or furnish to the SEC. We also make available on our website, our Code of Business Conduct and Ethics, our Board Guidelines on Corporate Governance Matters, and the charters for the Audit, Compensation, and Governance and Nominating Committees of the Board of Directors. Our SEC filings are also available for reading and copying at the SEC’s Public Reference Room at 100 F Street, NE, Washington, D.C. 20549. Information on the operation of the Public Reference Room may be obtained by calling the SEC at 1-800-SEC-0330. In addition, the SEC maintains an Internet site, www.sec.gov, containing reports, proxy and information statements, and other information regarding issuers that file electronically with the SEC.
Shareholder Proposals for the 2018 Annual Meeting
The Company held its 2017 Annual Meeting of Shareholders prior to the IPO; therefore, the first proxy materials to be filed with the SEC will be related to our 2018 Annual Meeting of Shareholders scheduled for April 26, 2018. If any shareholder wishes to propose a matter for consideration at our 2018 Annual Meeting, the proposal should be mailed to our Corporate Secretary, JELD-WEN Holding, Inc., 440 S. Church Street, Suite 400, Charlotte, North Carolina 28202. To be eligible under the SEC’s shareholder proposal rule (Rule 14a-8(e) of the Exchange Act) for inclusion in our proxy statement for the 2018 Annual Meeting, a proposal must be received by our Corporate Secretary on or before November 16, 2017, a date that the Company considers a reasonable time before it begins to print and mail its proxy materials for the 2018 Annual Meeting. Failure to deliver a proposal in accordance with this procedure may result in it not being deemed timely received.
In addition, our Bylaws permit shareholders to nominate candidates for director and present other business for consideration at our annual meeting of shareholders. To make a director nomination or present other business for consideration at the 2018 Annual Meeting, you must submit a timely notice in accordance with the procedures described in our Bylaws. To be timely, a shareholder’s notice must be delivered to the Corporate Secretary at the principal executive offices of our Company not less than 45 or more than 75 days prior to the one-year anniversary of the date on which the Company first mailed its proxy materials for the preceding year’s annual meeting of shareholders (which anniversary date, for purposes of tour first annual meeting of shareholders following our IPO, shall deemed to be April 30, 2018). Any such proposal will be considered timely only if it is otherwise in compliance with the requirements set forth in our Bylaws.
Item 12. Security Ownership of Certain Beneficial Owners and Management and Related Shareholder Matters.
The following table shows information about the beneficial ownership of our common stock, as of February 17, 2017, for:
• | each person known by us to beneficially own 5% or more of our outstanding common stock; |
• | each of our directors and Named Executive Officers; and |
• | all of our directors and executive officers as a group. |
Information with respect to beneficial ownership has been furnished to us by each director, executive officer, or shareholder listed in the table below. The amounts and percentages of our common stock beneficially owned are reported on the basis of rules of the SEC governing the determination of beneficial ownership of securities. Under these rules, a person is deemed to be a “beneficial owner” of a security if that person has or shares “voting power”, which includes the power to vote or direct the voting of such security, or “investment power”, which includes the power to dispose of or to direct the disposition of such security. A person is also deemed to be a beneficial owner of any securities of which that person has a right to acquire beneficial ownership within 60 days after February 17, 2017, including any shares of our common stock subject to an option that is currently exercisable or is exercisable within 60 days of that date. Securities that can be so acquired are deemed to be outstanding for purposes of computing such person’s ownership percentage, but not for purposes of computing any other person’s ownership percentage. More than one person may be deemed to be a beneficial owner of the same securities.
90
As of February 17, 2017, 104,886,303 shares of our common stock were issued and outstanding. Unless otherwise indicated, to our knowledge, all persons listed below have sole voting and investment power with respect to their shares of common stock, except to the extent authority is shared by spouses under applicable law. Unless otherwise indicated below, the address for each person or entity listed below is c/o JELD-WEN Holding, Inc., 440 S. Church Street, Suite 400, Charlotte, North Carolina 28202.
Number of shares beneficially owned | |||||
Name of Beneficial Owner | Number of shares | Percentage of shares | |||
5% Shareholders and selling shareholders | |||||
Onex(1) | 62,787,969 | 59.9% | |||
Named Executive Officers and Directors | |||||
Mark Beck(2) | 144,485 | * | |||
L. Brooks Mallard(3) | 78,816 | * | |||
John Dinger(4) | 26,922 | * | |||
Laura Doerre | — | — | |||
Kirk Hachigian(5) | 1,602,622 | 1.5% | |||
Martha (Stormy) Byorum | 5,500 | * | |||
Greg G. Maxwell | — | — | |||
Anthony Munk(6) | — | — | |||
Matthew Ross(6) | — | — | |||
Bruce Taten | 39,285 | * | |||
Patrick Tolbert | — | — | |||
Roderick Wendt(7) | 3,598,358 | 3.4% | |||
Steven Wynne(8) | 61,081 | * | |||
All executive officers and directors as a group (18 persons)(9) | 5,728,281 | 5.4% | |||
* | Represents beneficial ownership of less than 1% of our outstanding common stock. |
(1) | Includes: (i) 38,765,302 shares of common stock held by Onex Partners III LP; (ii) 5,239,894 shares of common stock held by Onex BP Co-Invest LP; (iii) 1,025,463 shares of common stock held by Onex Partners III GP LP; (iv) 519,480 shares of common stock held by Onex US Principals LP; (v) 494,320 shares of common stock held by Onex Partners III PV LP; (vi) 14,485,537 shares of common stock held by OAH Wind LLC; (vii) 641,378 shares of common stock held by BP EI II LLC; (viii) 124,808 shares of common stock held by Onex Partners III Select LP; and (ix) 1,491,787 shares of common stock held by Onex Advisor Subco III LLC. Onex Corporation, a corporation whose subordinated voting shares are traded on the Toronto Stock Exchange, and/or Mr. Gerald W. Schwartz, may be deemed to beneficially own the common stock held by (a) Onex Partners III LP, through Onex Corporation’s ownership of all of the common stock of Onex Partners Manager GP ULC, the general partner of Onex Partners Manager LP, the agent of Onex Partners III GP LP, the general partner of Onex Partners III LP, (b) Onex BP Co-Invest LP, through Onex Corporation’s ownership of all of the equity of Onex Partners Manager GP ULC, the general partner of Onex Partners Manager LP, the agent of Onex Partners III GP LP, the general partner of Onex BP Co-Invest LP, (c) Onex Partners III GP LP, through Onex Corporation’s ownership of all of the equity of Onex Partners GP Inc., the general partner of Onex Partners III GP LP, (d) Onex US Principals LP, through Onex Corporation’s ownership of all of the common stock of Onex American Holdings GP LLC, the general partner of Onex US Principals LP, (e) Onex Partners III PV LP, through Onex Corporation’s ownership of all of the equity of Onex Partners Manager GP ULC, the general partner of Onex Partners Manager LP, the agent of Onex Partners III GP LP, the general partner of Onex Partners III PV LP, (f) OAH Wind LLC, through Onex Corporation’s ownership of all of the equity of Onex American Holdings II LLC, which owns all of the equity of Onex American Holdings Subco LLC, which owns all of the equity of OAH Wind LLC, (g) BP EI II LLC, through Onex Corporation’s ownership of all of the equity of Onex American Holdings II LLC, which owns all of the equity of BP EI LLC, which owns all of the equity of BP EI II LLC, (h) Onex Partners III Select LP, through Onex Corporation’s ownership of all of the equity of Onex Partners Manager GP ULC, the general partner of Onex Partners Manager LP, the agent of Onex Partners III GP LP, the general partner of Onex Partners III Select LP; and (i) Onex Advisor Subco III LLC, through Gerald W. Schwartz’s control of 1597257 Ontario Inc., which owns all of the equity of New PCo II Investments Ltd., which owns all of the equity interest of Onex Advisor Subco LLC, which owns all of the equity interest of Onex Advisor Subco III LLC. Mr. Gerald W. Schwartz, the Chairman, President and Chief Executive Officer of Onex Corporation, owns shares representing a majority of the voting rights of the shares of Onex Corporation and as such may be deemed to beneficially own all of the common stock beneficially owned by Onex Corporation. Mr. Schwartz disclaims such beneficial ownership. The address for Onex Corporation and Mr. Schwartz is 161 Bay Street, Toronto, ON M5J 2S1. |
(2) | Includes 100,957 shares of common stock issuable upon the exercise of options exercisable within 60 days after February 17, 2017. |
(3) | Includes 66,320 shares of common stock issuable upon the exercise of options exercisable within 60 days after February 17, 2017. |
(4) | Includes 26,922 shares of common stock issuable upon the exercise of options exercisable within 60 days after February 17, 2017. |
(5) | Includes 1,290,684 shares of common stock issuable upon the exercise of options exercisable within 60 days after February 17, 2017. |
(6) | Does not include shares of common stock held by funds managed by an affiliate of Onex Corporation. Mr. Munk is a Senior Managing Director of Onex Corporation and Mr. Ross is a Managing Director of Onex Corporation. Mr. Munk and Mr. Ross do not have voting or investment power with respect to the shares held by such funds. |
91
(7) | Includes (i) 22,352 shares of common stock held through the Company’s ESOP; (ii) 8,772 shares of common stock held through the Company’s KSOP; (iii) 141,669 shares of common stock issuable upon the exercise of options exercisable within 60 days after February 17, 2017; (iv) 253,121 shares of common stock held through the Wendt Family Foundation; (v) 2,806,485 shares of common stock held through The Richard Lester Wendt Revocable Living Trust; (vi) 339,559 shares of common stock held through the RC Wendt Revocable Trust; and (vii) 26,400 shares of common stock held through the Roderick Wendt GST Trust. Mr. Wendt is one of nine trustees of the Wendt Family Foundation. Mr. Wendt is one of three trustees, each of whom are members of Mr. Wendt’s immediate family, of The Richard Lester Wendt Revocable Living Trust. Mr. Wendt is the sole trustee of the RC Wendt Revocable Trust and the Roderick Wendt GST Trust. Mr. Wendt has or shares voting and investment control of shares held by the Wendt Family Foundation, The Richard Lester Wendt Revocable Living Trust, the RC Wendt Revocable Trust and the Roderick Wendt GST Trust, and therefore may be deemed to have beneficial ownership of such shares. Mr. Wendt is also the beneficiary of the RC Wendt Revocable Trust. Mr. Wendt, as trustee and beneficiary of the RC Wendt Revocable Trust, has pledged 220,000 shares of common stock in the name of Lewis & Clark Bank to secure a loan obligation. |
(8) | Includes 45,362 shares of common stock issuable upon the exercise of options exercisable within 60 days after February 17, 2017. |
(9) | Includes 1,843,127 shares of common stock issuable upon the exercise of options exercisable within 60 days after February 17, 2017. |
Section 16(a) Beneficial Ownership Reporting Compliance
Section 16(a) of the Exchange Act requires that our executive officers and directors, and persons who beneficially own more than ten percent (10%) of our common stock, file initial reports of ownership and changes in ownership with the SEC and the NYSE. Since the Company did not register its common stock pursuant to Section 12 of the Exchange Act until January 27, 2017, no Section 16(a) filing requirements were applicable to our executive officers, directors or greater than 10% owners in fiscal 2016.
Securities Authorized For Issuance Under Equity Compensation Plans
As of December 31, 2016, there was no public market for our common stock and there were no equity compensation plans approved by security holders under which our equity securities were authorized for issuance.
The following table sets forth information with respect to shares of our common stock that may be issued under our existing equity compensation plans, as of December 31, 2016:
(a) | (b) | (c) | |||||||
Plan Category | Number of Securities to be Issued Upon Exercise of Outstanding Options, Warrants, and Rights(1) | Weighted Average Exercise Price of Outstanding Options, Warrants, and Rights(3) | Number of Securities Remaining Available for Future Issuance Under Equity Compensation Plans (Excluding Securities Reflected in Column (a)) | ||||||
Equity compensation plans approved by security holders(1) | 7,984,745(2) | $13.18 | 2,964,393(4) | ||||||
Equity compensation plans not approved by security holders | — | — | — | ||||||
Total | 7,984,745 | $13.18 | 2,964,393 | ||||||
(1) | Consists of shares underlying 1,812,404 common options, 3,344,572 Class B-1 Common options and 385,220 RSUs outstanding under the Stock Incentive Plan. Each Class B-1 Common option was convertible into 1.7303 common shares at December 31, 2016. |
(2) | Includes stock options and RSUs that are outstanding. |
(3) | Excludes RSUs, which have no exercise price. |
(4) | Number of securities remaining for future issuances assumes conversion of all outstanding Class B-1 Common options into common stock at the conversion rate in effect on December 31, 2016. |
Item 13. Certain Relationships and Related Transactions, and Director Independence.
Dividends and Other Distributions
In November 2016, we made payments of approximately $400 million to holders of our common stock, Series A Convertible Preferred Stock, Class B-1 Common Stock, options, and RSUs. Of the amount paid, approximately $327 million was paid to Onex in respect of its ownership of common stock and Series A Convertible Preferred Stock, and an aggregate of approximately $11.3 million was paid to our directors and executive officers in respect of common stock, Class B-1 Common Stock, options, and RSUs they own.
92
Consulting Agreement
In October 2011, we entered into a consulting agreement with Onex. In exchange for providing us with corporate finance and strategic planning consulting services, we paid Onex Partners Manager LP an annual management fee of $0.4 million in the year ending December 31, 2016, pursuant to the consulting agreement. The consulting agreement provided that we would indemnify Onex against any claims arising out of or in connection with Onex’ performance under the consulting agreement and reimburse Onex for any out-of-pocket legal expenses incurred in connection with the investigation or defense of any such claims. In connection with our IPO, the consulting agreement (excluding ongoing indemnification obligations) was terminated for no consideration.
Onex Shareholders Agreement
We, Onex, the RLW Trust, and certain other of our shareholders were party to a shareholders agreement, dated October 3, 2011, as amended, which was entered into in connection with the Onex investment. The shareholders agreement governed the transferability of shares of common stock and other rights with respect to the ownership of shares of common stock. The shareholders agreement was terminated in connection with our IPO.
Company Shareholders Agreement
We and certain of our pre-IPO shareholders were party to certain shareholders agreements, which were intended to limit the number and identity of our shareholders for so long as we operated as a private company. In connection with our IPO, we terminated these shareholder agreements.
Indemnification Agreements
In 2016, we entered into indemnification agreements with each of our directors and certain of our officers. The indemnification agreements provide the directors and officers with contractual rights to indemnification and expense advancement which are, in some cases, broader than the specific indemnification provisions contained under Delaware law. We believe that the indemnification agreements are, in form and substance, substantially similar to those commonly entered into with publicly traded Delaware corporations.
Employment Agreements
See Item 11- Executive Compensation- Employment Agreements for information regarding the employment agreements that we have entered into with our named executive officers.
Registration Rights Agreement
We, Onex, certain of our directors and executive officers, and other pre-IPO shareholders (who collectively owned approximately 95% of our outstanding common stock prior to our IPO) also entered into a registration rights agreement dated October 3, 2011, as amended, in connection with the Onex Investment. Pursuant to the registration rights agreement, upon the closing of the IPO and subject to the terms of the lock-up agreement they have entered into with the representatives of the underwriters, the shareholders who are party to the registration rights agreement will have the right to require us to register their shares under the Securities Act under specified circumstances, including the right to require us to facilitate underwritten offerings as well as to make available shelf registration statements permitting sales of shares into the market from time to time over an extended period, and will have incidental registration rights as described below. After registration pursuant to these rights, in most cases these shares will become freely tradable without restriction under the Securities Act.
Demand Registration Rights
Subject to certain restrictions, at any time after six months following our IPO, Onex (or its permitted transferees) will have the right to require us from time to time by written notice to prepare and file a registration statement registering the offer and sale of a number of their shares of common stock and/or to facilitate an underwritten offer of a number of shares of their common stock using an already effective shelf registration statement, except that no more than one demand may occur in any six-month period unless such demand is for a short-form registration or underwritten shelf takedown. The demand rights will also be subject to our right to delay registration for up to six months based on certain circumstances.
Piggyback Registration Rights
If, subject to certain customary limitations, we propose to register an offering of common stock (subject to certain exceptions) for our own account or for the account of any third party (including a demand registration), then we must give written
93
notice to all holders who own registrable securities to allow them to include a specified number of their shares in that registration statement.
Participation Right
For so long as Onex and its affiliates collectively own at least 5% of our outstanding common stock (calculated on an as-converted, fully diluted basis), Onex has the right to purchase its pro rata portion of the primary shares offered pursuant to any future public offering by the Company at the same price at which the common stock will be offered to the public pursuant to the offering.
Other Provisions
The registration rights are subject to certain conditions and limitations, including the right of the underwriters to limit the number of shares to be included in a registration and our right to delay or withdraw a registration statement under certain circumstances. We will generally pay all registration expenses in connection with our obligations under the registration rights agreement, regardless of whether a registration statement is filed or becomes effective. The registration rights agreement also contains customary cross-indemnification provisions, pursuant to which we are obligated to indemnify any selling shareholders in the event of material misstatements or omissions in the registration statement attributable to us, and each selling shareholder is obligated to indemnify us for material misstatements or omissions in the registration statement attributable to information specifically provided by such selling shareholder.
Stock Purchase Agreements
We and Onex were party to the amended and restated stock purchase agreement, dated as of July 29, 2011, and the stock purchase agreement, dated as of August 30, 2012, in each case as amended, which were entered into to provide for the acquisition of our equity by Onex. The stock purchase agreements require us to indemnify, hold harmless, and reimburse Onex and certain of its related parties for damages (as defined and subject to limitations specified in the stock purchase agreements) arising from, based upon, or otherwise in respect of various matters identified in the stock purchase agreements, including our ownership, operation, and disposition of businesses and assets that are not part of our core business (“non-core assets”) and certain specified liabilities. We were required to satisfy these obligations in cash or through the issuance of our common stock; any amounts payable would be “grossed-up” to compensate Onex for the portion of those amounts that it would bear as our majority shareholder, except to the extent that those amounts were paid in cash from certain operating cash flow and disposition proceeds derived from non-core assets. In August 2016, pursuant to a settlement agreement executed in June 2016, we paid Onex and the other investors under the stock purchase agreements an aggregate of $23.7 million in cash in full settlement and satisfaction of all existing claims (known or unknown) under these provisions of the stock purchase agreements. In connection with the settlement, the stock purchase agreements and our certificate of incorporation were amended to permit us to pay a cash dividend to holders of our common stock who are parties to the stock purchase agreements with the net proceeds (after provision for related taxes and other expenses), if any, received by us after August 3, 2016 and prior to the filing of a preliminary prospectus for the IPO that includes a price range from the sale of specified non-core assets. On July 26, 2016, we entered into an agreement to sell certain of these assets, which sale was completed on October 20, 2016. We did not distribute to shareholders the net proceeds of this sale. Our obligations under these provisions of the stock purchase agreements terminated automatically upon our IPO, except with respect to any unresolved claim made prior to such time.
Selling Shareholder Letter Agreement
In connection with the sale of shares by the selling shareholders in our IPO, we entered into a letter agreement with the selling shareholders pursuant to which we agreed to pay all registration expenses (other than underwriting discounts and commission, but including costs of outside counsel) and to indemnify the selling shareholders in the event of material misstatements or omissions in the IPO prospectus attributable to us, and in which each of the selling shareholders are obligated to indemnify us for material misstatements or omissions in the IPO prospectus attributable to information specifically provided by such selling shareholders.
Employee Stock Ownership and Retirement Plan and KSOP
Beginning in 1995, we sponsored the JELD-WEN, Inc. ESOP. The ESOP was frozen to new participants effective May 1, 2016. On August 16, 2016, we established the JELD-WEN, Inc. KSOP, or KSOP, and transferred a portion of participants' accounts under the ESOP into the KSOP. The ESOP and the KSOP are designed as tax-qualified retirement plans and employee stock ownership plans under the Code. Participants may direct the ESOP and KSOP trustees (who are designated from time to time by our board of directors) how to vote our common stock allocated to their ESOP and KSOP accounts on certain matters, such as corporate mergers or consolidations, recapitalizations, reclassifications, liquidations, dissolutions and the sale of substantially all of our assets.
The ESOP and KSOP provide that participants whose employment with us or our subsidiaries is terminated are entitled to receive distribution of their accounts held in the ESOP or KSOP, as applicable, at specified times and in specified forms. When an
94
account is distributed, participants may elect to receive either shares of our common stock or cash. Historically, in order to fund cash distributions, the ESOP sold shares of common stock to us for cash. In the years ended December 31, 2015 and 2014, we repurchased approximately $12.1 million $14.8 million, respectively, of our common stock from the ESOP. We did not repurchase any shares of common stock from the ESOP or KSOP during the year ended December 31, 2016, and, we do not expect to purchase any further shares from the ESOP or the KSOP. As of February 14, 2017, the ESOP and KSOP owned approximately 3.8% of our outstanding common stock.
Notes Receivable from the RLW Trust
RLW, was a director of the Company until his death in 2010. During the three-year period beginning on January 1, 2013, the RLW Estate, owned more than 5% of the Company’s common stock, and one of the directors of the Company, RCW, is a trustee of the RLW Estate. In connection with transactions between the Company and either RLW or entities owned by RLW prior to his death, RLW issued promissory notes to the Company. The promissory notes were secured by Company stock held by RLW, entities owned by RLW prior to his death, or the RLW Estate. As of December 31, 2016, 2015, and 2014, respectively, we were owed $0, $0, and $12.6 million by the RLW Estate, and we received interest payments of $0, $0.5 million, and $4.2 million. In December 2014, we reduced the principal amount of the promissory notes by $7.1 million in exchange for 355,487 shares of the Company’s stock held by the RLW Estate. The remaining $12.6 million of principal was repaid with the proceeds of the dividend paid on or about July 31, 2015. See “Dividends and Other Distributions” above.
Loan to Roderick C. Wendt
One of our directors, RCW, issued promissory notes to us. As of December 31, 2016, 2015, and 2014, respectively, we were owed $0 million, $2.0 million, and $3.4 million by RCW, and we received payments of interest of $0.2 million in each of the years ended December 31, 2015 and 2014 and payments of principal $1.4 million and $1.3 million in each of the years ended December 31, 2015, and 2014. The entire principal amount of the promissory notes was repaid in May 2016.
Aviation Department
In 2014, we restructured our aviation department, downsizing from three aircrafts to one and moving the operation from Oregon to North Carolina. As part of the restructuring plan, one of the aircrafts was subleased to the RLW Estate. In the agreement, we paid the ongoing lease payments of $79,000 per month and the RLW Estate paid a nominal amount to us. The RLW Estate was responsible for all maintenance and operational costs. This arrangement was entered to decrease the costs and extend the cash outflow associated with exiting the aircraft lease. The lease expired at the end of January 2017 and was not renewed. In addition, the aircraft hangar located in Klamath Falls, Oregon was sold to Fairmount Aviation for fair value of $2.0 million. Fairmount is a newly formed aviation company controlled by RCW, a director of the Company.
Policies and Procedures for Related Party Transactions
Our board of directors has adopted a policy providing that the governance and nominating committee will review and approve or ratify transactions in which we participate and in which a related party has or will have a direct or indirect material interest. Under this policy, the governance and nominating committee is to obtain all information it believes to be relevant to a review and approval or ratification of these transactions. After consideration of the relevant information, the governance and nominating committee is to approve only those related party transactions that the governance and nominating committee believes are in the best interests of the Company. In particular, our policy with respect to related party transactions will require our governance and nominating committee to consider the benefits to the Company; the impact on a director’s independence in the event the related party is a director, an immediate family member of a director or an entity in which a director has a position or relationship; the overall fairness of the transaction to both the Company and the related party; and any other matters the governance and nominating committee deems appropriate. A “related party” is any person who is or was one of our executive officers, directors, or director nominees or is a holder of more than 5% of our common stock, or their immediate family members or any entity owned or controlled by any of the foregoing persons. All of the transactions described above were entered into prior to the adoption of this policy.
Certain of the foregoing disclosures are summaries of certain provisions of our related party agreements,
and are qualified in their entirety by reference to all of the provisions of such agreements. Because these descriptions are only summaries of the applicable agreements, they do not necessarily contain all of the information that you may find useful. Copies of certain of the agreements (or forms of the agreements) have been incorporated by reference as exhibits to this Form 10-K, and are available electronically on the website of the SEC at www.sec.gov.
95
Item 14. Principal Accounting Fees and Services.
Audit Fees
The following table summarizes fees paid or accrued to our independent registered public accounting firm, PwC, in connection with various services for fiscal 2016.
(dollars in millions) | 2016 | 2015 | ||||||
Audit fees | (1) | $ | 5.5 | $ | 4.8 | |||
Audit-related fees | (2) | 1.4 | — | |||||
Tax fees | (3) | 2.2 | 1.5 | |||||
All other fees | (4) | 0.1 | 0.1 | |||||
Total | $ | 9.2 | $ | 6.4 | ||||
(1) | Audit fees: This category includes fees and expenses billed by PwC for the quarterly reviews and annual audits of our financial statements as well as the audit of statutory filings for certain foreign subsidiaries. |
(2) | Audit-related fees: This category includes fees and expenses billed by PwC associated with SEC registration statements and other documents issued in connection with our IPO. |
(3) | Tax fees: This category includes fees and expenses billed by PwC for domestic and international tax compliance and planning services and tax advice. |
(4) | All other fees: This category includes all other amounts billed by PwC including licensing of PwC's Inform software, which is an on-line accounting and reporting tool, and certain advisory services. |
96
Item 15. - Exhibits and Financial Statement Schedules.
1. Financial Statements
The financial statements are set forth under Item 8- Financial Statements and Supplementary Data of this Form 10-K.
2. Financial Statement Schedules
All financial statement schedules are omitted since they are not required or are not applicable, or the required information is included in the consolidated financial statements or notes thereto.
3. Exhibits
The exhibits listed on the accompanying Exhibit Index are filed or incorporated by reference as part of this report and such Exhibit Index is incorporated herein by reference.
Exhibit No. | Exhibit Description | Form | File No. | Exhibit | Filing Date | ||
3.1 | Restated Certificate of Incorporation of JELD-WEN Holding, Inc., filed February 1, 2017. | 8-K | 001-38000 | 3.1 | February 1, 2017 | ||
3.2 | Amended and Restated Bylaws of JELD-WEN Holding, Inc. | S-1/A | 333-211761 | 3.4 | January 5, 2017 | ||
4.1 | Specimen Common Stock Certificate of JELD-WEN Holding Inc. | S-1/A | 333-211761 | 4.1 | January 5, 2017 | ||
4.2* | |||||||
10.1 | Credit Agreement, among JELD-WEN Holding, Inc., JELD-WEN, Inc., JELD-WEN of Canada, Ltd., the other guarantors party thereto, Wells Fargo Bank, National Association, and the lenders party thereto, dated October 15, 2014. | S-1 | 333-211761 | 10.1 | June 1, 2016 | ||
10.2 | Amendment No. 1 to Credit Agreement, among JELD-WEN Holding, Inc., JELD-WEN, Inc., JELD-WEN of Canada, Ltd., the subsidiary guarantors party thereto, Wells Fargo Bank, National Association, and the lenders party thereto, dated July 1, 2015. | S-1 | 333-211761 | 10.1.1 | June 1, 2016 | ||
10.3 | Amendment No. 2 to Credit Agreement, among JELD-WEN Holding, Inc., JELD-WEN, Inc., JELD-WEN of Canada, Ltd., Karona, Inc., the subsidiary guarantors party thereto, Wells Fargo Bank, National Association, and the lenders party thereto, dated November 1, 2016. | S-1/A | 333-211761 | 10.1.2 | November 17, 2016 | ||
10.4 | Term Loan Credit Agreement, among JELD-WEN Holding, Inc., JELD-WEN, Inc., Onex BP Finance LP, the other guarantors party thereto, Bank of America, N.A. and the lenders party thereto, dated October 15, 2014. | S-1 | 333-211761 | 10.2 | June 1, 2016 | ||
10.5 | Amendment No. 1 to Term Loan Credit Agreement, among JELD-WEN Holding, Inc., JELD-WEN, Inc., Onex BP Finance LP, the subsidiary guarantors party thereto, Bank of America, N.A., and the lenders party thereto, dated July 1, 2015. | S-1 | 333-211761 | 10.2.1 | June 1, 2016 | ||
10.6 | Amendment No. 2 to Term Loan Credit Agreement, among JELD-WEN Holding, Inc., JELD-WEN, Inc. the subsidiary guarantors party thereto, Onex BP Finance LP, Bank of America, N.A., and the lenders party thereto, dated November 1, 2016. | S-1/A | 333-211761 | 10.2.2 | November 17, 2016 | ||
97
Exhibit No. | Exhibit Description | Form | File No. | Exhibit | Filing Date | ||
10.7 | Stock Purchase Agreement, among JELD-WEN Holding, Inc., Onex Partners III LP and the other investors party thereto, dated August 30, 2012. | S-1/A | 333-211761 | 10.3 | December 16, 2016 | ||
10.8 | Amendment to Stock Purchase Agreements, among JELD-WEN Holding, Inc. and Onex Partners III LP, dated April 3, 2013. | S-1/A | 333-211761 | 10.3.1 | December 16, 2016 | ||
10.9 | Amendment to Stock Purchase Agreement, among JELD-WEN Holding, Inc. and Onex Partners III LP, dated May 31, 2016. | S-1/A | 333-211761 | 10.3.2 | December 16, 2016 | ||
10.10 | Form of Joinder to Stock Purchase Agreement, among JELD-WEN Holding, Inc., Onex Partners III LP and the other investors party thereto. | S-1/A | 333-211761 | 10.3.3 | December 16, 2016 | ||
10.11 | Amended and Restated Stock Purchase Agreement, among JELD-WEN Holding, Inc., Onex Partners III LP, Onex Advisor III LLC, Onex Partners III GP LP, Onex Partners III PV LP, Onex Partners III Select LP, Onex US Principals LP, Onex Corporation, Onex American Holdings II LLC, BP EI LLC and 1597257 Ontario Inc., dated July 29, 2011. | S-1/A | 333-211761 | 10.4 | December 16, 2016 | ||
10.12 | Amendment No. 1 to Amended and Restated Stock Purchase Agreement, among JELD-WEN Holding, Inc. and Onex Partners III LP, dated September 1, 2011. | S-1/A | 333-211761 | 10.4.1 | December 16, 2016 | ||
10.13 | Amendment to Amended and Restated Stock Purchase Agreement, among JELD-WEN Holding, Inc. and Onex Partners III LP, dated May 31, 2016. | S-1/A | 333-211761 | 10.4.2 | December 16, 2016 | ||
10.14+ | JELD-WEN Holding, Inc. Amended and Restated Stock Incentive Plan, dated May 31, 2016. | S-1/A | 333-211761 | 10.6 | December 16, 2016 | ||
10.15+ | Form of Nonstatutory Common Stock Option Agreement under JELD-WEN Holding, Inc. Amended and Restated Stock Incentive Plan. | S-1/A | 333-211761 | 10.7 | December 16, 2016 | ||
10.16+ | Form of Nonstatutory Class B-1 Common Stock Option Agreement under JELD-WEN Holding, Inc. Amended and Restated Stock Incentive Plan. | S-1/A | 333-211761 | 10.8 | December 16, 2016 | ||
10.17+ | Form of Restricted Stock Unit Award Agreement under JELD-WEN Holding, Inc. Amended and Restated Stock Incentive Plan. | S-1/A | 333-211761 | 10.9 | December 16, 2016 | ||
10.18+ | Employment Agreement, by and between JELD-WEN Holding, Inc., JELD-WEN, Inc. and Mark A. Beck, dated November 10, 2015. | S-1/A | 333-211761 | 10.11 | January 5, 2017 | ||
10.19+ | Management Employment Agreement, by and between JELD-WEN, Inc. and Kirk S. Hachigian, dated March 31, 2014. | S-1/A | 333-211761 | 10.12 | January 5, 2017 | ||
10.20+ | Termination of Management Employment Agreement, by and between JELD-WEN, Inc. and Kirk S. Hachigian, dated December 30, 2016. | S-1/A | 333-211761 | 10.12.1 | January 5, 2017 | ||
10.21+ | Management Employment Agreement, by and between JELD-WEN, Inc. and L. Brooks Mallard, dated October 30, 2014. | S-1/A | 333-211761 | 10.13 | January 5, 2017 | ||
10.22+ | Management Employment Agreement, by and between JELD-WEN, Inc. and John Dinger, dated November 30, 2015. | S-1/A | 333-211761 | 10.14 | January 5, 2017 | ||
98
Exhibit No. | Exhibit Description | Form | File No. | Exhibit | Filing Date | ||
10.23+ | Management Employment Agreement, by and between JELD-WEN Holding, Inc., JELD-WEN, Inc. and Laura Doerre, dated September 6, 2016. | S-1/A | 333-211761 | 10.15 | January 5, 2017 | ||
10.24+ | Letter Agreement, by and between JELD-WEN, Inc. and Laura Doerre, dated July 25, 2016. | S-1/A | 333-211761 | 10.15.1 | January 5, 2017 | ||
10.25+ | Form of Management Transition Agreement. | S-1/A | 333-211761 | 10.16 | January 5, 2017 | ||
10.26+ | JELD-WEN Holding, Inc. 2017 Omnibus Equity Plan. | S-1/A | 333-211761 | 10.17 | January 5, 2017 | ||
10.27+ | Form of Nonqualified Stock Option Agreement under JELD-WEN Holding, Inc. 2017 Omnibus Equity Plan. | S-1/A | 333-211761 | 10.18 | January 5, 2017 | ||
10.28+ | Form of Restricted Stock Unit Award Agreement under JELD-WEN Holding, Inc. 2017 Omnibus Plan. | S-1/A | 333-211761 | 10.19 | January 5, 2017 | ||
10.29+ | JELD-WEN Holding, Inc. 2017 Management Incentive Plan. | S-1/A | 333-211761 | 10.20 | January 5, 2017 | ||
10.30*+ | |||||||
10.31 | Form of Indemnification Agreement. | S-1 | 333-211761 | 10.25 | June 1, 2016 | ||
21.1 | List of subsidiaries of JELD-WEN Holding, Inc. | S-1/A | 333-211761 | 21.1 | January 17, 2017 | ||
23.1* | |||||||
24.1* | Power of Attorney (included on signature page). | ||||||
31.1* | |||||||
31.2* | |||||||
32.1* | |||||||
* | Filed herewith. | ||||||
+ | Indicates management contract or compensatory plan. | ||||||
99
Item 16. - (Form 10-K Summary).
None.
100
SIGNATURES
Pursuant to the requirements of Section 13 or 15(d) of the Securities Exchange Act of 1934, the registrant has duly caused this report to be signed on its behalf by the undersigned, thereunto duly authorized.
JELD-WEN HOLDING, INC. | |
(Registrant) | |
By: | /s/ L. Brooks Mallard |
L. Brooks Mallard | |
Chief Financial Officer | |
Date: March 3, 2017
POWER OF ATTORNEY
KNOW ALL PERSONS BY THESE PRESENTS, that each person whose signature appears below constitutes and appoints L. Brooks Mallard and Laura W. Doerre, jointly and severally, his attorney-in-fact, with the power of substitution, for him in any and all capacities, to sign any amendments to this Annual Report on Form 10-K and to file the same, with exhibits thereto and other documents in connection therewith, with the Securities and Exchange Commission, hereby ratifying and confirming all that each of said attorneys-in-fact, or his substitute or substitutes, may do or cause to be done by virtue hereof.
Pursuant to the requirements of the Securities and Exchange Act of 1934, this report has been signed below by the following persons on behalf of the registrant and in the capacities and on the dates indicated.
Signature | Title | Date | |||
/s/ Mark A. Beck | President, Chief Executive Officer, and Director (Principal Executive Officer) | March 3, 2017 | |||
Mark A. Beck | |||||
/s/ L. Brooks Mallard | Chief Financial Officer (Principal Financial Officer and Principal Accounting Officer) | March 3, 2017 | |||
L. Brooks Mallard | |||||
/s/ Kirk Hachigian | Chairman | March 3, 2017 | |||
Kirk Hachigian | |||||
/s/ Roderick C. Wendt | Vice Chairman | March 3, 2017 | |||
Roderick C. Wendt | |||||
/s/ Martha Byorum | Director | March 3, 2017 | |||
Martha (Stormy) Byorum | |||||
/s/ Greg G. Maxwell | Director | March 3, 2017 | |||
Greg G. Maxwell | |||||
/s/ Matt Ross | Director | March 3, 2017 | |||
Matt Ross | |||||
/s/ Anthony Munk | Director | March 3, 2017 | |||
Anthony Munk | |||||
/s/ Bruce Taten | Director | March 3, 2017 | |||
Bruce Taten | |||||
101
Signature | Title | Date | |||
/s/ Patrick Tolbert | Director | March 3, 2017 | |||
Patrick Tolbert | |||||
/s/ Steven E. Wynne | Director | March 3, 2017 | |||
Steven E. Wynne | |||||
102
Index to Consolidated Financial Statements
Report of Independent Registered Public Accounting Firm | |
Consolidated Statements of Operations for the Years Ended December 31, 2016, 2015 and 2014 | |
Consolidated Statements of Comprehensive Income (Loss) for the Years Ended December 31, 2016, 2015 and 2014 | |
Consolidated Balance Sheets as of December 31, 2016 and 2015 | |
Consolidated Statements of Equity for the Years Ended December 31, 2016, 2015 and 2014 | |
Consolidated Statements of Cash Flows for the Years Ended December 31, 2016, 2015 and 2014 | |
Notes to Consolidated Financial Statements | |
Index to Financial Statement Schedules
All schedules have been omitted because they are not applicable or not required or because the required information is included in the consolidated financial statements or notes thereto.
F-1
Report of Independent Registered Public Accounting Firm
To the Board of Directors and shareholders of JELD-WEN Holding, Inc.:
In our opinion, the accompanying consolidated balance sheets and the related consolidated statements of operations, of comprehensive income (loss), of equity, and of cash flows present fairly, in all material respects, the financial position of JELD-WEN Holding, Inc. and its subsidiaries as of December 31, 2016 and December 31, 2015, and the results of their operations and their cash flows for each of the three years in the period ended December 31, 2016 in conformity with accounting principles generally accepted in the United States of America. These financial statements are the responsibility of the Company’s management. Our responsibility is to express an opinion on these financial statements based on our audits. We conducted our audits of these financial statements in accordance with the standards of the Public Company Accounting Oversight Board (United States). Those standards require that we plan and perform the audit to obtain reasonable assurance about whether the financial statements are free of material misstatement. An audit includes examining, on a test basis, evidence supporting the amounts and disclosures in the financial statements, assessing the accounting principles used and significant estimates made by management, and evaluating the overall financial statement presentation. We believe that our audits provide a reasonable basis for our opinion.
/s/ PricewaterhouseCoopers LLP
Charlotte, North Carolina
March 3, 2017
F-2
JELD-WEN HOLDING, INC.
CONSOLIDATED STATEMENTS OF OPERATIONS
For the Years Ended December 31, | ||||||||||||
(amounts in thousands, except share and per share data) | 2016 | 2015 | 2014 | |||||||||
Net revenues | $ | 3,666,799 | $ | 3,381,060 | $ | 3,507,206 | ||||||
Cost of sales | 2,866,805 | 2,715,125 | 2,919,864 | |||||||||
Gross margin | 799,994 | 665,935 | 587,342 | |||||||||
Operating expenses | ||||||||||||
Selling, general and administrative | 589,407 | 512,126 | 488,477 | |||||||||
Impairment and restructuring charges | 13,847 | 21,342 | 38,388 | |||||||||
Operating income | 196,740 | 132,467 | 60,477 | |||||||||
Other income (expense) | ||||||||||||
Interest income | 826 | 1,653 | 2,435 | |||||||||
Interest expense | (78,416 | ) | (62,285 | ) | (71,724 | ) | ||||||
Loss on debt extinguishment | — | — | (51,036 | ) | ||||||||
Other | 12,825 | 14,120 | 515 | |||||||||
Income (loss) before taxes, equity earnings (loss) and discontinued operations | 131,975 | 85,955 | (59,333 | ) | ||||||||
Income tax benefit (expense) | 225,596 | 5,435 | (18,942 | ) | ||||||||
Income (loss) from continuing operations, net of tax | 357,571 | 91,390 | (78,275 | ) | ||||||||
Equity earnings (loss) of non-consolidated entities | 3,264 | 2,384 | (447 | ) | ||||||||
Loss from discontinued operations, net of tax | (3,324 | ) | (2,856 | ) | (5,387 | ) | ||||||
Net income (loss) | $ | 357,511 | $ | 90,918 | $ | (84,109 | ) | |||||
Convertible preferred stock dividends | 396,647 | 381,418 | 100,034 | |||||||||
Net loss attributable to common shareholders | $ | (39,136 | ) | $ | (290,500 | ) | $ | (184,143 | ) | |||
Weighted average common shares outstanding | ||||||||||||
Basic | 17,992,879 | 18,296,003 | 20,440,057 | |||||||||
Diluted | 17,992,879 | 18,296,003 | 20,440,057 | |||||||||
Loss per share from continuing operations | ||||||||||||
Basic and diluted | $ | (1.99 | ) | $ | (15.72 | ) | $ | (8.75 | ) | |||
Loss per share from discontinued operations | ||||||||||||
Basic and diluted | $ | (0.18 | ) | $ | (0.16 | ) | $ | (0.26 | ) | |||
Net loss per share | ||||||||||||
Basic and diluted | $ | (2.17 | ) | $ | (15.88 | ) | $ | (9.01 | ) | |||
The accompanying notes are an integral part of these Consolidated Financial Statements.
F-3
JELD-WEN HOLDING, INC.
CONSOLIDATED STATEMENTS OF COMPREHENSIVE INCOME (LOSS)
For the Years Ended December 31, | ||||||||||||
(amounts in thousands) | 2016 | 2015 | 2014 | |||||||||
Net income (loss) | $ | 357,511 | $ | 90,918 | $ | (84,109 | ) | |||||
Other comprehensive (loss) income, net of tax: | ||||||||||||
Foreign currency translation adjustments, net of tax of $0 | (32,383 | ) | (78,636 | ) | (85,357 | ) | ||||||
Defined benefit pension plans: | ||||||||||||
Net actuarial pension (loss) gain, net of tax of $(419), $189 and $(522) | (11,406 | ) | 18,264 | (59,298 | ) | |||||||
Amortization of net actuarial pension loss to income, net of tax of $0 | 12,274 | 12,436 | 7,644 | |||||||||
Interest rate hedge adjustments, net of tax of $0, $0 and $369 | (2,679 | ) | (11,200 | ) | 583 | |||||||
Total other comprehensive loss, net of tax | (34,194 | ) | (59,136 | ) | (136,428 | ) | ||||||
Total comprehensive income (loss) | $ | 323,317 | $ | 31,782 | $ | (220,537 | ) | |||||
The accompanying notes are an integral part of these Consolidated Financial Statements.
F-4
JELD-WEN HOLDING, INC.
CONSOLIDATED BALANCE SHEETS
(amounts in thousands) | December 31, 2016 | December 31, 2015 | ||||||
ASSETS | ||||||||
Current assets | ||||||||
Cash and cash equivalents | $ | 102,701 | $ | 113,571 | ||||
Restricted cash | 751 | 706 | ||||||
Accounts receivable, net | 407,620 | 321,079 | ||||||
Inventories | 334,634 | 343,736 | ||||||
Other current assets | 30,104 | 35,326 | ||||||
Total current assets | 875,810 | 814,418 | ||||||
Property and equipment, net | 704,651 | 720,843 | ||||||
Deferred tax assets | 268,965 | 21,698 | ||||||
Goodwill | 486,055 | 482,506 | ||||||
Intangible assets, net | 117,795 | 78,318 | ||||||
Other assets | 63,020 | 64,590 | ||||||
Total assets | $ | 2,516,296 | $ | 2,182,373 | ||||
LIABILITIES AND EQUITY | ||||||||
Current liabilities | ||||||||
Accounts payable | $ | 188,906 | $ | 166,686 | ||||
Accrued payroll and benefits | 130,668 | 139,621 | ||||||
Accrued expenses and other current liabilities | 173,521 | 164,544 | ||||||
Notes payable and current maturities of long-term debt | 20,031 | 16,594 | ||||||
Total current liabilities | 513,126 | 487,445 | ||||||
Long-term debt | 1,600,004 | 1,243,726 | ||||||
Unfunded pension liability | 126,646 | 106,748 | ||||||
Deferred credits and other liabilities | 74,455 | 78,814 | ||||||
Deferred tax liabilities | 9,186 | 15,448 | ||||||
Total liabilities | 2,323,417 | 1,932,181 | ||||||
Commitments and contingencies (Note 31) | ||||||||
Convertible preferred shares | 150,957 | 481,937 | ||||||
Shareholders’ equity (deficit) | ||||||||
Common Stock: 904,732,200 shares authorized, par value $0.01 per share, 17,894,393 and 17,829,240 shares outstanding as of December 31, 2016 and 2015, respectively, and 177,221 and 68,046 Class B-1 Common Stock outstanding as of December 31, 2016 and 2015, respectively | 180 | 179 | ||||||
Additional paid-in capital | 36,362 | 86,022 | ||||||
Retained earnings (accumulated deficit) | 202,562 | (154,949 | ) | |||||
Accumulated other comprehensive loss | (197,182 | ) | (162,997 | ) | ||||
Total shareholders’ equity (deficit) | 41,922 | (231,745 | ) | |||||
Total liabilities, convertible preferred shares, and shareholders’ equity (deficit) | $ | 2,516,296 | $ | 2,182,373 | ||||
The accompanying notes are an integral part of these Consolidated Financial Statements.
F-5
JELD-WEN HOLDING, INC.
CONSOLIDATED STATEMENTS OF EQUITY
For the years ended December 31, | |||||||||||||||||||||
2016 | 2015 | 2014 | |||||||||||||||||||
(amounts in thousands, except share and per share amounts) | Shares | Amount | Shares | Amount | Shares | Amount | |||||||||||||||
Common stock, $0.01 par value per share | |||||||||||||||||||||
Common stock | |||||||||||||||||||||
Balance as of January 1 | 17,829,240 | $ | 178 | 19,757,309 | $ | 198 | 20,801,308 | $ | 208 | ||||||||||||
Shares issued | — | — | 118,976 | 1 | — | — | |||||||||||||||
Shares issued for exercise/vesting of stock options and restricted stock units | 65,153 | — | 25,355 | — | — | — | |||||||||||||||
Class B-1 Common Stock converted to common stock | — | — | 1,485 | — | — | — | |||||||||||||||
Shares repurchased | — | — | (2,073,885 | ) | (21 | ) | (1,043,999 | ) | (10 | ) | |||||||||||
Balance at period end | 17,894,393 | $ | 178 | 17,829,240 | $ | 178 | 19,757,309 | $ | 198 | ||||||||||||
Class B-1 Common Stock | |||||||||||||||||||||
Balance as of January 1 | 68,046 | 1 | 2,310 | — | 2,310 | — | |||||||||||||||
Shares issued for exercise of stock options | 109,175 | 1 | 66,781 | 1 | — | — | |||||||||||||||
Class B-1 Common stock converted to common | — | $ | — | (1,045 | ) | $ | — | — | $ | — | |||||||||||
Balance at period end | 177,221 | $ | 2 | 68,046 | $ | 1 | 2,310 | $ | — | ||||||||||||
Balance at period end | 180 | 179 | 198 | ||||||||||||||||||
Additional paid-in capital | |||||||||||||||||||||
Balance as of January 1 | $ | 89,101 | $ | 198,184 | $ | 212,134 | |||||||||||||||
Shares issued | — | 2,769 | — | ||||||||||||||||||
Shares issued for exercise of stock options | 205 | 1,235 | — | ||||||||||||||||||
Shares repurchased | — | (44,675 | ) | (21,918 | ) | ||||||||||||||||
Distributions on common stock and Class B-1 Common Stock | (73,957 | ) | (84,032 | ) | — | ||||||||||||||||
Amortization of share-based compensation | 21,856 | 15,620 | 7,968 | ||||||||||||||||||
Balance at period end | 37,205 | 89,101 | 198,184 | ||||||||||||||||||
Director notes | |||||||||||||||||||||
Balance as of January 1 | (2,068 | ) | (16,127 | ) | (27,249 | ) | |||||||||||||||
Net issuances, payments and accrued interest on Notes | 2,068 | 14,059 | 11,122 | ||||||||||||||||||
Balance at period end | — | (2,068 | ) | (16,127 | ) | ||||||||||||||||
Employee stock notes | |||||||||||||||||||||
Balance as of January 1 | (1,011 | ) | (1,353 | ) | (1,458 | ) | |||||||||||||||
Net issuances, payments and accrued interest on Notes | 168 | 342 | 105 | ||||||||||||||||||
Balance at period end | (843 | ) | (1,011 | ) | (1,353 | ) | |||||||||||||||
Balance at period end | $ | 36,362 | $ | 86,022 | $ | 180,704 | |||||||||||||||
Retained earnings (accumulated deficit) | |||||||||||||||||||||
Balance as of January 1 | $ | (154,949 | ) | $ | (245,867 | ) | $ | (161,758 | ) | ||||||||||||
Net income (loss) | 357,511 | 90,918 | (84,109 | ) | |||||||||||||||||
Balance at period end | $ | 202,562 | $ | (154,949 | ) | $ | (245,867 | ) | |||||||||||||
Accumulated other comprehensive (loss) income | |||||||||||||||||||||
Foreign currency adjustments | |||||||||||||||||||||
Balance as of January 1 | $ | (33,575 | ) | $ | 45,061 | $ | 130,418 | ||||||||||||||
Change during period | (32,374 | ) | (78,636 | ) | (85,357 | ) | |||||||||||||||
Balance at end of period | (65,949 | ) | (33,575 | ) | 45,061 | ||||||||||||||||
Unrealized (loss) gain on interest rate hedges | |||||||||||||||||||||
Balance as of January 1 | (10,617 | ) | 583 | — | |||||||||||||||||
Change during period | (2,679 | ) | (11,200 | ) | 583 | ||||||||||||||||
Balance at end of period | (13,296 | ) | (10,617 | ) | 583 | ||||||||||||||||
Net actuarial pension (loss) gain | |||||||||||||||||||||
Balance as of January 1 | (118,805 | ) | (149,505 | ) | (97,851 | ) | |||||||||||||||
Change during period | 868 | 30,700 | (51,654 | ) | |||||||||||||||||
Balance at end of period | (117,937 | ) | (118,805 | ) | (149,505 | ) | |||||||||||||||
Balance at period end | $ | (197,182 | ) | $ | (162,997 | ) | $ | (103,861 | ) | ||||||||||||
Total shareholders' equity (deficit) at end of period | $ | 41,922 | $ | (231,745 | ) | $ | (168,826 | ) | |||||||||||||
The accompanying notes are an integral part of these Consolidated Financial Statements.
F-6
JELD-WEN HOLDING, INC.
CONSOLIDATED STATEMENTS OF CASH FLOWS
For the years ended December 31, | ||||||||||||
(amounts in thousands) | 2016 | 2015 | 2014 | |||||||||
OPERATING ACTIVITIES | ||||||||||||
Net income (loss) | $ | 357,511 | $ | 90,918 | $ | (84,109 | ) | |||||
Adjustments to reconcile net loss to cash used in operating activities: | ||||||||||||
Depreciation and amortization | 106,790 | 95,196 | 100,026 | |||||||||
Deferred income taxes | (247,021 | ) | (18,862 | ) | 1,631 | |||||||
Non cash changes in inventory value | 4,660 | 8,079 | (420 | ) | ||||||||
(Gain) loss on sale of business units, property and equipment | (3,275 | ) | (414 | ) | 709 | |||||||
Adjustment to carrying value of assets | 5,221 | 4,268 | 10,543 | |||||||||
Equity (earnings) loss in non-consolidated entities | (3,264 | ) | (2,384 | ) | 447 | |||||||
Amortization of deferred financing costs | 3,980 | 4,261 | 5,736 | |||||||||
Non-cash loss on extinguishment of debt | — | — | 22,628 | |||||||||
Stock-based compensation | 22,464 | 15,620 | 7,968 | |||||||||
Required contributions to U.S. pension plan | — | (14,320 | ) | (16,578 | ) | |||||||
Amortization of U.S. pension expense | 12,264 | 12,803 | 7,609 | |||||||||
Other items, net | (5,283 | ) | 1,820 | 2,653 | ||||||||
Net change in operating assets and liabilities, net of effect of acquisitions: | ||||||||||||
Accounts receivable | (80,310 | ) | (3,904 | ) | (638 | ) | ||||||
Inventories | 10,089 | 2,872 | 10,843 | |||||||||
Other assets | (10,871 | ) | (7,023 | ) | (18,655 | ) | ||||||
Accounts payable and accrued expenses | 27,863 | (28,225 | ) | (28,605 | ) | |||||||
Change in uncertain tax liability | 765 | 11,634 | — | |||||||||
Net cash provided by operating activities | 201,583 | 172,339 | 21,788 | |||||||||
INVESTING ACTIVITIES | ||||||||||||
Purchases of property and equipment | (74,033 | ) | (74,978 | ) | (68,624 | ) | ||||||
Proceeds from sale of business units, property and equipment | 7,614 | 4,680 | 6,911 | |||||||||
Purchase of intangible assets | (5,464 | ) | (2,709 | ) | (2,222 | ) | ||||||
Purchases of businesses, net of cash acquired | (85,866 | ) | (86,695 | ) | — | |||||||
Issuances of notes receivable | (68 | ) | (73 | ) | (583 | ) | ||||||
Cash received on notes receivable | 1,035 | 1,323 | 7,780 | |||||||||
Net cash used in investing activities | (156,782 | ) | (158,452 | ) | (56,738 | ) | ||||||
FINANCING ACTIVITIES | ||||||||||||
Distributions paid | (404,198 | ) | (419,216 | ) | — | |||||||
Proceeds from issuance of new debt, net of discount | 374,063 | 477,600 | 790,250 | |||||||||
Borrowings on long-term debt | 763 | — | — | |||||||||
Payments of long-term debt | (16,844 | ) | (19,402 | ) | (655,361 | ) | ||||||
Change in notes payable | (180 | ) | (3,420 | ) | (3,338 | ) | ||||||
Employee note repayments | 2,336 | 15,073 | 4,516 | |||||||||
Payments of debt issuance costs | (8,146 | ) | (9,066 | ) | (15,684 | ) | ||||||
Common stock issued | 205 | 2,006 | — | |||||||||
Common stock repurchased | — | (44,647 | ) | (14,766 | ) | |||||||
Net cash (used in) provided by financing activities | (52,001 | ) | (1,072 | ) | 105,617 | |||||||
Effect of foreign currency exchange rates on cash | (3,670 | ) | (4,786 | ) | (2,791 | ) | ||||||
Net (decrease) increase in cash and cash equivalents | (10,870 | ) | 8,029 | 67,876 | ||||||||
Cash and cash equivalents, beginning | 113,571 | 105,542 | 37,666 | |||||||||
Cash and cash equivalents, ending | $ | 102,701 | $ | 113,571 | $ | 105,542 | ||||||
The accompanying notes are an integral part of these Consolidated Financial Statements.
F-7
JELD-WEN HOLDING, INC.
NOTES TO CONSOLIDATED FINANCIAL STATEMENTS
For the Years Ended December 31, 2016, 2015 and 2014
Note 1. Summary of Significant Accounting Policies
Nature of Business – JELD-WEN Holding, Inc., (“JWH”) (a Delaware corporation) along with its subsidiaries, is a vertically-integrated global manufacturer and distributor of windows and doors with substantially all of its revenues being derived from the sale of its door and window products. Unless otherwise specified or the context otherwise requires, all references in these notes to “JELD-WEN”, “we”, “us”, “our”, or the “Company” are to JELD-WEN Holding, Inc. and its subsidiaries.
We have facilities located in the United States (“U.S.”), Canada, Europe, Australia, Asia, Mexico, and South America, and our products are marketed primarily under the JELD-WEN brand name in the U.S. and Canada and under JELD-WEN and a variety of acquired brand names in Europe, Australia and Asia.
Our revenues are affected by the level of new housing starts and remodeling activity in each of our markets. Our sales typically follow seasonal new construction and repair and remodeling industry patterns. The peak season for home construction and remodeling in many of our markets generally correspond with the second and third calendar quarters, and therefore, sales volume is typically higher during those quarters. Our first and fourth quarter sales volumes are generally lower due to reduced repair and remodeling activity and reduced activity in the building and construction industry as a result of colder and more inclement weather in certain of our geographic end markets.
All dollar and other currency amounts, except per share amounts, are presented in thousands, unless otherwise noted.
Ownership – On October 3, 2011, we completed a transaction with Onex Partners III LP and certain affiliates (collectively, “Onex Partners”) whereby Onex Partners invested $700.0 million in convertible preferred stock. Concurrent with the investment, Onex Partners provided $171.0 million in the form of a convertible bridge loan due in April 2013. In October 2012, Onex Partners invested an additional $49.8 million in convertible preferred stock of the Company to fund an acquisition. In April 2013, the $71.6 million outstanding balance of our convertible bridge loan was converted into additional shares of our Series A Convertible Preferred Stock (“Series A Stock”). In March 2014, Onex Partners purchased $65.8 million in common stock from another investor and as of December 31, 2016 owned voting interests representing approximately 76% of the Company’s outstanding shares on a diluted, as-converted basis.
Corporate Conversion – On May 31, 2016, JELD-WEN Holding, inc., an Oregon corporation (the “Oregon corporation”), converted into a Delaware corporation pursuant to a statutory conversion and changed its name to JELD-WEN Holding, Inc. As a result of the corporate conversion, the holders of the Oregon corporation’s different classes and series of shares became holders, in aggregate, of 17,832,430 shares of common stock and 87,362 shares of B-1 Common Stock, 2,922,634 shares of Series A-1 Convertible Preferred Stock (“Series A-1 Stock”), 208,760 shares of Series A-2 Convertible Preferred Stock (“Series A-2 Stock”), 843,132 shares of Series A-3 Convertible Preferred Stock (“Series A-3 Stock”), and one share of Series B Preferred Stock (“Series B Stock”) in JELD-WEN Holding, Inc. In addition, holders of options to purchase shares and restricted stock units of the Oregon corporation received an aggregate of 1,916,255 common stock options, 3,515,919 B-1 Common Stock Options, and 405,933 restricted stock units of JELD-WEN Holding, Inc.
The accompanying consolidated financial statements and related notes thereto have been retroactively adjusted to account for the effect of the corporate conversion for all periods presented prior to May 31, 2016.
Unless otherwise indicated, all financial information contained in these financial statements for all periods presented gives effect to the 11-for-1 stock split of our common stock and Class B-1 Common Stock that was effected on January 3, 2017.
Principles of Consolidation – Our consolidated financial statements include the entities that we control, as well as majority-owned domestic and foreign subsidiaries and variable interest entities, if any, in which we are the primary beneficiary. Intercompany balances and transactions have been eliminated in consolidation and any non-controlling interests are presented as a separate component of equity. We account for investments in and advances to unconsolidated equity affiliates using the equity method.
Basis of Presentation – Certain prior year amounts have been reclassified to conform with the current period's presentation.
F-8
Fiscal Year – We operate on a fiscal calendar year, and each interim period is comprised of two 4-week periods and one 5-week period, with each week ending on a Saturday. Our fiscal year always begins on January 1 and ends on December 31. As a result, our first and fourth quarters may have more or fewer days included than a traditional 91-day fiscal quarter.
Customer Displays – Customer displays include the costs related to providing customers in store displays of our products and include all costs to manufacture, ship and install the displays in retail store locations. Capitalized display costs are included in other assets and are amortized over the life of the product lines, typically 3 to 4 years. Related amortization is included in SG&A expense in the accompanying consolidation statements of operations.
Consolidated Statements of Cash Flows – Cash flows from continuing and discontinued operations are not separated in the consolidated statements of cash flows. Cash balances associated within our discontinued operations are reflected in our consolidated balance sheet as cash and cash equivalents. See Note 3- Discontinued Operations and Divestitures.
Use of Estimates – The preparation of consolidated financial statements in conformity with accounting principles generally accepted in the U.S. ("GAAP") requires management to make estimates and assumptions that affect amounts reported in the consolidated financial statements and related notes. Significant items that are subject to such estimates and assumptions include, but are not limited to, long-lived assets including goodwill and other intangible assets, employee benefit obligations, income tax uncertainties, contingent assets and liabilities, provisions for bad debt, inventory, warranty liabilities, legal claims, valuation of derivatives, environmental remediation and claims relating to self-insurance. Actual results could differ due to the uncertainty inherent in the nature of these estimates.
Segment Reporting – Our reportable operating segments are organized and managed principally by geographic region: North America, Europe and Australasia. We report all other business activities in Corporate and unallocated costs. In addition to similar economic characteristics we also consider the following factors in determining the reportable segments: the nature of business activities, the management structure directly accountable to our chief operating decision maker for operating and administrative activities, availability of discrete financial information and information presented to the Board of Directors and investors. No segments have been aggregated for our presentation.
Acquisitions – We apply the provisions of Financial Accounting Standards Board (“FASB”) Accounting Standards Codification (“ASC”) Topic 805, Business Combinations, in the accounting for our acquisitions. It requires us to recognize separately from goodwill the assets acquired and the liabilities assumed, at their acquisition date fair values. Goodwill as of the acquisition date is measured as the excess of consideration transferred and the net of the acquisition date fair values of the assets acquired and the liabilities assumed. While we use our best estimates and assumptions to accurately value assets acquired and liabilities assumed at the acquisition date as well as contingent consideration, where applicable, our estimates are inherently uncertain and subject to refinement. As a result, during the measurement period, which may be up to one year from the acquisition date, material adjustments must be retroactively reflected in the comparative consolidated financial statements. Upon the conclusion of the measurement period or final determination of the values of assets acquired or liabilities assumed, whichever comes first, any subsequent adjustments are recorded in the current period in our consolidated statements of operations.
For a given acquisition, we may identify certain pre-acquisition contingencies as of the acquisition date and may extend our review and evaluation of these pre-acquisition contingencies throughout the measurement period in order to obtain sufficient information to assess whether we include these contingencies as a part of the fair value estimates of assets acquired and liabilities assumed and, if so, to determine their estimated amounts.
If we cannot reasonably determine the fair value of a pre-acquisition contingency (non-income tax related) by the end of the measurement period, we will recognize an asset or a liability for such pre-acquisition contingency if: (a) it is probable that an asset existed or a liability had been incurred at the acquisition date and (b) the amount of the asset or liability can be reasonably estimated. Subsequent to the measurement period, changes in our estimates of such contingencies will affect earnings and could have a material effect on our results of operations and financial position.
In addition, uncertain tax positions and tax related valuation allowances assumed in connection with a business combination are initially estimated as of the acquisition date. We re-evaluate these items quarterly based upon facts and circumstances that existed as of the acquisition date. Subsequent to the measurement period or our final determination of the tax allowance’s or contingency’s estimated value, whichever comes first, changes to these uncertain tax positions and tax related valuation allowances will affect our provision for income taxes in our consolidated statements of operations and could have a material impact on our results of operations and financial position.
Cash and Cash Equivalents – We consider all highly-liquid investments purchased with an original or remaining maturity at the date of purchase of three months or less to be cash equivalents. Our cash management system is designed to maintain
F-9
zero bank balances at certain banks. Checks written and not presented to these banks for payment are reflected as book overdrafts and are a component of accounts payable.
Restricted Cash – Restricted cash consists primarily of cash deposits required to meet certain projected self-insurance obligations. New funding is generated from employees’ portion of contributions and is added to the deposit account weekly as claims are paid.
Accounts Receivable – Accounts receivable are recorded at their net realizable value. Our customers are primarily retailers, distributors and contractors. As of December 31, 2016, one customer accounted for 21.2% of the consolidated accounts receivable balance. As of December 31, 2015, one customer accounted for 11.1% of the consolidated accounts receivable balance. We maintain allowances for doubtful accounts for estimated losses resulting from the inability of our customers to make required payments. We estimate the allowance for doubtful accounts based on a variety of factors including the length of time receivables are past due, the financial health of our customers, unusual macroeconomic conditions and historical experience. If the financial condition of a customer deteriorates or other circumstances occur that result in an impairment of a customer’s ability to make payments, we record additional allowances as needed. We write off uncollectible trade accounts receivable against the allowance for doubtful accounts when collection efforts have been exhausted and/or any legal action taken by us has concluded.
Inventories – Inventories in the accompanying consolidated balance sheets are valued at the lower of cost or market and are determined by the first-in, first-out (“FIFO”) or average cost methods. We record provisions to write-down obsolete and excess inventory to estimated net realizable value. The process for evaluating obsolete and excess inventory requires us to make subjective judgments and estimates concerning future sales levels, quantities and prices at which such inventory will be able to be sold in the normal course of business. Accelerating the disposal process or incorrect estimates of future sales potential may cause actual results to differ from the estimates at the time such inventory is disposed or sold.
Notes Receivable – Notes receivable are recorded at their net realizable value. The balance consists primarily of installment notes and affiliate notes. The allowance for doubtful notes is based upon historical loss trends and specific reviews of delinquent notes. We write off uncollectible note receivables against the allowance for doubtful accounts when collection efforts have been exhausted and/or any legal action taken by us has been concluded. Current maturities and interest, net of short-term allowance are reported as other current assets.
Property and Equipment – Property and equipment are recorded at cost. The cost of major additions and betterments are capitalized and depreciated using the straight-line method over their estimated useful lives while replacements, maintenance and repairs that do not improve or extend the useful lives of the related assets or adapt the property to a new or different use are expensed as incurred. Interest over the construction period is capitalized as a component of cost of constructed assets. Upon sale or retirement of property or equipment, cost and related accumulated depreciation are removed from the accounts and any gain or loss is charged to income.
Leasehold improvements are amortized over the shorter of the useful life of the improvement, the lease term, or the life of the building. Depreciation is generally provided over the following estimated useful service lives:
Land improvements | 10 - 20 years |
Buildings | 15 - 45 years |
Machinery and equipment | 3 - 20 years |
Intangible Assets –Intangible assets are accounted for in accordance with ASC 350, Intangibles – Goodwill and Other. Definite lived intangible assets are amortized based on the pattern of economic benefit over the following estimated useful lives:
Trademarks and trade names | 2 - 40 years |
Software | 1 - 10 years |
Licenses and rights | 1 - 10 years |
Customer relationships | 5 - 16 years |
Patents | 10 - 20 years |
The lives of definite lived intangible assets are reviewed and reduced if necessary whenever changes in their planned use occur. Legal and registration costs related to internally-developed patents and trademarks are capitalized and amortized over the lesser of their expected useful life or the legal patent life. Cost and accumulated amortization are removed from
F-10
the accounts in the period that an intangible asset becomes fully amortized. The carrying value of intangible assets is reviewed by management to assess the recoverability of the assets when facts and circumstances indicate that the carrying value may not be recoverable. The recoverability test requires us to first compare undiscounted cash flows expected to be generated by that definite lived intangible asset or asset group to its carrying amount. If the carrying amounts of the definite lived intangible assets are not recoverable on an undiscounted cash flow basis, an impairment charge is recognized to the extent that the carrying amount exceeds its fair value. Fair value is determined through various valuation techniques.
Our valuation of identifiable intangible assets acquired is based on information and assumptions available to us at the time of acquisition, using income and market approaches to determine fair value. We do not amortize our indefinite-lived intangible assets, but test for impairment annually, or when indications of potential impairment exist. For intangible assets other than goodwill, if the carrying value exceeds the fair value, we recognize an impairment loss in an amount equal to the excess. No material impairments were identified during fiscal years 2016, 2015 and 2014.
Long-Lived Assets – Long-lived assets, other than goodwill, are reviewed for impairment whenever events or changes in circumstances indicate the carrying amount of such assets may not be recoverable. The first step in an impairment review is to forecast the expected undiscounted cash flows generated from the anticipated use and eventual disposition of the asset. If the expected undiscounted cash flows are less than the carrying value of the asset, then an impairment charge is required to reduce the carrying value of the asset to fair value. Long-lived assets currently available for sale and expected to be sold within one year are classified as held for sale in other current assets or in assets of discontinued operations.
Goodwill – Goodwill is tested for impairment on an annual basis and between annual tests if indicators of potential impairment exist, using a fair-value-based approach. Current accounting guidance provides an entity the option to perform a qualitative assessment to determine whether it is more-likely-than-not that the fair value of a reporting unit is less than its carrying amount prior to performing the two-step goodwill impairment test. If this is the case, the two-step goodwill impairment test is required. If it is more-likely-than-not that the fair value of a reporting is greater than its carrying amount, the two-step goodwill impairment test is not required.
If the two-step goodwill impairment test is required, first, the fair value of the reporting unit is compared with its carrying amount (including attributable goodwill). If the fair value of the reporting unit is less than its carrying amount, an indication of goodwill impairment exists for the reporting unit and the entity must perform step two of the impairment test (measurement). Under step two, an impairment loss is recognized for any excess of the carrying amount of the reporting unit’s goodwill over the implied fair value of that goodwill. The implied fair value of goodwill is determined by allocating the fair value of the reporting unit in a manner similar to a purchase price allocation and the residual fair value after this allocation is the implied fair value of the reporting unit goodwill. Fair value of the reporting unit is determined using a discounted cash flow analysis. If the fair value of the reporting unit exceeds its carrying amount, step two does not need to be performed.
We estimated the fair value of our reporting units using a discounted cash flow model (implied fair value measured on a non-recurring basis using level 3 inputs). Inherent in the development of the discounted cash flow projections are assumptions and estimates derived from a review of our expected revenue growth rates, profit margins, business plans, cost of capital and tax rates. Changes in assumptions or estimates used in our goodwill impairment testing could materially affect the determination of the fair value of a reporting unit, and therefore, could eliminate the excess of fair value over carrying value of a reporting unit and, in some cases, could result in impairment. Such changes in assumptions could be caused by items such as a loss of one or more significant customers, decline in the demand for our products due to changing economic conditions or failure to control cost increases above what can be recouped in sale price increases. These types of changes would negatively affect our profits, revenues and growth over the long term and such a decline could significantly affect the fair value assessment of our reporting units and cause our goodwill to become impaired.
We have completed the required annual testing of goodwill for impairment for all reporting units and have determined that goodwill was not impaired.
Warranty Accrual – Warranty terms range primarily from one year to lifetime on certain window and door components. Warranties are normally limited to replacement or service of defective components for the original customer. Some warranties are transferable to subsequent owners, and are generally limited to ten years from the date of manufacture or require pro-rata payments from the customer. A provision for estimated warranty costs is recorded at the time of sale based on historical experience and we periodically adjust these provisions to reflect actual experience.
Restructuring – Costs to exit or restructure certain activities of an acquired company or our internal operations are accounted for as one-time termination and exit costs as required by the provisions of FASB ASC 420, Exit or Disposal Cost Obligations, and are accounted for separately from any business combination. A liability for costs associated with an
F-11
exit or disposal activity is recognized and measured at its fair value in our consolidated statements of operations in the period in which the liability is incurred. When estimating the fair value of facility restructuring activities, assumptions are applied regarding estimated sub-lease payments to be received, which can differ materially from actual results. This may require us to revise our initial estimates which may materially affect our results of operations and financial position in the period the revision is made.
Derivative Financial Instruments – Derivative financial instruments are used to manage interest rate risk associated with our borrowings and foreign currency exposures related to transactions denominated in currencies other than the U.S. dollar, or in the case of our non-U.S. companies, transactions denominated in a currency other than their functional currency. We record all derivative instruments in the consolidated balance sheets at fair value. Changes in a derivative’s fair value are recognized in earnings unless specific hedge criteria are met and we elect hedge accounting prior to entering into the derivative. If a derivative is designated as a fair value hedge, the changes in fair value of both the derivative and the hedged item attributable to the hedged risk are recognized in the results of operations. If the derivative is designated as a cash flow hedge, changes in the fair value of the derivative are recorded in consolidated other comprehensive income (loss) and subsequently classified to the consolidated statements of operations when the hedged item impacts earnings. At the inception of a fair value or cash flow hedge transaction, we formally document the hedge relationship and the risk management objective for undertaking the hedge. In addition, we assess both at inception of the fair value or cash flow hedge and on an ongoing basis, whether the derivative in the hedging transaction has been highly effective in offsetting changes in fair value or cash flows of the hedged item and whether the derivative is expected to continue to be highly effective. The impact of any ineffectiveness is recognized in our consolidated statements of operations.
Revenue Recognition – We recognize revenue when four basic criteria have been met: (i) persuasive evidence of a customer arrangement exists; (ii) the price is fixed or determinable; (iii) collectability is reasonably assured; and (iv) product delivery has occurred or services have been rendered. We recognize revenue based on the invoice price less allowances for sales returns, cash discounts, and other deductions as required under GAAP. Incentive payments to customers that directly relate to future business are recorded as a reduction of net revenues over the periods benefited.
Shipping Costs – Shipping costs charged to customers are included in net revenues. The cost of shipping is included in cost of sales.
Advertising Costs – All costs of advertising our products and services are charged to expense as incurred. Advertising and promotion expenses included in selling, general and administrative ("SG&A") expenses were $49.1 million in 2016, $46.0 million in 2015 and $46.8 million in 2014.
Interest Expense and Extinguishment of Debt Costs – We record the cost of debt extinguishment separately in the consolidated statements of operations. During 2016, 2015 and 2014, interest expense was allocated to discontinued operations based on debt that was specifically attributable to those operations.
Foreign Currency Translation and Adjustments – Typically, our foreign subsidiaries maintain their accounting records in their local currency. All of the assets and liabilities of these subsidiaries (including long-term assets, such as goodwill) are converted to U.S. dollars at the exchange rate in effect at the balance sheet date, income and expense accounts are translated at average rates for the period, and shareholder’s equity accounts are translated at historical rates. The effects of translating financial statements of foreign operations into our reporting currency are recognized as a cumulative translation adjustment in consolidated other comprehensive income (loss). This balance is net of tax, where applicable.
The effects of translating financial statements of foreign operations in which the U.S. dollar is their functional currency are included in the consolidated statements of operations. The effects of translating intercompany debt are recorded in the consolidated statements of operations unless the debt is of a long-term investment nature in which case gains and losses are recorded in consolidated other comprehensive income (loss).
Foreign currency transaction gains or losses are credited or charged to income as incurred.
Income Taxes – Income taxes are accounted for under the asset and liability method. Deferred tax assets and liabilities are recognized for the future tax consequences attributable to differences between the financial statement carrying amounts of existing assets and liabilities and their respective tax bases and operating loss and tax credit carryforwards. Deferred tax assets and liabilities are measured using enacted tax rates expected to apply to taxable income in the years in which those temporary differences are expected to be recovered or settled. The effect on the deferred tax assets and liabilities of a change in tax rates is recognized in income in the period that includes the enactment date. We evaluate both the positive and negative evidence that is relevant in assessing whether we will realize the deferred tax assets. A valuation allowance is recorded when it is more likely than not that some of the deferred tax assets will not be realized.
F-12
The tax effects from an uncertain tax position can be recognized in the consolidated financial statements, only if the position is more likely than not to be sustained, based on the technical merits of the position and the jurisdiction taxes of the Company. We recognize the financial statement benefit of a tax position only after determining that the relevant tax authority would more likely than not sustain the position following an audit and the tax related to the position would be due to the entity and not the owners. For tax positions meeting the more likely than not threshold, the amount recognized in the consolidated financial statements is the largest benefit that has a greater than 50 percent likelihood of being realized, upon ultimate settlement with the relevant tax authority. We apply this accounting standard to all tax positions for which the statute of limitations remains open. Changes in recognition or measurement are reflected in the period in which the change in judgment occurs.
We file a consolidated federal income tax return in the U.S. and various states. For financial statement purposes, we calculate the provision for federal income taxes using the separate return method. Certain subsidiaries file separate tax returns in certain countries and states. Any state and foreign income taxes refundable and payable are reported in other current assets and accrued income taxes payable in the consolidated balance sheets. We record interest and penalties on amounts due to tax authorities as a component of income tax expense in the consolidated statements of operations.
Recently Adopted Accounting Standards – In September 2015, the FASB issued ASU No. 2015-16, Business Combinations (Topic 805): Simplifying the Accounting for Measurement-Period Adjustments. The amendments in this accounting standard require that an acquirer recognize adjustments to provisional amounts that are identified during the measurement period in the reporting period in which the adjustment amounts are determined and record, in the same period, the effect on earnings of changes in depreciation, amortization, or other income effects, calculated as if the accounting had been completed at the acquisition date. These also require an entity to present separately on the face of the income statement or disclose in the notes the portion of the amount recorded in current-period earnings by line item that would have been recorded in previous reporting periods if the adjustment to the provisional amounts had been recognized as of the acquisition date. We adopted ASU 2015-16 in the quarter ended March 26, 2016 and adoption of this standard did not impact results of operations, retained earnings, or cash flows in the current or previous annual reporting periods.
In May 2015, the FASB issued ASU No. 2015-07, Fair Value Measurement - Disclosures for Investments in Certain Entities That Calculate Net Asset Value per Share (or Its Equivalent). This ASU removes the requirement to categorize investments within the fair value hierarchy for which fair value is measured using the net asset value (NAV) practical expedient. We adopted ASU 2015-07 in the quarter ended March 26, 2016 and adoption of this standard did not impact results of operations, retained earnings, or cash flows as the update relates to financial statement disclosures. See Note 29 - Fair Value Measurements.
In April 2015, the FASB issued ASU No. 2015-05, Intangibles – Goodwill and Other – Internal-Use Software: Customer’s Accounting for Fees Paid in a Cloud Computing Arrangement. This ASU provides criteria for customers in a cloud computing arrangement to use in order to determine whether the arrangement includes a license of software. We adopted ASU 2015-05 in the quarter ended March 26, 2016 and adoption of this standard did not impact results of operations, retained earnings, or cash flows in the current or previous annual reporting periods.
In January 2015, the FASB issued ASU No. 2015-01, Simplifying Income Statement Presentation by Eliminating the Concept of Extraordinary Items. The amendments in this accounting standard eliminate from GAAP the concept of extraordinary items. Prior to this standard, if an event or transaction met the criteria for extraordinary classification, an entity was required to segregate the extraordinary item from the results of ordinary operations and show the item separately in the income statement, net of tax, after income from continuing operations. We adopted ASU 2015-01 in the quarter ended March 26, 2016 and adoption of this standard did not impact results of operations, retained earnings, or cash flows in the current or previous annual reporting periods.
Recently Issued Accounting Standards – In January 2017, the FASB issued ASU No. 2017-04, Intangibles—Goodwill and Other (Topic 350): Simplifying the Test for Goodwill Impairment. To simplify the subsequent measurement of goodwill, the ASU eliminated Step 2 from the goodwill impairment test. In computing the implied fair value of goodwill under Step 2. Instead, under the amendments in this ASU, an entity should perform its annual, or interim, goodwill impairment test by comparing the fair value of a reporting unit with its carrying amount. The guidance will be effective for annual or any interim goodwill impairment tests in fiscal years beginning after December 15, 2019. Early adoption is permitted for interim or annual goodwill impairment tests performed on testing dates after January 1, 2017. The adoption of this guidance is not expected to have a material impact on our consolidated financial statements.
In January 2017, the FASB issued ASU No. 2017-01, Business Combinations (Topic 805): Clarifying the Definition of a Business. The amendments in this ASU provide a screen to determine when an integrated set of assets and activities is not a business. If the screen is not met, the amendments in this ASU (1) require that to be considered a business, a set must
F-13
include, at a minimum, an input and a substantive process that together significantly contribute to the ability to create output and (2) remove the evaluation of whether a market participant could replace missing elements. The amendments also narrow the definition of the term output so that the term is consistent with how outputs are described in Topic 606. The guidance will be effective for annual reporting periods beginning after December 15, 2017, and interim periods within those annual reporting periods. Early adoption is permitted in certain circumstances. The amendments should be applied prospectively on or after the effective date. We are currently evaluating the potential impact on our consolidated financial statements and disclosures.
In November 2016, the FASB issued ASU No. 2016-18, Statement of Cash Flows (Topic 230): Restricted Cash (a consensus of the FASB Emerging Issues Task Force). The standard require that a statement of cash flows explain the change during the period in the total of cash, cash equivalents, and amounts generally described as restricted cash or restricted cash equivalents. Amounts generally described as restricted cash and restricted cash equivalents should be included with cash and cash equivalents when reconciling the beginning-of-period and end-of-period total amounts shown on the statement of cash flows. The guidance will be effective for annual reporting periods beginning after December 15, 2017, and interim periods within those annual reporting periods. Early adoption is permitted, including adoption in an interim period. The amendments should be applied using a retrospective transition method to each period presented. We are currently evaluating the potential impact on our consolidated financial statements and disclosures.
In October 2016, the FASB issued ASU No. 2016-16, Income Taxes (Topic 740): Intra-Entity Transfers of Assets Other Than Inventory. The standard requires an entity to recognize the income tax consequences of an intra-entity transfer of an asset other than inventory when the transfer occurs. The amendments in this update eliminate the exception for an intra-entity transfer of an asset other than inventory. The amendments do not include new disclosure requirements; however, existing disclosure requirements might be applicable when accounting for the current and deferred income taxes for an intra-entity transfer of an asset other than inventory. The guidance will be effective for annual reporting periods beginning after December 15, 2017, including interim reporting periods within those annual reporting periods. Early adoption is permitted as of the beginning of an annual reporting period for which interim or annual financial statements have not been issued or made available for issuance. The amendments should be applied on a modified retrospective basis through a cumulative-effect adjustment directly to retained earnings as of the beginning of the period of adoption. We are currently evaluating the potential impact on our consolidated financial statements and disclosures.
In August 2016, the FASB issued ASU No. 2016-15, Statement of Cash Flows (Topic 230): Classification of Certain Cash Receipts and Cash Payments. This ASU addresses how cash receipts and cash payments are presented and classified in the statement of cash flows with regard to debt prepayment and debt extinguishment costs, zero-coupon debt instruments, contingent consideration payments, insurance settlement proceeds, equity method investees distributions, beneficial interests in securitization transactions, and separately identifiable cash flows. The guidance will be effective for the fiscal year beginning after December 15, 2017, including interim periods within those fiscal years, with early adoption permitted. We are currently evaluating the potential impact on our consolidated financial statements and disclosures.
In March 2016, the FASB issued ASU No. 2016-09, Stock Compensation, which is intended to simplify several aspects of the accounting for share-based payment awards to employees. The guidance will be effective for the fiscal year beginning after December 15, 2016, including interim periods within those fiscal years. Early adoption is permitted for any entity in any interim or annual period. If an entity early adopts the amendments in an interim period, any adjustments should be reflected as of the beginning of the fiscal year that includes that interim period. The adoption of this guidance is not expected to have a material impact on our consolidated financial statements.
In February 2016, the FASB issued ASU No. 2016-02, Leases (Topic 842). The standard requires lessees to recognize the assets and liabilities arising from leases on the balance sheet and retains a distinction between finance leases and operating leases. The classification criteria for distinguishing between finance leases and operating leases are substantially similar to the classification criteria for distinguishing between capital leases and operating leases in the previous lease guidance. The accounting standard is effective for annual periods beginning after December 15, 2018, including interim periods within those fiscal years, with early adoption permitted. We are currently assessing the impact, if any, the adoption of this standard will have on our consolidated financial statements and has not decided upon the method of adoption.
In January 2016, the FASB issued ASU No. 2016-01, Financial Instruments (Subtopic 825-10): Recognition and Measurement of Financial Assets and Financial Liabilities. This ASU enhances the reporting model for financial instruments to provide users of financial statements with more decision-useful information by requiring equity investments to be measured at fair value with changes in fair value recognized in net income. It simplifies the impairment assessment of equity investments without readily determinable fair values by requiring a qualitative assessment to identify impairment and eliminates the requirement to disclose the fair value of financial instruments measured at amortized cost for entities that are not public business entities. It also requires an entity to present separately in other comprehensive income the
F-14
portion of the total change in the fair value of a liability resulting from a change in the instrument-specific credit risk when the entity has elected to measure the liability at fair value in accordance with the fair value option for financial instruments and requires separate presentation of financial assets and financial liabilities by measurement category and form of financial asset on the balance sheet or the accompanying notes to the consolidated financial statements. The accounting standard is effective for annual periods beginning after December 15, 2017, including interim periods within those fiscal years, with early adoption permitted. We are currently evaluating the potential impact on our consolidated financial statements and disclosures.
In July 2015, the FASB issued ASU No. 2015-11, Simplifying the Measurement of Inventory. This ASU requires that inventory within the scope of this guidance be measured at the lower of cost and net realizable value. This accounting standard is effective for annual periods beginning after December 15, 2016, and interim periods thereafter, with early adoption permitted. We are currently evaluating the potential impact on our consolidated financial statements and disclosures. The adoption of this guidance is not expected to have a material impact on our consolidated financial statements.
In May 2014, the FASB issued ASU No. 2014-09, Revenue from Contracts with Customers. This ASU requires entities to recognize revenue in the way they expect to be entitled for the transfer of promised goods or services to customers. The ASU will replace most of the existing revenue recognition requirements in GAAP when it becomes effective. In March 2016, the FASB issued ASU No. 2016-08, Principal versus Agent Considerations (Reporting Revenue Gross versus Net). The amendments in this ASU clarify the implementation guidance on principal versus agent considerations. In December 2016, the FASB issued ASU No. 2016-20, Technical Corrections and Improvements to Topic 606, Revenue from Contracts with Customers. The amendments in this ASU narrow certain aspects of the guidance issued in Update 2014-09.
These standards are effective for fiscal years beginning after December 15, 2017, including interim periods within those fiscal years, which requires us to adopt the standard in fiscal year 2018. Early application in fiscal year 2017 is permitted. The updates permit the use of either the retrospective or cumulative effect transition method, with early application not permitted. We are assessing the impact, if any, the adoption of this standard will have on our consolidated financial statements and we have not decided upon the method of adoption.
With the exception of the new standards discussed above, there have been no other recent accounting pronouncements or changes in accounting pronouncements during the year ended December 31, 2016 that are of significance or potential significance to us.
Employee Retirement and Pension Benefits – We have a defined benefit plan available to certain U.S. hourly employees and several other defined benefit plans located outside of the U.S. that are country specific. The most significant of these plans is in the U.S. which is no longer open to new employees. Amounts relating to these plans are recorded based on actuarial calculations, which use various assumptions, such as discount rates and expected return on assets. See Note 32- Employee Retirement and Pension Benefits.
Note 2. Acquisitions
On August 30, 2016, we acquired all of the issued and outstanding shares of ARCPAC Building Products
Limited (“Breezway”). On February 1, 2016, we acquired all of the issued and outstanding shares of Trend Windows & Doors (“Trend”). We completed these two stock acquisitions for total consideration of approximately $85.9 million, net of cash acquired. The fair values of tangible assets acquired and liabilities assumed used in our evaluations were based upon preliminary calculations, allocations and valuations. The underlying estimates, allocations and assumptions for the acquisitions are subject to change as we obtain additional information and refine our assumptions during the measurement period (up to one year from the acquisition date). We evaluated these acquisitions quantitatively and qualitatively and determined them to be insignificant both individually and in the aggregate and therefore, have omitted the pro forma disclosures under ASC 805-10-50.
F-15
The preliminary fair values of the assets acquired are summarized below:
(amounts in thousands) | Total Acquisitions | ||
Fair value of identifiable assets and liabilities: | |||
Accounts receivable | $ | 16,497 | |
Inventories | 13,009 | ||
Other assets | 5,881 | ||
Property and equipment | 10,396 | ||
Identifiable intangible assets | 48,034 | ||
Goodwill | 15,935 | ||
Total assets | $ | 109,752 | |
Accounts payable and accrued liabilities | 7,930 | ||
Other liabilities | 15,956 | ||
Total liabilities | $ | 23,886 | |
Purchase Price: | |||
Total consideration, net of cash acquired | $ | 85,866 | |
The excess purchase price over the fair value of net assets acquired was allocated to goodwill and intangibles, respectively. Goodwill of $15.9 million is not expected to be fully tax-deductible. Goodwill represents cost savings from reduced overhead and operational expenses by leveraging our manufacturing footprint, supply chain savings and sales synergies. The intangible assets include technology, tradenames, trademarks, software, permits and customer relationships and are being amortized over a weighted average amortization period of 20 years. Acquisition-related costs of $1.3 million were expensed as incurred and are included in selling, general and administrative expense in our consolidated statements of operations. Measurement period adjustment reduced the preliminary allocation of goodwill and deferred tax liabilities by $5.9 million and $2.2 million respectively, and increased the preliminary allocation of intangible assets and property and equipment by $3.1 million and $1.5 million, respectively, with the remaining preliminary allocation changes related to other working capital accounts. The fair value of the current assets acquired includes trade receivables with a fair value of $16.5 million. The gross amount due is $17.3 million, of which $0.8 million is expected to be uncollectible.
During 2015, we completed four acquisitions using $88.6 million of cash and $2.0 million of JWH stock as consideration. The excess purchase price over the fair value of net assets acquired was allocated to goodwill and intangibles in the amounts of $38.0 million and $36.3 million, respectively. Goodwill of $28.1 million is expected to be fully tax-deductible. The intangible assets include technology, tradenames, trademarks, software, permits and customer relationships and are being amortized over a weighted average amortization period of 14 years. Acquisition-related costs of $1.8 million are included in selling, general and administrative expense in our consolidated statements of operations for 2015. Measurement period adjustments recorded in 2016 reduced the preliminary allocation of goodwill and deferred tax liabilities by $4.6 million and $0.6 million, respectively, and increased the preliminary allocation of deferred tax assets by $4.0 million.
Note 3. Discontinued Operations and Divestitures
Our discontinued operations consist primarily of our Silver Mountain resort and real estate located in Idaho and are included in our Corporate segment’s assets presented in the accompanying consolidated financial statements. The results of these operations have been removed from the results of continuing operations for all periods presented.
During 2014, we recorded a $3.4 million impairment charge based on a recent third party appraisal of the Silver Mountain property. During 2016, we further impaired Silver Mountain by an additional $2.2 million based on a signed sales agreement. On October 20, 2016, we sold the assets of Silver Mountain for $5.0 million in cash which was reduced by certain liabilities assumed by the buyer.
F-16
The results of discontinued operations including the gains on sale of discontinued operations are summarized as follows:
(amounts in thousands) | 2016 | 2015 | 2014 | ||||||||
Net revenues | $ | 7,593 | $ | 7,919 | $ | 8,591 | |||||
Loss before tax and non-controlling interest | (3,513 | ) | (2,853 | ) | (5,387 | ) | |||||
Loss from discontinued operations, net of tax | (3,324 | ) | (2,856 | ) | (5,387 | ) | |||||
The following is a summary of the assets and liabilities of discontinued operations separately presented in the consolidated balance sheets as of December 31, 2015. The current and long-term assets of discontinued operations are included within other current assets and other assets, respectively, in the accompanying consolidated balance sheets. The current and long-term liabilities of discontinued operations are included within accrued expenses and other current liabilities, and deferred credits and other liabilities, respectively, in the accompanying consolidated balance sheets. As of December 31, 2016, there are no remaining assets or liabilities of discontinued operations separately presented in the consolidated balance sheets.
(amounts in thousands) | 2015 | |||
ASSETS | ||||
Current assets | ||||
Accounts receivable, net | $ | 792 | ||
Inventories | 298 | |||
Real estate inventories | 532 | |||
Other current assets | 236 | |||
Current assets of discontinued operations | 1,858 | |||
Property and equipment, net | 3,669 | |||
Timber and timberlands | 614 | |||
Real estate development | 3,884 | |||
Intangible assets | 44 | |||
Other assets | 7 | |||
Long-term assets of discontinued operations | 8,218 | |||
$ | 10,076 | |||
LIABILITIES | ||||
Current liabilities | ||||
Accounts payable | $ | 732 | ||
Accrued payroll and benefits | 192 | |||
Accrued expenses | 1,608 | |||
Current liabilities of discontinued operations | 2,532 | |||
Deferred credits and other liabilities | 2,493 | |||
Long-term liabilities of discontinued operations | 2,493 | |||
$ | 5,025 | |||
Note 4. Accounts Receivable
The following is a roll forward of our allowance for doubtful accounts:
(amounts in thousands) | 2016 | 2015 | 2014 | ||||||||
Balance at beginning of period | $ | (3,664 | ) | $ | (4,166 | ) | $ | (6,338 | ) | ||
Acquisitions (Note 2) | (755 | ) | — | — | |||||||
Additions charged to expense | (410 | ) | (530 | ) | (567 | ) | |||||
Deductions | 1,057 | 1,180 | 2,474 | ||||||||
Currency translation | (67 | ) | (148 | ) | 265 | ||||||
Balance at end of period | $ | (3,839 | ) | $ | (3,664 | ) | $ | (4,166 | ) | ||
F-17
We sell our manufactured products to a large number of customers, primarily in the residential housing construction and remodel sectors, broadly dispersed across many domestic and foreign geographic regions. We perform ongoing credit evaluations of our customers to minimize credit risk and usually we do not require collateral for accounts receivable, but will require advance payment, guarantees, a security interest in the products sold to a customer, and/or letters of credit in certain situations. Customer accounts receivable converted to notes receivable are primarily collateralized by stock or other assets. One window and door customer represents 16.3% of net revenues in 2016, 15.2% of net revenues in 2015 and 16.6% of net revenues in 2014.
Note 5. Inventories
Inventories are stated at the lower of cost or market. Finished goods and work-in-process inventories include material, labor and manufacturing overhead costs.
(amounts in thousands) | 2016 | 2015 | |||||
Raw materials | $ | 233,730 | $ | 241,225 | |||
Work in process | 30,202 | 28,512 | |||||
Finished goods | 70,702 | 73,999 | |||||
Inventories | $ | 334,634 | $ | 343,736 | |||
Note 6. Other Current Assets
(amounts in thousands) | 2016 | 2015 | |||||
Prepaid assets | $ | 18,943 | $ | 18,463 | |||
Refundable income taxes | 4,294 | 6,999 | |||||
Fair value of derivative instruments | 6,309 | 6,957 | |||||
Other items | 558 | 1,049 | |||||
Current assets of discontinued operations (Note 3) | — | 1,858 | |||||
$ | 30,104 | $ | 35,326 | ||||
Note 7. Property and Equipment, Net
(amounts in thousands) | 2016 | 2015 | |||||
Land improvements | $ | 32,458 | $ | 32,705 | |||
Buildings | 435,577 | 420,355 | |||||
Machinery and equipment | 1,158,232 | 1,134,694 | |||||
Total depreciable assets | 1,626,267 | 1,587,754 | |||||
Accumulated depreciation | (1,008,031 | ) | (979,511 | ) | |||
618,236 | 608,243 | ||||||
Land | 60,500 | 60,266 | |||||
Construction in progress | 25,915 | 52,334 | |||||
$ | 704,651 | $ | 720,843 | ||||
We monitor all property, plant and equipment for any indicators of potential impairment. Impairment charges of $3.0 million, $2.7 million and $6.2 million on property, plant and equipment were recorded during the years ended December 31, 2016, 2015 and 2014, respectively.
The effect on our carrying value of property and equipment due to currency translations for foreign assets was a decrease of $9.9 million and $29.7 million for the years ended December 31, 2016 and 2015, respectively.
Depreciation expense was $86.4 million, $82.2 million and $89.0 million for the years ended December 31, 2016, 2015 and 2014, respectively.
F-18
Depreciation expense was recorded as follows:
(amounts in thousands) | 2016 | 2015 | 2014 | ||||||||
Cost of sales | $ | 78,608 | $ | 73,913 | $ | 78,890 | |||||
Selling, general and administrative | 7,839 | 8,264 | 10,148 | ||||||||
$ | 86,447 | $ | 82,177 | $ | 89,038 | ||||||
Note 8. Goodwill
The following table summarizes the changes in goodwill by reportable segment:
(amounts in thousands) | North America | Europe | Australasia | Total Reportable Segments | |||||||||||
Ending balance, December 31, 2014 | $ | 153,890 | $ | 265,233 | $ | 56,478 | $ | 475,601 | |||||||
Acquisitions | 34,369 | 3,228 | 4,386 | 41,983 | |||||||||||
Currency translation | (1,157 | ) | (28,274 | ) | (5,647 | ) | (35,078 | ) | |||||||
Ending balance, December 31, 2015 | $ | 187,102 | $ | 240,187 | $ | 55,217 | $ | 482,506 | |||||||
Acquisitions | — | — | 15,935 | 15,935 | |||||||||||
Acquisition remeasurements | — | (4,005 | ) | (643 | ) | (4,648 | ) | ||||||||
Currency translation | 274 | (7,070 | ) | (942 | ) | (7,738 | ) | ||||||||
Ending balance, December 31, 2016 | $ | 187,376 | $ | 229,112 | $ | 69,567 | $ | 486,055 | |||||||
We have recorded impairments in prior periods related to the divestiture of certain operations. Cumulative impairments of goodwill totaled $1.6 million at both December 31, 2016 and 2015.
During the year ended December 31, 2016, we elected to transfer acquired intangible property, and we determined a valuation allowance was no longer required on acquired deferred tax assets during the measurement period of prior year acquisitions. The transfer of intangible property resulted in a reversal of acquired deferred tax liabilities of $0.7 million and the release of the valuation allowance resulted in an additional $4.0 million of deferred tax assets originally recorded at the time of acquisition and is included in the “Acquisitions remeasurement” line in the table above. The remeasurement of the deferred tax asset was calculated at the translation rate during the period the valuation allowance was released. Measurement period adjustments related to current year acquisitions are included in the “Acquisitions” line above. See Note 2- Acquisitions.
During the fourth quarter of 2015, we concluded that our Creative Media Development (“CMD”) business unit, our internal advertising agency, should be merged into our North American reporting unit. Immediately prior to this change, we tested CMD goodwill of $4.3 million for impairment using a qualitative assessment, and we concluded it was more likely than not that the fair value was more than its carrying value and therefore did not perform the two-step quantitative analysis.
In accordance with current accounting guidance, we identified three reporting units for the purpose of conducting our goodwill impairment review. In determining our reporting units, we considered (i) whether an operating segment or a component of an operating segment was a business, (ii) whether discrete financial information was available, and (iii) whether the financial information is regularly reviewed by management of the operating segment. We performed our annual impairment assessment during the beginning of the December fiscal month of 2016. The excess of the fair value of our reporting units over their respective carrying values for the three reporting units exceeded 43%. No impairment loss was recorded in 2016 or 2015.
F-19
Note 9. Intangible Assets, Net
Changes in the carrying amount of intangible assets were as follows for the periods indicated:
(amounts in thousands) | 2016 | 2015 | |||||
Balance at beginning of period | $ | 78,318 | $ | 48,293 | |||
Acquisitions | 48,034 | 36,284 | |||||
Additions | 5,357 | 5,160 | |||||
Amortization | (11,528 | ) | (7,860 | ) | |||
Currency translation | (2,386 | ) | (3,559 | ) | |||
Balance at end of period | $ | 117,795 | $ | 78,318 | |||
The cost and accumulated amortization values of our intangible assets were as follows for the periods indicated:
(amounts in thousands) | 2016 | 2015 | |||||
Trademarks and trade names | $ | 28,709 | $ | 14,042 | |||
Software | 24,397 | 23,430 | |||||
Patents, licenses and rights | 38,217 | 7,498 | |||||
Customer relationships and agreements | 69,739 | 69,434 | |||||
Total amortizable intangibles | $ | 161,062 | $ | 114,404 | |||
Accumulated amortization | (45,767 | ) | (38,586 | ) | |||
$ | 115,295 | $ | 75,818 | ||||
Indefinite-lived intangibles | 2,500 | 2,500 | |||||
$ | 117,795 | $ | 78,318 | ||||
Intangible assets are removed from the accounts in the period that they become fully amortized.
Amortization expense was $11.5 million, $7.9 million and $8.3 million for the years ended December 31, 2016, 2015 and 2014, respectively. Certain customer supply agreement intangibles are amortized as a deduction from net revenues; however, there were none in 2016 and these amounts were immaterial in 2015 and 2014.
Estimated future amortization expense (amounts in thousands):
2017 | $ | 10,146 | |
2018 | 10,027 | ||
2019 | 9,264 | ||
2020 | 8,427 | ||
2021 | 7,909 | ||
Thereafter | 69,522 | ||
$ | 115,295 | ||
F-20
Note 10. Other Assets
(amounts in thousands) | 2016 | 2015 | |||||
Investments (Note 11) | $ | 28,949 | $ | 26,204 | |||
Customer displays | 11,886 | 14,952 | |||||
Other | 9,060 | 1,777 | |||||
Long-term notes receivable (Note 12) | 6,346 | 6,229 | |||||
Deposits | 3,784 | 3,391 | |||||
Debt issuance costs | 1,910 | 2,594 | |||||
Other long-term accounts receivable | 1,085 | 1,225 | |||||
Long-term assets of discontinued operations (Note 3) | — | 8,218 | |||||
$ | 63,020 | $ | 64,590 | ||||
Domestic debt issuance costs associated with revolving credit facilities are capitalized and amortized according to the effective interest rate method over the life of the new debt agreements. Non-cash additions are disclosed in Note 35- Supplemental Cash Flow Information. Customer displays are amortized over the life of the product line and $8.9 million, $5.1 million and $2.7 million of amortization is included in total depreciation and amortization in SG&A expense for the years ended December 31, 2016, 2015 and 2014, respectively. Costs associated with our initial public offering ("IPO") of $5.6 million are included in the "other" line above and will be subsequently charged to equity upon completion of the IPO.
Note 11. Investments
As of December 31, 2016, our investments consist of one 50% owned investment accounted for under the equity method and ten investments accounted for under the cost method. Our investment in West One Auto Group (“WOAG”) was included as an equity method investment as of December 31, 2014 and during fiscal year 2015 was fully impaired.
A summary of our equity and cost method investments, which are included in other assets in the accompanying consolidated balance sheets, is as follows:
(amounts in thousands) | Equity | Cost | Total | ||||||||
Ending balance, December 31, 2014 | $ | 23,852 | $ | 113 | $ | 23,965 | |||||
Equity earnings | 2,384 | — | 2,384 | ||||||||
Additions | — | 257 | 257 | ||||||||
Impairments | (332 | ) | — | (332 | ) | ||||||
Other | (70 | ) | — | (70 | ) | ||||||
Ending balance, December 31, 2015 | $ | 25,834 | $ | 370 | $ | 26,204 | |||||
Equity earnings | 3,264 | — | 3,264 | ||||||||
Other | (519 | ) | — | (519 | ) | ||||||
Ending balance, December 31, 2016 | $ | 28,579 | $ | 370 | $ | 28,949 | |||||
Net loans and advances to affiliates at | |||||||||||
December 31, 2015 | $ | 341 | $ | 3,768 | $ | 4,109 | |||||
December 31, 2016 | $ | 745 | $ | 3,768 | $ | 4,513 | |||||
F-21
The combined financial position and results of operations for the equity method investments owned as of December 31, 2016 are summarized below:
(amounts in thousands) | 2016 | 2015 | |||||
Assets | |||||||
Current assets | $ | 92,337 | $ | 85,726 | |||
Non-current assets | 21,079 | 20,606 | |||||
Total assets | $ | 113,416 | $ | 106,332 | |||
Liabilities | |||||||
Current liabilities | $ | 18,722 | $ | 18,452 | |||
Non-current liabilities | 37,499 | 36,608 | |||||
Total liabilities | 56,221 | 55,060 | |||||
Net worth | $ | 57,195 | $ | 51,272 | |||
(amounts in thousands) | 2016 | 2015 | 2014 | ||||||||
Net sales | $ | 314,036 | $ | 361,013 | $ | 342,030 | |||||
Gross profit | 66,417 | 82,914 | 71,267 | ||||||||
Net income (loss) | 6,696 | 4,628 | (137 | ) | |||||||
Adjustment for profit in inventory | (84 | ) | (70 | ) | (378 | ) | |||||
Net income (loss) attributable to Company | 3,264 | 2,384 | (447 | ) | |||||||
Goodwill of $0.2 million is included in equity investments and is reviewed for impairment if evidence of loss in value occurs in accordance with FASB guidance regarding The Equity Method of Accounting for Investments in Common Stock. Sales to affiliates totaled $61.7 million in 2016, $54.8 million in 2015 and $53.6 million in 2014 and purchases from affiliates totaled $3.5 million, $2.4 million and $1.5 million for 2016, 2015 and 2014, respectively.
No impairments were recorded during fiscal year 2016. We recorded impairments of $0.3 million and $0.4 million in the years ended December 31, 2015 and 2014, respectively, relating to our investment in WOAG due to the slow economic recovery in the Pacific Northwest and WOAG’s financing limitations.
Note 12. Notes Receivable
(amounts in thousands) | 2016 Year-End Interest Rate | 2016 | 2015 | ||||||
Employee demand notes secured by Company stock | 5.75% | $ | 238 | $ | 286 | ||||
Installment notes | 0.00 - 14.00% | 2,865 | 2,444 | ||||||
Affiliate notes | 0.00 - 8.75% | 3,768 | 3,768 | ||||||
Accrued interest | 24 | 10 | |||||||
Allowance for doubtful notes | (353 | ) | (69 | ) | |||||
6,542 | 6,439 | ||||||||
Current maturities and interest, net of short-term allowance | (196 | ) | (210 | ) | |||||
Long-term notes receivable, net of allowance | $ | 6,346 | $ | 6,229 | |||||
Current maturities and interest, net of short-term allowance and long term notes receivable and interest, net of allowance, are reported as other current assets and other assets, respectively, in the accompanying consolidated balance sheets.
Affiliate Notes – These notes consist of $3.8 million of senior secured notes from Chileno Bay, a cost method investment. During 2015 we fully impaired other affiliate notes in the amount of $1.0 million. We did not accrue interest on affiliate notes in 2016, 2015 or 2014.
Allowance for Doubtful Notes – The allowance for doubtful notes is based upon historical loss trends and specific reviews of delinquent notes.
F-22
Note 13. Accrued Payroll and Benefits
(amounts in thousands) | 2016 | 2015 | |||||
Accrued vacation | $ | 51,867 | $ | 46,666 | |||
Accrued management bonus | 31,243 | 30,865 | |||||
Other accrued benefits | 17,263 | 18,031 | |||||
Accrued payroll taxes | 15,338 | 13,864 | |||||
Accrued payroll and commissions | 14,091 | 11,196 | |||||
Current portion of unfunded pension liability | 714 | 10,036 | |||||
Accrued Company match of employee 401(k) contributions | 152 | 8,963 | |||||
$ | 130,668 | $ | 139,621 | ||||
During 2016, we changed our match of employee 401(k) contributions from an annual matching contribution to a monthly matching contribution, resulting in a reduction of the December 31, 2016 accrual.
Note 14. Accrued Expenses and Other Current Liabilities
(amounts in thousands) | 2016 | 2015 | |||||
Accrued sales and advertising rebates | $ | 70,862 | $ | 69,300 | |||
Accrued expenses | 44,721 | 32,281 | |||||
Current portion of warranty liability (Note 16) | 18,240 | 16,802 | |||||
Accrued claim costs relating to self-insurance programs | 11,965 | 10,333 | |||||
Current portion of deferred income | 11,644 | 9,315 | |||||
Current portion of derivative liability (Note 28) | 9,741 | 4,734 | |||||
Income taxes payable | 4,609 | 12,806 | |||||
Current portion of restructuring accrual (Note 25) | 1,467 | 6,192 | |||||
Accrued interest payable | 272 | 249 | |||||
Current liabilities of discontinued operations (Note 3) | — | 2,532 | |||||
$ | 173,521 | $ | 164,544 | ||||
Note 15. Notes Payable
(amounts in thousands) | 2016 Year-End Interest Rate | 2016 | 2015 | ||||||
Variable rate industrial revenue bonds | 0.78% - 0.89% | $ | 205 | $ | 385 | ||||
$ | 205 | $ | 385 | ||||||
Variable rate industrial revenue bonds are payable in quarterly installments that include both principal and interest. These bonds are collateralized by letters of credit and the related manufacturing and distribution properties.
Notes payable are included in notes payable and current maturities of long-term debt in the accompanying consolidated balance sheets.
F-23
Note 16. Warranty Liability
An analysis of our warranty liability is as follows:
(amounts in thousands) | 2016 | 2015 | 2014 | ||||||||
Balance at beginning of period | $ | 44,891 | $ | 45,843 | $ | 46,064 | |||||
Current period expense | 17,992 | 16,838 | 17,162 | ||||||||
Liabilities assumed due to acquisition | — | 718 | — | ||||||||
Experience adjustments | (3,846 | ) | (2,668 | ) | (2,789 | ) | |||||
Payments | (13,527 | ) | (14,172 | ) | (13,515 | ) | |||||
Currency translation | (112 | ) | (1,668 | ) | (1,079 | ) | |||||
Balance at end of period | 45,398 | 44,891 | 45,843 | ||||||||
Current portion | (18,240 | ) | (16,802 | ) | (16,467 | ) | |||||
Long-term portion | $ | 27,158 | $ | 28,089 | $ | 29,376 | |||||
We previously revised the rollforward of our warranty liability to correct an error in the presentation of expenses incurred, experience adjustments, and expenses paid in the same period.
This correction resulted in:
• | an increase to the “Current period expense” of $4.9 million and $6.8 million in 2015 and 2014, respectively; |
• | an increase to the “Experience adjustments” of $2.9 million in 2015; and |
• | an increase to the “Payments” of $2.0 million and $6.8 million in 2015 and 2014, respectively. |
These corrections were not material to the periods presented or the prior consolidated financial statements.
The most significant component of warranty liability is in the North America segment which totaled $40.9 million and $42.5 million at December 31, 2016 and 2015, respectively, after discounting future estimated cash flows at rates between 0.76% and 4.75%. Without discounting, the liability would have been higher by approximately $2.7 million and $3.0 million at December 31, 2016 and 2015, respectively. During the second quarter of 2016, we recorded an out-of-period correction of an error to increase our warranty reserve by approximately $2.5 million. This correction was not material to our accompanying consolidated financial statements or to our previously issued financial statements. The current and long-term portions of the warranty liability are included in accrued expenses and other current liabilities, and deferred credits and other liabilities, respectively, in the accompanying consolidated balance sheets.
F-24
Note 17. Long-Term Debt
(amounts in thousands) | December 31, 2016 Interest Rate | December 31, 2016 | December 31, 2015 | ||||||
Revolving credit facility | 2.95% | $ | 742 | $ | 876 | ||||
Term loan, net of original discount of $8,086 | 4.75% | 1,603,551 | 1,237,409 | ||||||
Mortgage notes | 1.10% | 29,505 | 30,335 | ||||||
Installment notes | 2.08% - 6.38% | 5,880 | 4,537 | ||||||
Installment notes for stock | 3.00% - 8.00% | 3,260 | 5,034 | ||||||
Unamortized debt issuance costs | (23,108 | ) | (18,256 | ) | |||||
1,619,830 | 1,259,935 | ||||||||
Current maturities of long-term debt | (19,826 | ) | (16,209 | ) | |||||
$ | 1,600,004 | $ | 1,243,726 | ||||||
Maturities by year: | ||||
2017 | $ | 19,826 | ||
2018 | 19,764 | |||
2019 | 19,883 | |||
2020 | 18,697 | |||
2021 | 17,901 | |||
Thereafter | 1,531,845 | |||
1,627,916 | ||||
Original issue discount | (8,086 | ) | ||
$ | 1,619,830 | |||
On November 1, 2016 we increased borrowings under our existing term loan credit facility and amended certain of its terms. We borrowed an incremental $375.0 million and refinanced the previously outstanding $1,236.6 million for a consolidated total of $1,611.6 million. The proceeds from the incremental term loan borrowing, along with cash on hand and/or borrowings on our revolving credit facility, were used to fund a distribution to shareholders and holders of equity awards (See Note 21- Convertible Preferred Shares). We incurred $8.1 million of debt issuance costs related to the new credit facility.
In July 2015, we amended our $775.0 million term loan credit facility and we received an additional $480.0 million in long-term borrowings. Proceeds from the incremental term loan debt were primarily used to pay distributions to our shareholders, with the balance used for acquisitions and general corporate purposes. We incurred $7.9 million of debt issuance costs related to the new credit facility.
In January 2015, we entered into a new EUR €39.0 million committed revolving credit facility in Europe that matures in January of 2019. The revolving credit facility bears interest at the relevant interbank offered rate (“IBOR”) plus a margin of 2.50%. The agreement requires that we maintain certain financial ratios, including an interest coverage ratio and a leverage ratio. We incurred $1.1 million of debt issuance costs related to the new credit facility.
Summaries of our outstanding debt agreements as of December 31, 2016 is as follows:
Revolving Credit Facilities
ABL Facility – Borrowings under our Revolver typically bear interest at LIBOR plus a margin in a range of 1.50% to 2.00% depending on availability under the facility. We must pay an annual commitment fee between 0.25% and 0.375% on the unused portion of the revolving commitment. The Revolver has no maintenance financial covenants unless we fail to meet certain liquidity metrics as defined in the Revolver agreement. The Revolver matures in 2019. At December 31, 2016, there were no borrowings and we had $226.9 million available under this facility.
Euro Revolving Facility – Loans under the Euro Revolving Facility bear interest at the relevant interbank offered rate (“IBOR”) plus a margin of 2.5%, and a commitment fee of 1% is also paid on the entire amount of the revolving credit
F-25
facility calculated on a day-to-day basis. The Euro Revolving Facility requires JELD-WEN A/S to maintain certain financial ratios and has various non-financial covenants including restrictions on liens, indebtedness, and dividends, customary representations and warranties, and customary events of default and remedies. At December 31, 2016, we had $0.7 million in borrowings and $39.3 million available under this facility and were in compliance with the terms of the Euro Revolving Facility.
Australia Senior Secured Credit Facility – In September 2016, JELD-WEN of Australia Pty. Ltd. (“JWA”) amended and extended its credit agreement to provide for an AUD $18.0 million floating rate revolving loan facility, an AUD $5.0 million overdraft line of credit, and an AUD $8.0 million interchangeable facility for guarantees/letters of credit. The credit agreement matures in June 2019. Loans under the revolving loan facility bear interest at the Bank Bill Swap Bid rate (“BBSY”) plus a margin of 0.75%, and a commitment fee of 1.15% is also paid on the entire amount of the revolving credit facility. Overdraft balances bear interest at the bank’s reference rate minus a margin of 1.00%, and a commitment fee of 1.15% is paid on the entire amount of the overdraft facility. The credit facility is secured by guarantees of the subsidiaries of JWA, fixed and floating charges on the assets of the JWA group, and mortgages on certain real properties owned by the JWA group. The agreement requires that JWA maintain certain financial ratios, including a minimum consolidated interest coverage ratio and a maximum consolidated debt to EBITDA ratio. The agreement limits dividends and repayments of intercompany loans where the JWA group is the borrower and limits acquisitions without the bank’s consent. At December 31, 2016, there were no borrowings or overdrafts and we had $13.0 million available under this facility.
Term Loan –The offering price of the $375.0 million incremental term loan was 99.75% of par. Amendments to the term loan facility included revised interest rates and a new maturity date for all outstanding loans of July 1, 2022. Borrowings under the amended term loans currently bear interest at LIBOR (subject to a floor of 1.00%) plus a margin of up to 3.75%, depending on our net leverage ratio, and requires quarterly principal repayment beginning in March 2017 with a balloon payment of $1,523.0 million due on maturity. As of December 31, 2016, we have remaining debt issuance costs of $23.1 million included as an offset to long-term debt in the accompanying consolidated balance sheets which are amortized to interest expense over the life of the facility using the effective interest method.
Mortgage Note – This note is secured by land and buildings and has scheduled principal payments beginning in 2018 through 2037.
Installment Notes – These notes represent miscellaneous capitalized equipment lease obligations and a term loan secured by the related equipment with payments through 2022.
Installment Notes for Stock – These notes represent amounts due to former or retired employees for repurchases of JWH stock that are payable over 5 or 10 years depending on the amount with payments through 2020.
Collateral For Long-Term Debt – At December 31, 2016, substantially all our assets provide direct or indirect collateral for substantially all outstanding short-term and long-term debt.
The debt agreements contain customary restrictions on liens, indebtedness, acquisitions, and dividends. As of December 31, 2016 and 2015, we were in compliance with the terms of all facilities.
Because interest rates on certain debt agreements have variable interest rates, we have entered into interest rate swap agreements with financial institutions to manage the exposure to changes in interest rates. See Note 28- Derivative Financial Instruments.
F-26
Note 18. Deferred Credits and Other Liabilities
Included in deferred credits and other liabilities is the long-term portion of the following liabilities:
(amounts in thousands) | 2016 | 2015 | |||||
Warranty liability (Note 16) | $ | 27,158 | $ | 28,089 | |||
Workers' compensation claims accrual | 13,966 | 15,005 | |||||
Uncertain tax positions (Note 19) | 12,054 | 11,634 | |||||
Other liabilities | 10,508 | 7,699 | |||||
Derivative liability LT | 3,878 | 5,895 | |||||
Restructuring accrual | 3,552 | 2,316 | |||||
Over-market lease liabilities | 2,830 | 4,433 | |||||
Deferred income | 509 | 1,250 | |||||
Long-term liabilities of discontinued operations (Note 3) | — | 2,493 | |||||
$ | 74,455 | $ | 78,814 | ||||
The over-market lease liabilities relate to our Melton operations in the United Kingdom ("U.K") and the related market value lease payments are included in the minimum annual lease payments schedule. The non-cash impact to expense of the change in the lease liability for the discount factor is reported in other income (expense) in the consolidated statements of operations and totaled $0.5 million in both 2016 and 2015 and $0.6 million in 2014.
Note 19. Income Taxes
Income (loss) before taxes, equity earnings (loss) and discontinued operations was comprised of the following:
(amounts in thousands) | 2016 | 2015 | 2014 | ||||||||
Domestic income (loss) | $ | 25,042 | $ | 24,146 | $ | (125,638 | ) | ||||
Foreign income | 106,933 | 61,809 | 66,305 | ||||||||
$ | 131,975 | $ | 85,955 | $ | (59,333 | ) | |||||
Our foreign income is primarily driven by our subsidiaries in Australia and the U.K. The statutory tax rates are 30% and 20% respectively.
Significant components of the provision for income taxes are as follows:
(amounts in thousands) | 2016 | 2015 | 2014 | ||||||||
Federal | $ | 1,015 | $ | (14,124 | ) | $ | (4,210 | ) | |||
State | 72 | 731 | 299 | ||||||||
Foreign | 20,338 | 28,289 | 22,013 | ||||||||
Current taxes | 21,425 | 14,896 | 18,102 | ||||||||
Federal | (151,077 | ) | (3,508 | ) | (323 | ) | |||||
State | (72,791 | ) | (290 | ) | (32 | ) | |||||
Foreign | (23,153 | ) | (16,533 | ) | 1,195 | ||||||
Deferred taxes | (247,021 | ) | (20,331 | ) | 840 | ||||||
Income tax (benefit) provision for continuing operations | (225,596 | ) | (5,435 | ) | 18,942 | ||||||
Income tax provision for discontinued operations | — | — | — | ||||||||
Total (benefit) provision for income taxes | $ | (225,596 | ) | $ | (5,435 | ) | $ | 18,942 | |||
The significant components of the deferred income tax benefit attributed to income from continuing operations for the year ended December 31, 2016, were the decrease in the valuation allowances for deferred tax assets, primarily in the U.S. and U.K. The significant component of the deferred income tax benefit for the year ended December 31, 2015, is the decrease in the valuation for our subsidiaries in France and Malaysia.
F-27
Reconciliation of the U.S. federal statutory income tax rate to our effective tax rate is as follows:
2016 | 2015 | 2014 | |||||||||||||||
(amounts in thousands) | Amount | % | Amount | % | Amount | % | |||||||||||
Statutory rate | $ | 46,191 | 35.0 | $ | 30,085 | 35.0 | $ | (20,767 | ) | 35.0 | |||||||
State income tax, net of federal benefit | 221 | 0.2 | 3,397 | 4.0 | (3,173 | ) | 5.3 | ||||||||||
Nontaxable income | — | — | — | — | (9,424 | ) | 15.9 | ||||||||||
Nondeductible expenses | 1,437 | 1.1 | 6,064 | 7.1 | 11,499 | (19.4) | |||||||||||
Equity based compensation | 6,162 | 4.7 | — | — | — | — | |||||||||||
Deferred benefit on acquisitions | — | — | (2,919 | ) | (3.4) | — | — | ||||||||||
Foreign tax rate differential | (12,346 | ) | (9.4) | (7,225 | ) | (8.4) | (8,307 | ) | 14.0 | ||||||||
Tax rate differences and credits | 382 | 0.3 | 698 | 0.7 | (4,802 | ) | 8.1 | ||||||||||
Uncertain tax positions | 406 | 0.3 | 11,634 | 13.5 | — | — | |||||||||||
Foreign source dividends | 1,992 | 1.5 | 5,193 | 6.0 | 1,528 | (2.6) | |||||||||||
Valuation allowance | (271,169 | ) | (205.5) | (41,196 | ) | (47.9) | 48,091 | (81.1) | |||||||||
IRS audit adjustments | 112 | 0.1 | (13,079 | ) | (15.2) | (4,826 | ) | 8.2 | |||||||||
Prior year correction | (1,392 | ) | (1.0) | (2,094 | ) | (2.4) | — | — | |||||||||
Other | 2,408 | 1.8 | 4,007 | 4.7 | 9,123 | (15.3) | |||||||||||
Effective rate for continuing operations | $ | (225,596 | ) | (170.9) | $ | (5,435 | ) | (6.3) | $ | 18,942 | (31.9) | ||||||
Effective rate including discontinued operations | $ | (225,596 | ) | (175.6) | $ | (5,435 | ) | (6.4) | $ | 18,942 | (28.3) | ||||||
Certain items in the table above have been reclassified to conform to the current year's presentation.
We recorded a tax charge of $0.1 million, and a benefit of $13.1 million and $4.8 million in 2016, 2015 and 2014, respectively, as a result of favorable audit settlements in the U.S., which allowed the use of tax attributes that previously had a valuation allowance reserve. During the fourth quarter of 2016, we recorded an out-of-period correction to previously overstated international deferred tax asset balances which resulted in a benefit of $2.9 million, $1.4 million of which is shown above on the line "prior year correction" and the remaining amount of which is within the "valuation allowance" line item in the reconciliation of tax expense above. This correction was determined not material to the current or prior period. During 2015, we recorded an out of period correction to an income tax payable account which resulted in a benefit of $2.1 million. This correction was not material to 2015 or prior periods.
F-28
Deferred income taxes are provided for the temporary differences between the financial reporting basis and tax basis of our assets, liabilities and operating loss carryforwards. Significant deferred tax assets and liabilities are as follows:
(amounts in thousands) | 2016 | 2015 | |||||
Allowance for doubtful accounts and notes receivable | $ | 4,807 | $ | 1,122 | |||
Employee benefits and compensation | 73,474 | 70,895 | |||||
Net operating loss and tax credit carryforwards | 284,822 | 319,195 | |||||
Inventory | 1,955 | — | |||||
Deferred credits | 865 | 10,523 | |||||
Accrued liabilities and other | 17,233 | 17,653 | |||||
Gross deferred tax assets | 383,156 | 419,388 | |||||
Valuation allowance | (40,118 | ) | (318,480 | ) | |||
Deferred tax assets | 343,038 | 100,908 | |||||
Depreciation and amortization | (77,238 | ) | (88,439 | ) | |||
Investments and marketable securities | (6,021 | ) | (3,225 | ) | |||
Inventory | — | (2,018 | ) | ||||
Other | — | (976 | ) | ||||
Deferred tax liabilities | (83,259 | ) | (94,658 | ) | |||
Net deferred tax asset (liability) | $ | 259,779 | $ | 6,250 | |||
Balance sheet presentation: | |||||||
Long-term asset | $ | 268,965 | $ | 21,698 | |||
Long-term liability | (9,186 | ) | (15,448 | ) | |||
Net deferred tax asset (liability) | $ | 259,779 | $ | 6,250 | |||
Impact of Divestitures and Acquisitions – As discussed in Note 2 – Acquisitions, we completed two acquisitions in fiscal 2016 and four acquisitions in fiscal 2015 that had an immaterial impact on our income tax assets and liabilities. As discussed in Note 3 - Discontinued Operations and Divestitures, we sold the assets of our Silver Mountain resort and real estate development in Idaho, which closed on October 20, 2016. The sale and resulting reversal of the Silver Mountain deferred tax assets and liabilities generated a $24.3 million tax loss in 2016. The tax loss was mainly a result of assets that had been previously impaired for book purposes and fixed assets with remaining tax basis in excess of book basis.
Valuation Allowance – The realization of deferred tax assets is based on historical tax positions and estimates of future taxable income. We evaluate both the positive and negative evidence that we believe is relevant in assessing whether we will realize the deferred tax assets. A valuation allowance is recorded when it is more likely than not that some portion of the deferred tax assets will not be realized.
Our valuation allowance was $40.1 million as of December 31, 2016, which represents a decrease of $278.4 million from December 31, 2015 and was allocated to continuing operations. The decrease was primarily the result of (i) the release of $236.5 million of valuation allowances associated with net operating loss ("NOL") carryforwards primarily for our U.S. subsidiaries as we concluded at December 31, 2016 that it was more likely than not that the deferred tax assets will be realized based on our forecasted earnings , (ii) the release of $40.2 of valuation allowance (inclusive of $8.4 million reduction to deferred tax assets related to prior years) associated primarily with the NOL's of our U.K. subsidiary based on anticipated earnings arising from the changes in the manner in which we manage our capacity and distribution in Europe, (iii) the establishment of a valuation allowance for our St. Maarten subsidiary of $0.8 million (iv) the release through goodwill of a valuation allowance for two of our Dooria foreign subsidiaries in Norway of $4.2 million, (v) the release of a valuation allowance attributed to certain tax credit for our Mexican subsidiaries of $0.2 million (vi) the partial release of a valuation allowance attributed to capital loss carry-forwards of our Australian subsidiary, and (vi) changes to existing valuations for changes in current year earnings for our subsidiaries in Peru, Canada, New Zealand and the U.K.
The ultimate realization of deferred tax assets depends on the generation of future taxable income during the periods in which those temporary differences are deductible. We consider the scheduled reversal of deferred tax liabilities (including the effect of available carryback and carryforward periods), and projected taxable income in making this assessment. In order to fully utilize the NOL and tax credits carryforwards we will need to generate sufficient future taxable income before the expiration of the deferred tax assets governed by the applicable tax code. Since early 2014, we have changed our business strategy to focus on lean manufacturing and productivity increases at the plant level. We had our first profitable
F-29
quarter in the second half of 2014 after a period of sustained losses. We refinanced our debt from a rate of 12% down to 5% in the fourth quarter of 2014 which resulted in significant savings. As a result, our improved profitability trend has continued through 2016. Due to the magnitude of previous losses, sustained profitability was necessary to support the release of the valuation allowance. Management has forecasted continued positive results, thus creating an expectation of taxable income for the foreseeable future.
At December 2015, our valuation allowance was $318.5 million. During 2015, we released valuation allowances associated with NOL carryforwards for certain of our foreign subsidiaries as it was more likely than not that the deferred tax assets would be realized at December 31, 2015. As a result, we had a deferred tax asset in France at December 31, 2015 of $16.1 million for which we have not provided a valuation allowance due to an indefinite carryforward period. We expect to utilize the deferred tax asset in France over a period of 25 years. Further, the dissolution of JELD-WEN Polska, Sp. z.o.o. and the merger of JELD-WEN of Europe, BV and JELD-WEN A/S, has resulted in the elimination of the deferred tax assets of these entities and the related valuation allowances. As of December 31, 2015, valuation allowances have primarily been provided on operating losses and basis differences of JELD-WEN of Canada, Ltd., JELD-WEN UK, Ltd., RJAC, Ltd., JELD-WEN Australia Pty, Ltd., Dooria Norge AS, and Dooria AS, as well as U.S. Federal and state deferred taxes exclusive of indefinite lived assets, in the amounts of $2.3 million, $41.4 million, $0.9 million, $6.2 million, $3.3 million, $0.9 million, $214.0 million and $49.2 million, respectively.
The remaining valuation allowances are provided for other subsidiary NOL's and credits, and other deferred tax assets, since their realization is dependent on the likelihood of these subsidiaries generating future taxable income of the appropriate character. Given our current earnings and anticipated future earnings, we believe that there is a realistic possibility that within the next twelve months, sufficient positive evidence may become available to allow us to reach a conclusion that a significant portion of our valuation allowance will no longer be needed. The potential release of the valuation allowance is dependent on our ability to achieve sustained profitable operations from continued execution of our operating strategy. Release of the valuation allowance would result in the recognition of certain deferred tax assets and a decrease in the provision for income taxes for the period the release is recorded. Therefore, the exact timing and amount of the valuation allowance release and the ultimate impact on our financial statements are subject to change on the basis of the level of profitability we are able to actually achieve.
The following is the activity in our valuation allowance for the year ended December 31, 2016, 2015 and 2014, respectively:
(amounts in thousands) | 2016 | 2015 | 2014 | ||||||||
Balance at beginning of period | $ | (318,480 | ) | $ | (361,470 | ) | $ | (296,480 | ) | ||
Valuation allowances established | (1,489 | ) | (4,381 | ) | (3,963 | ) | |||||
Changes to existing valuation allowances | 5,006 | 24,302 | (71,412 | ) | |||||||
Release of valuation allowances | 272,291 | 19,612 | 2,321 | ||||||||
Currency translation | 2,554 | 3,457 | 8,064 | ||||||||
Balance at end of period | $ | (40,118 | ) | $ | (318,480 | ) | $ | (361,470 | ) | ||
There were no valuation allowances included in discontinued operations for the year ended December 31, 2016 and $7.8 million and $7.0 million for the years ended December 31, 2015 and 2014, respectively and are excluded from the table above.
Loss Carryforwards – We reduced our income tax payments by utilizing NOL carryforwards of $256.2 million in 2016, $123.8 million in 2015 and $27.1 million in 2014. At December 31, 2016, our federal, state and foreign NOL carryforwards totaled $1,566.1 million, of which $6.0 million does not expire and the remainder expires as follows (amounts in thousands):
2017 | $ | 3,283 | |
2018 | 5,553 | ||
2019 | 7,068 | ||
2020 | 9,108 | ||
Thereafter | 1,535,069 | ||
$ | 1,560,081 | ||
F-30
We utilized $1.2 million capital loss carryforwards in 2016. We did not utilize capital loss carryforwards in 2015 or 2014. At December 31, 2016, our capital loss carryforwards totaled $19.5 million. All of the capital losses are foreign and do not expire.
Section 382 Net Operating Loss Limitation – On October 3, 2011, we had a change in ownership pursuant to Section 382 of the Internal Revenue Code of 1986 as amended (“Code”). Under this provision of the Code, the utilization of any of our NOL carryforward, incurred prior to the date of ownership change, may be limited during any particular year. A Section 382 analysis completed in 2012 indicated no reason to believe the annual loss limitation would result in an expiration of our NOL carryforward, and the update to the analysis completed in 2016 did not change this conclusion. The 2012 acquisition of CM Holdings, Inc. (“CMI”) included a cumulative NOL of $26.6 million. This loss is subject to the same limitations but performed on a separate basis under Section 382. We have concluded the limitation under Section 382 will not prevent us from fully utilizing the CMI NOL. As part of the acquisitions we completed in 2015, we acquired the historical NOL's of the entities of $24.7 million. We have concluded the limitation under Section 382 will not prevent us from fully utilizing these historical NOL's.
Tax Credit Carryforwards – Our tax credit carryforwards expire as follows:
(amounts in thousands) | EZ Credit | R & E credit | Foreign Tax Credit | Work Opportunity & Welfare to Work Credit | State Investment Tax Credits | TOTAL | |||||||||||||||||
2017 | $ | — | $ | — | $ | — | $ | — | $ | 352 | $ | 352 | |||||||||||
2018 | — | — | 8,690 | — | 261 | 8,951 | |||||||||||||||||
2019 | — | — | — | — | 256 | 256 | |||||||||||||||||
2020 | — | — | 12,975 | — | 183 | 13,158 | |||||||||||||||||
2021 | — | — | 14,990 | — | 175 | 15,165 | |||||||||||||||||
Thereafter | 68 | 4,342 | 18,117 | 4,501 | 453 | 27,481 | |||||||||||||||||
$ | 68 | $ | 4,342 | $ | 54,772 | $ | 4,501 | $ | 1,680 | $ | 65,363 | ||||||||||||
Earnings of Foreign Subsidiaries – We have not provided U.S. income or foreign withholding taxes on cumulative undistributed earnings of certain foreign subsidiaries of approximately $265.2 million. Our intention is to reinvest these earnings. A deferred tax liability will be recognized if we can no longer demonstrate that we plan to indefinitely reinvest our undistributed earnings. Quantification of the potential deferred tax liability, if any, associated with indefinitely reinvested earnings is not practical.
Dual-Rate Jurisdiction – Estonia taxes the corporate profits of resident corporations at different rates depending upon whether the profits are distributed. The undistributed profits of resident corporations are exempt from taxation while any distributed profits are subject to a 20% corporate income tax rate. The liability for the tax on distributed profits is recorded as an income tax expense in the period in which we declare the dividend. This tax must be remitted to the local tax authorities by the tenth day of the month following the month of the dividend distribution. The amount of undistributed earnings at December 31, 2016 and 2015 which, if distributed, would be subject to this tax was $65.2 million and $63.5 million, respectively.
Tax Payments and Balances – We made tax payments of $34.7 million in 2016, $9.1 million in 2015 and $24.8 million in 2014 primarily for foreign liabilities. We received tax refunds of $7.9 million in 2016, $15.5 million in 2015 and $0.6 million in 2014 primarily related to U.S. federal tax. We recorded receivables for U.S. federal, foreign and state refunds of $4.3 million at December 31, 2016 and $7.0 million at December 31, 2015 which is included in other current assets on the accompanying consolidated balance sheets. We recorded payables for U.S. federal, foreign and state taxes of $4.6 million at December 31, 2016 and $12.8 million at December 31, 2015 which is included in accrued income taxes payable in the accompanying consolidated balance sheets. The refunds received in 2016 were in excess of the receivables recorded at December 31, 2015 as the actual tax due was less than was estimated at the time of the income tax provision.
F-31
Accounting for Uncertain Tax Positions – A reconciliation of the beginning and ending amounts of unrecognized tax benefits excluding interest and penalties is as follows:
(amounts in thousands) | 2016 | 2015 | 2014 | ||||||||
Balance at beginning of period | $ | 11,634 | $ | — | $ | — | |||||
Increase for tax positions taken during the prior period | 359 | 786 | — | ||||||||
Increase for tax positions taken during the current period | — | 10,848 | — | ||||||||
Currency translation | (345 | ) | — | — | |||||||
Balance at end of period - unrecognized tax benefit | 11,648 | 11,634 | — | ||||||||
Accrued interest and penalties | 406 | — | — | ||||||||
Uncertain tax position - (Note 18) | $ | 12,054 | $ | 11,634 | $ | — | |||||
Unrecognized tax benefits were $11.6 million at December 31, 2016 and 2015. The changes during the current period relate to the establishment of an uncertain tax position for certain intercompany expenses offset by a currency translation during the period. As of December 31, 2014, we had no unrecognized tax benefits. Interest and penalties related to uncertain tax positions are reported as a component of tax expense and included in the total uncertain tax position balance within deferred credits and other liabilities in the accompanying consolidated balance sheets.
Uncertain tax positions recorded in 2015 are due to changes in the manner in which we manage our manufacturing capacity and the distribution and sale of our products in Europe. The reorganization of our Europe segment was part of our review of our operations structure and management that began in 2014 and resulted in changes in taxable income for certain of our subsidiaries within that reportable segment. Effective January 1, 2015, our subsidiary JELD-WEN U.K. Limited (the “Managing Subsidiary”) entered into an agreement (the “Managing Agreement”) with several of our other subsidiaries in Europe (collectively, the “Operating Subsidiaries”). The Managing Agreement provides that the Managing Subsidiary will receive a fee from the Operating Subsidiaries in exchange for performing various management and decision-making services for the Operating Subsidiaries. As a result, the Managing Agreement shifts certain risks (and correlated benefits) from the Operating Subsidiaries to the Managing Subsidiary. In exchange, the Managing Subsidiary guarantees a specific return to each Operating Subsidiary on a before interest and taxes basis, commensurate with such Operating Subsidiary’s functions and risk profile. While there is no impact on the consolidate reporting of the Europe segment due to the Managing Agreement, there may be changes in taxable income of the Operating Subsidiaries. Therefore, we have reserved for a potential loss resulting from such uncertainty.
Included in the balance of unrecognized tax benefits as of December 31, 2016, December 31, 2015, and December 31, 2014, are $11.6 million, $11.6 million, and nil respectively, of tax benefits that, if recognized, would affect the effective tax rate. We believe it is reasonably possible that a decrease of up to $0.8 million in unrecognized tax benefits related to conclusion of certain non-US income tax examinations may be necessary within the next twelve months.
We operate in multiple foreign tax jurisdictions and are generally open to examination for tax years 2012 and forward. In the US, we are open to examination at a federal level for tax years 2013 forward. We are under examination by certain US state and local jurisdictions for tax years 2005 through 2008, but generally we are open to examination for state and local jurisdictions for tax years 2012 forward. We are under examination in Austria, Denmark Estonia, and Indonesia for tax years 2010 through 2014, and generally remain open to examination for other non-US jurisdictions for tax years 2012 forward.
Note 20. Segment Information
We report our segment information in the same way management internally organizes the business in assessing performance and making decisions regarding allocation of resources in accordance with ASC 280-10- Segment Reporting. We determined that we have three reportable segments, organized and managed principally by geographic region. Our reportable segments are North America, Europe and Australasia. We report all other business activities in Corporate and unallocated costs. Factors considered in determining the three reportable segments include the nature of business activities, the management structure accountable directly to the chief operating decision maker ("CODM") for operating and administrative activities, the discrete financial information available and the information presented to the CODM. Management reviews net revenues and Adjusted EBITDA (as defined below) to evaluate segment performance and allocate resources. We define Adjusted EBITDA as net income (loss), as adjusted for the following items: income (loss) from discontinued operations, net of tax; gain (loss) on sale of discontinued operations, net of tax; equity earnings (loss) of non-consolidated entities; income tax (expense) benefit; depreciation and intangible amortization; interest expense, net; impairment and restructuring charges; (gain) loss on sale of property and equipment; share-based compensation expense;
F-32
non-cash foreign exchange transaction/translation (income) loss; other non-cash items; other items; and costs related to debt restructuring, debt refinancing, and the Onex Investment.
The following tables set forth certain reportable segment information relating to our operations for the years ended December 31, 2016, 2015 and 2014:
(amounts in thousands) | North America | Europe | Australasia | Total Operating Segments | Corporate and Unallocated Costs | Total Consolidated | |||||||||||||||||
2016: | |||||||||||||||||||||||
Total net revenues | $ | 2,182,108 | $ | 1,009,545 | $ | 541,770 | $ | 3,733,423 | $ | — | $ | 3,733,423 | |||||||||||
Elimination of intersegment net revenues | (32,940 | ) | (816 | ) | (32,868 | ) | (66,624 | ) | — | (66,624 | ) | ||||||||||||
Net revenues from external customers | $ | 2,149,168 | $ | 1,008,729 | $ | 508,902 | $ | 3,666,799 | $ | — | $ | 3,666,799 | |||||||||||
Depreciation and amortization | $ | 68,207 | $ | 26,657 | $ | 7,739 | $ | 102,603 | $ | 4,187 | $ | 106,790 | |||||||||||
Impairment and restructuring charges | 3,584 | 6,777 | 2,448 | 12,809 | 1,038 | 13,847 | |||||||||||||||||
Adjusted EBITDA | 251,831 | 122,574 | 59,519 | 433,924 | (39,792 | ) | 394,132 | ||||||||||||||||
Capital expenditures | 39,775 | 14,991 | 21,610 | 76,376 | 3,121 | 79,497 | |||||||||||||||||
Segment assets | $ | 1,099,090 | $ | 746,754 | $ | 378,740 | $ | 2,224,584 | $ | 291,712 | $ | 2,516,296 | |||||||||||
2015: | |||||||||||||||||||||||
Total net revenues | $ | 2,061,194 | $ | 996,753 | $ | 402,721 | $ | 3,460,668 | $ | — | $ | 3,460,668 | |||||||||||
Elimination of intersegment net revenues | (45,479 | ) | (739 | ) | (33,390 | ) | (79,608 | ) | — | (79,608 | ) | ||||||||||||
Net revenues from external customers | $ | 2,015,715 | $ | 996,014 | $ | 369,331 | $ | 3,381,060 | $ | — | $ | 3,381,060 | |||||||||||
Depreciation and amortization | $ | 61,165 | $ | 25,296 | $ | 5,697 | $ | 92,158 | $ | 3,038 | $ | 95,196 | |||||||||||
Impairment and restructuring charges | 7,113 | 13,089 | 317 | 20,519 | 823 | 21,342 | |||||||||||||||||
Adjusted EBITDA | 201,660 | 99,540 | 40,453 | 341,653 | (30,667 | ) | 310,986 | ||||||||||||||||
Capital expenditures | 35,721 | 25,572 | 14,049 | 75,342 | 2,345 | 77,687 | |||||||||||||||||
Segment assets | $ | 1,057,056 | $ | 725,604 | $ | 257,496 | $ | 2,040,156 | $ | 142,217 | $ | 2,182,373 | |||||||||||
2014: | |||||||||||||||||||||||
Total net revenues | $ | 2,041,595 | $ | 1,110,692 | $ | 444,867 | $ | 3,597,154 | $ | — | $ | 3,597,154 | |||||||||||
Elimination of intersegment net revenues | (51,974 | ) | (2,302 | ) | (35,672 | ) | (89,948 | ) | — | (89,948 | ) | ||||||||||||
Net revenues from external customers | $ | 1,989,621 | $ | 1,108,390 | $ | 409,195 | $ | 3,507,206 | $ | — | $ | 3,507,206 | |||||||||||
Depreciation and amortization | $ | 58,268 | $ | 30,365 | $ | 7,219 | $ | 95,852 | $ | 4,174 | $ | 100,026 | |||||||||||
Impairment and restructuring charges | 22,392 | 4,080 | 1,156 | 27,628 | 10,760 | 38,388 | |||||||||||||||||
Adjusted EBITDA | 114,086 | 100,570 | 40,783 | 255,439 | (25,590 | ) | 229,849 | ||||||||||||||||
Capital expenditures | 26,463 | 31,123 | 11,088 | 68,674 | 2,172 | 70,846 | |||||||||||||||||
Segment assets | $ | 1,035,303 | $ | 773,765 | $ | 260,813 | $ | 2,069,881 | $ | 114,178 | $ | 2,184,059 | |||||||||||
F-33
Reconciliations of pre-tax net income (loss) to Adjusted EBITDA for the years ended 2016, 2015 and 2014 are as follows:
(amounts in thousands) | 2016 | 2015 | 2014 | ||||||||
Net income (loss) | $ | 357,511 | $ | 90,918 | $ | (84,109 | ) | ||||
Loss from discontinued operations, net of tax | 3,324 | 2,856 | 5,387 | ||||||||
Equity (earnings) loss of non-consolidated entities | (3,264 | ) | (2,384 | ) | 447 | ||||||
Income tax (benefit) expense | (225,596 | ) | (5,435 | ) | 18,942 | ||||||
Depreciation and intangible amortization | 106,790 | 95,196 | 100,026 | ||||||||
Interest expense, net | 77,590 | 60,632 | 69,289 | ||||||||
Impairment and restructuring charges (a) | 18,353 | 31,031 | 38,645 | ||||||||
Gain on sale of property and equipment | (3,275 | ) | (416 | ) | (23 | ) | |||||
Stock-based compensation expense | 22,464 | 15,620 | 7,968 | ||||||||
Non-cash foreign exchange transaction/translation (income) loss | 5,734 | 2,697 | (528 | ) | |||||||
Other non-cash items (b) | 2,843 | 1,141 | 2,334 | ||||||||
Other items (c) | 30,585 | 18,893 | 20,278 | ||||||||
Costs relating to debt restructuring, debt refinancing and the Onex investment (d) | 1,073 | 237 | 51,193 | ||||||||
Adjusted EBITDA | $ | 394,132 | $ | 310,986 | $ | 229,849 | |||||
(a) | Impairment and restructuring charges consist of (i) impairment and restructuring charges that are included in our consolidated statements of operations plus (ii) additional charges of $4,506, $9,687, and $257 for the years ended December 31, 2016, 2015, and 2014, respectively. These additional charges are primarily comprised of non-cash changes in inventory valuation reserves, such as excess and obsolete reserves. For further explanation of impairment and restructuring charges that are included in our consolidated statements of operations, see Note 25- Impairment and Restructuring Charges of Continuing Operations in our financial statements for the year ended December 31, 2016 included elsewhere in this Form 10-K. |
(b) | Other non-cash items include, among other things, charges relating to inventory of $357, $893 and $2,496 in the years ended December 31, 2016, 2015 and 2014, respectively. For the year ended December 31, 2016, other non-cash items also include $2,153 charge for the out-of-period European warranty adjustments. |
(c) | Other items not core to business activity include: (i) in the year ended December 31, 2016, (1) $20,695 payment to holders of vested options and restricted shares in connection with the November 2016 dividend, (2) $3,721 of professional fees related to the IPO of our common stock, (3) $1,626 of acquisition costs, (4) $584 in legal costs associated with disposition of non-core properties, (5) $507 of dividend payout related costs, (6) $500 of recruitment costs related to the recruitment of executive management employees, (7) $450 in legal costs associated with Steves and Sons, Inc., (8) $346 in Dooria plant closure costs, and (9) $265 related to a legal settlement accrual for CMI; (ii) in the year ended December 31, 2015, (1) $11,446 payment to holders of vested options and restricted shares in connection with the July 2015 dividend, (2) $5,510 related to a U.K. legal settlement, (3) $1,825 in acquisition costs, (4) $1,833 of recruitment costs related to the recruitment of executive management employees, and (5) $1,082 of legal costs related to non-core property disposition, partially offset by (6) $5,678 of realized gain on foreign exchange hedges related to an intercompany loan; and (iii) in the year ended December 31, 2014, (1) $5,000 legal settlement related to our ESOP plan, (2) $3,657 of legal costs associated with non-core property disposition, (3) $3,443 production ramp-down costs, (4) $2,769 of consulting fees in Europe, (5) $1,250 of pre-acquisition costs related to the acquisition of CMI. |
(d) | Included in the year ended December 31, 2014 is a loss on debt extinguishment of $51,036 associated with the refinancing of our 12.25% secured notes. |
F-34
Net revenues by locality are as follows for the years ended December 31:
(amounts in thousands) | 2016 | 2015 | 2014 | ||||||||
Net revenues by location of external customer | |||||||||||
Canada | $ | 218,947 | $ | 234,017 | $ | 320,790 | |||||
U.S. | 1,893,585 | 1,740,303 | 1,630,503 | ||||||||
South America (including Mexico) | 34,518 | 38,422 | 39,711 | ||||||||
Europe | 1,035,398 | 1,020,073 | 1,124,179 | ||||||||
Australia | 476,251 | 345,523 | 390,850 | ||||||||
Africa and other | 8,100 | 2,722 | 1,173 | ||||||||
Total | $ | 3,666,799 | $ | 3,381,060 | $ | 3,507,206 | |||||
Geographic information regarding property, plant, and equipment which exceed 10% of consolidated property, plant, and equipment used in continuing operations is as follows for the years ended December 31:
(amounts in thousands) | 2016 | 2015 | 2014 | ||||||||
North America: | |||||||||||
U.S. | $ | 400,023 | $ | 418,795 | $ | 447,073 | |||||
Other | 25,371 | 24,500 | 30,914 | ||||||||
425,394 | 443,295 | 477,987 | |||||||||
Europe | 145,470 | 164,419 | 174,597 | ||||||||
Australasia: | |||||||||||
Australia | 104,063 | 81,992 | 80,490 | ||||||||
Other | 8,259 | 8,543 | 9,514 | ||||||||
112,322 | 90,535 | 90,004 | |||||||||
Corporate: | |||||||||||
U.S. | 21,465 | 22,594 | 12,541 | ||||||||
21,465 | 22,594 | 12,541 | |||||||||
Total property and equipment, net | $ | 704,651 | $ | 720,843 | $ | 755,129 | |||||
Note 21. Convertible Preferred Shares
We had the authority to issue up to 8,750,000 shares of preferred stock, par value of $0.01, of which 8,749,999 shares are designated as Series A Convertible Preferred Stock and one share was designated as Series B Preferred Stock. Series A Convertible Preferred Stock consisted of 2,922,634 shares of Series A-1 Stock, 208,760 shares of Series A-2 Stock, 843,132 shares of Series A-3 Stock, and 4,775,473 shares of Series A-4 Stock. At December 31, 2016 and December 31, 2015, all of the authorized shares of Series A-1, Series A-2, and Series A-3 Stock and one Series B Stock were issued and outstanding.
Immediately prior to the closing of our IPO, the outstanding shares and accrued but unpaid dividends of Series A Stock converted into 64,211,172 common shares by applying the applicable conversion rates as prescribed in our certificate of incorporation. The conversion rates were: 17.238 common shares for each share of Series A-1 Stock, 15.578 common shares for each share of Series A-2 Stock, and 12.547 common shares for each share of Series A-3 Stock. See Note 37- Subsequent Events for additional information on our IPO. In addition, the Series B Stock was redeemed.
Dividend - Prior to converting to common stock, the Series A Stock had a preferred annual dividend of 10% per annum on the Equity Constant, with the Equity Constant being $21.77 for dividends accruing prior to April 30, 2013. The cumulative dividends accrued continually and compounded annually at the rate of 10% whether or not they had been declared and whether or not there were funds available for the payment.
In July of 2015, the holders of the 3,974,525 shares of Series A Stock (57,700,434 as-converted common shares) received $272.8 million through participation in the $4.73 per share of Common Stock distribution (see Note 22- Equity). The Board
F-35
of Directors authorized an additional distribution of $62.4 million to holders of Series A Stock representing dividends accruing between January 1, 2015 and July 31, 2015. Total distributions for holders of our Series A Stock were $335.2 million, were paid on or about July 31, 2015, and were recorded as reductions to the carrying value of the Series A Stock.
In October of 2016, the Board of Directors authorized $256.3 million in distributions to the holders of the 3,974,525 shares of Series A Stock (62,645,538 as-converted common shares) through participation in the $4.09 per share of Common Stock distribution (see Note 22 - Equity). The Board of Directors authorized an additional distribution of $51.0 million to holders of Series A Stock representing dividends accruing between May 31, 2016 and November 3, 2016. Total distributions paid to holders of our Series A Stock were $306.7 million, and were paid on or about November 3, 2016. Cumulative unpaid dividends were approximately $390.6 million and $325.0 million at December 31, 2016 and 2015, respectively. The Series A Stock and cumulative unpaid dividends converted into 64,211,172 shares of our common stock on February 1, 2017.
Other - In June 2016, the Company, represented by directors not appointed by Onex, settled indemnification claims under the 2011 and 2012 Stock Purchase Agreements with Onex. As a result of this settlement, the Company refunded $23.7 million of the issuance price agreed to in the 2011 and 2012 Stock Purchase Agreements in August 2016. The refund was recorded as a reduction in the carrying value of the Convertible Preferred shares in the accompanying consolidated balance sheets.
Note 22. Equity
As of December 31, 2016, we had the authority to issue 904,732,200 shares of common stock, with a par value of $0.01 per share (the “Total Common Stock”), of which 900,000,000 shares were designated common stock and 4,732,200 shares were designated as Class B-1 Common Stock. Each share of Total Common Stock (whether common stock or Class B-1 Common Stock) has the same rights, privileges, interest and attributes and is subject to the same limitations as every other share of Total Common Stock treating the Class B-1 Common Stock on an as-converted basis. Each share of Class B-1 Common Stock is convertible at the option of the holder into shares of common stock at the same ratio on the date of conversion as a share of Series A-1 Stock would have been convertible on such date of conversion, assuming that no cash dividends had been paid on the Series A-1 Stock (or its predecessor security) since the date of initial issuance. Immediately prior to the closing of our IPO, all of the outstanding shares of Class B-1 Common Stock were converted into 309,404 common shares of common stock.
Common stock includes the basis of shares outstanding plus amounts recorded as additional paid-in capital. A summary of activity for common and Class B-1 Common Stock outstanding is as follows:
Common Stock | Class B-1 Common Stock | ||||
December 31, 2016 | |||||
Beginning shares outstanding | 17,829,240 | 68,046 | |||
Shares issued | 65,153 | 109,175 | |||
Ending shares outstanding | 17,894,393 | 177,221 | |||
December 31, 2015 | |||||
Beginning shares outstanding | 19,757,309 | 2,310 | |||
Shares issued | 144,331 | 66,781 | |||
Shares converted | 1,485 | (1,045 | ) | ||
Shares repurchased - ESOP | (459,910 | ) | — | ||
Shares repurchased - other | (1,613,975 | ) | — | ||
Ending shares outstanding | 17,829,240 | 68,046 | |||
Shares outstanding above excludes the shares issued to the Employee Benefit Trust that are considered similar to treasury shares and total 193,941 shares at both December 31, 2016 and December 31, 2015 with a total original issuance value of $12.4 million.
We use the specific identification method to account for repurchased shares and charge to retained earnings any excess of the purchase price over the original issuance price, unless there is an accumulated deficit in the preceding period, in which case the entire amount of the repurchases is charged to common stock. Shares are immediately retired upon repurchase.
F-36
On January 30, 2015, our Board of Directors approved a self-tender offer to purchase up to $40.0 million worth of common stock at a price of $20.00 per share. The tender offer was initiated on January 30, 2015, and on March 6, 2015, we repurchased 1,613,909 shares of our common stock for $32.3 million.
On July 28, 2015, our Board of Directors authorized a distribution of $4.73 per share of common stock in which the Series A Convertible Preferred Stock and Class B-1 Common Stock would participate on an as-converted basis. The record date for the distribution was June 30, 2015 and totaled $84.9 million for holders of our common stock and Class B-1 Common Stock. We applied distributions totaling $14.4 million against principal and accrued interest on outstanding employee and director notes. Participating in the distribution were 17,697,823 common shares and 52,679 shares of Class B-1 Common Stock (78,232 as-converted common shares). The distributions were paid on or about July 31, 2015.
On October 2, 2015, we issued 84,480 shares of common stock valued at $2.0 million as part of the consideration paid for the purchase of certain assets and liabilities related to an acquisition.
On October 31, 2016, our Board of Directors authorized a distribution of $4.09 per share of common stock in which the Series A Convertible Preferred Stock and Class B-1 Common Stock would participate on an as-converted basis. The record date for the distribution was November 1, 2016 and totaled $74.0 million for holders of our common stock and Class B-1 Common Stock. We applied distributions totaling $0.2 million against principal and accrued interest on outstanding employees. Participating in the distribution were 17,845,927 common shares and 136,565 B-1 Common shares (232,373 as-converted common shares). The distributions were paid on or about November 3, 2016.
Note 23. Earnings (Loss) Per Share
Basic loss per share is calculated by dividing net loss attributable to common shareholders by the weighted average shares outstanding during the period, without consideration for common stock equivalents. Diluted net loss per share is calculating by adjusting weighted average shares outstanding for the dilutive effect of common share equivalents outstanding for the period, determined using the treasury-stock method. For purposes of the dilutive net loss per share calculation, Series A Stock, common stock options, Class B-1 Common Stock options, and unvested Common Restricted Stock Units are considered to be common stock equivalents but are excluded from the calculation of diluted net loss per share because their effect would be anti-dilutive and therefore, basic and diluted net loss per share were the same for all periods presented.
The basic and diluted loss per share calculations for the years ended December 31, 2016, 2015 and 2014 are presented below (in thousands, except share and per share amounts).
2016 | 2015 | 2014 | |||||||||
Income (loss) from continuing operations | $ | 357,571 | $ | 91,390 | $ | (78,275 | ) | ||||
Equity earnings (loss) of non-consolidated entities | 3,264 | 2,384 | (447 | ) | |||||||
Income (loss) from continuing operations and equity earnings (loss) of non- consolidated entities | 360,835 | 93,774 | (78,722 | ) | |||||||
Undeclared Series A Convertible Preferred Stock dividends | (65,667 | ) | (46,234 | ) | (100,034 | ) | |||||
Series A Convertible Preferred Stock distributions and dividends declared and paid | (307,279 | ) | (335,184 | ) | — | ||||||
Deemed dividend on Series A Convertible Preferred Stock from Settlement Agreement | (23,701 | ) | — | — | |||||||
Loss attributable to common shareholders from continuing operations | (35,812 | ) | (287,644 | ) | (178,756 | ) | |||||
Loss from discontinued operations, net of tax | (3,324 | ) | (2,856 | ) | (5,387 | ) | |||||
Net loss attributable to common shareholders | $ | (39,136 | ) | $ | (290,500 | ) | $ | (184,143 | ) | ||
Weighted-average outstanding shares of common stock basic and diluted | 17,992,879 | 18,296,003 | 20,440,057 | ||||||||
Basic and diluted loss per share | |||||||||||
Loss from continuing operations | $ | (1.99 | ) | $ | (15.72 | ) | $ | (8.75 | ) | ||
Loss from discontinued operations | (0.18 | ) | (0.16 | ) | (0.26 | ) | |||||
Net loss per share | $ | (2.17 | ) | $ | (15.88 | ) | $ | (9.01 | ) | ||
Class B-1 Common Stock is considered a participating security as defined by ASC 260. However, because the effect of utilizing the two-class method to allocate earnings to the approximately 155,238, 61,853 and 3,058 weighted average
F-37
shares of Class B-1 Common Stock outstanding on an as-converted basis for the years ended December 31, 2016, 2015 and 2014, respectively, has an immaterial effect on the loss per share, we have elected to forgo the two-class method and separate presentation of loss per share for each participating class of common stock.
The following table provides the securities that could potentially dilute basic earnings per share in the future, but were not included in the computation of diluted earnings per share because to do so would have been anti-dilutive:
2016 | 2015 | 2014 | ||||||
Series A Convertible Preferred Stock | 3,974,525 | 3,974,525 | 3,974,525 | |||||
Common Stock options | 1,812,404 | 1,891,978 | 1,903,528 | |||||
Class B-1 Common Stock options | 3,344,572 | 3,396,118 | 3,133,328 | |||||
In addition, unvested restricted stock units of 385,220, 378,433 and 158,136 as of December 31, 2016, 2015 and 2014, respectively, have not been included as the vesting conditions have not been satisfied as of the respective period end.
Note 24. Stock Compensation
In December 2011, we adopted a stock incentive plan for the benefit of our employees, affiliate employees and key non-employees. In 2014, the plan was amended and allows us to offer common options, Class B-1 Common Stock Options and RSUs. Under the amended plan, we can award up to an aggregate of 2,761,000 common shares and 4,732,200 shares of Class B-1 Common Stock. The grants have various vesting terms including cliff and graded vesting over periods of 1 to 5 years. The stock incentive plan provides for accelerated vesting of awards upon the occurrence of certain events.
Share-based compensation expense included in selling, general and administrative expenses totaled $43.2 million in 2016, $27.4 million in 2015 and $8.8 million in 2014. There were no material related tax benefits for the years 2016, 2015 and 2014. As of December 31, 2016, there were $28.8 million of total unrecognized compensation expense related to non-vested share-based compensation arrangements. This cost is expected to be recognized over the remaining weighted-average vesting period of 1.6 years.
During the fourth quarter of 2016, we recorded $21.3 million of share-based compensation associated with cash payments to participants of our stock incentive plan. These payments consisted of $4.09 per vested common option and $6.96 per vested B-1 common option and $4.09 per restricted stock unit. In addition, we modified the terms of most unvested options, reducing the exercise prices by $4.09 and $6.96 for common and B-1 common options, respectively, resulting in additional share-based compensation expense of $0.9 million in 2016. Key assumptions used in valuing the option modification were as follows:
Expected volatility range | 34.56% - 48.09% |
Expected dividend yield rate | 0.00% |
Weighted average term (in years) | 2.57 - 7.06 |
Risk free rate | 0.94% - 1.63% |
During the third quarter of 2015, we recorded $11.4 million of share-based compensation associated with payments to participants of our stock incentive plan. These payments consisted of $4.73 per vested common option and $7.02 per vested Class B-1 Common Stock option and $4.73 per restricted stock unit. In addition, we modified the terms of unvested options, reducing the exercise prices by $4.73 and $7.02 for common and Class B-1 Common Stock options, respectively, resulting in additional share-based compensation expense of $3.6 million in 2015. Key assumptions used in valuing the option modification were as follows:
Expected volatility range | 36.02% - 51.19% |
Expected dividend yield rate | 0.00% |
Weighted average term (in years) | 1.60 - 5.72 |
Risk free rate | 0.54% - 1.75% |
Stock Options – Generally, stock option awards vest ratably each year on the anniversary date over a 2 to 5-year period, have an exercise term of 10 years and any vested options must be exercised within 90 days of the employee leaving the Company. The compensation cost of option awards is charged to expense based upon the graded-vesting method over the vesting periods applicable to the option awards. The graded-vesting method provides for vesting of portions of the overall awards at interim dates and results in greater vesting in earlier years than the straight-line method.
F-38
When options are granted, we calculate the fair value of common and Class B-1 Common Stock options using multiple Black-Scholes option valuation models. Expected volatilities are based upon a selection of public guideline companies. The risk-free rate was based upon U.S. Treasury rates.
Key assumptions used in the valuation models were as follows:
2016 | 2015 | 2014 | |||
Expected volatility | 43.57 - 52.72% | 36.00 - 58.30% | 54.00 - 62.60% | ||
Expected dividend yield rate | 0.00% | 0.00% | 0.00% | ||
Weighted average term (in years) | 5.50 - 7.50 | 1.60 - 6.20 | 2.00 - 7.30 | ||
Weighted average grant date fair value | $17.84 | $23.94 | $9.90 | ||
Risk free rate | 1.47 - 1.77% | 0.54 - 1.84% | 0.33 - 1.77% | ||
The following table represents stock option activity from January 1, 2014 to December 31, 2016:
Shares | Weighted Average Exercise Price Per Share | Weighted Average Remaining Contract Term in Years | ||||||
Outstanding at January 1, 2014 | 3,912,590 | $ | 22.32 | 8.3 | ||||
Granted | 2,916,441 | 19.19 | ||||||
Forfeited | (1,792,175 | ) | 22.06 | |||||
Balance at December 31, 2014 | 5,036,856 | $ | 20.60 | 8.4 | ||||
Granted | 1,088,450 | 29.60 | ||||||
Exercised | (95,667 | ) | 21.41 | |||||
Forfeited | (741,543 | ) | 20.37 | |||||
Balance at December 31, 2015 | 5,288,096 | $ | 19.06 | 7.9 | ||||
Granted | 367,400 | 37.12 | ||||||
Exercised | (245,014 | ) | 19.91 | |||||
Forfeited | (253,506 | ) | 16.82 | |||||
Balance at December 31, 2016 | 5,156,976 | $ | 20.40 | 7.1 | ||||
Exercisable at December 31, 2016 | 2,858,130 | $ | 18.66 | 6.4 | ||||
RSUs – RSUs are subject to the continued employment of the recipient through the vesting date, which is generally 12 to 48 months from issuance. Once vested, the recipient will receive one share of common stock for each restricted stock unit. The grant-day fair value per share used for RSUs was determined using the aggregate value of our common equity, as determined by a third-party valuation firm, as of the most recent calendar quarter-end and applying a 10% discount based upon reflecting the differential economic rights and preferences of the Preferred or the ESOP common shares relative to the common shares, with that amount rounded down to the nearest whole percent. We apply this grant-day fair value per share to the total number of shares that we anticipate will fully vest and amortize the fair value to compensation expense over the
vesting period using the straight-line method.
F-39
Shares | Weighted Average Grant-Day Fair Value Per Share | |||||
Outstanding January 1, 2015 | 158,136 | $ | 14.49 | |||
Granted | 246,840 | 23.49 | ||||
Vested | (23,375 | ) | 14.49 | |||
Forfeited | (3,168 | ) | 23.67 | |||
Balance at December 31, 2015 | 378,433 | $ | 20.28 | |||
Granted | 76,912 | 28.62 | ||||
Vested | (64,625 | ) | 20.35 | |||
Forfeited | (5,500 | ) | 15.31 | |||
Balance at December 31, 2016 | 385,220 | $ | 22.00 | |||
Note 25. Impairment and Restructuring Charges of Continuing Operations
Closure costs and impairment charges for operations not qualifying as discontinued operations are classified as impairment and restructuring charges in our consolidated statements of operations. We review our operations to identify those not meeting our minimum profitability or return on investment levels.
In 2016, we recorded $6.8 million of impairment and restructuring charges in Europe, including $3.8 million related to restructuring and plant closures of a recent acquisition and $3.0 million related to various personnel restructuring across Europe. In Australasia, we recorded charges of $2.4 million mostly related to a site closure and restructuring of a recent acquisition. In the U.S., we recorded $4.6 million of charges including $2.5 million of various termination benefits and $2.1 million of other impairment and restructuring charges.
In 2015, we recorded $13.4 million of impairment and restructuring charges in Europe, including $11.4 million related to the restructuring of our French operations. In North America, we recorded charges of $2.0 million related to consolidation of our fiber door skin designs. We also fully impaired an equity investment and related notes receivable totaling $1.5 million. The remaining costs of $4.4 million are mainly related to personnel restructuring.
In 2014, we recorded $7.1 million of impairment charges primarily related to facility closures, excess real estate and manufacturing process changes. We also recorded $13.7 million of severance costs related primarily to executive and other administrative management restructuring and $8.6 million for one-time payments related to the restructuring of our management incentive plan, which was revised to decrease the number of participants. In addition, we recorded restructuring charges of $3.3 million for lease termination and other costs related to the relocation and downsizing of our aviation department, $2.0 million for process reengineering and $3.6 million of other charges.
The table below summarizes the amounts included in impairment and restructuring charges in the accompanying consolidated statements of operations:
(amounts in thousands) | 2016 | 2015 | 2014 | ||||||||
Closed operations | $ | 1,778 | $ | 677 | $ | 3,229 | |||||
Continuing operations | 1,203 | 3,591 | 3,914 | ||||||||
Total impairments | 2,981 | 4,268 | 7,143 | ||||||||
Restructuring charges, net of fair value adjustment gains | 10,866 | 17,074 | 31,245 | ||||||||
Total impairment and restructuring charges | $ | 13,847 | $ | 21,342 | $ | 38,388 | |||||
Short-term restructuring accruals are recorded in accrued expenses and totaled $1.5 million and $6.2 million as of December 31, 2016 and 2015, respectively (See Note 14- Accrued Expenses). Long-term restructuring accruals are recorded in deferred credits and other liabilities and totaled $3.6 million and $2.3 million as of December 31, 2016 and 2015, respectively.
F-40
The following is a summary of the restructuring accruals recorded and charges incurred:
(amounts in thousands) | Beginning Accrual Balance | Additions Charged to Expense | Payments or Utilization | Ending Accrual Balance | |||||||||||
2016 | |||||||||||||||
Severance and sales restructuring costs | $ | 5,424 | $ | 7,448 | $ | (12,036 | ) | $ | 836 | ||||||
Disposal of property and equipment | — | (71 | ) | 71 | — | ||||||||||
Other | 3,083 | 3,489 | (2,389 | ) | 4,183 | ||||||||||
$ | 8,507 | $ | 10,866 | $ | (14,354 | ) | $ | 5,019 | |||||||
2015 | |||||||||||||||
Severance and sales restructuring costs | $ | 7,307 | $ | 10,493 | $ | (12,376 | ) | $ | 5,424 | ||||||
Disposal of property and equipment | — | 64 | (64 | ) | — | ||||||||||
Other | 373 | 6,517 | (3,807 | ) | 3,083 | ||||||||||
$ | 7,680 | $ | 17,074 | $ | (16,247 | ) | $ | 8,507 | |||||||
2014 | |||||||||||||||
Severance and sales restructuring costs | $ | 1,062 | $ | 22,340 | $ | (16,095 | ) | $ | 7,307 | ||||||
Assets held for sale | — | 364 | (364 | ) | — | ||||||||||
Marketing agreement termination | 10,000 | — | (10,000 | ) | — | ||||||||||
Other | 2,300 | 8,541 | (10,468 | ) | 373 | ||||||||||
$ | 13,362 | $ | 31,245 | $ | (36,927 | ) | $ | 7,680 | |||||||
Note 26. Interest Expense
Interest expense is net of capitalized interest. Capitalized interest incurred during the construction phase of significant property additions totaled $1.7 million in 2016, $0.8 million in 2015 and $0.9 million in 2014. We made interest payments of $73.9 million in 2016, $57.0 million in 2015 and $74.7 million in 2014. Interest expense also includes debt issuance costs that are amortized using the effective interest method. We allocated interest expense to discontinued operations of $0.6 million in 2016, $0.8 million in 2015 and $0.7 million in 2014.
Note 27. Other Income (Expense)
Other income (expense) for the years ended December 31, 2016, 2015 and 2014 was as follows:
(amounts in thousands) | 2016 | 2015 | 2014 | ||||||||
Legal settlement income | $ | 9,671 | $ | 2,421 | $ | 497 | |||||
Foreign currency (losses) gains | (3,580 | ) | 9,254 | (1,142 | ) | ||||||
Gain (loss) on sale of property and equipment | 2,971 | 487 | (342 | ) | |||||||
Rent and finance income | 2,630 | 2,174 | 2,361 | ||||||||
Other items | 1,133 | (216 | ) | (859 | ) | ||||||
$ | 12,825 | $ | 14,120 | $ | 515 | ||||||
In July 2016, we entered into a confidential settlement agreement on a commercial matter in our North America segment that originated in 2011 and received $8.4 million under the agreement. We recorded the gain associated with this settlement in other income in the accompanying consolidated statements of operations.
Note 28. Derivative Financial Instruments
All derivatives are recorded as assets or liabilities in the consolidated balance sheets at their respective fair values. For derivatives designated as hedging relationships, changes in the fair value are either offset through earnings against the change in fair value of the hedged item attributable to the risk being hedged or recognized in consolidated other comprehensive income (loss), to the extent the derivative is effective at offsetting the changes in cash flows being hedged until the hedged item affects earnings. For derivatives designated and that qualify as fair value hedges, the gain or loss on the derivative, as well as the offsetting gain or loss on the hedged item attributable to the hedged risk, are recognized in the consolidated statements of operations. Changes in the fair value of a derivative that do not meet the criteria for designation
F-41
as a fair value or cash flow hedge at inception, or fail to meet the criteria thereafter, are also recognized in the consolidated statements of operations.
Foreign currency derivatives – We are exposed to the impact of foreign currency fluctuations in certain countries in which we operate. In most of these countries, the exposure to foreign currency movements is limited because the operating revenues and expenses of our business units are substantially denominated in the local currency. To the extent borrowings, sales, purchases, revenues, expenses or other transactions are not executed in the local currency of the operating unit, we are exposed to currency risk. In order to mitigate the exposure, we enter into a variety of foreign currency derivative contracts, such as forward contracts, option collars and cross-currency swaps. We use foreign currency derivative contracts, with a total notional amount of $70.2 million, in order to manage the effect of exchange fluctuations on forecasted sales, purchases, acquisitions, inventory and capital expenditures and certain intercompany transactions that are denominated in foreign currencies. We use foreign currency derivative contracts, with a total notional amount of $54.6 million, to hedge the effects of translation gains and losses on intercompany loans and interest. We also use foreign currency derivative contracts, with a total notional amount of $150.8 million, to mitigate the impact to the consolidated earnings of the Company from the effect of the translation of certain subsidiaries’ local currency results into U.S. dollars. We do not use derivative financial instruments for trading or speculative purposes. Hedge accounting has not been elected for any foreign currency derivative contracts. We record mark-to-market changes in the values of these derivatives in other (expense) income. We recorded mark-to-market losses of $0.9 million, and gains of $0.9 million and $5.9 million in the years ended December 31, 2016, 2015 and 2014, respectively.
Interest rate swap derivatives – We are exposed to interest rate market risk in connection with our variable rate long-term debt. During the fourth quarter of 2014, we entered into interest rate swap agreements to manage this risk. The interest rate swaps mature in September 2019. On July 1, 2015, we amended our $775.0 million term loan credit facility, and we received an additional $480.0 million in long-term borrowings. In conjunction with the issuance of the incremental term loan debt, we entered into additional interest rate swap agreements to manage our increased exposure to the interest rate market risk associated with variable rate long-term debt. The additional interest rate swaps mature in September 2019 and are forward-starting, with half of the $426.0 million aggregate notional amount having become effective in June 2016 and the other half having become effective in December 2016.
The interest rate swap agreements are designated as cash flow hedges and effectively change the LIBOR portion of the interest rate (or “base rate”) on a portion of the debt outstanding under our term loan credit facility to the weighted average fixed rates per the time frames below:
Period | Notional (1) | Weighted Average Rate | |
(dollars in thousands) | |||
September 2015 - December 2015 | $289,875 | 1.997% | |
December 2015 - June 2016 | $273,000 | 1.997% | |
June 2016 - September 2016 | $486,000 | 2.054% | |
September 2016 - December 2016 | $759,000 | 2.161% | |
December 2016 - December 2017 | $914,250 | 2.188% | |
December 2017 - December 2018 | $825,000 | 2.190% | |
December 2018 - September 2019 | $707,250 | 2.192% | |
(1) | Aggregate notional in effect during the period shown. |
The cumulative pre-tax mark-to-market loss of $12.9 million relating to these interest rate contracts was recorded in consolidated other comprehensive income (loss) at December 31, 2016 as no portion was deemed ineffective. We recorded $5.0 million of interest expense deriving from the interest rate swaps that were in effect during the year ended December 31, 2016.
The agreements with our counterparties contain a provision where we could be declared in default on our derivative obligations if we either default or, in certain cases, are capable of being declared in default of any of our indebtedness greater than specified thresholds. These agreements also contain a provision where we could be declared in default subsequent to a merger or restructuring type event if the creditworthiness of the resulting entity is materially weaker.
F-42
The fair values of derivative instruments held as of December 31, 2016 and 2015 are as follows:
Asset derivatives | |||||||||
(amounts in thousands) | Balance Sheet Location | 2016 Fair Value | 2015 Fair Value | ||||||
Derivatives not designated as hedging instruments: | |||||||||
Foreign currency forward contracts | other current assets | $ | 6,309 | $ | 6,957 | ||||
Liability derivatives | |||||||||
Balance Sheet Location | 2016 Fair Value | 2015 Fair Value | |||||||
Derivatives designated as hedging instruments: | |||||||||
Interest rate contracts | accrued expenses | $ | 9,050 | $ | 4,353 | ||||
deferred credits and other liabilities | $ | 3,878 | $ | 5,895 | |||||
Derivatives not designated as hedging instruments: | |||||||||
Foreign currency forward contracts | accrued expenses | $ | 691 | $ | 381 | ||||
Note 29. Fair Value Measurements
We record financial assets and liabilities at fair value based on FASB guidance related to Fair Value Measurements. The guidance requires fair value to be determined based on the exchange price that would be received for an asset or paid to transfer a liability (an exit price) in the principal or most advantageous market for the asset or liability in an orderly transaction between market participants at the measurement date.
A valuation hierarchy consisting of three levels was established based on observable and non-observable inputs. The three levels of inputs are:
Level 1 – Quoted prices (unadjusted) in active markets for identical assets or liabilities that the reporting entity has the ability to access at the measurement date.
Level 2 – Quoted prices for similar assets or liabilities in active markets; quoted prices for identical or similar assets or liabilities in markets that are not active; and model-driven valuations whose significant inputs are observable or whose significant value drivers are observable.
Level 3 – Significant inputs to the valuation model that are unobservable.
For the years ended December 31, 2016 and December 31, 2015, the primary financial instruments measured at fair value on a recurring basis are presented below:
2016 | |||||||||||||||||||
(amounts in thousands) | Level 1 | Level 2 | Level 3 | Assets measured at NAV (a) | Total Fair Value | ||||||||||||||
Cash and equivalents | $ | — | $ | 6,059 | $ | — | $ | — | $ | 6,059 | |||||||||
Derivative assets, recorded in other current assets | — | 6,309 | — | — | 6,309 | ||||||||||||||
Derivative liabilities, recorded in accrued expenses | — | (13,619 | ) | — | — | (13,619 | ) | ||||||||||||
Pension plan assets: | |||||||||||||||||||
Cash and short-term investments | — | 5,873 | — | — | 5,873 | ||||||||||||||
U.S. Government and agency obligations | 30,953 | — | — | — | 30,953 | ||||||||||||||
Corporate and foreign bonds | — | 77,934 | — | — | 77,934 | ||||||||||||||
Asset-backed securities | — | 580 | — | — | 580 | ||||||||||||||
Equity securities | 48,320 | — | 658 | — | 48,978 | ||||||||||||||
Mutual funds | — | 129,791 | — | — | 129,791 | ||||||||||||||
Common and collective funds | — | — | — | 15,482 | 15,482 | ||||||||||||||
Total | $ | 79,273 | $ | 212,927 | $ | 658 | $ | 15,482 | $ | 308,340 | |||||||||
F-43
2015 | |||||||||||||||||||
(amounts in thousands) | Level 1 | Level 2 | Level 3 | Assets measured at NAV (a) | Total Fair Value | ||||||||||||||
Cash and equivalents | $ | — | $ | 8,152 | $ | — | $ | — | $ | 8,152 | |||||||||
Derivative assets, recorded in other current assets | — | 6,957 | — | — | 6,957 | ||||||||||||||
Derivative liabilities, recorded in accrued expenses | — | (10,629 | ) | — | — | (10,629 | ) | ||||||||||||
Pension plan assets: | |||||||||||||||||||
Cash and short-term investments | — | 11,517 | — | — | 11,517 | ||||||||||||||
U.S. Government and agency obligations | 26,270 | — | — | — | 26,270 | ||||||||||||||
Corporate and foreign bonds | — | 85,274 | — | — | 85,274 | ||||||||||||||
Asset-backed securities | — | 3,989 | — | — | 3,989 | ||||||||||||||
Equity securities | — | — | — | — | — | ||||||||||||||
Mutual funds | 174,840 | 4,345 | — | — | 179,185 | ||||||||||||||
Total | $ | 201,110 | $ | 109,605 | $ | — | $ | — | $ | 179,185 | |||||||||
(a) | Certain pension assets that are measured at fair value using the NAV per share (or its equivalent) practical expedient have not been classified in the fair value hierarchy. |
Derivative assets and liabilities reported in level 2 include foreign currency contracts and interest rate swaps. The fair values of the foreign currency contracts were determined using counterparty quotes based on prevailing market data and derived from their internal, proprietary model-driven valuation techniques. The fair values of the interest rate swaps are based on models using observable inputs such as relevant published interest rates. The pension plan assets consist of cash and short-term investments, corporate and foreign bonds, asset-backed securities and mutual funds which are valued by third parties who make comparison to similar assets or use quotes for the same assets in inactive markets and are included in level 2. The valuation methodologies for pension plan government bonds and equity securities are quoted prices and are included in level 1.
Our non-financial assets and liabilities that are measured at fair value on a non-recurring basis are presented below.
(amounts in thousands) | 2016 | ||||||||||||||||||
Level 1 | Level 2 | Level 3 | Fair Value | Total Losses | |||||||||||||||
Closed operations | $ | — | $ | — | $ | 1,445 | $ | 1,445 | $ | 1,602 | |||||||||
Total | $ | — | $ | — | $ | 1,445 | $ | 1,445 | $ | 1,602 | |||||||||
(amounts in thousands) | 2015 | ||||||||||||||||||
Level 1 | Level 2 | Level 3 | Fair Value | Total Losses | |||||||||||||||
Closed operations | $ | — | $ | — | $ | 747 | $ | 747 | $ | 497 | |||||||||
Continuing operations | — | — | 443 | 443 | 21 | ||||||||||||||
Total | $ | — | $ | — | $ | 1,190 | $ | 1,190 | $ | 518 | |||||||||
The valuation methodologies for the level 3 items are based primarily on internal cash flow projections.
Note 30. Fair Value of Financial Instruments
As part of our normal business activities we invest in financial assets and incur financial liabilities. Our recorded financial instruments consist primarily of cash and cash equivalents, restricted cash, accounts receivable, accounts payable, notes receivable, notes payable and fair value of derivative instruments. The fair values of these financial instruments approximate their recorded values in 2016 and 2015 due to their short-term nature, variable interest rates and mark to market accounting for derivative contracts. The fair values of fixed rate long-term receivables and debt were evaluated using a discounted cash flow analysis and using market interest rates. The fair value of long-term receivables approximated carrying values at both December 31, 2016 and 2015; however, long-term fixed rate debt indicated a fair value of $22.0 million higher than the recorded value as of December 31, 2016 and approximated carrying value at December 31, 2015.
F-44
Note 31. Commitments and Contingencies
Litigation – We are involved in various legal proceedings encountered in the normal course of business and accrue for loss amounts on legal matters when it is probable a liability has been incurred and the amount of liability can be reasonably estimated. Legal judgments and estimated settlements have been included in accrued expenses in the accompanying consolidated balance sheets.
Except as noted in the legal cases described below, as of December 31, 2016, there are no current proceedings or litigation matters involving the Company or its property that we believe could have a material adverse impact on our business, financial condition, results of operations or cash flows.
Steves and Sons, Inc. vs JELD-WEN – We sell molded door skins to certain customers pursuant to long-term contracts, and these customers in turn use the molded door skins to manufacture interior doors and compete directly against us in the marketplace. We have given notice of termination of one of these contracts and, on June 29, 2016, the counterparty to the agreement, Steves and Sons, Inc., or “Steves,” filed a claim against JELD-WEN, Inc. in the U.S. District Court for the Eastern District of Virginia, Richmond Division. The complaint alleges that our acquisition of CMI, together with subsequent price increases and termination of the contract, violated antitrust laws and constituted a breach of contract, breach of warranty, and tort. The complaint seeks injunctive relief, ordinary and treble damages, and declaratory relief. We believe Steves’ claims lack merit and intend to defend against this action vigorously.
United Kingdom - In the fourth quarter of 2012, a U.K. court issued an order authorizing the “reopening” of a liquidation proceeding of a former subsidiary. As part of these proceedings and pursuant to this order, we repaid an alleged preference payment of £0.4 million ($0.6 million). The creditor also filed a lawsuit in U.S. District Court (Oregon), and included a JELD-WEN director in that suit, seeking to assess liability to the Company for any and all losses incurred as a result of the leasehold obligations which were disclaimed by the former subsidiary in the prior liquidation proceeding. The amount demanded by the creditor in the U.S. District Court action was $50.0 million. In April 2015, we reached agreement with applicable parties resulting in our recording a $17.3 million liability to the plaintiff in other accrued expenses and $11.5 million in accounts receivable from the insurance carriers and the other third party in March 2015. In June 2015, we paid $5.8 million in cash to fully settle the lawsuits in the U.K. and U.S. District Court.
ESOP - The JELD-WEN ESOP Plan, Administrative Committee, and individual trustees were sued by three separate groups of former employees and members of the ESOP for alleged violations relating to the management and distribution of the ESOP funds. These matters were pled as class actions and none of the cases were certified. In January 2015, we executed settlement agreements with applicable parties resulting in our recording $5.0 million in settlement expense in December 2014. Pursuant to the agreements, we accrued a $15.7 million liability to the plaintiffs in other accrued expenses and a $10.7 million insurance receivable in accounts receivable. In June 2015 we paid all settlement funds into an escrow account. On October 19, 2015, the court provided final approval of the settlement in all respects. We received $10.7 million from insurance carriers on December 1, 2016. All settlement funds have now been credited to claimant's respective accounts.
Suncadia - Prior to June 2011, we held a 66% ownership interest in Suncadia, which was our single largest real estate development project. A 30% equity interest was held by Pacific Realty Associates, L.P. and a 4% equity interest was held by Lowe Enterprises, Inc.
In December 2009, we amended our 2008 federal income tax return to claim a worthlessness deduction in the amount of $224.0 million associated with our tax basis in Suncadia and received a refund of approximately $64.0 million. The IRS challenged the timing of the worthlessness claim arguing the deduction should not be available until 2011. In April 2013, the IRS issued a notice of deficiency for the full amount of the worthlessness deduction claimed. We contested the IRS’s determination and filed a petition with the U.S. Tax Court requesting the matter be docketed for trial. On July 10, 2015, we reached a settlement on this matter with the IRS which sustained our original refund position of $64.0 million and resulted in an incremental refund including interest of $15.5 million which was received in October 2015.
Self-Insured Risk – We self-insure substantially all of our domestic business liability risks including general liability, product liability, warranty, personal injury, auto liability, workers’ compensation and employee medical benefits. Excess insurance policies from independent insurance companies generally cover exposures between $3.0 million and $250.0 million for domestic product liability risk and exposures between $0.5 million and $250.0 million for auto, general liability, personal injury and workers’ compensation. We have no stop gap coverage on claims covered by our self-insured domestic employee medical plan and are responsible for all claims thereunder. We estimate our provision for self-insured losses based upon an evaluation of current claim exposure and historical loss experience. Actual self-insurance losses may vary
F-45
significantly from these estimates. At December 31, 2016 and December 31, 2015, our accrued liability for self-insured risks was $71.3 million and $70.2, respectively.
Indemnifications – At December 31, 2016, we had commitments related to certain representations made on contracts for the purchase or sale of businesses or property. These representations primarily relate to past actions such as responsibility for transfer taxes if they should be claimed, and the adequacy of recorded liabilities, warranty matters, employment benefit plans, income tax matters or environmental exposures. These guarantees or indemnification responsibilities typically expire within one to three years. We are not aware of any material amounts claimed or expected to be claimed under these indemnities. From time to time and in limited geographic areas we have entered into agreements for the sale of our products to certain customers that provide additional indemnifications for liabilities arising from construction or product defects. We cannot estimate the potential magnitude of such exposures, but to the extent specific liabilities have been identified related to product sales, liabilities have been provided in the warranty accrual in the accompanying consolidated balance sheets.
Performance Bonds and Letters of Credit – At times, we are required to provide letters of credit, surety bonds or guarantees to customers, vendors and others. Letters of credit are provided to certain customers and counterparties in the ordinary course of business as credit support for contractual performance guarantees, advanced payments received from customers and future funding commitments. The outstanding performance bonds and letters of credit were as follows:
(amounts in thousands) | 2016 | 2015 | |||||
Discontinued operations | $ | 85 | $ | 205 | |||
Self-insurance workers' compensation | 18,514 | 16,426 | |||||
Liability and other insurance | 15,884 | 18,064 | |||||
Environmental | 14,086 | 13,917 | |||||
Other | 13,985 | 10,279 | |||||
$ | 62,554 | $ | 58,891 | ||||
Environmental Contingencies – We periodically incur environmental liabilities associated with remediating our current and former manufacturing sites as well as penalties for not complying with environmental rules and regulations. We record a liability for remediation costs when it is probable that we will be responsible for such costs and the costs can be reasonably estimated. These environmental liabilities are estimated based on current available facts and present laws and regulations. Accordingly, it is likely that adjustments to the estimated liabilities will be necessary as additional information becomes available. Short-term environmental liabilities and settlements are recorded in accrued expenses in the accompanying consolidated balance sheets and totaled $0.5 million and $0.7 million at December 31, 2016 and December 31, 2015, respectively. There were no long-term environmental liabilities at both December 31, 2016 and December 31, 2015.
Everett, Washington WADOE Action - In 2008, we entered into an Agreed Order with the Washington Department of Ecology (WADOE) to assess historic environmental contamination at our former manufacturing site in Everett, Washington. As part of this order, we also agreed to develop a Cleanup Action Plan (CAP) identifying remediation options and the feasibility thereof. We are currently working with WADOE to finalize our assessment and draft CAP. We estimate the remaining cost to complete our assessment and develop the CAP at $0.5 million which we have fully accrued. We are working with insurance carriers who provided coverage to a previous owner and operator of the site, and at this time we cannot reasonably estimate the cost associated with any remedial action we would be required to undertake and have not provided for any remedial action in our accompanying consolidated financial statements. Should extensive remedial action ultimately be required, and if those costs are not found to be covered by insurance, the cost of remediation could have a material adverse effect on our results of operations and cash flows.
Everett, Washington NRD Action - In November 2014, we received a letter from the Natural Resource Damage Trustee Council (NRD), a Federal Agency, regarding a potential multi-party settlement of an impending damage claim related to historic environmental contamination on a site we sold in December 31. In September 2015 we entered into a settlement agreement under which we will pay $1.2 million to settle the claim. Of the $1.2 million, the prior insurance carrier for the site has agreed to fund $1.0 million of the settlement. All amounts related to the settlement are fully accrued and we do not expect to incur any further significant loss related to the settlement of this matter.
Towanda, Pennsylvania Consent Order - In 2015, we entered into a Consent Order and Agreement, or COA, with the Pennsylvania Department of Environmental Protection, or PaDEP, to remove a pile of wood fiber waste from our site in Towanda, Pennsylvania, which we acquired in connection with our acquisition of CMI in 2013, by using it as fuel for a
F-46
boiler at that site. The COA replaced a 1995 Consent Decree between CMI’s predecessor Masonite, Inc. and PaDEP. Under the COA, we are required to achieve certain periodic removal objectives and ultimately remove the entire pile by August 31, 2022. There is currently $10.7 million in bonds collateralized in connection with these obligations. If we are unable to remove this pile by August 31, 2022, then the bonds will be forfeited and we may be subject to penalties by PaDEP. We currently anticipate meeting all applicable removal deadlines; however, if our operations at this site decrease and we burn less fuel than currently anticipated then we may not be able to meet such deadlines.
Service Agreements – In February 2015, we entered into a strategic servicing agreement with a third party vendor to identify and execute cost reduction opportunities. The agreement provided for a tiered fee structure directly tied to cost savings realized. This contract terminated pursuant to its own terms on December 31, 2015, and we have accrued and will continue to incur fees associated with this agreement based upon realized cost savings from opportunities identified during the agreement.
Employee Stock Ownership Plan – We have historically provided cash to our U.S. ESOP plan in order to fund required distributions to participants. Following our January 2017 IPO, the ESOP value will be based on JELD-WEN’s public share price and the ESOP may sell shares of JELD-WEN’s common stock to fund cash distributions under the ESOP. Therefore, we do not anticipate that JWH will be funding future distributions.
Lease Commitments – We have various operating lease agreements primarily for facilities, manufacturing equipment, airplanes and vehicles. These obligations generally have remaining non-cancelable terms extending to the year 2035. Minimum annual lease payments are as follows (amounts in thousands):
Continuing Operations | |||
2017 | $ | 34,753 | |
2018 | 29,738 | ||
2019 | 23,071 | ||
2020 | 17,973 | ||
2021 | 14,186 | ||
Thereafter | 65,480 | ||
$ | 185,201 | ||
Rent expense from continuing operations was $45.8 million in 2016, $35.8 million in 2015 and $40.5 million in 2014. Rent expense from discontinued operations was $0.1 million in each of 2016, 2015 and 2014.
Note 32. Employee Retirement and Pension Benefits
U.S. Defined Benefit Pension Plan – Certain U.S. hourly employees participate in our defined benefit pension plan. The plan is not open to new employees. Pension expense, as recorded in the consolidated statements of operations, is determined by using weighted-average assumptions made on January 1 of each year as summarized below:
(amounts in thousands) | |||||||||||
Components of pension benefit expense - U.S. benefit plan | 2016 | 2015 | 2014 | ||||||||
Service cost | $ | 3,320 | $ | 2,590 | $ | 1,800 | |||||
Interest cost | 16,387 | 16,055 | 16,675 | ||||||||
Expected return on plan assets | (19,990 | ) | (21,213 | ) | (19,028 | ) | |||||
Amortization of net actuarial pension loss | 12,264 | 12,803 | 7,609 | ||||||||
Pension benefit expense | $ | 11,981 | $ | 10,235 | $ | 7,056 | |||||
Discount rate | 4.25% | 3.75% | 4.75% | ||||||||
Expected long-term rate of return on assets | 7.00% | 7.00% | 7.00% | ||||||||
Compensation increase rate | N/A | N/A | N/A | ||||||||
The new mortality tables published by the Society of Actuaries in 2014 were adopted in 2014 and represent our best estimate of future experience for the base mortality table. The Society of Actuaries has released annual updates to the mortality improvement projection scale that was first released in 2014, with the most recent annual update being Scale MP-2016. We adopted the use of Scale MP-2016 as of December 31, 2016 as it represents our best estimate of future
F-47
mortality improvement projection experience as of the measurement date. In the fourth quarter of 2016, we corrected through other comprehensive income a $3.7 million increase to our pension liability for a change in the retirement age assumption for vested terminated participants based upon a 2015 experience study. The change in retirement age should have been reflected in our 2015 actuarial estimate and was immaterial to the current and prior periods. We developed the discount rate based on the plan’s expected benefit payments using the November 30, 2016 Citigroup Pension Discount Curve. Based on this analysis, we selected a 4.25% discount rate. As the discount rate is reduced or increased, the pension obligation would increase or decrease, respectively, and future pension expense would increase or decrease, respectively.
Pension benefit expense from amortization of net actuarial pension loss is estimated to be $12.0 million in 2017.
We maintain policies for investment of pension plan assets. The policies set forth stated objectives and a structure for managing assets, which includes various asset classes and investment management styles that, in the aggregate, are expected to produce a sufficient level of diversification and investment return over time and provide for the availability of funds for benefits as they become due. The policies also provide guidelines for each investment portfolio that control the level of risk assumed in the portfolio and ensure that assets are managed in accordance with stated objectives. The plan invests primarily in publicly-traded equity and debt securities as directed by the plan’s investment committee. The pension plan’s expected return assumption is based on the weighted average aggregate long-term expected returns of various actively managed asset classes corresponding to the plan’s asset allocation. We have selected an expected return on plan assets based on a historical analysis of rates of return, our investment mix, market conditions and other factors. The fair value of plan assets increased in 2016 due primarily to investment returns in excess of benefit payments and decreased 2015 due primarily to investment returns and contributions in excess of benefit payments.
(amounts in thousands) | |||||||
Change in fair value of plan assets - U.S. benefit plan | 2016 | 2015 | |||||
Balance at beginning of period | $ | 293,055 | $ | 300,183 | |||
Actual return on plan assets | 20,658 | (4,877 | ) | ||||
Company contribution | — | 14,320 | |||||
Benefits paid | (14,415 | ) | (14,027 | ) | |||
Administrative expenses paid | (3,303 | ) | (2,544 | ) | |||
Balance at end of period | $ | 295,995 | $ | 293,055 | |||
The plan’s investments are summarized below:
% of Plan Assets | |||
Summary of plan investments - U.S. benefit plan | 2016 | 2015 | |
Equity securities | 57.7 | 58.5 | |
Debt securities | 35.9 | 37.1 | |
Other | 6.4 | 4.4 | |
100.0 | 100.0 | ||
The plan’s projected benefit obligation is determined by using weighted-average assumptions made on December 31 of each year as summarized below:
(amounts in thousands) | |||||||
Change in projected benefit obligation - U.S. benefit plan | 2016 | 2015 | |||||
Balance at beginning of period | $ | 392,459 | $ | 433,790 | |||
Service cost | 3,320 | 2,590 | |||||
Interest cost | 16,387 | 16,055 | |||||
Actuarial loss (gain) | 10,862 | (43,405 | ) | ||||
Benefits paid | (14,415 | ) | (14,027 | ) | |||
Administrative expenses paid | (3,303 | ) | (2,544 | ) | |||
Balance at end of period | $ | 405,310 | $ | 392,459 | |||
Discount rate | 4.00% | 4.25% | |||||
Compensation increase rate | N/A | N/A | |||||
F-48
As of December 31, 2016, the plan’s estimated benefit payments for the next ten years are as follows (amounts in thousands):
2017 | $ | 17,018 | |
2018 | 17,729 | ||
2019 | 18,617 | ||
2020 | 19,388 | ||
2021 | 20,109 | ||
2022-2026 | 109,201 | ||
The Plan currently exceeds the Pension Protection Act of 2006 guidelines, and expects to be in excess of the guidelines in the near future, therefore, no future contributions are required and we do not expect to contribute to the Plan in 2017.
The plan’s accumulated benefit obligation of $405.3 million is determined by taking the projected benefit obligation and removing the impact of the assumed compensation increases. The plan’s funded status as of December 31, 2016 and December 31, 2015 is as follows:
(amounts in thousands) | |||||||
Unfunded pension liability - U.S. benefit plan | 2016 | 2015 | |||||
Projected benefit obligation at end of period | $ | 405,310 | $ | 392,459 | |||
Fair value of plan assets at end of period | (295,995 | ) | (293,055 | ) | |||
Unfunded pension liability | 109,315 | 99,404 | |||||
Current portion | — | (10,000 | ) | ||||
Long-term unfunded pension liability | $ | 109,315 | $ | 89,404 | |||
The current portion of the unfunded pension liability is recorded in accrued payroll and benefits and is equal to the expected employer contributions in the following year.
Net actuarial pension losses are recorded in consolidated other comprehensive income (loss) as follows:
(amounts in thousands) | |||||||||||
Accumulated other comprehensive income (loss) - U.S. benefit plan | 2016 | 2015 | 2014 | ||||||||
Net actuarial pension loss beginning of period | $ | 130,052 | $ | 160,170 | $ | 110,258 | |||||
Amortization of net actuarial loss | (12,264 | ) | (12,803 | ) | (7,608 | ) | |||||
Net loss (gain) occurring during year | 10,194 | (17,315 | ) | 57,520 | |||||||
Net actuarial pension loss at end of period | 127,982 | 130,052 | 160,170 | ||||||||
Tax benefit | (15,041 | ) | (15,041 | ) | (15,041 | ) | |||||
Net actuarial pension loss at end of period, net of tax | $ | 112,941 | $ | 115,011 | $ | 145,129 | |||||
F-49
Non-U.S. Defined Benefit Plans – We have several other defined benefit plans located outside the U.S. that are country specific. Some of these plans remain open to participants and others are closed. The expenses related to these plans are recorded in the consolidated statements of operations and are determined by using weighted-average assumptions made on January 1 of each year as summarized below.
(amounts in thousands) | |||||||||||
Components of pension benefit expense - Non-U.S. benefit plans | 2016 | 2015 | 2014 | ||||||||
Service cost | $ | 1,142 | $ | 4,821 | $ | 5,718 | |||||
Interest cost | 1,118 | 970 | 1,332 | ||||||||
Expected return on plan assets | (714 | ) | (871 | ) | (979 | ) | |||||
Amortization of net actuarial pension loss | 351 | 334 | 98 | ||||||||
Pension benefit expense | $ | 1,897 | $ | 5,254 | $ | 6,169 | |||||
Discount rate | 0.7 - 8.3% | 0.7 - 9.0% | 0.9 - 8.5% | ||||||||
Expected long-term rate of return on assets | 0.0 - 5.3% | 0.0 - 5.3% | 0.0 - 6.5% | ||||||||
Compensation increase rate | 0.5 - 7.0% | 0.5 - 7.0% | 2.0 - 7.0% | ||||||||
Non-U.S. pension benefit expenses from amortization of net actuarial pension losses are estimated to be $0.2 million in 2017.
(amounts in thousands) | |||||||
Change in fair value of plan assets - Non-U.S. benefit plans | 2016 | 2015 | |||||
Balance at beginning of period | $ | 13,180 | $ | 14,501 | |||
Fair value of assets acquired | 424 | — | |||||
Actual return on plan assets | 508 | 603 | |||||
Company contribution | 970 | 500 | |||||
Benefits paid | (175 | ) | (843 | ) | |||
Administrative expenses paid | (1,286 | ) | (23 | ) | |||
Cumulative translation adjustment | (25 | ) | (1,558 | ) | |||
Balance at end of period | $ | 13,596 | $ | 13,180 | |||
The investments of the non-U.S. plans are summarized below:
% of Plan Assets | |||
Summary of plan investments - Non-U.S. benefit plans | 2016 | 2015 | |
Equity securities | 47.3 | 45.9 | |
Debt securities | 20.0 | 22.2 | |
Other | 32.7 | 31.9 | |
100.0 | 100.0 | ||
F-50
The projected benefit obligation for the non-U.S. plans is determined by using weighted-average assumptions made on December 2016 of each year as summarized below:
(amounts in thousands) | |||||||
Change in projected benefit obligation - Non-U.S. benefit plans | 2016 | 2015 | |||||
Balance at beginning of period | $ | 29,226 | $ | 33,411 | |||
Pension obligation acquired | 375 | — | |||||
Service cost | 1,229 | 1,284 | |||||
Interest cost | 1,118 | 970 | |||||
Actuarial loss (gain) | 618 | (183 | ) | ||||
Benefits paid | (1,401 | ) | (2,947 | ) | |||
Administrative expenses paid | (833 | ) | (355 | ) | |||
Cumulative translation adjustment | (25 | ) | (2,954 | ) | |||
Balance at end of period | $ | 30,307 | $ | 29,226 | |||
Discount rate | 0.7 - 5.1% | 0.7 - 3.7% | |||||
Compensation increase rate | 0.5 - 2.9% | 0.5 - 2.5% | |||||
As of December 31, 2016, the estimated benefit payments for the non-U.S. plans over the next ten years are as follows (amounts in thousands):
2017 | $ | 2,209 | |
2018 | 2,309 | ||
2019 | 2,063 | ||
2020 | 2,197 | ||
2021 | 2,998 | ||
2022-2026 | 12,620 | ||
The accumulated benefit obligations of $27.4 million for the non-U.S. plans are determined by taking the projected benefit obligation and removing the impact of the assumed compensation increases. We expect to contribute $0.3 million to the non-U.S. plans in 2017.
The funded status of these plans as of December 31, 2016 and December 31, 2015 are as follows:
(amounts in thousands) | |||||||
Unfunded pension liability - Non-U.S. benefit plans | 2016 | 2015 | |||||
Projected benefit obligation at end of period | $ | 30,307 | $ | 29,226 | |||
Fair value of plan assets at end of period | (13,596 | ) | (13,180 | ) | |||
Unfunded pension liability | 16,711 | 16,046 | |||||
Current portion | (714 | ) | (156 | ) | |||
Long-term unfunded pension liability | $ | 15,997 | $ | 15,890 | |||
The current portion of the unfunded pension liability is recorded in accrued payroll and benefits and is equal to the expected employer contributions in the following year.
F-51
Net actuarial pension losses are recorded in consolidated other comprehensive income (loss) as follows:
(amounts in thousands) | |||||||||||
Accumulated other comprehensive income (loss) - Non-U.S. benefit plans | 2016 | 2015 | 2014 | ||||||||
Net actuarial pension loss beginning of period | $ | 5,160 | $ | 5,931 | $ | 3,668 | |||||
Amortization of net actuarial (loss) gain | (10 | ) | 367 | (36 | ) | ||||||
Net loss (gain) occurring during year | 1,621 | (1,073 | ) | 2,515 | |||||||
Cumulative translation adjustment | 10 | (65 | ) | (216 | ) | ||||||
Net actuarial pension loss at end of period | 6,781 | 5,160 | 5,931 | ||||||||
Tax benefit | (1,785 | ) | (1,366 | ) | (1,555 | ) | |||||
Net actuarial pension loss at end of period, net of tax | $ | 4,996 | $ | 3,794 | $ | 4,376 | |||||
Other Defined Contribution Plans – U.S. elective contributions to the 401(k) plan are discussed in Note 33- Employee Stock Ownership Plan. We have several other defined contribution plans located outside the U.S. that are country specific. Other plans that are characteristically defined contribution plans have accrued liabilities of $0.3 million and $1.4 million, respectively, at December 31, 2016 and December 31, 2015. The total compensation expense for non-U.S. defined contribution plans was $23.3 million in 2016, $13.3 million in 2015 and $13.5 million in 2014.
Note 33. Employee Stock Ownership Plan
We have an employee stock ownership plan (ESOP) that covers eligible U.S. employees. The assets of the ESOP are held in a separate trust (the ESOP Trust) established for that purpose. According to the terms of the ESOP, our obligation to the participants is limited to the value of the cash, common stock, or other assets held in the ESOP Trust. At the discretion of the JWH Board of Directors, we can elect to contribute matching contributions to either our ESOP or 401(k) Plan. For the years ended December 31, 2016, 2015 and 2014, a match of 100% of employee contributions up to 3% of wages was approved to be contributed to the 401(k) Plan. Additionally, in 2016 we matched 50% of employee contributions between 3% and 5% of wages. As a result, we recorded compensation expense of $12.7 million in 2016, $9.3 million in 2015 and $9.0 million in 2014. No amounts related to discontinued operations in 2016, 2015 or 2014.
The ESOP contains both Company funded sub-accounts and employee funded sub-accounts within the Plan. The majority of Company-funded sub-accounts have a delayed payment feature while distributions from the ESOP are payable the year following the event. The value of ESOP participant accounts associated with Company contributions is payment-delayed for six years after the employee leaves employment. Payments for retirement, disability and death are not subject to this delay. In addition, an installment feature applies to balances of $25,000 or more.
Currently, all ESOP participant accounts, including accounts of former employees with the exception of those that fall under a limited grandfathering rule, are valued according to the ongoing value of our stock. Therefore, the value of substantially all ESOP accounts is tied to our stock, which is the primary asset of the ESOP Trust.
Repurchases of common stock from ESOP Trust – Based on periodic assessment of planned distributions to participants, we have historically been obligated to repurchase common stock from the ESOP Trust based on the fair value of such shares for ESOP purposes. The fair value of our common stock held by the ESOP Trust is determined for ESOP purposes on a quarterly basis by an appraiser. The current fair value is $32.09 per share, as most recently determined as of November 18, 2016. The determination of the fair value as of December 31, 2016 is made once the annual financial statements are issued. We did not repurchase shares from the ESOP in 2016. We repurchased shares from the ESOP that totaled $12.1 million in 2015 and $14.8 million in 2014.
Note 34. Related Party Transactions
Notes Receivable from Directors – Notes receivable and interest due from our current and former directors or family members were paid in full in June 2016 and related to cash advances which were partially secured by our stock. Such amounts totaled $2.2 million at December 31, 2015 and were recorded as a reduction to equity as the borrowers have significant influence over the Company and there was current uncertainty as to whether the amounts would be repaid in cash or by a return of our stock.
Receivables from the Estate of Richard L. Wendt – The estate of Richard L. Wendt ("RLW Estate") is considered a significant shareholder of JWH and a Company director is a trustee of the estate. We held short and long-term receivables that originated directly from transactions with RLW Estate, or from transactions with entities that were owned by RLW
F-52
Estate, who was a Company director until his death in 2010. In December 2014, we signed an agreement that restructured the terms of these receivables. The outstanding principal of the note was reduced by a $7.1 million non-cash exchange for 355,487 shares of JWH stock. The remaining principal of $12.6 million continued to bear interest at prime plus 3.25%, with a minimum interest rate of 5.50% and a maximum interest rate of 9.50% per annum. The note was paid in full in August 2015. These notes were secured by JWH stock and recorded as deductions to equity. We received interest payments of $0.5 million in 2015.
(amounts in thousands) | 2016 | 2015 | 2014 | ||||||||
Notes receivable and accrued interest balance, January 1 | $ | 2,159 | $ | 16,380 | $ | 27,496 | |||||
Cash payments | (2,152 | ) | (14,850 | ) | (4,474 | ) | |||||
Non-cash payments | — | — | (8,359 | ) | |||||||
Interest accrued | 49 | 629 | 1,717 | ||||||||
Notes receivable and accrued interest balance, December 31 | $ | 56 | $ | 2,159 | $ | 16,380 | |||||
Interest rates, December 31 | 5.75% | 5.50% | 5.25-6.50% | ||||||||
Amounts due from the estate of R.L. Wendt | $ | — | $ | — | $ | 12,603 | |||||
Amounts due from other directors and family | 56 | 2,159 | 3,777 | ||||||||
$ | 56 | $ | 2,159 | $ | 16,380 | ||||||
Payments to Onex Partners – As part of the original Onex investment transaction, we agreed to pay Onex Partners for management services they provide. Total fees paid were $0.4 million in 2016, $0.6 million in 2015 and $1.8 million in 2014.
Aviation Department – In 2014 we restructured our aviation department, downsizing from three aircraft to one and moving the operation from Oregon to North Carolina. As part of the restructuring plan, one of the aircraft was subleased to RLW Estate. In the agreement, we pay the ongoing lease payments of $79,000 per month and RLW Estate pays a nominal amount to us. RLW Estate is responsible for all maintenance and operational costs. This arrangement was entered to decrease the costs and extend the cash outflow associated with exiting the aircraft lease. The lease runs through January of 2017 and we do not plan to renew. In addition, the aircraft hangar located in Klamath Falls, Oregon was sold to Fairmount Aviation for fair value of $2.0 million. Fairmount is a newly formed aviation company controlled by a director and family member.
F-53
Note 35. Supplemental Cash Flow Information
(amounts in thousands) | 2016 | 2015 | 2014 | ||||||||
Non-cash Investing Activities | |||||||||||
Property, equipment and intangibles purchased in accounts payable | $ | 1,340 | $ | 4,128 | $ | 4,454 | |||||
Property and equipment purchased for debt | 1,438 | — | 207 | ||||||||
Notes receivable and accrued interest from employees and directors settled with return of JWH stock | — | 49 | 7,110 | ||||||||
Customer accounts receivable converted to notes receivable | 1,276 | 174 | 911 | ||||||||
Cash Financing Activities | |||||||||||
Common stock purchased | |||||||||||
Stock repurchases | $ | — | $ | (32,569 | ) | $ | (7,163 | ) | |||
Repurchase of ESOP shares to fund distribution | — | (12,127 | ) | (14,765 | ) | ||||||
$ | — | $ | (44,696 | ) | $ | (21,928 | ) | ||||
Change in notes payable | |||||||||||
Borrowings on notes payable | $ | — | $ | 8,017 | $ | 2,006 | |||||
Payments on notes payable | (180 | ) | (11,437 | ) | (5,344 | ) | |||||
$ | (180 | ) | $ | (3,420 | ) | $ | (3,338 | ) | |||
Non-Cash Financing Activities | |||||||||||
Debt issuance costs deducted from long-term debt borrowings | $ | 1,492 | $ | 1,279 | $ | 230 | |||||
Common stock issued as consideration for acquisition | — | 2,000 | — | ||||||||
Prepaid insurance funded through short-term debt borrowings | 2,954 | 3,107 | — | ||||||||
F-54
Note 36. Quarterly Financial Data (unaudited)
Summarized quarterly financial data for the years ended December 31, 2016 and 2015 are as follows:
Three Months Ended | ||||||||||||||||
Mar. 26, 2016 | Jun. 25, 2016 | Sep. 24, 2016 | Dec. 31, 2016 | |||||||||||||
(dollars in thousands) | ||||||||||||||||
Statements of Operations Data: | ||||||||||||||||
Net revenues | $ | 796,547 | $ | 964,608 | $ | 932,475 | $ | 973,169 | ||||||||
Operating income | 23,550 | 69,757 | 70,733 | 32,700 | ||||||||||||
Income before taxes, equity earnings and discontinued operations | 7,263 | 52,095 | 59,917 | 12,700 | ||||||||||||
Net income | 6,336 | 74,161 | 44,016 | 232,998 | ||||||||||||
Net (loss) income attributable to common shareholders | (20,070 | ) | 22,459 | 13,909 | (93,243 | ) | ||||||||||
(Loss) earnings per share - basic: | ||||||||||||||||
(Loss) income from continuing operations | $ | (12.62 | ) | $ | 14.12 | $ | 0.92 | $ | (5.13 | ) | ||||||
Income (loss) from discontinued operations | 0.31 | (0.38 | ) | (0.15 | ) | $ | (0.03 | ) | ||||||||
Net (loss) income per share | $ | (12.31 | ) | $ | 13.74 | $ | 0.77 | $ | (5.16 | ) | ||||||
(Loss) earnings per share - diluted: | ||||||||||||||||
(Loss) income from continuing operations | $ | (12.62 | ) | $ | 9.92 | $ | 0.55 | $ | (5.13 | ) | ||||||
Income (loss) from discontinued operations | 0.31 | (0.08 | ) | (0.03 | ) | $ | (0.03 | ) | ||||||||
Net (loss) income per share | $ | (12.31 | ) | $ | 9.84 | $ | 0.52 | $ | (5.16 | ) | ||||||
Three Months Ended | ||||||||||||||||
Mar. 28, 2015 | Jun. 27, 2015 | Sep. 26, 2015 | Dec. 31, 2015 | |||||||||||||
(dollars in thousands) | ||||||||||||||||
Statements of Operations Data: | ||||||||||||||||
Net revenues | $ | 736,982 | $ | 878,799 | $ | 874,331 | $ | 890,948 | ||||||||
Operating income | 302 | 58,429 | 50,835 | 22,901 | ||||||||||||
(Loss) income before taxes, equity earnings and discontinued operations | (6,776 | ) | 43,031 | 42,741 | 6,959 | |||||||||||
Net (loss) income | (788 | ) | 29,746 | 41,651 | 20,309 | |||||||||||
Net (loss) income attributable to common shareholders | (26,322 | ) | 2,914 | (310,385 | ) | (9,071 | ) | |||||||||
(Loss) earnings per share - basic: | ||||||||||||||||
(Loss) income from continuing operations | $ | (14.80 | ) | $ | 2.55 | $ | (17.43 | ) | $ | (0.46 | ) | |||||
Loss from discontinued operations | (0.10 | ) | (0.79 | ) | (0.03 | ) | $ | (0.05 | ) | |||||||
Net (loss) income per share | $ | (14.90 | ) | $ | 1.76 | $ | (17.46 | ) | $ | (0.51 | ) | |||||
(Loss) earnings per share - diluted: | ||||||||||||||||
Income (loss) from continuing operations | $ | (14.80 | ) | $ | 2.52 | $ | (17.43 | ) | $ | (0.46 | ) | |||||
Loss from discontinued operations | (0.10 | ) | (0.78 | ) | (0.03 | ) | $ | (0.05 | ) | |||||||
Net (loss) income per share | $ | (14.90 | ) | $ | 1.74 | $ | (17.46 | ) | $ | (0.51 | ) | |||||
During the fourth quarter 2016, we released a valuation allowance in the U.S. totaling $236.5 million resulting in an increase in tax benefit and net income for the period. Due to the impact of accrued and paid dividends on the calculation, the sum of the quarterly net (loss) income attributable to common shareholders may not agree to consolidated year-to-date amounts presented in the accompanying consolidated statements of operations.
F-55
Note 37. Subsequent Events
On January 3, 2017, the majority of our shareholders approved amendments to our charter increasing the number of shares were are authorized to issue and an 11-for-1 stock split of our outstanding common stock and Class B-1 Common Stock. The total number of shares of all classes of stock that we had the authority to issue was 913,482,200, of which (a) 904,732,200 shares were common stock, par value $0.01 per share (the “Total Common Stock”) and (b) 8,750,000 shares were Preferred Stock, par value $0.01 per share (the “Preferred Stock”). Of the Total Common Stock, there were designated two separate series: (i) 900,000,000 shares were designated Common Stock (the “Common Stock”); and (ii) 4,732,200 shares were designated Class B-1 Common Stock (the “Class B-1 Common Stock”). Accordingly, all share and per share amounts for all periods presented in these consolidated financial statements and notes thereto have been adjusted retrospectively, where applicable, to reflect this stock split.
On February 1, 2017, all outstanding shares of our Series A Convertible Preferred Stock converted into 64,211,172 shares of our common stock, and all of the outstanding shares of our Class B-1 Common Stock converted into 309,404 shares of our common stock. In addition, the one outstanding shares of our Series B Preferred Stock was canceled.
On February 1, 2017, immediately prior to the closing of the IPO, the Company filed its Restated Certificate of Incorporation (the “Charter”) with the Secretary of State of the State of Delaware and the Company’s Amended and Restated By-laws (the “By-laws”) became effective, each as contemplated by the Registration Statement. The Charter, among other things, provides that the Company’s authorized capital stock consists of 900,000,000 shares of common stock, par value $0.01 per share and 90,000,000 shares of preferred stock, par value $0.01 per share.
On February 1, 2017, we closed our IPO and received $472.8 million in proceeds, net of underwriting discounts, fees and commissions. As part of the IPO, Onex sold 2,727,273 shares of our common stock from which we did not receive any proceeds from the shares of common stock sold by Onex. On February 1, 2017, the underwriters purchased an additional 3,750,000 shares from Onex pursuant to their option to purchase additional shares.
On February 6, 2017, we prepaid $375 million of outstanding principal under our Term Loan Facility. As a result of this prepayment, we will record interest expense of approximately $6.1 million due to the write-off of a portion of the original issue discount and unamortized debt issuance costs associated with the Term Loan Facility.
F-56