Attached files
| file | filename |
|---|---|
| EX-32.2 - CERTIFICATION - HOMELAND ENERGY SOLUTIONS LLC | exhibit322-certification12.htm |
| EX-32.1 - CERTIFICATION - HOMELAND ENERGY SOLUTIONS LLC | exhibit321-certification12.htm |
| EX-31.2 - CERTIFICATION - HOMELAND ENERGY SOLUTIONS LLC | exhibit312-certification12.htm |
| EX-31.1 - CERTIFICATION - HOMELAND ENERGY SOLUTIONS LLC | exhibit311-certification12.htm |
| EX-10.43 - HES ICM DUEL DRYER SYSTEM CONTRACT - HOMELAND ENERGY SOLUTIONS LLC | ex1043homelandduelicmdryer.htm |
UNITED STATES
SECURITIES AND EXCHANGE COMMISSION
Washington, D.C. 20549
FORM 10-K
x | Annual report pursuant to Section 13 or 15(d) of the Securities Exchange Act of 1934. | |
For the fiscal year ended | December 31, 2016 | |
o | Transition report pursuant to Section 13 or 15(d) of the Securities Exchange Act of 1934. | |
Commission file number 000-53202 | ||
HOMELAND ENERGY SOLUTIONS, LLC | |||
(Exact name of registrant as specified in its charter) | |||
Iowa | 20-3919356 | ||
(State or other jurisdiction of incorporation or organization) | (I.R.S. Employer Identification No.) | ||
2779 Highway 24, Lawler, Iowa | 52154 | ||
(Address of principal executive offices) | (Zip Code) | ||
(563) 238-5555 | |||
(Registrant's telephone number, including area code) | |||
Securities registered pursuant to Section 12(b) of the Act: None | |||
Securities registered pursuant to Section 12(g) of the Act: Membership Units | |||
Indicate by check mark if the registrant is a well-known seasoned issuer, as defined in Rule 405 of the Securities Act.
o Yes x No
Indicate by check mark if the registrant is not required to file reports pursuant to Section 13 or Section 15(d) of the Act.
o Yes x No
Indicate by check mark whether the registrant: (1) has filed all reports required to be filed by Section 13 or 15(d) of the Securities Exchange Act of 1934 during the preceding 12 months (or for such shorter period that the registrant was required to file such reports), and (2) has been subject to such filing requirements for the past 90 days. x Yes o No
Indicate by check mark whether the registrant has submitted electronically and posted on its corporate Website, if any, every Interactive Data File required to be submitted and posted pursuant to Rule 405 of Regulation S-T (§232.405 of this chapter) during the preceding 12 months (or for such shorter period that the registrant was required to submit and post such files).
x Yes o No
Indicate by check mark if disclosure of delinquent filers pursuant to Item 405 of Regulation S-K (§229.405 of this chapter) is not contained herein, and will not be contained, to the best of registrant's knowledge, in definitive proxy or information statements incorporated by reference in Part III of this Form 10-K or any amendment to this Form 10-K. o
Indicate by check mark whether the registrant is a large accelerated filer, an accelerated filer, a non-accelerated filer, or a smaller reporting company. See the definitions of "large accelerated filer," "accelerated filer" and "smaller reporting company" in Rule 12b-2 of the Exchange Act.
Large accelerated filer | o | Accelerated filer | o | |
Non-accelerated filer | x | Smaller reporting company | o | |
(Do not check if a smaller reporting company) | ||||
Indicate by check mark whether the registrant is a shell company (as defined in Rule 12b-2 of the Act). o Yes x No
As of June 30, 2016, the aggregate market value of the membership units held by non-affiliates (computed by reference to the most recent offering price of membership units) was $56,777,000.
As of March 3, 2017, there were 90,445 membership units outstanding. On June 13, 2013, the registrant entered into an agreement with Steve Retterath, the registrant's largest equity holder, to repurchase and retire all of the units owned by Mr. Retterath. The registrant agreed to repurchase and retire 25,860 membership units owned by Mr. Retterath in exchange for $30 million. The registrant believes that it has a binding agreement with Mr. Retterath. Mr. Retterath contends he is not bound by the agreement. The registrant's position is that, as of the closing date, Mr. Retterath is no longer the equitable owner of any membership units in the registrant. As a result, the registrant has recorded a $30 million short-term liability related to the amount the registrant agreed to pay Mr. Retterath to repurchase his membership units and has correspondingly reduced members' equity on our balance sheet. The 90,445 membership units outstanding include the contested membership units the registrant agreed to repurchase from Mr. Retterath.
DOCUMENTS INCORPORATED BY REFERENCE
The registrant has incorporated by reference into Part III of this Annual Report on Form 10-K portions of its definitive proxy statement to be filed with the Securities and Exchange Commission within 120 days after the close of the fiscal year covered by this Annual Report.
INDEX
Page No. | |
2
PART I
CAUTIONARY STATEMENTS REGARDING FORWARD-LOOKING STATEMENTS
This annual report contains historical information, as well as forward-looking statements that involve known and unknown risks and relate to future events, our future financial performance, or our expected future operations and actions. In some cases, you can identify forward-looking statements by terminology such as "may," "will," "should," "expect," "plan," "anticipate," "believe," "estimate," "future," "intend," "could," "hope," "predict," "target," "potential," or "continue" or the negative of these terms or other similar expressions. These forward-looking statements are only our predictions based on current information and involve numerous assumptions, risks and uncertainties. Our actual results or actions may differ materially from these forward-looking statements for many reasons, including the reasons described in this report. While it is impossible to identify all such factors, factors that could cause actual results to differ materially from those estimated by us include:
• | Reductions in the corn-based ethanol use requirement in the Federal Renewable Fuels Standard; |
• | Lower oil and gasoline prices which result in lower ethanol prices; |
• | Negative operating margins which result from lower ethanol prices; |
• | Lower distillers grains prices which result from the Chinese anti-dumping and anti-subsidy duties; |
• | The impact of lower gasoline prices on ethanol prices and demand; |
• | Changes in the availability and price volatility of corn and natural gas; |
• | Decreases in the market price of ethanol, distiller grains and corn oil; |
• | Changes in economic conditions or the occurrence of certain events causing an economic impact in the agriculture, oil or automobile industries; |
• | Our ability to continue to satisfy the financial covenants contained in our credit agreements with our lender; |
• | Changes in interest rates or the lack of credit availability; |
• | Our ability to generate sufficient liquidity to fund our operations, debt service requirements and capital expenditures; |
• | The results of our hedging transactions and other risk management strategies; |
• | Changes in plant production capacity or technical difficulties in operating the plant; |
• | Changes in environmental regulations or in our ability to comply with the environmental regulations that apply to our plant site and our operations; |
• | Changes in or elimination of federal and/or state laws having an impact on the ethanol industry; |
• | Overcapacity within the ethanol industry; |
• | Lack of transport, storage and blending infrastructure preventing our products from reaching high demand markets; |
• | Changes and advances in ethanol production technology that may make it more difficult for us to compete with other ethanol plants utilizing such technology; |
• | Our reliance on key management personnel; and |
• | Competition in the ethanol industry from alternative fuels. |
The cautionary statements referred to in this section also should be considered in connection with any subsequent written or oral forward-looking statements that may be issued by us or any persons acting on our behalf. We undertake no duty to update these forward-looking statements, even though our situation may change in the future. Furthermore, we cannot guarantee future results, events, levels of activity, performance, or achievements. We caution you not to put undue reliance on any forward-looking statements, which speak only as of the date of this report. You should read this report and the documents that we reference in this report and have filed as exhibits, completely and with the understanding that our actual future results may be materially different from what we currently expect. We qualify all of our forward-looking statements by these cautionary statements.
AVAILABLE INFORMATION
Information about us is also available on our website at www.homelandenergysolutions.com, under "Investor Relations - SEC Filings," which includes links to reports we have filed with the Securities and Exchange Commission. The contents of our website are not incorporated by reference in this Annual Report on Form 10-K.
PART I
ITEM 1. BUSINESS.
Business Development
Homeland Energy Solutions, LLC (referred to herein as "we," "us," the "Company," "Homeland" or "Homeland Energy Solutions") is an Iowa limited liability company. We were formed on December 7, 2005 to build and operate a 100 million gallon
3
per year ethanol plant located near Lawler, Iowa. The primary products produced at the plant are ethanol, distiller grains and corn oil. We commenced production on April 4, 2009. The ethanol plant is currently operating at a rate in excess of its nameplate production capacity of 100 million gallons of ethanol per year.
On December 3, 2015, we executed a consulting agreement with Cornerstone Resources LLC ("Cornerstone Resources"). Pursuant to the consulting agreement, Cornerstone Resources provides the services of James Broghammer to serve as Homeland's President and CEO. On September 29, 2016, we agreed to amend and restate the consulting agreement to extend the term of the consulting agreement and revise the bonus compensation paid to Mr. Broghammer pursuant to the consulting agreement. The term was extended until December 31, 2016, with an optional extension of the Agreement for an additional six months which we exercised.
On December 21, 2016, our board of directors approved a plan to expand our ethanol production facility. We plan to increase our capacity by approximately 35 million gallons of ethanol per year and add additional grain storage capacity. The total capital cost of this project is expected to be approximately $42 million. We plan to finance the expansion using a combination of additional debt financing and cash from operations. As part of this expansion project, we entered into an Equipment Purchase and Installation Agreement (the "Construction Agreement") with ICM, Inc. ("ICM"). Pursuant to the Construction Agreement, ICM agreed to construct and install an ICM designed dual dryer system at the Company's ethanol production facility. The total cost of the system pursuant to the Construction Agreement is $27 million. The $27 million purchase price will be paid in several periodic payments as the system is constructed and installed. The dual dryer system is expected to be completed during the first quarter of 2018.
On June 13, 2013, we entered into an agreement with Steve Retterath, our largest member, to repurchase and retire all of the units owned by Mr. Retterath. We agreed to repurchase and retire 25,860 membership units owned by Mr. Retterath in exchange for $30 million, to be paid in two equal installments, payable at closing and on July 1, 2014. The transaction failed to close by August 1, 2013 due to objections by Mr. Retterath. The Company believes that it has a binding agreement with Mr. Retterath. On August 14, 2013, the Company filed a lawsuit against Mr. Retterath in Iowa state court to enforce the terms of the repurchase agreement. The Company is asking the Iowa state court to require Mr. Retterath to complete the repurchase agreement pursuant to its terms.
Mr. Retterath contends he is not bound by the agreement. Our position is that, as of the closing date, Mr. Retterath is no longer the equitable owner of any membership units in the Company. As a result, we have recorded a $30 million short-term liability related to the amount we agreed to pay Mr. Retterath to repurchase his membership units and have correspondingly reduced members' equity on our balance sheet. If we are ultimately unsuccessful in our lawsuit against Mr. Retterath, the Company will reevaluate the accounting considerations made during the period of time that the lawsuit is pending.
On the scheduled closing date for the repurchase agreement, Mr. Retterath sued the Company along with several directors, our former CEO, CFO, COO, a former director and our outside legal counsel in Florida state court. This lawsuit was subsequently removed to federal court in the State of Florida and ultimately to federal court in the State of Iowa. The federal court in the State of Iowa dismissed the only federal claim in Mr. Retterath's lawsuit against the Company and remanded the case to Florida state court. In August 2016, Mr. Retterath voluntarily dismissed this lawsuit.
On February 18, 2015, we filed a motion for summary judgment asking the Iowa state court to rule that the repurchase agreement was valid and enforceable and ordering Mr. Retterath to perform his obligations pursuant to the repurchase agreement. Mr. Retterath along with his son and daughter-in-law filed motions for summary judgment asking the Iowa state court to rule that the repurchase agreement was invalid. The Iowa state court entered a ruling granting Homeland's motion for summary judgment and determined no membership vote was required as Mr. Retterath has contended. The Iowa state court also denied the summary judgment motions filed by Mr. Retterath and his son and daughter-in-law.
In January 2017, we went to trial with Mr. Retterath on the first part of the Iowa state court case regarding whether the repurchase agreement is valid and enforceable. Once the Iowa state court renders its decision, a second part of the lawsuit will go to trial regarding the tax treatment associated with the repurchase between the time when the agreement was signed and the decision regarding the enforceability of the repurchase agreement.
On August 9, 2013, GS Cleantech Corporation ("GS Cleantech"), a subsidiary of Greenshift Corporation, filed a complaint in the United States District for the Northern District of Iowa against the Company. The Company is one of more than twenty ethanol manufacturers that were sued by GS Cleantech. The complaint alleges that the Company's operation of a corn oil extraction process infringes patent rights claimed by GS Cleantech. GS Cleantech seeks royalties, damages and potentially triple damages associated with the alleged infringement, as well as attorney's fees. The complaint was transferred to the United States District Court for the Southern District of Indiana due to a finding that the action involves questions of fact common to several other
4
lawsuits which were joined in a multi-district litigation ("MDL"). The MDL Court developed two tracks of defendants in this litigation. The first track includes defendants which were originally sued by GS Cleantech in 2010 and a second track of defendants sued in 2013 which includes the Company. On October 23, 2014, the MDL Court granted summary judgment in favor of the first track of defendants and found that the GS Cleantech patents which the Company is alleged to have infringed are invalid. Further, in a January 16, 2015 decision, the MDL ruled in favor of a stipulated motion for partial summary judgment finding that all of the GS Cleantech patents in the suit were invalid and, therefore, not infringed. GS Cleantech has said it will appeal this decision when the remaining claim in the suit has been decided. If GS Cleantech successfully appeals the District Court’s findings of invalidity, damages awarded GS Cleantech may be $1 million or more.
The only remaining claim in the lawsuit alleges that GS Cleantech inequitably conducted itself before the United States Patent Office when obtaining the patents at issue. A trial in the District Court for the Southern District of Indiana on the single issue of inequitable conduct was held in October 2015. Recently, the MDL Court ruled that GS Cleantech had engaged in inequitable conduct. GS Cleantech has asked the court to amend its ruling. The defendants are seeking damages against GS Cleantech and its attorneys as a result of this finding of inequitable conduct. We anticipate that if the determination of inequitable conduct is not amended, GS Cleantech will appeal this decision along with the summary judgment decision issued earlier.
Financial Information
Please refer to "Item 7 - Management's Discussion and Analysis of Financial Condition and Results of Operations" for information about our revenue, profit and loss measurements and total assets and liabilities and "Item 8 - Financial Statements and Supplementary Data" for our financial statements and supplementary data.
Principal Products
The principal products that we produce are ethanol, distiller grains and corn oil. The table below shows the approximate percentage of our total revenue which is attributed to each of our primary products for each of our last three fiscal years.
Product | Fiscal Year 2016 | Fiscal Year 2015 | Fiscal Year 2014 | ||||||
Ethanol | 79 | % | 75 | % | 76 | % | |||
Distiller Grains | 17 | % | 22 | % | 21 | % | |||
Corn Oil | 4 | % | 3 | % | 3 | % | |||
Ethanol
Ethanol is ethyl alcohol, a fuel component made primarily from corn and various other grains. Ethanol is primarily used as: (i) an octane enhancer in fuels; (ii) an oxygenated fuel additive for the purpose of reducing ozone and carbon monoxide vehicle emissions; and (iii) a non-petroleum-based gasoline substitute. Ethanol produced in the United States is primarily used for blending with unleaded gasoline and other fuel products. Ethanol blended fuel is typically designated in the marketplace according to the percentage of the fuel that is ethanol, with the most common fuel blend being E10, which includes 10% ethanol. The United States Environmental Protection Agency ("EPA") has approved the use of gasoline blends that contain 15% ethanol, or E15, for use in all vehicles manufactured in model year 2001 and later. In addition, flexible fuel vehicles can use gasoline blends that contain up to 85% ethanol called E85.
Our ethanol plant uses corn as the feedstock in the ethanol production process. A corn-based ethanol plant is essentially a fermentation plant. Ground corn and water are mixed with enzymes and yeast to produce a substance called "beer," which contains approximately 15% alcohol, 11% solids and 74% water. The beer is boiled to separate the water, resulting in ethyl alcohol, which is then dehydrated to increase the alcohol content. This product is then mixed with a certified denaturant, such as gasoline, to make the product unfit for human consumption which allows it to be sold commercially.
Distiller Grains
The principal co-product of the ethanol production process is distiller grains, a high protein, high-energy animal feed supplement primarily marketed to the dairy and beef industry. We produce two forms of distiller grains: Modified/Wet Distiller Grains ("MWDG") and Distiller Dried Grains with Solubles ("DDGS"). MWDG is processed corn mash that has been dried to approximately 50% moisture. MWDG has a shelf life of approximately seven days and is often sold to markets near our ethanol plant. DDGS is processed corn mash that has been dried to approximately 10% moisture. It has a longer shelf life and may be sold and shipped to any market, regardless of its vicinity to our ethanol plant. We market nearly all of our distiller grains as DDGS.
5
Corn Oil
In October 2011, we commenced operating our corn oil extraction equipment. The corn oil extraction equipment we installed allows us to remove some of the corn oil contained in our distiller grains and sell the corn oil separately. The corn oil that we are capable of producing is not food grade corn-oil and it cannot be used for human consumption. The primary uses of the corn oil that we produce are for animal feed, industrial uses and biodiesel production.
Principal Product Markets
Ethanol
The primary market for our ethanol is the domestic fuel blending market. However, in recent years the United States has experienced increased ethanol exports. This increase in ethanol exports follows a conscious effort by the United States ethanol industry to expand ethanol exports along with lower ethanol prices which encourage exports. During our 2016 fiscal year, exports of ethanol have increased with the top destinations being Brazil, Canada, China, India, Peru and the Philippines. However, ethanol export demand is more unpredictable than domestic demand and tends to fluctuate throughout the year as it is subject to monetary and political forces in other nations. An example of this, the recent imposition of a tax on imported ethanol by Brazil has created uncertainty as to the viability of that market for ethanol produced in the United States and may require United States producers to seek out other markets for their products. In addition, the strong U.S. Dollar may have negatively impacted ethanol exports from the United States during 2016. Also, the Chinese recently increased the tariff on imported ethanol from 5% to 30% which management believes could negatively impact ethanol prices in the United States.
Ethanol is generally blended with gasoline before it is sold to the end consumer. Therefore, the primary purchasers of ethanol are fuel blending companies who mix the ethanol we produce with gasoline. As discussed below in the section entitled "Distribution of Principal Products," we have a third party marketer that sells all of our ethanol. Our ethanol marketer makes substantially all decisions regarding where our ethanol is sold.
Distiller Grains
Distiller grains are primarily used as animal feed. Distiller grains are typically fed to animals instead of other traditional animal feeds such as corn and soybean meal. Distiller grains exports have increased in recent years as distiller grains have become a more accepted animal feed. The United States ethanol industry exported a significant amount of distillers grains to China and Mexico over the past fiscal year with South Korea and Vietnam receiving notable amounts. However, exports of distillers grains weakened during this past fiscal year. Earlier this year, China began an anti-dumping and countervailing duty investigation related to distillers grains imported from the United States which contributed to a decline in distillers grains shipped to China. Recently, China issued a final ruling on the anti-dumping investigation imposing an immediate duty on distillers grains that are produced in the United States. In addition, China implemented a final anti-subsidy duty in January 2017. The imposition of these duties are expected to result in a further decline in demand from this top importer requiring United States producers to seek out alternatives markets.
Corn Oil
The primary markets for corn oil are the industrial chemicals market, animal feeding market and the biodiesel production market. Corn oil demand was higher during 2016 partially as a result of the reintroduction of the biodiesel blenders' tax credit during 2016 which increased biodiesel production. However, additional corn oil supply has continued to enter the market which has negatively impacted corn oil prices. The market for corn oil is expected to continue to shift as changes in supply and demand of corn oil interact. Our corn oil is primarily marketed in the United States and we do not expect that significant exports of corn oil will occur in the near future.
Distribution of Principal Products
We have hired third party marketers who are responsible for the distribution of all of the products we produce. Below is a description of the arrangements we have with our ethanol, distiller grains and corn oil marketers.
Ethanol Distribution
We have an ethanol marketing agreement with Renewable Products Marketing Group, Inc. ("RPMG"), a professional third party marketer, which is the sole marketer of our ethanol. RPMG also markets all of our corn oil. We are an equity owner of RPMG, LLC ("RPMG, LLC"), the parent company of RPMG, which allows us to realize favorable marketing fees and
6
transparency in the sale of our ethanol and corn oil. Our ethanol marketing agreement provides we can sell our ethanol either through an index arrangement or at a fixed price agreed to between us and RPMG. The term of the ethanol marketing agreement is perpetual, until it is terminated. The primary reasons the ethanol marketing agreement would terminate are if we cease to be an owner of RPMG, LLC, if there is a breach of the ethanol marketing agreement which is not cured, or if we give advance notice to RPMG that we wish to terminate the ethanol marketing agreement. Notwithstanding our right to terminate the ethanol marketing agreement, we may be obligated to continue to market our ethanol through RPMG for a period of time after termination. Further, following termination, we would accept an assignment of certain railcar leases which RPMG has secured to service our ethanol sales. If our ethanol marketing agreement is terminated, it would trigger a redemption by RPMG, LLC of our ownership interest in RPMG, LLC.
Distiller Grains Distribution
We have a Distiller Grains Marketing Agreement with CHS, Inc. ("CHS"), pursuant to which CHS agreed to purchase all of the distiller grains produced at our plant. The initial term of the distiller grains marketing agreement was one year, beginning with the start-up of operations and production at the plant. After the initial one-year term, the agreement automatically renews for successive one year terms unless either party gives 90 days written notice of termination before the current term expires.
CHS agreed to pay us 98% of the actual sale price received by CHS from its customers for DDGS sold and 96% of the actual sale price received by CHS for MWDG sold, subject to certain minimum and maximum fees per ton. CHS deducts the customary freight costs incurred by CHS in delivering the distiller grains to its customers from our portion of the distiller grains sale price.
Corn Oil Distribution
In July 2011, we entered into a Corn Oil Marketing Agreement with RPMG. We have an exclusive marketing arrangement with RPMG where it will market all of the corn oil that we produce. We agreed to pay RPMG a commission based on each pound of corn oil that RPMG sells on our behalf. We also agreed to pay certain costs associated with RPMG marketing our corn oil. The initial term of the corn oil marketing agreement is for one year and the agreement automatically renews for additional one year terms unless written notice is given, either by us or RPMG, at least ninety days prior to the expiration of the current term of the agreement.
New Products and Services
We did not introduce any new products or services during our 2016 fiscal year.
Competition
We are in direct competition with numerous ethanol producers in the sale of our products and with respect to raw material purchases related to those products. Many of the ethanol producers with which we compete have greater resources than we do. While management believes we are a lower cost producer of ethanol, larger ethanol producers may be able to take advantage of economies of scale due to their larger size and increased bargaining power with both ethanol, distiller grains and corn oil customers as well as raw material suppliers. As of December 1, 2016, the Renewable Fuels Association estimates that there are 213 ethanol production facilities in the United States with capacity to produce approximately 15.8 billion gallons of ethanol per year. According to RFA estimates, approximately 2% of the ethanol production capacity in the United States was not operating as of December 1, 2016. The largest ethanol producers include Archer Daniels Midland, Flint Hills Resources, Green Plains Renewable Energy, POET, and Valero Renewable Fuels, each of which are capable of producing significantly more ethanol than we produce.
7
The following table identifies the largest ethanol producers in the United States along with their production capacities.
U.S. FUEL ETHANOL PRODUCTION CAPACITY
BY TOP PRODUCERS
Producers of Approximately 700
million gallons per year (MMgy) or more
Company | Current Capacity (MMgy) | Percent of Market | ||||
Archer Daniels Midland | 1,761 | 11 | % | |||
POET Biorefining | 1,629 | 10 | % | |||
Valero Renewable Fuels | 1,400 | 9 | % | |||
Green Plains Renewable Energy | 1,461 | 9 | % | |||
Flint Hills Resources | 820 | 5 | % | |||
Updated: December 1, 2016
The products that we produce are commodities. Since our products are commodities, there are typically no significant differences between the products we produce and the products of our competitors that would allow us to distinguish our products in the market. As a result, competition in the ethanol industry is primarily based on price and consistent quality.
We have experienced increased competition from oil companies that have purchased ethanol production facilities. These oil companies are required to blend a certain amount of ethanol each year. Therefore, the oil companies may be able to operate their ethanol production facilities at times when it is unprofitable for us to operate our ethanol plant. Further, some ethanol producers own multiple ethanol plants which may allow them to compete more effectively by providing them flexibility to run certain production facilities while they have other facilities shut down. Finally, some ethanol producers who own ethanol plants in geographically diverse areas of the United States may spread the risk they encounter related to feedstock prices due to localized corn shortages or poor growing conditions.
We anticipate increased competition from renewable fuels that do not use corn as the feedstock. Many of the current ethanol production incentives are designed to encourage the production of renewable fuels using raw materials other than corn. One type of ethanol production feedstock that is being explored is cellulose. Cellulose is the main component of plant cell walls and is the most common organic compound on earth. Cellulose is found in wood chips, corn stalks, rice straw, amongst other common plants. Cellulosic ethanol is ethanol produced from cellulose. There are several commercial scale cellulosic ethanol production facilities either in production or in the construction phase. If this technology can be profitably employed on a commercial scale, it could potentially lead to ethanol that is less expensive to produce than corn based ethanol, especially when corn prices are high. Cellulosic ethanol may also capture more government subsidies and assistance than corn based ethanol. This could decrease demand for our product or result in competitive disadvantages for our ethanol production process.
A number of automotive, industrial and power generation manufacturers are developing alternative clean power systems using fuel cells, plug-in hybrids, electric cars or clean burning gaseous fuels. Electric car technology has recently grown in popularity, especially in urban areas. While there are currently a limited number of vehicle recharging stations, making electric cars not feasible for all consumers, there has been increased focus on developing these recharging stations to make electric car technology more widely available in the future. Additional competition from these other sources of alternative energy, particularly in the automobile market, could reduce the demand for ethanol, which would negatively impact our profitability.
Competition among ethanol producers may continue to increase as gasoline demand decreases due to more fuel efficient vehicles being produced. If the concentration of ethanol used in most gasoline does not increase and gasoline demand is lower due to increased fuel efficiency by the vehicles operated in the United States, competition may increase among ethanol producers to supply the ethanol market.
Distiller Grains Competition
Our ethanol plant competes with other ethanol producers in the production and sales of distillers grains. Distillers grains are primarily used as an animal feed supplement which replaces corn and soybean meal. As a result, we believe that distillers grains prices are positively impacted by increases in corn and soybean prices. In addition, in recent years the United States ethanol industry has increased exports of distillers grains which management believes has positively impacted demand and prices for distillers grains in the United States. In the event these distillers grains exports decrease, including as a result of the Chinese tariffs
8
which have significantly reduced export demand for distillers grains, it could lead to an oversupply of distillers grains in the United States. An oversupply of distillers grains could result in increased competition among ethanol producers for sales of distillers grains which could negatively impact market distillers grains prices in the United States.
Corn Oil Competition
We compete with many ethanol producers for the sale of corn oil. Many ethanol producers have installed the equipment necessary to separate corn oil from the distiller grains they produce which has increased competition for corn oil sales and has resulted in lower market corn oil prices. Competition for corn oil sales has increased with the expiration of the biodiesel blenders' blenders credit at the end of 2016 which limits the market for corn oil sales due to anticipated lower biodiesel production.
Sources and Availability of Raw Materials
Corn Supply
The major raw material required to produce ethanol, distiller grains and corn oil at our plant is corn. The ethanol plant is currently operating at a rate in excess of its nameplate capacity. We anticipate that we will require approximately 52 million bushels of corn per year to produce approximately 145 million gallons of ethanol per year. However, starting in 2018 we anticipate purchasing a significant amount of additional corn due to our plant expansion project. Management prepared a corn origination study and we anticipate that we can purchase this additional corn at competitive prices. However, the additional corn demand may result in higher corn prices in the future. We buy as much corn as possible from local grain elevators and farmers. Our commodities manager is responsible for purchasing corn for our operations, scheduling corn deliveries and establishing hedging positions to protect the price we pay for corn.
During 2016, the United States harvested another large corn crop. Further, due to the large corn crops which were harvested in 2014 and 2015, there was a significant carryover of corn from the prior year. As a result of the large corn crop and higher carryover, management anticipates that corn prices will remain lower during our 2017 fiscal year. However, if we experience unfavorable weather conditions, either throughout the United States or more locally in the corn area that serves the plant, we may experience higher corn prices and increased corn price volatility. Further, farmers may choose to plant less corn due to lower corn prices which could impact corn prices moving forward.
Commodities Account
In an attempt to minimize the effects of the volatility of corn costs on our profitability, we have two commodities trading accounts with ADM Investor Services, Inc. ("ADMIS"). In addition, we have a commodities manager who manages our corn procurement activities. ADMIS serves as our broker for the purchase and sale of commodity futures contracts for corn, and enters into transactions and exercises commodity options for our account in accordance with our instructions. We are required to maintain adequate margins in our accounts, and if we do not maintain adequate margins, ADMIS may close out any of our positions or transfer funds from our other accounts to cover the margin.
The effectiveness of our risk management strategy is dependent on the cost of corn and our ability to sell sufficient ethanol to use all of the corn for which we have futures contracts. Our risk management activities may not be successful in reducing the risk caused by price fluctuation, which may leave us vulnerable to high corn prices.
Utilities
We entered into an agreement with Northern Natural Gas in April 2008 for connection to its interstate pipeline and for transportation services for our natural gas supply. To access sufficient supplies of natural gas to operate the plant, a dedicated lateral pipeline from Northern Natural Gas's interstate pipeline has been constructed to service our plant. Construction of the natural gas lateral pipeline was completed prior to the commencement of our operations at the ethanol plant. We purchase our natural gas through various suppliers.
We entered into an Energy Management Services Agreement with U.S. Energy dated July 10, 2009. Pursuant to the agreement, U.S. Energy assists us with electric energy and natural gas management and procurement. U.S. Energy's responsibilities include administration of our gas supply contracts, nomination, scheduling and other logistical issues such as storage and transportation, negotiation and delivery. We work with U.S. Energy to provide estimated usage volumes on a monthly basis. In exchange for these management services, we pay a monthly service fee, as well as pre-approved expenses in connection with the services. The agreement for these services continues on a month to month basis.
9
On March 6, 2009, we entered into an Electrical Services Agreement with Hawkeye Tri-County Electric Cooperative (Hawkeye), to supply all of the electricity necessary to operate the ethanol plant. Pursuant to the agreement, Hawkeye has installed the electrical facilities necessary to deliver all of the electric power and energy required to operate our ethanol plant. The agreement with Hawkeye will remain in effect for ten years from the date we began processing ethanol at the plant (April 2009), and will terminate on the tenth anniversary of that date (April 2019). We may continue to receive the service following expiration of the ten-year term for a minimum of two years. Either party will then have the right to terminate the agreement upon six months' written notice.
During our 2016 fiscal year we installed a steam turbine which allows us to use excess steam produced by the ethanol plant to generate electricity that we use in our production process. Management believes that this project allows us to decrease our total utility costs and allows us to operate the ethanol plant more profitably.
Seasonality of Sales
We experience some seasonality of demand for our ethanol, distiller grains and corn oil. Since ethanol is predominantly blended with gasoline for use in automobiles, ethanol demand tends to shift in relation to gasoline demand. As a result, we experience some seasonality of demand for ethanol in the summer months related to increased driving and, as a result, increased gasoline demand. In addition, we experience some increased ethanol demand during holiday seasons related to increased gasoline demand. We also experience decreased distiller grains demand during the summer months due to natural depletion in the size of herds at cattle feed lots and when the animals are turned out to pasture or are slaughtered. Further, we expect some seasonality of demand for our corn oil since a major corn oil user is the biodiesel industry which typically reduces production during the winter months.
Working Capital
We primarily use our working capital for purchases of raw materials necessary to operate the ethanol plant, for payments on our credit facilities, for distributions to our members and for capital expenditures to maintain and upgrade the ethanol plant. Our primary sources of working capital are income from our operations as well as our revolving line of credit with our primary lender, Home Federal Savings Bank ("Home Federal"). We are in the process of expanding the ethanol plant. We plan to enter into a new term loan in order to partially finance the expansion. Management believes that our current sources of working capital are sufficient to sustain our operations for our 2017 fiscal year and beyond and that we will be able to finance the expansion project using a term loan we anticipate receiving during our 2017 fiscal year.
Dependence on One or a Few Major Customers
As discussed previously, we have exclusive marketing agreements with RPMG for sales of our ethanol and corn oil and with CHS for sales of our distiller grains. As a result, we rely on RPMG and CHS for the sale and distribution of all of our products. Any loss of RPMG or CHS as the marketing agent for our products could have a significant negative impact on our revenues. While we anticipate that we could secure other ethanol, distiller grains and corn oil marketers if necessary, any loss of our marketers could significantly impact our ability to operate the ethanol plant profitably.
Patents, Trademarks, Licenses, Franchises and Concessions
We do not currently hold any patents, trademarks, franchises or concessions. We were granted a perpetual and royalty free license by ICM, Inc. ("ICM") to use certain ethanol production technology necessary to operate our ethanol plant. The cost of the license granted by ICM was included in the amount we paid to Fagen, Inc. to design and build our ethanol plant.
Governmental Regulation and Federal Ethanol Supports
Federal Ethanol Supports
The ethanol industry is dependent on several economic incentives to produce ethanol, the most significant of which is the Federal Renewable Fuels Standard (the "RFS"). The RFS requires that in each year, a certain amount of renewable fuels must be used in the United States. The RFS is a national program that does not require that any renewable fuels be used in any particular area or state, allowing refiners to use renewable fuel blends in those areas where it is most cost-effective. The RFS statutory volume requirement increases incrementally each year until the United States is required to use 36 billion gallons of renewable fuels by 2022. Starting in 2009, the RFS required that a portion of the RFS must be met by certain "advanced" renewable fuels. These advanced renewable fuels include ethanol that is not made from corn, such as cellulosic ethanol and biomass based biodiesel. The use of these advanced renewable fuels increases each year as a percentage of the total renewable fuels required to be used in the United States.
10
The United States Environmental Protection Agency (the "EPA") has the authority to waive the RFS statutory volume requirement, in whole or in part, provided one of the following two conditions have been met: (1) there is inadequate domestic renewable fuel supply; or (2) implementation of the requirement would severely harm the economy or environment of a state, region or the United States. Annually, the EPA is supposed to pass a rule that establishes the number of gallons of different types of renewable fuels that must be used in the United States which is called the renewable volume obligations. The RFS statutory Renewable Volume Obligation (RVO) for corn-based ethanol was 14.4 billion gallons in 2014, 15 billion gallons in 2015 and 15 billion gallons in 2016. On November 30, 2015, the EPA released its final RVO for corn-based ethanol for 2014 through 2016. The final RVO reduced the corn-based ethanol use requirements pursuant to the RFS below the statutory requirements. Pursuant to the final RVO release, the RFS requirement for corn-based ethanol was 13.61 billion gallons for 2014, 14.05 billion gallons for 2015 and 14.5 billion gallons for 2016. On May 18, 2016, the EPA released a proposed rule to set the RVO for 2017. The EPA proposed to set the total RVO at 18.8 billion gallons of which 14.8 billion gallons could be met by corn-based ethanol. A public hearing on the proposed rule was held in June and the public comment period expired on July 11, 2016. The final rule was released on November 23, 2016 and the corn-based ethanol RVO was increased to 15 billion gallons, which equals the statutory requirement in the RFS. However, previous reductions in the RVO have negatively impacted the ethanol industry.
In February 2010, the EPA issued new regulations governing the RFS. These new regulations are called RFS2. The most controversial part of RFS2 involves what is commonly referred to as the lifecycle analysis of greenhouse gas emissions. Specifically, the EPA adopted rules to determine which renewable fuels provided sufficient reductions in greenhouse gases, compared to conventional gasoline, to qualify under the RFS program. RFS2 establishes a tiered approach, where regular renewable fuels are required to accomplish a 20% greenhouse gas reduction compared to gasoline, advanced biofuels and biomass-based biodiesel must accomplish a 50% reduction in greenhouse gases, and cellulosic biofuels must accomplish a 60% reduction in greenhouse gases. Any fuels that fail to meet this standard cannot be used by fuel blenders to satisfy their obligations under the RFS program. The scientific method of calculating these greenhouse gas reductions has been a contentious issue. Many in the ethanol industry were concerned that corn based ethanol would not meet the 20% greenhouse gas reduction requirement based on certain parts of the environmental impact model that many in the ethanol industry believed was scientifically suspect. However, RFS2 as adopted by the EPA provides that corn-based ethanol from modern ethanol production processes does meet the definition of a renewable fuel under the RFS program. Our ethanol plant was grandfathered into the RFS due to the fact that it was constructed prior to the effective date of the lifecycle greenhouse gas requirement and is not required to prove compliance with the lifecycle greenhouse gas reductions. Many in the ethanol industry are concerned that certain provisions of RFS2 as adopted may disproportionately benefit ethanol produced from sugarcane which could make sugarcane based ethanol, which is primarily produced in Brazil, more competitive in the United States ethanol market. If this were to occur, it could reduce demand for the ethanol that we produce.
Most ethanol that is used in the United States is sold in a blend called E10. E10 is a blend of 10% ethanol and 90% gasoline. E10 is approved for use in all standard vehicles. Estimates indicate that gasoline demand in the United States is approximately 140 billion gallons per year. Assuming that all gasoline in the United States is blended at a rate of 10% ethanol and 90% gasoline, the maximum demand for ethanol is 14.0 billion gallons per year. This is commonly referred to as the "blend wall," which represents a theoretical limit where more ethanol cannot be blended into the national gasoline pool. This is a theoretical limit because it is believed that it would not be possible to blend ethanol into every gallon of gasoline that is being used in the United States and it discounts the use of higher percentage blends such as E15 or E85. These higher percentage blends may lead to additional ethanol demand if they become more widely available and accepted by the market.
Many in the ethanol industry believe that it will be impossible to meet the RFS requirement in future years without an increase in the percentage of ethanol that can be blended with gasoline for use in standard (non-flex fuel) vehicles. The EPA has approved the use of E15, gasoline which is blended at a rate of 15% ethanol and 85% gasoline, in vehicles manufactured in the model year 2001 and later. However, there are still state hurdles that need to be addressed in some states before E15 will become more widely available. Many states still have regulatory issues that prevent the sale of E15. Sales of E15 may be limited because it is not approved for use in all vehicles, the EPA requires a label that management believes may discourage consumers from using E15, and retailers may choose not to sell E15 due to concerns regarding liability. In addition, different gasoline blendstocks may be required at certain times of the year in order to use E15 due to federal regulations related to fuel evaporative emissions which may limit E15 sales in these markets. As a result, the approval of E15 by the EPA has not had an immediate impact on ethanol demand in the United States.
Effect of Governmental Regulation
Plant operations are governed by the Occupational Safety and Health Administration ("OSHA"). OSHA regulations may change such that the costs of operating the ethanol plant may increase. Any of these regulatory factors may result in higher costs or other adverse conditions effecting our operations, cash flows and financial performance.
11
In late 2009, California passed a Low Carbon Fuels Standard ("LCFS"). The California LCFS requires that renewable fuels used in California must accomplish certain reductions in greenhouse gases which is measured using a lifecycle analysis, similar to the RFS. On December 29, 2011, a federal district court in California ruled that the California LCFS was unconstitutional which halted implementation of the California LCFS. However, the California Air Resources Board ("CARB") appealed this court ruling and on September 18, 2013, the federal appellate court reversed the federal district court finding the LCFS constitutional and remanding the case back to federal district court to determine whether the LCFS imposes a burden on interstate commerce that is excessive in light of the local benefits. On June 30, 2014, the United States Supreme Court declined to hear the appeal of the federal appellate court ruling and CARB re-adopted the LCFS with some slight modifications. The LCFS could have a negative impact on demand for corn-based ethanol and result in decreased ethanol prices affecting our ability to operate profitably.
Costs and Effects of Compliance with Environmental Laws
We are subject to extensive air, water and other environmental regulations and we require a number of environmental permits to operate the plant. We have obtained all permits that are currently required for operation of the plant. In the fiscal year ended December 31, 2016, we incurred costs and expenses of approximately $111,000 complying with environmental laws, including the cost of obtaining permits. Although we have been successful in obtaining all of the permits currently required, any retroactive change in environmental regulations, either at the federal or state level, could require us to obtain additional or new permits or spend considerable resources in complying with such regulations. We anticipate incurring costs and expenses of approximately $150,000 for compliance with environmental laws for our fiscal year ended December 31, 2017.
Research and Development
We are continually working to develop new methods of operating the ethanol plant more efficiently. We continue to conduct research and development activities in order to realize these efficiency improvements.
Employees
As of December 31, 2016, we had 47 full-time employees. We do not anticipate a significant change in the number of full-time employees we have in the next 12 months.
Financial Information about Geographic Areas
All of the products we sold to our customers for our fiscal years 2016, 2015 and 2014 were produced in the United States and all of our long-lived assets and operations are domiciled in the United States. We have engaged third-party professional marketers that decide where our products are marketed and we have limited control over the marketing decisions made by our marketers. Our marketers may decide to sell our products in countries other than the United States. Currently, a significant amount of distiller grains are exported to China, Mexico, South Korea, Vietnam and Canada and the United States ethanol industry exported significant amounts of ethanol to Canada, Brazil, China, India and the Philippines. However, we anticipate that our products will still primarily be marketed and sold in the United States.
ITEM 1A. RISK FACTORS.
You should carefully read and consider the risks and uncertainties below and the other information contained in this report. The risks and uncertainties described below are not the only ones we may face. The following risks, together with additional risks and uncertainties not currently known to us or that we currently deem immaterial could impair our financial condition and results of operation.
Risks Relating to Our Business
The spread between ethanol and corn prices can vary significantly which can negatively impact our financial condition. Our only source of revenue comes from sales of our ethanol, distiller grains and corn oil. The primary raw materials we use to produce our ethanol, distiller grains and corn oil are corn and natural gas. In order to operate the ethanol plant profitably, we must maintain a positive spread between the revenue we receive from sales of our products and our corn and natural gas costs. This spread between the market price of our products and our raw material costs has been volatile in the past. If we were to experience a period of time where this spread is negative, and the negative margins continue for an extended period of time, it may prevent us from profitably operating the ethanol plant which could decrease the value of our units.
Decreasing gasoline prices may lower ethanol prices which could negatively impact our ability to operate profitably. In recent years, the price of ethanol has been less than the price of gasoline which increased demand for ethanol from fuel blenders.
12
However, at various times in recent years, the price of gasoline has decreased which has reduced the spread between the price of gasoline and the price of ethanol. This trend has negatively impacted ethanol prices. If this trend continues for a significant period of time, it could hurt our ability to profitably operate the ethanol plant which could decrease the value of our units.
Distiller grains demand and prices may be negatively impacted by the Chinese anti-dumping and countervailing duty investigation. China was historically the world's largest importer of distiller grains produced in the United States. On January 12, 2016, the Chinese government announced that it would commence an anti-dumping and countervailing duty investigation related to distiller grains imported from the United States. On September 23, 2016, the Chinese instituted a preliminary anti-dumping duty of 33% in response to this investigation and an anti-subsidy duty on September 30, 2016 of approximately 10%. In January 2017, the Chinese finalized the anti-dumping and anti-subsidy duties at rates higher than the preliminary rates set in September 2016. The anti-dumping duties will range from 42.2% to 53.7%, an increase from the preliminary duty of 33.8% issued in September 2016. The final anti-subsidy tariffs will range from 11.2% to 12%, up from 10% to 10.7% issued in September 2016. Both during the investigation and after the announcement of the duties, distiller grains demand and prices have been negatively impacted. While we expect China to continue to import some distiller grains, we do not anticipate that the imports will be at the same level as previous years which could continue to negatively impact market distiller grains demand and prices. This potential reduction in demand along with lower domestic corn prices could negatively impact our ability to profitably operate the ethanol plant.
We may be forced to reduce production or cease production altogether if we are unable to secure the corn we require to operate the ethanol plant. Our ability to operate the ethanol plant requires us to purchase a sufficient amount of corn throughout the year in order to continuously operate the ethanol plant. If we are unable to secure the corn we require, either now or in the future, it could negatively impact our operations. If we are unable to secure the corn we require to continue to operate the ethanol plant, we may have to reduce production or cease operating altogether which may negatively impact the value of our units.
We may violate the terms of our credit agreements and financial covenants which could result in our lender demanding immediate repayment of our loans. Our credit agreements with Home Federal require that we comply with various financial loan covenants. We are currently in compliance with all of our financial loan covenants. Current management projections indicate that we will be in compliance with our loan covenants for at least the next 12 months. However, unforeseen circumstances may develop which could result in us violating our loan covenants. If we violate the terms of our credit agreements, including our financial loan covenants, Home Federal could deem us to be in default of our loans and prevent us from drawing funds on our revolving line of credit and also require us to immediately repay any outstanding balance of our loans. If we do not have the funds available to repay the loans or we cannot find another source of financing, we may fail which could decrease or eliminate the value of our units.
Our marketers may fail to sell all of the ethanol, distiller grains and corn oil we produce which could negatively impact our profitability. We rely on our ethanol, distiller grains and corn oil marketers to sell all of our products. Currently we have an agreement with RPMG which markets all of our ethanol and corn oil and we have an agreement with CHS to market all of our distiller grains. Our only source of revenue is from the sale of our ethanol, distiller grains and corn oil. If our marketers are unable to sell all of the ethanol, distiller grains or corn oil we produce, or if they are unable to sell them at prices that allow us to operate profitability, the value of our units may be negatively impacted. Further, RPMG or CHS could fail. While we anticipate that we will be able to secure alternative marketers should RPMG or CHS cease marketing our products for any reason, we may not be able to do so without incurring additional costs or without a reduction in our revenue. Any loss of our ethanol, distiller grains or corn oil marketers may negatively impact our profitability and could decrease the value of our units.
We engage in hedging transactions which involve risks that can harm our business. We are exposed to market risk from changes in commodity prices. Exposure to commodity price risk results from our dependence on corn and natural gas in the ethanol production process. We seek to minimize the risks from fluctuations in the prices of corn and natural gas through the use of hedging instruments. These hedging instruments can be risky and can negatively impact our liquidity. In times when commodity prices are volatile, we may be required to use significant amounts of cash to make margin calls as a result of our hedging positions. The effectiveness of our hedging strategies is dependent on the cost of corn and natural gas and our ability to sell sufficient products to use all of the corn and natural gas for which we have futures contracts. Our hedging activities may not successfully reduce the risk caused by price fluctuations which may leave us vulnerable to high corn and natural gas prices. Alternatively, we may choose not to engage in hedging transactions in the future. As a result, our future results of operations and financial condition may also be adversely affected during periods in which corn and/or natural gas prices increase. These hedging transactions could impact our ability to profitably operate the ethanol plant and negatively impact our liquidity.
Our business is not diversified. Our success depends almost entirely on our ability to profitably operate our ethanol plant. We do not have any other lines of business or other sources of revenue if we are unable to operate our ethanol plant and manufacture ethanol, distiller grains and corn oil. If economic or political factors adversely affect the market for ethanol, distiller
13
grains and corn oil, we have no other line of business to fall back on. Our business would also be significantly harmed if the ethanol plant could not operate at full capacity for any extended period of time which could reduce the value of our units.
We depend on our management and key employees, and the loss of these relationships could negatively impact our ability to operate profitably. We are highly dependent on our management team to operate our ethanol plant. Our management employees may decide to end their employment with us. If one or more of our management employees terminate their employment, we may not be able to replace these individuals. While we seek to compensate our management and key employees in a manner that will encourage them to continue their employment with us, they may choose to seek other employment. Any loss of these managers or key employees may prevent us from operating the ethanol plant profitably and could decrease the value of our units.
We may incur casualty losses that are not covered by insurance which could negatively impact the value of our units. We have purchased insurance which we believe adequately covers our losses from foreseeable risks. However, there are risks that we may encounter for which there is no insurance or for which insurance is not available on terms that are acceptable to us. If we experience a loss which materially impairs our ability to operate the ethanol plant which is not covered by insurance, the value of our units could be reduced or eliminated.
Our operations may be negatively impacted by natural disasters, severe weather conditions, and other unforeseen plant shutdowns which can negatively impact our operations. Our operations may be negatively impacted by events outside of our control such as natural disasters, severe weather, strikes, train derailments and other unforeseen events which may negatively impact our operations. If we experience any of these unforeseen circumstances which negatively impact our operations, it may affect our cash flow and negatively impact the value of our business.
Changes and advances in ethanol production technology could require us to incur costs to update our plant or could otherwise hinder our ability to compete in the ethanol industry or operate profitably. Advances and changes in the technology of ethanol production are expected to occur. Such advances and changes may make the ethanol production technology installed in our plant less desirable or obsolete. These advances could also allow our competitors to produce ethanol at a lower cost than us. If we are unable to adopt or incorporate technological advances, our ethanol production methods and processes could be less efficient than our competitors, which could cause our plant to become uncompetitive or completely obsolete. If our competitors develop, obtain or license technology that is superior to ours or that makes our technology obsolete, we may be required to incur significant costs to enhance or acquire new technology so that our ethanol production remains competitive. Alternatively, we may be required to seek third-party licenses, which could also result in significant expenditures. These third-party licenses may not be available or, once obtained, they may not continue to be available on commercially reasonable terms. These costs could negatively impact our financial performance by increasing our operating costs and reducing our net income.
Risks Related to Ethanol Industry
Excess ethanol supply in the market could put negative pressure on the price of ethanol which could lead to tight operating margins and may impact our ability to operate profitably. In the past the ethanol industry has confronted market conditions where ethanol supply exceeded demand which led to unfavorable operating conditions. Most recently, in 2012, profitability in the ethanol industry was reduced due to increased ethanol imports from Brazil at a time when gasoline demand in the United States was lower and domestic ethanol supplies were higher. This disconnect between ethanol supply and demand resulted in lower ethanol prices at a time when corn prices were higher which led to unfavorable operating conditions. We may experience periods of time when ethanol supply exceeds demand which could negatively impact our profitability. The United States benefited from additional exports of ethanol during our 2015 and 2016 fiscal years which may not continue to occur during our 2017 fiscal year. The Chinese recently increased tariffs on ethanol produced in the United States which could negatively impact ethanol exports to China. We may experience periods of ethanol supply and demand imbalance during our 2017 fiscal year. If we experience excess ethanol supply, either due to increased ethanol production or lower gasoline demand, it could negatively impact the price of ethanol which could hurt our ability to profitably operate the ethanol plant.
Demand for ethanol may not continue to grow unless ethanol can be blended into gasoline in higher percentage blends for standard vehicles. Currently, ethanol is primarily blended with gasoline for use in standard (non-flex fuel) vehicles to create a blend which is 10% ethanol and 90% gasoline. Estimates indicate that approximately 140 billion gallons of gasoline are sold in the United States each year. Assuming that all gasoline in the United States is blended at a rate of 10% ethanol and 90% gasoline, the maximum demand for ethanol is 14.0 billion gallons. This is commonly referred to as the "blend wall," which represents a theoretical limit where more ethanol cannot be blended into the national gasoline pool. Many in the ethanol industry believe that the ethanol industry has reached this blend wall. In order to expand demand for ethanol, higher percentage blends of ethanol must be utilized in standard vehicles. Such higher percentage blends of ethanol are a contentious issue. Automobile manufacturers and environmental groups have fought against higher percentage ethanol blends. The EPA approved the use of E15 for standard (non-flex fuel) vehicles produced in the model year 2001 and later. The fact that E15 has not been approved for use in all vehicles and
14
the labeling requirements associated with E15 may lead to gasoline retailers refusing to carry E15. In addition, restrictions on the evaporative emissions of E15 during the summer months can limit the availability of E15 in some markets. Without an increase in the allowable percentage blends of ethanol that can be used in all vehicles, demand for ethanol may not continue to increase which could decrease the selling price of ethanol and could result in our inability to operate the ethanol plant profitably, which could reduce or eliminate the value of our units.
Technology advances in the commercialization of cellulosic ethanol may decrease demand for corn-based ethanol which may negatively affect our profitability. The current trend in ethanol production research is to develop an efficient method of producing ethanol from cellulose-based biomass, such as agricultural waste, forest residue, municipal solid waste, and energy crops. This trend is driven by the fact that cellulose-based biomass is generally cheaper than corn, and producing ethanol from cellulose-based biomass would create opportunities to produce ethanol in areas of the country which are unable to grow corn. The Energy Independence and Security Act of 2007 and the 2008 Farm Bill offer strong incentives to develop commercial scale cellulosic ethanol. The RFS requires that 16 billion gallons per year of advanced bio-fuels, such as cellulosic ethanol, must be consumed in the United States by 2022. Additionally, state and federal grants have been awarded to several companies which are seeking to develop commercial scale cellulosic ethanol plants. This has encouraged innovation and has led to several companies which have completed construction or are in the process of building commercial scale cellulosic ethanol plants. If an efficient method of producing ethanol from cellulose-based biomass is developed, we may not be able to compete effectively. If we are unable to produce ethanol as cost-effectively as cellulose-based producers, our ability to generate revenue and our financial condition will be negatively impacted.
New plants under construction or decreases in ethanol demand may result in excess production capacity in our industry. The supply of domestically produced ethanol is at an all-time high. According to the Renewable Fuels Association, as of December 1, 2016, there are 213 ethanol plants in the United States with capacity to produce approximately 15.8 billion gallons of ethanol per year. Excess ethanol production capacity may have an adverse impact on our results of operations, cash flows and general financial condition. According to the Renewable Fuels Association, approximately 2% of the ethanol production capacity in the United States was idled as of December 1, 2016. Further, ethanol demand may be negatively impacted by reductions in the RFS. While the United States is currently exporting ethanol which has resulted in increased ethanol demand, these ethanol exports may not continue. If ethanol demand does not grow at the same pace as increases in supply, we expect the selling price of ethanol to decline. If excess capacity in the ethanol industry continues to occur, the market price of ethanol may decline to a level that is inadequate to generate sufficient cash flow to cover our costs, which could negatively affect our profitability.
Growth in the ethanol industry is dependent on growth in the fuel blending infrastructure to accommodate ethanol, which may be slow and could result in decreased ethanol demand. The ethanol industry depends on the fuel blending industry to blend the ethanol that is produced with gasoline so it may be sold to the end consumer. Substantial investments are required to expand this blending infrastructure and the fuel blending industry may choose not to expand the blending infrastructure to accommodate ethanol. Should the ability to blend ethanol not expand at the same rate as increases in ethanol supply, it may decrease the demand for ethanol which may lead to a decrease in the selling price of ethanol, which could impact our ability to operate profitably.
We operate in an intensely competitive industry and compete with larger, better financed companies which could impact our ability to operate profitably. There is significant competition among ethanol producers. There are numerous producer-owned and privately-owned ethanol plants operating throughout the Midwest and elsewhere in the United States. We also face competition from ethanol producers located outside of the United States. The largest ethanol producers include Archer Daniels Midland, Flint Hills Resources, Green Plains Renewable Energy, POET, and Valero Renewable Fuels, each which is capable of producing significantly more ethanol than we produce. Further, many believe that there will be consolidation occurring in the ethanol industry which will likely lead to a few companies which control a significant portion of the United States ethanol production market. We may not be able to compete with these larger producers. These larger ethanol producers may be able to affect the ethanol market in ways that are not beneficial to us which could negatively impact our financial performance and the value of our units.
Competition from the advancement of alternative fuels may lessen demand for ethanol. Alternative fuels, gasoline oxygenates and ethanol production methods are continually under development. A number of automotive, industrial and power generation manufacturers are developing alternative clean power systems using fuel cells, plug-in hybrids, and electric cars or clean burning gaseous fuels. Like ethanol, these emerging technologies offer an option to address worldwide energy costs, the long-term availability of petroleum reserves and environmental concerns. If these alternative technologies continue to expand and gain broad acceptance and become readily available to consumers for motor vehicle use, we may not be able to compete effectively. This additional competition could reduce the demand for ethanol, resulting in lower ethanol prices that might adversely affect our results of operations and financial condition.
15
If exports of ethanol are reduced, including as a result of the imposition by the European Union of a tariff on U.S. ethanol, ethanol prices may be negatively impacted. The United States ethanol industry was supported during our 2016 fiscal year with exports of ethanol which increased demand for our ethanol. Management believes these additional exports of ethanol were due to lower market ethanol prices in the United States and increased global demand for ethanol. However, these ethanol exports may not continue. In 2012, the European Union concluded an anti-dumping investigation related to ethanol produced in the United States and exported to Europe. As a result of this investigation, the European Union has imposed a tariff on ethanol which is produced in the United States and exported to Europe. While we continue to experience some ethanol exports to Europe, as a result of this tariff, if ethanol prices increase, these exports to the European Union may cease. Further, ethanol exports could potentially be higher without the European Union tariff. In addition, other importers of United States ethanol could reduce their imports which could negatively impact ethanol prices in the United States and could result in an imbalance between ethanol supply and ethanol demand. Any decrease in ethanol prices or demand may negatively impact our ability to profitably operate the ethanol plant.
Consumer resistance to the use of ethanol based on the belief that ethanol is expensive, adds to air pollution, harms engines and/or takes more energy to produce than it contributes or based on perceived issues related to the use of corn as the feedstock to produce ethanol may affect demand for ethanol. Certain individuals believe that the use of ethanol will have a negative impact on gasoline prices at the pump. Some also believe that ethanol adds to air pollution and harms car and truck engines. Still other consumers believe that the process of producing ethanol actually uses more fossil energy, such as oil and natural gas, than the amount of energy that is produced. Further, some consumers object to the fact that ethanol is produced using corn as the feedstock which these consumers perceive as negatively impacting food prices. These consumer beliefs could potentially be wide-spread and may be increasing as a result of recent efforts to increase the allowable percentage of ethanol that may be blended for use in vehicles. If consumers choose not to buy ethanol based on these beliefs, it would affect the demand for the ethanol we produce which could negatively affect our profitability and financial condition.
Risks Related to Regulation and Governmental Action
Government incentives for ethanol production may be eliminated in the future, which could hinder our ability to operate at a profit. The ethanol industry is assisted by various federal ethanol incentives, including the RFS set forth in the Energy Policy Act of 2005. The RFS helps support a market for ethanol that might disappear without this incentive. The United States Environmental Protection Agency ("EPA") has the authority to waive the RFS statutory volume requirement, in whole or in part, provided certain conditions have been met. Annually, the EPA is supposed to pass a rule that establishes the number of gallons of different types of renewable fuels that must be used in the United States which is called the renewable volume obligations. However, the EPA decided to delay finalizing the rule on the 2014 and 2015 RFS standards until after the end of 2014. On November 30, 2015, the EPA released the final renewable volume obligations for 2014, 2015 and 2016 which lowered the renewable volume obligations below the statutory volume requirements. On November 23, 2016, the EPA released the final renewable volume obligations for 2017 which returned the renewable volume obligation for corn-based ethanol to the statutory volume requirement. However, any future reduction of the volume requirements under the RFS by the EPA could decrease the market price and demand for ethanol which will negatively impact our financial performance.
The California Low Carbon Fuel Standard may decrease demand for corn-based ethanol which could negatively impact our profitability. California passed a Low Carbon Fuels Standard ("LCFS") which requires that renewable fuels used in California must accomplish certain reductions in greenhouse gases which reductions are measured using a lifecycle analysis. Management believes that these regulations could preclude corn-based ethanol produced in the Midwest from being used in California. California represents a significant ethanol demand market. If the ethanol industry is unable to supply corn-based ethanol to California, it could significantly reduce demand for the ethanol we produce. This could result in a reduction of our revenues and negatively impact our ability to profitably operate the ethanol plant.
Changes in environmental regulations or violations of these regulations could be expensive and reduce our profitability. We are subject to extensive air, water and other environmental laws and regulations. In addition, some of these laws require our plant to operate under a number of environmental permits. These laws, regulations and permits can often require expensive pollution control equipment or operational changes to limit actual or potential impacts to the environment. A violation of these laws and regulations or permit conditions can result in substantial fines, damages, criminal sanctions, permit revocations and/or plant shutdowns. In the future, we may be subject to legal actions brought by environmental advocacy groups and other parties for actual or alleged violations of environmental laws or our permits. Additionally, any changes in environmental laws and regulations, both at the federal and state level, could require us to spend considerable resources in order to comply with future environmental regulations. The expense of compliance could be significant enough to reduce our profitability and negatively affect our financial condition.
16
Carbon dioxide may be regulated in the future by the EPA as an air pollutant requiring us to obtain additional permits and install additional environmental mitigation equipment, which could adversely affect our financial performance. In 2007, the Supreme Court decided a case in which it ruled that carbon dioxide is an air pollutant under the Clean Air Act for motor vehicle emissions. In 2011 the EPA issued a tailoring rule that deferred greenhouse gas regulations for ethanol plants until July of 2014. However, in July of 2013 the D.C. Circuit issued an opinion vacating the EPA's deferral of those regulations for biogenic sources, including ethanol plants. On June 23, 2014 the U.S. Supreme Court affirmed in part and reversed in part the D.C. Circuit’s decision. For plants that already hold PSD permits the court generally affirmed the EPA's ability to regulate greenhouse gas regulations. Our plant produces a significant amount of carbon dioxide. While there are currently no regulations restricting carbon dioxide emissions, if the EPA or the State of Iowa were to regulate carbon dioxide emissions by plants such as ours, we may have to apply for additional permits or we may be required to install carbon dioxide mitigation equipment or take other as yet unknown steps to comply with these potential regulations. Compliance with any future regulation of carbon dioxide, if it occurs, could be costly and may prevent us from operating the ethanol plant profitably which could decrease or eliminate the value of our units.
ITEM 2. PROPERTIES.
Our plant is located on an approximately 350 acre site in Chickasaw County, Iowa. The plant's address is 2779 Highway 24, Lawler, Iowa 52154. Construction of our plant was completed in April 2009. All of our operations are located at this site.
We selected our plant site because of its close proximity to rail service and access to natural gas supplies capable of meeting plant consumption needs. The plant is located on Iowa Highway 24, which runs east/west, and is about 10 miles east of Iowa Highway 63, which runs north/south, and about 40 miles north of Iowa Highway 20, which runs east/west. Our proximity to these highways provides us with easy access to Interstate 35 and Interstate 80. In addition, the plant is located on the Canadian Pacific railroad line which provides us access to many markets for our products.
All of our tangible and intangible property, real and personal, serves as the collateral for our debt financing with Home Federal Savings Bank, which is described below under "Item 7 - Management's Discussion and Analysis of Financial Condition and Results of Operations - Short-Term and Long-Term Debt Sources."
ITEM 3. LEGAL PROCEEDINGS.
Retterath Florida Lawsuit
On August 1, 2013, Steve Retterath, the Company's largest investor and a former member of the Company's board of directors filed a lawsuit in the Florida Circuit Court located in Palm Beach County, Florida. The lawsuit was subsequently removed to federal court in Florida. In the lawsuit, Mr. Retterath sued the Company, Pat Boyle, Maurice Hyde, Christine Marchand, Mathew Driscoll, Leslie Hansen, and Chad Kuhlers, each members of the Company's board of directors, Walter Wendland, the Company's former Chief Executive Officer, David Finke, the Company's former Chief Financial Officer and Kevin Howes, the Company's Chief Operating Officer. Mr. Retterath also sued James Boeding, a former director and the Company's outside legal counsel, Joseph Leo and the BrownWinick Law Firm. Mr. Retterath is claiming that certain actions taken by the Company violated fiduciary duties owed to him as a member or fraudulently induced him to take certain actions. Mr. Retterath is also claiming violations of state and federal securities laws and violations of Florida's deceptive and unfair trade practices statutes. Mr. Retterath claims an unspecified damage in excess of $30 million in monetary damages. The Florida court ruled in favor of the Company's motion to transfer the case to Iowa. Each of the defendants filed motions to dismiss the lawsuit and Mr. Retterath filed a motion for partial summary judgment in the case. The Federal Court in Iowa ruled in favor of the defendants and dismissed the federal claims in this lawsuit. Further, the Federal Court declined jurisdiction to hear the other state law matters in the case and remanded those claims back to Florida state court.
On August 21, 2014, Jason Retterath and Annie Retterath, the son and daughter-in-law of Steve Retterath, filed a motion to intervene in the lawsuit to protect their interests as members of the Company. The Company filed a motion to dismiss the intervenor petition. The Federal Court in Iowa declined to consider the Company's motion to dismiss the intervention and instead remanded the intervenors’ case back to Florida state court.
Mr. Retterath and his son and daughter-in-law voluntarily dismissed this lawsuit without prejudice.
Retterath Iowa Lawsuit
On August 14, 2013, the Company filed a lawsuit against Steve Retterath in the Iowa state court located in Polk County, Iowa. The purpose of the lawsuit is to enforce the terms of the repurchase agreement the Company executed with Mr. Retterath on June 13, 2013. The Company is asking the Iowa state court to require Mr. Retterath to perform his obligations under the
17
repurchase agreement pursuant to its terms. Mr. Retterath removed the case to federal court in the Federal District Court for the Southern District of Iowa in December 2013. The Company believed that this removal was improper and as a result the Company moved to remand the case back to the Iowa state court in Polk County which was granted. Mr. Retterath answered the lawsuit in August 2014, denying the validity of the repurchase agreement. In addition, the Iowa state court permitted Jason Retterath and Annie Retterath, the son and daughter-in-law of Steve Retterath, to be added as parties to the Iowa state lawsuit. In February 2015, the Company filed a motion for summary judgment asking the Iowa state court to enforce the repurchase agreement. The Retteraths also filed motions for summary judgment asking the Iowa state court to find the repurchase agreement invalid. On October 16, 2015, the Iowa state court entered a ruling granting Homeland's motion for summary judgment and determined no membership vote was required as Mr. Retterath has contended. The Iowa state court also denied the summary judgment motions filed by Mr. Retterath and his son and daughter-in-law.
Mr. Retterath and his son and daughter-in-law filed a motion to add a significant number of additional parties to the Iowa lawsuit along with additional claims against the Company. We filed a resistance to Mr. Retterath's attempts to expand the scope of the Iowa lawsuit. In November 2016, the Iowa Court ruled that our original claims against Mr. Retterath would proceed to trial in January 2017 as scheduled and that any other issues that remain following that trial would be litigated after a ruling is issued in the January 2017 trial. The trial was held in January 2017 and we are awaiting a ruling from the Iowa state court.
GS Cleantech Patent Litigation
On August 9, 2013, GS Cleantech Corporation ("GS Cleantech"), a subsidiary of Greenshift Corporation, filed a complaint in the United States District for the Northern District of Iowa against the Company. The Company is one of more than twenty ethanol manufacturers that were sued by GS Cleantech. The complaint alleges that the Company's operation of a corn oil extraction process infringes patent rights claimed by GS Cleantech. GS Cleantech seeks royalties, damages and potentially triple damages associated with the alleged infringement, as well as attorney's fees. The complaint was transferred to the United States District Court for the Southern District of Indiana due to a finding that the action involves questions of fact common to several other lawsuits which were joined in a multi-district litigation ("MDL"). The MDL Court developed two tracks of defendants in this litigation. The first track includes defendants which were originally sued by GS Cleantech in 2010 and a second track of defendants sued in 2013 which includes the Company. On October 23, 2014, the MDL Court granted summary judgment in favor of the first track defendants and found that the GS Cleantech patents which the Company is alleged to have infringed are invalid. Further, in a January 16, 2015 decision, the MDL ruled in favor of a stipulated motion for partial summary judgment finding that all of the GS Cleantech patents in the suit were invalid and, therefore, not infringed. GS Cleantech has said it will appeal this decision when the remaining claim in the suit has been decided. If GS Cleantech successfully appeals the District Court’s findings of invalidity, damages awarded GS Cleantech may be $1 million or more.
The only remaining claim in the lawsuit alleges that GS Cleantech inequitably conducted itself before the United States Patent Office when obtaining the patents at issue. A trial in the District Court for the Southern District of Indiana on the single issue of inequitable conduct was held in October 2015. The MDL Court ruled that GS Cleantech engaged in inequitable conduct. GS Cleantech has asked the court to amend its ruling. The defendants are seeking damages against GS Cleantech and its attorneys as a result of this finding of inequitable conduct. We anticipate that if the determination of inequitable conduct is not amended, GS Cleantech will appeal this decision along with the summary judgment decision issued earlier.
ITEM 4. MINE SAFETY DISCLOSURES
None.
PART II
ITEM 5. MARKET FOR REGISTRANT'S COMMON EQUITY, RELATED STOCKHOLDER MATTERS AND ISSUER PURCHASES OF EQUITY SECURITIES.
Outstanding Equity
As of March 3, 2017, we had 90,445 units outstanding and approximately 1,275 total members. On June 13, 2013, the Company entered into an agreement with Steve Retterath, the Company's largest equity holder, to repurchase and retire all of the units owned by Mr. Retterath. The Company agreed to repurchase and retire 25,860 membership units owned by Mr. Retterath in exchange for $30 million. The Company believes that it has a binding agreement with Mr. Retterath. Mr. Retterath contends he is not bound by the agreement. The Company's position is that, as of the closing date, Mr. Retterath is no longer the equitable owner of any membership units in the Company. As a result, the Company has recorded a $30 million short-term liability related to the amount the Company agreed to pay Mr. Retterath to repurchase his membership units and has correspondingly reduced
18
members' equity on our balance sheet. The 90,445 membership units outstanding include the contested membership units the Company agreed to repurchase from Mr. Retterath.
Unit Trading
There is no established public trading market for our units. However, on February 5, 2008, we established the Unit Trading Bulletin Board, which is a private online matching service, in order to facilitate trading among our members. The Unit Trading Bulletin Board consists of an electronic bulletin board on our website that provides a list of interested buyers and a list of interested sellers, along with their non-firm price quotes. The Unit Trading Bulletin Board does not automatically effect matches between potential sellers and buyers and it is the sole responsibility of sellers and buyers to contact each other to negotiate an agreement to transfer units. We do not become involved in any purchase or sale negotiations arising from our Unit Trading Bulletin Board and have no role in effecting transactions beyond approval, as required under our operating agreement, and the issuance of new certificates. We do not give advice regarding the merits or shortcomings of any particular transaction. We do not receive, transfer or hold funds or securities as an incident of operating the Unit Trading Bulletin Board. We do not receive any compensation for creating or maintaining the Unit Trading Bulletin Board. In advertising our Unit Trading Bulletin Board, we do not characterize Homeland Energy Solutions as being a broker or dealer or an exchange. We do not use the Unit Trading Bulletin Board to offer to buy or sell securities other than in compliance with the securities laws, including any applicable registration requirements.
There are detailed time lines that must be followed under the Unit Trading Bulletin Board rules and procedures with respect to offers and sales of membership units, with which all transactions must comply. In addition, all transactions must comply with our operating agreement, and are subject to approval by our board of directors.
The following table contains historical information by quarter for the past two years regarding the actual unit transactions that were completed by our unit-holders during the periods specified. Some of these transfers were made without consideration and as such no price information is included. We believe this most accurately represents the current trading value of our units. The information was compiled by reviewing the completed unit transfers that occurred on the Unit Trading Bulletin Board or through private transfers during the quarters indicated.
Quarter | Low Price | High Price | Average Price | Number of Units Traded | ||||||||||
First Quarter 2015 | $ | 1,500 | $ | 1,800 | $ | 1,687 | 455 | |||||||
Second Quarter 2015 | $ | 1,500 | $ | 1,800 | $ | 1,600 | 110 | |||||||
Third Quarter 2015 | $ | 1,600 | $ | 1,850 | $ | 1,752 | 82 | |||||||
Fourth Quarter 2015 | $ | 1,500 | $ | 1,800 | $ | 1,705 | 233 | |||||||
First Quarter 2016 | $ | 1,650 | $ | 2,000 | $ | 1,824 | 132 | |||||||
Second Quarter 2016 | $ | 1,700 | $ | 2,000 | $ | 1,902 | 275 | |||||||
Third Quarter 2016 | $ | 1,750 | $ | 1,900 | $ | 1,837 | 221 | |||||||
Fourth Quarter 2016 | $ | 1,800 | $ | 1,800 | $ | 1,800 | 40 | |||||||
19
The following tables contain the bid and asked prices that were posted on the Unit Trading Bulletin Board and includes some transactions that were not completed. We believe the table above more accurately describes the trading value of our units as the bid and asked prices below include some offers that never resulted in completed transactions. The information was compiled by reviewing postings that were made on the Unit Trading Bulletin Board.
Sellers' Quarter | Low Price | High Price | Average Price | Number of Units Listed | ||||||||||
First Quarter 2015 | $ | 1,800 | $ | 2,400 | $ | 2,015 | 627 | |||||||
Second Quarter 2015 | $ | 1,600 | $ | 2,400 | $ | 2,112 | 277 | |||||||
Third Quarter 2015 | $ | 1,800 | $ | 2,100 | $ | 1,879 | 175 | |||||||
Fourth Quarter 2015 | $ | 1,800 | $ | 2,100 | $ | 1,923 | 173 | |||||||
First Quarter 2016 | $ | 1,600 | $ | 1,900 | $ | 1,688 | 120 | |||||||
Second Quarter 2016 | $ | 1,850 | $ | 1,850 | $ | 1,850 | 150 | |||||||
Third Quarter 2016 | $ | — | $ | — | $ | — | — | |||||||
Fourth Quarter 2016 | $ | — | $ | — | $ | — | — | |||||||
Buyers' Quarter | Low Price | High Price | Average Price | Number of Units Listed | ||||||||||
First Quarter 2015 | $ | 1,625 | $ | 1,625 | $ | 1,625 | 100 | |||||||
Second Quarter 2015 | $ | 1,600 | $ | 1,600 | $ | 1,600 | 15 | |||||||
Third Quarter 2015 | $ | 1,800 | $ | 1,800 | $ | 1,800 | 22 | |||||||
Fourth Quarter 2015 | $ | 1,800 | $ | 1,600 | $ | 1,708 | 44 | |||||||
First Quarter 2016 | $ | 1,700 | $ | 1,700 | $ | 1,700 | 20 | |||||||
Second Quarter 2016 | $ | 1,650 | $ | 1,700 | $ | 1,672 | 45 | |||||||
Third Quarter 2016 | $ | 1,750 | $ | 1,800 | $ | 1,786 | 70 | |||||||
Fourth Quarter 2016 | $ | 1,830 | $ | 2,200 | $ | 1,966 | 70 | |||||||
As a limited liability company, we are required to restrict the transfers of our membership units in order to preserve our partnership tax status. Our membership units may not be traded on any established securities market or readily traded on a secondary market (or the substantial equivalent thereof). All transfers are subject to a determination that the transfer will not cause us to be deemed a publicly traded partnership.
Distributions
We paid distributions to our members in each of our last two fiscal years. Our board of directors paid three distributions during our 2016 fiscal year for a total of $499 per membership unit with total distributions equaling $32,227,915. Our board of directors paid three distributions during our 2015 fiscal year for a total of $362 per membership unit with total distributions equaling $23,379,770. No distributions were paid to the contested membership units which are subject to the Retterath litigation. Our board of directors has discretion over the timing and amount of distributions to our unit holders subject to certain financial covenants required by our senior credit facility and restrictions under Iowa law. Our operating agreement requires the board of directors to endeavor to make cash distributions at such times and in such amounts as will permit our unit holders to satisfy their income tax liability in a timely fashion. Our expectations with respect to our ability to make future distributions are discussed in greater detail in "Item 7 - Management's Discussion And Analysis Of Financial Condition And Results Of Operations."
Performance Graph
The following graph shows a comparison of cumulative total member return since December 31, 2011, calculated on a dividend reinvested basis, for the Company, the NASDAQ Composite Index (the "NASDAQ Market Index") and an index of other companies that have the same SIC code as the Company (the "SIC Code Index"). The graph assumes $100 was invested in each of our units, the NASDAQ Market Index, and the SIC Code Index on December 31, 2011. Data points on the graph are quarterly. Note that historic unit price performance is not necessarily indicative of future unit price performance. The data for this performance graph was compiled for us by Zacks Investment Research, Inc.
20
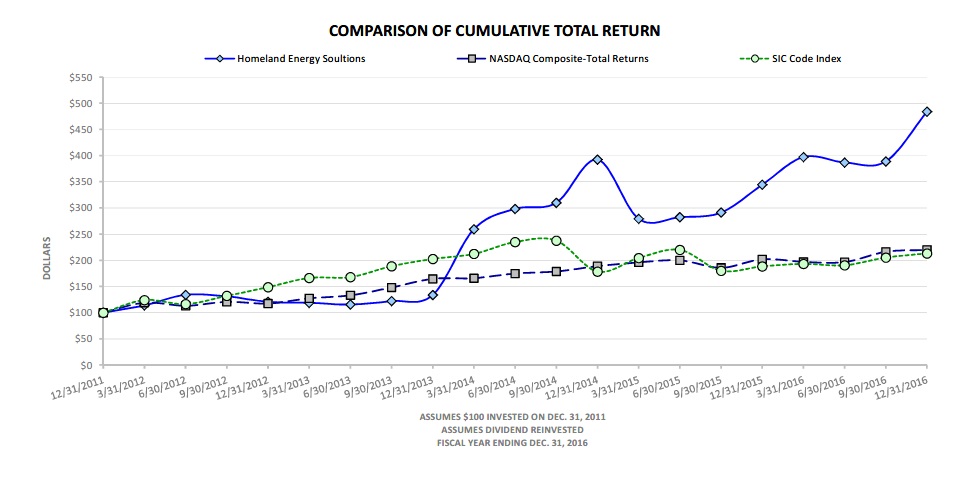
Pursuant to the rules and regulations of the Securities and Exchange Commission, the performance graph and the information set forth therein shall not be deemed to be filed for purposes of Section 18 of the Securities Exchange Act of 1934, and shall not be deemed to be incorporated by reference in any filing under the Securities Act of 1933, as amended, or the Exchange Act, except as shall be expressly set forth by specific reference in such a filing.
ITEM 6. SELECTED FINANCIAL DATA
The following table presents selected financial and operating data as of the dates and for the periods indicated. The selected balance sheet financial data as of December 31, 2014, 2013 and 2012 and the selected income statement data and other financial data for the years ended December 31, 2013 and 2012 have been derived from our audited financial statements that are not included in this Form 10-K. The selected balance sheet financial data as of December 31, 2016 and 2015 and the selected income statement data and other financial data for each of the years in the three year period ended December 31, 2016 have been derived from the audited financial statements included elsewhere in this Form 10-K. You should read the following table in conjunction with "Item 7. Management Discussion and Analysis of Financial Condition and Results of Operations" and the financial statements and the accompanying notes included elsewhere in this Form 10-K. Among other things, those financial statements include more detailed information regarding the basis of presentation for the following financial data.
2016 | 2015 | 2014 | 2013 | 2012 | ||||||||||||||||
Total Revenue | $ | 272,938,079 | $ | 269,970,953 | $ | 330,436,817 | $ | 400,211,785 | $ | 359,242,777 | ||||||||||
Net Income | 34,484,463 | 24,511,283 | 68,615,951 | 28,233,908 | 494,765 | |||||||||||||||
Net Income Per Unit | 533.94 | 379.52 | 1,062.41 | 359.48 | 5.47 | |||||||||||||||
Distributions Declared Per Unit | 499.00 | 362.00 | 618.00 | 131.00 | 133.00 | |||||||||||||||
Total Assets | 198,784,899 | 186,992.29 | 188,507,073 | 174,078,126 | 141,847,168 | |||||||||||||||
Long-term Liabilities | 123,190 | 350,059 | 419,904 | 15,303,526 | 1,268,793 | |||||||||||||||
Members' Equity | 151,237,372 | 148,980,824 | 147,849,311 | 119,146,890 | 129,373,617 | |||||||||||||||
21
ITEM 7. MANAGEMENT'S DISCUSSION AND ANALYSIS OF FINANCIAL CONDITION AND RESULTS OF OPERATIONS
Results of Operations
Comparison of Fiscal Years Ended December 31, 2016 and 2015
2016 | 2015 | |||||||||||||
Income Statement Data | Amount | % | Amount | % | ||||||||||
Revenue | $ | 272,938,079 | 100.0 | $ | 269,970,953 | 100.0 | ||||||||
Cost of goods sold | 235,786,636 | 86.4 | 242,628,553 | 89.9 | ||||||||||
Gross profit | 37,151,443 | 13.6 | 27,342,400 | 10.1 | ||||||||||
Selling, general and administrative expenses | 3,736,798 | 1.4 | 3,618,821 | 1.3 | ||||||||||
Operating income | 33,414,645 | 12.2 | 23,723,579 | 8.8 | ||||||||||
Other income (expense) | 1,069,818 | 0.4 | 787,704 | 0.3 | ||||||||||
Net income | $ | 34,484,463 | 12.6 | $ | 24,511,283 | 9.1 | ||||||||
Revenue
Our total revenue for our 2016 fiscal year was approximately 1% greater than our total revenue for our 2015 fiscal year. Management attributes this increase in revenue primarily with increased ethanol and corn oil revenue, partially offset by decreased distiller grains revenue for our 2016 fiscal year compared to our 2015 fiscal year. Our revenue is presented in our financial statements net of the shipping costs that are incurred in transporting our products to the end customer. These shipping charges are deducted by our marketers from the amounts realized on the sale of our ethanol, distiller grains and corn oil.
For our 2016 fiscal year, our total ethanol revenue increased by approximately 7% compared to our 2015 fiscal year due to higher average ethanol prices along with increased ethanol gallons sold. The average price we received for our ethanol during our 2016 fiscal year was approximately 1% greater than during our 2015 fiscal year. Management attributes this increase in ethanol prices with increased gasoline prices and higher export demand during our 2016 fiscal year. While we believe ethanol prices were impacted by uncertainty related to the corn-based ethanol requirement in the RFS, management believes that increased gasoline demand and increased export demand positively impacted market ethanol prices which increased the average price we received for our ethanol.
Management anticipates that ethanol prices will remain relatively stable during our 2017 fiscal year due to the fact that the RFS ethanol use requirements were set at 15 million gallons for corn-based ethanol for 2017 along with increased export demand for ethanol. However, export demand for ethanol is less consistent compared to domestic demand, so if ethanol exports are lower during 2017 compared to 2016, it could result in lower ethanol prices and could negatively impact our profitability. Further, other ethanol producers are expanding their production capacities to meet the increase in ethanol demand experienced during 2016. If ethanol supply increases at a greater pace compared to ethanol demand, it could negatively impact ethanol prices and could negatively impact our profitability.
We sold approximately 6% more gallons of ethanol during our 2016 fiscal year compared to the same period of 2015. Management attributes this increase in total production of ethanol with improved operating efficiency and plant performance during the 2016 period. Management anticipates that our ethanol production during our 2017 fiscal year will be higher than during our 2016 fiscal year due to capital improvement projects we have been undertaking designed to increase our production capacity along with improved corn to ethanol production yield which increases our production.
Our total distiller grains revenue was approximately 22% less during our 2016 fiscal year compared to the same period of 2015 primarily due to lower distiller grains prices. We sold approximately 1% more tons of distiller grains during our 2016 fiscal year compared to the same period of 2015 due to an overall increase in production during the 2016 period partially offset by an increase in corn oil extractions. The average prices we received for our distiller grains were lower during our 2016 fiscal year compared to the same period of 2015 due primarily to decreased distiller grains exports to China along with increased corn
22
supplies. Due to the Chinese trade issues, this major source of distiller grains demand was significantly decreased during our 2016 fiscal year. We primarily sell our distiller grains in the dried form based on market conditions which favor this product, however we still sell a small portion of our distillers grains in the modified/wet form. The average price we received per ton of dried distiller grains sold decreased by approximately 23% during our 2016 fiscal year compared to the same period of 2015. Since distiller grains are primarily used as an animal feed substitute for corn and soybean meal, the price of distiller grains is impacted by these competing products. When soybean and corn supplies increase and the prices of these commodities are lower, it negatively impacts the price we receive for our distiller grains. Management anticipates continued lower corn and soybean prices and lower export demand for distiller grains which may result in lower distiller grains prices during our 2017 fiscal year. Lower distiller grains prices have negatively impacted our profitability and may continue to negatively impact our financial performance during our 2017 fiscal year.
Our revenue from corn oil sales was greater during our 2016 fiscal year compared to the same period of 2015, due to higher corn oil prices along with increased total pounds of corn oil sold. The average price we received for our corn oil during our 2016 fiscal year was approximately 8% greater than the average price we received during the same period of 2015. Management attributes this increase in corn oil prices with increased corn oil demand from the biodiesel industry during 2016.
We produced approximately 22% more pounds of corn oil during our 2016 fiscal year compared to the same period of 2015. Management attributes this increase in corn oil production with increased production by the ethanol plant, generally, along with an increased in the amount of corn oil we removed from our distiller grains during our 2016 fiscal year. We increased the amount of corn oil we removed from our distiller grains through changes in our corn oil extraction process.
Management anticipates that corn oil prices may be lower during our 2017 fiscal year since the biodiesel blenders' tax credit expired at the end of 2016 and may not be renewed in 2017. The loss of the biodiesel blenders' tax credit may decrease demand for corn oil during 2017. Further, management anticipates stronger corn oil production during our 2017 fiscal year which could negatively impact corn oil prices.
Cost of Goods Sold
Our two primary costs of producing ethanol, distiller grains and corn oil are corn costs and natural gas costs. Our total cost of goods sold was approximately 3% less during our 2016 fiscal year compared to the same period of 2015 due to lower corn and natural gas prices partially offset by higher corn and natural gas consumption.
The average price we paid per bushel of corn was approximately 7% lower during our 2016 fiscal year compared to our 2015 fiscal year. Management attributes this decrease in the average price we paid per bushel of corn with lower market corn prices during our 2016 fiscal year compared to our 2015 fiscal year. Management attributes the decrease in market corn prices to a strong corn crop during the fall of 2015 along with a record corn crop harvested in the fall of 2014 which resulted in a large corn carryover. In addition, growing conditions were favorable during our 2016 fiscal year which management believes drove corn prices lower during 2016. Management anticipates that corn prices will remain lower during our 2017 fiscal year due to the large corn supply and relatively stable corn demand. In addition to the lower corn prices, our cost of goods sold was lower during our 2016 fiscal year due to approximately $4.2 million in combined realized and unrealized gains on our corn risk management positions which reduced our cost of goods sold during our 2016 fiscal year. During our 2015 fiscal year, we experienced a combined realized and unrealized gain on our risk management positions of approximately $2.0 million which reduced our cost of goods sold during our 2015 fiscal year.
We purchased approximately 6% more bushels of corn during our 2016 fiscal year compared to our 2015 fiscal year. Management attributes this increase in corn consumption with increased production during the 2016 period. We also experienced a slight improvement in our corn to ethanol conversion ratio. Management anticipates that our corn consumption will be greater during our 2017 fiscal year compared to our 2016 fiscal year due to anticipated increases in our ethanol production during our 2017 fiscal year.
During our 2016 fiscal year, the average price we paid per MMBtu of natural gas was approximately 17% less compared to our 2015 fiscal year. Management attributes this decrease in natural gas prices to lower energy prices, generally, during our 2016 fiscal year along with relatively mild weather during the winter months during our 2016 fiscal year. We expect higher natural gas prices during winter months due to annual increases in natural gas transportation costs. Management anticipates relatively stable natural gas prices during our 2017 fiscal year unless a supply disruption were to occur which negatively impacts market natural gas supplies. We consumed approximately 1% more natural gas during our 2016 fiscal year compared to the same period of 2015, primarily due to increased production at the ethanol plant offset by a 5% increase in efficiency to use less natural gas per gallon of ethanol production. We expect our natural gas consumption to continue to track our total production during our 2017 fiscal year.
23
Selling, General and Administrative Expenses
Our selling, general and administrative expenses were higher during our 2016 fiscal year compared to our 2015 fiscal year due primarily to increased dues to industry trade groups and employee bonuses that are partially calculated on net income.
Other Income (Expense)
We had more interest income during our 2016 fiscal year compared to the same period of 2015 due to having more cash on hand during the 2016 period due to our increased profitability compared to our 2015 fiscal year. We had more other income during our 2016 fiscal year compared to the same period of 2015 primarily due to having more net earnings on trading securities along with slight increases in investment income from our investment in RPMG, our ethanol and corn oil marketer.
Comparison of Fiscal Years Ended December 31, 2015 and 2014
2015 | 2014 | |||||||||||||
Income Statement Data | Amount | % | Amount | % | ||||||||||
Revenue | $ | 269,970,953 | 100.0 | $ | 330,436,817 | 100.0 | ||||||||
Cost of goods sold | 242,628,553 | 89.9 | 257,702,030 | 78.0 | ||||||||||
Gross profit | 27,342,400 | 10.1 | 72,734,787 | 22.0 | ||||||||||
Selling, general and administrative expenses | 3,618,821 | 1.3 | 4,694,794 | 1.4 | ||||||||||
Operating income | 23,723,579 | 8.8 | 68,039,993 | 20.6 | ||||||||||
Other income (expense) | 787,704 | 0.3 | 575,958 | 0.2 | ||||||||||
Net income | $ | 24,511,283 | 9.1 | $ | 68,615,951 | 20.8 | ||||||||
Revenue
Our total revenue for our 2015 fiscal year was approximately 18% less than our total revenue for our 2014 fiscal year. Management attributes this decrease in revenue primarily with lower average prices for our products partially offset by increased production and sales during the 2015 period.
For our 2015 fiscal year, our total ethanol revenue decreased by approximately 23% compared to our 2014 fiscal year due to lower average ethanol prices partially offset by increased ethanol sales. The average price we received for our ethanol during our 2015 fiscal year was approximately 29% less than during our 2014 fiscal year. Management attributes this decrease in ethanol prices with lower gasoline prices along with uncertainty regarding ethanol demand under the RFS during our 2015 fiscal year.
We sold approximately 9% more gallons of ethanol during our 2015 fiscal year compared to the same period of 2014. Management attributes this increase in total production of ethanol with improved operating efficiency and plant performance during the 2015 period along with decreased production during our 2014 fiscal year due to rail logistics issues we experienced primarily during our first quarter of 2014 which reduced our total production and sales during that time.
In addition to the lower ethanol revenue, our total distiller grains revenue was lower during our 2015 fiscal year compared to the same period of 2014. Our total distiller grains revenue was approximately 1% less during our 2015 fiscal year compared to the same period of 2014 primarily due to lower distiller grains prices. We sold approximately 11% more tons of distiller grains during our 2015 fiscal year compared to the same period of 2014 due to increased production during the 2015 period. The average prices we received for our distiller grains were lower during our 2015 fiscal year compared to the same period of 2014 due primarily to lower market corn prices and increased corn supplies. The average price we received per ton of dried distiller grains sold decreased by approximately 10% during our 2015 fiscal year compared to the same period of 2014.
Our revenue from corn oil sales was less during our 2015 fiscal year compared to the same period of 2014, due to lower corn oil prices partially offset by an increase in the total pounds of corn oil sold. The average price we received for our corn oil
24
during our 2015 fiscal year was approximately 17% less than the average price we received during the same period of 2014. Management attributes this decrease in corn oil prices with a combination of increased corn oil production by the ethanol industry along with lower corn oil demand. In addition, management believes corn oil demand was negatively impacted by the loss of the biodiesel blenders' credit since the biodiesel industry is a major source of corn oil demand.
We produced approximately 18% more pounds of corn oil during our 2015 fiscal year compared to the same period of 2014. Management attributes this increase in corn oil production with increased production by the ethanol plant generally along with an increase in the amount of corn oil contained in the corn we used during our 2015 fiscal year compared to the corn we used during our 2014 fiscal year. The corn we used during our 2015 fiscal year contained more corn oil and the corn oil was easier to separate compared to the corn we used during our 2014 fiscal year. This change in the corn we used resulted in increased corn oil extraction efficiency which positively impacted our total corn oil production.
Cost of Goods Sold
Our two primary costs of producing ethanol, distiller grains and corn oil are corn costs and natural gas costs. Our total cost of goods sold was approximately 6% less during our 2015 fiscal year compared to the same period of 2014 due to lower corn and natural gas prices partially offset by higher corn and natural gas consumption.
The average price we paid per bushel of corn was approximately 12% lower during our 2015 fiscal year compared to our 2014 fiscal year. Management attributes this decrease in the average price we paid per bushel of corn with lower market corn prices throughout our 2015 fiscal year compared to our 2014 fiscal year. Management attributes the decrease in market corn prices with a strong corn crop during the fall of 2015 along with a record corn crop harvested in the fall of 2014 which resulted in a large corn carryover. In addition to the lower corn prices, our cost of goods sold was lower during our 2015 fiscal year due to approximately $2.0 million in combined realized and unrealized gains on our corn risk management positions which reduced our cost of goods sold during our 2015 fiscal year. During our 2014 fiscal year we experienced a combined realized and unrealized gain on our risk management positions of approximately $4.5 million which reduced our cost of goods sold during our 2014 fiscal year.
We purchased approximately 6% more bushels of corn during our 2015 fiscal year compared to our 2014 fiscal year. Management attributes this increase in corn consumption with increased production during the 2015 period, partially offset by an improvement in our corn to ethanol conversion ratio.
During our 2015 fiscal year, the average price we paid per MMBtu of natural gas was approximately 43% less compared to our 2014 fiscal year. Management attributes this decrease in natural gas prices to unusually high natural gas prices during our 2014 fiscal year due to a longer and colder winter which resulted in natural gas price spikes, especially during our first two quarters of our 2014 fiscal year. Natural gas supplies returned to a more normal level in the second half of our 2014 fiscal year and the winter months during our 2015 fiscal year were much milder than the previous year which maintained lower natural gas demand during our 2015 fiscal year. We consumed approximately 4% more natural gas during our 2015 fiscal year compared to the same period of 2014 primarily due to increased production at the ethanol plant.
Selling, General and Administrative Expenses
Our selling, general and administrative expenses were lower during our 2015 fiscal year compared to our 2014 fiscal year due primarily to less legal expenses we incurred related to the various lawsuits in which we are involved.
Other Income (Expense)
We had no interest expense during our 2015 fiscal year compared to approximately $129,000 in interest expense during the same period of 2014 because we had no amounts outstanding on our debt instruments during our 2015 fiscal year compare to our 2014 fiscal year when we had borrowing on a term loan we secured to finance a portion of the Retterath repurchase. This loan was repaid during the second quarter of our 2014 fiscal year. We had less interest income during our 2015 fiscal year compared to the same period of 2014 due to having less cash on hand during the 2015 period due to our reduced profitability compared to our 2014 fiscal year. We had more other income during our 2015 fiscal year compared to the same period of 2014 primarily due to having more investment income from our investment in RPMG, our ethanol and corn oil marketer along with unrealized gains we had on trading securities we purchased with additional cash we had available during our 2014 fiscal year.
25
Changes in Financial Condition for the Fiscal Year Ended December 31, 2016
Balance Sheet Data | December 31, 2016 | December 31, 2015 | ||||||
Total current assets | $ | 76,835,075 | $ | 76,603,773 | ||||
Total property and equipment | 117,806,502 | 105,720,228 | ||||||
Total other assets | 4,143,322 | 4,668,228 | ||||||
Total Assets | $ | 198,784,899 | $ | 186,992,229 | ||||
Total current liabilities | $ | 47,424,337 | $ | 37,661,346 | ||||
Total long-term liabilities | 123,190 | 350,059 | ||||||
Total members' equity | 151,237,372 | 148,980,824 | ||||||
Total Liabilities and Members' Equity | $ | 198,784,899 | $ | 186,992,229 | ||||
We had less cash on hand at December 31, 2016 compared to December 31, 2015 due to distributions we paid to our members during our 2016 fiscal year. In addition, we had approximately $41.6 million in marketable trading securities at December 31, 2016 compared to approximately $40.7 million at December 31, 2015. A portion of our marketing trading securities during each period is being held to complete the Retterath unit repurchase. The value of our accounts receivable was higher at December 31, 2016 compared to December 31, 2015 due to the timing of our product shipments compared to the end of our fiscal year as we were awaiting payment for more of our finished products at the end of our 2016 fiscal year compared to the end of our 2015 fiscal year. The value of our inventory was greater at December 31, 2016 compared to December 31, 2015 due primarily to increased corn inventory at December 31, 2016 compared to December 31, 2015 due to our increased corn storage capacity. We had more prepaid and other assets at December 31, 2016 compared to December 31, 2015 due to increases in our prepaid expenses related to natural gas transportation.
The value of our plant equipment and buildings was higher at December 31, 2016 compared to December 31, 2015 primarily due to a number of capital improvement projects completed in our 2016 fiscal year, partially offset by depreciation of our assets. We had approximately $8.3 million in construction in progress at December 31, 2016 primarily related to our plant expansion project.
Our other assets were less at December 31, 2016 compared to December 31, 2015 due to a decrease in the value of the investment we made in RPMG, LLC, an affiliate of our ethanol and corn oil marketer. We received a distribution from RPMG, LLC during 2016 which reduced our asset. In addition, we continue to amortize certain utility rights associated with construction of the ethanol plant.
Our accounts payable was higher at December 31, 2016 compared to December 31, 2015 primarily due to construction payables related to our expansion project along with increased corn payables because of our increased corn storage capacity. We had a $30 million liability as of December 31, 2016 and 2015 related to the membership unit repurchase agreement. Our accrued expenses were higher at December 31, 2016 compared to December 31, 2015 because our payroll payable was higher at the end of our 2016 fiscal year compared to the end of our 2015 fiscal year due to increased year-end bonuses during our 2016 fiscal year.
We had less long-term liabilities at December 31, 2016 compared to December 31, 2015 due to vesting payments of previously deferred employee bonuses.
Liquidity and Capital Resources
Our primary sources of liquidity are cash from our operations and our $20 million long-term revolving loan. Our credit facilities are described in greater detail below under "Short-Term and Long-Term Debt Sources." As of December 31, 2016, we had $20 million available pursuant to our revolving loan and approximately $14.2 million in cash plus approximately $11.6 million in unrestricted trading securities. Based on financial forecasts performed by our management, we anticipate that we will have sufficient cash from our revolving loans and cash from our operations to continue to operate the ethanol plant at capacity for the next 12 months and beyond. We are in the process of expanding the ethanol plant and we anticipate securing a new term loan to finance this expansion. We do not anticipate seeking additional equity or debt financing in the next 12 months to continue our operations. However, should we experience unfavorable operating conditions in the future, we may have to secure additional debt or equity financing for working capital or other purposes.
26
The following table shows cash flows for the fiscal years ended December 31, 2016 and 2015:
2016 | 2015 | |||||||
Net cash provided by operating activities | $ | 40,386,461 | $ | 30,625,497 | ||||
Net cash (used in) investing activities | (14,246,581 | ) | (19,511,889 | ) | ||||
Net cash (used in) financing activities | (32,227,915 | ) | (23,379,770 | ) | ||||
Cash at beginning of period | 20,256,678 | 32,522,840 | ||||||
Cash at end of period | $ | 14,168,643 | $ | 20,256,678 | ||||
Cash Flow From Operations
Our operations generated more cash during our 2016 fiscal year compared to the same period of 2015 primarily due to increased net income during the 2016 fiscal year.
Cash Flow From Investing Activities
We used less cash for purchases of trading securities during our 2016 fiscal year compared to our 2015 fiscal year. We used more cash for equipment and construction purchases during our 2016 fiscal year compared to our 2015 fiscal year due to a number of capital projects which were ongoing during our 2016 fiscal year. During our 2016 fiscal year, our primarily capital additions were additional corn storage capacity along with increased fermentation capacity. We also completed a steam letdown turbine during December 2016 which will allow us to reduce our electricity usage. During our 2015 fiscal year, our primary capital additions were ethanol load-out, storage and fermentation projects.
Cash Flow From Financing Activities
We used more cash for financing activities during our 2016 fiscal year compared to the same period of 2015. During our 2016 fiscal year, we paid more cash in distributions to our members compared to our 2015 fiscal year.
The following table shows cash flows for the fiscal years ended December 31, 2015 and 2014:
2015 | 2014 | |||||||
Net cash provided by operating activities | $ | 30,625,497 | $ | 83,715,006 | ||||
Net cash (used in) investing activities | (19,511,889 | ) | (34,692,907 | ) | ||||
Net cash (used in) financing activities | (23,379,770 | ) | (54,990,211 | ) | ||||
Cash at beginning of period | 32,522,840 | 38,490,952 | ||||||
Cash at end of period | $ | 20,256,678 | $ | 32,522,840 | ||||
Cash Flow From Operations
Our operations generated less cash during our 2015 fiscal year compared to the same period of 2014 primarily due to having less net income during the 2015 fiscal year.
Cash Flow From Investing Activities
We used less cash for purchases of trading securities during our 2015 fiscal year compared to our 2014 fiscal year. We used more cash for equipment and construction purchases during our 2015 fiscal year compared to our 2014 fiscal year due to a number of capital projects which were ongoing during our 2015 fiscal year. During our 2015 fiscal year, our primary capital additions were ethanol load-out, storage and fermentation projects. During our 2014 fiscal year, our primary capital project was installation of an additional hammer mill.
Cash Flow From Financing Activities
Financing activities used less cash during our 2015 fiscal year compared to the same period of 2014. During our 2015 fiscal year, we paid a smaller distribution compared to our 2014 fiscal year which used less cash. In addition, we had more debt repayments during our 2014 fiscal year compared to our 2015 fiscal year which increased the cash we used during our 2014 fiscal year.
27
Short-Term and Long-Term Debt Sources
Master Loan Agreement with Home Federal Savings Bank
On November 30, 2007, we entered into a Master Loan Agreement with Home Federal Savings Bank ("Home Federal") establishing a senior credit facility with Home Federal. In return, we executed a mortgage and a security agreement in favor of Home Federal creating a senior lien on substantially all of our assets. We currently have a $20 million term revolving loan with Home Federal.
Term Revolving Loan
We have a $20 million term revolving loan which has a maturity date of August 1, 2018. Interest on the term revolving loan accrues at a rate equal to the one month LIBOR plus 310 basis points. We are required to make monthly payments of interest until the maturity date of the term revolving loan, on which date the unpaid principal balance of the term revolving loan becomes due. As of December 31, 2016, we had $0 outstanding on our term revolving loan and $20,000,000 available to be drawn. Interest accrued on our term revolving loan as of December 31, 2016 at a rate of 3.73% per year.
Covenants
In connection with the Master Loan Agreement, we are required to comply with certain debt covenants and financial ratios. As of December 31, 2016, we were in compliance with all of our debt covenants and financial ratios.
Management anticipates that we will be in compliance with all of our debt covenants and financial ratios for at least the next 12 months.
Failure to comply with the loan covenants or to maintain the required financial ratios may cause acceleration of the outstanding principal balance on the loan and/or the imposition of fees, charges or penalties. Any acceleration of the debt financing or imposition of the fees, charges or penalties may restrict or limit our access to the capital resources necessary to continue plant operations.
Should we default on any of our obligations pursuant to the Home Federal loan, Home Federal may terminate its commitment to provide us funds and declare the entire unpaid principal balance of the loan, plus accrued interest, immediately due and payable. Events of default include the failure to make payments when due, our insolvency, any material adverse change in our financial condition or the breach of any of the covenants, representations or warranties we have made in the loan agreements.
Contractual Cash Obligations
In addition to our long-term debt obligations, we have certain other contractual cash obligations and commitments. The following table provides information regarding our contractual obligations and approximate commitments as of December 31, 2016:
Payment Due By Period | ||||||||||||||||||||
Contractual Cash Obligations | Total | Less than One Year | One to Three Years | Three to Five Years | After Five Years | |||||||||||||||
Debt Obligations | $ | — | $ | — | $ | — | $ | — | $ | — | ||||||||||
Operating Lease Obligations | 5,786,000 | 1,526,000 | 2,087,000 | 1,932,000 | 241,000 | |||||||||||||||
Purchase Obligations | 42,300,000 | 37,566,000 | 4,734,000 | — | — | |||||||||||||||
Total Contractual Cash Obligations | $ | 48,086,000 | $ | 39,092,000 | $ | 6,821,000 | $ | 1,932,000 | $ | 241,000 | ||||||||||
28
Application of Critical Accounting Estimates
Management uses estimates and assumptions in preparing our financial statements in accordance with generally accepted accounting principles. These estimates and assumptions affect the reported amounts of assets and liabilities, the disclosure of contingent assets and liabilities, and the reported revenues and expenses. Of the significant accounting policies described in the notes to our financial statements, we believe that the following are the most critical:
Revenue recognition
Revenue from the sale of the Company's products is recognized at the time title to the goods and all risks of ownership transfer to the customers. This generally occurs upon shipment, loading of the goods or when the customer picks up the goods. Interest income is recognized as earned. Shipping costs incurred by the Company in the sale of ethanol, distiller grains and corn oil are not specifically identifiable and as a result, revenue from the sale of ethanol, distiller grains and corn oil is recorded based on the net selling price reported to the Company from the marketer.
Derivative Instruments
The Company evaluates its contracts to determine whether the contracts are derivative instruments. Certain contracts that literally meet the definition of a derivative may be exempted from derivative accounting as normal purchases or normal sales. Normal purchases and normal sales are contracts that provide for the purchase or sale of something other than a financial instrument or derivative instrument that will be delivered in quantities expected to be used or sold over a reasonable period in the normal course of business. Contracts that meet the requirements of normal purchases or sales are documented as normal and exempted from the accounting and reporting requirements of derivative accounting.
The Company enters into short-term cash, option and futures contracts as a means of securing purchases of corn, natural gas and sales of ethanol for the plant and managing exposure to changes in commodity and energy prices. All of the Company's derivatives are designated as non-hedge derivatives for accounting purposes, with changes in fair value recognized in net income. Although the contracts are economic hedges of specified risks, they are not designated as and accounted for as hedging instruments.
As part of its trading activity, the Company uses futures and option contracts through regulated commodity exchanges to manage its risk related to pricing of inventories. To reduce that risk, the Company generally takes positions using cash and futures contracts and options.
Realized and unrealized gains and losses related to derivative contracts related to corn and natural gas are included as a component of cost of goods sold and derivative contracts related to ethanol are included as a component of revenues in the accompanying financial statements. The fair values of contracts entered through commodity exchanges are presented on the accompanying balance sheet as derivative instruments.
Off-Balance Sheet Arrangements
We do not have any off-balance sheet arrangements.
ITEM 7A. QUANTITATIVE AND QUALITATIVE DISCLOSURES ABOUT MARKET RISK
We are exposed to the impact of market fluctuations associated with commodity prices as discussed below. We have no exposure to foreign currency risk as all of our business is conducted in U.S. Dollars and we had no amounts outstanding on variable interest debt as of December 31, 2016. We use derivative financial instruments as part of an overall strategy to manage market risk. We use cash, futures and option contracts to hedge changes to the commodity prices of corn, natural gas and ethanol. We do not enter into these derivative financial instruments for trading or speculative purposes, nor do we designate these contracts as hedges for accounting purposes.
Commodity Price Risk
We seek to minimize the risks from fluctuations in the prices of raw material inputs, such as corn and natural gas, and finished products, such as ethanol and distiller grains, through the use of hedging instruments. In practice, as markets move, we actively manage our risk and adjust hedging strategies as appropriate. Although we believe our hedge positions accomplish an economic hedge against our future purchases and sales, management has chosen not to use hedge accounting, which would match the gain or loss on our hedge positions to the specific commodity purchase being hedged. We are using fair value accounting for our hedge positions, which means as the current market price of our hedge positions changes, the realized or unrealized gains and
29
losses are immediately recognized in our cost of goods sold or as an offset to revenues. The immediate recognition of hedging gains and losses under fair value accounting can cause net income to be volatile from quarter to quarter due to the timing of the change in value of the derivative instruments relative to the cost and use of the commodity being hedged.
As of December 31, 2016, we had price protection in place for approximately 9% of our anticipated corn needs, 0% of our natural gas needs and approximately 9% of our ethanol sales for the next 12 months. A sensitivity analysis has been prepared to estimate our exposure to ethanol, corn and natural gas price risk. Market risk related to these factors is estimated as the potential change in income resulting from a hypothetical 10% adverse change in the average cost of our corn and natural gas prices and average ethanol price as of December 31, 2016, net of the forward and future contracts used to hedge our market risk for corn and natural gas usage requirements. The volumes are based on our expected use and sale of these commodities for a one year period from December 31, 2016. The results of this analysis, which may differ from actual results, are as follows:
Estimated Volume Requirements for the next 12 months (net of forward and futures contracts) | Unit of Measure | Hypothetical Adverse Change in Price | Approximate Adverse Change to income | ||||||||
Natural Gas | 3,900,000 | MMBTU | 10% | $ | 1,473,000 | ||||||
Ethanol | 141,500,000 | Gallons | 10% | 21,791,000 | |||||||
Corn | 47,200,000 | Bushels | 10% | 15,680,000 | |||||||
For comparison purposes, our sensitivity analysis for our 2015 fiscal year is set forth below.
Estimated Volume Requirements for the next 12 months (net of forward and futures contracts) | Unit of Measure | Hypothetical Adverse Change in Price | Approximate Adverse Change to income | ||||||||
Natural Gas | 2,880,000 | MMBTU | 10% | $ | 849,600 | ||||||
Ethanol | 150,000,000 | Gallons | 10% | 19,200,000 | |||||||
Corn | 47,000,000 | Bushels | 10% | 16,356,000 | |||||||
30
PART 8. FINANCIAL STATEMENTS
REPORT OF INDEPENDENT REGISTERED PUBLIC ACCOUNTING FIRM
To the Board of Directors and Members
Homeland Energy Solutions, LLC
We have audited the accompanying balance sheets of Homeland Energy Solutions, LLC as of December 31, 2016 and 2015, and the related statements of operations, members’ equity, and cash flows for each of the three years in the period ended December 31, 2016. These financial statements are the responsibility of the Company's management. Our responsibility is to express an opinion on these financial statements based on our audits.
We conducted our audits in accordance with the standards of the Public Company Accounting Oversight Board (United States). Those standards require that we plan and perform the audit to obtain reasonable assurance about whether the financial statements are free of material misstatement. The Company is not required to have, nor were we engaged to perform, an audit of its internal control over financial reporting. Our audits included consideration of internal control over financial reporting as a basis for designing audit procedures that are appropriate in the circumstances, but not for the purpose of expressing an opinion on the effectiveness of the Company’s internal control over financial reporting. Accordingly, we express no such opinion. An audit also includes examining, on a test basis, evidence supporting the amounts and disclosures in the financial statements, assessing the accounting principles used and significant estimates made by management, as well as evaluating the overall financial statement presentation. We believe that our audits provide a reasonable basis for our opinion.
In our opinion, the financial statements referred to above present fairly, in all material respects, the financial position of Homeland Energy Solutions, LLC as of December 31, 2016 and 2015, and the results of its operations and its cash flows for each of the three years in the period ended December 31, 2016, in conformity with U.S. generally accepted accounting principles.

Des Moines, Iowa
March 3, 2017
31
Homeland Energy Solutions, LLC
Balance Sheets
December 31, 2016 | December 31, 2015 | ||||||
ASSETS | |||||||
CURRENT ASSETS | |||||||
Cash and cash equivalents | $ | 14,168,643 | $ | 20,256,678 | |||
Trading securities | 41,551,151 | 40,730,621 | |||||
Accounts receivable | 6,258,503 | 4,875,102 | |||||
Derivative instruments | 529,185 | 705,549 | |||||
Inventory | 11,619,564 | 7,653,149 | |||||
Prepaid and other | 2,708,029 | 2,382,674 | |||||
Total current assets | 76,835,075 | 76,603,773 | |||||
PROPERTY AND EQUIPMENT | |||||||
Land and improvements | 22,539,788 | 22,539,771 | |||||
Buildings | 6,344,990 | 5,684,546 | |||||
Equipment | 166,657,213 | 149,732,809 | |||||
Construction in progress | 8,270,322 | 2,518,695 | |||||
203,812,313 | 180,475,821 | ||||||
Less accumulated depreciation | 86,005,811 | 74,755,593 | |||||
Total property and equipment | 117,806,502 | 105,720,228 | |||||
OTHER ASSETS | |||||||
Utility rights, net of amortization of $1,319,217 and $1,182,829 | 988,812 | 1,125,200 | |||||
Other assets | 3,154,510 | 3,543,028 | |||||
Total other assets | 4,143,322 | 4,668,228 | |||||
TOTAL ASSETS | $ | 198,784,899 | $ | 186,992,229 | |||
See Notes to Financial Statements.
32
Homeland Energy Solutions, LLC
Balance Sheets (continued)
December 31, 2016 | December 31, 2015 | ||||||
LIABILITIES AND MEMBERS' EQUITY | |||||||
CURRENT LIABILITIES | |||||||
Accounts payable | $ | 16,051,844 | $ | 6,522,326 | |||
Due to former member | 30,000,000 | 30,000,000 | |||||
Accrued expenses | 1,372,493 | 1,139,020 | |||||
Total current liabilities | 47,424,337 | 37,661,346 | |||||
COMMITMENTS AND CONTINGENCIES | |||||||
LONG-TERM LIABILITIES | |||||||
Other liabilities | 123,190 | 350,059 | |||||
Total long-term liabilities | 123,190 | 350,059 | |||||
MEMBERS' EQUITY (64,585 units issued and outstanding) | 151,237,372 | 148,980,824 | |||||
TOTAL LIABILITIES AND MEMBERS' EQUITY | $ | 198,784,899 | $ | 186,992,229 | |||
See Notes to Financial Statements.
33
Homeland Energy Solutions, LLC
Statements of Operations
For the Years Ended December 31, 2016, 2015, and 2014
2016 | 2015 | 2014 | |||||||||
Revenue | $ | 272,938,079 | $ | 269,970,953 | $ | 330,436,817 | |||||
Costs of goods sold | 235,786,636 | 242,628,553 | 257,702,030 | ||||||||
Gross profit | 37,151,443 | 27,342,400 | 72,734,787 | ||||||||
Selling, general and administrative expenses | 3,736,798 | 3,618,821 | 4,694,794 | ||||||||
Operating income | 33,414,645 | 23,723,579 | 68,039,993 | ||||||||
Other income (expense) | |||||||||||
Interest expense | — | — | (129,480 | ) | |||||||
Interest income | 10,641 | 9,322 | 23,460 | ||||||||
Other income | 1,059,177 | 778,382 | 681,978 | ||||||||
Total other income (expense) | 1,069,818 | 787,704 | 575,958 | ||||||||
Net Income | $ | 34,484,463 | $ | 24,511,283 | $ | 68,615,951 | |||||
Basic & diluted net income per capital unit | $ | 534 | $ | 380 | $ | 1,062 | |||||
Distribution per capital unit | $ | 499 | $ | 362 | $ | 618 | |||||
Weighted average number of units outstanding for the calculation of basic & diluted net income per capital unit | 64,585 | 64,585 | 64,585 | ||||||||
See Notes to Financial Statements.
34
Homeland Energy Solutions, LLC
Statement of Members' Equity
For the Years ended December 31, 2016, 2015 and 2014
Members' | ||||
Equity | ||||
Balance, December 31, 2013 | $ | 119,146,890 | ||
Distributions | (39,913,530 | ) | ||
Net Income | 68,615,951 | |||
Balance, December 31, 2014 | 147,849,311 | |||
Distributions | (23,379,770 | ) | ||
Net Income | 24,511,283 | |||
Balance, December 31, 2015 | 148,980,824 | |||
Distributions | (32,227,915 | ) | ||
Net Income | 34,484,463 | |||
Balance, December 31, 2016 | $ | 151,237,372 | ||
See Notes to Financial Statements.
35
Homeland Energy Solutions, LLC
Statements of Cash Flows
For the Years Ended December 31, 2016, 2015, and 2014
2016 | 2015 | 2014 | |||||||||
CASH FLOWS FROM OPERATING ACTIVITIES | |||||||||||
Net income | $ | 34,484,463 | $ | 24,511,283 | $ | 68,615,951 | |||||
Adjustments to reconcile net income to net cash provided by operating activities: | |||||||||||
Depreciation and amortization | 11,386,606 | 10,697,083 | 10,476,150 | ||||||||
Unrealized loss (gain) on risk management activities | 176,364 | 599,148 | (123,922 | ) | |||||||
Unrealized (gain) on trading securities | (820,530 | ) | (275,789 | ) | (19,974 | ) | |||||
Change in working capital components: | |||||||||||
Accounts receivable | (1,383,401 | ) | (3,626,618 | ) | 6,236,402 | ||||||
Inventory | (3,966,415 | ) | 1,863,978 | (2,119,394 | ) | ||||||
Prepaid expenses and other | (325,355 | ) | (404,231 | ) | (76,733 | ) | |||||
Accounts payable, accrued expenses and other | 834,729 | (2,739,357 | ) | 726,526 | |||||||
Net cash provided by operating activities | 40,386,461 | 30,625,497 | 83,715,006 | ||||||||
CASH FLOWS FROM INVESTING ACTIVITIES | |||||||||||
Purchase of trading securities | — | (8,234,031 | ) | (32,200,827 | ) | ||||||
Payments for equipment and construction in progress | (14,635,099 | ) | (10,969,318 | ) | (1,968,649 | ) | |||||
Proceeds from sale of equipment | — | — | 17,054 | ||||||||
Decrease (Increase) in other assets | 388,518 | (308,540 | ) | (540,485 | ) | ||||||
Net cash (used in) investing activities | (14,246,581 | ) | (19,511,889 | ) | (34,692,907 | ) | |||||
CASH FLOWS FROM FINANCING ACTIVITIES | |||||||||||
Distribution to members | (32,227,915 | ) | (23,379,770 | ) | (39,913,530 | ) | |||||
Payments for debt issuance costs | — | — | (76,681 | ) | |||||||
Proceeds from long-term borrowings | — | — | 30,000,000 | ||||||||
Payments on long-term borrowings | — | — | (45,000,000 | ) | |||||||
Net cash (used in) financing activities | (32,227,915 | ) | (23,379,770 | ) | (54,990,211 | ) | |||||
Net (decrease) in cash | (6,088,035 | ) | (12,266,162 | ) | (5,968,112 | ) | |||||
Cash and Cash Equivalents - Beginning | 20,256,678 | 32,522,840 | 38,490,952 | ||||||||
Cash and Cash Equivalents - Ending | $ | 14,168,643 | $ | 20,256,678 | $ | 32,522,840 | |||||
SUPPLEMENTAL DISCLOSURES OF CASH FLOW INFORMATION | |||||||||||
Cash paid for interest | $ | — | $ | — | $ | 130,841 | |||||
SUPPLEMENTAL SCHEDULE OF NONCASH INVESTING AND FINANCING ACTIVITIES | |||||||||||
Accounts payable related to property and equipment | $ | 8,701,393 | $ | 93,000 | $ | — | |||||
See Notes to Financial Statements.
36
1. | Nature of Business and Significant Accounting Policies |
Nature of Business
Homeland Energy Solutions, LLC (an Iowa Limited Liability Company) is located near Lawler, Iowa and was organized to pool investors for a 100 million gallon ethanol plant with distribution throughout the United States. The Company has capacity to produce in excess of 145 million gallons annually and sells distillers dried grains and corn oil as byproducts of ethanol production.
Organization
Homeland Energy Solutions, LLC is organized as an Iowa limited liability company. The members' liability is limited as specified in Homeland Energy Solutions' operating agreement and pursuant to the Iowa Revised Uniform Limited Liability Company Act.
Significant Accounting Policies:
Accounting Estimates
Management uses estimates and assumptions in preparing these financial statements in accordance with United States Generally Accepted Accounting Principles. Those estimates and assumptions affect the reported amounts of assets and liabilities, the disclosure of contingent assets and liabilities, and the reported revenues and expenses. Actual results could differ from those estimates.
Cash and Cash Equivalents
The Company maintains its accounts primarily at one financial institution. At various times, the Company's cash balances may exceed amounts insured by the Federal Deposit Insurance Corporation. The Company has not experienced any losses in such accounts.
Trading Securities
Investments bought and held principally for the purpose of selling them in the near term are classified as trading securities. Trading securities are measured at fair value using prices obtained from pricing services. Any interest, dividends, and unrealized or realized gains and losses on the trading securities are recorded as part of other income (expense).
At December 31, 2016, trading securities consisted of corporate bonds and short term bond mutual funds with an approximate cost of $41,863,000 and fair value of $41,551,000. At December 31, 2015, trading securities consisted of corporate bonds and short term bond mutual funds with an approximate cost of $41,157,000 and fair value of $40,731,000. For the fiscal years ended December 31, 2016 and 2015, the Company recorded interest, dividends and realized and unrealized gains and losses from these investments of approximately $821,000 and $276,000, respectively.
The Board of Directors voted to set aside up to $30 million in trading securities that will be used by the Company for the repurchase of 25,860 membership units held by Steve Retterath per the terms of an agreement with Mr. Retterath entered into on June 13, 2013 by the Company.
Receivables
Credit sales are made primarily to two customers and no collateral is required. The Company carries these accounts receivable at face amount with no allowance for doubtful accounts due to the historical collection rates on these accounts.
Investments
The Company has a less than 20% investment interest in Renewable Products Marketing Group, LLC (RPMG). This investment is being accounted for under the equity method of accounting under which the Company's share of net income is recognized as income in the Company's income statement and added to the investment account. The investment balance is included in other assets and the income recognized as other income. The investment is evaluated for indications of impairment on a regular basis, a loss would be recognized when the fair value is determined to be less than the carrying value.
Inventories
Inventories are generally valued at the lower of cost (first-in, first-out) or net realizable value. In the valuation of inventories and purchase commitments, net realizable value is defined as estimated selling price in the ordinary course of business less reasonably predictable costs of completion, disposal, and transportation.
37
Property and Equipment
Property and equipment are stated at cost. Significant additions and betterments are capitalized, while expenditures for maintenance and repairs are charged to operations when incurred. The Company uses the straight-line method of computing depreciation over the estimated useful lives as follows.
Estimated Useful Life in Years | |||
Minimum | Maximum | ||
Land Improvements | 20 | 40 | |
Buildings | 10 | 40 | |
Equipment | 7 | 40 | |
The Company reviews its property and equipment for impairment whenever events indicate that the carrying amount of the asset group may not be recoverable. If circumstances require a long-lived asset group be tested for possible impairment, the Company first compares undiscounted cash flows expected to be generated by an asset group to the carrying value of the asset group. If the carrying value of the long-lived asset group in not recoverable on an undiscounted cash flow basis, an impairment is recognized to the extent that the carrying value exceeds its fair value. Fair value is determined through various valuation techniques including discounted cash flow models, quoted market values, and third-party independent appraisals, as considered necessary. The Company has concluded that no impairment is necessary as of December 31, 2016 and 2015.
Derivative Instruments
The Company evaluates its contracts to determine whether the contracts are derivative instruments. Certain contracts that literally meet the definition of a derivative may be exempted from derivative accounting as normal purchases or normal sales. Normal purchases and normal sales are contracts that provide for the purchase or sale of something other than a financial instrument or derivative instrument that will be delivered in quantities expected to be used or sold over a reasonable period in the normal course of business. Contracts that meet the requirements of normal purchases or sales are documented as normal and exempted from the accounting and reporting requirements of derivative accounting.
The Company enters into short-term cash, option and futures contracts as a means of securing purchases of corn, natural gas and sales of ethanol for the plant and managing exposure to changes in commodity and energy prices. All of the Company's derivatives are designated as non-hedge derivatives for accounting purposes, with changes in fair value recognized in net income. Although the contracts are economic hedges of specified risks, they are not designated or accounted for as hedging instruments.
As part of its trading activity, the Company uses futures and option contracts through regulated commodity exchanges to manage its risk related to pricing of inventories. To reduce that risk, the Company generally takes positions using cash and futures contracts and options.
Realized and unrealized gains and losses related to derivative contracts related to corn and natural gas are included as a component of cost of goods sold and derivative contracts related to ethanol are included as a component of revenues in the accompanying financial statements. The fair values of all contracts with the same counter party are presented net on the accompanying balance sheet as derivative instruments net of cash due from/to broker.
Utility Rights
Utility rights consist of payments to electric and natural gas companies for construction in aid of electric and gas lines to the facility but the Company retains no ownership rights to the assets. The utility rights are amortized on a straight-line basis over 15 years based on the estimate normal usage of such infrastructure.
38
At December 31, 2016, the Company anticipates the following amortization of utility rights for the years ended December 31:
2017 | $ | 136,000 | ||
2018 | 136,000 | |||
2019 | 136,000 | |||
2020 | 136,000 | |||
2021 | 136,000 | |||
Thereafter | 309,000 | |||
Total amortization | $ | 989,000 | ||
Revenue and Cost Recognition
Revenue from the sale of the Company's products is recognized at the time title to the goods and all risks of ownership transfer to the customers. This generally occurs upon shipment, loading of the goods or when the customer picks up the goods. Interest income is recognized as earned. Shipping costs incurred by the Company in the sale of ethanol and distiller grains are not specifically identifiable, and as a result, revenue from the sale of ethanol and distiller grains is recorded based on the net selling price reported to the Company from the marketer. Rail car lease costs incurred by the Company in the sale and shipment of distiller grain products are included in the cost of goods sold.
Income Taxes
The Company was formed under sections of the federal and state income tax laws which provide that, in lieu of corporate income taxes, the members separately account for their share of the Company's items of income, deductions, losses and credits. As a result of this election, no income taxes have been recognized in the accompanying financial statements.
Management has evaluated the Company's tax positions under the Financial Accounting Standards Board issued guidance on accounting for uncertainty in income taxes and concluded that the Company had taken no uncertain tax positions that require adjustment to the financial statements to comply with the provisions of this guidance.
Committed Shares to be Redeemed
On June 13, 2013, the Company entered into an agreement with Steve Retterath, the Company's largest member, to repurchase and retire all of the membership units owned by Mr. Retterath. The Company agreed to close on this repurchase on, or before, August 1, 2013. The Company agreed to repurchase and retire 25,860 membership units owned by Mr. Retterath in exchange for $30 million, to be paid in two equal installments, payable at closing and on July 1, 2014. The transaction failed to close by the scheduled date due to objections by Mr. Retterath. Due to all conditions of the agreement being met prior to, or on, August 1, 2013, the Company believes that it has a binding agreement with Mr. Retterath; as such the commitment to repurchase and retire the membership units is reflected in the financial statements as a liability as these shares became mandatorily redeemable on June 13, 2013. No distributions have been paid to Mr. Retterath since the time of the original expected closing date of August 1, 2013.
Net Income per Unit
Basic and diluted net income per unit is computed by dividing net income by the weighted average number of members' units and members' unit equivalents outstanding during the period. There were no member unit equivalents outstanding during the periods presented; accordingly, the Company's basic and diluted net income per unit are the same.
Prior to, or on, August 1, 2013, the Company believes it has a binding agreement with Steve Retterath to repurchase and retire all 25,860 membership units owned by Mr. Retterath. These membership units have thus been excluded in the determination of net income per unit as presented in the Statement of Operations. The Company is currently involved in litigation with Mr. Retterath. There is potential that Mr. Retterath will continue as a unit holder upon conclusion of the litigation and said membership units would not be redeemed under the repurchase agreement. If the units are not redeemed, basic and diluted net income per unit, including the 25,860 units, for the twelve months ended December 31, 2016, 2015 and 2014 would be approximately $381, $271, and $759, respectively.
39
Environmental Liabilities
The Company's operations are subject to environmental laws and regulations adopted by various governmental authorities in the jurisdiction in which it operates. These laws require the Company to investigate and remediate the effects of the release or disposal of materials at its locations. Accordingly, the Company has adopted policies, practices and procedures in the areas of pollution control, occupational health and the production, handling, storage and use of hazardous materials to prevent material environmental or other damage, and to limit the financial liability which could result from such events. Environmental liabilities are recorded when the Company's liability is probable and the costs can be reasonably estimated. No expense or liability, including asset retirement obligations, for environmental liabilities has been recorded for the years ended December 31, 2016, 2015, or 2014.
Fair Value
Financial instruments include cash and equivalents, trading securities, accounts receivable, derivative instruments, accounts payable and accrued expenses. The fair value of trading securities and derivative financial instruments is based on quoted market prices (see Note 8). The fair value of other current financial instruments is estimated to approximate carrying value due to the short-term nature of these instruments (Level 3).
Risks and Uncertainties
The Company has certain risks and uncertainties that it will experience during volatile market conditions, which can have a severe impact on operations. The Company's revenues are derived from the sale and distribution of ethanol, distiller grains and corn oil to customers primarily located in the United States. Corn for the production process is supplied to the plant primarily from local agricultural producers and from purchases on the open market. For the year ended December 31, 2016, ethanol sales averaged approximately 79% of total revenues, while approximately 17% of revenues were generated from the sale of distiller grains and 4% of revenues were generated from the sale of corn oil. For the year ended December 31, 2016, corn costs averaged approximately 79% of cost of goods sold.
The Company's operating and financial performance is largely driven by the prices at which it sells ethanol and the net expense of corn. The price of ethanol is influenced by factors such as supply and demand, weather, government policies and programs, and unleaded gasoline and the petroleum markets. Excess ethanol supply in the market, in particular, puts downward pressure on the price of ethanol. The Company's largest cost of production is corn. The cost of corn is generally impacted by factors such as supply and demand, weather, and government policies and programs. The Company's risk management program is used to protect against the price volatility of these commodities.
Recent & Pending Accounting Pronouncements
The Company is currently evaluating the following new accounting pronouncements and their potential impact, if any, on our financial statements:
In February 2016, FASB issued ASU No. 2016-02 "Leases” ("ASU 2016-02"). ASU 2016-02 requires the recognition of lease assets and lease liabilities by lessees for all leases greater than one year in duration and classified as operating leases under previous GAAP. ASU 2016-02 is effective for fiscal years beginning after December 15, 2018, and for interim periods within that fiscal year.
In May 2014, the FASB issued ASU No. 2014-09, "Revenue from Contracts with Customers." This ASU supersedes the revenue recognition requirements in "Accounting Standard Codification 605 - Revenue Recognition" and most industry-specific guidance. The standard requires that entities recognize revenue to depict the transfer of promised goods or services to customers in an amount that reflects the consideration to which a company expects to be entitled in exchange for those goods or services. This ASU is effective for fiscal years beginning after December 15, 2017, and for interim periods within that fiscal year.
40
2. INVENTORY
Inventory consisted of the following as of December 31, 2016 and 2015.
2016 | 2015 | |||||||
Raw Materials | $ | 8,489,218 | $ | 5,030,182 | ||||
Work in Process | 1,900,387 | 1,428,646 | ||||||
Finished Goods | 1,229,959 | 1,194,321 | ||||||
Totals | $ | 11,619,564 | $ | 7,653,149 | ||||
3. DEBT
Term Revolving Loan
The Company has a $20 million term revolving loan which has a maturity date of August 1, 2018 and is secured by substaintially all assets of the Company. Interest on the term revolving loan accrues at a rate equal to the one month LIBOR plus 310 basis points, 3.73% on December 31, 2016. The Company is required to make monthly payments of interest until the maturity date of the term revolving loan on August 1, 2018, on which date the unpaid principal balance of the term revolving loan becomes due. There was no balance outstanding on the term revolving loan as of December 31, 2016 or December 31, 2015. The Company had $20 million available at both December 31, 2016 and December 31, 2015.
Covenants
In addition, during the term of the Loans, the Company is subject to certain financial covenants at various times calculated monthly, quarterly or annually, including restriction of the payment of dividends and capital expenditures and maintenance of certain financial ratios including the minimum working capital and a fixed charge ratio as defined by the Master Loan Agreement. Failure to comply with the protective loan covenants or maintain the required financial ratios may cause acceleration of the outstanding principal balance on the Loan and/or the imposition of fees, charges or penalties.
4. RELATED PARTY TRANSACTIONS
Due to Former Member
On June 13, 2013, the Company entered into an agreement with Steve Retterath, the Company's largest member, to repurchase and retire all of the units owned by Mr. Retterath. The Company agreed to close on this repurchase on or before August 1, 2013. The Company agreed to repurchase and retire 25,860 memberships units owned by Mr. Retterath in exchange for $30 million, to be paid in two equal installments payable at closing and on July 1, 2014. The transaction failed to close by the scheduled date due to objections by Mr. Retterath. The Company believes that it has a binding agreement with Mr. Retterath. On August 14, 2013, the Company filed a lawsuit against Mr. Retterath in Iowa state court to enforce the terms of the repurchase agreements. The Company is asking the Iowa court to require Mr. Retterath to complete the repurchase agreement pursuant to its terms.
Mr. Retterath contends that he is not bound by the agreement. The Company's position is as of the closing date, Mr. Retterath is no longer the equitable owner of any membership units in the Company. As a result, the Company has recorded a $30 million short-term liability related to the amount the Company agreed to pay Mr. Retterath to repurchase his membership units and has correspondingly reduced members' equity on its balance sheet. If the Company is ultimately unsuccessful in its lawsuit against Mr. Retterath, the Company will reevaluate the accounting considerations made during the period of time that the lawsuit is pending.
Other Matters
The Company purchases corn and materials from members of its Board of Directors who own or manage elevators or are local producers of corn. Purchases during the years ended December 31, 2016, 2015 and 2014 from these companies and individuals totaled approximately $10,892,000, $5,977,000 and $4,187,000, respectively. Amounts due to those members was $0 as of December 31, 2016 and 2015.
41
5. COMMITMENTS, CONTINGENCIES AND AGREEMENTS
Ethanol, corn oil, and distiller grains marketing agreements and major customers
The Company has entered into a marketing agreement with RPMG, a related party, to sell all ethanol produced at the plant at a mutually agreed on price, less commission and transportation charges. As of December 31, 2016, the Company had commitments to sell approximately 4.6 million gallons at various fixed prices and 8.5 million gallons at basis price levels indexed against exchanges for delivery through March 31, 2017.
The Company has also entered into a marketing agreement with RPMG to sell all corn oil produced at the plant at a mutually agreed on price, less marketing fees and transportation charges. As of December 31, 2016, the Company had commitments to sell approximately 5.8 million pounds at various fixed and basis price levels indexed against exchanges for delivery throughout the first quarter of 2017.
The Company also has an investment in RPMG, LLC, included in other assets, totaling approximately $2,302,000 and $2,837,000 as of December 31, 2016 and 2015.
The Company has entered into a marketing agreement to sell all distiller grains produced at the plant to CHS, an unrelated party, at a mutually agreed on price, less commission and transportation charges. The agreement was renewed for another one year term on April 1, 2016. The agreement calls for automatic renewal for successive one-year terms unless 90-day prior written notice is given before the current term expires. As of December 31, 2016, the Company had approximately 47,000 tons of distiller grains commitments for delivery through June 2017 at various fixed prices.
Sales and marketing fees related to the agreements in place for the years ended December 31, 2016, 2015 and 2014 were as follows:
2016 | 2015 | 2014 | ||||||||||
Sales ethanol - RPMG | $ | 215,380,000 | $ | 201,978,000 | $ | 262,029,000 | ||||||
Sales distiller grains | 45,969,000 | 59,183,000 | 59,715,000 | |||||||||
Sales corn oil - RPMG | 11,589,000 | 8,810,000 | 8,976,000 | |||||||||
Marketing fees ethanol - RPMG | $ | 187,000 | $ | 169,000 | $ | 141,000 | ||||||
Marketing fees distiller grains | 777,000 | 787,000 | 722,000 | |||||||||
Marketing fees corn oil - RPMG | 76,000 | 60,000 | 46,000 | |||||||||
2016 | 2015 | |||||||||||
Amount due from RPMG | $ | 4,717,000 | $ | 3,641,000 | ||||||||
Amount due from CHS | 1,329,000 | 1,179,000 | ||||||||||
At December 31, 2016, the Company had approximately $10,579,000 in outstanding corn purchase commitments for bushels at various prices and approximately 1,850,000 bushels of unpriced corn purchase commitments through July 2018 accounted for under the normal purchase exclusion.
As of December 31, 2016, the Company had approximately 522,000 bushels with approximate market value of $1,809,000 of deferred corn. As of December 31, 2015, the Company had approximately 363,000 bushels with approximate market value of $1,291,000 of deferred corn.
The Company has commitments for minimum purchases of various utilities such as natural gas and electricity over the next three years, accounted for under the normal purchase exclusion, which are anticipated to approximate the following for the years ending December 31:
42
2017 | $ | 3,787,000 | ||
2018 | 3,787,000 | |||
2019 | 947,000 | |||
Total anticipated commitments | $ | 8,521,000 | ||
On December 29, 2016, the Company entered into a construction agreement with ICM, Inc. to install a dual dryer system as part of an expansion project. The total commitment under this agreement is $27 million and is expected to be completed during 2018. On March 2, 2017, the Company entered into a construction agreement with Nelson Engineering to build fermentors as part of the expansion project. The total commitment under this agreement is $4.2 million and is expected to be completed during 2018. The Company expects the total expansion project to cost approximately $42 million however no other commitments have been executed.
6. LEASE OBLIGATIONS
The Company leases rail cars and rail moving equipment with original terms up to 5 years. The Company is obligated to pay costs of insurance, taxes, repairs and maintenance pursuant to terms of the leases. Rent expense incurred for the operating leases during the years ended December 31, 2016, 2015 and 2014 was approximately $1,810,000, $1,608,000 and $1,664,000.
At December 31, 2016, the Company had the following approximate minimum rental commitments under non-cancelable operating leases for the years ended December 31:
2017 | $ | 1,526,000 | ||
2018 | 1,121,000 | |||
2019 | 966,000 | |||
2020 | 966,000 | |||
2021 | 966,000 | |||
Thereafter | 241,000 | |||
Total lease commitments | $ | 5,786,000 | ||
7. EMPLOYEE BENEFIT PLANS
On January 1, 2016, the Company adopted a 401k retirement plan which provides retirement savings options for all eligible employees. Previously, the Company utilized a Simple IRA Adoption Agreement to provide retirement savings options for all eligible employees. Employees meeting certain eligibility requirements can participate in the plan. The Company makes a matching contribution based on the participants' eligible wages. For the years ended December 31, 2016, 2015 and 2014, the Company made matching contributions of approximately $130,000, $91,000 and $77,000, respectively.
8. DERIVATIVE INSTRUMENTS
The Company's activities expose it to a variety of market risks, including the effects of changes in commodity prices. These financial exposures are monitored and managed by the Company as an integral part of its overall risk-management program. The Company's risk management program focuses on the unpredictability of financial and commodities markets and seeks to reduce the potentially adverse effects that the volatility of these markets may have on its operating results.
To reduce price risk caused by market fluctuations, the Company generally follows a policy of using exchange traded futures and options contracts to reduce its net position of merchandisable agricultural commodity inventories and forward cash purchase and sales contracts and uses exchange traded futures and options contracts to reduce price risk. Exchange-traded futures contracts are valued at market price. Changes in market price of exchange traded futures and options contracts related to corn and natural gas are recorded in costs of goods sold and changes in market prices of contracts related to the sale of ethanol, if applicable, are recorded in revenues.
43
The Company uses futures or options contracts to fix the purchase price of anticipated volumes of corn to be purchased and processed in a future month. The Company's plant will grind approximately 52 million bushels of corn per year. During the previous period and over the next 12 months, the Company has hedged and anticipates hedging between 5% and 60% of its anticipated monthly grind. At December 31, 2016, the Company has hedged portions of its anticipated monthly purchases for corn averaging approximately 9% of its anticipated monthly grind over the next twelve months.
Unrealized gains and losses on non-exchange traded forward contracts are deemed "normal purchases or sales" under authoritative accounting guidance, as amended and, therefore, are not marked to market in the Company's financial statements. The following table represents the approximate amount of realized and unrealized gains (losses) and changes in fair value recognized in earnings on commodity contracts for years ended December 31, 2016, 2015, and 2014 and the fair value of derivatives as of December 31, 2016 and 2015:
Income Statement Classification | Realized Gain (Loss) | Change In Unrealized Gain (Loss) | Total Gain (Loss) | ||||||||||
Derivatives not designated as hedging instruments: Commodity contracts for the year ended December 31, 2016. | |||||||||||||
Cost of Goods Sold | $ | 4,626,000 | $ | (443,000 | ) | $ | 4,183,000 | ||||||
Total | $ | 4,626,000 | $ | (443,000 | ) | $ | 4,183,000 | ||||||
Derivatives not designated as hedging instruments: Commodity contracts for the year ended December 31, 2015. | |||||||||||||
Cost of Goods Sold | $ | 1,574,000 | $ | 394,000 | $ | 1,968,000 | |||||||
Total | $ | 1,574,000 | $ | 394,000 | $ | 1,968,000 | |||||||
Derivatives not designated as hedging instruments: Commodity contracts for the year ended December 31, 2014. | |||||||||||||
Cost of Goods Sold | $ | 4,698,000 | $ | (185,000 | ) | $ | 4,513,000 | ||||||
Revenue | (283,000 | ) | 283,000 | — | |||||||||
Total | $ | 4,415,000 | $ | 98,000 | $ | 4,513,000 | |||||||
Balance Sheet Classification | December 31, 2016 | December 31, 2015 | |||||||
Futures and option contracts | |||||||||
In gain position | $ | 78,000 | $ | 462,000 | |||||
In loss position | (59,000 | ) | — | ||||||
Cash held by broker | 510,000 | 244,000 | |||||||
Current Asset | $ | 529,000 | $ | 706,000 | |||||
9. FAIR VALUE MEASUREMENTS
Financial assets and liabilities carried at fair value will be classified and disclosed in one of the following three categories:
Level 1: Valuations for assets and liabilities traded in active markets from readily available pricing sources for market transactions involving identical assets or liabilities.
44
Level 2: Valuations for assets and liabilities traded in less active dealer or broker markets. Valuations are obtained from third-party pricing services for identical or similar assets or liabilities.
Level 3: Valuations incorporate certain assumptions and projections in determining the fair value assigned to such assets or liabilities.
A description of the valuation methodologies used for instruments measured at fair value, including the general classification of such instruments pursuant to the valuation hierarchy, is set forth below:
Trading securities: Trading securities consisting of corporate bonds and short term bond mutual funds are reported at fair value utilizing Level 1 inputs. Trading securities are measured at fair value using prices obtained from pricing services.
Derivative financial instruments: Commodity futures and exchange-traded commodity options contracts are reported at fair value utilizing Level 1 inputs. For these contracts, the Company obtains fair value measurements from an independent pricing service. The fair value measurements consider observable data that may include dealer quotes and live trading levels from the CBOT and NYMEX markets.
The following table summarizes financial assets and financial liabilities measured at fair value on a recurring basis as of December 31, 2016 and December 31, 2015, segregated by the level of the valuation inputs within the fair value hierarchy utilized to measure fair value:
Total | Level 1 | Level 2 | Level 3 | ||||||||||||
Trading Securities | |||||||||||||||
December 31, 2016 | |||||||||||||||
Assets | $ | 41,551,000 | $ | 41,551,000 | $ | — | $ | — | |||||||
December 31, 2015 | |||||||||||||||
Assets | $ | 40,731,000 | $ | 40,731,000 | — | — | |||||||||
Derivative financial instruments | |||||||||||||||
December 31, 2016 | |||||||||||||||
Assets | $ | 78,000 | $ | 78,000 | $ | — | $ | — | |||||||
Liabilities | (59,000 | ) | (59,000 | ) | — | — | |||||||||
December 31, 2015 | |||||||||||||||
Assets | $ | 462,000 | $ | 462,000 | $ | — | $ | — | |||||||
10. LITIGATION MATTERS
Retterath
In relation to the repurchase agreement discussed in Note 4, on August 1, 2013 Mr. Retterath filed a lawsuit against the Company along with several directors, the Company's former CEO, former CFO, COO, a former director and the Company's outside legal counsel in Florida state court. Mr. Retterath voluntarily dismissed this lawsuit in August 2016. On August 14, 2013, the Company filed a lawsuit in Iowa state court to enforce the repurchase agreement the Company entered into with Mr. Retterath. In January 2017, the Company went to trial with Mr. Retterath regarding whether the repurchase agreement is valid and enforceable and expects the Iowa state court to render its decision during the first half of 2017. No distributions have been paid to Mr. Retterath since the time of the original expected closing date of August 1, 2013.
GS Cleantech Corporation
On August 9, 2013, GS Cleantech Corporation (GS Cleantech), a subsidiary of Greenshift Corporation, filed a complaint against the Company alleging that the Company's operation of a corn oil extraction process licensed by the Company infringes patent rights claimed by GS Cleantech. GS Cleantech seeks royalties, damages and potentially triple damages associated with the alleged infringement, as well as attorney's fees from the Company. The Company filed a motion for summary judgment which was granted by the Court. The Company expects GS Cleantech will appeal this decision. The Company has filed an answer and counterclaims
45
claiming invalidity of the patents, noninfringement, and inequitable conduct. The Company is not currently able to predict the outcome of the litigation with any degree of certainty.
46
11. QUARTERLY FINANCIAL DATA (UNAUDITED)
Summary quarterly results for the years ended December 31, 2016, 2015 and 2014 are as follows:
2016 | First Quarter | Second Quarter | Third Quarter | Fourth Quarter | ||||||||||||
Total Revenues | $ | 61,310,749 | $ | 70,146,120 | $ | 64,675,851 | $ | 76,805,359 | ||||||||
Gross Profit | 2,578,236 | 9,068,138 | 9,630,522 | 15,874,547 | ||||||||||||
Operating Income | 1,743,781 | 8,331,826 | 8,503,535 | 14,835,503 | ||||||||||||
Net Income | 2,473,366 | 8,741,240 | 8,671,364 | 14,598,493 | ||||||||||||
Basic & diluted earnings per unit | $ | 38 | $ | 135 | $ | 134 | $ | 226 | ||||||||
2015 | First Quarter | Second Quarter | Third Quarter | Fourth Quarter | ||||||||||||
Total Revenues | $ | 61,670,033 | $ | 72,749,790 | $ | 67,305,573 | $ | 68,245,557 | ||||||||
Gross Profit | 2,906,247 | 9,225,176 | 9,223,725 | 5,987,252 | ||||||||||||
Operating Income | 1,961,974 | 8,299,991 | 8,435,936 | 5,025,678 | ||||||||||||
Net Income | 2,592,159 | 8,345,300 | 8,612,666 | 4,961,158 | ||||||||||||
Basic & diluted earnings per unit | $ | 40 | $ | 129 | $ | 133 | $ | 77 | ||||||||
2014 | First Quarter | Second Quarter | Third Quarter | Fourth Quarter | ||||||||||||
Total Revenues | $ | 81,752,306 | $ | 87,823,949 | $ | 83,212,628 | $ | 77,647,934 | ||||||||
Gross Profit | 15,439,851 | 23,036,031 | 20,393,602 | 13,865,303 | ||||||||||||
Operating Income | 14,437,092 | 22,044,490 | 19,199,400 | 12,359,011 | ||||||||||||
Net Income | 14,695,363 | 22,145,502 | 19,247,197 | 12,527,889 | ||||||||||||
Basic & diluted earnings per unit | $ | 228 | $ | 343 | $ | 298 | $ | 194 | ||||||||
47
ITEM 9. CHANGES IN AND DISAGREEMENTS WITH ACCOUNTANTS ON ACCOUNTING AND FINANCIAL DISCLOSURE.
None.
ITEM 9A. CONTROLS AND PROCEDURES.
Disclosure Controls and Procedures
Management of Homeland Energy is responsible for maintaining disclosure controls and procedures that are designed to ensure that information required to be disclosed in the reports that we file or submit under the Securities Exchange Act of 1934 (the "Exchange Act") are recorded, processed, summarized and reported within the time periods specified in the Securities and Exchange Commission's rules and forms. In addition, the disclosure controls and procedures must ensure that such information is accumulated and communicated to the Company's management, including its Chief Executive Officer and Interim Chief Financial Officer, as appropriate, to allow timely decisions regarding required financial and other required disclosures.
As of the end of the period covered by this report, an evaluation of the effectiveness of our disclosure controls and procedures (as defined in Rules 13(a)-15(e) and 15(d)-15(e) of the Exchange Act) was carried out under the supervision and with the participation of our Chief Executive Officer (the principal executive officer), James Broghammer, and our Interim Chief Financial Officer (the principal financial and accounting officer), Christine Marchand. Based on their evaluation of our disclosure controls and procedures, they have concluded that such disclosure controls and procedures were effective as of December 31, 2016 to ensure that information required to be disclosed in the reports that we file or submit under the Exchange Act are recorded, processed, summarized and reported within the time periods required by the forms and rules of the Securities and Exchange Commission; and to ensure that the information required to be disclosed by an issuer in the reports that it files or submits under the Exchange Act is accumulated and communicated to our management including our principal executive and principal financial officers, or persons performing similar functions, as appropriate to allow timely decisions regarding required disclosure.
Internal Control Over Financial Reporting
Inherent Limitations Over Internal Controls
Our internal control over financial reporting is designed to provide reasonable assurance regarding the reliability of financial reporting and the preparation of financial statements for external purposes in accordance with generally accepted accounting principles. Our internal control over financial reporting includes those policies and procedures that:
(i) pertain to the maintenance of records that, in reasonable detail, accurately and fairly reflect the transactions and dispositions of our assets;
(ii) provide reasonable assurance that transactions are recorded as necessary to permit preparation of financial statements in accordance with generally accepted accounting principles, and that our receipts and expenditures are being made only in accordance with authorizations of our management and directors; and
(iii) provide reasonable assurance regarding prevention or timely detection of unauthorized acquisition, use, or disposition of our assets that could have a material effect on the financial statements.
Management, including our Chief Executive Officer and Interim Chief Financial Officer, does not expect that our internal controls will prevent or detect all errors and all fraud. A control system, no matter how well designed and operated, can provide only reasonable, not absolute, assurance that the objectives of the control system are met. Further, the design of a control system must reflect the fact that there are resource constraints, and the benefits of controls must be considered relative to their costs. Because of the inherent limitations in all control systems, no evaluation of internal controls can provide absolute assurance that all control issues and instances of fraud, if any, have been detected. Also, any evaluation of the effectiveness of controls in future periods is subject to the risk that those internal controls may become inadequate because of changes in business conditions, or that the degree of compliance with the policies or procedures may deteriorate.
Management's Annual Report on Internal Control over Financial Reporting
Our management is responsible for establishing and maintaining adequate internal control over financial reporting (as defined in Rule 13a-15(f) under the Securities Exchange Act of 1934, as amended). Management conducted an evaluation of the effectiveness of our internal control over financial reporting based on the criteria set forth in the 1992 Internal Control-Integrated
48
Framework issued by the Committee of Sponsoring Organizations of the Treadway Commission ("COSO"). Based on this evaluation, management has concluded that our internal control over financial reporting was effective as of December 31, 2016.
This annual report does not include an attestation report of our registered public accounting firm regarding internal control over financial reporting. As we are a non-accelerated filer, management's report is not subject to attestation by our registered public accounting firm.
This report shall not be deemed to be filed for purposes of Section 18 of the Securities Exchange Act of 1934, or otherwise subject to the liabilities of that section , and is not incorporated by reference into any filing of the Company, whether made before or after the date hereof, regardless of any general incorporation language in such filing.
Changes in Internal Controls
There were no changes in our internal control over financial reporting during the fourth quarter of our 2016 fiscal year, which were identified in connection with management's evaluation required by paragraph (d) of rules 13a-15 and 15d-15 under the Exchange Act, that have materially affected, or are reasonably likely to materially affect, our internal control over financial reporting.
ITEM 9B. OTHER INFORMATION.
None.
PART III
ITEM 10. DIRECTORS, EXECUTIVE OFFICERS AND CORPORATE GOVERNANCE
The information required by this Item is incorporated by reference in the definitive proxy statement from our 2017 annual meeting of members to be filed with the Securities and Exchange Commission within 120 days after our 2016 fiscal year end on December 31, 2016. This proxy statement is referred to in this report as the 2017 Proxy Statement.
ITEM 11. EXECUTIVE COMPENSATION.
The information required by this Item is incorporated by reference to the 2017 Proxy Statement.
ITEM 12. SECURITY OWNERSHIP OF CERTAIN BENEFICIAL OWNERS AND MANAGEMENT AND RELATED STOCKHOLDER MATTERS.
The information required by this Item is incorporated by reference to the 2017 Proxy Statement.
ITEM 13. CERTAIN RELATIONSHIPS AND RELATED TRANSACTIONS, AND DIRECTOR INDEPENDENCE.
The information required by this Item is incorporated by reference to the 2017 Proxy Statement.
ITEM 14. PRINCIPAL ACCOUNTING FEES AND SERVICES.
The information required by this Item is incorporated by reference to the 2017 Proxy Statement.
49
PART IV
ITEM 15. EXHIBITS, FINANCIAL STATEMENT SCHEDULES.
Exhibits Filed as Part of this Report and Exhibits Incorporated by Reference.
The following exhibits and financial statements are filed as part of, or are incorporated by reference into, this report:
(1) | Financial Statements |
The financial statements appear beginning at page 32 of this report.
(2) | Financial Statement Schedules |
All supplemental schedules are omitted as the required information is inapplicable or the information is presented in the financial statements or related notes.
(3) | Exhibits |
Exhibit No. | Exhibit | Filed Herewith | Incorporated by Reference | ||
3.1 | Articles of Organization of the registrant. | Exhibit 3.1 to the registrant's registration statement on Form SB-2 (Commission File 333-135967). | |||
3.2 | Certificate of Name Change and Corresponding Amendment to Articles of Organization. | Exhibit 3.2 to the registrant's registration statement on Form SB-2 (Commission File 333-135967). | |||
3.3 | Operating Agreement of the registrant. | Exhibit 3.3 to the registrant's registration statement on Form SB-2 (Commission File 333-135967). | |||
3.4 | First Amendment to Operating Agreement of the registrant dated November 14, 2006. | Exhibit 3.4 to Pre-Effective Amendment No. 3 to the registrant's registration statement on Form SB-2 (Commission File 333-135967). | |||
3.5 | Amended and Restated Operating Agreement dated April 4, 2013. | Exhibit 3.1 to the registrant's Form 10-Q filed with the Commission on May 15, 2013. | |||
3.6 | First Amendment to Amended and Restated Operating Agreement dated December 19, 2013. | Exhibit 3.6 to the registrant's Form 10-K filed with the Commission on February 27, 2014. | |||
4.1 | Form of Membership Unit Certificate. | Exhibit 4.2 to the registrant's registration statement on Form SB-2 (Commission File 333-135967). | |||
10.1 | License Agreement dated August 1, 2007 between Homeland Energy Solutions and ICM, Inc. | Exhibit 10.26 to the registrant's Form 10-QSB filed with the Commission on August 14, 2007. | |||
10.2 | Master Loan Agreement dated November 30, 2007 between Homeland Energy Solutions, LLC and Home Federal Savings Bank. | Exhibit 10.30 to the registrant's Form 10-KSB filed with the Commission on February 22, 2008. | |||
10.3 | First Supplement to the Master Loan Agreement dated November 30, 2007 between Homeland Energy Solutions, LLC and Home Federal Savings Bank. | Exhibit 10.31 to the registrant's Form 10-KSB filed with the Commission on February 22, 2008. | |||
10.4 | Second Supplement to the Master Loan Agreement dated November 30, 2007 between Homeland Energy Solutions, LLC and Home Federal Savings Bank. | Exhibit 10.32 to the registrant's Form 10-KSB filed with the Commission on February 22, 2008. | |||
10.5 | Third Supplement to the Master Loan Agreement dated November 30, 2007 between Homeland Energy Solutions, LLC and Home Federal Savings Bank. | Exhibit 10.33 to the registrant's Form 10-KSB filed with the Commission on February 22, 2008. | |||
50
10.6 | Construction Note dated November 30, 2007 between Homeland Energy Solutions, LLC and Home Federal Savings Bank. | Exhibit 10.34 to the registrant's Form 10-KSB filed with the Commission on February 22, 2008. | |||
10.7 | Term Revolving Note dated November 30, 2007 between Homeland Energy Solutions, LLC and Home Federal Savings Bank. | Exhibit 10.35 to the registrant's Form 10-KSB filed with the Commission on February 22, 2008. | |||
10.8 | Revolving Line of Credit Note dated November 30, 2007 between Homeland Energy Solutions, LLC and Home Federal Savings Bank. | Exhibit 10.36 to the registrant's Form 10-KSB filed with the Commission on February 22, 2008. | |||
10.9 | Mortgage dated November 30, 2007 between Homeland Energy Solutions, LLC and Home Federal Savings Bank. | Exhibit 10.37 to the registrant's Form 10-KSB filed with the Commission on February 22, 2008. | |||
10.10 | Security Agreement dated November 30, 2007 between Homeland Energy Solutions, LLC and Home Federal Savings Bank. | Exhibit 10.38 to the registrant's Form 10-KSB filed with the Commission on February 22, 2008. | |||
10.11 | Disbursing Agreement dated November 30, 2007 between Homeland Energy Solutions, LLC and Home Federal Savings Bank. | Exhibit 10.39 to the registrant's Form 10-KSB filed with the Commission on February 22, 2008. | |||
10.12 | Second Amendment to the Lump Sum Design-Build Agreement dated July 6, 2007 between Homeland Energy Solutions and Fagen, Inc. | Exhibit 10.40 to the registrant's Form 10-KSB filed with the Commission on February 22, 2008. | |||
10.13 | Agreement for Private Development between Homeland Energy Solutions, LLC and Chickasaw County, Iowa dated December 18, 2007. | Exhibit 10.42 to the registrant's Form 10-KSB/A filed with the Commission on May 15, 2008. | |||
10.14 | Iowa Department of Transportation Application Form for RISE: Immediate Opportunity Project Funding for Homeland Energy Solutions, LLC dated August 20, 2007. | Exhibit 10.44 to the registrant's Form 10-KSB/A filed with the Commission on May 15, 2008. | |||
10.15 | Engineering, Procurement, and Construction Agreement between Homeland Energy Solutions, LLC and Cornerstone Energy, LLC d/b/a Constellation New Energy - CEI, LLC dated December 4, 2007. + | Exhibit 10.45 to the registrant's Form 10-KSB/A filed with the Commission on May 15, 2008. | |||
10.16 | Master Natural Gas Agreement and Base Agreement between Homeland Energy Solutions, LLC and Cornerstone Energy, LLC d/b/a Constellation NewEnergy - Gas Division CEI, LLC dated December 4, 2007. + | Exhibit 10.46 to the registrant's Form 10-KSB/A filed with the Commission on May 15, 2008. | |||
10.17 | Distillers Grain Marketing Agreement with CHS, Inc. dated August 8, 2008. | Exhibit 10.2 to the registrant's Form 10-Q filed with the Commission on August 14, 2008. | |||
10.18 | Rail Facilities Agreement with R & R Contracting dated July 24, 2008. | Exhibit 10.3 to the registrant's Form 10-Q filed with the Commission on August 14, 2008. | |||
10.19 | Customer Agreement with ADM Investor Services, Inc. dated July 29, 2008. | Exhibit 10.4 to the registrant's Form 10-Q filed with the Commission on August 14, 2008. | |||
10.20 | Management Services Agreement dated December 15, 2008 with Golden Grain Energy, LLC. | Exhibit 10.1 to the registrant's Form 10-K filed with the Commission on February 26, 2009. | |||
10.21 | Electrical Services Agreement dated March 6, 2009 with Hawkeye REC. + | Exhibit 10.1 to the registrant's Form 10-Q filed with the Commission on May 15, 2009. | |||
10.22 | U.S. Energy Agreement dated July 10, 2009. | Exhibit 10.1 to the registrant's Form 10-Q filed with the Commission on August 14, 2009. | |||
51
10.23 | Third Amendment to the Master Loan Agreement between Homeland Energy Solutions, LLC and Home Federal Savings Bank dated September 10, 2010. | Exhibit 10.1 to the registrant's Form 10-Q filed with the Commission on November 12, 2010. | |||
10.24 | Member Ethanol Fuel Marketing Agreement dated March 1, 2011 between Homeland Energy Solutions, LLC and RPMG, Inc. + | Exhibit 10.1 to the registrant's Form 10-Q filed with the Commission on May 16, 2011. | |||
10.25 | Corn Oil Marketing Agreement between RPMG, Inc. and Homeland Energy Solutions, LLC dated July 28, 2011. + | Exhibit 10.1 to the registrant's Form 10-Q filed with the Commission on August 12, 2011. | |||
10.26 | Third Amended Management Services Agreement between Homeland Energy Solutions, LLC and Golden Grain Energy, LLC dated December 15, 2011. | Exhibit 10.26 to the registrant's Form 10-K filed with the Commission on February 21, 2012. | |||
10.27 | Member Amended and Restated Marketing Agreement between RPMG, Inc. and Homeland Energy Solutions, LLC dated August 27, 2012. *+ | Exhibit 10.1 to the registrant's Form 10-Q filed with the Commission on November 9, 2012. | |||
10.28 | Change in Control Agreement between David Finke and Homeland Energy Solutions, LLC dated January 1, 2013. | Exhibit 10.1 to the registrant's Form 10-Q filed with the Commission on May 15, 2013. | |||
10.29 | Change in Control Agreement between Stan Wubbena and Homeland Energy Solutions, LLC dated January 1, 2013. | Exhibit 10.2 to the registrant's Form 10-Q filed with the Commission on May 15, 2013. | |||
10.30 | Change in Control Agreement between Kevin Howes and Homeland Energy Solutions, LLC dated January 1, 2013. | Exhibit 10.3 to the registrant's Form 10-Q filed with the Commission on May 15, 2013. | |||
10.31 | Membership Unit Repurchase Agreement between Homeland Energy Solutions, LLC and Steven Retterath dated June 13, 2013. | Exhibit 10.1 to the registrant's Form 10-Q filed with the Commission on August 14, 2013. | |||
10.32 | Seventh Amendment to the Master Loan Agreement between Homeland Energy Solutions, LLC and Home Federal Savings Bank dated November 29, 2013. | Exhibit 10.32 to the registrant's Form 10-K filed with the Commission on February 27, 2014. | |||
10.33 | First Amendment to Second Supplement to Master Loan Agreement between Homeland Energy Solutions, LLC and Home Federal Savings Bank dated November 29, 2013. | Exhibit 10.33 to the registrant's Form 10-K filed with the Commission on February 27, 2014. | |||
10.34 | Eighth Amendment to the Master Loan Agreement between Homeland Energy Solutions, LLC and Home Federal Savings Bank dated February 24, 2014. | Exhibit 10.34 to the registrant's Form 10-K filed with the Commission on February 27, 2014. | |||
10.35 | Fourth Supplement to Master Loan Agreement between Homeland Energy Solutions, LLC and Home Federal Savings Bank dated February 24, 2014. | Exhibit 10.35 to the registrant's Form 10-K filed with the Commission on February 27, 2014. | |||
10.36 | $15 Million Term Note between Homeland Energy Solutions, LLC and Home Federal Savings Bank dated February 24, 2014. | Exhibit 10.36 to the registrant's Form 10-K filed with the Commission on February 27, 2014. | |||
10.37 | Termination Agreement between Golden Grain Energy, LLC and Homeland Energy Solutions, LLC dated May 16, 2014 | Exhibit 99.1 to the registrant's Form 8-K filed with the Commission on May 16, 2014 | |||
10.38 | Independent Contractor Agreement between Walter Wendland and Homeland Energy Solutions, LLC dated May 12, 2014. | Exhibit 10.1 to the registrant's Form 10-K filed with the Commission on August 12, 2014 | |||
10.39 | 2015 Annual Cash Bonus Plan. | Exhibit 10.1 to the registrant's Form 10-Q filed with the Commission on May 15, 2015 | |||
10.40 | Consulting Agreement between Homeland Energy Solutions, LLC and Cornerstone Resources LLC dated December 1, 2015. | Exhibit 10.40 to the registrant's Form 10-K filed with the Commission on February 25, 2016. | |||
52
10.41 | Twelfth Amendment to Master Loan Agreement between Homeland Energy Solutions, LLC and Home Federal Savings Bank dated December 7, 2015. | Exhibit 10.41 to the registrant's Form 10-K filed with the Commission on February 25, 2016. | |||
10.42 | Amended and Restated Consulting Agreement between Homeland Energy Solutions, LLC and Cornerstone Resources, LLC dated effective June 1, 2016. | Exhibit 10.1 to the registrant's Form 10-Q filed with the Commission on November 14, 2016. | |||
10.43 | Equipment Purchase and Installation Agreement between ICM, Inc. and Homeland Energy Solutions, LLC dated December 29, 2016 | X | |||
14.1 | Code of Ethics. | Exhibit 14.1 to the registrant's Form 10-K filed with the Commission on February 26, 2009. | |||
31.1 | Certificate Pursuant to 17 CFR 240.13a-14(a) | X | |||
31.2 | Certificate Pursuant to 17 CFR 240.13a-14(a) | X | |||
32.1 | Certificate Pursuant to 18 U.S.C. Section 1350 | X | |||
32.2 | Certificate Pursuant to 18 U.S.C. Section 1350 | X | |||
101 | The following financial information from Homeland Energy Solutions, LLC's Annual Report on Form 10-K for the fiscal year ended December 31, 2016, formatted in XBRL (eXtensible Business Reporting Language): (i) Balance Sheets as of December 31, 2016 and 2015, (ii) Statements of Operations for the fiscal years ended December 31, 2016, 2015 and 2014, (iii) Statements of Cash Flows for the fiscal years ended December 31, 2016, 2015 and 2014, (iv) Statement of Changes in Members' Equity, and (v) the Notes to Financial Statements.** | ||||
________________________________
(+) Confidential Treatment Requested.
(**) Furnished herewith.
SIGNATURES
Pursuant to the requirements of Section 13 or 15(d) of the Securities Exchange Act of 1934, the registrant has duly caused this report to be signed on its behalf by the undersigned, thereunto duly authorized.
HOMELAND ENERGY SOLUTIONS, LLC | |||
Date: | March 3, 2017 | /s/ James Broghammer | |
James Broghammer | |||
President and Chief Executive Officer (Principal Executive Officer) | |||
Date: | March 3, 2017 | /s/ Christine Marchand | |
Christine Marchand | |||
Interim Chief Financial Officer (Principal Financial Officer) | |||
53
Pursuant to the requirements of the Securities Exchange Act of 1934, this report has been signed below by the following persons on behalf of the registrant and in the capacities and on the dates indicated.
Date: | March 3, 2017 | /s/ Nick Bowdish | |
Nick Bowdish, Director | |||
Date: | March 3, 2017 | /s/ Patrick Boyle | |
Patrick Boyle, Vice Chairman and Director | |||
Date: | March 3, 2017 | /s/ Randy Bruess | |
Randy Bruess, Director | |||
Date: | March 3, 2017 | /s/ Steven Core | |
Steven Core, Chairman and Director | |||
Date: | March 3, 2017 | /s/ Mathew Driscoll | |
Mathew Driscoll, Secretary and Director | |||
Date: | March 3, 2017 | /s/ Stephen Eastman | |
Stephen Eastman, Director | |||
Date: | March 3, 2017 | /s/ Leslie Hansen | |
Leslie Hansen, Director | |||
Date: | March 3, 2017 | /s/ Edward Hatten | |
Edward Hatten, Director | |||
Date: | March 3, 2017 | /s/ Maurice Hyde | |
Maurice Hyde, Director | |||
Date: | March 3, 2017 | /s/ Chad Kuhlers | |
Chad Kuhlers, Director | |||
Date: | March 3, 2017 | /s/ Christine Marchand | |
Christine Marchand, Director | |||
54