Attached files
| file | filename |
|---|---|
| EX-32.1 - Shepherd's Finance, LLC | ex32-1.htm |
| EX-31.2 - Shepherd's Finance, LLC | ex31-2.htm |
| EX-31.1 - Shepherd's Finance, LLC | ex31-1.htm |
UNITED STATES
SECURITIES AND EXCHANGE COMMISSION
WASHINGTON, DC 20549
FORM 10-K
[X] Annual Report Pursuant to Section 13 or 15(d) of the Securities Exchange Act of 1934
For the Fiscal Year Ended December 31, 2016
or
[ ] Transition Report Pursuant to Section 13 or 15(d) of the Securities Exchange Act of 1934
For the Transition Period From _____________ to _____________
Commission File Number 333-203707
SHEPHERD’S FINANCE, LLC
(Exact name of registrant as specified on its charter)
| Delaware | 36-4608739 | |
| (State or other jurisdiction | (I.R.S. Employer | |
| of Incorporation or organization) | Identification No.) |
12627 San Jose Blvd., Suite 203, Jacksonville, FL 32223
(Address of principal executive offices)
302-752-2688
(Registrant’s telephone number including area code)
Indicate by check mark if the registrant is a well-known seasoned issuer, as defined in Rule 405 of the Securities Act. Yes [ ] No [X]
Indicate by check mark if the registrant is not required to file reports pursuant to Section 13 or Section 15(d) of the Act. Yes [ ] No [X]
Indicate by check mark whether the registrant (1) has filed all reports required to be filed by section 13 or 15(d) of the Securities Exchange Act of 1934 during the preceding 12 months (or for such shorter period that the registrant was required to file such reports) and (2) has been subject to such filing requirements for the past 90 days. Yes [X] No [ ]
Indicate by check mark whether the registrant has submitted electronically and posted on its corporate Web site, if any, every Interactive Data File required to be submitted and posted pursuant to Rule 405 of Regulation S-T (§232.405 of this chapter) during the preceding 12 months (or for such shorter period that the registrant was required to submit and post such files). Yes [X] No [ ]
Indicate by check mark if disclosure of delinquent filers pursuant to Item 405 of Regulation S-K is not contained herein, and will not be contained, to the best of registrant’s knowledge, in definitive proxy or information statements incorporated by reference in Part III of the Form 10-K or any amendment of this Form 10-K. [X]
Indicate by check mark whether the registrant is a large accelerated filer, accelerated filer, or non-accelerated filer. See definition of “accelerated filer and large accelerated filer” in Rule 12b-2 of the Exchange Act.
| Large accelerated filer | [ ] | Accelerated filer | [ ] |
| Non-accelerated filer | [ ] | Smaller reporting company | [X] |
Indicate by check mark whether the registrant is a shell company (as defined in Rule 12b-2 of the Exchange Act). Yes [ ] No [X]
DOCUMENTS INCORPORATED BY REFERENCE:
None.
FORM 10-K
SHEPHERD’S FINANCE, LLC
TABLE OF CONTENTS
| 2 |
CAUTIONARY NOTE REGARDING FORWARD-LOOKING STATEMENTS
Certain statements contained in this Form 10-K of Shepherd’s Finance, LLC, other than historical facts, may be considered forward-looking statements within the meaning of the federal securities laws. Words such as “may,” “will,” “expect,” “anticipate,” “believe,” “estimate,” “continue,” “predict,” or other similar words identify forward-looking statements. Forward-looking statements appear in a number of places in this report, including without limitation, “Management’s Discussion and Analysis of Financial Condition and Results of Operations,” and include statements regarding our intent, belief or current expectation about, among other things, trends affecting the markets in which we operate, our business, financial condition and growth strategies. Although we believe that the expectations reflected in these forward-looking statements are based on reasonable assumptions, forward-looking statements are not guarantees of future performance and involve risks and uncertainties. Actual results may differ materially from those predicted in the forward-looking statements as a result of various factors, including but not limited to those set forth in “Item 1A. Risk Factors.” If any of the events described in “Risk Factors” occur, they could have an adverse effect on our business, consolidated financial condition, results of operations and cash flows.
When considering forward-looking statements, our risk factors, as well as the other cautionary statements in this report and in our Form S-1 Registration Statement, should be kept in mind. Do not place undue reliance on any forward-looking statement. We are not obligated to update forward-looking statements.
| 3 |
Overview
We were organized in the Commonwealth of Pennsylvania in 2007 under the name 84 RE Partners, LLC and changed our name to Shepherd’s Finance, LLC on December 2, 2011. We converted to a Delaware limited liability company on March 29, 2012. Our business is focused on commercial lending to participants in the residential construction and development industry. We believe this market is underserved because of the lack of traditional lenders currently participating in the market. We are located in Jacksonville, Florida. Our operations are governed pursuant to our operating agreement.
From 2007 through the majority of 2011, we were the lessor in three commercial real estate leases with a then affiliate, 84 Lumber Company. Beginning in late 2011, we began commercial lending to residential homebuilders. Our current loan portfolio is described more fully in this section under the sub heading “Commercial Construction and Development Loans.” We have a limited operating history as a finance company. We currently have ten paid employees, including our Executive Vice President of Operations. We currently use three employees to originate most of our new loans. Our office staff processes, underwrites, documents, and funds our loans. Our office staff also manages our investor relations and relationships with other debt holders. Our Board of Managers is comprised of Mr. Daniel M. Wallach and three independent managers – Bill Myrick, Eric Rauscher, and Kenneth R. Summers. Our officers are responsible for our day-to-day operations, while the Board of Managers is responsible for overseeing our business.
The commercial loans we extend are secured by mortgages on the underlying real estate. We extend and service commercial loans to small-to-medium sized homebuilders for the purchase of lots and/or the construction of homes thereon. In some circumstances, the lot is purchased with an older home on the lot which is then either removed or rehabilitated. If the home is rehabilitated, the loan is referred to as a “rehab” loan. We also extend and service loans for the purchase of undeveloped land and the development of that land into residential building lots. In addition, we may, depending on our cash position and the opportunities available to us, do none, any or all of the following: purchase defaulted unsecured debt from suppliers to homebuilders at a discount (and then secure that debt with real estate or other collateral), purchase defaulted secured debt from financial institutions at a discount, and purchase real estate in which we will operate our business. In February of 2017, we purchased a building in which we intend to operate once construction has been completed. We anticipate that construction will be completed in the summer of 2017.
Our Chief Executive Officer, Mr. Wallach, has been in the housing industry since 1985. He was the CFO of a multi-billion dollar supplier of building materials to home builders for 11 years. He also was responsible for that company’s lending business for 20 years. During those years, he was responsible for the creation and implementation of many secured lending programs to builders. Some of these were performed fully by that company, and some were performed in partnership with banks. In general, the creation of all loans, and the resolution of defaulted loans, was his responsibility, whether the loans were company loans or loans in partnership with banks. Through these programs, he was responsible for the creation of approximately $2,000,000,000 in loans which generated interest spread of $50,000,000, after deducting for loan losses. Through the years, he managed the development of systems for reducing and managing the risks and losses on defaulted loans. Mr. Wallach also was responsible for that company’s unsecured debt to builders, which reached over $300,000,000 at its peak. He also gained experience in securing defaulted unsecured debt.
We had $20,091,000 and $14,060,000 in loan assets as of December 31, 2016 and 2015, respectively. As of December 31, 2016, we have 69 construction loans in 15 states with 30 borrowers, and have three development loans in Pittsburgh, Pennsylvania. At the end of 2014 and again in April 2015, we entered into purchase and sale agreements for portions of our loans. The first loan portions sold under the program took place during the first quarter of 2015. These agreements have allowed us to increase our loan balances and commitments significantly in 2015 and 2016. In January of 2017, we entered into a line of credit agreement with a bank for $500,000. As of January 31, 2017 we had $3,417,000 in equity and $21,238,000 in loan assets.
We currently have eight sources of capital:
| December 31, 2016 | December 31, 2015 | |||||||
| Capital Source | ||||||||
| Purchase and sale agreements | $ | 7,322 | $ | 3,683 | ||||
| Secured line of credit from affiliates | – | – | ||||||
| Unsecured senior line of credit from a bank | – | – | ||||||
| Unsecured Notes through our public offering | 11,221 | 8,496 | ||||||
| Other unsecured debt | 1,152 | 600 | ||||||
| Preferred equity Series B units | 1,150 | 1,010 | ||||||
| Common equity | 2,249 | 2,274 | ||||||
| Total | $ | 23,094 | $ | 16,063 | ||||
Certain features of the purchase and sale agreement have added liquidity and flexibility, which have lessened the need for the lines of credit from affiliates. A new line of credit that we obtained from a bank also lessens the need for lines of credit from affiliates.
| 4 |
Investment Objectives and Opportunity
Background and Strategy
Finance markets are highly fragmented, with numerous large, mid-size, and small lenders and investment companies, such as banks, savings and loan associations, credit unions, insurance companies, and institutional lenders, all competing for investment opportunities. Many of these market participants have experienced losses, as a result of the housing market (which started to decline in 2006, reached its bottom in 2008, and is not back to historical norms as of December 31, 2016), and their participation in lending in it. As a result of credit losses and restrictive government oversight, the financial institutions are not participating in this market to the extent they had before the credit crisis (as evidenced by the general lack of availability of construction financing and the higher cost of financing for the deals actually done). We believe that these lenders will be unable to satisfy the current demand for residential construction financing, creating attractive opportunities for niche lenders such as us for many years to come. Additionally, while we believe the current credit environment will be temporary, we believe the many participants in the finance markets will significantly alter their lending standards (including percentages loaned on collateral value, cash required up front from the builder, and the number of speculatively built homes allowed at any given time), which will also create attractive, long-term opportunities for us. Our goal is not to be a customer’s only source of commercial lending, but an extra, more user-friendly piece of their financing. In 2016, while more small banks returned to the construction lending market, the demand for our loan products has increased. We attribute this to our sales staff, an increase in the number of small home builders in the market, and an improving housing market.
We create and service construction loans differently than most lenders have done historically, in that we:
| ● | Focus on long-term lending relationships with customers, and only on this type of lending; | |
| ● | Are a specialist in this type of lending; | |
| ● | Have a geographically diverse lending footprint without having the overhead of a geographically diverse footprint of branches; | |
| ● | Generally use appraisers who are experts in the specific market (rather than simply using the cheapest or most readily available); | |
| ● | Work out defaulted loans with the same person that created that loan, which helps both control the creation of bad loans, and the losses on bad loans; | |
| ● | Pursue customers with defaulted loans faster and more aggressively than typical lenders; and | |
| ● | While pursuing those customers, offer creative solutions to help them sell their home while in default (such as offering cash allowances for the purchase of furniture or appliances or paying extra up-front costs on behalf of the buyers in order to lower their mortgage interest rates and monthly payments). |
We believe that while creating speculative construction loans is a high risk venture, the reduction in competition, the differences in our lending versus typical bank lending (listed above), and our loss mitigation techniques (covered below) will all help this to continue to be a profitable business.
During the second half of the previous decade, the housing market was plagued by declining values and a lack of housing starts. More recently, values and starts have been rising. We believe that, despite the issues in the speculative construction industry that were a result of the declining values and a lack of housing starts, it is a good time for this type of lending because:
| ● | Many traditional lenders to this market have exited or cut back, reducing competition and allowing large spreads (the difference between cost of funds and the rate we charge our borrowers). Better builders can be obtained as customers, with higher spreads; and | |
| ● | The number of housing starts is low but improving. We believe that we were at the bottom of the housing cycle in 2008, and it is likely that housing starts and values will both continue to increase over time. Increases in both of these items should have a positive effect on our performance; |
| 5 |
We engage in various activities to try to mitigate the risks inherent in this type of lending by:
| ● | Keeping the loan-to-value ratio, or LTV, between 60% and 75% on a portfolio basis, however, individual loans may, from time to time, have a greater LTV; | |
| ● | Generally using deposits from the builder on home construction loans to ensure the completion of the home. Lending losses on defaulted loans are usually a higher percentage when the home is not built, or is only partially built; | |
| ● | Having a higher yield than other forms of secured real estate lending; | |
| ● | Paying major subcontractors and suppliers directly, which reduces the frequency of liens on the property (liens generally hurt the net realized value of loss mitigation techniques); | |
| ● | Aggressively working with builders who are in default on their loan before and during foreclosure. This technique generally yields a reduced realized loss; and | |
| ● | Market grading. We review all lending markets, analyzing their historic housing start cycles. Then, the current position of housing starts is examined in each market. Markets are classified into volatile, average, or stable, and then graded based on that classification and our opinion of where the market is in its housing cycle. This grading is then used to determine the builder deposit amount, the LTV, and the yield. |
Additionally, most financial institutions are highly regulated. In exchange for that regulation, they offer FDIC insurance to their investors. We are not highly regulated, nor do we offer FDIC insurance to our investors. While we are subject to some regulation, such as anti-terrorism and commercial lending laws, currently, we are not subject to consumer lending rules or federal banking regulations. We believe this provides us with the opportunity to learn from the positive aspects of banking regulations while avoiding costly regulatory compliance.
Since we are not subject to the stringent regulatory requirements imposed upon the operations of commercial banks, we feel that we have a competitive edge that allows us to make prudent, business-minded decisions. While regulators are restricting investments by regulated financial institutions in commercial construction loans, our business plan emphasizes commercial construction lending as our main line of business. We believe this to be an opportunity as the regulatory environment and resulting contraction in commercial lending has resulted in this segment of the market having fewer lenders. We also believe the real estate market is in a long, slow recovery. Finally, while we have instituted many of the underwriting requirements and activities used by regulated financial institutions, we believe that not being stringently regulated provides us with more flexibility in our underwriting process and procedures.
Outside of differences in our lending policies, we believe the benefits to not being stringently regulated include:
| ● | our ability to better manage our outflow of funds because the notes issued pursuant to our public offering (the “Notes”) have a stated term. Banks must offer demand deposit accounts (checking accounts) and other accounts, which provide that funds can be withdrawn at any time; | |
| ● | avoiding FDIC insurance and other regulatory fees; | |
| ● | not being subject to the Community Reinvestment Act; and | |
| ● | having less leverage than a bank. |
Conversely, our lack of stringent regulation introduces us to other risks which may harm us. For example:
| ● | we are not well diversified in our product risk; | |
| ● | we cannot benefit from government programs designed to protect regulated financial institutions; | |
| ● | we are not subject to periodic examinations by federal or state banking regulators; and | |
| ● | our cost of funds is higher. |
In addition, our Note holders will have greater risks than depositors in a regulated financial institution, since their investments will not be insured.
| 6 |
To help mitigate the risks associated with not being stringently regulated, we:
| ● | follow many of the same underwriting principals historically used by banks, including: |
| ● | Collateralizing loans; | |
| ● | Using LTV’s to control risk; | |
| ● | Controlling the number of loans in one subdivision; | |
| ● | Underwriting appraisals; and | |
| ● | Conducting property inspections; |
| ● | maintain loan files generally containing similar information as a bank loan file; | |
| ● | secure our loans with mortgages and other documents like banks do; and | |
| ● | monitor many of the same ratios bank regulators monitor. |
So, while we, in our opinion, improve on some policies and procedures historically used by banks, which we would not be able to do if we were stringently regulated, we follow many of the policies and procedures set up by the various bank regulators. We believe this balanced approach helps us mitigate risk while providing us the opportunity to participate in what we believe to be an underserved market. One example of an improvement on a policy historically used by banks is appraiser selection. Many times banks use a random process to select an appraiser, or a process which uses a middle man. We generally select one of the most qualified appraisers in the specific portion of the market in which we are having the appraisal prepared. We believe this provides for a more consistent result. Another example is geographic diversity. Banks generally do not lend outside of their branch footprint. This does not give regional or local banks enough exposure to most of the United States, but gives them too much exposure in a smaller area. Our geographic diversity has improved over the last three years (we were lending in fifteen and nine states as of December 31, 2016 and 2015, respectively).
Our loans are marketed by lending representatives who work for us and are driven to maintain long-term customer relationships. Compensation for loan originators is focused on the profitability of loans originated, not simply the volume of loans originated. As of January 1, 2017, we have retained ten employees (three of which are lending representatives) including our Chief Executive Officer. In his previous experience, our Chief Executive Officer had a nationwide staff of 20 lenders working in the field.
While our business was initially focused on transactions originating in the Pittsburgh area, in 2014 we originated loans in Colorado, Florida, Georgia, Louisiana, New Jersey, Pennsylvania, and South Carolina. In 2015, we entered Delaware, Connecticut, and North Carolina. In 2016 we entered Idaho, Michigan, New York, Ohio, Tennessee, and Utah. We anticipate expanding into other states in 2017. Our goal is to market our loans on a nationwide basis. Currently, our loan portfolio consists of loans made to thirty customers, and, as we grow our loan assets, we intend to further diversify our customer base.
Lines of Business
Our efforts are designed to create a portfolio that includes some or all of the following investment characteristics: (i) provides current income; (ii) is well-secured by residential real estate; (iii) is short term in nature; and (iv) provides high interest spreads. While we primarily provide commercial construction loans to homebuilders (for residential real estate), we may also purchase defaulted unsecured debt from suppliers to homebuilders at a discount (and then secure that debt with real estate or other collateral), purchase defaulted secured debt from financial institutions at a discount, and purchase real estate in which we will operate our business. In February of 2017, we purchased a building in which we intend to operate once construction has been completed. We anticipate that construction will be completed in the summer of 2017.
Our investment policies may be amended or changed at any time by our Board of Managers.
Commercial Construction Loans to Homebuilders
We extend and service commercial loans to small-to-medium sized homebuilders for the purchase of lots and/or the construction of homes thereon. We also extend and service loans for the purchase of undeveloped land and the development of that land into residential building lots. In addition, we lend money to purchase and rehabilitate older existing homes. Most of the loans are for “spec homes” or “spec lots,” meaning they are built or developed speculatively (with no specific end-user home owner in mind). The loans are secured, and the collateral is the land, lots, and constructed items thereon, as well as additional collateral, as we deem appropriate. Currently, all of our loans are secured by real property. Generally, our loans are secured by a first priority mortgage lien; however, we may make loans secured by a second or other lower priority mortgage lien. The loans are demand loans, but the typical length of a home construction loan will range between six months and two years (our average duration has been eight months for paid off loans, and our average outstanding loan is five months old). The typical length of a development project ranges between three and six years. Larger developments are usually developed in phases. Additionally, all of our loans are currently secured by personal guarantees by those owning 10% or more of the borrower.
| 7 |
In a typical home construction transaction, a homebuilder obtains a loan to purchase a lot and build a home on that lot. In some cases, the builder has a contract with a customer to purchase the home upon its completion. In other cases, the home is built as a spec home, but the homebuilder believes it will sell before or shortly after completion, and therefore, building the home before it is under contract will increase the homebuilder’s sales and profitability. The builder may also believe that the construction of a spec home will increase the number of contract sales he will have in a given year, as it may be easier to sell contract homes when the customer can see the builder’s work in the spec home. In some cases, these speculatively built homes are constructed with the intention to keep them as a model for a period of time, to increase contract sales, and then be sold. These are called model homes. While we may lend to a homebuilder for any of these types of new construction homes, about 82% of our construction loans to date have been spec homes and 18% have been contracts.
In a typical development transaction, a homebuilder/developer purchases a specific parcel or parcels of land. Developers must secure financing in order to pay the purchase price for the land as well as to pay expenses incurred while developing the lots. This is the financing we provide. Once financing has been secured, the lot developers create individual lots. Developers secure permits allowing the property to be developed and then design and build roads and utility systems for water, sewer, gas, and electricity to service the property. The individual lots are then sold before a home is built on them; paid off, built on and then sold; or built on, then sold and paid off (in these cases, we may subordinate our loan to the home construction loan). A portion of our current loan portfolio is made up of development loans and is more fully described in “Commercial Construction and Development Loans” in this section.
In a typical rehab transaction, we fund all or a portion of the purchase price, and then all of the cost to complete the project. In some circumstances, we are unable to see the inside of the home prior to closing, so we assume that anything from drywall to completion needs to be redone, as well as what we can see from the outside. Because we are flexible in our need to see the inside of the home, and we only use experienced builders as customers for this type of lending, we are different than banks.
We fund the loans we originate using available cash resources that are generated primarily from borrowings, our purchase and sale agreements, proceeds from the Notes, equity, and net operating cash flow. We intend to continue funding loans we originate using the same sources.
There is a seasonal aspect to home construction, and this affects monthly cash flow. In general, since the home construction loans we create will last less than a year on average, and since we are geographically diverse, the seasonality impact is somewhat mitigated.
Generally, our real estate loans are secured by one or more of the following:
| ● | the parcels of land to be developed; | |
| ● | finished lots; | |
| ● | model homes and new single-family homes; | |
| ● | a pledge of some or all of the equity interests in the borrower entity or other parent entity that owns the borrower entity; | |
| ● | additional assets of the borrower, including parcels of undeveloped and developed real property; and | |
| ● | in most cases, personal guarantees of the principals of the borrower entity. |
Our Chief Executive Officer is responsible for the oversight of all aspects of our commercial construction loan business, including:
| ● | closing and recording of mortgage documents; | |
| ● | collecting principal and interest payments; | |
| ● | enforcing loan terms and other borrower’s requirements; | |
| ● | periodic review of each loan file; and | |
| ● | exercising our remedies in connection with defaulted or non-performing loans. |
| 8 |
Our customers are typically small-to-medium sized homebuilders that are currently building in the markets in which we lend to them. Generally, they benefit from doing business with us not just because they are able to sell additional homes (which we finance), but because, as they build additional homes, they are able to increase sales of homes that are built as contracted homes, where the eventual home owner supplies the loan. Builders generally have more success selling homes when a model or spec home is available for customers to see. Most of our lending is based on the following general policies:
| Customer Type | Small-to-Medium Size Homebuilders |
| Loan Type | Commercial |
| Loan Purpose | Construction/rehabilitation of Homes or Development of Lots |
| Security | Homes, Lots, and/or Land |
| Priority | Generally, our loans are secured by a first priority mortgage lien; however, we may make loans secured by a second or other lower priority mortgage lien. |
| Loan-to-Value Averages | 60-75% |
| Loan Amounts | Average home construction loan $400,000, development loans vary greatly |
| Term | Demand |
| Rate | Cost of Funds plus 2%, minimum rate of 7% |
| Origination Fee | 5% for home construction loans, development loans on a case by case basis |
| Title Insurance | Only on high risk loans and rehabs |
| Hazard Insurance | Always |
| General Liability Insurance | Always |
| Credit | Builder should have significant building experience in the market, be building in the market currently, be able to make payments of interest, be able to make the required deposit, have acceptable personal credit, and have open lines of credit (unsecured) with suppliers reasonably within terms. Required deposits may be able to be avoided if we do not fund the purchase of land. We generally do not advertise to find customers, but use our loan representatives. We believe this approach will allow us to focus our efforts on builders that meet our acceptable risk profile. |
| Third Party Guarantor | None, however the loans are generally guaranteed by the owners of the Borrower |
We may change these policies at any time based on then-existing market conditions or otherwise, at the discretion of our Chief Executive Officer and Board of Managers.
Purchases and Securitization of Unsecured Debt from Suppliers to Homebuilders
Homebuilders generally buy their construction materials from building supply companies, which offer unsecured credit lines for these purchases. Sometimes the builder is unable to pay the principal on their line of credit when due, and in a small percentage of these cases, the builder owns unencumbered real estate. When this is the case, the building supply company may convert the unsecured line of credit to secured, using this real estate as security. In some of these situations, the building supply company is unwilling to complete this type of transaction, and is willing to take a payment of a percentage of the balance of the unsecured line as full payment. If we pay the building supply company a percentage of this debt, and then take the real estate as collateral for the whole amount of the original debt, management’s experience indicates we will be able to eventually collect from the builder, or from the sale of the property through foreclosure or otherwise, creating a profit for ourselves. We have not completed any of these transactions, but may choose to do so if the opportunity presents itself.
Purchases of Defaulted Secured Debt from Financial Institutions
Some financial institutions have made loans to homebuilders. In some cases, these loans default, and eventually these loans result in collateral foreclosure. After the foreclosure proceeding, the properties usually become the property of the financial institution, which then sells the property, generally at a loss. While the loan is in the foreclosure process, and after the process while the real estate is owned and for sale, the bank holds a nonperforming asset. Sometimes these nonperforming assets negatively impact the banks’ profitability and regulatory ratios. Some banks choose to cleanse their books of these items at a severe loss, allowing them to, while taking a loss, get back to their commercial lending business. There are opportunities to purchase some portfolios of defaulted loans, and/or real estate owned through foreclosure, at deep discounts compared to the actual value of the property. We have not completed any of these transactions, but may choose to do so if the opportunity presents itself.
Purchases of Real Estate
In limited circumstances, the commercial construction loans described above may result in us owning commercial real property as a result of a loan workout, foreclosure, or similar circumstances. Since 2011 we have acquired six pieces of property in this fashion. Three of these were lots which were never built on. These lots were in Georgia. We build and sold one house on one of those lots in 2016, and plan to do the same on one or both of the remaining two lots. We obtained two partially built homes in Louisiana. One has been completed and is listed, and the other is still being completed. We also obtained a valuable lot in Sarasota. This lot has a sales agreement on it and may close in March of 2017. In addition, we purchased a commercial office in which we intend to operate later in 2017. We intend to manage and dispose of any real property assets we acquire in the manner that our management determines is most advantageous to us.
| 9 |
Commercial Construction and Development Loans
Pennsylvania Loans
On December 30, 2011, pursuant to a credit agreement (as amended, the “Credit Agreement”) by and between us, Benjamin Marcus Homes, LLC (“BMH”), Investor’s Mark Acquisitions, LLC (“IMA”), and Mark L. Hoskins (“Hoskins”) (collectively, the “Hoskins Group”), we originated two new loan assets, one to BMH as borrower (the “BMH Loan”) and one to IMA as borrower (the “New IMA Loan”). Pursuant to the Credit Agreement and simultaneously with the origination of the BMH Loan and the New IMA Loan, we also assumed the position of lender on an existing loan to IMA (the “Existing IMA Loan”) and assumed the position of borrower on another existing loan in which IMA serves as the lender (the “SF Loan”). Throughout this report, we refer to the BMH Loan, the New IMA Loan, and the Existing IMA Loan collectively as the “Pennsylvania Loans.” When we assumed the position of the lender on the Existing IMA Loan, we purchased a loan which was originated by the borrower’s former lender, and assumed that lender’s position in the loan and maintained the recorded collateral position in the loan. The borrower’s former lender and the seller of the BMH property are the same independent third party. The BMH Loan, the New IMA Loan and the Existing IMA Loan are all cross-defaulted and cross-collateralized with each other. Further, IMA and Hoskins serve as guarantors of the BMH Loan, and BMH and Hoskins serve as guarantors of the New IMA Loan and the Existing IMA Loan. As such, we are currently reliant on a single developer and homebuilder for a significant portion of our revenues.
As a result of amendments to the Credit Agreement, we converted $1,000,000 of the SF Loan from debt to preferred equity. This preferred equity serves as collateral for the Pennsylvania Loans. There is no liquid market for the preferred equity, so we can give no assurance as to our ability to generate any amount of proceeds from that collateral. We also reduced the balance of the SF Loan by $125,000, which was added to the interest escrow, and repaid the remaining $375,000 with cash. The interest rate on the Existing IMA Loan was raised to match the New IMA Loan. Beginning in December 2015, the Hoskins Group invests in our preferred equity in an amount equal to $10,000 per closing of a lot payoff in the Hamlets or Tuscany subdivisions.
Also as a result of amendments to the Credit Agreement, we funded an additional $750,000 of interest escrow, we issued several letters of credit relating to BMH Loan which totaled $90,000 and $68,000 at December 31, 2016 and 2015, respectively, and we issued cash bonds for development with $257,000 outstanding at both December 31, 2016 and 2015.
Currently the Pennsylvania Loans have a maximum commitment amount of $5,931,000. We collected a fee of $1,000,000 at closing funded by loan proceeds, all of which was earned over the original expected life of the loans, which was July of 2016. Interest on the Pennsylvania Loans accrues annually at 7% (which increased from 2% starting August 1, 2016) plus the greater of (i) 5.0% or (ii) the weighted average price paid by us on or in connection with all of our borrowed funds (such weighted average price includes interest rates, loan fees, legal fees and any and all other costs paid by us on our borrowed funds, and, in the case of funds borrowed by us from our affiliates, the weighted average price paid by such affiliate on or in connection with such borrowed funds) (“COF”). Interest payments are funded from the Interest Escrow, with any shortfall funded by the Hoskins Group. Payments of principal are due upon our demand and in accordance with the payment schedule and other terms and conditions set forth in the Credit Agreement. The Credit Agreement obligates the Hoskins Group to make payoffs to us in varying amounts upon the sale or transfer of, or obtaining construction financing for, all or a portion of the property securing the Pennsylvania Loans. The Pennsylvania Loans may be prepaid in whole or in part at any time without penalty. The loans are secured by several first priority mortgages in residential property, consisting of 23 building lots located in the subdivisions commonly known as the Hamlets of Springdale and the Tuscany Subdivision, both in Peters Township, Pennsylvania, a suburb of Pittsburgh, as well as the Interest Escrow. The seller of the property securing the BMH Loan retained a second mortgage in the amount of $400,000, with a balance of approximately $61,000 and $157,000 as of December 31, 2016 and December 31, 2015, respectively.
Interest Escrow
The Pennsylvania Loans called for a funded Interest Escrow account which was funded with proceeds from the Pennsylvania Loans. The initial funding on that Interest Escrow was $450,000. The balance as of December 31, 2016 and 2015 was $541,000 and $267,000, respectively. To the extent the balance is available in the Interest Escrow, interest due on certain loans is deducted from the Interest Escrow on the date due. The Interest Escrow is increased by 20% of lot payoffs on the same loans, and by distributions on the Hoskins Group preferred equity. All of these transactions are noncash to the extent that the total escrow amount does not need additional funding. The Interest Escrow is also used to contribute to the reduction of the $400,000 subordinated mortgage upon certain lot sales of the collateral of the BMH Loan.
| 10 |
A detail of the financing receivables for the Pennsylvania loans at December 31, 2016 is as follows:
(All dollar [$] amounts shown in table in thousands).
| Item | Term | Interest Rate | Funded
to borrower |
Estimated collateral values |
||||||||
| BMH Loan | Demand(1) | COF +7%
(7% Floor) |
||||||||||
| Lots | $ | 39 | $ | 3,173 | (3) | |||||||
| Interest Escrow | 950 | 541 | ||||||||||
| Cash Bond | 257 | (5) | 257 | |||||||||
| Loan Fee | 750 | – | ||||||||||
| Total BMH Loan | 1,996 | 3,971 | ||||||||||
| IMA Loans | ||||||||||||
| New IMA Loan (loan fee) | Demand(1) | COF +7% (7% Floor) |
250 | – | ||||||||
| New IMA Loan (advances) | Demand(1) | COF +7% (7% Floor) |
149 | – | ||||||||
| Existing IMA Loan | Demand(2) | COF +7% (7% Floor) |
1,687 | 1,465 | (4) | |||||||
| Total IMA Loans | 2,086 | 1,465 | ||||||||||
| SF Preferred Equity | – | 1,150 | (6) | |||||||||
| Total | $ | 4,082 | $ | 6,586 | ||||||||
(1) These are the stated terms; however, in practice, principal will be repaid upon the sale of each developed lot.
(2) These are the stated terms; however, in practice, principal will be repaid upon the sale of each developed lot after the BMH loan and the New IMA loan are satisfied.
(3) Estimated collateral value is equal to the appraised value of the remaining lots of $3,756, net of the net estimated costs to finish the development of $583.
(4) Estimated collateral value is equal to the appraised value of $1,568, net of estimated costs to finish the development of $103.
(5) The cash bond is in place to guarantee to the township that work will be completed on this project. We will fund this work and expect to cancel the bond upon completion of the work.
(6) In the event of a foreclosure on the property securing certain of our loans, a portion of our collateral is preferred equity in our Company, which might be difficult to sell, which could impact our ability to eliminate the loan balance.
The Company has a credit agreement with its largest borrower which includes a maximum exposure on all three loans, as described in the chart below. This limit does not include construction loans.
Commercial Loans – Real Estate Development Loan Portfolio Summary
The following is a summary of our loan portfolio to builders for land development as of December 31, 2016. The Pennsylvania loans below are the Pennsylvania Loans discussed above.
(All dollar [$] amounts shown in table in thousands).
| State | Number
of Borrowers |
Number of Loans |
Value of Collateral(1) |
Commitment Amount |
Amount Outstanding |
Loan to Value Ratio(2) |
Loan Fee | |||||||||||||||||||||
| Pennsylvania | 1 | 3 | $ | 6,586 | $ | 5,931 | (3) | $ | 4,082 | 62 | % | $ | 1,000 | |||||||||||||||
| Total | 1 | 3 | $ | 6,586 | $ | 5,931 | $ | 4,082 | 62 | % | $ | 1,000 | ||||||||||||||||
| 11 |
| (1) | The value is determined by the appraised value adjusted for remaining costs to be paid and third party mortgage balances. Part of this collateral is $1,150 of preferred equity in our Company. In the event of a foreclosure on the property securing certain of our loans, a portion of our collateral is preferred equity in our Company, which might be difficult to sell, which could impact our ability to eliminate the loan balance. | |
| (2) | The loan to value ratio is calculated by taking the outstanding amount and dividing by the appraised value. | |
| (3) | The commitment amount does not include letters of credit and cash bonds, as the sum of the total balance outstanding including the cash bonds plus the letters of credit and remaining to fund for construction is less than the $5,931 commitment amount. |
Commercial Loans – Construction Loan Portfolio Summary
The following is a summary of our loan portfolio to builders for home construction loans as of December 31, 2016.
(All dollar [$] amounts shown in table in thousands).
| State | Number
of Borrowers |
Number
of Loans |
Value
of Collateral (1) |
Commitment Amount |
Amount
Outstanding |
Loan
to Value Ratio(2) |
Loan Fee | |||||||||||||||
| Colorado | 1 | 3 | $ | 1,615 | $ | 1,131 | $ | 605 | 70 | % | 5 | % | ||||||||||
| Connecticut | 1 | 1 | 715 | 500 | 479 | 70 | % | 5 | % | |||||||||||||
| Delaware | 1 | 2 | 244 | 171 | 40 | 70 | % | 5 | % | |||||||||||||
| Florida | 7 | 15 | 14,014 | 8,548 | 4,672 | 61 | % | 5 | % | |||||||||||||
| Georgia | 4 | 9 | 6,864 | 4,249 | 2,749 | 62 | % | 5 | % | |||||||||||||
| Idaho | 1 | 1 | 319 | 215 | 205 | 67 | % | 5 | % | |||||||||||||
| Michigan | 1 | 1 | 210 | 126 | 118 | 60 | % | 5 | % | |||||||||||||
| New Jersey | 1 | 3 | 977 | 719 | 528 | 74 | % | 5 | % | |||||||||||||
| New York | 1 | 4 | 1,745 | 737 | 685 | 42 | % | 5 | % | |||||||||||||
| North Carolina | 2 | 2 | 1,015 | 633 | 216 | 62 | % | 5 | % | |||||||||||||
| Ohio | 1 | 1 | 1,405 | 843 | 444 | 60 | % | 5 | % | |||||||||||||
| Pennsylvania | 2 | 15 | 12,725 | 6,411 | 5,281 | 50 | % | 5 | % | |||||||||||||
| South Carolina | 5 | 7 | 2,544 | 1,591 | 783 | 63 | % | 5 | % | |||||||||||||
| Tennessee | 1 | 3 | 1,080 | 767 | 430 | 71 | % | 5 | % | |||||||||||||
| Utah | 1 | 2 | 715 | 500 | 252 | 70 | % | 5 | % | |||||||||||||
| Total | 30 | 69 | $ | 46,187 | $ | 27,141 | $ | 17,487 | 59 | %(3) | 5 | % | ||||||||||
| (1) | The value is determined by the appraised value. | |
| (2) | The loan to value ratio is calculated by taking the commitment amount and dividing by the appraised value. | |
| (3) | Represents the weighted average loan to value ratio of the loans. |
Credit Quality Information
The following table presents credit-related information at the “class” level in accordance with ASC 310-10-50, Disclosures about the Credit Quality of Finance Receivables and the Allowance for Credit Losses. A class is generally a disaggregation of a portfolio segment. In determining the classes, the Company considered the finance receivable characteristics and methods it applies in monitoring and assessing credit risk and performance.
The following table summarizes finance receivables by the risk ratings that regulatory agencies utilize to classify credit exposure and which are consistent with indicators the Company monitors. Risk ratings are reviewed on a regular basis and are adjusted as necessary for updated information affecting the borrowers’ ability to fulfill their obligations.
The definitions of these ratings are as follows:
| ● | Pass – finance receivables in this category do not meet the criteria for classification in one of the categories below. | |
| ● | Special mention – a special mention asset exhibits potential weaknesses that deserve management’s close attention. If left uncorrected, these potential weaknesses may, at some future date, result in the deterioration of the repayment prospects. | |
| ● | Classified – a classified asset ranges from: 1) assets that are inadequately protected by the current sound worth and paying capacity of the borrower, and are characterized by the distinct possibility that some loss will be sustained if the deficiencies are not corrected to 2) assets with weaknesses that make collection or liquidation in full unlikely on the basis of current facts, conditions, and values. Assets in this classification can be accruing or on non-accrual depending on the evaluation of these factors. |
| 12 |
Finance Receivables – By risk rating:
| December 31, 2016 | December 31, 2015 | |||||||
| Pass | $ | 18,275 | $ | 15,247 | ||||
| Special mention | 3,294 | – | ||||||
| Classified – accruing | – | – | ||||||
| Classified – nonaccrual | – | – | ||||||
| Total | $ | 21,569 | $ | 15,247 | ||||
Finance Receivables – Method of impairment calculation:
| December 31, 2016 | December 31, 2015 | |||||||
| Performing loans evaluated individually | $ | 12,424 | $ | 10,672 | ||||
| Performing loans evaluated collectively | 9,145 | 4,575 | ||||||
| Non-performing loans without a specific reserve | $ | – | $ | – | ||||
| Non-performing loans with a specific reserve | – | – | ||||||
| Total | $ | 21,569 | $ | 15,247 | ||||
2017 Outlook
In 2017, we anticipate using proceeds from the Notes, the purchase and sale agreements, and other sources to generate additional loans (mostly spec home construction loans), increase loan balances, and increase our customer and geographic diversity.
Competition
Historically, our industry has been highly competitive. We compete for opportunities with numerous public and private investment vehicles, including financial institutions, specialty finance companies, mortgage banks, pension funds, opportunity funds, hedge funds, REITs, and other institutional investors, as well as individuals. Many competitors are significantly larger than us, have well established operating histories and may have greater access to capital, resources and other advantages over us. These competitors may be willing to accept lower returns on their investments or to modify underwriting standards and, as a result, our origination volume and profit margins could be adversely affected.
We believe that this is a good time to extend commercial loans to builders in the residential real estate market because, currently, this market appears underserved, home values are average, and many of our competitors have sustained losses due to declines in home values in the second half of the previous decade and, therefore, are reluctant to lend in this space at this time. We expect our loans to be different than other lenders in the markets in which we are active. Typically the differences are:
| ● | our loans may have a higher fee; | |
| ● | our loans may include an interest free period (whereas other lenders typically charge interest); and | |
| ● | some of our loans may have lower costs as a result of not requiring title insurance. |
Regulatory Matters
Financial Regulation
Our operations are not subject to the stringent regulatory requirements imposed upon the operations of commercial banks, savings banks, and thrift institutions, and are not subject to periodic compliance examinations by federal or state banking regulators.
Further, our Notes are not certificates of deposit or similar obligations or guaranteed by any depository institution and are not insured by the FDIC or any governmental or private insurance fund, or any other entity.
| 13 |
The Investment Company Act of 1940
An investment company is defined under the Investment Company Act of 1940, as amended (the “Investment Company Act”), to include any issuer engaged primarily in the business of investing, reinvesting, or trading in securities. Absent an exemption, investment companies are required to register as such with the SEC and to comply with various governance and operational requirements. If we were considered an “investment company” within the meaning of the Investment Company Act, we would be subject to numerous requirements and restrictions relating to our structure and operation. If we were required to register as an investment company under the Investment Company Act and to comply with these requirements and restrictions, we may have to make significant changes in our proposed structure and operations to comply with exemption from registration, which could adversely affect our business. Such changes may include, for example, limiting the range of assets in which we may invest. We intend to conduct our operations so as to fit within an exemption from registration under the Investment Company Act for purchasing or otherwise acquiring mortgages and other liens on and interest in real estate. In order to satisfy the requirements of such exemption, we may need to restrict the scope of our operations.
Environmental Compliance
We do not believe that compliance with federal, state, or local laws relating to the protection of the environment will have a material effect on our business in the foreseeable future. However, loans we extend or purchase are secured by real property. In the course of our business, we may own or foreclose and take title to real estate that could be subject to environmental liabilities with respect to these properties. We (or our loan customers) may be held liable to a governmental entity or to third parties for property damage, personal injury, investigation, and clean-up costs incurred by these parties in connection with environmental contamination or may be required to investigate or clean up hazardous or toxic substances or chemical release at a property. The costs associated with the investigation or remediation activities could be substantial. In addition, if we become the owner of or discover that we were formerly the owner of a contaminated site, we may be subject to common law claims by third-parties based on damages and costs resulting from environmental contamination emanating from the property. To date, we have not incurred any significant costs related to environmental compliance and we do not anticipate incurring any significant costs for environmental compliance in the future. Generally, when we are lending on property which is being developed into single family building lots, an environmental assessment is done by the builder for the various governmental agencies. When we lend for new construction on newly developed lots, the lots have generally been reviewed while they were being developed. We also perform our own physical inspection of the lot, which includes assessing potential environmental issues. Before we take possession of a property through foreclosure, we again assess the property for possible environmental concerns, which, if deemed to be a significant risk compared to the value of the property, could cause us to forego foreclosure on the property and to seek other avenues for collection.
Below are risks and uncertainties that could adversely affect our operations that we believe are material to investors. Other risks and uncertainties may exist that we do not consider material based on the information currently available to us at this time.
Risks Related to Our Structure
Payment on the Notes is subordinate to the payment of our outstanding present and future senior debt, if any. Since there is no limit on the amount of senior debt we may incur, our present and future senior debt may make it difficult to repay the Notes.
As of December 31, 2016, we had $0 of senior debt outstanding on our senior debt lines of credit of $1,500,000, with availability of $1,500,000. Our purchase and sale agreements with third-parties also function as senior debt. The balance on those purchase and sale agreements was $7,322,000 on December 31, 2016, and is expected to grow in the future. We also have senior subordinated notes which are senior to the Notes of $279,000 as of December 31, 2016. We entered into a line of credit agreement which is senior unsecured in January of 2017 with a maximum outstanding balance of $500,000. The balance was $500,000 as of February 28, 2017. The Notes are subordinate and junior in priority to any and all of our senior debt and senior subordinated debt, and equal to any and all non-senior debt, including other Notes. The Notes are senior to junior subordinated notes. There are no restrictions in the indenture regarding the amount of senior debt or other indebtedness that we may incur. Upon the maturity of our senior debt, by lapse of time, acceleration or otherwise, the holders of our senior debt have first right to receive payment, in full, prior to any payments being made to a Note holder or to other non-senior debt. Therefore, upon such maturity of our senior debt Note holders would only be repaid in full if the senior debt is satisfied first and, following satisfaction of the senior debt, if there is an amount sufficient to fully satisfy all amounts owed under the Notes and any other non-senior debt.
The indenture and terms of our Notes do not restrict our use of leverage. A relatively small loss can cause over leveraged companies a material adverse change in their financial position. If this happened to us, it may make it difficult to repay the Notes.
Financial institutions which are federally insured typically have 8-12% of their total assets in equity. A reduction in their loan assets due to losses of 2% reduces their equity by roughly 20%. Our Company had 17% and 23% of our loan assets in equity as of December 31, 2016 and 2015, respectively. If we allow our assets to increase without increasing our equity, we could have a much lower equity as a percentage of assets than we have today, which would increase our risk of nonpayment on the Notes. Note holders have no structural mechanism to protect them from this action, and rely solely on us to keep equity at a satisfactory ratio.
| 14 |
If we are unable to raise substantial funds, we will be limited in our ability to diversify the loans we make, and our ability to repay the Notes that have been sold will be dependent on the performance of the specific loans we make.
We are conducting this offering of Notes ourselves without any underwriter or placement agent. We have limited experience in conducting a notes offering or any other securities offering. In our initial public offering of Notes, we sold approximately $7.7 million of the maximum offering amount of $700 million. We have a limited operating history and limited experience operating as a company, so we may not be able to successfully operate our business or generate sufficient revenue. There is no minimum amount of proceeds that must be received from the sale of the Notes in order to accept proceeds from Notes actually sold. As a result, the amount of proceeds we raise in this offering may be substantially less than the amount we would need to achieve a broadly diversified portfolio of loans. If we are unable to raise a substantial amount of funds, we will make fewer loans, resulting in less diversification in terms of the number of loans we make, the borrowers on such loans, and the geographic regions in which our collateral is located. In such event, the likelihood of our profitability being affected by the performance of any one of our loans will increase. Our ability to repay the Notes will be subject to greater risk to the extent that we lack a diversified portfolio of loans.
If we are unable to meet our Note maturity and redemption obligations, and we are unable to obtain additional financing or other sources of capital, we may be forced to sell off our operating assets or we might be forced to cease our operations, and Note holders could lose some or all of their investment.
Our Notes have maturities ranging from one year to four years. In addition, holders of our Notes may request redemption upon death. We intend to pay our Note maturity and redemption obligations using our normal cash sources, such as collections on our loans to customers, as well as proceeds from the sale of the Notes. We may experience periods in which our Note maturity and redemption obligations are high. Since our loans are generally repaid when our borrower sells a real estate asset, our operations and other sources of funds may not provide sufficient available cash flow to meet our continued Note maturity and redemption obligations. While we have secured lines of credit from affiliates of up to $1,500,000 with no borrowings as of December 31, 2016, our affiliates are not obligated to fund our borrowing requests. For all of these reasons we may be substantially reliant upon the net offering proceeds we receive from the sale of the Notes to pay these obligations. If we are unable to repay or redeem the principal amount of the Notes when due, and we are unable to obtain additional financing or other sources of capital, we may be forced to sell off our operating assets or we might be forced to cease our operations, and Note holders could lose some or all of their investment.
There is no “early warning” on the Notes if we perform poorly. Only interest and principal payment defaults on the Notes can trigger a default on the Notes prior to a bankruptcy.
There are a limited number of performance covenants to be maintained under the Notes and/or the indenture. Therefore, no “early warning” of a possible default by us exists. Under the indenture, only (i) the non-payment of interest and/or principal on the Notes by us when payments are due, (ii) our bankruptcy or insolvency, or (iii) a failure to comply with provisions of the Notes or the indenture (if such failure is not cured or waived within 60 days after receipt of a specific notice) could cause a default to occur.
Management has broad discretion over the use of proceeds from this offering, and it is possible that the funds will not be used effectively to generate enough cash for payment of principal and interest on the Notes.
We expect to use the proceeds from this offering for purposes detailed in our prospectus under the “Questions and Answers” and “Use of Proceeds” sections. Because no specific allocation of the proceeds is required in the indenture, our management will have broad discretion in determining how the proceeds of the offering will be used.
The indenture does not contain the type of covenants restricting our actions, such as restrictions on creating senior debt, paying distributions to our owners, merging, recapitalizing, and/or entering into highly leveraged transactions. The indenture does not contain provisions requiring early payment of Notes in the event we suffer a material adverse change in our business or fail to meet certain financial standards. Therefore, the indenture provides very little protection of Note holders’ investments.
The Notes do not have the benefit of extensive covenants. The covenants in the indenture are not designed to protect Note holders’ investments if there is a material adverse change in our consolidated financial condition, results of operations, or cash flows. For example, the indenture does not contain any restrictions on our ability to create or incur senior debt or other debt to pay distributions to our equity holders, including our Chief Executive Officer. It also does not contain any financial covenants (such as a fixed charge coverage or a minimum amount of equity) to help ensure our ability to pay interest and principal on the Notes. The indenture does not contain provisions that permit Note holders to require that we redeem the Notes if there is a takeover, recapitalization or similar restructuring. In addition, the indenture does not contain covenants specifically designed to protect Note holders if we engage in a highly leveraged transaction. Therefore, the indenture provides very little protection of Note holders’ investments.
| 15 |
We are controlled by Daniel M. Wallach, as he is our Chief Executive Officer and beneficially owns 96%of our outstanding common equity membership interests.
Daniel M. Wallach, our Chief Executive Officer (who is also on our Board of Managers), constructively or beneficially owns 96% of the common equity interests in our Company. As our Chief Executive Officer, Mr. Wallach is responsible for all aspects of our day-to-day operations. Though the approval of the independent managers is required for all affiliate transactions, Mr. Wallach will, nonetheless, be able to exercise significant control over our affairs as the independent managers may be removed by a vote of holders of 80% of our outstanding voting membership interests.
If we lose or are unable to hire or retain key personnel, we may be delayed or unable to implement our business plan, which would adversely affect our ability to repay the Notes.
Our success depends to a significant degree upon the contributions of Daniel M. Wallach, our Chief Executive Officer and a manager. We do not have an employment agreement with Mr. Wallach and cannot guarantee that he will remain affiliated with us. We do not have key man insurance on Mr. Wallach. If he were to cease his affiliation with us, our operating results would suffer. We believe that our future success depends, in part, upon our ability to hire and retain additional personnel. We cannot assure Note holders that we will be successful in attracting and retaining such personnel, which could hinder our ability to implement our business plan.
Note holders do not have the opportunity to evaluate our investments before they are made.
We intend to use the net offering proceeds in accordance with the “Use of Proceeds” section of our prospectus, including investment in secured real estate loans for the acquisition and development of parcels of real property as single-family residential lots and/or the construction of single-family homes. Since we have not identified any investments that we will make with the net proceeds of this offering, we are generally unable to provide Note holders with information to evaluate the potential investments we may make with the net offering proceeds before purchasing the Notes. Note holders must rely on our management to evaluate our investment opportunities, and we are subject to the risk that our management may not be able to achieve our objectives, may make unwise decisions or may make decisions that are not in our best interest.
There is no sinking fund to ensure repayment of the Notes at maturity, so Note holders are totally reliant upon our ability to generate adequate cash flows.
We do not contribute funds to a separate account, commonly known as a sinking fund, to repay the Notes upon maturity. Because funds are not set aside periodically for the repayment of the Notes over their respective terms, Note holders must rely on our consolidated cash flows from operations, investing and financing activities and other sources of financing for repayment, such as funds from the sale of the Notes, loan repayments, and other borrowings. To the extent cash flows from operations and other sources are not sufficient to repay the Notes, Note holders may lose all or part of their investment.
If we default in our Note payment obligations, the indenture agreement provides that the trustee could accelerate all payments due under the Notes, which would further negatively affect our financial position.
Our obligations with respect to the Notes are governed by the terms of indenture agreement with U.S. Bank as trustee. Under the indenture, in addition to other possible events of default, if we fail to make a payment of principal or interest under any Note and this failure is not cured within 30 days, we will be deemed in default. Upon such a default, the trustee or holders of 25% in principal of the outstanding Notes could declare all principal and accrued interest immediately due and payable. If our total assets do not cover these payment obligations, we would most likely be unable to make all payments under the Notes when due, and we might be forced to cease our operations.
The portion of our business plan utilizing a note offering for a source of funds for commercial lending purposes is relatively new to us. This may decrease the likelihood that we will be successful and able to pay principal and interest on the Notes.
Our initial offering commenced on October 4, 2012, and our experience in managing a notes offering as a source of funds for our business activities is limited to this offering and the initial offering. This decreases the likelihood that the results from our new business plan will be similar to or better than the results we obtained under our prior business plan. If we are not successful, our ability to pay principal and interest on the Notes may be adversely affected.
If a large number of our Note holders die, we may be unable to repay their investments.
Upon the death of an investor, if requested by the executor or administrator of the investor’s estate (or if the Note is held jointly, by the surviving joint investor), we are obligated to redeem his or her Notes without any interest penalty. Such redemption requests are not subject to our consent but may be subject to restrictions in the indenture. If a large number of our investors, or a single investor holding a significant portion of the Notes, die within a short period of time, we could be faced with a large number of redemption requests. If the amounts of those redemptions are too high, and we cannot offset them with loan repayments, secure new financing, or issue additional Notes, we may not have the liquidity to redeem the investments.
| 16 |
We are an “emerging growth company” under the federal securities laws and are subject to reduced public company reporting requirements.
In April 2012, President Obama signed into law the Jumpstart Our Business Startups Act, or the JOBS Act. We are an “emerging growth company,” as defined in the JOBS Act, and are eligible to take advantage of certain exemptions from, or reduced disclosure obligations relating to, various reporting requirements that are normally applicable to public companies.
We will remain an “emerging growth company” until the earliest of (1) the last day of the first fiscal year in which we have total annual gross revenues of $1 billion or more, (2) the last day of the fiscal year following the fifth anniversary of the date of the first sale of our common equity securities pursuant to an effective registration statement, (3) the date on which we become a “large accelerated filer” as defined in Rule 12b-2 under the Exchange Act (which would occur if the market value of our common equity held by non-affiliates exceeds $700 million, measured as of the last business day of our most recently completed second fiscal quarter, and we have been publicly reporting for at least 12 months) or (4) the date on which we have issued more than $1 billion in non-convertible debt during the preceding three-year period. Under the JOBS Act, emerging growth companies are not required to (1) provide an auditor’s attestation report on management’s assessment of the effectiveness of internal control over financial reporting, pursuant to Section 404 of the Sarbanes-Oxley Act, (2) comply with new requirements adopted by the Public Company Accounting Oversight Board, or the PCAOB, which require mandatory audit firm rotation or a supplement to the auditor’s report in which the auditor must provide additional information about the audit and the issuer’s financial statements, (3) comply with new audit rules adopted by the PCAOB after April 5, 2012 (unless the SEC determines otherwise), (4) provide certain disclosures relating to executive compensation generally required for larger public companies or (5) hold shareholder advisory votes on executive compensation.
Additionally, the JOBS Act provides that an “emerging growth company” may take advantage of an extended transition period for complying with new or revised accounting standards that have different effective dates for public and private companies. This means an “emerging growth company” can delay adopting certain accounting standards until such standards are otherwise applicable to private companies. We intend to take advantage of such extended transition period. Since we will not be required to comply with new or revised accounting standards on the relevant dates on which adoption of such standards is required for other public companies, our financial statements may not be comparable to the financial statements of companies that comply with public company effective dates. If we were to subsequently elect to instead comply with these public company effective dates, such election would be irrevocable pursuant to Section 107 of the JOBS Act.
Risks Related to Our Business
We have $11,503,000 of unfunded commitments to builders as of December 31, 2016. If every builder borrowed every amount allowed (which would mean all of their homes were complete) and no builders paid us back, we would need to fund that amount. While some of that amount would automatically come from our purchase and sale agreements, the rest would have to come from our Notes program and/or our lines of credit. Therefore, we may not have the ability to fund our commitments to builders.
As of December 31, 2016, we have $11,503,000 of unfunded commitments to builders. If every builder borrowed every amount allowed (which would mean all of their homes were complete) and no builders put us back, we would need to fund that amount. Lines of credit, payoffs from builders, and immediate investments in our Notes may not be enough to fund our commitments to builders as they become payable. If we default on these obligations, we may face any one or more of the following: A higher default rate, lawsuits brought by customers, an eventual lack of business from borrowers, missed principal and interest payments to Note holders and holders of other debt, and a lack of desire for investors to invest in our Notes offering. Therefore, we could default on our repayment obligations to our Note holders.
We have $2,798,000 of foreclosed assets as of December 31, 2016, which unlike our loans, are generally recorded on our balance sheet at the value of the collateral. A 30% reduction in total collateral value would reduce our earnings and net worth by $839,000. Larger reductions would result in lower earnings and lower net worth.
As of December 31, 2016, we had $2,798,000 of foreclosed assets on our books. These assets are recorded on our balance sheet at the value of the collateral after deduction for expected selling expenses. A reduction in the value of the underlying collateral could result in significant losses. A 30% reduction, for instance, would result in an $839,000 loss. This is a much a greater loss than what a 30% reduction in the collateral value of our $20,091,000 loan portfolio would cause. Accordingly, while we are carrying large balances of foreclosed assets, our business is subject to increased risk of a loss of a portion of our Note holders’ investments if such a reduction were to occur.
| 17 |
We have two lines of credit from affiliates which allow us to incur a significant amount of secured debt. These lines are collateralized by a lien against all of our assets. Our purchase and sale agreements function as secured debt as well. We expect to incur a significant amount of additional debt in the future, including issuance of the Notes, which will subject us to increased risk of loss.
As of December 31, 2016, we had $0 of secured debt outstanding on our senior debt lines of credit of $1,500,000, with availability of $1,500,000 and the capacity to sell portions of many loans under the terms of our purchase and sale agreements. The lines of credit are from affiliates. The affiliate loans are collateralized by a lien against all of our assets. The purchase and sale agreements are with third-parties and are collateralized by the loans we sell under the agreement. We have a senior subordinated note for $279,000 and a line of credit from a bank with a maximum outstanding balance of $500,000 which is senior unsecured. In addition, we expect to incur a significant amount of additional debt in the future, including issuance of the Notes, borrowing under credit facilities and other arrangements. The Notes will be subordinated in right of payment to all secured debt, including the affiliate loans. Therefore, in the event of a default on the secured debt, affiliates of our Company, including Mr. Wallach, have the right to receive payment ahead of Note holders, as do other secured debt holders, like the purchase and sale agreements loan purchasers. Accordingly, our business is subject to increased risk of a total loss of our Note holders’ investments if we are unable to repay all of our secured debt.
Currently, we are reliant on a single developer and homebuilder, the Hoskins Group, for a significant portion of our revenues and a portion of our capital.
As of both December 31, 2016 and 2015, 37% of our outstanding loan commitments consisted of loans made to Benjamin Marcus Homes, LLC and Investor’s Mark Acquisitions, LLC, both of which are owned by Mark Hoskins (collectively all three parties referred to herein as the “Hoskins Group”). That same company has a preferred equity interest in us. Therefore, currently, we are reliant upon a single developer and homebuilder for a significant portion of our revenues and a portion of our capital. Any event of bankruptcy, insolvency, or general downturn in the business of this developer and homebuilder will have a substantial adverse financial impact on our business and our ability to pay back Note holders’ investments in the Notes in the long term.
In December 2014 and in April 2015 we agreed to purchase and sale agreements with two third parties to sell them portions of some of our loans. This is a new activity for our Company, and will increase our leverage. While the agreement is intended to increase our profitability, large loan losses and/or idle cash, could actually reduce our profitability, which could impair our ability to pay principal and/or interest on the Notes.
The purchase and sale agreements we entered into in December of 2014 and April 2015 have allowed us to increase our loan assets and debt. If loans that we create have significant losses, the benefit of larger balances can be outweighed by the additional loan losses. Also, while this transaction is booked as a secured financing, it is not a line of credit. So we will have increased our loan balances without increasing our lines of credit, which can cause liquidity problems. One solution to this problem is having idle cash for liquidity, which then can reduce our profitability. If either of these problems is persistent and significant, our ability to pay interest and principal on our Notes may be impaired.
Our operations are not subject to the stringent banking regulatory requirements designed to protect investors, so repayment of Note holders’ investments is completely dependent upon our successful operation of our business.
Our operations are not subject to the stringent regulatory requirements imposed upon the operations of commercial banks, savings banks, and thrift institutions, and are not subject to periodic compliance examinations by federal or state banking regulators. For example, we will not be well diversified in our product risk, and we cannot benefit from government programs designed to protect regulated financial institutions. Therefore, an investment in our Notes does not have the regulatory protections that the holder of a demand account or a certificate of deposit at a bank does. The return on any Notes purchased by a Note holder is completely dependent upon our successful operations of our business. To the extent that we do not successfully operate our business, our ability to pay interest and principal on the Notes will be impaired.
Most of our assets are commercial construction loans to homebuilders and/or developers which are a higher than average credit risk, and therefore could expose us to higher rates of loan defaults, which could impact our ability to repay amounts owed to Note holders.
Our primary business is extending commercial construction loans to homebuilders, along with some loans for land development. These loans are considered higher risk because the ability to repay depends on the homebuilder’s ability to sell a newly built home. These homes typically are not sold by the homebuilder prior to commencement of construction. Therefore, we may have a higher risk of loan default among our customers than other commercial lending companies. If we suffer increased loan defaults, in any given period, our operations could be materially adversely affected and we may have difficulty making our principal and interest payments on the Notes.
| 18 |
We depend on the availability of significant sources of credit to meet our liquidity needs and our failure to maintain these sources of credit could materially and adversely affect our liquidity in the future.
We plan to maintain our purchase and sale agreements and our line of credit from affiliates, so that we may draw funds when necessary to meet our obligation to redeem maturing Notes, pay interest on the Notes, meet our commitments to lend money to our customers, and for other general corporate purposes. Certain features of the purchase and sale agreements with third parties have added liquidity and flexibility, which have lessened the need for the lines of credit from affiliates, however we do plan to replace our line of credit from affiliates with a line of credit from a financial institution. If we fail to maintain liquidity through our purchase and sale agreements and lines of credit, we will be more dependent on the proceeds from the Notes for our continued liquidity. If the sale of the Notes is significantly reduced or delayed for any reason and we fail to obtain or renew a line of credit, or we default on our line of credit, our ability to meet our obligations, including our Note obligations, could be materially adversely affected, and we may not have enough cash to pay back Note holders’ investments. Also, the failure to maintain an active line of credit (and therefore using cash for liquidity instead of a borrowing line), even though we have liquidity from the Notes, will reduce our earnings, because we will be paying interest on the Notes, while we are holding cash instead of reducing our borrowings.
If the proceeds from the issuance of the Notes exceed the cash flow needed to fund the desirable business opportunities that are identified, we may not be able to invest all of the funds in a manner that generates sufficient income to pay the interest and principal on the Notes.
Our ability to pay interest on our debt, including the Notes, pay our expenses, and cover loan losses is dependent upon interest and fee income we receive from loans extended to our customers. If we are not able to lend to a sufficient number of customers at high enough interest rates, we may not have enough interest and fee income to meet our obligations, which could impair our ability to pay interest and principal to Note holders. If money brought in from new Notes and from repayments of loans from our customers exceeds our short term obligations such as expenses, Note interest and redemptions, and line of credit principal and interest, then it is likely to be held as cash, which will have a lower return than the interest rate we are paying on the Notes. This will lower earnings and may cause losses which could impair our ability to repay the principal and interest on the Notes.
The collateral securing our real estate loans may not be sufficient to pay back the principal amount in the event of a default by the borrowers.
In the event of default, our real estate loan investments are generally dependent entirely on the loan collateral to recover our investment. Our loan collateral consists primarily of a mortgage on the underlying property. In the event of a default, we may not be able to recover the premises promptly and the proceeds we receive upon sale of the property may be adversely affected by risks generally related to interests in real property, including changes in general or local economic conditions and/or specific industry segments, declines in real estate values, increases in interest rates, real estate tax rates and other operating expenses including energy costs, changes in governmental rules, regulations and fiscal policies, including environmental legislation, acts of God, and other factors which are beyond our or our borrowers’ control. Current market conditions may reduce the proceeds we are able to receive in the event of a foreclosure on our collateral. Our remedies with respect to the loan collateral may not provide us with a recovery adequate to recover our investment.
Currently, we are somewhat reliant on the local homebuilding industry in the Pittsburgh, Pennsylvania market.
Our loan investments are currently not well diversified geographically. As of both December 31, 2016 and 2015, 37% of our outstanding loan commitments are concentrated in the Pittsburgh, Pennsylvania market. We believe that home values are the predominant factor impacting the amount of money we may lose on defaulted loans. Housing in this market has been muted in the last two years. Because of our reliance on the Pittsburgh housing market, any adverse conditions affecting the local housing market in this area will have a magnified adverse effect on our loan portfolio and adversely affect our ability to pay back Note holders’ investments in the Notes. Adverse conditions affecting the local housing market could include, but are not limited to, declines in new housing starts, declines in new home prices, declines in new home sales, increases in the supply of available building lots or built homes available for sale, increases in unemployment, and unfavorable demographic changes.
Our business is not industry-diversified and the homebuilding industry has undergone a significant downturn. Further deterioration in industry or economic conditions could further decrease demand and pricing for new homes and residential home lots. A decline in housing values similar to the recent national downturn in the real estate market would have a negative impact on our business. Smaller value declines will also have a negative impact on our business. These factors may decrease the likelihood we will be able to generate enough cash to repay the Notes.
Developers and homebuilders to whom we may make loans use the proceeds of our loans to develop raw land into residential home lots and construct homes. The developers obtain the money to repay our development loans by selling the residential home lots to homebuilders or individuals who will build single-family residences on the lots, or by obtaining replacement financing from other lenders. A developer’s ability to repay our loans is based primarily on the amount of money generated by the developer’s sale of its inventory of single-family residential lots. Homebuilders obtain the money to repay our loans by selling the homes they construct or by obtaining replacement financing from other lenders, and thus, the homebuilders’ ability to repay our loans is based primarily on the amount of money generated by the sale of such homes.
| 19 |
The homebuilding industry is cyclical and is significantly affected by changes in industry conditions, as well as in general and local economic conditions, such as:
| ● | employment level and job growth; |
| ● | demographic trends, including population increases and decreases and household formation; |
| ● | availability of financing for homebuyers; |
| ● | interest rates; |
| ● | affordability of homes; |
| ● | consumer confidence; |
| ● | levels of new and existing homes for sale, including foreclosed homes and homes held by investors and speculators; and |
| ● | housing demand generally. |
These conditions may occur on a national scale or may affect some of the regions or markets in which we operate more than others.
We generally lend a percentage of the values of the homes and lots. These values are determined shortly prior to the lending. If the values of homes and lots in markets in which we lend drop fast enough to cause the builders losses that are greater than their equity in the property, we will be forced to liquidate the loan in a fashion which will cause us to lose money. If these losses when combined and added to our other expenses are greater than our revenue from interest charged to our customers, we will lose money overall, which will hurt our ability to pay interest on the Notes and repay the principal on the Notes. Values are typically affected by demand for homes, which can change due to many factors, including but not limited to, demographics, interest rates, overall economy, cost of building materials and labor, availability of financing for end-users, inventory of homes available and governmental action or inaction. The tightening credit markets have made it more difficult for potential homeowners to obtain financing to purchase homes. If housing prices decline or sales in the housing market decline, our customers may have a hard time selling their homes at a profit. This could cause the amount of defaulted loans that we will own to increase. An increase in defaulted loans would reduce our revenue and could lead to losses on our loans. A decline in housing prices will further increase our losses on defaulted loans. If the amount of defaulted loans or the loss per defaulted loan is large enough, we will operate at a loss, which will decrease our equity. This could cause us to become insolvent, and we will not be able to pay back Note holders’ principal and interest on the Notes.
Additional competition may decrease our profitability, which would adversely affect our ability to repay the Notes.
We may experience increased competition for business from other companies and financial institutions that are willing to extend the same types of loans that we extend at lower interest rates and/or fees. These competitors also may have substantially greater resources, lower cost of funds, and a better established market presence. If these companies increase their marketing efforts to our market niche of borrowers, or if additional competitors enter our markets, we may be forced to reduce our interest rates and fees in order to maintain or expand our market share. Any reduction in our interest rates, interest income, or fees could have an adverse impact on our profitability and our ability to repay the Notes.
We expect to be substantially reliant upon the net offering proceeds we receive from the sale of our Notes to meet principal and interest obligations on previously issued Notes.
We intend to use the net offering proceeds from the sale of Notes to, among other things, make payments on other borrowings, fund redemption obligations, make interest payments on the Notes, and to run our business to the extent that other sources of liquidity from our operations (e.g., repayment of loans we have previously extended to our customers) and our credit line are inadequate. However, these other sources of liquidity are subject to risks. Our operations alone may not produce a sufficient return on investment to repay interest and principal on our outstanding Notes. We may not be able to obtain or retain a line of credit. We may not be able to attract new investors, have sufficient loan repayments, or have sufficient borrowing capacity when we need additional funds to repay principal and interest on our outstanding Notes or redeem our outstanding Notes. If any of these things occur, our liquidity and capital needs may be severely affected, and we may be forced to sell off our loan receivables and other operating assets, or we might be forced to cease our operations.
| 20 |
Because we require a substantial amount of cash to service our debt, we may not be able to pay our obligations under the Notes.
To service our total indebtedness, we require a significant amount of cash. Our ability to generate cash depends on many factors, including our successful financial and operating performance. We cannot assure Note holders that our business plans will succeed or that we will achieve our anticipated financial results, which may prevent us from being able to pay our obligations under the Notes.
Additional competition for investment dollars may decrease our liquidity, which would adversely affect our ability to repay the Notes.
We could experience increased competition for investment dollars from other companies and financial institutions that are willing to offer higher interest rates. We may be forced to increase our interest rates in order to maintain or increase the issuance of Notes. Any increase in our interest rates could have an adverse impact on our liquidity and our ability to meet a debt covenant under any future lines of credit obtained and/or to repay the Notes.
Our real estate loans are illiquid, which could restrict our ability to respond rapidly to changes in economic conditions.
The real estate loans we currently hold and intend to extend are illiquid. As a result, our ability to sell under-performing assets in our portfolio or respond to changes in economic or other conditions may be very limited.
If we, our ownership, or any of our future employees suffer from severe negative publicity, we could be faced with significantly greater payments on Note redemption obligations than we have cash available for such payments or redemptions.
If we, our ownership, or any of our future employees suffer from severe negative publicity, our rate of new Note issuances could be negatively impacted, which would reduce the amount of cash available to make interest and principal payments on our debt including the Notes. In such event, we could be declared in default on the Notes and other debt instruments, and Note holders could lose their entire investment.
If we do not achieve our anticipated financial results, we may not be able to generate sufficient cash flows from operating, investing and financing activities or to obtain sufficient funding to satisfy all of our obligations, including our obligations under the Notes.
We are subject to risk of significant losses on our loans because we do not require our borrowers to insure the title of their collateral for our loans.
It is customary for lenders extending loans secured by real estate to require the borrower to provide title insurance with minimum coverage amounts set by the lender. We do not require most of our homebuilders to provide title insurance on their collateral for our loans to them. This represents an additional risk to us as the lender. The homebuilder may have a title problem which normally would be covered by insurance, but may result in a loss on the loan because insurance proceeds are not available.
Increases in interest rates, reductions in mortgage availability, or increases in other costs of home ownership could prevent potential customers from buying new homes and adversely affect our business and financial results.
Most new home purchasers finance their home purchases through lenders providing mortgage financing. Prior to the recent volatility in the financial markets, interest rates were at historically low levels and a variety of mortgage products were available. As a result, home ownership became more accessible. The mortgage products available included features that allowed buyers to obtain financing for a significant portion or all of the purchase price of the home, had very limited underwriting requirements or provided for lower initial monthly payments. Accordingly, more people were qualified for mortgage financing.
Since 2007, the mortgage lending industry has experienced significant instability, beginning with increased defaults on subprime loans and other nonconforming loans and compounded by expectations of increasing interest payment requirements and further defaults. This, in turn, resulted in a decline in the market value of many mortgage loans and related securities. Lenders, regulators and others questioned the adequacy of lending standards and other credit requirements for several loan products and programs offered in recent years. Credit requirements tightened, and investor demand for mortgage loans and mortgage-backed securities declined. In general, fewer loan products, tighter loan qualifications, and a reduced willingness of lenders to make loans make it more difficult for many buyers to finance the purchase of homes. These factors serve to reduce the pool of qualified homebuyers and made it more difficult to sell to first time and move-up buyers.
Mortgage rates may rise significantly in over the next several years. The benefit of recent trends loosening credit to potential end users of homes may be outweighed by the rise of interest rates for those borrowers, which might lower demand for new homes.
A reduction in the demand for new homes may reduce the amount and price of the residential home lots sold by the developers and homebuilders to which we loan money and/or increase the amount of time such developers and homebuilders must hold the home lots in inventory. These factors increase the likelihood of defaults on our loans, which would adversely affect our business and financial results.
| 21 |
In the event of a foreclosure on the property securing certain of our loans, a portion of our collateral is preferred equity in our Company, which might be difficult to sell in order to reduce the loan balance.
Some of the collateral securing the IMA Existing Loan (as such term is defined under “Business — Commercial Construction and Development Loans”) is preferred equity in our Company which has a book value of $1,150,000 as of December 31, 2016. If the borrower defaults on the loan and we are forced to use collateral to repay the loan, we will need to sell this preferred interest in us to a third-party. There is no liquid market for this instrument, so we can give no assurance as to our ability to generate any amount of proceeds from that collateral.
If a large number of our current and prospective borrowers are unable to repay their loans within a normal average number of months, we will experience a significant reduction in our income and/or liquidity, and may not be able to repay the Notes as they become due.
Construction loans that we extend are expected to be repaid in a normal average number of months, typically eight months, depending on the size of the loan. Development loans are expected to last for many years. We have interest paid on a monthly basis, but also charge a fee which will be earned over the life of the loan. If these loans are repaid over a longer period of time, the amount of income that we receive on these loans expressed as a percentage of the outstanding loan amount will be reduced, and fewer loans with new fees will be able to be made, since the cash will not be available. This will reduce our income as a percentage of the Notes, and if this percentage is significantly reduced it could impair our ability to pay principal and interest on the Notes.
The homebuilding industry could experience adverse conditions, and the industry’s implementation of strategies in response to such conditions may not be successful.
The United States homebuilding industry experienced a significant downturn beginning in 2007. During the course of the downturn, many homebuilders focused on generating positive operating cash flow, resizing and reshaping their product for a more price-conscious consumer and adjusting finished new home inventories to meet demand, and did so in many cases by significantly reducing the new home prices and increasing the level of sales incentives. Notwithstanding these strategies, homebuilders continued to experience an elevated rate of sales contract cancelations, as many of the factors that affect new sales and cancelation rates are beyond the control of the homebuilding industry. Although the homebuilding industry recently experienced positive gains, there can be no assurance that these gains will continue. The homebuilding industry could suffer similar, or worse, adverse conditions in the future. Continued decreases in new home sales would increase the likelihood of defaults on our loans and, consequently, reduce our ability to repay Note holders’ principal and interest on the Notes.
Our cost of funds is substantially higher than that of banks.
Because we do not offer FDIC insurance, and because we want to grow our Note program faster than most banks want to grow their CD base, our Notes offer significantly higher rates than bank CDs. This may make it more difficult for us to compete against banks when they rejoin our niche lending market in large numbers. This could result in losses which could impair or eliminate our ability to pay interest and principal on our outstanding Notes.
We are exposed to risk of environmental liabilities with respect to properties of which we take title. Any resulting environmental remediation expense may reduce our ability to repay the Notes.
In the course of our business, we may foreclose and take title to real estate that could be subject to environmental liabilities. We may be held liable to a governmental entity or to third-parties for property damage, personal injury, investigation and clean-up costs incurred by these parties in connection with environmental contamination, or may be required to investigate or clean up hazardous or toxic substances or chemical release at any property. The costs associated with investigation or remediation activities could be substantial. In addition, as the owner or former owner of a contaminated site, we may be subject to common law claims by third-parties based on damages and costs resulting from environmental contamination emanating from the property. If we ever become subject to significant environmental liabilities, our business, financial condition, liquidity, and results of operations could be materially and adversely affected.
We are subject to the general market risks associated with real estate construction and development.
Our financial performance depends on the successful construction and/or development and sale of the homes and real estate parcels that serve as security for the loans we make to homebuilders and developers. As a result, we are subject to the general market risks of real estate construction and development, including weather conditions, the price and availability of materials used in construction of homes and development of lots, environmental liabilities and zoning laws, and numerous other factors that may materially and adversely affect the success of the projects.
| 22 |
We may be subject to changes in our business as a result of the Dodd-Frank Wall Street Reform and Consumer Protection Act of 2010. These changes may restrict our ability to pursue or limit the feasibility of pursuing our business plan.
The Dodd-Frank Wall Street Reform and Consumer Protection Act of 2010 represents a comprehensive overhaul of the financial services industry within the United Sates and will require a number of federal agencies to implement numerous new rules, many of which may not be implemented for several months or years. At this time, it is difficult to predict the extent to which the Dodd-Frank Act or the resulting regulations will impact our business. However, compliance with these laws and regulations may impact our lending operations and/or result in additional costs and expenses, which may impact our consolidated results of operations, financial condition or liquidity.
We are required to devote resources to comply with various provisions of the Sarbanes-Oxley Act, including Section 404 relating to internal controls testing, and this may reduce the resources we have available to focus on our core business.
Pursuant to Section 404 (“Section 404”) of the Sarbanes-Oxley Act of 2002 (the “Sarbanes-Oxley Act”) and the related rules adopted by the SEC and the Public Company Accounting Oversight Board, our management is required to report on the effectiveness of our internal controls over financial reporting. We may encounter problems or delays in completing any changes necessary to our internal controls over financial reporting. Among other things, we may not be able to conclude on an ongoing basis that we have effective internal controls over financial reporting in accordance with Section 404. Any failure to comply with the various requirements of the Sarbanes-Oxley Act may require significant management time and expenses and divert attention or resources away from our core business. In addition, we may encounter problems or delays in completing the implementation of any requested improvements provided by our independent registered public accounting firm.
If we do not meet the requirements to maintain effective internal controls over financial reporting, our ability to raise new capital will be harmed.
If we do not maintain effective internal controls over our financial reporting in accordance with Section 404, it could result in delaying future SEC filings or future offerings. If future SEC filings or future offerings are delayed, it could have an extreme negative impact on our cash flow causing us to default on our obligations.
Our business plan may result in us rapidly growing our commercial lending business, and a team of employees will need to be hired and perform at a high level for us to be successful. We do not have a great deal of experience in this type of capital structure (using Notes).
There are many risks in running this business plan, including but not limited to rapid growth, liquidity and capital structure issues, and changing markets. We believe that we have effectively created a start-up financial institution. We cannot be sure that we will be successful in managing our growth. In order to successfully manage our growth, we must:
| ● | hire, train, manage and retain employees; | |
| ● | create loan products that are attractive to customers, protect us, and are profitable; | |
| ● | manage the duration and amounts of both our assets (loans to customers) and liabilities (our line of credit, Notes, and other debt); | |
| ● | create systems to track both our investors’ and our customers’ accounts; and | |
| ● | control our expenses. |
The strains posed by these demands are magnified by the start-up nature of our operations. Our failure to operate profitably or with enough liquidity could prevent us from being able to pay interest or principal on the Notes.
| 23 |
Risks Related to Conflicts of Interest
Our Chief Executive Officer (who is also on our Board of Managers) will face conflicts of interest as a result of the secured affiliated loans made to us, which could result in actions that are not in the best interests of our Note holders.
As of December 31, 2016, we had borrowed $0 from The 2007 Daniel M. Wallach Legacy Trust, with availability on that line of credit of $250,000, and $0 from Daniel M. Wallach, our Chief Executive Officer (who is also on our Board of Managers), and his wife, Joyce Wallach, with availability on that line of credit of $1,250,000. These affiliate loans are collateralized by a lien against all of our assets. The Notes are subordinated in right of payment to all secured debt, including these affiliate loans. Pursuant to each promissory note, the affiliates have the option of funding any amount up to the face amount of the note, in the lender’s sole and absolute discretion. Therefore, Mr. Wallach will face conflicts of interest in deciding whether and when to exercise any rights pursuant to the promissory notes and pledge agreement. If these Wallach affiliates exercise their rights to collect on their collateral upon a default by us, we could lose some or all of our assets, which could have a negative effect on our ability to repay the Notes.
Our Chief Executive Officer will face conflicts of interest as a result of his equity ownership in the Company, which could result in actions that are not in Note holders’ best interests.
Our Chief Executive Officer beneficially owns 96% of the common equity of the Company. Since the Company is taxed as a partnership for federal income tax purposes, all profits and losses flow through to the equity owners. Therefore, Mr. Wallach and his affiliated equity owners of the Company will be motivated to distribute profits to the equity owners on an annual basis, rather than retain earnings in the Company for Company purposes. There is currently no limit in the indenture or otherwise on the amount of funds that may be distributed by the Company to its equity owners. If substantial funds are distributed to the equity owners, the liquidity and capital resources of the Company will be reduced and our ability to repay the Notes may be negatively impacted.
ITEM 1B. UNRESOLVED STAFF COMMENTS
Not applicable.
As of December 31, 2016, we operate an office in Jacksonville, Florida pursuant to a lease, which has been prepaid through its expiration date of June 2017. In February of 2017 we purchased a building in which to operate, which we anticipate occupying in the summer after we finish the inside construction.
| (a) | As of the date of this filing, we are not aware that we or our members are a party to any pending or threatened legal proceeding or proceeding by a governmental authority that would have a material adverse effect on our business. | |
| (b) | None. |
ITEM 4. MINE SAFETY DISCLOSURES
Not applicable.
ITEM 5. MARKET FOR REGISTRANT’S COMMON EQUITY, RELATED STOCK HOLDER MATTERS, AND ISSUER PURCHASES OF EQUITY SECURITIES
(All dollar [$] amounts shown in thousands.)
Common Equity
As of December 31, 2016, we had 2,629 Class A common membership units outstanding, held by our three members. There is no established trading market for our membership units. As of December 31, 2016, 96% of our outstanding Class A common membership units are beneficially owned by our Chief Executive Officer (who is also on our Board of Managers), Daniel M. Wallach, and his wife, Joyce S. Wallach. Effective December 31, 2015, S.K. Funding, LLC acquired the remaining 4% Class A common membership units outstanding. For the fiscal years ended December 31, 2016 and 2015, we declared and paid total distributions to our owners of $436 and $181, respectively, which distributions were declared and paid on a quarterly basis.
Preferred Equity
As of December 31, 2016, the Hoskins Group owns a total of 11.5 Series B cumulative preferred units, which were issued for a total of $1,150. Of that total, 1.4and 0.1 Series B preferred units were issued to the Hoskins Group during 2016 and 2015, respectively, pursuant to an agreement whereby the Hoskins Group agreed to purchase 0.1 Series B preferred units upon each closing of a lot sale in the subdivisions in which we lend the Hoskins Group development funds. The Series B preferred units have a fixed value which is their purchase price, and preferred liquidation and distribution rights. Yearly distributions of 10% of the Series B preferred units’ value (providing profits are available) will be made quarterly. The Hoskins Group Series B cumulative preferred units are also used as collateral for that group’s loans to the Company.
Public Notes Offering
We registered up to $70,000 in Fixed Rate Subordinated Notes in our public offering (SEC File No. 333-203707, effective September 29, 2015). As of December 31, 2016, we had issued a gross amount of $6,239 in Notes pursuant to our public offering. From September 29, 2015 through December 31, 2016, we incurred expenses of $114 in connection with the issuance and distribution of the Notes, which were paid to third parties. These expenses were not for underwriters or discounts, but were for advertising, printing, and professional services. Net offering proceeds as of December 31, 2016 were $6,125, 87% of which was used to increase loan balances.
| 24 |
ITEM 6. SELECTED FINANCIAL DATA
(All dollar [$] amounts shown in thousands.)
The following selected consolidated financial data should be read together with our consolidated financial statements and accompanying notes and “Management Discussion and Analysis of Financial Condition and Results of Operations” appearing elsewhere in this document. The selected consolidated financial data in this section is not intended to replace our consolidated financial statements and the accompanying notes. Our historical results and information are not necessarily indicative of our future results.
The summary consolidated financial data as of and for the fiscal years ended December 31, 2016, and 2015 is derived from our audited consolidated financial statements included elsewhere in this document. The summary consolidated financial data as of and for the fiscal years ended December 31, 2014, 2013 and 2012 is derived from our audited consolidated financial statements not included in this document.
As of, and for, the years ended December 31,
| 2016 | 2015 | 2014 | 2013 | 2012 | ||||||||||||||||
| (Audited) | (Audited) | (Audited) | (Audited) | (Audited) | ||||||||||||||||
| Operations Data | ||||||||||||||||||||
| Net interest income | ||||||||||||||||||||
| Interest income | $ | 3,640 | $ | 1,863 | $ | 1,138 | $ | 596 | $ | 581 | ||||||||||
| Interest expense | 1,748 | 864 | 433 | 157 | 115 | |||||||||||||||
| Provision for Loan losses | 16 | 59 | 22 | – | – | |||||||||||||||
| Net interest income after Loan loss provision | 1,876 | 940 | 683 | 439 | 466 | |||||||||||||||
| Non-Interest Income | ||||||||||||||||||||
| Gain from foreclosure of assets | 72 | 105 | – | – | – | |||||||||||||||
| Non-Interest Expense | ||||||||||||||||||||
| Selling, general and administrative expenses | 1,319 | (1) | 547 | 390 | 415 | 344 | ||||||||||||||
| Impairment loss on foreclosed assets | 111 | – | – | – | – | |||||||||||||||
| Net income | $ | 518 | (1) | $ | 498 | $ | 293 | $ | 24 | $ | 122 | |||||||||
| Balance Sheet Data | ||||||||||||||||||||
| Cash and cash equivalents | $ | 1,566 | $ | 1,341 | $ | 558 | $ | 722 | $ | 646 | ||||||||||
| Accrued interest on loans | 280 | 146 | 78 | 27 | 26 | |||||||||||||||
| Other assets | 151 | 14 | 13 | 14 | 10 | |||||||||||||||
| Loans receivable, net | 20,091 | 14,060 | 8,097 | 4,045 | 3,604 | |||||||||||||||
| Foreclosed assets | 2,798 | 965 | – | – | – | |||||||||||||||
| Total assets | 24,886 | 16,526 | 8,746 | 4,808 | 4,286 | |||||||||||||||
| Customer interest escrow | 812 | 498 | 318 | 255 | 329 | |||||||||||||||
| Accounts payable and accrued expenses | 1,363 | 539 | 199 | 59 | 41 | |||||||||||||||
| Notes payable unsecured, net of deferred financing costs | 11,962 | 8,497 | 5,172 | 2,590 | 906 | |||||||||||||||
| Notes payable secured | 7,322 | 3,683 | – | – | – | |||||||||||||||
| Notes payable related parties | – | – | – | – | 1,108 | |||||||||||||||
| Due to preferred equity member | 28 | 25 | – | – | – | |||||||||||||||
| Total liabilities | 21,487 | 13,242 | 5,689 | 2,904 | 2,384 | |||||||||||||||
| Members’ capital | 3,399 | 3,284 | 3,057 | 1,904 | 1,902 | |||||||||||||||
| Members’ contributions | 140 | 10 | 1,000 | – | – | |||||||||||||||
| Members’ distributions | $ | (543 | ) | $ | (281 | ) | $ | (140 | ) | $ | (22 | ) | $ | (50 | ) | |||||
(1) We began paying our CEO effective January 1, 2016. Selling, general and administrative expenses were $403 higher due to those costs in 2016. Net income would have been $403 higher in 2016 without those costs.
| 25 |
ITEM 7. MANAGEMENT’S DISCUSSION AND ANALYSIS OF FINANCIAL CONDITION AND RESULTS OF OPERATIONS
(All dollar [$] amounts shown in thousands.)
The following Management’s Discussion and Analysis of Financial Condition and Results of Operations should be read in conjunction with our consolidated financial statements and the notes thereto contained elsewhere in this report. See also “Cautionary Note Regarding Forward-Looking Statements” preceding Part I.
Overview
We were organized in the Commonwealth of Pennsylvania in 2007 under the name 84 RE Partners, LLC and changed our name to Shepherd’s Finance, LLC on December 2, 2011. We converted to a Delaware limited liability company on March 29, 2012. Our business is focused on commercial lending to participants in the residential construction and development industry. We believe this market is underserved because of the lack of traditional lenders currently participating in the market. We are located in Jacksonville, Florida. Our operations are governed pursuant to our operating agreement.
From 2007 through the majority of 2011, we were the lessor in three commercial real estate leases with a then affiliate, 84 Lumber Company. Beginning in late 2011, we began commercial lending to residential homebuilders. Our current loan portfolio is described more fully in this section under the sub heading “Commercial Construction and Development Loans.” We have a limited operating history as a finance company. We currently have nine paid employees, including our Executive Vice President of Operations. We currently use three employees to originate most of our new loans. Our office staff processes, underwrites, documents, and funds our loans. Our office staff also manages our investor relations and relationships with other debt holders. Our Board of Managers is comprised of Mr. Daniel M. Wallach and three independent managers – Bill Myrick, Eric Rauscher, and Kenneth R. Summers. Our officers are responsible for our day-to-day operations, while the Board of Managers is responsible for overseeing our business.
The commercial loans we extend are secured by mortgages on the underlying real estate. We extend and service commercial loans to small-to-medium sized homebuilders for the purchase of lots and/or the construction of homes thereon. In some circumstances, the lot is purchased with an older home on the lot which is then either removed or rehabilitated. If the home is rehabilitated, the loan is referred to as a “rehab” loan. We also extend and service loans for the purchase of undeveloped land and the development of that land into residential building lots. In addition, we may, depending on our cash position and the opportunities available to us, do none, any or all of the following: purchase defaulted unsecured debt from suppliers to homebuilders at a discount (and then secure that debt with real estate or other collateral), purchase defaulted secured debt from financial institutions at a discount, and purchase real estate in which we will operate our business. In February of 2017, we purchased a building in which we intend to operate once construction has been completed. We anticipate that construction will be completed in the summer of 2017.
Our Chief Executive Officer, Mr. Wallach, has been in the housing industry since 1985. He was the CFO of a multi-billion dollar supplier of building materials to home builders for 11 years. He also was responsible for that company’s lending business for 20 years. During those years, he was responsible for the creation and implementation of many secured lending programs to builders. Some of these were performed fully by that company, and some were performed in partnership with banks. In general, the creation of all loans, and the resolution of defaulted loans, was his responsibility, whether the loans were company loans or loans in partnership with banks. Through these programs, he was responsible for the creation of approximately $2,000,000 in loans which generated interest spread of $50,000, after deducting for loan losses. Through the years, he managed the development of systems for reducing and managing the risks and losses on defaulted loans. Mr. Wallach also was responsible for that company’s unsecured debt to builders, which reached over $300,000 at its peak. He also gained experience in securing defaulted unsecured debt.
We had $20,091 and $14,060 in loan assets as of December 31, 2016 and 2015, respectively. As of December 31, 2016, we have 69 construction loans in 15 states with 30 borrowers, and have three development loans in Pittsburgh, Pennsylvania. At the end of 2014 and again in April 2015, we entered into purchase and sale agreements for portions of our loans. The first loan portions sold under the program took place during the first quarter of 2015. These agreements have allowed us to increase our loan balances and commitments significantly in 2015 and 2016. In January of 2017, we entered into a line of credit agreement with a bank for $500. As of January 31, 2017 we had $3,417 in equity and $21,238 in loan assets.
We currently have eight sources of capital:
| December 31, 2016 | December 31, 2015 | |||||||
| Capital Source | ||||||||
| Purchase and sale agreements | $ | 7,322 | $ | 3,683 | ||||
| Secured line of credit from affiliates | – | – | ||||||
| Unsecured senior line of credit from a bank | – | – | ||||||
| Unsecured Notes through our public offering | 11,221 | 8,496 | ||||||
| Other unsecured debt | 1,152 | 600 | ||||||
| Preferred equity Series B units | 1,150 | 1,010 | ||||||
| Common equity | 2,249 | 2,274 | ||||||
| Total | $ | 23,094 | $ | 16,063 | ||||
Certain features of the purchase and sale agreement have added liquidity and flexibility, which have lessened the need for the lines of credit from affiliates. A new line of credit that we obtained from a bank also lessens the need for lines of credit from affiliates.
| 26 |
Economic and Industry Dynamics
During the second half of the previous decade, the housing market was plagued by declining values and a lack of housing starts. Demand for residential construction loans was negatively impacted by the net decrease in housing starts (a key driver relative to commercial lending to residential homebuilders). The housing market started to decline in 2006, reached its bottom in 2008. More recently, values and starts have been rising, but are not back to historical norms as of December 31, 2016. See “Inflation, Interest Rates, and Housing Starts” later in this section. The decrease which started in 2006 followed 15 years of increases in housing starts. Home values also decreased during the housing start decline, but have returned to average numbers. The combination of these events, along with others, presented significant hurdles to residential homebuilders.
Due to the need to fund either part or all of the costs of their construction projects, homebuilders often have to work with lending institutions. The normal lending institutions (banks, S&L, credit unions, etc.) were all negatively impacted by the trends discussed above, which raised default rates and losses related to commercial lending loans issued to residential homebuilders. In fact, many state and federal regulators are discouraging community banks and lending institutions from lending to residential homebuilders.
We believe all the factors above present three significant opportunities. The first opportunity, and our primary focus, is to become the lender of choice or secondary lender to residential homebuilders during the absence of lending at the homebuilder’s local financial institution or community bank. Another is to purchase and securitize the loans made by building supply companies to those homebuilders. Finally, we may acquire deeply discounted defaulted debt from other financial institutions. While we have not entered into any transactions related to the final two opportunities, we will remain mindful of those opportunities to generate a return from such transactions.
Perceived Challenges and Anticipated Responses
The following is not intended to represent a comprehensive list or description of the risks or challenges facing the Company. Currently, our management is most focused on the following challenges along with the corresponding actions to address those challenges:
| Perceived Challenges and Risks | Anticipated Management Actions/Response | ||
| Concentration of loan portfolio (i.e., how many of the loans are of one type, with any particular customer, or within any particular geography) | As of both December 31, 2016 and 2015, 37%, of our outstanding loan commitments consist of loans to one borrower, and the collateral is in one real estate market, Pittsburgh, Pennsylvania. Accordingly, the ultimate collectability of a significant portion of these loans is susceptible to changes in market conditions in that area. As of December 31, 2016, our next two largest customers make up 11% and 6%, respectively, of our loan commitments, with loans in Sarasota, Florida and Savannah, Georgia, respectively. As of December 31, 2015, our next two largest customers made up 22% and 6%, respectively, of our loan commitments, with loans in Sarasota, Florida and Columbia, South Carolina, respectively. In the upcoming years, we plan on increasing our geographic and builder diversity while continuing to focus on residential homebuilder customers. | ||
| Potential loan value-to-collateral value issues (i.e., being underwater on particular loans) | We manage this challenge by risk-rating both the geographic region and the builder, and then adjusting the loan-to-value (i.e., the loan amount versus the value of the collateral) based on risk assessments. Additionally, we collect a deposit up-front for construction loans. | ||
| Potential increases in interest rates, which would reduce operating income | We offer variable rate loans that incorporate a spread (i.e., profit) above the Company’s costs of funds to insulate it against this risk. A more detailed description is included in Interest Spread below. | ||
| Liquidity |
As in every financial institution, we manage our loan balances to builders with our capital structure in mind. We had six sources of capital as of December 31, 2016: ● Secured lines of credit from our members; ● Purchase and sale agreements which are treated like a secured borrowing; ● Our Notes offering; ● Other unsecured debt; ● Preferred equity(Series B); and ● Common equity. In January of 2017 we added an unsecured line of credit from a bank.
We make decisions as to: ● What loans and to what customer(s) to make loan(s); ● What portions of loans to sell (under our purchase and sale agreements); and ● What interest rates and terms to offer to prospective Note holders.
These decisions are based on: ● Expected customer payoffs and borrowings; ● Expected Note redemptions; ● Expected new Note proceeds; ● Availability on our lines of credit; ● Unfunded commitments; and ● Loans we have agreed to make which have not closed yet. |
| 27 |
Opportunities
Although we can give no assurance as to our success in our efforts, in the future, our management will focus its efforts on the following opportunities:
| ● | receiving money from the Notes and other sources of capital, sufficient to operate our business and allow for growth and diversification in our loan portfolio; | |
| ● | growing loan assets and the staffing and operations to handle it. We hire office staff as loan volume grows, and hire the origination staff, which is field based, as our liquidity allows for new loan originations. The goal for the field staff is to have a geographic coverage that eventually covers most of the continental U.S.; | |
| ● | replacing our existing lines of credit from our affiliates with lines of credit from financial institutions. We would like the maximum amount (the credit limit) to be 20% of our asset size, and our outstanding amounts to average 10% of our asset size. Certain features of the purchase and sale agreements have added liquidity and flexibility, which have lessened the need for the lines of credit. We added an unsecured line of credit in January of 2017; | |
| ● | producing a profit, and making distributions to our members to cover their tax burden from our operations, and, if possible, to give them a return on their investment; and | |
| ● | retaining earnings to grow the equity of the Company. |
Understanding and Evaluating Our Operating Results
Our results of operations are driven by three major factors - interest spread, loan losses, and selling, general and administrative (SG&A) expenses.
Interest Spread
Interest spread is generally made up of the following three components:
| 28 |
● Difference between the interest rate received (on our loan assets) and the interest rate paid (on our borrowings).
● Fee income. This fee is generally recognized over the life of the loan, based on the maximum allowed loan balance over the expected life of the loan. The amount of interest spread on these loans will depend on the life of the loans, as well as the fee percentage. As more competition comes into the residential construction lending market, we expect this portion of spread income to decrease as a percentage of assets.
● Amount of nonperforming assets. Since we are paying interest on all money we borrow, any asset created or funded with borrowed funds that does not have an interest return costs us money. There is an interest expense for us, with no interest income to offset it. Generally there are two types of nonperforming assets. The first is nonperforming loans and related foreclosed assets held, which do not generate interest income unless actually received in cash. The second nonperforming asset type is money borrowed which is not invested in loans. To mitigate the negative spread on unused borrowed funds (idle cash), we use our line of credit to handle daily liquidity. We would like to maintain a secured line of credit with a credit limit of 20% of our loan assets, and generally carry a balance of 10% of our loan assets on that line. This way, as money comes in from Notes or loan payoffs, it can be used to pay down the line, and as money goes out for Note redemptions and new loans created, money can be drawn on the line. This will help reduce any negative spread on idle cash. In January of 2017, we obtained an unsecured line of credit, with a maximum borrowing limit of $500, which is 2.5% of our loan assets as of December 31, 2016.
We calculate interest spread by taking the difference between interest income and expense, and, when we express it as a percentage, by dividing it by our weighted average outstanding loan balance.
Loan Losses
The second major factor in determining our profitability is loan losses. Losses on loans occur with nonperforming loans (i.e., when customers are unable to repay their interest and/or principal). Normally, the loss in this situation is the difference between the collateral value and the loan value, less any costs of disposal. Homes which were constructed in the mid 2000’s created significant losses because many homes were worth less when completed than the appraised value at the time the loan was created. Losses also occur in loans when homes are partly built at the point of default, or never built. Generally, a declining real estate market will be the primary driver for loan losses. We believe that while current values may fall in some real estate markets, in general, values are low and represent a lower risk than at many other times over the last eight years, and that over the last several years in general, values have been rising. Another type of loss relating to loans is the loss which occurs when the loan becomes a foreclosed asset. At the initial conversion from loan to foreclosed asset, there is a calculation of current value of the real estate vs. the loan amount. If this amount is a loss and has not been provided for previously through our allowance for loan losses, there will be a loss on our financial statements, typically in the loan loss provision. If there is a gain it will show up in non-interest income. If during the ownership of the asset there is a reason to further write the item down, this loss shows as a non-interest expense. If upon sale there is a gain or loss, those items show up as non-interest gains or losses. Even though these items don’t impact interest spread, they are important pieces of our financial statements.
SG&A Expenses
SG&A expenses for us are almost all of the expenses that are not interest and loan/foreclosed asset losses. In 2016 we increased SG&A as compared to 2015 due to paying our CEO, increases in the number of employees, loan and foreclosed asset expenses, legal and accounting, board related expenses, and advertising. Foreclosed asset expenses generally include subdivision HOA expenses, taxes, and legal expenses. We anticipate SG&A expenses increasing as our loan balance increases in 2017.
Critical Accounting Estimates
To assist in evaluating our consolidated financial statements, we describe below the critical accounting estimates that we use. We consider an accounting estimate to be critical if: (1) the accounting estimate requires us to make assumptions about matters that were highly uncertain at the time the accounting estimate was made, and (2) changes in the estimate that are reasonably likely to occur from period to period, or use of different estimates that we reasonably could have used, would have a material impact on our consolidated financial condition or results of operations.
| 29 |
Loan Losses
Loan losses, as applicable, are accounted for both on the consolidated balance sheets and the consolidated statements of operations. On the consolidated statements of operations, management estimates the amount of losses to capture during the current year. This current period amount incurred is referred to as the loan loss provision. The calculation of our allowance for loan losses, which appears on our consolidated balance sheets, requires us to compile relevant data for use in a systematic approach to assess and estimate the amount of probable losses inherent in our commercial lending operations and to reflect that estimated risk in our allowance calculations. We use the policy summarized as follows:
We establish a collective reserve for all loans which are not more than 60 days past due at the end of a quarter. This collective reserve takes into account both historical information and a qualitative analysis of housing and other economic factors that may impact our future realized losses. For loans to one borrower with committed balances less than 10% of our total committed balances on all loans extended to all customers, we individually analyze for impairment all loans which are more than 60 days past due at the end of a quarter. For loans to one borrower with committed balances equal to or greater than 10% of our total committed balances on all loans extended to all customers, we individually analyze all loans for potential impairment. The analysis of loans, if required, includes a comparison of estimated collateral value to the principal amount of the loan. For impaired loans, if the value determined is less than the principal amount due (less any builder deposit), then the difference is included in the allowance for loan loss. As values change, estimated loan losses may be provided for more or less than the previous period, and some loans may not need a loss provision based on payment history. For homes which are partially complete, we appraise on an as-is and completed basis, and use the one that more closely aligns with our planned method of disposal for the property.
For loans greater than 12 months in age that are individually evaluated for impairment, appraisals have been prepared within the last 13 months. For all loans individually evaluated for impairment, there is also a broker’s opinions of value (“BOV”) prepared, if the appraisal is more than six months old. The lower of any BOV prepared in the last six months, or the most recent appraisal, is used, unless we determine a BOV to be invalid based on the comparable sales used. If we determine a BOV to be invalid, we will use the appraised value. Appraised values are adjusted down for estimated costs associated with asset disposal. Broker’s opinion of selling price, currently valid sales contracts on the subject property, or representative recent actual closings by the builder on similar properties may be used in place of a broker’s opinion of value.
Appraisers are state certified, and are selected by first attempting to utilize the appraiser who completed the original appraisal report. If that appraiser is unavailable or unreasonably expensive, we use another appraiser who appraises routinely in that geographic area. BOVs are created by real estate agents. We try to first select an agent we have worked with, and then, if that fails, we select another agent who works in that geographic area.
Currently, fair value of collateral has the potential to impact the calculation of the loan loss provision. Specifically relevant to the allowance for loan loss reserve is the fair value of the underlying collateral supporting the outstanding loan balances. Fair value measurements are an exit price, representing the amount that would be received to sell an asset or paid to transfer a liability in an orderly transaction between market participants. Due to a rapidly changing economic market, an erratic housing market, the various methods that could be used to develop fair value estimates, and the various assumptions that could be used, determining the collateral’s fair value requires significant judgment.
| December 31, 2016 | ||||
| Loan Loss | ||||
| Provision | ||||
| Change in Fair Value Assumption | Higher/(Lower) | |||
| Increasing fair value of the real estate collateral by 30%* | $ | – | ||
| Decreasing fair value of the real estate collateral by 30%** | $ | 46 | ||
* Increases in the fair value of the real estate collateral do not impact the loan loss provision, as the value generally is not “written up.”
**If the loans were nonperforming, assuming a book amount of the loans outstanding of $20,091, and the fair value of the real estate collateral on all outstanding loans was reduced by 30%, an addition to the loan loss provision of $46 would be required.
Foreclosed assets
Foreclosed assets, as applicable, are accounted for both on the consolidated balance sheets and the consolidated statements of operations. On the consolidated statements of operations, management estimates the amount of impairment to capture when a loan is converted to a foreclosed asset, the impairment when the value of an asset drops below its carrying amount, and any loss or gain upon final disposition of the asset. The calculation of the impairment, which appears on our consolidated balance sheets as a reduction in the asset, requires us to compile relevant data for use in a systematic approach to assess and estimate the value of the asset and therefore any required impairment thereof. We use the policy summarized as follows:
For properties which exist in the condition in which we intend to sell them, we obtain an appraisal of the assets current value. We reduce the appraised value by 10% to account for selling costs. This amount is used to initially book the asset. Typically prior to the initial booking of the foreclosed asset, the loan has already been reserved to this level. If during ownership, the value of the foreclosed asset drops, an additional impairment is recorded. For assets that need to be improved prior to sale, the above calculation is performed at the time of the booking of the foreclosed asset (an appraisal “as-is”), but subsequent to that, we look at the to be completed value minus 10% and subtract off the estimated cost of remaining work to be done. If this results in additional impairment, it is booked in non-interest expense. For assets which are going to be improved, while the asset is a loan (before it becomes a foreclosed asset) the calculation of the specific loan loss reserve is done based on the to be completed value as compared to the book value plus estimated completion costs. This can result in an impairment at the initial booking of the foreclosed asset.
| 30 |
The fair value of real estate will impact our foreclosed asset value, which is booked at 100% of fair value (after selling costs are deducted). Fair value measurements are an exit price, representing the amount that would be received to sell an asset or paid to transfer a liability in an orderly transaction between market participants.
| December 31, 2016 | ||||
| Foreclosed | ||||
| Assets | ||||
| Change in Fair Value Assumption | Higher/(Lower) | |||
| Increasing fair value of the foreclosed asset by 30%* | $ | – | ||
| Decreasing fair value of the foreclosed asset by 30% | $ | (839 | ) | |
* Increases in the fair value of the foreclosed assets do not impact the carrying value, as the value generally is not “written up.” Those gains would be recognized at the sale of the asset.
Amortization of Deferred Financing Costs
We amortize our deferred financing costs based on the effective interest method. As such, we make estimates for the duration of the future investment proceeds we anticipate receiving from our Notes offering. If this estimate is determined to be incorrect in the future, the rate at which we are amortizing the deferred financing costs as interest expense would be adjusted.
Currently, we anticipate a consistent average duration of 34 months for the Notes in our current offering. An increasing average duration over the remaining anticipated length of the Notes offering would decrease the amount of amortization reflected in interest in the next 12 months, and a decreasing average duration of investments over the remaining anticipated length would increase the amount reflected in the next 12 months.
| Change in Anticipated Average Duration | Resulting adjustment needed to Interest Expense during the next 12 months Higher/(Lower) |
|||
| Decreasing the average duration to 5 months for all remaining months of origination | $ | 15 | ||
| Increasing the average duration to 5 months for all remaining months of origination | $ | (11 | ) | |
Other Loss Contingencies
Other loss contingencies are recorded as liabilities when it is probable that a liability has been incurred and the amount of the loss is reasonably estimable. Disclosure is required when there is a reasonable possibility that the ultimate loss will exceed the recorded provision. Contingent liabilities are often resolved over long time periods. Estimating probable losses requires analysis of multiple forecasts that often depend on judgments about potential actions by third parties such as courts, arbitrators, juries, or regulators.
Accounting and Auditing Standards Applicable to “Emerging Growth Companies”
We are an “emerging growth company” under the recently enacted JOBS Act. For as long as we are an “emerging growth company,” we are not required to: (1) comply with any new or revised financial accounting standards that have different effective dates for public and private companies until those standards would otherwise apply to private companies, (2) provide an auditor’s attestation report on management’s assessment of the effectiveness of internal control over financial reporting pursuant to Section 404 of the Sarbanes-Oxley Act, (3) comply with any new requirements adopted by the Public Company Accounting Oversight Board, or the PCAOB, requiring mandatory audit firm rotation or a supplement to the auditor’s report in which the auditor would be required to provide additional information about the audit and the financial statements of the issuer or (4) comply with any new audit rules adopted by the PCAOB after April 5, 2012, unless the SEC determines otherwise. We intend to take advantage of such extended transition period. Since we will not be required to comply with new or revised accounting standards on the relevant dates on which adoption of such standards is required for other public companies, our consolidated financial statements may not be comparable to the financial statements of companies that comply with public company effective dates. If we were to subsequently elect to instead comply with these public company effective dates, such election would be irrevocable pursuant to Section 107 of the JOBS Act.
| 31 |
Other Significant Accounting Policies
Other significant accounting policies, not involving the same level of measurement uncertainties as those discussed above, are nevertheless important to an understanding of the consolidated financial statements. Policies related to credit quality information, fair value measurements, offsetting assets and liabilities, related party transactions and revenue recognition require difficult judgments on complex matters that are often subject to multiple and recent changes in the authoritative guidance. Certain of these matters are among topics currently under reexamination or have recently been addressed by accounting standard setters and regulators. Specific conclusions have not been reached by these standard setters, and outcomes cannot be predicted with confidence. Also, see Notes 1 and 2 to our consolidated financial statements, as they discuss accounting policies that we have selected from acceptable alternatives.
Consolidated Results of Operations
Key financial and operating data for the years ended December 31, 2016 and 2015 are set forth below. For a more complete understanding of our industry, the drivers of our business, and our current period results, this discussion should be read in conjunction with our consolidated financial statements, including the related notes and the other information contained in this document.
Accounting principles generally accepted in the United States of America (U.S. GAAP) require that we report financial and descriptive information about reportable segments and how these segments were determined. Our management determines the allocation and performance of resources based on operating income, net income and operating cash flows. Segments are identified and aggregated based on the products sold or services provided and the market(s) they serve. Based on these factors, management has determined that our ongoing operations are in one segment, commercial lending.
Below is a summary of our income statement for the following periods for the years ended December 31, 2016 and 2015:
| 2016 | 2015 | |||||||
| Net Interest Income | ||||||||
| Interest and fee income on loans | $ | 3,640 | $ | 1,863 | ||||
| Interest expense: | ||||||||
| Interest related to secured borrowings | 570 | 125 | ||||||
| Interest related to unsecured borrowings | 1,178 | 739 | ||||||
| Interest expense | 1,748 | 864 | ||||||
| Net interest income | 1,892 | 999 | ||||||
| Less: Loan loss provision | 16 | 59 | ||||||
| Net interest income after loan loss provision | 1,876 | 940 | ||||||
| Non-Interest Income | ||||||||
| Gain from foreclosure of assets | 44 | 105 | ||||||
| Gain from sale of foreclosed assets | 28 | – | ||||||
| Income | 1,948 | 1,045 | ||||||
| Non-Interest Expense | ||||||||
| Selling, general and administrative | 1,319 | (1) | 547 | |||||
| Impairment loss on foreclosed assets | 111 | – | ||||||
| Total non-interest expense | 1,430 | 547 | ||||||
| Net income | $ | 518 | (1) | $ | 498 | |||
| Earned distribution to preferred equity holder | 107 | 100 | ||||||
| Net income attributable to common equity holders | $ | 411 | (1) | $ | 398 | |||
(1) We began paying our CEO effective January 1, 2016. Selling, general and administrative expenses were $403 higher due to those costs in 2016. Net income would have been $403 higher in 2016 without those costs.
| 32 |
Interest Spread
The following table displays a comparison of our interest income, expense, fees and spread:
| For the Years Ended December 31, | ||||||||||||||||
| (in thousands of dollars) | 2016 | 2015 | ||||||||||||||
| Interest Income | * | * | ||||||||||||||
| Interest income on loans | $ | 2,415 | 13 | % | $ | 1,156 | 12 | % | ||||||||
| Fee income on loans | 1,225 | 7 | % | 707 | 7 | % | ||||||||||
| Interest and fee income on loans | 3,640 | 20 | % | 1,863 | 19 | % | ||||||||||
| Interest expense – secured | 570 | 3 | % | 125 | 1 | % | ||||||||||
| Interest expense – unsecured | 911 | 5 | % | 510 | 6 | % | ||||||||||
| Amortization of offering costs | 267 | 2 | % | 229 | 2 | % | ||||||||||
| Interest expense | 1,748 | 10 | % | 864 | 9 | % | ||||||||||
| Net interest income (spread) | 1,892 | 10 | % | 999 | 10 | % | ||||||||||
| Weighted average outstanding loan asset balance | $ | 18,249 | $ | 9,848 | ||||||||||||
*annualized amount as percentage of weighted average outstanding gross loan balance
There are three main components that can impact our interest spread:
● Difference between the interest rate received (on our loan assets) and the interest rate paid (on our borrowings). The loans we have originated have interest rates which are based on our cost of funds, with a minimum cost of funds of 5%. For most loans, the margin is fixed at 2%. Future loans are anticipated to be originated at approximately the same 2% margin. This component is also impacted by the lending of money with no interest cost (our equity). Our interest income on loans was higher in 2016 vs. 2015 by 1%. This increase was due to: 1) default interest charged to a borrower in 2016; 2) a higher interest rate charged to all of our borrowers (caused by an increase in our borrowing costs); 3) not recognizing interest in 2015 for a borrower we were foreclosing on; and 4) an increase in the rate we are charging on our development loans. Our interest expense increased in 2016 as we sought to increase our loan balances and found that we were able to do so by raising the interest rates we paid to our lenders, including the Notes program. Also we were using capital raised from debt to carry foreclosed assets, and while that raised our interest cost, it did not increase our weighted average outstanding loan balance.
The difference between the interest income and interest expense was 3% for both 2016 and 2015. We anticipate that interest cost and interest income will both rise as a percentage of loan balance, but that the difference between the interest income and interest expense will remain consistent with the past two years.
● Fee income. Fee income is displayed in the table above. The two loans originated in December 2011 had a net origination fee of $924. This fee was recognized over the life of the loans, and has been fully recognized as of August, 2016. All of our construction loans have a 5% fee on the amount we commit to lend, which is amortized over the expected life of each of those loans. When loans pay back quicker than their expected life, the remaining unrecognized fee is recognized upon the termination of the loan. For both 2016 and 2015, fee income was 7% of the average outstanding balance on all loans. The decrease in fee income from the development loans in the later part of 2016 was offset by a higher percentage of our loans being construction loans. In the future, we anticipate creating loans with fees ranging between 4 and 5% of the maximum loan amount, and we anticipate that our fee percentage in 2017 vs. 2016 will be slightly higher due to construction loans being a higher portion of our balances in 2017. This increase will be partially offset in the first half of 2017 because the 2011 loans had fee income through July 2016.
● Amount of nonperforming assets. In 2015 we had loan assets we were foreclosing on which were not paying interest, and in 2016 we had no such loan assets. Real estate assets owned (after we foreclosed on loans and took possession of the property serving as collateral) do not have an interest return either, and the balance of those has risen during 2016 from $965 to $2,798. On December 31, 2016 and 2015, we carried cash balances of $1,566 and $1,341, respectively, which also do not have a material return. We anticipate that our nonperforming assets will decrease somewhat in relation to total assets during 2017, reducing the impact of nonperforming assets on our interest spread.
Loan Loss Provision
We recorded $16 and $17 in the years ended December 31, 2016 and 2015, respectively, in loss reserve related to our collective reserve (loans not individually impaired). In addition, we reserved $0 and $42 in the years ended December 31, 2016 and 2015, respectively, in our specific reserve (for loans individually impaired) specifically related to loans we were foreclosing on in 2015. We anticipate that the collective reserve will increase as our balances rise throughout 2017.
Non-Interest Income
We recognized foreclosed gains of $44 and $105 in the years ended December 31, 2016 and 2015, respectively, from the initial foreclosure of assets. This represents the difference between our loan book value and the appraised value, net of selling costs, of the real estate. We also sold a foreclosed asset in 2016 and recognized a gain of $28. We anticipate some similar small gains in 2017.
| 33 |
SG&A Expenses
The following table displays our SG&A expenses for the years ended December 31, 2016 and 2015:
| For the Years Ended December 31, |
||||||||
| 2016 | 2015 | |||||||
| Selling, general and administrative expenses | ||||||||
| Legal and accounting | $ | 167 | $ | 144 | ||||
| Salaries and related expenses | 816 | 187 | ||||||
| Board related expenses | 112 | 105 | ||||||
| Advertising | 46 | 22 | ||||||
| Rent and utilities | 19 | 20 | ||||||
| Printing | 10 | 12 | ||||||
| Loan and foreclosed asset expenses | 62 | 16 | ||||||
| Travel | 35 | 15 | ||||||
| Other | 52 | 26 | ||||||
| Total SG&A | $ | 1,319 | $ | 547 | ||||
Printing costs are both for printing of investor related material and for the filing of documents electronically with the SEC.
We began paying our CEO effective January 1, 2016. Our CEO’s total compensation (including bonus accrual and benefits) was approximately $403 and $0 for the years ended December 31, 2016 and 2015, respectively. We also have additional staff in the field and in the office. Advertising increased due to expenses related to new builder efforts. Loan and foreclosed asset expenses increased due to expenses related to having real estate which we foreclosed on. Travel expense was higher due to our field representatives and more site visits to potential loan jobsites. Legal expenses were up due to our growth. We anticipate additional expenses as we grow in 2017.
Impairment loss on foreclosed assets
We recorded $111 and $0 in the years ended December 31, 2016 and 2015, respectively, in impairment losses of our foreclosed assets (real estate taken in foreclosure). These losses are generally due to either decreases in value or cost overruns in completion. We may have more impairment in 2017 either on our existing or acquired foreclosed assets.
Consolidated Financial Position
Cash and Cash Equivalents
We try to avoid borrowing on our line of credit from affiliates. To accomplish this, we must carry some cash for liquidity. This amount generally grows as our Company grows. At December 31, 2016 and 2015, we had $1,566 and $1,341, respectively, in cash. When we create new loans, they typically do not have significant outstanding loan balances for several months. We anticipate loan production to increase in 2017, therefore increasing the average amount of cash we may hold, unless we obtain a line of credit from a financial institution. In January 2017, we executed a line of credit with a bank with a maximum outstanding of $500, which should lessen somewhat the amount of cash we carry on our books.
Deferred Financing Costs, Net
Gross deferred financing costs were $1,014 and $935 as of December 31, 2016 and December 31, 2015, respectively. The accumulated amortization of those costs was $540 and $336 as of the same dates. We expect that the gross deferred financing amount will continue to increase over time as more of the anticipated financing costs are deferred when paid, and expensed over the life of the debt associated with the financing using the effective interest method. We also expect that the amortization expense and the accumulated amortization will increase in 2016 as compared to 2015.
The deferred financing costs are reflected as a reduction in the unsecured notes offering liability. The Company adopted the guidance on the presentation of debt issuance costs on January 1, 2016, as required. As a result, the Company retrospectively applied the guidance to the 2015 Consolidated Balance Sheet by reclassifying $599 of deferred financing costs previously classified in the assets section.
| 34 |
The following is a roll forward of deferred financing costs for the years ended December 31, 2016 and 2015:
| 2016 | 2015 | |||||||
| Deferred financing costs, beginning balance | $ | 935 | $ | 737 | ||||
| Additions | 79 | 198 | ||||||
| Deferred financing costs, ending balance | $ | 1,014 | $ | 935 | ||||
| Less accumulated amortization | (603 | ) | (336 | ) | ||||
| Deferred financing costs, net | $ | 411 | $ | 599 | ||||
The following is a roll forward of the accumulated amortization of deferred financing costs for the years ended December 31, 2016 and 2015:
| 2016 | 2015 | |||||||
| Accumulated amortization, beginning balance | $ | 336 | $ | 107 | ||||
| Additions | 267 | 229 | ||||||
| Accumulated amortization, ending balance | $ | 603 | $ | 336 | ||||
Loans Receivable
In December 2011, we originated two new loans and assumed a lender’s position on a third loan, which, net of unearned loan fees, had total balances of $4,082 and $6,004 as of December 31, 2016 and 2015, respectively. These loans were all to borrowers that are affiliated with each other, and are cross-collateralized. Collectively, the development loans are referred to herein as the “Pennsylvania Loans.” No individual impairment has been deemed necessary for these loans. The purpose of the loans was to develop two subdivisions in a suburb of Pittsburgh, Pennsylvania. The Hamlets subdivision is a five phase subdivision of 81 lots, of which 62 have been developed and sold, 19 are developed and not sold, as of December 31, 2016. The Tuscany subdivision is a single phase 18 lot subdivision, with four lots remaining as of December 31, 2016. A portion of the collateral of the Pennsylvania Loans is preferred equity interests in us (see Risk Factor “Currently, we are reliant on a single developer and homebuilder, the Hoskins Group, for a significant portion of our revenues and a portion of our capital.”).
The borrower also owns preferred equity in us which serves as collateral for the Pennsylvania Loans. There is no liquid market for the preferred equity, so we can give no assurance as to our ability to generate any amount of proceeds from that collateral. Beginning in December 2015, the Hoskins Group invests in our preferred equity in an amount equal to $10 per closing of a lot payoff in the Hamlets or Tuscany subdivisions. The terms and conditions of the Pennsylvania Loans are set forth in further detail below.
We have other borrowers, all of whom borrow money for the purpose of building new homes.
Commercial Loans – Real Estate Development Loan Portfolio Summary
The following is a summary of our loan portfolio to builders for land development as of December 31, 2016. The Pennsylvania loans below are the Pennsylvania Loans discussed above.
| State | Number of Borrowers | Number of Loans | Value of Collateral(1) | Commitment Amount | Amount Outstanding | Loan to Value Ratio(2) | Loan Fee | |||||||||||||||||||||
| Pennsylvania | 1 | 3 | $ | 6,586 | $ | 5,931 | (3) | $ | 4,082 | 62 | % | $ | 1,000 | |||||||||||||||
| Total | 1 | 3 | $ | 6,586 | $ | 5,931 | $ | 4,082 | 62 | % | $ | 1,000 | ||||||||||||||||
| (1) | The value is determined by the appraised value adjusted for remaining costs to be paid and third-party mortgage balances. Part of this collateral is $1,150 of preferred equity in our Company. In the event of a foreclosure on the property securing certain of our loans, a portion of our collateral is preferred equity in our Company, which might be difficult to sell, which could impact our ability to eliminate the loan balance. | |
| (2) | The loan to value ratio is calculated by taking the outstanding amount and dividing by the appraised value. | |
| (3) | The commitment amount does not include letters of credit and cash bonds, as the sum of the total balance outstanding including the cash bonds plus the letters of credit and remaining to fund for construction is less than the $5,931 commitment amount. |
| 35 |
The following is a summary of our loan portfolio to builders for land development as of December 31, 2015. The Pennsylvania loans below are the Pennsylvania Loans discussed above.
| State | Number of Borrowers | Number of Loans | Value of Collateral(1) | Commitment Amount | Amount Outstanding | Loan to Value Ratio(2) | Loan Fee | |||||||||||||||||||||
| Pennsylvania | 1 | 3 | $ | 7,902 | $ | 6,456 | (3) | $ | 6,118 | 77 | % | $ | 1,000 | |||||||||||||||
| Total | 1 | 3 | $ | 7,902 | $ | 6,456 | $ | 6,118 | 77 | % | $ | 1,000 | ||||||||||||||||
| (1) | The value is determined by the appraised value adjusted for remaining costs to be paid and third party mortgage balances. Part of this collateral is $1,010 of preferred equity in our Company. In the event of a foreclosure on the property securing certain of our loans, a portion of our collateral is preferred equity in our Company, which might be difficult to sell, which could impact our ability to eliminate the loan balance. | |
| (2) | The loan to value ratio is calculated by taking the outstanding amount and dividing by the appraised value. | |
| (3) | The commitment amount includes letters of credit and cash bonds. |
Commercial Loans – Construction Loan Portfolio Summary
The following is a summary of our loan portfolio to builders for home construction loans as of December 31, 2016.
| State | Number of Borrowers |
Number of Loans |
Value of Collateral(1) |
Commitment Amount |
Amount Outstanding |
Loan to Value Ratio(2) |
Loan Fee | |||||||||||||||||||||
| Colorado | 1 | 3 | $ | 1,615 | $ | 1,131 | $ | 605 | 70 | % | 5 | % | ||||||||||||||||
| Connecticut | 1 | 1 | 715 | 500 | 479 | 70 | % | 5 | % | |||||||||||||||||||
| Delaware | 1 | 2 | 244 | 171 | 40 | 70 | % | 5 | % | |||||||||||||||||||
| Florida | 7 | 15 | 14,014 | 8,548 | 4,672 | 61 | % | 5 | % | |||||||||||||||||||
| Georgia | 4 | 9 | 6,864 | 4,249 | 2,749 | 62 | % | 5 | % | |||||||||||||||||||
| Idaho | 1 | 1 | 319 | 215 | 205 | 67 | % | 5 | % | |||||||||||||||||||
| Michigan | 1 | 1 | 210 | 126 | 118 | 60 | % | 5 | % | |||||||||||||||||||
| New Jersey | 1 | 3 | 977 | 719 | 528 | 74 | % | 5 | % | |||||||||||||||||||
| New York | 1 | 4 | 1,745 | 737 | 685 | 42 | % | 5 | % | |||||||||||||||||||
| North Carolina | 2 | 2 | 1,015 | 633 | 216 | 62 | % | 5 | % | |||||||||||||||||||
| Ohio | 1 | 1 | 1,405 | 843 | 444 | 60 | % | 5 | % | |||||||||||||||||||
| Pennsylvania | 2 | 15 | 12,725 | 6,411 | 5,281 | 50 | % | 5 | % | |||||||||||||||||||
| South Carolina | 5 | 7 | 2,544 | 1,591 | 783 | 63 | % | 5 | % | |||||||||||||||||||
| Tennessee | 1 | 3 | 1,080 | 767 | 430 | 71 | % | 5 | % | |||||||||||||||||||
| Utah | 1 | 2 | 715 | 500 | 252 | 70 | % | 5 | % | |||||||||||||||||||
| Total | 30 | 69 | $ | 46,187 | $ | 27,141 | $ | 17,487 | 59 | %(3) | 5 | % | ||||||||||||||||
| (1) | The value is determined by the appraised value. | |
| (2) | The loan to value ratio is calculated by taking the commitment amount and dividing by the appraised value. | |
| (3) | Represents the weighted average loan to value ratio of the loans. |
The following is a summary of our loan portfolio to builders for home construction loans as of December 31, 2015.
| State | Number of Borrowers | Number of Loans | Value of Collateral(1) | Commitment Amount | Amount Outstanding | Loan to Value Ratio(2) | Loan Fee | |||||||||||||||||||||
| Colorado | 1 | 4 | $ | 2,160 | $ | 1,519 | $ | 830 | 70 | % | 5 | % | ||||||||||||||||
| Connecticut | 1 | 1 | 715 | 500 | 251 | 70 | % | 5 | % | |||||||||||||||||||
| Delaware | 1 | 2 | 1,074 | 671 | 105 | 63 | % | 5 | % | |||||||||||||||||||
| Florida | 3 | 10 | 10,683 | 6,440 | 4,378 | 60 | % | 5 | % | |||||||||||||||||||
| Georgia | 2 | 3 | 3,916 | 2,278 | 712 | 58 | % | 5 | % | |||||||||||||||||||
| New Jersey | 1 | 2 | 510 | 357 | 268 | 70 | % | 5 | % | |||||||||||||||||||
| North Carolina | 1 | 2 | 385 | 270 | 172 | 70 | % | 5 | % | |||||||||||||||||||
| Pennsylvania | 2 | 6 | 4,107 | 2,391 | 1,275 | 58 | % | 5 | % | |||||||||||||||||||
| South Carolina | 2 | 16 | 2,395 | 1,699 | 1,136 | 71 | % | 5 | % | |||||||||||||||||||
| Total | 14 | 46 | $ | 25,945 | $ | 16,125 | $ | 9,127 | 62 | %(3) | 5 | % | ||||||||||||||||
| 36 |
| (1) | The value is determined by the appraised value. | |
| (2) | The loan to value ratio is calculated by taking the commitment amount and dividing by the appraised value. | |
| (3) | Represents the weighted average loan to value ratio of the loans. |
Financing receivables are comprised of the following as of December 31, 2016 and 2015:
| December 31, 2016 | December 31, 2015 | |||||||
| Commercial loans, gross | $ | 21,569 | $ | 15,247 | ||||
| Less: Deferred loan fees | (618 | ) | (628 | ) | ||||
| Less: Deposits | (861 | ) | (521 | ) | ||||
| Plus: Deferred origination expense | 55 | – | ||||||
| Less: Allowance for loan losses | (54 | ) | (38 | ) | ||||
| Commercial loans, net | $ | 20,091 | $ | 14,060 | ||||
Roll forward of commercial loans for the years ended December 31, 2016 and 2015:
| 2016 | 2015 | |||||||
| Beginning balance | $ | 14,060 | $ | 8,097 | ||||
| Additions | 23,184 | 13,760 | ||||||
| Payoffs/sales | (15,168 | ) | (6,436 | ) | ||||
| Moved to foreclosed assets | (1,639 | ) | (767 | ) | ||||
| Change in deferred origination expense | 55 | – | ||||||
| Change in builder deposit | (340 | ) | (387 | ) | ||||
| Change in loan loss provision | (16 | ) | (17 | ) | ||||
| New loan fees | (1,270 | ) | (897 | ) | ||||
| Earned loan fees | 1,225 | 707 | ||||||
| Ending balance | $ | 20,091 | $ | 14,060 | ||||
Finance Receivables – Method of impairment calculation:
| December 31, 2016 | December 31, 2015 | |||||||
| Performing loans evaluated individually | $ | 11,865 | $ | 9,971 | ||||
| Performing loans evaluated collectively | 8,226 | 4,089 | ||||||
| Non-performing loans without a specific reserve | – | – | ||||||
| Non-performing loans with a specific reserve | – | – | ||||||
| Total | $ | 20,091 | $ | 14,060 | ||||
| 37 |
Below is an aging schedule of loans receivable as of December 31, 2016, on a recency basis:
| No. Accts. |
Unpaid Balances |
% | ||||||||||
| Current loans (current accounts and accounts on which more than 50% of an original contract payment was made in the last 59 days) | 71 | $ | 17,460 | 87 | % | |||||||
| 60-89 days | 1 | 2,631 | 13 | % | ||||||||
| 90-179 days | – | – | 0 | % | ||||||||
| 180-269 days | – | – | 0 | % | ||||||||
| Subtotal | 72 | $ | 20,091 | 100 | % | |||||||
| Interest only accounts (Accounts on which interest, deferment, extension and/or default charges were received in the last 60 days) | – | $ | – | 0 | % | |||||||
| Partial Payment accounts (Accounts on which the total received in the last 60 days was less than 50% of the original contractual monthly payment. “Total received” to include interest on simple interest accounts, as well as late charges on deferment charges on pre-computed accounts.) | – | $ | – | 0 | % | |||||||
| Total | 72 | $ | 20,091 | 100 | % | |||||||
Below is an aging schedule of loans receivable as of December 31, 2015, on a recency basis:
| No. Accts. |
Unpaid Balances |
% | ||||||||||
| Current loans (current accounts and accounts on which more than 50% of an original contract payment was made in the last 59 days) | 49 | $ | 14,060 | 100 | % | |||||||
| 60-89 days | – | – | 0 | % | ||||||||
| 90-179 days | – | – | 0 | % | ||||||||
| 180-269 days | – | – | 0 | % | ||||||||
| Subtotal | 49 | $ | 14,060 | 100 | % | |||||||
| Interest only accounts (Accounts on which interest, deferment, extension and/or default charges were received in the last 60 days) | – | $ | – | 0 | % | |||||||
| Partial Payment accounts (Accounts on which the total received in the last 60 days was less than 50% of the original contractual monthly payment. “Total received” to include interest on simple interest accounts, as well as late charges on deferment charges on pre-computed accounts.) | – | $ | – | 0 | % | |||||||
| Total | 49 | $ | 14,060 | 100 | % | |||||||
Below is an aging schedule of loans receivable as of December 31, 2016, on a contractual basis:
| No. Accts. |
Unpaid Balances |
% | ||||||||||
| Contractual Terms - All current Direct Loans and Sales Finance Contracts with installments past due less than 60 days from due date. | 71 | $ | 17,460 | 87 | % | |||||||
| 60-89 days | 1 | 2,631 | 13 | % | ||||||||
| 90-179 days | – | – | 0 | % | ||||||||
| 180-269 days | – | – | 0 | % | ||||||||
| Subtotal | 72 | $ | 20,091 | 100 | % | |||||||
| Interest only accounts (Accounts on which interest, deferment, extension and/or default charges were received in the last 60 days) | – | $ | – | 0 | % | |||||||
| Partial Payment accounts (Accounts on which the total received in the last 60 days was less than 50% of the original contractual monthly payment. “Total received” to include interest on simple interest accounts, as well as late charges on deferment charges on pre-computed accounts.) | – | $ | – | 0 | % | |||||||
| Total | 72 | $ | 20,091 | 100 | % | |||||||
| 38 |
Below is an aging schedule of loans receivable as of December 31, 2015, on a contractual basis:
| No. Accts. |
Unpaid Balances |
% | ||||||||||
| Contractual Terms - All current Direct Loans and Sales Finance Contracts with installments past due less than 60 days from due date. | 49 | $ | 14,060 | 100 | % | |||||||
| 60-89 days | – | – | 0 | % | ||||||||
| 90-179 days | – | – | 0 | % | ||||||||
| 180-269 days | – | – | 0 | % | ||||||||
| Subtotal | 49 | $ | 14,060 | 100 | % | |||||||
| Interest only accounts (Accounts on which interest, deferment, extension and/or default charges were received in the last 60 days) | – | $ | – | 0 | % | |||||||
| Partial Payment accounts (Accounts on which the total received in the last 60 days was less than 50% of the original contractual monthly payment. “Total received” to include interest on simple interest accounts, as well as late charges on deferment charges on pre-computed accounts.) | – | $ | – | 0 | % | |||||||
| Total | 49 | $ | 14,060 | 100 | % | |||||||
Foreclosed Assets
Roll forward of Foreclosed Assets for the years ended December 31, 2016 and 2015:
| 2016 | 2015 | |||||||
| Beginning balance | $ | 965 | $ | – | ||||
| Additions from loans | 1,813 | 880 | ||||||
| Additions for construction/development | 566 | 85 | ||||||
| Sale of foreclosed assets | (463 | ) | – | |||||
| Gain on sale | 28 | – | ||||||
| Impairment loss on foreclosed assets | (111 | ) | – | |||||
| Ending balance | $ | 2,798 | $ | 965 | ||||
We foreclosed on five properties during 2015, of which four were acquired at the foreclosure sale and one was acquired via a deed in lieu of foreclosure. Three of the properties were lots in Georgia. We had an agreement with a builder to build a house on one of the lots which was completed in 2016 and sold and closed in November of 2016. We recorded a gain of $28 as a result of that sale. We will likely start construction on another home on one of the lots early in 2017. Two of the properties were partially completed homes in Louisiana, one has been finished and work is proceeding to complete the second of these homes. Those homes were reappraised and impaired for $111 based on a declining value and cost overruns. We acquired one property via a deed in lieu of foreclosure during 2016. This property is a beach lot in Sarasota, Florida with a sales contract with contingencies scheduled to close in March of 2017.
Customer Interest Escrow
The Pennsylvania Loans called for a funded interest escrow account which was funded with proceeds from the Pennsylvania Loans. The initial funding on that interest escrow was $450. The balance as of December 31, 2016 and 2015 was $541 and $267, respectively. To the extent the balance is available in the interest escrow, interest due on certain loans is deducted from the interest escrow on the date due. The interest escrow is increased by 20% of lot payoffs on the same loans, and by interest and/or distributions on the SF Loan and Hoskins Group preferred equity. All of these transactions are noncash to the extent that the total escrow amount does not need additional funding. The interest escrow is also used to contribute to the reduction of the $400 subordinated mortgage upon certain lot sales of the collateral of that loan.
Sixteen and ten other loans active as of December 31, 2016 and 2015, respectively, also have interest escrows. The cumulative balance of all interest escrows other than the Pennsylvania Loans was $271 and $231 as of December 31, 2016 and 2015, respectively.
Roll forward of interest escrow for the years ended December 31, 2016 and 2015:
| 2016 | 2015 | |||||||
| Beginning balance | $ | 498 | $ | 318 | ||||
| + SF Loan interest and preferred equity dividends | 104 | 82 | ||||||
| + Additions from Pennsylvania Loans | 926 | 562 | ||||||
| + Additions from other loans | 430 | 328 | ||||||
| - Interest and fees | (1,109 | ) | (755 | ) | ||||
| - Repaid to borrower or used to reduce principal | (37 | ) | (37 | ) | ||||
| Ending balance | $ | 812 | $ | 498 | ||||
| 39 |
Notes Payable Unsecured
At the same time that we extended the Pennsylvania Loans in December 2011, we assumed a note payable to our borrowing customer for $1,500, which was the balance until December 2014. This loan was unsecured and had the same priority as the Notes. It was also collateral for the loans we extended to this customer. In December 2014, we converted $1,000 of this note payable to preferred equity and moved $125 of the note payable to the interest escrow. In January 2015, we repaid the remaining $375 to the borrower. In addition, we owed $11,221 and $8,496 in Notes payable under our Notes offering as of December 31, 2016 and 2015, respectively. In August 2015, we borrowed $500 through a note with Seven Kings Holdings, Inc. (“7Kings”), which is currently due in February of 2017. We also have four notes to third parties for $652 the majority of which are due in 2020. We expect our Notes payable unsecured balance to increase as we raise funds in our Notes offering.
Notes Payable Related Party
We have two lines of credit from affiliates, which had a combined, outstanding balance of $0 as of both December 31, 2016 and 2015. We had $1,500 available to us on the affiliate lines as of both December 31, 2016 and 2015, although there is no obligation of the affiliates to lend money up to the note amount. We intend to have a line of credit or multiple lines of credit in the future, and intend to eventually replace these lines from affiliates with lines from unrelated financial institutions. Certain features of the purchase and sale agreement with the Loan Purchaser have added liquidity and flexibility, which have lessened the need for the lines of credit from affiliates. In January of 2017, we executed a line of credit with a bank with a maximum outstanding balance of $500.
S.K. Funding, LLC (“S.K. Funding”), an affiliate of 7Kings, owns 4% of our common equity. S.K. Funding is also a buyer in a purchase and sale agreement where we are the seller. 7Kings is an investor in our notes program for $500 and has a $500 unsecured note due from us.
Purchase and Sale Agreements
In December 2014, the Company entered into a purchase and sale agreement with 1st Financial Bank USA whereby the purchaser may buy loans offered to it by us, and we may be obligated to offer certain loans to purchaser. Purchaser is buying senior positions in the loans they purchase, originally 50%, 70% on new loans as of January 2017, of each loan. Purchaser generally receives the interest rate we charge the borrower (with a floor of 10%) on their portion of the loan balance, and we receive the rest of the interest and all of the loan fee. We service the loans. There is an unlimited right for us to call any loan sold, however in any case of such call, a minimum of 4% of the commitment amount of purchaser must have been received by purchaser in interest, or we must make up the difference. Also, the purchaser has a put option, which is limited to 10% of the funding provided by purchaser under all loans purchased in the trailing 12 months.
In April 2015, the Company entered into a purchase and sale agreement with 7Kings as purchaser and the Company as seller, whereby 7Kings buys loans offered to it by us, providing that their portions of the loans always total less than $1,500. On or about May 7, 2015, 7Kings assigned its right and interest in the purchase and sale agreement to S.K. Funding, an affiliate of 7Kings. S.K. Funding may adjust the $1,500 with notice, but such change will not cause a buyback by us. S.K. Funding is buying pari-passu positions in the loans they purchase, generally 50% of each loan. S.K. Funding generally receives a 9% interest rate on its portion of the loan balance, and we receive the rest of the interest and all of the loan fees. We service the loans. There is an unlimited right for us to call any loan sold. This transaction is accounted for as a secured line of credit. In the fourth quarter of 2015, we entered into a modification of our agreement with S.K. Funding whereby S.K. Funding agreed to buy priority interests of $1,000 each in two large loans we originated. In the first quarter of 2016, after one of the $1,000 loans repaid, we entered into an additional modification whereby S.K. Funding agreed to buy priority interests totaling $2,000 in a total of three large loans we originated. The interest rate for the loans covered by these modifications is 9.5% to S.K. Funding. On June 30, 2016, one of those two loans was terminated with a deed in lieu of foreclosure. The property is owned by us, and we owe S.K. Funding $1,000 on that property (secured by mortgage) to be repaid upon the sale of the property. This amount is still covered by our purchase and sale agreement and is included in the totals in the chart below. Two more amendments were signed in the fourth quarter of 2016 allowing for more priority purchases of loans under the same terms as the first two amendments. On December 31, 2015, S.K. Funding purchased 4% of our common equity from the Wallach family.
The purchase and sale agreements are recorded as secured borrowings.
The purchase and sale agreements are detailed below:
| December 31, 2016 | December 31, 2015 | |||||||||||||||
| Book Value of | Due From | Book Value of | Due From | |||||||||||||
| Loans which | Shepherd’s | Loans which | Shepherd’s | |||||||||||||
| Served as | Finance to Loan | Served as | Finance to Loan | |||||||||||||
| Collateral | Purchaser | Collateral | Purchaser | |||||||||||||
| Loan purchaser | ||||||||||||||||
| 1st Financial Bank, USA | $ | 5,779 | $ | 2,517 | $ | 2,723 | $ | 1,061 | ||||||||
| S.K. Funding, LLC | 7,770 | 4,805 | 4,522 | 2,622 | ||||||||||||
| Total | $ | 13,549 | $ | 7,322 | $ | 7,245 | $ | 3,683 | ||||||||
The $7,770 of loans which served as collateral for S.K. Funding does not include the book value of the foreclosed assets which also secure their position, which amount is $1,813.
| 40 |
Priority of Borrowings
The following table displays our borrowings and a ranking of priority. The lower the number, the higher the priority. The bank line of credit did not start until January 2017, but is listed to better your understanding:
| Priority Rank | December 31, 2016 | December 31, 2015 | ||||||||
| Borrowing Source | ||||||||||
| Purchase and sale agreements | 1 | $ | 7,322 | $ | 3,683 | |||||
| Secured line of credit from affiliates | 2 | – | – | |||||||
| Bank line of credit debt (senior unsecured) | 3 | – | – | |||||||
| Other unsecured debt (senior subordinated) | 4 | 279 | – | |||||||
| Unsecured Notes through our public offering | 5 | 11,221 | 8,496 | |||||||
| Other unsecured debt (subordinated) | 5 | 700 | 600 | |||||||
| Other unsecured debt (junior subordinated) | 6 | 173 | – | |||||||
| Total | $ | 19,695 | $ | 12,779 | ||||||
Contractual Obligations
We currently have seven notes outstanding outside of the public offering. Two notes to affiliates are demand notes established on December 30, 2011, with balances of $0 as of both December 31, 2016 and 2015. We also have an unsecured note from 7Kings for $500 due in 2017 and four from unrelated third parties for $452 due mostly in 2020. We have secured debt as well, which is due when the loan collateral is repaid by the borrower. Their maturities are estimated in the table below. The following table shows the maturity of outstanding debt as of December 31, 2016.
| Year Maturing | Total Amount Maturing | Public Offering | Other Unsecured | Purchase and Sale Agreements | ||||||||||||
| 2017 | $ | 10,838 | $ | 3,116 | $ | 600 | $ | 7,322 | ||||||||
| 2018 | 2,516 | 2,516 | – | – | ||||||||||||
| 2019 | 3,011 | 3,011 | – | – | ||||||||||||
| 2020 | 3,330 | 2,578 | 552 | – | ||||||||||||
| Total | $ | 19,695 | $ | 11,221 | $ | 1,152 | $ | 7,322 | ||||||||
We are obligated to lend money to customers based on agreements we have with them. We do not always have the maximum amount obligated outstanding at any given time. The amount we have not loaned, but are obligated to lend, under certain conditions is a potential liquidity use. This amount was $11,503 as of December 31, 2016 and $7,332 as of December 31, 2015. See Note 9 of our consolidated 2016 financial statements for more information regarding contractual obligations.
Liquidity and Capital Resources
Our operations are subject to certain risks and uncertainties, particularly related to the concentration of our current operations, a significant portion of which are to a single customer and geographic region, as well as the evolution of the current economic environment and its impact on the United States real estate and housing markets. Both the concentration of risk and the economic environment could directly or indirectly cause or magnify losses related to certain transactions and access to and cost of adequate financing.
| 41 |
The Company’s anticipated primary sources of liquidity going forward are:
| ● | The purchase and sale agreements, which are allowing for a significant increase in loan balances; | |
| ● | The continued issuance of Notes to the general public through our second public Notes offering, which was declared effective by the SEC on September 29, 2015, and has been registered and declared effective in 44 states as of December 31, 2016. We began to advertise for our Notes offerings in March 2013 and received an aggregate of approximately $11,221 and $8,496 in Notes proceeds as of December 31, 2016 and 2015, respectively (net of redemptions). We anticipate continuing our capital raising efforts in 2017, focusing on the efforts that have proven fruitful; | |
| ● | Interest income and/or principal repayments related to the loans. The Company’s ability to fund its operations remains dependent upon the ability of our largest borrower, whose loan commitments represented 37% our total outstanding loan commitments as of both December 31, 2016 and 2015, to continue paying interest and/or principal. The risk of our largest customer not paying interest is mitigated in the short term by having an interest escrow, which had a balance of $541 and $267 as of December 31, 2016 and 2015, respectively. While a default by this large customer could impact our cash flow and/or profitability in the long term, we believe that, in the short term, a default might impact profitability, but not liquidity, as we are generally not receiving interest payments from the customer on the development loan portion of the customer’s balance while the customer is performing (this interest is being credited from the interest escrow). This customer is in good standing with us and is current on their construction loan interest payments. As of December 31, 2016, our next two largest customers make up 11% and 6% respectively of our loan commitments, with loans in Sarasota, Florida and Savannah, Georgia, respectively. As of December 31, 2015, our next two largest customers made up 22% and 6% respectively of our loan commitments, with loans in Sarasota, Florida and Columbia, South Carolina, respectively; | |
| ● | Funds from the sale of foreclosed assets, net of any debt which we might have on those assets; | |
| ● | Funds borrowed from our bank line (which was effective in January of 2017); and | |
| ● | Funds borrowed from affiliated creditors. |
We generated net income of $518 and $498 for the years ended December 31, 2016 and 2015, respectively and cash flow from operations of $1,568 and $1,322 for the same periods. At December 31, 2016 and 2015, we had cash on hand of $1,566 and $1,341, respectively, and our outstanding debt totaled $19,695 and $12,779, respectively, of which $7,322 and $3,683 was secured, respectively. The secured amount is from our purchase and sale agreements, which add liquidity and allow us to expand our business. As of December 31, 2016 and 2015, the amount that we have not loaned, but are obligated to potentially lend to our customers based on our agreements with them, was $11,503 and $7,332, respectively. Our availability on our line of credit from our members was $1,500 at both December 31, 2016 and 2015. Our members are not obligated to fund requests under our line of credit.
Our current plan is to expand the commercial lending program by using current liquidity and available funding (including funding from our Notes program).
To help manage our liquidity, we:
| ● | Do not offer demand deposits (for instance, a checking account). We manage the duration of our notes through the interest rates we offer at any time; | |
| ● | Fund loan requests with varying sources of capital, not just our Notes offering; and | |
| ● | Match our interest rate to our borrower to our cost of funds. |
We currently (or may in the future) use liquidity to:
| ● | make payments on other borrowings, including loans from affiliates and banks; | |
| ● | pay Notes on their scheduled due date and Notes that we are required to redeem early; | |
| ● | make interest payments on the Notes; and | |
| ● | to the extent we have remaining net proceeds and adequate cash on hand, fund any one or more of the following activities: |
| ● | to extend commercial construction loans to homebuilders to build single or multi-family homes or develop lots; | |
| ● | to make distributions to equity owners, including the preferred equity owners; | |
| ● | for working capital and other corporate purposes; | |
| ● | to purchase defaulted secured debt from financial institutions at a discount; | |
| ● | to purchase defaulted unsecured debt from suppliers to homebuilders at a discount and then secure it with real estate or other collateral; | |
| ● | to purchase real estate, in which we will operate our business, which occurred in February of 2017; and | |
| ● | to redeem Notes which we have decided to redeem prior to maturity. |
| 42 |
In the fourth quarter of 2016, the Company signed an agreement to buy the shell of an office building in which to operate, located near its current office in Jacksonville, Florida. The Company will close on this building purchase in the first quarter of 2017, and will need to fund the cost of the interior build out. The Company anticipates the total cost to be approximately $850, and intends to seek reasonable bank financing for a portion of that, if available.
Inflation, Interest Rates, and Housing Starts
Since we are in the housing industry, we are affected by factors that impact that industry. Housing starts impact our customers’ ability to sell their homes. Faster sales mean higher effective interest rates for us, as the recognition of fees we charge is spread over a shorter period. Slower sales mean lower effective interest rates for us. Slower sales are likely to increase the default rate we experience.
Housing inflation has a positive impact on our operations. When we lend initially, we are lending a percentage of a home’s expected value, based on historical sales. If those estimates prove to be low (in an inflationary market), the percentage we loaned of the value actually decreases, reducing potential losses on defaulted loans. The opposite is true in a deflationary housing price market. It is our opinion that values are average in many of the housing markets in the U.S. today, and our lending against these values is safer than loans made by financial institutions in 2006 to 2008.
Interest rates have several impacts on our business. First, rates affect housing (starts, home size, etc.). High long term interest rates may decrease housing starts, having the effects listed above. Higher interest rates will also affect our investors. We believe that there will be a spread between the rate our Notes yield to our investors and the rates the same investors could get on deposits at FDIC insured institutions. We also believe that the spread may need to widen if these rates rise. For instance, if we pay 7% above average CD rates when CDs are paying 0.5%, when CDs are paying 3%, we may have to have a larger than 7% difference. This may cause our lending rates, which are based on our cost of funds, to be uncompetitive. High interest rates may also increase builder defaults, as interest payments may become a higher portion of operating costs for the builder. Below is a chart showing three year U.S. treasury rates, which are being used by us here to approximate CD rates. Short term interest rates have risen slightly but are generally low historically.
Market Yield on U.S. Treasury Securities at 3-Year Constant Maturity
| Year | Yield | Year | Yield | Year | Yield | Year | Yield | Year | Yield | Year | Yield | |||||||||||||||||||||||
| 1970 | 7.29 | % | 1980 | 11.51 | % | 1990 | 8.26 | % | 2000 | 6.22 | % | 2010 | 1.11 | % | ||||||||||||||||||||
| 1971 | 5.66 | % | 1981 | 14.46 | % | 1991 | 6.82 | % | 2001 | 4.09 | % | 2011 | 0.75 | % | ||||||||||||||||||||
| 1962 | 3.47 | % | 1972 | 5.72 | % | 1982 | 12.93 | % | 1992 | 5.30 | % | 2002 | 3.10 | % | 2012 | 0.38 | % | |||||||||||||||||
| 1963 | 3.67 | % | 1973 | 6.96 | % | 1983 | 10.45 | % | 1993 | 4.44 | % | 2003 | 2.10 | % | 2013 | 0.54 | % | |||||||||||||||||
| 1964 | 4.03 | % | 1974 | 7.84 | % | 1984 | 11.92 | % | 1994 | 6.27 | % | 2004 | 2.78 | % | 2014 | 0.90 | % | |||||||||||||||||
| 1965 | 4.22 | % | 1975 | 7.50 | % | 1985 | 9.64 | % | 1995 | 6.25 | % | 2005 | 3.93 | % | 2015 | 1.02 | % | |||||||||||||||||
| 1966 | 5.23 | % | 1976 | 6.77 | % | 1986 | 7.06 | % | 1996 | 5.99 | % | 2006 | 4.77 | % | 2016 | 1.00 | % | |||||||||||||||||
| 1967 | 5.03 | % | 1977 | 6.68 | % | 1987 | 7.68 | % | 1997 | 6.10 | % | 2007 | 4.35 | % | ||||||||||||||||||||
| 1968 | 5.68 | % | 1978 | 8.29 | % | 1988 | 8.26 | % | 1998 | 5.14 | % | 2008 | 2.24 | % | ||||||||||||||||||||
| 1969 | 7.02 | % | 1979 | 9.70 | % | 1989 | 8.55 | % | 1999 | 5.49 | % | 2009 | 1.43 | % | ||||||||||||||||||||
(Source: Federal Reserve)
| 43 |
Housing prices are also generally correlated with housing starts, so that increases in housing starts usually coincide with increases in housing values, and the reverse is generally true. Below is a graph showing single family housing starts from 2000 through today.
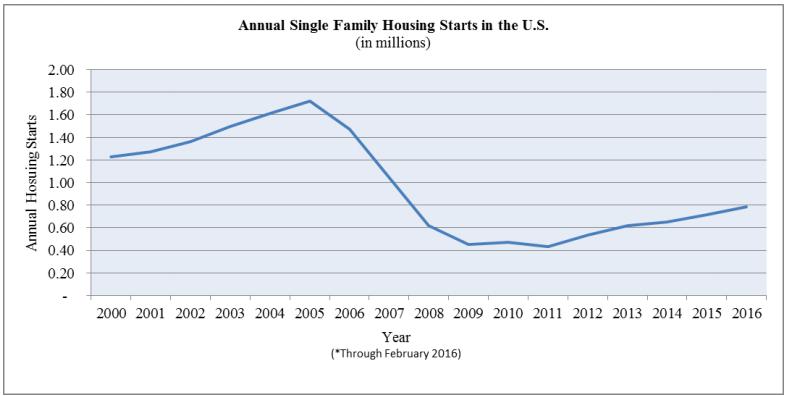
Source: U.S. Census Bureau
To date, changes in housing starts, CD rates, and inflation have not had a material impact on our business.
Off-Balance Sheet Arrangements
As of December 31, 2016, we had no off-balance sheet transactions, nor do we currently have any such arrangements or obligations
Recent Accounting Pronouncements
See Note 2 to our consolidated financial statements for a description of new or recent accounting pronouncements.
Subsequent Events
See Note 12 to our consolidated financial statements for subsequent events.
ITEM 7A. QUANTITATIVE AND QUALITATIVE DISCLOSURES ABOUT MARKET RISK
We are a smaller reporting company as defined by Rule 12b-2 of the Securities Exchange Act of 1934 and are not required to provide the information under this item.
ITEM 8. FINANCIAL STATEMENTS AND SUPPLEMENTARY DATA
The consolidated financial statements and supplementary data filed as part of this annual report are set forth beginning on page F-1 of this report.
ITEM 9. CHANGES IN AND DISAGREEMENTS WITH ACCOUNTANTS ON ACCOUNTING AND FINANCIAL DISCLOSURE.
None.
| 44 |
ITEM 9A. CONTROLS AND PROCEDURES
Disclosure Controls and Procedures
As of the end of the period covered by this report our Chief Executive Officer (our principal executive officer and principal financial officer) evaluated the effectiveness of the design and operation of our disclosure controls and procedures. Based upon, and as of the date of, the evaluation, our Chief Executive Officer (our principal executive officer and principal financial officer) concluded that the disclosure controls and procedures were effective as of the end of the period covered by this report to ensure that information required to be disclosed in the reports we file and submit under the Securities Exchange Act of 1934, as amended (the “Exchange Act”), is recorded, processed, summarized and reported as and when required. Disclosure controls and procedures include, without limitation, controls and procedures designed to ensure that information required to be disclosed by us in the reports we file and submit under the Exchange Act is accumulated and communicated to our management, including our Chief Executive Officer (our principal executive officer and principal financial officer), as appropriate to allow timely decisions regarding required disclosure.
Internal Control over Financial Reporting
Our management is responsible for establishing and maintaining adequate internal control over financial reporting (as defined in Exchange Act Rules 13a-15(f) and 15d-15(f)) for us. Our Chief Executive Officer evaluated, as of December 31, 2016, the effectiveness of our internal control over financial reporting. In making this assessment, our Chief Executive Officer used the criteria set forth by the Committee of Sponsoring Organizations of the Treadway Commission (“COSO”) in Internal Control—Integrated Framework (2013). Based on this evaluation, our Chief Executive Officer concluded that our internal control over financial reporting was effective as of December 31, 2016.
There have been no changes in our internal control over financial reporting that occurred during the year ended December 31, 2016 that have materially affected, or are reasonably likely to materially affect, our internal control over financial reporting.
During the fourth quarter of 2016, there was no information required to be disclosed in a report on Form 8-K which was not disclosed in a report on Form 8-K.
ITEM 10. DIRECTORS, EXECUTIVE OFFICERS AND CORPORATE GOVERNANCE
Managers and Executive Officers
Included below is certain information about our managers and executive officers. Pursuant to our operating agreement, which was adopted on March 29, 2012, Messrs. Wallach, Myrick, and Summers were appointed to initial terms of one year, two years and three years, respectively. Following the expiration of these initial terms, our managers are elected to three-year staggered terms. In March 2013, Mr. Wallach’s initial one-year term expired and he was elected to a three-year term expiring in March 2016 and a second three-year term expiring in March 2019. In March 2014, Mr. Summer’s initial one-year term expired and he was elected to a three-year term expiring in March 2017. In March 2015, Mr. Myrick’s initial three-year term expired and he was elected to a three-year term expiring in March, 2018. Also in March 2015, the members amended the operating agreement of the Company to add a third independent manager, Eric Rauscher. Mr. Rauscher was suggested by the members, recommended by the nominating and corporate governance committee of the Board of Managers, and was appointed by the Board of Managers to an initial three year term.
Daniel M. Wallach, age 49, is our Chief Executive Officer and a manager. He has been our Chief Executive Officer since our Company was founded and, prior to the addition of the two independent managers in March 2012, he was our sole manager. Mr. Wallach has over 25 years of experience in finance and real estate. Prior to his time with us, most recently, from May 2011 to July 2011, Mr. Wallach was an Executive Vice President for ProBuild Holdings, a building material supplier to homebuilders. Before that, from 1985 to 1989, and 1990 to April 2011, Mr. Wallach held various positions with 84 Lumber Company and affiliates, including Chief Financial Officer and Director. 84 Lumber is a building material supplier to homebuilders and was, at that time, one of our affiliates. At 84 Lumber, Mr. Wallach oversaw the company’s financial and accounting function, including all aspects related to financial reporting, debt financing, customer financing, customer credit and management information systems. Mr. Wallach was also intimately involved with the creation of 84 FINANCIAL, L.P., a finance company affiliated with and owned by 84 Lumber, which had investment objectives similar to ours. Mr. Wallach has also held operational and finance positions with a mortgage brokerage firm and a building contractor. He graduated from Washington and Jefferson College in Washington, Pennsylvania with a B.A. in Business Administration.
| 45 |
Barbara L. Harshman, age 41, is our Executive Vice President of Operations, a position to which she was appointed in July, 2015. She was hired in August 2012 as Vice President of Operations. Prior to joining the Company, from 2005 to 2012, Ms. Harshman worked in various positions in 84 Lumber Company’s lending operations, including Vice President of Lending. Ms. Harshman also worked as a credit manager for 84 Lumber during 2004 and 2005, where she managed a portfolio of $35,000,000 of unsecured debt owed by builders. Ms. Harshman graduated from Baylor University with a B.A. in Anthropology.
Bill Myrick, age 55, is one of the independent managers, to which he was elected in March 2012. He has been involved in lumber and building materials for over 35 years. In July 2012, Mr. Myrick became the Chief Executive Officer of American Builders Supply, a building material supplier to homebuilders, where he is responsible for all aspects of the management of that business. From January 2007 to July 2011, he held various executive officer positions with ProBuild Holdings, including, most recently, Chief Executive Officer, and was responsible for all aspects of the management of ProBuild’s business. From 1982 to January 2007, Mr. Myrick was with 84 Lumber Company, where he held positions including, most recently, Chief Operating Officer. Mr. Myrick served as a director of ProBuild from July 2010 to July 2011, and currently serves as a director of American Builders Supply, a position he has held since July 2012. He is a graduate of the Advanced Management Program from Harvard Business School.
Kenneth R. Summers, age 71, is one of the independent managers, to which he was elected in March 2012. Mr. Summers retired from United Bank, Inc. of Morgantown, West Virginia in July 2011, but continues to be associated with United Bank, a regional bank. Prior to retirement, he had been an Executive Vice President for United Bank since 2001. In that role he was responsible for the expansion and recognition of the bank’s franchise in north central West Virginia. Mr. Summers has over 30 years of experience as a community bank executive. He graduated from the University of Charleston with a B.S. in Accounting and Management.
Eric A. Rauscher, age 51, is one of the independent managers, to which he was elected in March 2015. Mr. Rauscher is a licensed insurance sales person and has worked in that industry since 1999. Prior to that, he spent over ten years as a field sales engineer. He graduated from Case Western Reserve University with a B.S. in Electrical Engineering and Applied Physics, with a minor in Economics.
Code of Ethics
Our Board of Managers adopted a Code of Ethics and Business Conduct on August 9, 2012 (the “Code of Ethics”), which contains general guidelines applicable to our employees, executive officers and the members of our Board of Managers with the purpose of promoting the following: (1) honest and ethical conduct, including the ethical handling of actual or apparent conflicts of interest between personal and professional relationships; (2) full, fair, accurate, timely and understandable disclosure in reports and documents that we file with, or submit to, the SEC and in other public communications made by us; (3) compliance with applicable laws and governmental rules and regulations; (4) the prompt internal reporting of violations of the Code of Ethics to an appropriate person or persons identified in the Code of Ethics; and (5) accountability for adherence to the Code of Ethics. A copy of the Code of Ethics is posted on our website at www.shepherdsfinance.com.
Audit Committee
Our Board of Managers has established a separately-designated audit committee, whose charter was adopted on August 9, 2012 and amended on October 30, 2013. The purpose of the audit committee is to oversee the Company’s accounting and financial reporting processes and the audit of the Company’s consolidated financial statements. Our audit committee consists of Messrs. Myrick and Summers, two of the independent managers. We have no “audit committee financial expert” (as such term is defined in Item 407(d)(5)(ii) of Regulation S-K). We believe the cost to retain a financial expert at this time is prohibitive. However, our Board of Managers believes that each member of the audit committee has sufficient knowledge and relevant background experience to serve on the audit committee.
ITEM 11. EXECUTIVE COMPENSATION
Executive Officer Compensation
Historically we have not compensated our Chief Executive Officer for services rendered to us. Starting in 2016, we began compensating him. We also compensate our Executive Vice President of Operations. This discussion describes our compensation philosophy and policies.
Objectives of Executive Officer Compensation Program
The objectives of our executive compensation program are to attract, retain, and motivate highly talented executives and to align each executive’s incentives with our short-term and long-term objectives, while maintaining a healthy and stable financial position. Specifically, our executive compensation program will be designed to accomplish the following goals and objectives:
| ● | maintain a compensation program that is equitable in our marketplace; | |
| ● | provide opportunities that integrate pay with the short-term and long-term performance goals; | |
| ● | encourage and reward achievement of strategic objectives, while properly balancing a controlled risk-taking behavior; and | |
| ● | maintain an appropriate balance between base salary and short-term and long-term incentive opportunity. |
| 46 |
Determining Executive Officer Compensation
The compensation committee of our Board of Managers is responsible for determining all aspects of our executive compensation program. The determination and assessment of executive compensation are primarily driven by the following three factors: (1) market data based on the compensation levels, programs and practices of other comparable companies for comparable positions, (2) our financial performance, and (3) executive officer performance. We believe these three factors provide a reasonably measurable assessment of executive performance in light of building value and creating a healthy financial position for us. We rely upon the judgment of the members of the compensation committee and not on rigid formulas or short-term changes in business performance in determining the amount and mix of compensation elements and whether each element provides the appropriate incentive and reward for performance that sustains and enhances our long-term growth.
Executive Officer Compensation Components
Base Salary
We provide each of our executive officers with a base salary to compensate such officer for services rendered throughout the year. Salaries are established annually based on the individual’s position, experience, performance, past and potential contribution to us, and level of responsibility, as well as our overall financial performance. No specific weighting is applied to any one factor considered, and the independent managers will use their judgment and expertise in determining appropriate salaries within the parameters of the compensation philosophy.
Membership Interests
As the beneficial owner of 96% of our outstanding common membership interests, Mr. Wallach’s interests are closely aligned with our success. As we hire additional executive officers, we may use membership interests in some fashion as part of their compensation.
The following table provides a summary of the compensation received by our current executives for last two completed fiscal years (Barbara L. Harshman became an executive officer in July 2015):
| Name and Position | Year | Salary | Bonus(1) | Stock Awards | Option Awards | Non-Equity Incentive Plan Compensation | Non-Qualified Deferred Compensation Earnings | All Other Compensation(2) | Total | |||||||||||||||||||||||||||
| Daniel M. Wallach, Chief Executive Officer |
2016 | $ | 150,458 | $ | 45,000 | $ | – | $ | – | $ | – | $ | – | $ | – | $ | 195,458 | |||||||||||||||||||
| 2015 | – | – | – | – | – | – | – | – | ||||||||||||||||||||||||||||
| Barbara L. Harshman, Executive Vice President of Operations | 2016 | 56,784 | 19,046 | – | – | – | – | 17,065 | 92,895 | |||||||||||||||||||||||||||
| 2015 | 50,000 | 18,261 | – | – | – | – | 14,316 | 82,577 | ||||||||||||||||||||||||||||
(1) Amounts in the Bonus column represent amounts paid in the period.
(2) Qualified Retirement Plan Contributions are shown here when funds are contributed to the plan.
Changes for 2017
Mr. Wallach’s compensation will not change in 2017, however some of the money he earned for bonuses and profit sharing in 2016 will be paid in 2017 and therefore show in the table above in year 2017. Ms. Harshman will receive a base of $60,800 for 2017. Both Mr. Wallach and Ms. Harshman will receive the same incentive package each had in 2016 for 2017, with the additional of a team bonus which will reward each between $0 and $12.
| 47 |
Board of Managers Compensation
The following table provides a summary of the compensation received by our managers for the year ended December 31, 2016:
| Name | Fees Earned or Paid in Cash | Stock Awards | Option Awards | Non-Equity Incentive Plan Compensation | Change in Pension Value and Nonqualified Deferred Compensation | All Other Compensation | Total | |||||||||||||||||||||
| Daniel M. Wallach | $ | – | $ | – | $ | – | $ | – | $ | – | $ | – | $ | – | ||||||||||||||
| Kenneth R. Summers | 38,000 | – | – | – | – | – | 38,000 | |||||||||||||||||||||
| Eric A. Rauscher | 38,000 | – | – | – | – | – | 38,000 | |||||||||||||||||||||
| William Myrick | 36,000 | – | – | – | – | – | 36,000 | |||||||||||||||||||||
| Total | $ | 112,000 | $ | 112,000 | ||||||||||||||||||||||||
We pay each of the independent managers a retainer of $30,000 per year. Our independent managers also receive fees of $2,000 for the first day and $1,200 for any additional days for meetings of the Board of Managers and committees attended in person, all or a portion of which may be allocated as reimbursement of expenses incurred in connection with attendance at meetings. The independent managers do not receive separate reimbursement of out-of-pocket expenses incurred in connection with attendance at meetings. Mr. Wallach receives no compensation for his services as a manager.
ITEM 12. SECURITY OWNERSHIP OF CERTAIN BENEFICIAL OWNERS AND MANAGEMENT AND RELATED STOCKHOLDER MATTERS
The following table sets forth the ownership of our outstanding membership interests as of December 31, 2016.
| Title of Class | Name and Address (1) of Owner | Number of Units (2) | Percent of Class | Dollar Value | Percentage of Total Equity | |||||||||||||
| Class A Common Units | Daniel M. Wallach and Joyce S. Wallach | 542.84 | 20.6 | % | 464,553 | 14 | % | |||||||||||
| Class A Common Units | S.K. Funding, LLC | 105.16 | 4.0 | % | 89,969 | 3 | % | |||||||||||
| Class A Common Units | 2007 Daniel M. Wallach Legacy Trust | 1,981.00 | 75.4 | % | 1,694,692 | 49 | % | |||||||||||
| Subtotal of common voting equity | 2,629.00 | 100 | % | 2,249,214 | 66 | % | ||||||||||||
| Series B Preferred Units | Hoskins Group | 11.50 | 100 | % | 1,150,000 | 34 | % | |||||||||||
| Total Members’ Capital | 3,399,214 | 100 | % | |||||||||||||||
(1) The address of Daniel and Joyce Wallach, and the 2007 Daniel M. Wallach Legacy is 450-106 State Rd. 13 N, Box 243, Saint Johns, FL, 32259. The address of S.K. Funding, LLC is 630 Maplewood Dr., Suite 100, Jupiter FL, 33458. The address of each Series B Preferred Units owner is PO Box 1287, McMurray, PA 15317.
(2) The units listed above are owned directly by the owners listed above. 96% of our outstanding common membership interests are beneficially owned by our Chief Executive Officer (who is also on our Board of Managers), Daniel M. Wallach, and his wife, Joyce S. Wallach.
| 48 |
ITEM 13. CERTAIN RELATIONSHIPS AND RELATED TRANSACTIONS, AND DIRECTOR INDEPENDENCE
Transactions with Affiliates
As previously described, on December 30, 2011, we obtained two demand loans from our members to finance our operations. These demand loans are collateralized by a lien against all of our assets and are senior in right of payment to the Notes. Daniel M. Wallach, our Chief Executive Officer (who is also on our Board of Managers), is the beneficial owner of 96% of our outstanding common membership interests.
The first loan, in the original principal amount of $1,250,000, is payable to Daniel M. Wallach and Joyce S. Wallach, as tenants by the entirety (the “Wallach Loan”). The second loan, in the original principal amount of $250,000, is payable to the 2007 Daniel M. Wallach Legacy Trust (the “Trust Loan”). The total outstanding balance on these loans as of both December 31, 2016 and 2015 was $0. We have had no borrowings on the lines in 2016 and 2015. Each of the demand loans is evidenced by a promissory note, is payable upon demand of the lender and bears an interest rate equal to the lender’s cost of funds (defined in the promissory note as the weighted average price paid by the lender on or in connection with all of its borrowed funds). Pursuant to each promissory note, the affiliate has the option of funding any amount up to the face amount of the note, in the lender’s sole and absolute discretion. As of December 31, 2016 and 2015, the interest rate was 4.19% and 4.20%, respectively, for both the Wallach Loan and the Trust Loan.
These transactions were approved by Mr. Wallach in his capacity as sole manager prior to the time we had independent managers. As the demand loans were made at rates equal to the lenders’ cost of funds, Mr. Wallach determined the terms of the demand loans to be as favorable to us as those generally available from unaffiliated third parties. The independent managers ratified and approved these transactions subsequent to the formation of the Board of Managers. See “Risk Factors - Risks Related to Conflicts of Interest - Our Chief Executive Officer (who is also one of our managers) will face conflicts of interest as a result of the secured affiliated loans made to us, which could result in actions that are not in the best interests of our Note holders.”
The Company has accepted new investments under the Notes program from employees, managers, members and relatives of managers and members, with $2,197,000 outstanding at December 31, 2016. The larger of these investments are detailed below:
(All dollar [$] amounts shown in table in thousands).
| Relationship
to Shepherd’s |
Amount invested as of | Weighted average interest rate as of | Interest
earned during the year ended December 31, |
|||||||||||||||||||
| Investor | Finance |
December 31, 2016 | December 31, 2015 | December 31, 2016 | 2016 | 2015 | ||||||||||||||||
| Bill Myrick | Independent Manager | $ | 304 | $ | 286 | 8.60 | % | $ | 24 | $ | 14 | |||||||||||
| Wallach Family Irrevocable Educational Trust | Trustee is Member | 200 | 200 | 9.00 | % | 16 | 15 | |||||||||||||||
| Eric Rauscher | Independent Manager | 600 | 600 | 7.13 | % | 45 | 37 | |||||||||||||||
| Joseph Rauscher | Parents of Independent Manager | 186 | 186 | 8.00 | % | 16 | 16 | |||||||||||||||
| Seven Kings Holdings, Inc. | Affiliate of Member | 500 | 500 | 9.00 | % | 38 | 35 | |||||||||||||||
Seven Kings Holdings, Inc. (“7Kings”) and affiliates
S. K. Funding, LLC, an affiliate of 7Kings, owns 4% of our common equity units. 7Kings also:
| ● | Is the lender to us on a $500,000 unsecured note. The note is a six month note due in February of 2017. | |
| ● | Is an investor in our unsecured Notes for $500,000. Those notes mature in February of 2019. | |
| ● | Is the purchaser in a purchase and sale agreement. As of December 31, 2016, the principal balance due under this agreement is $4,522,000 |
| 49 |
All three of the above relationships were entered into as an unrelated third party. The equity ownership interest was purchased as of December 31, 2015.
Hoskins Group Preferred Equity
The Series B cumulative preferred membership units of our membership interests were first issued to the Hoskins Group through a reduction in the SF Loan. They are redeemable only at the option of the Company or upon a change or control or liquidation. Ten units were issued for a total of $1,000,000. The Series B preferred units have a fixed value which is their purchase price, and preferred liquidation and distribution rights. Yearly distributions of 10% of the units’ value (providing profits are available) will be made quarterly. The Hoskins Group Series B cumulative preferred units are also used as collateral for that group’s loans to the Company. There is no liquid market for the Series B preferred equity instrument, so we can give no assurance as to our ability to generate any amount of proceeds from that collateral. In December of 2015, the Hoskins Group agreed to purchase 0.1 units of Series B cumulative preferred stock units upon each closing of a lot sale in the subdivisions in which we lend the Hoskins Group development funds. They purchased 0.1 Series B preferred units in December of 2015 and 1.4 Series B preferred units from 14 closings in 2016.
Affiliate Transaction Policy
Our operating agreement provides that any future transaction involving the Company and an affiliate must be approved by a majority vote of independent managers not otherwise interested in the transaction upon a determination of such independent managers that the transaction is on terms no less favorable to the Company than could be obtained from an independent third party. An approval pursuant to this policy shall be set forth in the minutes of the Company and shall include a description of the transaction approved. The responsibility for reviewing and approving affiliate transactions has been delegated to the nominating and corporate governance committee of our Board of Managers, which is comprised entirely of independent managers.
Pursuant to our operating agreement, we must provide the independent managers with access, at our expense, to our legal counsel or independent legal counsel, as needed.
Board of Managers Independence
We have no securities listed for trading on a national securities exchange or in an automated inter-dealer quotation system of a national securities association, which has requirements that a majority of our Board of Managers be independent. For purposes of complying with the disclosure requirements of the Securities and Exchange Commission, we have adopted the definition of independence used by the New York Stock Exchange (NYSE). Under the NYSE’s definition of independence, Messrs. Myrick, Summers, and Rauscher each meet the definition of “independent.”
ITEM 14. PRINCIPAL ACCOUNTING FEES AND SERVICES
During the years ended December 31, 2016 and 2015, Carr, Riggs & Ingram, LLC (“CRI”) served as our independent registered public accounting firm and provided certain other services. CRI has served as our independent registered public accounting firm since 2011. The audit committee currently anticipates that it will engage CRI as our independent registered public accounting firm to audit our consolidated financial statements as of and for the year ending December 31, 2017, subject to agreeing on fee estimates for the audit work. The audit committee reserves the right, however, to select a new independent registered public accounting firm at any time in the future in its discretion if it deems such decision to be in our best interests. Any such decision would be disclosed in accordance with applicable securities laws.
Our audit committee reviewed the audit and non-audit services performed by CRI, as well as the fees charged by CRI for such services. In its review of the non-audit service fees, the audit committee considered whether the provision of such services is compatible with maintaining the independence of CRI. The aggregate agreed-upon and billed fees for professional accounting services provided by CRI, including the audits of our annual consolidated financial statements, for the years ended December 31, 2016 and 2015, respectively, are set forth in the table below.
| 50 |
| 2016 | 2015 | |||||||
| Audit Fees | $ | 113,511 | $ | 102,873 | ||||
| Audit-Related Fees* | 4,028 | 12,314 | ||||||
| Tax Fees | – | – | ||||||
| All Other Fees | – | – | ||||||
| Total | $ | 117,539 | $ | 115,187 | ||||
* Public offering assistance
Pre-Approval Policies
The audit committee charter imposes a duty on the audit committee to pre-approve all auditing services performed for us by our independent auditors, as well as all permitted non-audit services (including the fees and terms thereof) in order to ensure that the provision of such services does not impair the auditor’s independence. In determining whether or not to pre-approve services, the audit committee considers whether the service is permissible under applicable SEC rules. The audit committee may, in its discretion, delegate one or more of its members the authority to pre-approve any services to be performed by our independent registered public accounting firm, provided such pre-approval is presented to the full audit committee at its next scheduled meeting.
ITEM 15. EXHIBITS, FINANCIAL STATEMENT SCHEDULES
| (a) | List of Documents Filed. | ||
| 1. | The list of the financial statements contained herein is set forth on page F-1 hereof. | ||
| 2. | All schedules for which provision is made in the applicable accounting regulations of the SEC are not required under the related instructions or are not applicable and therefore have been omitted. | ||
| 3. | The Exhibits filed in response to Item 601 of Regulation S-K are listed on the Exhibit Index below. | ||
| (b) | See (a)3 above. | ||
| (c) | See (a)2 above. | ||
| 51 |
EXHIBIT INDEX
The following exhibits are included in this Annual Report on Form 10-K for the year ended December 31, 2016 (and are numbered in accordance with Item 601 of Regulation S-K).
| Exhibit No. | Name of Exhibit | |
| 3.1 | Certificate of Conversion, incorporated by reference to Exhibit 3.1 to the Company’s Registration Statement on Form S-1, filed on May 11, 2012, Commission File No. 333-181360 | |
| 3.2 | Certificate of Formation, incorporated by reference to Exhibit 3.2 to the Company’s Registration Statement on Form S-1, filed on May 11, 2012, Commission File No. 333-181360 | |
| 3.3 | Amended and Restated Operating Agreement, incorporated by reference to Exhibit 3.3 to the Company’s Registration Statement on Form S-1, filed on May 11, 2012, Commission File No. 333-181360 | |
| 3.4 | Amendment No. 1 to the Amended and Restated Limited Liability Company Agreement of Shepherd’s Finance, LLC, dated December 31, 2014, incorporated by reference to Exhibit 10.2 to the Company’s Form 8-K, filed on January 6, 2015, Commission File No. 333-181360 | |
| 3.5 | Amendment No. 2 to the Amended and Restated Limited Liability Company Agreement of Shepherd’s Finance, LLC, dated as of March 30, 2015, incorporated by reference to Exhibit 10.1 to the Company’s Form 8-K, filed on March 30, 2015, Commission File No. 333-181360 | |
| 3.6 | Amendment No. 3 to the Amended and Restated Limited Liability Company Agreement of Shepherd’s Finance, LLC, dated as of December 28, 2015, incorporated by reference to Exhibit 10.3 to the Company’s Form 8-K, filed on December 31, 2015, Commission File No. 333-203707 | |
| 4.1 | Indenture Agreement (including Form of Note) dated October 4, 2012 | |
| 10.1 | Mortgage dated July 21, 2010 between Investor’s Mark Acquisitions, LLC, Mark L. Hoskins, Louis E. Menichi, Jennie Menichi, Erma Grego, and Anna Marie Corrado, incorporated by reference to Exhibit 10.1 to the Company’s Registration Statement on Form S-1, filed on May 11, 2012, Commission File No. 333-181360 | |
| 10.2 | Subordinated Promissory Note dated December 29, 2010 between 84 FINANCIAL, L.P. and Investor’s Mark Acquisitions, LLC, incorporated by reference to Exhibit 10.2 to the Company’s Registration Statement on Form S-1, filed on May 11, 2012, Commission File No. 333-181360 | |
| 10.3 | Credit Agreement dated December 30, 2011 by and between Benjamin Marcus Homes, L.L.C., Investor’s Mark Acquisitions, LLC and Mark L. Hoskins, incorporated by reference to Exhibit 10.3 to the Company’s Registration Statement on Form S-1, filed on May 11, 2012, Commission File No. 333-181360 | |
| 10.4 | Open-End Mortgage dated December 30, 2011 between Benjamin Marcus Homes, L.L.C. and Shepherd’s Finance, LLC, related to the Hamlets of Springdale, incorporated by reference to Exhibit 10.4 to the Company’s Registration Statement on Form S-1, filed on May 11, 2012, Commission File No. 333-181360 | |
| 10.5 | Open-End Mortgage dated December 30, 2011 between Investor’s Mark Acquisitions, LLC and Shepherd’s Finance, LLC, related to the Tuscany Subdivision, incorporated by reference to Exhibit 10.5 to the Company’s Registration Statement on Form S-1, filed on May 11, 2012, Commission File No. 333-181360 | |
| 10.6 | Commercial Guaranty dated December 30, 2011 by Mark L. Hoskins, Investor’s Mark Acquisitions, LLC, and Benjamin Marcus Homes, L.L.C. in favor of Shepherd’s Finance, LLC, incorporated by reference to Exhibit 10.6 to the Company’s Registration Statement on Form S-1, filed on May 11, 2012, Commission File No. 333-181360 | |
| 10.7 | Amended and Restated Commercial Pledge Agreement dated December 30, 2011 by Investor’s Mark Acquisitions, LLC and Benjamin Marcus Homes, L.L.C. in favor of Shepherd’s Finance, LLC, incorporated by reference to Exhibit 10.7 to the Company’s Registration Statement on Form S-1, filed on May 11, 2012, Commission File No. 333-181360 | |
| 10.8 | Assignment, Assumption, Amendment, and Restatement of Mortgage dated December 30, 2011 between 84 FINANCIAL, L.P., Shepherd’s Finance, LLC, and Investor’s Mark Acquisitions, LLC, incorporated by reference to Exhibit 10.8 to the Company’s Registration Statement on Form S-1, filed on May 11, 2012, Commission File No. 333-181360 | |
| 10.9 | Assignment, Assumption, and Amendment of Promissory Note dated December 30, 2011 between 84 FINANCIAL, L.P., Shepherd’s Finance, LLC, and Investor’s Mark Acquisitions, LLC, incorporated by reference to Exhibit 10.9 to the Company’s Registration Statement on Form S-1, filed on May 11, 2012, Commission File No. 333-181360 | |
| 10.10 | Promissory Note dated December 30, 2011 from Shepherd’s Finance, LLC to 2007 Daniel M. Wallach Legacy Trust, incorporated by reference to Exhibit 10.10 to the Company’s Registration Statement on Form S-1, filed on May 11, 2012, Commission File No. 333-181360 | |
| 10.11 | Promissory Note dated December 30, 2011 from Shepherd’s Finance, LLC to Daniel M. Wallach and Joyce S. Wallach, incorporated by reference to Exhibit 10.11 to the Company’s Registration Statement on Form S-1, filed on May 11, 2012, Commission File No. 333-181360 | |
| 10.12 | Commercial Pledge Agreement dated December 30, 2011 by Shepherd’s Finance, LLC in favor of 2007 Daniel M. Wallach Legacy Trust and Daniel M. Wallach and Joyce S. Wallach, incorporated by reference to Exhibit 10.12 to the Company’s Registration Statement on Form S-1, filed on May 11, 2012, Commission File No. 333-181360 | |
| 10.13 | Amended and Restated Subordination of Mortgage dated December 31, 2011 between Investor’s Mark Acquisitions, LLC, Mark L. Hoskins, Louis E. Menichi, Jennie Menichi, Erma Grego, Anna Marie Corrado, and Shepherd’s Finance, LLC, incorporated by reference to Exhibit 10.13 to the Company’s Registration Statement on Form S-1, filed on May 11, 2012, Commission File No. 333-181360 |
| 52 |
| 10.14 | Amendment of Promissory Note dated January 31, 2012 between Shepherd’s Finance, LLC and Investor’s Mark Acquisitions, LLC, incorporated by reference to Exhibit 10.14 to the Company’s Registration Statement on Form S-1, filed on May 11, 2012, Commission File No. 333-181360 | |
| 10.15 | First Amendment to Credit Agreement by and between Shepherd’s Finance, LLC, Benjamin Marcus Homes, L.L.C., Investor’s Mark Acquisitions, LLC and Mark. L. Hoskins, dated December 26, 2012, incorporated by reference to Exhibit 10.15 to the Company’s Annual Report on Form 10-K for the year ended December 31, 2012, filed on March 8, 2013, Commission File No. 333-181360 | |
| 10.16 | Subordination of Mortgage dated September 27, 2013 between Benjamin Marcus Homes, LLC, Shepherd’s Finance, LLC, and United Bank, Inc. | |
| 10.17 | Sixth Amendment to Credit Agreement by and between Shepherd’s Finance, LLC, Benjamin Marcus Homes, LLC, Investor’s Mark Acquisitions, LLC, and Mark L. Hoskins, dated March 27, 2014, incorporated by reference to Exhibit 10.1 to the Company’s Form 8-K, filed on March 27, 2014, Commission File No. 333-181360 | |
| 10.18 | Credit Agreement dated June 20, 2014 by and between Shepherd’s Finance, LLC, Southeastern Land Developers, LLC, and Charles R. Rich, incorporated by reference to Exhibit 10.1 to the Company’s Form 8-K, filed on June 26, 2014, Commission File No. 333-181360 | |
| 10.19 | Promissory Note dated June 20, 2014 from Southeastern Land Developers, LLC to Shepherd’s Finance, LLC, incorporated by reference to Exhibit 10.2 to the Company’s Form 8-K, filed on June 26, 2014, Commission File No. 333-181360 | |
| 10.20 | Deed to Secure Debt dated June 20, 2014 between Shepherd’s Finance, LLC and Southeastern Land Developers, LLC, incorporated by reference to Exhibit 10.3 to the Company’s Form 8-K, filed on June 26, 2014, Commission File No. 333-181360 | |
| 10.21 | Loan Purchase and Sale Agreement dated December 24, 2014 between Shepherd’s Finance, LLC and 1st Financial Bank USA, incorporated by reference to Exhibit 10.1 to the Company’s Form 8-K, filed on December 29, 2014, Commission File No. 333-181360 | |
| 10.22 | Series B Cumulative Redeemable Preferred Unit Purchase Agreement dated December 31, 2014 between Shepherd’s Finance, LLC and Investor’s Mark Acquisitions, LLC, incorporated by reference to Exhibit 10.1 to the Company’s Form 8-K, filed on January 6, 2015, Commission File No. 333-181360 | |
| 10.23 | Seventh Amendment to Credit Agreement by and between Shepherd’s Finance, LLC, Benjamin Marcus Homes, LLC, Investor’s Mark Acquisitions, LLC, and Mark L. Hoskins, dated December 31, 2014, incorporated by reference to Exhibit 10.3 to the Company’s Form 8-K, filed on January 6, 2015, Commission File No. 333-181360 | |
| 10.24 | Loan Purchase and Sale Agreement dated as of April 28, 2015 between Shepherd’s Finance, LLC and Seven Kings Holdings, Inc., incorporated by reference to Exhibit 10.1 to the Company’s Form 8-K, filed on May 5, 2015, Commission File No. 333-181360 | |
| 10.25 | Second Amendment to the Loan Purchase and Sale Agreement by and between Shepherd’s Finance, LLC and 1st Financial Bank USA, dated August 6, 2015, incorporated by reference to Exhibit 10.1 to the Company’s Form 8-K, filed August 12, 2015, Commission File No. 333-181360 | |
| 10.26 | Construction Loan Agreement by and between Shepherd’s Finance, LLC and Eclipse Partners II, LLC, dated November 4, 2015, incorporated by reference to Exhibit 10.1 to the Company’s Form 8-K, filed November 9, 2015, Commission File No. 333-203707 | |
| 10.27 | Promissory Note from Eclipse Partners II, LLC to Shepherd’s Finance, LLC, dated November 4, 2015, incorporated by reference to Exhibit 10.2 to the Company’s Form 8-K, filed November 9, 2015, Commission File No. 333-203707 | |
| 10.28 | Mortgage and Security Agreement by and between Shepherd’s Finance, LLC and Eclipse Partners II, LLC, dated November 4, 2015, incorporated by reference to Exhibit 10.3 to the Company’s Form 8-K, filed November 9, 2015, Commission File No. 333-203707 | |
| 10.29 | First Amendment to the Loan Purchase and Sale Agreement by and between Shepherd’s Finance, LLC and S.K. Funding, Inc., dated November 19, 2015, incorporated by reference to Exhibit 10.1 to the Company’s Form 8-K, filed on November 24, 2015, Commission File No. 333-203707 | |
| 10.30 | Construction Loan Agreement by and between Shepherd’s Finance, LLC and Eclipse Partners II, LLC, dated December 9, 2015, incorporated by reference to Exhibit 10.1 to the Company’s Form 8-K, filed December 15, 2015, Commission File No. 333-203707 | |
| 10.31 | Promissory Note from Eclipse Partners II, LLC to Shepherd’s Finance, LLC, dated December 9, 2015, incorporated by reference to Exhibit 10.2 to the Company’s Form 8-K, filed December 15, 2015, Commission File No. 333-203707 | |
| 10.32 | Builder Deposit Agreement by and between Shepherd’s Finance, LLC and Eclipse Partners II, LLC, dated December 9, 2015, incorporated by reference to Exhibit 10.3 to the Company’s Form 8-K, filed December 15, 2015, Commission File No. 333-203707 | |
| 10.33 | Mortgage and Security Agreement by and between Shepherd’s Finance, LLC and Eclipse Partners II, LLC, dated December 9, 2015, incorporated by reference to Exhibit 10.4 to the Company’s Form 8-K, filed December 15, 2015, Commission File No. 333-203707 | |
| 10.34 | Series B Cumulative Preferred Unit Purchase Agreement by and between Shepherd’s Finance, LLC and Investor’s Mark Acquisitions, LLC, dated December 28, 2015, incorporated by reference to Exhibit 10.1 to the Company’s Form 8-K, filed on December 31, 2015, Commission File No. 333-203707.10.38Tenth Amendment to Credit Agreement by and between Shepherd’s Finance, LLC, Benjamin Marcus Homes, L.L.C., and Investor’s Mark Acquisitions, LLC, dated December 28, 2015, incorporated by reference to Exhibit 10.2 to the Company’s Form 8-K, filed on December 31, 2015, Commission File No. 333-203707 |
| 53 |
| 10.35 | Third Amendment to the Loan Purchase and Sale Agreement by and between Shepherd’s Finance, LLC and 1st Financial Bank USA, dated as of January 12, 2015, incorporated by reference to Exhibit 10.1 to the Company’s Form 8-K, filed on January 19, 2016, Commission File No. 333-203707 | |
| 10.36 | Construction Loan Agreement between Shepherd’s Finance, LLC and Lex Partners II, LLC, dated February 19, 2016, incorporated by reference to Exhibit 10.1 to the Company’s Form 8-K, filed on February 25, 2016, Commission File No. 333-203707 | |
| 10.37 | Promissory Note from Lex Partners II, LLC, dated February 19, 2016, incorporated by reference to Exhibit 10.2 to the Company’s Form 8-K, filed on February 25, 2016, Commission File No. 333-203707 | |
| 10.38 | Mortgage and Security Agreement between Shepherd’s Finance, LLC and Lex Partners II, LLC, dated February 19, 2016, incorporated by reference to Exhibit 10.3 to the Company’s Form 8-K, filed on February 25, 2016, Commission File No. 333-203707 | |
| 10.39 | Second Amendment to the Loan Purchase and Sale Agreement between Shepherd’s Finance, LLC and S.K. Funding, LLC, dated as of February 19, 2016, incorporated by reference to Exhibit 10.4 to the Company’s Form 8-K, filed on February 25, 2016, Commission File No. 333-203707 | |
| 10.40 | Deed in Lieu of Foreclosure Agreement between Shepherd’s Finance, LLC and Eclipse Partners II, LLC, dated June 30, 2016, incorporated by reference to Exhibit 10.1 to the Company’s Form 8-K, filed on July 7, 2016, Commission File No. 333-203707 | |
| 10.41 | Option to Purchase between Shepherd’s Finance, LLC and Eclipse Partners II, LLC, dated June 30, 2016, incorporated by reference to Exhibit 10.2 to the Company’s Form 8-K, filed on July 7, 2016, Commission File No. 333-203707 | |
| 10.42 | Assignment of Mortgage from Shepherd’s Finance, LLC to S.K. Funding, LLC, dated June 30, 2016, incorporated by reference to Exhibit 10.3 to the Company’s Form 8-K, filed on July 7, 2016, Commission File No. 333-203707 | |
| 10.43 | Agreement between Shepherd’s Finance, LLC, Lex Partners II, LLC, and 1333 Vista Drive, LLC, effective as of June 30, 2016, incorporated by reference to Exhibit 10.4 to the Company’s Form 8-K, filed on July 7, 2016, Commission File No. 333-203707 | |
| 10.44 | Interest Escrow Account Agreement between Shepherd’s Finance, LLC and 1333 Vista Drive, LLC, dated June 30, 2016, incorporated by reference to Exhibit 10.5 to the Company’s Form 8-K, filed on July 7, 2016, Commission File No. 333-203707 | |
| 10.45 | Amendment to Builder Deposit Agreement between Shepherd’s Finance, LLC, Eclipse Partners II, LLC, and Lex Partners II, LLC, dated June 30, 2016, incorporated by reference to Exhibit 10.6 to the Company’s Form 8-K, filed on July 7, 2016, Commission File No. 333-203707 | |
| 10.46 | Tenth Amendment to Credit Agreement by and between Shepherd’s Finance, LLC, Benjamin Marcus Homes, L.L.C., and Investor’s Mark Acquisitions, LLC, dated as of July 20, 2016, incorporated by reference to Exhibit 10.1 to the Company’s Form 8-K, filed on July 25, 2016, Commission File No. 333-203707 | |
| 10.47 | Loan Purchase and Sale Agreement between Shepherd’s Finance, LLC and Builder Finance, Inc., dated as of February 6, 2017, incorporated by reference to Exhibit 10.1 to the Company’s Form 8-K, filed on February 10, 2017, Commission File No. 333-203707 | |
| 10.48 | Confirmation Agreement between Shepherd’s Finance, LLC, 1st Financial Bank USA, and Builder Finance, Inc., dated as of February 6, 2017, incorporated by reference to Exhibit 10.2 to the Company’s Form 8-K, filed on February 10, 2017, Commission File No. 333-203707 | |
| 21.1 | Subsidiaries of Shepherd’s Finance, LLC, incorporated by reference to Exhibit 21.1 to the Company’s Annual Report on Form 10-K for the year ended December 31, 2012, filed on March 8, 2013, Commission File No. 333-181360 | |
| 31.1* | Certification of Principal Executive Officer, pursuant to Section 302 of the Sarbanes-Oxley Act of 2002 | |
| 31.2* | Certification of Principal Financial Officer, pursuant to Section 302 of the Sarbanes-Oxley Act of 2002 | |
| 32.1* | Certification of Principal Executive Officer and Principal Financial Officer, pursuant to 18 U.S.C. Section 1350, as created by Section 906 of the Sarbanes-Oxley Act of 2002 |
| 101.INS** | XBRL Instance Document | |
| 101.SCH** | XBRL Schema Document | |
| 101.CAL** | XBRL Calculation Linkbase Document | |
| 101.DEF** | XBRL Definition Linkbase Document | |
| 101.LAB** | XBRL Label Linkbase Document | |
| 101.PRE** | XBRL Presentation Linkbase Document |
* Filed herewith.
**Pursuant to Regulation 406T of Regulation S-T, these Interactive data files are deemed not filed or part of a registration statement or prospectus for purposes of Section 11 or 12 of the Securities Act of 1933, as amended, or Section 18 of the Securities Exchange Act of 1934, as amended, and are otherwise not subject to liability.
| 54 |
Pursuant to the requirements of the Securities Exchange Act of 1934, the Registrant has duly caused this report to be signed on its behalf by the undersigned thereunto duly authorized.
| SHEPHERD’S FINANCE, LLC | ||
| (Registrant) | ||
| Dated: March 2, 2017 | By: | /s/ Daniel M. Wallach |
| Daniel M. Wallach | ||
| Chief Executive Officer and Manager | ||
Pursuant to the requirements of the Securities Exchange Act of 1934, this report has been signed below by the following persons on behalf of the registrant and in the capacities and on the dates indicated:
| Signature | Title | Date | ||
| /s/ Daniel M. Wallach | Chief Executive Officer and Manager | March 2, 2017 | ||
| Daniel M. Wallach | (Principal Executive Officer, Principal Financial Officer, and Principal Accounting Officer) | |||
| /s/ Bill Myrick | Manager | March 2, 2017 | ||
| Bill Myrick | ||||
| /s/ Kenneth Summers | Manager | March 2, 2017 | ||
| Kenneth Summers | ||||
| /s/ Eric Rauscher | Manager | March 2, 2017 | ||
| Eric Rauscher |
| 55 |
INDEX TO FINANCIAL STATEMENTS
| Audited Consolidated Financial Statements as of and for the years ended December 31, 2016 and 2015: | ||
| Report of Independent Registered Public Accounting Firm on Financial Statements | F-2 | |
| Consolidated Balance Sheets as of December 31, 2016 and 2015 | F-3 | |
| Consolidated Statements of Operations for the Years Ended December 31, 2016 and 2015 | F-4 | |
| Consolidated Statements of Changes in Members’ Capital for the Years Ended December 31, 2016 and 2015 | F-5 | |
| Consolidated Statements of Cash Flows for the Years Ended December 31, 2016 and 2015 | F-6 | |
| Notes to Consolidated Financial Statements | F-7 |
| F-1 |
REPORT OF INDEPENDENT REGISTERED PUBLIC ACCOUNTING FIRM
To the Board of Managers and
Members of Shepherd’s Finance, LLC
We have audited the accompanying consolidated balance sheets of Shepherd’s Finance, LLC and affiliate (the “Company”) as of December 31, 2016 and 2015, and the related consolidated statements of operations, changes in members’ capital, and cash flows for each of the years in the two-year period ended December 31, 2016. The Company’s management is responsible for these consolidated financial statements. Our responsibility is to express an opinion on these consolidated financial statements based on our audits.
We conducted our audits in accordance with the standards of the Public Company Accounting Oversight Board (United States). Those standards require that we plan and perform the audit to obtain reasonable assurance about whether the financial statements are free of material misstatement. The Company is not required to have, nor were we engaged to perform, an audit of its internal control over financial reporting. Our audit included consideration of internal control over financial reporting as a basis for designing audit procedures that are appropriate in the circumstances, but not for the purpose of expressing an opinion on the effectiveness of the Company’s internal control over financial reporting. Accordingly, we express no such opinion. An audit also includes examining, on a test basis, evidence supporting the amounts and disclosures in the financial statements, assessing the accounting principles used and significant estimates made by management, as well as evaluating the overall financial statement presentation. We believe that our audits provide a reasonable basis for our opinion.
In our opinion, the consolidated financial statements referred to above present fairly, in all material respects, the consolidated financial position of the Company as of December 31, 2016 and 2015, and the results of their operations and their cash flows for each of the years in the two-year period ended December 31, 2016, in conformity with accounting principles generally accepted in the United States of America.
| /s/ Carr, Riggs & Ingram, LLC | |
| March 2, 2017 | |
| Enterprise, Alabama |
| F-2 |
Consolidated Balance Sheets
As of December 31, 2016 and 2015
| (in thousands of dollars) | 2016 | 2015 | ||||||
| Assets | ||||||||
| Cash and cash equivalents | $ | 1,566 | $ | 1,341 | ||||
| Accrued interest on loans | 280 | 146 | ||||||
| Loans receivable, net | 20,091 | 14,060 | ||||||
| Foreclosed assets | 2,798 | 965 | ||||||
| Other assets | 151 | 14 | ||||||
| Total assets | $ | 24,886 | $ | 16,526 | ||||
| Liabilities and Members’ Capital | ||||||||
| Customer interest escrow | $ | 812 | $ | 498 | ||||
| Accounts payable and accrued expenses | 1,363 | 539 | ||||||
| Notes payable secured | 7,322 | 3,683 | ||||||
| Notes payable unsecured, net of deferred financing costs | 11,962 | 8,497 | ||||||
| Due to preferred equity member | 28 | 25 | ||||||
| Total liabilities | 21,487 | 13,242 | ||||||
| Commitments and Contingencies (Notes 4 and 8) | ||||||||
| Series B preferred equity | 1,150 | 1,010 | ||||||
| Class A common equity | 2,249 | 2,274 | ||||||
| Members’ capital | 3,399 | 3,284 | ||||||
| Total liabilities and members’ capital | $ | 24,886 | $ | 16,526 | ||||
The accompanying notes are an integral part of these consolidated financial statements.
| F-3 |
Consolidated Statements of Operations
For the years ended December 31, 2016 and 2015
| (in thousands of dollars) | 2016 | 2015 | ||||||
| Net Interest Income | ||||||||
| Interest and fee income on loans | $ | 3,640 | $ | 1,863 | ||||
| Interest expense: | ||||||||
| Interest related to secured borrowings | 570 | 125 | ||||||
| Interest related to unsecured borrowings | 1,178 | 739 | ||||||
| Interest expense | 1,748 | 864 | ||||||
| Net interest income | 1,892 | 999 | ||||||
| Less: Loan loss provision | 16 | 59 | ||||||
| Net interest income after loan loss provision | 1,876 | 940 | ||||||
| Non-Interest Income | ||||||||
| Gain from foreclosure of assets | 44 | 105 | ||||||
| Gain from sale of foreclosed assets | 28 | – | ||||||
| Income | 1,948 | 1,045 | ||||||
| Non-Interest Expense | ||||||||
| Selling, general and administrative | 1,319 | 547 | ||||||
| Impairment loss on foreclosed assets | 111 | – | ||||||
| Total non-interest expense | 1,430 | 547 | ||||||
| Net income | $ | 518 | $ | 498 | ||||
| Earned distribution to preferred equity holder | 107 | 100 | ||||||
| Net income attributable to common equity holders | $ | 411 | $ | 398 | ||||
The accompanying notes are an integral part of these consolidated financial statements.
| F-4 |
Consolidated Statements of Changes In Members’ Capital
For the years ended December 31, 2016 and 2015
| (in thousands of dollars) | 2016 | 2015 | ||||||
| Members’ capital, beginning balance | $ | 3,284 | $ | 3,057 | ||||
| Net income | 518 | 498 | ||||||
| Contributions from members (preferred) | 140 | 10 | ||||||
| Earned distributions to preferred equity holder | (107 | ) | (100 | ) | ||||
| Distributions to common equity holders | (436 | ) | (181 | ) | ||||
| Members’ capital, ending balance | $ | 3,399 | $ | 3,284 | ||||
The accompanying notes are an integral part of these consolidated financial statements.
| F-5 |
Consolidated Statements of Cash Flows
For the years ended December 31, 2016 and 2015
| (in thousands of dollars) | 2016 | 2015 | ||||||
| Cash flows from operations | ||||||||
| Net income | $ | 518 | $ | 498 | ||||
| Adjustments to reconcile net income to net cash provided by (used in) operating activities | ||||||||
| Amortization of deferred financing costs | 267 | 229 | ||||||
| Provision for loan losses | 16 | 59 | ||||||
| Net loan origination fees deferred (earned) | 45 | 190 | ||||||
| Change in deferred origination expense | (55 | ) | – | |||||
| Impairment of foreclosed assets | 111 | – | ||||||
| Gain from sale of foreclosed assets | (28 | ) | – | |||||
| Gain on foreclosure of assets | (44 | ) | (105 | ) | ||||
| Net change in operating assets and liabilities | ||||||||
| Other assets | (137 | ) | (1 | ) | ||||
| Accrued interest on loans | (263 | ) | (68 | ) | ||||
| Customer interest escrow | 314 | 180 | ||||||
| Accounts payable and accrued expenses | 824 | 340 | ||||||
| Net cash provided by (used in) operating activities | 1,568 | 1,322 | ||||||
| Cash flows from investing activities | ||||||||
| Loan originations and principal collections, net | (7,677 | ) | (6,987 | ) | ||||
| Investment in foreclosed assets | (566 | ) | (85 | ) | ||||
| Proceeds from sale of foreclosed assets | 463 | – | ||||||
| Net cash provided by (used in) investing activities | (7,780 | ) | (7,072 | ) | ||||
| Cash flows from financing activities | ||||||||
| Contributions from members (preferred) | 140 | 10 | ||||||
| Distributions to members | (540 | ) | (256 | ) | ||||
| Proceeds from secured notes payable | 8,882 | 5,314 | ||||||
| Repayments of secured notes payable | (5,243 | ) | (1,631 | ) | ||||
| Proceeds from unsecured notes payable | 5,524 | 4,337 | ||||||
| Redemptions/repayments of unsecured notes payable | (2,247 | ) | (1,043 | ) | ||||
| Deferred financing costs paid | (79 | ) | (198 | ) | ||||
| Net cash provided by (used in) financing activities | 6,437 | 6,533 | ||||||
| Net increase (decrease) in cash and cash equivalents | 225 | 783 | ||||||
| Cash and cash equivalents | ||||||||
| Beginning of period | 1,341 | 558 | ||||||
| End of period | $ | 1,566 | $ | 1,341 | ||||
| Supplemental disclosure of cash flow information | ||||||||
| Cash paid for interest | $ | 1,002 | $ | 326 | ||||
| Non-cash investing and financing activities | ||||||||
| Earned but not paid distribution of preferred equity holder | $ | 28 | $ | 25 | ||||
| Foreclosed assets acquired in the settlement of loans | $ | 1,813 | $ | 965 | ||||
| Accrued interest reduction due to foreclosure | $ | 130 | $ | – | ||||
| Net change in loan origination fees due to foreclosure | $ | (55 | ) | $ | – | |||
The accompanying notes are an integral part of these consolidated financial statements.
| F-6 |
Notes to Consolidated Financial Statements
Information presented throughout these notes to the consolidated financial statements is in thousands of dollars.
1. Description of Business
Shepherd’s Finance, LLC and subsidiary (the “Company”, “we” or “our”) was originally formed as a Pennsylvania limited liability company on May 10, 2007. We are the sole member of a consolidating subsidiary, 84 REPA, LLC. The Company operated pursuant to an operating agreement by and among Daniel M. Wallach and the members of the Company from its inception through March 29, 2012, at which time it adopted an amended and restated operating agreement.
The Company lends money to residential homebuilders to construct single family homes, to develop undeveloped land into residential building lots, and to purchase and improve for sale older homes. The loans are extended to residential homebuilders and, as such, are commercial loans. We lend in fifteen states as of December 31, 2016.
2. Summary of Significant Accounting Policies
Principles of Consolidation
These consolidated financial statements include the consolidated accounts of the Company’s subsidiary and reflect all adjustments (all of which are normal recurring accruals) which are, in the opinion of management, necessary for a fair presentation of the consolidated financial position, operating results, and cash flows for the periods. All intercompany balances and transactions have been eliminated.
Use of Estimates
The preparation of consolidated financial statements in conformity with accounting principles generally accepted in the United States of America (“U.S. GAAP”) requires management to make estimates and assumptions that affect the reported amounts of assets and liabilities and disclosure of contingent assets and liabilities at the date of the consolidated financial statements and the reported amounts of revenues and expenses during the reporting period. Actual results could differ from those estimates. It is reasonably possible that market conditions could deteriorate, which could materially affect our consolidated financial position, results of operations and cash flows. Among other effects, such changes could result in the need to increase the amount of our allowance for loan losses and impair our foreclosed assets.
Operating Segments
Financial Accounting Standards Board (“FASB”) Accounting Standards Codification (“ASC”) Topic 280, Segment Reporting, requires that the Company report financial and descriptive information about reportable segments and how these segments were determined. We determine the allocation of resources and performance of business units based on operating income, net income and operating cash flows. Segments are identified and aggregated based on products sold or services provided. Based on these factors, we have determined that the Company’s operations are in one segment, commercial lending.
Revenue Recognition
Interest income generally is recognized on an accrual basis. The accrual of interest is generally discontinued on all loans past due 90 days or more. All interest accrued but not collected for loans that are placed on nonaccrual or charged off is reversed against interest income, unless management believes that the accrued interest is recoverable through liquidation of collateral. Interest received on nonaccrual loans is applied against principal. Interest on accruing impaired loans is recognized as long as such loans do not meet the criteria for nonaccrual status.
We generally charge a loan fee funded by loan proceeds at the inception of each loan. This fee is recognized on a straight-line basis over the expected life of the loan, which approximates the interest method.
We defer the cost of loan origination at loan inception and recognize this cost over the average life of our typical loan.
Advertising
Advertising costs are expensed as incurred and are included in selling, general and administrative. Advertising expenses were $46 and $22 for the years ended December 31, 2016 and 2015, respectively.
| F-7 |
Cash and Cash Equivalents
Management considers highly-liquid investments with original maturities of three months or less to be cash equivalents.
Fair Value Measurements
The Company follows the guidance of FASB ASC 825, Financial Instruments, (ASC 825) and FASB ASC 820, Fair Value Measurements. (ASC 820) ASC 825 permits entities to measure many financial instruments and certain other items at fair value. The objective is to improve financial reporting by providing entities with the opportunity to mitigate volatility in reported earnings caused by measuring related assets and liabilities differently without having to apply complex hedge accounting provisions. ASC 820 clarifies that fair value is an exit price, representing the amount that would be received to sell an asset or paid to transfer a liability in an orderly transaction between market participants. Under this guidance, fair value measurements are not adjusted for transaction costs. This guidance establishes a fair value hierarchy that prioritizes the inputs to valuation techniques used to measure fair value. The hierarchy gives the highest priority to unadjusted quoted prices in active markets for identical assets or liabilities (Level 1 measurements) and the lowest priority to unobservable inputs (Level 3 measurements). See Note 3.
Loans Receivable
Loans are stated at the amount of unpaid principal, net of any allowances for loan losses, and adjusted for (1) the net unrecognized portion of direct costs and nonrefundable loan fees associated with lending, and (2) deposits made by the borrowers used as collateral for a loan and due back to the builder at or prior to loan payoff. The net amount of nonrefundable loan origination fees and direct costs associated with the lending process, including commitment fees, is deferred and accreted to interest income over the lives of the loans using a method that approximates the interest method.
A loan is classified as nonaccrual, and the accrual of interest on such loan is discontinued, when the contractual payment of principal or interest becomes 90 days past due. In addition, a loan may be placed on nonaccrual at any other time management has serious doubts about further collectability of principal or interest according to the contractual terms, even though the loan is currently performing. A loan may remain on accrual status if it is in the process of collection or well-secured (i.e., the loan has sufficient collateral value). Loans are restored to accrual status when the obligation is brought current or has performed in accordance with the contractual terms for a reasonable period of time and the ultimate collectability of the total contractual principal and interest is no longer in doubt.
A loan is considered impaired when, based on current information and events, it is probable that the Company will be unable to collect the scheduled payments of principal or interest when due according to the contractual terms of the loan agreement. Impaired loans, or portions thereof, are charged off when deemed uncollectible. Once a loan is 90 days past due, management begins a workout plan with the borrower or commences its foreclosure process on the collateral.
Allowance for Loan Losses
The allowance for loan losses is maintained at a level believed adequate by management to absorb probable losses inherent in the loan portfolio.
We establish a collective reserve for all loans which are not more than 60 days past due at the end of a quarter. This collective reserve takes into account both historical information and a qualitative analysis of housing and other economic factors that may impact our future realized losses. For loans to one borrower with committed balances less than 10% of our total committed balances on all loans extended to all customers, we individually analyze for impairment all loans which are more than 60 days past due at the end of a quarter. For loans to one borrower with committed balances equal to or greater than 10% of our total committed balances on all loans extended to all customers, we individually analyze all loans for potential impairment. The analysis of loans, if required, includes a comparison of estimated collateral value to the principal amount of the loan. For impaired loans, if the value determined is less than the principal amount due (less any builder deposit), then the difference is included in the allowance for loan loss. As values change, estimated loan losses may be provided for more or less than the previous period, and some loans may not need a loss provision based on payment history. For homes which are partially complete, we appraise on an as-is and completed basis, and use the one that more closely aligns with our planned method of disposal for the property.
For loans greater than 12 months in age that are individually evaluated for impairment, appraisals have been prepared within the last 13 months. For all loans individually evaluated for impairment, there is also a broker’s opinions of value (“BOV”) prepared, if the appraisal is more than six months old. The lower of any BOV prepared in the last six months, or the most recent appraisal, is used, unless we determine a BOV to be invalid based on the comparable sales used. If we determine a BOV to be invalid, we will use the appraised value. Appraised values are adjusted down for estimated costs associated with asset disposal. Broker’s opinion of selling price, currently valid sales contracts on the subject property, or representative recent actual closings by the builder on similar properties may be used in place of a BOV.
| F-8 |
Impaired Loans
A loan is considered to be impaired when it is probable the Company will be unable to collect all principal and interest payments due in accordance with the contractual terms of the loan agreement. The analysis of impaired loans includes a comparison of estimated collateral value to the principal amount of the loan. If the value determined is less than the principal amount due (less any builder deposit), then the difference is included in the allowance for loan loss. As values change, estimated loan losses may be provided for more or less than the previous period. For homes which are partially complete, we appraise on an as-is and completed basis, and use the one that more closely aligns with our planned method of disposal for the property. For loans greater than 12 months in age that are individually evaluated for impairment, appraisals have been prepared within the last 13 months. For all loans individually evaluated for impairment, there is also a BOV prepared, if the appraisal is more than six months old. The lower of any BOV prepared in the last six months, or the most recent appraisal, is used, unless we determine a BOV to be invalid based on the comparable sales used. If we determine a BOV to be invalid, we will use the appraised value. Appraised values are adjusted down for estimated costs associated with asset disposal. Broker’s opinion of selling price, currently valid sales contracts on the subject property, or representative recent actual closings by the builder on similar properties may be used in place of a BOV.
Foreclosed Assets
When a loan is converted into a foreclosed asset, the asset is booked at the as-is fair value minus estimated selling costs. Any gain is recognized on our income statement as non-interest income. A loss resulting from the carying value of the loan exceeding its fair value and estimated selling costs is charged to the allowance for loan losses. While we own the asset, we may remeasure its value. An increase in value is not recognized until the property is sold, but a decrease in value will be recognized as an impairment loss, a non-interest expense. While the initial valuation is done on an as-is basis, subsequent values are based on our plan for the asset. Assets which are not going to be improved are still evaluated on an as-is basis. Assets we intend to improve, are improving, or have improved are appraised based on the to-be-completed value, minus reasonable selling costs and the cost to complete
Deferred Financing Costs, Net
We defer certain costs associated with financing activities related to the issuance of debt securities (deferred financing costs). These costs consist primarily of professional fees incurred related to the transactions. Deferred financing costs are amortized into interest expense over the life of the related debt. We make estimates for the average duration of future investments. If these estimates are determined to be incorrect in the future, the rate at which we are amortizing the deferred offering costs as interest expense would be adjusted and could have a material impact on the consolidated financial statements. The deferred financing costs are reflected as a reduction in the unsecured notes offering liability. The Company adopted the guidance on the presentation of debt issuance costs on January 1, 2016, as required. As a result, the Company retrospectively applied the guidance to the 2015 Consolidated Balance Sheet by reclassifying $599 of deferred financing costs previously classified in the assets section.
The following is a roll forward of deferred financing costs for the years ended December 31, 2016 and 2015:
| 2016 | 2015 | |||||||
| Deferred financing costs, beginning balance | $ | 935 | $ | 737 | ||||
| Additions | 79 | 198 | ||||||
| Deferred financing costs, ending balance | $ | 1,014 | $ | 935 | ||||
| Less accumulated amortization | (603 | ) | (336 | ) | ||||
| Deferred financing costs, net | $ | 411 | $ | 599 | ||||
The following is a roll forward of the accumulated amortization of deferred financing costs for the years ended December 31, 2016 and 2015:
| 2016 | 2015 | |||||||
| Accumulated amortization, beginning balance | $ | 336 | $ | 107 | ||||
| Additions | 267 | 229 | ||||||
| Accumulated amortization, ending balance | $ | 603 | $ | 336 | ||||
| F-9 |
Income Taxes
The entities included in the consolidated financial statements are organized as pass-through entities under the Internal Revenue Code. As such, taxes are the responsibility of the members. Other significant taxes for which the Company is liable are recorded on an accrual basis.
The Company applies FASB ASC 740, Income Taxes. (ASC 740) ASC 740 provides guidance for how uncertain tax positions should be recognized, measured, presented and disclosed in the consolidated financial statements and requires the evaluation of tax positions taken or expected to be taken in the course of preparing the Company’s consolidated financial statements to determine whether the tax positions are “more-likely-than-not” to be sustained by the applicable tax authority. Tax positions with respect to income tax at the LLC level not deemed to meet the “more-likely-than-not” threshold would be recorded as a tax benefit or expense in the appropriate period. Management concluded that there are no uncertain tax positions that should be recognized in the consolidated financial statements. With few exceptions, the Company is no longer subject to income tax examinations for years prior to 2013.
The Company’s policy is to record interest and penalties related to taxes in interest expense on the consolidated statements of operations. There have been no significant interest or penalties assessed or paid.
Risks and Uncertainties
The Company is subject to many of the risks common to the commercial lending and real estate industries, such as general economic conditions, decreases in home values, decreases in housing starts, and high unemployment. These risks, which could have a material and negative impact on the Company’s consolidated financial condition, results of operations, and cash flows include, but are not limited to, declines in housing starts, unfavorable changes in interest rates, and competition from other lenders. At December 31, 2016, our loans were significantly concentrated in a suburb of Pittsburgh, Pennsylvania, so the housing starts and prices in that area are more significant to our business than other areas until and if more loans are created in other markets.
Concentrations
Financial instruments that potentially subject the Company to concentrations of credit risk consist principally of loans receivable. Our concentration risks are summarized in the table below:
| December 31, 2016 | December 31, 2015 | |||||||||||||||
| Percent of | Percent of | |||||||||||||||
| Borrower | Loan | Borrower | Loan | |||||||||||||
| City | Commitments | City | Commitments | |||||||||||||
| Highest concentration risk | Pittsburgh, PA | 37% | Pittsburgh, PA | $ | 37% | |||||||||||
| Second highest concentration risk | Sarasota, FL | 11% | Sarasota, FL | 22% | ||||||||||||
| Third highest concentration risk | Savannah, GA | 6% | Columbia, SC | 6% | ||||||||||||
Recent Accounting Pronouncements
The FASB issued Accounting Standards Update (ASU) 2014-09, “Revenue from Contracts with Customers (Topic 606)” (ASU 2014-09).ASU 2014-09 implements a common revenue standard that clarifies the principles for recognizing revenue. The core principle of ASU 2014-09 is that an entity should recognize revenue to depict the transfer of promised goods or services to customers in an amount that reflects the consideration to which the entity expects to be entitled in exchange for those goods or services. To achieve that core principle, an entity should apply the following steps: (i) identify the contract(s) with a customer, (ii) identify the performance obligations in the contract, (iii) determine the transaction price, (iv) allocate the transaction price to the performance obligations in the contract and (v) recognize revenue when (or as) the entity satisfies a performance obligation. ASU 2014-09 is effective for the Company on January 1, 2018. The Company has evaluated the potential impact on the Company’s consolidated financial statements, and determined that this standards update would not impact the accounting of any of our transactions which have already occurred. This standard will be applied when appropriate to future transactions, although none are currently anticipated.
In April 2015, the FASB issued ASU 2015-03, Interest - Imputation of Interest (Subtopic 835-30): Simplifying the Presentation of Debt Issuance Costs. The amendments in this ASU require that debt issuance costs related to a recognized debt liability be presented in the balance sheet as a direct deduction from the carrying amount of that debt liability, consistent with debt discounts. This guidance required retrospective application. The Company adopted the guidance on January 1, 2016, as required. See Note 1 - Deferred Financing Costs, Net for additional information regarding the adoption of the new guidance.
In June 2016, the FASB issued ASU 2016-13, Financial Instruments - Credit Losses: Measurement of Credit Losses on Financial Instruments (ASU 2016-13), which introduces the current expected credit losses methodology. Among other things, ASU 2016-13 requires the measurement of all expected credit losses for financial assets, including available-for-sale debt securities, held at the reporting date based on historical experience, current conditions, and reasonable and supportable forecasts that affect the collectability of the reported amount. The new model will require institutions to calculate all probable and estimable losses that are expected to be incurred through the loan’s entire life. ASU 2016-13 also requires the allowance for credit losses for purchased financial assets with credit deterioration since origination to be determined in a manner similar to that of other financial assets measured at amortized cost; however, the initial allowance will be added to the purchase price rather than recorded as credit loss expense. The disclosure of credit quality indicators related to the amortized cost of financing receivables will be further disaggregated by year of origination (or vintage). Institutions are to apply the changes through a cumulative-effect adjustment to their retained earnings as of the beginning of the first reporting period in which the standard is effective. The amendments are effective for fiscal years beginning after December 15, 2020. Early application will be permitted for fiscal years beginning after December 15, 2018. The Company is currently evaluating the impact of these amendments on the consolidated financial statements.
On August 26, 2016, the FASB issued ASU 2016-15, Statement of Cash Flows (Topic 230): Classification of Certain Cash Receipts and Cash Payments (ASU 2016-15) which amends guidance in FASB ASC 230 on the classification of certain cash receipts and payments in the statement of cash flows, in order to reduce inconsistent application. The amendments address eight cash flow issues including debt repayment and extinguishment costs, settlement of zero-coupon debt instruments, contingent consideration payments following a business combination, proceeds from the settlement of insurance claims and corporate-owned life insurance policies, distributions received from equity method investees, beneficial interests in securitization transactions and separately identifiable cash flows. ASU 2016-15 is effective for the Company for annual reporting periods beginning after December 15, 2017, including interim periods within those fiscal years. Entities must apply the guidance retrospectively to all periods presented but may apply it prospectively from the earliest date practicable if retrospective application would be impracticable. Adoption of ASU 2016-15 is not expected to have a material impact on the Company’s consolidated financial statements.
| F-10 |
Subsequent Events
Management of the Company has evaluated subsequent events through March 2, 2017, the date these consolidated financial statements were issued. See Note 12.
3. Fair Value
Utilizing ASC 820, the Company has established a framework for measuring fair value under U.S. GAAP using a hierarchy, which requires the Company to maximize the use of observable inputs and minimize the use of unobservable inputs. Fair value measurements are an exit price, representing the amount that would be received to sell an asset or paid to transfer a liability in an orderly transaction between market participants. Three levels of inputs are used to measure fair value, as follows:
| Level 1 – | quoted prices in active markets for identical assets or liabilities; | |
| Level 2 – | quoted prices in active markets for similar assets and liabilities and inputs that are observable for the asset or liability; or | |
| Level 3 – | unobservable inputs, such as discounted cash flow models or valuations. |
A financial instrument’s level within the fair value hierarchy is based on the lowest level of input that is significant to the fair value measurement.
Fair Value Measurements of Non-financial Instruments on a Recurring Basis
The Company has no non-financial instruments measured at fair value on a recurring basis.
Fair Value Measurements of Non-Financial Instruments on a Non-recurring Basis
Certain assets are measured at fair value on a non-recurring basis when there is evidence of impairment. The fair values of impaired loans with specific allocations of the allowance for loan losses are generally based on recent real estate appraisals of the collateral less estimated cost to sell. Declines in the fair values of other real estate owned subsequent to their initial acquisitions are also based on recent real estate appraisals less selling costs.
Impaired Loans
Fair value estimates are determined using the methodology discussed in Note 2. The appraisals are on similar properties at similar times; however due to the differences in time and properties, the impaired loans are classified as Level 3. There were no impaired loan assets as of December 31, 2016 and 2015.
Foreclosed assets
Foreclosed assets (upon initial recognition or subsequent impairment) are measured at fair value on a non-recurring basis. See methodology described in Note 2.
During both 2016 and 2015, certain foreclosed assets, upon initial recognition, were measured and reported at fair value. During 2016, the Company remeasured the fair value of its foreclosed assets. During 2015, no foreclosed assets were remeasured at fair value subsequent to initial recognition.
| F-11 |
The following tables presents the balances of non-financial instruments measured at fair value on a non-recurring basis as of December 31, 2016 and 2015.
December 31, 2016
| Quoted Prices | ||||||||||||||||||||
| in Active | Significant | |||||||||||||||||||
| Markets for | Other | Significant | ||||||||||||||||||
| Identical | Observable | Unobservable | ||||||||||||||||||
| Carrying | Estimated | Assets | Inputs | Inputs | ||||||||||||||||
| Amount | Fair Value | Level 1 | Level 2 | Level 3 | ||||||||||||||||
| Foreclosed assets | $ | 2,798 | $ | 2,798 | $ | – | $ | – | $ | 2,798 | ||||||||||
December 31, 2015
| Quoted Prices | ||||||||||||||||||||
| in Active | Significant | |||||||||||||||||||
| Markets for | Other | Significant | ||||||||||||||||||
| Identical | Observable | Unobservable | ||||||||||||||||||
| Carrying | Estimated | Assets | Inputs | Inputs | ||||||||||||||||
| Amount | Fair Value | Level 1 | Level 2 | Level 3 | ||||||||||||||||
| Foreclosed assets | $ | 965 | $ | 965 | $ | – | $ | – | $ | 965 | ||||||||||
Fair Value of Financial Instruments
ASC 825 requires disclosure of fair value information about financial instruments, whether or not recognized on the face of the balance sheet, for which it is practicable to estimate that value. The following methods and assumptions were used by the Company in estimating the fair value of its financial instruments:
Cash and Cash Equivalents
The carrying amount approximates fair value because of the short maturity of these instruments.
Loans Receivable and Commitments to Extend Credit
For variable rate loans that reprice frequently with no significant change in credit risk, estimated fair values of collateral are based on carrying values at both December 31, 2016 and 2015. Because the loans are demand loan and therefore have no known time horizon, there is no significant impact from fluctuating interest rates. For unfunded commitments to extend credit, because there would be no adjustment between fair value and carrying amount for the amount if actually loaned, there is no adjustment to the amount before it is loaned. The amount for commitments to extend credit is not listed in the tables below because there is no difference between carrying value and fair value, and the amount is not recorded on the consolidated balance sheets as a liability.
Interest Receivable
Although interest receivable from our customers does not yield additional interest to us, because interest is due roughly 10 days after it is billed, the impact is negligible and the fair value approximates the carrying value at both December 31, 2016 and 2015.
Customer Interest Escrow
The customer interest escrow does not yield interest to the customer, but because: 1) the customer loans are demand loans, 2) there is no way to estimate how long the escrow will be in place, and 3) the interest rate which could be used to discount this amount is negligible, the fair value approximates the carrying value at both December 31, 2016 and 2015.
Borrowings under Credit Facilities
The fair value of the Company’s borrowings under credit facilities is estimated based on the expected cash flows discounted using the current rates offered to the Company for debt of the same remaining maturities. As all of the borrowings under credit facilities or the Notes are either payable on demand or at similar rates to what the Company can borrow funds for today, the fair value of the borrowings is determined to approximate carrying value at both December 31, 2016 and 2015. The interest on our Notes offering is paid to our Note holders either monthly or at the end of their investment, compounding on a monthly basis. For the same reasons as the determination for the principal balances on the Notes, the fair value approximates the carrying value for the interest as well. The interest payable makes up the bulk of our accounts payable and accrued expenses.
| F-12 |
The table below is a summary of fair value estimates for financial instruments and the level of the fair value hierarchy (as discussed in Note 2) within which the fair value measurements are categorized at the periods indicated:
December 31, 2016
| Quoted Prices | ||||||||||||||||||||
| in Active | Significant | |||||||||||||||||||
| Markets for | Other | Significant | ||||||||||||||||||
| Identical | Observable | Unobservable | ||||||||||||||||||
| Carrying | Estimated | Assets | Inputs | Inputs | ||||||||||||||||
| Amount | Fair Value | Level 1 | Level 2 | Level 3 | ||||||||||||||||
| Financial Assets | ||||||||||||||||||||
| Cash and cash equivalents | $ | 1,566 | $ | 1,566 | $ | 1,566 | $ | – | $ | – | ||||||||||
| Loans receivable, net | 20,091 | 20,091 | – | – | 20,091 | |||||||||||||||
| Accrued interest on loans | 280 | 280 | – | – | 280 | |||||||||||||||
| Financial Liabilities | ||||||||||||||||||||
| Customer interest escrow | 812 | 812 | – | – | 812 | |||||||||||||||
| Notes payable secured | 7,322 | 7,322 | – | – | 7,322 | |||||||||||||||
| Notes payable unsecured, net | 11,962 | 11,962 | – | – | 11,962 | |||||||||||||||
| Accrued interest payable | 993 | 993 | – | – | 993 | |||||||||||||||
December 31, 2015
| Quoted Prices | ||||||||||||||||||||
| in Active | Significant | |||||||||||||||||||
| Markets for | Other | Significant | ||||||||||||||||||
| Identical | Observable | Unobservable | ||||||||||||||||||
| Carrying | Estimated | Assets | Inputs | Inputs | ||||||||||||||||
| Amount | Fair Value | Level 1 | Level 2 | Level 3 | ||||||||||||||||
| Financial Assets | ||||||||||||||||||||
| Cash and cash equivalents | $ | 1,341 | $ | 1,341 | $ | 1,341 | $ | – | $ | – | ||||||||||
| Loans receivable, net | 14,060 | 14,060 | – | – | 14,060 | |||||||||||||||
| Accrued interest on loans | 146 | 146 | – | – | 146 | |||||||||||||||
| Financial Liabilities | ||||||||||||||||||||
| Customer interest escrow | 498 | 498 | – | – | 498 | |||||||||||||||
| Notes payable secured | 3,683 | 3,683 | – | – | 3,683 | |||||||||||||||
| Notes payable unsecured, net | 8,497 | 8,497 | – | – | 8,497 | |||||||||||||||
| Accrued interest payable | 460 | 460 | – | – | 460 | |||||||||||||||
4. Financing Receivables
Financing receivables are comprised of the following as of December 31, 2016 and 2015:
| December 31, 2016 | December 31, 2015 | |||||||
| Commercial loans, gross | $ | 21,569 | $ | 15,247 | ||||
| Less: Deferred loan fees | (618 | ) | (628 | ) | ||||
| Less: Deposits | (861 | ) | (521 | ) | ||||
| Plus: Deferred origination expense | 55 | – | ||||||
| Less: Allowance for loan losses | (54 | ) | (38 | ) | ||||
| Commercial loans, net | $ | 20,091 | $ | 14,060 | ||||
| F-13 |
Roll forward of commercial loans for the years ended December 31, 2016 and 2015:
| 2016 | 2015 | |||||||
| Beginning balance | $ | 14,060 | $ | 8,097 | ||||
| Additions | 23,184 | 13,760 | ||||||
| Payoffs/sales | (15,168 | ) | (6,436 | ) | ||||
| Moved to foreclosed assets | (1,639 | ) | (767 | ) | ||||
| Change in deferred origination expense | 55 | – | ||||||
| Change in builder deposit | (340 | ) | (387 | ) | ||||
| Change in loan loss provision | (16 | ) | (17 | ) | ||||
| New loan fees | (1,270 | ) | (897 | ) | ||||
| Earned loan fees | 1,225 | 707 | ||||||
| Ending balance | $ | 20,091 | $ | 14,060 | ||||
Commercial Construction and Development Loans
Pennsylvania Loans
We have three development loans (the “Pennsylvania Loans”) covering two developments. The loans are to the same borrowing group (the “Hoskins Group”). They are cross-defaulted and cross-collateralized with each other. As such, we are currently reliant on a single developer and homebuilder for a significant portion of our revenues. As part of our agreement with the Hoskins Group, they invest in our preferred equity in an amount equal to $10 per closing of a lot payoff in the two developments. We collected a fee of $1,000 upon closing of the loans in 2011, which was recognized through July of 2016, the original expected life of the loan. Additionally, we created an interest escrow account (the “Interest Escrow”) which has been funded at various times by borrowings, and by a portion of each lot payoff. Interest on the Pennsylvania Loans accrues annually at 7% (2% prior to August 1, 2016) plus the greater of (i) 5.0% or (ii) the weighted average price paid by us on or in connection with all of our borrowed funds (such weighted average price includes interest rates, loan fees, legal fees and any and all other costs paid by us on our borrowed funds, and, in the case of funds borrowed by us from our affiliates, the weighted average price paid by such affiliate on or in connection with such borrowed funds) (“COF”). Pursuant to the credit agreement, interest payments on the loans are funded from the Interest Escrow, with any shortfall funded by the Hoskins Group. Loans may be prepaid in whole or in part at any time without penalty.
The loans are secured by several first priority mortgages in residential building lots located in the subdivisions commonly known as the Hamlets of Springdale and the Tuscany Subdivision, both in Peters Township, Pennsylvania, a suburb of Pittsburgh, as well as the Interest Escrow.
A detail of the financing receivables for the Pennsylvania loans at December 31, 2016 is as follows:
| Item | Term | Interest Rate | Funded to borrower | Estimated collateral values | ||||||||
| BMH Loan | Demand(1) | COF +7% (7% Floor) |
||||||||||
| Lots | 39 | 3,173 | (3) | |||||||||
| Interest Escrow | 950 | 541 | ||||||||||
| Cash Bond | 257 | (5) | 257 | |||||||||
| Loan Fee | 750 | – | ||||||||||
| Total BMH Loan | 1,996 | 3,971 | ||||||||||
| IMA Loans | ||||||||||||
| New IMA Loan (loan fee) | Demand(1) | COF +7% (7% Floor) |
250 | – | ||||||||
| New IMA Loan (advances) | Demand(1) | COF +7% (7% Floor) |
149 | – | ||||||||
| Existing IMA Loan | Demand(2) | COF +7% (7% Floor) |
1,687 | 1,465 | (7) | |||||||
| Total IMA Loans | 2,086 | 1,465 | ||||||||||
| SF Preferred Equity | – | 1,150 | (8) | |||||||||
| Total | $ | 4,082 | $ | 6,586 | ||||||||
| F-14 |
A detail of the financing receivables for the Pennsylvania loans at December 31, 2015 is as follows:
| Item | Term | Interest Rate | Funded to borrower | Estimated collateral values | ||||||||
| BMH Loan | Demand(1) | COF +2% (7% Floor) |
||||||||||
| Land for phase 5 (10 acres) | $ | – | $ | 1,079 | ||||||||
| Lots | 974 | 2,338 | (4) | |||||||||
| Interest Escrow | 950 | 267 | ||||||||||
| Cash Bond | 257 | (5) | 257 | |||||||||
| Loan Fee | 750 | – | ||||||||||
| Total BMH Loan | 2,931 | 3,941 | ||||||||||
| IMA Loans | ||||||||||||
| New IMA Loan (loan fee) | Demand(1) | COF +2% (7% Floor) |
250 | – | ||||||||
| New IMA Loan (advances) | Demand(1) | COF +2% (7% Floor) |
1,251 | – | ||||||||
| Existing IMA Loan | Demand(2) | COF +2% (7% Floor) |
1,687 | 2,951 | (6) | |||||||
| Total IMA Loans | 3,188 | 2,951 | ||||||||||
| Unearned Loan Fee | (115 | ) | – | |||||||||
| SF Preferred Equity | – | 1,010 | (8) | |||||||||
| Total | $ | 6,004 | $ | 7,902 | ||||||||
(1) These are the stated terms; however, in practice, principal will be repaid upon the sale of each developed lot.
(2) These are the stated terms; however, in practice, principal will be repaid upon the sale of each developed lot after the BMH loan and the New IMA loan are satisfied.
(3) Estimated collateral value is equal to the appraised value of the remaining lots of $3,756, net of the net estimated costs to finish the development of $583.
(4) Estimated collateral value is equal to the appraised value of the remaining lots of $3,600, net of the net estimated costs to finish the development of $531 and the first mortgage amount of $731.
(5) The cash bond is in place to guarantee to the township that work will be completed on this project. We will fund this work and expect to cancel the bond upon completion of the work.
(6) Estimated collateral value is equal to the appraised value of $3,101, net of estimated costs to finish the development of $150.
(7) Estimated collateral value is equal to the appraised value of $1,568, net of estimated costs to finish the development of $103.
(8) In the event of a foreclosure on the property securing certain of our loans, a portion of our collateral is preferred equity in our Company, which might be difficult to sell, which could impact our ability to eliminate the loan balance. The loans are collectively cross-collateralized and, therefore, treated as one loan for the purpose of calculating the effective interest rate and for available remedies upon an instance of default. As lots are released, a specific release price is repaid by the borrower, with 10% of that amount being used to fund the Interest Escrow (except for the construction funding for homes). The customer will make cash interest payments only when the Interest Escrow is fully depleted, except for construction funding for homes, where the customer makes interest payments monthly.
| F-15 |
Commercial Loans – Real Estate Development Loan Portfolio Summary
The following is a summary of our loan portfolio to builders for land development as of December 31, 2016. The Pennsylvania loans below are the Pennsylvania Loans discussed above.
| State | Number of Borrowers | Number of Loans | Value of Collateral(1) | Commitment Amount | Amount Outstanding | Loan to Value Ratio(2) | Loan Fee | |||||||||||||||||||||
| Pennsylvania | 1 | 3 | $ | 6,586 | $ | 5,931 | (3) | $ | 4,082 | 62 | % | $ | 1,000 | |||||||||||||||
| Total | 1 | 3 | $ | 6,586 | $ | 5,931 | $ | 4,082 | 62 | % | $ | 1,000 | ||||||||||||||||
| (1) | The value is determined by the appraised value adjusted for remaining costs to be paid and third party mortgage balances. Part of this collateral is $1,150 of preferred equity in our Company. In the event of a foreclosure on the property securing certain of our loans, a portion of our collateral is preferred equity in our Company, which might be difficult to sell, which could impact our ability to eliminate the loan balance. | |
| (2) | The loan to value ratio is calculated by taking the outstanding amount and dividing by the appraised value. | |
| (3) | The commitment amount does not include letters of credit and cash bonds, as the sum of the total balance outstanding including the cash bonds plus the letters of credit and remaining to fund for construction is less than the $5,931 commitment amount. |
The following is a summary of our loan portfolio to builders for land development as of December 31, 2015. The Pennsylvania loans below are the Pennsylvania Loans discussed above.
| State | Number of Borrowers | Number of Loans | Value of Collateral(1) | Commitment Amount | Amount Outstanding | Loan to Value Ratio(2) | Loan Fee | |||||||||||||||||||||
| Pennsylvania | 1 | 3 | $ | 7,902 | $ | 6,456 | (3) | $ | 6,118 | 77 | % | $ | 1,000 | |||||||||||||||
| Total | 1 | 3 | $ | 7,902 | $ | 6,456 | $ | 6,118 | 77 | % | $ | 1,000 | ||||||||||||||||
| (1) | The value is determined by the appraised value adjusted for remaining costs to be paid and third party mortgage balances. Part of this collateral is $1,010 of preferred equity in our Company. In the event of a foreclosure on the property securing certain of our loans, a portion of our collateral is preferred equity in our Company, which might be difficult to sell, which could impact our ability to eliminate the loan balance. | |
| (2) | The loan to value ratio is calculated by taking the outstanding amount and dividing by the appraised value. | |
| (3) | The commitment amount includes letters of credit and cash bonds. |
Commercial Loans – Construction Loan Portfolio Summary
The following is a summary of our loan portfolio to builders for home construction loans as of December 31, 2016.
| State | Number of Borrowers | Number of Loans | Value of Collateral (1) | Commitment Amount | Amount Outstanding | Loan to Value Ratio(2) | Loan Fee | |||||||||||||||||||||
| Colorado | 1 | 3 | $ | 1,615 | $ | 1,131 | $ | 605 | 70 | % | 5 | % | ||||||||||||||||
| Connecticut | 1 | 1 | 715 | 500 | 479 | 70 | % | 5 | % | |||||||||||||||||||
| Delaware | 1 | 2 | 244 | 171 | 40 | 70 | % | 5 | % | |||||||||||||||||||
| Florida | 7 | 15 | 14,014 | 8,548 | 4,672 | 61 | % | 5 | % | |||||||||||||||||||
| Georgia | 4 | 9 | 6,864 | 4,249 | 2,749 | 62 | % | 5 | % | |||||||||||||||||||
| Idaho | 1 | 1 | 319 | 215 | 205 | 67 | % | 5 | % | |||||||||||||||||||
| Michigan | 1 | 1 | 210 | 126 | 118 | 60 | % | 5 | % | |||||||||||||||||||
| New Jersey | 1 | 3 | 977 | 719 | 528 | 74 | % | 5 | % | |||||||||||||||||||
| New York | 1 | 4 | 1,745 | 737 | 685 | 42 | % | 5 | % | |||||||||||||||||||
| North Carolina | 2 | 2 | 1,015 | 633 | 216 | 62 | % | 5 | % | |||||||||||||||||||
| Ohio | 1 | 1 | 1,405 | 843 | 444 | 60 | % | 5 | % | |||||||||||||||||||
| Pennsylvania | 2 | 15 | 12,725 | 6,411 | 5,281 | 50 | % | 5 | % | |||||||||||||||||||
| South Carolina | 5 | 7 | 2,544 | 1,591 | 783 | 63 | % | 5 | % | |||||||||||||||||||
| Tennessee | 1 | 3 | 1,080 | 767 | 430 | 71 | % | 5 | % | |||||||||||||||||||
| Utah | 1 | 2 | 715 | 500 | 252 | 70 | % | 5 | % | |||||||||||||||||||
| Total | 30 | 69 | $ | 46,187 | $ | 27,141 | $ | 17,487 | 59 | %(3) | 5 | % | ||||||||||||||||
| F-16 |
| (1) | The value is determined by the appraised value. | |
| (2) | The loan to value ratio is calculated by taking the commitment amount and dividing by the appraised value. | |
| (3) | Represents the weighted average loan to value ratio of the loans. |
The following is a summary of our loan portfolio to builders for home construction loans as of December 31, 2015.
| State | Number of Borrowers | Number of Loans | Value of Collateral (1) | Commitment Amount | Amount Outstanding | Loan to Value Ratio(2) | Loan Fee | |||||||||||||||||||||
| Colorado | 1 | 4 | $ | 2,160 | $ | 1,519 | $ | 830 | 70 | % | 5 | % | ||||||||||||||||
| Connecticut | 1 | 1 | 715 | 500 | 251 | 70 | % | 5 | % | |||||||||||||||||||
| Delaware | 1 | 2 | 1,074 | 671 | 105 | 63 | % | 5 | % | |||||||||||||||||||
| Florida | 3 | 10 | 10,683 | 6,440 | 4,378 | 60 | % | 5 | % | |||||||||||||||||||
| Georgia | 2 | 3 | 3,916 | 2,278 | 712 | 58 | % | 5 | % | |||||||||||||||||||
| New Jersey | 1 | 2 | 510 | 357 | 268 | 70 | % | 5 | % | |||||||||||||||||||
| North Carolina | 1 | 2 | 385 | 270 | 172 | 70 | % | 5 | % | |||||||||||||||||||
| Pennsylvania | 2 | 6 | 4,107 | 2,391 | 1,275 | 58 | % | 5 | % | |||||||||||||||||||
| South Carolina | 2 | 16 | 2,395 | 1,699 | 1,136 | 71 | % | 5 | % | |||||||||||||||||||
| Total | 14 | 46 | $ | 25,945 | $ | 16,125 | $ | 9,127 | 62 | %(3) | 5 | % | ||||||||||||||||
| (1) | The value is determined by the appraised value. | |
| (2) | The loan to value ratio is calculated by taking the commitment amount and dividing by the appraised value. | |
| (3) | Represents the weighted average loan to value ratio of the loans. |
Credit Quality Information
The following table presents credit-related information at the “class” level in accordance withFASB ASC 310-10-50, Disclosures about the Credit Quality of Finance Receivables and the Allowance for Credit Losses. A class is generally a disaggregation of a portfolio segment. In determining the classes, the Company considered the finance receivable characteristics and methods it applies in monitoring and assessing credit risk and performance.
The following table summarizes finance receivables by the risk ratings that regulatory agencies utilize to classify credit exposure and which are consistent with indicators the Company monitors. Risk ratings are reviewed on a regular basis and are adjusted as necessary for updated information affecting the borrowers’ ability to fulfill their obligations.
The definitions of these ratings are as follows:
| ● | Pass – finance receivables in this category do not meet the criteria for classification in one of the categories below. | |
| ● | Special mention – a special mention asset exhibits potential weaknesses that deserve management’s close attention. If left uncorrected, these potential weaknesses may, at some future date, result in the deterioration of the repayment prospects. | |
| ● | Classified – a classified asset ranges from: 1) assets that are inadequately protected by the current sound worth and paying capacity of the borrower, and are characterized by the distinct possibility that some loss will be sustained if the deficiencies are not corrected to 2) assets with weaknesses that make collection or liquidation in full unlikely on the basis of current facts, conditions, and values. Assets in this classification can be accruing or on non-accrual depending on the evaluation of these factors. |
Finance Receivables – By risk rating:
| December 31, 2016 | December 31, 2015 | |||||||
| Pass | $ | 18,275 | $ | 15,247 | ||||
| Special mention | 3,294 | – | ||||||
| Classified – accruing | – | – | ||||||
| Classified – nonaccrual | – | – | ||||||
| Total | $ | 21,569 | $ | 15,247 | ||||
| F-17 |
Finance Receivables – Method of impairment calculation:
| December 31, 2016 | December 31, 2015 | |||||||
| Performing loans evaluated individually | $ | 12,424 | $ | 10,672 | ||||
| Performing loans evaluated collectively | 9,145 | 4,575 | ||||||
| Non-performing loans without a specific reserve | $ | – | $ | – | ||||
| Non-performing loans with a specific reserve | – | – | ||||||
| Total | $ | 21,569 | $ | 15,247 | ||||
At December 31, 2016 and 2015, there were no loans acquired with deteriorated credit quality, loans past due 90 or more days, impaired loans, or loans on nonaccrual status.
5. Foreclosed Assets
Roll forward of Foreclosed Assets for the years ended December 31, 2016 and 2015:
| 2016 | 2015 | |||||||
| Beginning balance | $ | 965 | $ | – | ||||
| Additions from loans | 1,813 | 880 | ||||||
| Additions for construction/development | 566 | 85 | ||||||
| Sale proceeds | (463 | ) | – | |||||
| Gain on sale | 28 | – | ||||||
| Impairment loss on foreclosed assets | (111 | ) | – | |||||
| Ending balance | $ | 2,798 | $ | 965 | ||||
6. Borrowings
The following table displays our borrowings and a ranking of priority:
| Priority Rank | December 31, 2016 | December 31, 2015 | ||||||||
| Borrowing Source | ||||||||||
| Purchase and sale agreements | 1 | $ | 7,322 | $ | 3,683 | |||||
| Secured line of credit from affiliates | 2 | – | – | |||||||
| Other unsecured debt (senior subordinated) | 3 | 279 | – | |||||||
| Unsecured Notes through our public offering | 4 | 11,221 | 8,496 | |||||||
| Other unsecured debt (subordinated) | 4 | 700 | 600 | |||||||
| Other unsecured debt (junior subordinated) | 5 | 173 | – | |||||||
| Total | $ | 19,695 | $ | 12,779 | ||||||
The following table shows the maturity of outstanding debt as of December 31, 2016.
| Year Maturing | Total Amount Maturing |
Public Offering | Other Unsecured | Purchase and Sale Agreements |
||||||||||||
| 2017 | $ | 10,838 | $ | 3,116 | $ | 600 | $ | 7,322 | ||||||||
| 2018 | 2,516 | 2,516 | – | – | ||||||||||||
| 2019 | 3,011 | 3,011 | – | – | ||||||||||||
| 2020 | 3,330 | 2,578 | 552 | – | ||||||||||||
| Total | $ | 19,695 | $ | 11,221 | $ | 1,152 | $ | 7,322 | ||||||||
| F-18 |
Purchase and Sale Agreements
We have two purchase and sale agreements where we are the seller of portions of loans we create. The two purchasers are 1st Financial Bank, USA (“1st Financial”) and S.K. Funding, LLC (“S.K. Funding”). Generally the purchasers buy between 50% and 70% of each loan sold. They receive interest rates ranging from our cost of funds to the note rate charged to the borrower (interest rates were between 9% and 12% for both 2016 and 2015), and generally none of the loan fees we charge. We have the right to call some of the loans sold, with some restrictions. Once sold, the buyer must fund their portion of the loans purchased. We service the loans. Also, there are limited put options in some cases, whereby the purchaser can cause us to repurchase a loan. The purchase and sale agreements are recorded as secured borrowings.
The purchase and sale agreements are detailed below:
| December 31, 2016 | December 31, 2015 | |||||||||||||||
| Book Value of | Due From | Book Value of | Due From | |||||||||||||
| Loans which | Shepherd’s | Loans which | Shepherd’s | |||||||||||||
| Served as | Finance to Loan | Served as | Finance to Loan | |||||||||||||
| Collateral | Purchaser | Collateral | Purchaser | |||||||||||||
| Loan purchaser | ||||||||||||||||
| 1st Financial Bank, USA | $ | 5,779 | $ | 2,517 | $ | 2,723 | $ | 1,061 | ||||||||
| S.K. Funding, LLC | 7,770 | 4,805 | 4,522 | 2,622 | ||||||||||||
| Total | $ | 13,549 | $ | 7,322 | $ | 7,245 | $ | 3,683 | ||||||||
The $7,770 of loans which served as collateral for S.K. Funding does not include the book value of the foreclosed assets which also secure their position, which amount is $1,813.
Affiliate Loans
In December 2011, the Company entered into two secured revolving lines of credit with affiliates, both of whom are members. These loans have an interest rate of the affiliates’ cost of funds, which was 4.19% and 4.20% as of December 31, 2016 and 2015, respectively. They are demand notes. The maximum that can be borrowed under these notes is $1,500, at the discretion of the lenders. The security for the lines of credit includes all of the assets of the Company. The Company has not borrowed on these lines in either 2016 or 2015.
Other Unsecured Loans
In August 2015, we entered into an unsecured note with 7Kings, under which we are the borrower. The note has a maximum amount outstanding of $500, of which $500 was outstanding as of both December 31, 2016 and 2015. Interest on the 7Kings loan accrues annually at a rate of 7.5%. The note was due on February 19, 2016 and was renewed several times. The maturity date is now February 18, 2017 and may be prepaid at any time without penalty. Interest is due at the end of each month and was $38 in 2016 and 14 in 2015.
In December 2015, we entered into an unsecured note with an unrelated third party, under which we are the borrower. The note has a maximum amount outstanding of $100, of which $100 was outstanding on both December 31, 2016 and 2015. Interest on this note accrues annually at a rate of 7.9%. The note is due on June 23, 2017 and may be prepaid at any time without penalty. Interest accrues and compounds monthly. In April 2016, we entered into anadditional unsecured note with the same unrelated third party, under which we are the borrower. The note has a maximum amount outstanding of $100, of which $100 was outstanding on .December 31, 2016 Interest on this note accrues annually at a rate of 10%. The note is due on April 15, 2020 and may be prepaid at any time without penalty. Interest accrues and compounds monthly.
In October of 2016, we entered into two unsecured notes with two third parties not affiliated with us, but affiliate with each other. One note is senior to our unsecured debt, and the other is junior to our unsecured debt. The senior note receives a lower rate and the junior note receives a higher rate. Overall, the notes will yield a 10% compounding rate for the four year duration of the notes, with interest paid at maturity. The notes may be prepaid at any time without penalty. The total amount outstanding on the two notes as of December 31, 2016 was $452.
Unsecured Notes through the Public Offering (Notes Program)
The effective interest rate on the borrowings at December 31, 2016 and 2015 was 8.26% and 7.30%, respectively, not including the amortization of deferred financing costs. There are limited rights of early redemption. We generally offer four durations at any given time, ranging anywhere from 12 to 48 months. The following table shows the roll forward of our Notes program:
| F-19 |
| Year
Ended December 31, 2016 |
Year
Ended December 31, 2015 |
|||||||
| Gross notes outstanding, beginning of period | $ | 8,496 | $ | 5,427 | ||||
| Notes issued | 4,972 | 3,737 | ||||||
| Note repayments / redemptions | (2,247 | ) | (668 | ) | ||||
| Gross notes outstanding, end of period | 11,221 | 8,496 | ||||||
| Less deferred financing costs, net | 411 | 599 | ||||||
| Notes outstanding, net | $ | 10,810 | $ | 7,897 | ||||
7. Members’ Capital
There are currently two classes of units: Class A common units and Series B cumulative preferred units.
The Class A common units are held by three members, all of whom have no personal liability. All Class A common members have voting rights in proportion to their capital account. There were 2,629 Class A common units outstanding at both December 31, 2016 and 2015. On December 31, 2015, S.K. Funding purchased 4% of our common equity from the Wallach family.
The Series B cumulative preferred units were issued to the Hoskins Group. They are redeemable only at the option of the Company or upon a change or control or liquidation. Ten units were issued for a total of $1,000. The Series B preferred units have a fixed value which is their purchase price, and preferred liquidation and distribution rights. Yearly distributions of 10% of the preferred units’ value (providing profits are available) will be made quarterly. The Hoskins Group Series B cumulative preferred units are also used as collateral for that group’s loans to the Company. There is no liquid market for the preferred units, so we can give no assurance as to our ability to generate any amount of proceeds from that collateral. In December of 2015, the Hoskins Group agreed to purchase 0.1 units for $10 at each closing of a lot to a third party in the Hamlets and Tuscany subdivision.
There are two additional authorized unit classes: Class A preferred units and Class B profit units. Once Class B profit units are issued, the existing Class A common units will become Class A preferred units. Class A preferred units will receive preferred treatment in terms of distributions and liquidation proceeds.
The members’ capital balances by class are as follows:
| Class | December 31, 2016 | December 31, 2015 | ||||||
| B Preferred Units | $ | 1,150 | $ | 1,010 | ||||
| A Common Units | 2,249 | 2,274 | ||||||
| Members’ Capital | $ | 3,399 | $ | 3,284 | ||||
8. Related Party Transactions
Notes and Accounts Payable to Affiliates
The Company has a loan agreement with two of our affiliates, as more fully described in Note 6 – Affiliate Loans.
The Company has loan agreements with the Hoskins Group, as more fully described in Note 6 – SF Loan and Note 4 – Pennsylvania Loans.
The Hoskins Group has a preferred equity interest in the Company, as more fully described in Note 7.
S.K. Funding, an affiliate of 7Kings, owns 4% of our common equity. 7Kings also is:
| ● | The lender on a $500 unsecured note, as more fully described in Note 6 – Other Unsecured Loans | |
| ● | An investor in our unsecured Notes for $500, and | |
| ● | The purchaser in a purchase and sale agreement, as more fully described in Note 6, Purchase and Sale Agreements |
| F-20 |
The Company has accepted new investments under the Notes Program from employees, managers, members and relatives of managers and members, with $2,197 and $2,600 outstanding at December 31, 2016 and 2015, respectively. The larger of these investments are detailed below:
| Amount invested as of | Weighted average interest rate as of |
Interest earned during the year ended December 31, | ||||||||||||||||||||
| Investor | Finance | December 31, 2016 | December 31, 2015 | December 31, 2016 | 2016 | 2015 | ||||||||||||||||
| Bill Myrick | Independent Manager | $ | 304 | $ | 286 | 8.60 | % | $ | 24 | $ | 14 | |||||||||||
| Wallach Family Irrevocable Educational Trust | Trustee is Member | 200 | 200 | 9.00 | % | 16 | 15 | |||||||||||||||
| Eric Rauscher | Independent Manager | 600 | 600 | 7.13 | % | 45 | 37 | |||||||||||||||
| Joseph Rauscher | Parents of Independent Manager | 186 | 186 | 8.00 | % | 16 | 16 | |||||||||||||||
| Seven Kings Holdings, Inc. | Affiliate of Member | 500 | 500 | 9.00 | % | 38 | 35 | |||||||||||||||
9. Commitments and Contingencies
In the normal course of business there may be outstanding commitments to extend credit that are not included in the consolidated financial statements. Commitments to extend credit are agreements to lend to a customer as long as there is no violation of any condition established in the contract. Commitments generally have fixed expiration dates or other termination clauses and may require payment of a fee. Since many of the commitments are expected to expire without being drawn upon and some of the funding may come from the earlier repayment of the same loan (in the case of revolving lines), the total commitment amounts do not necessarily represent future cash requirements. The financial instruments involve, to varying degrees, elements of credit and interest rate risk in excess of amounts recognized in the consolidated financial statements. The Company evaluates each customer’s creditworthiness on a case-by-case basis. Unfunded commitments to extend credit, which have similar collateral, credit risk and market risk to our outstanding loans, were $11,503 and $7,332 at December 31, 2016 and 2015, respectively.
The Company has several Letters of Credit relating to the BMH Loan. Refer to the chart in Note 4 – Commercial Loans – Real Estate Development Loan Portfolio Summary for further details describing this commitment.
10. Selected Quarterly Condensed Consolidated Financial Data (Unaudited)
Summarized unaudited quarterly condensed consolidated financial data for the four quarters of 2016 and 2015 are as follows (in thousands):
| Quarter 4 | Quarter 3 | Quarter 2 | Quarter 1 | Quarter 4 | Quarter 3 | Quarter 2 | Quarter 1 | |||||||||||||||||||||||||
| 2016 | 2016 | 2016 | 2016 | 2015 | 2015 | 2015 | 2015 | |||||||||||||||||||||||||
| Net Interest Income | $ | 491 | $ | 442 | $ | 464 | $ | 479 | $ | 326 | $ | 210 | $ | 212 | $ | 192 | ||||||||||||||||
| Non-Interest Income | 28 | – | 44 | – | 105 | – | – | – | ||||||||||||||||||||||||
| SG&A expense | 367 | 297 | 305 | 350 | 163 | 115 | 119 | 150 | ||||||||||||||||||||||||
| Impairment loss on foreclosed assets | 111 | – | – | – | – | – | – | – | ||||||||||||||||||||||||
| Net Income | $ | 41 | $ | 145 | $ | 203 | $ | 129 | $ | 268 | $ | 95 | $ | 93 | $ | 42 | ||||||||||||||||
| F-21 |
11. Non-Interest expense detail
The following table displays our SG&A expenses for the years ended December 31, 2016 and 2015:
| For the Years Ended December 31, | ||||||||
| 2016 | 2015 | |||||||
| Selling, general and administrative expenses | ||||||||
| Legal and accounting | $ | 167 | $ | 144 | ||||
| Salaries and related expenses | 816 | 187 | ||||||
| Board related expenses | 112 | 105 | ||||||
| Advertising | 46 | 22 | ||||||
| Rent and utilities | 19 | 20 | ||||||
| Printing | 10 | 12 | ||||||
| Loan and foreclosed asset expenses | 62 | 16 | ||||||
| Travel | 35 | 15 | ||||||
| Other | 52 | 26 | ||||||
| Total SG&A | $ | 1,319 | $ | 547 | ||||
Printing costs are both for printing of investor related material and for the filing of documents electronically with the SEC.
12. Subsequent Events
On February 6, 2017, we entered into a Loan Purchase and Sale Agreement (the “LPSA”) with Builder Finance, Inc. (“Builder Finance”), pursuant to which Builder Finance shall have the right, from time to time, to purchase from us senior priority interests in certain loans made to fund the vertical construction of one to four family residential dwellings (“Eligible Loans”). The LPSA is made effective as of August 1, 2016. Each Eligible Loan will be evidenced by notes secured by, among other things, mortgages or deeds of trust encumbering the respective construction properties.
Previously, we had entered into a separate Loan Purchase and Sale Agreement with 1st Financial dated as of December 24, 2014, as amended (the “Original LPSA”). Builder Finance is a subsidiary of 1st Financial. The LPSA governs all Eligible Loans purchased from us on or after August 1, 2016, even those that would have been owned by 1st Financial pursuant to the Original LPSA. We, 1st Financial, and Builder Finance entered into a Confirmation Agreement dated as of February 6, 2017 which confirmed that all Eligible Loans purchased by 1st Financial from us prior to August 1, 2016 will continue to be governed by the terms of the Original LPSA, whereas those purchased on or after August 1, 2016 will be governed by the LPSA.
| F-22 |