Attached files
| file | filename |
|---|---|
| EX-99.1 - EXHIBIT 99.1 - STONERIDGE INC | v460951_ex99-1.htm |
| 8-K - 8-K - STONERIDGE INC | v460951_8k.htm |
This document and information in it may not be copied, reproduced, revealed or appropriated, either in whole or in part, without the prior written consent of Stoneridge, Inc. Technologies In Motion Fourth - Quarter and Full - Year 2016 Results March 2, 2017 Exhibit 99.2

This document and information in it may not be copied, reproduced, revealed or appropriated, either in whole or in part, without the prior written consent of Stoneridge, Inc. Forward - Looking Statements 2 Statements in this presentation that are not historical facts are forward - looking statements, which involve risks and uncertaint ies that could cause actual events or results to differ materially from those expressed or implied by the statements. Important factors that may c aus e actual results to differ materially from those in the forward - looking statements include, among other factors, the loss or bankruptcy of a major c ustomer; the costs and timing of facility closures, business realignment or similar actions; a significant change in medium - and heavy - duty truck, automotive or agricultural and off - highway vehicle production; our ability to achieve cost reductions that offset or exceed customer - mandated selling price reductions; a significant change in general economic conditions in any of the various countries in which Stoneridge operates; la bor disruptions at Stoneridge’s facilities or at any of Stoneridge’s significant customers or suppliers; the ability of suppliers to supply Ston eri dge with parts and components at competitive prices on a timely basis; the amount of Stoneridge’s indebtedness and the restrictive covenants con tai ned in the agreements governing its indebtedness, including its asset - based credit facility and senior secured notes; customer acceptance o f new products; capital availability or costs, including changes in interest rates or market perceptions; the failure to achieve successful i nte gration of any acquired company or business; the occurrence or non - occurrence of circumstances beyond Stoneridge’s control; and the items described in “ Risk Factors” and other uncertainties or risks discussed in Stoneridge’s periodic and current reports filed with the Securities and Exchang e C ommission. Important factors that could cause the performance of the commercial vehicle and automotive industry to differ materially fro m t hose in the forward - looking statements include factors such as (1) continued economic instability or poor economic conditions in the United States and global markets, (2) changes in economic conditions, housing prices, foreign currency exchange rates, commodity prices, including sho rta ges of and increases or volatility in the price of oil, (3) changes in laws and regulations, (4) the state of the credit markets, (5) po lit ical stability, (6) international conflicts and (7) the occurrence of force majeure events. These factors should not be construed as exhaustive and should be considered with the other cautionary statements in Stonerid ge’ s filings with the Securities and Exchange Commission. Forward - looking statements are not guarantees of future performance; Stoneridge’s actual results of operations, financial condit ion and liquidity, and the development of the industry in which Stoneridge operates may differ materially from those described in or suggested b y t he forward - looking statements contained in this presentation. In addition, even if Stoneridge’s results of operations, financial conditi on and liquidity, and the development of the industry in which Stoneridge operates are consistent with the forward - looking statements contained in this pr esentation, those results or developments may not be indicative of results or developments in subsequent periods. This presentation contains time - sensitive information that reflects management’s best analysis only as of the date of this prese ntation. Any forward - looking statements in this presentation speak only as of the date of this presentation, and Stoneridge undertakes no obl igation to update such statements. Comparisons of results for current and any prior periods are not intended to express any future trends or i ndi cations of future performance, unless expressed as such, and should only be viewed as historical data. Stoneridge does not undertake any obligation to publicly update or revise any forward - looking statement as a result of new infor mation, future events or otherwise, except as otherwise required by law. Rounding Disclosure: There may be slight immaterial differences between figures represented in our public filings compared t o w hat is shown in this presentation. The differences are the a result of rounding due to the representation of values in millions rather than tho usands in public filings.
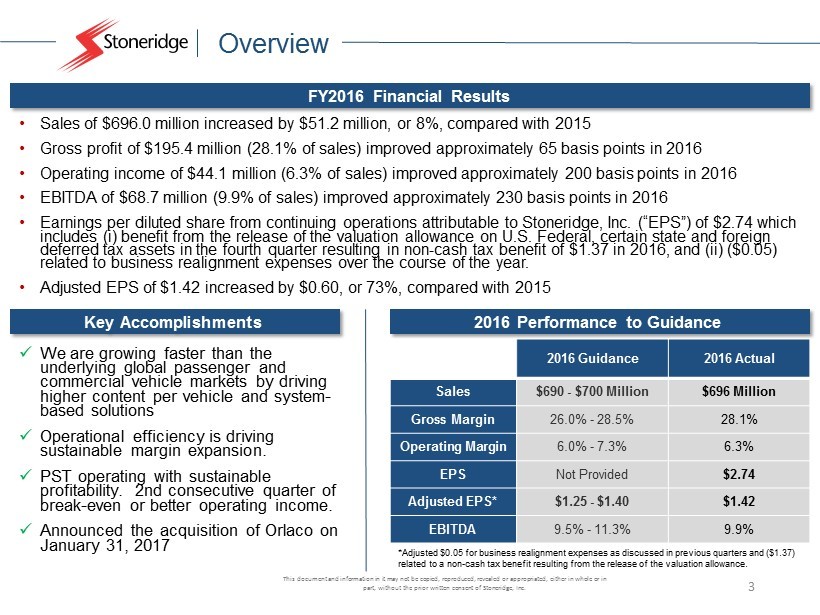
This document and information in it may not be copied, reproduced, revealed or appropriated, either in whole or in part, without the prior written consent of Stoneridge, Inc. Overview 3 x We are growing faster than the underlying global passenger and commercial vehicle markets by driving higher content per vehicle and system - based solutions x Operational efficiency is driving sustainable margin expansion. x PST operating with sustainable profitability. 2nd consecutive quarter of break - even or better operating income. x Announced the acquisition of Orlaco on January 31, 2017 FY 2016 Financial Results Key Accomplishments 2016 Performance to Guidance • Sales of $696.0 million increased by $51.2 million, or 8%, compared with 2015 • Gross profit of $195.4 million (28.1% of sales) improved approximately 65 basis points in 2016 • Operating i ncome of $44.1 million (6.3% of sales) improved approximately 200 basis points in 2016 • EBITDA of $68.7 million (9.9% of sales) improved approximately 230 basis points in 2016 • Earnings per diluted share from continuing operations attributable to Stoneridge, Inc. (“ EPS”) of $2.74 which includes (i) benefit from the release of the valuation allowance on U.S. Federal, certain state and foreign deferred tax assets in the fourth quarter resulting in non - cash tax benefit of $1.37 in 2016, and (ii) ($0.05) related to business realignment expenses over the course of the year. • Adjusted EPS of $1.42 increased by $0.60, or 73%, compared with 2015 *Adjusted $0.05 for business realignment expenses as discussed in previous quarters and ($ 1.37) related to a non - cash tax benefit resulting from the release of the valuation allowance. 2016 Guidance 2016 Actual Sales $690 - $700 Million $696 Million Gross Margin 26.0% - 28.5% 28.1% Operating Margin 6.0% - 7.3% 6.3% EPS Not Provided $2.74 Adjusted EPS* $1.25 - $1.40 $1.42 EBITDA 9.5% - 11.3% 9.9%

This document and information in it may not be copied, reproduced, revealed or appropriated, either in whole or in part, without the prior written consent of Stoneridge, Inc. Financial Summary 4 Sales $0.22 $1.70 Q4 2015 Q4 2016 Operating Income and % Margin EPS $154.6 $172.6 Q4 2015 Q4 2016 $8.3 $10.2 5.4% 5.9% Q4 2015 Q4 2016 Sales $0.82 $2.74 2015 2016 Operating Income and % Margin EPS $644.8 $696.0 2015 2016 $27.8 $44.1 4.3% 6.3% 2015 2016 +12% +22% +56% +8% +58% Full - Year 2016 *Adjusted to exclude impact of valuation allowance release ($1.36) in 4Q16 and ($1.37) for the full year period (based on weighted average shares outstanding) and $0.05 related to business realignment in 2Q16. $0.22 $0.34 Q4 2015 Q4 2016 Adjusted EPS $0.82 $1.42 2015 2016 Adjusted EPS +73% 4 Q 16
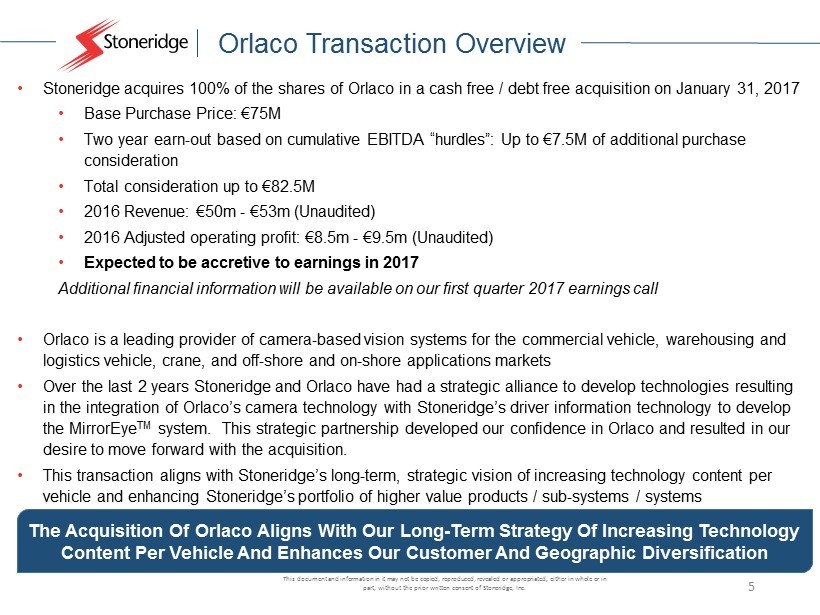
This document and information in it may not be copied, reproduced, revealed or appropriated, either in whole or in part, without the prior written consent of Stoneridge, Inc. Orlaco Transaction Overview 5 The Acquisition O f Orlaco Aligns W ith O ur Long - Term S trategy O f Increasing T echnology C ontent P er V ehicle A nd Enhances O ur Customer A nd Geographic Diversification • Stoneridge acquires 100% of the shares of Orlaco in a cash free / debt free acquisition on January 31, 2017 • Base Purchase Price: € 75M • Two year earn - out based on cumulative EBITDA “hurdles”: Up to € 7.5M of additional purchase consideration • Total consideration up to € 82.5M • 2016 Revenue: € 50m - € 53m (Unaudited) • 2016 Adjusted operating profit: € 8.5m - € 9.5m (Unaudited) • Expected to be accretive to earnings in 2017 Additional financial information will be available on our first quarter 2017 earnings call • Orlaco is a leading provider of camera - based vision systems for the commercial vehicle, warehousing and logistics vehicle, crane, and off - shore and on - shore applications markets • Over the last 2 years Stoneridge and Orlaco have had a strategic alliance to develop technologies resulting in the integration of Orlaco’s camera technology with Stoneridge’s driver information technology to develop the MirrorEye TM system. This strategic partnership developed our confidence in Orlaco and resulted in our desire to move forward with the acquisition. • This transaction aligns with Stoneridge’s long - term, strategic vision of increasing technology content per vehicle and enhancing Stoneridge’s portfolio of higher value products / sub - systems / systems
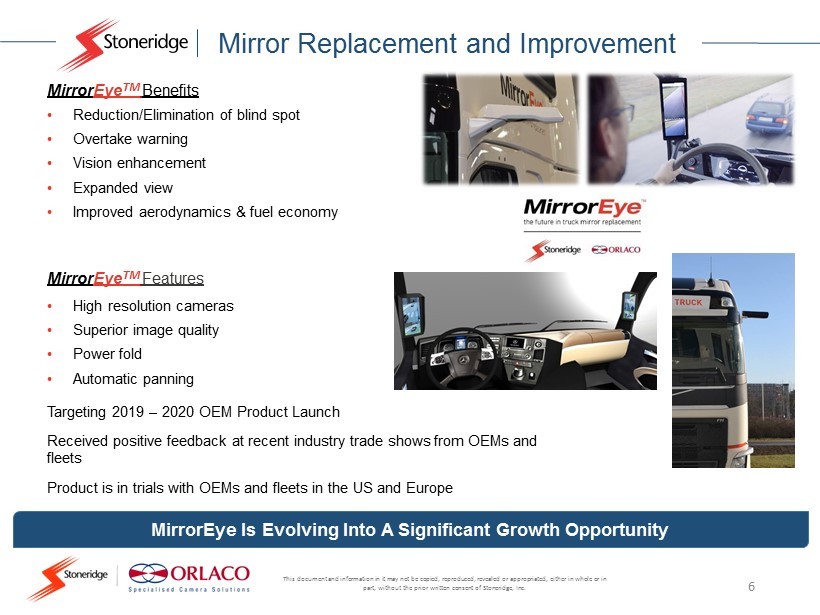
This document and information in it may not be copied, reproduced, revealed or appropriated, either in whole or in part, without the prior written consent of Stoneridge, Inc. Mirror Replacement and Improvement 6 Mirror Eye TM Benefits • Reduction/Elimination of blind spot • Overtake warning • Vision enhancement • Expanded view • Improved aerodynamics & fuel economy Mirror Eye TM Features • High resolution cameras • Superior image quality • Power fold • Automatic panning Targeting 2019 – 2020 OEM Product Launch Received positive feedback at recent industry trade shows from OEMs and fleets Product is in trials with OEMs and fleets in the US and Europe MirrorEye Is Evolving Into A Significant Growth Opportunity
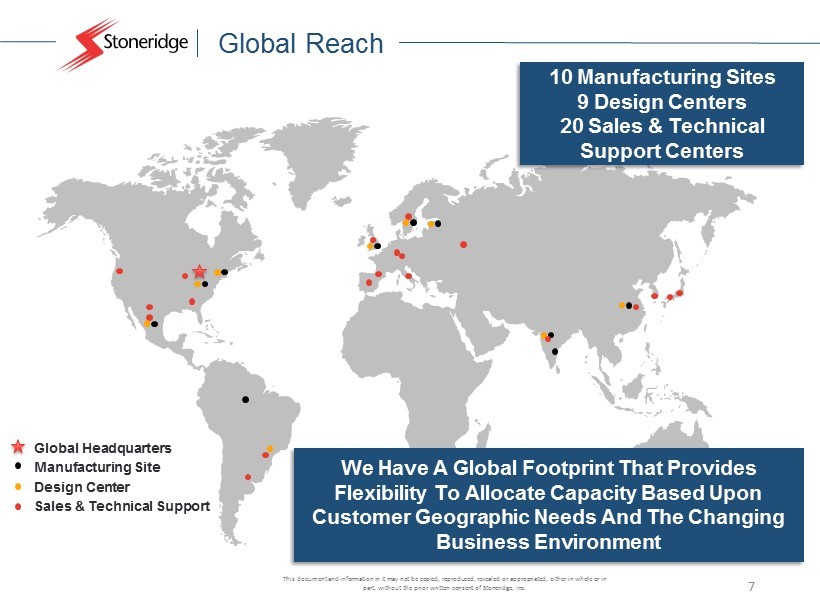
This document and information in it may not be copied, reproduced, revealed or appropriated, either in whole or in part, without the prior written consent of Stoneridge, Inc. Global Reach 7 Global Headquarters Manufacturing Site Design Center Sales & Technical Support 10 Manufacturing Sites 9 Design Centers 20 Sales & Technical Support Centers We Have A Global F ootprint T hat Provides F lexibility T o Allocate C apacity B ased U pon C ustomer G eographic N eeds A nd T he Ch anging B usiness E nvironment
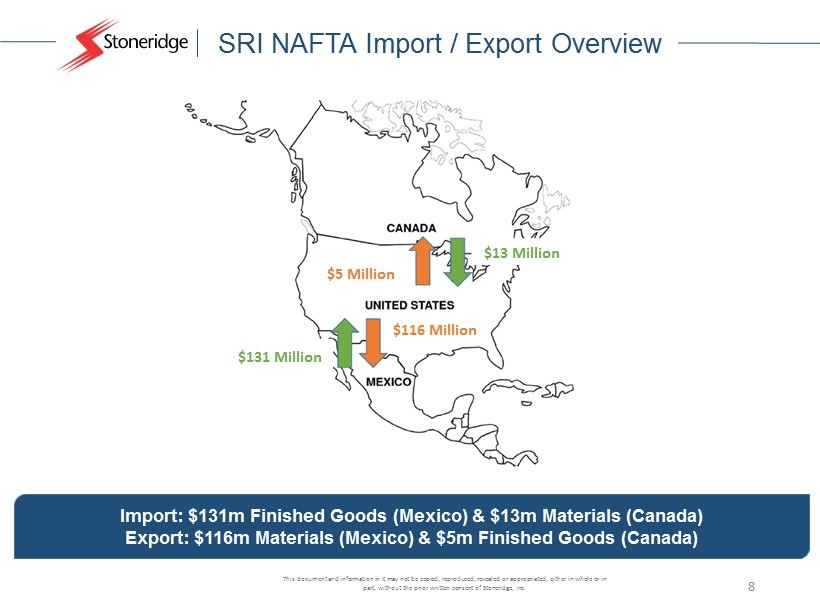
This document and information in it may not be copied, reproduced, revealed or appropriated, either in whole or in part, without the prior written consent of Stoneridge, Inc. SRI NAFTA Import / Export Overview $13 Million $131 Million $116 Million $5 Million 8 Import: $131m Finished G oods (Mexico) & $13m Materials (Canada) Export: $116m M aterials ( Mexico) & $5m F inished G oods (Canada)
This document and information in it may not be copied, reproduced, revealed or appropriated, either in whole or in part, without the prior written consent of Stoneridge, Inc. Q4 and FY2016 Summary 9 • Full - year financial performance at the high - end of expectations through strong sales growth performance and improved, sustainable operating margins • PST continues to operate with positive operating income for the quarter driven by dramatic reductions in hourly payroll, SG&A and design and development costs • The successful completion of the Orlaco acquisition will continue to drive shareholder return through the utilization of our available capital • We are well positioned to adapt to changing global business policies through our global manufacturing capacity, flexibility and dedication to serving our customers We Continue T o Drive S hareholder V alue T hrough S trong F inancial P erformance, A Well D efined Long - Term S trategy A nd Effective U se Of O ur Available C apital
This document and information in it may not be copied, reproduced, revealed or appropriated, either in whole or in part, without the prior written consent of Stoneridge, Inc. Technologies In Motion Financial Update 10

This document and information in it may not be copied, reproduced, revealed or appropriated, either in whole or in part, without the prior written consent of Stoneridge, Inc. FY2016 Summary and 2017 Guidance 11 x We expect continued growth in spite of a reduction to forecasted macro - volumes in our primary markets x We continue to expect margin improvement FY 2016 Financial Results 2017 Guidance Summary 2017 Guidance • Sales of $696.0 million increased by $51.2 million, or 8%, compared with 2015 • Gross profit of $195.4 million (28.1% of sales) improved approximately 65 basis points in 2016 resulting in an increase of $18.5 million, or 10%, compared with 2015 • Operating income of $44.1 million (6.3% of sales) improved approximately 200 basis points in 2016 resulting in an increase of $16.3 million, or 58%, compared with 2015 • EBITDA of $68.7 million (9.9% of sales) improved approximately 230 basis points in 2016 resulting in an increase of $19.9 million, or 41%, compared with 2015 • EPS of $2.74 • Adjusted EPS of $1.42 increased by $ 0.60, or 73%, compared with 2015 2016 Guidance 2016 Actual 2017 Guidance (Excl. Orlaco) Sales $690 - $700 Million $696 Million $705 - $730 Million Gross Margin 26.0% - 28.5% 28.1% 28.0% - 30.0% Operating Margin 6.0% - 7.3% 6.3% 6.5% - 7.5% EPS Not provided $2.74 $1.00 - $1.15 Adjusted EPS $1.25 - $1.40* $1.42* $1.40 - $1.50** EBITDA 9.5% - 11.3% 9.9% 10.0% - 11.5% *Adjusted $0.05 for business realignment expenses as discussed in previous quarters and ($1.37) related to a non - cash tax benefit resulting from the release of the valuation allowance . **Adjusted $0.35 - $0.40 for the release of the valuation allowance in the fourth quarter of 2016
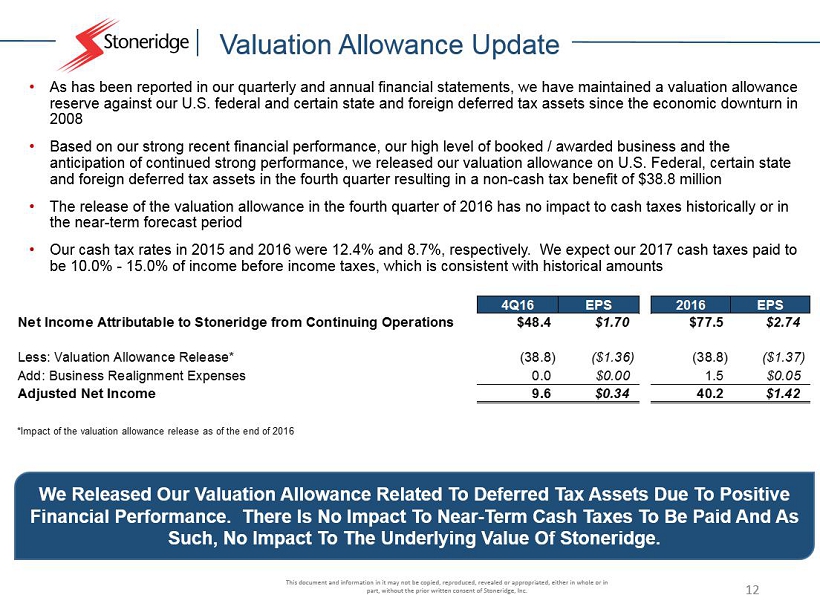
This document and information in it may not be copied, reproduced, revealed or appropriated, either in whole or in part, without the prior written consent of Stoneridge, Inc. Valuation Allowance Update 12 We Released O ur Valuation A llowance R elated T o Deferred T ax A ssets D ue T o Positive F inancial P erformance. There Is No I mpact T o Near - Term Cash T axes T o B e Paid A nd As S uch, No I mpact T o T he Underlying V alue O f Stoneridge. • As has been reported in our quarterly and annual financial statements, we have maintained a valuation allowance reserve against our U.S. federal and certain state and foreign deferred tax assets since the economic downturn in 2008 • Based on our strong recent financial performance, our high level of booked / awarded business and the anticipation of continued strong performance, we released our valuation allowance on U.S. Federal, certain state and foreign deferred tax assets in the fourth quarter resulting in a non - cash tax benefit of $38.8 million • The release of the valuation allowance in the fourth quarter of 2016 has no impact to cash taxes historically or in the near - term forecast period • Our cash tax rates in 2015 and 2016 were 12.4% and 8.7 %, respectively. We expect our 2017 cash taxes paid to be 10.0% - 15.0% of income before income taxes, which is consistent with historical amounts 4Q16 EPS 2016 EPS Net Income Attributable to Stoneridge from Continuing Operations $48.4 $1.70 $77.5 $2.74 Less: Valuation Allowance Release* (38.8) ($1.36) (38.8) ($1.37) Add: Business Realignment Expenses 0.0 $0.00 1.5 $0.05 Adjusted Net Income 9.6 $0.34 40.2 $1.42 *Impact of the valuation allowance release as of the end of 2016
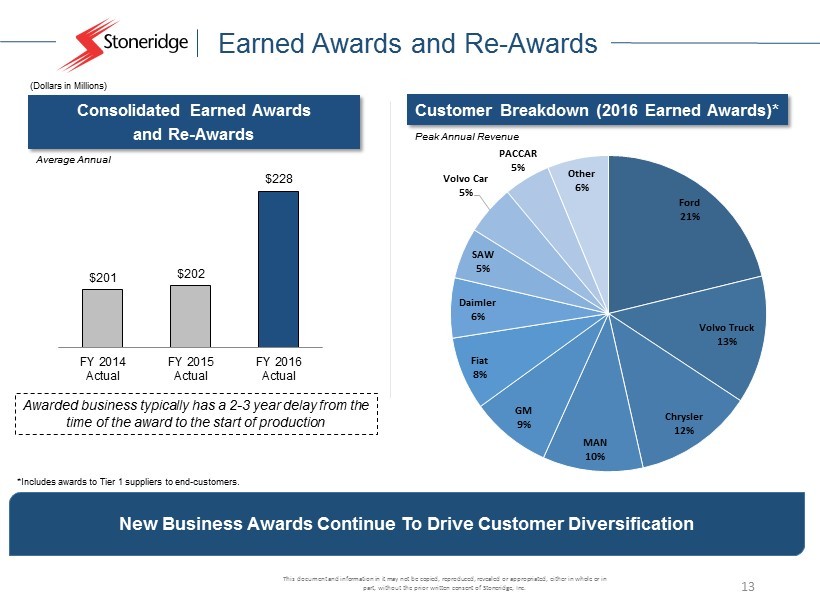
This document and information in it may not be copied, reproduced, revealed or appropriated, either in whole or in part, without the prior written consent of Stoneridge, Inc. Earned Awards and Re - Awards 13 Average Annual Peak Annual Revenue (Dollars in Millions) $201 $202 $228 FY 2014 Actual FY 2015 Actual FY 2016 Actual New Business A wards C ontinue T o D rive C ustomer D iversification Customer Breakdown ( 2016 Earned Awards)* Consolidated Earned Awards and Re - Awards *Includes awards to Tier 1 suppliers to end - customers. Ford 21% Volvo Truck 13% Chrysler 12% MAN 10% GM 9% Fiat 8% Daimler 6% SAW 5% Volvo Car 5% PACCAR 5% Other 6% Awarded business typically has a 2 - 3 year delay from the time of the award to the start of production
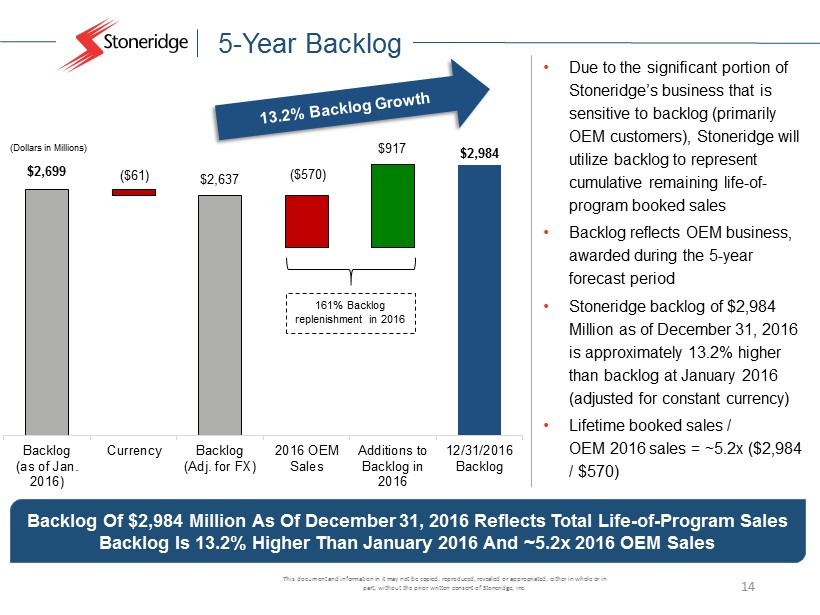
This document and information in it may not be copied, reproduced, revealed or appropriated, either in whole or in part, without the prior written consent of Stoneridge, Inc. 5 - Year Backlog 14 $2,699 $2,984 ($61) $2,637 ($570) $917 Backlog (as of Jan. 2016) Currency Backlog (Adj. for FX) 2016 OEM Sales Additions to Backlog in 2016 12/31/2016 Backlog 161% Backlog replenishment in 2016 (Dollars in Millions) • Due to the significant portion of Stoneridge’s business that is sensitive to backlog (primarily OEM customers), Stoneridge will utilize backlog to represent cumulative remaining life - of - program booked sales • Backlog reflects OEM business, awarded during the 5 - year forecast period • Stoneridge backlog of $2,984 Million as of December 31, 2016 is approximately 13.2% higher than backlog at January 2016 (adjusted for constant currency ) • Lifetime booked sales / OEM 2016 sales = ~5.2x ($2,984 / $570 ) Backlog Of $2,984 Million As O f December 31, 2016 Reflects Total Life - of - Program Sales Backlog I s 13.2% Higher Than January 2016 And ~5.2x 2016 OEM Sales
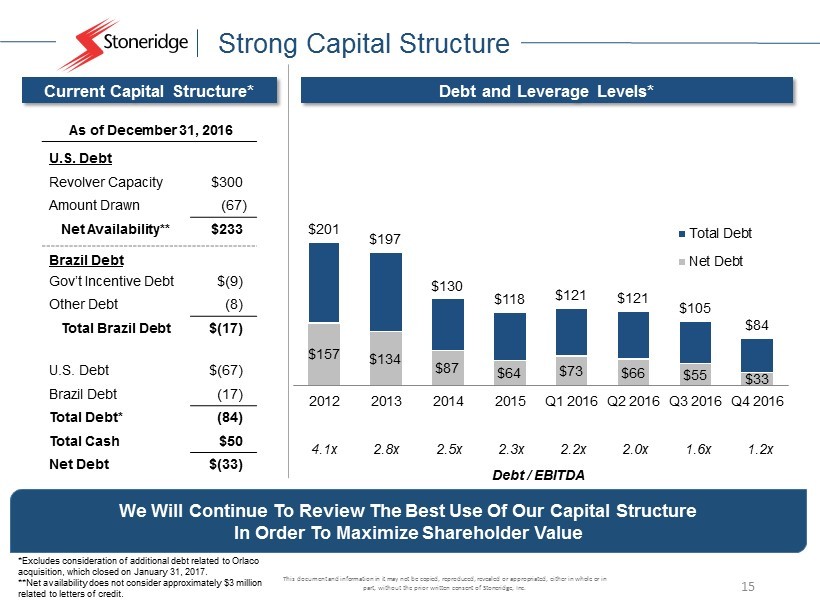
This document and information in it may not be copied, reproduced, revealed or appropriated, either in whole or in part, without the prior written consent of Stoneridge, Inc. Strong Capital Structure 15 As of December 31, 2016 U.S. Debt Revolver Capacity $300 Amount Drawn (67) Net Availability** $233 Brazil Debt Gov’t Incentive Debt $(9) Other Debt (8) Total Brazil Debt $(17) U.S. Debt $(67) Brazil Debt (17) Total Debt* (84) Total Cash $50 Net Debt $(33) Debt and Leverage Levels* $157 $134 $87 $64 $73 $66 $55 $33 $201 $197 $130 $118 $121 $121 $105 $84 2012 2013 2014 2015 Q1 2016 Q2 2016 Q3 2016 Q4 2016 Total Debt Net Debt Current Capital Structure* We Will C ontinue T o R eview T he Best U se O f O ur C apital S tructure In O rder T o M aximize S hareholder V alue 4.1x 2.8x 2.5x 2.3x 2.2x 2.0x 1.6x 1.2x Debt / EBITDA *Excludes consideration of additional debt related to Orlaco acquisition, which closed on January 31, 2017. **Net availability does not consider approximately $3 million related to letters of credit.
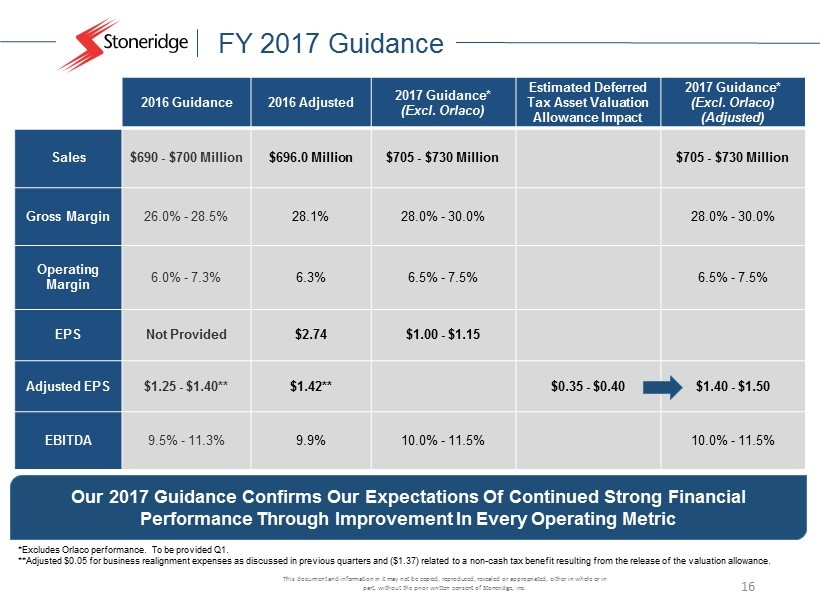
This document and information in it may not be copied, reproduced, revealed or appropriated, either in whole or in part, without the prior written consent of Stoneridge, Inc. 2016 Guidance 2016 Adjusted 2017 Guidance* (Excl. Orlaco) Estimated Deferred Tax Asset Valuation Allowance Impact 2017 Guidance* (Excl. Orlaco) (Adjusted) Sales $690 - $700 Million $696.0 Million $705 - $730 Million $705 - $730 Million Gross Margin 26.0% - 28.5% 28.1% 28.0% - 30.0% 28.0% - 30.0% Operating Margin 6.0% - 7.3% 6.3% 6.5% - 7.5% 6.5% - 7.5% EPS Not Provided $2.74 $1.00 - $1.15 Adjusted EPS $1.25 - $1.40** $1.42** $0.35 - $0.40 $1.40 - $1.50 EBITDA 9.5% - 11.3% 9.9% 10.0% - 11.5% 10.0% - 11.5% FY 2017 Guidance 16 Our 2017 Guidance C onfirms O ur E xpectations O f C ontinued S trong F inancial P erformance T hrough I mprovement I n E very O perating M etric *Excludes Orlaco performance. To be provided Q1 . **Adjusted $0.05 for business realignment expenses as discussed in previous quarters and ($1.37) related to a non - cash tax benef it resulting from the release of the valuation allowance.
This document and information in it may not be copied, reproduced, revealed or appropriated, either in whole or in part, without the prior written consent of Stoneridge, Inc. Q4 and FY2016 Financial Summary 17 • Full - Year financial performance exceeded expectations through strong top - line performance and improved, sustainable operating margins • Provided 2017 guidance suggests top - line growth and continued margin expansion • We released our valuation allowance in the fourth quarter of 2016 resulting in an additional $38.8 million of net income. This will have no impact on the cash tax rate in the near - term • Business wins and re - wins continue to suggest strong future growth and continued business diversification • Our backlog remains very strong at 5.2x 2016 OEM sales over the next 5 years • We continue to evaluate our capital structure to ensure that we are utilizing our available capital to drive the highest shareholder return

This document and information in it may not be copied, reproduced, revealed or appropriated, either in whole or in part, without the prior written consent of Stoneridge, Inc. Technologies In Motion Thank You 18
This document and information in it may not be copied, reproduced, revealed or appropriated, either in whole or in part, without the prior written consent of Stoneridge, Inc. Technologies In Motion Appendix 19
This document and information in it may not be copied, reproduced, revealed or appropriated, either in whole or in part, without the prior written consent of Stoneridge, Inc. Reconciliations to US GAAP 20 This document contains information about Stoneridge's financial results which is not presented in accordance with accounting principles generally accepted in the United States ("GAAP"). Such non - GAAP financial measures are reconciled to their closest GAAP financial measures in the appendix of this document. The provision of these non - GAAP financial measures for 2016 is not intended to indicate that Stoneridge is explicitly or implicitly providing projections on those non - GAAP financial measures, and actual results for such measures are likely to vary from those presented. The reconciliations include all information reasonably available to the Company at the date of this document and the adjustments that management can reasonably predict.
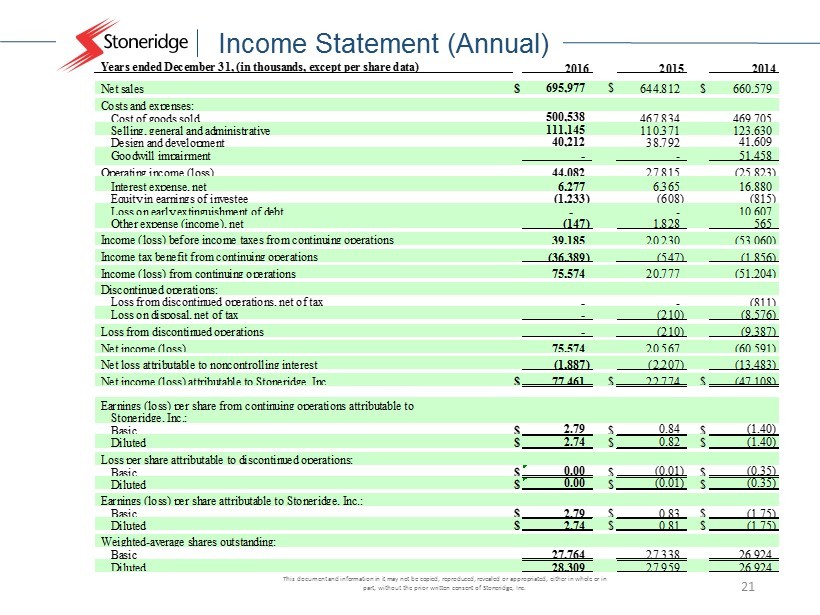
This document and information in it may not be copied, reproduced, revealed or appropriated, either in whole or in part, without the prior written consent of Stoneridge, Inc. Income Statement (Annual) 21 Years ended December 31, (in thousands, except per share data) 2016 2015 2014 Net sales $ 695,977 $ 644,812 $ 660,579 Costs and expenses: Cost of goods sold 500,538 467,834 469,705 Selling, general and administrative 111,145 110,371 123,630 Design and development 40,212 38,792 41,609 Goodwill impairment - - 51,458 Operating income (loss) 44,082 27,815 (25,823) Interest expense, net 6,277 6,365 16,880 Equity in earnings of investee (1,233) (608) (815) Loss on early extinguishment of debt - - 10,607 Other expense (income), net (147) 1,828 565 39,185 20,230 (53,060) (36,389) (547) (1,856) Income (loss) from continuing operations 75,574 20,777 (51,204) Discontinued operations: - - (811) Loss on disposal, net of tax - (210) (8,576) Loss from discontinued operations - (210) (9,387) Net income (loss) 75,574 20,567 (60,591) Net loss attributable to noncontrolling interest (1,887) (2,207) (13,483) Net income (loss) attributable to Stoneridge, Inc. $ 77,461 $ 22,774 $ (47,108) Earnings (loss) per share from continuing operations attributable to Stoneridge, Inc.: Basic $ 2.79 $ 0.84 $ (1.40) Diluted $ 2.74 $ 0.82 $ (1.40) Basic $ 0.00 $ (0.01) $ (0.35) Diluted $ 0.00 $ (0.01) $ (0.35) Earnings (loss) per share attributable to Stoneridge, Inc.: Basic $ 2.79 $ 0.83 $ (1.75) Diluted $ 2.74 $ 0.81 $ (1.75) Weighted-average shares outstanding: Basic 27,764 27,338 26,924 Diluted 28,309 27,959 26,924 Loss per share attributable to discontinued operations: Income (loss) before income taxes from continuing operations Income tax benefit from continuing operations Loss from discontinued operations, net of tax
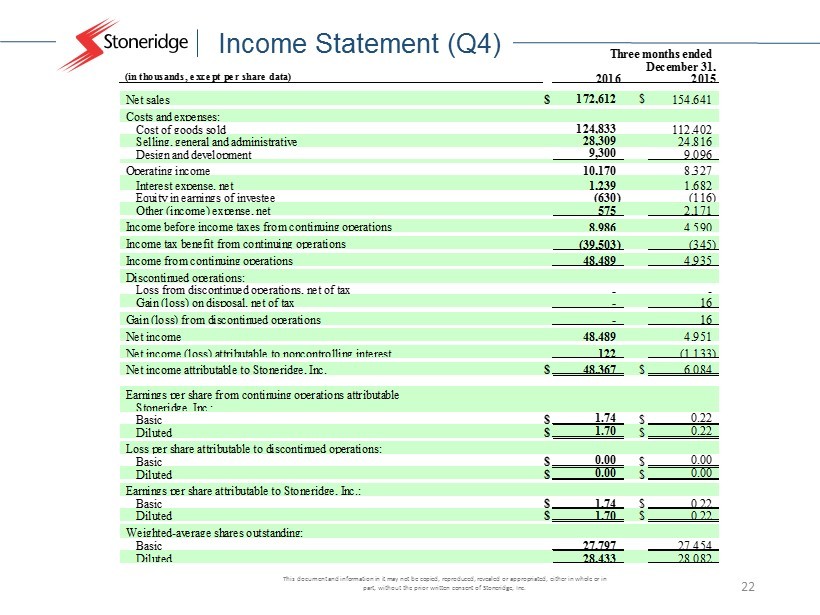
This document and information in it may not be copied, reproduced, revealed or appropriated, either in whole or in part, without the prior written consent of Stoneridge, Inc. Income Statement (Q4) 22 (in thousands, except per share data) 2016 2015 Net sales $ 172,612 $ 154,641 Costs and expenses: Cost of goods sold 124,833 112,402 Selling, general and administrative 28,309 24,816 Design and development 9,300 9,096 Operating income 10,170 8,327 Interest expense, net 1,239 1,682 Equity in earnings of investee (630) (116) Other (income) expense, net 575 2,171 8,986 4,590 (39,503) (345) Income from continuing operations 48,489 4,935 Discontinued operations: - - Gain (loss) on disposal, net of tax - 16 Gain (loss) from discontinued operations - 16 Net income 48,489 4,951 Net income (loss) attributable to noncontrolling interest 122 (1,133) Net income attributable to Stoneridge, Inc. $ 48,367 $ 6,084 Earnings per share from continuing operations attributable Stoneridge, Inc.: Basic $ 1.74 $ 0.22 Diluted $ 1.70 $ 0.22 Basic $ 0.00 $ 0.00 Diluted $ 0.00 $ 0.00 Earnings per share attributable to Stoneridge, Inc.: Basic $ 1.74 $ 0.22 Diluted $ 1.70 $ 0.22 Weighted-average shares outstanding: Basic 27,797 27,454 Diluted 28,433 28,082 Loss per share attributable to discontinued operations: Three months ended December 31, Income before income taxes from continuing operations Income tax benefit from continuing operations Loss from discontinued operations, net of tax
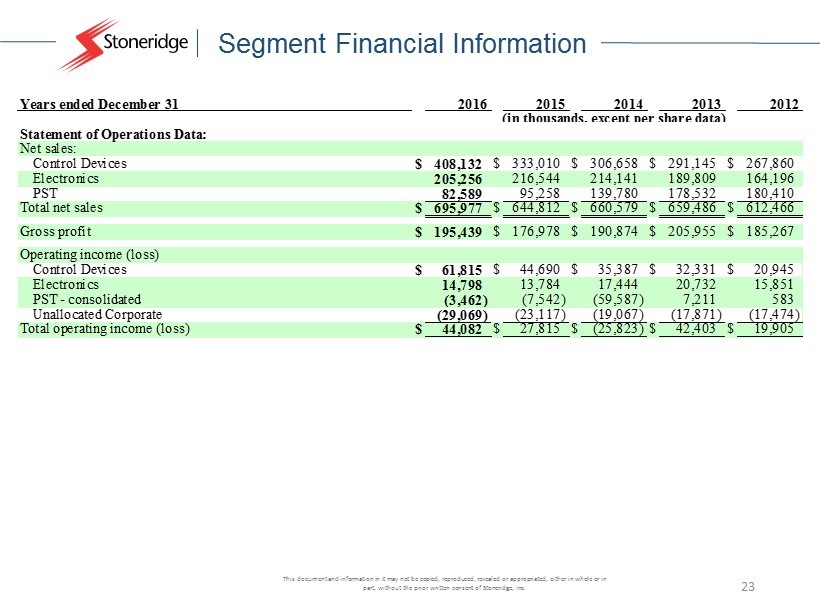
This document and information in it may not be copied, reproduced, revealed or appropriated, either in whole or in part, without the prior written consent of Stoneridge, Inc. Segment Financial Information 23 2016 2015 2014 2013 2012 Statement of Operations Data: Net sales: Control Devices $ 408,132 $ 333,010 $ 306,658 $ 291,145 $ 267,860 Electronics 205,256 216,544 214,141 189,809 164,196 PST 82,589 95,258 139,780 178,532 180,410 Total net sales $ 695,977 $ 644,812 $ 660,579 $ 659,486 $ 612,466 Gross profit $ 195,439 $ 176,978 $ 190,874 $ 205,955 $ 185,267 Operating income (loss) Control Devices $ 61,815 $ 44,690 $ 35,387 $ 32,331 $ 20,945 Electronics 14,798 13,784 17,444 20,732 15,851 PST - consolidated (3,462) (7,542) (59,587) 7,211 583 Unallocated Corporate (29,069) (23,117) (19,067) (17,871) (17,474) Total operating income (loss) $ 44,082 $ 27,815 $ (25,823) $ 42,403 $ 19,905 Years ended December 31 (in thousands, except per share data)
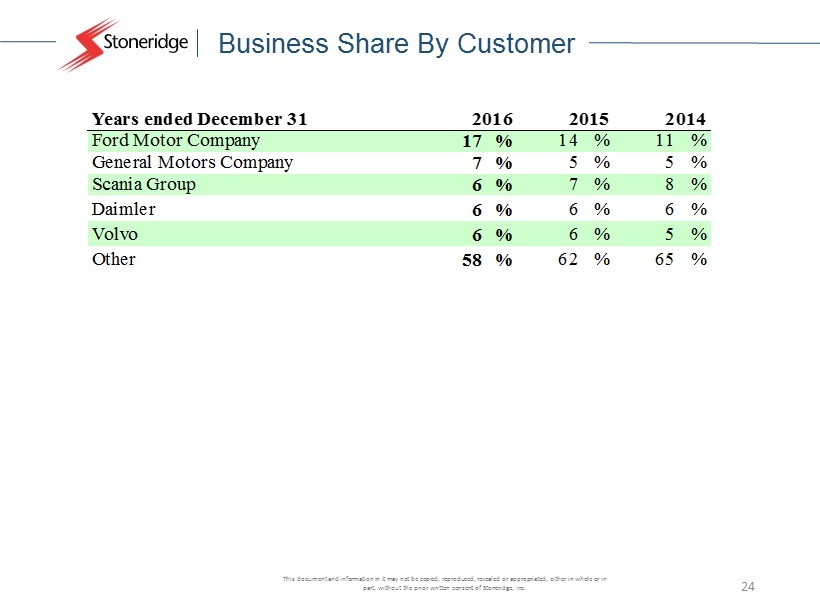
This document and information in it may not be copied, reproduced, revealed or appropriated, either in whole or in part, without the prior written consent of Stoneridge, Inc. Business Share By Customer 24 Ford Motor Company 17 % 14 % 11 % General Motors Company 7 % 5 % 5 % Scania Group 6 % 7 % 8 % Daimler 6 % 6 % 6 % Volvo 6 % 6 % 5 % Other 58 % 62 % 65 % Years ended December 31 2016 2015 2014
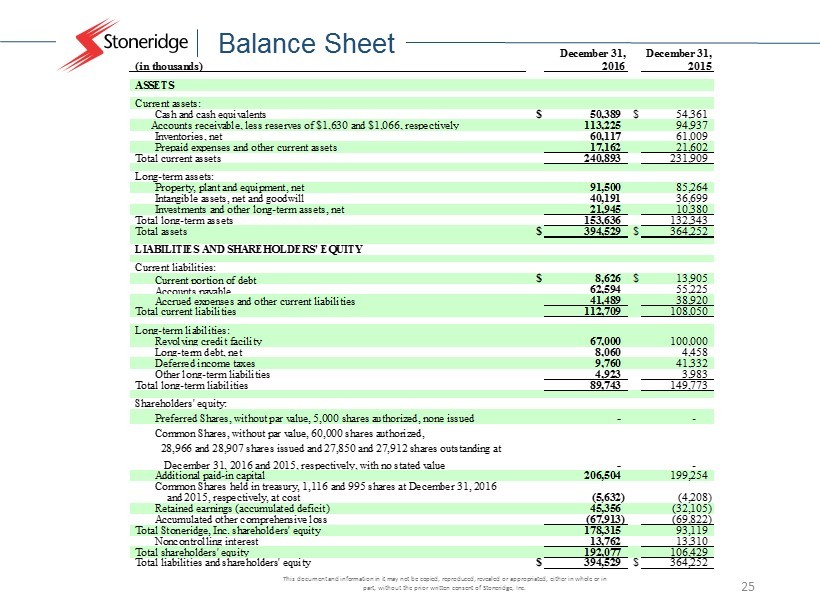
This document and information in it may not be copied, reproduced, revealed or appropriated, either in whole or in part, without the prior written consent of Stoneridge, Inc. Balance Sheet 25 December 31, December 31, (in thousands) 2016 2015 ASSETS Current assets: Cash and cash equivalents $ 50,389 $ 54,361 Accounts receivable, less reserves of $1,630 and $1,066, respectively 113,225 94,937 Inventories, net 60,117 61,009 Prepaid expenses and other current assets 17,162 21,602 Total current assets 240,893 231,909 Long-term assets: Property, plant and equipment, net 91,500 85,264 Intangible assets, net and goodwill 40,191 36,699 Investments and other long-term assets, net 21,945 10,380 Total long-term assets 153,636 132,343 Total assets $ 394,529 $ 364,252 LIABILITIES AND SHAREHOLDERS' EQUITY Current liabilities: Current portion of debt $ 8,626 $ 13,905 Accounts payable 62,594 55,225 Accrued expenses and other current liabilities 41,489 38,920 Total current liabilities 112,709 108,050 Long-term liabilities: Revolving credit facility 67,000 100,000 Long-term debt, net 8,060 4,458 Deferred income taxes 9,760 41,332 Other long-term liabilities 4,923 3,983 Total long-term liabilities 89,743 149,773 Shareholders' equity: Preferred Shares, without par value, 5,000 shares authorized, none issued - - Common Shares, without par value, 60,000 shares authorized, - - Additional paid-in capital 206,504 199,254 and 2015, respectively, at cost (5,632) (4,208) Retained earnings (accumulated deficit) 45,356 (32,105) Accumulated other comprehensive loss (67,913) (69,822) Total Stoneridge, Inc. shareholders' equity 178,315 93,119 Noncontrolling interest 13,762 13,310 Total shareholders' equity 192,077 106,429 Total liabilities and shareholders' equity $ 394,529 $ 364,252 28,966 and 28,907 shares issued and 27,850 and 27,912 shares outstanding at December 31, 2016 and 2015, respectively, with no stated value Common Shares held in treasury, 1,116 and 995 shares at December 31, 2016
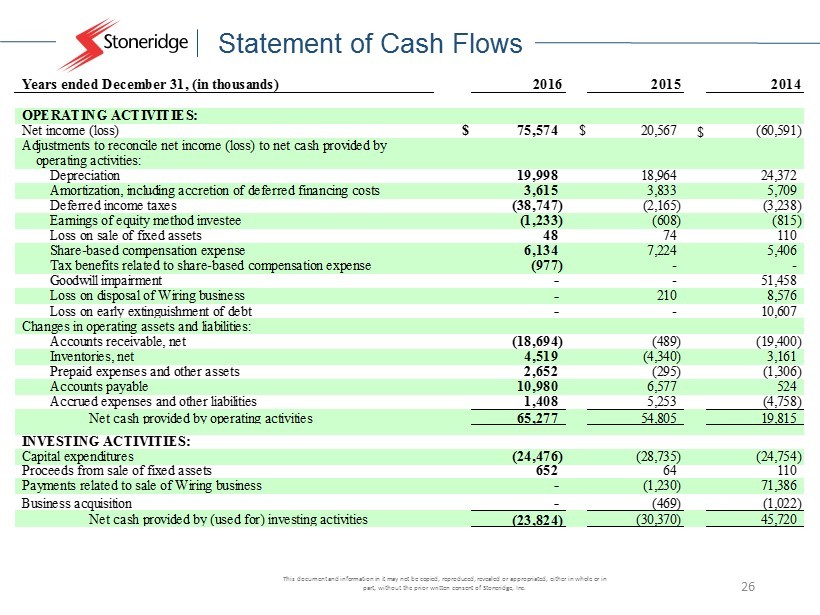
This document and information in it may not be copied, reproduced, revealed or appropriated, either in whole or in part, without the prior written consent of Stoneridge, Inc. Statement of Cash Flows 26 Years ended December 31, (in thousands) 2016 2015 2014 OPERATING ACTIVITIES: Net income (loss) $ 75,574 $ 20,567 $ (60,591) Adjustments to reconcile net income (loss) to net cash provided by operating activities: Depreciation 19,998 18,964 24,372 Amortization, including accretion of deferred financing costs 3,615 3,833 5,709 Deferred income taxes (38,747) (2,165) (3,238) Earnings of equity method investee (1,233) (608) (815) Loss on sale of fixed assets 48 74 110 Share-based compensation expense 6,134 7,224 5,406 Tax benefits related to share-based compensation expense (977) - - Goodwill impairment - - 51,458 Loss on disposal of Wiring business - 210 8,576 Loss on early extinguishment of debt - - 10,607 Accounts receivable, net (18,694) (489) (19,400) Inventories, net 4,519 (4,340) 3,161 Prepaid expenses and other assets 2,652 (295) (1,306) Accounts payable 10,980 6,577 524 Accrued expenses and other liabilities 1,408 5,253 (4,758) Net cash provided by operating activities 65,277 54,805 19,815 INVESTING ACTIVITIES: Capital expenditures (24,476) (28,735) (24,754) Proceeds from sale of fixed assets 652 64 110 Payments related to sale of Wiring business - (1,230) 71,386 Business acquisition - (469) (1,022) Net cash provided by (used for) investing activities (23,824) (30,370) 45,720 Changes in operating assets and liabilities:
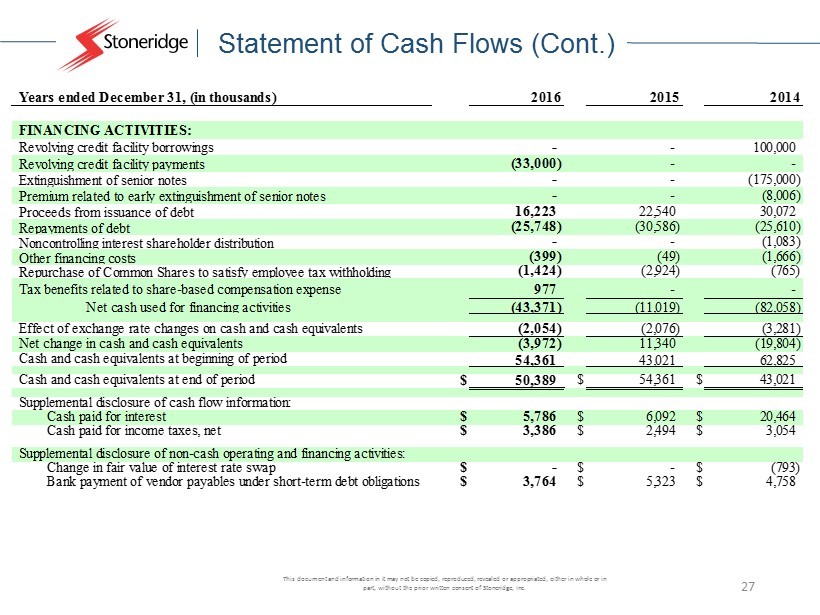
This document and information in it may not be copied, reproduced, revealed or appropriated, either in whole or in part, without the prior written consent of Stoneridge, Inc. Statement of Cash Flows (Cont.) 27 Years ended December 31, (in thousands) 2016 2015 2014 FINANCING ACTIVITIES: Revolving credit facility borrowings - - 100,000 Revolving credit facility payments (33,000) - - Extinguishment of senior notes - - (175,000) Premium related to early extinguishment of senior notes - - (8,006) Proceeds from issuance of debt 16,223 22,540 30,072 Repayments of debt (25,748) (30,586) (25,610) Noncontrolling interest shareholder distribution - - (1,083) Other financing costs (399) (49) (1,666) Repurchase of Common Shares to satisfy employee tax withholding (1,424) (2,924) (765) Tax benefits related to share-based compensation expense 977 - - Net cash used for financing activities (43,371) (11,019) (82,058) Effect of exchange rate changes on cash and cash equivalents (2,054) (2,076) (3,281) Net change in cash and cash equivalents (3,972) 11,340 (19,804) Cash and cash equivalents at beginning of period 54,361 43,021 62,825 Cash and cash equivalents at end of period $ 50,389 $ 54,361 $ 43,021 Supplemental disclosure of cash flow information: Cash paid for interest $ 5,786 $ 6,092 $ 20,464 Cash paid for income taxes, net $ 3,386 $ 2,494 $ 3,054 Supplemental disclosure of non-cash operating and financing activities: Change in fair value of interest rate swap $ - $ - $ (793) Bank payment of vendor payables under short-term debt obligations $ 3,764 $ 5,323 $ 4,758
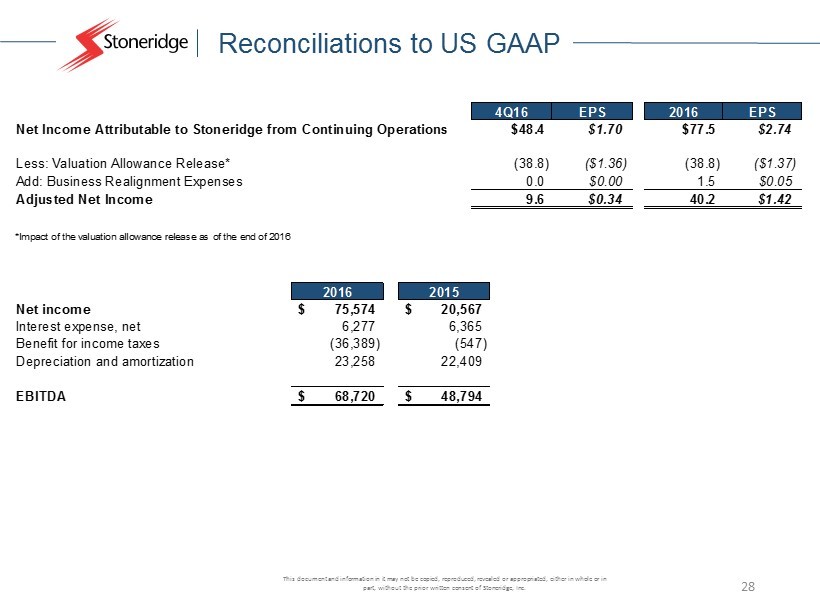
This document and information in it may not be copied, reproduced, revealed or appropriated, either in whole or in part, without the prior written consent of Stoneridge, Inc. Reconciliations to US GAAP 28 4Q16 EPS 2016 EPS Net Income Attributable to Stoneridge from Continuing Operations $48.4 $1.70 $77.5 $2.74 Less: Valuation Allowance Release* (38.8) ($1.36) (38.8) ($1.37) Add: Business Realignment Expenses 0.0 $0.00 1.5 $0.05 Adjusted Net Income 9.6 $0.34 40.2 $1.42 *Impact of the valuation allowance release as of the end of 2016 2016 2015 Net income 75,574$ 20,567$ Interest expense, net 6,277 6,365 Benefit for income taxes (36,389) (547) Depreciation and amortization 23,258 22,409 EBITDA 68,720$ 48,794$