Attached files
| file | filename |
|---|---|
| EX-10.33 - EXHIBIT 10.33 - QUANTENNA COMMUNICATIONS INC | qtna-ex1033x10k.htm |
| EX-32.1 - EXHIBIT 32.1 - QUANTENNA COMMUNICATIONS INC | qtna-ex321.htm |
| EX-31.2 - EXHIBIT 31.2 - QUANTENNA COMMUNICATIONS INC | qtna-ex312.htm |
| EX-31.1 - EXHIBIT 31.1 - QUANTENNA COMMUNICATIONS INC | qtna-ex311.htm |
| EX-23.1 - EXHIBIT 23.1 - QUANTENNA COMMUNICATIONS INC | qtna-ex231x10k.htm |
| EX-10.35 - EXHIBIT 10.35 - QUANTENNA COMMUNICATIONS INC | qtna-ex1035x10k.htm |
| EX-10.34 - EXHIBIT 10.34 - QUANTENNA COMMUNICATIONS INC | qtna-ex1034x10k.htm |
| EX-10.3 - EXHIBIT 10.3 - QUANTENNA COMMUNICATIONS INC | qtna-ex103x10k.htm |
| EX-10.2 - EXHIBIT 10.2 - QUANTENNA COMMUNICATIONS INC | qtna-ex102x10k.htm |
UNITED STATES
SECURITIES AND EXCHANGE COMMISSION
Washington, D.C. 20549
_____________________________________
FORM 10-K
_____________________________________
(Mark One) | |
x | ANNUAL REPORT PURSUANT TO SECTION 13 OR 15(d) OF THE SECURITIES EXCHANGE ACT OF 1934 |
For the fiscal year ended January 1, 2017
or
¨ | TRANSITION REPORT PURSUANT TO SECTION 13 OR 15(d) OF THE SECURITIES EXCHANGE ACT OF 1934 |
For transition period from to
Commission File Number: 001-37927
____________________________________
QUANTENNA COMMUNICATIONS, INC.
(Exact name of Registrant as specified in its charter)
_____________________________________
Delaware | 33-1127317 | |
(State or other jurisdiction of incorporation or organization) | (I.R.S. Employer Identification Number) | |
3450 W. Warren Avenue
Fremont, California 94538(Address of principal executive offices, including zip code)
(510) 743-2260
(Registrant’s telephone number, including area code)
_____________________________________
Securities registered pursuant to Section 12(b) of the Act:
Title of each class | Name of each exchange on which registered | |
Common Stock, par value $0.0001 | The NASDAQ Stock Market LLC | |
(NASDAQ Global Select Market) | ||
Securities registered pursuant to section 12(g) of the Act:
None
__________________
Indicate by a check mark if the Registrant is a well-known seasoned issuer, as defined in Rule 405 of the Securities Act. Yes ¨ No x
Indicate by check mark if the Registrant is not required to file reports pursuant to Section 13 or Section 15(d) of the Act. Yes ¨ No x
Indicate by check mark whether the Registrant (1) has filed all reports required to be filed by Section 13 or 15(d) of the Securities Exchange Act of 1934 during the preceding 12 months (or for such shorter period that the Registrant was required to file such reports), and (2) has been subject to such filing requirements for the past 90 days. Yes ☒ No ☐
Indicate by check mark whether the Registrant has submitted electronically and posted on its corporate Web site, if any, every Interactive Data File required to be submitted and posted pursuant to Rule 405 of Regulation S-T (§232.405 of this chapter) during the preceding 12 months (or for such shorter period that the Registrant was required to submit and post such files). Yes ¨ No ¨
Indicate by check mark if disclosure of delinquent filers pursuant to Item 405 of Regulation S-K is not contained herein, and will not be contained, to the best of Registrant’s knowledge, in definitive proxy or information statements incorporated by reference in Part III of this Form 10-K or any amendment to this Form 10-K. x
Indicate by check mark whether the registrant is a large accelerated filer, an accelerated filer, a non-accelerated filer, or a smaller reporting company. See the definitions of “large accelerated filer,” “accelerated filer” and “smaller reporting company” in Rule 12b-2 of the Exchange Act. (Check one):
Large accelerated filer | ¨ | Accelerated filer | ¨ |
Non-accelerated filer | x (Do not check if a smaller reporting company) | Smaller reporting company | ¨ |
Indicate by check mark whether the registrant is a shell company (as defined in Rule 12b-2 of the Exchange Act). Yes ¨ No x
The aggregate market value of the registrant’s common stock held by non-affiliates of the registrant, based on the closing price of a share of the registrant’s common stock on October 28, 2016 as reported by the NASDAQ Global Select Market on such date was approximately $317,688,682 million. The registrant has elected to use October 28, 2016, which was the initial trading date of the registrant’s common stock on the NASDAQ Global Select Market because on June 30, 2016 (the last business day of the registrant’s most recently completed second fiscal quarter), the registrant was a privately-held company. Shares of the registrant’s common stock held by each executive officer, director and holder of 5% or more of the outstanding common stock have been excluded in that such persons may be deemed to be affiliates. This calculation does not reflect a determination that certain persons are affiliates of the registrant for any other purpose.
As of February 24, 2017, 33,076,150 shares of the registrant’s common stock, $0.0001 par value, were outstanding.
DOCUMENTS INCORPORATED BY REFERENCE
Portions of the information called for by Part III of this Annual Report on Form 10-K where indicated are hereby incorporated by reference from the Definitive Proxy Statement for the registrant’s Annual Meeting of Stockholders to be held in 2017, which will be filed with the Securities and Exchange Commission not later than 120 days after the end of the registrant’s fiscal year ended January 1, 2017.
TABLE OF CONTENTS
Page | ||||
_____________________________________
SPECIAL NOTE REGARDING FORWARD-LOOKING STATEMENTS
This Annual Report on Form 10-K contains forward-looking statements within the meaning of Section 27A of the Securities Act of 1933, as amended, and Section 21E of the Securities Exchange Act of 1934, as amended, which statements involve substantial risks and uncertainties. Forward-looking statements generally relate to future events or our future financial or operating performance. In some cases, you can identify forward-looking statements because they contain words such as “may,” “will,” “should,” “expects,” “plans,” “anticipates,” “could,” “intends,” “target,” “projects,” “contemplates,” “believes,” “estimates,” “predicts,” “potential” or “continue” or the negative of these words or other similar terms or expressions that concern our expectations, strategy, plans or intentions. Forward-looking statements contained in this Annual Report on Form 10-K include, but are not limited to, statements about:
• | our ability to design and develop Wi-Fi solutions; |
• | our ability to attract and retain customers; |
• | our ability to attract and maintain relationships with service providers; |
• | our ability to maintain an adequate rate of revenue growth; |
• | our ability to expand into new Wi-Fi market segments and additional markets; |
• | our ability to achieve design wins; |
• | our future financial and results of operations; |
• | our business plan and our ability to effectively manage our growth and associated investments; |
• | our expectations regarding our industry and potential market; |
• | beliefs and objectives for future operations; |
• | beliefs associated with the use of our solutions; |
• | our ability to further penetrate our existing customer base; |
• | our ability to further develop strategic relationships; |
• | our expectations concerning additional purchase orders by existing customers; |
• | our ability to maintain our competitive technological advantages against new entrants in our industry; |
• | our ability to timely and effectively scale and adapt our existing technology; |
• | our ability to innovate new solutions and bring them to market in a timely manner; |
• | our ability to maintain, protect, and enhance our brand and intellectual property; |
• | our ability to expand internationally; |
• | our ability to increase our revenue and our revenue growth rate; |
• | the effects of increased competition in our market and our ability to compete effectively; |
• | cost of revenue, including changes in costs associated with production, manufacturing and customer support; |
• | operating expenses, including changes in research and development, sales and marketing, and general and administrative expenses; |
• | anticipated income tax rates; |
• | costs associated with defending intellectual property infringement and other claims; |
• | our expectations concerning relationships with third parties, including manufacturing partners; |
• | the release of new products; |
• | economic and industry trends or trend analysis; |
- 3 -
• | the attraction and retention of qualified employees and key personnel; and |
• | future acquisitions of or investments in complementary companies, products or technologies. |
We caution you that the foregoing list may not contain all of the forward-looking statements made in this Annual Report on Form 10-K.
You should not rely upon forward-looking statements as predictions of future events. We have based the forward-looking statements contained in this Annual Report on Form 10-K primarily on our current expectations and projections about future events and trends that we believe may affect our business, financial condition, results of operations and prospects. The outcome of the events described in these forward-looking statements is subject to risks, uncertainties and other factors described in the section titled “Risk Factors” and elsewhere in this Annual Report on Form 10-K. Moreover, we operate in a very competitive and rapidly changing environment. New risks and uncertainties emerge from time to time and it is not possible for us to predict all risks and uncertainties that could have an impact on the forward-looking statements contained in this Annual Report on Form 10-K. We cannot assure you that the results, events and circumstances reflected in the forward-looking statements will be achieved or occur, and actual results, events or circumstances could differ materially from those described in the forward-looking statements.
The forward-looking statements made in this Annual Report on Form 10-K relate only to events as of the date on which the statements are made. We undertake no obligation to update any forward-looking statements made in this Annual Report on Form 10-K to reflect events or circumstances after the date of this Annual Report on Form 10-K or to reflect new information or the occurrence of unanticipated events, except as required by law. We may not actually achieve the plans, intentions or expectations disclosed in our forward-looking statements and you should not place undue reliance on our forward-looking statements. Our forward-looking statements do not reflect the potential impact of any future acquisitions, mergers, dispositions, joint ventures or investments we may make.
- 4 -
PART I
Item 1. BUSINESS
Overview
We are a leader in the design, development, and marketing of advanced high-speed wireless communication solutions enabling wireless local area networking. Our solutions are designed to deliver leading-edge Wi-Fi performance to support an increasing number of connected devices accessing a rapidly growing pool of digital content. We apply our wireless systems and software expertise with high-performance radio frequency, mixed-signal and digital semiconductor design skills to provide highly integrated Wi-Fi solutions to our customers. Our technical expertise and focus on innovation enable us to address the increasing complexity inherent in managing Wi-Fi network access for multiple client devices with different high-bandwidth content streams, while simultaneously delivering superior network speed, broad coverage area, and high capacity and reliability. Our innovative solutions have historically addressed the telecommunications service provider market for home networking applications, including home gateways, repeaters, and set-top boxes, or STBs, but we are increasingly addressing additional end markets, with solutions for retail, outdoor, small and medium business, enterprise and consumer electronics. As a pioneer in high performance Wi-Fi solutions, we believe that we are well positioned to serve the rapidly evolving Wi-Fi needs of customers in both our existing and future end markets. We also believe our significant engineering expertise in wireless and communications can be applied to address other markets beyond Wi-Fi.
Wi-Fi is a ubiquitous standard for wireless network connectivity, defined by the Institute of Electrical and Electronics Engineers, or IEEE, 802.11 standardization body working group, that is rapidly evolving to deliver continued performance improvements while maintaining backward compatibility. According to ABI Research, in 2016 there were approximately 2.8 billion Wi-Fi-enabled devices shipped, of which approximately 1 billion were non-mobile phone devices, and cumulatively, over 12 billion Wi-Fi-connected devices have been shipped worldwide as of the end of 2016. The rapid growth in Wi-Fi connected devices, coupled with the steadily rising volume of global Internet Protocol-based, or IP-based, traffic, such as web browsing, email, Internet audio and video, file sharing, cloud computing and online gaming, has significantly increased the performance requirements of access points that power Wi-Fi networks. Such requirements have led to the adoption of 802.11ac, the latest revision of the 802.11 standard, which offers up to a 10-fold improvement in network speeds over its predecessor. Given the limited wireless spectrum available for Wi-Fi networks and the rapidly increasing demand for Wi-Fi-enabled services, the IEEE standardization body is expected to continue to define more advanced capabilities for future revisions of the standard, such as 802.11ax. The 802.11 standard implementation is left to the chipset vendors, and the inherent complexity and many optional features of the standard result in trade-offs leading to wide-ranging levels of Wi-Fi chipset functionality, performance, power and cost.
As the performance requirements of next generation Wi-Fi increase, a more advanced approach to the design of high-speed wireless communication products is required to address numerous challenges such as increasing Wi-Fi speeds, spectrum sharing, competing traffic, evolving standards, legacy Wi-Fi processing architecture and network interferences. We have pioneered significant enhancements to advanced features such as higher-order Multiple Input and Multiple Output, or MIMO, Multi-User MIMO, or MU-MIMO, transmit beamforming, and additional technologies to achieve superior Wi-Fi performance relative to our competition. Our competitive strengths include support of the most advanced specifications, proprietary technology architectures, and advanced software and system-level algorithms. Furthermore, we have created a cloud-based Wi-Fi analytics and monitoring platform that diagnoses and repairs network inefficiencies remotely.
Customers choose our Wi-Fi solutions to offer products with differentiated network speed, coverage area, reliability, and capacity. Our solutions portfolio is currently comprised of multiple generations of our radio frequency chip and our digital baseband chip, which together support the IEEE Wi-Fi standards, including 802.11n, 802.11ac and draft 802.11ax standard. Radio frequency chips use a combination of analog, digital and high frequency circuits to transmit and receive signals in certain frequencies, such as 2.4 gigahertz, or GHz, and 5GHz for Wi-Fi. Digital baseband chips transmit and receive data to and from radio frequency chips. These chips are typically sold together as a chipset combined with software and system-level reference designs that constitute a highly integrated Wi-Fi solution. We maintain our product differentiation by designing and implementing a variety of innovative system architecture features, as well as advanced software and system-level algorithms.
According to ABI Research, the global market for Wi-Fi chipsets is expected to grow from $3.8 billion in 2016 to $5.2 billion in 2021. We have shipped over 90 million chips to our customers across four semiconductor process generations. Our
- 1 -
chips consist of transistors using various advanced semiconductor fabrication technology nodes, which are measured in nanometers, or nm, to address different system requirements. We are currently in volume production in 90nm, 65nm, 40nm, and we began volume production of 28nm in early 2017. During the year ended January 1, 2017, our global original equipment manufacturer, or OEM, and original design manufacturer, or ODM, customers included Arris International plc, or Arris, Sagemcom Broadband SAS, or Sagemcom, and Technicolor SA, or Technicolor. During the same period, these OEM and ODM customers supported a number of major service providers in the United States as well as internationally. For the year ended January 1, 2017, our revenue was $129.1 million and our net loss was $1.9 million, and we had an accumulated deficit of $161.6 million as of January 1, 2017.
Industry Background
Global growth in IP data traffic and the proliferation of Wi-Fi connected devices are driving demand for more and better Wi-Fi connectivity. In addition, the types of IP traffic carried over Wi-Fi are also expanding. When Wi-Fi was first introduced into homes and enterprises, the predominant applications were email and Internet access. Today, the number of applications supported over Wi-Fi has grown to also encompass voice over IP, high-definition audio, Ultra High Definition television, or UHD, TV, cloud computing, gaming and over-the-top video, which refers to the delivery of video over the subscriber’s broadband connection without the involvement of traditional TV service providers. We believe that Wi-Fi will become the most prevalent method to carry these applications.
To meet these demands, service providers, retail OEMs, enterprise OEMs, and consumer electronics OEMs are increasingly focused on integrating the best Wi-Fi capabilities into their products.
• | Service Providers. Service providers, including AT&T, Inc., or AT&T, Orange S.A., and Telefonica, S.A., are seeking to deploy and manage the best Wi-Fi infrastructure inside the home to enable the connectivity of a growing number of Wi-Fi devices, and to offer a richer complement of value-added services such as high-speed Internet, UHD TV, voice over IP, home security, energy management, cloud computing and gaming. To meet the connectivity and bandwidth demands of such wireless infrastructure, service providers have migrated from home gateways with single-band 2.4GHz 802.11n to the latest dual-band 2.4GHz and 5GHz solutions, which include support for the latest 802.11ac standard. The 802.11ac standard not only supports faster speeds but also allows more devices to be simultaneously connected within the home, which is a crucial requirement as the average number of connected devices per household will continue to grow rapidly. Furthermore, service providers desire to offer their customers a seamless Wi-Fi connectivity experience outside the home. They have increased investments in the deployment of Wi-Fi hotspots to support sophisticated roaming and authentication with other hotspots and with customers’ home gateways. As a result, service providers use Wi-Fi to offer a higher performance, lower cost alternative to traditional mobile cellular services. |
• | Retail OEMs. Retail OEMs, including Asus, Belkin International, Inc. and NETGEAR, Inc. are focusing on higher performance Wi-Fi as consumers are increasingly motivated to invest in higher-performance Wi-Fi for their homes. Consumers desire high-performance Wi-Fi throughout the home to connect many devices including laptops, smartphones, tablets, TVs, gaming consoles, wireless speakers, thermostats, smoke detectors, home security and other IoT applications. As a result, retail OEMs strive to offer routers with the latest Wi-Fi technology and performance to provide customers’ homes with the fastest and most reliable speeds. Accordingly, we believe high-performance Wi-Fi routers will constitute an increasing portion of retail OEM router sales. |
• | Enterprise OEMs. Enterprise OEMs for enterprise networking are seeking to meet the demands of an increasingly mobile workforce that is connecting to the network via multiple devices beyond a desktop or laptop, such as smartphones and tablets. Enterprises are also seeking to optimize the costs of their networking infrastructure by adopting cost-effective wireless architecture. As a result, enterprise OEMs are increasingly adopting higher performance Wi-Fi in their products to achieve higher speeds and improved wireless network capacity. Capacity refers to the amount of data that can be supported in a given frequency or channel. 802.11ac access points can support almost three times the capacity of 802.11n access points. Higher capacity translates into a lower cost per bit, which is an important metric when tens, hundreds, or even thousands of access points are deployed in a given enterprise environment. We believe that the combination of higher capacity and lower cost per bit translates into greater enterprise demand for high-performance Wi-Fi enterprise access points. |
• | Consumer Electronics OEMs. A more robust Wi-Fi network inside the home has enabled a proliferation of connected Wi-Fi devices and has driven an increasing need for better delivery of content to those Wi-Fi-enabled devices. As a |
- 2 -
result, consumer electronics OEMs are seeking to incorporate high-performance Wi-Fi in their products. We believe high-performance Wi-Fi is becoming a differentiator in consumer purchase decisions for high-end products which deliver optimal user experience and, as a result, we believe consumer electronics device OEMs will increasingly enable devices, such as 4K UHD TVs, over-the-top set top boxes, and gaming consoles with higher performance Wi-Fi.
Industry Challenges
Designing Wi-Fi solutions to provide the highest levels of performance is imperative to address consumer demands, yet remains very challenging due to the following factors.
Increasing Wi-Fi Speeds. 802.11ac-based devices are up to 10 times faster than prior generation devices, sending data at gigabits per second through the wireless channel, an unpredictable medium filled with obstacles, such as walls, doors, and furniture. As a result, more advanced digital signal processing techniques, such as MIMO, MU-MIMO, and explicit transmit beamforming, are required to keep up with the increasing performance requirements. A device incorporating MIMO technology transmits signals using more than one antenna and receives signals using more than one antenna, which allows the device to have increased speed and range. MU-MIMO refers to an algorithm that allows multiple client devices to be served by a Wi-Fi access point simultaneously. Explicit transmit beamforming is a technique that enables gateways and access points to direct their signals toward a client rather than covering a larger area, which increases transmission efficiency and ultimately improves Wi-Fi speed, range and reliability. Together, these techniques increase the performance level of 802.11ac solutions with improved range and more reliable connections, while serving an increased number of simultaneous users.
Spectrum Sharing. Wi-Fi operates in a limited, unlicensed wireless spectrum, as regulated in the United States by the Federal Communications Commission, or FCC. While the 5GHz spectrum used by 802.11ac is inherently wider relative to the 2.4GHz spectrum, it is not always entirely available due to regulatory constraints that vary from country to country. For example, in many parts of the world, much of the 5GHz spectrum is reserved for military, weather radar, and air traffic control applications. These regulations mandate that Wi-Fi devices vacate such reserved spectrum upon detection of higher priority applications. To reliably achieve maximum speeds with 802.11ac, some of this restricted spectrum needs to be utilized. Therefore, a method referred to as Dynamic Frequency Selection, or DFS, needs to be implemented to accurately detect when these channels are available for Wi-Fi use. As bands become wider, it becomes increasingly critical for Wi-Fi applications to operate in the DFS spectrum. In the United States, in the 5GHz frequency band, there are 16 DFS channels that can be used in addition to the nine non-DFS channels. Therefore, a network that can use these DFS channels will increase total system capacity by almost threefold. Implementing efficient use of DFS channels requires complex algorithms.
Competing Traffic. The types of traffic carried by Wi-Fi are rapidly increasing as technology providers seek to enable more device connectivity and value-added services. Each type of traffic has unique quality metrics that must be met in order to create a satisfactory user experience. For example, voice and video latencies must be low to ensure that users do not perceive any gaps in performance. Internet webpage and email traffic are sporadic by nature and typically do not have strict latency guidelines. As a result, certain traffic types need to be prioritized over others. A comprehensive Quality of Service, or QoS, mechanism is needed to prioritize traffic types, guarantee on-time delivery of specific traffic types ahead of others, and scale to meet the increased number of Wi-Fi clients in a network.
Rapid Evolution of Industry Standards. The IEEE standardization body continually strives to improve Wi-Fi functionality and performance. For example, from 1997 to 2013, Wi-Fi maximum speeds increased from 1Mbps under the 802.11 standard to 6.8 gigabit per second, or Gbps, with the 802.11ac revision. All competitors in the Wi-Fi solutions market design their products according to the same IEEE Wi-Fi standards, which have become more complex as each subsequent standard includes an increasing number of specifications for both basic and optional features. While all Wi-Fi products need to incorporate all of the basic specifications under the standards, competitors in the high-performance Wi-Fi solutions market distinguish themselves by the speed with which they introduce new products and the degree to which their products are able to support advanced specifications and optional features such as explicit transmit beamforming, high-order MIMO, and MU-MIMO. This trend will continue with 802.11ax, the future revision of the 802.11 Wi-Fi standard. Some competitors decide to only implement the mandatory specifications and leave more complex optional features out of their products.
Legacy Wi-Fi Processing Architecture. There are seven distinct layers of software functions needed for one Wi-Fi device to transmit data to another under IEEE Wi-Fi standards. Layers one and two comprise the Wi-Fi protocol stack, and layers three and above are referred to as higher-layer network functions. Historically, Wi-Fi chipsets were architected such that the host central processing unit, or CPU, inside a gateway or access point handled the majority of the higher-layer network processing
- 3 -
activity. However, as Wi-Fi speeds increase, the ability of the CPU to sustain maximum Wi-Fi data bandwidth while also performing other tasks is compromised. As a result, in order for the end product to meet its performance specifications, the Wi-Fi chipset must be capable of processing a greater proportion of both the Wi-Fi protocol stack and network functions to ensure that host CPUs have the bandwidth to operate properly.
Network Interference Management. As Wi-Fi usage increases, higher levels of network congestion will occur. This was especially common with 802.11b 2.4GHz networks, which only had three non-overlapping channels. The limited number of channels meant that there was a high likelihood that competing devices were using the same channel, thereby degrading performance. While the industry’s transition to 5GHz networks temporarily helped to alleviate such degradation by offering more channels, similar congestion and degradation of performance may occur over time. A Wi-Fi management system is needed to constantly monitor and optimize Wi-Fi network performance. Such a system would not only oversee one access point or gateway within a particular home, but would also have the capability to monitor a whole network of access points, which can comprise millions of Wi-Fi clients.
Our Solution and Competitive Strengths
Our four generations of Wi-Fi solutions have been designed to achieve and maintain market leadership. Historically, in each case where we have introduced a new high performance Wi-Fi solution compliant with the 802.11 IEEE standard, we have done so well before our competitors have introduced a comparable product with the same features. This first-mover advantage has enabled us to market and monetize our solutions and capture key new customers and design wins while our competitors were still in the product development phase. This advantage has been particularly evident in the service provider market for home networking applications. Due to long design and deployment cycles, service providers may only undertake major product updates every few years. As a result, the ability to secure a service provider design win for a solution with advanced features can create a market advantage that lasts for months to years, depending on various factors, including how quickly a competitor releases a comparable product, how the performance of the competing product compares to ours, and how the timing of such release relates to the service provider’s design and deployment cycle. We believe our success in pioneering previous Wi-Fi solutions has also given us a head start in the development of next generation Wi-Fi solutions.
We strive to deliver the industry’s highest speed, broadest coverage, highest capacity, and most reliable performance through advanced software and system-level algorithms, Wi-Fi protocol processing using embedded CPUs, and, more recently, the introduction of a cloud-based Wi-Fi network management system. Our solutions allow us to address the industry challenges posed by increasing Wi-Fi speeds, limited spectrum, increasing traffic, legacy Wi-Fi processing architectures and network interference management. We deliver proprietary feature set extensions beyond standard requirements, offering significant performance advantages to the user. Our innovative solutions have historically addressed the service provider market for home networking applications such as home gateways, repeaters, and STBs, and we are increasingly addressing additional end markets, with solutions for home networking and small and medium business applications (e.g., routers and repeaters), enterprise networking (e.g., access points), and consumer applications, including wireless streaming of audio and video, wireless TVs, and wireless speakers.
Performance Benefits We Provide to Our Customers and Service Providers
We believe our Wi-Fi solutions enable the highest overall level of Wi-Fi performance in the market relative to network speed, range, capacity and reliability. A high-performing solution results in a positive user experience and high level of satisfaction from customers, service providers and their subscribers. The performance benefits that we provide to our customers and their target service providers are set forth below.
OEM and ODM Customers
• | Integrated 2.4GHz and 5GHz Solutions. Our most recent solutions include both 2.4 GHz and 5 GHz capabilities. As a result, our customers only need to design in a single chipset, instead of one for each frequency band. This integrated solution not only enables a more streamlined design process, but also maximizes interoperability and performance. |
• | Streamlined Integration and Faster Time to Market. We have designed host offload technology, which allows the majority of Wi-Fi functions to be executed within our baseband chips. This offload software capability streamlines the integration of our chipsets into customer and reference design partner platforms. In addition, our experienced customer engineering support team engages with our OEM and ODM customers and partners early in their respective design cycles, which we believe accelerates their product development and ultimately optimizes product performance. |
- 4 -
Service Providers
• | Improved Subscriber Experience and Increased Subscriber Retention. Our Wi-Fi solutions are high-performance solutions, which helps create a positive subscriber experience when using Wi-Fi. Our Wi-Fi solutions also provide enhanced network performance capabilities, which enable service providers to offer their subscribers a broader range of value-added products and services such as wireless phone service, wireless set-top boxes and seamless streaming of ultra-high definition video. By offering such premium products and services, we believe service providers are able to generate more revenue per subscriber and deliver a better subscriber experience, which contributes to improved subscriber retention. |
• | Longer Lifecycle and Reduced Capital Investment. Subscribers desire the most up-to-date technologies from their service providers. Devices featuring our solutions offer the leading edge of Wi-Fi technology, and therefore have a longer lifecycle and time to obsolescence. Additionally, a high-performing Wi-Fi infrastructure results in lower network expenditures for service providers by offloading cellular data, thereby reducing the burden on the cellular network. |
• | Fewer Service Disruptions and Lower Support Costs. Because our Wi-Fi solutions support the most advanced IEEE Wi-Fi optional specifications, they provide higher speed, greater range and better reliability than our competitors’ products, which increases the quality of data transmission and improves Wi-Fi connectivity within a given area. We believe the high quality and reliability of our Wi-Fi solutions results in fewer service disruptions, and therefore reduces customer complaints and the need for support calls and on-site service requests. |
• | Automated Network Management. We have a cloud-based Wi-Fi analytics platform which allows us to remotely collect data from our products in the field. The dataset helps us to efficiently support our customers, improve future performance of our products and improve our customers’ ability to ramp deployments, ultimately accelerating our time to market. |
Our competitive strengths include:
• | Market Leadership through Support of the Most Advanced Specifications. We design Wi-Fi solutions that support the most advanced IEEE Wi-Fi optional specifications, which allows us to be a leader in terms of both performance and innovation. For example, we shipped the world’s first 4x4 MIMO solution when our competitors were providing products with support for only 2x2 or 3x3 MIMO. Today, we are the first and only company shipping the full 8x8 MIMO specification of 802.11ac with our QSR10G Wi-Fi solution, which we believe allows us to offer the highest speed as well as the farthest range. While some of our competitors offer a wider variety of products, many of those products incorporate only basic features for low-performance applications outside our target market segments. In contrast, we focus on segments of the market where advanced features are critical for the targeted application to provide higher performance, such as whole home coverage or video delivery over Wi-Fi. |
• | Proprietary Technology Architectures. We design proprietary technology architectures that we deliver through our high-performing chipsets. The 802.11 standard does not dictate implementation and a significant portion of modem design is vendor discretionary. We were the first to commercially introduce several new technology architectures, including the first 4-stream 802.11n 4x4 chipset in 2010, the first 4x4 802.11ac chipset in 2013 and the first 802.11ac 8x8 chipset in 2015. We were the first Wi-Fi solution provider to have integrated 12 chains on a single baseband chip die and eight transmit and eight receive chains on a single radio frequency chip, or RFIC, die as part of a 10Gbps Wi-Fi access point solution. Transmit and receive chains refer to circuitry in the RFIC responsible for transmitting and receiving data, respectively. We believe our proprietary architectures are a key part of what enables us to successfully compete against our larger, more established competitors. |
• | Advanced Software and System-Level Algorithms. We enable our innovative Wi-Fi solutions with advanced proprietary software and system-level algorithms that provide superior functionality. For example, we were the first to commercially introduce a number of features built on the 802.11 standards, such as 4x4 MIMO, 8x8 MIMO, MU-MIMO, and 4x4 universal beamforming. We have integrated advanced digital signal processing, or DSP, algorithms in each of our baseband chips. The process of detecting and decoding the desired data from a noisy environment requires sophisticated DSP algorithms, which we have developed over the last 10 years. These algorithms include explicit transmit beamforming, MIMO, MU-MIMO, and others. We believe these algorithms are crucial to the performance and stability of products integrating our solutions. |
• | Pure Focus on High-Performance Wi-Fi Solutions and Deep Wireless Engineering Expertise. Our research and development, engineering, manufacturing, sales, and marketing activities are focused mainly on high-performance Wi- |
- 5 -
Fi solutions, which we believe gives us an advantage over many of our competitors who do not focus exclusively on Wi-Fi. We have assembled a world-class wireless engineering team comprised of over 250 engineers worldwide with demonstrated capabilities in silicon and systems engineering, software engineering and customer engineering, including more than 150 with advanced degrees in relevant fields.
• | Deep Relationships with Our Customers and Reference Design Partners. We have built collaborative relationships with our customers and reference design partners, many of whom are industry leaders. We believe these relationships provide us with enhanced visibility into their future requirements. We often collaborate with these leaders at the front end of the design cycle and help them architect their next-generation products. We believe we have a strong industry reputation for responsiveness and delivering Wi-Fi solutions that meet or exceed our customers and reference design partners’ technological requirements, as well as their overall business needs. |
Our Strategy
The key components of our strategy include the following:
• | Continue to Deliver Wi-Fi Innovation. The Wi-Fi industry is constantly evolving as new technologies emerge and standards are updated. We intend to continue our investment in research and development to drive further innovation, including new Wi-Fi standards, and maintain a market leadership position in the Wi-Fi marketplace. |
• | Expand Share in Service Provider Market. We intend to leverage our growing number of service provider and OEM and ODM relationships to aggressively market our solutions’ competitive advantages and increase our footprint among service providers. This market is characterized by long product lifecycles and stable customer engagements with greater visibility into future revenue. In addition, we intend to expand our geographic reach beyond North America and Western Europe, which are currently the predominant end markets for our Wi-Fi solutions. |
• | Leverage Industry Partnerships to Promote Adoption of Our Solutions. We maintain partnerships with several technology industry leaders to ensure the compatibility of our solutions with other components of the end product, and to promote the adoption of our Wi-Fi solutions. We will seek to broaden and strengthen these partnerships to drive design wins and establish incumbency. |
• | Address Other Wi-Fi Market Segments. We have addressed only a small portion of the retail Wi-Fi market opportunity and have not yet entered the small and medium business, enterprise and consumer electronics markets. We intend to leverage our existing technologies and solutions, as well as broaden our Wi-Fi solutions portfolio, to continue to expand our presence in the retail Wi-Fi market and address the small and medium business, enterprise, consumer electronics and other markets. |
• | Broaden Solutions Beyond Wi-Fi. We believe our existing technologies and wireless engineering expertise, as well as our deep industry relationships, provide us an opportunity to expand beyond the Wi-Fi market through a combination of organic investments and acquisitions. |
Our Products and Technology
Our differentiated Wi-Fi system architecture typically consists of a RFIC and a digital baseband system-on-chip, or baseband SOC. The RFIC transmits and receives at a particular frequency, and the baseband SOC implements system-level algorithms to process physical layer (layer one) functions and additional logic that executes software to process 802.11 protocols from the signals received to and from the RFIC. The RFIC and baseband SOC are placed on a printed circuit board called a “reference design,” where they interact with the rest of the hardware and software system of the end product.
- 6 -
The typical applications that use our current solutions are:
• | Access Point and Gateways. These applications are at the core of wireless home networking and enterprise access. Our initial solutions supported 2-stream applications with 4x4 5GHz 802.11n, and we have continuously innovated to deliver increasing speeds, culminating in our latest 12-stream (8x8 5GHz 802.11ac and 4x4 2.4GHz and 5GHz 802.11n), 10Gbps, dual-band dual-concurrent offering. Our solutions have also evolved from primarily supporting real-time video delivery over Wi-Fi to supporting voice, video, and data. We seek to extend our industry-leading position by continuing to develop solutions to support the next-generation of Wi-Fi applications. We believe that the increasing demands on wireless home networks and enterprise applications will help drive the need for high performance access points and gateways in the marketplace, which we believe will also contribute to greater demand for high-performance Wi-Fi solutions with higher average selling prices, or ASPs, given the benefits they provide to our customers. |
• | Clients. We provide Wi-Fi solutions for non-mobile client applications such as STBs. We believe the performance advantages of our solutions will better support the latest generation of UHD STBs, which have higher Wi-Fi speed requirements. In addition, increased speed, range, capacity and reliability can be achieved when our client solutions are used in conjunction with our access point and gateway solutions. We believe that overall Wi-Fi penetration of STBs in the marketplace is relatively low. |
• | Repeaters and Distributed Access Points. In certain challenging networking environments, repeaters and distributed access points can be used to provide extended Wi-Fi coverage. Our repeater and distributed access point solutions support advanced functionality, including setup, management, and client connectivity features. We believe repeaters, along with our access point solutions, can play an important role in addressing the growing consumer demand for whole-home coverage. |
We differentiate our solutions portfolio by designing and implementing a variety of innovative system architecture and software features that are aimed at solving the challenges of high-performance wireless networking, including:
Increasing Wi-Fi Speeds
• | Transmit Beamforming. Beamforming is critical to effectively compete in the high-performance Wi-Fi market as it enables gateways and access points to direct their signals toward a client to increase transmission efficiency and improve Wi-Fi speed and range. We were the first to apply Wi-Fi transmit beamforming technology to four antennas, and have continued to optimize it for eight antennas. Beamforming is an integral part of our solutions, and our engineering team includes leading system algorithm experts to address the design and implementation challenges in this field. |
• | Advanced MIMO and MU-MIMO. MIMO technology multiplies the capacity of a wireless connection by allowing access points to transmit and receive multiple streams of data at the same time. MU-MIMO technology permits not only multiple streams to a single device, but also enables multiple client devices to receive multiple streams of data at the same time. When combined, these two features allow the most efficient use of a given channel by offering the highest bits per hertz. A 4x4 MIMO transmission uses four antennas, and an 8x8 MIMO transmission uses eight antennas. We refer to these technologies as higher-order MIMO. Four antennas are used in the 2.4GHz band, and four or eight antennas are used in the 5GHz band. We were the first to commercially introduce MIMO and MU-MIMO for 4x4 802.11n, 4x4 802.11ac, and 8x8 802.11ac. We have experienced wireless system architects and software engineers to lead the implementation of these technologies. |
Spectrum Scarcity
• | SuperDFS Dynamic Smart Channel Selection. SuperDFS is a set of system-level algorithms that combine RFIC, baseband, and software functions to select a particular DFS channel that has the least interference and best system capacity. Our detection mechanisms have been optimized to pass strict FCC product certification guidelines without being overly reactive in DFS frequencies. |
More Traffic Types
• | IQStream Advanced Traffic Management. IQstream is a proprietary system-level algorithm that classifies and prioritizes all types of Wi-Fi traffic in order for the most critical traffic to be delivered with the least interruption. For example, IQStream allows the prioritization of real-time HD video or voice call transmissions over lower priority data such as email and Internet webpage access. |
- 7 -
Legacy Wi-Fi Processing Architecture
• | Host Offload. We have implemented host offload technology, which allows the majority of Wi-Fi functions to be executed within our baseband chips. This not only frees up the resources of the host CPU, but also requires less software integration and optimization between our Wi-Fi chips and the host CPU during system design. This significantly decreases our customers’ product development time. |
Network Management
• | Cloud-based Wi-Fi Management Platform. Our proprietary cloud-based platform comprises a debugging agent embedded within a product, such as an access point, which sends Wi-Fi data to an analytics engine in the cloud. This system permits remote, real-time issue identification and resolution. This allows us to deliver enhanced customer support and Wi-Fi performance. Our cloud-based platform can scale to manage millions of Wi-Fi devices and thus can provide a complete network-wide Wi-Fi management system for our customers. |
• | Smart Wi-Fi Management. Our smart Wi-Fi managed home solution provide a comprehensive solution for total home connectivity. This solution is comprised of a software framework, SONiQ, for the management of multiple access points or repeaters, and a range of repeater hardware reference designs. Together, these two elements manage and optimize home Wi-Fi networks and help provide maximum speed and quality of experience for our customers. |
We are currently shipping our second generation 4x4 802.11n and third generation 4x4 802.11ac Wi-Fi solutions in volume, as well as production samples of our fourth generation 10Gbps Wi-Fi solution. In October 2016, we announced our QSR 10G-AX product, which follows the 802.11ax draft standard. We are expecting to begin sampling this product to early access partners in 2017.
Our Customers
We sell our Wi-Fi solutions directly to global OEMs and ODMs that serve the end markets we target. In addition, we sell our Wi-Fi solutions to third-party distributors who in turn resell to OEMs and ODMs. OEMs incorporate our Wi-Fi solutions into their products, which are then sold to their own customers, such as service providers, retailers, enterprises, small and medium businesses, and retail consumers. To date, we have primarily addressed the service provider market for home networking applications, including home gateways, repeaters, and set-top boxes. We are increasingly addressing additional end markets with solutions for (i) retail OEMs for home networking as well as small and medium business applications (e.g., routers and repeaters), (ii) enterprise OEMs for enterprise networking applications (e.g., access points), and (iii) consumer electronics OEMs for consumer applications, including wireless streaming of audio and video, wireless TVs, and wireless speakers. We believe the life cycles of our customers’ products can range from approximately one year to five years or more depending on the end market.
Some OEMs purchase our Wi-Fi solutions directly from us and use them in the design and manufacture (directly or through their third-party contract manufacturers) of their own products. Other OEMs utilize ODMs to design and build subsystem products incorporating our Wi-Fi solutions, which the OEMs then purchase from the ODM and incorporate into the OEM products. Accordingly, we ship our Wi-Fi solutions either directly to the OEM, its contract manufacturer, or its ODM, based on the requirements of each OEM. However, we maintain close relationships with the target OEM to monitor OEM end-market demand as the initial Wi-Fi solution design win is generally awarded by the OEM.
Service providers purchase the products they sell to, or subsidize for use by, their subscribers through OEMs and ODMs. We typically do not enter into formal agreements with service providers, and our relationship with service providers varies depending on the service provider’s strategy:
• | Service Providers Selecting Wi-Fi Technology Directly. Some service providers, typically those with large subscriber bases, require that a specific Wi-Fi solution be designed into the OEM products they purchase. As a result, although our customers are OEMs and ODMs, we maintain close relationships with these service providers since they award design wins for our Wi-Fi solutions. After a design win is achieved, we continue to work closely with the service providers to assist them and their OEMs and ODMs throughout their product development and early deployment, which can often last six to 18 months. |
• | Service Providers Selecting OEM / ODM Products. Other service providers, typically those with smaller subscriber bases, do not require that specific Wi-Fi solutions be designed into the OEM or ODM products they purchase. As a |
- 8 -
result, the OEM or ODM is the key decision maker with respect to awarding design wins and may incorporate the winning design into their products for numerous service providers. We maintain close relationships with our OEM and ODM customers to secure design wins and monitor end-market demand.
The following table represents OEM, ODM and third-party distributor customers comprising 10% or more of our revenue:
Years Ended | |||||
January 1, 2017 | December 27, 2015 | December 28, 2014 | |||
(Percentage of revenue) | |||||
Customer: | |||||
Pace plc** | 19% | 14% | * | ||
Technicolor SA | 11% | 15% | 11% | ||
Sagemcom Broadband SAS | 11% | * | * | ||
Prohubs International Corp. | * | 11% | * | ||
Gemtek Electronics Co. Ltd. | * | 10% | 28% | ||
CyberTAN, Technology, Inc. | * | * | 21% | ||
________________________
* | Customer percentage of revenue was less than 10%. |
** | Pace plc was acquired by Arris International plc in January 2016. |
Substantially all of our revenue as of January 1, 2017 has been derived from sales to customers serving the service provider home networking market.
Almost all of our revenue is generated outside the United States in the years ended January 1, 2017, December 27, 2015, and, December 28, 2014, based on ship-to destinations, and we anticipate that the vast majority of our shipments will continue to be delivered outside the United States. Although almost all shipments are delivered outside the United States, we believe that a significant number of the Wi-Fi products that include our chips, such as access points, gateways, set-top boxes and repeaters, are ultimately directed and sold by OEM customers to service providers in North America and Western Europe. See Note 13 of our consolidated financial statements included elsewhere in this Annual Report on Form 10-K for information regarding our operations by geographic area.
We currently derive substantially all of our revenue from the sale of our Wi-Fi solutions. During the years ended January 1, 2017, December 27, 2015, and December 28, 2014, revenue from sales of our Wi-Fi solutions constituted 99%, 89%, and 91% of our total revenue, respectively. In addition, during the years ended January 1, 2017, December 27, 2015, and December 28, 2014, we also derived revenue from a limited number of licensing and non-recurring arrangements, which together constituted 1%, 11%, and 9%, of our total revenue, respectively. These arrangements are no longer active. In the future, we may enter into new licensing arrangements on an opportunistic basis. To date, all of our revenue has been denominated in United States dollars.
Sales and Marketing
We sell our solutions worldwide using a combination of a direct sales force and third-party distributors. We employ direct sales teams in the United States, Europe and Asia who support our OEM and ODM customers and service providers. We have located our sales and marketing teams near our existing OEM and ODM customers and larger service providers in the United States (serving North America), France, Spain, Japan, and Taiwan (serving greater Asia). Each salesperson has specific end market expertise. We also employ field application engineers, or FAEs, typically co-located with our direct sales teams, who provide technical pre-sales support to our sales team and assistance to existing and potential customers throughout their design-in and qualification cycles. Our FAE team is organized by end markets as well as core competencies in hardware, software, and wireless systems necessary to support our customers and their target service providers.
To supplement our direct sales team, we have contracts with several independent sales representatives and distributors in the United States, Taiwan, Korea, and China. We selected these independent representatives and distributors based on their ability to provide effective field sales, marketing communications and technical support for our Wi-Fi solutions. In the case of
- 9 -
representatives, our customers place orders with us directly rather than with the representatives who do not maintain any inventory. In the case of distributors, our customers place orders through distributors who purchase inventory from us.
Our sales have historically been made on the basis of purchase orders rather than customer specific, long-term agreements. All of our material terms and conditions are consistent with general industry practice, but vary from customer to customer. We typically receive purchase orders 12 to 14 weeks ahead of the customer’s desired delivery date. Because industry practice allows customers to reschedule or cancel orders on relatively short notice, we believe that backlog is not a reliable indicator of our future revenue.
Our marketing team focuses on our solutions strategy and road maps, product marketing, new solution introduction processes, demand assessment and competitive analysis, marketing communication and public relations.
Manufacturing
We use a fabless semiconductor business model and rely on third-party contractors to fabricate, assemble, and test our chipset designs. We believe this outsourced manufacturing approach gives us access to the best available process technology, reduces our capital requirements, and allows us to focus our resources on the design, development, marketing, sales and customer integration of our Wi-Fi solutions. We use industry-standard complementary metal-oxide semiconductor manufacturing process technology, which enables us to produce cost-effective products and achieve high-performance. We partner with our third-party contractors to improve the efficiency of our supply chain and to secure the necessary level of manufacturing capacity. We work closely with these contractors to improve our chipset’s manufacturability, enhance yields, lower product and manufacturing costs, and improve quality. We are committed to continuous improvements in our chipset design for better manufacturability and in our third-party contractors’ manufacturing processes to achieve the high-quality, reliability, cost, and the performance metrics targets.
Wafer Fabrication, Assembly and Testing
We purchase silicon wafers from Taiwan Semiconductor Manufacturing Corporation, or TSMC, in Taiwan, our foundry partner, which are then shipped to third-party contractors who assemble and test our chipsets. We currently use several process nodes ranging from 90nm to 28nm. We qualify and utilize multiple TSMC facilities to ensure consistent production performance and redundancy, which is a critical component of our supply chain strategy. We currently use Advanced Semiconductor Engineering in Taiwan and Signetics Corporation in Korea for assembly and testing. All of our material terms and conditions are consistent with general industry practice, but vary from vendor to vendor. Our inventory is distributed from the third-party contractors and a contracted warehouse in Taiwan. We require our third-party contractors to have comprehensive quality manufacturing systems, certified at International Organization for Standardization, or ISO, 9000 levels.
Research and Development
We believe that our success depends on our ability to enhance our existing Wi-Fi solutions, develop new innovative solutions, and integrate additional capabilities to serve our existing and future target markets. We engage in research and development efforts in four core areas:
• | System-level algorithm development (core Wi-Fi algorithms and system-level integration); |
• | Digital, mixed-signal, and RFIC design (baseband and RFIC Wi-Fi silicon chipsets); |
• | Software development (embedded Wi-Fi and network-level drivers); and |
• | Reference hardware platforms (board designs for internal use and customer reference). |
We also have a team of dedicated customer engineers to support our OEMs and service providers in their integration of our solutions into their products. We believe our competencies can be leveraged to broaden our solutions portfolio within and beyond the Wi-Fi market.
Our research and development team is comprised of highly skilled engineers and technologists with extensive experience in digital, mixed signal, and RFIC design, system level architecture, and software development. We have assembled our engineering team in the United States, Australia, China, Taiwan, and Russia. Approximately 70% of our research & development team holds advanced technical degrees.
- 10 -
Our research and development expense was $46.6 million, $35.6 million, and $31.3 million, for the years ended January 1, 2017, December 27, 2015, and December 28, 2014, respectively. We intend to continue to invest in research and development to support and enhance our existing Wi-Fi solutions and design and develop future product offerings.
Intellectual Property
We rely on a combination of intellectual property rights, including patents, trade secrets, copyrights and trademarks, and contractual protections, to protect our core technology and intellectual property. As of January 1, 2017, we had 42 issued patents in the United States and five foreign counterpart patents issued in Taiwan. The issued patents in the United States expire beginning in 2026 through 2035. Our issued patents and pending patent applications relate to MIMO systems, algorithms, circuits, system level optimization and wireless network management.
In addition to our own intellectual property, we also use third-party licenses for certain technologies embedded in our Wi-Fi solutions. These are typically non-exclusive contracts provided under royalty-accruing or paid-up licenses. While we do not believe our business is dependent to any significant degree on any individual third-party license, we expect to continue to use and may license additional third-party technology for our solutions. We also invest in the latest commercially available software design and simulation tools, which enable us to leverage our intellectual property portfolio, improve time to commercialization, and deliver high-performance solutions.
We generally control access to and use of our confidential information through employing internal and external controls, including contractual protections with employees, consultants, customers, partners and suppliers. Our employees and consultants are required to execute confidentiality agreements in connection with their employment and consulting relationships with us. We also require them to agree to disclose and assign to us all inventions conceived or made in connection with the employment or consulting relationship. Despite our efforts to protect our intellectual property, unauthorized parties may copy or otherwise obtain and use our software, technology or other information that we regard as proprietary intellectual property.
The semiconductor industry is characterized by vigorous protection and pursuit of intellectual property rights, which has resulted in protracted and expensive litigation for many companies. From time to time, we have received communications from other third parties, including non-practicing entities, alleging our infringement of their patents, and we may receive additional claims of infringement in the future. In addition, our customers and our customers’ customers may also receive communications regarding alleged infringement of their products that implicate our Wi-Fi solutions, which could trigger warranty and indemnity obligations from us. Any lawsuits could subject us to significant liability for damages, invalidate our proprietary rights and harm our business and our ability to compete. See the section titled “Risk Factors” for additional information.
Competition
We compete with numerous domestic and international semiconductor companies, many of which have greater financial and other resources with which to pursue design, development, manufacturing, sales, marketing and distribution of their products. Our competitors include public companies with broader product lines, a larger base of customers and greater resources compared to us. We consider our primary competitors to be other companies that provide Wi-Fi products to the market, including Broadcom Corporation, or Broadcom, Intel Corporation, or Intel, Marvell Technology Group Ltd., or Marvell, MediaTek USA Inc., or MediaTek, Qualcomm Incorporated, or Qualcomm, and Realtek Semiconductor Corp. We may also face competition from other new and emerging companies, including emerging companies in China.
The principal competitive factors in our market include:
• | performance of Wi-Fi solutions, including the ability to support advanced optional IEEE Wi-Fi specifications; |
• | cost effectiveness of Wi-Fi solutions; |
• | design process and time to market; |
• | innovation and development of functionality and features not previously available in the marketplace; |
• | ability to anticipate requirements of customers’ and service providers’ next-generation products and applications; |
• | ability to identify new and emerging markets, applications and technologies; |
• | brand recognition and reputation; |
- 11 -
• | strength of personnel, including software engineers and chip designers; and |
• | customer service and support. |
While most of our competitors may offer a wider variety of products, we design Wi-Fi solutions that support the most advanced optional IEEE Wi-Fi specifications. As such, we focus on high-performance Wi-Fi solutions for each of our end markets and we believe we compete favorably with respect to the factors described above.
Information about Segment and Geographic Revenue
Information about segment and geographic revenue is set forth in Note 13 of the “Financial Statements and Supplementary Data-Notes to Consolidated Financial Statements” under Part II, Item 8 of this Annual Report on Form 10-K.
Employees
As of January 1, 2017, we employed a total of 325 people, comprised of 261 in research and development and in operations, and 64 in sales, marketing, and administration. We also engage temporary employees and consultants. We have never had a work stoppage, and we consider our employee relations to be good. None of our employees are represented by a labor organization or subject to a collective bargaining arrangement.
Facilities
Our corporate headquarters is located in Fremont, California in a facility consisting of approximately 27,000 square feet of office space under a lease that expires in September 2018, but can be terminated earlier at our option. We have also recently entered into a new lease agreement located in San Jose, California for our corporate headquarters consisting of approximately 84,000 square feet, which expires in 2024. We also lease properties in Australia, China, Russia, and Taiwan which accommodate our design centers and sales support team. Based on our business requirements, the location and size of these leased properties will change from time to time. We intend to expand our existing facilities as we grow our business and add resources. We believe that additional facilities will be available on commercially reasonable terms to accommodate foreseeable expansion of our operations. We do not own any real property.
Corporate Information
We were incorporated in Delaware in November 2005 as mySource Communications, Inc., and we changed our name to Quantenna Communications, Inc. in January 2007. Our headquarters is located at 3450 W. Warren Avenue, Fremont, California 94538, and our telephone number is (510) 743-2260. We completed our initial public offering in November 2016 and our common stock is listed on the NASDAQ Global Select Market under the symbol “QTNA.” Unless the context requires otherwise, the words “Quantenna,” “we,” “Company,” “us” and “our” refer to Quantenna Communications, Inc. and our wholly owned subsidiaries.
“Quantenna” and our other registered or common law trademarks, service marks or trade names appearing in this Annual Report on Form 10-K are the property of Quantenna Communications, Inc. Other trademarks and trade names referred to in this prospectus are the property of their respective owners.
We are an “emerging growth company,” as defined in the Jumpstart Our Business Startups Act of 2012, and, as such, we have elected to comply with certain reduced public company reporting requirements. We will remain an “emerging growth company” until the earliest of (i) the last day of the fiscal year following the fifth anniversary of the completion of our initial public offering, (ii) the last day of the first fiscal year in which our annual gross revenue is $1 billion or more, (iii) the date on which we have, during the previous rolling three-year period, issued more than $1 billion in non-convertible debt securities or (iv) the date on which we are deemed to be a “large accelerated filer” as defined in the Exchange Act. We refer to the Jumpstart Our Business Startups Act of 2012 herein as the “JOBS Act,” and references herein to “emerging growth company” are intended to have the meaning associated with it in the JOBS Act.
Available Information
Our website is located at www.quantenna.com, and our investor relations website is located at http://ir.quantenna.com/. We have used, and intend to continue to use, our Investor Relations website as a means of disclosing material non-public information and for complying with our disclosure obligations under Regulation FD. Copies of our Annual Reports on Form 10-K, Quarterly Reports on Form 10-Q, Current Reports on Form 8-K, and amendments to these
- 12 -
reports filed or furnished pursuant to Section 13(a) or 15(d) of the Securities Exchange Act of 1934, as amended, or the Exchange Act, are available, free of charge, on our investor relations website as soon as reasonably practicable after we file such material electronically with or furnish it to the Securities and Exchange Commission, or the SEC. The SEC also maintains a website that contains our SEC filings. The address of the site is www.sec.gov. Further, a copy of this Annual Report on Form 10-K is located at the SEC’s Public Reference Room at 100 F Street, NE, Washington, D.C. 20549. Information on the operation of the Public Reference Room can be obtained by calling the SEC at 1-800-SEC-0330.
Item 1A. RISK FACTORS
You should carefully consider the risks and uncertainties described below, together with all of the other information in this Annual Report on Form 10-K, including “Management’s Discussion and Analysis of Financial Condition and Results of Operations” and our financial statements and related notes. The risks and uncertainties described below are not the only ones we face. Additional risk and uncertainties not presently known to us or that we presently deem less significant may also impair our business operations. If any of the events or circumstances described in the following risk factors actually occurs, our business, operating results, financial condition, cash flows and prospects could be materially and adversely affected. In that event, the trading price of our common stock could decline, and you could lose part or all of your investment.
Risks Related to Our Business and Industry
If we fail to develop and introduce new or enhanced Wi-Fi solutions to meet the requirements of our target markets on a timely basis, our ability to retain and attract customers could be impaired and our competitive position could be harmed.
We are largely dependent on sales of leading-edge, high-performance Wi-Fi solutions. The markets we target with our solutions are characterized by rapidly changing technology, changing customer and service provider needs, evolving industry standards, intense competition and frequent introductions of new products. To succeed, we must effectively anticipate customer and service provider requirements and respond to these requirements on a timely basis. For example, we were the first to announce an 802.11ac 8x8 product, our QSR-10G product, in September 2015. We also announced a new product based on the draft 802.11ax standard in October 2016. If we fail to develop new Wi-Fi solutions or enhancements to our existing solutions that offer increased features and performance in a cost-effective manner, or if our customers or service providers do not believe that our solutions have compelling technological advantages, our business could be adversely affected. We must also successfully manage the transition from older solutions to new or enhanced solutions to minimize disruptions in our business. In addition, if our competitors introduce new products that outperform our solutions or provide similar performance at lower prices, we may lose market share or be required to reduce our prices. For example, in February 2017, Qualcomm announced a new 8x8 product based on the draft 802.11ax standard that may compete with our previously announced product. Our failure to accurately predict market needs or timely develop Wi-Fi solutions that address market needs could harm our business, results of operations and financial condition.
The complexity of our solutions could result in unforeseen design and development delays or expenditures.
Developing our Wi-Fi solutions is expensive, complex, time-consuming and involves uncertainties. We must often make significant investments in product roadmaps, design and development far in advance of established market needs and may not be able to consistently and accurately predict what those actual needs will be in the future. Each phase in the development of our solutions presents serious risks of failure, rework or delay, any one of which could impact the timing and cost-effective development of such solutions and could jeopardize customer acceptance of the solutions. Product development efforts may last two years or longer, and require significant investments of time, third-party development costs, prototypes and sample materials, as well as sales and marketing resources and expenses, which will not be recouped if the product launch is unsuccessful. We also have limited resources and may not be able to develop alternative designs or address a variety of differing market requirements in parallel. Our failure to adequately address any such delays in a cost-effective manner could harm our business, results of operations and financial condition.
In addition, as is common in our industry, our Wi-Fi solutions may contain defects, errors and bugs when they are first introduced or as new versions are released. We have in the past, and may in the future, experience defects, errors and bugs. For example, in 2015, in response to a defect we identified, we were required to make a revision to one of our chips, which resulted in a four month delay in product introduction. Product defects, errors or bugs could affect the performance of our products resulting in reliability, quality or compatibility problems, and delay the development or shipments of new solutions or new
- 13 -
versions of our solutions. As a result, our reputation may be damaged and the market adoption of our Wi-Fi solutions could be adversely affected. If any of these problems are not found until after we have commenced shipment of a new solution, we may incur significant additional development costs to redesign, recall, repair or replace the defective solution. These problems may also trigger warranty or contractual indemnity claims against us by our customers or others, and our reputation and results of operations may be adversely affected.
Our solutions must also successfully operate with products from other vendors. As a result, when problems occur in a customer product in which our solution is used, it may be difficult to identify the source of these problems. The occurrence of hardware and software errors, whether or not caused by our solutions, could result in the delay or loss of market adoption of our solutions, and therefore delay our ability to recognize revenue from sales, and any necessary repairs may cause us to incur significant expenses. The occurrence of any such problems could harm our business, results of operations and financial condition.
We depend on a limited number of customers and service providers for a significant portion of our revenue.
We derive a significant portion of our revenue from a small number of OEMs and ODMs, and we anticipate that we will continue to do so for the foreseeable future. In 2016, four customers accounted for approximately 50% of our revenue. In addition, substantially all of our revenue to date has been generated by sales of our solutions to OEMs and ODMs serving the service provider market for home networking. Based on sell-through information provided to us by our OEM and ODM customers, we estimate that our two largest service providers, which are based in the United States, represented approximately 40% of our revenue in 2016. The loss of a key customer or service provider, or a reduction in sales to any key customer or service provider could negatively impact our revenue, cause us to have excess or obsolete inventory, and harm our business, results of operations and financial condition.
We have an accumulated deficit and have incurred net losses in the past, and we may incur net losses in the future.
We have incurred net losses in the past and may incur net losses in the future. For the years ended January 1, 2017, December 27, 2015, and December 28, 2014, we incurred net losses of $1.9 million, $7.0 million, and $13.6 million, respectively. As of January 1, 2017, we had an accumulated deficit of $162.0 million. We expect to continue to make significant investments related to the development of our Wi-Fi solutions and the expansion of our business, including investments to support our research and development, sales and marketing and general and administrative functions. As a public company, we will also incur significant additional legal, accounting and other expenses. If our revenue growth does not exceed the growth of these anticipated expenses, we may not be able to achieve or sustain profitability, and our stock price could decline.
We face intense competition from a number of larger and more established companies and expect competition to increase in the future, which could have an adverse effect on our market share, revenue and results of operations.
Many of our competitors, including Broadcom, Intel Corporation, Marvell, MediaTek, and Qualcomm, have greater financial, technical, sales, marketing and other resources than we do, as well as longer operating histories, greater name recognition, larger customer bases and more established customer relationships. In the future, we may also face competition from other new and emerging companies, including from companies in China.
Our competitors may be able to anticipate, influence or adapt more quickly to new or emerging technologies and standards and changes in customer and service provider requirements. Our competitors may also be able to devote greater resources to the promotion and sale of their products, initiate or withstand substantial price competition, take advantage of acquisitions or other opportunities more readily and develop and expand their product offerings more quickly than we can. In addition, many of our larger competitors offer a broader range of products than we do, including non-Wi-Fi products. These competitors may be able to sell at lower margins, bundle additional products and features with their Wi-Fi products, or create closed platforms that discourage customers or service providers from purchasing our Wi-Fi solutions. This strategy may be particularly effective for customers and service providers who prefer the convenience of purchasing all of their Wi-Fi products from a single provider. If we are unable to maintain our competitive advantages through the delivery of superior solutions, our business, results of operations and financial condition may be harmed.
- 14 -
Consolidation in our industry or in a related industry that involves our customers, service providers, partners and competitors could disrupt our business.
There has been a significant amount of consolidation in our industry and related industries. Examples include consolidation among service providers, such as the acquisition of DIRECTV by AT&T in 2015; consolidation involving our customers, such as the acquisition of the Cisco video business by Technicolor in 2015 and the acquisition of Pace plc, or Pace, by Arris, in 2016; consolidation involving our partners, such as the acquisition of Freescale Semiconductor by NXP Semiconductors in 2015; and consolidation involving our competitors, such as the acquisition of Broadcom by Avago Technologies in 2016 and the pending acquisition of NXP Semiconductors by Qualcomm announced in October 2016.
Consolidation among our customers and service providers can create significant uncertainty regarding demand for our Wi-Fi solutions and could cause delays in the purchase of our Wi-Fi solutions or the loss of business. For example, in 2015 our two largest service providers consolidated, resulting in the cancellation of previously submitted purchase orders, which adversely impacted our revenue for several quarters. Consolidation among our competitors could adversely affect the competitive landscape and industry dynamics, including causing increased pricing pressure, intensifying the focus of our competitors on certain markets or customers that could cause us to lose market share or customers, and enabling our competitors to leverage complementary products or technologies of the combined company. Accordingly, any industry consolidation could have an adverse effect on our business, results of operations and financial condition.
Our customers may cancel their orders, change production quantities or delay production, which could harm our business.
Our customers typically do not provide us with firm, long-term purchase commitments. Substantially all of our sales to date have been made on a purchase order basis, which permits our customers to cancel, change or delay their purchases of our solutions with little or no notice to us. As a result, our ability to accurately forecast customer demand is limited. Any such cancellation of or decrease in purchase orders subjects us to a number of risks, including unanticipated revenue shortfalls, loss of volume-based wafer rebates from our third-party foundry and excess or obsolete inventory.
We may face claims of intellectual property infringement, which could be time-consuming and costly to defend or settle and, if adversely adjudicated, could harm our business.
The semiconductor industry is characterized by vigorous protection and pursuit of intellectual property rights, which has resulted in protracted and expensive litigation for many companies. We have received communications from third parties, including non-practicing entities, alleging our infringement of their patents, and we may receive additional claims of infringement in the future. For example, in October 2016, a third party filed suit in the United States District Court for the Northern District of Illinois alleging infringement by us of nine expired United States patents. See Note 6 of our consolidated financial statements included elsewhere in this Annual Report on Form 10-K. In addition, our customers and service providers may become subject to litigation or receive communications regarding alleged infringement of their products that implicate our Wi-Fi solutions. We have certain contractual obligations to defend and indemnify our customers and other third parties from damages and costs which may arise in connection with any such infringement claims. We or our customers may be required to obtain licenses for such patents, which could require us to pay royalties. Any lawsuits could subject us to significant liability for damages, invalidate our proprietary rights and harm our business and our ability to compete. Any litigation, regardless of success or merit, could cause us to incur substantial expenses, reduce our sales and divert the efforts of our technical and management personnel. If we receive an adverse result in any litigation, we could be required to pay substantial damages, seek licenses from third parties, which may not be available on reasonable terms or at all, cease sale of products or licensing of our technology, expend significant resources to redesign our solutions, develop alternative technology or discontinue the use of processes requiring the relevant technology.
Our failure to adequately protect our intellectual property rights could impair our ability to compete effectively or defend ourselves from litigation, which could adversely affect our results of operations and financial condition.
Our success depends, in part, on our ability to adequately protect our intellectual property. We rely primarily on patent, copyright, trademark and trade secret laws, as well as confidentiality and non-disclosure agreements and other contractual provisions, to protect our proprietary technologies and know-how. As of January 1, 2017, we had 42 issued patents in the United States and five foreign counterpart patents issued in Taiwan. The rights granted to us may not be meaningful or provide us with any commercial advantage. For example, any patent claims we make may be deemed insufficient to cover the third party’s product or technology or the patent could be opposed, contested, circumvented, designed around or be declared invalid or
- 15 -
unenforceable in judicial or administrative proceedings. The failure of any of our patents to adequately protect our technology could make it easier for our competitors to offer similar products or technologies. Our foreign patent protection is not as comprehensive as our United States patent protection. As a result, we may not be able to effectively protect our intellectual property in some countries where our solutions are sold or may be sold in the future. Even if foreign patents are granted, effective enforcement in foreign countries may be challenging or may not be available. Furthermore, changes to the patent laws in the United States and other jurisdictions could also diminish the value of our patents and patent applications or narrow the scope of our patent protection.
We cannot ensure that the steps we have taken will prevent unauthorized use of our intellectual property or the reverse engineering of our technology. In addition to the protection afforded by patents, we rely on confidential proprietary information, including trade secrets and know-how, to develop and maintain our competitive position. Any disclosure or misappropriation by third parties of our confidential proprietary information could enable competitors to quickly duplicate our proprietary information, thus eroding our competitive position. We seek to protect our proprietary information in part by confidentiality agreements with our employees, contractors, customers, partners and other third parties. These agreements are designed to protect our proprietary information; however, any of these parties may breach the agreements and disclose our proprietary information, and we may not be able to obtain adequate remedies for such breaches. Detecting and monitoring unauthorized use of our intellectual property can be difficult and costly. It is possible that unauthorized use of our intellectual property may have occurred or may occur without our knowledge. Our failure to adequately protect our intellectual property could adversely impact our ability to maintain a competitive advantage in our markets, thus harming our business, results of operations and financial condition.
We may in the future need to initiate infringement claims or litigation to try to protect our intellectual property rights. Litigation, whether we are a plaintiff or a defendant, can be very expensive and time-consuming and may divert the efforts of our technical and management personnel without resulting in a favorable outcome. Further, many of our current and potential competitors have the ability to dedicate substantially greater resources to defending intellectual property infringement claims and to enforcing their intellectual property rights. If we are unable to protect our proprietary rights or if third parties independently develop or gain access to our or similar technologies, our business, revenue, reputation and competitive position could be harmed.
We may have difficulty accurately predicting our future revenue, cost of revenue, operating expense, working capital, and capital investments.
We were incorporated in 2005 and only began shipments of our Wi-Fi solutions in 2010. As a result, we have a limited operating history from which to predict future operating results. This limited operating history, combined with the rapidly evolving nature of the markets in which we sell our Wi-Fi solutions, substantial uncertainty concerning how these markets may develop and other factors beyond our control, limit our ability to accurately forecast our future revenue, cost of revenue, operating expense, working capital, and capital investments. Additionally, if we are unable to accurately forecast customer demand or service provider deployments in a timely manner, we may not build enough supply or maintain enough inventory, which could lead to delays in product shipments and lost sales opportunities, as well as cause our customers to identify alternative sources of supply. Alternatively, we may accumulate excess or obsolete inventory. Any of these factors could harm our margins, increase our write-offs due to product obsolescence and restrict our ability to fund our operations. If our revenue does not increase as anticipated, we could incur significant losses to the extent we are unable to decrease our expenses in a timely manner to offset any shortfall in future revenue. Any failure to accurately predict our future operating results could cause us to miss our financial projections and adversely affect the price of our common stock.
If we are unable to effectively manage any future growth, we may not be able to execute our business plan and our results of operations could suffer.
We have expanded our operations significantly since our inception in 2005 and anticipate that further expansion will be required to achieve our business objectives. For example, we grew from 219 employees as of December 28, 2014 to 325 employees as of January 1, 2017, and expect our headcount to continue to grow rapidly as we scale our business. The growth and expansion of our business have placed and will continue to place a significant strain on our management, operations and financial resources. We expect that any future growth will also add complexity to, and require effective coordination throughout, our organization.
To manage any future growth effectively, we must continue to improve and expand our operating and administrative systems and controls. We may not be able to successfully implement improvements to these systems and controls in a timely or efficient
- 16 -
manner, which could result in operating inefficiencies and could cause our costs to increase more than planned. If we are unable to effectively manage our future growth, our business, results of operations and financial condition may be harmed.
We rely on a limited number of third-party contractors and suppliers in connection with the design and manufacture of certain parts of our solutions. The failed performance or loss of any of these third parties may adversely impact our business.
We currently depend on a single foundry, TSMC, for the supply of our mask-sets and for the fabrication of our wafers. We also depend on a limited number of sources in connection with the design, development, testing and assembly of our solutions and components thereof. We currently do not have long-term supply contracts with any of our third-party contractors or suppliers, and we typically negotiate pricing separately for each purchase order. Therefore, our contractors and suppliers are not obligated to perform services or supply products to us for any specific period, in any specific quantities, or at any specific price, except as may be provided in a particular purchase order. Sufficient capacity through our foundry or the third-party contractors we rely on for assembly and testing may not be available when we need it or at reasonable prices. In addition, we rely on intellectual property rights and software development tools from third-parties such as Cadence Design Systems, Inc., Mentor Graphics Corporation, and Synopsys, Inc., to support the design, development, simulation and verification of new solutions or enhancement to existing solutions. If licenses to such technologies are not available on commercially reasonable terms and conditions, or such products become unavailable for any other reason, and we cannot otherwise integrate such technologies, our solutions or our customers’ products could become unmarketable or obsolete, and we could lose market share. In such instances, we could also incur substantial unanticipated costs or scheduling delays to develop or acquire substitute technologies to deliver competitive products.
If we lose any of our single source or limited source contractors or suppliers, we could be required to transition to a new third party, which could increase our costs, result in delays in the manufacture and delivery of our solutions, require a redesign of our solutions to transition to alternative sources, or cause us to carry excess, obsolete or insufficient inventory. In addition, if these contractors or suppliers fail to produce and deliver our solutions according to required specifications, quantity, quality, cost and time requirements, our business, results of operations and financial condition could suffer.
Our results of operations are likely to vary significantly from period to period, which could cause the trading price of our common stock to decline.
Our results of operations have fluctuated from period to period, and we expect such results to continue to fluctuate as a result of a number of factors, many of which are outside our control and may be difficult to predict, including:
• | the fluctuations in demand for high-performance Wi-Fi products in general; |
• | the inherent complexity, length and associated unpredictability of the sales cycles for our Wi-Fi solutions; |
• | changing market conditions and competitive dynamics of our markets, including new entrants and current and potential customer or service provider consolidation; |
• | timing of introductions of new products by our customers and service providers and our ability to secure design wins related to such products; |
• | changes to or inaccurate demand forecasts from our customers and service providers; |
• | the timing and amount of purchase orders, especially from significant customers; |
• | reductions in or cancellations of purchase orders by our customers, including with little or no notice; |
• | changes in the mix of our sales in the service provider market versus retail, enterprise or consumer electronics end markets and among different customers; |
• | declines in average selling prices, or ASPs, and the extent to which the impact of such declines is offset by increased sales volume or decreased manufacturing and other costs; |
• | changes in manufacturing costs, including wafer fabrication, testing and assembly costs, manufacturing yields and product quality and reliability; |
• | our ability to develop, introduce and ship new Wi-Fi solutions in a timely manner and anticipate future market demands that meet our customers’ requirements; |
- 17 -
• | the timing and amount of tape-out costs; |
• | timing of headcount adjustments; |
• | the timing and amount of litigation expense or settlement of any litigation or other disputes; |
• | volatility in our stock price, which may lead to material changes in stock compensation expense; and |
• | our ability to derive benefits from our investments in research, development, sales, marketing, and other activities. |
In addition, changes in general economic or political conditions in the United States or other regions could adversely affect our business. For example, the new administration under President Donald Trump has indicated that it may propose significant changes with respect to a variety of issues, including trade agreements among nations, import and export regulations, tariffs and customs duties, foreign relations, immigration laws, tax laws and corporate governance laws, that could have a positive or negative impact on our business.
The effects of the risk factors noted herein could result in large fluctuations and unpredictability in our quarterly and annual results of operations. Therefore, comparing our results of operations on a period-to-period basis may not be meaningful, and you should not rely on our past results as an indication of our future performance.
If we fail to successfully address additional Wi-Fi markets, our revenue growth and financial condition could be harmed.
Currently, we sell most of our Wi-Fi solutions to OEMs and ODMs that target the service provider market for home networking. Our success will depend in part on our ability to expand beyond the service provider market to other Wi-Fi markets, including the enterprise and consumer electronics markets, as well as grow our market share in the retail market. These other markets have separate and unique requirements that may not be directly addressed by our current Wi-Fi solutions, including different specifications, performance requirements and product support needs. For example, our current Wi-Fi solutions may not be well suited for certain market opportunities and may require significant new functionality or features. Therefore, meeting the technical requirements and securing design wins with customers targeting these markets will require a substantial investment of our time and resources. We may also face challenges and delays in accurately understanding the specific needs of new markets, which in turn may impair our ability to develop the customer and partner relationships necessary to be successful in such markets. If any of these markets do not develop as we currently anticipate or if we are unable to penetrate them successfully, our growth opportunities could be harmed and our business, results of operations and financial condition could be negatively impacted.
If we fail to successfully leverage our engineering expertise to penetrate markets beyond Wi-Fi, our long-term revenue growth and financial condition could be harmed.
Our future growth will depend in part on our ability to leverage our engineering expertise in wireless and communications to address other markets beyond Wi-Fi. We have historically focused on high-performance Wi-Fi solutions, and may not be successful in identifying or implementing strategies to penetrate and sustain growth in new markets. If we are unable to develop solutions that are applicable beyond the Wi-Fi market, or to manage the expansion and growth of our business in such markets, our long-term revenue growth and financial condition could be harmed.
If we are unable to attract, train and retain qualified and key personnel, particularly our engineering personnel, we may not be able to execute our business strategy effectively.
We believe our future success will depend in large part upon our ability to attract, train and retain highly skilled management, engineering and sales and marketing personnel. Each of our employees is an at-will employee. The loss of any key employees or the inability to attract, train or retain qualified personnel, particularly our engineering personnel, could harm our business. For example, if any of these individuals were to leave unexpectedly, we could face substantial difficulty in hiring qualified successors and could experience a loss in productivity during the search for any such successor and while any successor is integrated into our business and operations.
Our key engineering personnel represent a significant asset and serve as the source of our technological and product innovations. We may not be successful in attracting, training and retaining sufficient numbers of technical and engineering personnel to support our anticipated growth. The competition for qualified engineering personnel in our industry is very intense, especially in the San Francisco Bay Area, where we have a substantial presence and need for highly skilled personnel.
- 18 -
Changes to industry standards and government requirements relevant to our solutions and markets could adversely affect our business, results of operations and financial condition.
If our customers adopt new or competing industry standards with which our solutions are not compatible, our existing solutions would become less desirable and our revenue and results of operations would suffer. In addition, changes in government-imposed requirements, such as maximum power consumption regulations in Europe, can prevent our solutions from being shipped to certain countries if they do not meet such requirements.
To compete effectively in the Wi-Fi marketplace, we rely on industry partners to enable and complement our Wi-Fi solutions.
Our Wi-Fi solutions need to be integrated with other components and products, such as broadband processors, video SOCs and network processors, to serve the service provider markets. We have developed relationships with various third-party partners who enable and enhance our ability to bring our Wi-Fi solutions to various markets. These partners can provide critical support to enable us to reach certain markets and better address customer needs, including through the development of joint reference designs, the establishment of relationships with key customers, the validation of our Wi-Fi solutions, and the creation of bundled solutions to contend with competitive offerings. For example, when our Wi-Fi solution is designed into a product that also incorporates Intel or Broadcom network processors, we depend on the ability of these partners to deliver their products in a timely fashion in order to meet shipping schedules. These partners may also be our competitors, which can negatively impact their willingness to collaborate with us, to support the integration of our solutions with their products, and to pursue joint sales and marketing efforts. In addition, in some cases it may be necessary to share competitively sensitive information with our partners that could enable our partners to compete more effectively against us or create uncertainty regarding ownership of intellectual property rights. If we are unable to continue to successfully develop or maintain these relationships, we may not be able to compete effectively and our business and results of operations may be adversely affected.
Our historical growth rate may not be indicative of future financial results.
You should not consider the growth rate in our revenue in recent periods as indicative of our future performance. Our revenue increased to $83.8 million in the year ended December 27, 2015 from $66.9 million in the year ended December 28, 2014, representing an increase of 25%.Our revenue increased to $129.1 million in the year ended January 1, 2017 from $83.8 million in the year ended December 27, 2015, representing an increase of 54%. Our revenue may be adversely impacted by various factors, including reduced demand for our Wi-Fi solutions, increased competition, a decrease in the size of our target markets, and the failure to capitalize on growth opportunities. Moreover, even if our revenue continues to increase in absolute terms, we expect that our revenue growth rate will decline over time as we mature as a public company.
We may pursue strategic acquisitions or partnerships which could require significant management attention, increase operating risk, dilute stockholder value, fail to achieve intended results, and adversely affect our business, results of operations and financial condition.
In the future, we may acquire other businesses, products or technologies, or partner with other businesses. Our ability to make and successfully integrate acquisitions is unproven. Even if we complete one or more acquisitions, we may not be able to strengthen our competitive position or realize the intended benefits of the acquisition in a timely manner, or at all. Any acquisitions may also be viewed negatively by our customers, financial markets or investors. In addition, any acquisitions we make could lead to difficulties in integrating technologies, products and operations from the acquired businesses and in retaining and motivating key personnel from these businesses. Acquisitions may disrupt our ongoing operations, divert management from their primary responsibilities, subject us to additional liabilities, increase our expense and adversely impact our business. Acquisitions may also reduce our cash available for operations and other uses, and could also result in an increase in amortization expense related to identifiable assets acquired, potentially dilutive issuances of equity securities or the incurrence of debt, any of which could harm our business.
Our business is subject to disruption from hazards, natural disasters, terrorism, and political unrest, which could cause significant delays in the design, development, production or shipment of our solutions.
Our operations and those of our third-party contractors are vulnerable to interruptions caused by technical breakdowns, computer hardware and software malfunctions, software viruses, infrastructure failures, fires, earthquakes, power losses, telecommunications failures, terrorist attacks, wars, Internet failures and other events beyond our control. For example, our sole foundry, TSMC, is located in Taiwan, which has been subject to a number of earthquakes, which has in the past impacted, and
- 19 -
may in the future impact, the fabrication of our solutions. In addition, a significant portion of our engineering equipment, servers, storage and networking equipment, and other office equipment is located in our offices in the seismically active San Francisco Bay Area and Taiwan. If we suffer a significant hazard or outage to these offices and equipment, our business could experience disruption, which could harm our business and negatively impact our business, results of operations and financial condition.
The average selling prices for our Wi-Fi solutions could decrease over time, which could harm our revenue, gross margin and results of operations.
Products sold in our industry, including our Wi-Fi solutions, have often experienced a decrease in ASPs over time. We anticipate that the ASPs of our solutions may decrease in the future in response to competitive pricing pressures, customer expectations for price reduction, increased sales discounts, and new product introductions by our competitors. Our future results of operations may be harmed due to the decrease of our average selling prices.
Additionally, because we use a fabless semiconductor business model and rely on third-party contractors to fabricate, assemble, and test our chipset designs, we may not be able to reduce our costs as rapidly as companies that operate their own manufacturing processes, and our costs may even increase, which could also reduce our gross margins. To maintain our current gross margins or increase our gross margins in the future, we must develop and introduce on a timely basis new solutions and enhancements to existing solutions; continually reduce the costs of manufacturing our solutions; and manage transitions from one solution to another in a timely and cost-effective manner. Our failure to do so would likely cause our revenue and gross margins to decline, which could have an adverse effect on our business, results of operations and financial condition.
Our international operations expose us to additional business risks, and failure to manage these risks may adversely affect our business.
We have international operations in China, Russia, Taiwan, Australia, Japan, and parts of Europe, and we derive substantially all of our revenue from shipments delivered outside the United States, particularly in Asia. International operations are subject to inherent risks, and our future results could be adversely affected by a number of factors, including:
• | differing technical standards, existing or future regulatory and certification requirements and required product features and functionality; |
• | challenges related to managing and integrating operations in new markets with different languages, cultures and political systems; |
• | heightened risks of unfair or corrupt business practices in certain countries and of improper or fraudulent sales arrangements that may impact financial results and lead to restatements of, and irregularities in, our financial statements or violations of law, including the United States Foreign Corrupt Practices Act; |
• | tariffs and trade barriers, export controls and trade and economic sanctions regulations and other regulatory or contractual limitations on our ability to sell or develop our solutions in certain foreign markets, particularly in China and Russia; |
• | difficulties and costs associated with staffing and managing international operations; |
• | difficulties associated with enforcing and protecting intellectual property rights in some countries; |
• | requirements or preferences for in-country products, which could reduce demand for our products; |
• | difficulties in enforcing contracts and collecting accounts receivable, which may result in longer payment cycles, especially in emerging markets; |
• | potentially adverse tax consequences, including taxes impacting our ability to repatriate profits to the United States; |
• | added legal compliance obligations and complexity; |
• | public health emergencies and other disasters, such as earthquakes and tsunamis, that are more common in certain regions; |
• | increased cost of terminating employees in some countries; |
• | the effect of currency exchange rate fluctuations; and |
• | political and economic instability, and terrorism. |
- 20 -
In 2012, we established our Russian subsidiary for research and development activities pursuant to a letter agreement with Joint Stock Company “RUSNANO” (formerly Open Joint Stock Company “RUSNANO”), or RUSNANO. Pursuant to the letter agreement, as amended, we have obligations to periodically fund the subsidiary, and RUSNANO has certain rights regarding the governance and operation of the subsidiary. While certain of these rights terminated upon completion of our initial public offering, RUSNANO may seek to continue to remain involved with our subsidiary, including its board of directors and use of our subsidiary’s funds. We may incur specified penalties under the letter agreement if we fail to meet any applicable funding obligations, and may incur other unanticipated costs if we are required to restructure our operations in Russia. See the section titled “Certain Relationships and Related Party Transactions--Agreement with RUSNANO” in this Annual Report on Form 10-K for additional information about this arrangement.
We expect that we will continue to rely on our international operations, and our success will depend on our ability to anticipate and effectively manage these and other associated risks. Our failure to manage any of these risks successfully could harm our international operations and adversely affect our business.
We could be subject to additional tax liabilities.
We are subject to United States federal, state and local income, sales and other taxes in the United States and foreign income taxes, withholding taxes and value-added and other transaction taxes in numerous foreign jurisdictions. Significant judgment is required in evaluating our tax positions and our worldwide provision for taxes. During the ordinary course of business, there are many activities and transactions for which the ultimate tax determination is uncertain. Our tax obligations and effective tax rates could be adversely affected by changes in the relevant tax, accounting and other laws, regulations, principles and interpretations, including those relating to income tax nexus, by challenges to our intercompany arrangements, valuation methodologies and transfer pricing, by recognizing tax losses or lower than anticipated earnings in jurisdictions where we have lower statutory rates and higher than anticipated earnings in jurisdictions where we have higher statutory rates, by changes in foreign currency exchange rates, or by changes in the valuation of our deferred tax assets and liabilities. In addition, the new Trump administration has indicated that they plan to propose significant tax and other changes, but it is not yet clear what specific changes will be proposed or ultimately enacted. Such changes could have an adverse impact on our tax liabilities. We may also be audited in various jurisdictions, and such jurisdictions may challenge our intercompany structures or assess additional taxes, interest and penalties, including sales taxes and value-added taxes against us. Although we believe our tax estimates are reasonable, the final determination of any tax audits or litigation could be materially different from our historical tax provisions and accruals, which could have an adverse effect on our results of operations or cash flows in the period or periods for which a determination is made.
Our ability to use our net operating losses to offset future taxable income may be subject to certain limitations.
We currently have a significant amount of net operating losses, or NOLs, which we expect will reduce our overall tax liability for the foreseeable future. However, our existing NOLs may be subject to limitations arising from previous ownership changes, and if we undergo an ownership change our ability to utilize NOLs could be further limited by Section 382 of the Internal Revenue Code of 1986, as amended, or the Code. Future changes in our stock ownership, some of which are outside of our control, could result in an ownership change under Section 382 of the Code. Furthermore, our ability to utilize NOLs of companies that we may acquire in the future may be subject to limitations. There is also a risk that due to regulatory changes, such as suspensions on the use of NOLs, or other unforeseen reasons, our existing NOLs could expire or otherwise be unavailable to offset future income tax liabilities. For these reasons, we may not be able to utilize a material portion of the NOLs reflected on our balance sheet, even if we attain profitability.
Our use of open source software in our solutions, processes and technology may expose us to additional risks and compromise our proprietary intellectual property.
We incorporate open source software into our Wi-Fi solutions, including certain open source code governed by the GNU General Public License, Lesser GNU General Public License and Common Development and Distribution License. The terms of many open source licenses have not been interpreted by United States courts, and there is a risk that these licenses could be construed in a manner that could impose unanticipated conditions or restrictions on our ability to commercialize our solutions. In such event, we could be required to seek licenses from third parties to continue offering our solutions, make our proprietary code generally available in source code form (for example, proprietary code that links to certain open source modules), re-engineer our solutions, discontinue the sale of our solutions if re-engineering cannot be accomplished on a cost-effective and
- 21 -
timely basis, or become subject to other consequences, any of which could adversely affect our business, results of operations and financial condition.
The requirements of being a public company may strain our resources and divert management’s attention from managing our business.
As a public company, we are subject to the reporting requirements of the Securities Exchange Act of 1934, as amended, or the Exchange Act, the listing requirements of the securities exchange on which our common stock is traded, and other applicable securities rules and regulations. Our management team and other personnel will need to devote a substantial amount of time to compliance. Compliance with these rules and regulations will increase our legal and financial compliance costs, make some activities more difficult, time-consuming or costly, and increase demands on our administrative systems and resources. Among other things, the Exchange Act requires that we file annual, quarterly and current reports with respect to our business and results of operations, and maintain effective disclosure controls and procedures and internal control over financial reporting. To maintain and, if required, improve our disclosure controls and procedures and internal control over financial reporting to meet this standard, significant resources and management oversight may be required. As a result, management’s attention may be diverted from other business concerns, which could harm our business and results of operations. In addition, we have limited internal resources and we may need to hire additional employees to comply with these requirements in the future, which will increase our costs and expenses. We may also not be able to hire additional, qualified resources on a timely basis.
In addition, changing laws, regulations and standards relating to corporate governance and public disclosure are creating uncertainty for public companies, increasing legal and financial compliance costs, and making some activities more time consuming. These laws, regulations and standards are subject to varying interpretations, in many cases due to their lack of specificity, and as a result, their application in practice may evolve over time as new guidance is provided by regulatory and governing bodies. This could result in continuing uncertainty regarding compliance matters and higher costs necessitated by ongoing revisions to disclosure and governance practices. We intend to invest resources to comply with evolving laws, regulations, and standards, and this investment will increase our general and administrative expense and result in a diversion of management’s time and attention from revenue-generating activities to compliance activities. If our efforts to comply with new laws, regulations, and standards are unsuccessful, regulatory authorities may initiate legal proceedings against us and our business, results of operations and financial condition may be harmed.
We have identified a material weakness in our internal control over financial reporting that, if not properly remediated, could result in material misstatements in our financial statements in future periods and impair our ability to comply with the accounting and reporting requirements applicable to public companies.
During the course of the preparation of our 2015 consolidated financial statements, we identified a material weakness in our internal control over financial reporting as a result of a lack of sufficient qualified personnel within the finance and accounting function who possessed an appropriate level of expertise to effectively perform the following functions commensurate with our structure and financial reporting requirements: (i) identify, select and apply generally accepted principles in the United States, or GAAP, sufficiently to provide reasonable assurance that transactions were being appropriately recorded, and (ii) assess risk and design appropriate control activities over financial and reporting processes necessary to provide reasonable assurance regarding the reliability of financial reporting and the preparation of financial statements.
In response to the identified material weakness, we have taken a number of steps to remediate this material weakness and improve our internal control over financial reporting during the year ended January 1, 2017. We hired a number of individuals, including additional certified public accountants, which we believe have appropriate knowledge and capacity to help fulfill our obligations to comply with the accounting and reporting requirements applicable to public companies. The additional resources added to the finance function (i) allow separate preparation and review of reconciliations and other account analysis, (ii) enable us to develop a more structured close process, including enhancing our existing policies and procedures, to improve the completeness, timeliness and accuracy of our financial reporting, and (iii) identify and review complex or unusual transactions.
While we believe that the foregoing actions will improve our internal control over financial reporting, the implementation of these measures is ongoing and will require validation and testing of the design and operating effectiveness of internal controls over a sustained period of financial reporting cycles. In addition, we may need to implement additional systems and controls, including further segregation of duties, to help ensure that our internal controls are effective. As a result, we determined that the material weaknesses had not been fully remediated as of January 1, 2017, and there is no assurance that these remediation
- 22 -
efforts will be successful. If not properly remediated, this material weakness could result in material misstatements in our financial statements in future periods and impair our ability to comply with accounting and reporting requirements.
We also cannot be certain that other material weaknesses and control deficiencies will not be discovered in the future. In addition, if our remediation efforts are not successful or other material weaknesses or control deficiencies occur in the future, we may be unable to report our financial results accurately or on a timely basis, which could cause our reported financial results to be materially misstated and result in the loss of investor confidence or delisting and cause the trading price of our common stock to decline. As a result of any such failures, we could also become subject to investigations by the stock exchange on which our securities are listed, the SEC, or other regulatory authorities, and become subject to litigation from investors and stockholders, which could harm our reputation and financial condition, or divert financial and management resources from our core business.
We may not be able to implement an effective system of internal controls and accurately report our financial results on a timely basis, which may adversely affect investor confidence in our company and negatively impact the trading price of our common stock.
Pursuant to the Exchange Act, we will be required to furnish a report by management on, among other things, the effectiveness of our internal control over financial reporting beginning with our Annual Report on Form 10-K for fiscal year 2017 . This assessment will need to include disclosure of any material weaknesses identified by our management in our internal control over financial reporting. We are currently documenting and testing our internal controls in order to identify, evaluate and remediate any deficiencies in those internal controls and documenting the results of our evaluation, testing and remediation. We may not be able to complete our evaluation, testing and any required remediation in a timely fashion. During the evaluation and testing process, if we identify one or more additional material weaknesses in our internal control over financial reporting, as we did in preparing our 2015 consolidated financial statements, that we are unable to remediate before the end of the same fiscal year in which the material weakness is identified, we will be unable to assert that our internal controls are effective. If we are unable to assert that our internal control over financial reporting is effective, or if our auditors, when required, are unable to attest to management’s report on the effectiveness of our internal controls, we could lose investor confidence in the accuracy and completeness of our financial reports, which would cause the price of our common stock to decline.
We are subject to the cyclical nature of the semiconductor industry, which has suffered, and may in the future suffer, from cyclical downturns.
The semiconductor industry is highly cyclical and is characterized by constant and rapid technological change, rapid product obsolescence, price erosion, evolving standards, consolidation and wide fluctuations in product supply and demand. The industry has historically experienced cyclical downturns, including during global recessions, which have been characterized by diminished product demand, production overcapacity, high inventory levels and accelerated erosion of ASPs. A significant portion of our operating expense is incurred in connection with developing our Wi-Fi solutions, securing design wins and assisting customers and service providers in the development of their product specifications in advance of anticipated sales. As a result, in the event that such sales do not ultimately materialize due to a cyclical downturn or otherwise, we may not be able to decrease our operating expense rapidly enough to offset any unanticipated shortfall in revenue. There is a risk that future downturns could negatively impact our revenue, which could harm our business, results of operations and financial condition.
Our results of operations and financial condition could be seriously impacted by security breaches, including cyber security incidents.
We may not be able to effectively detect, prevent and recover from security breaches, including attacks on information technology and infrastructure by hackers and viruses. Cyber-attacks could result in unauthorized parties gaining access to certain confidential business information, and could include unauthorized third parties obtaining trade secrets and proprietary information related to our solutions. For example, we offer a cloud-based Wi-Fi analytics and monitoring platform that collects certain Wi-Fi network and system data. While we utilize Amazon Web Services for this platform, which provides a number of sophisticated technical and physical controls designed to prevent unauthorized access to or disclosure of customer content, we cannot be certain that such controls will be sufficient to prevent a security breach. It can be difficult, if not impossible, to entirely prevent cyber-attacks. As these threats continue to evolve, we may be required to expend significant resources to enhance our control environment, processes, practices and other protective measures. Despite these efforts, if we experience a cyber security incident, such incident could adversely affect our business, results of operations and financial condition.
- 23 -
Failure to comply with the terms of our loan and security agreements with a financial institution may adversely affect our working capital and financial condition.
Our Loan Agreement and Mezzanine Loan Agreement with Silicon Valley Bank, or SVB, contains customary covenants, which could restrict our ability to operate and finance our business and operations, such as nonpayment of amounts due under the revolving line of credit or the loans, violation of the restrictive covenants, violation of other contractual provisions, or a material adverse change in our business. Our ability to comply with these covenants may be affected by events beyond our control, and breaches of any of these covenants could result in defaults under the loan agreements. In addition, borrowings under these loan agreements are collateralized by certain of our assets, including our receivables and inventory, subject to customary exceptions and limits.
The loan agreements also contain customary events of default. Defaults, if not waived, could cause all of the outstanding indebtedness under our loan agreements to become immediately due and payable and would permit Silicon Valley Bank to exercise remedies against the collateral in which we granted Silicon Valley Bank a security interest.
If we are unable to comply with the terms of these agreements, we may not be able to obtain additional debt or equity financing on favorable terms, if at all, and our assets may become subject to Silicon Valley Bank’s security interest. This could materially and adversely affect our working capital, financial condition and our ability to operate.
We are exposed to fluctuations in currency exchange rates that could negatively impact our business, operating results and financial condition.
Because a portion of our business is conducted outside of the United States, we face exposure to adverse movements in foreign currency exchange rates. These exposures may change over time, as international customer mix, business practices and our international footprint evolve, and they could have a material adverse impact on our business, operating results and financial condition.
To date, all of our revenue has been denominated in U.S. dollars; however, most of our expenses associated with our international operations are denominated in local currencies. As a result, a decline in the value of the U.S. dollar relative to the value of these local currencies could have a material adverse effect on our results of operations. Conversely, an increase in the value of the U.S. dollar could result in our Wi-Fi solutions being more expensive to our customers in their local currencies, and could have an adverse impact on our pricing and our business.
To date, we have not used risk management techniques to hedge the risks associated with these fluctuations. Even if we were to implement hedging strategies, not every exposure can be hedged and, where hedges are put in place based on expected foreign currency exchange exposure, they are based on forecasts that may vary or that may later prove to have been inaccurate. As a result, fluctuations in foreign currency exchange rates or our failure to successfully hedge against these fluctuations could have a material adverse effect on business, operating results and financial condition.
Risks Related to Ownership of Our Common Stock
The market price of our common stock has been and may continue to be volatile, which could cause the value of an investment in our common stock to decline.
Technology stocks have historically experienced high levels of volatility. Prior to our initial public offering, there had been no public market for shares of our common stock. Since our initial public offering, the trading price of our common stock has been subject to significant fluctuations and may continue to fluctuate substantially. These fluctuations depend on many factors, some of which are beyond our control and may not be related to our operating performance. These fluctuations could cause an investor to lose all or part of their investment in our common stock. Factors that could cause fluctuations in the trading price of our common stock include the following:
• | announcements of new products or technologies, commercial relationships, acquisitions or other events by us or our competitors; |
• | changes in how customers perceive the benefits of our Wi-Fi solutions; |
• | departures of key personnel; |
- 24 -
• | price and volume fluctuations in the overall stock market from time to time; |
• | fluctuations in the trading volume of our shares or the size of our public float; |
• | sales of large blocks of our common stock; |
• | actual or anticipated changes or fluctuations in our results of operations; |
• | whether our results of operations meet the expectations of securities analysts or investors; |
• | changes in actual or future expectations of investors or securities analysts; |
• | litigation involving us, our industry, or both; |
• | regulatory developments in the United States, foreign countries or both; |
• | general economic conditions and trends; |
• | major catastrophic events in our domestic and foreign markets; and |
• | “flash crashes,” “freeze flashes” or other glitches that disrupt trading on the securities exchange on which we are listed. |
In addition, if the market for technology stocks or the stock market in general experiences a loss of investor confidence, the trading price of our common stock could decline for reasons unrelated to our business, results of operations or financial condition. The trading price of our common stock might also decline in reaction to events that affect other companies in our industry even if these events do not directly affect us. In the past, following periods of volatility in the market price of a company’s securities, securities class action litigation has often been brought against that company. If our stock price is volatile, we may become the target of securities litigation. Securities litigation could result in substantial costs and divert our management’s attention and resources from our business. This could have a material adverse effect on our business, results of operations and financial condition.
If securities analysts or industry analysts downgrade our stock, publish negative research or reports or fail to publish reports about our business, our stock price could be adversely be adversely affected.
The trading market for our common stock will, to some extent, depend on the research and reports that securities or industry analysts publish about us or our business. We do not have any control over these analysts. If one or more of the analysts who cover us should downgrade our stock or publish negative research or reports, cease coverage of our company or fail to regularly publish reports about our business, such actions could adversely affect our stock price .
Sales of substantial amounts of our common stock in the public markets, or the perception that such sales might occur, could reduce the price that our common stock might otherwise attain.
Sales of a substantial number of shares of our common stock in the public market, or the perception that such sales could occur, could have an adverse effect on the market price of our common stock and may make it more difficult for investors to sell their shares of our common stock at a desirable time and price. In addition, our executive officers and directors may wish to sell shares of our common stock held by them, including sales through automatic and non-discretionary written plans, known as “Rule 10b5-1 Plans.” Sales made by our executive officers and directors, including sales pursuant to Rule 10b5-1 Plans, regardless of the amount of such sales, could adversely affect the market price of our common stock.
As of January 1, 2017, we had 33,076,150 shares of common stock outstanding. As a result of lock-up agreements entered into by certain stockholders in connection with our initial public offering and certain transfer restrictions under our insider trading policy, shares of our common stock will be available for sale in the public market, subject to the provisions of Rules 144 and 701 under the Securities Act. We and all of our directors and officers, and substantially all of our stockholders, have agreed not to offer, sell or agree to sell, directly or indirectly, any shares of common stock without the permission of the representatives of the underwriters for a period of 180 days from the date of our final prospectus filed with the SEC on October 28, 2016 pursuant to Rule 424(b) under the Securities Act of 1933. When the lock-up period expires, we and our locked-up security holders will be able to sell shares in the public market. In addition, the underwriters may, in their sole discretion, release all or some portion of the shares subject to lock-up agreements prior to the expiration of the lock-up period. Sales of a substantial number of such shares upon expiration, or the perception that such sales may occur, or early release of the lock-up, could cause our share price to fall or make it more difficult for investors to sell their common stock at a time and price that they deem appropriate.
- 25 -
As of January 1, 2017, certain holders of our common stock also have rights, subject to some conditions, to require us to file registration statements covering the sale of their shares or to include their shares in registration statements that we may file for ourselves or other stockholders. Such a transaction could divert management’s attention from the Company’s core business, require us to incur additional expenses, and could have an adverse effect on the price of our common stock.
Our issuance of additional capital stock in connection with financings, acquisitions, investments, our stock incentive plans or otherwise will dilute all other stockholders.
We expect to issue additional capital stock in the future that will result in dilution to all other stockholders. We expect to grant equity awards to employees, directors and consultants under our stock incentive plans. We may also raise capital through equity financings in the future. As part of our business strategy, we may acquire or make investments in complementary companies, products or technologies and issue equity securities to pay for any such acquisition or investment. Any such issuances of additional capital stock may cause stockholders to experience significant dilution of their ownership interests and the per share value of our common stock to decline.
A limited number of stockholders will continue to have substantial control over us , which could limit your ability to influence the outcome of key transactions, including a change of control and other matters requiring stockholder approval.
Our directors, executive officers and each of our stockholders who own greater than 5% of our outstanding common stock, in the aggregate, beneficially own approximately 62.7% of the outstanding shares of our common stock , based on the number of shares outstanding as of January 1, 2017. As a result, these stockholders, if acting together, will be able to influence or control matters requiring approval by our stockholders, and limit your ability to influence the outcome of key transactions, including the election of directors and the approval of mergers, acquisitions or other extraordinary transactions. They may also have interests that differ from yours and may vote in a way with which you disagree and which may be adverse to your interests. This concentration of ownership may have the effect of delaying, preventing or deterring a change of control of our company, could deprive our stockholders of an opportunity to receive a premium for their common stock as part of a sale of our company and might ultimately affect the market price of our common stock.
We do not intend to pay dividends on our common stock and, consequently, your ability to achieve a return on your investment will depend on appreciation in the price of our common stock.
We have never declared or paid any dividends on our common stock. We intend to retain any earnings to finance the operation and expansion of our business, and we do not anticipate paying any cash dividends in the foreseeable future. In addition, our SVB Loan Agreement and Mezzanine Loan Agreement impose restrictions on our ability to pay dividends on our common stock. As a result, you may only receive a return on your investment in our common stock if the market price of our common stock increases.
Delaware law and our corporate charter and bylaws contain anti-takeover provisions that could delay or discourage takeover attempts that stockholders may consider favorable.
Our amended and restated certificate of incorporation and amended and restated bylaws contain provisions that could delay or prevent a change in control of our company. These provisions could also make it difficult for stockholders to elect directors who are not nominated by the current members of our board of directors or take other corporate actions, including effecting changes in our management. These provisions include:
• | a classified board of directors with three-year staggered terms, which could delay the ability of stockholders to change the membership of a majority of our board of directors; |
• | the ability of our board of directors to issue shares of preferred stock and to determine the price and other terms of those shares, including preferences and voting rights, without stockholder approval, which could be used to significantly dilute the ownership of a hostile acquirer; |
• | the exclusive right of our board of directors to elect a director to fill a vacancy created by the expansion of our board of directors or the resignation, death or removal of a director, which prevents stockholders from being able to fill vacancies on our board of directors; |
• | a prohibition on stockholder action by written consent, which forces stockholder action to be taken at an annual or special meeting of our stockholders; |
- 26 -
• | the requirement that a special meeting of stockholders may be called only by our board of directors, the chairperson of our board of directors, our chief executive officer or our president (in the absence of a chief executive officer), which could delay the ability of our stockholders to force consideration of a proposal or to take action, including the removal of directors; |
• | the requirement for the affirmative vote of holders of at least 66 2/3% of the voting power of all of the then outstanding shares of the voting stock, voting together as a single class, to amend the provisions of our amended and restated certificate of incorporation relating to the management of our business (including our classified board structure) or certain provisions of our amended and restated bylaws, which may inhibit the ability of an acquirer to effect such amendments to facilitate an unsolicited takeover attempt; |
• | the ability of our board of directors to amend the bylaws, which may allow our board of directors to take additional actions to prevent an unsolicited takeover and inhibit the ability of an acquirer to amend the bylaws to facilitate an unsolicited takeover attempt; and |
• | advance notice procedures with which stockholders must comply to nominate candidates to our board of directors or to propose matters to be acted upon at a stockholders’ meeting, which may discourage or deter a potential acquirer from conducting a solicitation of proxies to elect the acquirer’s own slate of directors or otherwise attempting to obtain control of us. |
In addition, as a Delaware corporation, we are subject to Section 203 of the Delaware General Corporation Law, which may prohibit large stockholders, in particular those owning 15% or more of our outstanding voting stock, from merging or combining with us for a specified period of time.
We may not be able to obtain capital when desired on favorable terms, if at all, or without dilution to our stockholders and our failure to raise capital when needed could prevent us from executing our growth strategy.
We intend to continue to make investments to support our business growth and may require additional funds to respond to business challenges, including the need to develop new and enhance our existing Wi-Fi solutions, improve our operating infrastructure or acquire complementary businesses and technologies. Accordingly, we may need to engage in equity or debt financings to secure additional funds. If we raise additional equity financing, our stockholders may experience significant dilution of their ownership interests and the per share value of our common stock could decline. Furthermore, if we engage in debt financing, the holders of debt would have priority over the holders of common stock, and we may be required to accept terms that restrict our ability to incur additional indebtedness. We may also be required to take other actions that would otherwise be in the interests of the debt holders and force us to maintain specified liquidity or other ratios, any of which could harm our business, results of operations, and financial condition. If we need additional capital and cannot raise it on acceptable terms, we may not be able to, among other things:
• | develop new or enhance our existing Wi-Fi solutions; |
• | expand our research and development and sales and marketing organizations; |
• | respond to competitive pressures or unanticipated working capital requirements; |
• | hire, train and retain employees; |
• | expand our operations, in the United States or internationally; or |
• | acquire complementary technologies, products or businesses. |
Our failure to do any of these things could harm our business, financial condition and results of operations.
We are an “emerging growth company,” and our election to comply with the reduced disclosure requirements as a public company may make our common stock less attractive to investors.
For so long as we remain an “emerging growth company,” as defined in the Jumpstart Our Business Startups Act, or the JOBS Act, we may take advantage of certain exemptions from various requirements that are applicable to public companies that are not “emerging growth companies,” including not being required to comply with the independent auditor attestation requirements of Section 404 of the Sarbanes-Oxley Act, reduced disclosure obligations regarding executive compensation in our periodic reports and proxy statements, and exemptions from the requirements of holding a non-binding advisory vote on
- 27 -
executive compensation and stockholder approval of any golden parachute payments not previously approved. We will remain an “emerging growth company” until the earliest of (i) the last day of the fiscal year following the fifth anniversary of the completion of our initial public offering, (ii) the last day of the first fiscal year in which our annual gross revenue is $1 billion or more, (iii) the date on which we have, during the previous rolling three-year period, issued more than $1 billion in non-convertible debt securities or (iv) the date on which we are deemed to be a “large accelerated filer” as defined in the Exchange Act. We cannot predict if investors will find our common stock less attractive because we may rely on these exemptions. If some investors find our common stock less attractive as a result, there may be a less active trading market for our common stock, and our stock price may be more volatile and may decline.
In addition, the JOBS Act also provides that an “emerging growth company” can take advantage of an extended transition period for complying with new or revised accounting standards. However, we have chosen to “opt out” of such extended transition period, and as a result, we will comply with new or revised accounting standards on the relevant dates on which adoption of such standards is required for non-emerging growth companies. Our decision to opt out of the extended transition period for complying with new or revised accounting standards is irrevocable.
Item 1B. UNRESOLVED STAFF COMMENTS
Not applicable.
Item 2. PROPERTIES
Our corporate headquarters is located in Fremont, California in a facility consisting of approximately 27,000 square feet of office space under a lease that expires in September 2018, but can be terminated earlier at our option. We have also recently entered into a new lease agreement located in San Jose, California for our corporate headquarters consisting of approximately 84,000 square feet, which expires in 2024. We also lease properties in Australia, China, Russia, and Taiwan which accommodate our design centers and sales support team. Based on our business requirements, the location and size of these leased properties will change from time to time. We intend to expand our existing facilities as we grow our business and add resources. We believe that additional facilities will be available on commercially reasonable terms to accommodate foreseeable expansion of our operations. We do not own any real property.
Item 3. LEGAL PROCEEDINGS
We are currently not party to litigation that could have a material adverse effect on our business. From time to time, we may be subject to legal proceedings and claims arising in the ordinary course of business. The semiconductor and Wi-Fi industries are characterized by frequent claims and litigation, including claims regarding infringement of intellectual property rights. Litigation is often unpredictable, costly, diverts management’s attention, and may result in an unfavorable outcome, including monetary damages or injunctive relief.
Item 4. MINE SAFETY DISCLOSURES
Not applicable.
- 28 -
PART II
Item 5. Market for Registrant’s Common Equity, Related Stockholder Matters and Issuer Purchases of Equity Securities
Market Information
Our common stock has traded on the NASDAQ Global Select Market under the symbol “QTNA” since October 28, 2016. The following table sets forth the high and low sales prices per share for our common stock as quoted on the NASDAQ Global Select Market during the fourth quarter of our fiscal year ended January 1, 2017:
Common Stock Price | |||
High | Low | ||
Year Ended January 1, 2017: | |||
Fourth Quarter (from October 28, 2016) | $20.68 | $13.75 | |
On February 24, 2017, the last reported sale price on the NASDAQ Global Select Market for our common stock was $21.44 per share.
Holders of Record
As of February 24, 2017, there were 180 holders of record of our common stock. The actual number of stockholders is greater than this number of record holders and includes stockholders who are beneficial owners but whose shares are held in street name by brokers and other nominees. This number of holders of record also does not include stockholders whose shares may be held in trust by other entities.
Stock Performance Graph
This performance graph shall not be deemed “soliciting material” or to be “filed” with the Securities and Exchange Commission Commission, or the SEC, for purposes of Section 18 of the Securities Exchange Act of 1934, as amended, or the Exchange Act, or otherwise subject to the liabilities under that Section, and shall not be deemed to be incorporated by reference into any of our filings under the Securities Act of 1933, as amended, or the Securities Act, except as shall be expressly set forth by specific reference in such filing.
The following performance graph compares, for the period beginning on October 28, 2016, the first day of trading of our common stock on the NASDAQ Global Select Market, and ending on January 1, 2017, the last day of our fiscal year, the cumulative total stockholder return for our common stock, the NASDAQ Composite Index and Philadelphia Semiconductor Index. The graph assumes that $100 was invested on October 28, 2016 in each of our common stock, the NASDAQ Composite Index and Philadelphia Semiconductor Index and assumes reinvestment of any dividends. The stock price performance on the
- 29 -
following graph is not necessarily indicative of future price performance of our stock. 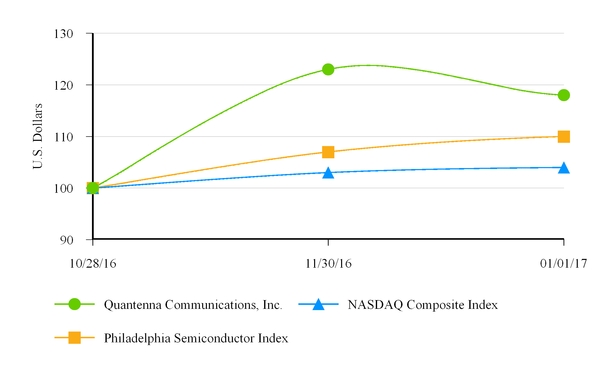
Company/Index | October 28, 2016 | November 30, 2016 | January 1, 2017 | |||||||||
Quantenna Communications, Inc | $ | 100 | $ | 123 | $ | 118 | ||||||
NASDAQ Composite Index | $ | 100 | $ | 103 | $ | 104 | ||||||
Philadelphia Semiconductor Index | $ | 100 | $ | 107 | $ | 110 | ||||||
Dividends
We have never declared or paid a cash dividend on our common stock and we intend to retain all available funds and any future earnings to fund the development and growth of our business. We therefore do not anticipate paying any cash dividends on our common stock in the foreseeable future. In addition, our credit facility materially restricts, and future debt instruments may materially restrict, our ability to pay dividends on our common stock. Any future determinations to pay dividends on our common stock would depend on our results of operations, our financial condition and liquidity requirements, restrictions that may be imposed by applicable law or our contracts, and any other factors that our board of directors may consider relevant.
Securities Authorized for Issuance under Equity Compensation Plans
The information required by this item will be included in our Definitive Proxy Statement for the 2017 Annual Meeting of Stockholders to be filed with the SEC within 120 days of the fiscal year ended January 1, 2017, and is incorporated herein by reference.
Recent Sales of Unregistered Securities
The following list sets forth information regarding all unregistered securities sold by us during the fiscal year ended January 1, 2017. All of the share numbers shown reflect the 1-for-50 reverse stock split of our capital stock effected on October 13, 2016.
No underwriters were involved in the sales, and the certificates representing the securities sold and issued contain legends restricting transfer of the securities without registration under the Securities Act or an applicable exemption from registration.
- 30 -
Warrant Issuances
In February 2016, we issued warrants to purchase up to 9,000 shares of its common stock to one accredited investor in connection with a consulting agreement at an exercise price of $0.05 per share and warrants to purchase up to 20,250 shares of our common stock to one accredited investor in connection with a separation agreement at an exercise price of $4.00 per share.
In May 2016, we issued warrants to purchase up to 126,400 shares of our common stock to two accredited investors in connection with a loan agreement at an exercise price of $4.00 per share.
Option and Common Stock Issuances
During the fiscal year ended January 1, 2017, prior to filing our Registration Statement on Form S-8 on October 28, 2016:
• | We granted to our directors, officers, employees, consultants and other service providers options to purchase an aggregate of 174,075 shares of our common stock under our 2006 Equity Incentive Plan at exercise prices ranging from $4.00 to $5.00 per share. |
• | We granted to our directors, officers, employees, consultants and other service providers options to purchase an aggregate of 1,763,380 shares of our common stock under our 2016 Equity Incentive Plan at exercise prices ranging from $7.00 to $15.00 per share. |
• | We issued to consultants an aggregate of 2,777 shares of our common stock under our 2016 Equity Incentive Plan in exchange for services rendered. |
• | We issued and sold to our officers, directors, employees, consultants, and other service providers an aggregate of 324,157 shares of our common stock upon the exercise of options under our 2006 Stock Plan at exercise prices ranging from $1.00 to $3.00 per share, for an aggregate exercise price of $568,568.50. |
• | We issued and sold to our officers, directors, employees, consultants, and other service providers an aggregate of 72,000 shares of our common stock upon the exercise of options under our 2016 Equity Incentive Plan at an exercise price of $8.50 per share, for an aggregate exercise price of $612,000.00. |
None of the foregoing transactions involved any underwriters, underwriting discounts or commissions, or any public offering. We believe the offers, sales and issuances of the above securities were exempt from registration under the Securities Act by virtue of Section 4(a)(2) of the Securities Act (or Regulation D promulgated thereunder) because the issuance of securities to the recipients did not involve a public offering, or in reliance on Rule 701 because the transactions were pursuant to compensatory benefit plans or contracts relating to compensation as provided under such rule. The recipients of the securities in each of these transactions represented their intentions to acquire the securities for investment only and not with a view to or for sale in connection with any distribution thereof, and appropriate legends were placed upon the stock certificates issued in these transactions. All recipients had adequate access, through their relationships with us, to information about us. The sales of these securities were made without any general solicitation or advertising.
There were no other sales of unregistered securities during the year ended January 1, 2017.
Use of Proceeds
On October 27, 2016, our Registration Statement on Form S-1 (File No. 333-213871) was declared effective by the SEC for our initial public offering, or IPO, of common stock. We started trading on the NASDAQ Global Select Market on October 28, 2016. On November 2, 2016, we closed our IPO and sold 6,775,466 shares of our common stock, including the exercise of the underwriters’ option to purchase an additional 75,466 shares, at an offering price of $16.00 per share, for an aggregate offering price of approximately $108.4 million. Upon completion of the sale of the shares of our common stock, our IPO terminated.
The underwriters for our initial public offering were Morgan Stanley & Co. LLC, Barclays Capital Inc., Deutsche Bank Securities Inc., Needham & Company, LLC, William Blair & Company, L.L.C. and Roth Capital Partners, LLC. We paid to the underwriters of our IPO underwriting discounts and commissions totaling approximately $7.6 million and incurred estimated offering expenses of approximately $3.4 million which, when added to the underwriting discounts and commissions, amount to total expenses of approximately $11.0 million. Thus, the net offering proceeds, after deducting underwriting discounts and commission and other offering expenses and including the exercise by the underwriters of their option to purchase additional shares of our common stock, were approximately $97.4 million.
- 31 -
There has been no material change in the planned use of proceeds from our IPO as described in our final prospectus, dated October 27, 2016, pursuant to Rule 424(b) of the Securities Act. The net offering proceeds have been invested in money market funds.
Purchases of Equity Securities by the Issuer
None.
- 32 -
Item 6. SELECTED CONSOLIDATED FINANCIAL AND OTHER DATA
The following selected consolidated financial data should be read in conjunction with our Consolidated Financial Statements and the accompanying notes appearing in Part II, Item 8, “Financial Statements and Supplementary Data”, and Part II, Item 7, “Management’s Discussion and Analysis of Financial Condition and Results of Operations”, included elsewhere in this Annual Report on Form 10-K. The selected data in this section is not intended to replace our Consolidated Statements of Operations and Consolidated Balance Sheets. Our historical results are not necessarily indicative of the results that may be expected in the future.
The following consolidated statement of operations data for the years ended January 1, 2017, December 27, 2015 and December 28, 2014 and the balance sheet data as of January 1, 2017 and December 27, 2015 have been derived from our audited consolidated financial statements included elsewhere in this Annual Report on Form 10-K.
Years Ended | |||||||||||
January 1, 2017 | December 27, 2015 | December 28, 2014 | |||||||||
(In thousands, except share and per share data) | |||||||||||
Consolidated Statements of Operations Data: | |||||||||||
Revenue | $ | 129,069 | $ | 83,773 | $ | 66,860 | |||||
Cost of revenue(1) | 64,640 | 42,554 | 38,211 | ||||||||
Gross profit | 64,429 | 41,219 | 28,649 | ||||||||
Operating expenses(1): | |||||||||||
Research and development | 46,604 | 35,575 | 31,283 | ||||||||
Sales and marketing | 8,091 | 6,644 | 5,932 | ||||||||
General and administrative | 10,559 | 5,212 | 4,532 | ||||||||
Total operating expenses | 65,254 | 47,431 | 41,747 | ||||||||
Loss from operations | (825 | ) | (6,212 | ) | (13,098 | ) | |||||
Interest expense | (665 | ) | (697 | ) | (481 | ) | |||||
Other income (expense), net | (38 | ) | (21 | ) | 89 | ||||||
Loss before income taxes | (1,528 | ) | (6,930 | ) | (13,490 | ) | |||||
Provision for income taxes | (367 | ) | (115 | ) | (108 | ) | |||||
Net loss | $ | (1,895 | ) | $ | (7,045 | ) | $ | (13,598 | ) | ||
Net loss attributable to common stockholders per share, basic and diluted(2) | $ | (0.30 | ) | $ | (9.16 | ) | $ | (20.72 | ) | ||
Weighted average shares used to compute basic and diluted net loss per share(2) | 6,384,709 | 769,524 | 656,146 | ||||||||
________________________
(1) | Cost of revenue and operating expenses include stock-based compensation expense as follows: |
- 33 -
Years Ended | |||||||||||
January 1, 2017 | December 27, 2015 | December 28, 2014 | |||||||||
(In thousands) | |||||||||||
Cost of revenue | $ | 33 | $ | 9 | $ | 7 | |||||
Research and development | 911 | 302 | 256 | ||||||||
Sales and marketing | 248 | 445 | 101 | ||||||||
General and administrative | 1,898 | 446 | 203 | ||||||||
Total stock-based compensation expense | $ | 3,090 | $ | 1,202 | $ | 567 | |||||
(2) | See Notes 1 and 3 to our consolidated financial statements included elsewhere in this Annual Report on Form 10-K for an explanation of the calculation of our basic and diluted net loss per common share, pro forma net loss per common share, and the weighted-average number of shares used in the computation of the per share amounts. |
As of | |||||||||||
January 1, 2017 | December 27, 2015 | December 28, 2014 | |||||||||
Consolidated Balance Sheet Data: | |||||||||||
Cash and cash equivalents | $ | 117,045 | $ | 18,850 | $ | 18,320 | |||||
Working capital | $ | 127,981 | $ | 28,287 | $ | 21,091 | |||||
Total assets | $ | 154,789 | $ | 46,667 | $ | 43,533 | |||||
Total liabilities | $ | 26,041 | $ | 17,635 | $ | 23,078 | |||||
Convertible preferred stock | $ | — | $ | 184,704 | $ | 170,448 | |||||
Total stockholders’ equity (deficit) | $ | 128,748 | $ | (155,672 | ) | $ | (149,993 | ) | |||
- 34 -
Item 7. MANAGEMENT’S DISCUSSION AND ANALYSIS OF FINANCIAL CONDITION AND RESULTS OF OPERATIONS
The following discussion and analysis of our financial condition and results of operations should be read in conjunction with the section titled “Selected Consolidated Financial and Other Data” and the consolidated financial statements and related notes thereto included elsewhere in this Annual Report on Form 10-K. This discussion contains forward-looking statements that involve risks and uncertainties. Our actual results could differ materially from those discussed below. Factors that could cause or contribute to such differences include, but are not limited to, those identified below and those discussed in the section titled “Risk Factors” included elsewhere in this Annual Report on Form 10-K.
Overview
We are a leader in the design, development, and marketing of advanced high-speed wireless communication solutions enabling wireless local area networking. Our solutions are designed to deliver leading-edge Wi-Fi performance to support an increasing number of connected devices accessing a rapidly growing pool of digital content. We combine our wireless systems and software expertise with high-performance radio frequency, mixed-signal and digital semiconductor design skills to provide highly integrated solutions to our customers.
Our solutions portfolio is currently comprised of multiple generations of our radio frequency chip and our digital baseband chip, which together support the IEEE Wi-Fi standards, including 802.11n and 802.11ac. These chips are typically sold together as a chipset combined with software and system-level reference designs that constitute a highly integrated Wi-Fi solution.
We sell our Wi-Fi solutions directly to global OEMs and ODMs that serve the end markets we address. In addition, we sell our Wi-Fi solutions to third-party distributors who in turn resell to OEMs and ODMs. OEMs incorporate our solutions into their products, which are then sold to their own customers, such as service providers, retailers, enterprises, small and medium businesses, and retail consumers. To date, we have primarily addressed the service provider market for home networking applications, including home gateways, repeaters, and set-top boxes. We are also addressing additional end markets, with solutions for (i) retail OEMs for home networking as well as small and medium business applications (e.g., routers and repeaters), (ii) enterprise OEMs for enterprise networking applications (e.g., access points), and (iii) consumer electronics OEMs for consumer applications, including wireless streaming of audio and video, wireless TVs, and wireless speakers. We believe the life cycles of our customers’ products can range from approximately one year to five years or more depending on the end market.
Some OEMs purchase our Wi-Fi solutions directly from us and use them in the design and manufacture (directly or through their third-party contract manufacturers) of their own products. Other OEMs utilize ODMs to design and build subsystem products incorporating our Wi-Fi solutions, which the OEMs then purchase from the ODM and incorporate into the OEM products. Accordingly, we ship our Wi-Fi solutions either directly to the OEM, its contract manufacturer, or its ODM, based on the requirements of each OEM. However, we maintain close relationships with the target OEM to monitor OEM end-market demand as the initial Wi-Fi solution design win is generally awarded by the OEM.
We derive the substantial majority of our revenue from the sale of our Wi-Fi solutions. In addition, historically we also derived a portion of our revenue from a limited number of licensing and non-recurring arrangements. These arrangements are no longer active. In the future, we may enter into new licensing arrangements on an opportunistic basis.
The following table shows percentage of our revenue by category:
Years Ended | |||||
January 1, 2017 | December 27, 2015 | December 28, 2014 | |||
(Percentage of revenue) | |||||
Wi-Fi Solutions | 99.5% | 89.4% | 90.6% | ||
Licensing | 0.4% | 6.8% | 9.4% | ||
Non-recurring Arrangements | 0.1% | 3.8% | —% | ||
- 35 -
The following table shows OEM, ODM and third-party distributor customers from which we derived 10% or more of our revenue:
Years Ended | |||||
January 1, 2017 | December 27, 2015 | December 28, 2014 | |||
(Percentage of revenue) | |||||
Customer: | |||||
Pace plc** | 19% | 14% | * | ||
Technicolor SA | 11% | 15% | 11% | ||
Sagemcom Broadband SAS | 11% | * | * | ||
Prohubs International Corp. | * | 11% | * | ||
Gemtek Electronics Co. Ltd. | * | 10% | 28% | ||
CyberTAN, Technology, Inc. | * | * | 21% | ||
________________________
* | Customer percentage of revenue was less than 10%. |
** | Pace plc was acquired by Arris International plc in January 2016. |
Substantially all of our revenue as of January 1, 2017 has been derived from sales to customers serving the service provider home networking market.
Almost all of our revenue is generated outside the United States in the years ended January 1, 2017, December 27, 2015, and, December 28, 2014, based on ship-to destinations, and we anticipate that the vast majority of our shipments will continue to be delivered outside the United States. Although almost all shipments are delivered outside the United States, we believe that a significant number of the Wi-Fi products that include our chips, such as access points, gateways, set-top boxes and repeaters, are ultimately directed and sold by OEM customers to service providers in North America and Western Europe. To date, all of our revenue has been denominated in U.S. dollars.
We use a fabless semiconductor business model and rely on third-party contractors to fabricate, assemble, and test our chipset designs. We purchase silicon wafers from TSMC, our foundry partner, which are then shipped to third-party contractors who assemble and test our chipsets. Our inventory is distributed from the third-party contractors and a contracted warehouse in Taiwan. We believe this outsourced manufacturing approach gives us access to the best available process technology, reduces our capital requirements, and allows us to focus our resources on the design, development, marketing, sales, and customer integration of our Wi-Fi solutions. We typically receive purchase orders 12 to 14 weeks ahead of our customers’ desired delivery date, and we build our inventory primarily on the basis of purchase orders from our customers.
Our revenue increased to $129.1 million in 2016 from $83.8 million in 2015, representing an increase of 54%. Our revenue increased to $83.8 million in 2015 from $66.9 million in 2014, representing an increase of 25%. Our net loss was $1.9 million, $7.0 million and $13.6 million in 2016, 2015 and 2014, respectively.
Our employee headcount has increased to 325 as of January 1, 2017 from 241 employees as of December 27, 2015, of which 80% are engaged in research and development activities.
We intend to continue scaling our business to meet the needs of our growing customer base. Key elements of our growth strategy include continuing to deliver innovation and drive new standards, expanding our share of the service provider market for home networking, and addressing other markets, such as retail, small and medium business applications, and enterprise. In addition, we are focused on broadening our solutions portfolio to address additional market segments such as consumer electronics. We anticipate that our operating expense will increase in absolute dollars in the future as we further invest in research and development to support and enhance our solutions and a growing number of customer products, in sales and marketing to acquire new customers in both new and existing markets, and in general and administrative to support our growth. We believe these investments will contribute to our long-term growth.
Factors Affecting Our Performance
- 36 -
Design Wins with Existing and Prospective Service Providers
Existing and prospective service providers that we serve through our OEM and ODM customers tend to be global enterprises that are continuously working with their partners to deploy new products. We believe our Wi-Fi solutions enable service providers to differentiate their products and services and drive the next upgrade cycles in their end market to ultimately gain market share. We work closely with service providers to assist in the development of their product specifications and designs. We compete to secure service provider design wins through an extended sales cycle, which can often last six to 18 months. After a design win is achieved, we continue to work closely with the service providers to assist them and their OEMs and ODMs throughout their product development and early deployment, which can often last six to 18 months. We believe our design win performance is dependent on the investments we make in research and development and sales and marketing to bring innovative Wi-Fi solutions to our existing and new markets and develop close relationships with our customers and service providers. As a result, we expect our research and development and sales and marketing expenses to increase in absolute dollars as we continue to grow our business.
Because of this extended sales cycle, our revenue is highly dependent upon the ongoing achievement of service provider design wins. We expect future revenue to depend upon sales to service providers with whom we have existing relationships as well as our ability to garner design wins with new service providers with whom we currently do not have relationships or sales. Further, because we expect revenue relating to our earlier generation solutions to decline in the future, we consider these design wins critical to our future success.
Product Life Cycle of our Customers and Service Providers; Expanding into Other End Markets
In the service provider home networking market, once service providers select our Wi-Fi solutions for integration into their products, we work with our OEM and ODM customers to monitor all phases of the product life cycle, including the initial design phase, prototype production and volume production. Our service providers’ product life cycles typically range from three to five years or more, based on product features, size of subscriber base, and roll-out plans. In contrast, wireless products sold in the retail or consumer electronics end markets have shorter life cycles than those sold into the service provider home networking market. In the retail or consumer electronics markets, a wireless product typically has a product life cycle of one to two years.
Currently, the majority of our revenue is derived from sales to OEMs and ODMs serving the service provider home networking market, with relatively longer sales cycles, longer customer product development cycles and longer time to shipment, but also with longer product life cycles. However, as we expand into additional end markets, such as retail, small and medium business, enterprise or consumer electronics, we expect revenue from such markets to increase as a proportion of our revenue over time. The shorter product life cycles associated with such additional end markets typically require greater frequency of design wins, and they may also result in faster time to shipment of our Wi-Fi solutions.
Sales Volume and Customer Concentration
A typical design win can generate a wide range of sales volumes for our Wi-Fi solutions, depending on the end market demand for our customers’ products. Such demand depends on several factors, including end market size, size of the service providers, product price and features, and the ability of customers and service providers to sell their products into their end markets. As such, some design wins result in orders and significant revenue shortly after the design win is awarded and other design wins do not result in significant orders and revenue for several months or longer after the initial design win, if at all. As a result, an increase or decrease in the number of design wins we achieve on a quarterly or annual basis does not necessarily correlate to a likely increase or decrease in revenue in the same or immediately succeeding quarter or year. Nonetheless, design wins are critical to our continued sales, and we believe that the collective impact of design wins correlates to our overall revenue growth over time.
Our customers and service providers often share their product development schedules with us, including the projected launch dates of their wireless product offerings. Once customers and service providers are in production, they generally will provide nine to 12-month forecasts of expected demand. However, they may change their purchase orders and demand forecasts at any time with limited or no prior notice.
We derive a significant portion of our revenue from a small number of OEMs and ODMs, and substantially all of our revenue to date has been generated by sales of our solutions to OEMs and ODMs serving the service provider market for home networking. While we strive to expand and diversify our customer base and we expect our customer concentration to decline over time, we
- 37 -
anticipate that sales to a limited number of customers will continue to account for a significant percentage of our revenue in the foreseeable future. In light of this customer and service provider concentration, our revenue is likely to continue to be materially impacted by the purchasing decisions of our largest customers and the service providers they serve.
Wi-Fi Solutions Pricing, Cost and Gross Margin
Our average selling price, or ASP, can vary by product mix, customer mix and end market, due to end market-specific characteristics such as supply and demand, competitive landscape, the maturation of Wi-Fi solutions launched in prior years and the launch of new Wi-Fi solutions. Our gross margin depends on a variety of factors, including the sales volume, features, price, and manufacturing costs of our Wi-Fi solutions. We make continuous investments in our solutions to enhance existing and add new features, maintain our competitiveness, minimize ASP erosion, and reduce the cost of our solutions.
As we rely on third-party contractors for the fabrication, assembly and testing of our chipsets, we work closely with these third-parties to improve the manufacturability of our chipsets, lower wafer cost, enhance yields, lower assembly and test costs, and improve quality.
In general, our latest generation solutions have higher prices compared to our prior generation solutions. As is typical in the semiconductor industry and consistent with our historical trends, we expect the ASPs of our solutions to decline as those solutions mature and unit volumes increase. These ASP declines often coincide with improvements in manufacturing yields and lower wafer, assembly and testing costs, which may offset some or all of the margin reduction that results from lower ASPs.
Components of Results of Operations
Revenue
Our revenue is generated primarily from sales of our Wi-Fi solutions to our OEM and ODM customers. In addition, we sell our Wi-Fi solutions to third-party distributors who in turn resell to OEMs and ODMs. Our Wi-Fi solutions are integrated into OEM products, such as gateways, set-top boxes, repeaters or routers, which are then sold primarily to service providers. Our sales have historically been made on the basis of purchase orders against our standard terms and conditions, rather than long-term agreements. Sales of our Wi-Fi solutions fluctuate primarily based on competition, sales volume, customer inventory and price. We expect our revenue to fluctuate from quarter to quarter due to a variety of factors, such as customer product development and deployment cycles and the purchasing patterns of our customers and third-party distributors.
During the years ended January 1, 2017, December 27, 2015, and December 28, 2014, we also derived revenue from a limited number of licensing and non-recurring arrangements. These arrangements are no longer active. In the future, we may enter into new licensing arrangements on an opportunistic basis.
Cost of Revenue, Gross Margin
We utilize third-party contractors for the production of the chipsets included in our Wi-Fi solutions. Cost of revenue primarily relates to the purchase of silicon wafers from our third-party foundry, and costs associated with assembly, testing and inbound and outbound shipping of our wafers and chipsets. After we purchase wafers from our third-party foundry, we bear the manufacturing yield risk related to assembling and testing these wafers into chipsets, which can result in benefit or expense recorded in cost of revenue. Cost of revenue also includes lower of cost or market adjustments to the carrying value of inventory, scrap and inventory obsolescence, and any accruals for warranty obligations, which we record when revenue is recognized. Additionally, cost of revenue includes manufacturing overhead expense, such as personnel cost which primarily consist of compensation costs related to employees, consultants and contractors, including salaries, sales commissions, bonuses, stock-based compensation and other employee benefits; depreciation expense, and allocated administrative costs associated with supply chain management and quality assurance activities, as well as property insurance premiums and royalty costs.
We seek to negotiate price reductions, which historically has included rebates, from our third-party foundry on the purchase of silicon wafers upon achieving certain volume targets. Such rebates are recorded as a reduction of inventory cost and are recognized as a reduction of cost of revenue. Because we do not have long-term, fixed supply agreements, our wafer costs are subject to changes based on the cyclical demand for semiconductors.
- 38 -
We calculate gross margin as revenue less cost of revenue divided by revenue. Our gross margin has been and will continue to be affected by a variety of factors, including ASPs, sales volume, and wafer, assembly and testing costs. We believe the primary driver of our gross margin is the ASPs negotiated between us and our customers, relative to the wafer, assembly and testing costs for our Wi-Fi solutions. As each of our Wi-Fi solutions matures and sales volumes increase, we expect ASPs to decline. Historically, such ASP declines have often coincided with lower wafer, assembly and testing costs, which have offset some or all of the gross margin reduction resulting from lower ASPs. In the future, we expect our gross margin to fluctuate on a quarterly basis as a result of changes in ASPs, introductions of new Wi-Fi solutions, changes in our product and customer mix, and changes in wafer, assembly and testing costs.
Operating Expenses
Our operating expenses consist of research and development, or R&D, sales and marketing, or S&M, and general and administrative, or G&A, expense. Personnel costs are the largest component of operating expenses and primarily consist of compensation costs related to employees, consultants and contractors, including salaries, sales commissions, bonuses, stock-based compensation and other employee benefits. As we continue to grow our business, we expect operating expenses to increase in absolute dollars.
Research and Development. Our R&D expense consists primarily of personnel costs to support our R&D activities, including silicon design, software development and testing, and customers’ product development support and qualification. R&D expense also includes tape-out costs, which include layout services, mask sets, prototype wafers, mask set revisions, intellectual property license fees, and system qualification and testing incurred before releasing new chip designs into production. In addition, R&D expense includes design software and simulation tools licenses, depreciation expense, and allocated administrative costs. All R&D costs are expensed as incurred. We expect R&D expense to fluctuate from period to period based on the timing and amount of tape-out costs and hiring.
Sales and Marketing. Our S&M expense consists primarily of personnel costs for our S&M activities, including pre-sales support. S&M expense also includes sales-based commissions we pay to independent sales representatives, public relations costs, trade show expenses, product marketing and communication, promotional activities, travel and entertainment costs and allocated administrative costs. Our S&M expense in a given period can be particularly affected by the timing of marketing programs and hiring.
General and Administrative. Our G&A expense consists primarily of personnel costs for our administrative personnel in support of our infrastructure functions such as general management, finance, human resources, legal, facilities and information technology. G&A expense also includes professional services fees, insurance premiums, depreciation expense, and allocated administrative costs, as well as any allowance for doubtful accounts. We expect our G&A expense to increase in absolute dollars as we grow our business, support our operations as a public company, and increase our headcount.
Interest Expense
Interest expense consists primarily of interest related to outstanding debt and amortization of debt discount.
Other Income (Expense), Net
Other income (expense), net currently consists primarily of interest income from our cash equivalent portfolio, the effect of exchange rates on our foreign currency-denominated asset and liability balances as well as changes in the fair value of our convertible preferred stock warrants.
Provision for Income Taxes
Provision for income taxes consists primarily of alternative minimum tax and income taxes in the foreign jurisdictions in which we conduct business. We maintain a full valuation allowance for deferred tax assets, including net operating loss carry-forward and R&D credits. Due to improvements in the United States operating results over the past three years, we believe a reasonable possibility exists that, within the next year, sufficient positive evidence may become available to reach a conclusion that the valuation allowance against our federal and state net deferred tax assets will no longer be needed.
- 39 -
Results of Operations
The following tables set forth our results of operations for the periods presented, in dollars and as a percentage of our revenue:
Years Ended | ||||||||||||||||||||
January 1, 2017 | December 27, 2015 | December 28, 2014 | ||||||||||||||||||
Amount | % of Revenue | Amount | % of Revenue | Amount | % of Revenue | |||||||||||||||
(Dollars in thousands) | ||||||||||||||||||||
Revenue | $ | 129,069 | 100 | % | $ | 83,773 | 100 | % | $ | 66,860 | 100 | % | ||||||||
Cost of revenue (1) | 64,640 | 50 | 42,554 | 51 | 38,211 | 57 | ||||||||||||||
Gross profit | 64,429 | 50 | 41,219 | 49 | 28,649 | 43 | ||||||||||||||
Operating expenses (1) | ||||||||||||||||||||
Research and development | 46,604 | 36 | 35,575 | 42 | 31,283 | 47 | ||||||||||||||
Sales and marketing | 8,091 | 6 | 6,644 | 8 | 5,932 | 9 | ||||||||||||||
General and administrative | 10,559 | 8 | 5,212 | 6 | 4,532 | 7 | ||||||||||||||
Total operating expenses | 65,254 | 50 | 47,431 | 56 | 41,747 | 63 | ||||||||||||||
Loss from operations | (825 | ) | — | (6,212 | ) | (7 | ) | (13,098 | ) | (20 | ) | |||||||||
Interest expense | (665 | ) | (1 | ) | (697 | ) | (1 | ) | (481 | ) | (1 | ) | ||||||||
Other income (expense), net | (38 | ) | — | (21 | ) | — | 89 | — | ||||||||||||
Loss before income taxes | (1,528 | ) | (1 | ) | (6,930 | ) | (8 | ) | (13,490 | ) | (21 | ) | ||||||||
Provision for income taxes | (367 | ) | — | (115 | ) | — | (108 | ) | — | |||||||||||
Net loss | $ | (1,895 | ) | (1 | )% | $ | (7,045 | ) | (8 | )% | $ | (13,598 | ) | (21 | )% | |||||
Net loss attributable to common stockholders per share, basic and diluted | $ | (0.30 | ) | $ | (9.16 | ) | $ | (20.72 | ) | |||||||||||
Weighted average shares used to compute basic and diluted net loss per share | 6,384,709 | 769,524 | 656,146 | |||||||||||||||||
________________________
(1) | Cost of revenue and operating expenses include stock-based compensation expense as follows: |
Years Ended | |||||||||||
January 1, 2017 | December 27, 2015 | December 28, 2014 | |||||||||
(In thousands) | |||||||||||
Cost of revenue | $ | 33 | $ | 9 | $ | 7 | |||||
Research and development | 911 | 302 | 256 | ||||||||
Sales and marketing | 248 | 445 | 101 | ||||||||
General and administrative | 1,898 | 446 | 203 | ||||||||
Total stock-based compensation expense | $ | 3,090 | $ | 1,202 | $ | 567 | |||||
- 40 -
Comparison of the Years Ended January 1, 2017 and December 27, 2015
Revenue, Cost of Revenue, Gross Profit and Gross Margin
Year Ended | ||||||||||||||
January 1, 2017 | December 27, 2015 | Change | % Change | |||||||||||
(Dollars in thousands) | ||||||||||||||
Revenue | $ | 129,069 | $ | 83,773 | $ | 45,296 | 54 | % | ||||||
Cost of revenue | 64,640 | 42,554 | 22,086 | 52 | % | |||||||||
Gross profit | $ | 64,429 | $ | 41,219 | $ | 23,210 | 56 | % | ||||||
Gross margin | 49.9 | % | 49.2 | % | 0.7 | % | ||||||||
Revenue. Revenue increased $45.3 million, or 54%, to $129.1 million in 2016 compared to 2015. This increase was primarily due to a $53.5 million increase in sales of our Wi-Fi solutions driven by higher sales volumes on substantially flat ASPs period to period, partially offset by a $8.2 million, decrease in revenue from licensing and non-recurring arrangements that ended in January 2016. In 2016 and 2015, licensing revenue was $0.5 million and $5.7 million, respectively. We expect that revenue will decrease in absolute dollars in the first quarter of 2017 due to seasonality and as we will operate with one less week sequentially.
Cost of Revenue, Gross Profit and Gross Margin. Cost of revenue increased $22.1 million, or 52%, to $64.6 million in 2016 compared to 2015, as a result of higher sales volume partially offset by lower unit cost for our Wi-Fi solutions. Gross profit increased $23.2 million, or 56%, to $64.4 million in 2016 compared to 2015 due to the higher sales volume and lower unit cost. Gross margin increased by 70 basis points, to 49.9% in 2016, compared to 2015, primarily consisting of an approximately 600 basis points gross margin increase from higher gross margin from sales of our Wi-Fi solutions, partially offset by an approximately 530 basis points of lost gross margin from the expiration of certain licensing and non-recurring arrangements. The 600 basis points from higher gross margin from Wi-Fi solutions resulted from a mix shift towards higher margin 802.11ac Wi-Fi solutions, and unit cost reductions due to more favorable pricing from our third-party contractors as a result of higher manufacturing volume.
Operating Expenses
Year Ended | ||||||||||||||||||||
January 1, 2017 | December 27, 2015 | |||||||||||||||||||
Amount | % of Revenue | Amount | % of Revenue | Change | % Change | |||||||||||||||
(Dollars in thousands) | ||||||||||||||||||||
Operating expenses: | ||||||||||||||||||||
Research and development | $ | 46,604 | 36 | % | $ | 35,575 | 42 | % | $ | 11,029 | 31 | % | ||||||||
Sales and marketing | 8,091 | 6 | % | 6,644 | 8 | % | 1,447 | 22 | % | |||||||||||
General and administrative | 10,559 | 8 | % | 5,212 | 6 | % | 5,347 | 103 | % | |||||||||||
Total operating expenses | $ | 65,254 | 50 | % | $ | 47,431 | 56 | % | $ | 17,823 | 38 | % | ||||||||
Research and Development Expense. R&D expense increased $11.0 million, or 31%, to $46.6 million in the year ended January 1, 2017 compared to the year ended December 27, 2015, primarily due to a $6.0 million increase in personnel costs, including $0.6 million in stock-based compensation expense, resulting from additional headcount to further develop and expand our solutions portfolio, and to support increased customer product development activities. R&D expense also increased due to tape-out, lay-out and prototype related expenses of $2.4 million, equipment related expenses of $0.9 million to support and qualify new product platforms and $1.2 million from allocated administrative costs. We expect that research and development expense will decrease in absolute dollars in the first quarter of 2017 as we will operate with one less week sequentially.
- 41 -
Sales and Marketing Expense. S&M expense increased $1.4 million, or 22%, to $8.1 million in the year ended January 1, 2017 compared to the year ended December 27, 2015 due to an increase of $1.2 million in personnel costs to support our expanding business and, $0.2 million from allocated administrative costs. We expect that sales and marketing expense will decrease in absolute dollars in the first quarter of 2017 as we will operate with one less week sequentially.
General and Administrative Expense. G&A expense increased $5.3 million, or 103%, to $10.6 million in the year ended January 1, 2017 compared to the year ended December 27, 2015, primarily due to $2.4 million in legal and consulting costs as we prepared to become a public company, $1.4 million in stock-based compensation expense due to a $1.1 million expense from accelerated vesting of stock options and shares of common stock issued upon early exercise of a warrant, and $1.2 million in personnel costs as we increased our administrative headcount to support the growth of our business. We expect that general and administrative expense will decrease in absolute dollars in the first quarter of 2017 as we will operate with one less week sequentially.
Comparison of the Years Ended December 27, 2015 and December 28, 2014
Revenue, Cost of Revenue, Gross Profit and Gross Margin
Years Ended | ||||||||||||||
December 27, 2015 | December 28, 2014 | Change | % Change | |||||||||||
Revenue | $ | 83,773 | $ | 66,860 | $ | 16,913 | 25 | % | ||||||
Cost of revenue | 42,554 | 38,211 | 4,343 | 11 | % | |||||||||
Gross profit | $ | 41,219 | $ | 28,649 | $ | 12,570 | 44 | % | ||||||
Gross margin | 49.2 | % | 42.8 | % | 6.4 | % | ||||||||
Revenue. Revenue increased $16.9 million, or 25%, to $83.8 million in 2015 compared to 2014. This increase was primarily due to a $14.3 million increase in sales of our Wi-Fi solutions driven by higher sales volumes and higher ASPs resulting from the start of shipment of our latest generation 802.11ac solution in late 2014 and related mix-shift from 802.11n to 802.11ac. The increase was also due to $3.2 million of revenue from a non-recurring arrangement, which ended in 2015, offset by a $0.5 million decrease in licensing revenue. Revenue in each of 2015 and 2014 included $5.7 million and $6.2 million, respectively, from a licensing arrangement that ended in January 2016.
Cost of Revenue, Gross Profit and Gross Margin. Cost of revenue increased $4.3 million, or 11%, to $42.6 million in 2015 compared to 2014, as a result of higher sales volume, partially offset by lower unit cost. Gross profit increased $12.6 million, or 44%, to $41.2 million in 2015 compared to 2014 due to the higher sales volume and lower unit cost. Of the $12.6 million increase, $9.8 million resulted from the growth of our Wi-Fi solutions sales volume, and $2.7 million resulted from revenue from licensing and non-recurring arrangements. Gross margin improved 640 basis points to 49.2% in 2015 compared to 2014, driven by a 480 basis point increase from sales of our Wi-Fi solutions, and a 160 basis points increase from licensing and non-recurring arrangements. The 480 basis points from higher Wi-Fi solutions gross margin resulted from a more favorable customer mix, the sales of higher margin 802.11ac Wi-Fi solutions and cost reductions due to more favorable pricing from our third-party contractors as a result of higher manufacturing volume.
- 42 -
Operating Expenses
Years Ended | |||||||||||||||||||||
December 27, 2015 | December 28, 2014 | ||||||||||||||||||||
Amount | % of Revenue | Amount | % of Revenue | Change | % Change | ||||||||||||||||
(Dollars in thousands) | |||||||||||||||||||||
Operating expenses: | |||||||||||||||||||||
Research and development | $ | 35,575 | 42 | % | $ | 31,283 | 47 | % | $ | 4,292 | 14 | % | |||||||||
Sales and marketing | 6,644 | 8 | 5,932 | 9 | 712 | 12 | % | ||||||||||||||
General and administrative | 5,212 | 6 | 4,532 | 7 | 680 | 15 | % | ||||||||||||||
Total operating expenses | $ | 47,431 | 57 | % | $ | 41,747 | 62 | % | $ | 5,684 | 14 | % | |||||||||
Research and Development Expense. R&D expense increased $4.3 million, or 14%, to $35.6 million in 2015, compared to 2014, primarily due to an increase of $2.7 million in tape-out costs related to our next generation solutions, and an increase of $1.5 million in personnel costs from additional headcount to further develop and expand our solutions portfolio, and to support increased customer product development activities.
Sales and Marketing Expense. S&M expense increased $0.7 million, or 12%, to $6.6 million in 2015, compared to 2014, as we increased sales headcount to drive growth, and recorded additional stock-based compensation expense. In 2015, stock-based compensation expense was $0.4 million as compared to $0.1 million in 2014.
General and Administrative Expense. G&A expense increased $0.7 million, or 15%, to $5.2 million in 2015, compared to 2014, primarily due to an increase in personnel costs as we increased our administrative headcount to support the growth of our business.
Quarterly Results of Operations
The following table sets forth selected unaudited quarterly consolidated statements of operations data for each of the eight quarters in the period ended January 1, 2017. The information for each of these quarters has been prepared on the same basis as our audited consolidated financial statements and reflect, in the opinion of management, all adjustments of a normal, recurring nature that are necessary for a fair statement of this information. These quarterly operating results are not necessarily indicative of the results that may be expected for a full year or any other period. This information should be read in conjunction with our audited consolidated financial statements and related notes included elsewhere in this Annual Report on Form 10-K. Basic and diluted net income (loss) per share for each of the quarters in 2016 and 2015 and for the full years ended January 1, 2017 and December 27, 2015 have been computed separately. Accordingly, quarterly amounts may not add to the annual amounts because of differences in the weighted-average shares outstanding during each quarter due to the effect of potentially dilutive securities only in the periods in which such effect would be dilutive.
- 43 -
Three Months Ended | |||||||||||||||||||||||||||||||
January 1, 2017 | September 25, 2016 | June 26, 2016 | March 27, 2016 | December 27, 2015 | September 27, 2015 | June 28, 2015 | March 29, 2015 | ||||||||||||||||||||||||
(In thousands, except per share data) (Unaudited) | |||||||||||||||||||||||||||||||
Revenue | $ | 37,492 | $ | 34,105 | $ | 33,035 | $ | 24,437 | $ | 25,412 | $ | 21,806 | $ | 18,171 | $ | 18,384 | |||||||||||||||
Cost of revenue(1) | 18,188 | 17,247 | 16,671 | 12,534 | 12,425 | 11,395 | 8,903 | 9,831 | |||||||||||||||||||||||
Gross profit | 19,304 | 16,858 | 16,364 | 11,903 | 12,987 | 10,411 | 9,268 | 8,553 | |||||||||||||||||||||||
Operating expenses(1): | |||||||||||||||||||||||||||||||
Research and development | 13,691 | 11,162 | 11,524 | 10,227 | 9,545 | 7,587 | 8,681 | 9,762 | |||||||||||||||||||||||
Sales and marketing | 2,520 | 2,172 | 1,769 | 1,630 | 1,625 | 1,490 | 1,681 | 1,848 | |||||||||||||||||||||||
General and administrative | 2,756 | 3,248 | 2,993 | 1,562 | 1,302 | 1,178 | 1,305 | 1,427 | |||||||||||||||||||||||
Total operating expenses | 18,967 | 16,582 | 16,286 | 13,419 | 12,472 | 10,255 | 11,667 | 13,037 | |||||||||||||||||||||||
Income (loss) from operations | 337 | 276 | 78 | (1,516 | ) | 515 | 156 | (2,399 | ) | (4,484 | ) | ||||||||||||||||||||
Interest expense | (252 | ) | (189 | ) | (111 | ) | (114 | ) | (137 | ) | (160 | ) | (179 | ) | (221 | ) | |||||||||||||||
Other income (expense), net | 261 | (52 | ) | (180 | ) | (68 | ) | 87 | (28 | ) | (42 | ) | (38 | ) | |||||||||||||||||
Income (loss) before income taxes | 346 | 35 | (213 | ) | (1,698 | ) | 465 | (32 | ) | (2,620 | ) | (4,743 | ) | ||||||||||||||||||
Provision for income taxes | (314 | ) | (14 | ) | (21 | ) | (17 | ) | (38 | ) | (40 | ) | (21 | ) | (16 | ) | |||||||||||||||
Net income (loss) | $ | 32 | $ | 21 | $ | (234 | ) | $ | (1,715 | ) | $ | 427 | $ | (72 | ) | $ | (2,641 | ) | $ | (4,759 | ) | ||||||||||
Basic net income (loss) per share: | — | 0.02 | (0.22 | ) | (1.63 | ) | 0.49 | (0.09 | ) | (3.64 | ) | (6.81 | ) | ||||||||||||||||||
Dilutive net income (loss) per share: | — | — | (0.22 | ) | (1.63 | ) | 0.02 | (0.09 | ) | (3.64 | ) | (6.81 | ) | ||||||||||||||||||
Shares used in computing basic net income (loss) per share: | 21,245,757 | 1,157,279 | 1,075,323 | 1,050,798 | 872,396 | 781,830 | 726,190 | 698,337 | |||||||||||||||||||||||
Shares used in computing diluted net income (loss) per share: | 35,386,904 | 29,974,428 | 1,075,323 | 1,050,798 | 27,066,613 | 781,830 | 726,190 | 698,337 | |||||||||||||||||||||||
________________________
(1) | Cost of revenue and operating expenses include stock-based compensation expense as follows (unaudited): |
January 1, 2017 | September 25, 2016 | June 26, 2016 | March 27, 2016 | December 27, 2015 | September 27, 2015 | June 28, 2015 | March 29, 2015 | ||||||||||||||||||||||||
Cost of revenue | $ | 18 | $ | 9 | $ | 3 | $ | 3 | $ | 3 | $ | 2 | $ | 2 | $ | 2 | |||||||||||||||
Research and development | 457 | 231 | 122 | 101 | 77 | 72 | 70 | 83 | |||||||||||||||||||||||
Sales and marketing | 128 | 60 | 30 | 30 | 26 | 26 | 196 | 197 | |||||||||||||||||||||||
General and administrative | 263 | 734 | 731 | 170 | 139 | 113 | 102 | 92 | |||||||||||||||||||||||
Total stock-based compensation expense | $ | 866 | $ | 1,034 | $ | 886 | $ | 304 | $ | 245 | $ | 213 | $ | 370 | $ | 374 | |||||||||||||||
- 44 -
Three Months Ended | |||||||||||||||||||||||
January 1, 2017 | September 25, 2016 | June 26, 2016 | March 27, 2016 | December 27, 2015 | September 27, 2015 | June 28, 2015 | March 29, 2015 | ||||||||||||||||
(As a percentage of revenue) (Unaudited) | |||||||||||||||||||||||
Revenue | 100.0 | % | 100.0 | % | 100.0 | % | 100.0 | % | 100.0 | % | 100.0 | % | 100.0 | % | 100.0 | % | |||||||
Cost of revenue | 48.5 | 50.6 | 50.5 | 51.3 | 48.9 | 52.3 | 49.0 | 53.5 | |||||||||||||||
Gross profit | 51.5 | 49.4 | 49.5 | 48.7 | 51.1 | 47.7 | 51.0 | 46.5 | |||||||||||||||
Operating expenses: | |||||||||||||||||||||||
Research and development | 36.5 | 32.7 | 34.9 | 41.9 | 37.6 | 34.8 | 47.8 | 53.1 | |||||||||||||||
Sales and marketing | 6.7 | 6.4 | 5.4 | 6.7 | 6.4 | 6.8 | 9.3 | 10.1 | |||||||||||||||
General and administrative | 7.4 | 9.5 | 9.1 | 6.4 | 5.1 | 5.4 | 7.2 | 7.8 | |||||||||||||||
Total operating expenses | 50.6 | 48.6 | 49.3 | 54.9 | 49.1 | 47.0 | 64.2 | 70.9 | |||||||||||||||
Income (loss) from operations | 0.9 | 0.8 | 0.2 | (6.2 | ) | 2.0 | 0.7 | (13.2 | ) | (24.4 | ) | ||||||||||||
Interest expense | (0.7 | ) | (0.6 | ) | (0.3 | ) | (0.5 | ) | (0.5 | ) | (0.7 | ) | (1.0 | ) | (1.2 | ) | |||||||
Other income (expense), net | 0.7 | (0.2 | ) | (0.5 | ) | (0.3 | ) | 0.3 | (0.1 | ) | (0.2 | ) | (0.2 | ) | |||||||||
Income (loss) before income taxes | 0.9 | 0.1 | (0.6 | ) | (6.9 | ) | 1.8 | (0.1 | ) | (14.4 | ) | (25.8 | ) | ||||||||||
Provision for income taxes | (0.8 | ) | — | (0.1 | ) | (0.1 | ) | (0.1 | ) | (0.2 | ) | (0.1 | ) | (0.1 | ) | ||||||||
Net income (loss) | 0.1 | % | 0.1 | % | (0.7 | )% | (7.0 | )% | 1.7 | % | (0.3 | )% | (14.5 | )% | (25.9 | )% | |||||||
Quarterly Revenue Trends
Our quarterly revenue was $18.4 million and $18.2 million in the three months ended March 29, 2015 and June 28, 2015, respectively, on flat sales volume and ASPs. Quarterly revenue grew to $21.8 million, $25.4 million, $24.4 million, $33.0 million, $34.1 million and $37.5 million in the three months ended September 27, 2015, December 27, 2015, March 27, 2016, June 26, 2016, September 25, 2016 and January 1, 2017, respectively, as a result of consecutive quarterly sales volume increases reflecting higher customer adoption of our Wi-Fi solutions, and substantially flat ASPs. Revenue in the three months ended March 27, 2016 saw a slight decline over that of the prior quarter as a result of a decrease in revenue from a licensing arrangement that ended in January 2016 and from a non-recurring arrangement that ended in December 2015.
Quarterly Gross Profit and Gross Margin Trends
Quarterly gross profit steadily increased sequentially from the three months ended March 29, 2015, through the three months ended January 1, 2017, primarily as a result of increasing sales volume, substantially flat ASPs and declining average unit cost over the quarterly periods. In addition, in the three months ended June 28, 2015 and December 27, 2015, gross profit was positively impacted by cancellation fees charged to customers. In the three months ended March 27, 2016, gross profit was negatively impacted by the completion of revenue from a licensing arrangement in January 2016 and from a non-recurring arrangement that ended in December 2015. In the three months ended June 26, 2016, September 25, 2016 and January 1, 2017, gross profit increased primarily as a result of increasing sales volume.
Gross margin increased to 51.5% in the three months ended January 1, 2017 from 46.5% in the three months ended March 29, 2015, as result of product mix shift toward higher margin 802.11ac Wi-Fi solutions with flat ASPs and lower unit cost over the period. In the three months ended June 28, 2015 and December 27, 2015, gross margin increased to approximately 51% as a result of customer cancellation fees we received in each of those quarters.
- 45 -
Quarterly Operating Expense Trends
Total operating expenses fluctuated during the period primarily as a result of the timing of tape-out costs, timing of sales and marketing programs, and fluctuations in headcount and stock-based compensation expense.
R&D expense fluctuated from period to period primarily due to the timing and amount of tape-out costs and hiring.
S&M expense was stable between $1.5 million and $1.7 million a quarter, other than at $1.8 million in the three months ended March 29, 2015 and June 26, 2016. For the three months ended March 29, 2015, the increase in expense was primarily as a result of higher sales commission and trade show expenses, as well as stock-based compensation expense. For the three months ended June 26, 2016, the increase was primarily as a result of higher sales commission expenses due to increased revenue. For the three months ended January 1, 2017 and September 25, 2016, the increase was primarily as a result of increased personnel cost to support the growth of our business.
G&A expense fluctuated from period to period primarily due to hiring and timing of professional services costs to support the growth of our business. In the three months ended June 26, 2016 and September 25, 2016, G&A expense increased primarily related to a $0.6 million and $0.5 million expense due to the accelerated vesting of certain shares issued upon the early exercise of warrants and the accelerated vesting of stock options, respectively. G&A expense for June 26, 2016 and September 25, 2016 also increased as a result of higher legal and consulting costs as we prepared to become a public company. G&A expense for January 1, 2017 declined as compared to the previous quarter due to reduced legal and consulting cost.
Liquidity and Capital Resources
Since our inception in 2005, we have funded our operations primarily through sales of our common stock in conjunction with our IPO, private equity financing, gross profits generated from sales and, to a lesser extent, through technology licensing and debt financing arrangements. As of January 1, 2017 and December 27, 2015 , we had cash and cash equivalents of $117.0 million and $18.9 million, respectively. As of January 1, 2017, we had an accumulated deficit of $161.6 million.
On November 2, 2016, we consummated our IPO and sold 6,775,466 shares of common stock, including the sale of 75,466 shares of common stock to the underwriters upon their exercise of their option to purchase additional shares. We received net proceeds of approximately $97.4 million, after underwriting discounts, commissions and other offering expenses. Immediately prior to the consummation of our IPO, all outstanding shares of convertible preferred stock and preferred stock warrants were converted into common stock and common stock warrants, respectively.
Credit Facilities
In April 2013, we entered into a Loan and Security Agreement with Silicon Valley Bank, or the Lender. The agreement provided for a revolving line of credit and a term loan. The maximum amount available for borrowing under the revolving line of credit was 80% of eligible accounts receivable, not to exceed $3.5 million in the aggregate. Interest under the revolving line of credit was calculated at the greater of the prime rate plus 0.50% or 3.75%. The original maturity date of the revolving line of credit was April 26, 2015. The term loan amount was for $1.0 million, which was advanced in April 2013. The principal amount outstanding on the term loan accrued interest at a per annum rate equal to prime rate plus 0.75%, fixed at the time of funding. The term loan was payable in 36 equal monthly payments starting on May 1, 2013, with the last payment occurring on April 1, 2016.
In October 2013, we and the Lender agreed to increase the maximum amount available for borrowing under the revolving line of credit to 80% of eligible accounts receivable plus 60% of eligible customer purchase orders, not to exceed $9.5 million in the aggregate. We may request cash advances for eligible purchase orders at any time provided that our net cash balance is equal to or greater than $8.0 million and the amount of purchase order advances outstanding does not exceed $2.0 million. The effective annual interest rate for borrowing against receivables is 4.69%, and the effective annual percentage rate for borrowing against purchase order advances is 6.25%. We and the Lender also added a growth capital term loan for up to $5.0 million, of which $3.0 million was advanced on October 31, 2013, and the remaining $2.0 million was to become available to us upon the achievement of certain milestones related to revenue growth during 2013. We achieved the milestones under this agreement, but we did not borrow the remaining $2.0 million. The principal amount outstanding for the growth capital advance accrues interest at a floating per annum rate equal to prime plus 2.25%. The growth capital loan is payable monthly over a 30-month period starting on October 1, 2014, with the last payment set to occur on March 1, 2017.
- 46 -
On January 30, 2015, we and the Lender agreed to (i) increase the maximum amount available under the revolving line of credit to 80% of eligible accounts receivable, not to exceed $12.5 million in the aggregate, (ii) extend the maturity date of the revolving line of credit to April 26, 2016, and (iii) add a supplemental growth capital term loan for up to $3.0 million, of which $3.0 million was advanced on February 3, 2015. The effective annual interest rate for borrowing against receivables under the revolving line of credit is 4.25% if our net cash is equal to or greater than $4.0 million. If our net cash is less than $4.0 million, the effective annual percentage rate for borrowing against receivables is 6.75%. The principal amount outstanding for the supplemental growth capital loan accrues interest at a floating rate per annum equal to prime plus 1.00%. The supplemental growth capital loan is payable monthly over a 36-month period starting on August 1, 2015, with the last payment set to occur on July 1, 2018.
In May 2016, we and the Lender amended and restated the Loan and Security Agreement to (i) increase the maximum amount available under the revolving line of credit to $20.0 million, (ii) extend the maturity date of the revolving line of credit to May 17, 2018, and (iii) add a new senior term loan in the amount of $4.0 million, in addition to the growth capital term loans described above. The new senior term loan has a one-year draw down period, and the principal amount outstanding under the new senior term loan accrues interest at a floating rate per annum equal to prime plus 0.75%. The new senior term loan is payable monthly over a 30-month term starting on June 1, 2017, with the last payment due on November 1, 2019. We drew down $3.0 million under the revolving line of credit in June 2016, and repaid $3.0 million in August 2016. We had an undrawn balance under the revolving line of credit of $20.0 million as of January 1, 2017, subject to availability of borrowing base.
In connection with the amendment and restatement of the Loan and Security Agreement, we entered into a subordinated secured Mezzanine Loan with the Lender for up to $10.0 million. The principal amount outstanding on the Mezzanine Loan accrues interest at a fixed rate per annum equal to 10.5%. The Mezzanine Loan has a one-year draw down period, with repayment due on May 1, 2019. In connection with the Mezzanine Loan, we issued warrants to purchase up to 126,400 shares of common stock, which become exercisable depending on the amounts borrowed under the Mezzanine Loan at an exercise price of $4.00 per share.
As of January 1, 2017 , December 27, 2015, and December 28, 2014, the aggregate outstanding balance under the Loan and Security Agreement, in each case as amended through such date, and the Mezzanine Loan was $6.0 million, $4.4 million and $3.2 million, respectively.
The amended and restated Loan and Security Agreement, or the SVB Loan Agreement, and the Mezzanine Loan are collateralized by certain of our assets, including pledging of certain of our equity interest in our subsidiaries, receivables and inventory, subject to customary exceptions and limits. The SVB Loan Agreement and the Mezzanine Loan contain customary events of default upon the occurrence of certain events, such as nonpayment of amounts due under the revolving line of credit or the term loans, violation of restrictive covenants, violation of other contractual provisions, or a material adverse change in our business. In addition, the credit facilities prohibit the payment of cash dividends on our capital stock and also places restrictions on mergers, sales of assets, investments, incurrence of liens, incurrence of indebtedness and transactions with affiliates. As of January 1, 2017, we were in compliance with all applicable covenants.
In accordance with the SVB Loan Agreement, we paid $0.2 million in fees to the Lender upon our IPO.
Based on our current operating plan, we expect that our cash on hand, will be sufficient to fund our operations through at least the next 12 months. However, our liquidity assumptions may prove to be incorrect, and we could utilize our available financial resources sooner than we currently expect. Our future capital requirements will depend on many factors, including:
• | the degree and rate of market adoption of our solutions, including design wins with customers and service providers; |
• | the emergence of new competing technologies and products; |
• | the costs of R&D activities we undertake to develop and expand our solutions portfolio; |
• | the costs of commercialization activities, including sales, marketing and manufacturing; |
• | the level of working capital required to support our growth; and |
• | our need for additional personnel, information technology or other operating infrastructure to support our growth and operations as a public company. |
- 47 -
In the event that additional capital is needed, we may not be able to raise such capital on terms acceptable to us or at all. If we are unable to raise additional capital when desired, our business, results of operations, and financial condition would be adversely affected. We may also seek to raise capital opportunistically to support the anticipated growth of our business.
Cash Flows
The following table sets forth the primary sources and uses of cash and cash equivalents for each of the periods presented below:
Years Ended | |||||||||||
January 1, 2017 | December 27, 2015 | December 28, 2014 | |||||||||
(In thousands) | |||||||||||
Net cash provided by (used in) : | |||||||||||
Operating activities | 2,316 | $ | (12,077 | ) | $ | (17,851 | ) | ||||
Investing activities | (2,783 | ) | (1,702 | ) | (1,257 | ) | |||||
Financing activities | 98,662 | 14,309 | 20,566 | ||||||||
Net increase in cash and cash equivalents | $ | 98,195 | $ | 530 | $ | 1,458 | |||||
Cash flows from Operating Activities.
Net cash provided by operating activities for 2016 was $2.3 million, compared to net cash used in operating activities for 2015 of $12.1 million.
Net cash provided by operating activities for 2016 of $2.3 million was comprised of a net loss of $1.9 million, as well as net cash outflow from changes in operating assets and liabilities of $0.6 million, partially offset by non-cash expenses of $3.1 million of stock-based compensation, $1.3 million of depreciation and amortization and $0.3 million of non-cash interest expense. The changes in operating assets and liabilities primarily consist of a $5.8 million increase in accrued liabilities and other current liabilities as a result of an increase in expenses consistent with the growth of our business, $1.8 million increase in accounts payable due to timing of payments to our suppliers, and a decrease of $1.2 million in accounts receivable due to timing of payments from our customers, offset by an increase of $8.4 million in inventory due to timing of purchases of raw materials and an increase of $0.9 million in prepaid expenses and other current assets.
Net cash used in operating activities was $12.1 million and $17.9 million for 2015 and 2014, respectively.
Net cash used in operating activities for 2015 of $12.1 million was comprised of a net loss of $7.0 million, as well as a net cash outflow from changes in operating assets and liabilities of $7.6 million in the normal course of business, partially offset by non-cash expenses of $1.2 million of stock-based compensation and $1.0 million of depreciation and amortization. The changes in operating assets and liabilities primarily consist of an increase of $5.9 million in accounts receivable due to increased sales, decreases of $4.4 million in accounts payable due to timing of payments to our suppliers and a decrease of $2.2 million in deferred revenue as a result of recognition of revenue under a contractual arrangement, respectively, partially offset by a decrease of $3.4 million in inventory due to timing of shipments of Wi-Fi solutions to our customers, and an increase of $0.9 million in accrued liabilities and other current liabilities.
Net cash used in operating activities for 2014 of $17.9 million was comprised of a net loss of $13.6 million, as well as a net cash outflow from changes in operating assets and liabilities of $5.7 million in the normal course of business, partially offset by non-cash expenses of $0.9 million of depreciation and amortization and $0.6 million of stock-based compensation. The changes in operating assets and liabilities primarily consist of a decrease of $2.7 million in deferred revenue as a result of recognition of revenue under a contractual arrangement, increases of $4.0 million in inventory as a result of production of inventory at the end of the period, $2.1 million in accounts receivable due to increased sales, and $1.6 million in prepaid expenses and other current assets, respectively, partially offset by increases of $3.4 million in accounts payable and $1.3 million in accrued liabilities and other current liabilities as a result of an increase in expenses consistent with the growth of our business.
- 48 -
Cash flows from Investing Activities.
Net cash used in investing activities was $2.8 million for 2016 compared to net cash used in investing activities for 2015 of $1.7 million compared to net cash used in investing activities for 2014 of $1.3 million. Cash used in investing activities for 2016 was primarily related to $2.7 million purchase of property and equipment. Net cash used increased in 2015 compared to 2014 primarily due to increased purchases of equipment.
Cash flows from Financing Activities.
Net cash provided by financing activities was $98.7 million for 2016, compared to net cash provided by financing activities of $14.3 million for 2015. Cash flow provided by financing activities for 2016 primarily reflected $97.5 million proceeds from the IPO, net of issuance costs, $3.9 million in long-term debt borrowing, net of debt issuance costs, $3.0 million from borrowing under our revolving line of credit, and $1.2 million proceeds from exercise of stock options, partially offset by repayments of outstanding long-term debt of $3.8 million and repayment of outstanding amounts under the revolving line of credit of $3.0 million.
Net cash provided by financing activities was $14.3 million for 2015, compared to $20.6 million for 2014. Cash flow from financing activities in 2015 consisted of $14.3 million in net proceeds from the issuance of convertible preferred stock and $3.0 million of long-term debt borrowing, partially offset by repayments of outstanding long-term debt of $3.1 million. Cash flows from financing activities in 2014 consisted primarily of $21.5 million in net proceeds from the issuance of convertible notes and convertible preferred stock, partially offset by repayments of outstanding long-term debt of $1.1 million.
Contractual Obligations and Commitments
The following table summarizes our contractual commitments and obligations as of January 1, 2017:
Total | Less Than 1 Year | 1-3 Years | 3-5 Years | More Than 5 Years | |||||||||||||||
(In thousands) | |||||||||||||||||||
Debt obligations and related interest payments and fees(1) | $ | 6,570 | $ | 2,570 | $ | 4,000 | $ | — | $ | — | |||||||||
Operating lease obligations | 1,273 | 811 | 462 | — | — | ||||||||||||||
Commitments(2) | 7,100 | 2,200 | 4,900 | — | — | ||||||||||||||
$ | 14,943 | $ | 5,581 | $ | 9,362 | $ | — | $ | — | ||||||||||
________________________
(1) | Future interest payments were calculated using the rates applicable as of January 1, 2017. See Note 7 of our consolidated financial statements included elsewhere in this Annual Report on Form 10-K. In May 2016, we amended and restated the April 2013 Loan and Security Agreement with Silicon Valley Bank and entered into a new Mezzanine Loan Agreement to increase the total amount available for borrowing to $34.0 million. Borrowings bear interest at a fluctuating rate, as further discussed in the section titled “Liquidity and Capital Resources.” As of January 1, 2017, the debt obligations and related interest payments and fees amount to $6.6 million. |
(2) | In April 2012, we entered into a letter agreement with RUSNANO, one of our private company investors, pursuant to which we agreed, among other matters, to create a subsidiary to be incorporated in Russia and to fund such subsidiary in an aggregate amount of $20.0 million over three years. In July 2014, we amended and restated such letter agreement with RUSNANO, pursuant to which we agreed, among other matters, to operate and fund our Russian operations in an aggregate amount of $13.0 million over six annual periods beginning on December 31, 2014. The annual funding requirements in period one to period six are $2.2 million, $1.7 million, $2.0 million, $2.2 million, $2.4 million, and $2.5 million, respectively. In the event that we fail to meet our funding obligations for any period, we will be required to pay RUSNANO a penalty fee of 10% on 80% of the difference between the funding obligation and the actual funding for that period, subject to a cure period of one calendar quarter after the applicable period funding deadline. As of January 1, 2017, we had met the minimum funding requirements. For more information about this agreement, see the section titled “Certain Relationships and Related Party Transactions-Agreement with RUSNANO” in this Annual Report on Form 10-K. |
Obligations under contracts that we can cancel without a significant penalty are not included in the table above. As of January 1, 2017 and December 27, 2015, we have purchase obligations of $10.5 million and $5.6 million, respectively, that are
- 49 -
based on outstanding purchase orders related to the fabrication of silicon wafers for which production has started. These purchase orders are cancellable at any time, provided that we are required to pay all costs incurred through the cancellation date. Historically, we have rarely canceled these agreements once production has started.
Off-Balance Sheet Arrangements
As of January 1, 2017, December 27, 2015, and December 28, 2014, we did not have any off-balance sheet arrangements.
Segment Information
We have one primary business activity and operate as one reportable segment, design, development, and marketing of advanced high-speed wireless communication solutions enabling wireless local area networking.
JOBS Act Accounting Election
The JOBS Act permits an “emerging growth company” such as us to take advantage of an extended transition period to comply with new or revised accounting standards applicable to public companies. We are choosing to “opt out” of this provision and, as a result, we will comply with new or revised accounting standards as required when they are adopted. This decision to opt out of the extended transition period under the JOBS Act is irrevocable.
Critical Accounting Policies, Significant Judgments and Use of Estimates
This discussion and analysis of our financial condition and results of operations is based on our consolidated financial statements, which have been prepared in accordance with U.S. GAAP. The preparation of these consolidated financial statements requires us to make estimates and judgments that affect the reported amounts of assets and liabilities, revenue and expenses, and the disclosure of contingent assets and liabilities. Our estimates are based on our historical experience and on various other assumptions that we believe to be reasonable under the circumstances, the results of which form the basis for making judgments about the carrying value of assets and liabilities. Actual results may differ from these estimates. We believe that the critical accounting policies discussed below are essential to understanding our historical and future performance, as these policies relate to the more significant areas involving management’s estimates and judgments.
Revenue Recognition
We derive a vast majority of our revenue from the sale of Wi-Fi solutions. Revenue is recognized net of accruals for sales returns and rebates, which is estimated based on past experience or contractual rights. We recognize revenue when persuasive evidence of an arrangement exists, delivery has occurred, the price is deemed fixed or determinable and collection is reasonably assured. These criteria are met upon shipment to customers. For sales made through distributors, revenue is recognized when title passes to the distributor upon shipment, and payment by distributors is not contingent on resale of the Wi-Fi solutions. Our sales arrangements with distributors do not allow for rights of return or price protection on unsold Wi-Fi solutions. Our policy is to classify shipping and handling costs, net of costs charged to customers, as cost of revenue.
We also derive revenue from contracts with multiple deliverables, including a mix of intellectual property licenses, research and development services, and other non-recurring arrangements. Revenue recognition for contracts with multiple deliverables is based on the individual units of accounting determined to exist in the contract. A delivered item is considered a separate unit of accounting when (i) the delivered item has value to the customer on a stand-alone basis; and (ii) if a general right of return exists, the delivery or performance of an undelivered item is considered probable and under our control. Items are considered to have a stand-alone value when they are sold separately by any vendor or when the customer could resell the item on a stand-alone basis. In addition, intellectual property deliverables are considered to have value on a stand-alone basis if the customer could use them without the remaining elements of the arrangement. When a deliverable does not meet the criteria to be considered a separate unit of accounting, it is grouped together with other deliverables that, when combined, meet the criteria, and the appropriate allocation of arrangement consideration and revenue recognition is determined.
In April 2013, we entered into an agreement consisting of intellectual property licenses and research and development services. We concluded that the agreement consisted of two deliverables, intellectual property licenses and research and development services. We determined that the two deliverables do not meet the criteria to be accounted as separate units of accounting because the intellectual property licenses do not have a value on a standalone basis from the research and development
- 50 -
services. As a result, the intellectual property licenses and research and development services are considered one combined unit of accounting. Revenue is recognized on a straight-line basis over the 33-month period the services are expected to be performed, provided all other revenue recognition criteria are met. If the estimated period over which the services are originally expected to be performed changes, the amount of revenue remaining to be recognized will be recognized over the revised remaining performance period. The agreement’s term is ten years. The agreement may be terminated by either party if (a) the other party materially breaches a material provision of the agreement unless such breach is cured during the 30 day grace period, (b) the other party materially breaches any provision of the agreement that cannot be cured, or (c) the other party makes any assignment for the benefit of creditors, files a petition in bankruptcy, is adjudged bankrupt, becomes insolvent, or is placed in the hands of a receiver. Certain payments received under the agreement are refundable if the agreement is terminated for our material breach of the agreement terms. The fees under this agreement totaled $16.5 million, of which $0.5 million, $5.7 million, and $6.2 million, was recognized as revenue for the year ended January 1, 2017, December 27, 2015, and December 28, 2014, respectively. The agreement was terminated in 2016.
Inventory
Inventory is stated at the lower of cost to purchase or manufacture the inventory or the market value of such inventory. Cost is determined using the standard cost method which approximates the first-in first-out basis. Market value is determined as the lower of replacement cost or net realizable value. On at least a quarterly basis, we assess the recoverability of all inventories to determine whether adjustments are required to record inventory at the lower of cost or market. Potentially excess and obsolete inventory is written off based on management’s analysis of inventory levels and estimates of future 12-month demand and market conditions. We are also entitled to receive rebates from our foundry partner on the purchase of silicon wafers upon achieving certain volume targets. Rebates from our foundry partner are recorded as a reduction of inventory cost and are recognized in cost of revenue as the chipsets made from such silicon wafers are sold to customers.
Stock-Based Compensation
We measure and recognize compensation expense for all stock-based awards made to employees, directors and non-employees, based on estimated fair values recognized using the straight-line method over the requisite service period.
The fair value of stock-based awards issued to employees and non-employees is estimated on the grant date using the Black-Scholes option valuation model. We account for stock-based awards issued to non-employees under ASC 505-50 Equity-Equity based payments to Non-Employees, and the fair value of such non-employee awards is remeasured at each quarter-end over the vesting period.
The Black-Scholes option valuation model requires the use of highly subjective assumptions to determine the fair value of stock-based awards. The assumptions used in our option-pricing model represent management’s best estimates. These estimates are complex, involve a number of factors, variables, uncertainties and the application of management’s judgment. If factors change and different assumptions are used, our stock-based compensation expense could be materially different in the future. The assumptions and estimates we use in the Black-Scholes option valuation model are as follows:
• | Fair value of common stock: Prior to our IPO in November 2016, the fair value of the common stock underlying our stock-based awards were determined by the Company’s board of directors, with input from management and a third-party valuation firm as discussed below under the heading “Common Stock Valuations Prior to Our Initial Public Offering”. Since our IPO, the fair value of common stock was determined based on the market closing price for our common stock as reported on the NASDAQ Global Select Market at each grant date. |
• | Risk-Free Interest Rate. We base the risk-free interest rate on the implied yield available on U.S. Treasury zero-coupon issues with a term equivalent to that of the expected term of the option or warrant. |
• | Expected Term. Expected term represents the period that our stock-based awards are expected to be outstanding. We use the simplified method to calculate the expected term, which is the average of the contractual term and vesting period. |
• | Volatility. We determine the price volatility based on the historical volatilities of industry peers as we have limited trading history for our common stock price. Industry peers consist of several public companies in the semiconductor industry with comparable characteristics, including revenue growth, operating model and working capital requirements. |
- 51 -
• | Dividend Yield. The expected dividend assumption is based on our current expectations about our anticipated dividend policy. To date, we have not declared any dividends and do not expect to declare dividends in the foreseeable future. Consequently, we have used an expected dividend yield of zero. |
In addition to the assumptions used in the Black-Scholes option valuation model, we must also estimate a forfeiture rate to calculate the stock-based compensation for our awards. Our forfeiture rate is based on an analysis of our actual forfeitures. We will continue to evaluate the appropriateness of the forfeiture rate based on our actual forfeiture experience, analysis of employee turnover, and other factors. Quarterly changes in our estimated forfeiture rate can have a significant impact on our stock-based compensation expense as the cumulative effect of adjusting the rate is recognized in our financial statements. If a revised forfeiture rate is lower than our previously estimated forfeiture rate, an adjustment is made that will result in an increase to the stock-based compensation expense recognized in our financial statements.
We will continue to use judgment in evaluating the assumptions related to our stock-based compensation on a prospective basis. As we continue to accumulate additional data, we may have refinements to our estimates, which could materially impact our future stock-based compensation expense. Subsequent to our IPO, we determine the fair values of the shares of common stock underlying our share–based awards based upon the closing stock price on the date of grant.
Common Stock Valuations Prior to Our Initial Public Offering
Historically, for all periods prior to the IPO, the fair values of the shares of common stock underlying our share-based awards were estimated on each grant date by our board of directors. In order to determine the fair value of our common stock underlying option grants, our board of directors considered, among other things, contemporaneous valuations of our common stock prepared by an unrelated third-party valuation firm in accordance with the guidance provided by the American Institute of Certified Public Accountants Practice Guide, Valuation of Privately-Held-Company Equity Securities Issued as Compensation.
Convertible Preferred Stock Warrants Liability
Warrants to purchase shares of convertible preferred stock are classified as liabilities on the consolidated balance sheets at fair value upon issuance because the underlying shares of convertible preferred stock are redeemable at the option of the holders upon the occurrence of certain deemed liquidation events considered not solely within our control, which may therefore obligate us to transfer assets at some point in the future. The convertible preferred stock warrants are subject to remeasurement to fair value at each balance sheet date and any change in fair value is recognized as a component of “Other income (expense), net” in the consolidated statements of operations. We adjusted the liability for changes in fair value until immediately prior to the consummation of our IPO in November 2016, at which time all convertible preferred stock warrants were converted into shares of common stock and the related convertible preferred stock warrant liability was reclassified to additional paid-in capital.
Common Stock Warrants
We account for common stock warrants as equity in accordance with the accounting guidance for derivatives. The accounting guidance provides a scope exception from classifying and measuring as a financial liability a contract that would otherwise meet the definition of a derivative if the contract is both (i) indexed to the entity’s own stock and (ii) meets the requirement for classification in the stockholders’ equity (deficit) section of the balance sheet.
We determined that the common stock warrants issued in connection with the debt arrangement are required to be classified in equity. Warrants classified as equity are recorded as additional paid in capital on the consolidated balance sheet in “Stockholders’ equity (deficit)” and no further adjustments to their valuation are made.
We account for common stock warrants issued to non-employees for services under ASC 505-50. The fair value of such non-employee warrants is remeasured at each quarter-end over the vesting period. We determine the fair value of the common stock warrants using the Black-Scholes option valuation model using the stock price and other measurement assumptions as of the earlier of the date at which either (1) a commitment for performance by the counterparty has been reached; or (2) the counterparty’s performance is complete.
Income Taxes
We recognize deferred income taxes for temporary differences between the basis of assets and liabilities for financial statement and income tax purposes. We periodically evaluate the positive and negative evidence bearing upon realizability of
- 52 -
our deferred tax assets. Based upon the weight of available evidence, which includes our historical operating performance, reported cumulative net losses since inception and difficulty in accurately forecasting our future results, we maintained a full valuation allowance against federal and state net deferred tax assets as of January 1, 2017, December 27, 2015, and December 28, 2014. We intend to maintain a full valuation allowance on the federal and state deferred tax assets until sufficient positive evidence exists to support reversal of the valuation allowance.
At January 1, 2017, December 27, 2015, and December 28, 2014, we had federal net operating loss carry-forwards of $134.1 million, $151.9 million and $145.1 million, respectively, and state net operating loss carry-forwards of $104.7 million, $106.7 million and $109.2 million, respectively. These federal and state net operating loss carry-forwards expire beginning in 2026 and 2017, respectively. At January 1, 2017, December 27, 2015, and December 28, 2014, we also had federal research and development tax credit carry-forwards of $7.2 million, $6.3 million and $5.3 million, respectively, and state research and development tax credit carry-forwards of $7.7 million, $6.3 million and $5.4 million, respectively. The federal tax credits will expire in 2026, and the California tax credits carry forward indefinitely. Realization of these NOL and research tax credit carry-forwards depends on future income, and there is a risk that our existing carry-forwards could expire unused and be unavailable to reduce future income tax liabilities, which could impact our financial position and results of operations.
In addition, under Section 382 of the Code, our ability to utilize NOL carry-forwards or other tax attributes such as research tax credits, in any taxable year may be limited if we experience, or have experienced, an “ownership change.” A Section 382 “ownership change” generally occurs if one or more stockholders or groups of stockholders, who own at least 5% of our stock, increase their ownership by more than 50 percentage points over their lowest ownership percentage within a rolling three-year period. Similar rules may apply under state tax laws.
No deferred tax assets have been recognized on our balance sheet related to our NOLs and tax credits, as they are fully reserved by a valuation allowance. We may have previously experienced, and may in the future experience, one or more Section 382 “ownership changes,” including in connection with our initial public offering. If so, or if we do not generate sufficient taxable income, we may not be able to utilize a material portion of our NOLs and tax credits even if we achieve profitability. If we are limited in our ability to use our NOLs and tax credits in future years in which we have taxable income, we will pay more taxes than if we were able to fully utilize our NOLs and tax credits. This could adversely affect our results of operations.
We record unrecognized tax benefits as liabilities and adjust these liabilities when our judgment changes as a result of the evaluation of new information not previously available. Because of the complexity of some of these uncertainties, the ultimate resolution may result in a payment that is materially different from our current estimate of the unrecognized tax benefit liabilities. These differences will be reflected as increases or decreases to income tax expense in the period in which new information is available. Our policy is to recognize interest and penalties related to income taxes as a component of income tax expense. No interest and penalties related to income taxes have been recognized in the consolidated statements of operations in the years ended January 1, 2017, December 27, 2015, and December 28, 2014.
Contingencies and Litigation
The outcome of litigation is inherently uncertain and subject to numerous factors outside of our control. Significant judgment is required when we assess the likelihood of any adverse judgments or outcomes to a potential claim or legal proceeding, as well as potential ranges of probable losses, and when the outcomes of the claims or proceedings are probable and reasonably estimable. A determination of the amount of accrued liabilities required, if any, for these contingencies is made after the analysis of each matter. Because of uncertainties related to these matters, we base our estimates on the information available at the time. As additional information becomes available, we reassess the potential liability related to pending claims and litigation, and may revise our estimates. Any revisions in the estimates of potential liabilities could have a material impact on our results of operations, financial position and cash flows.
Recent Accounting Pronouncements
See Note 2 to our consolidated financial statements for information regarding recently issued accounting pronouncements.
- 53 -
Item 7A. QUANTITATIVE AND QUALITATIVE DISCLOSURES ABOUT MARKET RISK
We are exposed to market risk related to changes in interest rates, foreign currency exchange rates and inflation rates. These exposures may change over time as business practices evolve, and could have a material adverse impact on our financial results.
Interest Rate Risk
We had cash and cash equivalents of $117.0 million, $18.9 million and $18.3 million as of January 1, 2017, December 27, 2015 and December 28, 2014, respectively. We manage our cash and cash equivalents portfolio for operating and working capital purposes. Our cash and cash equivalents are held in cash and short-term money market funds. Due to the short-term nature of these instruments, we believe that we do not have any material exposure to changes in the fair value of our cash equivalents portfolio as a result of changes in interest rates. Declines in interest rates, however, would reduce our future interest income. During the years ended January 1, 2017, December 27, 2015 and December 28, 2014, the effect of a hypothetical 100 basis points increase or decrease in overall interest rates would not have had a material impact on our interest income. In addition, as of January 1, 2017, we had $6.6 million in long-term debt (current and non-current), including accrued interest, with variable interest rate components. A hypothetical 100 basis points increase or decrease in interest rates would not have had a material impact on our consolidated statements of operations.
Foreign Currency Exchange Risk
To date, all of our revenue has been denominated in United States dollars. Some of our operating expenses are subject to fluctuations due to changes in foreign currency exchange rates, particularly changes in the Chinese Yuan Renminbi and the Russian Ruble. Fluctuations in foreign currency exchange rates may cause us to recognize transaction gains and losses in our consolidated statements of operations. To date, foreign currency gains and losses have not been material to our consolidated financial statements, and we have not engaged in any foreign currency hedging activities. As our international operations grow, we will continue to reassess our approach to managing the risks relating to fluctuations in foreign currency exchange rates. During January 1, 2017, December 27, 2015, and December 28, 2014, the effect of an immediate 10% adverse change in foreign exchange rates on foreign-denominated accounts as of January 1, 2017 and December 27, 2015 would not have had a material impact on our consolidated statements of operations.
Inflation Risk
We do not believe that inflation had a significant impact on our results of operations for any periods presented in our consolidated financial statements.
- 54 -
Item 8. FINANCIAL STATEMENTS AND SUPPLEMENTARY DATA
Page(s) | |
Consolidated Financial Statements: | |
The supplementary financial information required by this Item 8 is included in Item 7 under the caption “Management’s Discussion and Analysis of Financial Condition and Results of Operations--Quarterly Results of Operations.”
- 55 -
Report of Independent Registered Public Accounting Firm
To the Board of Directors and Stockholders of Quantenna Communications, Inc.:
In our opinion, the accompanying consolidated balance sheets and the related consolidated statements of operations, of convertible preferred stock and stockholders’ equity (deficit) and cash flows present fairly, in all material respects, the financial position of Quantenna Communications, Inc. and its subsidiaries as of January 1, 2017 and December 27, 2015, and the results of their operations and their cash flows for each of the three years in the period ended January 1, 2017, in conformity with accounting principles generally accepted in the United States of America. These financial statements are the responsibility of the Company’s management. Our responsibility is to express an opinion on these financial statements based on our audits. We conducted our audits of these financial statements in accordance with the standards of the Public Company Accounting Oversight Board (United States). Those standards require that we plan and perform the audit to obtain reasonable assurance about whether the financial statements are free of material misstatement. An audit includes examining, on a test basis, evidence supporting the amounts and disclosures in the financial statements, assessing the accounting principles used and significant estimates made by management, and evaluating the overall financial statement presentation. We believe that our audits provide a reasonable basis for our opinion.
/s/ PricewaterhouseCoopers LLP
San Jose, California
March 1, 2017
- 56 -
Quantenna Communications, Inc.
Consolidated Balance Sheets
(In thousands, except share and per share data)
January 1, 2017 | December 27, 2015 | ||||||
Assets | |||||||
Current assets | |||||||
Cash and cash equivalents | $ | 117,045 | $ | 18,850 | |||
Accounts receivable | 14,480 | 15,717 | |||||
Inventory | 15,820 | 7,407 | |||||
Prepaid expenses and other current assets | 2,470 | 1,428 | |||||
Total current assets | 149,815 | 43,402 | |||||
Property and equipment, net | 4,742 | 3,083 | |||||
Other long-term assets | 232 | 182 | |||||
Total assets | $ | 154,789 | $ | 46,667 | |||
Liabilities, Convertible Preferred Stock, and Stockholders’ Equity (Deficit) | |||||||
Current liabilities | |||||||
Accounts payable | $ | 7,776 | $ | 5,917 | |||
Accrued liabilities and other current liabilities | 11,801 | 5,617 | |||||
Long-term debt, current portion | 2,257 | 3,581 | |||||
Total current liabilities | 21,834 | 15,115 | |||||
Long-term debt | 3,680 | 2,265 | |||||
Other long-term liabilities | 527 | — | |||||
Convertible preferred stock warrant liability | — | 255 | |||||
Total liabilities | 26,041 | 17,635 | |||||
Commitments and contingencies (see Note 6) | |||||||
Convertible preferred stock, $0.0001 par value 100,000,000 and 23,049,634 shares authorized at January 1, 2017 and December 27, 2015, respectively; zero and 22,471,537 shares issued and outstanding at January 1, 2017 and December 27, 2015, respectively; Liquidation preference of zero and 190,130 at January 1, 2017 and December 27, 2015 respectively; | — | 184,704 | |||||
Stockholders’ equity (deficit) | |||||||
Common stock, $0.0001 par value 1,000,000,000 and 33,136,893, shares authorized at January 1, 2017 and December 27, 2015, respectively; 33,076,150 and 1,106,240 shares issued and outstanding at January 1, 2017 and December 27, 2015, respectively | 3 | — | |||||
Additional paid-in capital | 290,319 | 4,007 | |||||
Accumulated deficit | (161,574 | ) | (159,679 | ) | |||
Total stockholders’ equity (deficit) | 128,748 | (155,672 | ) | ||||
Total liabilities, convertible preferred stock and stockholders’ equity (deficit) | $ | 154,789 | $ | 46,667 | |||
The accompanying notes are an integral part of these financial statements.
57
Quantenna Communications, Inc.
Consolidated Statements of Operations
(In thousands, except share and per share data)
Years Ended | |||||||||||
January 1, 2017 | December 27, 2015 | December 28, 2014 | |||||||||
Revenue | $ | 129,069 | $ | 83,773 | $ | 66,860 | |||||
Cost of revenue | 64,640 | 42,554 | 38,211 | ||||||||
Gross profit | 64,429 | 41,219 | 28,649 | ||||||||
Operating expenses: | |||||||||||
Research and development | 46,604 | 35,575 | 31,283 | ||||||||
Sales and marketing | 8,091 | 6,644 | 5,932 | ||||||||
General and administrative | 10,559 | 5,212 | 4,532 | ||||||||
Total operating expenses | 65,254 | 47,431 | 41,747 | ||||||||
Loss from operations | (825 | ) | (6,212 | ) | (13,098 | ) | |||||
Interest expense | (665 | ) | (697 | ) | (481 | ) | |||||
Other income (expense), net | (38 | ) | (21 | ) | 89 | ||||||
Loss before income taxes | (1,528 | ) | (6,930 | ) | (13,490 | ) | |||||
Provision for income taxes | (367 | ) | (115 | ) | (108 | ) | |||||
Net loss | $ | (1,895 | ) | $ | (7,045 | ) | $ | (13,598 | ) | ||
Net loss attributable to common stockholders per share, basic and diluted | $ | (0.30 | ) | $ | (9.16 | ) | $ | (20.72 | ) | ||
Weighted average shares used to compute basic and diluted net loss per share | 6,384,709 | 769,524 | 656,146 | ||||||||
The accompanying notes are an integral part of these financial statements.
58
Quantenna Communications, Inc.
Consolidated Statements of Convertible Preferred Stock and Stockholders’ Equity (Deficit)
(In thousands, except share data)
Convertible Preferred Stock | Common Stock | |||||||||||||||||||||||||
Shares | Amount | Shares | Amount | Additional Paid-In Capital | Accumulated Deficit | Total Stockholders’ Equity (Deficit) | ||||||||||||||||||||
Balances at December 31, 2013 | 19,821,417 | $ | 148,905 | 598,280 | $ | — | $ | 1,946 | $ | (139,036 | ) | $ | (137,090 | ) | ||||||||||||
Issuance of common stock for exercise of options | — | — | 97,380 | — | 128 | — | 128 | |||||||||||||||||||
Expiration of Series A preferred stock warrants | — | 5 | — | — | — | — | — | |||||||||||||||||||
Issuance of Series G convertible preferred stock, net of issuance costs | 1,599,540 | 21,538 | — | — | — | — | — | |||||||||||||||||||
Stock-based compensation expense | — | — | — | — | 567 | — | 567 | |||||||||||||||||||
Net loss | — | — | — | — | — | (13,598 | ) | (13,598 | ) | |||||||||||||||||
Balances at December 28, 2014 | 21,420,957 | 170,448 | 695,660 | — | 2,641 | (152,634 | ) | (149,993 | ) | |||||||||||||||||
Issuance of common stock for exercise of options | — | — | 121,880 | — | 150 | — | 150 | |||||||||||||||||||
Issuance of common stock for exercise of warrants | — | — | 288,700 | — | 14 | — | 14 | |||||||||||||||||||
Issuance of Series G convertible preferred stock, net of issuance costs | 1,050,580 | 14,256 | — | — | — | — | — | |||||||||||||||||||
Stock-based compensation expense | — | — | — | — | 1,202 | — | 1,202 | |||||||||||||||||||
Net loss | — | — | — | — | — | (7,045 | ) | (7,045 | ) | |||||||||||||||||
Balances at December 27, 2015 | 22,471,537 | 184,704 | 1,106,240 | — | 4,007 | (159,679 | ) | (155,672 | ) | |||||||||||||||||
Issuance of common stock for exercise of options | — | — | 329,017 | — | 579 | — | 579 | |||||||||||||||||||
Issuance of common stock for service provided | — | — | 2,777 | — | 25 | — | 25 | |||||||||||||||||||
Proceeds from initial public offering, net of issuance costs | — | — | 6,775,466 | 1 | 97,418 | — | 97,419 | |||||||||||||||||||
Conversion of preferred stock to common stock pursuant to IPO | (22,471,537 | ) | (184,704 | ) | 24,790,650 | 2 | 184,702 | — | 184,704 | |||||||||||||||||
Conversion of preferred stock warrants to common stock warrants | — | — | — | — | 342 | — | 342 | |||||||||||||||||||
Issuance of common stock upon exercise of options subject to repurchase | — | — | 72,000 | — | — | — | ||||||||||||||||||||
Vesting of options subject to repurchase | — | — | — | — | 85 | 85 | ||||||||||||||||||||
Stock-based compensation expense | 3,065 | 3,065 | ||||||||||||||||||||||||
Issuance of common stock warrants | — | — | — | — | 96 | — | 96 | |||||||||||||||||||
Net loss | — | — | — | — | — | (1,895 | ) | (1,895 | ) | |||||||||||||||||
Balances at January 1, 2017 | — | — | 33,076,150 | 3 | 290,319 | (161,574 | ) | 128,748 | ||||||||||||||||||
The accompanying notes are an integral part of these financial statements.
59
Quantenna Communications, Inc.
Consolidated Statements of Convertible Preferred Stock and Stockholders’ Equity (Deficit)
(In thousands, except share data)
The accompanying notes are an integral part of these financial statements.
60
Years Ended | |||||||||||
January 1, 2017 | December 27, 2015 | December 28, 2014 | |||||||||
Cash flows from operating activities | |||||||||||
Net loss | $ | (1,895 | ) | $ | (7,045 | ) | $ | (13,598 | ) | ||
Adjustments to reconcile net loss to net cash provided by (used in) operating activities | |||||||||||
Depreciation and amortization | 1,278 | 987 | 875 | ||||||||
Stock-based compensation expense | 3,090 | 1,202 | 567 | ||||||||
Non-cash interest expense | 322 | 271 | — | ||||||||
Change in fair value of convertible preferred stock warrants liability | 87 | 61 | (38 | ) | |||||||
Changes in assets and liabilities | |||||||||||
Accounts receivable | 1,237 | (5,877 | ) | (2,120 | ) | ||||||
Inventory | (8,413 | ) | 3,387 | (3,967 | ) | ||||||
Prepaid expenses and other current assets | (901 | ) | 541 | (1,556 | ) | ||||||
Other assets | (50 | ) | 60 | 43 | |||||||
Accounts payable | 1,804 | (4,401 | ) | 3,356 | |||||||
Accrued liabilities and other current liabilities | 5,757 | 934 | 1,269 | ||||||||
Deferred revenue | — | (2,197 | ) | (2,682 | ) | ||||||
Net cash provided by (used) in operating activities | 2,316 | (12,077 | ) | (17,851 | ) | ||||||
Cash flows from investing activities | |||||||||||
Purchase of property and equipment | (2,724 | ) | (1,761 | ) | (1,257 | ) | |||||
Restricted cash | (59 | ) | 59 | — | |||||||
Net cash used in investing activities | (2,783 | ) | (1,702 | ) | (1,257 | ) | |||||
Cash flows from financing activities | |||||||||||
Proceeds from issuance of convertible notes | — | — | 16,163 | ||||||||
Proceeds from issuance of convertible preferred stock, net of issuance costs | — | 14,256 | 5,375 | ||||||||
Proceeds from issuance of common stock | 1,191 | 164 | 128 | ||||||||
Proceeds from initial public offering, net of issuance costs | 97,483 | — | — | ||||||||
Proceeds from revolving line of credit, net of fees paid | 2,950 | — | — | ||||||||
Repayment of revolving line of credit | (3,000 | ) | — | — | |||||||
Proceeds from issuance of long-term debt, net of fees paid | 3,854 | 3,000 | — | ||||||||
Repayments of long-term debt | (3,816 | ) | (3,111 | ) | (1,100 | ) | |||||
Net cash provided by financing activities | 98,662 | 14,309 | 20,566 | ||||||||
Net increase in cash and cash equivalents | $ | 98,195 | $ | 530 | $ | 1,458 | |||||
Cash and cash equivalents | |||||||||||
Beginning of period | $ | 18,850 | $ | 18,320 | $ | 16,862 | |||||
End of period | $ | 117,045 | $ | 18,850 | $ | 18,320 | |||||
Supplemental disclosure of cash flow information | |||||||||||
Interest paid during the period | $ | 489 | $ | 440 | $ | 481 | |||||
Income taxes paid during the period | $ | 106 | $ | 135 | $ | 23 | |||||
Supplemental disclosure of non-cash investing and financing activities | |||||||||||
Unpaid deferred offering costs | $ | 64 | $ | — | $ | — | |||||
Issuance of convertible preferred stock upon conversion of convertible notes and accrued interest | $ | — | $ | — | $ | 16,163 | |||||
The accompanying notes are an integral part of these financial statements.
61
Purchases of property and equipment included in accounts payable and accrued liabilities and other current liabilities | $ | 213 | $ | — | $ | — | |||||
Conversion of convertible preferred stock warrants to common stock | $ | 342 | $ | — | $ | — | |||||
Conversion of convertible preferred stock to common stock | $ | 184,704 | $ | — | $ | — | |||||
Issuance of warrants in conjunction with the execution of debt agreement | $ | 96 | $ | — | $ | — | |||||
The accompanying notes are an integral part of these financial statements.
62
1. The Company and Summary of Significant Accounting Policies
Quantenna Communications, Inc. (the “Company”) was incorporated in the State of Delaware on November 28, 2005. The Company designs, develops and markets advanced high-speed wireless communication solutions enabling wireless local area networking. The Company’s wireless communication solutions deliver high performance, speed, and reliability for wireless networks and devices.
Reporting Calendar
The Company’s fiscal year consists of either 52 or 53 weeks. For each year consisting of 52 weeks, the Company’s fiscal year ends on the Sunday nearest the end of December. For each year consisting of 53 weeks, the Company’s fiscal year ends on the first Sunday in January. Fiscal 2014 and 2015 each included 52 weeks and fiscal 2016 included 53 weeks.
Initial Public Offering
On October 27, 2016, the Company’s registration statement on Form S-1 relating to its initial public offering (“IPO”) of its common stock was declared effective by the Securities and Exchange Commission (“SEC”) and the shares of its common stock began trading on The NASDAQ Global Select Market on October 28, 2016. The public offering price of the shares sold in the IPO was $16.00 per share. The IPO closed on November 2, 2016 and second close on November 25, 2016, pursuant to which the Company sold 6,775,466 shares of common stock, including the sale of 75,466 shares of common stock to the underwriters upon their exercise of their option to purchase additional shares. The Company received net proceeds of approximately $97.4 million, after underwriting discounts, commissions and offering expenses. Immediately prior to the consummation of the IPO, all outstanding shares of convertible preferred stock and preferred stock warrants were converted into common stock and common stock warrants, respectively.
Liquidity and Capital Resources
The Company has funded its operations primarily through sales of its common stock in conjunction with the IPO and private equity financing. In November 2016, the Company consummated its IPO and raised net proceeds of approximately $97.4 million, after deducting underwriting discounts and commissions and offering expenses and including the exercise by the underwriters of their option to purchase additional shares of common stock. As of December 27, 2015, the Company had completed several rounds of private equity financing with net proceeds totaling $184.7 million. The Company has incurred losses for every fiscal year since inception and has generated positive cash flow from operations for the first time in the fiscal year ended January 1, 2017. As of January 1, 2017 and December 27, 2015, the Company had cash and cash equivalents of $117.0 million and $18.9 million, respectively, and an accumulated deficit of $161.6 million and $159.7 million, respectively. In May 2016, the Company amended and restated the April 2013 Loan and Security Agreement with Silicon Valley Bank and entered into a new Mezzanine Loan Agreement to increase the total amount available for borrowing to $34.0 million. The Company has under the revolving line of credit an undrawn balance of $20.0 million as of January 1, 2017, subject to availability of borrowing base. There is no draw down on the Mezzanine Loan as of January 1, 2017.
Use of Estimates
Preparation of financial statements in conformity with accounting principles generally accepted in the United States of America, or US GAAP, requires management to make estimates and assumptions that affect the reported amounts of assets and liabilities and disclosure of contingent assets and liabilities at the date of the financial statements and reported amounts of revenue and expenses during the reporting periods covered by the financial statements and accompanying notes. Actual results could differ from those estimates.
Principles of Consolidation
The consolidated financial statements include the accounts of the Company and its wholly owned subsidiaries. All intercompany transactions and balances have been eliminated in consolidation.
- 63 -
Reclassifications
Certain prior year balances presented in the consolidated financial statements have been reclassified to conform to the current year presentation. For the year ended December 28, 2014, the Company has reallocated $1.7 million of facility and information technology overhead expenses from general and administrative expense, and included $1.5 million in research and development expense and $0.2 million in sales and marketing expense. These reclassifications had no effect on the previously reported net loss.
Foreign Currency Remeasurement
The Company and its subsidiaries use the U.S. dollar as the functional currency. Foreign currency assets and liabilities are remeasured into U.S. dollars at the end-of-period exchange rates except for non-monetary assets and liabilities, which are measured at historical exchange rates. Revenue and expenses are remeasured using an average exchange rate for the respective period, except for expenses related to non-monetary assets and liabilities, which are measured at historical exchange rates. Gains or losses from foreign currency remeasurement and transactions are included in “Other income (expense), net”. For the years ended January 1, 2017, December 27, 2015 and December 28, 2014, foreign currency remeasurement and transactions gains and losses were immaterial.
Cash and Cash Equivalents
Cash equivalents include liquid short-term investments with original or remaining maturities of three months or less at the date of purchase, readily convertible to known amounts of cash.
Fair Value of Financial Instruments
The carrying amounts of the Company’s financial instruments, which include cash equivalents, accounts receivable, accounts payable and accrued liabilities and other current liabilities, approximate their fair values due to their short maturities. The estimated fair value of the Company’s debt approximates the carrying value because the interest rate on the borrowings approximates market rates and was determined to be a Level 2 instrument. The Company also has issued certain convertible preferred stock warrants which are accounted for as liabilities at fair value. See Note 5 for further details.
Accounts Receivable and Allowances for Doubtful Accounts
Accounts receivable are stated at invoice value less estimated allowances for returns and doubtful accounts. The Company continually monitors customer payments and maintains an allowance for estimated losses resulting from its customers’ inability to make required payments. The Company considers factors such as historical experience, credit quality, age of the accounts receivable balances, geographic related risks and economic conditions that may affect a customer’s ability to pay. In cases where there are circumstances that may impair a specific customer’s ability to meet its financial obligations, a specific allowance is recorded against amounts due, which reduces the net recognized receivable to the amount reasonably believed to be collectible. For all periods presented, the Company concluded that no allowance for doubtful accounts was necessary.
Concentration of Credit Risk
Financial instruments that potentially subject the Company to significant concentrations of credit risk consist principally of cash and cash equivalents and accounts receivable. The Company places its cash and cash equivalents primarily in banks and highly rated institutional money market funds.
- 64 -
The Company generally requires no collateral from its customers. For the years ended January 1, 2017, December 27, 2015 and December 28, 2014, three, four and three customers accounted for 10% or more of revenue, respectively. The following table discloses these customers’ percentage of revenue for the respective periods:
Years Ended | |||||
January 1, 2017 | December 27, 2015 | December 28, 2014 | |||
Customer | |||||
A | 19% | 14% | * | ||
B | 11% | 15% | 11% | ||
C | 11% | * | * | ||
D | * | 11% | * | ||
E | * | 10% | 28% | ||
F | * | * | 21% | ||
* | Total customer percentage of revenue was less than 10%. |
At January 1, 2017 and December 27, 2015, three customers accounted for 10% or more of accounts receivable. The following customers represented 10% or more of accounts receivable:
January 1, 2017 | December 27, 2015 | ||
Customer | |||
A | 30% | 17% | |
B | 12% | 16% | |
C | 12% | * | |
G | * | 13% | |
* | Total customer accounts receivable was less than 10%. |
Restricted Cash
The Company maintained $59,000 of restricted cash in certificate of deposit accounts at January 1, 2017, supporting letters of credit required for the Company’s operating lease facility and deposits required by the Company’s foundry partner in connection with its purchase of silicon wafers. Restricted cash is included in Prepaid expenses and other current assets on the consolidated balance sheet. There was zero restricted cash as of December 27, 2015.
Inventory
Inventory is stated at the lower of cost to purchase or manufacture the inventory or the market value of such inventory. Cost is determined using the standard cost method which approximates the first-in first-out basis. Market value is determined as the lower of replacement cost or net realizable value. The Company, at least quarterly, assesses the recoverability of all inventories to determine whether adjustments are required to record inventory at the lower of cost or market. Potentially excess and obsolete inventory is written off based on management’s analysis of inventory levels and estimates of future 12-month demand and market conditions. The Company is also entitled to receive rebates from its foundry partner on the purchase of silicon wafers upon achieving certain volume targets. Rebates from the Company’s foundry partner are recorded as a reduction of inventory cost when it is probable and reasonably estimable, and are recognized in cost of revenue as the chipsets made from such silicon wafers are sold to customers.
- 65 -
Prepaid Expenses and Other Current Assets
The Company purchases rights to software and intellectual property used in the development of its Wi-Fi solutions. Certain of the arrangements require payment over the life of the right to use the related software and intellectual property. The Company records the up-front fees and periodic payments in prepaid expenses and other current assets and amortizes the amount over the life of the arrangement using the straight-line method.
Debt Issuance Costs and Debt Discounts
Costs incurred in connection with the issuance of new debt are capitalized and amounts paid in connection with the modification of existing debt are expensed as incurred. Capitalizable debt issuance costs paid to third parties and debt discounts paid to creditors, net of amortization, are recorded as a reduction to the long-term debt balance on the consolidated balance sheet.
Amortization expense on capitalized debt issuance costs and debt discounts related to loans with fixed payment terms is calculated using the effective interest method over the term of the associated loans. Amortization expense on capitalized debt issuance costs and debt discounts related to revolving loans are calculated using the straight-line method over the term of the revolving loan commitment, and is recorded as Interest expense in the consolidated statements of operations. When debt is extinguished prior to the maturity date, any remaining associated debt issuance costs or debt discounts are expensed to Interest expense in the consolidated statements of operations.
Property and Equipment
Property and equipment are stated at cost and depreciated using the straight‑line method over the estimated useful lives of the assets as follows:
Computer and lab equipment | 3 to 5 years |
Computer software | 3 years |
Furniture and fixtures | 3 to 5 years |
Leasehold improvements | Shorter of remaining lease term or estimated useful lives of the assets |
Costs of maintenance and repairs that do not improve or extend the lives of the respective assets are expensed as incurred. Upon retirement or sale, the cost and related accumulated depreciation are removed from the balance sheet and the resulting gain or loss is reflected in operating expenses.
Impairment of Long-Lived Assets
The Company evaluates its long-lived assets for impairment whenever events or changes in circumstances indicate that the carrying amount of an asset may not be recoverable. When the sum of the undiscounted future net cash flows expected to result from the use of the asset or asset group and its eventual disposition is less than its carrying amount, an impairment loss would be measured based on the discounted cash flows compared to the carrying amount attributable to the asset group. No impairment loss has been recognized for the periods presented.
Warranty
The Company provides 12-month warranty coverage on all of its Wi-Fi solutions. The warranty provides for replacement of the associated Wi-Fi solutions during the warranty period. The Company establishes a liability for estimated warranty costs at the time revenue is recognized. The warranty obligation is affected by historical failure rates and associated replacement costs. The warranty liability is included in accrued liabilities and other current liabilities on the consolidated balance sheet. The warranty liability and activity for the periods presented are immaterial.
Income Taxes
The Company recognizes deferred tax assets and liabilities for the expected future tax consequences of events that have been included in the financial statements or tax returns. The Company recognizes future tax benefits, measured by enacted tax
- 66 -
rates attributable to deductible temporary differences between financial statements and income tax bases of assets and liabilities, and net operating loss carry-forwards to the extent that realization of such benefits is more likely than not.
The Company records a liability for the difference between the benefit recognized and measured pursuant to the accounting guidance on accounting for uncertain tax positions and the tax position taken or expected to be taken on the Company’s tax return. To the extent that the assessment of such tax positions changes, the change in estimate is recorded in the period in which the determination is made. The Company establishes these liabilities based on estimates of whether, and the extent to which, additional taxes will be due. These liabilities are established when the Company believes that certain positions might be challenged despite the Company’s belief that the tax return positions are fully supportable. The liabilities are adjusted in light of changing facts and circumstances, such as the outcome of tax audits.
Revenue Recognition
The Company derives majority of its revenue from the sale of its Wi-Fi solutions. Revenue is recognized net of accruals for sales returns and rebates, which is estimated based on past experience or contractual rights. The Company recognizes revenue when persuasive evidence of an arrangement exists, delivery has occurred, the price is deemed fixed or determinable and collection is reasonably assured. These criteria are met upon shipment to customers. For sales made through distributors, revenue is recognized when title passes to the distributor upon shipment, and payment by the Company’s distributors is not contingent on resale of the Wi-Fi solutions. The Company’s sales arrangements with distributors do not allow for rights of return or price protection on unsold Wi-Fi solutions. The Company’s policy is to classify shipping and handling costs, net of costs charged to customers, as cost of revenue.
The Company also derives revenue from contracts with multiple deliverables, including a mix of intellectual property licenses, research and development services, and other non-recurring arrangements. Revenue recognition for contracts with multiple deliverables is based on the individual units of accounting determined to exist in the contract. A delivered item is considered a separate unit of accounting when (i) the delivered item has value to the customer on a stand-alone basis; and (ii) if a general right of return exists, the delivery or performance of an undelivered item is considered probable and under the Company’s control. Items are considered to have a stand-alone value when they are sold separately by any vendor or when the customer could resell the item on a stand-alone basis. In addition, intellectual property deliverables are considered to have value on a stand-alone basis if the customer could use them without the remaining elements of the arrangement. When a deliverable does not meet the criteria to be considered a separate unit of accounting, it is grouped together with other deliverables that, when combined, meet the criteria, and the appropriate allocation of arrangement consideration and revenue recognition is determined.
In April 2013, the Company entered into an agreement consisting of intellectual property licenses and research and development services. The Company concluded that the agreement consisted of two deliverables, intellectual property license and research and development services. The Company determined that two deliverables did not meet the criteria to be accounted as separate units of accounting because the intellectual property licenses did not have a value on a standalone basis from the research and development services. As a result, the intellectual property licenses and research and development services was considered one combined unit of accounting. Revenue was recognized on a straight-line basis over the 33-month period the services were expected to be performed, provided all other revenue recognition criteria were met. If the estimated period over which the services were originally expected to be performed changed, the amount of revenue remaining to be recognized would be recognized over the revised remaining performance period. The agreement’s term was ten (10) years. The agreement may be terminated by either party if (a) the other party materially breaches a material provision of the agreement unless such breach is cured during the thirty (30) day grace period, (b) the other party materially breaches any provision of the agreement that cannot be cured, or (c) the other party makes any assignment for the benefit of creditors, files a petition in bankruptcy, is adjudged bankrupt, becomes insolvent, or is placed in the hands of a receiver. Certain payments received under the agreement were refundable if the agreement is terminated for the Company’s material breach of the agreement terms. The fees under this agreement totaled $16.5 million, of which $0.5 million, $5.7 million, $6.2 million, was recognized as revenue for the year ended January 1, 2017, December 27, 2015, December 28, 2014, respectively. The agreement was terminated in 2016.
Deferred Revenue
Deferred revenue is comprised of billings or payments received in advance of meeting revenue recognition criteria.
- 67 -
Research and Development Expenses
All costs related to the research and development of the Company’s Wi-Fi solutions are expensed as incurred. Research and development (“R&D”) expense consists primarily of personnel costs for the Company’s R&D activities. R&D expense also includes costs associated with the design and development of the Company’s Wi-Fi solutions, such as mask sets, prototype wafers, prototype engineering boards, software and computer-aided design software licenses, intellectual property licenses, reference design development, development testing and evaluation, depreciation expense, and allocated administrative costs.
Operating Leases
The Company recognizes rent expense on a straight-line basis over the non-cancellable term of the operating lease. The difference between rent expense and rent paid is recorded as deferred rent in accrued liabilities and other current liabilities on the consolidated balance sheets.
Advertising and Promotion Costs
Expenses related to advertising and promotion of products are charged to sales and marketing expense as incurred. The Company incurred immaterial advertising or promotion expenses in the years ended January 1, 2017, December 27, 2015 and December 28, 2014, respectively.
Stock-Based Compensation
The Company measures and recognizes compensation expense for all stock-based awards made to employees, directors and non-employees, based on estimated fair values recognized using the straight-line method over the requisite service period.
The fair value of options and warrants to purchase common stock granted to employees is estimated on the grant date using the Black-Scholes option valuation model. The calculation of stock-based compensation expense requires that the Company make assumptions and judgments about the variables used in the Black-Scholes model, including the expected term, expected volatility of the underlying common stock, risk-free interest rate, as well as estimating future forfeitures of unvested stock options. To the extent actual forfeiture results differ from the estimates, the difference will be recorded as a cumulative adjustment in the period the estimates are revised.
The Company accounts for common stock warrants and options issued to non-employees under ASC 505-50 Equity-Equity based payments to Non-Employees, using the Black-Scholes option valuation model. The fair value of such non-employee awards is remeasured at each quarter-end over the vesting period.
Common Stock Warrants
The Company accounts for common stock warrants as equity in accordance with the accounting guidance for derivatives. The accounting guidance provides a scope exception from classifying and measuring as a financial liability a contract that would otherwise meet the definition of a derivative if the contract is both (i) indexed to the entity’s own stock and (ii) meets the requirement for classification in the stockholders’ equity (deficit) section of the balance sheet.
The Company determined that the common stock warrants issued in connection with the debt arrangement are required to be classified in equity. Warrants classified as equity are recorded as additional paid in capital on the consolidated balance sheet in stockholders’ equity (deficit) and no further adjustments to their valuation are made.
The Company accounts for common stock warrants issued to non-employees for services under ASC 505-50. The fair value of such non-employee warrants is remeasured at each quarter-end over the vesting period. The Company determines the fair value of the common stock warrants using the Black-Scholes option valuation model using the stock price and other measurement assumptions as of the earlier of the date at which either (1) a commitment for performance by the counterparty has been reached; or (2) the counterparty’s performance is complete.
Convertible Preferred Stock
The Company recorded the convertible preferred stock at fair value on the dates of issuance, net of issuance costs. The convertible preferred stock is recorded outside of “Stockholders’ equity (deficit)” because, in the event of certain deemed liquidation events considered not solely within the Company’s control, such as a merger, acquisition and sale of all or substantially
- 68 -
all of the Company’s assets, the convertible preferred stock will become redeemable at the option of the holders. The Company has not adjusted the carrying values of the convertible preferred stock to the liquidation preferences of such shares because it is uncertain whether or when an event would occur that would obligate the Company to pay the liquidation preferences to holders of shares of convertible preferred stock. Subsequent adjustments to the carrying values to the liquidation preferences will be made only when it becomes probable that such a liquidation event will occur. In November 2016, pursuant to the consummation of the IPO, all outstanding shares of convertible preferred stocks were converted into common stock.
Convertible Preferred Stock Warrants Liability
Warrants to purchase shares of convertible preferred stock are classified as liabilities on the consolidated balance sheets at fair value upon issuance because the underlying shares of convertible preferred stock are redeemable at the option of the holders upon the occurrence of certain deemed liquidation events considered not solely within the Company’s control, which may therefore obligate the Company to transfer assets at some point in the future. The convertible preferred stock warrants are subject to remeasurement to fair value at each balance sheet date and any change in fair value is recognized as a component of “Other income (expense), net” in the consolidated statements of operations. The Company will continue to adjust the liability for changes in fair value until the earlier of the exercise or expiration of the warrants, the completion of a deemed liquidation event, conversion of convertible preferred stock into common stock, or until the convertible preferred stock can no longer trigger a deemed liquidation event. At that time, the convertible preferred stock warrant liability will be reclassified to convertible preferred stock or additional paid-in-capital, as applicable. In November 2016, pursuant to the consummation of the IPO, all outstanding convertible preferred stock warrants were converted into common stock warrants and the warrant liability was reclassified to additional paid-in capital.
Net Loss per Share Attributable to Common Stockholders
Basic net loss per share attributable to common stockholders is calculated by dividing the net loss attributable to common stockholders by the weighted-average number of shares of common stock outstanding during the period, without consideration for potentially dilutive securities. Diluted net loss per share is computed by dividing the net loss attributable to common stockholders by the weighted-average number of shares of common stock and potentially dilutive securities outstanding for the period. For purposes of the diluted net loss per share calculation, stock options, warrants and convertible preferred stock are considered to be potentially dilutive securities. Basic and diluted net loss attributable to common stockholders per share is presented in conformity with the two-class method required for participating securities as the convertible preferred stock is considered a participating security. In addition, the Company considers shares issued upon the early exercise of non-vested warrants to purchase common stock to be participating securities, as the holders of these shares have a non-forfeitable right to dividends. In accordance with the two-class method, earnings allocated to these participating securities and the related number of outstanding shares of the participating securities, which include contractual participation rights in undistributed earnings, have been excluded from the computation of basic and diluted net loss per share attributable to common stockholders. The Company’s participating securities do not have a contractual obligation to share in the Company’s losses. As such, the net loss was attributed entirely to common stockholders. Because the Company has reported a net loss in all periods presented, diluted net loss per share attributable to common stockholders is the same as basic net loss per share attributable to common stockholders for all periods presented.
Comprehensive Income (Loss)
Comprehensive income (loss) is defined as the change in equity of the Company during a period from transactions and other events and circumstances excluding transactions resulting from investments and distributions to owners. The Company has not included a separate statement of comprehensive income (loss) as there were no transactions to report in the periods presented.
Deferred Offering Costs
Deferred offering costs, consisted of legal, accounting and other fees and costs related to the Company’s IPO were capitalized within “Other assets” on the consolidated balance sheet until the consummation of the IPO. These offering costs were reclassified to common stock upon the closing of the initial public offering in November 2016. There were no deferred offering costs capitalized as of January 1, 2017 and December 27, 2015.
- 69 -
Reverse Stock Split
In September 2016 and October 2016, respectively, the Company’s board of directors and stockholders approved a one-for-50 reverse split of the Company’s common stock and convertible preferred stock (the “Reverse Stock Split”), which was effected on October 13, 2016. The board of directors and stockholders also approved a proportionate adjustment in the authorized number of shares of common stock and each series of convertible preferred stock and proportionate adjustments to the conversion prices, dividend rates, original issue prices and liquidation preferences of each series of preferred stock. The number of options and warrants to purchase common stock and convertible preferred stock were also proportionately adjusted to reflect the Reverse Stock Split. The par value of the common and convertible preferred stock was not adjusted as a result of the Reverse Stock Split. All share and per share information included in the accompanying financial statements and notes thereto have been adjusted to reflect the Reverse Stock Split.
2. Recent Accounting Pronouncements
In November 2016, the FASB issued ASU 2016-18, Statement of Cash Flows - Restricted Cash, which requires entities to show the changes in the total of cash, cash equivalents, restricted cash and restricted cash equivalents in the statement of cash flow. This standard is effective for fiscal years beginning after December 15, 2017, including interim periods within those fiscal years. Early adoption is permitted, including adoption in an interim period, but any adjustments must be reflected as of the beginning of the fiscal year that includes that interim period. The new standard must be adopted retrospectively. The Company is currently evaluating the effects, if any, that the adoption of this guidance will have on its consolidated statements of cash flows.
In October 2016, the FASB issued ASU 2016-17, Consolidation - Interests Held through Related Parties That Are under Common Control, to amend the consolidation guidance on how a reporting entity that is the single decision maker of a variable interest entity should treat indirect interests in the entity held through related parties that are under common control within the reporting entity when determining whether it is the primary beneficiary of that variable interest entity. The standard is effective for fiscal years beginning after December 15, 2016, including interim periods within those fiscal years. Early adoption is permitted. The adoption of this standard is not expected to have a material impact on the Company’s consolidated financial position and results of operations.
In October 2016, the FASB issued ASU 2016-16, Income Taxes - Intra-Entity Transfers of Assets Other Than Inventory, which requires entities to recognize the income tax consequences of an intra-entity transfer of an asset other than inventory when the transfer occurs. The standard is effective for fiscal years beginning after December 15, 2017, including interim periods within those fiscal years. Early adoption is permitted as of the beginning of a fiscal year. The new standard must be adopted using a modified retrospective transition method which is a cumulative-effective adjustment to retained earnings as of the beginning of the first effective reporting period. The adoption of this standard is not expected to have a material impact on the Company’s consolidated financial position and results of operations.
In August 2016, the FASB issued ASU 2016-15, Statement of Cash Flows - Classification of Certain Cash Receipts and Cash Payments, ASU 2016-15 addresses eight specific cash flow issues with the objective of reducing the existing diversity in practice in how certain cash receipts and cash payments are presented and classified in the statement of cash flows. The standard is effective for fiscal years beginning after December 15, 2017, including interim periods within those fiscal years. Early adoption is permitted, including adoption in an interim period. The adoption of this standard is not expected to have a material impact on the Company’s consolidated statements of cash flow.
In March 2016, the FASB issued ASU 2016-09, Improvements to Employee Share-Based Payment Accounting as part of its simplification initiative, which involves several aspects of accounting for share-based payment transactions, including the income tax effects, statutory withholding requirements, forfeitures, and classification on the statement of cash flows. The standard is effective for companies for fiscal years beginning after December 15, 2016, and interim periods within those fiscal years with early adoption permitted. If an entity early adopts the amendments in an interim period, any adjustments should be reflected as of the beginning of the fiscal year that includes that interim period. The Company is currently evaluating the effects, if any, that the adoption of this guidance will have on its consolidated financial statements.
In February 2016, the FASB issued ASU 2016-02, Leases (ASC 842), which sets out the principles for the recognition, measurement, presentation and disclosure of leases for both parties to a contract (i.e., lessees and lessors). The new standard
- 70 -
requires lessees to apply a dual approach, classifying leases as either finance or operating leases based on the principle of whether or not the lease is effectively a financed purchase by the lessee. This classification will determine whether lease expense is recognized based on an effective interest method or on a straight line basis over the term of the lease, respectively. A lessee is also required to record a right-of-use asset and a lease liability for all leases with a term of greater than twelve months regardless of their classification. Leases with a term of twelve months or less will be accounted for similar to existing guidance for operating leases today. ASC 842 supersedes the previous leases standard, ASC 840 Leases. The standard is effective on January 1, 2019, with early adoption permitted. The Company is currently evaluating the effects, if any, that the adoption of this guidance will have on its consolidated financial statements.
In January 2016, the FASB issued ASU 2016-01, Recognition and Measurement of Financial Assets and Financial Liabilities, which addresses certain aspects of recognition, measurement, presentation and disclosure of financial instruments. ASU 2016-01 is effective for annual periods, and interim periods within those annual periods, beginning after December 15, 2017. The Company is currently evaluating the effects, if any, that the adoption of this guidance will have on its consolidated financial statements.
In November 2015, the FASB issued ASU 2015-17, Balance Sheet Classification of Deferred Taxes to simplify the presentation of deferred income taxes. The amendments in this update require that deferred tax liabilities and assets be classified as non-current in a classified statement of financial position. The standard is effective on January 1, 2017, with early adoption permitted. The Company adopted ASU 2015-17 as of January 1, 2017 and the adoption of this guidance did not have a material effect on its consolidated financial statements.
In July 2015, the FASB issued ASU No. 2015-11, Inventory (Topic 330): Simplifying the Measurement of Inventory, which permits companies to measure inventory at the lower of cost and realizable value. ASU 2015-11 applies to all business entities and is effective for annual periods, and interim periods within those annual periods, beginning after December 15, 2016. Early adoption is permitted. The Company is currently evaluating the effects, if any, that the adoption of this guidance will have on its consolidated financial statements.
In April 2015, the FASB issued ASU No. 2015-05, “Customer’s Accounting for Fees Paid in a Cloud Computing Arrangement,” which provides guidance for a customer’s accounting for cloud computing costs. Under ASU 2015-05, if a software cloud computing arrangement contains a software license, customers should account for the license element of the arrangement in a manner consistent with the acquisition of other software licenses. If the arrangement does not contain a software license, customers should account for the arrangement as a service contract. This standard may be applied either prospectively to all arrangements entered into or materially modified after the effective date, or retrospectively. ASU 2015-05 is effective for fiscal years, and interim periods within those fiscal years, beginning after December 15, 2015, and early adoption is permitted. The adoption of ASU 2015-05 did not have a material effect on the Company’s consolidated financial statements.
In April 2015, the FASB issued ASU No. 2015-03, Interest–Imputation of Interest (Subtopic 835-30): Simplifying the Presentation of Debt Issuance Costs. Under ASU No. 2015-03, debt issuance costs related to a recognized debt liability are presented as a direct deduction from the carrying amount of that debt liability, consistent with debt discounts. The adoption of ASU No. 2015-03 has been applied retrospectively to the Company’s Consolidated Balance Sheet and resulted in an immaterial impact on the outstanding carrying value of the debt as of December 27, 2015.
In June 2014, the FASB issued ASU 2014-12, Accounting for Share-Based Payments When the Terms of an Award Provide That a Performance Target Could Be Achieved after the Requisite Service Period. ASU 2014-12 requires that a performance target that affects vesting and could be achieved after the requisite service period be treated as a performance condition. ASU 2014-12 is effective for the Company in its first quarter of 2016 with early adoption permitted. The adoption of ASU 2014-12 did not have a material effect on the Company’s consolidated financial statements.
In May 2014, the FASB issued ASU No. 2014-09, Revenue from Contracts with Customers (Topic 606), which supersedes the revenue recognition requirements in ASC 605, Revenue Recognition. This ASU is based on the principle that revenue is recognized to depict the transfer of goods or services to customers in an amount that reflects the consideration to which the entity expects to be entitled in exchange for those goods or services. The ASU also requires additional disclosure about the nature, amount, timing and uncertainty of revenue and cash flows arising from customer contracts, including significant judgments and changes in judgments and assets recognized from costs incurred to obtain or fulfill a contract. In August 2015, FASB issued ASU No. 2015-14, Revenue from Contracts with Customers (Topic 606): Deferral of the Effective Date, which effectively delayed the adoption date by one year, to an effective date for public entities for annual and interim periods beginning after December 15,
- 71 -
2017. In March, April and May 2016, the FASB issued additional updates to the new revenue standard relating to reporting revenue on a gross versus net basis, identifying performance obligations and licensing arrangements, and narrow-scope improvements and practical expedients, respectively. The effective date of this additional update is the same as that of ASU 2014-09. The guidance permits the use of either a retrospective or cumulative effect transition method. The Company has not yet selected a transition method. The Company is still finalizing the analysis to quantify the adoption impact of the provisions of the new standard, but it does not currently expect to have a material impact on the consolidated financial position or results of operations. Based on the evaluation of its current contracts and revenue streams, most of the revenue will be recorded consistently under both the current and new standard. The FASB has issued, and may issue in the future, interpretive guidance which may cause the Company’s evaluation to change. The Company believes it is following an appropriate timeline to allow for proper recognition, presentation and disclosure upon adoption effective the beginning of fiscal year 2018.
3. Earnings Per Share
The following table summarizes the computation of basic and diluted net loss per share attributable to common stockholders of the Company:
Years Ended | |||||||||||
(in thousands, except share and per share data) | January 1, 2017 | December 27, 2015 | December 28, 2014 | ||||||||
Net loss | $ | (1,895 | ) | $ | (7,045 | ) | $ | (13,598 | ) | ||
Weighted-average shares outstanding | 6,454,038 | 775,710 | 656,146 | ||||||||
Less: weighted average shares subject to repurchase due to early exercise | (69,329 | ) | (6,186 | ) | — | ||||||
Weighted average shares used to compute basic and diluted net loss per share | 6,384,709 | 769,524 | 656,146 | ||||||||
Net loss attributable to common stockholders per share, basic and diluted | $ | (0.30 | ) | $ | (9.16 | ) | $ | (20.72 | ) | ||
The following potentially dilutive securities outstanding at the end of the periods have been excluded from the computation of diluted shares outstanding as the effect would have been anti-dilutive:
Years Ended | ||||||||
January 1, 2017 | December 27, 2015 | December 28, 2014 | ||||||
Convertible preferred stock (as-converted) | — | 24,790,650 | 23,740,070 | |||||
Warrants to purchase convertible preferred stock | — | 271,248 | 271,248 | |||||
Warrants to purchase common stock | 477,404 | 283,006 | 288,700 | |||||
Shares available for ESPP | 223,662 | — | — | |||||
Restricted Stock Units (RSUs) | 6,950 | — | — | |||||
Options to purchase common stock | 6,473,624 | 5,062,342 | 5,046,448 | |||||
Total | 7,181,640 | 30,407,246 | 29,346,466 | |||||
4. Balance Sheets Components
Property and equipment, net consisted of the following:
- 72 -
(in thousands) | January 1, 2017 | December 27, 2015 | |||||
Computer and lab equipment | $ | 9,748 | $ | 7,100 | |||
Computer software | 625 | 363 | |||||
Furniture and fixtures | 136 | 136 | |||||
Leasehold improvements | 218 | 218 | |||||
10,727 | 7,817 | ||||||
Accumulated depreciation and amortization | (5,985 | ) | (4,734 | ) | |||
Property and equipment, net | $ | 4,742 | $ | 3,083 | |||
Depreciation expense related to property and equipment was $1.3 million, $1.0 million and $0.9 million, for the years ended January 1, 2017, December 27, 2015 and December 28, 2014, respectively.
Inventory
Inventory consisted of the following:
(in thousands) | January 1, 2017 | December 27, 2015 | |||||
Raw materials | $ | 9,067 | $ | 3,707 | |||
Work in progress | 1,128 | 1,238 | |||||
Finished goods | 5,625 | 2,462 | |||||
$ | 15,820 | $ | 7,407 | ||||
Accrued Liabilities and Other Current Liabilities
Accrued liabilities and other current liabilities consisted of the following:
(in thousands) | January 1, 2017 | December 27, 2015 | |||||
Accrued payroll and related benefits | $ | 2,842 | $ | 2,243 | |||
Accrued customer rebates | 3,026 | 2,501 | |||||
Accrual for inventory purchases | 1,353 | 182 | |||||
Accrued Expenses | 2,952 | 259 | |||||
Other | 1,628 | 432 | |||||
$ | 11,801 | $ | 5,617 | ||||
5. Fair Value Measurements
The Company determines fair value measurements used in its consolidated financial statements based upon the price that would be received to sell an asset or paid to transfer a liability in an orderly transaction between market participants at the measurement date. The fair value hierarchy distinguishes between (i) market participant assumptions developed based on market data obtained from independent sources (observable inputs) and (ii) an entity’s own assumptions about market participant assumptions developed based on the best information available in the circumstances (unobservable inputs). The fair value hierarchy consists of three broad levels, which gives the highest priority to unadjusted quoted prices in active markets for identical
- 73 -
assets or liabilities (Level 1) and the lowest priority to unobservable inputs (Level 3). The three levels of the fair value hierarchy are described below:
Level 1 | Valuations based on quoted prices in active markets for identical assets or liabilities that the entity has the ability to access. |
Level 2 | Valuations based on quoted prices for similar assets or liabilities, quoted prices in markets that are not active, or other inputs that are observable or can be corroborated by observable data for substantially the full term of the assets or liabilities. |
Level 3 | Valuations based on inputs that are supported by little or no market activity and that are significant to the fair value of the assets or liabilities. |
At January 1, 2017, December 27, 2015 and December 28, 2014, highly liquid money market funds of $100.9 million, $10.0 million and $14.0 million, respectively, were valued using Level 1 of the fair value hierarchy, quoted prices in active markets for identical assets and are included in cash equivalents.
There were no transfers between Level 1 and Level 2 categories during any of the periods presented.
The Company classifies financial instruments in Level 3 of the fair value hierarchy when there is reliance on at least one significant unobservable input to the valuation model. In addition to these unobservable inputs, the valuation models for Level 3 financial instruments typically also rely on a number of inputs that are readily observable, either directly or indirectly. The Company’s assessment of the significance of a particular input to the fair value measurement in its entirety requires management to make judgments and consider factors specific to the asset or liability. The gains and losses presented below include changes in the fair value related to both observable and unobservable inputs. At December 27, 2015, the Company’s only Level 3 financial instruments were convertible preferred stock warrants which ceased to be a financial instrument upon their conversion to common stock warrants.
The following tables set forth the fair value of the Company’s financial assets and liabilities measured at fair value on a recurring basis as of January 1, 2017 and December 27, 2015 based on the three-tier fair value hierarchy:
Fair Value as of January 1, 2017 | |||||||||||||||
(in thousands) | Level 1 | Level 2 | Level 3 | Total | |||||||||||
Assets | |||||||||||||||
Cash equivalents | $ | 100,876 | $ | — | $ | — | $ | 100,876 | |||||||
Fair Value as of December 27, 2015 | |||||||||||||||
(in thousands) | Level 1 | Level 2 | Level 3 | Total | |||||||||||
Assets | |||||||||||||||
Cash equivalents | $ | 10,014 | $ | — | $ | — | $ | 10,014 | |||||||
Liabilities | |||||||||||||||
Convertible preferred stock warrant liability | $ | — | $ | — | $ | 255 | $ | 255 | |||||||
- 74 -
(in thousands) | Convertible Preferred Stock Warrant Liability | ||
Fair value using Level 3 inputs | |||
Balance at January 1, 2014 | $ | 232 | |
Addition | — | ||
Change in fair value | (38 | ) | |
Balance at December 28, 2014 | 194 | ||
Addition | — | ||
Change in fair value | 61 | ||
Balance at December 27, 2015 | 255 | ||
Addition | — | ||
Change in fair value | 87 | ||
Converted to common stock warrants and reclassified to additional paid-in capital | $ | (342 | ) |
Balance at January 1, 2017 | $ | — | |
Series A Convertible Preferred Stock Warrants
In connection with a $6.0 million debt agreement entered into in 2007, the Company issued warrants to purchase an aggregate of 13,892 shares of Series A convertible preferred stock at an exercise price of $17.28 per share to two lenders during 2007. The Company recorded the fair value of the warrants of $118,000 on issuance as a debt discount, which was determined using the Black-Scholes option valuation model with the following assumptions: contractual life of seven years, volatility of 74%, risk-free interest rate of 4.5%, and no expected dividends. The Company accreted this discount to interest expense over the three-year contractual life of the debt. The warrants expired in March 2014.
Series F-1 Convertible Preferred Stock Warrants
During the Series F-1 financing in March 2012, the Company issued a convertible preferred stock warrant to purchase 232,500 shares of Series F-1 convertible preferred stock at an exercise price of $0.0001 per share. The warrants become exercisable upon the achievement of certain milestones. The milestones were not considered probable of being met and were not reached during the periods presented. As a result, no amount was recorded in the Company’s consolidated financial statements during the periods presented. On March 23, 2016, the convertible preferred stock warrants expired.
In addition, in October 2013, in connection with a $3.0 million finance agreement, the Company issued a convertible preferred stock warrant to purchase 38,748 shares of Series F-1 preferred stock at an exercise price of $7.74 per share. The Company recorded the fair value of the warrant of $0.2 million on issuance, which was determined using the assumptions: contractual life of 10 years, volatility rate of 49.3%, risk free interest rate of 2.57% and no expected dividends.
The convertible preferred stock warrant liabilities increased or decreased each period based on the fluctuations of the fair value of the underlying convertible preferred stock. Immediately prior to the consummation of the IPO, all outstanding convertible preferred stock warrants were converted into common stock warrants and the preferred stock warrant liability of $0.3 million was reclassified into Additional paid-in capital.
The Company recorded a loss of $87,000, a loss of $61,000 and gain of $38,000 within “Other income (expense), net” in the consolidated statements of operations for the years ended January 1, 2017, December 27, 2015 and December 28, 2014, respectively, for the change in fair value of the convertible preferred stock warrants.
The following assumptions were used to determine the fair value of the Series F-1 convertible preferred stock warrants issued in October 2013:
- 75 -
November 2, 2016 | December 27, 2015 | December 28, 2014 | |||
Remaining contractual life (in years) | 7.0 | 0.2 - 7.9 | 1.2 - 8.8 | ||
Volatility rate | 40%-44% | 42% - 44% | 34% - 48% | ||
Risk–free interest rate | 1.3% - 1.7% | 0.2% - 2.1% | 0.4% - 2.1% | ||
Expected dividends | — | — | — | ||
Common Stock Warrants
In October 2014, in connection with the Series G financing and the appointment of a member of the Company’s board of directors, the Company issued a common stock warrant to Centerview Capital Technology Management, L.P., or Centerview, to purchase 288,700 shares of common stock at an exercise price of $0.05 per share, of which 173,220 become exercisable upon the achievement of certain milestones, which were achieved during 2015. The remaining 115,480 shares were subject to vesting over a service period of four years ending in October 2018, of which 28,870 vested during 2015. In December 2015, the warrant was exercised with respect to all 288,700 shares of common stock, of which 86,610 shares remained subject to future vesting. In June 2016, the Company accelerated the vesting of the remaining unvested shares of common stock issued upon early exercise of the warrant, and the Company recorded stock-based compensation expense of $0.6 million associated with this modification.
In September 2015 and in February 2016, in connection with a separation agreement with a former executive, the Company issued warrants to purchase 283,006 and 20,250 shares of common stock, at an exercise price of $2.50 and $4.00 per share, respectively. Both warrants were fully exercisable on the grant date and expire in February 2019.
In February 2016, in connection with a consulting arrangement, the Company issued warrants to purchase 9,000 shares of common stock at an exercise price of $0.05 per share. The warrants are subject to a 12-month vesting term and expire in January 2018.
In May 2016, in connection with the Mezzanine Loan (see Note 7), the Company issued warrants to purchase up to 126,400 shares of common stock, of which 31,600 were immediately exercisable, and up to an additional 94,800 will become exercisable depending on the amounts borrowed under the Mezzanine Loan, at an exercise price of $4.00 per share. The fair value of vested warrants on the date of issuance was $96,000. The warrants expire in May 2026.
For expenses recognized by the Company in connection to the common stock warrants transactions discussed above, see section “stock-based compensation for non-employees” within Note 10.
The following assumptions were used to determine the fair value of the common stock warrants:
Years Ended | |||||
January 1, 2017 | December 27, 2015 | December 28, 2014 | |||
Remaining contractual life (in years) | 1.3 - 10.0 | 3.4 - 9.6 | 9.8 | ||
Volatility rate | 37% - 44% | 36% - 47% | 45% | ||
Risk–free interest rate | 0.6% - 1.8% | 0.2% - 2.5% | 2.2% | ||
Expected dividends | — | — | — | ||
As of January 1, 2017, warrants issued and outstanding were as follows:
- 76 -
Date of Issuance | Number of Warrants | Exercise Price | Expiration Date | |||||||
Common stock warrants | October 2013 | 38,748 | $ | 7.74 | October 2023 | |||||
Common stock warrants | September 2015 | 283,005 | $ | 2.50 | February 2019 | |||||
Common stock warrants | February 2016 | 20,251 | $ | 4.00 | February 2019 | |||||
Common stock warrants | February 2016 | 9,000 | $ | 0.05 | January 2018 | |||||
Common stock warrants | May 2016 | 126,400 | $ | 4.00 | May 2026 | |||||
As of December 27, 2015, warrants issued and outstanding were as follows:
Date of Issuance | Number of Warrants | Exercise Price | Expiration Date | ||||||||
Series F-1 convertible preferred stock warrants | March 2012 | 232,500 | $ | 0.0001 | March 2016 | ||||||
Series F-1 convertible preferred stock warrants | October 2013 | 38,748 | $ | 7.74 | October 2023 | ||||||
Common stock warrants | September 2015 | 283,006 | $ | 2.50 | February 2019 | ||||||
6. Commitments and Contingencies
Leases
The Company conducts its operations using leased office facilities in various locations.
The following is a schedule of future minimum lease payments under operating leases as of January 1, 2017:
(in thousands) | |||
2017 | $ | 811 | |
2018 | 421 | ||
2019 | 41 | ||
Total minimum lease payments | $ | 1,273 | |
The Company leases office space under arrangements expiring through 2019. Rent expense for the years ended January 1, 2017, December 27, 2015 and December 28, 2014 was $1.2 million, $1.0 million and $0.9 million, respectively.
- 77 -
In February 2017, the Company entered into a lease agreement for its new corporate headquarters in San Jose, California. For additional details on lease terms refer to Note 15.
Purchase Commitments
The Company has purchase obligations of $10.5 million that are based on outstanding purchase orders as of January 1, 2017, related to the fabrication of certain wafers for which production has started. These purchase orders are cancellable at any time, provided that the Company is required to pay all costs incurred through the cancellation date. Historically, the Company has rarely canceled these agreements once production has started. The Company did not otherwise have any outstanding non-cancellable purchase obligations as of January 1, 2017.
Indemnification
In connection with the sale of its semiconductor chip products, the Company executes standard software license agreements allowing customers to use its firmware. Under the indemnification clauses of these license agreements, the Company agrees to defend the licensee against third-party claims asserting infringement by the Company’s products of certain intellectual property rights, which may include patents, copyrights, trademarks or trade secrets, and to pay any judgments entered on such claims against the licensee, subject to certain restrictions and limitations. The Company has never incurred significant expense defending its licensees against third-party claims. Further, the Company has never incurred significant expense under its standard product or services performance warranties. As a result, the Company believes the estimated fair value of these agreements is minimal. Accordingly, the Company has no liabilities recorded for these agreements at January 1, 2017.
Commitments
In April 2012, an agreement was entered into with Joint Stock Company “RUSNANO” (formerly Open Joint Stock Company “RUSNANO”), which required the Company to form a wholly-owned subsidiary in the Russian Federation and to provide funding to the subsidiary in the three years following April 16, 2012. This wholly-owned subsidiary performs research and development activities for the Company. Funding shall mean cash transfers to the subsidiary for equity investments, reimbursements of subsidiary operating expenses and Company expenses related to the subsidiary. RUSNANO also requires participation in subsidiary financial decisions.
In July 2014, the Company entered into an amended and restated letter agreement with RUSNANO pursuant to which the Company agreed, among other matters, to operate and fund its Russian operations in an aggregate amount of $13.0 million over six annual periods beginning on December 31, 2014. The annual funding requirements in period one to period six are $2.2 million, $1.7 million, $2.0 million, $2.2 million, $2.4 million, and $2.5 million, respectively. In the event that the Company fails to meet its funding obligations for any period, it will be required to pay RUSNANO a penalty fee of 10% on 80% of the difference between the funding obligation and the actual funding for that period, subject to a cure period of one calendar quarter after the applicable period funding deadline.
As of January 1, 2017, no penalty had been incurred, as the Company had met the minimum funding requirements.
Legal Matters
From time to time, the Company is a party to litigation and subject to claims incident to the ordinary course of business, including intellectual property claims, labor and employment claims, breach of contract claims, and other matters. Significant judgment is required when we assess the likelihood of any adverse judgments or outcomes to a potential claim or legal proceeding, as well as potential ranges of probable losses, and when the outcomes of the claims or proceedings are probable and reasonably estimable. Because of uncertainties related to these matters, we base our estimates on the information available at the time. As additional information becomes available, we reassess the potential liability related to pending claims and litigation, and may revise our estimates. Any revisions in the estimates of potential liabilities could have a material impact on our results of operations and financial position.
In October 2016, Innovatio IP Ventures, LLC filed suit in the United States District Court for the Northern District of Illinois alleging infringement by the Company of nine expired U.S. patents. The complaint seeks unspecified damages. The lawsuit is in the early stages and the Company has not accrued for a loss or range of loss contingency relating to such matter because the Company believes that, although an unfavorable outcome may be possible, it is not considered at this time to be probable and reasonably estimable.
7. Long-term Debt
Finance Agreement
In October 2013, the Company entered into a finance agreement which provides for equipment funding of $3.0 million over 39 months at an annual percentage rate of 11.9%. The finance agreement is collateralized by all tangible and intangible property of the Company, excluding any intellectual property. This finance agreement was subordinated to the Loan and Security Agreement entered into in April 2013 as amended in October 2013 and in January 2015. In connection with the finance agreement, the Company issued a warrant to the lender to purchase up to 38,748 shares of Series F-1 convertible preferred stock at $7.74 per share (refer to Note 5). As of December 27, 2015 the outstanding balance under the finance agreement was $1.5 million. In May 2016, in connection with the amendment and restatement of the April 2013 Loan and Security Agreement described below, the Company paid the remaining outstanding balance of $1.0 million under such finance agreement. Immediately prior to the consummation of the IPO, all outstanding convertible preferred stock warrants were converted into common stock warrants.
- 78 -
Loan and Security Agreement
In April 2013, the Company entered into a Loan and Security Agreement with its primary financial institution (“Lender”). The agreement provides for a revolving line of credit and a term loan. The maximum amount available for borrowing under the revolving line of credit was 80% of eligible accounts receivable, not to exceed $3.5 million in the aggregate. Interest under the revolving line of credit was calculated at the greater of the prime rate plus 0.50% or 3.75%. The original maturity date of the revolving line of credit was April 26, 2015. The term loan amount was for $1.0 million, which was advanced in April 2013. The principal amount outstanding on the term loan accrued interest at a per annum rate equal to prime rate plus 0.75%, fixed at the time of funding. The term loan was payable in 36 equal monthly payments starting on May 1, 2013 with the last payment occurring on April 1, 2016.
In October 2013, the Company and Lender agreed to increase the maximum amount available for borrowing under the revolving line of credit to 80% of eligible accounts receivable plus 60% of eligible customer purchase orders, not to exceed $9.5 million in the aggregate. The Company may request cash advances for eligible purchase orders at any time provided that the Company’s net cash balance is equal to or greater than $8.0 million and the amount of purchase order advances outstanding does not exceed $2.0 million. The effective annual interest rate for borrowing against receivables is 4.69% and the effective annual percentage rate for borrowing against purchase order advances is 6.25%. The Company and the Lender also added a growth capital term loan for up to $5.0 million of which $3.0 million was advanced on October 31, 2013 and the remaining $2.0 million was to become available upon the Company achieving certain milestones related to revenue growth during 2013. The milestones under this agreement were achieved by the Company but the Company did not borrow the remaining $2.0 million. The principal amount outstanding for the growth capital advance accrues interest at a floating per annum rate equal to prime plus 2.25%. The growth capital loan is payable monthly over a 30-month period starting on October 1, 2014 with the last payment set to occur on March 1, 2017.
On January 30, 2015, the Company and the Lender agreed to (i) increase the maximum amount available under the revolving line of credit to 80% of eligible accounts receivable, not to exceed $12.5 million in the aggregate, (ii) extend the maturity date of the revolving line of credit to April 26, 2016, and (iii) add a supplemental growth capital term loan for up to $3.0 million of which $3.0 million was advanced on February 3, 2015. The effective annual interest rate for borrowing against receivables under the revolving line of credit is 4.25% if the Company’s net cash is equal to or greater than $4.0 million. If the Company’s net cash is less than $4.0 million, the effective annual percentage rate for borrowing against receivables is 6.75%. The principal amount outstanding for the supplemental growth capital loan accrues interest at a floating rate per annum equal to prime plus 1.00%. The supplemental growth capital loan is payable monthly over a 36-month period starting on August 1, 2015 with the last payment set to occur on July 1, 2018.
In May 2016, the Company and the Lender amended and restated the Loan and Security Agreement to (i) increase the maximum amount available under the revolving line of credit to $20.0 million, (ii) extend the maturity date of the revolving line of credit to May 17, 2018, and (iii) add a new senior term loan in the amount of $4.0 million, in addition to the growth capital term loans described above. The effective annual percentage rate on the revolving line of credit is between 4.25% to 5.00% depending on the Company’s consolidated leverage ratio. The new senior term loan has a one-year draw down period, and the principal amount outstanding under the new senior term loan accrues interest at a floating rate per annum equal to prime plus 0.75%. The new senior term loan is payable monthly over a 30-month term starting on June 1, 2017 with the last payment due on November 1, 2019. The Company had drawn down $3.0 million under the revolving line of credit and repaid $3.0 million in August 2016. The Company has an undrawn balance under the revolving line of credit of $20.0 million as of January 1, 2017.
In connection with the amendment and restatement of the Loan and Security Agreement, the Company concurrently entered into a subordinated secured Mezzanine Loan with the Lender for up to $10.0 million. The principal amount outstanding on the Mezzanine Loan accrues interest at a fixed rate per annum equal to 10.5%. The Mezzanine Loan has a one-year draw down period, with repayment due on May 1, 2019. In connection with the Mezzanine Loan, the Company issued warrants to purchase up to 126,400 shares of common stock, of which 31,600 were immediately exercisable, and up to an additional 94,800 may become exercisable depending on the amounts borrowed under the Mezzanine Loan, at an exercise price of $4.00 per share. The fair value of vested warrants on the date of issuance was $96,000. The Company paid $0.2 million in May 2016 to the lender as origination fees. The fair value of warrants and origination fees are accounted as debt discounts and are recorded as interest expense in the consolidated statement of operations over the term of the loan. The debt discounts related to the Mezzanine Loan is recorded in “Prepaid expense and other current assets” on the consolidated balance sheet, as the Company has not yet drawn down from the Mezzanine Loan as of January 1, 2017.
- 79 -
In accordance with the Loan and Security Agreement, as amended and restated, upon the occurrence of an IPO the Company is obligated to pay to its lender an aggregate of $0.2 million in fees. This fee is amortized over the term of the loan.
As of January 1, 2017, December 27, 2015, the aggregate outstanding balance under the Loan and Security Agreement, in each case as amended through such date, and the Mezzanine Loan was $6.0 million and $4.4 million, respectively.
The agreement contains usual and customary events of default upon the occurrence of certain events, such as nonpayment of amounts due under the revolving line of credit or the term loans, violation of the restrictive covenants, violation of other contractual provisions, or a material adverse change in its business. The agreement includes customary administrative covenants, including a prohibition on declaring dividends, but does not include any financial maintenance or operating related covenants.
The amended and restated Loan and Security Agreement, or the “SVB Loan Agreement”, and the Mezzanine Loan are collateralized by certain of our assets, including pledges of certain of our equity interests in our subsidiaries, receivables and inventory, subject to customary exceptions and limits. The SVB Loan Agreement and the Mezzanine Loan contain customary events of default upon the occurrence of certain events, such as nonpayment of amounts due under the revolving line of credit or the term loans, violation of restrictive covenants, violation of other contractual provisions, or a material adverse change in the Company’s business. In addition, the credit facilities prohibit the payment of cash dividends on the Company’s capital stock and also place restrictions on mergers, sales of assets, investments, incurrence of liens, incurrence of indebtedness and transactions with affiliates.
As of January 1, 2017, future minimum payments for the long-term debt are as follows (in thousands):
Long-term debt | ||
2017 | 2,570 | |
2018 | 2,383 | |
2019 | 1,618 | |
Total minimum payments | 6,571 | |
Less: Amount representing interest | (357 | ) |
Less: Amount representing closing and repayment fees | (330 | ) |
Present value of minimum payments | 5,884 | |
Less: Unamortized debt discounts | (167 | ) |
Plus: Accretion of closing and repayment fees | 220 | |
Long-term debt, net | 5,937 | |
Less: Long-term debt, current portion | 2,257 | |
Non-current portion of long-term debt | 3,680 | |
- 80 -
As of December 27, 2015, future minimum payments for the long-term debt are as follows (in thousands):
Long-term debt | |||
2016 | $ | 3,842 | |
2017 | 1,729 | ||
2018 | 682 | ||
Total minimum payments | 6,253 | ||
Less: Amount representing interest | (294 | ) | |
Less: Amount representing closing and repayment fees | (383 | ) | |
Present value of minimum payments | 5,576 | ||
Less: Unamortized debt discounts | (31 | ) | |
Plus: Accretion of closing and repayment fees | 301 | ||
Long-term debt, net | 5,846 | ||
Less: Long-term debt, current portion | 3,581 | ||
Non-current portion of long-term debt | $ | 2,265 | |
8. Convertible Preferred Stock
The Company’s Certificate of Incorporation, as amended, authorizes the Company to issue up to 100,000,000 shares of convertible preferred stock. Under the terms of the Certificate of Incorporation, the board of directors may determine the rights, preferences and terms of the Company’s authorized shares of convertible preferred stock.
From May 2015 through August 2015, the Company issued 1,050,580 shares of Series G convertible preferred stock to new investors at $13.57 per share with gross proceeds of $14.3 million.
Convertible preferred stock was as follows:
As of December 27, 2015 | |||||||||
Shares Authorized | Shares Issued and Outstanding | Aggregate Liquidation Preference | |||||||
(in thousands) | |||||||||
Series A | 783,862 | 783,853 | $ | 13,542 | |||||
Series B | 822,242 | 822,232 | 15,277 | ||||||
Series C | 875,199 | 875,192 | 19,254 | ||||||
Series D | 4,369,204 | 4,369,186 | 17,309 | ||||||
Series E | 5,348,816 | 5,348,808 | 29,772 | ||||||
Series F-1 | 7,893,419 | 7,622,159 | 59,013 | ||||||
Series G | 2,956,892 | 2,650,107 | 35,963 | ||||||
23,049,634 | 22,471,537 | $ | 190,130 | ||||||
In connection with the consummation of the IPO in November 2016, all outstanding shares of Series A, Series B, Series C, Series D, Series E, Series F-1 and Series G were converted into 24,790,650 shares of common stock. As such, no convertible preferred stock shares were outstanding as of January 1, 2017.
9. Stockholders’ Equity (Deficit)
Common Stock
- 81 -
The Company’s Certificate of Incorporation, as amended, authorizes the Company to issue 1,000,000,000 shares of $0.0001 par value common stock. Each share of common stock is entitled to one vote. The holders of common stock are also entitled to receive dividends whenever funds are legally available and when and if declared by the board of directors, subject to the prior rights of holders of all classes of preferred stock outstanding. The Company has never declared any dividends.
The Company had reserved shares of common stock for issuance, on an as-converted basis, as follows:
As of January 1, 2017 | ||
Options issued and outstanding | 6,473,624 | |
Common stock warrants | 477,404 | |
Shares available for ESPP | 2,000,000 | |
Shares available for future stock option grants | 4,370,066 | |
13,321,094 | ||
10. Stock-based Compensation
Under the Company’s 2006 Stock Plan, or the “2006 Plan”, the Company may grant options to purchase or directly issue shares of common stock to employees, directors, and consultants of the Company. In 2014 and 2016, the Company’s board of directors and stockholders approved an increase to the shares available under the 2006 Plan of 1,034,200 and 60,092 shares, respectively. Options may be granted at an exercise price per share of not less than 100% of the fair market value at the date of grant. If an incentive stock option is granted to a 10% stockholder, then the purchase or exercise price per share must not be less than 110% of the fair market value per share of common stock on the grant date. Options granted are exercisable over a maximum term of 10 years from the date of grant and generally vest over a period of four years.
In May 2016, the Company’s board of directors discontinued the 2006 Plan and approved the adoption of the 2016 Equity Incentive Plan, or the “2016 EIP”. All outstanding shares under the 2006 Plan were rolled over to the 2016 EIP. Initially the 2016 EIP permitted the Company to grant up to 416,000 shares of the Company’s common stock awards, including incentive stock options, non-statutory stock options, stock appreciation rights, restricted stock and restricted stock units to employees, directors, and consultants of the Company. In June 2016, the number of shares authorized for issuance under the 2016 EIP was increased to 1,653,000. In July 2016, the number of shares authorized for issuance under the 2016 EIP was increased to 1,953,000. All granted shares that are canceled, forfeited or expired are returned to the 2016 EIP and are available for grant in conjunction with the issuance of new equity awards. Stock options may be granted at an exercise price per share not less than 100% of the fair market value at the date of grant. If a stock option is granted to a 10% stockholder, then the exercise price per share must not be less than 110% of the fair market value per share of common stock on the grant date. Options granted are exercisable over a maximum term of 10 years from the date of grant and generally vest over a period of four years.
Concurrent with the completion of the IPO in November 2016, the Company’s 2016 Omnibus Equity Incentive Plan, or the “2016 Plan”, became effective. The 2016 EIP plan was terminated and all outstanding shares under the 2016 EIP plan were rolled over to the 2016 Plan. The 2016 Plan allows the Company to grant up to 4,100,000 shares of Company’s common stock with annual increase on the first day of each fiscal year beginning of January 1, 2018, equal to the lesser of (i) 3,400,000 shares, (ii) five percent of the outstanding shares of the Company’s common stock as of the last day of the immediately preceding fiscal year; or (iii) such other amounts as the board of directors may determine. The 2016 Plan provides for the grant of common stock awards, including incentive stock options, non-statutory stock options, stock appreciation rights, restricted stock and restricted stock units, performance units and performance shares to employees, directors, and consultants of the Company. All granted shares that are canceled, forfeited or expired are returned to the 2016 Plan and are available for grant in conjunction with the issuance of new equity awards. Stock options may be granted at an exercise price per share not less than 100% of the fair market value at the date of grant. If a stock option is granted to a 10% stockholder, then the exercise price per share must not be less than 110% of the fair market value per share of common stock on the grant date. Options granted are exercisable over a maximum term of 10 years from the date of grant and generally vest over a period of four years.
- 82 -
Total stock-based compensation expense for employees and non-employees recognized in the consolidated statements of operations was as follows:
Years Ended | |||||||||||
(in thousands) | January 1, 2017 | December 27, 2015 | December 28, 2014 | ||||||||
Cost of revenue | $ | 33 | $ | 9 | $ | 7 | |||||
Research and development | 911 | 302 | 256 | ||||||||
Sales and marketing | 248 | 445 | 101 | ||||||||
General and administrative | 1,898 | 446 | 203 | ||||||||
Total stock-based compensation expense | $ | 3,090 | $ | 1,202 | $ | 567 | |||||
In September 2016, the Company accelerated the vesting of the remaining unvested stock options issued to the former Chief Financial Officer upon his termination, and recorded stock-based compensation expense of $0.5 million associated with this modification.
At January 1, 2017 , unamortized compensation expense related to unvested stock awards was approximately $5.9 million. The weighted-average period over which such compensation expense will be recognized is 3.2 years.
At December 27, 2015, unamortized compensation expense related to unvested stock awards was approximately $1.9 million. The weighted-average period over which such compensation expense will be recognized is 2.9 years.
- 83 -
Stock Option Activity
The table below summarizes stock option activity under the 2006 Plan, 2016 EIP and 2016 Plan:
Number of Shares Available for Issuance | Number of Shares Outstanding | Weighted– Average Exercise Price | Weighted– Average Remaining Contractual Term (Years) | Aggregate Intrinsic Value (in thousands) | |||||||||||
Balances at January 1, 2014 | 359,205 | 3,967,172 | $ | 1.36 | 8.1 | ||||||||||
Authorized | 1,034,200 | ||||||||||||||
Granted (weighted–average fair value of $0.94 per share) | (1,574,681 | ) | 1,574,681 | 2.00 | |||||||||||
Exercised | (97,380 | ) | 1.32 | ||||||||||||
Expired, Forfeited or canceled | 398,025 | (398,025 | ) | 1.54 | |||||||||||
Balances at December 28, 2014 | 216,749 | 5,046,448 | 1.55 | 7.4 | $ | 2,391 | |||||||||
Granted (weighted–average fair value of $1.18 per share) | (875,715 | ) | 875,715 | 2.71 | |||||||||||
Exercised | (121,880 | ) | 1.38 | ||||||||||||
Expired, Forfeited or canceled | 737,941 | (737,941 | ) | 1.38 | |||||||||||
Balances at December 27, 2015 | 78,975 | 5,062,342 | 1.77 | 7.4 | $ | 11,269 | |||||||||
Authorized | 6,113,092 | ||||||||||||||
Restricted Stock Units Granted | (6,950 | ) | |||||||||||||
Granted (weighted–average fair value of $3.65 per share) | (2,064,982 | ) | 2,064,982 | 8.99 | |||||||||||
Exercised | (403,769 | ) | 2.95 | ||||||||||||
Expired, Forfeited or canceled | 249,931 | (249,931 | ) | 3.14 | |||||||||||
Balances at January 1, 2017 | 4,370,066 | 6,473,624 | 3.95 | 7.4 | $ | 91,840 | |||||||||
Options Exercisable— January 1, 2017 | 3,567,314 | 1.88 | 6 | $ | 57,974 | ||||||||||
Options vested and expected to vest—January 1, 2017 (1) | 5,959,099 | $ | 3.64 | 7.2 | $ | 86,398 | |||||||||
________________________
(1) | Options expected to vest reflect an estimated forfeiture rate of 15% based on historical experience. |
The aggregate intrinsic value of options exercised was $2.6 million , $0.8 million and $68,000 for the years ended January 1, 2017, December 27, 2015 and December 28, 2014, respectively. Upon the exercise of options, the Company issues new common stock from its authorized shares.
The aggregate fair value of options vested during the years ended January 1, 2017, December 27, 2015 and December 28, 2014 was $1.8 million, $1.2 million, and $0.5 million, respectively.
- 84 -
Additional information regarding options outstanding at January 1, 2017 and December 27, 2015 are as follows:
January 1, 2017 | |||||||||||||||||||||||
Options Outstanding | Options Vested | ||||||||||||||||||||||
Exercise Price | Number of Shares | Weighted- Average Remaining Contractual Life (Years) | Aggregate Intrinsic Value (in thousands) | Weighted- Average Exercise Price | Number of Shares | Aggregate Intrinsic Value (in thousands) | |||||||||||||||||
$ | 1.00 | 927,909 | 4.19 | 15,895 | $ | 1.00 | 927,909 | 15,895 | |||||||||||||||
$ | 1.50 | 1,610,095 | 5.93 | 26,776 | $ | 1.50 | 1,529,423 | 25,434 | |||||||||||||||
$ | 2.00 | 1,222,233 | 7.87 | 19,715 | $ | 2.00 | 646,221 | 10,424 | |||||||||||||||
$ | 2.50 | 212,650 | 7.19 | 3,324 | $ | 2.50 | 108,147 | 1,690 | |||||||||||||||
$ | 3.00 | 559,733 | 8.04 | 8,469 | $ | 3.00 | 192,458 | 2,912 | |||||||||||||||
$ | 4.00 | 67,975 | 9.09 | 960 | $ | 4.00 | 10,155 | 143 | |||||||||||||||
$ | 5.00 | 98,100 | 9.26 | 1,288 | $ | 5.00 | — | — | |||||||||||||||
$ | 7.00 | 53,700 | 9.40 | 598 | $ | 7.00 | 1,001 | 11 | |||||||||||||||
$ | 8.50 | 1,209,700 | 9.51 | 11,649 | $ | 8.50 | 152,000 | 1,464 | |||||||||||||||
$ | 9.00 | 325,980 | 9.57 | 2,976 | $ | 9.00 | — | — | |||||||||||||||
$ | 15.00 | 60,800 | 9.74 | 190 | $ | 15.00 | — | — | |||||||||||||||
$ | 18.95 | 124,749 | 9.94 | — | $ | 18.95 | — | — | |||||||||||||||
6,473,624 | 7.35 | $ | 91,840 | 3,567,314 | $ | 57,974 | |||||||||||||||||
December 27, 2015 | |||||||||||||||||||||||
Options Outstanding | Options Vested | ||||||||||||||||||||||
Exercise Price | Number of Shares | Weighted- Average Remaining Contractual Life (Years) | Aggregate Intrinsic Value (in thousands) | Weighted- Average Exercise Price | Number of Shares | Aggregate Intrinsic Value (in thousands) | |||||||||||||||||
$ | 1.00 | 995,309 | 4.98 | $ | 2,986 | $ | 1.00 | 995,309 | $ | 2,986 | |||||||||||||
$ | 1.50 | 1,712,087 | 6.91 | 4,280 | $ | 1.50 | 1,346,907 | 3,367 | |||||||||||||||
$ | 2.00 | 1,536,836 | 8.85 | 3,074 | $ | 2.00 | 419,438 | 839 | |||||||||||||||
$ | 2.50 | 223,650 | 8.28 | 335 | $ | 1.50 | 55,033 | 138 | |||||||||||||||
$ | 3.00 | 594,460 | 9.05 | 594 | $ | 3.00 | 69,430 | 69 | |||||||||||||||
5,062,342 | 7.43 | $ | 11,269 | 2,886,117 | $ | 7,399 | |||||||||||||||||
Stock Options Granted to Employees and Non-Employee Directors
Stock-based compensation expense is based on the grant date fair value. The Company recognizes compensation expense for all stock-based awards on a straight-line basis over the requisite service period of the awards, which is generally the option vesting term of four years.
The Company uses the Black-Scholes option valuation model, which requires the use of highly subjective assumptions to determine the fair value of stock-based awards. The assumptions used in the Company’s option-pricing model represent management’s best estimates. These estimates are complex, involve a number of variables, uncertainties and assumptions and the application of management’s judgment. If factors change and different assumptions are used, the Company’s stock-based compensation expense could be materially different in the future. The assumptions and estimates that the Company uses in the Black-Scholes model are as follows:
- 85 -
• | Fair Value of Common Stock. For all periods prior to the IPO, the Company must estimate its fair value. The fair value of common stock was determined on a periodic basis by the Company’s board of directors, with the assistance of an independent third-party valuation firm. The board of directors intended all options granted to be exercisable at a price per share not less than the estimated per share fair value of common stock underlying those options on the date of grant. Subsequent to the IPO, the Company determines the fair values of the shares of common stock underlying its share–based awards based upon the closing stock price on the date of grant. |
• | Risk-Free Interest Rate. The Company bases the risk-free interest rate used in the Black-Scholes valuation model on the implied yield available on U.S. Treasury zero-coupon issues with a term equivalent to that of the expected term of the options for each option group. |
• | Expected Term. The expected term represents the period that the Company’s stock-based awards are expected to be outstanding. Because of the limitations on the sale or transfer of the Company’s common stock as a privately held company, the Company does not believe its historical exercise pattern is indicative of the pattern it will experience as a publicly traded company. The Company has consequently used the Staff Accounting Bulletin 110, or SAB 110, simplified method to calculate the expected term, which is the average of the contractual term and vesting period. The Company plans to continue to use the SAB 110 simplified method until it has sufficient trading history as a publicly traded company. |
• | Volatility. The Company determines the price volatility based on the historical volatilities of industry peers as it has no sufficient trading history for its common stock price. Industry peers consist of several public companies in the semiconductor industry with comparable characteristics, including revenue growth, operating model and working capital requirements. The Company intends to continue to consistently apply this process using the same or a similar peer group of public companies until a sufficient amount of historical information regarding the volatility of its own common stock price becomes available, or unless circumstances change such that the identified peer companies are no longer similar, in which case other suitable peer companies whose common stock prices are publicly available would be utilized in the calculation. |
• | Dividend Yield. The expected dividend assumption is based on the Company’s current expectations about its anticipated dividend policy. To date, the Company has not declared any dividends, and therefore the Company has used an expected dividend yield of zero. |
In addition to the assumptions used in the Black-Scholes valuation model, the Company must also estimate a forfeiture rate to calculate the stock-based compensation for its equity awards. The Company will continue to use judgment in evaluating the assumptions related to the Company’s stock-based compensation on a prospective basis. As the Company continues to accumulate additional data, it may have refinements to its estimates, which could materially impact the Company’s future stock-based compensation expense. The following assumptions were used to calculate the fair value of options granted to employees and non-employee directors during the years indicated:
Years Ended | |||||
January 1, 2017 | December 27, 2015 | December 28, 2014 | |||
Expected term (in years) | 5.5 - 6.6 | 5.6 – 6.5 | 5.0 – 6.1 | ||
Volatility | 39% - 40% | 40% – 44% | 40% – 51% | ||
Risk-free interest rate | 1.1 % - 2.1% | 1.5% – 2.0% | 1.5% – 1.9% | ||
Expected dividend | — | — | — | ||
Options Subject to Repurchase
The Company has a right of repurchase with respect to unvested shares issued upon early exercise of options at an amount equal to the lower of (i) the exercise price of each restricted share being repurchased and (ii) the fair market value of such restricted share at the time the Company’s right of repurchase is exercised. The Company’s right to repurchase these shares lapses as to 1/36 of the total number of shares originally granted per month for 36 months. At January 1, 2017, 62,000, shares remained subject to the Company’s right of repurchase.
- 86 -
The shares purchased by employees pursuant to the early exercise of stock options are not deemed, for accounting purposes, to be issued until those shares vest according to their respective vesting schedules. The cash received in exchange for unvested shares of early exercised stock options is recorded as an early exercise liability on the balance sheets and will be transferred to common stock and additional paid-in capital as such shares vest.
Stock-Based Compensation for Non-employees
Stock-based compensation expense related to stock awards granted to non-employee is recognized as the awards vest. The Company believes that the fair value of the stock-based awards granted is more reliably measurable than the fair value of the services received. The fair value of stock awards granted is calculated using the Black-Scholes option valuation model. Stock-based compensation expense related to awards granted to non-employees for the years ended January 1, 2017, December 27, 2015 and December 28, 2014 was $0.8 million , $0.4 million, and $22,000, respectively.
In June 2016, the Company accelerated the vesting of the remaining unvested shares of common stock issued upon early exercise of a warrant by Centerview, and the Company recorded stock-based compensation expense of $0.6 million associated with this modification. For additional information on the Centerview common stock warrants, see the section titled “Common Stock Warrants” within Note 5.
During the year ended January 1, 2017, the Company issued 2,777 shares to consultants for payment of services, and the Company recorded $25,000 as stock-based compensation expense.
The fair values of options and common stock warrants granted to non-employees were calculated using the following assumptions for the periods presented:
Years Ended | |||||
January 1, 2017 | December 27, 2015 | December 28, 2014 | |||
Contractual term remaining (in years) | 1.6 - 8.3 | 3.4 - 10.0 | 5.0 - 10.0 | ||
Volatility | 37% - 53% | 36% - 48% | 44% - 76% | ||
Risk-free interest rate | 0.6% - 1.7% | 0.2% - 2.5% | 0.7% - 4.7% | ||
Expected dividend | — | — | — | ||
Employee Stock Purchase Plan
Concurrent with the completion of the IPO in November 2016, the Company’s 2016 Employee Stock Purchase Plan, or ESPP became effective. The ESPP allows eligible employees to purchase shares of the Company’s common stock at a discount through payroll deductions of up to 20% of their eligible compensation, subject to any plan limitations. The ESPP generally provides for one year offering periods with purchase periods every six months, and at the end of each purchase period, employees are able to purchase shares at 85% of the lower of the fair market value of the Company’s common stock on the first trading day of the purchase period or on the last trading day of the offering period. No shares were issued under the ESPP as of January1, 2017. Shares expected to be issued under the ESPP were 223,662 at January 1, 2017. Shares authorized for future purchase under the ESPP were 2,000,000 at January 1, 2017.
- 87 -
The fair values of ESPP was calculated using the following assumptions:
January 1, 2017 | |
Contractual term remaining (in years) | 0.5 - 1.0 |
Volatility | 36% - 41% |
Risk-free interest rate | 0.5% - 0.7% |
Expected dividend | — |
At January 1, 2017 , unamortized compensation expense related to ESPP was approximately $0.7 million. The weighted-average period over which such compensation expense will be recognized is six months.
Restricted Stock Unit (“RSU”) Awards
The Company grants restricted stock units to employees under the 2016 Plan. RSUs granted typically vest ratably over a four-year period, and are converted into shares of the Company’s common stock upon vesting on a one-for-one basis subject to the employee’s continued service to the Company over that period. The fair value of RSUs is determined using the fair value of the Company’s common stock on the date of the grant, reduced by the discounted present value of dividends expected to be declared before the awards vest. Compensation expense is recognized on a straight-line basis over the requisite service period of each grant adjusted for estimated forfeitures. Each RSU award granted from the 2016 Plan will reduce the number of shares available for issuance under the 2016 Plan by one share.
The table below summarizes RSU activity under the 2016 Plan:
Number of Shares Outstanding | Weighted– Average Remaining Contractual Term (Years) | Aggregate Intrinsic Value (in thousands) | |||||||
Balances at December 27, 2015 | — | ||||||||
Granted (weighted–average fair value of $18.95 per share) | 6,950 | ||||||||
Vested | — | ||||||||
Forfeited | — | ||||||||
Balances at January 1, 2017 | 6,950 | 3.9 | $ | 126 | |||||
Outstanding and expected to vest at January 1, 2017 | 4,938 | 3.9 | $ | 90 | |||||
At January 1, 2017 , unrecognized compensation expense related to unvested RSU awards was approximately $0.1 million. The weighted-average period over which such compensation expense will be recognized is 3.9 years. No RSU’s were vested for the year ended January 1, 2017. The Company did not grant any RSUs prior to fiscal year ended January 1, 2017.
- 88 -
11. Income Taxes
The components of loss before income taxes were as follows:
Years Ended | |||||||||||
(in thousands) | January 1, 2017 | December 27, 2015 | December 28, 2014 | ||||||||
United States | $ | 16,535 | $ | (7,584 | ) | $ | (14,353 | ) | |||
Foreign | (18,063 | ) | 654 | 863 | |||||||
$ | (1,528 | ) | $ | (6,930 | ) | $ | (13,490 | ) | |||
The components of the provision for income taxes were as follows:
Years Ended | |||||||||||
(in thousands) | January 1, 2017 | December 27, 2015 | December 28, 2014 | ||||||||
Federal | $ | 266 | $ | — | |||||||
State | $ | 1 | $ | 2 | $ | 2 | |||||
Foreign | 132 | 113 | 106 | ||||||||
Total current provision | $ | 399 | $ | 115 | $ | 108 | |||||
Foreign | (32 | ) | — | — | |||||||
Total deferred provision | $ | (32 | ) | $ | — | $ | — | ||||
Total provision | $ | 367 | $ | 115 | $ | 108 | |||||
The material components of the deferred tax assets and liabilities consisted of net operating loss carry-forwards and tax credit carry-forwards.
(in thousands) | January 1, 2017 | December 27, 2015 | |||||
Deferred tax assets: | |||||||
Accrual, reserve and other | $ | 2,112 | $ | 2,129 | |||
Depreciation and amortization | (555 | ) | (159 | ) | |||
Net operating loss and credits carry forwards | 59,628 | 64,837 | |||||
Stock-based compensation | 535 | 387 | |||||
Others | 519 | — | |||||
Total gross deferred tax assets | 62,239 | 67,194 | |||||
Valuation allowance | (62,207 | ) | (67,194 | ) | |||
Total net deferred tax assets | $ | 32 | $ | — | |||
The net valuation allowance decreased by $5.0 million and increased by $3.2 million for the years ended January 1, 2017 and December 27, 2015, respectively.
- 89 -
A reconciliation of the Company’s effective tax rate to the statutory U.S. federal rate is as follows:
Years Ended | ||||||||
January 1, 2017 | December 27, 2015 | December 28, 2014 | ||||||
US Federal Rate | 34.0 | % | 34.0 | % | 34.0 | % | ||
Difference between statutory rate and foreign effective tax rate | (437.8 | ) | 1.7 | 2.2 | ||||
Other permanent Items | (125.2 | ) | (0.8 | ) | (0.4 | ) | ||
Stock-based compensation | (29.2 | ) | (2.7 | ) | (1.1 | ) | ||
Research and development credit | 102.2 | 9.5 | 5.5 | |||||
Change in valuation allowance | 477.6 | (43.4 | ) | (41.1 | ) | |||
Foreign Income | (75.8 | ) | — | — | ||||
Foreign Tax Credit | 30.7 | — | — | |||||
(23.5 | )% | (1.7 | )% | (0.9 | )% | |||
The reported amount of income tax expense differs from an expected amount based on statutory rates primarily due to the Company’s valuation allowance and research and development credits offset by the difference between the statutory rate and the foreign effective tax rate.
As of January 1, 2017, based on the available objective evidence, management believes it is more likely than not that the net deferred tax assets will not be realized for federal and state purposes. Accordingly, management has applied a full valuation allowance against its federal and state net deferred tax assets at January 1, 2017. Due to improvements in the United States operating results over the past three years, management believes a reasonable possibility exists that, within the next year, sufficient positive evidence may become available to reach a conclusion that the valuation allowance against its federal and state net deferred tax assets will no longer be needed.
As of December 27, 2015, based on the available objective evidence, management believes it is more likely than not that the net deferred tax assets will not be realized. Accordingly, management has applied a full valuation allowance against its net deferred tax assets at December 27, 2015.
At January 1, 2017 and December 27, 2015, the Company has federal net operating loss carry-forwards of approximately $134.1 million and $151.9 million, respectively, and state net operating loss carry-forwards of approximately $104.7 million and $106.7 million, respectively. These federal and state net operating loss carry-forwards will expire beginning in 2026 and 2016, respectively. At January 1, 2017 and December 27, 2015, the Company also has federal research and development tax credit carry-forwards of approximately $7.2 million and $6.3 million, respectively, and state research and development tax credit carry-forwards of approximately $7.7 million and 6.3 million, respectively. The federal tax credits begin to expire in 2026, and the California tax credits carry forward indefinitely. Of the total federal net operating loss carry forwards, approximately $137,000 relates to deductions for stock-based compensation, the tax benefit of which will be credited to additional paid-in capital when realized.
Under Internal Revenue Code Section 382, our ability to utilize NOL carry-forwards or other tax attributes such as research tax credits, in any taxable year may be limited if we experience, or have experienced, an “ownership change.” A Section 382 “ownership change” generally occurs if one or more stockholders or groups of stockholders, who own at least 5% of our stock, increase their ownership by more than 50 percentage points over their lowest ownership percentage within a rolling three-year period. Similar rules may apply under state tax laws.
No deferred tax assets have been recognized on our balance sheet related to our NOLs and tax credits, as they are fully reserved by a valuation allowance. We may have previously experienced, and may in the future experience, one or more Section 382 “ownership changes,” including in connection with our initial public offering. If so, or if we do not generate sufficient taxable income, we may not be able to utilize a material portion of our NOLs and tax credits even if we achieve profitability. If we are limited in our ability to use our NOLs and tax credits in future years in which we have taxable income, we will pay more taxes than if we were able to fully utilize our NOLs and tax credits. This could adversely affect our results of operations.
- 90 -
As of January 1, 2017 and December 27, 2015, the Company had $5.2 million and $4.4 million of total unrecognized tax benefits, respectively. Of the total $5.2 million of unrecognized tax benefits as of January 1, 2017, none represents an amount that if recognized, would favorably affect the effective income tax rate in any future periods. The Company cannot conclude on the range of cash payments that will be made within the next twelve months associated with its uncertain tax positions. The Company’s policy is to record interest and penalties related to unrecognized tax benefits as income tax expense. During the years ended January 1, 2017 and December 27, 2015, the Company had immaterial amounts related to the accrual of interest and penalties.
A reconciliation of the beginning and ending unrecognized tax benefit amount is as follows :
(in thousands) | January 1, 2017 | December 27, 2015 | December 28, 2014 | ||||||||
Beginning Balance | $ | 4,425 | $ | 3,738 | $ | 2,936 | |||||
Increases related to current year’s unrecognized tax benefits | 888 | 687 | 802 | ||||||||
Decrease related to prior year’s unrecognized tax benefits | $ | (92 | ) | $ | — | $ | — | ||||
Ending Balance | $ | 5,221 | $ | 4,425 | $ | 3,738 | |||||
The Company does not have any tax positions for which it is reasonably possible the total amount of gross unrecognized tax benefits will increase or decrease within 12 months of the year ended January 1, 2017.
The Company and its subsidiaries are subject to taxation in various jurisdictions, including federal, state and foreign. As of January 1, 2017, the Company’s federal and state income tax returns remain subject to examination by taxing authorities for fiscal years from 2006 to 2016.
The Company intends to reinvest the earnings of its non U.S. subsidiaries in those operations. The Company does not provide for U.S. income taxes on the earnings of foreign subsidiaries because the Company intends to reinvest such earnings offshore indefinitely. As of January 1, 2017 and December 27, 2015, there is approximately $3.4 million earnings upon which U.S. income taxes have not been provided. The amount of unrecognized deferred tax liability related to these earnings is not material.
12. Employee Benefit Plans
Defined Contribution Plan
The Company adopted a 401(k) Plan that qualifies as a deferred compensation arrangement under Section 401 of the Internal Revenue Code. Under the 401(k) Plan, participating employees may defer a portion of their pretax earnings not to exceed the maximum amount allowable. The 401(k) plan permits the Company to make matching contributions and profit sharing contributions to eligible participants. The Company has made matching contributions of $0.1 million as of January 1, 2017.
13. Segment Information and Operations by Geographic Area
The chief operating decision maker for the Company is the Chief Executive Officer. The Chief Executive Officer reviews financial information presented on a consolidated basis for purposes of allocating resources and evaluating financial performance. The Company has one business activity consisting of design, development, and marketing of advanced high-speed wireless communication solutions enabling wireless local area networking, and there are no segment managers who are held accountable for operations, operating results or plans for levels or components below the consolidated level. Accordingly, the Company has determined that it has a single reportable and operating segment structure.
- 91 -
The following table sets forth revenue by country, based on ship-to destinations, for countries with 10% or more of revenue during any of the periods presented:
Years Ended | |||||||||||||||||
January 1, 2017 | December 27, 2015 | December 28, 2014 | |||||||||||||||
Amount | % of Revenue | Amount | % of Revenue | Amount | % of Revenue | ||||||||||||
(Dollars in thousands) | |||||||||||||||||
China | $ | 86,107 | 66 | % | $ | 45,102 | 54 | % | $ | 43,185 | 65 | % | |||||
Taiwan | 13,752 | 11 | 10,169 | 12 | 4,925 | 7 | % | ||||||||||
Tunisia | 13,755 | 11 | 5,414 | 6 | 4,039 | 6 | % | ||||||||||
United States | 291 | — | 3,326 | 4 | 321 | — | % | ||||||||||
Other foreign countries | 15,164 | 12 | 19,762 | 24 | 14,390 | 22 | % | ||||||||||
Total | $ | 129,069 | 100 | % | $ | 83,773 | 100 | % | $ | 66,860 | 100 | % | |||||
Long-lived assets outside the U.S. are immaterial; therefore, disclosures have been limited to revenue.
14. Related Party transactions
Purchases from Cadence Design Systems, Inc.
Lip-Bu Tan, a member of the Company’s board of directors since June 2015, is the President and Chief Executive Officer of Cadence Design Systems, Inc., or Cadence, an electronic design automation software and engineering services company. Since 2012, the Company has paid licensing fees for digital and analog layout tools and simulation tools from Cadence in the ordinary course of business. The Company incurred fees of approximately $1.7 million, $1.2 million and $1.1 million under the terms of this arrangement in fiscal years ended January 1, 2017, December 27, 2015 and December 28, 2014, respectively.
Agreement with RUSNANO
Dmitry Akhanov, formerly a member of the Company’s board of directors, is President and Chief Executive Officer at Rusnano USA, Inc., a U.S. subsidiary of RUSNANO, one of the Company’s investors. In July 2014, the Company entered into an amended and restated letter agreement with RUSNANO in connection with RUSNANO’s investment in convertible promissory notes, which subsequently converted into shares of the Company’s Series G convertible preferred stock. Pursuant to the amended and restated letter agreement, the Company agreed, among other matters, to operate and fund the Company’s Russian operations in an aggregate amount of $13.0 million over six annual periods beginning on December 31, 2014. The annual funding requirements in period one to period six are $2.2 million, $1.7 million, $2.0 million, $2.2 million, $2.4 million, and $2.5 million, respectively. In the event that the Company fails to meet its funding obligations for any period, the Company will be required to pay RUSNANO a penalty fee of 10% on 80% of the difference between the funding obligation and the actual funding for that period, subject to a cure period of one calendar quarter after the applicable period funding deadline. As of January 1, 2017, the Company had met the minimum funding requirements.
Common stock warrants granted to Centerview
In October 2014, in connection with the Series G financing and the appointment of a member of the Company’s board of directors, the Company issued a common stock warrant to Centerview, a convertible preferred stockholder of the Company, to purchase 288,700 shares of common stock at an exercise price of $0.05 per share. In December 2015, the warrant was fully exercised by Centerview (see Note 5). In June 2016, the Company accelerated the vesting of the remaining unvested shares of common stock issued upon early exercise of the warrant, and the Company recorded stock-based compensation expense of $0.6 million associated with this modification.
15. Subsequent Events
- 92 -
In February 2017, the Company entered into a new lease agreement for its corporate headquarters located in San Jose, California consisting of approximately 84,000 square feet. The lease term is 76 months commencing on October 1, 2017 and expiring in 2024 with total base rent of approximately $9.3 million over the lease term.
Item 9. CHANGES IN AND DISAGREEMENTS WITH ACCOUNTANTS ON ACCOUNTING AND FINANCIAL DISCLOSURE
None.
Item 9A. CONTROLS AND PROCEDURES
Evaluation of Disclosure Controls and Procedures.
Our management, with the participation of our Chief Executive Officer and Chief Financial Officer, evaluated the effectiveness of our disclosure controls and procedures as of January 1, 2017 the last day of the period covered by this Annual Report on Form 10-K. The term “disclosure controls and procedures,” as defined in Rules 13a-15(e) and 15d-15(e) under the Securities Exchange Act of 1934, as amended, or the Exchange Act, refers to controls and procedures that are designed to provide reasonable assurance that information required to be disclosed by a company in the reports that it files or submits under the Exchange Act is recorded, processed, summarized and reported, within the time periods specified in the Securities and Exchange Commission’s, or SEC, rules and forms. Disclosure controls and procedures include, without limitation, controls and procedures designed to provide reasonable assurance that information required to be disclosed by a company in the reports that it files or submits under the Exchange Act is accumulated and communicated to the company’s management, including its principal executive and principal financial officers, or persons performing similar functions, as appropriate to allow timely decisions regarding required disclosure.
As disclosed in our final prospectus, dated October 27, 2016, or Prospectus, during the course of the preparation of our 2015 consolidated financial statements, we identified a control deficiency in our internal control over financial reporting. This control deficiency did not result in a misstatement of the annual or interim financial statements, however, this control deficiency could result in a misstatement of the consolidated financial statements or disclosures that would result in a material misstatement to the annual or interim consolidated financial statements that would not be prevented or detected on a timely basis. A material weakness is a deficiency, or a combination of deficiencies, in internal control over financial reporting such that there is a reasonable possibility that a material misstatement of the annual or interim financial statements will not be prevented or detected on a timely basis. Accordingly, our management has determined that this control deficiency constitutes a material weakness.
The material weakness was a result of a lack of sufficient qualified personnel within the finance and accounting function who possessed an appropriate level of expertise to effectively perform the following functions commensurate with our structure and financial reporting requirements:
• | identify, select and apply GAAP sufficiently to provide reasonable assurance that transactions were being appropriately recorded; and |
• | assess risk and design appropriate control activities over financial and reporting processes necessary to provide reasonable assurance regarding the reliability of financial reporting and the preparation of financial statements. |
As discussed in our Prospectus, and as discussed below, we have already taken steps to remediate the material weakness in internal control over financial reporting and we continue to take additional steps to remediate the material weakness in internal control over financial reporting; however, we are not yet able to determine whether the steps we are taking will fully remediate the material weakness.
Because of the material weakness in our internal control over financial reporting as previously disclosed, and as described above, our Chief Executive Officer and Chief Financial Officer concluded that, as of January 1, 2017, our disclosure controls and procedures were not effective. Our management, including our Chief Executive Officer and Chief Financial Officer, has concluded that, notwithstanding the material weakness in our internal control over financial reporting, the consolidated financial statements in this Annual Report on Form 10-K fairly present, in all material respects, our financial position, results of operations and cash flows for the periods presented in conformity with United States GAAP.
- 93 -
In response to the identified material weakness, we have taken a number of steps to remediate this material weakness and improve our internal control over financial reporting during the year ended January 1, 2017.
These steps include hiring a number of individuals, including additional certified public accountants, with appropriate knowledge and capacity to help fulfill our obligations to comply with the accounting and reporting requirements applicable to public companies.
The additional resources added to the finance function are intended to (i) allow separate preparation and review of reconciliations and other account analysis, (ii) enable us to develop a more structured close process, including enhancing our existing policies and procedures, to improve the completeness, timeliness and accuracy of our financial reporting, and (iii) identify and review complex or unusual transactions.
While we believe that the foregoing actions will improve our internal control over financial reporting, the implementation of these measures is ongoing and will require validation and testing of the design and operating effectiveness of internal controls over a sustained period of financial reporting cycles.We also believe that our planned efforts to assess risk and identify, design and implement the necessary control activities to address such risk will be effective in remediating the material weakness described above. However until the remediation steps, including training the additional resources in the finance function and potentially hiring additional qualified resources as needed, are completed and operate for a sufficient period of time, and subsequent evaluation of their effectiveness is completed, the material weakness previously disclosed, and as described above, will continue to exist. We may also conclude that additional measures may be required to remediate the material weaknesses in our internal control over financial reporting, which may necessitate additional implementation and evaluation time. We will continue to assess the effectiveness of our internal control over financial reporting and take steps to remediate the known material weaknesses expeditiously.
Changes in Internal Control Over Financial Reporting
We are taking actions to remediate the material weakness relating to our internal control over financial reporting, as described above. Except as otherwise described herein, there were no changes in our internal control over financial reporting identified in connection with the evaluation required by Rules 13(a)-15(d) and 15d-15(d) under the Exchange Act that occurred during the quarter ended January 1, 2017 that has materially affected, or is reasonably likely to materially affect, our internal control over financial reporting.
Limitations on the Effectiveness of Controls and Procedures
Our management, including our Chief Executive Officer and Chief Financial Officer, does not expect that our disclosure controls and procedures or internal control over financial reporting will prevent all errors and all fraud. A control system, no matter how well designed and implemented, can provide only reasonable, not absolute, assurance that the control system’s objectives will be met. Further, the design of a control system must reflect the fact that there are resource constraints and the benefits of controls must be considered relative to their costs. Because of the inherent limitations in all control systems, no evaluation of controls can provide absolute assurance that all control issues within a company are detected. The inherent limitations include the realities that judgments in decision-making can be faulty and that breakdowns can occur because of simple errors or mistakes. Controls can also be circumvented by the individual acts of some persons, by collusion of two or more people, or by management override of the controls. Because of the inherent limitations in a cost-effective control system, misstatements due to error or fraud may occur and may not be detected. Also, projections of any evaluation of effectiveness to future periods are subject to the risk that controls may become inadequate because of changes in conditions or that the degree of compliance with the policies or procedures may deteriorate.
Management’s Annual Report on Internal Control over Financial Reporting
This Annual Report on Form 10-K does not include a report of management’s assessment regarding internal control over financial reporting or an attestation report of the company’s registered public accounting firm due to a transition period established by rules and regulations of the SEC for newly public companies. Further, our independent registered public accounting firm will not be required to formally attest to the effectiveness of our internal controls over financials reporting as long as we are an “emerging growth company” pursuant to the provisions of the JOBS Act.
- 94 -
Item 9B. OTHER INFORMATION
On February 21, 2017, the Company entered into a real estate lease agreement, or the Lease Agreement, for the premises located at 1704 Automation Parkway, San Jose, California, with Automation Parkway Owner LLC, a Delaware limited liability company. The premises is intended for the Company’s corporate headquarters, including research and development, and consists of approximately 84,208 square feet. The lease term is 76 months commencing on October 1, 2017 and expiring in 2024 with total base rent of approximately $9.3 million over the lease term.
The foregoing summary of the Lease Agreement is qualified in its entirety by reference to the full text of the Lease Agreement, which is filed as Exhibit 10.35 to this Annual Report.
- 95 -
PART III
Item 10. DIRECTORS, EXECUTIVE OFFICERS AND CORPORATE GOVERNANCE
The information required by this item will be contained in our Definitive Proxy Statement to be filed with the Securities and Exchange Commission, or SEC, in connection with our 2017 annual meeting of stockholders, or the Proxy Statement, which is expected to be filed not later than 120 days after the end of our fiscal year ended January 1, 2017, and is incorporated in this report by reference.
Item 11. EXECUTIVE COMPENSATION
The information required by this item will be set forth in the Proxy Statement to be filed with the SEC within 120 days of the fiscal year ended January 1, 2017, and is incorporated herein by reference.
Item 12. SECURITY OWNERSHIP OF CERTAIN BENEFICIAL OWNERS AND MANAGEMENT AND RELATED STOCKHOLDER MATTERS
The information required by this item will be set forth in the Proxy Statement to be filed with the SEC within 120 days of the fiscal year ended January 1, 2017, and is incorporated herein by reference.
Item 13. CERTAIN RELATIONSHIPS AND RELATED TRANSACTIONS, AND DIRECTOR INDEPENDENCE
The information required by this item will be set forth in the Proxy Statement to be filed with the SEC within 120 days of the fiscal year ended January 1, 2017, and is incorporated herein by reference.
Item 14. PRINCIPAL ACCOUNTING FEES AND SERVICES
The information required by this item will be set forth in the Proxy Statement to be filed with the SEC within 120 days of the fiscal year ended January 1, 2017, and is incorporated herein by reference.
With the exception of the information incorporated in Items 10, 11, 12, 13, and 14 of this Annual Report on Form 10-K, our Proxy Statement to be filed with the SEC within 120 days of the fiscal year ended January 1, 2017 is not deemed “filed” as part of this Annual Report on Form 10-K.
- 96 -
PART IV
Item 15. EXHIBITS AND FINANCIAL STATEMENT SCHEDULES.
Documents filed as part of this report are as follows:
1. | Consolidated Financial Statements |
Our Consolidated Financial Statements are listed in the “Index to Consolidated Financial Statements” under Part II, Item 8 of this Annual Report on Form 10-K.
2. | Financial Statement Schedules |
Financial Statement Schedules have been omitted as information required is inapplicable or the information is presented in the consolidated financial statements and the related notes.
3.Exhibits
The documents listed in the Exhibit Index immediately following the signature page of this Annual Report on Form 10-K are incorporated by reference or are filed or furnished with this Annual Report on Form 10-K, in each case as indicted therein (numbered in accordance with Item 601 of Regulation S-K).
- 97 -
SIGNATURES
Pursuant to the requirements of Section 13 or 15(d) of the Securities Exchange Act of 1934, the registrant has duly caused this Annual Report on Form 10-K to be signed on its behalf by the undersigned, thereunto duly authorized.
Date: March 1, 2017
QUANTENNA COMMUNICATIONS, INC. | ||
By: | /s/ Sam Heidari | |
Sam Heidari | ||
Chairman and Chief Executive Officer | ||
POWER OF ATTORNEY
Each person whose signature appears below constitutes and appoints Sam Heidari and Sean Sobers, and each of them, as his true and lawful attorney-in-fact and agent, with full power of substitution and resubstitution, for him or her and in his or her name, place and stead, in any and all capacities, to sign any and all amendments to this Annual Report on Form 10-K, and to file the same, with all exhibits thereto, and other documents in connection therewith, with the Securities and Exchange Commission, granting unto said attorneys-in-fact and agents, and each of them, full power and authority to do and perform each and every act and thing requisite and necessary to be done in connection therewith, as fully to all intents and purposes as he or she might or could do in person, hereby ratifying and confirming all that said attorneys-in-fact and agents, or any of them, or their or his substitutes, may lawfully do or cause to be done by virtue thereof.
- S-1 -
Pursuant to the requirements of the Securities Exchange Act of 1934, this report has been signed below by the following persons on behalf of the registrant and in the capacities and on the dates indicated:
Signature | Title | Date | ||
/s/ Sam Heidari | Chairman and Chief Executive Officer (Principal Executive Officer) | March 1, 2017 | ||
Sam Heidari | ||||
/s/ Sean Sobers | Chief Financial Officer (Principal Accounting and Financial Officer) | March 1, 2017 | ||
Sean Sobers | ||||
/s/ Fahri Diner | Director | March 1, 2017 | ||
Fahri Diner | ||||
/s/ Edward Frank | Director | March 1, 2017 | ||
Edward Frank | ||||
/s/ Edwin B. Hooper III | Director | March 1, 2017 | ||
Edwin B. Hooper III | ||||
/s/ Harold Hughes | Director | March 1, 2017 | ||
Harold Hughes | ||||
/s/ Jack Lazar | Director | March 1, 2017 | ||
Jack Lazar | ||||
/s/ John Scull | Director | March 1, 2017 | ||
John Scull | ||||
/s/ Mark Stevens | Director | March 1, 2017 | ||
Mark Stevens | ||||
/s/ Lip-Bu Tan | Director | March 1, 2017 | ||
Lip-Bu Tan | ||||
- S-2 -
EXHIBIT INDEX
Incorporated by Reference | ||||||||||
Exhibit Number | Description | Form | File No. | Exhibit | Filing Date | |||||
3.1 | Amended and Restated Certificate of Incorporation of the Registrant. | S-1/A | 333-213871 | 3.1 | October 17, 2016 | |||||
3.2 | Amended and Restated Bylaws of the Registrant. | S-1 | 333-213871 | 3.4 | September 29, 2016 | |||||
4.1 | Form of common stock certificate of the Registrant. | S-1/A | 333-213871 | 4.1 | October 17, 2016 | |||||
10.1+ | Form of Indemnification Agreement between the Registrant and each of its directors and executive officers. | S-1 | 333-213871 | 10.1 | September 29, 2016 | |||||
10.2+* | Quantenna Communications, Inc. 2016 Omnibus Equity Incentive Plan and related form agreements. | |||||||||
10.3+* | Quantenna Communications, Inc. 2016 Employee Stock Purchase Plan and related form agreements. | |||||||||
10.4+ | Quantenna Communications, Inc. 2016 Equity Incentive Plan and related form agreements. | S-1/A | 333-213871 | 10.4 | October 17, 2016 | |||||
10.5+ | Quantenna Communications, Inc. 2006 Stock Plan and related form agreements. | S-1/A | 333-213871 | 10.5 | October 17, 2016 | |||||
10.6+ | Quantenna Communications, Inc. Executive Incentive Compensation Plan. | S-1 | 333-213871 | 10.6 | September 29, 2016 | |||||
10.7 | Warrant to Purchase Shares of Preferred Stock of the Registrant issued to Eastward Fund Management, LLC, dated October 31, 2013. | S-1 | 333-213871 | 10.7 | September 29, 2016 | |||||
10.8 | Warrant to Purchase Shares of Common Stock of the Registrant issued to Behrooz Rezvani, dated September 10, 2015. | S-1 | 333-213871 | 10.8 | September 29, 2016 | |||||
10.9 | Warrant to Purchase Shares of Common Stock of the Registrant issued to Behrooz Rezvani, dated February 3, 2016. | S-1 | 333-213871 | 10.9 | September 29, 2016 | |||||
10.10 | Warrant to Purchase Shares of Common Stock of the Registrant issued to Airfide Networks, dated February 3, 2016. | S-1 | 333-213871 | 10.10 | September 29, 2016 | |||||
10.11 | Warrant to Purchase Stock issued to Silicon Valley Bank, dated May 17, 2016. | S-1 | 333-213871 | 10.11 | September 29, 2016 | |||||
10.12 | Warrant to Purchase Stock issued to Westriver Mezzanine Loans, dated May 17, 2016. | S-1 | 333-213871 | 10.12 | September 29, 2016 | |||||
10.13 | Amended and Restated Loan and Security Agreement, dated May 17, 2016, between the Registrant, as Borrower, and Silicon Valley Bank, as Bank. | S-1 | 333-213871 | 10.13 | September 29, 2016 | |||||
10.14 | Mezzanine Loan and Security Agreement, dated May 17, 2016, between the Registrant, as Borrower, and Silicon Valley Bank, as Bank. | S-1 | 333-213871 | 10.14 | September 29, 2016 | |||||
10.15 | Amended and Restated Stock Pledge Agreement, dated May 17, 2016, between the Registrant, as Pledgor, and Silicon Valley Bank, as Bank. | S-1 | 333-213871 | 10.15 | September 29, 2016 | |||||
10.16 | Amended and Restated Investors’ Rights Agreement among the Registrant and certain holders of its capital stock, dated August 29, 2014, as amended from time to time. | S-1 | 333-213871 | 10.16 | September 29, 2016 | |||||
10.17 | Agreement Regarding Investment in Series F Preferred Stock Financing, dated April 16, 2012, between the Registrant and Open Joint Stock Company “RUSNANO,” as amended on July 9, 2014. | S-1/A | 333-213871 | 10.17 | October 17, 2016 | |||||
10.18+ | Executive Change of Control Agreement between the Registrant and Sam Heidari. | S-1/A | 333-213871 | 10.18 | October 27, 2016 | |||||
10.19+ | Executive Change of Control Agreement between the Registrant and Sean Sobers. | S-1/A | 333-213871 | 10.19 | October 27, 2016 | |||||
E-1
10.20+ | Executive Change of Control Agreement between the Registrant and David Carroll. | S-1/A | 333-213871 | 10.20 | October 27, 2016 | |||||
10.21 | Industrial Lease between the Registrant, BTP Investors, LLC and other parties therein. | S-1 | 333-213871 | 10.21 | September 29, 2016 | |||||
10.22 | Landlords Consent and Agreement (Sublease) among the Registrant, JER Bayside, LLC, DCG Systems, Inc. and other parties therein. | S-1 | 333-213871 | 10.22 | September 29, 2016 | |||||
10.23+ | Offer Letter between the Registrant and Sam Heidari, dated May 19, 2009, and amendments thereto. | S-1 | 333-213871 | 10.23 | September 29, 2016 | |||||
10.24+ | Offer Letter between the Registrant and Philippe Morali, dated August 25, 2014. | S-1 | 333-213871 | 10.24 | September 29, 2016 | |||||
10.25+ | Offer Letter between the Registrant and Lionel Bonnot, dated October 30, 2007, and amendments thereto. | S-1 | 333-213871 | 10.25 | September 29, 2016 | |||||
10.26+ | Offer Letter between the Registrant and David Carroll, dated December 20, 2012. | S-1 | 333-213871 | 10.26 | September 29, 2016 | |||||
10.27+ | Offer Letter between the Registrant and Harold Hughes, dated October 17, 2014. | S-1 | 333-213871 | 10.27 | September 29, 2016 | |||||
10.28+ | Offer Letter between the Registrant and Jack Lazar, dated June 9, 2016. | S-1 | 333-213871 | 10.28 | September 29, 2016 | |||||
10.29+ | Offer Letter between the Registrant and Edward Frank, dated June 13, 2016. | S-1 | 333-213871 | 10.29 | September 29, 2016 | |||||
10.30+ | Offer Letter between the Registrant and Mark Stevens, dated June 24, 2016. | S-1 | 333-213871 | 10.30 | September 29, 2016 | |||||
10.31+ | Offer Letter between the Registrant and Sean Sobers, dated July 8, 2016. | S-1 | 333-213871 | 10.31 | September 29, 2016 | |||||
10.32+ | Quantenna Communications, Inc. Outside Director Compensation Policy. | S-1/A | 333-213871 | 10.32 | October 17, 2016 | |||||
10.33+* | Amended and Restated Change of Control and Severance Agreement between the Registrant and David Carroll. | |||||||||
10.34+* | Amended and Restated Change of Control and Severance Agreement between the Registrant and Sean Sobers. | |||||||||
10.35 | Office Lease, between the Registrant and Automation Parkway Owner, LLC, dated February 21, 2017 | |||||||||
21.1 | List of subsidiaries of the Registrant. | S-1 | 333-213871 | 21.1 | September 29, 2016 | |||||
23.1* | Consent of PricewaterhouseCoopers LLP, Independent Registered Public Accounting Firm. | |||||||||
24.1* | Power of Attorney (included on signature page). | |||||||||
31.1* | Certification of Principal Executive Officer Pursuant to Rules 13a-14(a) and 15d-14(a) under the Securities Exchange Act of 1934, as Adopted Pursuant to Section 302 of the Sarbanes-Oxley Act of 2002. | |||||||||
31.2* | Certification of Principal Financial Officer Pursuant to Rules 13a-14(a) and 15d-14(a) under the Securities Exchange Act of 1934, as Adopted Pursuant to Section 302 of the Sarbanes-Oxley Act of 2002. | |||||||||
32.1** | Certification of Principal Executive Officer Pursuant to 18 U.S.C. Section 1350, as Adopted Pursuant to Section 906 of hte Sarbanes-Oxley Act of 2002. | |||||||||
32.2** | Certification of Principal Financial Officer Pursuant to 18 U.S.C. Section 1350, as Adopted Pursuant to Section 906 of the Sarbanes-Oxley Act of 2002. | |||||||||
________________________
+ | Indicates management contract or compensatory plan. |
* | Filed herewith. |
** | Furnished herewith. The certifications attached as Exhibit 32.1 and Exhibit 32.2 that accompany this Annual Report on Form 10-K are deemed furnished and not filed with the Securities and Exchange Commission and are not to be incorporated |
E-2
by reference into any filing of Quantenna Communications, Inc. under the Securities Act of 1933, as amended, or the Securities Exchange Act of 1934, as amended, whether made before or after the date of this Annual Report on Form 10-K, irrespective of any general incorporation language contained in such filing.
E-3