Attached files
| file | filename |
|---|---|
| 8-K - 8-K - MARKET MOSAIC (MARCH 2017) - MOSAIC CO | a8-kmarketmosaicmarch2017.htm |
Michael R. Rahm
Vice President, Market and Strategic Analysis
Andy J. Jung
Director, Market and Strategic Analysis
Josh Paula
Market Analysis Manager
Dan Halonen
Market Analyst
Market Mosaic is a quarterly newsletter published
for our customers, suppliers and stakeholders by the
Market and Strategic Analysis group of The Mosaic
Company. Some issues assess the near term
outlook for agricultural and plant nutrient markets
while others take and in-depth look at a topic of
interest to our readers.
2017 Phosphate Outlook
– continued inside
For phosphate producers, 2017 is off to a good start. Prices and margins have
moved up sharply during what typically is a seasonally slow period, and fundamentals
continue to look positive heading into the upcoming application season.
Several developments are driving up prices. Global shipments of the leading
products are projected to post solid gains this year as a result of much leaner channel
inventories as well as strong agronomic and economic demand drivers. Sales are
off to a fast start this year because distributors who deferred purchases as prices
declined last year are now scrambling to cover large commitments as prices rise this
year. At the same time, Chinese export availability has declined due to a take-off of
domestic shipments as well as a drop in industry output. More recently, rain storms
and large swells have delayed peak shipments out of the large Jorf Lasfar facility in
Morocco. Finally, it looks like new capacity will not deliver material tonnage until later
this year or in 2018.
These developments have brought the global phosphate market into a much tighter
balance and have quickly turned sentiment. The key question now is: How long
will the current price momentum continue? This issue of Market Mosaic reviews
recent developments and recaps our near term outlook, highlighting the factors that
ultimately will answer this question.
Based on our analysis, we expect that the recent price momentum will continue
through the upcoming application season. Momentum could even accelerate
if shipping delays worsen, the application season breaks early, Chinese export
availability remains limited, and agricultural commodity prices hold up. The outlook
for the second half of this year looks less certain. At this point, however, the key
swing factors – Chinese exports, global shipments, and the start-up of new capacity –
look like they are tilting in favor of a continued tight supply/demand balance through
the end of this year
Recent Developments: Prices Take Off
After hitting bottom last December,
phosphate prices have surged higher,
especially since the beginning of
February. The price of DAP fob
NOLA barge traded at $345 per ton
at the end of February, up $55 from
its December low. The price of MAP
delivered Brazil flirted with $400 per
tonne at the same time, up $75 from
the end of last year, and the price of
DAP fob Chinese port spiked to $370
per tonne at the end of February, up
$80 from its December low.
Market Mosaic
March 2017
®
275
300
325
350
375
400
425
450
475
500
525
550
575
Jan-13 Jan-14 Jan-15 Jan-16 Jan-17
$ Tonne DAP/MAP PricesPublished Weekly Spot Prices
DAP NOLA MAP Brazil DAP China
Source: Argus FMB
In our view, four factors are driving the recent price surge: a decline
in Chinese export availability, a rush of buying as distributors
scramble to cover large commitments in a rising market, a jump in
raw materials costs, and shipping delays from Jorf Lasfar.
In China, production and exports of the leading phosphate
products are declining as a result of unprofitable economics and
more stringent environmental regulations. Exports dropped to 9.5
million tonnes in 2016, a decrease of 2.1 million from the 2015
record. The 12-month rolling total peaked at 11.7 million tonnes
in October 2015 and since then has trended downward toward
the 9.0 million tonne mark. The latest CRU estimates indicate
that production of these products declined the equivalent of 3.7
million tonnes of DAP in 2016.
A take-off of domestic shipments coupled with production
cutbacks continues to crimp export availability so far this year
despite the elimination of a $15 per tonne export tax on January 1.
Customs statistics show that DAP/MAP/TSP exports totaled less
than 215,000 tonnes in January, a drop of almost 40% or more
than 130,000 tonnes from the two-year average for the month,
and exports for the first quarter are projected to fall far short of the
higher levels of the last two years.
After deferring purchases and depleting channel inventories as
prices declined last year, distributors in several regions now are
rushing to cover large commitments for the upcoming application
season. Statistics are beginning to trickle in that confirm anecdotal
reports of brisk sales to start the year. In Brazil, ANDA statistics for
January showed that total plant nutrient shipments jumped 24%
or more than one-half million tonnes from a year earlier. DAP/
MAP/TSP imports were up 22% to start the year. Our Brazilian
team now projects total shipments in the first quarter will increase
17% or 1.0 million tonnes from a year ago. In the United States,
the U.S. Army Corps of Engineers reported that plant nutrient
deliveries along the Arkansas River system in January surged 85%
from a year ago.
A run-up in raw materials costs also has pressured phosphate
prices. For U.S. producers, higher ammonia and sulphur prices
have boosted costs $30 per tonne of DAP since late last year. The
jump in Tampa ammonia prices from $210 per tonne in November
to $330 in March accounts for most of the increase, but the price
of sulphur delivered Tampa also moved up $5 per long ton in
the first quarter. Tight fundamentals have enabled producers to
quickly pass through higher raw materials costs.
Most recently, rain storms and large swells have disrupted loading
out of Jorf Lasfar, the world’s largest phosphate facility located
on Morocco’s Atlantic coast. Several publications reported that
as many as two dozen vessels were waiting to load at the end of
February, with shipments expected to be delayed at least two to
four weeks.
First Half: More Upside than Downside Risk
Given these developments, it looks like there is more upside than
downside price risk heading into the upcoming application season.
Demand prospects continue to look strong. After increasing 1.6
million tonnes last year, we project that global shipments will
increase another 1.7 million this year, and rising prices are pulling
demand forward. Mild weather also is raising expectations of an
early start to the North American spring season. Chinese export
availability is expected to remain limited due to large domestic
shipments as well as lower industry output. Loading delays at
Jorf Lasfar seem to be getting longer rather than shorter. Finally,
agricultural commodity prices continue to trade at levels that
underpin solid on-farm use.
How much upside during the next few months is hard to gauge.
The current state of affairs is similar in some ways to the situation
three years ago. At that time, the NOLA DAP price surged $180
per ton from a low of $320 in November 2013 to almost $500 by
the end of March 2014.
Much like last year, distributors had cleaned out channel inventories
as prices declined in 2013. Buyers then rushed to the market to
“While we see more upside than downside price risk heading into
the upcoming application season, the outlook for the second half of
this year looks less certain.”
- Dr. Michael R. Rahm
50.0
62.5
75.0
87.5
100.0
112.5
125.0
137.5
150.0
162.5
175.0
200
250
300
350
400
450
500
550
600
650
700
Jan-13 Jan-14 Jan-15 Jan-16 Jan-17
Sulphur
$ LT
Ammonia
$ Tonne
Weekly Raw Materials Prices
c&f Tampa
Ammonia Sulphur
Source: Argus FMB
4
5
6
7
8
9
10
11
12
2013 2014 2015 2016 2017
Mil Tonnes
Source: China Customs
China DAP/MAP/TSP Exports
12-Month Rolling Total
cover large commitments once prices began to turn up. As a result,
global shipments climbed 3% or almost two million tonnes in 2014.
North American shipments jumped 7% or 650,000 tonnes.
Logistical bottlenecks also accelerated price gains in 2014. Weather-
related loading disruptions delayed shipments out of Jorf Lasfar
from four to six weeks during the first quarter of 2014. And, it
is worth noting that prices surged despite the Ma’aden project in
Saudi Arabia ramping up operating rates from 55% in 2013 to 71%
in 2014, and despite the imminent start-up of the first two Jorf
Phosphate Hubs in Morocco.
There are, however, some important differences. Current and
expected raw materials costs are lower this year. For U.S. producers,
the Tampa ammonia price was $415 per tonne in February 2014
vs. $330 today, and the Tampa sulphur price was $110 per long ton
three years ago vs. $75 this quarter. So, raw materials costs three
years ago were almost $35 per tonne of DAP greater than today.
More importantly, raw materials costs surged during the first half of
2014. The Tampa ammonia price spiked to $580 by April, and the
Tampa sulphur price jumped to $133 in Q2. Raw materials costs
are expected to remain stable or even decline later this year. If
that happens, producers can realize higher margins from smaller
increases in phosphate prices.
The role of China also is different today than three years ago. In
2014, additional tonnage was needed from China to meet global
demand. And China delivered – DAP/MAP/TSP exports increased
from 5.3 million tonnes in 2013 to 8.1 million in 2014. Unlike three
years ago, fewer exports are required from China this year, and it
remains unclear how industry and government initiatives to reduce
output and restructure the sector will play out, especially if prices
continue to move higher.
Finally, although key crop prices are only a bit lower today than three
years ago, fundamentals are not as robust given the large stock
builds during the last three years. Sentiment, however, remains
positive. Commodity funds continue to hold hefty long positions in
part as a hedge against an expected uptick in inflation. Nevertheless,
absent a weather shock, crop prices likely will provide a drag on any
phosphate price run this time around.
Second Half Outlook: Tilting Toward Tight
While we see more upside than downside price risk heading into
the upcoming application season, the outlook for the second half
of this year looks less certain. At this point, however, key swing
factors – Chinese exports, global shipments, and the start-up of
new capacity – look like they are tilting in favor of a continued tight
supply/demand balance through the end of this year.
Lower Chinese Exports in 2017
Chinese exports are one of the key swing factors that will impact
second-half prices and margins. Forecasts vary widely, but we
project that exports of the main phosphate products will decline
to around 8 million tonnes this year. Industry and government
objectives look tightly aligned today, and an accelerated restructuring
of the domestic industry and further declines in output and exports
are expected this year.
After piling up big losses last year, the leading Chinese producers
are seeking to restore profitability by accelerating the planned
restructuring of the large and diverse phosphate industry. And big
losses piled up as prices collapsed last year. YTH and Yihua, two of
the big four phosphate producers, recently warned that 2016 losses
are expected to total $465 million and $160 million, respectively,
and the Chinese government reported that 70% of domestic
producers were not profitable last year.
Plans outlined at the National Phosphate and Compound Fertilizer
Industry Annual Conference last May called for the permanent
closure of “outdated” facilities with capacity of 3.0 million tonnes
P2O5 or the equivalent of about 6.5 million tonnes DAP by the end of
this decade. Publications reported that the 6+2 Group, made up of
six of the largest domestic producers and the two main distributors,
are developing detailed initiatives to boost industry profitability and
accelerate restructuring yet ensure adequate domestic supplies.
Initiatives include setting a minimum export price, establishing
operating rate guidelines, raising rock prices, and forming a sulphur
sourcing joint venture among some members.
The Chinese government also appears intent on improving air
and water quality. Photos of masked citizens making their way
through dense smog in Beijing highlight the public’s growing
3.00
3.25
3.50
3.75
4.00
4.25
4.50
4.75
5.00
5.25
S O N D J F M A M J J A
US$ BU New Crop Corn PriceDaily Close of the Dec Contract (Sep 1 - Aug 31)
2017 2016 2014
Source: CME
8.00
9.00
10.00
11.00
12.00
13.00
S O N D J F M A M J J A
US$ BU New Crop Soybean PriceDaily Close of the Nov Contract (Sep 1 - Aug 31)
2017 2016 2014
Source: CME
4
5
6
7
8
9
10
11
12
2010 2011 2012 2013 2014 2015 2016 2017F
Mil Tonnes
Source: China Customs and Mosaic
China DAP/MAP/TSP Exports
Actual 2017 Forecast Range
dissatisfaction with current air and water quality, particularly in
large and increasingly affluent urban centers. The government
is responding by initiating environmental audits of industrial sites
and developing plans to close the most egregious violators. This
government crackdown is expected to provide an assist to the
industry’s restructuring efforts.
Recent reports indicate that nearly 300 government inspectors
began audits of industrial sites in six northern provinces at the end
of February. Several non-integrated NPK facilities but no large-
scale phosphate plants operate in these provinces. Subsequent
audits in southern and eastern provinces, however, will include
phosphate producers in Hubei, Sichuan, and Chongqing provinces.
Although there is no precedent for such audits, Beijing authorities
are managing the process and the worst violations are expected to
result in shut downs via the cutoff of electricity and water supplies.
The only remedy for some phosphate facilities that discharge
phosphogypsum and effluents into waterways may be permanent
closure.
In addition, other developments also support forecasts of less
rather than more exports in the future. The government will
impose new taxes on discharges into air and waterways beginning
in January 2018. These taxes potentially could raise production
costs $10 to $30 per tonne of DAP/MAP. The much-feared collapse
of the RMB has not occurred. In fact, the RMB has stabilized in
the 6.8-6.9 per dollar range since the beginning of the year so
exporters have not benefited from a much weaker currency, as
many analysts had expected.
Continued Demand-Pull Pressure
Back-half demand is the second and potentially most important
swing factor that will impact prices and margins later this year.
Broad-based and steady demand growth is a key feature of our
phosphate outlook. Global shipments of the leading phosphate
products are projected to increase to a record 67.8 million tonnes
this year, an increase of 2.6% or 1.7 million from last year. That
follows a 2.4% or 1.6 million tonne gain in 2016.
Shipments have broken quickly out of the gate, and demand
is expected to stay strong during the last half of this year. For
example, in Brazil, we project that DAP/MAP/NPS/TSP shipments
will increase 10% or 760,000 tonnes to 8.5 million tonnes this
year. Of the total, first-half shipments are projected to increase
14% or 420,000 tonnes and second-half shipments are forecast
to climb 7% or 340,000 tonnes from the high levels of last year.
In India, DAP shipments are projected to increase 2% or about
200,000 tonnes to 9.4 million tonnes this calendar year with first-
half shipments off about 150,000 tonnes but back-half shipments
up 350,000 from a year earlier.
Positive Demand Drivers
Positive agronomic and economic drivers as well as much leaner
channel inventories underpin our record shipment forecast for this
year. Agronomic requirements have taken a big step up along
with global grain and oilseed production during the last few years,
and farm economics, while not as robust as a few years ago, still
remain profitable at current crop and plant nutrient prices.
Record harvests have removed record amounts of phosphate
from farm fields during the last few years. We will use U.S. corn
production as the poster child for the nutrient removal story. U.S.
corn yields averaged 171 bushels per acre during the last three
years, up 12% or 19 bushels from the prior three-year average
(the prior three-year averages cited here exclude the low yields for
the drought-ravaged crop in 2012). In Iowa, yields averaged 191
bushels per acre, up 14% or 24 bushels for the same periods. In
Illinois, yields also averaged 191 bushels per acre during the last
three years, up 16% or a staggering 27 bushels from the prior
three-year average.
Assuming each bushel of corn removes 0.3 lbs. of P2O5 from
the field, the Iowa and Illinois corn crops removed 20 to 25
more pounds of phosphate per acre over the last three years
than what was removed during the previous three harvests.
Farmers would need to increase application rates 30% to 40%
from typical recommendations in order to replace the additional
nutrients removed by recent record corn crops. So, the multiple
reports from our account managers that Corn Belt farmers are
boosting phosphate (and potash) application rates this year are
not surprising, especially given much lower retail prices today.
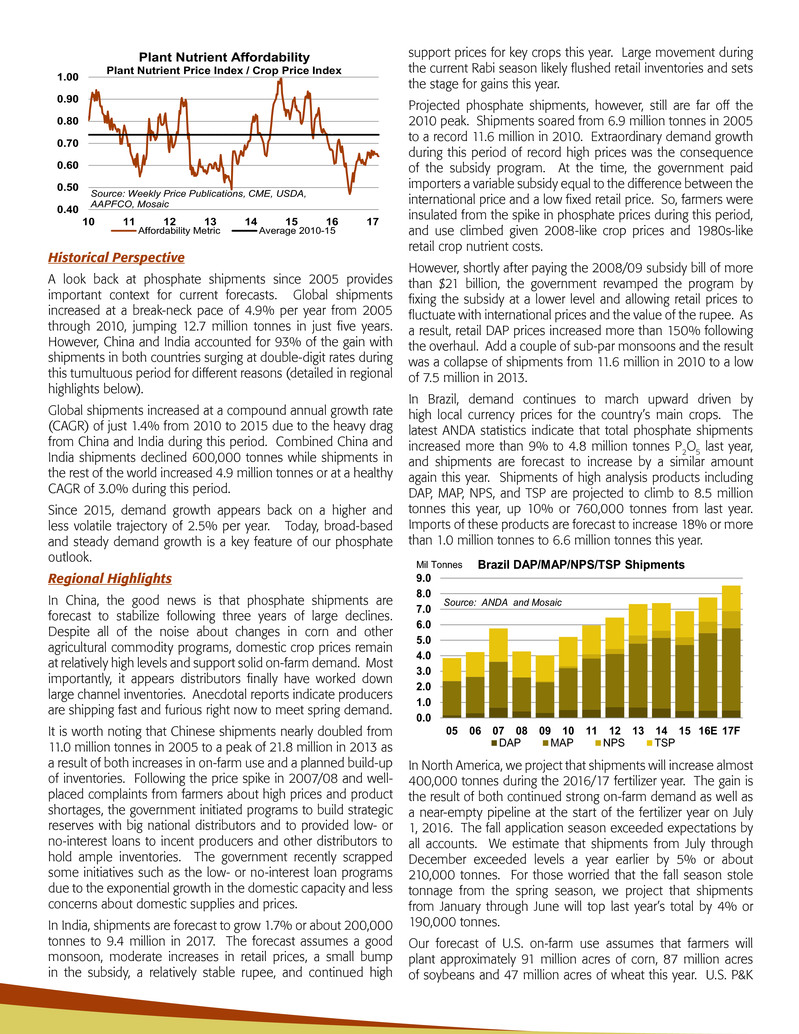
Economic drivers also remain positive. Based on current crop
prices and plant nutrient costs, our affordability metric still points
to above-average affordability. Most crop prices continue to trade
at relatively high levels – despite the record U.S. harvest last fall
and what looks increasingly like a record South American crop
this year. At the end of February, 2017 corn, soybean and wheat
prices still exceeded new crop values a year earlier, and prices for
other important crops such as palm oil, cotton, sugar, and coffee
were up sharply from 2016 lows.
®
0
10
20
30
40
50
60
70
05 06 07 08 09 10 11 12 13 14 15 16E 17F
Global Phosphate Shipments
China India Rest of World
Mil Tonnes
Source: CRU, Mosaic
Bu Ac USA Iowa Illinois
2010 152.6 165.0 157.0
2011 146.8 172.0 157.0
2013 158.1 164.0 178.0
Avg 152.5 167.0 164.0
2014 171.0 178.0 200.0
2015 168.4 192.0 175.0
2016 174.6 203.0 197.0
Avg 171.3 191.0 190.7
Source: USDA
U.S. Corn Yields
Historical Perspective
A look back at phosphate shipments since 2005 provides
important context for current forecasts. Global shipments
increased at a break-neck pace of 4.9% per year from 2005
through 2010, jumping 12.7 million tonnes in just five years.
However, China and India accounted for 93% of the gain with
shipments in both countries surging at double-digit rates during
this tumultuous period for different reasons (detailed in regional
highlights below).
Global shipments increased at a compound annual growth rate
(CAGR) of just 1.4% from 2010 to 2015 due to the heavy drag
from China and India during this period. Combined China and
India shipments declined 600,000 tonnes while shipments in
the rest of the world increased 4.9 million tonnes or at a healthy
CAGR of 3.0% during this period.
Since 2015, demand growth appears back on a higher and
less volatile trajectory of 2.5% per year. Today, broad-based
and steady demand growth is a key feature of our phosphate
outlook.
Regional Highlights
In China, the good news is that phosphate shipments are
forecast to stabilize following three years of large declines.
Despite all of the noise about changes in corn and other
agricultural commodity programs, domestic crop prices remain
at relatively high levels and support solid on-farm demand. Most
importantly, it appears distributors finally have worked down
large channel inventories. Anecdotal reports indicate producers
are shipping fast and furious right now to meet spring demand.
It is worth noting that Chinese shipments nearly doubled from
11.0 million tonnes in 2005 to a peak of 21.8 million in 2013 as
a result of both increases in on-farm use and a planned build-up
of inventories. Following the price spike in 2007/08 and well-
placed complaints from farmers about high prices and product
shortages, the government initiated programs to build strategic
reserves with big national distributors and to provided low- or
no-interest loans to incent producers and other distributors to
hold ample inventories. The government recently scrapped
some initiatives such as the low- or no-interest loan programs
due to the exponential growth in the domestic capacity and less
concerns about domestic supplies and prices.
In India, shipments are forecast to grow 1.7% or about 200,000
tonnes to 9.4 million in 2017. The forecast assumes a good
monsoon, moderate increases in retail prices, a small bump
in the subsidy, a relatively stable rupee, and continued high
support prices for key crops this year. Large movement during
the current Rabi season likely flushed retail inventories and sets
the stage for gains this year.
Projected phosphate shipments, however, still are far off the
2010 peak. Shipments soared from 6.9 million tonnes in 2005
to a record 11.6 million in 2010. Extraordinary demand growth
during this period of record high prices was the consequence
of the subsidy program. At the time, the government paid
importers a variable subsidy equal to the difference between the
international price and a low fixed retail price. So, farmers were
insulated from the spike in phosphate prices during this period,
and use climbed given 2008-like crop prices and 1980s-like
retail crop nutrient costs.
However, shortly after paying the 2008/09 subsidy bill of more
than $21 billion, the government revamped the program by
fixing the subsidy at a lower level and allowing retail prices to
fluctuate with international prices and the value of the rupee. As
a result, retail DAP prices increased more than 150% following
the overhaul. Add a couple of sub-par monsoons and the result
was a collapse of shipments from 11.6 million in 2010 to a low
of 7.5 million in 2013.
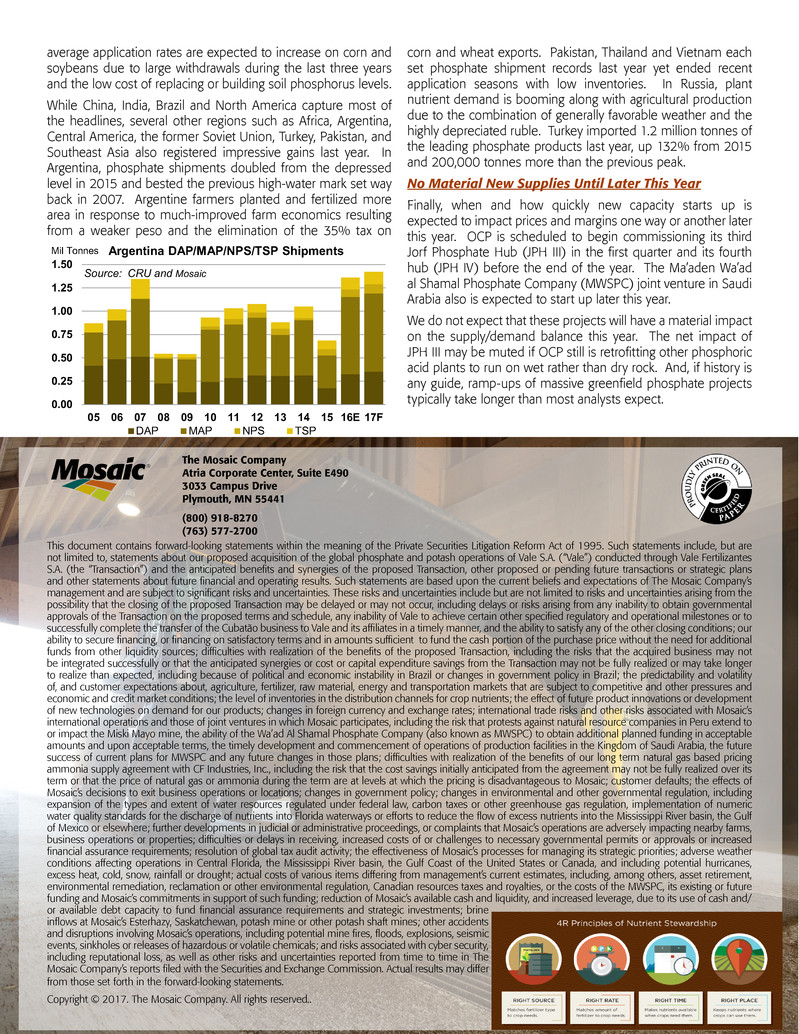
In Brazil, demand continues to march upward driven by
high local currency prices for the country’s main crops. The
latest ANDA statistics indicate that total phosphate shipments
increased more than 9% to 4.8 million tonnes P2O5 last year,
and shipments are forecast to increase by a similar amount
again this year. Shipments of high analysis products including
DAP, MAP, NPS, and TSP are projected to climb to 8.5 million
tonnes this year, up 10% or 760,000 tonnes from last year.
Imports of these products are forecast to increase 18% or more
than 1.0 million tonnes to 6.6 million tonnes this year.
In North America, we project that shipments will increase almost
400,000 tonnes during the 2016/17 fertilizer year. The gain is
the result of both continued strong on-farm demand as well as
a near-empty pipeline at the start of the fertilizer year on July
1, 2016. The fall application season exceeded expectations by
all accounts. We estimate that shipments from July through
December exceeded levels a year earlier by 5% or about
210,000 tonnes. For those worried that the fall season stole
tonnage from the spring season, we project that shipments
from January through June will top last year’s total by 4% or
190,000 tonnes.
Our forecast of U.S. on-farm use assumes that farmers will
plant approximately 91 million acres of corn, 87 million acres
of soybeans and 47 million acres of wheat this year. U.S. P&K
0.0
1.0
2.0
3.0
4.0
5.0
6.0
7.0
8.0
9.0
05 06 07 08 09 10 11 12 13 14 15 16E 17F
Brazil DAP/MAP/NPS/TSP Shipments
DAP MAP NPS TSP
Mil Tonnes
Source: ANDA and Mosaic
0.40
0.50
0.60
0.70
0.80
0.90
1.00
10 11 12 13 14 15 16 17
Plant Nutrient Affordability
Plant Nutrient Price Index / Crop Price Index
Affordability Metric Average 2010-15
Source: Weekly Price Publications, CME, USDA,
AAPFCO, Mosaic
average application rates are expected to increase on corn and
soybeans due to large withdrawals during the last three years
and the low cost of replacing or building soil phosphorus levels.
While China, India, Brazil and North America capture most of
the headlines, several other regions such as Africa, Argentina,
Central America, the former Soviet Union, Turkey, Pakistan, and
Southeast Asia also registered impressive gains last year. In
Argentina, phosphate shipments doubled from the depressed
level in 2015 and bested the previous high-water mark set way
back in 2007. Argentine farmers planted and fertilized more
area in response to much-improved farm economics resulting
from a weaker peso and the elimination of the 35% tax on
corn and wheat exports. Pakistan, Thailand and Vietnam each
set phosphate shipment records last year yet ended recent
application seasons with low inventories. In Russia, plant
nutrient demand is booming along with agricultural production
due to the combination of generally favorable weather and the
highly depreciated ruble. Turkey imported 1.2 million tonnes of
the leading phosphate products last year, up 132% from 2015
and 200,000 tonnes more than the previous peak.
No Material New Supplies Until Later This Year
Finally, when and how quickly new capacity starts up is
expected to impact prices and margins one way or another later
this year. OCP is scheduled to begin commissioning its third
Jorf Phosphate Hub (JPH III) in the first quarter and its fourth
hub (JPH IV) before the end of the year. The Ma’aden Wa’ad
al Shamal Phosphate Company (MWSPC) joint venture in Saudi
Arabia also is expected to start up later this year.
We do not expect that these projects will have a material impact
on the supply/demand balance this year. The net impact of
JPH III may be muted if OCP still is retrofitting other phosphoric
acid plants to run on wet rather than dry rock. And, if history is
any guide, ramp-ups of massive greenfield phosphate projects
typically take longer than most analysts expect.
This document contains forward-looking statements within the meaning of the Private Securities Litigation Reform Act of 1995. Such statements include, but are
not limited to, statements about our proposed acquisition of the global phosphate and potash operations of Vale S.A. (“Vale”) conducted through Vale Fertilizantes
S.A. (the “Transaction”) and the anticipated benefits and synergies of the proposed Transaction, other proposed or pending future transactions or strategic plans
and other statements about future financial and operating results. Such statements are based upon the current beliefs and expectations of The Mosaic Company’s
management and are subject to significant risks and uncertainties. These risks and uncertainties include but are not limited to risks and uncertainties arising from the
possibility that the closing of the proposed Transaction may be delayed or may not occur, including delays or risks arising from any inability to obtain governmental
approvals of the Transaction on the proposed terms and schedule, any inability of Vale to achieve certain other specified regulatory and operational milestones or to
successfully complete the transfer of the Cubatão business to Vale and its affiliates in a timely manner, and the ability to satisfy any of the other closing conditions; our
ability to secure financing, or financing on satisfactory terms and in amounts sufficient to fund the cash portion of the purchase price without the need for additional
funds from other liquidity sources; difficulties with realization of the benefits of the proposed Transaction, including the risks that the acquired business may not
be integrated successfully or that the anticipated synergies or cost or capital expenditure savings from the Transaction may not be fully realized or may take longer
to realize than expected, including because of political and economic instability in Brazil or changes in government policy in Brazil; the predictability and volatility
of, and customer expectations about, agriculture, fertilizer, raw material, energy and transportation markets that are subject to competitive and other pressures and
economic and credit market conditions; the level of inventories in the distribution channels for crop nutrients; the effect of future product innovations or development
of new technologies on demand for our products; changes in foreign currency and exchange rates; international trade risks and other risks associated with Mosaic’s
international operations and those of joint ventures in which Mosaic participates, including the risk that protests against natural resource companies in Peru extend to
or impact the Miski Mayo mine, the ability of the Wa’ad Al Shamal Phosphate Company (also known as MWSPC) to obtain additional planned funding in acceptable
amounts and upon acceptable terms, the timely development and commencement of operations of production facilities in the Kingdom of Saudi Arabia, the future
success of current plans for MWSPC and any future changes in those plans; difficulties with realization of the benefits of our long term natural gas based pricing
ammonia supply agreement with CF Industries, Inc., including the risk that the cost savings initially anticipated from the agreement may not be fully realized over its
term or that the price of natural gas or ammonia during the term are at levels at which the pricing is disadvantageous to Mosaic; customer defaults; the effects of
Mosaic’s decisions to exit business operations or locations; changes in government policy; changes in environmental and other governmental regulation, including
expansion of the types and extent of water resources regulated under federal law, carbon taxes or other greenhouse gas regulation, implementation of numeric
water quality standards for the discharge of nutrients into Florida waterways or efforts to reduce the flow of excess nutrients into the Mississippi River basin, the Gulf
of Mexico or elsewhere; further developments in judicial or administrative proceedings, or complaints that Mosaic’s operations are adversely impacting nearby farms,
business operations or properties; difficulties or delays in receiving, increased costs of or challenges to necessary governmental permits or approvals or increased
financial assurance requirements; resolution of global tax audit activity; the effectiveness of Mosaic’s processes for managing its strategic priorities; adverse weather
conditions affecting operations in Central Florida, the Mississippi River basin, the Gulf Coast of the United States or Canada, and including potential hurricanes,
excess heat, cold, snow, rainfall or drought; actual costs of various items differing from management’s current estimates, including, among others, asset retirement,
environmental remediation, reclamation or other environmental regulation, Canadian resources taxes and royalties, or the costs of the MWSPC, its existing or future
funding and Mosaic’s commitments in support of such funding; reduction of Mosaic’s available cash and liquidity, and increased leverage, due to its use of cash and/
or available debt capacity to fund financial assurance requirements and strategic investments; brine
inflows at Mosaic’s Esterhazy, Saskatchewan, potash mine or other potash shaft mines; other accidents
and disruptions involving Mosaic’s operations, including potential mine fires, floods, explosions, seismic
events, sinkholes or releases of hazardous or volatile chemicals; and risks associated with cyber security,
including reputational loss, as well as other risks and uncertainties reported from time to time in The
Mosaic Company’s reports filed with the Securities and Exchange Commission. Actual results may differ
from those set forth in the forward-looking statements.
Copyright © 2017. The Mosaic Company. All rights reserved..
The Mosaic Company
Atria Corporate Center, Suite E490
3033 Campus Drive
Plymouth, MN 55441
(800) 918-8270
(763) 577-2700
®
0.00
0.25
0.50
0.75
1.00
1.25
1.50
05 06 07 08 09 10 11 12 13 14 15 16E 17F
Argentina DAP/MAP/NPS/TSP Shipments
DAP MAP NPS TSP
Mil Tonnes
Source: CRU and Mosaic
