Attached files
| file | filename |
|---|---|
| 8-K - 8-K - Vectrus, Inc. | vec-12312016x8xk.htm |
| EX-99.1 - EXHIBIT 99.1 - Vectrus, Inc. | vec-12312016x8xk991.htm |
VECTRUS
FOURTH QUARTER 2016 RESULTS
CHUCK PROW
PRESIDENT AND CHIEF EXECUTIVE OFFICER
MATT KLEIN
SENIOR VICE PRESIDENT AND CHIEF FINANCIAL OFFICER
MARCH 1, 2017
SAFE HARBOR STATEMENT
Page 2
SAFE HARBOR STATEMENT UNDER THE PRIVATE SECURITIES LITIGATION REFORM ACT OF 1995 (THE "ACT"): CERTAIN MATERIAL PRESENTED
HEREIN INCLUDES FORWARD-LOOKING STATEMENTS INTENDED TO QUALIFY FOR THE SAFE HARBOR FROM LIABILITY ESTABLISHED BY THE ACT.
THESE FORWARD-LOOKING STATEMENTS INCLUDE, BUT ARE NOT LIMITED TO, STATEMENTS IN 2017 GUIDANCE, ABOUT OUR REVENUE,
OPERATING MARGIN, NET INCOME, EPS AND NET CASH PROVIDED BY OPERATING ACTIVITIES FOR 2017 AND OTHER ASSUMPTIONS CONTAINED
THEREIN FOR PURPOSES OF SUCH GUIDANCE, DEBT PAYMENTS, EXPENSE SAVINGS, CONTRACT OPPORTUNITIES, BIDS AND AWARDS,
COLLECTIONS, BUSINESS STRATEGY, OUTLOOK, OBJECTIVES, PLANS, INTENTIONS OR GOALS, AND ANY DISCUSSION OF FUTURE OPERATING
OR FINANCIAL PERFORMANCE. WHENEVER USED, WORDS SUCH AS "MAY," "WILL," "LIKELY," "ANTICIPATE," "ESTIMATE," "EXPECT," "PROJECT,"
"INTEND," "PLAN," "BELIEVE," "TARGET," "COULD," "POTENTIAL,“ “ARE CONSIDERING,” "CONTINUE," OR SIMILAR TERMINOLOGY ARE FORWARD-
LOOKING STATEMENTS. THESE STATEMENTS ARE BASED ON THE BELIEFS AND ASSUMPTIONS OF OUR MANAGEMENT BASED ON INFORMATION
CURRENTLY AVAILABLE TO MANAGEMENT. FORWARD-LOOKING STATEMENTS ARE NOT GUARANTEES OF FUTURE PERFORMANCE AND ARE
SUBJECT TO RISKS AND UNCERTAINTIES THAT COULD CAUSE ACTUAL RESULTS TO DIFFER MATERIALLY FROM THE RESULTS CONTEMPLATED
BY THE FORWARD-LOOKING STATEMENTS, OUR HISTORICAL EXPERIENCE AND OUR PRESENT EXPECTATIONS OR PROJECTIONS. THESE RISKS
AND UNCERTAINTIES INCLUDE, BUT ARE NOT LIMITED TO: OUR DEPENDENCE ON A FEW LARGE CONTRACTS FOR A SIGNIFICANT PORTION OF
OUR REVENUE; COMPETITION IN OUR INDUSTRY; OUR ABILITY TO SUBMIT PROPOSALS FOR AND/OR WIN POTENTIAL OPPORTUNITIES IN OUR
PIPELINE; OUR ABILITY TO RETAIN AND RENEW OUR EXISTING CONTRACTS; PROTESTS OF NEW AWARDS; OUR INTERNATIONAL OPERATIONS,
INCLUDING THE ECONOMIC, POLITICAL AND SOCIAL CONDITIONS IN THE COUNTRIES IN WHICH WE CONDUCT OUR BUSINESSES; CHANGES IN
U.S. GOVERNMENT MILITARY OPERATIONS, INCLUDING ITS OPERATIONS IN AFGHANISTAN; CHANGES IN, OR DELAYS IN THE COMPLETION OF,
U.S. OR INTERNATIONAL GOVERNMENT BUDGETS; GOVERNMENT REGULATIONS AND COMPLIANCE THEREWITH, INCLUDING CHANGES TO THE
DEPARTMENT OF DEFENSE PROCUREMENT PROCESS; CHANGES IN TECHNOLOGY; INTELLECTUAL PROPERTY MATTERS; GOVERNMENTAL
INVESTIGATIONS, REVIEWS, AUDITS AND COST ADJUSTMENTS; CONTINGENCIES RELATED TO ACTUAL OR ALLEGED ENVIRONMENTAL
CONTAMINATION, CLAIMS AND CONCERNS; OUR SUCCESS IN EXPANDING OUR GEOGRAPHIC FOOTPRINT OR BROADENING OUR CUSTOMER
BASE, MARKETS AND CAPABILITIES; OUR ABILITY TO REALIZE THE FULL AMOUNTS REFLECTED IN OUR BACKLOG; OUR MAINTAINING OUR GOOD
RELATIONSHIP WITH THE U.S. GOVERNMENT; IMPAIRMENT OF GOODWILL; OUR PERFORMANCE OF OUR CONTRACTS AND OUR ABILITY TO
CONTROL COSTS; OUR LEVEL OF INDEBTEDNESS; OUR COMPLIANCE WITH THE TERMS OF OUR CREDIT AGREEMENT; SUBCONTRACTOR AND
EMPLOYEE PERFORMANCE AND CONDUCT; OUR TEAMING ARRANGEMENTS WITH OTHER CONTRACTORS; ECONOMIC AND CAPITAL MARKETS
CONDITIONS; ANY FUTURE ACQUISITIONS, INVESTMENTS OR JOINT VENTURES; OUR ABILITY TO RETAIN AND RECRUIT QUALIFIED PERSONNEL;
OUR MAINTENANCE OF SAFE WORK SITES AND EQUIPMENT; OUR COMPLIANCE WITH APPLICABLE ENVIRONMENTAL, HEALTH AND SAFETY
REGULATIONS; OUR ABILITY TO MAINTAIN REQUIRED SECURITY CLEARANCES; ANY DISPUTES WITH LABOR UNIONS; COSTS OF OUTCOME OF
ANY LEGAL PROCEEDINGS; SECURITY BREACHES AND OTHER DISRUPTIONS TO OUR INFORMATION TECHNOLOGY AND OPERATIONS; CHANGES
IN OUR TAX PROVISIONS OR EXPOSURE TO ADDITIONAL INCOME TAX LIABILITIES; CHANGES IN U.S. GENERALLY ACCEPTED ACCOUNTING
PRINCIPLES; ACCOUNTING ESTIMATES MADE IN CONNECTION WITH OUR CONTRACTS; OUR EXPOSURE TO INTEREST RATE RISK; OUR
COMPLIANCE WITH PUBLIC COMPANY ACCOUNTING AND FINANCIAL REPORTING REQUIREMENTS; TIMING OF PAYMENTS BY THE U.S.
GOVERNMENT; RISKS AND UNCERTAINTIES RELATING TO THE SPIN-OFF FROM OUR FORMER PARENT; AND OTHER FACTORS SET FORTH IN
PART I, ITEM 1A, – “RISK FACTORS,” AND ELSEWHERE IN OUR 2016 ANNUAL REPORT ON FORM 10-K AND DESCRIBED FROM TIME TO TIME IN OUR
FUTURE REPORTS FILED WITH THE SECURITIES AND EXCHANGE COMMISSION. WE UNDERTAKE NO OBLIGATION TO UPDATE ANY FORWARD-
LOOKING STATEMENTS, WHETHER AS A RESULT OF NEW INFORMATION, FUTURE EVENTS OR OTHERWISE, EXCEPT AS REQUIRED BY LAW.
FULL-YEAR 2016 HIGHLIGHTS
Page 3
• Full-Year 2016 Results
o Revenue of $1,190.5 million
o Operating margin of 3.6%
o Diluted EPS of $2.16
o Net cash provided by operating activities of $36.6 million
o Paid down $29 million of debt; $15 million voluntary
• Awarded and successfully phased in a $21 million dollar installation services
task order in support of the U.S. Air Force at Al Udeid Air Base in Qatar
• Awarded a position on the U.S. Navy’s Global Contingency Services Multiple
Award Contract II (GCS MAC II)
• Successful ELVIS contract win extends our ~20-year support of the program
BUSINESS UPDATE
Page 4
• Contract Updates
o K-BOSSS
o APS-5 Kuwait/Qatar
o Maxwell BOS
• Thule Base Maintenance Contract Update
• New Business
o Approx. $1.5 billion of proposals submitted and pending potential award1, 100% for new
business; almost $6 billion in potential new business opportunities identified over the
next 12 months. Award decisions expected on roughly $1 billion of bids in the next six to
nine months.
• Favorable Financial Liquidity
• Vectrus Improvement Project (VIP) Update
• Strategy Update
(1) Indefinite Delivery Indefinite Quantity (IDIQ) contracts carry no value in the pipeline of potential proposals to be submitted until a specific task order is identified.
VECTRUS STRATEGY UPDATE
Page 5
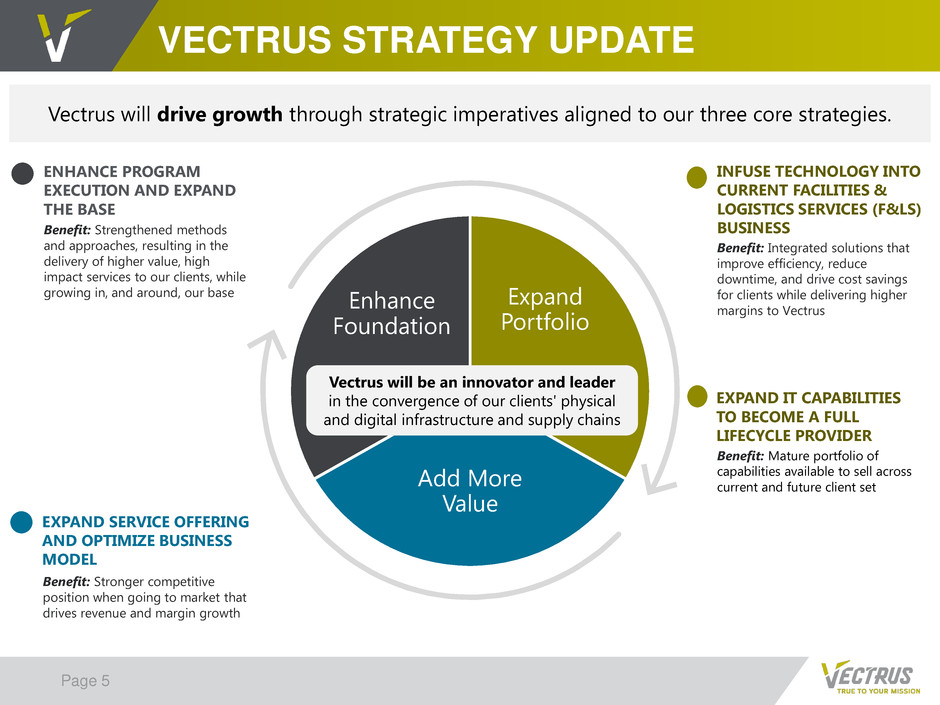
Vectrus will drive growth through strategic imperatives aligned to our three core strategies.
ENHANCE PROGRAM
EXECUTION AND EXPAND
THE BASE
EXPAND SERVICE OFFERING
AND OPTIMIZE BUSINESS
MODEL
INFUSE TECHNOLOGY INTO
CURRENT FACILITIES &
LOGISTICS SERVICES (F&LS)
BUSINESS
Expand
Portfolio
Add More
Value
Enhance
Foundation
Vectrus will be an innovator and leader
in the convergence of our clients' physical
and digital infrastructure and supply chains
Benefit: Strengthened methods
and approaches, resulting in the
delivery of higher value, high
impact services to our clients, while
growing in, and around, our base
Benefit: Integrated solutions that
improve efficiency, reduce
downtime, and drive cost savings
for clients while delivering higher
margins to Vectrus
Benefit: Stronger competitive
position when going to market that
drives revenue and margin growth
EXPAND IT CAPABILITIES
TO BECOME A FULL
LIFECYCLE PROVIDER
Benefit: Mature portfolio of
capabilities available to sell across
current and future client set
Q4 AND FULL-YEAR 2016 FINANCIAL RESULTS
Page 6
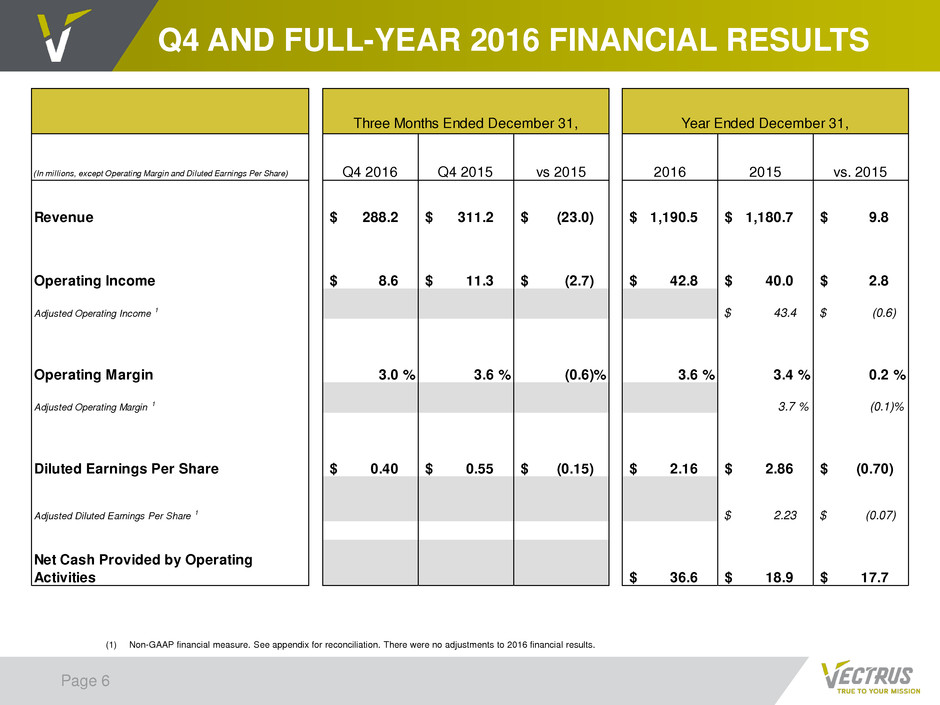
(1) Non-GAAP financial measure. See appendix for reconciliation. There were no adjustments to 2016 financial results.
(In millions, except Operating Margin and Diluted Earnings Per Share) Q4 2016 Q4 2015 vs 2015 2016 2015 vs. 2015
Revenue 288.2$ 311.2$ (23.0)$ 1,190.5$ 1,180.7$ 9.8$
Operating Income 8.6$ 11.3$ (2.7)$ 42.8$ 40.0$ 2.8$
Adjusted Operating Income 1 43.4$ (0.6)$
Operating Margin 3.0 % 3.6 % (0.6)% 3.6 % 3.4 % 0.2 %
Adjusted Operating Margin 1 3.7 % (0.1)%
Diluted Earnings Per Share 0.40$ 0.55$ (0.15)$ 2.16$ 2.86$ (0.70)$
Adjusted Diluted Earnings Per Share 1 2.23$ (0.07)$
Net Cash Provided by Operating
Activities 36.6$ 18.9$ 17.7$
Three Months Ended December 31, Year Ended December 31,
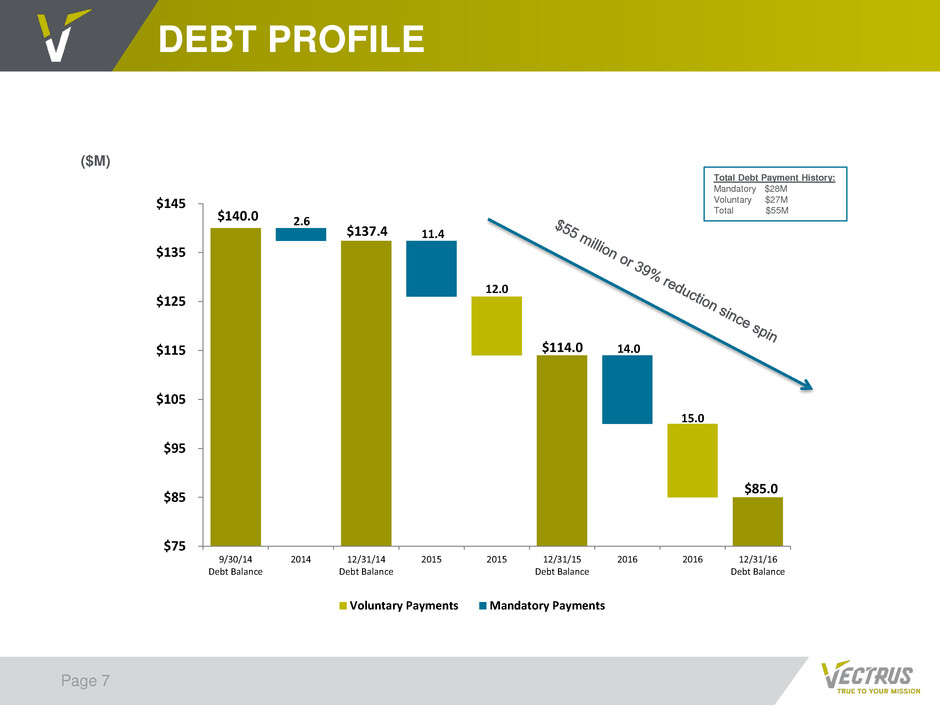
$140.0
$137.4
$114.0
$85.0
12.0
15.0
2.6
11.4
14.0
$75
$85
$95
$105
$115
$125
$135
$145
9/30/14
Debt Balance
2014 12/31/14
Debt Balance
2015 2015 12/31/15
Debt Balance
2016 2016 12/31/16
Debt Balance
Voluntary Payments Mandatory Payments
DEBT PROFILE
Page 7
($M)
Total Debt Payment History:
Mandatory $28M
Voluntary $27M
Total $55M
BACKLOG(1)(2)
Page 8
(2)
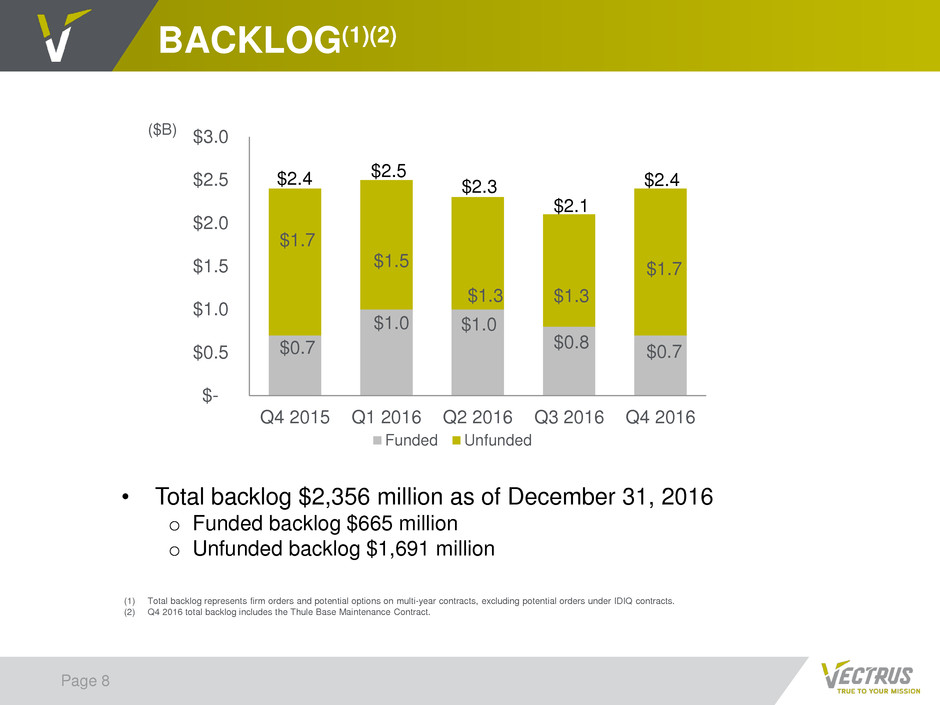
(1) Total backlog represents firm orders and potential options on multi-year contracts, excluding potential orders under IDIQ contracts.
(2) Q4 2016 total backlog includes the Thule Base Maintenance Contract.
• Total backlog $2,356 million as of December 31, 2016
o Funded backlog $665 million
o Unfunded backlog $1,691 million
$0.7
$1.0 $1.0
$0.8
$0.7
$1.7
$1.5
$1.3 $1.3
$1.7
$-
$0.5
$1.0
$1.5
$2.0
$2.5
$3.0
Q4 2015 Q1 2016 Q2 2016 Q3 2016 Q4 2016
Funded Unfunded
$2.4 $2.3
$2.1
$2.4
$2.5
($B)
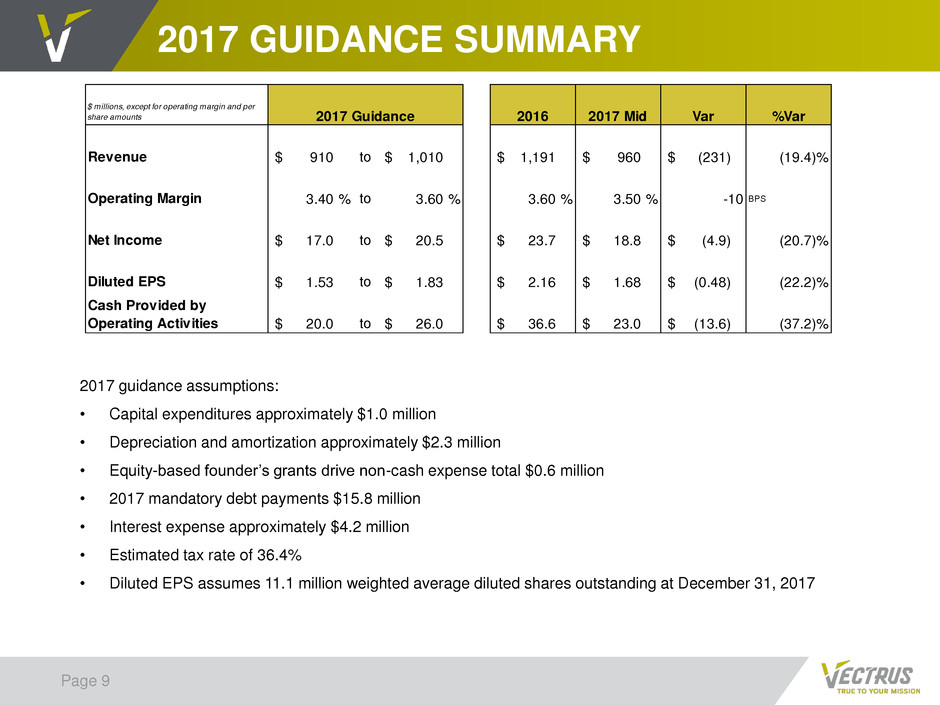
2017 GUIDANCE SUMMARY
Page 9
2017 guidance assumptions:
• Capital expenditures approximately $1.0 million
• Depreciation and amortization approximately $2.3 million
• Equity-based founder’s grants drive non-cash expense total $0.6 million
• 2017 mandatory debt payments $15.8 million
• Interest expense approximately $4.2 million
• Estimated tax rate of 36.4%
• Diluted EPS assumes 11.1 million weighted average diluted shares outstanding at December 31, 2017
$ millions, except for operating margin and per
share amounts 2016 2017 Mid Var %Var
Revenue 910$ to 1,010$ 1,191$ 960$ (231)$ (19.4)%
Operating Margin 3.40 % to 3.60 % 3.60 % 3.50 % -10 BPS
Net Income 17.0$ to 20.5$ 23.7$ 18.8$ (4.9)$ (20.7)%
Diluted EPS 1.53$ to 1.83$ 2.16$ 1.68$ (0.48)$ (22.2)%
Cash Provided by
Operating Activities 20.0$ to 26.0$ 36.6$ 23.0$ (13.6)$ (37.2)%
2017 Guidance
CHUCK PROW
PRESIDENT AND CHIEF EXECUTIVE OFFICER
MATT KLEIN
SENIOR VICE PRESIDENT AND CHIEF FINANCIAL OFFICER
VECTRUS
FOURTH QUARTER 2016 RESULTS

APPENDIX
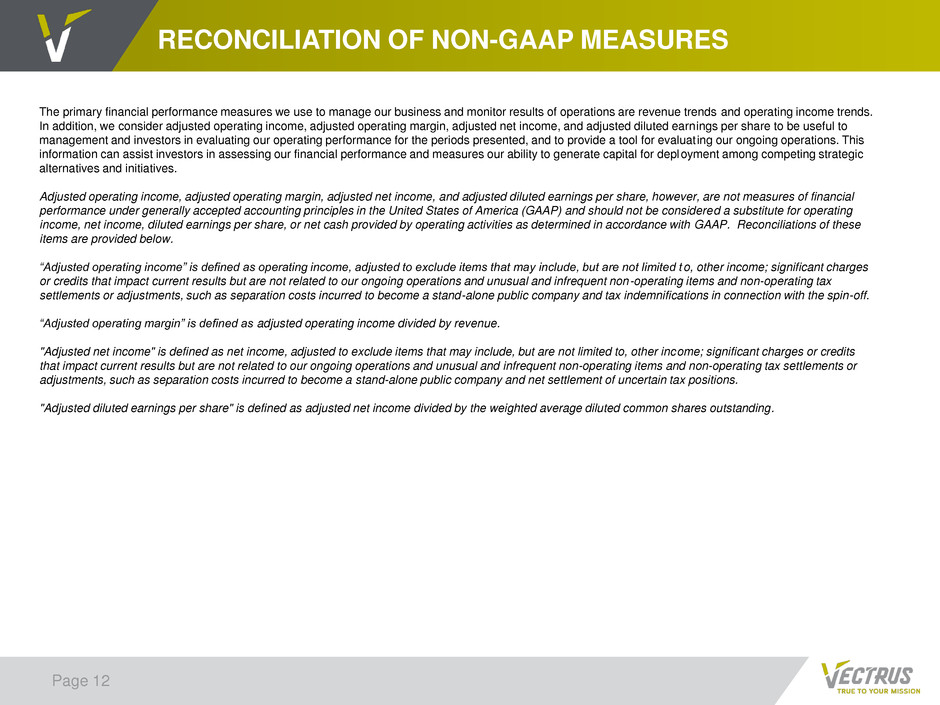
RECONCILIATION OF NON-GAAP MEASURES
Page 12
The primary financial performance measures we use to manage our business and monitor results of operations are revenue trends and operating income trends.
In addition, we consider adjusted operating income, adjusted operating margin, adjusted net income, and adjusted diluted earnings per share to be useful to
management and investors in evaluating our operating performance for the periods presented, and to provide a tool for evaluating our ongoing operations. This
information can assist investors in assessing our financial performance and measures our ability to generate capital for deployment among competing strategic
alternatives and initiatives.
Adjusted operating income, adjusted operating margin, adjusted net income, and adjusted diluted earnings per share, however, are not measures of financial
performance under generally accepted accounting principles in the United States of America (GAAP) and should not be considered a substitute for operating
income, net income, diluted earnings per share, or net cash provided by operating activities as determined in accordance with GAAP. Reconciliations of these
items are provided below.
“Adjusted operating income” is defined as operating income, adjusted to exclude items that may include, but are not limited to, other income; significant charges
or credits that impact current results but are not related to our ongoing operations and unusual and infrequent non-operating items and non-operating tax
settlements or adjustments, such as separation costs incurred to become a stand-alone public company and tax indemnifications in connection with the spin-off.
“Adjusted operating margin” is defined as adjusted operating income divided by revenue.
"Adjusted net income" is defined as net income, adjusted to exclude items that may include, but are not limited to, other income; significant charges or credits
that impact current results but are not related to our ongoing operations and unusual and infrequent non-operating items and non-operating tax settlements or
adjustments, such as separation costs incurred to become a stand-alone public company and net settlement of uncertain tax positions.
"Adjusted diluted earnings per share" is defined as adjusted net income divided by the weighted average diluted common shares outstanding.
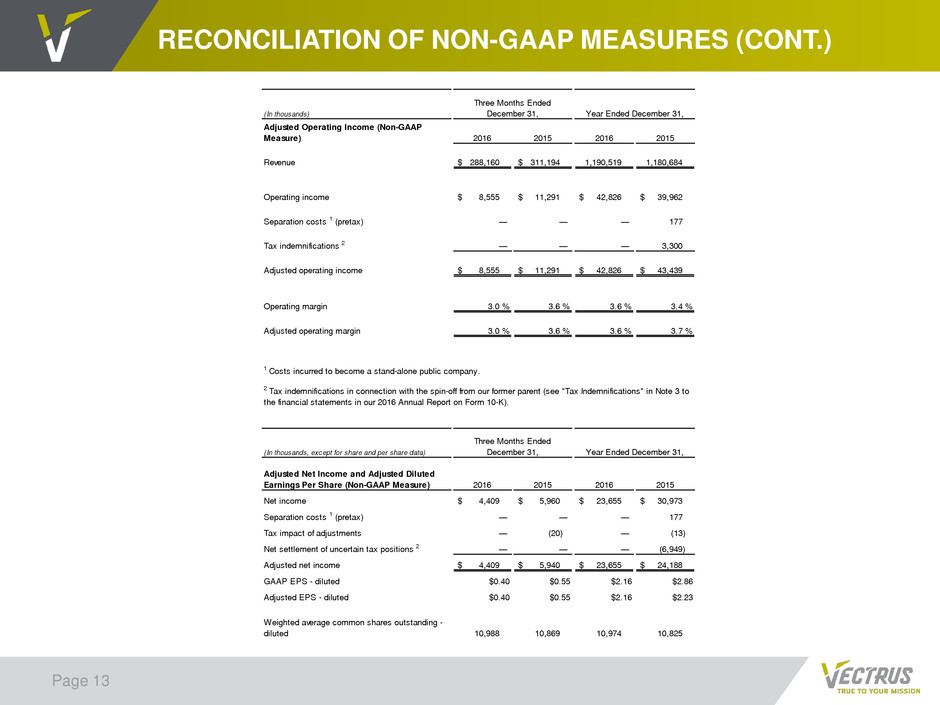
RECONCILIATION OF NON-GAAP MEASURES (CONT.)
Page 13
(In thousands)
Adjusted Operating Income (Non-GAAP
Measure) 2016 2015 2016 2015
Revenue 288,160$ 311,194$ 1,190,519 1,180,684
Operating income 8,555$ 11,291$ 42,826$ 39,962$
Separation costs 1 (pretax) — — — 177
Tax indemnifications 2 — — — 3,300
Adjusted operating income 8,555$ 11,291$ 42,826$ 43,439$
Operating margin 3.0 % 3.6 % 3.6 % 3.4 %
Adjusted operating margin 3.0 % 3.6 % 3.6 % 3.7 %
(In thousands, except for share and per share data)
Adjusted Net Income and Adjusted Diluted
Earnings Per Share (Non-GAAP Measure) 2016 2015 2016 2015
Net income 4,409$ 5,960$ 23,655$ 30,973$
Separation costs 1 (pretax) — — — 177
Tax impact of adjustments — (20) — (13)
Net settlement of uncertain tax positions 2 — — — (6,949)
Adjusted net income 4,409$ 5,940$ 23,655$ 24,188$
GAAP EPS - diluted $0.40 $0.55 $2.16 $2.86
Adjusted EPS - diluted $0.40 $0.55 $2.16 $2.23
Weighted average common shares outstanding -
diluted 10,988 10,869 10,974 10,825
Three Months Ended
December 31, Year Ended December 31,
1 Costs incurred to become a stand-alone public company.
2 Tax indemnifications in connection with the spin-off from our former parent (see "Tax Indemnifications" in Note 3 to
the financial statements in our 2016 Annual Report on Form 10-K).
Three Months Ended
December 31, Year Ended December 31,
