Attached files
| file | filename |
|---|---|
| EX-32.2 - EX-32.2 - SOUTHERN COPPER CORP/ | a2231031zex-32_2.htm |
| EX-32.1 - EX-32.1 - SOUTHERN COPPER CORP/ | a2231031zex-32_1.htm |
| EX-31.2 - EX-31.2 - SOUTHERN COPPER CORP/ | a2231031zex-31_2.htm |
| EX-31.1 - EX-31.1 - SOUTHERN COPPER CORP/ | a2231031zex-31_1.htm |
| EX-23.1 - EX-23.1 - SOUTHERN COPPER CORP/ | a2231031zex-23_1.htm |
| EX-21.1 - EX-21.1 - SOUTHERN COPPER CORP/ | a2231031zex-21_1.htm |
| EX-12.1 - EX-12.1 - SOUTHERN COPPER CORP/ | a2231031zex-12_1.htm |
Use these links to rapidly review the document
TABLE OF CONTENTS
FINANCIAL STATEMENTS
UNITED STATES
SECURITIES AND EXCHANGE COMMISSION
Washington, D.C. 20549
FORM 10-K
ý |
ANNUAL REPORT PURSUANT TO SECTION 13 OR 15(d) OF THE SECURITIES EXCHANGE ACT OF 1934 |
|
For the fiscal year ended: December 31, 2016 |
||
OR |
||
o |
TRANSITION REPORT PURSUANT TO SECTION 13 OR 15(d) OF THE SECURITIES EXCHANGE ACT OF 1934 |
|
For the transition period from to |
||
Commission File Number: 1-14066

SOUTHERN COPPER CORPORATION
(Exact name of registrant as specified in its charter)
| Delaware (State or other jurisdiction of incorporation or organization) |
13-3849074 (I.R.S. Employer Identification No.) |
|
1440 East Missouri Avenue Suite 160 Phoenix, AZ (Address of principal executive offices) |
85014 (Zip code) |
Registrant's telephone number, including area code: (602) 264-1375
Securities registered pursuant to Section 12(b) of the Act:
| Title of each class: | Name of each exchange on which registered: | |
|---|---|---|
| Common stock, par value $0.01 per share | New York Stock Exchange Lima Stock Exchange |
Securities registered pursuant to Section 12(g) of the Act: None
Indicate by check mark if the registrant is a well-known seasoned issuer, as defined in Rule 405 of the Securities Act. Yes ý No o
Indicate by check mark if the registrant is not required to file reports pursuant to Section 13 or Section 15(d) of the Act. Yes o No ý
Indicate by check mark whether the registrant (1) has filed all reports required to be filed by Section 13 or 15(d) of the Securities Exchange Act of 1934 during the preceding 12 months (or for such shorter period that the registrant was required to file such reports), and (2) has been subject to such filing requirements for the past 90 days. Yes ý No o
Indicate by check mark whether the registrant has submitted electronically and posted on its corporate Website, if any, every Interactive Data File required to be submitted and posted pursuant to Rule 405 of Regulation S-T (§ 232.405 of this chapter) during the preceding 12 months (or for such shorter period that the registrant was required to submit and post such files). Yes ý No o
Indicate by check mark if disclosure of delinquent filers pursuant to Item 405 of Regulation S-K (§ 229.405 of this chapter) is not contained herein, and will not be contained, to the best of registrant's knowledge, in definitive proxy or information statements incorporated by reference in Part III of this Form 10-K or any amendment to this Form 10-K. o
Indicate by check mark whether the registrant is a large accelerated filer, an accelerated filer, a non-accelerated filer, or a smaller reporting company. See the definitions of "large accelerated filer," "accelerated filer" and "smaller reporting company" in Rule 12b-2 of the Exchange Act.
| Large accelerated filer ý | Accelerated filer o | Non-accelerated filer o | Smaller reporting company o |
Indicate by check mark whether the registrant is a shell company (as defined in Rule 12b-2 of the Act). Yes o No ý
At February 15, 2017, there were of record 773,016,469 shares of common stock, par value $0.01 per share, outstanding.
The aggregate market value of the shares of common stock (based upon the closing price at June 30, 2016 as reported on the New York Stock Exchange—Composite Transactions) of Southern Copper Corporation held by non-affiliates was approximately $2,332.2 million.
PORTIONS OF THE FOLLOWING DOCUMENTS ARE INCORPORATED BY REFERENCE:
| Part III: | Proxy statement for 2017 Annual Meeting of Stockholders | |
Part IV: |
Exhibit Index is on Page 152 through 154 |
Southern Copper Corporation ("SCC")
2
Southern Copper Corporation ("SCC", "Southern Copper" or the "Company") is one of the largest integrated copper producers in the world. Our major production includes copper, molybdenum, zinc and silver. All of our mining, smelting and refining facilities are located in Peru and Mexico and we conduct exploration activities in those countries and in Argentina, Chile and Ecuador. See Item 2 "Properties—Review of Operations" for maps of our principal mines, smelting facilities and refineries. Our operations make us one of the largest mining companies in Peru and Mexico. We believe we have the largest copper reserves in the world. We were incorporated in Delaware in 1952 and have conducted copper mining operations since 1960. Since 1996, our common stock has been listed on both the New York and Lima Stock Exchanges.
Our Peruvian copper operations involve mining, milling and flotation of copper ore to produce copper concentrates and molybdenum concentrates; the smelting of copper concentrates to produce blister and anode copper; and the refining of anode copper to produce copper cathodes. As part of this production process, we also produce significant amounts of molybdenum concentrate and sulfuric acid. Our precious metals plant at the Ilo refinery produces refined silver, gold, and other materials. Additionally, we produce refined copper using solvent extraction/electrowinning technology ("SX-EW"). We operate the Toquepala and Cuajone open-pit mines high in the Andes Mountains, approximately 860 kilometers southeast of the city of Lima, Peru. We also operate a smelter and refinery west of the Toquepala and Cuajone mines in the coastal city of Ilo, Peru.
Our Mexican operations are conducted through our subsidiary, Minera Mexico S.A. de C.V. ("Minera Mexico"), which we acquired in 2005. Minera Mexico engages primarily in the mining and processing of copper, molybdenum, zinc, silver, gold and lead. Minera Mexico operates through subsidiaries that are grouped into three separate units. Mexicana de Cobre S.A. de C.V. (together with its subsidiaries, the "La Caridad" unit) operates La Caridad, an open-pit copper mine, a copper ore concentrator, a SX-EW plant, a smelter, refinery and a rod plant. The La Caridad refinery has a precious metals plant which produces refined silver, gold and other materials. Operadora de Minas e Instalaciones Mineras S.A de C.V. (the "Buenavista unit") operates Buenavista, an open-pit copper mine, which is located at the site of one of the world's largest copper ore deposits, two copper concentrators and three SX-EW plants. Industrial Minera Mexico, S.A. de C.V. (together with its subsidiaries, the "IMMSA unit") operates five underground mines that produce zinc, lead, copper, silver and gold, a coal mine and a zinc refinery.
We utilize modern, state of the art mining and processing methods, including global positioning systems and computerized mining processes. Our operations have a high level of vertical integration that allows us to manage the entire production process, from the mining of the ore to the production of refined copper rod and other products and most related transport and logistics functions, using our own facilities, employees and equipment.
The sales prices for our products are largely determined by market forces out of our control. Our management, therefore, focuses on cost control and production enhancement to remain profitable. We endeavor to achieve these goals through capital spending programs, exploration efforts and cost reduction programs. Our focus is to remain profitable during periods of low copper prices and on maximizing results in periods of high copper prices. For additional information on the sale prices of the metals we produce, please see "Metal Prices" in this Item 1.
3
Currency Information:
Unless stated otherwise, all our financial information is presented in U.S. dollars and any reference herein to "U.S. dollars", "dollars", or "$" are to U.S. dollars; references to "sol", "soles" or "S/", are to Peruvian soles; and references to "peso", "pesos", or "Ps.", are to Mexican pesos.
Unit Information:
Unless otherwise noted, all tonnages are in metric tons. To convert to short tons, multiply by 1.102. All ounces are troy ounces. All distances are in kilometers. To convert to miles, multiply by 0.621. To convert hectares to acres, multiply by 2.47.
ORGANIZATIONAL STRUCTURE
The following chart describes our organizational structure, starting with our controlling stockholders, as of December 31, 2016. For clarity of presentation, the chart identifies only our main subsidiaries and eliminates intermediate holding companies.
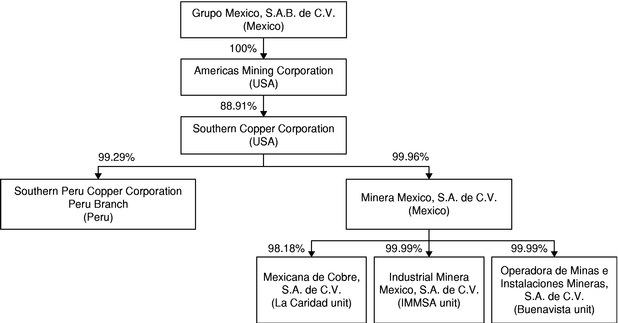
We are a majority-owned, indirect subsidiary of Grupo Mexico S.A.B. de C.V. ("Grupo Mexico"). At December 31, 2016, Grupo Mexico through its wholly-owned subsidiary Americas Mining Corporation ("AMC") owned 88.9% of our capital stock. Grupo Mexico's principal business is to act as a holding company for the shares of other corporations engaged in the mining, processing, purchase and sale of minerals and other products and railway and other related services.
We conduct our operations in Peru through a registered branch (the "SPCC Peru Branch", "Branch" or "Peruvian Branch"). The SPCC Peru Branch comprises substantially all of our assets and liabilities associated with our copper operations in Peru. The SPCC Peru Branch is not a corporation separate from us and, therefore, obligations of SPCC Peru Branch are direct obligations of SCC and vice-versa. It is, however, an establishment, registered pursuant to Peruvian law, through which we hold assets, incur liabilities and conduct operations in Peru. Although it has neither its own capital nor liability separate from us, it is deemed to have equity capital for purposes of determining the economic interests of holders of our investment shares (See Note 14 "Stockholders´ Equity" of our consolidated financial statements).
4
In April 2005, we acquired Minera Mexico, from Americas Mining Corporation ("AMC"), a subsidiary of Grupo Mexico, our controlling stockholder. Minera Mexico is a holding company and all of its operations are conducted through subsidiaries that are grouped into three units: (i) the La Caridad unit (ii) the Buenavista unit and (iii) the IMMSA unit. We own 99.96% of Minera Mexico.
In 2008, our Board of Directors ("BOD") authorized a $500 million share repurchase program that has since been increased by the BOD and is currently authorized to $3 billion. Pursuant to this program, through December 31, 2016 we have purchased 119.5 million shares of our common stock at a cost of $2,918.4 million. These shares are available for general corporate purposes. We may purchase additional shares from time to time, based on market conditions and other factors. This repurchase program has no expiration date and may be modified or discontinued at any time.
REPUBLIC OF PERU AND MEXICO
Our revenues are derived primarily from our operations in Peru and Mexico. Risks related to our operations in both countries include those associated with economic and political conditions, the effects of currency fluctuations and inflation, the effects of government regulations and the geographic concentration of our operations.
AVAILABLE INFORMATION
We file annual, quarterly and current reports, proxy statements and other information with the U.S. Securities and Exchange Commission ("SEC"). You may read and copy any document we file at the SEC's Public Reference Room at 100 F Street NE, Washington, D.C. 20549. Please call the SEC at 1-800-SEC-0330 for information on the Public Reference Room. The SEC maintains a website that contains annual, quarterly and current reports, proxy statements and other information that issuers (including Southern Copper Corporation) file electronically with the SEC. The SEC's website is www.sec.gov.
Our website is www.southerncoppercorp.com. Beginning with the Form 8-K dated March 14, 2003, we have made available on this website our annual, quarterly and current reports, as soon as reasonably practical after we electronically file such material with, or furnish it to, the SEC. Our website also includes the Company's Corporate Governance guidelines and the charters of our principal Board Committees. However, the information found on our website is not part of this or any other report.
CAUTIONARY STATEMENT
Forward-looking statements in this report and in other Company statements include information regarding expected commencement dates of mining or metal production operations, projected quantities of future metal production, anticipated production rates, operating efficiencies, costs and expenditures, including taxes, as well as projected demand or supply for the Company's products. Actual results could differ materially depending upon certain factors, including the risks and uncertainties relating to general U.S. and international economic and political conditions, the cyclical and volatile prices of copper, other commodities and supplies, including fuel and electricity, the availability of materials, insurance coverage, equipment, required permits or approvals and financing, the occurrence of unusual weather or operating conditions, lower than expected ore grades, water and geological problems, the failure of equipment or processes to operate in accordance with specifications, failure to obtain financial assurance to meet closure and remediation obligations, labor relations, litigation and environmental risks, as well as political and economic risk associated with foreign operations. Results of operations are directly affected by metal prices on commodity exchanges, which can be volatile.
5
Additional business information follows:
COPPER BUSINESS
Copper is an important component in the world's infrastructure. It is the third most widely used metal, after to iron and aluminum. Copper has unique chemical and physical properties, including high ductility, malleability, thermal and electrical conductivity, and resistance to corrosion that has made it a superior material for use in electrical and electronic products, including power transmission and generation, which accounts for about three quarters of copper global use, telecommunications, building construction, transportation and industrial machinery. Copper is also an important metal in non-electrical applications such as plumbing and roofing and, when alloyed with zinc to form brass, in many industrial and consumer applications.
Copper is an internationally traded commodity with prices principally determined by the major metal exchanges, the Commodities Exchange, or "COMEX", in New York and the London Metal Exchange or "LME." Copper is usually found in nature in association with sulfur. Pure copper metal is generally produced from a multistage process, beginning with the mining and concentrating of low-grade ores containing copper sulfide minerals, and followed by smelting and electrolytic refining to produce a pure copper cathode. An increasing share of copper is produced from acid leaching of oxidized ores. Copper is one of the oldest metals ever used and has been one of the most important materials in the development of civilization.
BUSINESS REPORTING SEGMENTS:
Our management views Southern Copper as having three reportable segments and manages it on the basis of these segments.
The three segments identified are groups of individual mines, each of which constitutes an operating segment with similar economic characteristics, type of products, processes and support facilities, regulatory environments, employee bargaining contracts and currency risks. In addition, each mine within the individual group earns revenues from similar types of customers for their products and services and each group incurs expenses independently, including commercial transactions between groups.
Inter-segment sales are based on arm's length prices at the time of sale. These may not be reflective of actual prices realized by the Company due to various factors, including additional processing, timing of sales to outside customers and transportation cost. Added to the segment data is information regarding the Company's sales. The segments identified by the Company are:
- 1.
- Peruvian
operations, which include the Toquepala and Cuajone mine complexes and the smelting and refining plants, including a precious metals plant, industrial
railroad and port facilities that service both mines. Sales of its products are recorded as revenue of our Peruvian mines. The Peruvian operations produce copper, with production of by-products of
molybdenum, silver and other materials.
- 2.
- Mexican
open-pit operations, which include the La Caridad and Buenavista mine complexes and the smelting and refining plants, including a precious metals plant and a
copper rod plant and support facilities that service both mines. Sales of its products are recorded as revenue of our Mexican mines. The Mexican open-pit operations produce copper, with production of
by-products of molybdenum, silver and other materials.
- 3.
- Mexican underground mining operations, which include five underground mines that produce zinc, copper, lead, silver and gold, a coal mine that produces coal and coke, and a zinc refinery. This group is identified as the IMMSA unit and sales of its products are recorded as revenue of the IMMSA unit.
6
Financial information is regularly prepared for each of the three segments and the results are reported to Senior Management on a segment basis. Senior Management focuses on operating income and on total assets as measures of performance to evaluate different segments and to make decisions to allocate resources to the reported segments. These are common measures in the mining industry.
Segment information is included in Item 2 "Properties," under the captions—"Metal Production by Segments" and "Ore Reserves." More information on business segment and segment financial information is included in Note 18 "Segment and Related Information" of our consolidated financial statements.
CAPITAL INVESTMENT PROGRAM AND EXPLORATION ACTIVITIES
For a description of our capital investment program, see Item 7 "Management's Discussion and Analysis of Financial Condition and Results of Operations—Capital Investment Program" and for our exploration activities, see Item 2 "Properties—Explorations Activities."
PRINCIPAL PRODUCTS AND MARKETS
Copper is primarily used in the building and construction industries, in the power generation and transmission industry, in electrical and electronic products and, to a lesser extent, in industrial machinery and equipment, consumer products and in the automotive and transportation industries. Molybdenum is used to toughen alloy steels and soften tungsten alloy and is also used in fertilizers, dyes, enamels and reagents. Silver is used for photographic, electrical and electronic products and, to a lesser extent, in brazing alloys and solder, jewelry, coinage, silverware and catalysts. Zinc is primarily used as a coating on iron and steel to protect against corrosion and is also used to make die cast parts, in the manufacturing of batteries and in the form of sheets for architectural purposes.
Our marketing strategy and annual sales planning emphasize developing and maintaining long-term customer relationships. Thus acquiring annual or other long-term contracts for the sale of our products is a high priority. Generally, 80% to 90% of our metal production is sold under annual or longer-term contracts. Sales prices are determined based on the prevailing commodity prices for the quotation period according to the terms of the contract.
We focus on the ultimate end-user customers as opposed to selling on the spot market or to trading companies. In addition, we devote significant marketing efforts to diversifying our sales both by region and by customer base. We also strive to provide superior customer service, including timely deliveries of our products. Our ability to consistently fulfill customer demand is supported by our substantial production capacity.
For additional information on sales please see "Revenue recognition" in Note 2 "Summary of Significant Accounting Policies" and Note 18 "Segment and Related Information" of our consolidated financial statements.
METALS PRICES
Prices for our products are principally a function of supply and demand and, with the exception of molybdenum, are established on COMEX and LME. Prices for our molybdenum products are established by reference to the publication Platt's Metals Week. Our contract prices also reflect any negotiated premiums and the costs of freight and other factors. From time to time, we have entered into hedging transactions to provide partial protection against future decreases in the market price of metals and we may do so under certain market conditions. For a further discussion of our products market prices, please see Item 7 "Management's Discussion and Analysis of Financial Condition and Results of Operations—Metal Prices."
7
The table below shows the high, low and average COMEX and LME per pound copper prices during the last 10 years:
| |
Copper (COMEX) | Copper (LME) | |||||||||||||||||
|---|---|---|---|---|---|---|---|---|---|---|---|---|---|---|---|---|---|---|---|
Year
|
High | Low | Average | High | Low | Average | |||||||||||||
2007 |
3.75 | 2.40 | 3.23 | 3.77 | 2.37 | 3.23 | |||||||||||||
2008 |
4.08 | 1.25 | 3.13 | 4.08 | 1.26 | 3.16 | |||||||||||||
2009 |
3.33 | 1.38 | 2.35 | 3.33 | 1.38 | 2.34 | |||||||||||||
2010 |
4.44 | 2.76 | 3.43 | 4.42 | 2.76 | 3.42 | |||||||||||||
2011 |
4.62 | 3.05 | 4.01 | 4.60 | 3.08 | 4.00 | |||||||||||||
2012 |
3.97 | 3.28 | 3.61 | 3.93 | 3.29 | 3.61 | |||||||||||||
2013 |
3.78 | 3.03 | 3.34 | 3.74 | 3.01 | 3.32 | |||||||||||||
2014 |
3.43 | 2.84 | 3.12 | 3.37 | 2.86 | 3.11 | |||||||||||||
2015 |
2.95 | 2.02 | 2.51 | 2.92 | 2.05 | 2.50 | |||||||||||||
2016-1st Q |
2.29 |
1.94 |
2.11 |
2.31 |
1.96 |
2.12 |
|||||||||||||
2016-2nd Q |
2.28 | 2.03 | 2.13 | 2.29 | 2.04 | 2.15 | |||||||||||||
2016-3rd Q |
2.26 | 2.07 | 2.16 | 2.25 | 2.07 | 2.17 | |||||||||||||
2016-4th Q |
2.69 | 2.08 | 2.39 | 2.69 | 2.10 | 2.40 | |||||||||||||
2016 |
2.69 | 1.94 | 2.20 | 2.69 | 1.96 | 2.21 | |||||||||||||
The per pound COMEX copper price during the last 5 and 10 year periods averaged $2.96 and $3.09, respectively. The per pound LME copper price during the last 5 and 10 year periods averaged $2.95 and $3.09, respectively.
The table below shows the high, low and average per-pound, except silver, which is per ounce, market prices for our three principal by-products during the last 10 years:
| |
Silver (COMEX) | Molybdenum (Dealer Oxide Platt's Metals Week) |
Zinc (LME) | |||||||||||||||||||||||||
|---|---|---|---|---|---|---|---|---|---|---|---|---|---|---|---|---|---|---|---|---|---|---|---|---|---|---|---|---|
Year
|
High | Low | Average | High | Low | Average | High | Low | Average | |||||||||||||||||||
2007 |
15.50 | 11.47 | 13.39 | 33.75 | 24.50 | 30.19 | 1.93 | 1.00 | 1.47 | |||||||||||||||||||
2008 |
20.69 | 8.80 | 14.97 | 33.88 | 8.75 | 28.42 | 1.28 | 0.47 | 0.85 | |||||||||||||||||||
2009 |
19.30 | 10.42 | 14.67 | 18.00 | 7.83 | 10.91 | 1.17 | 0.48 | 0.75 | |||||||||||||||||||
2010 |
30.91 | 14.82 | 20.18 | 18.60 | 11.75 | 15.60 | 1.14 | 0.72 | 0.98 | |||||||||||||||||||
2011 |
48.58 | 26.81 | 35.18 | 17.88 | 12.70 | 15.33 | 1.15 | 0.79 | 0.99 | |||||||||||||||||||
2012 |
37.14 | 26.25 | 31.19 | 14.80 | 10.90 | 12.62 | 0.99 | 0.80 | 0.88 | |||||||||||||||||||
2013 |
32.41 | 18.53 | 23.82 | 11.95 | 9.12 | 10.26 | 0.99 | 0.81 | 0.87 | |||||||||||||||||||
2014 |
22.05 | 15.39 | 19.04 | 15.05 | 8.75 | 11.30 | 1.10 | 0.88 | 0.98 | |||||||||||||||||||
2015 |
18.35 | 13.67 | 15.68 | 9.40 | 4.30 | 6.59 | 1.09 | 0.66 | 0.88 | |||||||||||||||||||
2016-1st Q |
16.02 |
13.74 |
14.87 |
5.55 |
5.10 |
5.27 |
0.84 |
0.73 |
0.76 |
|||||||||||||||||||
2016-2nd Q |
18.58 | 14.94 | 16.83 | 8.60 | 5.30 | 6.89 | 0.95 | 0.79 | 0.87 | |||||||||||||||||||
2016-3rd Q |
20.67 | 18.48 | 19.59 | 7.55 | 6.40 | 6.94 | 1.08 | 0.94 | 1.02 | |||||||||||||||||||
2016-4th Q |
18.80 | 15.70 | 17.12 | 7.05 | 6.30 | 6.58 | 1.32 | 1.01 | 1.14 | |||||||||||||||||||
2016 |
20.67 | 13.74 | 17.10 | 8.60 | 5.10 | 6.42 | 1.32 | 0.73 | 0.95 | |||||||||||||||||||
8
The per ounce COMEX silver price during the last 5 and 10 year periods averaged $21.37 and $20.52, respectively. The per pound Platt's Metals Week Dealer Oxide molybdenum price during the last 5 and 10 year periods averaged $9.44 and $14.76, respectively. The per pound LME zinc price during the last 5 and 10 year periods averaged $0.91 and $0.96, respectively.
COMPETITIVE CONDITIONS
Competition in the copper market is based primarily on price and service basis, with price being the most important factor when supplies of copper are ample. Our products compete with other materials, including aluminum and plastics. For additional information, see Item 1A "Risk Factors—The copper mining industry is highly competitive."
LABOR FORCE
As of December 31, 2016, we had 13,414 employees, approximately 73.4% of whom are unionized and represented by eight different labor unions. In recent years we have experienced a positive labor environment in our operations in Mexico and Peru, which is allowing us to increase productivity as well as helping us achieve the goals of our capital expansion program.
Peru
73% of our 4,562 Peruvian employees were unionized at December 31, 2016. Currently, there are five separate unions, one large union and four smaller unions. In the first quarter of 2016, the Company signed three-year agreements with all five unions. These agreements include, among other things, annual salary increases of 5% for each of the three years.
In the last six years, the Peruvian operations has experienced a stable labor environment without major labor stoppages.
Employees of the Toquepala and Cuajone units reside in townsites, where we have built 3,700 houses and apartments. We also have 90 houses at Ilo for staff personnel. Housing, together with maintenance and utility services, is provided at minimal cost to most of our employees. Our townsite and housing complexes include schools, medical facilities, churches, social clubs and recreational facilities. We also provide shopping, banking and other services at the townsites.
Mexico
74.3% of our 8,760 Mexican employees were unionized at December 31, 2016, represented by three separate unions. Under Mexican law, the terms of employment for unionized workers are set forth in collective bargaining agreements. Mexican companies negotiate the salary provisions of collective bargaining agreements with the labor unions annually and negotiate other benefits every two years. We conduct negotiations separately at each mining complex and each processing plant.
Our Taxco and San Martin mines in Mexico have been on strike since July 2007. For a discussion of labor matters reference is made to the information contained under the caption "Labor matters" in Note 13 "Commitments and Contingencies" of the consolidated financial statements.
Employees of La Caridad and Buenavista units reside in townsites at Nacozari and Cananea, where we have built approximately 2,000 and 275 houses and apartments, respectively. Most of the employees of the IMMSA unit reside on the grounds of the mining or processing complexes in which they work and where we have built approximately 900 houses and apartments. Housing, together with maintenance and utility services, is provided at minimal cost to most of our employees. Our townsites and housing complexes include educational and medical facilities, churches, social clubs, shopping centers, banking and other services. Through 2007, the Buenavista unit provided health care services to employees and retired unionized employees and their families through its own hospital at the
9
Buenavista unit. In 2010, the Company signed an agreement with the Secretary of Health of the State of Sonora to provide these services to its retired workers and their families. The new workers of Buenavista receive health services through the Mexican Institute of Social Security as is the case for all Mexican workers.
FUEL, ELECTRICITY AND WATER SUPPLIES
The principal raw materials used in our operations are fuel, electricity and water. We use natural gas to power boilers and generators, and for metallurgical processes at our Mexican operations and diesel fuel to power mining equipment. We believe that sources of fuel, electricity and water are readily available. The prices of these raw materials may fluctuate outside of our control, therefore we focus our efforts to reduce these costs through cost and energy saving measures.
Energy is the principal cost in mining, so the concern for its conservation and efficient usage is very important. We have energy management committees at most of our mines, which meet periodically to discuss consumption and to develop measures directed at saving energy. Also, alternative sources are being analyzed at the corporate level, from both traditional and renewable energy sources. This has helped us to develop a culture of energy conservation directed at the sustainability of our operations.
Peru:
Fuel: In Peru, we obtain fuel primarily from local production. The Company believes that adequate supplies of fuel are available in Peru.
Electricity: We currently receive power from Engie Energia Peru S.A., "Engie" (formerly Enersur S.A.) under a power purchase agreement through April 2017. In June 2014, we entered into a power purchase agreement for 120 megawatt ("MW") with the state company Electroperu S.A., which will supply energy for our Peruvian operations for twenty years starting on April 17, 2017 and ending on April 30, 2037. In July 2014, we entered into a power purchase agreement for 120MW with a private power generator Kallpa, which will supply energy for our Peruvian operations for ten years starting on April 17, 2017 and ending on April 30, 2027. In May 2016, we signed an additional power purchase agreement for a maximum of 80MW with Kallpa, under which Kallpa will supply energy for the operations related to the Toquepala Expansion and other minor projects for ten years starting on May 1, 2017 and ending after ten years of commercial operation of the Toquepala Expansion or on April 30, 2029; whichever happens first. In addition, we feel confident that additional power can be obtained from the Peruvian national grid, should the need arise.
Additionally, we have nine megawatts of power generation capacity from two small hydro-generating installations at Cuajone. Power is distributed over a 224-kilometer closed loop transmission circuit, which is interconnected with the Peruvian network.
Water: We have water rights or licenses for up to 1,950 liters per second from well fields at the Huaitire, Vizcachas and Titijones aquifers and surface water rights from the Suches lake and two small water courses, Quebrada Honda and Quebrada Tacalaya. We believe these water sources are sufficient to supply the needs of our operating units at Toquepala and Cuajone. At Ilo, we have desalination plants that produce water for industrial use and domestic consumption that we believe are sufficient for our current and projected needs.
Mexico:
Fuel: In Mexico, fuel is purchased directly from Petroleos Mexicanos ("PEMEX"), the state oil monopoly.
The La Caridad unit imports natural gas from the United States through its pipeline (between Douglas, Arizona and Nacozari, Sonora), which allows us to import natural gas from the United States
10
at market prices and thereby reduce operating costs. Several contracts with PEMEX and the United States provide us with the option of using a monthly or daily fixed price for our natural gas purchases.
Natural gas is used for metallurgical processes, to power furnaces, converters, casting wheels, boilers and electric generators. Diesel oil is a backup for all these uses. We use diesel oil to power mining equipment at our operations.
Electricity: Electricity is used as the main energy source at our mining complexes. We purchase most of our electricity from Mexico Generadora de Energia S. de R. L. ("MGE"), a subsidiary of Grupo Mexico which has two power plants designed to supply power to La Caridad and Buenavista units. It is expected that MGE will supply approximately 12% of its power output to third party energy users. These plants are natural gas-fired combined cycle power generating units, with a net total capacity of 516.2 megawatts. In 2012, we entered into a power supply agreement with MGE through 2032. The first plant was completed in 2013 and the second, in the second quarter of 2014. MGE has the authorization for the interconnection with the Mexican electrical system to start operations at the second plant. The first plant began to supply power to the Company in December 2013, and the second plant began to supply power in June 2015.
We also purchase electricity from the Comision Federal de Electricidad (the Federal Electricity Commission or the "CFE"), the state's electrical power producer. In addition, we recover some energy from waste heat boilers at the La Caridad smelter. Accordingly, a significant portion of our operating costs in Mexico is dependent upon the pricing policies of CFE, as well as PEMEX, which reflect government policy, as well as international market prices for crude oil, natural gas and conditions in the refinery markets.
Some of the mining operations also purchase electricity from EOLICA el RETIRO, S.A.P.I de C.V. a windfarm energy producer that is an indirect subsidiary of Grupo Mexico. On August of 2013, IMMSA and other of the mining operations of the Company signed a purchase agreement and in late 2014 started to purchase electricity. Most of the purchases where made by IMMSA, due to the nature of the producer there is not a set amount of KWh contracted. In 2016 the total purchases were of approximately 34.7 million KWh.
Water: In Mexico, water is deemed a public property and industries not connected to a public service water supply must obtain a water concession from Comision Nacional del Agua (the National Water Commission or the "CNA"). Water usage fees are established in the Ley Federal de Derechos (the Federal Rights Law), which distinguishes several availability zones with different fees per unit of volume according to each zone, with the exception of Mexicana de Cobre. All of our operations have one or several water concessions and pump out the required water from wells. Mexicana de Cobre pumps water from the La Angostura dam, which is close to the mine and plants. At our Buenavista facility, we maintain our own wells and pay the CNA for water usage. Water conservation committees have been established in each plant in order to conserve and recycle water. Water usage fees are updated on a yearly basis and have been increasing in recent years.
ENVIRONMENTAL MATTERS
For a discussion of environmental matters reference is made to the information contained under the caption "Environmental matters" in Note 13 "Commitments and Contingencies" of the consolidated financial statements.
11
MINING RIGHTS AND CONCESSIONS
Peru:
We have 171,056 hectares in concessions from the Peruvian government for our exploration, exploitation, extraction and production operations, at various sites, as follows:
| |
Toquepala | Cuajone | Ilo | Other | Total | |||||||||||
|---|---|---|---|---|---|---|---|---|---|---|---|---|---|---|---|---|
| |
(hectares) |
|||||||||||||||
Plants |
300 | 456 | 421 | — | 1,177 | |||||||||||
Operations |
22,762 | 21,255 | 4,525 | 39,359 | 87,901 | |||||||||||
Exploration |
— | — | — | 81,979 | 81,979 | |||||||||||
| | | | | | | | | | | | | | | | | |
Total |
23,062 | 21,711 | 4,946 | 121,338 | 171,057 | |||||||||||
| | | | | | | | | | | | | | | | | |
| | | | | | | | | | | | | | | | | |
| | | | | | | | | | | | | | | | | |
We believe that our Peruvian concessions are in full force and in effect under applicable Peruvian laws and that we are in compliance with all material terms and requirements applicable to these concessions. The concessions have indefinite terms, subject to our payment of concession fees of up to $3.00 per hectare annually for the mining concessions and a fee based on nominal capacity for the processing concessions. Fees paid during 2016, 2015 and 2014, were approximately $1.3 million, $1.7 million and $1.2 million, respectively. We have two types of mining concessions in Peru: metallic and non-metallic concessions.
In 2011, the Peruvian Congress approved an amendment to the mining royalty charge. The new mining royalty charge is based on operating income margins with graduated rates ranging from 1% to 12% of operating profits, with a minimum royalty charge assessed at 1% of net sales. If the operating income margin is 10% or less, the royalty charge is 1% and for each 5% increment in the operating income margin, the royalty charge rate increases by 0.75%, up to a maximum of 12%. In 2016, 2015 and 2014, we made provisions of $16.8 million, $22.9 million and $32.4 million, respectively.
At the same time the Peruvian Congress amended the mining royalty charge, it enacted a new tax for the mining industry. This tax is also based on operating income and its rates range from 2% to 8.4%. For additional information see Note 8 "Income Taxes" to the consolidated financial statements.
Mexico:
In Mexico we have 530,056 hectares in concessions from the Mexican government for our exploration and exploitation activities as outlined on the table below.
| |
IMMSA | La Caridad | Buenavista | Projects | Total | |||||||||||
|---|---|---|---|---|---|---|---|---|---|---|---|---|---|---|---|---|
| |
(hectares) |
|||||||||||||||
Mine concessions |
254,204 | 102,699 | 93,706 | 79,447 | 530,056 | |||||||||||
We believe that our Mexican concessions are in full force and in effect under applicable Mexican laws and that we are in compliance with all material terms and requirements applicable to these concessions. Under Mexican law, mineral resources belong to the Mexican nation and a concession from the Mexican federal government is required to explore or mine mineral reserves. Mining concessions have a 50-year term that can be renewed for another 50 years. Holding fees for mining concessions can be from $0.30 to $7.40 per hectare depending on the beginning date of the mining concession. Fees paid during 2016, 2015 and 2014 were approximately $5.4 million, $5.6 million and $5.7 million, respectively. In addition, all of our operating units in Mexico have water concessions that are in full force and effect. Although ownership is not required in order to explore or mine a concession, we generally own the land related to our Mexican concessions. We also own all of the processing facilities of our Mexican operations and the land on which they are constructed.
In December 2013, the Mexican government enacted a new law which, among other things, established a mining royalty charge of 7.5% on earnings before taxes as defined by Mexican tax regulations and an additional royalty charge of 0.5% over gross income from sales of gold, silver and platinum. These charges were effective January 2014 and are deductible for income tax purposes.
12
Every investor or potential investor in Southern Copper Corporation should carefully consider the following risk factors.
Financial risks
Our financial performance is highly dependent on the price of copper and the other metals we produce.
Our financial performance is significantly affected by the market prices of the metals that we produce, particularly the market prices of copper, molybdenum, zinc and silver. Historically, these prices have been subject to wide fluctuations and are affected by numerous factors out of our control, including international economic and political conditions, levels of supply and demand, the availability and costs of substitutes, inventory levels maintained by users, actions of participants in the commodities markets and currency exchange rates. In addition, the market prices of copper and certain other metals have on occasion been subject to rapid short-term changes.
In the last three years, approximately 78.0% of our revenues came from the sale of copper, 6.0% came from molybdenum and 9.0% came from silver and zinc. Please see the distribution of our revenues per product on Item 7 "Management's Discussion and Analysis of Financial Condition and Results of Operations" caption "Results of operations—net sales" on page 80.
See also historical average price of our products on Item 1 Business caption "Metals prices".
We cannot predict whether metals prices will rise or fall in the future. Future declines in metals prices, and in particular copper, will have an adverse impact on our results of operations and financial condition. In very adverse market conditions, we might consider curtailing or modifying some of our mining and processing operations.
Our business requires levels of capital investments which we may not be able to maintain.
Our business is capital intensive. Specifically, the exploration and exploitation of copper and other metal reserves, mining, smelting and refining costs, the maintenance of machinery and equipment and compliance with laws and regulations require significant capital investments. We must continue to invest capital to maintain or increase the amount of copper reserves that we exploit and the amount of copper and other metals we produce. We cannot assure you that we will be able to maintain our production levels to generate sufficient cash, or that we have access to sufficient financing to continue our exploration, exploitation and refining activities at or above present levels.
Restrictive covenants in the agreements governing our indebtedness and the indebtedness of our Minera Mexico subsidiary may restrict our ability to pursue our business strategies.
Our financing instruments and those of our Minera Mexico subsidiary include financial and other restrictive covenants that, among other things, limit our and Minera Mexico's abilities to incur additional debt and sell assets. If either we or our Minera Mexico subsidiary do not comply with these obligations, we could be in default under the applicable agreements which, if not addressed or waived, could require repayment of the indebtedness immediately. Our Minera Mexico subsidiary is further limited by the terms of its outstanding notes, which also restrict the Company's applicable incurrence of debt and liens. In addition, future credit facilities may contain limitations on our incurrence of additional debt and liens, on our ability to dispose of assets, or on our ability to pay dividends to our common stockholders.
13
We may not pay a significant amount of our net income as cash dividends on our common stock in the future.
We distributed a significant amount of our net income as dividends since 1996 through 2014. Our dividend practice is subject to change at the discretion of our Board of Directors at any time. The amount that we pay in dividends is subject to a number of factors, including our results of operations, financial condition, cash requirements, tax considerations, future prospects, legal restrictions, contractual restrictions in credit agreements, limitations imposed by the government of Peru, Mexico or other countries where we have significant operations and other factors that our Board of Directors may deem relevant. In light of our capital investment program and global economic conditions, it is possible that future dividend distributions will be reduced from the levels of recent years.
Our ability to recognize the benefits of deferred tax assets is dependent on future cash flows and taxable income.
We recognize the expected future tax benefit from deferred tax assets when the tax benefit is considered to be more likely than not of being realized, otherwise, a valuation allowance is applied against deferred tax assets. Assessing the recoverability of deferred tax assets requires management to make significant estimates related to expectations of future taxable income. Estimates of future taxable income are based on forecasted cash flows from operations and the application of existing tax laws in each jurisdiction. To the extent that future cash flows and taxable income differ significantly from estimates, our ability to realize the deferred tax assets could be impacted. In the future, our estimates could change requiring a valuation allowance or impairment of our deferred tax assets. Additionally, future changes in tax laws could limit our ability to obtain the future tax benefits represented by our deferred tax assets.
Operational risks
Our actual reserves may not conform to our current estimates of our ore deposits and we depend on our ability to replenish ore reserves for our long-term viability.
There is a degree of uncertainty attributable to the calculation of reserves. Until reserves are actually mined and processed, the quantity of ore and grades must be considered as estimates only. The proven and probable ore reserves data included in this report are estimates prepared by us based on evaluation methods generally used in the mining industry. We may be required in the future to revise our reserves estimates based on our actual production. We cannot assure you that our actual reserves conform to geological, metallurgical or other expectations or that the estimated volume and grade of ore will be recovered. Market prices of our metals, increased production costs, reduced recovery rates, short-term operating factors, royalty charges and other factors may render proven and probable reserves uneconomic to exploit and may result in revisions of reserves data from time to time. Reserves data are not indicative of future results of operations. Our reserves are depleted as we mine. We depend on our ability to replenish our ore reserves for our long-term viability. We use several strategies to replenish and increase our ore reserves, including exploration and investment in properties located near our existing mine sites and investing in technology that could extend the life of a mine by allowing us to cost-effectively process ore types that were previously considered uneconomic. Acquisitions may also contribute to increase ore reserves and we review potential acquisition opportunities on a regular basis. However, we cannot assure you that we will be able to continue with our strategy to replenish reserves indefinitely.
Our operations are subject to risks, some of which are not insurable.
The business of mining, smelting and refining copper, zinc and other metals is subject to a number of risks and hazards, including industrial accidents, labor disputes, unusual or unexpected geological
14
conditions, changes in the regulatory environment, environmental hazards, weather and other natural phenomena, such as seismic activity. Such occurrences could result in damage to, or destruction of, mining operations resulting in monetary losses and possible legal liability. In particular, surface and underground mining and related processing activities present inherent risks of injury to personnel and damage to equipment. We maintain insurance against many of these and other risks, which in certain circumstances may not provide adequate coverage. Insurance against certain risks, including certain liabilities for environmental damage or hazards as a result of exploration and production, is not generally available to us or other companies within the mining industry. Nevertheless recent environmental legal initiatives have considered future regulations regarding environmental damage insurance. In case such regulations come into force, we will have to analyze the need to obtain such insurance. We do not have, and do not intend to obtain, political risk insurance. These or other uninsured events may adversely affect our financial condition and the results of operations.
Changes in the demand level for our products and copper sales agreements could adversely affect our revenues.
Our financial results are subject to fluctuations on the level of industrial and consumer demand for the refined, semi-refined metal products and concentrates we sell, as well as global economic slow-downs or recessions. Also, changes in technology, industrial processes, concerns over weaknesses in the global economy and consumer habits may affect the level of demand to the extent that those increase or decrease the need for our metal products. Likewise, our revenues could be adversely affected by events of force majeure that could have a negative impact on our sales agreements. These events include acts of nature, labor strikes, fires, floods, wars, transportation delays, government actions or other events that are beyond the control of the parties of the agreement.
Interruptions of energy supply or increases in energy costs, shortages of water supply, critical parts, equipment, skilled labor and other production costs may adversely affect our results of operations.
We require substantial amounts of fuel oil, electricity, water and other resources for our operations. Fuel, gas and power costs constituted approximately 30%, 32% and 35% of our total production cost in 2016, 2015 and 2014, respectively. We rely upon third parties for our supply of the energy resources consumed in our operations so that prices for and availability of energy resources may be subject to change or curtailment, due to, among other things, new laws or regulations, imposition of new taxes or tariffs, interruptions in production by suppliers, worldwide price levels and market conditions. Regarding water consumption, although each operation currently has sufficient water rights to cover its operational demands, the loss of some or all water rights for any of our mines or operations, in whole or in part, or shortages of water to which we have rights could require us to curtail or shut down mining production and could prevent us from pursuing expansion opportunities. In addition, future shortages of critical parts, equipment and skilled labor could adversely affect our operations and development projects.
Our Company is subject to health and safety laws which may restrict our operations, result in operational delays or increase our operating costs and adversely affect our financial results of operations.
We are required to comply with occupational health and safety laws and regulations in Peru and Mexico where our operations are subject to periodic inspections by the relevant governmental authorities. These laws and regulations govern, among others, health and safety work place conditions, including high risk labor and the handling, storage and disposal of chemical and other hazardous substances. We believe our operations are in compliance in all material respects with applicable health and safety laws and regulations in the countries in which we operate. Compliance with these laws and regulations and new or existing regulations that may be applicable to us in the future could increase our operating costs and adversely affect our financial results of operations and cash flows.
15
Our efforts are focused on the health and safety of our workforce in order to consistently improve performance and compliance through the implementation of occupational health programs, adequate training and safety incentives at our operations. Despite the Company's efforts, we are not exempt from accidents. These are reported to Mexican and Peruvian authorities as required. Regarding non-fatal accidents, in the last three years, the Company's Dart rate (rate to measure workplace injuries severe enough to warrant Day Away from work, job Restrictions and/or job Transfers) was much lower than the MSHA Dart rate (the MSHA Dart rate is published by the U.S.'s Mine Safety and Health Administration, and is used as an industry benchmark).
In 2016, 2015 and 2014 we had six, one and eight fatalities, respectively, in Mexico and Peru. The amounts paid to the Mexican and Peruvian authorities for reportable accidents did not have an adverse effect on our results. Under Mexican and Peruvian law penalties and fines for safety violations are generally monetary, but in certain cases may lead to the temporary or permanent shutdown of the affected facility or the suspension or revocation of permits or licenses. Also, violations of security and safety laws and regulations in our Peruvian operations can be considered a crime, punishable with a sentence of up to 10 years of prison.
Our metals exploration efforts are highly speculative in nature and may be unsuccessful.
Metals exploration is highly speculative in nature. It involves many risks and is frequently unsuccessful. Once mineralization is discovered, it may take a number of years from the initial phases of drilling until production is possible, during which time the economic feasibility of production may change. Substantial expenditures are required to establish proven and probable ore reserves through drilling, to determine metallurgical processes to extract the metals from the ore and, in the case of new properties, to construct mining and processing facilities. We cannot assure you that our exploration programs will result in the expansion or replacement of current production with new proven and probable ore reserves.
Development projects have no operating history upon which we can base estimates of proven and probable ore reserves and estimates of future cash operating costs. Estimates are, to a large extent, based upon the interpretation of geological data obtained from drill holes and other sampling techniques, and feasibility studies that derive estimates of cash operating costs based upon anticipated tonnage and grades of ore to be mined and processed, the configuration of the ore body, expected recovery rates of the mineral from the ore, comparable facility and equipment operating costs, anticipated climatic conditions and other factors. As a result, actual cash operating costs and economic returns based upon development of proven and probable ore reserves may differ significantly from those originally estimated. Moreover, significant decreases in actual or expected prices may mean reserves, once found, will be uneconomical to produce.
We may be adversely affected by challenges relating to slope stability.
Our open-pit mines get deeper as we mine them, presenting certain geotechnical challenges including the possibility of slope failure. If we are required to decrease pit slope angles or provide additional road access to prevent such a failure, our stated reserves could be negatively affected. Furthermore, hydrological conditions relating to pit slopes, renewal of material displaced by slope failures and increased stripping requirements could also negatively affect our stated reserves. We have taken actions in order to maintain slope stability, but we cannot assure you that we will not have to take additional action in the future or that our actions taken to date will be sufficient. Unexpected failure or additional requirements to prevent slope failure may negatively affect our results of operations and financial condition, as well as have the effect of diminishing our stated ore reserves.
16
We may be adversely affected by labor disputes.
In the last several years we have experienced a number of strikes or other labor disruptions that have had an adverse impact on our operations and operating results. As of December 31, 2016, unions represented approximately 73.4% of our workforce. Currently, we have labor agreements in effect for our Mexican and Peruvian operations.
Our Taxco and San Martin mines in Mexico have been on strike since July 2007. It is expected that operations at these mines will remain suspended until these labor issues are resolved.
We cannot assure you when these strikes will be settled, or that in the future we will not experience strikes or other labor related work stoppages that could have a material adverse effect on our financial condition and results of operations.
Our mining or metal production projects may be subject to additional costs due to community actions and other factors.
In recent years, worldwide mining activity has been pressured by neighboring communities for financial commitments to fund social benefit programs and infrastructure improvements. Our projects in Peru are not exempt from these pressures. Our Tia Maria project in Peru has experienced delays while trying to resolve issues with community groups.
It appears that it is becoming a part of the Peruvian mining environment that in order to obtain acceptance from local communities for projects in their localities, demands for substantial investments in community infrastructure and upgrades must be met in order to proceed with the mining projects.
We are confident that we will move forward with the Tia Maria project. However, we cannot assure you when and that we will not continue to incur additional costs for community infrastructure and upgrades in order to obtain the approval of current or future mining projects.
Environmental, regulatory response to climate change, and other regulations may increase our costs of doing business, restrict our operations or result in operational delays.
Our exploration, mining, milling, smelting and refining activities are subject to a number of Peruvian and Mexican laws and regulations, including environmental laws and regulations, and certain industry technical standards. Additional matters subject to regulation include, but are not limited to, concession fees, transportation, production, water use and discharge, power use and generation, use and storage of explosives, surface rights, housing and other facilities for workers, reclamation, taxation, labor standards, mine safety and occupational health.
Environmental regulations in Peru and Mexico have become increasingly stringent over the last decade and we have been required to dedicate more time and money to compliance and remediation activities. Furthermore, the Mexican authorities have become more rigorous and strict in enforcing Mexican environmental laws. We expect additional laws and regulations will be enacted over time with respect to environmental matters.
Please refer to Note 13 "Commitments and Contingencies—Environmental matters" of our financial statements for further information on this subject.
The potential physical impacts of climate change on our operations are highly uncertain, and would be particular to the geographic location of our facilities. These may include changes in rainfall patterns, water shortages, changing sea levels, changing storm patterns and intensities, and changing temperatures. These effects may adversely impact the cost, production and financial performance of our operations.
17
We are aware of fluctuations in weather patterns in the areas where we operate. Aligned with government efforts, we are working in measuring its carbon footprint in order to reduce any contribution to greenhouse gases generated by our operations. Similarly, we evaluate our water demand, as weather changes may result in increase/decrease scenarios that affect our needs.
The development of more stringent environmental protection programs in Peru and Mexico and in relevant trade agreements could impose constraints and additional costs on our operations requiring us to make significant investments in the future. We cannot assure you that current or future legislative, regulatory or trade developments will not have an adverse effect on our business, properties, operating results, financial condition or prospects.
Our mining and metal production projects may subject us to new risks.
Our Company is in the midst of a large expansion program, which may subject us to additional risks of industrial accidents. While we believe our contractors employ safety standards and other procedures to ensure these projects are completed with proper governance, it is possible that the increased activity occurring at our sites could cause accidents of an environmental nature or danger to human life.
In August 2014, our new SX-EW plant in Mexico had an industrial accident caused by a rock slide, coupled with a construction defect in the seal of a pipe at the new leaching system containment dam, which caused a spill of copper sulfate solution in to the Bacanuchi River, a tributary of the Sonora River. As a result of this accident the Company absorbed charges of $45.0 million and $91.4 million in its 2015 and 2014 results, respectively. In addition, there are a number of collective action lawsuits and civil action lawsuits, filed against the Company in Mexico´s federal courts and the state courts of Sonora. Also a number of constitutional lawsuits have been filed against various governmental authorities and against the Company. These lawsuits are seeking damages and requesting remedial actions to restore the environment. The Company believes that it is not possible to determine the extent of the damages sought and considers the lawsuits without merit. However the Company cannot offer any assurances that the outcome of these lawsuits will not have an adverse effect on the Company.
While this is an unusual event in the Company's history, we cannot offer assurance that an accident related to our project development program will not occur again in the future and cause environmental damage or damage that causes harm or loss of life.
Our business depends upon information technology systems which may be adversely affected by disruptions, damage, failure and risks associated with implementation and integration.
Our operations depend upon information technology systems which may be subject to disruption, damage or failure from different sources, including, without limitation, installation of malicious software, computer viruses, security breaches, cyber-attacks and defects in design. In recent years, cybersecurity incidents have increased in frequency and include, but are not limited to, malicious software, attempts to gain unauthorized access to data and other electronic security breaches that could lead to disruptions in systems, unauthorized release of confidential or otherwise protected information and the corruption of data. We believe that we have implemented appropriate preventative measures to mitigate potential risks by implementing a certified IT service management system with the necessary controls that are frequently reviewed and tested, including a risk matrix that considers all the possible threats with an impact and probability analysis, actions to avoid or mitigate them and the corresponding testing plan. However, given the unpredictability of the timing, nature and scope of information technology disruptions, we could potentially be subject to manipulation or improper use of our systems and networks, operational delays, the compromising of confidential or otherwise protected information, destruction or corruption of data, security breaches, financial losses from remedial actions, any of which
18
could have a material adverse effect on our cash flows, competitive position, financial condition or results of operations.
Other risks
Applicable law restricts the payment of dividends from our Minera Mexico subsidiary to us.
Our subsidiary, Minera Mexico, is a Mexican company and, as such, may pay dividends only out of net income that has been approved by the shareholders. Shareholders must also approve the actual dividend payment, after mandatory legal reserves have been created and losses for prior fiscal years have been satisfied. These legal constraints may limit the ability of Minera Mexico to pay dividends to us, which in turn, may have an impact on our ability to pay stockholder dividends or to service debt.
In 2014, our management identified a material weakness in our internal control over financial reporting, which could have resulted in material misstatements in our future financial statements and may have adversely affected our business and stock price.
Our management is responsible for establishing and maintaining adequate internal control over financial reporting. In 2014, our management identified a material weakness in our internal control over financial reporting related to ineffective design of processes and procedures to restrict access to key financial systems and records to appropriate users.
A material weakness is a deficiency, or a combination of deficiencies, in internal control over financial reporting, such that there is a reasonable possibility that a material misstatement in our annual or interim financial statements will not be prevented or detected on a timely basis. As a result of the material weakness discussed above, our management concluded that our internal control over financial reporting was not effective as of December 31, 2014.
Although we have remedied the ineffectiveness of our internal control over financial reporting, we cannot assure you that an additional material weakness may not occur in the future.
Global and local market conditions, including the high competitiveness in the copper mining industry, may adversely affect our profitability.
Our industry is cyclical by nature and fluctuates with economic cycles. Therefore, we are subject to the risks arising from adverse changes in domestic and global economic and political conditions, such as lower levels of consumer and corporate confidence, decreased business investment, increased unemployment, reduced income and asset values in many areas, currency volatility and limited availability of credit and access to capital. Additionally, we face competition from other copper mining and producing companies around the world; significant competition exists to acquire properties producing or capable of producing copper and other metals as well as consolidation among some of our main competitors that make them more diversified than we are.
We cannot assure you that changes in market conditions, including competition, will not adversely affect us to compete in the future on the basis of price or other factors with companies that may benefit from future favorable trading or other arrangements.
We are controlled by Grupo Mexico, which exercises control over our affairs and policies and whose interests may be different from yours.
At December 31, 2016, Grupo Mexico owned indirectly 88.9% of our capital stock. Certain of our and Minera Mexico's officers and directors are also directors and/or officers of Grupo Mexico and/or of its affiliates. We cannot assure you that the interests of Grupo Mexico will not conflict with our minority stockholders.
19
Grupo Mexico has the ability to determine the outcome of substantially all matters submitted for a vote to our stockholders and thus exercises control over our business policies and affairs, including the following:
- •
- the composition of our Board of Directors and, as a result, any determinations of our Board with respect to our business direction and policy,
including the appointment and removal of our officers;
- •
- determinations with respect to mergers and other business combinations, including those that may result in a change of control;
- •
- whether dividends are paid or other distributions are made and the amount of any dividends or other distributions;
- •
- sales and dispositions of our assets;
- •
- the amount of debt financing that we incur; and
- •
- the approval of capital projects.
We cannot assure you that increased financial obligations of Grupo Mexico or AMC resulting from financings or for other reasons will not result in our parent corporations obtaining loans, increased dividends or other funding from us.
In addition, we have in the past engaged in, and expect to continue to engage in, transactions with Grupo Mexico and its other affiliates which are related party transactions and may present conflicts of interest. For additional information regarding the share ownership of, and our relationships with, Grupo Mexico and its affiliates, see Note 17 "Related Party Transactions."
Unanticipated litigation or negative developments in pending litigation or with respect to other contingencies may adversely affect our financial condition and results of operations.
We are currently, and may in the future become, subject to litigation, arbitration or other legal proceedings with other parties. If decided adversely to the Company, these legal proceedings, or others that could be brought against us in the future, may adversely affect our financial position or prospects. For further detailed discussion of pending litigation, please see Note 13 "Commitment and Contingencies—Litigation matters".
International Risks
We are a company with substantial assets located outside of the United States. We conduct production operations in Peru and Mexico and exploration activities in these countries as well as in Chile, Argentina and Ecuador. Accordingly, in addition to the usual risks associated with conducting business in foreign countries, our business may be adversely affected by political, economic and social uncertainties in each of these countries. Such risks include possible expropriation or nationalization of property, confiscatory taxes or royalties, possible foreign exchange controls, changes in the national policy toward foreign investors, extreme environmental standards, etc.
Our insurance does not cover most losses caused by the above described risks. Consequently, our production, development and exploration activities in these countries could be substantially affected by factors out of control, some of which could materially and adversely affect our financial position or results of operations.
20
Risks Associated with Doing Business in Peru and Mexico
There is uncertainty as to the termination and renewal of our mining concessions.
Under the laws of Peru and Mexico, mineral resources belong to the state and government and concessions are required in both countries to explore for or exploit mineral reserves. In Peru, our mineral rights derive from concessions from Ministry of Energy and Mines ("MINEM") for our exploration, exploitation, extraction and/or production operations. In Mexico, our mineral rights derive from concessions granted, on a discretionary basis, by the Ministry of Economy, pursuant to Mexican mining law and regulations thereunder.
Mining concessions in both Peru and Mexico may be terminated if the obligations of the concessioner are not satisfied. In Peru, we are obligated to pay certain fees for our mining concession. In Mexico, we are obligated, among other things, to explore or exploit the relevant concession, to pay any relevant fees, to comply with all environmental and safety standards, to provide information to the Ministry of Economy and to allow inspections by the Ministry of Economy. Any termination or unfavorable modification of the terms of one or more of our concessions, or failure to obtain renewals of such concessions subject to renewal or extensions, could have a material adverse effect on our financial condition and prospects.
Peruvian economic and political conditions may have an adverse impact on our business.
A significant part of our operations are conducted in Peru. Accordingly, our business, financial condition or results of operations could be affected by changes in economic or other policies of the Peruvian government or other political, regulatory or economic developments in the country. During the past several decades, Peru has had a succession of regimes with differing policies and programs. Past governments have frequently intervened in the nation's economy and social structure. Among other actions, past governments have imposed controls on prices, exchange rates and local and foreign investments, as well as limitations on imports, have restricted the ability of companies to dismiss employees and have prohibited the remittance of profits to foreign investors.
In more recent years Peru has had political and social stability. The Peruvian government's economic policies reduced inflation and the Peruvian economy has experienced significant growth.
Because we have significant operations in Peru, we cannot provide any assurance that political developments and economic conditions in Peru and/or other factors will not have a material adverse effect on market conditions, prices of our securities, our ability to obtain financing and our results of operations and financial condition.
Mexican economic and political conditions, as well as drug-related violence, may have an adverse impact on our business.
The Mexican economy is highly sensitive to economic developments in the United States, mainly because of its high level of exports to this market. In the last quarter of 2015, the international economy was affected by a general appreciation of the U.S. dollar that was caused by the difference between the growth rhythm and the expectations on the monetary position of the United States regarding the main advanced economies and the majority of emerging economies. Accordingly, the Bank of Mexico expects higher growth in 2016 due to the improved dynamism of the U.S. economy. Gross domestic product grew by 2.5% in 2015, 2.3 in 2016 and is expected to grow between 1.5% and 2.5% in 2017. Other risks in Mexico are increases in taxes on the mining sector and higher royalties. As has occurred in other metal producing countries, the mining industry may be perceived as a source of additional fiscal revenue.
In addition, security institutions in Mexico are under significant stress, as a result of drug-related violence. This situation creates potential risks especially for transportation of minerals and finished
21
products, which affect a small part of our production. However, drug-related violence has had a limited impact on our operations as it has tended to concentrate outside our areas of production. If this were to change, the potential risks to our operations might increase.
Because we have significant operations in Mexico, we cannot provide any assurance that political developments and economic conditions as well as drug-related violence, in Mexico will not have a material adverse effect on market conditions, prices of our securities, on our ability to obtain financing, and on our results of operations and financial condition.
Peruvian inflation and fluctuations in the sol exchange rate may adversely affect our financial condition and results of operations.
Although the U.S. dollar is our functional currency and our revenues are primarily denominated in U.S. dollars, due to the countries we operate, portions of our operating costs are denominated in Peruvian soles. Accordingly, when inflation or deflation in Peru is not offset by a change in the exchange rate of the sol, our financial position, results of operations, cash flows and the market price of our common stock could be affected.
Over the past several years, Peru has experienced one of its best economic periods. Inflation in 2016, 2015 and 2014 was 3.2%, 4.4% and 3.2%, respectively. The value of the sol has appreciated against the U.S. dollar 1.6% in 2016, and it has depreciated 14.2% in 2015, and 6.9% in 2014. Although the Peruvian government's economic policy reduced inflation and the economy has experienced significant growth in recent years, we cannot assure you that inflation will not increase from its current level or that such growth will continue in the future at similar rates or at all. Additionally a global financial economic crisis, could negatively affect the Peruvian economy.
To manage the volatility related to the risk of currency rate fluctuations, we may enter into forward exchange contracts. We cannot assure you, however, that currency fluctuations will not have an impact on our financial condition and results of operations.
Mexican inflation, restrictive exchange control policies and fluctuations in the peso exchange rate may adversely affect our financial condition and results of operations.
Although all of our Mexican operations' sales of metals are priced and invoiced in U.S. dollars, a substantial portion of its costs are denominated in pesos. Accordingly, when inflation in Mexico increases without a corresponding depreciation of the peso, the net income generated by our Mexican operations is adversely affected. The annual inflation rate in Mexico was 3.4% in 2016, 2.1% in 2015 and 4.1% in 2014. The Bank of Mexico expects inflation in 2017 to be above the publicly announced target of 3%.
At the same time, the peso has been subject in the past to significant volatility, which may not have been proportionate to the inflation rate and may not be proportionate to the inflation rate in the future. The value of the peso to the U.S. dollar decreased by 20.1% in 2016, 16.9% in 2015, and 12.6% in 2014.
The Mexican government does not currently restrict the ability of Mexican companies or individuals to convert pesos into dollars or other currencies. While we do not expect the Mexican government to impose any restriction or exchange control policies in the future, it is an area we closely monitor. We cannot assure you the Mexican government will maintain its current policies with regard to the peso or that the peso's value will not fluctuate significantly in the future. The imposition of exchange control policies could impair Minera Mexico's ability to obtain imported goods and to meet its U.S. dollar-denominated obligations and could have an adverse effect on our business and financial condition.
22
Developments in the United States, Europe and emerging market countries and may adversely affect the Company business, our common stock price and our debt securities.
The business and market value of securities of companies with significant operations in Peru and Mexico is, to varying degrees, affected by the economic policies and market conditions in the United States, Europe and emerging market countries. Although economic policies and conditions in such countries may significantly differ from economic conditions in Peru or Mexico, as the case may be, the business community reactions to developments in any of these countries may adversely effect the Company business or the market value or trading price of the securities, including debt securities, of issuers that have significant operations in Peru or Mexico.
In addition, in recent years economic conditions in Mexico have increasingly become correlated to U.S. economic conditions. Therefore, changes in economic policies and conditions in the United States could also have a significant adverse effect on Mexican economic conditions, affecting our business, the price of our common stock or debt securities.
We cannot assure you that the market value or trading prices of our common stock and debt securities, will not be adversely affected by events in the United States or elsewhere, including in emerging market countries.
ITEM 1B. UNRESOLVED STAFF COMMENTS
None.
23
We were incorporated in Delaware in 1952. Our corporate offices in the United States are located at 1440 East Missouri Avenue Suite 160, Phoenix, Arizona 85014. Our Phoenix telephone number is (602) 264-1375. Our corporate offices in Mexico are located in Mexico City and our corporate offices in Peru are located in Lima. Our website is www.southerncoppercorp.com. We believe that our existing properties are in good condition and suitable for the conduct of our business.
REVIEW OF OPERATIONS
The following maps set forth the locations of our principal mines, smelting facilities and refineries. We operate open-pit copper mines in the southern part of Peru—at Toquepala and Cuajone—and in Mexico, at La Caridad and Buenavista. We also operate five underground mines that produce zinc, copper, silver and gold, as well as a coal mine and a coke oven.
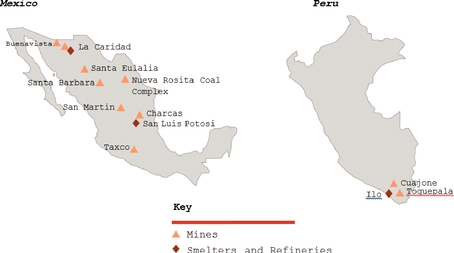
EXTRACTION, SMELTING AND REFINING PROCESSES
Our operations include open-pit and underground mining, concentrating, copper smelting, copper refining, copper rod production, solvent extraction/electrowinning ("SX-EW"), zinc refining, sulfuric acid production, molybdenum concentrate production and silver and gold refining. The extraction and production process are summarized below.
OPEN-PIT MINING
In an open-pit mine, the production process begins at the mine pit, where waste rock, leaching ore and copper ore are drilled and blasted and then loaded onto diesel-electric trucks by electric shovels. Waste is hauled to dump areas and leaching ore is hauled to leaching dumps. The ore to be milled is transported to the primary crushers.
UNDERGROUND MINING
In an underground mine, the production process begins at the stopes, where copper, zinc and lead veins are drilled and blasted and the ore is hauled to the underground crusher station. The crushed ore is then hoisted to the surface for processing.
CONCENTRATING
The copper ore with a copper grade over 0.4% from the primary crusher or the copper, zinc and lead-bearing ore from the underground mines is transported to a concentrator plant where gyratory
24
crushers break the ore into sizes no larger than three-quarter of an inch. The ore is then sent to a mill section where it is ground to the consistency of fine powder. The finely ground ore is mixed with water and chemical reagents and pumped as a slurry to the flotation separator where it is mixed with certain chemicals. In the flotation separator, reagent solutions and air pumped into the flotation cells cause the minerals to separate from the waste rock and bubble to the surface where they are collected and dried.
If the bulk concentrated copper contains molybdenum, it is first processed in a molybdenum plant as described below under "Molybdenum Production."
COPPER SMELTING
Copper concentrates are transported to a smelter, where they are smelted using a furnace, converter and anode furnace to produce either blister copper (which is in the form of cakes with air pockets) or copper anodes (which are cleaned of air pockets). At the smelter, the concentrates are mixed with flux (a chemical substance intentionally included for high temperature processing) and then sent to reverberatory furnaces producing copper matte and slag (a mixture of iron and other impurities). Copper matte contains approximately 65% copper. Copper matte is then sent to the converters, where the material is oxidized in two steps: (i) the iron sulfides in the matte are oxidized with silica, producing slag that is returned to the reverberatory furnaces, and (ii) the copper contained in the matte sulfides is then oxidized to produce copper that, after casting, is called blister copper, containing approximately 98% to 99% copper, or anodes, containing approximately 99.7% copper. Most of the blister and anode production is sent to the refinery and the remainder is sold to customers.
COPPER REFINING
Anodes are suspended in tanks with a solution containing water, sulfuric acid and copper sulfate. A weak electrical current is passed through the anodes and chemical solution and the dissolved copper is deposited on very thin starting sheets to produce copper cathodes containing approximately 99.99% copper. During this process, silver, gold and other metals (for example, palladium, platinum and selenium), along with other impurities, settle on the bottom of the tank (anodic muds). This anodic mud is processed at a precious metal plant where selenium, silver and gold are recovered.
COPPER ROD PLANT
To produce copper rod, copper cathodes are first smelted in a furnace and then dosified in a casting machine. The dosified copper is then extruded and passed through a cooling system that begins solidification of copper into a 60×50 millimeter copper bar. The resulting copper bar is gradually stretched in a rolling mill to achieve the desired diameter. The rolled bar is then cooled and sprayed with wax as a preservation agent and collected into a rod coil that is compacted and sent to market.
SOLVENT EXTRACTION/ELECTROWINNING ("SX-EW")
A complementary processing method is the leaching and SX-EW process. During the SX-EW process, low-grade sulfides ore and copper oxides are leached with sulfuric acid to allow copper content recovery. The acid and copper solution is then agitated with a solvent that contains chemical additives that attract copper ions. As the solvent is lighter than water, it floats to the surface carrying with it the copper content. The solvent is then separated using an acid solution, freeing the copper. The acid solution containing the copper is then moved to electrolytic extraction tanks to produce copper cathodes.
MOLYBDENUM PRODUCTION
Molybdenum is recovered from copper-molybdenum concentrates produced at the concentrator. The copper-molybdenum concentrate is first treated with a thickener until it becomes slurry with 60%
25
solids. The slurry is then agitated in a chemical and water solution and pumped to the flotation separator. The separator creates a froth that carries molybdenum to the surface but not the copper mineral (which is later filtered to produce copper concentrates containing approximately 27% copper). The molybdenum froth is skimmed off, filtered and dried to produce molybdenum concentrates of approximately 58% contained molybdenum.
ZINC REFINING
Metallic zinc is produced through electrolysis using zinc concentrates and zinc oxides. Sulfur is eliminated from the concentrates by roasting and the zinc oxide is dissolved in sulfuric acid solution to eliminate solid impurities. The purified zinc sulfide solution is treated by electrolysis to produce refined zinc and to separate silver and gold, which are recovered as concentrates.
SULFURIC ACID PRODUCTION
Sulfur dioxide gases are produced in the copper smelting and zinc roasting processes. As a part of our environmental preservation program, we treat the sulfur dioxide emissions at two of our Mexican plants and at our Peruvian processing facilities to produce sulfuric acid, some of which is, in turn, used for the copper leaching process, with the balance sold to mining and fertilizer companies located principally in Mexico, Peru, United States and Chile.
SILVER AND GOLD REFINING
Silver and gold are recovered from copper, zinc and lead concentrates in the smelters and refineries, and from slimes through electrolytic refining.
KEY PRODUCTION CAPACITY DATA
All production facilities are owned by us. The following table sets forth as of December 31, 2016, the locations of production facilities by reportable segment, the processes used, as well as the key production and capacity data for each location:
Facility Name
|
Location | Process | Nominal Capacity(1) | 2016 Production |
2016 Capacity Use(4) |
||||||||
|---|---|---|---|---|---|---|---|---|---|---|---|---|---|
PERUVIAN OPEN-PIT UNIT |
|||||||||||||
Mining Operations |
|
|
|
||||||||||
Cuajone open-pit mine |
Cuajone (Peru) | Copper ore milling and recovery, copper and molybdenum concentrate production | 90.0 ktpd—ore milled | 85.8 | 95.4 | % | |||||||
Toquepala open-pit mine |
Toquepala (Peru) | Copper ore milling and recovery, copper and molybdenum concentrate production | 60.0 ktpd—ore milled | 55.8 | 92.9 | % | |||||||
Toquepala SX-EW plant |
Toquepala (Peru) | Leaching, solvent extraction and cathode electrowinning | 56.0 ktpy—refined | 24.9 | 44.4 | % | |||||||
Processing Operations |
|
|
|
||||||||||
Ilo copper smelter |
Ilo (Peru) | Copper smelting, blister, anodes production | 1,200.0 ktpy—concentrate feed | 1,070.6 | 89.2 | % | |||||||
Ilo copper refinery |
Ilo (Peru) | Copper refining | 280 ktpy—refined cathodes | 270.2 | 96.5 | % | |||||||
Ilo acid plants |
Ilo (Peru) | Sulfuric acid | 1,050 ktpy—sulfuric acid | 1,036.3 | 98.7 | % | |||||||
26
Facility Name
|
Location | Process | Nominal Capacity(1) | 2016 Production |
2016 Capacity Use(4) |
||||||||
|---|---|---|---|---|---|---|---|---|---|---|---|---|---|
Ilo precious metals refinery |
Ilo (Peru) | Slime recovery & processing, gold & silver refining | 320 tpy | 347.2 | 108.5 | % | |||||||
|
|||||||||||||
Mining Operations |
|
|
|
||||||||||
Buenavista open-pit mine Concentrator 1 |
Sonora (Mexico) | Copper ore milling & recovery, copper concentrate production | 82.0 ktpd—milling | 81.6 | 99.5 | % | |||||||
Buenavista open-pit mine Concentrator 2 |
Sonora (Mexico) | Copper ore milling & recovery, copper concentrate production | 100.0 ktpd—milling | 99.0 | 99.0 | % | |||||||
Buenavista SX-EW I plant |
Sonora (Mexico) | Leaching, solvent extraction & refined cathode electrowinning | 11.0 ktpy—refined | 5.6 | 50.9 | % | |||||||
Buenavista SX-EW II plant |
Sonora (Mexico) | Leaching, solvent extraction & refined cathode electrowinning | 43.8 ktpy—refined | 22.1 | 50.5 | % | |||||||
Buenavista SX-EW III plant |
Sonora (Mexico) | Leaching, solvent extraction & refined cathode electrowinning | 120.0 ktpy—refined | 102.8 | 85.7 | % | |||||||
La Caridad open-pit mine |
Sonora (Mexico) | Copper ore milling & recovery, copper & molybdenum concentrate production | 94.5 ktpd—milling | 94.4 | 99.9 | % | |||||||
La Caridad SX-EW plant |
Sonora (Mexico) | Leaching, solvent extraction & cathode electrowinning | 21.9 ktpy—refined | 28.3 | 129.3 | % | |||||||
Processing Operations |
|
|
|
||||||||||
La Caridad copper smelter |
Sonora (Mexico) | Concentrate smelting, anode production | 1,000 ktpy—concentrate feed | 1,008 | 100.5 | % | |||||||
La Caridad copper refinery |
Sonora (Mexico) | Copper refining | 300 ktpy copper cathode | 224.2 | 74.7 | % | |||||||
La Caridad copper rod plant |
Sonora (Mexico) | Copper rod production | 150 ktpy copper rod | 144.5 | 96.3 | % | |||||||
La Caridad precious metals refinery |
Sonora (Mexico) | Slime recovery & processing, gold & silver refining | 1.8 ktpy—slime | 1.1 | 59.4 | % | |||||||
La Caridad sulfuric acid plant |
Sonora (Mexico) | Sulfuric acid | 1,565.5 ktpy—sulfuric acid | 1,007.9 | 64.4 | % | |||||||
IMMSA UNIT |
|
|
|
||||||||||
Underground mines |
|
|
|
||||||||||
Charcas |
San Luis Potosi (Mexico) | Copper, zinc, lead milling, recovery & concentrate production | 1,460 ktpy—ore milled | 1,229.2 | 84.2 | % | |||||||
San Martin(2) |
Zacatecas (Mexico) | Lead, zinc, copper & silver mining, milling recovery & concentrate production | 1,606 ktpy—ore milled | — | 0 | % | |||||||
27
Facility Name
|
Location | Process | Nominal Capacity(1) | 2016 Production |
2016 Capacity Use(4) |
||||||||
|---|---|---|---|---|---|---|---|---|---|---|---|---|---|
Santa Barbara |
Chihuahua (Mexico) | Lead, copper and zinc mining & concentrates production | 2,190 ktpy—ore milled | 1,524.5 | 69.6 | % | |||||||
Santa Eulalia |
Chihuahua (Mexico) | Lead & zinc mining and milling recovery & concentrate production | 547.5 ktpy—ore milled | 278.2 | 50.8 | % | |||||||
Taxco(2) |
Guerrero (Mexico) | Lead, zinc silver & gold mining recovery & concentrate production | 730 ktpy—ore milled | — | 0 | % | |||||||
Nueva Rosita coal & coke complex(3) |
Coahuila (Mexico) | Clean coal production | 900 ktpy clean coal | 86.2 | 9.6 | % | |||||||
|
100 ktpy coke | 71.7 | 71.7 | % | |||||||||
Processing Operations |
|
|
|
||||||||||
San Luis Potosi zinc refinery |
San Luis Potosi (Mexico) | Zinc concentrates refining | 105.0 ktpy zinc cathode | 106.1 | 101.0 | % | |||||||
San Luis Potosi sulfuric acid plant |
San Luis Potosi (Mexico) | Sulfuric acid | 180.0 ktpy sulfuric acid | 181.3 | 100.7 | % | |||||||
ktpd = thousands of tons per day
ktpy = thousands of tons per year
Tpy = tons per year
- (1)
- Our
estimates of actual capacity under normal operating conditions with allowance for normal downtime for repairs and maintenance and based on the average metal
content for the relevant period.
- (2)
- The
Taxco and San Martin mines have been on strike since July 2007.
- (3)
- At
December 31, 2016, the coal reserves for the Nueva Rosita coal plant were 95.1 million tons with average sulfur content of 1.03% and a BTU content
of 8,501 per pound.
- (4)
- In some cases, real production exceeds the nominal capacity due to higher grades and recovery rates.
28
PROPERTY BOOK VALUE
At December 31, 2016, net book values of property are as follows (in millions):
Peruvian operations: |
||||
Cuajone |
$ | 473.8 | ||
Toquepala |
897.3 | |||
Tia Maria project |
363.5 | |||
Ilo and other support facilities |
600.1 | |||
Construction in progress |
994.9 | |||
| | | | | |
Total |
$ | 3,329.6 | ||
| | | | | |
Mexican open-pit operations: |
||||
Buenavista |
$ | 3,522.1 | ||
La Caridad |
840.2 | |||
Construction in progress |
408.3 | |||
| | | | | |
Total |
$ | 4,770.6 | ||
| | | | | |
Mexican IMMSA unit: |
||||
San Luis Potosi |
$ | 97.3 | ||
Zinc electrolytic refinery |
85.6 | |||
Charcas |
58.7 | |||
San Martin |
25.2 | |||
Santa Barbara |
65.4 | |||
Taxco |
2.7 | |||
Santa Eulalia |
32.1 | |||
Nueva Rosita |
16.1 | |||
Construction in progress and other facilities |
65.6 | |||
| | | | | |
Total |
$ | 448.7 | ||
| | | | | |
Other property: |
||||
El Pilar |
$ | 86.7 | ||
Mexicana del Arco |
42.7 | |||
| | | | | |
Total |
$ | 129.4 | ||
| | | | | |
Mexican administrative offices |
$ | 88.2 | ||
Total Southern Copper Corporation |
$ |
8,766.5 |
||
| | | | | |
| | | | | |
| | | | | |
29
SUMMARY OPERATING DATA
The following table sets out certain operating data underlying our financial and operating information for each of the periods indicated.
| |
Year Ended December 31, | Variance | ||||||||||||||||||||
|---|---|---|---|---|---|---|---|---|---|---|---|---|---|---|---|---|---|---|---|---|---|---|
| |
|
|
|
2016 - 2015 | 2015 - 2014 | |||||||||||||||||
| |
2016 | 2015 | 2014 | Volume | % | Volume | % | |||||||||||||||
COPPER (thousand pounds): |
||||||||||||||||||||||
Mined |
||||||||||||||||||||||
Peru open-pit |
||||||||||||||||||||||
Toquepala |
256,894 | 263,291 | 253,152 | (6,397 | ) | (2.4 | )% | 10,139 | 4.0 | % | ||||||||||||
Cuajone |
377,978 | 392,835 | 393,165 | (14,857 | ) | (3.8 | )% | (330 | ) | (0.1 | )% | |||||||||||
SX-EW Toquepala |
54,851 | 53,279 | 56,604 | 1,572 | 3.0 | % | (3,325 | ) | (5.9 | )% | ||||||||||||
Mexico open-pit |
||||||||||||||||||||||
La Caridad |
231,373 | 228,974 | 222,803 | 2,399 | 1.0 | % | 6,171 | 2.8 | % | |||||||||||||
Buenavista |
696,681 | 357,157 | 292,890 | 339,524 | 95.1 | % | 64,267 | 21.9 | % | |||||||||||||
SX-EW La Caridad |
62,406 | 59,883 | 55,583 | 2,523 | 4.2 | % | 4,300 | 7.7 | % | |||||||||||||
SX-EW Buenavista |
289,705 | 270,268 | 205,957 | 19,437 | 7.2 | % | 64,311 | 31.2 | % | |||||||||||||
IMMSA unit |
14,171 |
12,330 |
11,488 |
1,841 |
14.9 |
% |
842 |
7.3 |
% |
|||||||||||||
| | | | | | | | | | | | | | | | | | | | | | | |
Total Mined |
1,984,059 | 1,638,017 | 1,491,642 | 346,042 | 21.1 | % | 146,375 | 9.8 | % | |||||||||||||
| | | | | | | | | | | | | | | | | | | | | | | |
Smelted |
||||||||||||||||||||||
Peru open-pit |
||||||||||||||||||||||
Blister Ilo |
2,048 | 6,174 | — | (4,126 | ) | (66.8 | )% | 6,174 | N/A | |||||||||||||
Anodes Ilo |
711,137 | 747,131 | 670,069 | (35,994 | ) | (4.8 | )% | 77,062 | 11.5 | % | ||||||||||||
Mexico open-pit |
||||||||||||||||||||||
Anodes La Caridad |
590,492 | 564,938 | 568,793 | 25,554 | 4.5 | % | (3,855 | ) | (0.7 | )% | ||||||||||||
| | | | | | | | | | | | | | | | | | | | | | | |
Total Smelted |
1,303,677 | 1,318,243 | 1,238,862 | (14,556 | ) | (1.1 | )% | 79,381 | 6.4 | % | ||||||||||||
| | | | | | | | | | | | | | | | | | | | | | | |
Refined |
||||||||||||||||||||||
Peru Open-pit |
||||||||||||||||||||||
Cathodes Ilo |
595,652 | 618,587 | 568,619 | (22,935 | ) | (3.7 | )% | 49,968 | 8.8 | % | ||||||||||||
SX-EW Toquepala |
54,851 | 53,279 | 56,604 | 1,572 | 3.0 | % | (3,325 | ) | (5.9 | )% | ||||||||||||
Mexico Open-pit |
||||||||||||||||||||||
Cathodes La Caridad |
494,175 | 470,369 | 450,401 | 23,806 | 5.1 | % | 19,968 | 4.4 | % | |||||||||||||
SX-EW La Caridad |
62,406 | 59,883 | 55,583 | 2,523 | 4.2 | % | 4,300 | 7.7 | % | |||||||||||||
SX-EW Buenavista |
289,705 | 270,268 | 205,957 | 19,437 | 7.2 | % | 64,311 | 31.2 | % | |||||||||||||
| | | | | | | | | | | | | | | | | | | | | | | |
Total Refined |
1,496,789 | 1,472,386 | 1,337,164 | 24,403 | 1.7 | % | 135,222 | 10.1 | % | |||||||||||||
| | | | | | | | | | | | | | | | | | | | | | | |
Rod Mexico Open-pit—La Caridad |
318,604 | 304,634 | 284,569 | 13,970 | 4.6 | % | 20,065 | 7.1 | % | |||||||||||||
| | | | | | | | | | | | | | | | | | | | | | | |
SILVER (thousand ounces) |
||||||||||||||||||||||
Mined |
||||||||||||||||||||||
Peru Open-pit |
||||||||||||||||||||||
Toquepala |
1,586 | 1,613 | 1,435 | (27 | ) | (1.7 | )% | 178 | 12.4 | % | ||||||||||||
Cuajone |
2,178 | 2,269 | 2,588 | (91 | ) | (4.0 | )% | (319 | ) | (12.3 | )% | |||||||||||
Mexico Open-pit |
||||||||||||||||||||||
La Caridad |
1,967 | 2,044 | 2,000 | (77 | ) | (3.8 | )% | 44 | 2.2 | % | ||||||||||||
Buenavista |
4,819 | 2,367 | 2,024 | 2,452 | 103.5 | % | 343 | 17.0 | % | |||||||||||||
IMMSA unit |
5,622 |
4,995 |
4,945 |
627 |
12.6 |
% |
50 |
1.0 |
% |
|||||||||||||
| | | | | | | | | | | | | | | | | | | | | | | |
Total Mined |
16,172 | 13,288 | 12,992 | 2,884 | 21.7 | % | 296 | 2.3 | % | |||||||||||||
| | | | | | | | | | | | | | | | | | | | | | | |
30
| |
Year Ended December 31, | Variance | ||||||||||||||||||||
|---|---|---|---|---|---|---|---|---|---|---|---|---|---|---|---|---|---|---|---|---|---|---|
| |
|
|
|
2016 - 2015 | 2015 - 2014 | |||||||||||||||||
| |
2016 | 2015 | 2014 | Volume | % | Volume | % | |||||||||||||||
Refined |
||||||||||||||||||||||
Peru—Ilo |
3,295 | 3,408 | 3,479 | (113 | ) | (3.3 | )% | (71 | ) | (2.0 | )% | |||||||||||
Mexico—La Caridad |
8,260 | 7,659 | 7,237 | 601 | 7.9 | % | 422 | 5.8 | % | |||||||||||||
IMMSA unit |
3,641 | 2,571 | 2,632 | 1,070 | 41.6 | % | (61 | ) | (2.3 | )% | ||||||||||||
| | | | | | | | | | | | | | | | | | | | | | | |
Total Refined |
15,196 | 13,638 | 13,348 | 1,558 | 11.4 | % | 290 | 2.2 | % | |||||||||||||
| | | | | | | | | | | | | | | | | | | | | | | |
| | | | | | | | | | | | | | | | | | | | | | | |
| | | | | | | | | | | | | | | | | | | | | | | |
MOLYBDENUM (thousand pounds) |
||||||||||||||||||||||
Mined |
||||||||||||||||||||||
Toquepala |
13,942 | 17,469 | 13,448 | (3,527 | ) | (20.2 | )% | 4,021 | 29.9 | % | ||||||||||||
Cuajone |
8,655 | 9,797 | 8,821 | (1,142 | ) | (11.7 | )% | 976 | 11.1 | % | ||||||||||||
Buenavista |
3,472 | 2,071 | 4,893 | 1,401 | 67.7 | % | (2,822 | ) | (57.7 | )% | ||||||||||||
La Caridad |
21,850 | 22,136 | 23,810 | (286 | ) | (1.3 | )% | (1,674 | ) | (7.0 | )% | |||||||||||
| | | | | | | | | | | | | | | | | | | | | | | |
Total Mined |
47,919 | 51,473 | 50,972 | (3,554 | ) | (6.9 | )% | 501 | 1.0 | % | ||||||||||||
| | | | | | | | | | | | | | | | | | | | | | | |
| | | | | | | | | | | | | | | | | | | | | | | |
| | | | | | | | | | | | | | | | | | | | | | | |
ZINC (thousand pounds) |
||||||||||||||||||||||
Mined IMMSA |
163,107 | 136,447 | 146,859 | 26,630 | 19.5 | % | (10,382 | ) | (7.1 | )% | ||||||||||||
Refined IMMSA |
233,894 | 221,732 | 203,118 | 12,162 | 5.5 | % | 18,614 | 9.2 | % | |||||||||||||
SLOPE STABILITY:
Peruvian Operations
The Toquepala and Cuajone pits are approximately 825 meters and 930 meters deep, respectively. Under the present mine plan configuration the Toquepala pit will reach a depth of 1,635 meters and the Cuajone pit will reach a depth of 1,290 meters. The deepening pits present us with a number of geotechnical challenges. Perhaps the foremost concern is the possibility of slope failure, a possibility that all open-pit mines face. In the past, in order to maintain slope stability, we have decreased pit slope angles, installed additional or duplicate haul road access, and increased stripping requirements. We have also responded to hydrological conditions and removed material displaced by slope failures. To meet the geotechnical challenges relating to slope stability of the open-pit mines, we have taken the following steps:
In the late 1990s, we hosted round table meetings in Vancouver, B.C. with a group of recognized slope stability and open-pit mining specialists. The agenda for these meetings was principally a review of pit design for mines with greater than 700 meter depth. The discussions included practices for monitoring, data collection and blasting processes.
Based on the concepts defined at the Vancouver meetings, we initiated slope stability studies to define the mining of reserves by optimum design. These studies were performed by outside consultants and included slope stability appraisals, evaluation of the numerical modeling, slope performance and inter-ramp angle design and evaluation of hydrological conditions.
The studies were completed in 2000 and we believe we implemented the study recommendations. One of the major changes implemented was slope angle reduction at both mines, at Toquepala by an average of five degrees and at Cuajone by an average of seven degrees. Although this increased the waste included in the mineable reserve calculation, it also improved the stability of the pits.
Since 1998, a wall depressurization program has been in place in both pits. This consists of a horizontal drilling program, which improves drainage thereby reducing saturation and increasing wall stability. Additionally, a new blasting control program was put in place, implementing vibration monitoring and blasting designs of low punctual energy and pre-split techniques. Also a new slope
31
monitoring system was implemented using reflection prisms, deformation inclinometers and piezometers for water level control, as well as real-time robotic monitoring equipment.
Toquepala:
In 2007, we installed 20 meter wide geotechnical berms every 10 benches at the Toquepala mine. We believe this will further strengthen the stability of the Toquepala pit. In October 2012, two interferometric radars were put in place to monitor slope stability at the Toquepala mine, and in September 2013, new full monitoring software (FMS360) was installed. These systems improve the reliability of instrumentation, the information quality for assessing the behavior of the slopes and anticipates the risks of instability.
In 2013, a mining consulting group began a study of dump stability at the Toquepala mine. This study assessed the current stability of the dumps and is developing a geotechnical campaign to obtain information to assess the stability of the future and final stages of the dumps. In 2016, the stability study was resumed by executing geophysical test and test pits for the characterization of the dumps. The execution of sonic perforations and complementary geophysical tests are currently pending. On December 2016, The consultants also presented the report "Slope Stability Analysis in Deposits of Waste and Leachable Material".
In 2016, the mining consultants presented the final report "Physical Stability of the Quebrada Honda tailings dam". This study consisted in the development of geotechnical investigations, static, seismic and post-seismic stability analysis, filtration analysis, deformation analysis, liquefaction potential analysis and dynamic analysis.
In 2016, as part of the slope stability upgrade study, a geotechnical and hydrological oriented drill program of 3,470 meters was executed at the Toquepala mine. This program was conducted in order to complement the study and to get a better understanding of the behavior of the rock mass. The geotechnical drilling program involved 11 diamond drill holes, six geotechnical drills and five hydrogeological drills, all of them with geological and geotechnical logging. During the execution of these hydrogeological drills, permeability tests in the rock were executed as well as slug tests and constant load tests. Additionally, instrumentation was implemented with five vibrating wire piezometers for the monitoring of water table and to give support to the hydrogeological model. Also in 2016, the external mining consultants began the report for phase three of this study. They submitted and updated the block model with geotechnical parameters for the slope mine design.
Cuajone:
At the Cuajone mine, in 2007 in order to minimize the damage to the slopes caused by production blast vibrations, blasting control using three pre-split drills was implemented. Also, the slope monitoring system with reflection prisms has been replaced by a system using slope monitoring radar. In February 2012, the first radar equipment was put in service followed in August 2013 with the second radar installation and a geotechnical surveillance camera was added. This system improved the reliability and continuity of monitoring, improved the quality of information used to evaluate the performance of the slopes and helped better anticipate the risk of instability. The sub-surface deformation and the water level are still monitored with inclinometers and piezometers. In September 2012, we completed a program of oriented geotechnical drilling totaling 17,938 meters, and in May 2013 we completed a program of vertical geotechnical drilling totaling 2,814 meters, with hydraulic tests performed on rock and subsequently instrumented with inclinometers/piezometers. The geotechnical and hydraulic information obtained from the two programs will be used in the development of a geotechnical study for the new 15 year mine development plan (2015-2029). Also during 2013, we drilled 772 meters of sub-horizontal holes in order to drain the east slope of the pit. The geotechnical study for the new 15-year mine development plan was completed at the end of 2015 and the result of this study is the
32
increase by an average of three degrees of the inter ramp angle and include 40 meters wide geotechnical berms for inter ramp heights above 150 meters. This study also contains recommendations for improving the stability of the pit slopes.
In 2013, the Board of Directors approved a project to improve slope stability at the south area of the Cuajone mine, which will remove approximately 148 million tons of waste material in order to improve the mine design without reducing our actual production level. As of December 31, 2016, 79.1 million tons of waste material have been removed. For further information see Item 7 "Management Discussion and Analysis—Capital Investment Program."
To increase the possibility of mining in the event of a slide, we have provided for two extraction ramps for each open-pit mine. While these measures cannot guarantee that a slope failure will not occur, we believe that our mining practices are sound and that the steps taken and the ongoing reviews performed are a prudent methodology for open-pit mining.
Mexican operations
In 2004, our 15-year mine plan study for the La Caridad mine was awarded to an independent consulting firm to conduct a geotechnical evaluation. The purpose of the plan was to develop a program of optimum bench design and inter-ramp slope angles for the open-pit. The results of the evaluation presented by the consultants included a recommendation of a maximum average bench face angle of 72 degrees. Additionally, single benching was recommended for the upper sections of the west, south and east walls of the main pit. Likewise, double benching was recommended for the lower levels of the main pit and single benching for the upper slope segments that consist of either alluvial material, mine waste dumps or mineralized stockpile material. Alternatively, slopes in these types of materials, may be designed with an overall 37 degree slope. The geostructural and geotechnical parameters recommended were applied in the pit design for the new life of the mine plan for La Caridad mine prepared in 2015. This mine plan replaced the 15-year mine plan prepared in 2010. However, since final pit limits have not been yet established at La Caridad, all current pit walls are effectively working slopes. Geostructural and geotechnical data collected at the open-pit mine from cell-mapping and oriented-core drilling databases provided the basis for the geotechnical evaluation and recommendations. We continue to collect new information related to geotechnical data and other geology features from the mine pit and diamond drill hole, in order to ensure the structural security and also to improve the geotechnical data base for future studies.
At the Buenavista mine, we are following the recommendations of a geotechnical evaluation of design slope for the 15-year pit plan. This evaluation was prepared by an independent mine consulting firm. This evaluation included the determination of optimum pit slope design angles and bench design parameters for the proposed mine plan. The objective of the study was: (1) to determine optimum inter-ramp slope angles and bench design parameters for the 15-year plan and (2) to identify and analyze any potential major instability that could adversely impact mine operation. In 2012, we installed a radar system to monitor the walls of the mine.
The following recommendations were made for the Buenavista mine: inter-ramp slope design angles for the 15-year pit plan, for all of the 21 design sectors, defined on a rock-fabric-based catch bench analysis, using double bench, can range from 48° and 55°, and the inter-ramp slope angles are based on geometries that resulted from the back-break analysis using 80% reliability of achieving the required 7.5 meter catch bench width for a single bench configuration and 10.6 meter catch bench width for a double bench configuration. Preliminary observations suggest the 15-year pit walls may be relative free-draining, the back-break analysis assumed depressurized conditions of mine benches, and the inter-ramp stability analysis were performed for both, saturated and depressurized conditions.
A pit dewatering/depressurization plan for the Buenavista mine was also recommended to address the issues of open-pit drainage, dewatering plan and future slope depressurization. Phase I of the
33
geohydrological study was completed by an independent consultant. The analysis included a preliminary assessment and work plan implementations.
In 2011, five wells for extraction and monitoring were drilled close to the mine. Also, we began a drilling program to monitor possible water filtration beyond the limits of the open-pit mine. All the information obtained from these well drilling programs has been analyzed and included in the hydrologic model. The open-pit dewatering program from the bottom benches also continued during 2012 with a drilling program of 3,797 meters in several monitoring wells in order to allow us to continue with the current mining plan.
In 2013, Buenavista continued the drilling program monitoring the extraction wells in the area of Increment (Phase) five of the mine and beyond the current limits of the open pit mine.
During 2013, the program to dewater the Buenavista pit bottom was continued in accordance with the short and medium term mine plans. Pumping from sumps located in Increment five, permitted mining of high grade copper blocks. Concurrent with this operational task, a geophysical study was conducted to determine the best locations for water extraction wells to control the inflow of water to the pit bottom and thus allow us to continue our mining operations. The water extracted is being used for various purposes, including road irrigation for dust mitigation. The geophysical investigation also permitted the location of underground workings and the filtration and seepage through fractures.
A total of 7,339 meters were drilled during 2013 for 30 extraction wells, three of these wells are located in the area of Increment (Phase) five. The rest were drilled at various locations outside of the current open pit mine limit.
In 2014, we continued collecting new geotechnical information from two exploration drilling projects; this data is available to analyze the geotechnical data base for new studies in accordance with slope angle for the open pit excavations. In the free face benches at the open pit mine operations, the cell-mapping were prepared to increment the geotechnical data base. Following the recommendations of geotechnical evaluation we continued monitoring the walls using the radar system. In 2015, we decided not to update the geotechnical evaluation as expected because the 15-year pit plan conducted in 2004 is valid until 2018.
Various studies are now being conducted by outside specialized consultants in order to establish long-range mine water management objectives and to implement recommendations for the efficient use of this resource.
METAL PRODUCTION BY SEGMENTS
Set forth below are descriptions of the operations and other information relating to the operations included in each of our three segments.
34
PERUVIAN OPERATIONS
Our Peruvian segment operations include the Cuajone and Toquepala mine complexes and the smelting and refining plants, industrial railroad which links Ilo, Toquepala and Cuajone and the port facilities.
Following is a map indicating the approximate location of, and access to, our Cuajone and Toquepala mine complexes, as well as our Ilo processing facilities:
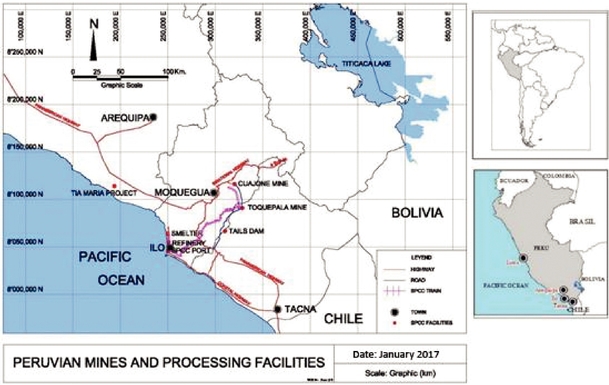
We have ongoing maintenance and improvement programs to ensure the satisfactory performance of our equipment. We believe all our Peruvian plant's equipment is in good physical condition and suitable for our operations.
Cuajone
Our Cuajone operations consist of an open-pit copper mine and a concentrator located in southern Peru, 30 kilometers from the city of Moquegua and 840 kilometers from Lima, at an altitude of 3,430 meters above sea level. Access to the Cuajone property is by plane from Lima to Tacna (1:40 hours) and then by highway to Moquegua and Cuajone (3:30 hours). The concentrator has a milling capacity of 90,000 tons per day. Overburden removal commenced in 1970 and ore production commenced in 1976. Our Cuajone operations utilize a conventional open-pit mining method to collect copper ore for further processing at the concentrator.
35
The table below sets forth 2016, 2015 and 2014 production information for our Cuajone operations:
| |
|
|
|
|
Variance 2016 - 2015 |
|||||||||||||
|---|---|---|---|---|---|---|---|---|---|---|---|---|---|---|---|---|---|---|
| |
|
2016 | 2015 | 2014 | Volume | % | ||||||||||||
Mine annual operating days |
366 | 365 | 365 | |||||||||||||||
Mine |
||||||||||||||||||
Total ore mined |
(kt) | 30,825 | 30,956 | 30,555 | (131 | ) | (0.4 | )% | ||||||||||
Copper grade |
(%) | 0.649 | 0.666 | 0.680 | (0.017 | ) | (2.55 | )% | ||||||||||
Leach material mined |
(kt) | — | — | 1,898 | — | — | ||||||||||||
Leach material grade |
(%) | — | — | 0.671 | — | — | ||||||||||||
Stripping ratio |
(x) | 4.68 | 5.19 | 4.98 | (0.51 | ) | (9.8 | )% | ||||||||||
Total material mined |
(kt) | 175,009 | 191,651 | 182,812 | (16,642 | ) | (8.7 | )% | ||||||||||
Concentrator |
||||||||||||||||||
Total material milled |
(kt) | 30,681 | 31,093 | 30,555 | (412 | ) | (1.3 | )% | ||||||||||
Copper recovery |
(%) | 86.12 | 86.09 | 85.88 | 0.03 | 0.0 | % | |||||||||||
Copper concentrate |
(kt) | 656.5 | 694.6 | 702.1 | (38.1 | ) | (5.5 | )% | ||||||||||
Copper in concentrate |
(kt) | 171.4 | 178.2 | 178.3 | (6.8 | ) | (3.8 | )% | ||||||||||
Copper concentrates average grade |
(%) | 26.11 | 25.65 | 25.40 | 0.46 | 1.8 | % | |||||||||||
Molybdenum |
||||||||||||||||||
Molybdenum grade |
(%) | 0.019 | 0.021 | 0.019 | (0.002 | ) | (9.5 | )% | ||||||||||
Molybdenum recovery |
(%) | 68.60 | 69.48 | 67.59 | (0.88 | ) | (1.28 | )% | ||||||||||
Molybdenum concentrate |
(kt) | 7.1 | 8.2 | 7.4 | (1.1 | ) | (13.41 | )% | ||||||||||
Molybdenum concentrate average grade |
(%) | 55.01 | 53.99 | 54.00 | 1.02 | 1.89 | % | |||||||||||
Molybdenum in concentrate |
(kt) | 3.9 | 4.4 | 4.0 | (0.5 | ) | (11.36 | )% | ||||||||||
- Key:
- kt =
thousand tons
x = Stripping ratio obtained dividing waste plus leachable material by ore mined.
Copper and molybdenum grades are referred to as total copper grade and total molybdenum grade, respectively.
Geology
The Cuajone porphyry copper deposit is located on the western flank of Cordillera Occidental, in the southern-most Andes Mountains of Peru. The deposit is part of a mineral district that contains additional known deposits, Toquepala, Quellaveco and Cerro Verde. The copper mineralization at Cuajone is typical of porphyry copper deposits and it can also be obtained molybdenum.
The Cuajone deposit is located approximately 30 kilometers north-west from the Toquepala deposit and is part of the Toquepala Group dated approximately 50 to 100 million years (Upper Cretaceous to Lower Tertiary). These rocks, part of the Toquepala Group, have been intruded by magmatic pulses between 50 and 70 million years, which some of them originated the Cuajone mineralization. Covering the previous sequence, there are the postmineral volcanics (Miocene) that partially cover the deposit. The deposit contains 43 rock types including, pre-mineral rocks, basaltic andesite, porphyritic rhyolite, Toquepala dolerite and intrusive rocks, including diorite, porphyritic latite, breccias and dikes. In addition, the following post-mineral rocks are present: the Huaylillas and Chuntacala formation that have been formed by conglomerates, tuffs sequence, traquites and agglomerates. These formations date nine to 23 million years. There is also the occurrence of Quaternary rocks formed by alluvial and colluvial mainly located in slopes of hills and streams.
36
The mineralogy is simple and is evenly distributed. It is mainly composed of copper minerals and iron such as chalcopyrite (CuFeS2), bornite (Cu5FeS4), pyrite (FeS2), chalcosine (Cu2S) and molybdenite (MoS2) with occasional presence of galena, sphalerite and tetraedrite.
Mine exploration
Exploration activities during the drill campaign in 2016 were as follows:
Studies
|
Meters | Holes | Notes | |||||
|---|---|---|---|---|---|---|---|---|
Infill drilling |
2,996 | 12 | To obtain additional information to improve confidence in our block model. | |||||
Geotechnical |
410 | 2 | To confirm the continuity of major structures. | |||||
Concentrator
Our Cuajone operations use state-of-the-art computer monitoring systems at the concentrator, the crushing plant and the flotation circuit in order to coordinate inflows and optimize operations. Material with a copper grade over 0.35% is loaded onto rail cars and sent to the milling circuit, where giant rotating crushers reduce the size of the rocks to approximately one-half of an inch. The ore is then sent to the ball mills, which grind it to the consistency of fine powder. The finely ground powder is agitated in a water and reagents solution and is then transported to flotation cells. Air is pumped into the cells to produce foam for floating the copper and molybdenum minerals, but separating waste material called tailings. This copper-molybdenum bulk concentrate is then treated by inverse flotation where molybdenum is floated and copper is depressed. The copper concentrate is shipped by rail to the smelter at Ilo and the molybdenum concentrate is packaged for shipment to customers. Sulfides under 0.35% copper are considered waste.
Tailings are sent to thickeners where water is recovered. The remaining tailings are sent to the Quebrada Honda dam, our principal tailings storage facility.
A major mill expansion was completed in 1999 and the eleventh primary mill was put in operation in January 2008. In December 2013, the high pressure grinding roll was put in operation. At the end of 2016, the Larox filter press for molybdenum concentrate began operations.
Toquepala
Our Toquepala operations consist of an open-pit copper mine and a concentrator. We also refine copper at the SX-EW facility through a leaching process. Toquepala is located in southern Peru, 30 kilometers from Cuajone and 870 kilometers from Lima, at an altitude of 3,220 meters above sea level. Access is by plane from Lima to the city of Tacna (1:40 hours) and then by the Pan-American highway to Camiara (1:20 hours) and by road to Toquepala (1 hour). The concentrator has a milling capacity of 60,000 tons per day. The SX-EW facility has a production capacity of 56,000 tons per year of LME grade A copper cathodes. Overburden removal commenced in 1957 and ore production commenced in 1960. Our Toquepala operations utilize a conventional open-pit mining method to collect copper ore for further processing in our concentrator.
37
The table below sets forth 2016, 2015 and 2014 production information for our Toquepala operations:
| |
|
|
|
|
Variance 2016 - 2015 |
|||||||||||||
|---|---|---|---|---|---|---|---|---|---|---|---|---|---|---|---|---|---|---|
| |
|
2016 | 2015 | 2014 | Volume | % | ||||||||||||
Mine annual operating days |
366 | 365 | 365 | |||||||||||||||
Mine |
||||||||||||||||||
Total ore mined |
(kt) | 19,940 | 20,150 | 19,922 | (210 | ) | (1.0 | )% | ||||||||||
Copper grade |
(%) | 0.647 | 0.643 | 0.626 | 0.004 | 0.6 | % | |||||||||||
Leach material mined |
(kt) | 78,485 | 54,440 | 37,939 | 24,045 | 44.2 | % | |||||||||||
Leach material grade |
(%) | 0.191 | 0.158 | 0.155 | 0.033 | 20.9 | % | |||||||||||
Stripping ratio |
(x) | 9.48 | 8.58 | 9.60 | 0.90 | 10.5 | % | |||||||||||
Total material mined |
(kt) | 209,064 | 193,013 | 211,202 | 16,051 | 8.3 | % | |||||||||||
Concentrator |
||||||||||||||||||
Total material milled |
(kt) | 20,071 | 20,272 | 19,942 | (201 | ) | (1.0 | )% | ||||||||||
Copper recovery |
(%) | 89.73 | 91.62 | 91.98 | (1.89 | ) | (2.1 | )% | ||||||||||
Copper concentrate |
(kt) | 424.5 | 429.0 | 416.7 | (4.5 | ) | (1.1 | )% | ||||||||||
Copper in concentrate |
(kt) | 116.5 | 119.4 | 114.8 | (2.9 | ) | (2.4 | )% | ||||||||||
Copper concentrate average grade |
(%) | 27.45 | 27.84 | 27.55 | (0.39 | ) | (1.4 | )% | ||||||||||
Molybdenum |
||||||||||||||||||
Molybdenum grade |
(%) | 0.043 | 0.054 | 0.042 | (0.011 | ) | (20.4 | )% | ||||||||||
Molybdenum recovery |
(%) | 73.61 | 72.70 | 73.54 | 0.91 | 1.3 | % | |||||||||||
Molybdenum concentrate |
(kt) | 11.3 | 14.1 | 10.9 | (2.8 | ) | (19.9 | )% | ||||||||||
Molybdenum concentrate average grade |
(%) | 55.96 | 56.14 | 56.02 | (0.18 | ) | (0.3 | )% | ||||||||||
Molybdenum in concentrate |
(kt) | 6.3 | 7.9 | 6.1 | (1.6 | ) | (20.3 | )% | ||||||||||
SX-EW plant |
||||||||||||||||||
Estimated leach recovery |
(%) | 25.29 | 25.88 | 25.94 | (0.59 | ) | (2.3 | )% | ||||||||||
SX-EW cathode production |
(kt) | 24.8 | 24.2 | 25.7 | 0.6 | 2.5 | % | |||||||||||
- Key:
- kt =
thousand tons
x = Stripping ratio obtained dividing waste plus leachable material by ore mined.
Copper and molybdenum grades are referred to as total copper grade and total molybdenum grade, respectively.
Geology
The Toquepala porphyry copper deposit is located on the western slopes of Cordillera Occidental, in the southern-most Andes Mountains of Peru. The deposit is part of a mineral district that contains two additional known deposits, Cuajone and Quellaveco.
The Toquepala deposit is in the southern region of Peru, located on the western slope of the Andes mountain range, approximately 120 kilometers from the border with Chile. This region extends into Chile and is home to many of the world's most significant known copper deposits. The deposit is in a territory with intrusive and eruptive activities of rhyolitic and andesitic rocks which are 70 million years old (Cretaceous-Tertiary) and which created a series of volcanic lava. The lava is composed of rhyolites, andesites and volcanic agglomerates with a western dip and at an altitude of 1,500 meters. These series are known as the Toquepala Group. Subsequently, different intrusive activities occurred which broke and smelted the rocks of the Toquepala Group. These intrusive activities resulted in diorites, granodiorites and dikes of porphyric dacite. Toquepala has a simple mineralogy with regular copper grade distribution. Economic ore is found as disseminated sulfurs throughout the deposit as veinlets, replenishing empty places or as small aggregates. Ore minerals include chalcopyrite (CuFeS2),
38
chalcosine (Cu2S) and molybdenite (MoS2). A secondary enrichment zone is also found with thicknesses between 0 and 150 meters.
Mine Exploration
Exploration activities during the drill campaign in 2016 were as follows:
Studies
|
Meters | Holes | Notes | |||||
|---|---|---|---|---|---|---|---|---|
Ore confirmation and Work Index for phase 4 and 5 |
18,856 | 35 | To confirm the lateral continuity of the ore body and Work Index for ore mill. | |||||
Study of Slopes Stability Instability-South east |
10 | 01 | To define the potential depth of instability. | |||||
Exploration geotechnical and hydrogeological drill |
3,470 | 11 | To define rock mass quality and hydrogeological behavior. | |||||
| | | | | | | | | |
Total |
22,336 | 47 | ||||||
Concentrator
Our Toquepala concentrator operations use state-of-the-art computer monitoring systems in order to coordinate inflows and optimize operations. Material with a copper grade over 0.40% is loaded onto rail cars and sent to the crushing circuit, where rotating crushers reduce the size of the rocks by approximately 85%, to less than one-half of an inch. The ore is then sent to the rod and ball mills, which grind it in a mix with water to the consistency of fine powder. The finely ground powder mixed with water is then transported to flotation cells. Air is pumped into the cells producing a froth, which carries the copper mineral to the surface but not the waste rock, or tailings. The bulk concentrate with sufficient molybdenum content is processed to recover molybdenum by inverse flotation. This final copper concentrate with a content of approximately 26.5% of copper is filtered in order to reduce moisture to 8.5% or less. Concentrates are then shipped by rail to the Ilo smelter.
Tailings are sent to thickeners where water is recovered. The remaining tailings are sent to the Quebrada Honda dam, our principal tailings storage facility.
SX-EW Plant
The SX-EW facility at Toquepala produces grade A LME electrowon copper cathodes of 99.999% purity from solutions obtained by leaching low-grade ore stored at the Toquepala and Cuajone mines. The leach plant commenced operations in 1995 with a design capacity of 35,629 tons per year of copper cathodes. In 1999, the capacity was expanded to 56,000 tons per year.
Copper oxides from Cuajone with a copper grade higher than 0.208%, with an acid solubility index higher than 43% and a cyanide solubility index higher than 17% are leached. In Toquepala, the copper sulfides cutoff grade is 0.153% and therefore material with a total copper grade between 0.153% and 0.300% are leached. Copper in solution produced at Cuajone is sent to Toquepala through an eight-inch pipe laid alongside the Cuajone-Toquepala railroad track.
Plant and equipment are supported by a maintenance plan and a quality management system to assure good physical condition and high availability. The SX-EW plant management quality system (including leaching operations) has been audited periodically since 2002 by an external audit company, and found to be in compliance with the requirements of the ISO 9001-2008 standard. In 2012, we obtained the certification OHSAS 18001 of our occupational health and safety system and the ISO14001-2004 for our environmental standards at the SX-EW plant.
39
Processing Facilities—Ilo
Our Ilo smelter and refinery complex is located in the southern part of Peru, 17 kilometers north of the city of Ilo, 121 kilometers from Toquepala, 147 kilometers from Cuajone and 1,240 kilometers from the city of Lima. Access is by plane from Lima to Tacna (1:40 hours) and then by highway to the city of Ilo (2:00 hours). Additionally, we maintain a port facility in Ilo, from which we ship our products and receive supplies. Products shipped and supplies received are moved between Toquepala, Cuajone and Ilo on our industrial railroad.
Smelter
Our Ilo smelter produces copper anodes for the refinery we operate as part of the same facility. Copper produced by the smelter exceeds the refinery's capacity and the excess is sold to other refineries around the world. In 2007, we completed a major modernization of the smelter. The nominal installed capacity of the smelter is 1,200,000 tons of concentrate per year.
Copper concentrates from Toquepala and Cuajone are transported by railroad to the smelter, where they are smelted using an ISASMELT furnace, converters and anode furnaces to produce copper anodes with 99.7% copper. At the smelter, the concentrates are mixed with flux and other material and sent to the ISASMELT furnace producing a mixture of copper matte and slag, which is tapped through a taphole to either of two rotary holding furnaces, where these smelted phases will be separated. Copper matte contains approximately 63% copper. Copper matte is then sent to the four Pierce Smith converters, where the material is oxidized in two steps: (1) the iron sulfides in the matte are oxidized with oxygen enriched air and silica is added producing slag that is sent to the slag cleaning furnaces, and (2) the copper contained in the matte sulfides is then oxidized to produce blister copper, containing approximately 99.3% copper. The blister copper is refined in two anode furnaces by oxidation to remove sulfur with compressed air injected into the bath. Finally, the oxygen content of the molten copper is adjusted by reduction with injection of liquefied petroleum gas with steam into the bath. Anodes, containing approximately 99.7% copper, are cast in two casting wheels. The smelter also can produce blister copper bars, especially when an anode furnace is in general repair.
The table below sets forth 2016, 2015 and 2014 production and sales information for our Ilo smelter plant:
| |
|
|
|
|
Variance 2016 - 2015 |
|||||||||||||
|---|---|---|---|---|---|---|---|---|---|---|---|---|---|---|---|---|---|---|
| |
|
2016 | 2015 | 2014 | Volume | % | ||||||||||||
Smelter |
||||||||||||||||||
Concentrate smelted |
(kt) | 1,070.6 | 1,143.7 | 1,022.5 | (73.1 | ) | (6.39 | )% | ||||||||||
Average copper recovery |
(%) | 97.4 | 97.4 | 97.5 | — | — | ||||||||||||
Anode production |
(kt) | 323.3 | 339.7 | 304.7 | (16.4 | ) | (4.8 | )% | ||||||||||
Average anode grade |
(%) | 99.77 | 99.76 | 99.75 | 0.01 | — | ||||||||||||
Blister production |
kt | 0.9 | 2.8 | — | (1.9 | ) | (67.9 | )% | ||||||||||
Average blister grade |
(%) | 99.23 | 99.31 | — | (0.08 | ) | — | |||||||||||
Sulfuric acid produced |
(kt) | 1,036.3 | 1,104.7 | 994.2 | (68.4 | ) | (6.19 | )% | ||||||||||
Sales data: |
||||||||||||||||||
Anode sales |
(kt) | 2.00 | 4.00 | — | (2.00 | ) | (50.0 | )% | ||||||||||
Average anode sales price |
($/lb) | 1.98 | 2.13 | — | (0.15 | ) | (7.0 | )% | ||||||||||
Blister sales |
(kt) | 0.93 | 2.80 | — | (1.87 | ) | (66.8 | )% | ||||||||||
Average blister sales price |
($/lb) | 1.52 | 2.47 | — | (0.95 | ) | (38.5 | )% | ||||||||||
Average sulfuric acid price |
($/ton) | 49.40 | 73.47 | 64.67 | (24.07 | ) | (32.8 | )% | ||||||||||
- Key:
- kt = thousand tons
40
The off gases from the smelter are treated to recover over 92% of the incoming sulfur received in the concentrates producing 98.5% sulfuric acid. The gas stream from the smelter with 11.34% SO2 is split between two plants: The No. 1 acid plant (single absorption/single contact) and the No. 2 plant (double absorption/double contact). Approximately, 16% of the acid produced is used at our facilities with the balance sold to third parties. We anticipate that our internal usage will be over 80% when the Tia Maria project begins operation.
The smelter also has two oxygen plants. Plant No. 1, with 272 tons per day of production capacity, and Plant No.2, with 1,045 tons per day of capacity.
In 2010, the Ilo smelter marine trestle started operation. This facility allows us to offload directly to offshore ships the sulfuric acid produced, avoiding hauling cargo through the city of Ilo. The 500 meter long marine trestle is the last part of the Ilo smelter modernization project. Currently all overseas shipments of sulfuric acid are being made using the marine trestle.
Refinery
The Ilo refinery consists of an electrolytic plant, a precious metal plant and a number of ancillary installations. The refinery is producing grade A copper cathode of 99.998% purity. The nominal capacity is 280,000 tons per year. Anodic slimes are recovered from the refining process and then sent to the precious metals facility to produce refined silver, refined gold and commercial grade selenium.
Anodes are suspended in tanks containing a solution of sulfuric acid and copper sulfate. A low voltage but high amperage electrical current is passed through the anodes, chemical solution and cathodes in order to dissolve copper which is deposited on initially very thin starting sheets increasing its thickness to produce high grade copper cathodes. During this process, silver, gold and other metals, including palladium, platinum and selenium, along with other impurities, settle on the bottom of the tank in the form of anodic slime. This anodic slime is processed in a precious metal plant where silver, gold and selenium are recovered.
The table below sets forth 2016, 2015 and 2014 production and sales information for our Ilo refinery and precious metals plants:
| |
|
|
|
|
Variance 2016 - 2015 |
|||||||||||||
|---|---|---|---|---|---|---|---|---|---|---|---|---|---|---|---|---|---|---|
| |
|
2016 | 2015 | 2014 | Volume | % | ||||||||||||
Refinery |
||||||||||||||||||
Cathodes produced |
(kt) | 270.2 | 280.6 | 257.9 | (10.4 | ) | (3.7 | )% | ||||||||||
Average copper grade |
(%) | 99.998 | 99.998 | 99.998 | — | — | ||||||||||||
Refined silver produced |
(000 Kg) | 102.5 | 106.0 | 108.2 | (3.5 | ) | (3.3 | )% | ||||||||||
Refined gold produced |
(kg) | 209.9 | 190.9 | 225.8 | 19.0 | 10.0 | % | |||||||||||
Commercial grade selenium produced |
(tons) | 48.7 | 54.4 | 50.0 | (5.7 | ) | (10.5 | )% | ||||||||||
Sales data: |
||||||||||||||||||
Average cathodes sales price |
($/lb) | 2.25 | 2.50 | 3.17 | (0.25 | ) | (10.0 | )% | ||||||||||
Average silver sales price |
($/oz) | 16.83 | 15.78 | 19.11 | 1.05 | 6.7 | % | |||||||||||
Average gold sales price |
($/oz) | 1,224.18 | 1,157.30 | 1,259.01 | 66.88 | 5.8 | % | |||||||||||
- Key:
- kt = thousand tons
In addition to the processing facilities, the refinery has a production control section, a laboratory which provides sample analysis throughout the Company, a maintenance department, a desalinization plant and other support facilities.
41
Other facilities in Ilo are a coquina plant with a production capacity of 200,000 tons per year of seashells and a lime plant with a capacity of 80,000 tons per year. We also operate an industrial railroad to haul production and supplies between Toquepala, Cuajone and Ilo.
The industrial railroad's main equipment includes locomotives of different types and rolling stock with different types of cars and capacities. The track runs in a single 214 kilometer standard gauge line and supports a 30-ton axle load. The total length of the track system is around 257 kilometers including main yards and sidings. The infrastructure includes 27 kilometers of track under tunnels and one concrete bridge. The industrial railroad includes a car repair shop which is responsible for maintenance and repair of the car fleet. Annual tonnage transported is approximately 4.7 million tons.
MEXICAN OPERATIONS
Following is a map indicating the approximate locations of our Mexican mines and processing facilities:
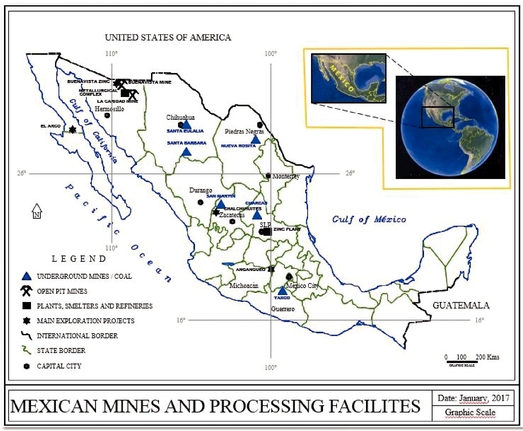
MEXICAN OPEN-PIT SEGMENT
Our Mexican open-pit segment operations combine two units of Minera Mexico, La Caridad and Buenavista, which include La Caridad and Buenavista mine complexes and smelting and refining plants and support facilities, which service both complexes.
42
Following is a map indicating the approximate location of, and access to, our Mexican open-pit mine complexes, as well as our processing facilities:
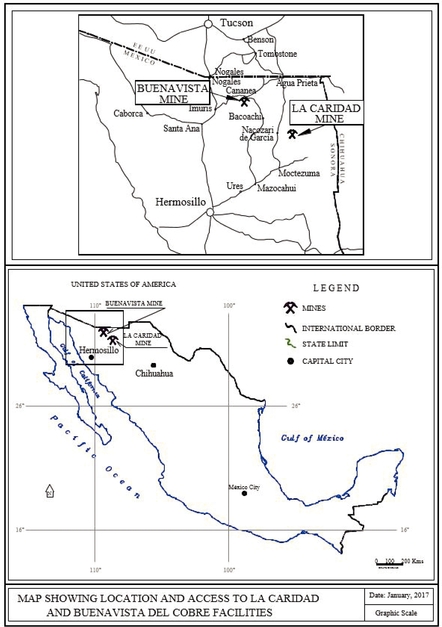
We have ongoing maintenance and improvement programs to ensure the satisfactory performance of our equipment. We believe all our Mexican open-pit segment equipment is in good physical condition and suitable for our operations.
Buenavista
The Buenavista mining unit operates an open-pit copper mine, two concentrators and three SX-EW plants. It is located 100 air-kilometers northwest of La Caridad and 40 kilometers south of the Arizona, U.S.—Mexican border, at an altitude of 1,900 meters above sea level. It lies on the outskirts of the city of Cananea. Buenavista is connected by paved highways to the border city of Agua Prieta to the northeast, to the town of Nacozari in the southeast and to the town of Imuris to the west. Buenavista is also connected by railway to Agua Prieta and Nogales. A municipal airport is located approximately 20 kilometers to the northeast of Buenavista.
43
In 2010, a strike of approximately three years was settled and full production was restored in 2011. In 2013, mine operations were affected by flooding problems caused by unusual rains in the area, as a consequence we lost approximately 22,900 tons of copper production. The mine restored full operations by the end of the third quarter of 2013.
We have concluded our $3.5 billion investment program in Mexico and all of the projects of this program will be in full operation in 2017. The program included a third SX-EW plant, completed in June 2014, with a rated annual capacity of 120,000 tons of copper. A new concentrator, completed in 2015, with an annual copper production capacity of 188,000 tons. The program includes two molybdenum plants with a combined annual capacity of 4,600 tons. The first plant was completed in 2013 and the second one, in 2016. Additionally, the program included the Crushing, Conveying and Spreading System for Leachable Ore (Quebalix IV), which will reduce processing time as well as mining and hauling costs increasing production by improving SX-EW copper recovery. The installed conveyor system is operating steadily.
The original concentrator currently has a nominal milling capacity of 76,700 tons per day. The second concentrator began operations in 2015 with a nominal milling capacity of 100,000 tons per day. The SX-EW facilities have a cathode production capacity of 174,470 tons per year. The Buenavista ore body is considered one of the world's largest porphyry copper deposits. Buenavista is the oldest continuously operated copper mine in North America, with operations dating back to 1899. High grade ore deposits in the district were mined exclusively using underground methods. The Anaconda Company acquired the property in 1917. In the early 1940s, Anaconda started developing the first open-pit in Buenavista. In 1990, through a public auction procedure, Minera Mexico acquired 100% of the Buenavista mining assets for $475 million. Buenavista is currently applying conventional open-pit mining methods to extract copper ore for further processing in the concentrator.
In 2014, a spill of copper sulfate solution occurred at a leaching pond for Buenavista's new SX-EW III plant. The solution reached the Bacanuchi River, a tributary of the Sonora River. We took immediate action to contain the spill and expedited the cleanup, also to comply with all the legal requirements. A trust fund of two billion pesos (approximately $150 million) was established to support remedial action and provide compensation to those adversely affected by this accident. Approximately one billion Mexican pesos have already been contributed.
On September 15, 2014, BVC executed an administrative agreement with PROFEPA, providing for the submission of a remediation action plan to the Mexican Ministry of Environment and Natural Resources (Secretaria de Medio Ambiente y Recursos Naturales "SEMARNAT"). The remediation program submitted to SEMARNAT was approved on January 6, 2015. This program will be developed in five zones along the rivers. As of December 31, 2016, the Company informed SEMARNAT of the conclusion of the clean-up and soil remediation actions in phase one of zone one. Remediation activities in phase two of zone one are expected to be concluded in February 2017. The Company has already obtained approval of the monitoring programs for zones two to five.
44
The following table shows 2016, 2015 and 2014 production information for Buenavista:
| |
|
|
|
|
2016 - 2015 Variance |
|||||||||||||
|---|---|---|---|---|---|---|---|---|---|---|---|---|---|---|---|---|---|---|
| |
|
2016 | 2015 | 2014 | Volume | % | ||||||||||||
Mine annual operating days |
366 | 365 | 365 | |||||||||||||||
Mine: |
||||||||||||||||||
Total ore mined |
(kt) | 66,328 | 33,726 | 27,291 | 32,602 | 96.7 | % | |||||||||||
Copper grade |
(%) | 0.566 | 0.593 | 0.581 | (0.027 | ) | (4.6 | )% | ||||||||||
Leach material mined |
(kt) | 123,738 | 150,546 | 142,288 | (26,808 | ) | (17.8 | )% | ||||||||||
Leach material grade |
(%) | 0.281 | 0.293 | 0.263 | (0.012 | ) | (4.1 | )% | ||||||||||
Stripping ratio |
(x) | 2.88 | 6.23 | 8.93 | (3.35 | ) | (53.8 | )% | ||||||||||
Total material mined |
(kt) | 257,395 | 282,954 | 271,026 | (25,559 | ) | (9.0 | )% | ||||||||||
Concentrator: |
||||||||||||||||||
Total material milled |
(kt) | 66,112 | 33,141 | 27,278 | 32,971 | 99.5 | % | |||||||||||
Copper recovery |
(%) | 84.50 | 82.50 | 83.81 | 2.00 | 2.4 | % | |||||||||||
Copper concentrate |
(kt) | 1,329.6 | 705.0 | 565.7 | 624.6 | 88.6 | % | |||||||||||
Copper in concentrate |
(kt) | 316.0 | 162.0 | 132.9 | 154 | 95.1 | % | |||||||||||
Copper concentrate average grade |
(%) | 23.77 | 22.98 | 23.49 | 0.79 | 3.4 | % | |||||||||||
Molybdenum |
||||||||||||||||||
Molybdenum grade |
(%) | 0.013 | 0.013 | 0.019 | — | — | ||||||||||||
Molybdenum recovery |
(%) | 25.11 | 25.55 | 44.01 | (0.44 | ) | (1.7 | )% | ||||||||||
Molybdenum concentrate |
(kt) | 3.19 | 1.87 | 4.21 | 1.32 | 70.6 | % | |||||||||||
Molybdenum concentrate average grade |
(%) | 49.45 | 50.25 | 52.72 | (0.80 | ) | (1.6 | )% | ||||||||||
Molybdenum in concentrate |
(kt) | 1.58 | 0.94 | 2.22 | 0.64 | 68.1 | % | |||||||||||
SX-EW plant |
||||||||||||||||||
Estimated leach recovery |
(%) | 70.77 | 47.78 | 58.47 | 22.99 | 48.1 | % | |||||||||||
SX-EW cathode production |
(kt) | 131.4 | 122.5 | 93.4 | 8.90 | 7.3 | % | |||||||||||
- Key:
- kt =
thousand tons
x = Stripping ratio obtained dividing waste plus leachable material by ore mined.
The copper and molybdenum grade are total grade.
Geology
The Buenavista mining district lies on the southern cordilleran orogen, which extends from southern Mexico to northwestern United States. It also falls within the Basin and Range metallogenic province. Geological and structural features in the district are representative of large, disseminated type, porphyry copper deposits. A calcareous sedimentary sequence of lower Paleozoic age, lithologically correlated with a similar section in southeastern Arizona, uncomformably overlies Precambrian granite basement. The entire section was covered by volcanic rocks of Mesozoic age and later intruded by deep seated granodiorite batholith of Tertiary age, with further quartz monzonite porphyry differentiates of Laramide age.
Mineralization in the district is extensive covering a surface area of approximately 30 square kilometers. An early pegmatitic stage associated with bornite-chalcopyrite-molybdenite assemblage was followed by a widespread flooding of hydrothermal solutions with quartz-pyrite-chalcopyrite. A pervasive quartz-sericite alteration is evident throughout the district's igneous rock fabric.
An extensive and economically important zone of supergene enrichment, with disseminated and stockworks of chalcocite (Cu2S), developed below the iron oxide capping. This zone coincides with the topography and has an average thickness of 300 meters. A mixed zone of secondary and primary
45
sulfides underlay the chalcocite blanket. The hypogene mineralization, principally chalcopyrite (CuFeS2), extensively underlies the ore body. Molybdenite occurs throughout the deposit and the content tends to increase with depth.
The Buenavista copper porphyry is considered world-class and unique. The deepest exploration results in the core of the deposit have confirmed significant increase in copper grades. Similar porphyry copper deposits usually contain lower grades at depth. The district is also unique for the occurrence of high-grade breccia pipes, occurring in clusters following the trend of the district.
Current dimensions of the mineralized ore body are 5x3 kilometers, and projects to more than one kilometer at depth. Considering the geological and economic potential of the Buenavista porphyry copper deposit, it is expected that the operation can support a sizeable increase in copper production capacity.
Mine Exploration
In-fill core drilling was conducted in 2011 at the Buenavista zinc-copper-silver deposit, including directional drilling for geotechnical purposes. A deep drilling campaign was initiated in 2011 to explore the extent of the deposit at depth, drilling a total of 3,860 meters in 2012. For short-term mine planning, 6,652 meters were drilled to confirm copper grade and metallurgical recoveries. Also, in 2011, a condemnation drilling program was initiated to define areas for future infrastructure, as well as areas where leach and waste dumps will be deposited. A total of 28,369 meters of core drilling were completed in 2011. A geohydrology program was initiated in 2011 to explore the possibility of groundwater sources within the mine limits, and a total of 29,750 meters of diamond drilling were drilled in 2012. In addition, 3,797 meters were drilled for water monitoring wells. We did not have a drilling campaign in 2013. In 2014, we performed a drilling program of 20,000 meters in order to verify the reserves. In 2015, we complied with our drilling program target of 15,000 meters to define reserves and to confirm copper and molybdenum grades. For 2017, we plan to drill 16,600 meters to further define reserves and confirm grades.
Concentrator
Buenavista uses state-of-the-art computer monitoring systems at the concentrators, the crushing plant and the flotation circuit in order to coordinate inflows and optimize operations. In the original concentrator, material with a copper grade over 0.38% is loaded onto trucks and sent to the milling circuit, where giant rotating crushers reduce the size of the ore to approximately one-half of an inch. The ore is then sent to the ball mills, which grind it to the consistency of fine powder. The finely ground powder is agitated in a water and reagents solution and is then transported to flotation cells. Air is pumped into the cells producing a froth, which carries the copper mineral to the surface but not the waste rock, or tailings. Recovered copper, with the consistency of froth, is filtered and dried to produce copper concentrates with an average copper content of approximately 24%. Concentrates are then shipped by rail to the smelter at La Caridad.
In the second concentrator, material with a copper grade over 0.57% is sent to a three-phase milling circuit, where the ore size is reduced to approximately one-half inch. The ore is then sent to a circuit of six ball mills, which grind it to the consistency of fine powder. The finely ground powder is agitated in a water and reagents solution and is then transported to flotation cells. Air is pumped into the cells producing a froth, which carries the copper mineral to the surface but not the waste rock, or tailings. Recovered copper, with the consistency of froth, is filtered and dried to produce copper concentrates with an average copper content of approximately 24%. Concentrates are then sent by trucks or by railroad to the La Caridad smelter or to the Guaymas port, at Sonora, for exporting.
As part of the expansion program for this unit, in 2013 we completed the construction of the first molybdenum plant with an annual production capacity of 2,000 tons of molybdenum contained in
46
concentrate. The plant was designed to process 1,500 tons of copper-molybdenum concentrates per day with a recovery of approximately 80%of copper and 50% of molybdenum content. The molybdenum plant consists of thickeners, homogenizer tanks, flotation cells, column cells and a holo-flite dryer. The second molybdenum plant obtained its first production lot in July 2016 and fully initiated operations in November 2016.
SX-EW Plant
The Buenavista unit operates a leaching facility and three SX-EW plants. All copper ore with a grade lower than the mill cut-off grade of 0.38%, but higher than 0.25%, is delivered to the leach dumps. A cycle of leaching and resting occurs for approximately five years in the run-of-mine dumps and three years for the crushed leach material.
The Buenavista unit currently maintains 6.3 million cubic meters of pregnant leach solution in inventory with a concentration of approximately 1.034 grams of copper per liter.
There are three irrigation systems for the dumps and eleven dams for the pregnant leach solution (PLS). Plant I has four solvent extraction tanks with a nominal capacity of 18,000 liters per minute of PLS and 54 electrowinning cells and has a daily production capacity of 30 tons of copper cathodes with 99.999% purity. Plant II has five trains of solvent extraction with a nominal capacity of 62,000 liters per minute of PLS and 220 cells distributed in two bays and has a daily production capacity of 120 tons of copper cathodes with 99.9% purity. Plant III has three trains of solvent extraction with a nominal capacity of 167,100 liters per minute of PLS and 270 cells distributed in two bays and has a daily production capacity of 328 tons of copper cathodes with 99.9% purity. The plant produces copper cathodes of LME grade A. Please see "Capital Investment Program" under Item 7 for further information.
La Caridad
The La Caridad complex includes an open-pit mine, concentrator, smelter, copper refinery, precious metals refinery, rod plant, SX-EW plant, lime plant and two sulfuric acid plants.
La Caridad mine and mill are located about 23 kilometers southeast of the town of Nacozari in northeastern Sonora, at an altitude of 2,000 meters above sea level. Nacozari is about 264 kilometers northeast of the Sonora state capital of Hermosillo and 121 kilometers south of the U.S.-Mexico border. Nacozari is connected by paved highway with Hermosillo and Agua Prieta and by rail with the international port of Guaymas, and the Mexican and United States rail systems. An airstrip with a reported runway length of 2,500 meters is located 36 kilometers north of Nacozari, less than one kilometer away from the La Caridad copper smelter and refinery. The smelter and the sulfuric acid plants, as well as the refineries and rod plant, are located approximately 24 kilometers from the mine. Access is by paved highway and by railroad.
The concentrator began operations in 1979, the molybdenum plant was added in 1982, the smelter in 1986, the first sulfuric acid plant in 1988, the SX-EW plant in 1995, the second sulfuric acid plant in 1997, the copper refinery in 1997, the rod plant in 1998, the precious metals refinery in 1999 and the dust and effluents plant in 2012.
47
The table below sets forth 2016, 2015 and 2014 production information for La Caridad:
| |
|
|
|
|
Variance 2016 - 2015 |
|||||||||||||
|---|---|---|---|---|---|---|---|---|---|---|---|---|---|---|---|---|---|---|
| |
|
2016 | 2015 | 2014 | Volume | % | ||||||||||||
Mine annual operating days |
366 | 365 | 365 | |||||||||||||||
Mine |
||||||||||||||||||
Total ore mined |
(kt) | 34,648 | 34,445 | 34,251 | 203 | 0.6 | % | |||||||||||
Copper grade |
(%) | 0.355 | 0.351 | 0.343 | 0.004 | 1.1 | % | |||||||||||
Leach material mined |
(kt) | 41,342 | 32,758 | 31,164 | 8,584 | 26.2 | % | |||||||||||
Leach material grade |
(%) | 0.228 | 0.244 | 0.239 | (0.016 | ) | (6.6 | )% | ||||||||||
Stripping ratio |
(x) | 1.84 | 1.74 | 1.67 | 0.10 | 5.8 | % | |||||||||||
Total material mined |
(kt) | 98,435 | 94,283 | 91,454 | 4,152 | 4.4 | % | |||||||||||
Concentrator |
||||||||||||||||||
Total material milled |
(kt) | 34,539 | 34,468 | 34,427 | 71 | 0.2 | % | |||||||||||
Copper recovery |
(%) | 85.66 | 85.76 | 85.53 | (0.10 | ) | (0.1 | )% | ||||||||||
Copper concentrate |
(kt) | 447.1 | 455.2 | 458.8 | (8.1 | ) | (1.8 | )% | ||||||||||
Copper in concentrate |
(kt) | 104.9 | 103.9 | 101.1 | 1.0 | 1.0 | % | |||||||||||
Copper concentrate average grade |
(%) | 23.47 | 22.81 | 22.03 | 0.66 | 2.9 | % | |||||||||||
Molybdenum |
||||||||||||||||||
Molybdenum grade |
(%) | 0.035 | 0.036 | 0.039 | (0.001 | ) | (2.8 | )% | ||||||||||
Molybdenum recovery |
(%) | 81.15 | 81.62 | 81.52 | (0.47 | ) | (0.6 | )% | ||||||||||
Molybdenum concentrate |
(kt) | 18.7 | 18.9 | 20.2 | (0.2 | ) | (1.1 | )% | ||||||||||
Molybdenum concentrate average grade |
(%) | 52.96 | 53.76 | 53.55 | (0.80 | ) | (1.5 | )% | ||||||||||
Molybdenum in concentrate |
(kt) | 9.9 | 10.0 | 10.8 | (0.1 | ) | (1.0 | )% | ||||||||||
SX-EW plant |
||||||||||||||||||
Estimated leach recovery |
(%) | 38.26 | 38.57 | 38.56 | (0.31 | ) | (0.8 | )% | ||||||||||
SX-EW cathode production |
(kt) | 28.31 | 27.16 | 25.2 | 1.15 | 4.2 | % | |||||||||||
- Key:
- kt
= thousand tons
x = Stripping ratio obtained dividing waste plus leachable material by ore mined
The copper and molybdenum grade are total grade.
Geology
The La Caridad deposit is a typical porphyry copper and molybdenum deposit as seen also in the southwestern basin of United States. The La Caridad mine uses a conventional open-pit mining method. The ore body is at the top of a mountain, which gives La Caridad the advantage of a relative low waste-stripping ratio, natural pit drainage and relative short haul for both ore and waste. The mining method involves drilling, blasting, loading and haulage of ore mill and waste to the primary crushers and the leach materials and waste to dumps, respectively.
La Caridad deposit is located in northeastern Sonora, Mexico. The deposit is situated near the crest of the Sierra Juriquipa, about 23 kilometers southeast of the town of Nacozari, Sonora, Mexico. The Sierra Juriquipa rises to elevations of around 2,000 meters in the vicinity of La Caridad and is one of the many north-trending mountain ranges in Sonora that form a southern extension of the basin and range province.
The La Caridad porphyry copper-molybdenum deposit occurs exclusively in felsic to intermediate intrusive igneous rocks and associated breccias. Host rocks include diorite and granodiorite. These rocks are intruded by a quartz monzonite porphyry stock and by numerous breccia masses, which contain fragments of all the older rock types.
48
Supergene enrichment consists of complete to partial chalcosite (Cu2S) replacement of chalcopyrite (CuFeS2). The zone of supergene enrichment occurs as a flat and tabular blanket with an average diameter of 1,700 meters and thickness generally between 0 and 90 meters.
Economic ore is found as disseminated sulfurs within the central part of the deposit. Sulfide-filled breccia cavities are most abundant in the intrusive breccia. This breccia-cavity mineralization occurs as sulfide aggregates which have crystallized in the spaces separating breccia clasts. Near the margins of the deposit, mineralization occurs almost exclusively in veinlets. Ore minerals include chalcopyrite (CuFeS2), chalcosite (Cu2S) and molybdenite (MoS2).
Mine Exploration
The La Caridad ore body has been mined for over 35 years. The extent of the model area is approximately 6,000 meters by 4,000 meters with elevation ranging from 750 to 1,800 meters. Seventeen drilling campaigns have been conducted on the property since 1968. These campaigns drilled a total of 3,349 drill holes: 1,186 were diamond drill holes and 2,163 were reverse circulation. We have also drilled some hammer and percussion drill holes.
In 2008, La Caridad finished a large exploration program of 50,000 meters. The target was to reach to the 900 level in order to reduce the drilling space and to define the copper and molybdenum mineralization continuity and also carry out metallurgical testing for the flotation and leaching processes. There was no exploration program in 2009, 2011 and 2013. In 2012 we drilled 10,000 meters and further defined the extent of the copper and molybdenum mineralization. In 2014, 2015, and 2016 we drilled 60 diamond drill holes equivalent to 22,981 meters in order to define a high grade ore body located in the south western edge of the pit (Bella Union location).
Concentrator
La Caridad uses state-of-the-art computer monitoring systems at the concentrator, the crushing plant and the flotation circuit in order to coordinate inflows and optimize operations. The concentrator has a current capacity of 94,500 tons of ore per day.
Ore extracted from the mine with a copper grade over 0.30% is sent to the concentrator and is processed into copper concentrates and molybdenum concentrates. The copper concentrates are sent to the smelter and the molybdenum concentrate is sold to a Mexican customer. The molybdenum recovery plant has a capacity of 2,000 tons per day of copper-molybdenum concentrates. The lime plant has a capacity of 340 tons of finished product per day.
SX-EW Plant
Approximately 790.6 million tons of leaching ore with an average grade of approximately 0.25312% copper have been extracted from the La Caridad open-pit mine and deposited in leaching dumps from May 1995 to December 31, 2016. All copper ore with a grade lower than the mill cut-off grade 0.30%, but higher than 0.15% copper, is delivered to the leaching dumps. In 1995, we completed the construction of a SX-EW facility at La Caridad that has allowed processing of this ore and certain leach ore reserves that were not mined and has resulted in a reduction in our copper production costs. The SX-EW facility has an annual design capacity of 21,900 tons of copper cathodes.
The plant has three trains of solvent extraction with a nominal capacity of 2,400 cubic meters per hour and 94 electrowinning cells distributed in one single electrolytic bay. The plant has a daily production capacity of 65 tons of copper cathodes with 99.999% purity.
49
Processing Facilities—La Caridad
Our La Caridad complex includes a smelter, an electrolytic copper refinery, a precious metal refinery, a copper rod plant and an effluent and dust treatment plant. The distance between this complex and the La Caridad mine is approximately 24 kilometers.
Smelter
Copper concentrates from Buenavista, Santa Barbara, Charcas and La Caridad are transported by rail and truck to the La Caridad smelter where they are processed and cast into copper anodes of 99.2% purity. Sulfur dioxide off-gases collected from the flash furnace, the El Teniente converter and conventional converters are processed into sulfuric acid at two sulfuric acid plants. Approximately 2% to 3% of this acid is used by our SX-EW plants and the balance is sold to third parties.
All of the anodes produced in the smelter are sent to the La Caridad copper refinery. The actual installed capacity of the smelter is 1,000,000 tons per year, a capacity that is sufficient to treat all the concentrates of La Caridad and almost 40.5% of total production of the OMIMSA I and OMIMSA II concentrators from Buenavista, and starting in 2010, the concentrates from the IMMSA mines, as we closed the San Luis Potosi smelter.
Other facilities in the smelter include two sulfuric acid plants with capacities of 2,625 and 2,135 tons per day, three oxygen plants each with a production capacity of 275 tons per day; and one power turbine which generates 11.5 MWh.
Refinery
La Caridad includes an electrolytic copper refinery that uses permanent cathode technology. The installed capacity of the refinery is 300,000 tons per year. The refinery consists of an anode plant with a preparation area, an electrolytic plant with an electrolytic cell house with 1,115 cells and 32 liberator cells, two cathode stripping machines, an anode washing machine, a slime treatment plant and a number of ancillary installations. The refinery is producing grade A (LME) and grade 1 (COMEX) copper cathode of 99.99% purity. Anodic slimes are recovered from the refining process and sent to the slimes treatment plant where additional copper is extracted. The slimes are then filtered, dried, packed and shipped to the La Caridad precious metals refinery to produce silver and gold.
Precious Metals Plant
The operations of the precious metal refinery begin with the reception of anodic slimes, which are dried in a steam dryer. After this, the dried slime is smelted and a gold and silver alloy is obtained, which is known as Dore. The precious metal refinery plant has a hydrometallurgical stage and a pyrometallurgical stage, besides a steam dryer, Dore casting system, Kaldo furnace, 20 electrolytic cells in the silver refinery, one induction furnace for fine silver, one silver ingot casting system and two reactors for obtaining fine gold. The process ends with the refining of the gold and silver alloy. We also recover commercial selenium from the gas produced by the Kaldo furnace process.
Copper Rod Plant
A rod plant at the La Caridad complex began operations in 1998 and reached its full annual operating capacity of 150,000 tons in 1999. The plant is producing eight millimeter copper rods with a purity of 99.99%.
Effluent and Dust Treatment Plant
In 2012, we started operating a dust and effluent plant with a treatment capacity of 5,000 tons of smelter dusts per year which will produce 1,500 tons of copper by-products and 2,500 tons of lead
50
sulfates per year. This plant is designed to reduce dust emissions from La Caridad metallurgical complex.
The table below sets forth 2016, 2015 and 2014 production information for the La Caridad processing facilities:
| |
|
|
|
|
Variance 2016 - 2015 |
|||||||||||||
|---|---|---|---|---|---|---|---|---|---|---|---|---|---|---|---|---|---|---|
| |
|
2016 | 2015 | 2014 | Volume | % | ||||||||||||
Smelter |
||||||||||||||||||
Total copper concentrate smelted |
(kt) | 1,004.8 | 933.4 | 926.4 | 71.4 | 7.7 | % | |||||||||||
Anode copper production |
(kt) | 269.5 | 257.9 | 259.6 | 11.6 | 4.5 | % | |||||||||||
Average copper content in anode |
(%) | 99.38 | 99.34 | 99.38 | 0.04 | — | ||||||||||||
Average smelter recovery |
(%) | 96.8 | 98.3 | 97.4 | (1.5 | ) | (1.5 | )% | ||||||||||
Sulfuric acid production |
(kt) | 1,007.9 | 972.4 | 960.8 | 35.5 | 3.7 | % | |||||||||||
Refinery |
||||||||||||||||||
Refined cathode production |
(kt) | 224.2 | 213.4 | 204.3 | 10.8 | 5.1 | % | |||||||||||
Refined silver production |
(000 kg) | 256.9 | 238.2 | 225.1 | 18.7 | 7.9 | % | |||||||||||
Refined gold production |
(Kg) | 4,805.8 | 4,578.5 | 1,541.8 | 227.3 | 5.0 | % | |||||||||||
Rod Plant |
||||||||||||||||||
Copper rod production |
(kt) | 144.5 | 138.2 | 129.1 | 6.3 | 4.6 | % | |||||||||||
Sales data: |
||||||||||||||||||
Average realized price copper rod |
($ per lb) | 2.25 | 2.49 | 3.18 | (0.24 | ) | (9.6 | )% | ||||||||||
Average premium copper rod |
($ per lb) | 0.13 | 0.11 | 0.10 | 0.02 | 18.2 | % | |||||||||||
Average realized price gold |
($ per ounce) | 1,254.68 | 1,149.91 | 1,240.67 | 104.77 | 9.1 | % | |||||||||||
Average realized price silver |
($ per ounce) | 17.29 | 15.75 | 18.77 | 1.54 | 9.8 | % | |||||||||||
Average realized price sulfuric acid |
($ per ton) | 47.94 | 63.92 | 66.40 | (15.98 | ) | (25.0 | )% | ||||||||||
- Key:
- kt =
thousand tons
Kg = kilograms
MEXICAN IMMSA UNIT
Our IMMSA unit (underground mining poly-metallic division) operates five underground mining complexes situated in central and northern Mexico and produces zinc, lead, copper, silver and gold, and has a coal mine. These complexes include industrial processing facilities for zinc, lead, copper and silver. All of IMMSA's mining facilities employ exploitation systems and conventional equipment. We believe that all the plants and equipment are in satisfactory operating condition. IMMSA's principal mining facilities include Charcas, Santa Barbara, San Martin, Santa Eulalia and Taxco.
51
The table below sets forth 2016, 2015 and 2014 production information for our Mexican IMMSA unit:
| |
|
|
|
|
Variance 2016 - 2015 |
|||||||||||||
|---|---|---|---|---|---|---|---|---|---|---|---|---|---|---|---|---|---|---|
| |
|
2016 | 2015 | 2014 | Volume | % | ||||||||||||
Average annual operating days(*) |
353 | 234 | 247 | |||||||||||||||
Total material mined and milled |
(kt) | 3,031 | 2,631 | 2,471 | 400 | 15.2 | % | |||||||||||
Zinc: |
||||||||||||||||||
Zinc average ore grade |
(%) | 2.81 | 2.68 | 3.00 | 0.13 | 4.8 | % | |||||||||||
Zinc average recovery |
(%) | 86.93 | 87.88 | 89.73 | (0.95 | ) | (1.1 | )% | ||||||||||
Zinc concentrate produced |
(kt) | 140.0 | 115.0 | 124.0 | 25 | 21.7 | % | |||||||||||
Zinc concentrate average grade |
(%) | 52.96 | 53.81 | 53.74 | (0.85 | ) | (1.6 | )% | ||||||||||
Zinc in concentrate |
(kt) | 73.9 | 61.9 | 66.6 | 12 | 19.3 | % | |||||||||||
Lead: |
||||||||||||||||||
Lead average ore grade |
(%) | 1.00 | 0.96 | 1.06 | 0.04 | 4.1 | % | |||||||||||
Lead average recovery |
(%) | 80.41 | 82.05 | 85.16 | (1.64 | ) | (1.9 | )% | ||||||||||
Lead concentrate produced |
(kt) | 40.7 | 32.8 | 36.1 | 7.9 | 24 | % | |||||||||||
Lead concentrate average grade |
(%) | 59.88 | 63.15 | 61.72 | (3.27 | ) | (5.2 | )% | ||||||||||
Lead in concentrate |
(kt) | 24.4 | 20.7 | 22.3 | 3.7 | 17.8 | % | |||||||||||
Copper: |
||||||||||||||||||
Copper average ore grade |
(%) | 0.37 | 0.38 | 0.39 | (0.01 | ) | (2.6 | )% | ||||||||||
Copper average recovery |
(%) | 56.83 | 55.32 | 54.31 | 1.51 | 2.8 | % | |||||||||||
Copper concentrate produced |
(kt) | 24.9 | 23.5 | 20.1 | 1.4 | 5.9 | % | |||||||||||
Copper concentrate average grade |
(%) | 25.86 | 23.82 | 25.95 | 2.04 | 8.5 | % | |||||||||||
Copper in concentrate |
(kt) | 6.4 | 5.6 | 5.2 | 0.8 | 14.2 | % | |||||||||||
Silver: |
||||||||||||||||||
Silver average ore grade |
(ounces) | 2.35 | 2.31 | 2.71 | 0.04 | 1.7 | % | |||||||||||
Silver average recovery |
(%) | 79.41 | 81.53 | 81.14 | (2.12 | ) | (2.6 | )% | ||||||||||
Silver concentrate average grade |
(ounces/) | 30.4 | 29.2 | 27.5 | 1.2 | 3.9 | % | |||||||||||
Silver in concentrates |
(000) ounces) | 5,622.0 | 4,995.0 | 4,944.9 | 627.0 | 12.5 | % | |||||||||||
kt = thousand tons
- (*)
- Weighted average annual operating days based on total material mined and milled in the three active mines: Charcas, Santa Barbara, and Santa Eulalia.
Charcas
The Charcas mining complex is located 111 kilometers north of the city of San Luis Potosi in the State of San Luis Potosi, Mexico. Charcas is connected to the state capital by a paved highway of 130 kilometers. It was discovered in 1573 and operations in the 20th century began in 1911. The complex includes three underground mines (San Bartolo, Rey-Reina and La Aurora) and one flotation plant that produces zinc, lead and copper concentrates, with significant amounts of silver. The Charcas mine is characterized by low operating costs and good quality ores and is situated near the zinc refinery. Regarding its geology, economic ore is found as replacement sulfurs in carbonates host rock. The ore mineralogy is comprised predominantly of calcopyrite (CuFeS2), sphalerite (ZnS), galena (PbS) and silver minerals as diaphorite (Pb2Ag3Sb3S8). The Charcas mine is now Mexico's largest producer of zinc.
In October 2015, an earthquake damaged some underground facilities as well as the access to the mine. Consequently, normal mine operations were interrupted. In 2016, operations took place normally and a production compliance of 97% was reached.
52
Mine exploration in 2014 included 38,643 meters of surface diamond drilling and 16,893 meters from underground stations, which increased our reserves by 1,474,964 tons. For 2015, it included 32,144 meters of surface drilling and 20,536 meters from underground stations, which increased our reserves by 3,089,797 tons. For 2016, it included 20,000 meters of surface drilling and 20,754 meters from underground stations, which increased our reserves by 1,778,728 tons. For 2017, 40,000 meters of diamond drilling are planned to identify additional reserves.
Santa Barbara
The Santa Barbara mining complex is located approximately 26 kilometers southwest of the city of Hidalgo del Parral in southern Chihuahua, Mexico. The area can be reached via paved road from Hidalgo del Parral, a city on a federal highway. It was discovered in 1536 and mining activities in the 20th century began in 1913. Santa Barbara includes three main underground mines (San Diego, Segovedad and Tecolotes) and a flotation plant and produces lead, copper and zinc concentrates, with significant amounts of silver.
Regarding its geology, economic ore minerals include sphalerite (ZnS), marmatite (ZnFeS), galena (PbS), chalcopyrite (CuFeS2) and tetrahedrite (CuFe12Sb4S13). Due to the variable characteristics of the ore bodies, four types of mining methods are used: shrinkage stoping, long-hole drilled open stoping, cut-and-fill stoping and horizontal bench stoping. The ore, once crushed, is processed in the flotation plant to produce concentrates.
Mine exploration in 2014 included 46,000 meters of surface diamond drilling and 15,231 meters from underground stations, which increased reserves by 4,084,041 tons. For 2015, it included 5,977 meters of surface drilling and 16,609 meters from underground stations, which increased our reserves by 1,135,750 tons. For 2016, it included 14,300 meters from underground stations, which increased our reserves by 1,416,756 tons. For 2017, 13,700 meters of diamond drilling from underground stations are planned to identify additional reserves.
Santa Eulalia
The mining district of Santa Eulalia is located in the central part of the state of Chihuahua, Mexico, approximately 26 kilometers east of the city of Chihuahua, and is connected to the city of Chihuahua by a paved road (highway no. 45). It was discovered in 1590 but exploitation began in 1870. The main mines in Santa Eulalia are The Buena Tierra mine and the San Antonio mine.
Regarding its geology, the mineralization corresponds in its majority to ore skarns: silicoaluminates of calcium, iron and manganese with variable quantities of lead, zinc, copper and iron sulfides. Economic ore include sphalerite (ZnS), galena (PbS) and small quantities of pyrargyrite (Ag3SbS3).
Mine exploration in 2014 included 17,300 meters of surface drilling. For 2015, it included 3,014 meters from underground stations, which increased our reserves by 64,800 tons. For 2017, 7,135 meters of diamond drilling are planned to identify additional reserves.
In the third quarter of 2014, the Santa Eulalia mine suspended operations due to a flooding in the area brought on by the failure of a dike caused by excess water pressure. Production was restored in November 2015.
San Martin and Taxco
San Martin and Taxco have been on strike since July 2007. Please see Note 13 "Commitments and Contingencies—Labor matters" to our consolidated financial statements.
The San Martin mining complex is located in the municipality of Sombrerete in the western part of the state of Zacatecas, Mexico. It was discovered in 1555 and mining operations in the 20th century
53
began in 1949. The complex includes an underground mine and a flotation plant. The ore body contains lead, copper and zinc concentrates, with significant amounts of silver.
The Taxco mining complex is located on the outskirts of the city of Taxco in the northern part of the state of Guerrero, Mexico. It was discovered in 1519 and mining activities in the 20th century began in 1918. The complex includes several underground mines (San Antonio, Guerrero and Remedios) and a flotation plant. The ore contains lead and zinc concentrates, with some amounts of gold and silver.
There was no mine exploration drilling in San Martin and Taxco during the three years ended December 31, 2016 because of the strikes.
Processing Facilities—San Luis Potosi
Our San Luis Potosi electrolytic zinc refinery is located in the city of San Luis Potosi, in the state of San Luis Potosi, Mexico. The city of San Luis Potosi is connected to our refinery by a major highway.
Zinc Refinery
The San Luis Potosi electrolytic zinc refinery was built in 1982 and was designed to produce 105,000 tons of refined zinc per year by treating up to 200,000 tons of zinc concentrate from our own mines, principally Charcas, which is located 113 kilometers from the refinery. The refinery produces special high grade zinc (99.995% zinc), high grade zinc (over 99.9% zinc) and zinc-based alloys with aluminum, lead, copper or magnesium in varying quantities and sizes depending on market demand. Refined silver and gold production is obtained from tolling services provided by a third party mining company.
The electrolytic zinc refinery has an acid plant, a steam recovery boiler and a roaster. There is also a calcine processing area with five leaching stages: neutral, hot acid, intermediate acid, acid, purified fourth and jarosite, as well as two stages for solution purifying.
The table below sets forth 2016, 2015 and 2014 production information for our San Luis Potosi zinc refinery:
| |
|
|
|
|
Variance 2016 - 2015 |
|||||||||||||
|---|---|---|---|---|---|---|---|---|---|---|---|---|---|---|---|---|---|---|
| |
|
2016 | 2015 | 2014 | Volume | % | ||||||||||||
Total zinc concentrate treated |
(kt) | 202.0 | 191.7 | 187.3 | 10.3 | 5.4 | % | |||||||||||
Refined zinc produced |
(kt) | 106.1 | 100.5 | 92.1 | 5.6 | 5.6 | % | |||||||||||
Sulfuric acid produced |
(kt) | 181.3 | 183.7 | 171.5 | (2.4 | ) | (1.3 | )% | ||||||||||
Refined silver produced |
(kt) | 10.5 | 11.3 | 11.0 | (0.8 | ) | (7.0 | )% | ||||||||||
Refined gold produced |
(k) | 14.4 | 14.0 | 16.0 | 0.4 | 2.8 | % | |||||||||||
Refined cadmium produced |
(kt) | 0.7 | 0.6 | 0.6 | 0.1 | 1.6 | % | |||||||||||
Average refinery recovery |
(%) | 93.8 | 93.7 | 94.1 | 0.1 | 0.1 | % | |||||||||||
Average realized price refined zinc |
($ per lb) | 100.1 | 94.60 | 103.70 | 5.5 | 5.8 | % | |||||||||||
Average realized price zinc concentrate |
($ per lb) | 91.62 | 83.21 | 92.60 | 8.41 | 10.1 | % | |||||||||||
Average realized price silver |
($ per oz) | 17.10 | 15.68 | 19.28 | 1.42 | 9.0 | % | |||||||||||
kt = thousand tons
Nueva Rosita Coal and Coke Complex
The Nueva Rosita coal and coke complex began operations in 1924 and is located in the state of Coahuila, Mexico, on the outskirts of the city of Nueva Rosita near the Texas border. It includes (a) an
54
underground coal mine, which has been closed since 2006; (b) an open-pit mine with a yearly capacity of approximately 350,000 tons of coal; (c) a coal washing plant with a capacity of 900,000 tons per year that produces high quality clean coal; and d) a re-engineered and modernized 21 ovens coke facility capable of producing 100,000 tons of coke per year (metallurgical, nut and fine) of which, 95,000 tons are metallurgical coke. There is also a by-product plant to clean the coke gas oven in which tar, ammonium sulfate and light crude oil are recovered. There are also two boilers, which produce 80,000 pounds of steam that is used in the by-products plant. We believe the plant's equipment is in good physical condition and suitable for our operations.
Coke production is sold to Penoles and other Mexican consumers in northern Mexico. We sold 77,417 tons, 84,793 tons and 90,796 tons of metallurgical coke in 2016, 2015 and 2014, respectively. We expect to sell 60,554 tons of metallurgical coke in 2017.
Carbon mine exploration
In Coahuila, an intensive exploration program of diamond drilling has identified two additional areas, Esperanza with a potential for more than 30 million tons of "in place" mineralized coal and Guayacan with a potential for 15 million tons of "in place" mineralized coal, that could be used for a future coal-fired power plant. In 2013 we drilled 2,451 meters and increased our coal reserve estimate by 39,552 tons at the La Conquista pit. In 2014, we drilled 3,100 meters of diamond drilling and increased our estimated reserves by 300,000 tons. In 2015, we drilled 3,046 meters and increased our reserves by 465,509 tons. In 2016, we drilled 1,052 meters and finished the last stage of exploration in two areas for open pit, San Jose y Cuatro y medio, and increased reserves by 607,532. For 2017, we expect to execute a drilling program of 1,000 meters.
The table below sets forth 2016, 2015 and 2014 production information for our Nueva Rosita coal and coke complex:
| |
|
|
|
|
Variance 2016 - 2015 |
|||||||||||||
|---|---|---|---|---|---|---|---|---|---|---|---|---|---|---|---|---|---|---|
| |
|
2016 | 2015 | 2014 | Volume | % | ||||||||||||
Coal mined—open-pit |
(kt) | 194.3 | 248.5 | 276.1 | (54.2 | ) | (21.8 | )% | ||||||||||
Average BTU content |
BTU/Lb | 9,485 | 9,485 | 9,485 | — | — | ||||||||||||
Average percent sulfur |
% | 1.49 | 1.49 | 1.49 | — | — | ||||||||||||
Clean coal produced |
(kt) | 86.2 | 114.3 | 149.8 | (28.1 | ) | (24.5 | )% | ||||||||||
Coke tonnage produced |
(kt) | 71.7 | 97.5 | 96.1 | (25.8 | ) | (26.4 | )% | ||||||||||
Average realized price—Coal |
($ per ton) | 40.2 | 39.9 | 46.2 | 0.3 | 0.7 | % | |||||||||||
Average realized price—Arsenic clean coal |
($ per ton) | — | — | — | — | — | ||||||||||||
Average realized price—Coke |
($ per ton) | 215.0 | 250.0 | 260.52 | (35.0 | ) | (0.1 | )% | ||||||||||
kt = thousand tons
ORE RESERVES
Ore reserves are those estimated quantities of proven and probable material that may be economically mined and processed for extraction of their mineral content, at the time of the reserve determination. "Proven" (measured) reserves are reserves for which (a) quantity is computed from dimensions revealed in outcrops, trenches, workings or drill holes; (b) grade and/or quality are computed from the results of detailed samplings; and (c) the sites for inspection, sampling and measurement are spaced so closely and the geologic character is so well defined that size, shape, depth and mineral content of reserves are well-established. "Probable" (indicated) reserves are reserves for which quantity and grade and/or quality are computed from information similar to that used for proven (measured) reserves, but the sites for inspection, sampling, and measurement are farther apart or are
55
otherwise less adequately spaced. The degree of assurance, although lower than that for proven (measured) reserves, is high enough to assume continuity between points of observation. "Mineralized material," on the other hand, is a mineralized body that has been delineated by appropriately spaced drilling and/or underground sampling to support the reported tonnage and average grade of metal(s). Such a deposit does not qualify as a reserve until legal and economic feasibility are concluded based upon a comprehensive evaluation of unit costs, grade, recoveries and other material factors.
Our proven and probable ore reserve estimates are based on engineering evaluations of assay values derived from the sampling of drill holes and other openings. We believe that the samplings taken are spaced at intervals sufficiently close enough and the geological characteristics of the deposits are sufficiently well defined to render the estimates reliable. The ore reserves estimates include assessments of the resource, mining and metallurgy, as well as economic, marketing, legal, environmental, governmental, social and other necessary considerations.
Our Peruvian operations, including the Toquepala and Cuajone reserves, are classified into proven (measured), probable (indicated) and possible (inferred) categories based on a Relative Confidence Bound Index ("RCB Index") that measures our level of geologic knowledge and confidence in each block. The RCB index is a measure of relative confidence in the block grade estimate. This approach combines the local variability of the composites used to krig a block with the kriging variance and incorporates the use of confidence intervals in measuring uncertainty of the block estimates relative to each other. The final resource classification is then based on the distribution of these RCB values for blocks above 0.05% copper. It is the distribution that is used to find the breaks between proven/probable and probable/possible.
Our Mexican operations, including the Buenavista and La Caridad reserves, are calculated using a mathematical block model and applying the MineSight software system. The estimated grades per block are classified as proven and probable. These grades are calculated applying a three-dimensional interpolation procedure and the inverse distance squared. Likewise, the quadrant method or spherical search is implemented in order to limit the number of composites that will affect the block's interpolated value. The composites data is derived from the geological exploration of the ore body. In order to classify the individual blocks in the model, a thorough geostatistical variogram analysis is conducted, taking into consideration the principal characteristics of the deposit. Based on this block model classification, and with the implementation of the Lerch-Grossman algorithm, and the MineSight Pit Optimizer procedure, mineable reserves are determined. The calculated proven and probable reserves include those blocks that are economically feasible to mine by open-pit method within a particular mine design.
For the IMMSA unit, the basis for reserve estimations are sampling of mining operations and drilling exploration, geographical and topographic surveys, tracking down all the foregoing in the corresponding maps, measurement, calculation and interpretation based on the maps and reports from the mines, the mills and/or smelters. Mineral reserves are mineral stock which is estimated for extraction, to exploit if necessary, to sell or utilize economically, all or in part, taking into consideration the quotations, subsidies, costs, availability of treatment plants and other conditions which we estimate will prevail in the period for which reserves are being calculated. The reserves are divided into proven (85% reliable or more according to statistical studies) and probable (70%-80% reliable or more according to statistical studies) categories according to their level of reliability and availability. In order to comply with SEC regulations, proven reserves is a classification that can only be used for such mineral found on top of the last level of the mine (either mineral up to 15 meters below the last level or below the first 15 meters only with sufficient drilling (25 or 30 meters between each drill)).
Annually our engineering department reviews in detail the reserve computations. In addition, our engineering department reviews the computation when changes in assumptions occur. Changes can occur for price or cost assumptions, results in field drilling or new geotechnical parameters. We also engage third party consultants to review mine planning procedures.
56
Pursuant to SEC guidance, the reserves information in this report are calculated using average metals prices over the most recent three years unless otherwise stated. We refer to these three-year average metals prices as "current prices." Our current prices for copper are calculated using prices quoted by COMEX, and our current prices for molybdenum are calculated according to Platt's Metals Week. Unless otherwise stated, reserves estimates in this report use $2.61 per pound for copper and $8.10 per pound for molybdenum, both current prices as of December 31, 2016. The current prices for copper and molybdenum were $2.99 and $9.38 as of December 31, 2015 and $3.36 and $11.39 as of December 31, 2014, respectively.
For internal ore reserve estimation, our management uses long-term metal price assumptions for copper and molybdenum. At December 31, 2016, we consider $2.90 per pound of copper and $6.50 per pound of molybdenum. At December 31,2015, we considered $2.90 per pound of copper and $9.50 per pound of molybdenum; which we believe to be conservative prices for long-term trends. For other forecast and planning purposes, particularly related to merger and acquisition activities, our management considers various other price scenarios. The use of these other price assumptions does not affect the preparation of our financial statements.
For the years 2016, 2015 and 2014, we have used reserve estimates based on current average prices as of the most recent three years then ended to determine amortization of mine development and intangible assets.
We periodically reevaluate estimates of our ore reserves, which represent our estimate as to the amount of unmined copper remaining in our existing mine locations that can be produced and sold at a profit. These estimates are based on engineering evaluations derived from samples of drill holes and other openings, combined with assumptions about copper market prices and production costs at each of our mines.
The persons responsible for ore reserve calculations are as follows:
Peruvian open-pit:
Cuajone mine—Edgar A. Peña Valenzuela, Mine Engineering Superintendent
Toquepala mine—Wilbert Perez, Mine Engineering Superintendent
Tia Maria project:
Jaime Arana Murriel, Investment Projects Leaching Manager
Yuver Velasquez Pari, Investment Projects Mine Engineer
Mexican open-pit:
La Caridad Mine—Marco A. Figueroa, Engineering and Mine Planning Superintendent
Buenavista mine—Jesus Molinares, Engineering and Mine Planning Superintendent
IMMSA unit:
Santa Barbara—Jorge M. Espinosa, Planning and Control Superintendent
Charcas—Juan J. Aguilar, Planning and Control Superintendent
Santa Eulalia—Juan M. Martinez, Planning and Control Superintendent
Taxco—Armando Aranda, Chief of Geology
San Martin—Maria I. Carrillo, Chief Engineer
El Arco project:
Mario Arturo Gascon, Special Studies Manager (with support of Hexagon Mining)
El Pilar project:
Mario Arturo Gascon, Special Studies Manager (with support of Hexagon Mining)
For more information regarding our reserve estimates, please see Item 7 "Management's Discussion and Analysis of Financial Condition and Results of Operations—Critical Accounting Policies and Estimates—Ore Reserves."
57
Ore Reserves Estimated at Current Prices:
The table below details our estimated proven and probable copper and molybdenum reserves at December 31, 2016 based on the last three year average market prices following SEC guidance:
| |
PERUVIAN OPEN-PIT UNIT |
MEXICAN OPEN-PIT UNIT |
|
|
|
|
|
|||||||||||||||||||||
|---|---|---|---|---|---|---|---|---|---|---|---|---|---|---|---|---|---|---|---|---|---|---|---|---|---|---|---|---|
| |
|
|
DEVELOPMENT PROJECTS | |||||||||||||||||||||||||
| |
Cuajone Mine(1) |
Toquepala Mine(1) |
Buenavista Mine(1) |
La Caridad Mine(1) |
TOTAL OPEN-PIT MINES |
MEXICAN IMMSA UNIT(2) |
||||||||||||||||||||||
| |
Tia Maria | El Arco | El Pilar | |||||||||||||||||||||||||
Mineral Reserves |
||||||||||||||||||||||||||||
Metal prices: |
||||||||||||||||||||||||||||
Copper ($/lb.) |
2.609 | 2.609 | 2.609 | 2.609 | 2.609 | 2.609 | 2.609 | 2.609 | 2.609 | |||||||||||||||||||
Molybdenum ($/lb.) |
8.104 | 8.104 | 8.104 | 8.104 | 8.104 | 8.104 | ||||||||||||||||||||||
Cut-off grade |
0.227 | % | 0.245 | % | 0.203 | % | 0.121 | % | 0.194 | % | 0.205 | % | 0.150 | % | ||||||||||||||
Proven |
||||||||||||||||||||||||||||
Sulfide ore reserves (kt) |
984,188 | 1,795,794 | 2,536,912 | 1,978,244 | 7,295,138 | 17,717 | 1,369,493 | |||||||||||||||||||||
Average grade: |
||||||||||||||||||||||||||||
Copper |
0.584 | % | 0.571 | % | 0.498 | % | 0.240 | % | 0.458 | % | 0.450 | % | 0.443 | % | ||||||||||||||
Molybdenum |
0.020 | % | 0.034 | % | 0.009 | % | 0.029 | % | 0.022 | % | 0.007 | % | ||||||||||||||||
Lead |
1.250 | % | ||||||||||||||||||||||||||
Zinc |
2.840 | % | ||||||||||||||||||||||||||
Leachable material (kt) |
1,977 | 830,047 | 2,220,500 | 516,591 | 3,569,115 | 214,232 | 238,052 | 289,571 | ||||||||||||||||||||
Leachable material grade |
0.672 | % | 0.217 | % | 0.191 | % | 0.179 | % | 0.196 | % | 0.328 | % | 0.274 | % | 0.292 | % | ||||||||||||
Probable |
||||||||||||||||||||||||||||
Sulfide ore reserves (kt) |
822,016 | 133,154 | 1,156,037 | 908,889 | 3,020,096 | 28,147 | 972,955 | |||||||||||||||||||||
Average grade: |
||||||||||||||||||||||||||||
Copper |
0.434 | % | 0.368 | % | 0.442 | % | 0.228 | % | 0.372 | % | 0.530 | % | 0.405 | % | ||||||||||||||
Molybdenum |
0.018 | % | 0.013 | % | 0.010 | % | 0.030 | % | 0.018 | % | 0.008 | % | ||||||||||||||||
Lead |
0.910 | % | ||||||||||||||||||||||||||
Zinc |
2.940 | % | ||||||||||||||||||||||||||
Leachable material (kt) |
2,866 | 955,589 | 814,178 | 155,340 | 1,927,973 | 518,074 | 112,554 | 20,408 | ||||||||||||||||||||
Leachable material grade |
0.603 | % | 0.159 | % | 0.168 | % | 0.169 | % | 0.164 | % | 0.367 | % | 0.118 | % | 0.264 | % | ||||||||||||
Total |
||||||||||||||||||||||||||||
Sulfide ore reserves (kt) |
1,806,204 | 1,928,948 | 3,692,948 | 2,887,133 | 10,315,233 | 45,864 | 2,342,448 | |||||||||||||||||||||
Average grade: |
||||||||||||||||||||||||||||
Copper |
0.516 | % | 0.557 | % | 0.480 | % | 0.236 | % | 0.433 | % | 0.499 | % | 0.427 | % | ||||||||||||||
Molybdenum |
0.019 | % | 0.033 | % | 0.009 | % | 0.029 | % | 0.021 | % | 0.007 | % | ||||||||||||||||
Lead |
1.041 | % | ||||||||||||||||||||||||||
Zinc |
2.901 | % | ||||||||||||||||||||||||||
Leachable material (kt) |
4,843 | 1,785,636 | 3,034,678 | 671,931 | 5,497,088 | 732,307 | 350,605 | 309,979 | ||||||||||||||||||||
Leachable material grade |
0.631 | % | 0.186 | % | 0.185 | % | 0.177 | % | 0.185 | % | 0.356 | % | 0.224 | % | 0.290 | % | ||||||||||||
Waste (kt) |
4,919,585 | 7,648,781 | 5,776,086 | 1,768,341 | 20,112,793 | 655,490 | 1,557,714 | 490,887 | ||||||||||||||||||||
Total material (kt) |
6,730,632 | 11,363,365 | 12,503,712 | 5,327,405 | 35,925,114 | 45,864 | 1,387,797 | 4,250,767 | 800,866 | |||||||||||||||||||
Stripping ratio ((W+L)/O) |
2.73 | 4.89 | 2.39 | 0.85 | 2.48 | 0.81 | ||||||||||||||||||||||
Stripping ratio (W/(L+O)) |
2.72 | 2.06 | 0.86 | 0.50 | 1.27 | 0.90 | 0.58 | 1.58 | ||||||||||||||||||||
Leachable material |
||||||||||||||||||||||||||||
Reserves in stock (kt) |
18,610 | 1,361,659 | 1,373,182 | 799,006 | 3,552,457 | |||||||||||||||||||||||
Average copper grade |
0.495 | % | 0.155 | % | 0.156 | % | 0.245 | % | 0.177 | % | ||||||||||||||||||
In pit reserves: |
||||||||||||||||||||||||||||
Proven (kt) |
1,977 | 830,047 | 2,220,500 | 516,591 | 3,569,115 | 214,233 | 238,052 | 289,571 | ||||||||||||||||||||
Average copper grade |
0.672 | % | 0.217 | % | 0.191 | % | 0.179 | % | 0.196 | % | 0.328 | % | 0.274 | % | 0.292 | % | ||||||||||||
Probable (kt) |
2,866 | 955,589 | 814,178 | 155,340 | 1,927,973 | 518,074 | 112,554 | 20,408 | ||||||||||||||||||||
Average copper grade |
0.603 | % | 0.159 | % | 0.168 | % | 0.169 | % | 0.164 | % | 0.367 | % | 0.118 | % | 0.264 | % | ||||||||||||
Total leachable reserves (kt) |
23,453 | 3,147,295 | 4,407,860 | 1,470,937 | 9,049,545 | 732,307 | 350,605 | 309,979 | ||||||||||||||||||||
Average copper grade |
0.523 | % | 0.173 | % | 0.176 | % | 0.214 | % | 0.182 | % | 0.356 | % | 0.224 | % | 0.290 | % | ||||||||||||
Copper contained in ore reserves in pit(kt)(3) |
9,351 | 14,066 | 23,340 | 8,003 | 54,760 | 229 | 2,607 | 10,788 | 899 | |||||||||||||||||||
kt = Thousand tons
W= Waste, L= Leachable material; O= Ore.
- (1)
- The
Cuajone, Toquepala, Buenavista and La Caridad concentrator recoveries calculated for these reserves were 86.0%, 86.3%, 83.0%, and 82.0%, respectively, obtained
by using recovery formulas according to the different milling capacity and geo-metallurgical zones.
- (2)
- The IMMSA unit includes the Charcas, Santa Barbara, San Martin, Santa Eulalia and Taxco mines. Zinc and lead contained in ore reserves are as follows:
| (in thousand tons) |
Proven | Probable | Total | |||||||
|---|---|---|---|---|---|---|---|---|---|---|
Zinc |
503,158 | 827,517 | 1,330,675 | |||||||
Lead |
221,460 | 256,136 | 477,597 | |||||||
- (3)
- Copper contained in ore reserves for open-pit mines is (i) the product of sulfide ore reserves and the average copper grade proven plus (ii) the product of sulfide ore reserves and the average copper grade probable plus (iii) the product of in-pit leachable reserves and the average copper grade. Copper contained in ore reserves for underground mines is the product of sulfide ore reserves and the average copper grade.
58
Metal Price Sensitivity:
In preparing the sensitivity analysis, we recalculated our reserves based on the assumption that current average metal prices were 20% higher and 20% lower, respectively, than the actual current average prices for year-end 2016. Reserve results of this sensitivity analysis are not proportional to the increase or decrease in metal price assumptions.
| |
INCREASE—20% | DECREASE—20% | |||||||||||||||||
|---|---|---|---|---|---|---|---|---|---|---|---|---|---|---|---|---|---|---|---|
| |
Open-Pit Mines |
IMMSA | Development Projects |
Open-Pit Mines | IMMSA | Development Projects |
|||||||||||||
Mineral Reserves |
|||||||||||||||||||
Metal prices: |
|||||||||||||||||||
Copper ($/lb.) |
3.130 | 3.130 | 3.130 | 2.087 | 2.087 | 2.087 | |||||||||||||
Molybdenum ($/lb.) |
9.725 | 9.725 | 6.483 | 6.483 | |||||||||||||||
Cut-off grade |
0.162 | % | 0.164 | % | 0.246 | % | 0.272 | % | |||||||||||
Proven |
|||||||||||||||||||
Sulfide ore reserves (kt) |
8,587,901 | 18,681 | 1,051,533 | 5,398,849 | 15,740 | 1,292,681 | |||||||||||||
Average grade: |
|||||||||||||||||||
Copper |
0.431 | % | 0.450 | % | 0.389 | % | 0.504 | % | 0.470 | % | 0.459 | % | |||||||
Molybdenum |
0.021 | % | 0.007 | % | 0.022 | % | 0.008 | % | |||||||||||
Lead |
1.220 | % | 1.330 | % | |||||||||||||||
Zinc |
2.770 | % | 3.010 | % | |||||||||||||||
Leachable material (kt) |
3,046,986 | 635,299 | 3,848,770 | 694,439 | |||||||||||||||
Leachable material grade |
0.175 | % | 0.271 | % | 0.215 | % | 0.301 | % | |||||||||||
Probable |
|||||||||||||||||||
Sulfide ore reserves (kt) |
3,816,756 | 29,417 | 1,408,809 | 2,052,625 | 24,900 | 812,862 | |||||||||||||
Average grade: |
|||||||||||||||||||
Copper |
0.342 | % | 0.510 | % | 0.434 | % | 0.430 | % | 0.560 | % | 0.434 | % | |||||||
Molybdenum |
0.017 | % | 0.007 | % | 0.019 | % | 0.008 | % | |||||||||||
Lead |
0.890 | % | 0.950 | % | |||||||||||||||
Zinc |
2.890 | % | 3.000 | % | |||||||||||||||
Leachable material (kt) |
1,943,973 | 791,091 | 1,506,731 | 614,450 | |||||||||||||||
Leachable material grade |
0.146 | % | 0.333 | % | 0.186 | % | 0.331 | % | |||||||||||
Total |
|||||||||||||||||||
Sulfide ore reserves (kt) |
12,404,657 | 48,098 | 2,460,341 | 7,451,475 | 40,640 | 2,105,543 | |||||||||||||
Average grade: |
|||||||||||||||||||
Copper |
0.403 | % | 0.487 | % | 0.415 | % | 0.484 | % | 0.525 | % | 0.449 | % | |||||||
Molybdenum |
0.019 | % | 0.007 | % | 0.021 | % | 0.008 | % | |||||||||||
Lead |
1.018 | % | 1.097 | % | |||||||||||||||
Zinc |
2.844 | % | 3.004 | % | |||||||||||||||
Leachable material (kt) |
4,990,959 | 1,426,389 | 5,355,501 | 1,308,888 | |||||||||||||||
Leachable material grade |
0.164 | % | 0.305 | % | 0.207 | % | 0.315 | % | |||||||||||
Waste (kt) |
22,478,264 | 2,909,407 | 15,866,014 | 2,228,821 | |||||||||||||||
Total material (kt) |
39,873,880 | 48,098 | 6,796,137 | 28,672,990 | 40,640 | 5,643,253 | |||||||||||||
Stripping ratio ((W+L)/O) |
2.21 | 1.76 | 2.85 | 1.68 | |||||||||||||||
Stripping ratio (W/(L+O)) |
1.29 | 0.75 | 1.24 | 0.65 | |||||||||||||||
Leachable material |
|||||||||||||||||||
Reserves in stock (kt) |
3,552,457 | 3,552,457 | |||||||||||||||||
Average copper grade |
0.177 | % | 0.177 | % | |||||||||||||||
In pit reserves: |
|||||||||||||||||||
Proven (kt) |
3,046,986 | 635,299 | 3,848,770 | 694,439 | |||||||||||||||
Average copper grade |
0.175 | % | 0.271 | % | 0.215 | % | 0.301 | % | |||||||||||
Probable (kt) |
1,943,973 | 791,091 | 1,506,731 | 614,450 | |||||||||||||||
Average copper grade |
0.146 | % | 0.333 | % | 0.186 | % | 0.331 | % | |||||||||||
Total leachable reserves (kt) |
8,543,416 | 1,426,389 | 8,907,958 | 1,308,888 | |||||||||||||||
Average copper grade |
0.170 | % | 0.305 | % | 0.195 | 0.315 | % | ||||||||||||
Copper contained in ore reserves in pit(kt)(1) |
58,201 | 234 | 14,566 | 47,164 | 213 | 13,576 | |||||||||||||
- (1)
- Copper contained in ore reserves for open-pit mines is (i) the product of sulfide ore reserves and the average copper grade proven plus (ii) the product of sulfide ore reserves and the average copper grade probable plus (iii) the product of in-pit leachable reserves and the average copper grade. Copper contained in ore reserves for underground mines is the product of sulfide ore reserves and the average copper grade.
59
Internal Ore Reserves Estimates:
The table below details our proven and probable copper and molybdenum reserves as of December 31, 2016, estimated based on long-term price assumptions of $2.90 for copper and $6.50 for molybdenum. As discussed on page 53 the presentation of these internal ore reserve estimates are not compliant with SEC requirements, as the long-term price assumptions differ from the current prices used pursuant to SEC guidance. These internal ore reserve estimates do not affect the preparation of our financial statements.
| |
PERUVIAN OPEN-PIT UNIT |
MEXICAN OPEN-PIT UNIT |
|
|
|
|
|
|||||||||||||||||||||
|---|---|---|---|---|---|---|---|---|---|---|---|---|---|---|---|---|---|---|---|---|---|---|---|---|---|---|---|---|
| |
|
|
DEVELOPMENT PROJECTS | |||||||||||||||||||||||||
| |
Cuajone Mine |
Toquepala Mine |
Buenavista Mine |
La Caridad Mine |
TOTAL OPEN-PIT MINES |
MEXICAN IMMSA UNIT(1) |
||||||||||||||||||||||
| |
Tia Maria | El Arco | El Pilar | |||||||||||||||||||||||||
Mineral Reserves |
||||||||||||||||||||||||||||
Metal prices: |
||||||||||||||||||||||||||||
Copper ($/lb.) |
2.900 | 2.900 | 2.900 | 2.900 | 2.900 | 2.900 | 2.900 | 2.900 | 2.900 | |||||||||||||||||||
Molybdenum ($/lb.) |
6.500 | 6.500 | 6.500 | 6.500 | 6.500 | 6.500 | ||||||||||||||||||||||
Cut-off grade |
0.195 | % | 0.222 | % | 0.157 | % | 0.142 | % | 0.173 | % | 0.188 | % | 0.150 | % | ||||||||||||||
Proven |
||||||||||||||||||||||||||||
Sulfide ore reserves(kt) |
1,010,030 | 1,962,393 | 3,214,498 | 2,188,202 | 8,375,123 | 18,009 | 1,376,024 | |||||||||||||||||||||
Average grade: |
||||||||||||||||||||||||||||
Copper |
0.575 | % | 0.558 | % | 0.446 | % | 0.231 | % | 0.432 | % | 0.450 | % | 0.441 | % | ||||||||||||||
Molybdenum |
0.019 | % | 0.033 | % | 0.008 | % | 0.029 | % | 0.021 | % | 0.007 | % | ||||||||||||||||
Lead |
1.230 | % | ||||||||||||||||||||||||||
Zinc |
2.780 | % | ||||||||||||||||||||||||||
Leachable material (kt) |
2,143 | 752,980 | 1,772,519 | 451,994 | 2,979,636 | 217,124 | 236,496 | 302,091 | ||||||||||||||||||||
Leachable material grade |
0.638 | % | 0.207 | % | 0.164 | % | 0.186 | % | 0.179 | % | 0.325 | % | 0.275 | % | 0.289 | % | ||||||||||||
Probable |
||||||||||||||||||||||||||||
Sulfide ore reserves(kt) |
877,440 | 184,325 | 1,480,121 | 1,073,013 | 3,614,899 | 28,454 | 989,676 | |||||||||||||||||||||
Average grade: |
||||||||||||||||||||||||||||
Copper |
0.420 | % | 0.359 | % | 0.396 | % | 0.216 | % | 0.347 | % | 0.520 | % | 0.402 | % | ||||||||||||||
Molybdenum |
0.017 | % | 0.012 | % | 0.009 | % | 0.030 | % | 0.017 | % | 0.008 | % | ||||||||||||||||
Lead |
0.900 | % | ||||||||||||||||||||||||||
Zinc |
2.890 | % | ||||||||||||||||||||||||||
Leachable material (kt) |
3,235 | 1,016,919 | 671,928 | 137,372 | 1,829,454 | 528,940 | 112,146 | 22,440 | ||||||||||||||||||||
Leachable material grade |
0.560 | % | 0.152 | % | 0.144 | % | 0.174 | % | 0.151 | % | 0.363 | % | 0.117 | % | 0.260 | % | ||||||||||||
Total |
||||||||||||||||||||||||||||
Sulfide ore reserves(kt) |
1,887,470 | 2,146,718 | 4,694,620 | 3,261,215 | 11,990,022 | 46,463 | 2,365,700 | |||||||||||||||||||||
Average grade: |
||||||||||||||||||||||||||||
Copper |
0.503 | % | 0.541 | % | 0.430 | % | 0.226 | % | 0.406 | % | 0.493 | % | 0.425 | % | ||||||||||||||
Molybdenum |
0.018 | % | 0.031 | % | 0.008 | % | 0.030 | % | 0.020 | % | 0.007 | % | ||||||||||||||||
Lead |
1.028 | % | ||||||||||||||||||||||||||
Zinc |
2.847 | % | ||||||||||||||||||||||||||
Leachable material (kt) |
5,378 | 1,769,899 | 2,444,447 | 589,366 | 4,809,090 | 746,064 | 348,641 | 324,531 | ||||||||||||||||||||
Leachable material grade |
0.591 | % | 0.175 | % | 0.159 | % | 0.183 | % | 0.168 | % | 0.352 | % | 0.224 | % | 0.287 | % | ||||||||||||
Waste (kt) |
4,837,875 | 8,136,025 | 6,095,405 | 1,857,335 | 20,926,550 | 672,277 | 1,624,869 | 534,535 | ||||||||||||||||||||
Total material (kt) |
6,730,633 | 12,052,642 | 13,234,472 | 5,707,916 | 37,725,663 | 46,463 | 1,418,341 | 4,339,210 | 859,066 | |||||||||||||||||||
Stripping ratio ((W+L)/O) |
2.57 | 4.61 | 1.82 | 0.75 | 2.15 | 0.83 | ||||||||||||||||||||||
Stripping ratio (W/(L+O)) |
2.56 | 2.08 | 0.85 | 0.48 | 1.25 | 0.90 | 0.60 | 1.65 | ||||||||||||||||||||
Leachable material |
||||||||||||||||||||||||||||
Reserves in stock (kt) |
18,610 | 1,361,659 | 1,373,182 | 799,006 | 3,552,457 | |||||||||||||||||||||||
Average copper grade |
0.495 | % | 0.155 | % | 0.156 | % | 0.245 | % | 0.177 | % | ||||||||||||||||||
In-pit reserves: |
||||||||||||||||||||||||||||
Proven (kt) |
2,143 | 752,980 | 1,772,519 | 451,994 | 2,979,636 | 217,124 | 236,496 | 302,091 | ||||||||||||||||||||
Average copper grade |
0.638 | % | 0.207 | % | 0.164 | % | 0.186 | % | 0.179 | % | 0.325 | % | 0.275 | % | 0.289 | % | ||||||||||||
Probable(kt) |
3,235 | 1,016,919 | 671,928 | 137,372 | 1,829,454 | 528,940 | 112,146 | 22,440 | ||||||||||||||||||||
Average copper grade |
0.560 | % | 0.152 | % | 0.144 | % | 0.174 | % | 0.151 | % | 0.363 | % | 0.117 | % | 0.260 | % | ||||||||||||
Total leachable reserves |
23,988 | 3,131,558 | 3,817,629 | 1,388,372 | 8,361,547 | 746,064 | 348,641 | 324,531 | ||||||||||||||||||||
Average copper grade |
0.517 | % | 0.166 | % | 0.158 | % | 0.219 | % | 0.172 | % | 0.352 | % | 0.224 | % | 0.287 | % | ||||||||||||
Copper contained in ore reserves (kt)(2) |
9,526 | 14,711 | 24,074 | 8,449 | 56,760 | 229 | 2,626 | 10,835 | 931 | |||||||||||||||||||
(kt) =
Thousand tons
W= Waste, L= Leachable material; O= Ore.
- (1)
- The IMMSA unit includes the Charcas, Santa Barbara, San Martin, Santa Eulalia and Taxco mines. Zinc and lead contained in ore reserves are as follows:
| (in thousand tons) |
Proven | Probable | Total | |||||||
|---|---|---|---|---|---|---|---|---|---|---|
Zinc |
500,637 | 822,331 | 1,322,968 | |||||||
Lead |
221,505 | 256,089 | 477,594 | |||||||
Copper contained in ore reserves for open-pit mines is (i) the product of sulfide ore reserves and the average copper grade plus (ii) the product of in-pit leachable reserves and the average grade of copper. Copper contained in ore reserves for underground mines is the product of sulfide ore reserves and the average copper grade.
60
OVERVIEW OF BLOCK MODEL RECONCILIATION PROCESS
We apply the following block model to mill reconciliation procedure.
The following stages are identified at the Cuajone, Toquepala, Buenavista and La Caridad mines:
- 1.
- The
mine geologists gather the necessary monthly statistical data from our information system ("SRP"), which provides ore tons milled and ore grades in the
concentrator.
- 2.
- Mined
areas are topographically determined and related boundaries are built.
- 3.
- Using
the "interactive planner" option in our mining software (MineSight), ore tons and grades are calculated inside mined areas over the block model. At this point
the current cut-off grade is considered.
- 4.
- In the final stage, accumulated tons mined, weighted average grade for ore material and leach is compared to data coming from our SRP system.
Tonnage and grade reconciliation for 2016 are as follows:
| |
Long Range Model | Mill | Variance | ||||||||||||||||
|---|---|---|---|---|---|---|---|---|---|---|---|---|---|---|---|---|---|---|---|
Mine
|
Tons (thousands) |
% Copper | Tons (thousands) |
% Copper | Tons (thousands) |
% Copper | |||||||||||||
Cuajone |
29,956 | 0.631 | 30,825 | 0.649 | (869 | ) | (0.018 | ) | |||||||||||
Toquepala |
20.051 | 0.614 | 19,940 | 0.647 | 111 | (0.033 | ) | ||||||||||||
Buenavista |
65,957 | 0.550 | 66,328 | 0.566 | (371 | ) | (0.016 | ) | |||||||||||
La Caridad |
33,741 | 0.345 | 34,648 | 0.355 | (907 | ) | (0.010 | ) | |||||||||||
If the estimation error appears greater than 3%, a detailed evaluation is done to review the differences, which normally could result in more in-fill drilling, in order to better understand the geological characteristics (grade, rock type, mineralization and alteration) and the spacing of drill holes which are considered in the ore body zone.
AVERAGE DRILL-HOLE SPACING
The following is the average drill-hole spacing for proven and probable sulfide reserves as of December 31, 2016:
| |
Proven | Probable | |||||
|---|---|---|---|---|---|---|---|
| |
(average spacing in meters) |
||||||
Cuajone |
78.23 | 118.21 | |||||
Toquepala |
76.76 | 121.74 | |||||
Buenavista |
54.08 | 106.23 | |||||
La Caridad |
46.52 | 104.71 | |||||
EXPLORATION ACTIVITIES
We are engaged in ongoing extensive exploration to locate additional ore bodies in Peru, Mexico, Argentina, Ecuador and Chile. We also conduct exploration in the areas of our current mining operations. We invested $40.1 million in exploration programs in 2016, $48.8 million in 2015 and $74.6 million in 2014 and we expect to spend approximately $56.9 million in exploration programs in 2017.
Currently, we have direct control of 81,979 hectares and 154,937 hectares of exploration concessions in Peru and in Mexico, respectively. We also currently hold 36,097 hectares, 58,138 hectares and 2,543 hectares of exploration concessions in Argentina, Chile and Ecuador, respectively.
61
Peru
Los Chancas. This property, located in the department of Apurimac in southern Peru, is a copper and molybdenum porphyry deposit. Current estimates indicate the presence of 545 million tons of mineralized material with a copper content of 0.59%, molybdenum content of 0.04% and 0.039 grams of gold per ton and 181 million tons of mineralized leachable material with a total copper content of 0.357%. In 2016, we continued with the development of social and environmental improvements for the local communities. We plan to continue these in 2017, in conjunction with the development and presentation of the environmental impact assessment for the project.
Other Peruvian Prospects. During 2016, we completed the explorations at the Lana project, located in Arequipa, in southern Peru. Between April 2015 and May 2016, we drilled a total of 2,105 meters. Evaluation of the results were not satisfactory, therefore we decided not to continue with exploration in this project.
In addition, we explored several prospects in the south coast of Peru with a total of 22,087 meters of diamond drilling which results are currently under evaluation.
For 2017, after obtaining the environmental licenses in 2016, we will conduct a diamond drilling program of 5,000 meters at the Tambillo project, to confirm the existence of a copper-molybdenum porphyry deposit. The Tambillo project is located in the central coast of Peru. We also expect to conduct a diamond drilling program of 20,000 meters in mineralized zones, with evidences of copper porfides at the metollogenic zones in southern Peru. Additionally, we will continue with several prospection programs through Peruvian metallogenic zones.
Mexico
In addition to exploration and drilling programs at existing mines, we are currently conducting exploration to locate mineral deposits at various other sites in Mexico. The following are some of the more significant exploration projects:
Buenavista-Zinc. The Buenavista-Zinc site is located in the state of Sonora, Mexico and is part of the northwest Buenavista ore body. It is a skarn deposit containing zinc, copper, silver and lead sulfide mineralization. The deposit contains approximately 158 million tons of mineralized material, containing 1.76% of zinc, 0.54% of copper and 21 grams of silver per ton. In 2016, we reviewed the geological model of the deposit and the lithological description of prior drill holes which were analyzed using infrared spectrometry. The results were included in the reserves database. Currently, we are working on a revised mine plan which we expect to conclude in the first quarter 2017. In addition, we continue with the metallurgical flotation test in order to further optimize the flotation circuit process.
The Chalchihuites. This is a skarn type deposit located in the state of Zacatecas, close to the San Martin mining unit. Drilling programs conducted between 1980 and 2014 identified 12.6 million of mineralized material with an average silver content of 110 grams per ton, 2.66% of zinc, 0.37% of lead and 0.67% of copper. Current results indicate that mineralization consists of a complex mixture of oxides and sulfides of silver, lead and zinc that requires additional metallurgical research. For 2017, we expect to conduct a drilling program of 21,000 meters in order to continue the metallurgical research and testing.
Bella Union (La Caridad). This prospect is a mineralized copper and molybdenum breccia deposit; the site is located at less than one kilometer from the border of La Caridad pit. In 2016, we conducted a drilling program of 21,730 meters to define the geometry of the deposit. The results allowed the identification of 63.3 million tons of mineralized material with an average of 0.43% of copper content and 0.04% of molybdenum. In 2017 we will continue with drilling programs in order to complete its morphology delimitation. The program will include a hyperspectral aerial image of 40,000 square kilometers of La Caridad District and a diamond drilling program of 15,000 meters.
62
Campo Medio (Santa Eulalia). This prospect is located close to the west border of the Santa Eulalia mine. Preliminary geological surveying in the zone indicates the possible presence of replacement ore bodies in limestone, similar to ore bodies currently being mined at Santa Eulalia. During 2016, we completed a geochemical and geological survey of 800 hectares between the two currently operating mines and from which we obtained in the past more than 25 million metric tons of ore. The results obtained indicate the presence of potential mineralization in five different zones. In 2017, we expect to conduct a 5,000 meters drilling program as part of a geophysical survey to identify drilling targets and confirm the existence of mineralization in the zone.
Chile
El Salado (Montonero). A copper-gold prospect located in the Atacama region, northern Chile is being explored for copper and molybdenum porphyry since 2014. In 2016, we conducted a diamond drilling program of 12,169 meters in order to define mineral classification. For 2017, we expect to conduct a diamond drilling program of 4,000 meters to define a preliminar prefeasibility of the prospect.
Resguardo de la Costa. An epithermal gold deposit located at southern Chañaral. For 2017, we expect to conduct a diamond drilling program of 3,000 meters.
Other Chilean Prospects. For 2017, we expect to continue prospecting works in areas with interesting indicators of copper porphyry miineralization systems located in the Antofagasta region at the north of Chile.
Ecuador
Chaucha. the Ruta del Cobre ("Copper Road") project is located west of Cuenca city and south of Guayaquil. The mineralization is characteristic of a copper-molybdenum porphyry system which is being explored since 2014. In 2016, we conducted a diamond drilling program of 25,081 meters, in compliance with the socioenvironmental regulations of Ecuador. This drilling allowed us to consolidate the information obtained for a better geological and economic interpretation.For 2017, we expect to conduct a diamond drilling program of 12,000 meters in order to perform geotechnical and metallurgical studies, as well as, to prepare a conceptual study for an initial economic evaluation of the project.
Argentina
In 2011, we started exploration activities in Argentina. In 2015, we performed geological exploration in the Salta, Rio Negro and Neuquen provinces where we expected to locate copper porphyry with precious metals epithermal systems. During 2016, we completed the prospecting and the geological evaluation of two copper- gold systems: La Voluntad and Cochico, located in the Neuquen province. The results obtained were not satisfactory.
We also, concluded certain evaluation in third parties properties in the province of San Juan. We identified areas with potential of silver—gold epithermal systems in Cerro Abanico and Cerro Las Minas, located in the Rio Negro province.
For 2017, we plan to continue with the exploration of the silver—gold epithermal systems in Cerro Abanico and Cerro Las Minas. We also expect to begin exploration activities at the Marisa I prospect, located in the San Juan province. The concession was granted to the Company by a resolution from the Mining Authorities of the San Juan province. Preliminary results suggest the possible existence of a Copper- Molybdenum deposit.
Reference is made to the information under the caption "Litigation Matters" in the consolidated financial statement Note 13 "Commitments and contingencies."
ITEM 4. MINE SAFETY DISCLOSURE
Not applicable.
63
ITEM 5. MARKET FOR REGISTRANT'S COMMON EQUITY, RELATED STOCKHOLDER MATTERS AND ISSUER PURCHASES OF EQUITY SECURITIES
SCC COMMON STOCK:
SCC's common stock is traded on the New York Stock Exchange ("NYSE") and the Lima Stock Exchange ("BVL"). SCC's common stock symbol is SCCO on both the NYSE and the BVL. At December 31, 2016, there were 1,114 holders of record of our common stock.
DIVIDEND AND STOCK MARKET PRICES:
The table below sets forth the cash dividends paid per share of capital stock and the high and low stock prices on both the NYSE and the BVL for the periods indicated.
| For the year 2016 | ||||||||||||||||
|---|---|---|---|---|---|---|---|---|---|---|---|---|---|---|---|---|
| |
|
NYSE: | BVL: | |||||||||||||
| |
Dividend per Share |
|||||||||||||||
Quarters
|
High | Low | High | Low | ||||||||||||
1st |
$ | 0.03 | $ | 28.44 | $ | 22.29 | $ | 28.30 | $ | 22.37 | ||||||
2nd |
$ | 0.05 | $ | 30.21 | $ | 25.52 | $ | 30.00 | $ | 25.30 | ||||||
3rd |
$ | 0.05 | $ | 26.76 | $ | 25.20 | $ | 26.60 | $ | 25.20 | ||||||
4th |
$ | 0.05 | $ | 34.98 | $ | 26.01 | $ | 34.76 | $ | 26.02 | ||||||
| | | | | | | | | | | | | | | | | |
Year |
$ | 0.18 | $ | 34.98 | $ | 22.29 | $ | 34.76 | $ | 22.37 | ||||||
| For the year 2015 | ||||||||||||||||
|---|---|---|---|---|---|---|---|---|---|---|---|---|---|---|---|---|
| |
|
NYSE: | BVL: | |||||||||||||
| |
Dividend per Share |
|||||||||||||||
Quarters
|
High | Low | High | Low | ||||||||||||
1st |
$ | 0.10 | $ | 30.72 | $ | 25.56 | $ | 30.80 | $ | 25.40 | ||||||
2nd |
$ | 0.10 | $ | 33.14 | $ | 28.91 | $ | 32.82 | $ | 28.80 | ||||||
3rd |
$ | 0.10 | $ | 29.56 | $ | 24.40 | $ | 29.22 | $ | 24.20 | ||||||
4th |
$ | 0.04 | $ | 30.16 | $ | 24.45 | $ | 29.30 | $ | 24.50 | ||||||
| | | | | | | | | | | | | | | | | |
Year |
$ | 0.34 | $ | 33.14 | $ | 24.40 | $ | 32.82 | $ | 24.20 | ||||||
On January 26, 2017, the Board of Directors ("BOD") authorized a dividend of $0.08 per share payable on February 28, 2017, to shareholders of record at the close of business on February 14, 2017.
For a description of limitations on our ability to make dividend distributions, see "Management's Discussion and Analysis of Financial Condition and Results of Operations—"Liquidity and Capital Resources" and Note 11 "Financing" to our consolidated financial statements.
DIRECTORS' STOCK AWARD PLAN
The following table sets forth certain information related to our shares held as treasury stock for the Directors' stock award plan at December 31, 2016:
Equity Compensation Plan Information
Plan Category
|
Number of securities to be issued upon exercise of outstanding options |
Weighted-average exercise price of outstanding options |
Number of securities remaining available for future issuance |
|||||
|---|---|---|---|---|---|---|---|---|
Directors' stock award plan |
N/A | N/A | 265,200 | |||||
For additional information see Note 14—"Stockholders Equity—Directors' Stock Award Plan."
64
SCC COMMON STOCK REPURCHASE PLAN:
In 2008, our BOD authorized a $500 million share repurchase program that has since been increased by the BOD and is currently authorized to $3 billion. Pursuant to this program, the Company purchased common stock as shown in the table below. These shares are available for general corporate purposes. The Company may purchase additional shares of its common stock from time to time, based on market conditions and other factors. This repurchase program has no expiration date and may be modified or discontinued at any time.
| |
|
|
|
|
Maximum Number of Shares that May Yet Be Purchased Under the Plan @ $31.94(1) |
|
|||||||||||||
|---|---|---|---|---|---|---|---|---|---|---|---|---|---|---|---|---|---|---|---|
| Period | |
|
Total Number of Shares Purchased as Part of Publicly Announced Plan |
|
|||||||||||||||
| Total Number of Shares Purchased |
Average Price Paid per Share |
Total Cost ($ in millions) |
|||||||||||||||||
From
|
To | ||||||||||||||||||
2008 |
2012 | 46,914,486 | $ | 18.72 | 46,914,486 | 878.1 | |||||||||||||
2013: |
10,245,000 | 27.47 | 57,159,486 | 281.4 | |||||||||||||||
2014: |
22,711,428 | 30.06 | 79,870,914 | 682.8 | |||||||||||||||
2015: |
36,689,052 | 27.38 | 116,559,966 | 1,004.4 | |||||||||||||||
2016: |
|||||||||||||||||||
01/01/16 |
01/31/16 | 2,235,200 | 24.05 | 118,795,166 | 53.7 | ||||||||||||||
| | | | | | | | | | | | | | | | | | | | |
Total first quarter |
2,235,200 | 24.05 | 53.7 | ||||||||||||||||
| | | | | | | | | | | | | | | | | | | | |
08/01/16 |
08/31/16 | 115,000 | 25.88 | 118,910,166 | 3.0 | ||||||||||||||
09/01/16 |
09/30/16 | 587,601 | 25.55 | 119,497,767 | 15.0 | ||||||||||||||
| | | | | | | | | | | | | | | | | | | | |
Total third quarter |
702,601 | 25.61 | 18.0 | ||||||||||||||||
| | | | | | | | | | | | | | | | | | | | |
Total 2016 |
2,937,801 | 24.42 | 71.7 | ||||||||||||||||
Total purchased |
119,497,767 |
$ |
24.42 |
2,555,835 |
$ |
2,918.4 |
|||||||||||||
| | | | | | | | | | | | | | | | | | | | |
| | | | | | | | | | | | | | | | | | | | |
| | | | | | | | | | | | | | | | | | | | |
- (1)
- NYSE closing price of SCC common shares at December 31, 2016.
As a result of the repurchase of shares of SCC's common stock, Grupo Mexico's direct and indirect ownership was 88.9% as of December 31, 2016 and 88.6% at December 31, 2015.
65
SHAREHOLDER RETURN PERFORMANCE PRESENTATION
Set forth below is a line graph comparing the yearly change in the cumulative total returns on the Company's common stock against cumulative total return on the S&P 500 Stock Index and the S&P Metals and Mining Select Industry Index, for the five year period ending December 31, 2016. The chart below analyzes the total return on SCC's common stock for the period commencing December 31, 2011 and ending December 31, 2016, compared to the total return of the S&P 500 and the S&P Metals and Mining Select Industry Index for the same five-year period.
Comparison of Five Year Cumulative Total Return*
SCC Stock, S&P 500 Index and S&P Metals and Mining Select Industry Index**
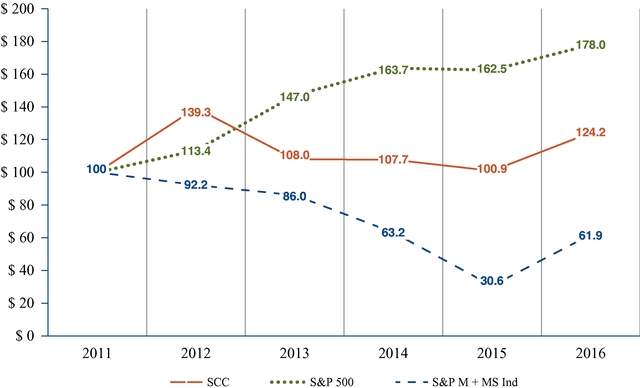
- *
- Total
return assumes reinvestment of dividends
- **
- The comparison assumes $100 invested on December 31, 2011
| |
Total Return per Year | |||||||||||||||
|---|---|---|---|---|---|---|---|---|---|---|---|---|---|---|---|---|
| |
2012 | 2013 | 2014 | 2015 | 2016 | |||||||||||
SCC |
39.3 | % | (22.5 | )% | (0.3 | )% | (6.3 | )% | 23.1 | % | ||||||
S&P 500 |
13.4 | % | 29.6 | % | 11.4 | % | (0.7 | )% | 9.5 | % | ||||||
S&P M + MS |
(7.8 | )% | (6.7 | )% | (26.6 | )% | (51.5 | )% | 102.4 | % | ||||||
The foregoing Performance Graph and related information shall not be deemed "soliciting material" or "filed" with the SEC or subject to Section 18 of the Securities Exchange Act of 1934, as amended, nor shall such information be incorporated by reference into any future filing under the Securities Act of 1933 or Securities Exchange Act of 1934, each as amended, except to the extent that the Company specifically incorporates it by reference into such filing.
66
ITEM 6. SELECTED FINANCIAL DATA
FIVE-YEAR SELECTED FINANCIAL AND STATISTICAL DATA
The selected historical financial data presented below as of and for the five years ended December 31, 2016, includes certain information that has been derived from our consolidated financial statements. The selected financial data should be read in conjunction with Item 7, "Management's Discussion and Analysis of Financial Condition and Results of Operations" and the consolidated financial statements and notes thereto.
| |
Years Ended December 31, | |||||||||||||||
|---|---|---|---|---|---|---|---|---|---|---|---|---|---|---|---|---|
| (In millions, except per share amounts, stock and financial ratios) |
2016 | 2015 | 2014 | 2013 | 2012 | |||||||||||
Statement of Earnings Data |
||||||||||||||||
Net sales(1) |
$ | 5,379.8 | $ | 5,045.9 | $ | 5,787.7 | $ | 5,952.9 | $ | 6,669.3 | ||||||
Operating income |
1,564.2 | 1,414.4 | 2,232.7 | 2,532.1 | 3,108.9 | |||||||||||
Net income |
778.8 | 741.1 | 1,337.9 | 1,624.2 | 1,941.3 | |||||||||||
Net income attributable to: |
||||||||||||||||
Non-controlling interest |
2.3 | 4.7 | 4.9 | 5.7 | 6.7 | |||||||||||
Southern Copper Corporation |
$ | 776.5 | $ | 736.4 | $ | 1,333.0 | $ | 1,618.5 | $ | 1,934.6 | ||||||
Per share amounts:(2) |
||||||||||||||||
Earnings basic and diluted |
$ | 1.00 | $ | 0.93 | $ | 1.61 | $ | 1.92 | $ | 2.28 | ||||||
Dividends paid |
$ | 0.18 | $ | 0.34 | $ | 0.46 | $ | 0.68 | $ | 4.06 | ||||||
| |
As of December 31, | |||||||||||||||
|---|---|---|---|---|---|---|---|---|---|---|---|---|---|---|---|---|
| |
2016 | 2015 | 2014 | 2013 | 2012 | |||||||||||
Balance Sheet Data |
||||||||||||||||
Cash and cash equivalents |
$ | 546.0 | $ | 274.5 | $ | 364.0 | $ | 1,672.7 | $ | 2,459.5 | ||||||
Total assets(3) |
13,234.3 | 12,593.2 | 11,393.9 | 10,970.0 | 10,357.8 | |||||||||||
Total long-term debt, including current portion(3) |
5,954.2 | 5,951.5 | 4,180.9 | 4,178.9 | 4,188.0 | |||||||||||
Total liabilities(3) |
7,363.4 | 7,294.0 | 5,557.3 | 5,408.2 | 5,568.7 | |||||||||||
Total equity |
$ | 5,870.9 | $ | 5,299.2 | $ | 5,836.6 | $ | 5,561.8 | $ | 4,789.1 | ||||||
| |
Years Ended December 31, | |||||||||||||||
|---|---|---|---|---|---|---|---|---|---|---|---|---|---|---|---|---|
| |
2016 | 2015 | 2014 | 2013 | 2012 | |||||||||||
Statement of Cash Flows Data |
||||||||||||||||
Net income |
$ | 778.8 | $ | 741.1 | $ | 1,337.9 | $ | 1,624.2 | $ | 1,941.3 | ||||||
Depreciation, amortization and depletion |
647.1 | 510.7 | 445.0 | 396.0 | 325.7 | |||||||||||
Cash provided by operating activities |
923.1 | 879.8 | 1,355.9 | 1,859.1 | 2,004.0 | |||||||||||
Capital investments(4) |
(1,118.5 | ) | (1,149.6 | ) | (1,529.8 | ) | (1,703.3 | ) | (1,051.9 | ) | ||||||
Debt repaid |
— | (266.0 | ) | — | (10.0 | ) | (10.0 | ) | ||||||||
Debt incurred |
— | 2,045.8 | — | — | 1,477.5 | |||||||||||
Dividends paid to common stockholders |
(139.3 | ) | (271.2 | ) | (381.0 | ) | (573.8 | ) | (3,140.0 | ) | ||||||
SCC common shares buyback |
(71.7 | ) | (1,004.4 | ) | (682.7 | ) | (281.4 | ) | (147.3 | ) | ||||||
SCC shareholder derivative lawsuit |
— | — | — | — | 2,108.2 | |||||||||||
Increase (decrease) in cash and cash equivalents |
$ | 271.5 | $ | (89.5 | ) | $ | (1,308.7 | ) | $ | (786.8 | ) | $ | 1,611.4 | |||
67
| |
Years Ended December 31, | |||||||||||||||
|---|---|---|---|---|---|---|---|---|---|---|---|---|---|---|---|---|
| |
2016 | 2015 | 2014 | 2013 | 2012 | |||||||||||
Capital Stock(2) |
||||||||||||||||
Common shares outstanding—basic and diluted (in thousands) |
773,016 | 775,942 | 812,618 | 835,318 | 845,551 | |||||||||||
NYSE Price—high |
$ | 34.98 | $ | 33.14 | $ | 33.54 | $ | 41.96 | $ | 38.94 | ||||||
NYSE Price—low |
$ | 22.29 | $ | 24.40 | $ | 26.08 | $ | 24.78 | $ | 28.16 | ||||||
Book value per share |
7.54 | 6.78 | 7.14 | 6.62 | 5.64 | |||||||||||
P/E ratio(5) |
31.82 | 28.19 | 17.52 | 14.95 | 16.60 | |||||||||||
| |
Years Ended December 31, | |||||||||||||||
|---|---|---|---|---|---|---|---|---|---|---|---|---|---|---|---|---|
| |
2016 | 2015 | 2014 | 2013 | 2012 | |||||||||||
Financial Ratios |
||||||||||||||||
Gross margin(6) |
31.6 | % | 31.9 | % | 43.2 | % | 45.1 | % | 53.6 | % | ||||||
Operating income margin(7) |
29.1 | % | 28.0 | % | 38.6 | % | 42.5 | % | 46.6 | % | ||||||
Net margin(8) |
14.4 | % | 14.6 | % | 23.0 | % | 27.2 | % | 29.0 | % | ||||||
Current assets to current liabilities |
2.57 | 2.70 | 2.07 | 4.36 | 5.00 | |||||||||||
Net debt/Net capitalization(9) |
47.7 | % | 48.9 | % | 37.3 | % | 29.2 | % | 25.0 | % | ||||||
Ratio of earnings to fixed charges(10) |
4.4x | 4.2x | 8.4x | 9.8x | 15.8x | |||||||||||
- (1)
- Please
see copper and metal prices for the last 10 years on Item 1 "Business—Metal Prices and sales volumes for the last three years on
Item 7 "Management Discussion and Analysis of Financial Condition and Results of Operations—Segments Results Analysis."
- (2)
- Per
share amounts reflect earnings and dividends of Southern Copper Corporation. Numbers of shares and values per share have been adjusted to reflect the effect of
the 9.0 million shares paid as stock dividend on February 28, 2012.
- (3)
- In
the second quarter of 2015, the Company adopted ASU 2015-03 whereby debt issuance costs are presented net of the related debt. This adoption was applied on a
retrospective basis. As a consequence, the long-term debt data and total liabilities for the years 2012 to 2014 have been modified to reflect this presentation.
- (4)
- Please
see Item 7 "Management Discussion and Analysis of Financial Condition and Results of Operations—Capital Investment Programs."
- (5)
- Represents
closing Price divided by Earnings per share.
- (6)
- Represents
net sales less cost of sales (including depreciation, amortization and depletion), divided by net sales as a percentage.
- (7)
- Represents
operating income divided by sales as a percentage.
- (8)
- Represents
net income divided by net sales as a percentage.
- (9)
- Net
debt, which is a Non-GAAP measure, is defined as total debt minus cash,cash equivalents and short-term investments balance. Please see Item 7 "Management
Discussion and Analysis of Financial Condition and Results of Operations—Financing Section". During 2015, management decided to include short-term investments as a reduction to debt to
arrive at net debt given that the Company can liquidate these investments at any time as needed. This change was applied on a retrospective basis for all years presented herein.
Net capitalization is defined as Net debt plus Equity.
68
Net debt/Net capitalization: represents net debt divided by net debt plus equity. Net debt to net capitalization is a Non-GAAP measure. This non-GAAP information should not be considered in isolation or as substitute for measures of performance determined in accordance with GAAP. A reconciliation of our net debt to net capitalization ratio to total debt and capitalization as presented in the consolidated balance sheet is presented under the subheading "Non-GAAP information reconciliation" in Item 7 "Management's Discussion and Analysis of Financial Condition and Results of Operations."
- (10)
- Represents earnings divided by fixed charges. Earnings are defined as earnings before income taxes and before adjustment for income or loss from equity investees, plus equity earnings of affiliate, fixed charges and amortization of interest capitalized, less interest capitalized. Fixed charges are defined as the sum of interest expense without the discount of capitalized interest, plus amortized premiums, discounts and capitalized expenses related to indebtedness.
69
ITEM 7. MANAGEMENT'S DISCUSSION AND ANALYSIS OF FINANCIAL CONDITION AND RESULTS OF OPERATIONS
EXECUTIVE SUMMARY
This Management's Discussion and Analysis of Financial Condition and Results of Operations relates to and should be read together with our Audited Consolidated Financial Statements as of and for each of the years in the three-year period ended December 31, 2016. Therefore, unless otherwise noted, the discussion below of our financial condition and results of operations is for Southern Copper Corporation and its subsidiaries (collectively, "SCC," the" Company," "our," and "we") on a consolidated basis for all periods. Our financial results may not be indicative of our future results.
This discussion contains forward-looking statements that are based on management's current expectations, estimates and projections about our business and operations. Our actual results may differ materially from those currently anticipated and expressed in the forward-looking statements as a result of a number of factors. See Item 1 "Business—Cautionary Statement."
EXECUTIVE OVERVIEW
Business: Our business is primarily the production and sale of copper. In the process of producing copper, a number of valuable metallurgical by-products are recovered, which we also produce and sell. Market forces outside of our control largely determine the sale prices for our products. Our management, therefore, focuses on value creation through copper production, cost control, production enhancement and maintaining a prudent capital structure to remain profitable. We endeavor to achieve these goals through capital spending programs, exploration efforts and cost reduction programs. Our aim is to remain profitable during periods of low copper prices and to maximize financial performance in periods of high copper prices.
We are one of the world's largest copper mining companies in terms of production and sales with our principal operations in Peru and Mexico. We also have an active ongoing exploration program in Chile, Argentina and Ecuador. In addition to copper, we produce significant amounts of other metals, either as a by-product of the copper process or in a number of dedicated mining facilities in Mexico.
In 2016, we invested $1,118.5 million in capital programs, along with $40.1 million in our exploration efforts. We believe this commitment to growth will continue to benefit our Company, our investors, our neighboring communities, and the countries in which we operate.
We believe we hold the world's largest copper reserve position. At December 31, 2016, our copper ore reserves, calculated at a copper price of $2.90 per pound, totaled 71.4 million tons of contained copper, at the following locations:
Copper contained in ore reserves
|
Thousand tons | |||
|---|---|---|---|---|
Mexican open-pit |
32,523 | |||
Peruvian operations |
24,237 | |||
IMMSA |
229 | |||
Development projects |
14,392 | |||
| | | | | |
Total |
71,381 | |||
| | | | | |
| | | | | |
| | | | | |
Outlook: Various key factors affect our outcome. These include, but are not limited to, the following:
- •
- Changes in copper, molybdenum, silver and zinc prices: In 2016, the average LME and COMEX per pound copper prices were $2.21 and $2.20, respectively, about 12.4% lower than in 2015. In 2016, per pound LME spot copper prices ranged from $1.96 to $2.69. Average zinc and silver
70
- •
- Sales structure: In the last three years, approximately 78% of our revenues came from the sale of copper, 6% from
molybdenum, 5% from silver, 4% from zinc and 7% from various other products, including gold, sulfuric acid and other materials.
- •
- Copper: 2017 is starting with the copper market showing the first signs of a structural supply deficit created by the lack of investments in the last few years. For 2017, we expect demand to grow between 2.0% to 2.5%, driven by China's metal consumption recovery, and a strong economy in the United States and Europe, where the auto industry demand is a driver of basic metal consumption .
- •
- Silver: We believe that silver prices will have support due to its industrial uses as well as being perceived as a
value shelter in times of economic uncertainty. Silver represented 5.5% of our sales in 2016.
- •
- Molybdenum: This metal represented 5.0% of Company sales in 2016. During the fourth quarter of 2016, the molybdenum price maintained its level when compared to the third quarter of 2016 due to production cuts from major producers. The molybdenum market is still affected by existing excess inventories and weak demand coming from steel special alloys and the oil drilling industry.
prices increased in 2016 by 8.0% and 9.1%, respectively, compared to 2015. Molybdenum price decreased by 2.6% in 2016 compared to 2015.
On the supply side, after five years of copper price reductions, we see supply underperforming the market needs. We expect a weak growth, in the range of 0.5% to 1.0% in 2017. This lack of growth results from the above noted decline in investments as well as technical problems, labor unrest, excess government taxation and other difficulties. All of these factors will contribute to the market deficit in 2017, thereby giving good support to current copper prices.
Annual copper production in 2016 was 899,955 tons, a new Company record. This increase of 21.1% from the 742,993 tons produced in 2015 results from the higher production from our Buenavista mine expansion. The additional copper units produced have lower cost per pound, improving the overall Company cash cost and competitiveness.
- •
- Zinc: Zinc has very good long term fundamentals due to its significant industrial consumption and the expected
mine production shutdowns. In the last 12 months zinc inventories have consistently decreased, improving this market's fundamentals. We are expecting an increasing price scenario for zinc
during 2017. Zinc represented 4.4% of our sales in 2016.
- •
- Production: For 2017, we expect to maintain our current production level of about 900,000 tons of copper. For 2018, we will initiate production at the new Toquepala concentrator and expect to be able to produce 972,300 tons of copper, continuing our aggressive organic growth program.
Molybdenum is mainly used for the production of special alloys of stainless steel that require significant hardness, corrosion and heat resistance. A new use for this metal is in lubricants and sulfur filtering of heavy oils and shale gas production.
We also expect to produce 16.6 million ounces of silver, about 2.5% higher than the 2016 production of 16.2 million ounces due to higher Buenavista and IMMSA production. For zinc production, in 2017, we expect to produce 80,800 tons from our mines, up from 2016's production, of 73,984 tons, mainly due to higher production from our Charcas, Santa Barbara and Santa Eulalia mines, which will increase their milling amd forecast higher grades as well in 2017. Additionally, we expect to produce 19,700 tons of molybdenum, lower by 9.4% from last year's production of 21,736 tons.
71
- •
- Cost: Our operating costs and expenses for the three-years ended December 2016 have increased in total in each of the years. Our comparison of costs for the three year period is as follows:
| |
2016 | 2015 | 2014 | |||||||
|---|---|---|---|---|---|---|---|---|---|---|
Operating costs and expenses (in millions) |
$ | 3,815.6 | $ | 3,631.5 | $ | 3,555.0 | ||||
Percentage increase from prior year |
5.1 | % | 2.2 | % | 3.9 | % | ||||
- •
- Capital investments: Capital investments were $1,118.5 million for 2016. This is 2.7% lower than in 2015, and represented 144% of net income. Our growth program to develop the full production potential of our Company is underway. In addition, the Buenavista expansion program is largely completed.
Operating costs and expenses in 2016 increased $184.1 million, compared to 2015, principally due to higher costs of sales at our Mexican operations resulting from the 18.3% increase in copper sales volume, higher depreciation, amortization and depletion on the new assets added to our operations at Buenavista. This was partially offset by lower environmental remediation and exploration expenses.
Operating costs and expenses in 2015 increased $76.5 million, compared to 2014, principally due to higher production, which led to higher costs of sales and due to higher depreciation, amortization and depletion at our operations; partially offset by lower environmental remediation and exploration expense.
For 2017, the Board of Directors approved a capital investment program of $1,105.2 million. The year 2017 will be the starting point of a new strategic plan: we will grow copper production capacity to exceed the one million ton milestone by mid-2018, and by 2023 we expect to reach 1.5 million copper tons.
KEY MATTERS
We discuss below several matters that we believe are important to understand our results of operations and financial condition. These matters include (i) earnings, (ii) production, (iii) "operating cash costs" as a measure of our performance, (iv) metal prices, (v) business segments, (vi) the effect of inflation and other local currency issues and (vii) our capital investment and exploration program.
Earnings: The table below highlights key financial and operational data of our Company for the three years ended December 31, 2016 (in millions, except per share amounts):
| |
|
|
|
Variance | ||||||||||||
|---|---|---|---|---|---|---|---|---|---|---|---|---|---|---|---|---|
| |
2016 | 2015 | 2014 | 2016 - 2015 | 2015 - 2014 | |||||||||||
Copper price LME |
2.21 | 2.50 | 3.11 | 0.29 | 0.61 | |||||||||||
Pounds of copper sold |
1,923.9 | 1,625.8 | 1,448.0 | 298.1 | 177.8 | |||||||||||
Net sales |
$ |
5,379.8 |
$ |
5,045.9 |
$ |
5,787.7 |
$ |
333.9 |
$ |
(741.8 |
) |
|||||
Operating income |
$ | 1,564.2 | $ | 1,414.4 | $ | 2,232.7 | $ | 149.8 | $ | (818.3 | ) | |||||
Net income attributable to SCC |
$ | 776.5 | $ | 736.4 | $ | 1,333.0 | $ | 40.1 | $ | (596.6 | ) | |||||
Earnings per share |
$ | 1.00 | $ | 0.93 | $ | 1.61 | $ | 0.07 | $ | (0.68 | ) | |||||
Dividends per share |
$ | 0.18 | $ | 0.34 | $ | 0.46 | $ | (0.16 | ) | $ | (0.12 | ) | ||||
Net sales in 2016 were higher than in 2015, mainly as a result of higher sales volume of copper (+18.3%), silver (+18.9%) and zinc (+4.6%), partially offset by lower prices for copper and molybdenum. Net sales decreased from 2014 to 2015, due to lower metal prices for copper, molybdenum and silver, partially offset by an increase in copper and zinc sales volume.
72
The two largest components of operating costs and expenses are cost of sales and depreciation, amortization and depletion, both of which increased in each of the years in the periods above. In 2016, cost of sales increased by $106.5 million and depreciation, amortization and depletion increased by $136.4 million. In 2015, cost of sales increased by $87.1 million and depreciation, amortization and depletion increased by $65.7 million. The increase in cost of sales in both periods was due to higher copper sales volume, which increased by 18.3% and 12.3% in 2016 and 2015, respectively. However, cost of sales only increased by 3.6% and 3.1% in the respective years, as a result of our lower unit costs. This reduction in unit cost is attributable to the lower unitary cost for our new production as well as lower cost for fuel and other production inputs. The increase in depreciation was mainly due to investment and maintenance capital acquisitions at most of our operations.
Net income attributable to SCC in 2016 was 5.4% higher mainly due to the above noted factors.
Production: The table below highlights, mine production data of our Company for the three years ended December 31, 2016:
| |
|
|
|
Variance | ||||||||||||||||||
|---|---|---|---|---|---|---|---|---|---|---|---|---|---|---|---|---|---|---|---|---|---|---|
| |
|
|
|
2016 - 2015 | 2015 - 2014 | |||||||||||||||||
| (million pounds, except silver—million ounces) |
2016 | 2015 | 2014 | Volume | % | Volume | % | |||||||||||||||
Copper |
1,984.1 | 1,638.0 | 1,491.6 | 346.1 | 21.1 | % | 146.4 | 9.8 | % | |||||||||||||
Molybdenum |
47.9 | 51.5 | 51.0 | (3.6 | ) | (6.9 | )% | 0.5 | 1.0 | % | ||||||||||||
Zinc |
163.1 | 136.5 | 146.9 | 26.6 | 19.5 | % | (10.4 | ) | (7.1 | )% | ||||||||||||
Silver |
16.2 | 13.3 | 13.0 | 2.9 | 21.7 | % | 0.3 | 2.3 | % | |||||||||||||
The table below highlights copper production data at each of our mines for the three years ended December 31, 2016:
| |
|
|
|
Variance | ||||||||||||||||||
|---|---|---|---|---|---|---|---|---|---|---|---|---|---|---|---|---|---|---|---|---|---|---|
| |
|
|
|
2016 - 2015 | 2015 - 2014 | |||||||||||||||||
Copper (in million pounds): |
2016 | 2015 | 2014 | Volume | % | Volume | % | |||||||||||||||
Toquepala |
311.8 | 316.6 | 309.7 | (4.8 | ) | (1.5 | )% | 6.9 | 2.2 | % | ||||||||||||
Cuajone |
378.0 | 392.8 | 393.2 | (14.8 | ) | (3.8 | )% | (0.4 | ) | (0.1 | )% | |||||||||||
La Caridad |
293.8 | 288.9 | 278.4 | 4.9 | 1.7 | % | 10.5 | 3.8 | % | |||||||||||||
Buenavista |
986.4 | 627.4 | 498.8 | 359.0 | 57.2 | % | 128.6 | 25.8 | % | |||||||||||||
IMMSA |
14.1 | 12.3 | 11.5 | 1.8 | 14.9 | % | 0.8 | 7.3 | % | |||||||||||||
| | | | | | | | | | | | | | | | | | | | | | | |
Total mined copper |
1,984.1 | 1,638.0 | 1,491.6 | 346.1 | 21.1 | % | 146.4 | 9.8 | % | |||||||||||||
| | | | | | | | | | | | | | | | | | | | | | | |
2016 compared to 2015:
Mined copper in 2016 increased 346.1 million pounds, compared to 2015 production. This increase was due to:
- •
- Higher production at our Buenavista mine due to the ramping up of the new concentrator and better concentrate grades and recoveries.
- •
- Higher production at the La Caridad mine due to higher concentrate grades, partially offset by
- •
- Lower production at the Cuajone and Toquepala mines due to lower ore grades and concentrate recoveries.
Molybdenum production decreased 3.6 million pounds in 2016, compared to 2015, principally due to lower production at our Peruvian mines because of lower grades. Silver production increased 2.9 million ounces in 2016 due to higher production at our Buenavista and IMMSA mines. Zinc
73
production increased by 26.6 million pounds in 2016 due to a year of full production without the flooding problems that we encountered in prior years.
2015 compared to 2014:
Mined copper in 2015 increased 146.4 million pounds, compared to 2014 production. This increase was due to:
- •
- Higher production at our Buenavista mine due to higher throughput at the concentrator and better ore grades, as well as higher production from
the SX-EW III plant.
- •
- Higher production at the Toquepala mine and La Caridad mine due to better ore grades and recoveries.
- •
- Higher production at the IMMSA mines due to higher throughput at the concentrators, slightly reduced by
- •
- Lower production at the Cuajone mine due to lower ore grades.
Molybdenum production increased 0.5 million pounds in 2015, compared to 2014, and silver production increased 0.3 million ounces in 2015. Zinc production decreased by 10.4 million pounds in 2015, continuing the slide seen in the prior year.
Operating Cash Costs: An overall benchmark used by us and a common industry metric to measure performance is operating cash costs per pound of copper produced. Operating cash cost is a non-GAAP measure that does not have a standardized meaning and may not be comparable to similarly titled measures provided by other companies. This non-GAAP information should not be considered in isolation or as substitute for measures of performance determined in accordance with GAAP. A reconciliation of our operating cash cost per pound to the cost of sales (exclusive of depreciation, amortization and depletion) as presented in the consolidated statement of earnings is presented under the subheading, "Non-GAAP Information Reconciliation", beginning on page 90. We disclose operating cash cost per pound of copper produced, both without and with the inclusion of by-product revenues.
We define operating cash cost per pound of copper produced without by-product revenues as cost of sales (exclusive of depreciation, amortization and depletion), plus selling, general and administrative charges, treatment and refining charges net of sales premiums; less the cost of purchased concentrates, workers' participation and other miscellaneous charges, including royalty charges, and the change in inventory levels; divided by total pounds of copper produced by our own mines.
In our calculation of operating cash cost per pound of copper produced, we exclude depreciation, amortization and depletion, which are considered non-cash expenses. Exploration is considered a discretionary expenditure and is also excluded. Workers' participation provisions are determined on the basis of pre-tax earnings and are also excluded. Additionally excluded from operating cash costs are items of a non-recurring nature and the mining royalty charge as it is based on various calculations of taxable income, depending on which jurisdiction, Peru or Mexico, is imposing the charge. We believe these adjustments will allow our management and stakeholders to see a presentation of our controllable cash cost, which we consider is one of the lowest of copper producing companies of similar size.
We define operating cash cost per pound of copper produced with by-product revenues as operating cash cost per pound of copper produced, as defined above, less by-product revenues and net revenue (loss) on sale of metals purchased from third parties.
In our calculation of operating cash cost per pound of copper produced, with by-product revenues, we credit against our costs the revenues from the sale of all our by-products, including, molybdenum, zinc, silver, gold, etc. and the net revenue (loss) on sale of metals purchased from third parties. We disclose this measure including the by-product revenues in this way because we consider our principal
74
business to be the production and sale of copper. As part of our copper production process, much of our by-products are recovered. These by-products, as well as the processing of copper purchased from third parties, are a supplemental part of our production process and their sales value contribute to cover part of our incurred fixed costs. We believe that our Company is viewed by the investment community as a copper company, and is valued, in large part, by the investment community's view of the copper market and our ability to produce copper at a reasonable cost.
We believe that both of these measures are useful tools for our management and our stakeholders. Our cash costs, without by-product revenues allows us to monitor our cost structure and address with operating management areas of concern as copper is our main source of revenues.
The measure operating cash cost per pound of copper with by-product revenues is a common measure used in the copper industry and is a useful management tool that allow us to track our performance and better allocate our resources. This measure is also used in our investment project evaluation process to determine a project's potential contribution to our operations, its competitiveness and its relative strength in different price scenarios. The expected contribution of by-products is generally a significant factor used by the copper industry in determining whether to move forward with the development of a new mining project. As the price of our by-product commodities can have significant fluctuations from period to period, the value of its contribution to our costs can be volatile.
Our operating cash cost per pound of copper produced, as defined above, is presented in the table below for the three years ended December 31, 2016:
Operating cash cost per pound of copper produced(1)
(In millions, except cost per pound and percentages)
| |
|
|
|
Variance | ||||||||||||||||||
|---|---|---|---|---|---|---|---|---|---|---|---|---|---|---|---|---|---|---|---|---|---|---|
| |
|
|
|
2016 - 2015 | 2015 - 2014 | |||||||||||||||||
| |
2016 | 2015 | 2014 | Value | % | Value | % | |||||||||||||||
Total operating cash cost without by-product revenues |
$ | 2,789.1 | $ | 2,643.9 | $ | 2,739.3 | $ | 145.2 | 5.5 | % | $ | (95.4 | ) | (3.5 | )% | |||||||
Total by-product revenues |
(955.6 | ) | (866.8 | ) | (1,186.4 | ) | (88.8 | ) | 10.2 | % | 319.6 | (26.9 | )% | |||||||||
Total operating cash cost with by-product revenues |
$ | 1,833.5 | $ | 1,777.1 | $ | 1,552.9 | $ | 56.4 | 3.2 | % | $ | 224.2 | 14.4 | % | ||||||||
Total pounds of copper produced(2) |
1,924.7 | 1,599.3 | 1,453.2 | 325.4 | 20.3 | % | 146.1 | 10.1 | % | |||||||||||||
Operating cash cost per pound without by-product revenues |
1.45 | 1.65 | 1.89 | (0.20 | ) | (12.1 | )% | (0.24 | ) | (12.7 | )% | |||||||||||
Operating cash cost per pound with by-product revenues |
0.95 | 1.11 | 1.07 | (0.16 | ) | (14.4 | )% | 0.04 | 3.7 | % | ||||||||||||
- (1)
- These
are non-GAAP measures, see page 90 for reconciliation to GAAP measure.
- (2)
- Net of metallurgical losses.
2016 compared to 2015:
As seen on the chart above, our 2016 operating cash cost per pound of copper without by-product revenues was $0.20 per pound lower than in 2015, a decrease of 12.1%. This was due to lower costs per pound from production costs, as a result of higher production at a lower per-unit cost from the Buenavista projects, lower fuel costs and lower costs per pound from selling, general and administrative expenses and inventory change, partially offset by higher treatment and refining charges and premiums.
Our cash cost per pound for 2016 when calculated with by-product revenues was $0.95 per pound, compared to $1.11 per pound in 2015, a decrease of 14.4%. The total value of by-products increased by
75
$88.8 million in 2016, principally due to the higher sales volume and the higher sales prices for silver and zinc, reduced somewhat by decreases in molybdenum volume and sales prices.
2015 compared to 2014:
As seen on the chart above, our 2015 operating cash cost per pound of copper without by-product revenues was $0.24 per pound lower than in 2014, a decrease of 12.7%. This was due to lower costs per pound from production costs, as a result of higher production, lower labor expenses, fuel and power costs; and lower costs per pound from selling, general and administrative expenses and capitalized leachable material included in cost of sales, partially offset by higher treatment and refining charges and premium.
Our cash cost per pound for 2015 when calculated with by-product revenues was $1.11 per pound, compared to $1.07 per pound in 2014, an increase of 3.7%. This was due to lower credits of our by-products, mainly because of lower prices.
Metal Prices: The profitability of our operations is dependent on, and our financial performance is significantly affected by, the international market prices for the products we produce, especially for copper, molybdenum, zinc and silver.
We are subject to market risks arising from the volatility of copper and other metals prices. Metal prices historically have been subject to wide fluctuations and are affected by numerous factors beyond our control. These factors, which affect each commodity to varying degrees, include international economic and political conditions, levels of supply and demand, the availability and cost of substitutes, inventory levels maintained by producers and others and, to a lesser degree, inventory carrying costs and currency exchange rates. In addition, the market prices of certain metals have on occasion been subject to rapid short-term changes due to economic concerns and financial investments.
For 2017, assuming that expected metal production and sales are achieved, that tax rates are unchanged and giving no effect to potential hedging programs, metal price sensitivity factors would indicate the following change in estimated annual net income attributable to SCC resulting from metal price changes:
| |
Copper | Molybdenum | Zinc | Silver | |||||||||
|---|---|---|---|---|---|---|---|---|---|---|---|---|---|
Change in metal prices (per pound except silver—per ounce) |
$ | 0.10 | $ | 1.00 | $ | 0.10 | $ | 1.00 | |||||
Change in net earnings (in millions) |
$ | 113.4 | $ | 25.6 | $ | 23.8 | $ | 23.7 | |||||
Business Segments: We view our Company as having three reportable segments and manage it on the basis of these segments. These segments are (1) our Peruvian operations, (2) our Mexican open-pit operations and (3) our Mexican underground operations, known as our IMMSA unit. Our Peruvian operations include the Toquepala and Cuajone mine complexes and the smelting and refining plants, industrial railroad and port facilities that service both mines. Our Mexican open-pit operations include La Caridad and Buenavista mine complexes, the smelting and refining plants and support facilities, which service both mines. Our IMMSA unit includes five underground mines, a coal mine, and several industrial processing facilities.
Segment information is included in our review of "Results of Operations" in this item and also in Note 18 "Segment and Related Information" of our consolidated financial statements.
Inflation and Exchange Rate Effect of the Peruvian sol and the Mexican peso: Our functional currency is the U.S. dollar and our revenues are primarily denominated in U.S. dollars. Significant portions of our operating costs are denominated in Peruvian sol and Mexican pesos. Accordingly, when inflation and currency devaluation/appreciation of the Peruvian and Mexican currency occur, our operating results can be affected. In recent years, we do believe such changes have not had a material effect on our results and financial position. Please see Item 7A "Quantitative and Qualitative Disclosures about Market Risk" for more detailed information.
76
Capital Investment Program: We made capital investments of $1,118.5 million in 2016, $1,250.0 million in 2015 (including the El Pilar acquisition) and $1,529.8 million in 2014. In general, the capital investments and projects described below are intended to increase production, decrease costs or address social and environmental commitments.
The table below sets forth our capital investments for the three years ended December 31, 2016 (in millions):
| |
2016 | 2015 | 2014 | |||||||
|---|---|---|---|---|---|---|---|---|---|---|
Peruvian projects: |
||||||||||
Toquepala expansion project |
$ | 164.2 | $ | 56.5 | $ | 65.7 | ||||
Toquepala mine equipment acquisition project |
94.2 | 2.8 | — | |||||||
HPGR system—Toquepala |
17.0 | 5.6 | — | |||||||
Heavy mineral management optimizing project—Cuajone |
76.6 | 50.0 | 31.3 | |||||||
Tailings disposal—Quebrada Honda dam |
18.3 | 0.7 | 2.9 | |||||||
Other projects |
19.1 | 21.0 | 40.7 | |||||||
| | | | | | | | | | | |
Sub-total projects |
389.4 | 136.6 | 140.6 | |||||||
Maintenance and replacement |
210.5 | 185.7 | 213.2 | |||||||
Net change in capital expenditures incurred but not yet paid |
(58.9 | ) | (37.1 | ) | — | |||||
| | | | | | | | | | | |
Total Peruvian expenditures |
541.0 | 285.2 | 353.8 | |||||||
| | | | | | | | | | | |
Mexican projects: |
||||||||||
New Buenavista concentrator |
70.7 | 238.4 | 465.2 | |||||||
Buenavista projects infrastructure |
46.6 | 89.6 | 65.8 | |||||||
Buenavista SX-EW plant III |
— | 11.0 | 175.8 | |||||||
Quebalix IV |
104.7 | 99.4 | 70.4 | |||||||
New tailing disposal deposit at Buenavista mine |
65.7 | 47.8 | — | |||||||
Solutions system improvements of Tinajas |
42.5 | 34.2 | — | |||||||
New system recovery solutions |
— | 14.9 | 66.2 | |||||||
El Pilar mine |
— | 100.4 | — | |||||||
Other projects |
94.5 | 92.4 | 101.8 | |||||||
| | | | | | | | | | | |
Sub-total projects |
424.7 | 728.1 | 945.2 | |||||||
Maintenance and replacement |
142.2 | 216.9 | 235.8 | |||||||
Net change in capital expenditures incurred but not yet paid |
10.6 | 19.8 | (5.0 | ) | ||||||
| | | | | | | | | | | |
Total Mexican expenditures |
577.5 | 964.8 | 1,176.0 | |||||||
| | | | | | | | | | | |
Total capital investments |
$ | 1,118.5 | $ | 1,250.0 | $ | 1,529.8 | ||||
| | | | | | | | | | | |
| | | | | | | | | | | |
| | | | | | | | | | | |
In 2017, we plan to invest $1,105.2 million in capital projects. In addition to our ongoing capital maintenance and replacement spending, our principal capital programs include the following:
Projects in Mexico:
We have concluded our $3.5 billion investment program in Mexico and all of the projects under this program will be in full operation in 2017.
Buenavista Projects—Sonora: The Buenavista program is being completed on time and $100 million below our budget, including the crushing, conveying and spreading system for leachable ore project (Quebalix IV). This project will reduce processing time as well as mining and hauling costs, increasing production by improving SX-EW copper recovery. The installed conveyor system is operating steadily. The project has reached 99% progress and $285.7 million have been invested as of December 31, 2016 from a budget of $444.2 million.
77
Projects in Peru:
We are currently working on five copper projects in Peru with a total capital investment for these projects of $2,900 million.
Toquepala Concentrator Expansion Project—Tacna: This $1.2 billion project includes a new state-of-the-art concentrator which will increase annual copper production by 100,000 tons to 217,000 tons in 2018 and 260,000 tons in 2019, and will also increase annual molybdenum production by 3,100 tons. Through December 31, 2016, we have invested $550.4 million in the project. The project has reached 53% progress and is expected to be completed in the second quarter of 2018.
The project to improve the crushing process at Toquepala with the installation of a High Pressure Grinding Roll (HPGR) system, has as its main objective, to ensure that our existing concentrator will operate at its maximum milling capacity of 60,000 tons per day, even with an increase of the ore material hardness index. Additionally, recoveries will be improved and production enhanced with a better ore crushing. The budget for this project is $40 million and as of December 31, 2016, we have invested $21.9 million in this project. We expect that it will be completed by the fourth quarter of 2017.
Cuajone Projects—Moquegua: The Heavy Mineral Management Optimizing Project consists of installing a primary crusher at the Cuajone mine pit with a conveyor system for moving the ore to the concentrator. The project aims to optimize the hauling process by replacing rail haulage, thereby reducing operating and maintenance costs as well as the environmental impact of the Cuajone mine. The crusher will have a processing capacity of 43.8 million tons per year. The main components, including the crusher and the seven kilometer overland conveyor belt, have been acquired and we are well underway with electromechanical assembly. As of December 31, 2016, we have invested $150.9 million in this project out of the approved capital budget of $215.5 million. The project has reached 80% progress and is expected to be completed by the second quarter of 2017.
The Cuajone tailing thickeners project at the concentrator will replace two of the three existing thickeners with a new hi-rate thickener. The purpose is to streamline the concentrator flotation process and improve water recovery efficiency, increasing the tailings solids content from 54% to 61%, thereby reducing fresh water consumption and replacing it with recovered water. As of December 31, 2016, we have almost completed the engineering and procurement process and have started the excavation and civil works . We have invested $14.4 million in this project out of the approved capital budget of $30 million. The project has reached 62% progress and we expect it to be completed by the second quarter of 2017.
Tailings disposal at Quebrada Honda—Moquegua: This project increases the height of the existing Quebrada Honda dam to impound future tailings from the Toquepala and Cuajone mills and will extend the expected life of this tailings facility by 25 years. The first stage and construction of the drainage system for the lateral dam is finished. We finished the engineering and procurement is in progress. In order to improve and increase the dam's embankment, we have assigned a construction contractor to install a new cyclone battery station that will allow us to place more slurry at the dams. The project has a total budgeted cost of $116.0 million. We have invested $71.7 million through December 31, 2016 and expect the project to be completed by the second quarter of 2018.
Potential projects
We have a number of other projects that we may develop in the future. We continuously evaluate new projects on the basis of our long-term corporate objectives, strategic and operating fit, expected return on investment, required investment, estimated production, estimated cash-flow profile, social and environmental considerations, among other factors. All capital spending plans will continue to be reviewed and adjusted to respond to changes in the economy or market conditions. The year 2017 will be the starting point of a new strategic plan: we will grow copper production capacity to exceed the one
78
million ton milestone by mid-2018, and by 2023 we expect to reach 1.5 million copper tons. This strategic plan includes the following projects:
Buenavista- Zinc project: This zinc open pit mine located in our Buenavista complex in Sonora, Mexico will produce 87,800 tons of zinc and 27,500 tons of copper content in concentrates per year with a capital budget of $360 million. Currently, we are reviewing the block model and the mine plan which are expected to be completed in March 2017. Also, we are preparing the basic engineering and will request authorization to begin the detail engineering. As of December 31, 2016 we have invested $14.6 million and expect the project to be completed in 2018.
Pilares: This brownfield project located in Sonora, Mexico will produce 35,000 tons of copper per year with an initial capital budget of $200 million which we believe is still subject to further optimization. Pilares is an open-pit mine, located 6 kilometers away from our La Caridad complex, thus, leveraging on La Caridad infrastructure. We are working to define the mineral flow and on a trade-off analysis for a potential expansion of the La Caridad concentrator. In addition, we are analyzing mineral blending alternatives between Pilares and La Caridad in order to improve the copper grade of concentrates. As of December 31, 2016 we have invested $39.9 million and expect the project to be completed in 2018.
Tia Maria: We have completed all engineering and have successfully obtained the approval of the environmental impact assessment for the project. We are currently working to obtain the construction license for this 120,000 tons of SX-EW copper per year project with a total capital investment of $1,400 million. In 2017, we expect to continue with our social development programs with the neighboring communities.
This greenfield project, located in Arequipa Peru, will use state of the art SX-EW technology with the highest international environmental standards. SX-EW facilities are the most environmentally friendly in the industry due to their technical process and consequently no emissions into the atmosphere are released. The project will use seawater, transporting it more than 25 kilometers and at 1,000 meters above sea level. The construction of the desalinization plant requires an investment of approximately $95 million.
We expect the project to generate 3,500 jobs during the construction phase. When in operation, Tia Maria will directly employ 600 workers and indirectly another 2,000. Through its expected twenty-year life, the project related services will create significant business opportunities in the Arequipa region. Tia Maria has complied with all existing requirements and regulations and therefore the Company trusts that it will soon receive from government authorities the construction licenses and permits required in order to begin construction of this project.
El Arco: This is a world class copper deposit located in the central part of the Baja California peninsula, with ore reserves over 2.7 billion tons with an ore grade of 0.399% and 0.11 grams of gold per ton. This project, includes an open-pit mine combining concentrator and SX-EW operations with an estimated production of 190,000 tons of copper and 105,000 ounces of gold annually. Between July 2015 and February 2016, we conducted a drilling program of 20,170 meters in order to further define the deposit at lower depths of between 300 and 600 meters. Through December 31, 2016 we have invested $77 million on studies, exploration and land acquisition for the project. Further exploration work is still required to better define the geometry of the deposit towards its west end and at the depths worked. In 2017, we expect to conduct certain exploration activities. In addition, we will begin an engineering study to determine the best way to optimize the project and to update the feasibility study.
El Pilar: This is a fully permitted, low capital intensity copper development project strategically located in Sonora, Mexico, approximately 45 kilometers from our Buenavista mine. Its copper oxide mineralization contains estimated proven and probable reserves of 325 million tons of ore with an
79
average copper grade of 0.287%. El Pilar will operate as a conventional open-pit mine and copper cathodes will be produced using the highly cost efficient and environmentally friendly SX-EW technology. Average annual production is currently estimated at 35,000 tons of copper cathodes over an initial 13-year mine life, with start of commercial operations forecasted by 2019. On a preliminary basis, we estimate a development investment of approximately $310 million. In 2016, we conducted a diamond drilling program of 3,700 meters and a geophysical survey of 40 kilometers in order to confirm the reserves additionally, the results allow us to identify potential areas of interest of oxides and sulfures. In 2017, we expect to conclude the exploration in the north area and to continue with the metallurgical testing. In addition, we expect to begin the revised feasibility study and the project engineering.
Los Chancas. This greenfield project, located in Apurimac, Peru, is a copper and molybdenum porphyry deposit. Current estimates indicate the presence of 545 million tons of mineralized material with a copper content of 0.59%, molybdenum content of 0.04% and 0.039 grams of gold per ton as well as, 181 million tons of mineralized leachable material with a total copper content of 0.357%. Los Chancas project includes an open-pit mine with a combined operation of concentrator and SX-EW processes to produce 100,000 tons of copper and 4,500 tons of molybdenum. The estimated capital investment is $2,800 million and is expected to be in operation in 2022. In 2016, we continued b with the development of social and environmental programs with the local communities in order to initiate the environmental impact assessment process in 2017.
The above information is based on estimates only. We cannot make any assurances that we will undertake any of these projects or that the information noted is accurate.
CRITICAL ACCOUNTING POLICIES AND ESTIMATES
Our significant accounting policies are discussed in Note 2 "Summary of Significant Accounting Policies" of the Notes to Consolidated Financial Statements, included in Item 8 "Financial Statements and Supplementary Data" of this Annual Report.
Our discussion and analysis of financial condition and results of operations, as well as quantitative and qualitative disclosures about market risks, are based upon our consolidated financial statements, which have been prepared in accordance with U.S. GAAP. Preparation of these consolidated financial statements requires our management to make estimates and assumptions that affect the reported amounts of assets and liabilities and disclosures of contingent assets and liabilities at the date of the financial statements and the reported amounts of revenues and expenses during the reporting period. We make our best estimate of the ultimate outcome for these items based on historical trends and other information available when the financial statements are prepared. Changes in estimates are recognized in accordance with the accounting rules for the estimate, which is typically in the period when new information becomes available to management. Areas where the nature of the estimate makes it reasonably possible that actual results could materially differ from amounts estimated include: ore reserves, revenue recognition, leachable material and related amortization, estimated impairment of assets, asset retirement obligations, valuation allowances for deferred tax assets and unrecognized tax benefits. We base our estimates on historical experience and on various other assumptions that we believe to be reasonable under the circumstances. Actual results may differ from these estimates under different assumptions or conditions.
Ore Reserves: For internal ore reserve estimation, we use metal price assumptions of $2.90 per pound for copper and $6.50 per pound for molybdenum. These prices are intended to conservatively approximate average prices over the long term.
However, pursuant to SEC guidance, the reserve information in this report is calculated using average metals prices over the most recent three years, except as otherwise stated. We refer to these three-year average metals prices as "current average prices." Our current average prices for copper are
80
calculated using prices quoted by COMEX, and our current average prices for molybdenum are calculated using prices published in Platt's Metals Week. Unless otherwise stated, reserve estimates in this report use the following three years average prices for copper and molybdenum as of December 31, 2016:
| |
2016 | 2015 | 2014 | Average 2016 - 2014 |
|||||||||
|---|---|---|---|---|---|---|---|---|---|---|---|---|---|
Copper ($ per pound) |
$ | 2.20 | $ | 2.51 | $ | 3.12 | $ | 2.61 | |||||
Molybdenum ($ per pound) |
$ | 6.42 | $ | 6.59 | $ | 11.30 | $ | 8.10 | |||||
Certain financial information is based on reserve estimates calculated on the basis of current average prices. These include amortization of intangible assets and mine development. Variations in ore reserve calculations from changes in metal price assumptions generally do not create material changes to our financial results. However, significant decreases in metal prices could adversely affect our earnings by causing, among other things, asset impairment charges, please see "Assets impairment" below. A 20% increase or decrease in three-year average copper prices (current prices), for mineral reserves estimation, which is a reasonable possibility, would not materially affect our statement of earnings as the amount of reserves would not change significantly. Please see Item 2 "Properties—caption Ore reserves."
Ore stockpiles on leach pads: The leaching process is an integral part of the mining operations carried out at our open-pit mines. We capitalize the production cost of leachable material at our Toquepala, La Caridad and Buenavista mines recognizing it as inventory. The estimates of recoverable mineral content contained in the leaching dumps are supported by engineering studies. As the production cycle of the leaching process is significantly longer than the conventional process of concentrating, smelting and electrolytic refining, we include on our balance sheet, current leach inventory (as part of work-in-process inventories) and long-term leach inventory. Through the third quarter of 2014, the cost attributed to the produced leach material was charged to cost of sales over a five-year period, which was the average estimated recovery period based on the recovery percentages of each mine. However, the improvements in efficiency in production and use of leachable material, as a result of the completion of construction of a new plant during the fourth quarter of 2014, resulted in a change in amortization of leachable material to the units of production method. This was accounted for prospectively in 2014 and will better match costs with revenues resulting from the increases in production stemming from the new plant. As the plant entered into operation in the fourth quarter of 2014, the impact to results in 2014 was not considered significant and totaled approximately $17 million recognized within cost of sales. The Company expects that the impacts in future periods will be significant as a result of the increased production levels, which can be seen in the increased production in Buenavista due to the new SX-EW III plant.
Asset Retirement Obligation: Our mining and exploration activities are subject to various laws and regulations governing the protection of the environment. Accounting for reclamation and remediation obligations requires management to make estimates unique to each mining operation of the future costs we will incur to complete the reclamation and remediation work required to comply with existing laws and regulations. These estimates are based in part on our inflation and credit rate assumptions. Actual costs incurred in future periods could differ from amounts estimated. Additionally, future changes to environmental laws and regulations could increase the extent of reclamation and remediation work required to be performed by us. Any such increases in future costs could materially impact the amounts charged to operations for reclamation and remediation.
Asset retirement obligations are further discussed in Note 10 "Asset Retirement Obligation" to our consolidated financial statements included herein.
81
Revenue Recognition: For certain of our sales of copper and molybdenum products, customer contracts allow for pricing based on a month subsequent to shipping, in most cases within the following three months and in few cases perhaps a few further months. In such cases, revenue is recorded at a provisional price at the time of shipment. The provisionally priced copper sales are adjusted to reflect forward LME or COMEX copper prices at the end of each month until a final adjustment is made to the price of the shipments upon settlement with customers pursuant to the terms of the contract. In the case of molybdenum sales, for which there are no published forward prices, the provisionally priced sales are adjusted to reflect the market prices at the end of each month until a final adjustment is made to the price of the shipments upon settlement with customers pursuant to the terms of the contract. (See details in "Provisionally Priced Sales" under this Item 7).
Income Taxes: In preparing our consolidated financial statements, we recognize income taxes in each of the jurisdictions in which we operate. For each jurisdiction, we calculate the actual amount currently payable or receivable, as well as deferred tax assets and liabilities attributable to temporary differences between the financial statement carrying amounts of existing assets and liabilities and their respective tax bases. Deferred income tax assets and liabilities are measured using enacted tax rates expected to apply to taxable income in the years in which these temporary differences are expected to be recovered or settled. The effect on deferred tax assets and liabilities of a change in rate is recognized through the income tax provision in the period that the change is enacted.
A valuation allowance is provided for those deferred tax assets for which it is more likely than not that the related benefits will not be realized. In determining the amount of the valuation allowance, we consider estimated future taxable income, as well as feasible tax planning strategies in each jurisdiction. If we determine that we will not realize all or a portion of our deferred tax assets, we will increase our valuation allowance with a charge to income tax expense. Conversely, if we determine that we will ultimately be able to realize all or a portion of the related benefits for which a valuation allowance has been provided, all or a portion of the related valuation allowance will be reduced with a credit to income tax expense.
Our Company's operations involve dealing with uncertainties and judgments in the application of complex tax regulations in multiple jurisdictions. The final taxes paid are dependent upon many factors, including negotiations with taxing authorities in various jurisdictions and resolution of disputes arising from federal, state, and international tax audits. We recognize potential liabilities and record tax liabilities for anticipated tax audit issues in the U.S. and other tax jurisdictions based on our estimate of whether, and the extent to which, additional taxes will be due. We follow the guidance of ASC 740 "Income Taxes" to record these liabilities. (See Note 8 "Income Taxes" of the consolidated financial statements for additional information). We adjust these reserves in light of changing facts and circumstances; however, due to the complexity of some of these uncertainties, the ultimate resolution may result in a payment that is materially different from our current estimate of the tax liabilities. If our estimate of tax liabilities proves to be less than the ultimate assessment, an additional charge to expense would result. If payment of these amounts ultimately proves to be less than the recorded amounts, the reversal of the liabilities would result in tax benefits being recognized in the period when we determine the liabilities are no longer necessary. We recognize interest and penalties, if any, related to unrecognized tax benefits in income tax expense.
Asset Impairments: We evaluate our long-term assets when events or changes in economic circumstances indicate that the carrying amount of such assets may not be recoverable. Our evaluations are based on business plans that are prepared using a time horizon that is reflective of our expectations of metal prices over our business cycle. We are currently using an average copper price of $2.20 per pound of copper and an average molybdenum price of $5.00 per pound, reflective of what we believe is the lower level of the current price environment, for our impairment tests. The results of our impairment sensitivity analysis, which included a stress test using a copper price assumption of $2.00 per pound and a molybdenum price assumption of $4.00 per pound showed projected discounted cash
82
flows in excess of the carrying amounts of long-lived assets by margins ranging from 2.20 to 4.00 times such carrying amount.
In recent years our assumptions for long-term average prices resulted in stricter evaluations for impairment analysis than using the three year average prices for copper and molybdenum prices. Should this situation reverse in the future with three year average prices below the long-term price assumption, we would assess the need to use the three year average prices in our evaluations. We use an estimate of the future undiscounted net cash flows of the related asset or asset group over the remaining life to measure whether the assets are recoverable and measure any impairment by reference to fair value.
RESULTS OF OPERATIONS
The following table highlights key financial results for each of the years in the three-year period ended December 31, 2016 (in millions):
| |
|
|
|
Variance | ||||||||||||
|---|---|---|---|---|---|---|---|---|---|---|---|---|---|---|---|---|
Statement of Earnings Data
|
2016 | 2015 | 2014 | 2016 - 2015 | 2015 - 2014 | |||||||||||
Net sales |
$ | 5,379.8 | $ | 5,045.9 | $ | 5,787.7 | $ | 333.9 | $ | (741.8 | ) | |||||
Operating costs and expenses |
(3,815.6 | ) | (3,631.5 | ) | (3,555.0 | ) | (184.1 | ) | (76.5 | ) | ||||||
| | | | | | | | | | | | | | | | | |
Operating income |
1,564.2 | 1,414.4 | 2,232.7 | 149.8 | (818.3 | ) | ||||||||||
Non-operating income (expense) |
(308.2 | ) | (225.2 | ) | (164.1 | ) | (83.0 | ) | (61.1 | ) | ||||||
| | | | | | | | | | | | | | | | | |
Income before income taxes |
1,256.0 | 1,189.2 | 2,068.6 | 66.8 | (879.4 | ) | ||||||||||
Income taxes |
(501.1 | ) | (464.9 | ) | (754.6 | ) | (36.2 | ) | 289.7 | |||||||
Equity earnings of affiliate |
23.9 | 16.8 | 23.9 | 7.1 | (7.1 | ) | ||||||||||
Net income attributable to non-controlling interest |
(2.3 | ) | (4.7 | ) | (4.9 | ) | 2.4 | 0.2 | ||||||||
| | | | | | | | | | | | | | | | | |
Net income attributable to SCC |
$ | 776.5 | $ | 736.4 | $ | 1,333.0 | $ | 40.1 | $ | (596.6 | ) | |||||
| | | | | | | | | | | | | | | | | |
| | | | | | | | | | | | | | | | | |
| | | | | | | | | | | | | | | | | |
NET SALES
2016-2015: Net sales in 2016 were $5,379.8 million, compared to $5,045.9 million in 2015, an increase of $333.9 million or 6.6%. The increase was principally the result of higher sales volume of copper (+18.3%) and silver (+18.9%), partially offset by lower prices for copper and molybdenum.
2015-2014: Net sales in 2015 were $5,045.9 million, compared to $5,787.7 million in 2014, a decrease of $741.8 million or 12.8%. The decrease was principally the result of lower metal prices, partially offset by an increase in copper and zinc sales volumes, which increased 12.3% and 10.3%, respectively.
83
The table below outlines the average published market metals prices for our metals for each of the three years in the three-year period ended December 31, 2016:
| |
|
|
|
% Variance | ||||||||||||
|---|---|---|---|---|---|---|---|---|---|---|---|---|---|---|---|---|
| |
2016 | 2015 | 2014 | 2016 - 2015 | 2015 - 2014 | |||||||||||
Copper price ($ per pound—LME) |
$ | 2.21 | $ | 2.50 | $ | 3.11 | (11.6 | )% | (19.6 | )% | ||||||
Copper price ($ per pound—COMEX) |
$ | 2.20 | $ | 2.51 | $ | 3.12 | (12.4 | )% | (19.6 | )% | ||||||
Molybdenum price ($ per pound)(1) |
$ | 6.42 | $ | 6.59 | $ | 11.30 | (2.6 | )% | (41.7 | )% | ||||||
Zinc price ($ per pound—LME) |
$ | 0.95 | $ | 0.88 | $ | 0.98 | 8.0 | % | (10.2 | )% | ||||||
Silver price ($ per ounce—COMEX) |
$ | 17.10 | $ | 15.68 | $ | 19.04 | 9.1 | % | (17.6 | )% | ||||||
- (1)
- Platt's Metals Week Dealer Oxide.
The table below provides our metal sales as a percentage of our total net sales:
Sales as a percentage of total net sales
|
2016 | 2015 | 2014 | |||||||
|---|---|---|---|---|---|---|---|---|---|---|
Copper |
78.4 | % | 79.2 | % | 78.0 | % | ||||
Molybdenum |
5.0 | % | 4.7 | % | 8.8 | % | ||||
Silver |
5.5 | % | 4.5 | % | 4.7 | % | ||||
Zinc |
4.4 | % | 4.2 | % | 3.6 | % | ||||
Other by-products |
6.7 | % | 7.4 | % | 4.9 | % | ||||
| | | | | | | | | | | |
Total |
100.0 | % | 100.0 | % | 100.0 | % | ||||
| | | | | | | | | | | |
| | | | | | | | | | | |
| | | | | | | | | | | |
The table below provides our copper sales by type of product (in million pounds):
| |
|
|
|
Variance | ||||||||||||
|---|---|---|---|---|---|---|---|---|---|---|---|---|---|---|---|---|
Copper Sales
|
2016 | 2015 | 2014 | 2016 - 2015 | 2015 - 2014 | |||||||||||
Refined (including SX-EW) |
1,161.7 | 1,146.1 | 1,028.1 | 15.6 | 118.0 | |||||||||||
Rod |
319.4 | 304.6 | 284.1 | 14.8 | 20.5 | |||||||||||
Concentrates and other |
442.8 | 175.1 | 135.8 | 267.7 | 39.3 | |||||||||||
| | | | | | | | | | | | | | | | | |
Total |
1,923.9 | 1,625.8 | 1,448.0 | 298.1 | 177.8 | |||||||||||
| | | | | | | | | | | | | | | | | |
| | | | | | | | | | | | | | | | | |
| | | | | | | | | | | | | | | | | |
The table below provides our copper sales volume by type of product as a percentage of our total copper sales volume:
Copper Sales by product type
|
2016 | 2015 | 2014 | |||||||
|---|---|---|---|---|---|---|---|---|---|---|
Refined (including SX-EW) |
60.4 | % | 70.5 | % | 71.0 | % | ||||
Rod |
16.6 | % | 18.7 | % | 19.6 | % | ||||
Concentrates and other |
23.0 | % | 10.8 | % | 9.4 | % | ||||
| | | | | | | | | | | |
Total |
100.0 | % | 100.0 | % | 100.0 | % | ||||
| | | | | | | | | | | |
| | | | | | | | | | | |
| | | | | | | | | | | |
84
OPERATING COSTS AND EXPENSES
The table below summarizes the production cost structure by major components for the three years ended 2016 as a percentage of total production cost:
| |
2016 | 2015 | 2014 | |||||||
|---|---|---|---|---|---|---|---|---|---|---|
Power |
18.5 | % | 18.5 | % | 18.6 | % | ||||
Labor |
13.2 | % | 13.3 | % | 14.4 | % | ||||
Fuel |
11.5 | % | 13.8 | % | 16.0 | % | ||||
Maintenance |
19.4 | % | 16.7 | % | 15.5 | % | ||||
Operating material |
19.3 | % | 20.8 | % | 18.6 | % | ||||
Other |
18.1 | % | 16.9 | % | 16.9 | % | ||||
| | | | | | | | | | | |
Total |
100.0 | % | 100.0 | % | 100.0 | % | ||||
| | | | | | | | | | | |
| | | | | | | | | | | |
| | | | | | | | | | | |
2016-2015: Operating costs and expenses in 2016 increased $184.1 million, compared to 2015, primarily due to:
Operating cost and expenses for 2015 |
$ | 3,631.5 | ||
Plus: |
||||
• Higher cost of sales (exclusive of depreciation, amortization and depletion), mainly as a result of higher sales volume, capitalized leachable material, maintentance costs, and sales expenses; partially offset by lower fuel costs, inventory consumption, and lower cost of metals purchased from third parties. |
106.5 | |||
• Higher depreciation, amortization and depletion mainly as a result of our expansion and maintenance capital investments. |
136.4 | |||
Less: |
||||
• Lower environmental remediation expenses from the 2014 spill at Buenavista. |
(45.0 | ) | ||
• Lower exploration expenses in Mexico, Peru and other exploration locations. |
(8.7 | ) | ||
• Lower selling, general and administrative expenses. |
(5.1 | ) | ||
| | | | | |
Operating cost and expenses for 2016 |
$ | 3,815.6 | ||
| | | | | |
| | | | | |
| | | | | |
2015-2014: Operating costs and expenses in 2015 increased $76.5 million, compared to 2014, primarily due to:
Operating cost and expenses for 2014 |
$ | 3,555.0 | ||
Plus: |
||||
• Higher cost of sales (exclusive of depreciation, amortization and depletion), mainly as a result of higher sales volume, purchase of metals from third parties, net foreign currency transaction effect; partially offset by lower fuel and power costs, workers' participation expense, labor costs, and sales expense. |
87.1 | |||
• Higher depreciation, amortization and depletion mainly as a result of our expansion and maintenance capital investments. |
65.7 | |||
Less: |
||||
• Lower environmental remediation expenses from the 2014 spill at Buenavista. |
(46.4 | ) | ||
• Lower exploration expenses in Mexico, Peru and other exploration locations. |
(25.9 | ) | ||
• Lower selling, general and administrative expenses. |
(4.0 | ) | ||
| | | | | |
Operating cost and expenses for 2015 |
$ | 3,631.5 | ||
| | | | | |
| | | | | |
| | | | | |
85
| |
|
|
|
Variance | ||||||||||||
|---|---|---|---|---|---|---|---|---|---|---|---|---|---|---|---|---|
NON-OPERATING INCOME (EXPENSE)
|
2016 | 2015 | 2014 | 2016 - 2015 | 2015 - 2014 | |||||||||||
Interest expense |
$ | (360.3 | ) | $ | (334.0 | ) | $ | (265.3 | ) | $ | (26.3 | ) | $ | (68.7 | ) | |
Capitalized interest |
69.6 | 123.2 | 126.7 | (53.6 | ) | (3.5 | ) | |||||||||
Other (expense) income |
(24.6 | ) | (25.3 | ) | (40.8 | ) | 0.7 | 15.5 | ||||||||
Interest income |
7.1 | 10.9 | 15.3 | (3.8 | ) | (4.4 | ) | |||||||||
| | | | | | | | | | | | | | | | | |
Total non-operating income (expense) |
$ | (308.2 | ) | $ | (225.2 | ) | $ | (164.1 | ) | $ | (83.0 | ) | $ | (61.1 | ) | |
| | | | | | | | | | | | | | | | | |
| | | | | | | | | | | | | | | | | |
| | | | | | | | | | | | | | | | | |
2016-2015: Non-operating income and expense were a net expense of $308.2 million in 2016 compared to a net expense of $225.2 million in 2015. The $83.0 million increase in net expense in 2016 was mainly due to:
- •
- $53.6 million of lower capitalized interest, as completed Buenavista projects have been transferred to operations
- •
- $26.3 million of higher interest expense related to the $2 billion bond issue, in April 2015;
- •
- $3.8 million of lower interest income; partially offset by,
- •
- $0.7 million of higher miscellaneous income.
2015-2014: Non-operating income and expense were a net expense of $225.2 million in 2015 compared to a net expense of $164.1 million in 2014. The $61.1 million increase in net expense in 2015 was mainly due to:
- •
- $68.7 million of higher interest expense due to increased debt levels; partially offset by,
- •
- $15.5 million of lower miscellaneous expenses.
Income taxes
| |
2016 | 2015 | 2014 | |||||||
|---|---|---|---|---|---|---|---|---|---|---|
Provision for income taxes ($ in millions) |
$ | 501.1 | $ | 464.9 | $ | 754.6 | ||||
Effective income tax rate |
39.9 | % | 39.1 | % | 36.5 | % | ||||
The income tax provision includes Peruvian, Mexican and U.S. federal and state income taxes.
Components of income tax provision for 2016, 2015 and 2014 include the following ($ in millions):
| |
2016 | 2015 | 2014 | |||||||
|---|---|---|---|---|---|---|---|---|---|---|
Statutory income tax provision |
$ | 441.1 | $ | 423.1 | $ | 630.6 | ||||
Peruvian royalty |
— | 2.7 | 7.5 | |||||||
Mexican royalty |
48.9 | 20.9 | 81.2 | |||||||
Peruvian special mining tax |
11.1 | 18.2 | 35.3 | |||||||
| | | | | | | | | | | |
Total income tax provision |
$ | 501.1 | $ | 464.9 | $ | 754.6 | ||||
| | | | | | | | | | | |
| | | | | | | | | | | |
| | | | | | | | | | | |
The increase in the effective tax rate in 2016 from prior year was primarily due to the repatriation of foreign income to the U.S. jurisdiction from our Mexican Operations net of a decrease in permanent differences including exchange gain or loss, which is non-deductible in the Peruvian jurisdiction. The increase in the effective tax rate in 2015 from 2014 was primarily due to the increase in permanent differences including exchange gain or loss, which is non-deductible in the Peruvian jurisdiction.
Please see Note 8 "Income taxes" for further information regarding tax changes.
86
Equity earnings of affiliate
In 2016, 2015 and 2014 we have recognized $23.9 million, $16.8 million and $23.9 million, respectively of equity earnings of affiliate, from our 44.2% interest in the Tantahuatay mine.
Net Income attributable to the non-controlling interest
Net income attributable to the non-controlling interest in 2016 was $2.3 million, compared to $4.7 million in 2015, and $4.9 million in 2014, decreases in 2016 and 2015 of $2.4 million and $0.2 million, respectively. These decreases were the result of lower earnings at our Peruvian operations.
Income attributable to SCC
Our net income attributable to SCC in 2016 was $776.5 million, compared to $736.4 million in 2015 and $1,333.0 million in 2014. Net income attributable to SCC increased in 2016 and decreased in 2015 mainly as a result of higher copper sales volume, decrease in metal prices and other factors described above.
SEGMENT RESULTS ANALYSIS
We have three segments: the Peruvian operations, the Mexican open-pit operations and the Mexican underground mining operations. Please see a detailed definition of these segments in Item 1 "Business—Business Reporting Segments."
The following table presents the volume of sales by segment of copper and our significant by-products, for each of the years in the three year period ended December 31, 2016:
| |
|
|
|
Variance | ||||||||||||
|---|---|---|---|---|---|---|---|---|---|---|---|---|---|---|---|---|
Copper Sales (million pounds)
|
2016 | 2015 | 2014 | 2016 - 2015 | 2015 - 2014 | |||||||||||
Peruvian operations |
697.2 | 714.1 | 688.0 | (16.9 | ) | 26.1 | ||||||||||
Mexican open-pit |
1,226.7 | 911.7 | 760.0 | 315.0 | 151.7 | |||||||||||
Mexican IMMSA unit |
19.5 | 16.6 | 17.8 | 2.9 | (1.2 | ) | ||||||||||
Other and intersegment elimination |
(19.5 | ) | (16.6 | ) | (17.8 | ) | (2.9 | ) | 1.2 | |||||||
| | | | | | | | | | | | | | | | | |
Total copper sales |
1,923.9 | 1,625.8 | 1,448.0 | 298.1 | 177.8 | |||||||||||
| | | | | | | | | | | | | | | | | |
| | | | | | | | | | | | | | | | | |
| | | | | | | | | | | | | | | | | |
| |
|
|
|
Variance | ||||||||||||
|---|---|---|---|---|---|---|---|---|---|---|---|---|---|---|---|---|
By-product Sales (million pounds, except silver—million ounces)
|
2016 | 2015 | 2014 | 2016 - 2015 | 2015 - 2014 | |||||||||||
Peruvian operations: |
||||||||||||||||
Molybdenum contained in concentrate |
22.6 | 27.2 | 22.2 | (4.6 | ) | 5.0 | ||||||||||
Silver |
3.7 | 3.7 | 3.9 | — | (0.2 | ) | ||||||||||
Mexican open-pit operations: |
||||||||||||||||
Molybdenum contained in concentrate |
25.3 | 24.0 | 28.8 | 1.3 | (4.8 | ) | ||||||||||
Silver |
10.6 | 8.4 | 7.8 | 2.2 | 0.6 | |||||||||||
IMMSA unit |
||||||||||||||||
Zinc-refined and in concentrate |
232.4 | 222.2 | 201.5 | 10.2 | 20.7 | |||||||||||
Silver |
4.8 | 4.3 | 4.8 | 0.5 | (0.5 | ) | ||||||||||
Other and intersegment elimination |
||||||||||||||||
Silver |
(1.9 | ) | (1.9 | ) | (1.9 | ) | — | — | ||||||||
Total by-product sales |
||||||||||||||||
Molybdenum contained in concentrate |
47.9 | 51.2 | 51.0 | (3.3 | ) | 0.2 | ||||||||||
Zinc-refined and in concentrate |
232.4 | 222.2 | 201.5 | 10.2 | 20.7 | |||||||||||
Silver |
17.2 | 14.5 | 14.6 | 2.7 | (0.1 | ) | ||||||||||
87
Peruvian Open-pit Operations
| |
|
|
|
Variance | ||||||||||||
|---|---|---|---|---|---|---|---|---|---|---|---|---|---|---|---|---|
| |
2016 | 2015 | 2014 | 2016 - 2015 | 2015 - 2014 | |||||||||||
Net sales |
$ | 1,794.4 | $ | 2,021.3 | $ | 2,481.8 | $ | (226.9 | ) | $ | (460.5 | ) | ||||
Operating costs and expenses |
(1,547.8 | ) | (1,570.4 | ) | (1,673.4 | ) | 22.6 | 103.0 | ||||||||
| | | | | | | | | | | | | | | | | |
Operating income |
$ | 246.6 | $ | 450.9 | $ | 808.4 | $ | (204.3 | ) | $ | (357.5 | ) | ||||
| | | | | | | | | | | | | | | | | |
| | | | | | | | | | | | | | | | | |
| | | | | | | | | | | | | | | | | |
Net sales:
2016-2015: Net sales in 2016 decreased $226.9 million, compared to 2015, mainly as a result of lower sales volumes and the decrease in copper and molybdenum prices.
2015-2014: Net sales in 2015 decreased $460.5 million, compared to 2014, primarily due to the decrease in metal prices, partially offset by higher copper and molybdenum sales volume.
Operating costs and expenses:
2016-2015: Operating costs and expenses in 2016 decreased $22.6 million, compared to 2015, principally due to:
Operating cost and expenses for 2015 |
$ | 1,570.4 | ||
Less: |
||||
• Lower cost of sales (exclusive of depreciation, amortization and depletion), mainly due to lower fuel and power costs, workers participation expense and capitalized leachable material, partially offset by higher foreign currency transaction effect. |
(8.8 | ) | ||
• Lower depreciation, amortization and depletion. |
(11.0 | ) | ||
• Lower selling, general and administrative expenses. |
(3.9 | ) | ||
Plus: |
||||
• Higher exploration expenses. |
1.1 | |||
| | | | | |
Operating cost and expenses for 2016 |
$ | 1,547.8 | ||
| | | | | |
| | | | | |
| | | | | |
2015-2014: Operating costs and expenses in 2015 decreased $103.0 million, compared to 2014, principally due to:
Operating cost and expenses for 2014 |
$ | 1,673.4 | ||
Less: |
||||
• Lower cost of sales (exclusive of depreciation, amortization and depletion), mainly due to lower costs of fuels and power, labor costs and workers participation. |
(127.6 | ) | ||
• Lower selling, general and administrative expenses. |
(3.4 | ) | ||
• Lower exploration expenses. |
(1.7 | ) | ||
Plus: |
||||
• Higher depreciation, amortization and depletion due to the acquisition of mine equipment. |
29.7 | |||
| | | | | |
Operating cost and expenses for 2015 |
$ | 1,570.4 | ||
| | | | | |
| | | | | |
| | | | | |
88
Mexican Open-pit Operations
| |
|
|
|
Variance | ||||||||||||
|---|---|---|---|---|---|---|---|---|---|---|---|---|---|---|---|---|
| |
2016 | 2015 | 2014 | 2016 - 2015 | 2015 - 2014 | |||||||||||
Net sales |
$ | 3,234.3 | $ | 2,703.9 | $ | 2,954.6 | $ | 530.4 | $ | (250.7 | ) | |||||
Operating costs and expenses |
(1,940.2 | ) | (1,758.3 | ) | (1,504.6 | ) | (181.9 | ) | (253.7 | ) | ||||||
| | | | | | | | | | | | | | | | | |
Operating income |
$ | 1,294.1 | $ | 945.6 | $ | 1,450.0 | $ | 348.5 | $ | (504.4 | ) | |||||
| | | | | | | | | | | | | | | | | |
| | | | | | | | | | | | | | | | | |
| | | | | | | | | | | | | | | | | |
Net sales:
2016-2015: Net sales in 2016 increased by $530.4 million, compared to 2015, mainly as a result of higher copper, molybdenum and silver sales volume, due to the completion of the Buenavista projects; partially offset by lower copper and molybdenum prices.
2015-2014: Net sales in 2015 decreased by $250.7 million, compared to 2014, due to lower metal prices, partially offset by higher copper and silver sales volume.
Operating costs and expenses:
2016-2015: Operating costs and expenses in 2016 increased $181.9 million, compared to 2015, principally due to:
Operating cost and expenses for 2015 |
$ | 1,758.3 | ||
Plus: |
||||
• Higher cost of sales (exclusive of depreciation, amortization and depletion), principally as a result of higher copper sales volume from our new Buenavista concentrator production, capitalized leachable material, workers' participation expense and sales expenses, partially offset by lower inventory consumption and foreign currency transaction effect. |
133.2 | |||
• Higher depreciation, amortization and depletion mainly due to our expansion and maintenance capital projects. |
99.7 | |||
Less: |
||||
• Lower environmental remediation expense due to the spill at Buenavista. |
(45.0 | ) | ||
• Lower selling, general and administrative expenses. |
(3.5 | ) | ||
• Lower exploration expenses. |
(2.5 | ) | ||
| | | | | |
Operating cost and expenses for 2016 |
$ | 1,940.2 | ||
| | | | | |
| | | | | |
| | | | | |
2015-2014: Operating costs and expenses in 2015 increased $253.7 million, compared to 2014, principally due to:
Operating cost and expenses for 2014 |
$ | 1,504.6 | ||
Plus: |
||||
• Higher cost of sales (exclusive of depreciation, amortization and depletion), principally as a result of higher sales volume from our new Buenavista concentrator production, higher cost of metals purchased from third parties, inventory consumption and net foreign currency transaction effect. |
243.4 | |||
• Higher depreciation, amortization and depletion due to our expansion and maintenance capital investments. |
39.5 | |||
• Higher selling, general and administrative expenses. |
13.3 | |||
• Higher exploration expenses. |
3.9 | |||
Less: |
||||
• Lower environmental remediation expense for the 2014 spill at Buenavista. |
(46.4 | ) | ||
| | | | | |
Operating cost and expenses for 2015 |
$ | 1,758.3 | ||
| | | | | |
| | | | | |
| | | | | |
89
IMMSA unit
| |
|
|
|
Variance | ||||||||||||
|---|---|---|---|---|---|---|---|---|---|---|---|---|---|---|---|---|
| |
2016 | 2015 | 2014 | 2016 - 2015 | 2015 - 2014 | |||||||||||
Net sales |
$ | 423.1 | $ | 388.3 | $ | 441.7 | $ | 34.8 | $ | (53.4 | ) | |||||
Operating costs and expenses |
(366.3 | ) | (374.6 | ) | (414.2 | ) | 8.3 | 39.6 | ||||||||
| | | | | | | | | | | | | | | | | |
Operating income |
$ | 56.8 | $ | 13.7 | $ | 27.5 | $ | 43.1 | $ | (13.8 | ) | |||||
| | | | | | | | | | | | | | | | | |
| | | | | | | | | | | | | | | | | |
| | | | | | | | | | | | | | | | | |
Net sales:
2016-2015: Net sales in 2016 increased $34.8 million, compared to 2015, mainly as a result of higher zinc, copper and silver sales volumes, partially offset by lower copper prices.
2015-2014: Net sales in 2015 decreased $53.4 million, compared to 2014, mainly due to lower metal prices, partially offset by higher zinc sales volume. Copper and silver sales volume also decreased in 2015.
Operating costs and expenses:
2016-2015: Operating costs and expenses in 2016 decreased $8.3 million, compared to 2015, principally due to:
Operating cost and expenses for 2015 |
$ | 374.6 | ||
Less: |
||||
• Lower cost of sales (exclusive of depreciation, amortization and depletion), principally as a result of lower cost of metals purchased from third parties, inventory consumption and power costs. |
(19.7 | ) | ||
• Lower exploration expenses. |
(4.6 | ) | ||
Plus: |
||||
• Higher depreciation, amortization and depletion due to our maintenance capital investments. |
15.0 | |||
• Higher selling, general and administrative expenses. |
1.0 | |||
| | | | | |
Operating cost and expenses for 2016 |
$ | 366.3 | ||
| | | | | |
| | | | | |
| | | | | |
2015-2014: Operating costs and expenses in 2015 decreased $39.6 million, compared to 2014, principally due to:
Operating cost and expenses for 2014 |
$ | 414.2 | ||
Less: |
||||
• Lower exploration expenses. |
(19.9 | ) | ||
• Lower cost of sales (exclusive of depreciation, amortization and depletion), principally as a result of lower cost of power, workers participation and others. |
(11.2 | ) | ||
• Lower selling, general and administrative expenses. |
(9.9 | ) | ||
Plus: |
||||
• Higher depreciation, amortization and depletion. |
1.4 | |||
| | | | | |
Operating cost and expenses for 2015 |
$ | 374.6 | ||
| | | | | |
| | | | | |
| | | | | |
Intersegment Eliminations and Adjustments
The net sales, operating costs and expenses and operating income discussed above will not be directly equal to amounts in our consolidated statement of earnings because the adjustments of intersegment operating revenues and expenses must be taken into account. Please see Note 18 "Segment and Related Information" of our consolidated financial statements.
90
LIQUIDITY AND CAPITAL RESOURCES
The following discussion relates to our liquidity and capital resources for each of the years in the three year period ended December 31, 2016.
Cash Flow:
The following table shows the cash flow for the three year period ended December 31, 2016 (in millions):
| |
|
|
|
Variance | ||||||||||||
|---|---|---|---|---|---|---|---|---|---|---|---|---|---|---|---|---|
| |
2016 | 2015 | 2014 | 2016 - 2015 | 2015 - 2014 | |||||||||||
Net cash provided by operating activities |
$ | 923.1 | $ | 879.8 | $ | 1,355.9 | $ | 43.3 | $ | (476.1 | ) | |||||
Net cash used in investing activities |
$ | (452.0 | ) | $ | (1,461.0 | ) | $ | (1,655.2 | ) | $ | 1,009.0 | $ | 194.2 | |||
Net cash (used in) provided by financing activities |
$ | (210.7 | ) | $ | 492.2 | $ | (1,064.5 | ) | $ | (702.9 | ) | $ | 1,556.7 | |||
Net cash provided by operating activities:
The 2016, 2015 and 2014 change in net cash from operating activities include (in millions):
| |
|
|
|
Variance | ||||||||||||
|---|---|---|---|---|---|---|---|---|---|---|---|---|---|---|---|---|
| |
2016 | 2015 | 2014 | 2016 - 2015 | 2015 - 2014 | |||||||||||
Net income |
$ | 778.8 | $ | 741.1 | $ | 1,337.9 | $ | 37.7 | $ | (596.8 | ) | |||||
Depreciation, amortization and depletion |
647.1 | 510.7 | 445.0 | 136.4 | 65.7 | |||||||||||
Provision (benefit) for deferred income taxes |
(117.0 | ) | (153.2 | ) | (233.8 | ) | 36.2 | 80.6 | ||||||||
Other adjustments to net income |
8.0 | (9.0 | ) | (61.6 | ) | 17.0 | 52.6 | |||||||||
Operating assets and liabilities |
(393.8 | ) | (209.8 | ) | (131.6 | ) | (184.0 | ) | (78.2 | ) | ||||||
| | | | | | | | | | | | | | | | | |
Net cash provided from operating activities |
$ | 923.1 | $ | 879.8 | $ | 1,355.9 | $ | 43.3 | $ | (476.1 | ) | |||||
| | | | | | | | | | | | | | | | | |
| | | | | | | | | | | | | | | | | |
| | | | | | | | | | | | | | | | | |
Significant items added to (deducted from) net income to arrive at operating cash flow include depreciation, amortization and depletion, deferred tax amounts and changes in operating assets and liabilities.
2016: Net income was $778.8 million, approximately 84% of the net operating cash flow. An increase in operating assets and liabilities reduced operating cash flow by $393.8 million and included:
- •
- $(143.3) million increase in accounts receivable.
- •
- $(207.9) million increase in inventory which includes $(122.3) million of higher leachable material inventory and $(43.1) million of metals in
process, $(26.3) million of higher finished goods and $(16.2) million of higher supplies inventory.
- •
- $(42.6) million of net changes in accounts payable, accrued liabilities and other operating assets.
2015: Net income was $741.1 million, approximately 84% of the net operating cash flow. An increase in operating assets and liabilities reduced operating cash flow by $209.8 million and included:
- •
- $91. 6 million decrease in accounts receivable.
- •
- $(260.3) million increase in inventory which includes $(239.6) million of higher long-term leachable material inventory, principally at our
Buenavista mine.
- •
- $(28.9) million decrease in accounts payable and accrued liabilities which included $99.7 million of higher accounts payable, $(40.8)
million lower income tax accrual, $(73.1) million of workers' participation payments and $(14.7) millions of other liabilities.
- •
- $(12.2) million of changes in other operating assets and liabilities.
91
2014: In 2014, net income was $1,337.9 million, approximately 99% of the net operating cash flow. An increase in operating assets and liabilities reduced operating cash flow by $131.6 million and included:
- •
- $(7.0) million increase in accounts receivable.
- •
- $(260.1) million increase in inventory which includes $(117.5) million of higher long-term leachable material inventory, mainly at our
Buenavista mine, and an increase in current inventory of $(142.6) million principally related to the build-up of supplies inventory for the Buenavista expansion project.
- •
- $109.6 million increase in accounts payable and accrued liabilities which includes $72.6 million of higher income tax accrual,
$56.4 million of higher accounts payable mainly at our Mexican operations which includes higher capital investment at our Buenavista projects and $(19.4) million of lower deferred workers'
participation.
- •
- $25.9 million of changes in other operating assets and liabilities.
Net cash used in investing activities:
2016: Net cash used for investing activities in 2016 included $1,118.5 million for capital investments. These included $577.5 million of investments at our Mexican operations and $541.0 million of investments at our Peruvian operations. For further information, please see "Capital Investment Program" under this Item on page 74.
The 2016 investing activities also include net sales of short-term investments of $552.1 million, and a repayment of $111.2 million received from a related party.
2015: Net cash used for investing activities in 2015 included $1,149.6 million for capital investments. These included $964.8 million of investments at our Mexican operations and $285.2 million of investments at our Peruvian operations. For further information, please see "Capital Investment Program" under this Item on page 74.
The 2015 investing activities also include net purchases of short-term investments of $264.8 million and $100.4 million for the acquisition of the El Pilar mining property, and a repayment of $50 million received from a related party.
2014: Net cash used for investing activities in 2014 included $1,529.8 million for capital investments. These included $1,176.0 million of investments at our Mexican operations and $353.8 million of investments at our Peruvian operations. For further information, please see "Capital Investment Program" under this Item on page 74.
The 2014 investment activities also include net purchases of short-term investments of $130.3 million.
Net cash provided by (used in) financing activities:
2016: Net cash used in financing activities in 2016 was $210.7 million and included:
- •
- A dividend distribution of $139.3 million.
- •
- The repurchase of 2.9 million of our common shares at a cost of $71.7 million.
2015: Net cash provided by financing activities in 2015 was $492.2 million and included:
- •
- Gross proceeds of $2,045.8 million from the issuance of unsecured notes, net of an underwriting discount and $66 million of short-term borrowing in Peru.
92
- •
- Repayment of a short-term Peruvian loan of $66 million, and the repayment of $200 million of ten year senior unsecured notes.
- •
- A dividend distribution of $271.2 million.
- •
- The repurchase of 36.7 million of our common shares at a cost of $1,004.4 million.
- •
- Payment of debt issuance cost of $11.8 million.
- •
- A distribution of $0.5 million to the non-controlling interest.
2014: Net cash used in financing activities in 2014 was $1,064.5 million and included:
- •
- A dividend distribution of $381.0 million.
- •
- The repurchase of 22.7 million of our common shares at a cost of $682.7 million.
- •
- A distribution of $1.0 million to the non-controlling interest.
Other Liquidity Considerations
We expect that we will meet our cash requirements for 2017 and beyond from cash on hand and internally generated funds. In addition, we believe that we will be able to access additional external financing on reasonable terms, if required.
As of December 31, 2016, $509.7 million of the Company´s total cash, cash equivalents, restricted cash and short-term investments of $600.9 million was held by foreign subsidiaries. The cash, cash equivalents and short-term investments maintained in our foreign operations are generally used to cover local operating and investment expenses. At December 31, 2016, Minera Mexico determined that it has $470.5 million in earnings available for dividends to the United States. These earnings have not been remitted, but U.S. federal income tax, net of foreign tax credit utilization was recognized in 2016 resulting in an increase tax of $45.7 million. At December 31, 2015, Minera Mexico had determined that it had no remittable earnings available for dividends to the United States due to its internal financial obligations and expansion plans and had met the indefinite reversal criteria of ASC 740-30-25-17 that it intended to reinvest its earnings indefinitely. Any distribution of earning from our Mexican subsidiaries to the United States is subject to a U.S. federal income tax that equates to approximately 10% of the amount of the distribution, after considering foreign tax credit utilization.Distributions of earnings from our Peruvian branch to the United States are not subject to repatriation taxes. Our Peruvian operations are not foreign subsidiaries. Rather they are mainly comprised of operations that are treated as a branch of our U.S. operations from a tax perspective.
Share repurchase program: In 2008, our BOD authorized a $500 million share repurchase program that has since been increased by the BOD and is currently authorized to $3 billion. Since the inception of the program through December 31, 2016, we have purchased 119.5 million shares of our common stock at a cost of $2.9 billion. These shares are available for general corporate purposes. We may purchase additional shares of our common stock from time to time based on market conditions and other factors. This repurchase program has no expiration date and may be modified or discontinued at any time. For further details please see Item 5 "Market for Registrant's Common Equity, Related Stockholder Matters and Issuer Purchases of Equity Securities—SCC common stock repurchase plan."
Dividend: On January 26, 2017, the Board of Directors ("BOD") authorized a dividend of $0.08 per share payable on February 28, 2017, to shareholders of record at the close of business on February 14, 2017.
93
FINANCING
Our total debt at December 31, 2016 was $5,954.2 million, compared to $5,951.5 million at December 31, 2015, net of the unamortized discount and issuance costs of notes issued under par of $97.0 million and $99.6 million at December 31, 2016 and 2015, respectively. This debt is all denominated in dollars at fixed interest rates, weighed at 5.89%.
The ratio of total debt to total capitalization was 50.4% at December 31, 2016, compared to 52.9% at December 31, 2015. Also the ratio of net debt to net capitalization was 47.7% at December 31, 2016, compared to 48.9% at December 31, 2015.
We define net debt as total debt, including current maturities, minus cash, cash equivalents and short-term investments balance. We believe that net debt is useful to investors as a measure of our financial position. We define net capitalization as the sum of net debt and equity. We use the net debt to net capitalization ratio as measure of our indebtedness position and to determine how much debt we can take in addition to the use of the equity and the balance sheet in general. We define total capitalization as the sum of the carrying values of our total debt, including current maturities, and equity. A reconciliation of our net debt to net capitalization and total debt to total capitalization as included in the consolidated balance sheet is presented under the sub heading "Non-GAAP Information Reconciliation" below.
Please see Note 11 "Financing" for a discussion about the covenants requirements related to our long-term debt.
Capital investment programs
A discussion of our capital investment programs is an important part of understanding our liquidity and capital resources. We expect to meet the cash requirements for these capital investments from cash on hand, internally generated funds and from additional external financing if required. For information regarding our capital expenditure programs, please see the discussion under the caption "Capital Investment Program" under this Item 7.
CONTRACTUAL OBLIGATIONS
The following table summarizes our significant contractual obligations as of December 31, 2016:
| |
|
Payments due by Period | ||||||||||||||||||||
|---|---|---|---|---|---|---|---|---|---|---|---|---|---|---|---|---|---|---|---|---|---|---|
| |
Total | 2017 | 2018 | 2019 | 2020 | 2021 | 2022 and Thereafter |
|||||||||||||||
| |
(dollars in millions) |
|||||||||||||||||||||
Long-term debt |
$ | 6,051.1 | $ | — | $ | — | $ | — | $ | 400.0 | $ | — | $ | 5,651.1 | ||||||||
Interest on debt |
7,613.7 | 356.5 | 356.5 | 356.5 | 341.3 | 335.0 | 5,867.9 | |||||||||||||||
Uncertain tax position(a) |
304.0 | — | — | — | — | — | — | |||||||||||||||
Workers' participation |
125.4 | 125.4 | — | — | — | — | — | |||||||||||||||
Pension and post-retirement obligations |
26.3 | 3.0 | 2.4 | 2.5 | 2.5 | 2.6 | 13.3 | |||||||||||||||
Asset retirement obligation |
216.5 | 0.2 | — | — | — | — | 216.3 | |||||||||||||||
Purchase obligations: |
||||||||||||||||||||||
Commitment to purchase energy |
3,890.1 | 259.0 | 254.9 | 254.9 | 254.9 | 254.9 | 2,611.5 | |||||||||||||||
Capital investment projects |
1,447.2 | 785.2 | 662.0 | — | — | — | — | |||||||||||||||
| | | | | | | | | | | | | | | | | | | | | | | |
Total |
$ | 19,674.3 | $ | 1,529.3 | $ | 1,275.8 | $ | 613.9 | $ | 998.7 | $ | 592.5 | $ | 14,360.1 | ||||||||
| | | | | | | | | | | | | | | | | | | | | | | |
| | | | | | | | | | | | | | | | | | | | | | | |
| | | | | | | | | | | | | | | | | | | | | | | |
- (a)
- The above table does not include any future payment related to uncertain tax position liabilities because there is often a high degree of uncertainty regarding the timing of future cash outflows. As of December 31, 2016, the tax liability recognized by the Company is $304 million and is included as non-current liability in the consolidated Balance Sheet.
94
Long-term debt payments do not include the debt discount valuation account and issuance costs of $97.0 million.
Interest on debt is calculated at rates in effect at December 31, 2016. As all our debt is at fixed rates, future expenditures will not change due to rate changes. Please refer to Note 11 "Financing" of our consolidated financial statements for a description of our long-term debt arrangements and credit facilities.
Workers' participation is currently calculated based on Peruvian Branch and Mexican pre-tax earnings. In Peru, the provision for workers' participation is calculated at 8% of pre-tax earnings. The current portion of this participation, which is accrued during the year, is based on the Peruvian Branch's taxable income and is largely distributed to workers following determination of final results for the year. Amounts in excess of 18 times a worker's salary is distributed to governmental bodies. In Mexico, workers' participation is determined using the guidelines established in the Mexican income tax law at a rate of 10% of pre-tax earnings as adjusted by the tax law.
Pension and post retirement obligations include the benefits expected to be paid under our pension and post-retirement benefit plans. Please refer to Note 12 "Benefit Plans" of our consolidated financial statements.
Asset retirement obligations include the aggregate amount of the closure and remediation costs of our Peruvian mines and facilities to be paid under the mine closure plans approved by MINEM and the closure and remediation costs of our Mexican operations. See Note 10 "Asset Retirement Obligation."
We have a commitment to purchase power for our Peruvian operations from Engie Energia Peru S.A., "Engie" (formerly Enersur S.A.) through April 2017. In June 2014, we signed a power purchase agreement for 120MW with the state company Electroperu S.A., which will supply energy for our Peruvian operations for twenty years starting on April 17, 2017 and ending on April 30, 2037. In July 2014, we signed a power purchase agreement for 120MW with a private power generator Kallpa, which will supply energy for our Peruvian operations for ten years starting on April 17, 2017 and ending on April 30, 2027. In May 2016, we signed an additional power purchase agreement for a maximum of 80MW with Kallpa, under which Kallpa will supply energy for the Peruvian operations related to the Toquepala Expansion and other minor projects for ten years starting on May 1, 2017 and ending after ten years of commercial operation of the Toquepala Expansion or on April 30, 2029; whichever happens first.
Also we have a commitment to purchase power for our Mexican operations from MGE, a subsidiary of Grupo Mexico through 2032. See Note 13 "Commitment and Contingencies—Other commitments".
Amounts indicated on the above table are based on our long-term estimated power costs, which are subject to change as energy generation costs change and our forecasted power requirements through the life of the agreements change.
Capital investment projects include committed purchase orders and executed contracts principally for our Mexican projects at the Buenavista mine, and for our Peruvian expansion projects at Tia Maria and the Toquepala mine.
95
NON-GAAP INFORMATION RECONCILIATION
Operating cash cost: Following is a reconciliation of "Operating Cash Cost" (see page 71) to cost of sales (exclusive of depreciation, amortization and depletion) as reported in our consolidated statement of earnings, in millions of dollars and dollars per pound in the table below:
| |
2016 | 2015 | 2014 | ||||||||||||||||
|---|---|---|---|---|---|---|---|---|---|---|---|---|---|---|---|---|---|---|---|
| |
$ millions | $ per pound | $ millions | $ per pound | $ millions | $ per pound | |||||||||||||
Cost of sales (exclusive of depreciation, amortization and depletion) |
$ | 3,034.1 | $ | 1.58 | $ | 2,927.6 | $ | 1.83 | $ | 2,840.5 | $ | 1.96 | |||||||
Add: |
|||||||||||||||||||
Selling, general and administrative |
94.3 | 0.05 | 99.4 | 0.06 | 103.4 | 0.07 | |||||||||||||
Sales premiums, net of treatment and refining charges |
24.4 | 0.01 | (34.5 | ) | (0.02 | ) | (44.2 | ) | (0.03 | ) | |||||||||
Less: |
|||||||||||||||||||
Workers' participation |
(130.2 | ) | (0.07 | ) | (116.1 | ) | (0.07 | ) | (204.4 | ) | (0.14 | ) | |||||||
Cost of metals purchased from third parties |
(329.9 | ) | (0.17 | ) | (351.8 | ) | (0.22 | ) | (160.9 | ) | (0.11 | ) | |||||||
Royalty charge and other, net |
(65.6 | ) | (0.03 | ) | (72.9 | ) | (0.05 | ) | (21.5 | ) | (0.02 | ) | |||||||
Inventory change |
162.0 | 0.08 | 192.2 | 0.12 | 226.4 | 0.16 | |||||||||||||
| | | | | | | | | | | | | | | | | | | | |
Operating Cash Cost without by-product revenues |
$ | 2,789.1 | $ | 1.45 | $ | 2,643.9 | $ | 1.65 | $ | 2,739.3 | $ | 1.89 | |||||||
| | | | | | | | | | | | | | | | | | | | |
| | | | | | | | | | | | | | | | | | | | |
| | | | | | | | | | | | | | | | | | | | |
Add: |
|||||||||||||||||||
By-product revenues(1) |
(904.9 | ) | (0.47 | ) | (806.1 | ) | (0.50 | ) | (1,153.6 | ) | (0.80 | ) | |||||||
Net revenue on sale of metal purchased from third parties |
(50.7 | ) | (0.03 | ) | (60.7 | ) | (0.04 | ) | (32.8 | ) | (0.02 | ) | |||||||
| | | | | | | | | | | | | | | | | | | | |
Add: |
|||||||||||||||||||
Total by-product revenues |
(955.6 | ) | (0.50 | ) | (866.8 | ) | (0.54 | ) | (1,186.4 | ) | (0.82 | ) | |||||||
| | | | | | | | | | | | | | | | | | | | |
| | | | | | | | | | | | | | | | | | | | |
| | | | | | | | | | | | | | | | | | | | |
Operating Cash Cost with by-product revenues |
1,833.5 | 0.95 | 1,777.1 | $ | 1.11 | $ | 1,552.9 | $ | 1.07 | ||||||||||
| | | | | | | | | | | | | | | | | | | | |
| | | | | | | | | | | | | | | | | | | | |
| | | | | | | | | | | | | | | | | | | | |
Total pounds of copper produced (in millions) |
1,924.7 | 1,599.3 | 1,453.2 | ||||||||||||||||
- (1)
- By-product revenues included in our presentation of operating cash cost contain the following:
| |
2016 | 2015 | 2014 | ||||||||||||||||
|---|---|---|---|---|---|---|---|---|---|---|---|---|---|---|---|---|---|---|---|
| |
$ millions | $ per pound |
$ millions | $ per pound |
$ millions | $ per pound |
|||||||||||||
Molybdenum |
$ | (268.1 | ) | $ | (0.14 | ) | $ | (239.0 | ) | $ | (0.15 | ) | $ | (506.9 | ) | $ | (0.35 | ) | |
Silver |
(246.3 | ) | (0.13 | ) | (193.0 | ) | (0.12 | ) | (239.4 | ) | (0.17 | ) | |||||||
Zinc |
(189.3 | ) | (0.10 | ) | (148.9 | ) | (0.09 | ) | (160.8 | ) | (0.10 | ) | |||||||
Sulfuric Acid |
(87.6 | ) | (0.04 | ) | (127.6 | ) | (0.08 | ) | (121.5 | ) | (0.08 | ) | |||||||
Gold |
(50.6 | ) | (0.02 | ) | (35.1 | ) | (0.02 | ) | (41.3 | ) | (0.03 | ) | |||||||
Other |
(63.0 | ) | (0.04 | ) | (62.5 | ) | (0.04 | ) | (83.7 | ) | (0.07 | ) | |||||||
| | | | | | | | | | | | | | | | | | | | |
Total |
$ | (904.9 | ) | $ | (0.47 | ) | $ | (806.1 | ) | $ | (0.50 | ) | $ | (1,153.6 | ) | $ | (0.80 | ) | |
| | | | | | | | | | | | | | | | | | | | |
| | | | | | | | | | | | | | | | | | | | |
| | | | | | | | | | | | | | | | | | | | |
96
The by-product revenue presented does not match with the sales value reported by segment on page 141 because the above table excludes purchases from third parties, which are reclassified to net revenue on sale of metal purchased from third parties.
Net debt to net capitalization: Net debt to net capitalization as of December 31, 2016 and 2015 is as follows:
| |
2016 | 2015 | |||||
|---|---|---|---|---|---|---|---|
Total debt |
$ | 5,954.2 | $ | 5,951.5 | |||
Cash and cash equivalents |
(546.0 | ) | (274.5 | ) | |||
Short-term investments |
(51.3 | ) | (603.5 | ) | |||
| | | | | | | | |
Net debt |
5,356.9 | 5,073.5 | |||||
Net capitalization: |
|||||||
Net debt |
5,356.9 | 5,073.5 | |||||
Equity |
5,870.9 | 5,299.2 | |||||
| | | | | | | | |
Net capitalization |
$ | 11,227.8 | $ | 10,372.7 | |||
Net debt/net capitalization(*) |
47.7 |
% |
48.9 |
% |
|||
- (*)
- Represents net debt divided by net capitalization.
Total debt to total capitalization: Total debt to total capitalization as of December 31, 2016 and 2015 is as follows:
| |
2016 | 2015 | |||||
|---|---|---|---|---|---|---|---|
Total debt |
$ | 5,954.2 | $ | 5,951.5 | |||
Capitalization |
|||||||
Debt |
5,954.2 | 5,951.5 | |||||
Equity |
5,870.9 | 5,299.2 | |||||
| | | | | | | | |
Total capitalization |
$ | 11,825.1 | $ | 11,250.7 | |||
Total debt/total capitalization(*) |
50.4 |
% |
52.9 |
% |
|||
- (*)
- Represents debt divided by total capitalization.
97
ITEM 7A. QUANTITATIVE AND QUALITATIVE DISCLOSURES ABOUT MARKET RISK
Commodity price risk:
For additional information on metal price sensitivity, refer to "Metal Prices" in Part II, Item 7 of this annual report.
Open sales risk:
Our provisional copper and molybdenum sales contain an embedded derivative that is required to be separate from the host contract for accounting purposes. The host contract is the receivable from the sale of copper or molybdenum concentrates at prevailing market prices at the time of the sale. The embedded derivative, which does not qualify for hedge accounting, is marked to market through earnings each period prior to settlement. See Note 18 to our consolidated financial statements for further information about these provisional sales.
Foreign currency exchange rate risk:
Our functional currency is the U.S. dollar. Portions of our operating costs are denominated in Peruvian soles and Mexican pesos. Since our revenues are primarily denominated in U.S. dollars, when inflation or deflation in our Mexican or Peruvian operations is not offset by a change in the exchange rate of the sol or the peso to the dollar, our financial position, results of operations and cash flows could be affected by local cost conversion when expressed in U.S. dollars. In addition, the dollar value of our net monetary assets denominated in soles or pesos can be affected by an exchange rate variance of the sol or the peso, resulting in a re-measurement gain or loss in our financial statements. Recent inflation and exchange rate variances for the three years ended December 31, 2016, are provided in the table below:
| |
2016 | 2015 | 2014 | |||||||
|---|---|---|---|---|---|---|---|---|---|---|
Peru: |
||||||||||
Peruvian inflation rate |
3.2 | % | 4.4 | % | 3.2 | % | ||||
Initial exchange rate |
3.413 |
2.989 |
2.796 |
|||||||
Closing exchange rate |
3.360 | 3.413 | 2.989 | |||||||
Appreciation/(devaluation) |
1.6 | % | (14.2 | )% | (6.9 | )% | ||||
Mexico: |
||||||||||
Mexican inflation rate |
3.4 | % | 2.1 | % | 4.1 | % | ||||
Initial exchange rate |
17.207 |
14.718 |
13.077 |
|||||||
Closing exchange rate |
20.664 | 17.207 | 14.718 | |||||||
Appreciation/(devaluation) |
(20.1 | )% | (16.9 | )% | (12.6 | )% | ||||
Change in monetary position:
Assuming an exchange rate variance of 10% at December 31, 2016, we estimate our net monetary position in Peruvian sol and Mexican peso would increase (decrease) our net earnings as follows:
| |
Effect in net earnings ($ in millions) |
|||
|---|---|---|---|---|
Appreciation of 10% in U.S. dollar vs. Peruvian sol |
$ | 0.6 | ||
Devaluation of 10% in U.S. dollar vs. Peruvian sol |
$ | (0.8 | ) | |
Appreciation of 10% in U.S. dollar vs. Mexican peso |
$ | 3.1 | ||
Devaluation of 10% in U.S. dollar vs. Mexican peso |
$ | (3.8 | ) | |
98
The net monetary position is net of those assets and liabilities that are sol or peso denominated at December 31, 2016.
Short-term investments:
For additional information on our trading securities and available-for-sale investments, refer to Note 3 Short-term Investments in Part II, Item 8 of this annual report.
99
ITEM 8. FINANCIAL STATEMENTS AND SUPPLEMENTAL DATA
REPORT OF INDEPENDENT REGISTERED PUBLIC ACCOUNTING FIRM
To the Board of Directors and Stockholders of Southern Copper Corporation
We have audited the accompanying consolidated balance sheets of Southern Copper Corporation and subsidiaries (the "Company") as of December 31, 2016 and 2015, and the related consolidated statements of earnings, comprehensive income, stockholders' equity, and cash flows for each of the three years in the period ended December 31, 2016. Our audits also included the financial statement schedule listed in the Index at Item 15. These financial statements and financial statement schedule are the responsibility of the Company's management. Our responsibility is to express an opinion on the financial statements and financial statement schedule based on our audits.
We conducted our audits in accordance with the standards of the Public Company Accounting Oversight Board (United States). Those standards require that we plan and perform the audit to obtain reasonable assurance about whether the financial statements are free of material misstatement. An audit includes examining, on a test basis, evidence supporting the amounts and disclosures in the financial statements. An audit also includes assessing the accounting principles used and significant estimates made by management, as well as evaluating the overall financial statement presentation. We believe that our audits provide a reasonable basis for our opinion.
In our opinion, such consolidated financial statements present fairly, in all material respects, the financial position of Southern Copper Corporation and subsidiaries as of December 31, 2016 and 2015, and the results of their operations and their cash flows for each of the three years in the period ended December 31, 2016, in conformity with accounting principles generally accepted in the United States of America. Also, in our opinion, such financial statement schedule, when considered in relation to the basic consolidated financial statements taken as a whole, present fairly, in all material respects, the information set forth therein.
We have also audited, in accordance with the standards of the Public Company Accounting Oversight Board (United States), the Company's internal control over financial reporting as of December 31, 2016, based on the criteria established in Internal Control—Integrated Framework (2013) issued by the Committee of Sponsoring Organizations of the Treadway Commission and our report dated March 1, 2017 expressed an unqualified opinion on the Company's internal control over financial reporting.
Galaz,
Yamazaki, Ruiz Urquiza, S.C.
Member of Deloitte Touche Tohmatsu Limited
C.P.C.
Miguel Angel Andrade Leven
Mexico City, Mexico
March 1, 2017
100
Southern Copper Corporation
and Subsidiaries
CONSOLIDATED STATEMENTS OF EARNINGS
| For the years ended December 31, (in millions, except for per share amounts) |
2016 | 2015 | 2014 | |||||||
|---|---|---|---|---|---|---|---|---|---|---|
Net sales (including sales to related parties, see note 17) |
$ | 5,379.8 | $ | 5,045.9 | $ | 5,787.7 | ||||
Operating cost and expenses: |
||||||||||
Cost of sales (exclusive of depreciation, amortization and depletion shown separately below) |
3,034.1 | 2,927.6 | 2,840.5 | |||||||
Selling, general and administrative |
94.3 | 99.4 | 103.4 | |||||||
Depreciation, amortization and depletion |
647.1 | 510.7 | 445.0 | |||||||
Exploration |
40.1 | 48.8 | 74.7 | |||||||
Environmental remediation |
— | 45.0 | 91.4 | |||||||
| | | | | | | | | | | |
Total operating costs and expenses |
3,815.6 | 3,631.5 | 3,555.0 | |||||||
| | | | | | | | | | | |
Operating income |
1,564.2 | 1,414.4 | 2,232.7 | |||||||
Interest expense |
(360.3 |
) |
(334.0 |
) |
(265.3 |
) |
||||
Capitalized interest |
69.6 | 123.2 | 126.7 | |||||||
Other (expense) |
(24.6 | ) | (25.3 | ) | (40.8 | ) | ||||
Interest income |
7.1 | 10.9 | 15.3 | |||||||
| | | | | | | | | | | |
Income before income taxes |
1,256.0 | 1,189.2 | 2,068.6 | |||||||
Income taxes (including royalty taxes, see Note 8) |
501.1 | 464.9 | 754.6 | |||||||
| | | | | | | | | | | |
Net income before equity earnings of affiliate |
754.9 | 724.3 | 1,314.0 | |||||||
Equity earnings of affiliate, net of income tax |
23.9 | 16.8 | 23.9 | |||||||
| | | | | | | | | | | |
Net income |
778.8 | 741.1 | 1,337.9 | |||||||
Less: Net income attributable to the non-controlling interest |
2.3 | 4.7 | 4.9 | |||||||
| | | | | | | | | | | |
Net income attributable to SCC |
$ | 776.5 | $ | 736.4 | $ | 1,333.0 | ||||
| | | | | | | | | | | |
| | | | | | | | | | | |
| | | | | | | | | | | |
Per common share amounts attributable to SCC: |
||||||||||
Net earnings—basic and diluted |
$ | 1.00 | $ | 0.93 | $ | 1.61 | ||||
Dividends declared and paid |
$ | 0.18 | $ | 0.34 | $ | 0.46 | ||||
Weighted average shares outstanding—basic and diluted |
773.6 |
794.7 |
828.2 |
|||||||
| | | | | | | | | | | |
| | | | | | | | | | | |
| | | | | | | | | | | |
The accompanying notes are an integral part of these consolidated financial statements.
101
Southern Copper Corporation
and Subsidiaries
CONSOLIDATED STATEMENTS OF COMPREHENSIVE INCOME
| |
2016 | 2015 | 2014 | |||||||
|---|---|---|---|---|---|---|---|---|---|---|
| |
(in millions) |
|||||||||
COMPREHENSIVE INCOME: |
||||||||||
Net income |
$ | 778.8 | $ | 741.1 | $ | 1,337.9 | ||||
| | | | | | | | | | | |
Other comprehensive income (loss) net of tax: |
||||||||||
—(Increase) decrease in pension and other post-retirement benefits (net of income tax of $2.6, $2.6 and $0.8, respectively) |
(3.5 | ) | (3.7 | ) | (1.4 | ) | ||||
| | | | | | | | | | | |
Total other comprehensive income (loss) |
(3.5 | ) | (3.7 | ) | (1.4 | ) | ||||
| | | | | | | | | | | |
Total comprehensive income |
775.3 | 737.4 | 1,336.5 | |||||||
Comprehensive income attributable to the non-controlling interest |
2.3 | 4.7 | 4.9 | |||||||
| | | | | | | | | | | |
Comprehensive income attributable to SCC |
$ | 773.0 | $ | 732.7 | $ | 1,331.6 | ||||
| | | | | | | | | | | |
| | | | | | | | | | | |
| | | | | | | | | | | |
The accompanying notes are an integral part of these consolidated financial statements.
102
Southern Copper Corporation
and Subsidiaries
CONSOLIDATED BALANCE SHEETS
| At December 31, (in millions) |
2016 | 2015 | |||||
|---|---|---|---|---|---|---|---|
ASSETS |
|||||||
Current assets: |
|||||||
Cash and cash equivalents |
$ | 546.0 | $ | 274.5 | |||
Restricted cash |
3.6 | 4.3 | |||||
Short-term investments |
51.3 | 603.5 | |||||
Accounts receivable trade |
591.9 | 448.6 | |||||
Accounts receivable other (including related parties 2016—$23.4 and 2015—$15.8) |
76.6 | 102.6 | |||||
Inventories |
1,010.4 | 857.2 | |||||
Prepaid taxes |
249.4 | 165.8 | |||||
Other current assets |
36.9 | 27.7 | |||||
| | | | | | | | |
Total current assets |
2,566.1 | 2,484.2 | |||||
Property and mine development, net |
8,766.5 |
8,262.8 |
|||||
Ore stockpiles on leach pads |
806.9 | 752.3 | |||||
Intangible assets, net |
154.2 | 155.1 | |||||
Related parties receivable |
— | 111.2 | |||||
Deferred income tax |
727.3 | 614.2 | |||||
Equity method investment |
87.5 | 76.1 | |||||
Other non-current assets |
125.8 | 137.3 | |||||
| | | | | | | | |
Total assets |
$ | 13,234.3 | $ | 12,593.2 | |||
| | | | | | | | |
| | | | | | | | |
| | | | | | | | |
LIABILITIES |
|||||||
Current liabilities: |
|||||||
Accounts payable (including related parties 2016—$62.2 and 2015—$69.3) |
$ | 584.2 | $ | 646.6 | |||
Accrued income taxes |
185.1 | 39.2 | |||||
Accrued workers' participation |
125.4 | 124.9 | |||||
Accrued interest |
85.6 | 87.1 | |||||
Other accrued liabilities |
18.7 | 22.4 | |||||
| | | | | | | | |
Total current liabilities |
999.0 | 920.2 | |||||
| | | | | | | | |
Long-term debt |
5,954.2 | 5,951.5 | |||||
Deferred income taxes |
162.6 | 196.0 | |||||
Other liabilities and reserves |
31.1 | 35.4 | |||||
Asset retirement obligation |
216.5 | 190.9 | |||||
| | | | | | | | |
Total non-current liabilities |
6,364.4 | 6,373.8 | |||||
| | | | | | | | |
Commitments and contingencies (Note 13) |
|||||||
STOCKHOLDERS' EQUITY (NOTE 14) |
|||||||
Common stock par value $0.01; shares authorized, 2016 and 2015—2,000 shares issued, 2016 and 2015—884.6 |
8.8 | 8.8 | |||||
Additional paid-in capital |
3,358.2 | 3,349.8 | |||||
Retained earnings |
5,455.3 | 4,812.1 | |||||
Accumulated other comprehensive income |
(2.4 | ) | 1.1 | ||||
Treasury stock, at cost, common shares |
(2,987.6 | ) | (2,908.9 | ) | |||
| | | | | | | | |
Total Southern Copper Corporation stockholders' equity |
5,832.3 | 5,262.9 | |||||
Non-controlling interest |
38.6 | 36.3 | |||||
| | | | | | | | |
Total equity |
5,870.9 | 5,299.2 | |||||
| | | | | | | | |
Total liabilities and equity |
$ | 13,234.3 | $ | 12,593.2 | |||
| | | | | | | | |
| | | | | | | | |
| | | | | | | | |
The accompanying notes are an integral part of these consolidated financial statements.
103
Southern Copper Corporation
and Subsidiaries
CONSOLIDATED STATEMENTS OF CASH FLOWS
| For the years ended December 31, (in millions) |
2016 | 2015 | 2014 | |||||||
|---|---|---|---|---|---|---|---|---|---|---|
OPERATING ACTIVITIES |
||||||||||
Net income |
$ | 778.8 | $ | 741.1 | $ | 1,337.9 | ||||
Adjustments to reconcile net earnings to net cash provided from operating activities: |
||||||||||
Depreciation, amortization and depletion |
647.1 | 510.7 | 445.0 | |||||||
Equity earnings of affiliate, net of dividends received |
(11.3 | ) | (9.4 | ) | (9.6 | ) | ||||
(Gain) on foreign currency transaction effect |
(8.9 | ) | (2.2 | ) | (54.0 | ) | ||||
(Benefit) provision for deferred income taxes |
(117.0 | ) | (153.2 | ) | (233.8 | ) | ||||
Other, net |
28.2 | 2.6 | 2.0 | |||||||
Change in operating assets and liabilities: |
||||||||||
(Increase) decrease in accounts receivable |
(143.3 | ) | 91.6 | (7.0 | ) | |||||
(Increase) decrease in inventories |
(207.9 | ) | (260.3 | ) | (260.1 | ) | ||||
Increase (decrease) in accounts payable and accrued liabilities |
30.5 | (28.9 | ) | 109.6 | ||||||
(Increase) decrease in other operating assets and liabilities |
(73.1 | ) | (12.2 | ) | 25.9 | |||||
| | | | | | | | | | | |
Net cash provided by operating activities |
923.1 | 879.8 | 1,355.9 | |||||||
| | | | | | | | | | | |
INVESTING ACTIVITIES |
||||||||||
Capital expenditures |
(1,118.5 | ) | (1,149.6 | ) | (1,529.8 | ) | ||||
Payment to acquire business, net of cash acquired |
— | (100.4 | ) | — | ||||||
Purchase of short-term investments |
(129.8 | ) | (956.9 | ) | (436.6 | ) | ||||
Proceeds on sale of short-term investment |
681.9 | 692.1 | 306.3 | |||||||
Loan repaid by related parties |
111.2 | 50.0 | — | |||||||
Other, net |
3.2 | 3.8 | 4.9 | |||||||
| | | | | | | | | | | |
Net cash used in investing activities |
(452.0 | ) | (1,461.0 | ) | (1,655.2 | ) | ||||
| | | | | | | | | | | |
FINANCING ACTIVITIES |
||||||||||
Proceeds from issuance of debt |
— | 2,045.8 | — | |||||||
Repayments of debt |
— | (266.0 | ) | — | ||||||
Payments of debt issuance cost |
— | (11.8 | ) | — | ||||||
Repurchase of common shares |
(71.7 | ) | (1,004.4 | ) | (682.7 | ) | ||||
Cash dividends paid to common stockholders |
(139.3 | ) | (271.2 | ) | (381.0 | ) | ||||
Distributions to non-controlling interest |
— | (0.5 | ) | (1.0 | ) | |||||
Other, net |
0.3 | 0.3 | 0.2 | |||||||
| | | | | | | | | | | |
Net cash (used in) provided by financing activities |
(210.7 | ) | 492.2 | (1,064.5 | ) | |||||
| | | | | | | | | | | |
Effect of exchange rate changes on cash and cash equivalents |
11.1 | (0.5 | ) | 55.1 | ||||||
| | | | | | | | | | | |
Increase (decrease) in cash and cash equivalents |
271.5 | (89.5 | ) | (1,308.7 | ) | |||||
Cash and cash equivalents, at beginning of year |
274.5 | 364.0 | 1,672.7 | |||||||
| | | | | | | | | | | |
Cash and cash equivalents, at end of year |
$ | 546.0 | $ | 274.5 | $ | 364.0 | ||||
| | | | | | | | | | | |
| | | | | | | | | | | |
| | | | | | | | | | | |
The accompanying notes are an integral part of these consolidated financial statements.
104
Southern Copper Corporation
and Subsidiaries
CONSOLIDATED STATEMENTS OF CASH FLOWS (Continued)
| |
2016 | 2015 | 2014 | |||||||
|---|---|---|---|---|---|---|---|---|---|---|
| |
(in millions) |
|||||||||
Supplemental disclosure of cash flow information: |
||||||||||
Cash paid during the year for: |
||||||||||
Interest |
$ | 356.7 | $ | 315.8 | $ | 262.0 | ||||
Income taxes |
$ | 571.8 | $ | 737.7 | $ | 848.3 | ||||
Workers' participation |
$ | 121.6 | $ | 192.5 | $ | 202.4 | ||||
Supplemental schedule of non-cash operating, investing and financing activities: |
||||||||||
Decrease (increase) in pension and other post-retirement benefits |
$ | (3.5 | ) | $ | (3.7 | ) | $ | (1.4 | ) | |
Capital expenditures incurred but not yet paid |
$ | 99.4 | $ | 51.0 | $ | 33.8 | ||||
In 2015, the Company purchased all of the outstanding stock of Recursos Stingray de Cobre S.A de C.V for $100.0 million. In conjunction with the acquisition, liabilities were assumed as follows (in millions):
| |
2015 | |||
|---|---|---|---|---|
Fair value of assets acquired |
$ | 128.3 | ||
Cash paid for the capital stock |
(100.0 | ) | ||
| | | | | |
Liabilities assumed |
$ | 28.3 | ||
The accompanying notes are an integral part of these consolidated financial statements.
105
Southern Copper Corporation
and Subsidiaries
CONSOLIDATED STATEMENTS OF CHANGES IN EQUITY
| For years ended December 31, (in millions) |
2016 | 2015 | 2014 | |||||||
|---|---|---|---|---|---|---|---|---|---|---|
TOTAL EQUITY, beginning of year |
$ | 5,299.2 | $ | 5,836.6 | $ | 5,561.8 | ||||
| | | | | | | | | | | |
STOCKHOLDERS' EQUITY, beginning of year |
5,262.9 | 5,804.5 | 5,533.7 | |||||||
CAPITAL STOCK: |
||||||||||
Balance at beginning and end of year: |
8.8 | 8.8 | 8.8 | |||||||
ADDITIONAL PAID-IN CAPITAL: |
||||||||||
Balance at beginning of year |
3,349.8 | 3,344.7 | 3,340.4 | |||||||
Other activity of the period |
8.4 | 5.1 | 4.3 | |||||||
| | | | | | | | | | | |
Balance at end of year |
3,358.2 | 3,349.8 | 3,344.7 | |||||||
| | | | | | | | | | | |
TREASURY STOCK: |
||||||||||
Southern Copper common shares |
||||||||||
Balance at beginning of the year |
(2,697.6 | ) | (1,693.5 | ) | (1,011.0 | ) | ||||
Share repurchase program |
(71.7 | ) | (1,004.4 | ) | (682.7 | ) | ||||
Used for corporate purposes |
0.3 | 0.3 | 0.2 | |||||||
| | | | | | | | | | | |
Balance at end of period |
(2,769.0 | ) | (2,697.6 | ) | (1,693.5 | ) | ||||
| | | | | | | | | | | |
Parent Company common shares |
||||||||||
Balance at beginning of year |
(211.3 | ) | (207.1 | ) | (205.5 | ) | ||||
Other activity, including dividend, interest and foreign currency transaction effect |
(7.3 | ) | (4.2 | ) | (1.6 | ) | ||||
| | | | | | | | | | | |
Balance at end of year |
(218.6 | ) | (211.3 | ) | (207.1 | ) | ||||
| | | | | | | | | | | |
Treasury stock balance at end of year |
(2,987.6 | ) | (2,908.9 | ) | (1,900.6 | ) | ||||
| | | | | | | | | | | |
RETAINED EARNINGS: |
||||||||||
Balance at beginning of year |
4,812.1 | 4,346.8 | 3,394.8 | |||||||
Net earnings |
776.5 | 736.4 | 1,333.0 | |||||||
Dividends declared and paid, common stock, per share, 2016—$0.18, 2015—$0.34, 2014—$0.46 |
(139.3 | ) | (271.1 | ) | (381.0 | ) | ||||
Other activity of the period |
6.0 | — | — | |||||||
| | | | | | | | | | | |
Balance at end of year |
5,455.3 | 4,812.1 | 4,346.8 | |||||||
| | | | | | | | | | | |
ACCUMULATED OTHER COMPREHENSIVE INCOME (LOSS): |
||||||||||
Balance at beginning of year |
1.1 | 4.8 | 6.2 | |||||||
Other comprehensive (loss) income |
(3.5 | ) | (3.7 | ) | (1.4 | ) | ||||
| | | | | | | | | | | |
Balance at end of year |
(2.4 | ) | 1.1 | 4.8 | ||||||
| | | | | | | | | | | |
STOCKHOLDERS' EQUITY, end of year |
5,832.3 | 5,262.9 | 5,804.5 | |||||||
| | | | | | | | | | | |
NON-CONTROLLING INTEREST, beginning of year |
36.3 | 32.1 | 28.2 | |||||||
Net earnings |
2.3 | 4.7 | 4.9 | |||||||
Distributions paid |
— | (0.5 | ) | (0.9 | ) | |||||
Other activity |
— | — | (0.1 | ) | ||||||
| | | | | | | | | | | |
NON-CONTROLLING INTEREST, end of year |
38.6 | 36.3 | 32.1 | |||||||
| | | | | | | | | | | |
TOTAL EQUITY, end of year |
$ | 5,870.9 | $ | 5,299.2 | $ | 5,836.6 | ||||
| | | | | | | | | | | |
| | | | | | | | | | | |
| | | | | | | | | | | |
The accompanying notes are an integral part of these consolidated financial statements.
106
SOUTHERN COPPER CORPORATION AND SUBSIDIARIES
NOTES TO CONSOLIDATED FINANCIAL STATEMENTS
NOTE 1—DESCRIPTION OF THE BUSINESS:
The Company is a majority-owned, indirect subsidiary of Grupo Mexico S.A.B. de C.V. ("Grupo Mexico"). At December 31, 2016, Grupo Mexico through its wholly-owned subsidiary Americas Mining Corporation ("AMC") owned 88.9% of the Company's capital stock. The consolidated financial statements presented herein consist of the accounts of Southern Copper Corporation ("SCC" or the "Company"), a Delaware corporation, and its subsidiaries. The Company is an integrated producer of copper and other minerals, and operates mining, smelting and refining facilities in Peru and Mexico. The Company conducts its primary operations in Peru through a registered branch (the "Peruvian Branch" or "Branch" or "SPCC Peru Branch"). The Peruvian Branch is not a corporation separate from the Company. The Company's Mexican operations are conducted through subsidiaries. The Company also conducts exploration activities in Argentina, Chile, Ecuador, Mexico and Peru.
NOTE 2—SUMMARY OF SIGNIFICANT ACCOUNTING POLICIES:
Principles of consolidation—
The consolidated financial statements include the accounts of subsidiaries of which the Company has voting control, in accordance with Accounting Standards Codification ("ASC") 810 Consolidation. Such financial statements are prepared in accordance with accounting principles generally accepted in the United States ("U.S. GAAP").
Use of estimates—
The preparation of financial statements in conformity with U.S. GAAP requires management to make estimates and assumptions that affect the reported amounts of assets and liabilities, and disclosure of contingent assets and liabilities at the date of the financial statements, and the reported amounts of revenues and expenses during the reporting period. Significant items subject to such estimates and assumptions include the carrying value of ore reserves that are the basis for future cash flow estimates and amortization calculations; environmental reclamation, closure and retirement obligations; estimates of recoverable copper in mill and leach stockpiles; asset impairments (including estimates of future cash flows); unrecognized tax benefits; valuation allowances for deferred tax assets; and fair value of financial instruments. Management bases its estimates on the Company's historical experience and on various other assumptions that are believed to be reasonable under the circumstances. Actual results could differ from those estimates.
Revenue recognition—
Substantially all of the Company's copper and non-copper products are sold under annual or other longer-term contracts.
Revenue is recognized when title passes to the customer. The passing of title is based on terms of the contract, generally upon shipment. Copper and non-copper revenues are determined based on the monthly average of prevailing commodity prices according to the terms of the contracts. The Company provides allowances for doubtful accounts based upon historical bad debt and claims experience and periodic evaluation of specific customer accounts.
For certain of the Company's sales of copper and molybdenum products, customer contracts allow for pricing based on a month subsequent to shipping, in most cases within the following three months and occasionally in some cases a few additional months. In such cases, revenue is recorded at a
107
SOUTHERN COPPER CORPORATION AND SUBSIDIARIES
NOTES TO CONSOLIDATED FINANCIAL STATEMENTS (Continued)
NOTE 2—SUMMARY OF SIGNIFICANT ACCOUNTING POLICIES: (Continued)
provisional price at the time of shipment. The provisionally priced copper sales are adjusted to reflect forward LME or COMEX copper prices at the end of each month until a final adjustment is made to the price of the shipments upon settlement with customers pursuant to the terms of the contract. In the case of molybdenum sales, for which there are no published forward prices, the provisionally priced sales are adjusted to reflect the market prices at the end of each month until a final adjustment is made to the price of the shipments upon settlement with customers pursuant to the terms of the contract.
These provisional pricing arrangements are accounted for separately from the contract as an embedded derivative instrument under ASC 815-30 "Derivatives and Hedging—Cash Flow Hedges." The Company sells copper in concentrate, anode, blister and refined form at industry standard commercial terms. Net sales include the invoiced value of copper, zinc, silver, molybdenum, sulfuric acid and other metals and the corresponding fair value adjustment of the related forward contract of copper and molybdenum.
Shipping and handling fees and costs—
Amounts billed to customers for shipping and handling are classified as sales. Amounts incurred for shipping and handling are included in cost of sales (exclusive of depreciation, amortization and depletion).
Cash and cash equivalents—
Cash and cash equivalents include bank deposits, certificates of deposit and short-term investment funds with original maturities of three months or less at the date of purchase. The carrying value of cash and cash equivalents approximates fair value.
Short-term investments—
The Company accounts for short-term investments in accordance with ASC 320-10 "Investments Debt and Equity Securities—Recognition." The Company determines the appropriate classification of all short-term investments as held-to-maturity, available-for-sale or trading at the time of purchase and re-evaluates such classifications as of each balance sheet date. Unrealized gains and losses on available-for-sale investments, net of taxes, are reported as a component of accumulated other comprehensive income (loss) in stockholders' equity, unless such loss is deemed to be other than temporary.
Inventories—
The Company principally produces copper and, in the production process, obtains several by-products, including molybdenum, silver, zinc, sulfuric acid and other metals.
Metal inventories, consisting of work-in-process and finished goods, are carried at the lower of average cost or market. Costs incurred in the production of metal inventories exclude general and administrative costs. Once molybdenum, silver, zinc and other by-products are identified, they are transferred to their respective production facilities and the incremental cost required to complete production is assigned to their inventory value.
108
SOUTHERN COPPER CORPORATION AND SUBSIDIARIES
NOTES TO CONSOLIDATED FINANCIAL STATEMENTS (Continued)
NOTE 2—SUMMARY OF SIGNIFICANT ACCOUNTING POLICIES: (Continued)
Work-in-process inventories represent materials that are in the process of being converted into a saleable product. Conversion processes vary depending on the nature of the copper ore and the specific mining operation. For sulfide ores, processing includes milling and concentrating and results in the production of copper and molybdenum concentrates.
Finished goods include saleable products (e.g., copper concentrates, copper anodes, copper cathodes, copper rod, molybdenum concentrate and other metallurgical products).
Supplies inventories are carried at the lower of average cost or market.
Long-term inventory—Ore stockpiles on leach pads.
The leaching process is an integral part of the mining operations carried out at the Company's open-pit mines. The Company capitalizes the production cost of leachable material at its Toquepala, La Caridad and Buenavista mines recognizing it as inventory. The estimates of recoverable mineral content contained in the leaching dumps are supported by engineering studies. As the production cycle of the leaching process is significantly longer than the conventional process of concentrating, smelting and electrolytic refining, the Company includes on its balance sheet current leach inventory (included in work-in-process inventories) and long-term leach inventory. Through 2013, the cost attributed to the leach material was charged to cost of sales over a five-year period, which was considered the average estimated recovery period based on the historical recovery percentages of each mine. During the fourth quarter of 2014, the Company completed the construction of a new plant that has resulted in increased efficiency in production and use of leachable material. Accordingly, the Company changed its method of amortization to the units of production method. This change in estimate effected by a change in accounting principle results in a better matching of costs to revenues as a result of the improved production levels from the new plant and results in a better estimate of current and long-term leachable material inventory.
Property—
Property is recorded at acquisition cost, net of accumulated depreciation and amortization. Cost includes major expenditures for improvements and replacements, which extend useful lives or increase capacity and interest costs associated with significant capital additions. Maintenance, repairs, normal development costs at existing mines and gains or losses on assets retired or sold are reflected in earnings as incurred.
Buildings and equipment are depreciated on the straight-line method over estimated lives from five to 40 years or the estimated life of the mine if shorter.
Mine development—
Mine development includes primarily the cost of acquiring land rights to an exploitable ore body, pre-production stripping costs at new mines that are commercially exploitable, costs associated with bringing new mineral properties into production, and removal of overburden to prepare unique and identifiable areas outside the current mining area for such future production. Mine development costs are amortized on a unit of production basis over the remaining life of the mines.
109
SOUTHERN COPPER CORPORATION AND SUBSIDIARIES
NOTES TO CONSOLIDATED FINANCIAL STATEMENTS (Continued)
NOTE 2—SUMMARY OF SIGNIFICANT ACCOUNTING POLICIES: (Continued)
There is a diversity of practices in the mining industry in the treatment of drilling and other related costs to delineate new ore reserves. The Company follows the practices outlined in the next two paragraphs in its treatment of drilling and related costs.
Drilling and other associated costs incurred in the Company's efforts to delineate new resources, whether near-mine or Greenfield are expensed as incurred. These costs are classified as mineral exploration costs. Once the Company determines through feasibility studies that proven and probable reserves exist and that the drilling and other associated costs embody a probable future benefit that involves a capacity, singly or in combination with other assets, to contribute directly or indirectly to future net cash inflow, then the costs are classified as mine development costs. These mine development costs incurred prospectively to develop the property are capitalized as incurred, until the commencement of production, and are amortized using the units of production method over estimated life of the ore body. During the production stage, drilling and other related costs incurred to maintain production are included in production cost in the period in which they are incurred.
Drilling and other related costs incurred in the Company's efforts to delineate a major expansion of reserves at an existing production property are expensed as incurred. Once the Company determines through feasibility studies that proven and probable incremental reserves exist and that the drilling and other associated costs embody a probable future benefit that involves a capacity, singly or in combination with other assets, to contribute directly or indirectly to future net cash inflow, then the costs are classified as mine development costs. These incremental mine development costs are capitalized as incurred, until the commencement of production and amortized using the units of production method over the estimated life of the ore body. A major expansion of reserves is one that increases total reserves at a property by approximately 10% or more.
For the years ended December 31, 2016, 2015 and 2014, the Company did not capitalize any drilling and related costs.
Asset retirement obligations (reclamation and remediation costs)—
The fair value of a liability for asset retirement obligations is recognized in the period in which the liability is incurred. The liability is measured at fair value and is adjusted to its present value in subsequent periods as accretion expense is recorded. The corresponding asset retirement costs are capitalized as part of the carrying value of the related long-lived assets and depreciated over the asset's useful life.
Intangible assets—
Intangible assets include primarily the excess amount paid over the book value for investment shares which are presented as mining concessions, and mining and engineering development studies. Intangible assets are carried at acquisition costs, net of accumulated amortization and are amortized principally on a unit of production basis over the estimated remaining life of the mines. Intangible assets are reviewed for impairment whenever events or changes in circumstances indicate that the carrying amount of the asset may not be recoverable.
110
SOUTHERN COPPER CORPORATION AND SUBSIDIARIES
NOTES TO CONSOLIDATED FINANCIAL STATEMENTS (Continued)
NOTE 2—SUMMARY OF SIGNIFICANT ACCOUNTING POLICIES: (Continued)
Debt issuance costs—
Debt issuance costs related to a recognized debt liability are presented in the balance sheet as a direct deduction from the carrying amount of that debt liability, consistent with the treatment of a debt discount.
Ore reserves—
The Company periodically reevaluates estimates of its ore reserves, which represent the Company's estimate as to the amount of unmined copper remaining in its existing mine locations that can be produced and sold at a profit. Such estimates are based on engineering evaluations derived from samples of drill holes and other openings, combined with assumptions about copper market prices and production costs at each of the respective mines.
The Company updates its estimate of ore reserves at the beginning of each year. In this calculation, the Company uses current metal prices which are defined as the average metal price over the preceding three years. The current price per pound of copper, as defined, was $2.61, $2.99 and $3.36 at the end of 2016, 2015 and 2014, respectively. The ore reserve estimates are used to determine the amortization of mine development and intangible assets.
Once the Company determines through feasibility studies that proven and probable reserves exist and that the drilling and other associated costs embody a probable future benefit that involves a capacity, singly or in combination with other assets, to contribute directly or indirectly to future net cash inflow, then the costs are classified as mine development costs and the Company discloses the related ore reserves.
Exploration—
Tangible and intangible costs incurred in the search for mineral properties are charged against earnings when incurred.
Income taxes—
Provisions for income taxes are based on taxes payable or refundable for the current year and deferred taxes on temporary differences between the amount of taxable income and pretax financial income and between the tax bases of assets and liabilities and their reported amounts in the financial statements. Deferred tax assets and liabilities are included in the financial statements at currently enacted income tax rates applicable to the period in which the deferred tax assets and liabilities are expected to be realized and settled as prescribed in ASC 740 "Income taxes." As changes in tax laws or rates are enacted, deferred tax assets and liabilities are adjusted through the provision for income taxes. Deferred income tax assets are reduced by any benefits that, in the opinion of management, are more likely not to be realized.
The Company's operations involve dealing with uncertainties and judgments in the application of complex tax regulations in multiple jurisdictions. The final taxes paid are dependent upon many factors, including negotiations with taxing authorities in various jurisdictions and resolution of disputes arising from federal, state, and international tax audits. The Company recognizes potential liabilities and records tax liabilities for anticipated tax audit issues in the U.S. and other tax jurisdictions based on its estimate of whether, and the extent to which, additional taxes will be due. The Company follows the
111
SOUTHERN COPPER CORPORATION AND SUBSIDIARIES
NOTES TO CONSOLIDATED FINANCIAL STATEMENTS (Continued)
NOTE 2—SUMMARY OF SIGNIFICANT ACCOUNTING POLICIES: (Continued)
guidance of ASC 740 "Income taxes" to record these liabilities. (See Note 8 "Income taxes" of the consolidated financial statements for additional information). The Company adjusts these reserves in light of changing facts and circumstances; however, due to the complexity of some of these uncertainties, the ultimate resolution may result in a payment that is materially different from the Company's current estimate of the tax liabilities. If its estimate of tax liabilities proves to be less than the ultimate assessment, an additional charge to expense would result. If payment of these amounts ultimately proves to be less than the recorded amounts, the reversal of the liabilities would result in tax benefits being recognized in the period when the Company determines the liabilities are no longer necessary.
The Company classifies income tax-related interest and penalties as income taxes in the financial statements, as well as interest and penalties, if any, related to unrecognized tax benefits.
Foreign exchange—
The Company's functional currency is the U.S. dollar. As required by local law, both the Peruvian Branch and Minera Mexico maintain their books of accounts in Peruvian soles and Mexican pesos, respectively.
Foreign currency assets and liabilities are remeasured into U.S. dollars at current exchange rates, except for non-monetary items such as inventory, property, intangible assets and other assets which are remeasured at historical exchange rates. Revenues and expenses are generally translated at actual exchange rates in effect during the period, except for those items related to balance sheet amounts that are remeasured at historical exchange rates. Gains and losses from foreign currency remeasurement are included in earnings of the period.
Gains and (losses) resulting from foreign currency transactions are included in "Cost of sales (exclusive of depreciation, amortization and depletion)."
Asset impairments—
The Company evaluates long-term assets when events or changes in economic circumstances indicate that the carrying amount of such assets may not be recoverable. These evaluations are based on business plans that are prepared using a time horizon that is reflective of the Company's expectations of metal prices over its business cycle. The Company is currently using a long-term average copper price and an average molybdenum price for impairment tests, reflective of what the Company believes is the lower level of the current price environment. The results of its impairment tests using these long-term copper and molybdenum prices show no impairment in the carrying value of their assets.
In recent years testing using assumptions for long-term average prices have resulted in stricter evaluation for impairment analysis than would the higher three year average prices for copper and molybdenum prices. Should this situation reverse in the future with three year average prices below the long-term price assumption, the Company would assess the need to use the three year average prices in its evaluations. The Company uses an estimate of the future undiscounted net cash flows of the related asset or asset group over the remaining life to measure whether the assets are recoverable and measures any impairment by reference to fair value.
112
SOUTHERN COPPER CORPORATION AND SUBSIDIARIES
NOTES TO CONSOLIDATED FINANCIAL STATEMENTS (Continued)
NOTE 2—SUMMARY OF SIGNIFICANT ACCOUNTING POLICIES: (Continued)
Other comprehensive income—
Comprehensive income represents changes in equity during a period, except those resulting from investments by owners and distributions to owners. During the fiscal years ended December 31, 2016, 2015 and 2014, the components of "other comprehensive income (loss)" were, the unrecognized gain (loss) on employee benefit obligations and unrealized gain (loss) on available-for-sale securities (which were not material in the aforementioned years).
Business segments—
Company management views Southern Copper as having three reportable segments and manages it on the basis of these segments. The segments identified by the Company are: 1) the Peruvian operations, which include the two open-pit copper mines in Peru and the plants and services supporting such mines, 2) the Mexican open-pit copper mines, which include La Caridad and Buenavista mine complexes and their supporting facilities and 3) the Mexican underground mining operations, which include five underground mines that produce zinc, lead, copper, silver and gold, a coal mine and a zinc refinery. Please see Note 18 "Segments and Related Information."
Senior management officers of the Company focus on operating income as measure of performance to evaluate different segments, and to make decisions to allocate resources to the reported segments. These are common measures in the mining industry.
PROPOSED ACCOUNTING STANDARDS
In May 2014, the FASB issued ASU 2014-09 "Revenue from Contracts with Customers" (Topic 606). The objective of the new revenue standard is to provide a single comprehensive revenue recognition model for all contracts with customers to improve comparability within industries, across industries and across capital markets.
The core principle of the standard is that the Company should recognize revenue to represent the transfer of promised goods or services to customers in an amount that reflects the consideration to which the Company expects to be entitled in exchange for those goods or services.
The Company should apply the following five steps to achieve the core principle:
Step 1: Identify the contract(s) with a customer.
Step 2: Identify the performance obligations (promises) in the contract.
Step 3: Determine the transaction price.
Step 4: Allocate the transaction price to the performance obligations in the contract.
Step 5: Recognize revenue when (or as) the Company satisfies a performance obligation.
The guidance also specifies the accounting for some costs to obtain or fulfill a contract with a customer. Additionally, the Company should disclose sufficient qualitative and quantitative information to enable users of financial statements to understand the nature, amount, timing, and uncertainty of revenue and cash flows arising from contracts with customers.
On July 9, 2015, the FASB approved a one year deferral of the effective date of the new revenue standard for all entities. This revenue standard is effective for the first interim period within annual
113
SOUTHERN COPPER CORPORATION AND SUBSIDIARIES
NOTES TO CONSOLIDATED FINANCIAL STATEMENTS (Continued)
NOTE 2—SUMMARY OF SIGNIFICANT ACCOUNTING POLICIES: (Continued)
reporting periods beginning after December 15, 2017, and early adoption is not permitted. The Company is evaluating the impact of the adoption of this new standard on the consolidated financial information.
NOTE 3—SHORT-TERM INVESTMENTS:
Short-term investments were as follows ($ in millions):
| |
At December 31, | ||||||
|---|---|---|---|---|---|---|---|
| |
2016 | 2015 | |||||
Trading securities |
$ | 49.2 | $ | 600.2 | |||
Weighted average interest rate |
2.2 | % | 0.71 | % | |||
Available-for-sale |
$ |
2.1 |
$ |
3.3 |
|||
Weighted average interest rate |
0.78 | % | 0.72 | % | |||
| | | | | | | | |
Total |
$ | 51.3 | $ | 603.5 | |||
| | | | | | | | |
| | | | | | | | |
| | | | | | | | |
Trading securities consist of bonds issued by public companies and are publicly traded. Each financial instrument is independent of the others. The Company has the intention to sell these bonds in the short-term.
Available-for-sale investments consist of securities issued by public companies. Each security is independent of the others and, as of December 31, 2016 and 2015, included corporate bonds and asset and mortgage backed obligations. As of December 31, 2016 and 2015, gross unrealized gains and losses on available-for-sale securities were not material.
Related to these investments the Company earned interest, which was recorded as interest income in the consolidated statement of earnings. Also the Company redeemed some of these securities and recognized gains (losses) due to changes in fair value, which were recorded as other income (expense) in the consolidated statement of earnings.
The following table summarizes the activity of these investments by category (in millions):
| |
Years ended December 31, |
||||||
|---|---|---|---|---|---|---|---|
| |
2016 | 2015 | |||||
Trading: |
|||||||
Interest earned |
$ | 1.5 | $ | 1.5 | |||
Unrealized gain (loss) at December 31, |
$ | 0.4 | $ | (0.1 | ) | ||
Available-for-sale: |
|||||||
Interest earned |
(* | ) | (* | ) | |||
Investment redeemed |
$ | 1.2 | $ | 1.6 | |||
- (*)
- Less than $0.1 million
114
SOUTHERN COPPER CORPORATION AND SUBSIDIARIES
NOTES TO CONSOLIDATED FINANCIAL STATEMENTS (Continued)
NOTE 3—SHORT-TERM INVESTMENTS: (Continued)
At December 31, 2016 and 2015, contractual maturities of the available-for-sale debt securities are as follows (in millions):
| |
2016 | 2015 | |||||
|---|---|---|---|---|---|---|---|
One year or less |
$ | — | $ | 0.2 | |||
Maturing after one year through five years |
— | — | |||||
Maturing after five years through ten years |
— | — | |||||
Due after 10 years |
2.1 | 3.1 | |||||
| | | | | | | | |
Total debt securities |
$ | 2.1 | $ | 3.3 | |||
| | | | | | | | |
| | | | | | | | |
| | | | | | | | |
NOTE 4—INVENTORIES:
| |
At December 31, | ||||||
|---|---|---|---|---|---|---|---|
| (in millions) |
2016 | 2015 | |||||
Inventory, current: |
|||||||
Metals at average cost: |
|||||||
Finished goods |
$ | 130.5 | $ | 104.1 | |||
Work-in-process |
231.6 | 188.6 | |||||
Ore stockpiles on leach pads |
310.9 | 243.2 | |||||
Supplies at average cost |
337.4 | 321.3 | |||||
| | | | | | | | |
Total current inventory |
$ | 1,010.4 | $ | 857.2 | |||
| | | | | | | | |
| | | | | | | | |
| | | | | | | | |
Inventory, long-term: |
|||||||
Ore stockpiles on leach pads |
$ | 806.9 | $ | 752.3 | |||
| | | | | | | | |
| | | | | | | | |
| | | | | | | | |
Total leaching costs added as long-term inventory of ore stockpiles in leach pads amounted to $439.0 million, $506.9 million and $401.3 million in 2016, 2015 and 2014, respectively. Long-term leaching inventories recognized as cost of sales amounted to $316.6 million, $274.1 million and $177.5 million in 2016, 2015 and 2014, respectively.
NOTE 5—PROPERTY:
| |
At December 31, | ||||||
|---|---|---|---|---|---|---|---|
| (in millions) |
2016 | 2015 | |||||
Buildings and equipment |
$ | 12,177.1 | $ | 11,529.4 | |||
Construction in progress |
1,811.8 | 1,449.6 | |||||
Mine development |
259.1 | 265.9 | |||||
Mineral assets |
83.2 | 93.0 | |||||
Land, other than mineral |
142.1 | 118.4 | |||||
| | | | | | | | |
Total property |
14,473.3 | 13,456.3 | |||||
Accumulated depreciation, amortization and depletion |
(5,706.8 | ) | (5,193.5 | ) | |||
| | | | | | | | |
Total property and mine development, net |
$ | 8,766.5 | $ | 8,262.8 | |||
| | | | | | | | |
| | | | | | | | |
| | | | | | | | |
115
SOUTHERN COPPER CORPORATION AND SUBSIDIARIES
NOTES TO CONSOLIDATED FINANCIAL STATEMENTS (Continued)
NOTE 5—PROPERTY: (Continued)
Construction in progress increased in 2016 as a result of the spending on the Company expansion projects. For more detailed information, please see Item 7 "Management Discussion and Analysis of Financial Condition and Results of Operations—Capital Investment Program."
Depreciation and depletion expense for the years ended December 31, 2016, 2015 and 2014, amounted to $639.1 million, $503.6 million and $440.1 million, respectively.
NOTE 6—INTANGIBLE ASSETS:
| |
At December 31, | ||||||
|---|---|---|---|---|---|---|---|
| (in millions) |
2016 | 2015 | |||||
Mining concessions |
$ | 121.2 | $ | 121.2 | |||
Mine engineering and development studies |
19.8 | 6.0 | |||||
Software |
44.8 | 44.6 | |||||
| | | | | | | | |
|
185.8 | 171.8 | |||||
Accumulated amortization: |
|||||||
Mining concessions |
(35.6 | ) | (34.8 | ) | |||
Mine engineering and development studies |
(14.8 | ) | (5.6 | ) | |||
Software |
(23.1 | ) | (17.7 | ) | |||
| | | | | | | | |
|
(73.5 | ) | (58.1 | ) | |||
Goodwill |
41.9 |
41.4 |
|||||
| | | | | | | | |
Intangible assets, net |
$ | 154.2 | $ | 155.1 | |||
| | | | | | | | |
| | | | | | | | |
| | | | | | | | |
Amortization of intangibles for the years ended December 31, 2016, 2015 and 2014, amounted to $8.0 million, $7.1 million and $4.9 million, respectively. Estimated amortization are as follows:
| Estimated amortization expense (in millions): |
|
|||
|---|---|---|---|---|
2017 |
$ | 6.2 | ||
2018 |
5.9 | |||
2019 |
5.7 | |||
2020 |
5.9 | |||
2021 |
4.3 | |||
| | | | | |
Total 2017 - 2021 |
$ | 28.0 | ||
| | | | | |
Average annual |
$ | 5.6 | ||
| | | | | |
Goodwill includes $17.0 million generated in 1997 as a result of purchasing a third party interest in the Buenavista mine. It also includes $24.9 million representing the amount of the purchase price in excess of the fair value of the net assets acquired from El Pilar mine. This goodwill is attributable to future benefits that the Company expects to realize from the mine and will not be deductible for income tax purposes.
116
SOUTHERN COPPER CORPORATION AND SUBSIDIARIES
NOTES TO CONSOLIDATED FINANCIAL STATEMENTS (Continued)
NOTE 7—ACQUISITION OF EL PILAR MINE:
On July 6, 2015, the Company acquired 100% of the outstanding stock of Recursos Stingray de Cobre, S.A. de C.V. for $100.0 million, a company incorporated under the laws of Mexico whose principal holding is a 100% interest in the El Pilar mine concession. Related to this purchase, the Company paid approximately $0.4 million of acquisition related costs which was included in selling, general and administrative expenses in the statement of income in 2015. Amounts related to the acquisition in the Company's consolidated financial statements for the year ended December 31, 2015, were provisional as the purchase was still in the measurement period. The Company finalized the acquisition accounting during the third quarter of 2016, which final amounts were determined as follows:
Recognized amounts of identifiable assets acquired and liabilities assumed ($ in million)
| |
At September 30, 2016 |
At December 31, 2015 |
|||||
|---|---|---|---|---|---|---|---|
Cash |
$ | 0.1 | $ | 0.1 | |||
Trade accounts receivable |
0.3 | 0.3 | |||||
Mining assets |
57.2 | 93.0 | |||||
Value beyond proven and probable mineral reserves |
29.5 | — | |||||
Exploration cost |
7.5 | 10.5 | |||||
Deferred income tax asset |
5.5 | — | |||||
Deferred income tax liability |
(25.0 | ) | (24.7 | ) | |||
Trade accounts payable |
(0.1 | ) | (3.6 | ) | |||
| | | | | | | | |
Total identifiable net assets |
75.0 | 75.6 | |||||
Goodwill |
25.0 |
24.4 |
|||||
| | | | | | | | |
Total paid |
$ | 100.0 | $ | 100.0 | |||
| | | | | | | | |
| | | | | | | | |
| | | | | | | | |
Unless otherwise noted, all assets and liabilities acquired were measured at fair value. However, certain items such as deferred taxes continued to be measured in accordance with other applicable accounting literature.
The Company has recorded goodwill of $25.0 million, representing the amount of the purchase price in excess of the fair value of the net assets acquired. This goodwill is attributable to future benefits that the Company expects to realize from the mine and will not be deductible for income tax purposes.
NOTE 8—INCOME TAXES:
Since March 2009, Grupo Mexico, through its wholly-owned subsidiary AMC, owns an interest in excess of 80% of SCC.
Accordingly, SCC's results are included in the consolidated results of the Grupo Mexico subsidiary for U.S. federal income tax reporting. SCC provides current and deferred income taxes, as if it were filing a separate income tax return.
117
SOUTHERN COPPER CORPORATION AND SUBSIDIARIES
NOTES TO CONSOLIDATED FINANCIAL STATEMENTS (Continued)
NOTE 8—INCOME TAXES: (Continued)
The components of the provision for income taxes for the three years ended December 31, 2016, are as follows:
| (in millions) |
2016 | 2015 | 2014 | |||||||
|---|---|---|---|---|---|---|---|---|---|---|
U.S. federal and state: |
||||||||||
Current |
$ | — | $ | — | $ | — | ||||
Deferred |
(109.4 | ) | (143.0 | ) | (352.1 | ) | ||||
Uncertain tax positions |
20.3 | 80.0 | 10.7 | |||||||
| | | | | | | | | | | |
|
(89.1 | ) | (63.0 | ) | (341.4 | ) | ||||
| | | | | | | | | | | |
Foreign (Peru and Mexico): |
||||||||||
Current |
625.0 | 620.4 | 987.1 | |||||||
Deferred |
(34.8 | ) | (92.5 | ) | 108.9 | |||||
| | | | | | | | | | | |
|
590.2 | 527.9 | 1,096.0 | |||||||
| | | | | | | | | | | |
Total provision for income taxes |
$ | 501.1 | $ | 464.9 | $ | 754.6 | ||||
| | | | | | | | | | | |
| | | | | | | | | | | |
| | | | | | | | | | | |
The source of income is as follows:
| (in millions) |
2016 | 2015 | 2014 | |||||||
|---|---|---|---|---|---|---|---|---|---|---|
Earnings by location: |
||||||||||
U.S. |
$ | (1.9 | ) | $ | (2.1 | ) | $ | (1.7 | ) | |
Foreign |
||||||||||
Peru |
(85.7 | ) | 213.2 | 605.7 | ||||||
Mexico |
1,343.6 | 978.1 | 1,464.6 | |||||||
| | | | | | | | | | | |
|
1,257.9 | 1,191.3 | 2,070.3 | |||||||
| | | | | | | | | | | |
Earnings before taxes on income |
$ | 1,256.0 | $ | 1,189.2 | $ | 2,068.6 | ||||
| | | | | | | | | | | |
| | | | | | | | | | | |
| | | | | | | | | | | |
The reconciliation of the statutory income tax rate to the effective tax rate for the three years ended December 31, 2016, is as follows (in percentage points):
| |
2016 | 2015 | 2014 | |||||||
|---|---|---|---|---|---|---|---|---|---|---|
Expected tax at U.S. statutory rate |
35.0 | % | 35.0 | % | 35.0 | % | ||||
Foreign tax at other than statutory rate, net of foreign tax credit benefit(1) |
2.0 | 3.6 | 3.6 | |||||||
Percentage depletion |
(2.7 | ) | (5.9 | ) | (5.2 | ) | ||||
Other permanent differences |
— | 0.7 | 0.1 | |||||||
Increase (decrease) in unrecognized tax benefits for uncertain tax positions |
0.2 | 6.7 | 0.5 | |||||||
Repatriated foreign earnings |
3.6 | — | (0.4 | ) | ||||||
Amounts (over) / under provided in prior years |
(0.5 | ) | (2.2 | ) | 2.2 | |||||
Other |
2.3 | 1.2 | 0.7 | |||||||
| | | | | | | | | | | |
Effective income tax rate |
39.9 | % | 39.1 | % | 36.5 | % | ||||
| | | | | | | | | | | |
| | | | | | | | | | | |
| | | | | | | | | | | |
- (1)
- Foreign tax at other than statutory rates, net of foreign tax credit benefit, also includes the effects of permanent differences in Peru and Mexico, that are determined at the local statutory rate.
118
SOUTHERN COPPER CORPORATION AND SUBSIDIARIES
NOTES TO CONSOLIDATED FINANCIAL STATEMENTS (Continued)
NOTE 8—INCOME TAXES: (Continued)
The Company files income tax returns in three jurisdictions, Peru, Mexico and the United States. For the three years presented above, the statutory income tax rate for Mexico was 30% and 35% for the United States. The Peruvian tax rate was 28% for 2016 and 2015 and 30% for 2014. While the largest components of income taxes are the Peruvian and Mexican taxes, the Company is a domestic U.S. entity. Therefore, the rate used in the above reconciliation is the U.S. statutory rate.
For all of the years presented, both the Peruvian branch and Minera Mexico filed separate tax returns in their respective tax jurisdictions. Although the tax rules and regulations imposed in the separate tax jurisdictions may vary significantly, similar permanent items exist, such as items which are nondeductible or nontaxable. Some permanent differences relate specifically to SCC such as the allowance in the United States for percentage depletion.
Deferred taxes include the U.S., Peruvian and Mexican tax effects of the following types of temporary differences and carryforwards:
| |
At December 31, | ||||||
|---|---|---|---|---|---|---|---|
| (in millions) |
2016 | 2015 | |||||
Assets: |
|||||||
Inventories |
$ | 27.9 | $ | 27.6 | |||
Capitalized exploration expenses |
17.5 | 20.1 | |||||
U.S. foreign tax credit carryforward, net of FIN 48 liability |
284.2 | 187.4 | |||||
U.S. tax effect of Peruvian deferred tax liability |
162.6 | 171.2 | |||||
Property, plant and equipment |
1.2 | — | |||||
Reserves |
108.9 | 42.3 | |||||
Mexican tax on consolidated dividends |
13.6 | 5.5 | |||||
Prepaids |
11.1 | 0.4 | |||||
Other |
29.7 | 22.4 | |||||
| | | | | | | | |
Total deferred tax assets |
656.7 | 476.9 | |||||
| | | | | | | | |
Liabilities: |
|||||||
Property, plant and equipment |
— | (18.5 | ) | ||||
Deferred charges |
(35.4 | ) | (38.1 | ) | |||
Unremitted foreign earnings |
(45.7 | ) | — | ||||
Other |
(10.9 | ) | (2.1 | ) | |||
| | | | | | | | |
Total deferred tax liabilities |
(92.0 | ) | (58.7 | ) | |||
| | | | | | | | |
Total net deferred tax assets / (liabilities) |
$ | 564.7 | $ | 418.2 | |||
| | | | | | | | |
| | | | | | | | |
| | | | | | | | |
U.S. Tax Matters—
As of December 31, 2016, the Company considers its ownership of the stock of Minera Mexico to be essentially permanent in duration. The excess of the amount for financial reporting over the tax basis of the investment in this stock is estimated to be at least $6.7 billion.
As of December 31, 2016, $509.7 million of the Company's cash, cash equivalents, restricted cash and short-term investments of $600.9 million was held by foreign subsidiaries. The cash, cash equivalents and short-term investments maintained in the Company's foreign operations are generally
119
SOUTHERN COPPER CORPORATION AND SUBSIDIARIES
NOTES TO CONSOLIDATED FINANCIAL STATEMENTS (Continued)
NOTE 8—INCOME TAXES: (Continued)
used to cover local operating and investment expenses. At December 31, 2016, Minera Mexico determined that it has $470.5 million in earnings available for dividends to the United States. These earnings have not been remitted, but U.S. federal income tax, net of foreign tax credit utilization was recognized in 2016 resulting in an increase tax of $45.7 million. At December 31, 2015, Minera Mexico had determined that it had no remittable earnings available for dividends to the United States due to its internal financial obligations and expansion plans and had met the indefinite reversal criteria of ASC 740-30-25-17 that it intended to reinvest its earnings indefinitely. Any distribution of earning from the Company's Mexican subsidiaries to the United States is subject to a U.S. federal income tax that equates to approximately 10% of the amount of the distribution, after considering foreign tax credit utilization. Distributions of earnings from the Company's Peruvian branch to the United States are not subject to repatriation taxes. The Company's Peruvian operations are not foreign subsidiaries. Rather they are mainly comprised of operations that are treated as a branch of the Company's U.S. operations from a tax perspective.
At December 31, 2016, there were $577.1 million of foreign tax credits available for carryback or carryforward. These credits have a one year carryback and a ten year carryforward period and can only be used to reduce U.S. income tax on foreign earnings. There were no other unused U.S. tax credits at December 31, 2016. These credits expire as follows:
Year
|
Amount | |||
|---|---|---|---|---|
2019 |
9.9 | |||
2020 |
10.5 | |||
2021 |
11.7 | |||
2022 |
84.1 | |||
2023 |
69.2 | |||
2024 |
99.7 | |||
2025 |
189.5 | |||
2026 |
102.5 | |||
| | | | | |
Total |
$ | 577.1 | ||
| | | | | |
| | | | | |
| | | | | |
These foreign tax credits are presented above on a gross basis and have not been reduced here for any unrecognized tax benefits. These foreign tax credits have been adjusted to include the 2016 Net Operating Loss carryback in the U.S. jurisdiction, increasing foreign tax credits by approximately $13.6 million. In accordance with ASU 2013-11 the Company has recorded $295.2 million of an unrecognized tax benefit as an offset to the Company's deferred tax asset for foreign tax credits. The remaining foreign tax credits of $281.9 million will be used to offset future liabilities but can expire if not utilized by 2023 ($11.3 million), 2024 ($36.3 million), 2025 ($141.5 million) and 2026 ($92.8 million). At this time, the Company considers it more likely than not that it will have sufficient taxable income in the future that will allow it to utilize these credits. However, based on a variety of factors (such as metal prices and tax rates), it is possible that some or all of the credits could ultimately expire unused and require a valuation allowance that could materially increase tax expense.
120
SOUTHERN COPPER CORPORATION AND SUBSIDIARIES
NOTES TO CONSOLIDATED FINANCIAL STATEMENTS (Continued)
NOTE 8—INCOME TAXES: (Continued)
Peruvian Tax Matters—
Royalty mining charge: The royalty charge is based on operating income margins with graduated rates ranging from 1% to 12% of operating profits, with a minimum royalty charge assessed at 1% of net sales. If the operating income margin is 10% or less, the royalty charge is 1% and for each 5% increment in the operating income margin, the royalty charge rate increases by 0.75%, up to a maximum of 12%. The minimum royalty charge assessed at 1% of net sales is recorded as cost of sales and those amounts assessed against operating income are included in the income tax provision. The Company has accrued $16.8 million, $22.9 million and $32.4 million of royalty charges in 2016, 2015 and 2014, respectively, of which $2.7 million and $7.5 million were included in income taxes in 2015 and 2014, respectively; no amounts were included in income tax in 2016.
Peruvian special mining tax: This tax is based on operating income and its rate ranges from 2% to 8.4%. It begins at 2% for operating income margin up to 10% and increases by 0.4% of operating income for each additional 5% of operating income until 85% of operating income is reached. The Company recognized $10.8 million, $18.1 million and $35.3 million in 2016, 2015 and 2014, respectively, with respect to this tax. These amounts are included as "income taxes" in the consolidated statement of earnings.
In 2014, the income tax rate was 30% and the dividend tax rate was 4.1%. In 2014, the Peruvian congress enacted tax law changes to both the income tax and dividend tax rates that become effective on January 1, 2015 until December 31, 2016. The rates were as follows:
Year
|
Income Tax Rate |
Dividend Tax Rate |
|||||
|---|---|---|---|---|---|---|---|
2015 - 2016 |
28 | % | 6.8 | % | |||
In December 2016, the Peruvian Government enacted income tax law changes to both the income tax and dividend tax rate that become effective on January 1, 2017. The new rates are as follows:
Year
|
Income Tax Rate |
Dividend Tax Rate |
|||||
|---|---|---|---|---|---|---|---|
2017 and later |
29.5 | % | 5 | % | |||
The recalculation of the deferred tax liability for the Peruvian jurisdiction using the new tax rates did not have a material effect on the deferred tax liability or the financial statements of the Company.
Mexican Tax Matters—
In 2013, the Mexican Congress enacted tax law changes that became effective on January 1, 2014. Among other effects, the amounts that the subsidiary companies of Minera Mexico recorded during 2016 were:
- •
- Mining royalty at the rate of 7.5% on taxable earnings before taxes: $48.9 million.
- •
- Additional royalty of 0.5% over gross income from sales of gold, silver and platinum: $0.8 million.
- •
- The cancellation of the consolidation regime, paid in March 2016: $0.01 million.
121
SOUTHERN COPPER CORPORATION AND SUBSIDIARIES
NOTES TO CONSOLIDATED FINANCIAL STATEMENTS (Continued)
NOTE 8—INCOME TAXES: (Continued)
- •
- Income tax payable stemming from changes to tax consolidation: $0.3 million.
A new tax bill enacted in 2016, presented by the President to the Congress, was approved by both Chambers of Congress on October 29, 2015 and released in the Official Gazette of the Federation on November 18, 2015. Most of the respective legislative amendments became effective as of January 1, 2016 and include amendments to the Federal Income Tax Law, to the Excise Law and to the Federal Tax Code.
The most relevant changes applicable to Minera Mexico and subsidiaries are: i) new tax reporting and tax compliance obligations for corporations and financial institutions, mainly derived from the implementations of certain OECD´s (Organization of Economic Cooperation and Development) Base Erosion and Profit Shifting (BEPS) and automatic exchange of information initiatives; ii) relief measures and clarifications to rules dealing with the tax regime applicable to private equity and venture capital trusts and groups of companies that previously filed consolidated income tax returns.
Accounting for Uncertainty in Income Taxes—
The total amount of unrecognized tax benefits in 2016, 2015 and 2014, was as follows (in millions):
| |
2016 | 2015 | 2014 | |||||||
|---|---|---|---|---|---|---|---|---|---|---|
Unrecognized tax benefits, opening balance |
$ | 400.0 | $ | 319.4 | $ | 221.2 | ||||
Gross increases—tax positions in prior period |
3.9 | 36.3 | 55.1 | |||||||
Gross increases—current-period tax positions |
23.3 | 44.3 | 43.1 | |||||||
Decreases related to settlements with taxing authorities |
(123.2 | ) | — | — | ||||||
| | | | | | | | | | | |
|
(96.0 | ) | 80.6 | 98.2 | ||||||
| | | | | | | | | | | |
Unrecognized tax benefits, ending balance |
$ | 304.0 | $ | 400.0 | $ | 319.4 | ||||
| | | | | | | | | | | |
| | | | | | | | | | | |
| | | | | | | | | | | |
The amount of unrecognized tax benefits that, if recognized, would affect the effective tax rate was $304.0 million and $400 million at December 31, 2016 and 2015, respectively. These amounts relate entirely to U.S. income tax matters. The Company has no unrecognized Peruvian or Mexican tax benefits. The settlement with taxing authorities of $123.2 million resulted in a cash refund of $1.5 million and a reduction in foreign tax credits for the remainder.
The Company is currently under examination by the Internal Revenue Service for the years 2011-2013 as part of the audit of the AMC consolidated tax group.
Unrecognized tax benefits included a liability of $224.0 million from 2012; however, the parent company expects to benefit from offsetting tax benefits of the same amount and therefore would not ultimately require a cash payment from the Company with respect to the unrecognized tax benefit. Accordingly, the liability was derecognized in the consolidated financial statements and thus is not reflected in the aforementioned table.
As of December 31, 2016 and December 31, 2015 the Company's liability for uncertain tax positions included accrued interest and penalties of $1.9 million.
122
SOUTHERN COPPER CORPORATION AND SUBSIDIARIES
NOTES TO CONSOLIDATED FINANCIAL STATEMENTS (Continued)
NOTE 8—INCOME TAXES: (Continued)
The following tax years remain open to examination and adjustment in the Company's three major tax jurisdictions:
| Peru: | 2011 and all subsequent years | |
| U.S.: | 2011 and all subsequent years | |
| Mexico: | 2011 and all subsequent years |
Management does not expect that any of the open years will result in a cash payment within the upcoming twelve months ending December 31, 2017. The Company's reasonable expectations about future resolutions of uncertain items did not materially change during the year ended December 31, 2016.
NOTE 9—WORKERS' PARTICIPATION:
The Company's operations in Peru and Mexico are subject to statutory workers' participation.
In Peru, the provision for workers' participation is calculated at 8% of pre-tax earnings. The current portion of this participation, which is accrued during the year, is based on the Peruvian Branch's taxable income and is distributed to workers following determination of final results for the year. The annual amount payable to an individual worker is capped at the worker's salary for an 18 month period. Amounts determined in excess of the 18 months of worker's salary is no longer made as a payment to the worker and is levied first for the benefit of the "Fondo Nacional de Capacitacion Laboral y de Promocion del Empleo" (National Workers' Training and Employment Promotion Fund) until this entity receives from all employers in its region an amount equivalent to 2,200 Peruvian taxable units (approximately $2.6 million in 2016). Any remaining excess is levied as payment for the benefit of the regional governments. These levies fund worker training, employment promotion, entrepreneurship and various other programs.
In Mexico, workers' participation is determined using the guidelines established in the Mexican income tax law at a rate of 10% of pre-tax earnings as adjusted by the tax law. In December 2013, the Mexican Congress approved some amendments to the tax law, as consequence the Company recorded a deferred workers' participation provision of $16.3 million in 2014.
The provision for workers' participation is allocated to "Cost of sales (exclusive of depreciation, amortization and depletion)" and to "selling, general and administrative" in the consolidated statement of earnings, proportional to the number of workers in the production and administrative areas, respectively. Workers' participation expense for the three years ended December 31, 2016 was as follows (in millions):
| |
2016 | 2015 | 2014 | |||||||
|---|---|---|---|---|---|---|---|---|---|---|
Current |
$ | 131.8 | $ | 140.8 | $ | 221.2 | ||||
Deferred |
(13.4 | ) | (19.8 | ) | (11.4 | ) | ||||
| | | | | | | | | | | |
|
$ | 118.4 | $ | 121.0 | $ | 209.8 | ||||
| | | | | | | | | | | |
| | | | | | | | | | | |
| | | | | | | | | | | |
123
SOUTHERN COPPER CORPORATION AND SUBSIDIARIES
NOTES TO CONSOLIDATED FINANCIAL STATEMENTS (Continued)
NOTE 10—ASSET RETIREMENT OBLIGATION:
The Company maintains an estimated asset retirement obligation for its mining properties in Peru, as required by the Peruvian Mine Closure Law. In accordance with the requirements of this law, the Company's closure plans were approved by the Peruvian Ministry of Energy and Mines ("MINEM"). As part of the closure plans, the Company is required to provide annual guarantees over the estimated life of the mines, based on a present value approach, and to furnish the funds for the asset retirement obligation. This law requires a review of closing plans every five years. Currently and for the near-term future, the Company has pledged the value of its Lima office complex as support for this obligation. The accepted value of the Lima office building for this purpose is $30.8 million. Through January 2017, the Company has provided guarantees of $26.9 million. The closure cost recognized for this liability includes the cost, as outlined in its closure plans, of dismantling the Toquepala and Cuajone concentrators, the smelter and refinery in Ilo, and the shops and auxiliary facilities at the three units. In 2015, we added $12.5 million related to the Toquepala expansion closure plan. In 2014, the Company reviewed ASC 410-20 Asset Retirement Obligation and adjusted the liability by $36.3 million at its Peruvian operations. A comparable adjustment was applied against the deferred asset recognized in property. The net effect of these adjustments did not change the Company's net income.
In 2010, the Company announced to the Mexican federal environmental authorities its closure plans for the copper smelter plant at San Luis Potosi. In order to transform an environmental liability into an asset, the Company initiated a program for plant demolition and soil remediation with a budget of $66.2 million, of which the Company has spent $66.0 million through December 31, 2016. Plant demolition and construction of a confinement area at the south of the property were completed in 2012. In accordance with remediation goals previously approved by environmental authorities, soil remediation and on-site encapsulation on a second confinement area of impacted soils have been completed. Confirmation sampling was successfully completed. On September 2, 2016, the environmental authorities approved the conclusion of the remediation effort. The Company is currently studying the possibilities for this property in order to decide whether to sell or develop the property. The overall cost recognized for mining closure in Mexico includes the estimated costs of dismantling concentrators, smelter and refinery plants, shops and other facilities. In 2016, we added $9.5 million related to the Quebalix IV closure plan, a project that is part of the Buenavista expansion.
The following table summarizes the asset retirement obligation activity for years ended December 31, 2016 and 2015 (in millions):
| |
2016 | 2015 | |||||
|---|---|---|---|---|---|---|---|
Balance as of January 1 |
$ | 190.9 | $ | 116.1 | |||
Changes in estimates |
— | 3.8 | |||||
Additions |
10.5 | 72.2 | |||||
Closure payments |
(2.0 | ) | (14.6 | ) | |||
Accretion expense |
17.1 | 13.4 | |||||
| | | | | | | | |
Balance as of December 31, |
$ | 216.5 | $ | 190.9 | |||
| | | | | | | | |
| | | | | | | | |
| | | | | | | | |
124
SOUTHERN COPPER CORPORATION AND SUBSIDIARIES
NOTES TO CONSOLIDATED FINANCIAL STATEMENTS (Continued)
NOTE 11—FINANCING:
Long-term debt:
| |
Face amount |
Issuance discount |
Issuance costs |
Carrying value as of December 31, 2016 |
|||||||||
|---|---|---|---|---|---|---|---|---|---|---|---|---|---|
5.375% Senior unsecured notes due 2020 |
$ | 400 | $ | (0.8 | ) | $ | (0.9 | ) | $ | 398.3 | |||
3.500% Senior unsecured notes due 2022 |
300 | (0.7 | ) | (0.9 | ) | 298.4 | |||||||
3.875% Senior unsecured notes due 2025 |
500 | (2.3 | ) | (2.2 | ) | 495.5 | |||||||
9.250% Yankee Bonds due 2028 |
125 | — | — | 51.2 | |||||||||
7.500% Senior unsecured notes due 2035 |
1,000 | (13.6 | ) | (8.9 | ) | 977.5 | |||||||
6.750% Senior unsecured notes due 2040 |
1,100 | (7.5 | ) | (6.1 | ) | 1,086.4 | |||||||
5.250% Senior unsecured notes due 2042 |
1,200 | (20.2 | ) | (6.7 | ) | 1.173.1 | |||||||
5.875% Senior unsecured notes due 2045 |
1,500 | (17.1 | ) | (9.1 | ) | 1,473.8 | |||||||
| | | | | | | | | | | | | | |
Total |
$ | 6,125 | $ | (62.2 | ) | $ | (34.8 | ) | 5,954.2 | ||||
| | | | | | | | | | | | | | |
Less, current portion |
— | ||||||||||||
| | | | | | | | | | | | | | |
Total long-term debt |
$ | 5,954.2 | |||||||||||
| | | | | | | | | | | | | | |
| | | | | | | | | | | | | | |
| | | | | | | | | | | | | | |
| |
Face amount |
Issuance discount |
Issuance costs |
Carrying value as of December 31, 2015 |
|||||||||
|---|---|---|---|---|---|---|---|---|---|---|---|---|---|
5.375% Senior unsecured notes due 2020 |
$ | 400 | $ | (1.0 | ) | $ | (1.1 | ) | $ | 397.9 | |||
3.500% Senior unsecured notes due 2022 |
300 | (0.7 | ) | (1.1 | ) | 298.2 | |||||||
3.875% Senior unsecured notes due 2025 |
500 | (2.6 | ) | (2.4 | ) | 495.0 | |||||||
9.250% Yankee Bonds due 2028 |
125 | — | — | 51.1 | |||||||||
7.500% Senior unsecured notes due 2035 |
1,000 | (14.0 | ) | (9.1 | ) | 976.9 | |||||||
6.750% Senior unsecured notes due 2040 |
1,100 | (7.7 | ) | (6.1 | ) | 1,086.2 | |||||||
5.250% Senior unsecured notes due 2042 |
1,200 | (20.5 | ) | (6.8 | ) | 1,172.7 | |||||||
5.875% Senior unsecured notes due 2045 |
1,500 | (17.3 | ) | (9.2 | ) | 1,473.5 | |||||||
| | | | | | | | | | | | | | |
Total |
$ | 6,125 | $ | (63.8 | ) | $ | (35.8 | ) | 5,951.5 | ||||
| | | | | | | | | | | | | | |
Less, current portion |
— | ||||||||||||
| | | | | | | | | | | | | | |
Total long-term debt |
$ | 5,951.5 | |||||||||||
| | | | | | | | | | | | | | |
| | | | | | | | | | | | | | |
| | | | | | | | | | | | | | |
The bonds, referred above as "Yankee bonds", contain a covenant requiring Minera Mexico to maintain a ratio of EBITDA to interest expense of not less than 2.5 to 1.0 as such terms are defined in the debt instrument. At December 31, 2016, Minera Mexico was in compliance with this covenant.
Between July 2005 and November 2012 the Company issued senior unsecured notes six times totaling $4.2 billion, as listed above. Interest on the notes is paid semi-annually in arrears. The notes rank pari passu with each other and rank pari passu in right of payment with all of the Company's other existing and future unsecured and unsubordinated indebtedness.
On April 20, 2015, the Company issued $2.0 billion of fixed-rate senior unsecured notes. This debt was issued in two tranches, $500 million due 2025 at an annual interest rate of 3.875% and $1.5 billion due 2045 at an annual interest rate of 5.875%. These notes are general unsecured obligations of the Company and rank equally with all of its existing and future unsecured and unsubordinated debt. Net proceeds are being used for general corporate purposes, including the financing of the Company´s
125
SOUTHERN COPPER CORPORATION AND SUBSIDIARIES
NOTES TO CONSOLIDATED FINANCIAL STATEMENTS (Continued)
NOTE 11—FINANCING: (Continued)
capital investment program. The notes were issued with an underwriters' discount of $20.2 million. Additionally, issuance costs of $11.8 million associated with these notes were paid and deferred. The unamortized balance of the discount and the costs are presented net of the carrying value of the debt issued and are amortized as interest expense over the life of the loan.
The indentures relating to the notes contain certain restrictive covenants, including limitations on liens, limitations on sale and leaseback transactions, rights of the holders of the notes upon the occurrence of a change of control triggering event, limitations on subsidiary indebtedness and limitations on consolidations, mergers, sales or conveyances. Certain of these covenants cease to be applicable before the notes mature if the Company obtains an investment grade rating. The Company obtained investment grade rating in 2005. The Company has registered these notes under the Securities Act of 1933, as amended. The Company may issue additional debt from time to time pursuant to certain of the indentures.
If the Company experiences a "Change of Control Triggering Event", the Company must offer to repurchase the notes at a purchase price equal to 101% of the principal amount thereof, plus accrued and unpaid interest, if any. A Change of Control Trigger Event means a Change of Control (as defined) and a rating decline (as defined), that is, if the rating of the notes, by at least one of the rating agencies shall be decreased by one or more gradations.
At December 31, 2016, the Company was in compliance with the covenants of the notes.
Aggregate maturities of the outstanding borrowings at December 31, 2016, are as follows:
Years
|
Principal Due(*) | |||
|---|---|---|---|---|
| |
(in millions) |
|||
2017 |
$ | — | ||
2018 |
— | |||
2019 |
— | |||
2020 |
400.0 | |||
2021 |
— | |||
Thereafter |
5,651.2 | |||
| | | | | |
Total |
$ | 6,051.2 | ||
| | | | | |
| | | | | |
| | | | | |
- (*)
- Total debt maturities do not include the debt discount valuation account of $97.0 million.
NOTE 12—BENEFIT PLANS:
Post retirement defined benefit plans
The Company has two noncontributory defined benefit pension plans covering former salaried employees in the United States and certain former expatriate employees in Peru (the "Expatriate Plan"). Effective October 31, 2000, the Board of Directors amended the qualified pension plan to suspend the accrual of benefits.
In October 2014, the Society of Actuaries ("SOA") issued new mortality tables based on a comprehensive study of private retirement plans. Effective December 31, 2014, the Company elected to update the mortality assumption to the new SOA tables.
126
SOUTHERN COPPER CORPORATION AND SUBSIDIARIES
NOTES TO CONSOLIDATED FINANCIAL STATEMENTS (Continued)
NOTE 12—BENEFIT PLANS: (Continued)
In addition, the Company's Mexican subsidiaries have a defined contribution pension plan for salaried employees and a non-contributory defined benefit pension plan for union employees (the "Mexican Plan").
The components of net periodic benefit costs calculated in accordance with ASC 715 "Compensation retirement benefits," using December 31 as a measurement date, consist of the following:
| |
Years ended December 31, |
|||||||||
|---|---|---|---|---|---|---|---|---|---|---|
| (in millions) |
2016 | 2015 | 2014 | |||||||
Service cost |
$ | 0.7 | $ | 1.1 | $ | 1.0 | ||||
Interest cost |
1.0 | 1.0 | 1.1 | |||||||
Expected return on plan assets |
(2.2 | ) | (3.0 | ) | (3.3 | ) | ||||
Amortization of transition assets, net |
0.1 | 0.1 | 0.1 | |||||||
Amortization of net actuarial loss |
— | (0.5 | ) | (0.4 | ) | |||||
Settlement / Curtailment |
(0.2 | ) | — | — | ||||||
Amortization of net loss/(gain) |
0.2 | 0.2 | 0.2 | |||||||
| | | | | | | | | | | |
Net periodic benefit cost |
$ | (0.4 | ) | $ | (1.1 | ) | $ | (1.3 | ) | |
| | | | | | | | | | | |
| | | | | | | | | | | |
| | | | | | | | | | | |
127
SOUTHERN COPPER CORPORATION AND SUBSIDIARIES
NOTES TO CONSOLIDATED FINANCIAL STATEMENTS (Continued)
NOTE 12—BENEFIT PLANS: (Continued)
The change in benefit obligation and plan assets and a reconciliation of funded status are as follows:
| |
As of December 31, |
||||||
|---|---|---|---|---|---|---|---|
| (in millions) |
2016 | 2015 | |||||
Change in benefit obligation: |
|||||||
Projected benefit obligation at beginning of year |
$ | 24.9 | $ | 25.8 | |||
Service cost |
0.7 | 1.1 | |||||
Interest cost |
1.0 | 1.0 | |||||
Settlement |
(0.1 | ) | — | ||||
Benefits paid |
(2.0 | ) | (2.9 | ) | |||
Actuarial (gain)/loss |
3.3 | 2.4 | |||||
Actuarial gain assumption changes |
(0.1 | ) | (0.7 | ) | |||
Inflation adjustment |
(2.1 | ) | (1.8 | ) | |||
| | | | | | | | |
Projected benefit obligation at end of year |
$ | 25.6 | $ | 24.9 | |||
| | | | | | | | |
| | | | | | | | |
| | | | | | | | |
Change in plan assets: |
|||||||
Fair value of plan assets at beginning of year |
$ | 46.8 | $ | 57.7 | |||
Actual return on plan assets |
4.5 | (3.2 | ) | ||||
Employer contributions |
(0.4 | ) | (0.5 | ) | |||
Benefits paid |
(0.9 | ) | (1.0 | ) | |||
Currency exchange rate adjustment |
(5.4 | ) | (6.2 | ) | |||
| | | | | | | | |
Fair value of plan assets at end of year |
$ | 44.6 | $ | 46.8 | |||
| | | | | | | | |
| | | | | | | | |
| | | | | | | | |
Funded status at end of year: |
$ | 19.0 | $ | 21.9 | |||
| | | | | | | | |
| | | | | | | | |
| | | | | | | | |
ASC-715 amounts recognized in statement of financial position consists of: |
|||||||
Non-current assets |
$ | 19.0 | $ | 21.9 | |||
| | | | | | | | |
Total |
$ | 19.0 | $ | 21.9 | |||
| | | | | | | | |
| | | | | | | | |
| | | | | | | | |
ASC-715 amounts recognized in accumulated other comprehensive income (net of income taxes of $(3.3) million and $(3.2) million in 2016 and 2015, respectively) consists of: |
|||||||
Net loss (gain) |
$ | 4.8 | $ | 4.4 | |||
Prior service cost |
1.0 | 1.3 | |||||
| | | | | | | | |
Total |
$ | 5.8 | $ | 5.7 | |||
| | | | | | | | |
| | | | | | | | |
| | | | | | | | |
128
SOUTHERN COPPER CORPORATION AND SUBSIDIARIES
NOTES TO CONSOLIDATED FINANCIAL STATEMENTS (Continued)
NOTE 12—BENEFIT PLANS: (Continued)
The following table summarizes the changes in accumulated other comprehensive income for the years ended December 31, related to the defined benefit pension plan, net of income tax:
| (in millions) |
2016 | 2015 | |||||
|---|---|---|---|---|---|---|---|
Reconciliation of accumulated other comprehensive income: |
|||||||
Accumulated other comprehensive income at beginning of plan year |
$ | 5.7 | $ | 0.3 | |||
Net loss/(gain) amortized during the year |
(0.2 | ) | 0.2 | ||||
Net loss/(gain) occurring during the year |
0.6 | 4.7 | |||||
Amortization of transition obligation |
. | (0.1 | ) | ||||
Currency exchange rate adjustment |
(0.3 | ) | 0.6 | ||||
| | | | | | | | |
Net adjustment to accumulated other comprehensive income (net of income taxes of $(3.3) million and $(3.6) million in 2016 and 2015, respectively) |
0.1 | 5.4 | |||||
| | | | | | | | |
Accumulated other comprehensive income at end of plan year |
$ | 5.8 | $ | 5.7 | |||
| | | | | | | | |
| | | | | | | | |
| | | | | | | | |
The following table summarizes the amounts in accumulated other comprehensive income amortized and recognized as a component of net periodic benefit cost in 2016 and 2015, net of income tax:
| (in millions) |
2016 | 2015 | |||||
|---|---|---|---|---|---|---|---|
Net loss / (gain) |
$ | 0.6 | $ | 4.7 | |||
Amortization of net (loss) gain |
(0.1 | ) | 0.2 | ||||
Amortization of transition obligation |
— | (0.1 | ) | ||||
| | | | | | | | |
Total amortization expenses |
$ | 0.5 | $ | 4.8 | |||
| | | | | | | | |
| | | | | | | | |
| | | | | | | | |
The assumptions used to determine the pension obligations are:
Expatriate Plan
|
2016 | 2015 | 2014 | |||||||
|---|---|---|---|---|---|---|---|---|---|---|
Discount rate |
3.65 | % | 3.80 | % | 3.50 | % | ||||
Expected long-term rate of return on plan asset |
4.00 | % | 4.50 | % | 4.50 | % | ||||
Rate of increase in future compensation level |
N/A | N/A | N/A | |||||||
Mexican Plan(*)
|
2016 | 2015 | 2014 | |||||||
|---|---|---|---|---|---|---|---|---|---|---|
Discount rate |
7.55 | % | 6.80 | % | 6.70 | % | ||||
Expected long-term rate of return on plan asset |
7.55 | % | 6.80 | % | 6.70 | % | ||||
Rate of increase in future compensation level |
4.50 | % | 4.50 | % | 4.00 | % | ||||
- (*)
- These rates are based on Mexican pesos as pension obligations are denominated in pesos.
129
SOUTHERN COPPER CORPORATION AND SUBSIDIARIES
NOTES TO CONSOLIDATED FINANCIAL STATEMENTS (Continued)
NOTE 12—BENEFIT PLANS: (Continued)
The scheduled maturities of the benefits expected to be paid in each of the next five years, and thereafter, are as follows:
Years
|
Expected Benefit Payments |
|||
|---|---|---|---|---|
| |
(in millions) |
|||
2017 |
$ | 2.2 | ||
2018 |
1.5 | |||
2019 |
1.6 | |||
2020 |
1.6 | |||
2021 |
1.7 | |||
2022 to 2025 |
8.7 | |||
| | | | | |
Total |
$ | 17.3 | ||
| | | | | |
| | | | | |
| | | | | |
Expatriate Plan
The Company's funding policy is to contribute amounts to the qualified plan sufficient to meet the minimum funding requirements set forth in the Employee Retirement Income Security Act of 1974 plus such additional amounts as the Company may determine to be appropriate.
Plan assets are invested in a group annuity contract with Metropolitan Life Insurance Company ("MetLife"). The Contract invests in the MetLife General Account Payment Fund (the "Money Fund") and the MetLife Broad Market Bond Fund (the "Bond Fund") managed by BlackRock, Inc.
The Money Fund seeks to earn interest and maintain a $1.00 per share net asset value, by investing in U.S. Dollar-denominated money market securities.
The Bond Fund seeks to outperform the Bloomberg Barclays ® U.S. Aggregate Bond Index, net of fees, over a full market cycle. The Bond Fund invests in publicly traded, investment grade securities. These may include corporate securities, mortgage securities, treasuries and cash, agency securities, commercial mortgage backed securities and other investment vehicles adhering to the fund's investment objectives. These investments are classified as Level 1 because they are valued using quoted prices of the same securities as they consist of instruments which are publicly traded.
Plan assets are invested with the objective of maximizing returns with an acceptable level of risk and maintaining adequate liquidity to fund expected benefit payments. The Company's policy for determining asset mix-targets to meet investment objectives includes periodic consultation with recognized third party investment consultants.
The expected long-term rate of return on plan assets is reviewed annually, taking into consideration asset allocations, historical returns and the current economic environment. Based on these factors the Company expects its assets will earn an average of 4.50% per annum assuming its long-term mix will be consistent with its current mix.
Mexican Plan
Minera Mexico's policy for determining asset mix targets includes periodic consultation with recognized third party investment consultants. The expected long-term rate of return on plan assets is
130
SOUTHERN COPPER CORPORATION AND SUBSIDIARIES
NOTES TO CONSOLIDATED FINANCIAL STATEMENTS (Continued)
NOTE 12—BENEFIT PLANS: (Continued)
updated periodically, taking into consideration assets allocations, historical returns and the current economic environment. The fair value of plan assets is impacted by general market conditions. If actual returns on plan assets vary from the expected returns, actual results could differ.
The plan assets are managed by three financial institutions, Scotiabank Inverlat S.A., Banco Santander and Banco Mercantil del Norte, S.A. 78% of the funds are invested in Mexican government securities, including treasury certificates and development bonds of the Mexican government. The remaining 22% is invested in common shares of Grupo Mexico.
The plan assets are invested without restriction in active markets that are accessible when required and are therefore considered as level 1, in accordance with ASC 820 "Fair Value Measurement."
These plans accounted for approximately 30% of benefit obligations. The following table represents the asset mix of the investment portfolio as of December 31:
| |
2016 | 2015 | |||||
|---|---|---|---|---|---|---|---|
Asset category: |
|||||||
Equity securities |
22 | % | 21 | % | |||
Treasury bills |
78 | % | 79 | % | |||
| | | | | | | | |
|
100 | % | 100 | % | |||
| | | | | | | | |
The amount of contributions that the Company expects to pay to the plan during 2017 is $1.3 million, which excludes $3.4 million of pending payments to former Buenavista workers.
Post-retirement Health Care Plan:
Peru: The Company adopted a post-retirement health care plan for retired salaried employees eligible for Medicare in 1996. The Company manages the plan and is currently providing health benefits to retirees. The plan is accounted for in accordance with ASC 715 "Compensation retirement benefits."
Mexico: Through 2007, the Buenavista unit provided health care services free of charge to employees and retired unionized employees and their families through its own hospital at the Buenavista unit. In 2011, the Company signed an agreement with the Secretary of Health of the State of Sonora to provide these services to its retired workers and their families. The new workers of Buenavista will receive health services through the Mexican Institute of Social Security as is the case for all Mexican workers.
The components of net period benefit costs for the three years ended December 31, 2016 are as follows:
| |
Years ended December 31, |
|||||||||
|---|---|---|---|---|---|---|---|---|---|---|
| (in millions) |
2016 | 2015 | 2014 | |||||||
Interest cost |
$ | 0.6 | $ | 1.0 | $ | 1.3 | ||||
Amortization of prior service cost/ (credit) |
(0.5 | ) | (0.4 | ) | (0.3 | ) | ||||
| | | | | | | | | | | |
Net periodic benefit cost |
$ | 0.1 | $ | 0.6 | $ | 1.0 | ||||
| | | | | | | | | | | |
| | | | | | | | | | | |
| | | | | | | | | | | |
131
SOUTHERN COPPER CORPORATION AND SUBSIDIARIES
NOTES TO CONSOLIDATED FINANCIAL STATEMENTS (Continued)
NOTE 12—BENEFIT PLANS: (Continued)
The change in benefit obligation and a reconciliation of funded status are as follows:
| |
As of December 31, |
||||||
|---|---|---|---|---|---|---|---|
| (in millions) |
2016 | 2015 | |||||
Change in benefit obligation: |
|||||||
Projected benefit obligation at beginning of year |
$ | 10.8 | $ | 17.1 | |||
Interest cost |
0.6 | 1.0 | |||||
Actuarial loss/ (gain)—claims cost |
— | (0.4 | ) | ||||
Benefits paid |
(0.8 | ) | (0.7 | ) | |||
Actuarial (gain)/loss |
3.9 | (3.9 | ) | ||||
Actuarial gain assumption changes |
— | (0.1 | ) | ||||
Inflation adjustment |
(1.6 | ) | (2.2 | ) | |||
| | | | | | | | |
Projected benefit obligation at end of year |
$ | 12.9 | $ | 10.8 | |||
| | | | | | | | |
| | | | | | | | |
| | | | | | | | |
Change in plan assets: |
|||||||
Fair value of plan assets at beginning of year |
$ | — | $ | — | |||
Employer contributions |
0.1 | 0.1 | |||||
Benefits paid |
(0.1 | ) | (0.1 | ) | |||
| | | | | | | | |
Fair value of plan assets at end of year |
$ | — | $ | — | |||
| | | | | | | | |
| | | | | | | | |
| | | | | | | | |
Funded status at end of year: |
$ | (12.9 | ) | $ | (10.8 | ) | |
| | | | | | | | |
| | | | | | | | |
| | | | | | | | |
ASC-715 amounts recognized in statement of financial position consists of: |
|||||||
Current liabilities |
$ | (0.1 | ) | $ | (0.1 | ) | |
Non-current liabilities |
(12.8 | ) | (10.7 | ) | |||
| | | | | | | | |
Total |
$ | (12.9 | ) | $ | (10.8 | ) | |
| | | | | | | | |
ASC-715 amounts recognized in accumulated other comprehensive income consists of: |
|||||||
Net loss (gain) |
$ | (2.8 | ) | $ | (6.5 | ) | |
Total (net of income taxes of $1.9 million and $4.4 million in 2016 and 2015, respectively) |
$ | (2.8 | ) | $ | (6.5 | ) | |
| | | | | | | | |
| | | | | | | | |
| | | | | | | | |
132
SOUTHERN COPPER CORPORATION AND SUBSIDIARIES
NOTES TO CONSOLIDATED FINANCIAL STATEMENTS (Continued)
NOTE 12—BENEFIT PLANS: (Continued)
The following table summarizes the changes in accumulated other comprehensive income for the years ended December 31, related to the post-retirement health care plan, net of income tax:
| |
As of December 31, |
||||||
|---|---|---|---|---|---|---|---|
| (in millions) |
2016 | 2015 | |||||
Reconciliation of accumulated other comprehensive income: |
|||||||
Accumulated other comprehensive income at beginning of plan year |
$ | (6.5 | ) | $ | (4.8 | ) | |
Net loss/(gain) occurring during the year |
2.3 | (2.7 | ) | ||||
Net loss/(gain) amortized during the year |
0.3 | 0.2 | |||||
Currency exchange rate adjustment |
1.1 | 0.8 | |||||
| | | | | | | | |
Net adjustment to accumulated other comprehensive income (net of income taxes of $1.5 million and $4.4 million in 2016 and 2015, respectively) |
3.7 | (1.7 | ) | ||||
| | | | | | | | |
Accumulated other comprehensive income at end of plan year |
$ | (2.8 | ) | $ | (6.5 | ) | |
| | | | | | | | |
| | | | | | | | |
| | | | | | | | |
The following table summarizes the amounts in accumulated other comprehensive income amortized and recognized as a component of net periodic benefit cost in 2016 and 2015, net of income tax:
| |
At December 31, |
||||||
|---|---|---|---|---|---|---|---|
| (in millions) |
2016 | 2015 | |||||
Net loss / (gain) |
$ | 2.3 | $ | (2.7 | ) | ||
Amortization of net (loss) gain |
0.3 | 0.2 | |||||
| | | | | | | | |
Total amortization expenses |
$ | 2.6 | $ | (2.5 | ) | ||
| | | | | | | | |
| | | | | | | | |
| | | | | | | | |
The discount rates used in the calculation of other post-retirement benefits and cost as of December 31 were:
| |
2016 | 2015 | 2014 | |||||||
|---|---|---|---|---|---|---|---|---|---|---|
Expatriate health plan |
||||||||||
Discount rate |
3.65 | % | 3.80 | % | 3.50 | % | ||||
Mexican health plan |
||||||||||
Weighted average discount rate |
7.55 | % | 6.80 | % | 6.70 | % | ||||
133
SOUTHERN COPPER CORPORATION AND SUBSIDIARIES
NOTES TO CONSOLIDATED FINANCIAL STATEMENTS (Continued)
NOTE 12—BENEFIT PLANS: (Continued)
The benefits expected to be paid in each of the next five years, and thereafter, are as follows:
Year
|
Expected Benefit Payments |
|||
|---|---|---|---|---|
| |
(in millions) |
|||
2017 |
$ | 0.8 | ||
2018 |
0.9 | |||
2019 |
0.9 | |||
2020 |
0.9 | |||
2021 |
0.9 | |||
2022 to 2025 |
4.6 | |||
| | | | | |
Total |
$ | 9.0 | ||
| | | | | |
| | | | | |
| | | | | |
Expatriate Health Plan
For measurement purposes for pre 65 years participants, a 6.2% annual rate of increase in the per capita cost of covered health care benefits was assumed for 2016 which gradually decrease to 4.2% in a 85 year period. For post 65 years the annual rate of increase in the per capita cost for 2016 is 7.2% which is assumed to decrease gradually to 4.6%. .
Assumed health care cost trend rates can have a significant effect on amounts reported for health care plans. However, because of the size of the Company's plan, a one percentage-point change in assumed health care trend rate would not have a significant effect.
Mexican Health Plan
For measurement purposes, a 4.5% annual rate of increase in the per capita cost of covered health care benefits was assumed for 2015 and remains at that level thereafter.
An increase in other benefit cost trend rates have a significant effect on the amount of the reported obligations, as well as component cost of the other benefit plan. One percentage-point change in assumed other benefits cost trend rates would have the following effects:
| |
One Percentage Point |
||||||
|---|---|---|---|---|---|---|---|
| (in millions) |
Increase | Decrease | |||||
Effect on total service and interest cost components |
$ | 1.0 | $ | 0.8 | |||
Effect on the post-retirement benefit obligation |
$ | 12.5 | $ | 11.2 | |||
NOTE 13—COMMITMENTS AND CONTINGENCIES:
Environmental matters:
The Company has instituted extensive environmental conservation programs at its mining facilities in Peru and Mexico. The Company's environmental programs include, among others, water recovery systems to conserve water and minimize the impact on nearby streams, reforestation programs to stabilize the surface of the tailings dams and the implementation of scrubbing technology in the mines to reduce dust emissions.
134
SOUTHERN COPPER CORPORATION AND SUBSIDIARIES
NOTES TO CONSOLIDATED FINANCIAL STATEMENTS (Continued)
NOTE 13—COMMITMENTS AND CONTINGENCIES: (Continued)
Environmental capital investments in years 2016, 2015 and 2014, were as follows (in millions):
| |
2016 | 2015 | 2014 | |||||||
|---|---|---|---|---|---|---|---|---|---|---|
Peruvian operations |
$ | 110.3 | $ | 98.8 | $ | 127.8 | ||||
Mexican operations |
140.1 | 22.0 | 24.4 | |||||||
| | | | | | | | | | | |
Total |
$ | 250.4 | $ | 120.8 | $ | 152.2 | ||||
| | | | | | | | | | | |
| | | | | | | | | | | |
| | | | | | | | | | | |
Peruvian operations: The Company's operations are subject to applicable Peruvian environmental laws and regulations. The Peruvian government, through the Ministry of Environment ("MINAM") conducts annual audits of the Company's Peruvian mining and metallurgical operations. Through these environmental audits, matters related to environmental obligation, compliance with legal requirements, atmospheric emissions, effluent monitoring and waste management are reviewed. The Company believes that it is in material compliance with applicable Peruvian environmental laws and regulations. Peruvian law requires that companies in the mining industry provide assurances for future mine closure and remediation. In accordance with the requirements of this law, the Company's closure plans were approved by MINEM. See Note 10 "Asset retirement obligation," for further discussion of this matter. In accordance with the requirements of the law, in 2015 the Company submitted the closure plans for the Tia Maria project and for the Toquepala expansion. The process of review and approval of closure plans usually takes several months. In March 2016, MINEM approved the Mining Closure Plan for the Toquepala expansion project. The closure plan for the Tia Maria project is pending approval.
In 2008, the Peruvian government enacted environmental regulations establishing more stringent air quality standards ("AQS") for daily sulfur dioxide ("SO2") in the air for the Peruvian territory. These regulations, as amended in 2013, recognize distinct zones/areas, as atmospheric basins. MINAM has established three atmospheric basins that require further attention to comply with the air quality standards. The Ilo basin is one of these three areas and the Company's smelter and refinery are part of the area. A supreme decree issued on April 8, 2014, indicates that mining companies should review their compliance with these regulations and develop a modification plan to reach compliance. At December 31, 2016, the Company continues to work with an environmental technical study group, established by a MINAM resolution to identify activities, goals, deadlines, timetables and to develop an action plan in order to achieve compliance with AQS.
While the Company believes that a potential loss contingency may exist, it cannot currently estimate the amount of such contingency. The Company and other industries affected by this supreme decree believe that the lack of further regulations and direction from the government has delayed the full review and analysis of the necessary actions to establish compliance. Pending further government action, the Company will continue to work with its study group to analyze this issue. Furthermore, the Company does not believe it can estimate a reasonable range of possible costs until additional guidance is received from the government. Therefore, currently the Company is not able to disclose a range of costs that is meaningful.
In 2013, the Peruvian government enacted new soil environmental quality standards ("SQS") applicable to any existing facility or project that generates or could generate risk of soil contamination in its area of operation or influence. In March 2014, MINAM issued a supreme decree, which establishes additional provisions for the gradual implementation of SQS. Under this rule the Company had twelve months to identify contaminated sites in and around its facilities and present a report of
135
SOUTHERN COPPER CORPORATION AND SUBSIDIARIES
NOTES TO CONSOLIDATED FINANCIAL STATEMENTS (Continued)
NOTE 13—COMMITMENTS AND CONTINGENCIES: (Continued)
identified contaminated sites. This report was submitted to MINEM in April 2015. After a review, MINEM should evaluate and issue a report to the Company, which will allow it to continue to the next phase. At December 31, 2016, the Company is awaiting an official response from MINEM. Once MINEM notifies the Company, it must prepare a characterization study to determine the depth, extent and physio-chemical composition of the contaminated areas and to define an appropriate remediation plan and the time-frame in which it will take place. In addition, the Company must submit for approval a Soil Decontamination Plan (SDP) within 24 months after being notified by the authority. This SDP shall include remediation actions, a schedule and compliance deadlines. Also under this rule, if deemed necessary and given reasonable justification, the Company may request a one year extension for the decontamination plan.
Soil confirmation tests must be carried out after completion of decontamination actions (within the approved schedule) and results must be presented to authorities within 30 days after receiving such results. Non-compliance with this obligation or with decontamination goals will carry penalties, although no specific sanctions have been established yet. During compliance with this schedule, companies cannot be penalized for non-compliance with the SQS.
While the Company believes that there is a reasonable possibility that a potential loss contingency may exist, it cannot currently estimate the amount of the contingency. The Company believes that a reasonable determination of the loss will be possible once the characterization study and the SDP are substantially completed. At that time the Company will be in a position to estimate the remediation cost. Further, the Company does not believe that it can estimate a reasonable range of possible costs until the noted studies have substantially progressed and therefore is not be able to disclose a range of costs that is meaningful.
Mexican operations: The Company's operations are subject to applicable Mexican federal, state and municipal environmental laws, to Mexican official standards, and to regulations for the protection of the environment, including regulations relating to water supply, water quality, air quality, noise levels and hazardous and solid waste.
The principal legislation applicable to the Company's Mexican operations is the Federal General Law of Ecological Balance and Environmental Protection (the "General Law"), which is enforced by the Federal Bureau of Environmental Protection ("PROFEPA"). PROFEPA monitors compliance with environmental legislation and enforces Mexican environmental laws, regulations and official standards. It may also initiate administrative proceedings against companies that violate environmental laws, which in the most extreme cases may result in the temporary or permanent shutdown of non-complying facilities, the revocation of operating licenses and/or other sanctions or fines.
In 2011, the General Law was amended, giving an individual or entity the ability to contest administrative acts, including environmental authorizations, permits or concessions granted, without the need to demonstrate the actual existence of harm to the environment as long as it can be argued that the harm may be caused. In addition, in 2011, amendments to the Civil Federal Procedures Code ("CFPC") were enacted. These amendments establish three categories of collective actions by means of which 30 or more people claiming injury derived from environmental, consumer protection, financial services and economic competition issues will be considered to be sufficient in order to have a legitimate interest to seek through a civil procedure restitution or economic compensation or suspension of the activities from which the alleged injury derived. The amendments to the CFPC may
136
SOUTHERN COPPER CORPORATION AND SUBSIDIARIES
NOTES TO CONSOLIDATED FINANCIAL STATEMENTS (Continued)
NOTE 13—COMMITMENTS AND CONTINGENCIES: (Continued)
result in more litigation, with plaintiffs seeking remedies, including suspension of the activities alleged to cause harm.
In 2013, the Environmental Liability Federal Law was enacted. The law establishes general guidelines for actions to be considered to likely cause environmental harm. If a possible determination regarding harm occurs, environmental clean-up and remedial actions sufficient to restore environment to a pre-existing condition should be taken. Under this law, if restoration is not possible, compensation measures should be provided. Criminal penalties and monetary fines can be assessed under this law.
On August 6, 2014, an accidental spill of approximately 40,000 cubic meters of copper sulfate solution occurred at a leaching pond that was under construction ten kilometers from the mine of Buenavista del Cobre, S.A. de C.V. ("BVC") a subsidiary of the Company. The accident was caused by a rock collapse that affected the system's pumping station and by a construction defect in the seal of a pipe in the leaching system containment dam, a part of the new SX-EW III plant. This solution reached the Bacanuchi River and the Sonora River. Immediate actions were taken in order to contain the spill, and to comply with all the legal requirements. In August 2014, the Company hired contractors including environmental specialists and more than 1,200 of its own workers to clean the river.
In addition, the Company developed a service program to assist the residents of the Sonora River region, which included (i) water distribution provisions, and infrastructure development within the affected region, (ii) the expansion of the current Community Development program to communities further downstream that were affected and previously not within the scope of the Company´s program, (iii) meetings with local farmers and producers in coordination with the Federal Ministry of Agriculture, Livestock, Rural Development, Fisheries, and Nutrition in order to revamp and promote the activities of local farmers and producers, (iv) the implementation of sustainable productive projects at each affected site, as well as (v) the establishment of service desks to address specific complaints and concerns of the community.
The National Water Commission, the Federal Commission for the Protection of Sanitary Risk and PROFEPA initiated administrative proceedings regarding the spill to determine possible environmental and health damages. On August 19, 2014, PROFEPA, as part of the administrative proceeding initiated after the spill, announced the filing of a criminal complaint against BVC in order to determine those responsible for the environmental damages. The Company is vigorously defending itself against this complaint. As of December 31, 2016, the case remains in the procedural stages and is pending resolution.
On September 15, 2014, BVC executed an administrative agreement with PROFEPA, providing for the submission of a remediation action plan to the Mexican Ministry of Environment and Natural Resources (Secretaria de Medio Ambiente y Recursos Naturales "SEMARNAT"). The general remediation program submitted to SEMARNAT was approved on January 6, 2015. This program is being developed in five different zones all of which have obtained approval from SEMARNAT. The Company is complying with the remedial program.
The Company also created a trust with Nacional Financiera S.N.C., a Mexican development bank, acting as a Trustee to support environmental remedial actions in connection with the spill, to comply with the remedial action plan and to compensate those persons adversely affected by the spill. The Company committed up to two billion Mexican pesos (approximately $150 million) of which approximately one billion Mexican pesos have already been contributed. A technical committee for the
137
SOUTHERN COPPER CORPORATION AND SUBSIDIARIES
NOTES TO CONSOLIDATED FINANCIAL STATEMENTS (Continued)
NOTE 13—COMMITMENTS AND CONTINGENCIES: (Continued)
trust was created with representatives from the federal government, the Company and specialists assisted by a team of environmental experts to ensure the proper use of the funds. Along with the administrative agreement executed with PROFEPA, the trust serves as an alternative mechanism for dispute resolution to mitigate public and private litigation risks.
As a result of the administrative proceeding, conducted by PROFEPA, on March 2, 2015 a final ruling imposed a fine of $1.7 million.
Through the first half of 2015, six collective action lawsuits were filed in federal courts in Mexico City and Sonora against two subsidiaries of the Company seeking economic compensation, clean up and remedial activities in order to restore the environment to its pre-existing conditions. Four of the collective action lawsuits have been dismissed by the court. The plaintiffs in these six lawsuits are: Acciones Colectivas de Sinaloa, A.C. which established two collective actions (one of which was dismissed on September 26, 2016); Filiberto Navarro Soto et al (dismissed on July 14, 2015); Defensa Colectiva A.C. (dismissed on August 7, 2015); Ismael Navarro Babuca et al (dismissed on August 17, 2015); and Ana Luisa Salazar Medina et al. which has been granted a collective action certification and the plaintiffs have requested cautionary measures on the construction of facilities for the monitoring of public health services and the prohibition of the closure of the Río Sonora Trust.
For a description of the regulations related to collective actions in Mexico, please refer to the 2011 amendments to the CFPC described above.
Similarly, during 2015, eight civil action lawsuits were filed against BVC in the state courts of Sonora seeking damages for alleged injuries and for moral damages as a consequence of the spill. The plaintiffs in the state court lawsuits are: Jose Vicente Arriola Nunez et al; Santana Ruiz Molina et al; Andres Nogales Romero et al; Teodoro Javier Robles et al; Gildardo Vasquez Carvajal et al; Rafael Noriega Souffle et al; Grupo Banamichi Unido de Sonora El Dorado, S.C. de R.L. de C.V; and Marcelino Mercado Cruz. In the first quarter of 2016, one additional civil action lawsuit, claiming the same damages, was filed by Juan Melquicedec Lebaron. Additionally, during the second half of 2016, two additional civil action lawsuits, claiming the same damages, were filed by Blanca Lidia Valenzuela Rivera et al and Ramona Franco Quijada et al.
During 2015, four constitutional lawsuits (juicios de amparo) were filed before Federal Courts against various authorities and against a subsidiary of the Company, arguing; (i) the alleged lack of a waste management program approved by SEMARNAT; (ii) the alleged lack of a remediation plan approved by SEMARNAT with regard to the August 2014 spill; (iii) the alleged lack of community approval regarding the environmental impact authorizations granted by SEMARNAT to one subsidiary of the Company; and (iv) the alleged inactivity of the authorities with regard of the spill in August 2014. The plaintiffs of those lawsuits are: Francisca Garcia Enriquez, et al which established two lawsuits, Francisco Ramon Miranda, et al and Jesus David Lopez Peralta et al. In the first quarter of 2016, an additional constitutional lawsuit, claiming same damages was filed by Oscar Encinas Gamez et al (dismissed in December, 2016); and during the third quarter of 2016, three additional constitutional lawsuits, claiming same damages were filed by Maria Elena Heredia Bustamante et al; Martin Eligio Ortiz Gamez et al; and Maria de los Angeles Enriquez Bacame et al.
It is currently not possible to determine the extent of the damages sought in these state and federal lawsuits but the Company considers that these lawsuits are without merit. Accordingly, the Company is vigorously defending against these actions. Nevertheless, the Company considers that none of the legal proceedings resulting from the spill, individually or in the aggregate, would have a material effect on its financial position or results of operations.
138
SOUTHERN COPPER CORPORATION AND SUBSIDIARIES
NOTES TO CONSOLIDATED FINANCIAL STATEMENTS (Continued)
NOTE 13—COMMITMENTS AND CONTINGENCIES: (Continued)
As of December 31, 2016, BVC estimated total damages at $136.4 million, of which $42.5 million was paid with the Company's funds, and approximately one billion Mexican pesos (approximately $74.9 million) was deposited in the trust. These funds have been available and are being used to compensate claims as they arise. This deposit was classified as restricted cash and was recorded as an operating expense in the Company's results.
On December 1, 2016, SEMARNAT issued its final resolution which established that all remediation actions contained in the Remediation Plan, as approved by the same authority, have been fully complied with no pending obligations according to such Plan, except for biological monitoring activities at the Sonora river that will be continued until the first semester of 2019. Also, on January 26, 2017, PROFEPA issued its final resolution under which it declared all mitigation actions as complete and its investigation procedure is definitely closed. In light of the above, the Company has obtained all necessary formal decisions from SEMARNAT and PROFEPA. On February 7, 2017, the Company proceeded to close the trust created with the purpose of complying with all remediation activities. Therefore, this matter is closed.
The Company believes that all of its facilities in Peru and Mexico are in material compliance with applicable environmental, mining and other laws and regulations.
The Company also believes that continued compliance with environmental laws of Mexico and Peru will not have a material adverse effect on the Company's business, properties, result of operations, financial condition or prospects and will not result in material capital investments.
Litigation matters:
Garcia Ataucuri and Others against SCC's Peruvian Branch:
In April 1996, the Branch was served with a complaint filed in Peru by Mr. Garcia Ataucuri and approximately 900 former employees seeking the delivery of a substantial number of "labor shares" (acciones laborales) plus dividends on such shares, to be issued to each former employee in proportion to their time of employment with SCC's Peruvian Branch, pursuant to a former Peruvian mandated profit sharing law.
The labor share litigation is based on claims of former employees for ownership of labor shares that the plaintiffs state that the Branch did not issue during the 1970s until 1979 under such former Peruvian mandated profit sharing law. In 1971, the Peruvian government enacted legislation providing that mining workers would have a 10% participation in the pre-tax profits of their employing enterprises. This participation was distributed 40% in cash and 60% in an equity interest of the enterprise. In 1978, the equity portion, which was originally delivered to a mining industry workers' organization, was set at 5.5% of pre-tax profits and was delivered, mainly in the form of "labor shares" to individual workers. The cash portion was set at 4.0% of pre-tax earnings and was delivered to individual employees also in proportion to their time of employment with the Branch. In 1992, the workers' participation was set at 8%, with 100% payable in cash and the equity participation was eliminated from the law.
139
SOUTHERN COPPER CORPORATION AND SUBSIDIARIES
NOTES TO CONSOLIDATED FINANCIAL STATEMENTS (Continued)
NOTE 13—COMMITMENTS AND CONTINGENCIES: (Continued)
In relation to the issuance of "labor shares" by the Branch in Peru, the Branch is a defendant in the following lawsuits:
- 1)
- Mr. Garcia Ataucuri seeks delivery, to himself and each of the approximately 900 former employees of the Peruvian Branch, of the 3,876,380,679.65 old soles or 38,763,806.80 "labor shares" (acciones laborales), as required by Decree Law 22333 (a former profit sharing law), to be issued proportionally to each former employee in accordance with the time of employment of such employee with SCC's Branch in Peru, plus dividends on such shares. The 38,763,806.80 labor shares sought in the complaint, with a face value of 100.00 old soles each, represent 100% of the labor shares issued by the Branch during the 1970s until 1979 for all of its employees during that period. The plaintiffs do not represent 100% of the Branch's eligible employees during that period.
It should be noted that the lawsuit refers to a prior Peruvian currency called "sol de oro" or old soles, which was later changed to the "inti", and then into today's "sol". Due to a past period of high inflation between 1985 and 1990, one billion of old soles is equivalent to today's one sol.
After lengthy proceedings before the civil courts in Peru on September 19, 2001, on appeal by the Branch, the Peruvian Supreme Court annulled the proceedings noting that the civil courts lacked jurisdiction and that the matter had to be decided by a labor court (the "2000 appeal").
In October 2007, in a separate proceeding initiated by the plaintiffs, the Peruvian Constitutional Court nullified the September 19, 2001 Peruvian Supreme Court decision and ordered the Supreme Court to decide again on the merits of the case accepting or denying the 2000 appeal.
In May 2009, the Supreme Court rejected the 2000 appeal of the Branch affirming the adverse decision of the appellate civil court and lower civil court. While the Supreme Court has ordered SCC's Peruvian Branch to deliver the labor shares and dividends, it has clearly stated that SCC's Peruvian Branch may prove, by all legal means, its assertion that the labor shares and dividends were distributed to the former employees in accordance with the profit sharing law then in effect, an assertion which SCC's Peruvian Branch continues to make.
On June 9, 2009, the Branch filed a proceeding of relief before a civil court in Peru seeking the nullity of the 2009 Supreme Court decision and, in a separate proceeding, a request for a precautionary measure. The civil court rendered a favorable decision on the nullity and the precautionary measure, suspending the enforcement of the Supreme Court decision, for the reasons indicated above and other reasons. In February 2012, the Branch was notified that the civil court had reversed its prior decisions. On appeal by the Peruvian Branch the Superior Court affirmed the lower court's decisions regarding the nullity of the 2009 Supreme Court decision and the precautionary measure. As a result, the nullity of the precautionary measure became final and is not appealable. However, the nullity of the 2009 Supreme Court decision was appealed by the Branch before the Constitutional Court. On April 10, 2014, the Constitutional Court denied the Company's appeal and affirmed the lower court's decision.
On September 23, 2015, the lower court that ordered the delivery by the Branch of the labor shares, seized 10,501,857 investment shares owned by SCC and Compañia Minera Los
140
SOUTHERN COPPER CORPORATION AND SUBSIDIARIES
NOTES TO CONSOLIDATED FINANCIAL STATEMENTS (Continued)
NOTE 13—COMMITMENTS AND CONTINGENCIES: (Continued)
- 2)
- In addition to the aforementioned lawsuits, the following lawsuits have been filed against SCC's Branch, involving approximately 800 plaintiffs, which seek the same number of labor shares as in the Garcia Ataucuri case, plus interest, labor shares resulting from capital increases and dividends: (1) Armando Cornejo Flores and others v. SCC's Peruvian Branch (filed May 10, 2006); (2) Alejandro Zapata Mamani and others v. SCC's Peruvian Branch
Tolmos, S.A. ("Los Tolmos"). The Company is vigorously defending against these measures, and has challenged them on various grounds, mainly because a "labor share" created by law in 1979 is not equivalent to an "investment share", on a one to one basis, as the latter must recognize the Peruvian inflation of the 1980-2014 period. One "investment share" represents ten million "labor shares". Additionally, the seized investment shares are owned by SCC and Los Tolmos, companies that are not a party in the lawsuit.
In December 2015, the Company appealed the lower court´s decision before the Superior Court that declared without merit its opposition to the seizure. Los Tolmos initiated a third party claim to ownership, to have the lower court cancel the seizure order on their investment shares. In January 2016, the lower court issued a resolution clarifying that the seizure measure applies to the investment shares owned by SCC's Peruvian Branch even if they are in possession of SCC or Los Tolmos.
On October 4, 2016, the Superior Court issued Resolution N°10 which ruled that the seizure of the corporation´s investment shares to Los Tolmos in 2015 was unfounded. To reach this assertion, the Lima Superior Court recognizes that the labor shares have suffered variations in their denomination and face value, due to the currency changes suffered in Peru since 1985 to 1991, for which a first share exchange was made at a rate of 10 to 1, and later at a rate of 1,000 to 1. The Court also indicated that SCC's assertion that the plaintiffs had participated in each of the labor share exchange transactions has not been proven. Accordingly, the judge in charge of the case must define this situation and determine (a) which plaintiffs received the labor shares to determine who are the holders of the current investment share certificates, (b) who have sold their shares, (c) determine the dividend amounts that have been generated by such shares and identify the plaintiffs who have collected the dividends, and (d) review the shares ledger. The judge ordered that an expert be appointed to assist in defining these items.
In addition, Resolution N° 10 also ruled that the value and proportion of the 10,185,700 labor shares represented by the plaintiffs must be mathematically determined in respect to the total of 57,649,479 current investment shares issued by the Branch.
The Company considers that the Superior Court's decision is important because it recognizes that the value of the original labor shares was affected by the fluctuations in Peruvian currency, which changed over time from the original "sol de oro" to the "inti", and subsequently to the "Nuevo sol" or currently simply referred to the "sol". Such fluctuation affected the value of a Labor share.
SCC's Peruvian Branch believes that the review by an expert will establish that the labor shares ordered to be paid by the Court are not equivalent on a one to one ratio to the current investment shares, as well as to prove the Company's delivery of the labor shares to some of the plaintiffs. The Court did not define the amount to be paid, however, taking into account the effect of currency fluctuation, the Company expects that the final amount of this contingency will not be material.
141
SOUTHERN COPPER CORPORATION AND SUBSIDIARIES
NOTES TO CONSOLIDATED FINANCIAL STATEMENTS (Continued)
NOTE 13—COMMITMENTS AND CONTINGENCIES: (Continued)
(filed June 27, 2008); (3) Edgardo Garcia Ataucuri, in representation of 216 of SCC's Peruvian Branch former workers, v. SCC's Peruvian Branch (filed May 2011); (4) Juan Guillermo Oporto Carpio v. SCC's Peruvian Branch (filed August 2011); (5) Rene Mercado Caballero v. SCC's Peruvian Branch (filed November 2011); (6) Enrique Salazar Alvarez and others v. SCC's Peruvian Branch (filed December 2011); (7) Armando Cornejo Flores, in representation of 37 of SCC's Peruvian Branch former workers v. SCC's Peruvian Branch (filed March 2012); (8) Porfirio Ochochoque Mamani and others v. SCC's Peruvian Branch (filed July 2012); (9) Alfonso Claudio Flores Jimenez and others v. SCC's Peruvian Branch (filed July 2013); (10) Edgardo Garcia Ataucuri in representation of 104 of SCC´s Peruvian Branch former workers (filed March 2015); (11) Nicolas Aurelio Sueros Benavente v. SCC's Peruvian Branch (filed May 2015); (12) Victor Raul Marquez Cano v. SCC's Peruvian Branch (filed June 2015) and (13) Armando Cornejo Flores in representation of five former workers of SCC's Peruvian Branch v. SCC's Peruvian Branch (filed September 2016). SCC's Peruvian Branch has answered the complaints and denied the validity of the asserted claims.
SCC's Peruvian Branch asserts that the labor shares were distributed to the former employees in accordance with the profit sharing law then in effect. The Peruvian Branch has not made a provision for these lawsuits because it believes that it has meritorious defenses to the claims asserted in the complaints.
The "Virgen Maria" Mining Concessions of the Tia Maria Mining Project
The Tia Maria project includes various mining concessions, totaling 32,989.64 hectares. One of the concessions is the "Virgen Maria" mining concession totaling 943.72 hectares or 2.9% of the total mining concessions.
Related to the "Virgen Maria" mining concessions, in August 2009, a lawsuit was filed against SCC's Branch by the former stockholders of Exploraciones de Concesiones Metalicas S.A.C. ("Excomet"). The plaintiffs allege that the acquisition of Excomet's shares by the Branch is null and void because the $2 million purchase price paid by the Branch for the shares of Excomet was not fairly negotiated by the plaintiffs and the Branch. In 2005, the Branch acquired the shares of Excomet after lengthy negotiations with the plaintiffs, and after the plaintiffs, which were all the stockholders of Excomet, approved the transaction in a general stockholders' meeting. Excomet was at the time owner of the "Virgen Maria" mining concession. In October 2011, the civil court dismissed the case on the grounds that the claim had been barred by the statute of limitations. On appeal by the plaintiffs, the superior court reversed the lower court's decision and remanded it to the lower court for further proceedings. In August 2015, the lower court dismissed the case on the grounds that the plaintiffs had not proven the alleged unfairness of the negotiations. The plaintiffs appealed this resolution before the Superior Court. In September 2016, the Superior Court confirmed the lower court's resolution and the plaintiffs filed an extraordinary appeal in order to have the case reviewed by the Supreme Court. As of December 31, 2016, the matter is pending resolution.
The Company asserts that this lawsuit is without merit and is vigorously defending against it. Additionally, the amount of this contingency cannot be reasonably estimated by management at this time.
142
SOUTHERN COPPER CORPORATION AND SUBSIDIARIES
NOTES TO CONSOLIDATED FINANCIAL STATEMENTS (Continued)
NOTE 13—COMMITMENTS AND CONTINGENCIES: (Continued)
The Tia Maria Mining Project
There are five lawsuits filed against the Peruvian Branch of the Company related to the Tia Maria project. The lawsuits seek (i) to declare null and void the resolution which approved the Environmental Impact Assessment of the project; (ii) the cancellation of the project and the withdrawal of mining activities in the area and (iii) to declare null and void the mining concession application of the Tia Maria project. The lawsuits were filed by Messrs. Jorge Isaac del Carpio Lazo (filed May 22, 2015), Ernesto Mendoza Padilla (filed May 26, 2015), Juan Alberto Guillen Lopez (filed June 18, 2015), Hernan Raul Hatamare Hual (filed August 6, 2015) and Nicolas Belfiore Nicolini (filed November 13, 2015).
The Del Carpio Lazio case was rejected by the court of first instance on November 14, 2016. The Plaintiff filed an appeal before the Superior Court on January 3, 2017. As of December 31, 2016, the matter is pending resolution.
The Mendoza Padilla case was rejected by the lower court on July 8, 2015. This ruling was confirmed by the Superior Court on June 14, 2016. On July 12, 2016, the case was appealed before the Constitutional Court. As of December 31, 2016, the matter is pending resolution.
The Guillen Lopez and Belfiore Nicolini cases are currently before the lower court. As of December 31, 2016, the matter is pending resolution.
On October 3, 2016 the lower court ruled that the Hatamare Hual case had expired and declared the case concluded. The Plaintiff has not filed appeal before the Superior Court. On November 16, 2016, the Company´s Peruvian Branch requested for the case to be closed. As of December 31, 2016, the matter is pending resolution. The amount of this contingency cannot be reasonably estimated by management at this time.
Special Regional Pasto Grande Project ("Pasto Grande Project")
In 2012, the Pasto Grande Project, an entity of the Regional Government of Moquegua, filed a lawsuit against SCC's Peruvian Branch alleging property rights over a certain area used by the Peruvian Branch and seeking the demolition of the tailings dam where SCC's Peruvian Branch has deposited its tailings from the Toquepala and Cuajone operations since 1995. The Peruvian Branch has had title to use the area in question since 1960 and has constructed and operated the tailing dams with proper governmental authorization, since 1995. SCC's Peruvian Branch asserts that the lawsuit is without merit and is vigorously defending against it. Upon a motion filed by the Peruvian Branch, the lower court has included MINEM as a defendant in this lawsuit. MINEM has answered the complaint and denied the validity of the claim. As of December 31, 2016, the case remains pending resolution without further developments. The amount of this contingency cannot be reasonably estimated by management at this time.
Carla Lacey and Barbara Siegfried, on behalf of themselves and all other similarly situated stockholders of Southern Copper Corporation, and derivatively on behalf of Southern Copper Corporation
A purported class action derivative lawsuit filed in the Delaware Court of Chancery was served on the Company and its Directors in February 2016 relating to the 2012 capitalization of 99.999% of MGE by Controladora de Infraestructura Energetica Mexico, S.A. de C.V., an indirect subsidiary of Grupo Mexico (the "CIEM Capitalization"), the Company's entry into a power purchase agreement with MGE in 2012 (the "MGE Power Purchase Agreement"), and the 2012 restructuring of a loan from the
143
SOUTHERN COPPER CORPORATION AND SUBSIDIARIES
NOTES TO CONSOLIDATED FINANCIAL STATEMENTS (Continued)
NOTE 13—COMMITMENTS AND CONTINGENCIES: (Continued)
Company's Mexican Operations to MGE for the construction of two power plants to supply power to the Company's Mexican operations (the "MGE Loan Restructuring"). The action purports to be brought on behalf of the Company and its common stockholders. The complaint alleges, among other things, that the CIEM Capitalization, the MGE Power Purchase Agreement and the MGE Loan Restructuring were the result of breaches of fiduciary duties and the Company's charter. The Company has filed a response denying these allegations and is currently in the discovery process.
Labor matters:
Mexican operations: In recent years, the Mexican operations have experienced a positive improvement of their labor environment, as its workers opted to change their affiliation from the Sindicato Nacional de Trabajadores Mineros, Metalurgicos y Similares de la Republica Mexicana (the "National Mining Union") to other less politicized unions.
However, the workers of the San Martin and Taxco mines, are still under the National Mining Union and have been on strike since July 2007. On December 10, 2009, a federal court confirmed the legality of the San Martin strike. In order to recover the control of the San Martin mine and resume operations, the Company filed a court petition on January 27, 2011 requesting that the court, among other things, define the termination payment for each unionized worker. The court denied the petition alleging that, according to federal labor law, the union was the only legitimate party to file such petition. On appeal by the Company, on May 13, 2011, the Mexican federal tribunal accepted the petition. In July 2011, the National Mining Union appealed the favorable court decision before the Supreme Court. On November 7, 2012, the Supreme Court affirmed the decision of the federal tribunal. The Company filed a new proceeding before the labor court on the basis of the Supreme Court decision, which recognized the right of the labor court to define responsibility for the strike and the termination payment for each unionized worker. A favorable decision of the labor court in this new proceeding would have the effect of terminating the protracted strike at San Martin. As of December 31, 2016, the case remains pending resolution without further developments.
In the case of the Taxco mine, following the workers refusal to allow exploration of new reserves, the Company commenced litigation seeking to terminate the labor relationship with workers at the mine (including termination of the related collective bargaining agreement). On September 1, 2010, the federal labor court issued a ruling approving the termination of the collective bargaining agreement and all the individual labor contracts of the workers affiliated with the Mexican mining union at the Taxco mine. The mining union appealed the labor court ruling before a federal court. In September 2011, the federal court accepted the union's appeal and remanded the case to the federal labor court for reconsideration. After several legal proceedings on January 25, 2013, the Company filed a new proceeding before the labor court. On June 16, 2014, the labor court denied the petition of the Company. The resolution issued by the labor court was challenged by the Company before a federal court. In August 2015, the Supreme Court decided to assert jurisdiction over the case and to rule on it directly. As of December 31, 2016, the case remains pending resolution without further developments.
It is expected that operations at these mines will remain suspended until these labor issues are resolved.
In view of these lengthy strikes, the Company has reviewed the carrying value of the San Martin and Taxco mines to ascertain whether impairment exists. The Company concluded that there is a non-material impairment of the assets located at these mines.
144
SOUTHERN COPPER CORPORATION AND SUBSIDIARIES
NOTES TO CONSOLIDATED FINANCIAL STATEMENTS (Continued)
NOTE 13—COMMITMENTS AND CONTINGENCIES: (Continued)
Excluding the San Martin and Taxco mines, the Company has not had any labor stoppages at its Mexican operations as of the year ending December 31, 2016.
Other legal matters:
The Company is involved in various other legal proceedings incidental to its operations, but the Company does not believe that decisions adverse to it in any such proceedings, individually or in the aggregate, would have a material effect on its financial position or results of operations.
Other commitments:
Peruvian Operations
Tia Maria:
On August 1, 2014, the Company received the final approval of Tia Maria´s Environmental Impact Assessment ("EIA"). However, the issuance of the project´s construction permit has been delayed due to pressures from anti-mining groups. In 2016, the Company has continued working with community groups in order to resolve open issues concerning the project.
Tia Maria´s project budget is approximately $1.4 billion of which $363.5 million have been invested through December 31, 2016. When completed, it is expected to produce 120,000 tons of copper cathodes per year. This project will use state-of-the-art SX-EW technology with the highest international environmental standards. SX-EW facilities are the most environmentally friendly in the industry as they do not require a smelting process and consequently, no emissions are released into the atmosphere. The project will only use seawater, transporting this more than 25 kilometers to 1,000 meters above sea level, and includes a desalinization plant which will be constructed at a cost of $95 million. Consequently, the Tambo river water resources and the water resources from the wells in the area will be used solely for farming and human consumption.
The Company expects the project to generate 3,500 jobs during the construction phase. When in operation, Tia Maria will directly employ 600 workers and indirectly another 2,000. Through its expected twenty-year life, the project related services will create significant business opportunities in the Arequipa region.
In view of the delay in this project, the Company has reviewed the carrying value of this asset to ascertain whether impairment exists. Should the Tia Maria project not resume operations, the Company is confident that most of the project equipment will continue to be used productively, through reassignment to other mine locations operated by the Company. The Company believes that an impairment loss, if any, will not be material.
Toquepala Concentrator Expansion:
In April 2015, the construction permit for the Toquepala expansion project was approved by the MINEM. The project budget is $1.2 billion, of which $550.4 million has been expended through December 31, 2016. When completed, this expansion project is expected to increase annual production capacity by 100,000 tons of copper and 3,100 tons of molybdenum.
Corporate Social Responsibility:
The Company has a corporate social responsibility policy to maintain and promote continuity of its mining operations and obtain the best results. The main objective of this policy is to integrate its
145
SOUTHERN COPPER CORPORATION AND SUBSIDIARIES
NOTES TO CONSOLIDATED FINANCIAL STATEMENTS (Continued)
NOTE 13—COMMITMENTS AND CONTINGENCIES: (Continued)
operations with the local communities in the areas of influence of its operations by creating a permanent positive relationship with the communities to develop the optimum social conditions and to promote sustainable development in the area. Accordingly, the Company has made the following commitments:
Tacna Region: In connection with the Toquepala concentrator expansion, the Company has committed to fund various social and infrastructure improvement projects in Toquepala's neighboring communities. The total amount committed for these purposes is S/ 445.0 million (approximately $132 million).
Moquegua Region: In the Moquegua region, the Company is part of a "development roundtable" in which the local municipal authorities, the community representatives and the Company discuss the social needs and the way the Company could contribute to sustainable development in the region. As part of this, the roundtable is discussing the creation of a Development Fund Moquegua Region for which the Company has offered S/. 700 million (approximately $ 209 million). While final funding is not yet settled, the Company has committed to contribute S/ 108.5 million (approximately $32 million) in advance, which is being utilized in an educational project and S/. 48.4 million (approximately $14 million) for a residual water treatment plan in Ilo, sea side water front and fresh water at El Algarrobal.
In addition, the Company has committed S/. 143.0 million (approximately $43 million) for the construction of five infrastructure projects at the Moquegua region under the "social investment for taxes" (obras por impuestos) program which allows the Company to use this amounts invested as an advance payment of taxes.
Arequipa Region: In connection with the Tia Maria project, in 2014 the Company offered to establish a S/ 100 million fund (approximately $29 million) for the benefit of social and infrastructure improvements in Tia Maria's neighboring communities.
These commitments are subject to the continuity of the respective mine operations and, as such, are not considered to be present obligations of the Company. Therefore, the Company has not recorded a liability in its consolidated financial statements.
Power purchase agreements
- •
- Engie: In 1997, SCC signed a power purchase agreement with an independent
power company, Engie Energia Peru S.A. (formerly Enersur S.A.) under which SCC agreed to purchase all of its power needs for its current Peruvian operations from Enersur for twenty
years, through April 2017.
- •
- Electroperu S.A.: In June 2014, the Company signed a power purchase
agreement for 120 megawatt ("MW") with the state power company Electroperu S.A., under which Electroperu S.A. will supply energy for the Peruvian operations for twenty years
starting on April 17, 2017 and ending on April 30, 2037.
- •
- Kallpa Generacion S.A. ("Kallpa"): In July 2014, the Company signed a power purchase agreement for 120MW with Kallpa, an independent Israeli owned power company, under which Kallpa will supply energy for the Peruvian operations for ten years starting on April 17, 2017 and ending on April 30, 2027. In May 2016, the Company signed an additional power purchase agreement for a maximum of 80MW with Kallpa, under which Kallpa will supply energy for the
146
SOUTHERN COPPER CORPORATION AND SUBSIDIARIES
NOTES TO CONSOLIDATED FINANCIAL STATEMENTS (Continued)
NOTE 13—COMMITMENTS AND CONTINGENCIES: (Continued)
Peruvian operations related to the Toquepala Expansion and other minor projects for ten years starting on May 1, 2017 and ending after ten years of commercial operation of the Toquepala Expansion or on April 30, 2029; whichever happens first.
Mexican operations
Power purchase agreements:
- •
- MGE: In 2012, the Company signed a power purchase agreement with MGE, an
indirect subsidiary of Grupo Mexico, to supply power to some of the Company's Mexican operations through 2032. For further information, please see Note 17 "Related party transactions".
- •
- Eólica el Retiro S.A.P.I. de C.V.: In 2013, the Company signed a power purchase agreement with EOLICA el RETIRO, S.A.P.I de C.V. a windfarm energy producer that is an indirect subsidiary of Grupo Mexico, to supply power to some of the Company's Mexican operations. For further information, please see Note 17 "Related party transactions".
For an estimate of the Company's contractual obligations for power purchases, please see, "Contractual Obligations" under Item 7 "Management Discussion and Analysis of Financial Condition and Results of Operations."
Commitment for Capital projects:
As of December 31, 2016, the Company has committed approximately $1,447.2 million for the development of its capital investment projects.
Tax contingency matters:
Tax contingencies are provided for under ASC 740-10-50-15 Uncertain tax position (see Note 8 "Income taxes").
NOTE 14—STOCKHOLDERS' EQUITY
Treasury Stock:
Activity in treasury stock in the years 2016 and 2015 was as follows (in millions):
| |
2016 | 2015 | |||||
|---|---|---|---|---|---|---|---|
Southern Copper common shares |
|||||||
Balance as of January 1, |
$ | 2.697.6 | $ | 1,693.5 | |||
Purchase of shares |
71.7 | 1,004.4 | |||||
Used for corporate purposes |
(0.3 | ) | (0.3 | ) | |||
| | | | | | | | |
Balance as of December 31, |
2,769.0 | 2,697.6 | |||||
| | | | | | | | |
Parent Company (Grupo Mexico) common shares |
|||||||
Balance as of January 1, |
211.3 | 207.1 | |||||
Other activity, including dividend, interest and foreign currency transaction effect |
7.3 | 4.2 | |||||
| | | | | | | | |
Balance as of December 31, |
218.6 | 211.3 | |||||
| | | | | | | | |
Treasury stock balance as of December 31, |
$ |
2,987.6 |
$ |
2,908.9 |
|||
| | | | | | | | |
| | | | | | | | |
| | | | | | | | |
147
SOUTHERN COPPER CORPORATION AND SUBSIDIARIES
NOTES TO CONSOLIDATED FINANCIAL STATEMENTS (Continued)
NOTE 14—STOCKHOLDERS' EQUITY (Continued)
SCC shares of common stock in treasury:
At December 31, 2016 and 2015, treasury stock holds 111,579,617 shares and 108,653,816 shares of SCC's common stock with a cost of $2,769.0 million and $2,697.6 million, respectively. The shares of SCC's common stock held in treasury are used for Director's stock award plans and available for general corporate purposes.
SCC share repurchase program:
In 2008, the Company's Board of Directors ("BOD") authorized a $500 million share repurchase program that has since been increased by the BOD and is currently authorized to $3 billion. Pursuant to this program, the Company purchased common stock as shown in the table below. These shares are available for general corporate purposes. The Company may purchase additional shares of its common stock from time to time, based on market conditions and other factors. This repurchase program has no expiration date and may be modified or discontinued at any time.
| |
|
|
|
|
Maximum Number of Shares that May Yet Be Purchased Under the Plan @ $31.94(1) |
|
|||||||||||||
|---|---|---|---|---|---|---|---|---|---|---|---|---|---|---|---|---|---|---|---|
| Period | |
|
Total Number of Shares Purchased as Part of Publicly Announced Plan |
|
|||||||||||||||
| Total Number of Shares Purchased |
Average Price Paid per Share |
Total Cost ($ in millions) |
|||||||||||||||||
From
|
To | ||||||||||||||||||
2008 |
2012 | 46,914,486 | $ | 18.72 | 46,914,486 | 878.1 | |||||||||||||
2013: |
10,245,000 | 27.47 | 57,159,486 | 281.4 | |||||||||||||||
2014: |
22,711,428 | 30.06 | 79,870,914 | 682.8 | |||||||||||||||
2015: |
36,689,052 | 27.38 | 116,559,966 | 1,004.4 | |||||||||||||||
2016: |
|||||||||||||||||||
01/01/16 |
01/31/16 | 2,235,200 | 24.05 | 118,795,166 | 53.7 | ||||||||||||||
| | | | | | | | | | | | | | | | | | | | |
Total first quarter |
2,235,200 | 24.05 | 53.7 | ||||||||||||||||
| | | | | | | | | | | | | | | | | | | | |
08/01/16 |
08/31/16 | 115,000 | 25.88 | 118,910,166 | 3.0 | ||||||||||||||
09/01/16 |
09/30/16 | 587,601 | 25.55 | 119,497,767 | 15.0 | ||||||||||||||
| | | | | | | | | | | | | | | | | | | | |
Total third quarter |
702,601 | 25.61 | 18.0 | ||||||||||||||||
| | | | | | | | | | | | | | | | | | | | |
Total 2016 |
2,937,801 | 24.42 | 71.7 | ||||||||||||||||
Total purchased |
119,497,767 |
$ |
24.42 |
2,555,835 |
$ |
2,918.4 |
|||||||||||||
| | | | | | | | | | | | | | | | | | | | |
| | | | | | | | | | | | | | | | | | | | |
| | | | | | | | | | | | | | | | | | | | |
- (1)
- NYSE closing price of SCC common shares at December 31, 2016.
As a result of the repurchase of shares of SCC's common stock, Grupo Mexico's direct and indirect ownership was 88.9% as of December 31, 2016 and 88.6% at December 31, 2015.
Directors' Stock Award Plan:
The Company established a stock award compensation plan for certain directors who are not compensated as employees of the Company. Under this plan, participants will receive 1,200 shares of common stock upon election and 1,200 additional shares following each annual meeting of stockholders thereafter. 600,000 shares of Southern Copper common stock have been reserved for this plan. The fair
148
SOUTHERN COPPER CORPORATION AND SUBSIDIARIES
NOTES TO CONSOLIDATED FINANCIAL STATEMENTS (Continued)
NOTE 14—STOCKHOLDERS' EQUITY (Continued)
value of the award is measured each year at the date of the grant. In 2016 and 2015 the stock based compensation expense under this plan equaled $0.3 million and $0.4 million, respectively.
The plan expired by its terms on January 30, 2017. A 10-year extension of the plan is being submitted for approval by the Company's stockholders at the 2017 Annual Meeting of Stockholders.
The activity of this plan for the years ended December 31, 2016 and 2015 was as follows:
| |
2016 | 2015 | |||||
|---|---|---|---|---|---|---|---|
Total SCC shares reserved for the plan |
600,000 | 600,000 | |||||
| | | | | | | | |
Total shares granted at January 1, |
(322,800 | ) | (309,600 | ) | |||
Granted in the period |
(12,000 | ) | (13,200 | ) | |||
| | | | | | | | |
Total shares granted at December 31, |
(334,800 | ) | (322,800 | ) | |||
| | | | | | | | |
Remaining shares reserved |
265,200 | 277,200 | |||||
| | | | | | | | |
| | | | | | | | |
| | | | | | | | |
Parent Company common shares:
At December 31, 2016 and 2015, there were in treasury 115,667,784 and 110,472,170 of Grupo Mexico's common shares, respectively.
Employee Stock Purchase Plan:
2010 Plan: During 2010, the Company offered to eligible employees a stock purchase plan through a trust that acquires series B shares of Grupo Mexico stock for sale to its employees, employees of subsidiaries, and certain affiliated companies. The purchase price was established at 26.51 Mexican pesos (approximately $1.28) for the initial subscription. The terms of this plan are similar to the terms of the prior Employee Stock Purchase Plan.
The stock based compensation expense for the years ended December 31, 2016, 2015 and 2014 and the remaining balance of the unrecognized compensation expense under this plan were as follows (in millions):
| |
2016 | 2015 | 2014 | |||||||
|---|---|---|---|---|---|---|---|---|---|---|
Stock based compensation expense |
$ | 0.6 | $ | 0.6 | $ | 0.6 | ||||
Unrecognized compensation expense |
$ | 0.8 | $ | 1.4 | $ | 2.0 | ||||
The unrecognized compensation expense under this plan is expected to be recognized over the remaining two year period.
149
SOUTHERN COPPER CORPORATION AND SUBSIDIARIES
NOTES TO CONSOLIDATED FINANCIAL STATEMENTS (Continued)
NOTE 14—STOCKHOLDERS' EQUITY (Continued)
The following table presents the stock award activity of the 2010 Employee Stock Purchase Plan for the years ended December 31, 2016 and 2015:
| |
Shares | Unit Weighted Average Grant Date Fair Value |
|||||
|---|---|---|---|---|---|---|---|
Outstanding shares at January 1, 2016 |
2,227,582 | $ | 2.05 | ||||
Granted |
— | — | |||||
Exercised |
(826,486 | ) | 2.05 | ||||
Forfeited |
— | — | |||||
| | | | | | | | |
Outstanding shares at December 31, 2016 |
1,401,096 | $ | 2.05 | ||||
| | | | | | | | |
| | | | | | | | |
| | | | | | | | |
Outstanding shares at January 1, 2015 |
2,287,891 | $ | 2.05 | ||||
Granted |
— | — | |||||
Exercised |
(60,309 | ) | 2.05 | ||||
Forfeited |
— | — | |||||
| | | | | | | | |
Outstanding shares at December 31, 2015 |
2,227,582 | $ | 2.05 | ||||
| | | | | | | | |
| | | | | | | | |
| | | | | | | | |
2015 Plan: In January 2015, the Company offered to eligible employees a new stock purchase plan (the "New Employee Stock Purchase Plan") through a trust that acquires series B of shares of Grupo Mexico stock for sale to its employees, and employees of subsidiaries, and certain affiliated companies. The purchase price was established at 38.44 Mexican pesos (approximately $1.86) for the initial subscription, which expires on January 2023. Every two years employees will be able to acquire title to 50% of the shares paid in the previous two years. The employees will pay for shares purchased through monthly payroll deductions over the eight year period of the plan. At the end of the eight year period, the Company will grant the participant a bonus of 1 share for every 10 shares purchased by the employee. Any future subscription will be at the average market price at the date of acquisition or the grant date.
If Grupo Mexico pays dividends on shares during the eight year period, the participants will be entitled to receive the dividend in cash for all shares that have been fully purchased and paid as of the date that the dividend is paid. If the participant has only partially paid for shares, the entitled dividends will be used to reduce the remaining liability owed for purchased shares.
In the case of voluntary or involuntary resignation/termination of the employee, the Company will pay to the employee the fair market sales price at the date of resignation of the fully paid shares, net of costs and taxes. When the fair market sales value of the shares is higher than the purchase price, the Company will apply a deduction over the amount to be paid to the employee based on a decreasing schedule specified in the plan.
In case of retirement or death of the employee, the Company will render the buyer or his legal beneficiary, the fair market sales value as of the date of retirement or death of the shares effectively paid, net of costs and taxes.
150
SOUTHERN COPPER CORPORATION AND SUBSIDIARIES
NOTES TO CONSOLIDATED FINANCIAL STATEMENTS (Continued)
NOTE 14—STOCKHOLDERS' EQUITY (Continued)
The stock based compensation expense for the years ended December 31, 2016 and 2015 and the unrecognized compensation expense under this plan were as follows (in millions):
| |
2016 | 2015 | |||||
|---|---|---|---|---|---|---|---|
Stock based compensation expense |
$ | 0.6 | $ | 0.4 | |||
Unrecognized compensation expense |
$ | 3.8 | $ | 4.4 | |||
The following table presents the stock award activity of this plan for the years ended December 31, 2016 and 2015:
| |
Shares | Unit Weighted Average Grant Date Fair Value |
|||||
|---|---|---|---|---|---|---|---|
Outstanding shares at January 1, 2016 |
2,656,386 | $ | 2.63 | ||||
Granted |
— | — | |||||
Exercised |
(116,163 | ) | $ | 2.63 | |||
Forfeited |
— | — | |||||
| | | | | | | | |
Outstanding shares at December 31, 2016 |
2,540,223 | $ | 2.63 | ||||
| | | | | | | | |
| | | | | | | | |
| | | | | | | | |
Outstanding shares at January 1, 2015 |
— | — | |||||
Granted |
2,656,386 | $ | 2.63 | ||||
Exercised |
— | — | |||||
Forfeited |
— | — | |||||
| | | | | | | | |
Outstanding shares at December 31, 2015 |
2,656,386 | $ | 2.63 | ||||
| | | | | | | | |
| | | | | | | | |
| | | | | | | | |
Executive Stock Purchase Plan:
Grupo Mexico also offers a stock purchase plan for certain members of its executive management and the executive management of its subsidiaries and certain affiliated companies. Under this plan, participants will receive incentive cash bonuses which are used to purchase shares of Grupo Mexico which are deposited in a trust.
Non-controlling interest:
For all the years presented, in the consolidated statement of earnings the income attributable to non-controlling interest is based on the earnings of the Company's Peruvian Branch.
The non-controlling interest of the Company's Peruvian Branch is for investment shares. These shares were generated by legislation in place in Peru from the 1970s through 1991; such legislation provided for the participation of mining workers in the profits of the enterprises for which they worked. This participation was divided between equity and cash. The investment shares included in the non-controlling interest on the consolidated balance sheets are the still outstanding equity distributions made to the Peruvian Branch's employees.
In prior years, the Company acquired some Peruvian investment shares in exchange for newly issued common shares of the Company and through purchases at market value. These acquisitions were accounted for as purchases of non-controlling interests. The excess paid over the carrying value was assigned to intangible assets and is being amortized based on production. As a result of these
151
SOUTHERN COPPER CORPORATION AND SUBSIDIARIES
NOTES TO CONSOLIDATED FINANCIAL STATEMENTS (Continued)
NOTE 14—STOCKHOLDERS' EQUITY (Continued)
acquisitions, the remaining investment shareholders hold a 0.71% interest in the Peruvian Branch and are entitled to a pro rata participation in the cash distributions made by the Peruvian Branch. The shares are recorded as a non-controlling interest in the Company's financial statements.
NOTE 15—FAIR VALUE MEASUREMENT:
Subtopic 820-10 of ASC "Fair value measurement and disclosures—Overall" establishes a fair value hierarchy that prioritizes the inputs to valuation techniques used to measure fair value. The hierarchy gives the highest priority to unadjusted quoted prices in active markets for identical assets or liabilities (Level 1 measurements) and the lowest priority to unobservable inputs (Level 3 measurements). The three levels of the fair value hierarchy under Subtopic 820-10 are described below:
Level 1—Unadjusted quoted prices in active markets that are accessible at the measurement date for identical, unrestricted assets or liabilities.
Level 2—Inputs that are observable, either directly or indirectly, but do not qualify as Level 1 inputs. (i.e., quoted prices for similar assets or liabilities).
Level 3—Prices or valuation techniques that require inputs that are both significant to the fair value measurement and unobservable (i.e., supported by little or no market activity).
The carrying amounts of certain financial instruments, including cash and cash equivalents, accounts receivable (other than accounts receivable associated with provisionally priced sales) and accounts payable approximate fair value due to their short maturities. Consequently, such financial instruments are not included in the following table that provides information about the carrying amounts and estimated fair values of other financial instruments that are not measured at fair value in the consolidated balance sheet as of December 31, 2016 and December 31, 2015 (in millions):
| |
At December 31, 2016 | At December 31, 2015 | |||||||||||
|---|---|---|---|---|---|---|---|---|---|---|---|---|---|
| |
Carrying Value | Fair Value | Carrying Value | Fair Value | |||||||||
Liabilities: |
|||||||||||||
Long-term debt |
$ | 5,954.2 | $ | 6,212.0 | $ | 5,951.5 | $ | 5,211.5 | |||||
Long-term debt is carried at amortized cost and its estimated fair value is based on quoted market prices classified as Level 1 in the fair value hierarchy except for the case of the Yankee bonds which qualify as Level 2 in the fair value hierarchy as they are based on quoted priced in market that are not active.
152
SOUTHERN COPPER CORPORATION AND SUBSIDIARIES
NOTES TO CONSOLIDATED FINANCIAL STATEMENTS (Continued)
NOTE 15—FAIR VALUE MEASUREMENT: (Continued)
Fair values of assets and liabilities measured at fair value on a recurring basis were calculated as of December 31, 2016 and 2015, as follows (in millions):
| |
Fair Value at Measurement Date Using: | ||||||||||||
|---|---|---|---|---|---|---|---|---|---|---|---|---|---|
Description
|
Fair Value as of December 31, 2016 |
Quoted prices in active markets for identical assets (Level 1) |
Significant other observable inputs (Level 2) |
Significant unobservable inputs (Level 3) |
|||||||||
Assets: |
|||||||||||||
Short term investment: |
|||||||||||||
— Trading securities |
$ | 49.2 | $ | 49.2 | — | $ | — | ||||||
— Available-for-sale debt securities: |
|||||||||||||
Corporate bonds |
— | — | — | — | |||||||||
Asset backed securities |
— | — | — | — | |||||||||
Mortgage backed securities |
2.1 | — | $ | 2.1 | — | ||||||||
Accounts receivable: |
|||||||||||||
— Embedded derivatives—Not classified as hedges: |
|||||||||||||
Provisionally priced sales: |
|||||||||||||
Copper |
203.8 | 203.8 | — | — | |||||||||
Molybdenum |
54.0 | 54.0 | — | — | |||||||||
| | | | | | | | | | | | | | |
Total |
$ | 309.1 | $ | 307.0 | $ | 2.1 | $ | — | |||||
| | | | | | | | | | | | | | |
| | | | | | | | | | | | | | |
| | | | | | | | | | | | | | |
| |
Fair Value at Measurement Date Using: | ||||||||||||
|---|---|---|---|---|---|---|---|---|---|---|---|---|---|
Description
|
Fair Value as of December 31, 2015 |
Quoted prices in active markets for identical assets (Level 1) |
Significant other observable inputs (Level 2) |
Significant unobservable inputs (Level 3) |
|||||||||
Assets: |
|||||||||||||
Short term investment: |
|||||||||||||
— Trading securities |
$ | 600.2 | $ | 600.2 | — | $ | — | ||||||
— Available-for-sale debt securities: |
|||||||||||||
Corporate bonds |
0.2 | — | $ | 0.2 | — | ||||||||
Asset backed securities |
— | — | — | — | |||||||||
Mortgage backed securities |
3.1 | — | 3.1 | — | |||||||||
Accounts receivable: |
|||||||||||||
— Embedded derivatives—Not classified as hedges: |
|||||||||||||
Provisionally priced sales: |
|||||||||||||
Copper |
351.0 | 351.0 | — | — | |||||||||
Molybdenum |
62.4 | 62.4 | — | — | |||||||||
| | | | | | | | | | | | | | |
Total |
$ | 1,016.9 | $ | 1,013.6 | $ | 3.3 | $ | — | |||||
| | | | | | | | | | | | | | |
| | | | | | | | | | | | | | |
| | | | | | | | | | | | | | |
153
SOUTHERN COPPER CORPORATION AND SUBSIDIARIES
NOTES TO CONSOLIDATED FINANCIAL STATEMENTS (Continued)
NOTE 15—FAIR VALUE MEASUREMENT: (Continued)
The Company's short-term trading securities investments are classified as Level 1 because they are valued using quoted prices of the same securities as they consist of bonds issued by public companies and publicly traded. The Company's short-term available-for-sale investments are classified as Level 2 because they are valued using quoted prices for similar investments.
The Company's accounts receivables associated with provisionally priced copper sales are valued using quoted market prices based on the forward price on the LME or on the COMEX. Such value is classified within Level 1 of the fair value hierarchy. Molybdenum prices are established by reference to the publication Platt's Metals Week and are considered Level 1 in the fair value hierarchy.
NOTE 16—CONCENTRATION OF RISK:
The Company operates four open-pit copper mines, five underground poly-metallic mines, two smelters and eight refineries in Peru and Mexico and substantially all of its assets are located in these countries. There can be no assurances that the Company's operations and assets that are subject to the jurisdiction of the governments of Peru and Mexico will not be adversely affected by future actions of such governments. Much of the Company's products are exported from Peru and Mexico to customers principally in the United States, Europe, Asia and South America.
Financial instruments, which potentially subject the Company to a concentration of credit risk, consist primarily of cash and cash equivalents, short-term investments and trade accounts receivable.
The Company invests or maintains available cash with various banks, principally in the United States, Mexico, Europe and Peru, or in commercial papers of highly-rated companies. As part of its cash management process, the Company regularly monitors the relative credit standing of these institutions. At December 31, 2016, SCC had invested its cash and cash equivalents and short-term investments as follows:
| |
|
|
% in one institution | ||||||||||
|---|---|---|---|---|---|---|---|---|---|---|---|---|---|
Country
|
$ in million | % of total cash(1) |
of country | of total cash |
|||||||||
United States |
$ | 510.8 | 85.5 | % | 33.9 | % | 29.0 | % | |||||
Switzerland |
51.4 | 8.6 | % | 94.7 | % | 8.2 | % | ||||||
Peru |
5.1 | 0.9 | % | 34.7 | % | 0.3 | % | ||||||
Mexico |
30.0 | 5.0 | % | 94.4 | % | 4.7 | % | ||||||
| | | | | | | | | | | | | | |
Total cash and short-term investment |
$ | 597.3 | 100.0 | % | |||||||||
| | | | | | | | | | | | | | |
| | | | | | | | | | | | | | |
| | | | | | | | | | | | | | |
- (1)
- 97.0% of the Company's cash is in U.S. dollars.
During the normal course of business, the Company provides credit to its customers. Although the receivables resulting from these transactions are not collateralized, the Company has not experienced significant problems with the collection of receivables.
The Company is exposed to credit loss in cases where the financial institutions with which it has entered into derivative transactions (commodity, foreign exchange and currency/interest rate swaps) are unable to pay when they owe funds as a result of protection agreements with them. To minimize the risk of such losses, the Company only uses highly-rated financial institutions that meet certain
154
SOUTHERN COPPER CORPORATION AND SUBSIDIARIES
NOTES TO CONSOLIDATED FINANCIAL STATEMENTS (Continued)
NOTE 16—CONCENTRATION OF RISK: (Continued)
requirements. The Company also periodically reviews the creditworthiness of these institutions to ensure that they are maintaining their ratings. The Company does not anticipate that any of the financial institutions will default on their obligations.
The Company's largest customers as percentage of accounts receivable and total sales were as follows:
| |
2016 | 2015 | 2014 | |||||||
|---|---|---|---|---|---|---|---|---|---|---|
Accounts receivable trade as of December 31, |
||||||||||
Five largest customers |
31.1 | % | 32.4 | % | 31.2 | % | ||||
Largest customer |
11.9 | % | 10.9 | % | 8.0 | % | ||||
Total sales in year |
||||||||||
Five largest customers |
30.4 | % | 28.0 | % | 34.3 | % | ||||
Largest customer |
8.4 | % | 7.7 | % | 8.2 | % | ||||
NOTE 17—RELATED PARTY TRANSACTIONS:
The Company has entered into certain transactions in the ordinary course of business with parties that are controlling shareholders or their affiliates. These transactions include the lease of office space, air transportation, construction services and products and services related to mining and refining. The Company lends and borrows funds among affiliates for acquisitions and other corporate purposes. These financial transactions bear interest and are subject to review and approval by senior management, as are all related party transactions. It is the Company's policy that the Audit Committee of the Board of Directors shall review all related party transactions. The Company is prohibited from entering or continuing a material related party transaction that has not been reviewed and approved or ratified by the Audit Committee.
155
SOUTHERN COPPER CORPORATION AND SUBSIDIARIES
NOTES TO CONSOLIDATED FINANCIAL STATEMENTS (Continued)
NOTE 17—RELATED PARTY TRANSACTIONS: (Continued)
Receivable and payable balances with related parties are shown below (in millions):
| |
At December 31, | ||||||
|---|---|---|---|---|---|---|---|
| |
2016 | 2015 | |||||
Related parties receivable current: |
|||||||
Compañia Perforadora Mexico S.A.P.I. de C.V. and affiliates |
$ | 1.3 | $ | 0.7 | |||
Asarco LLC |
5.5 | ||||||
Ferrocarril Mexicano S.A. de C.V. |
— | 0.2 | |||||
Grupo Mexico |
4.5 | 0.6 | |||||
Mexico Generadora de Energia S. de R.L. ("MGE") |
10.2 | 13.9 | |||||
Operadora de Generadoras de Energia Mexico S.A. de C.V. |
0.1 | 0.1 | |||||
Operadora de Cinemas S.A. de C.V. |
0.2 | ||||||
Boutique Bowling de Mexico S.A. de C.V. |
0.1 | ||||||
Mexico Proyectos y Desarrollos, S.A. de C.V. and affiliates |
1.5 | 0.3 | |||||
| | | | | | | | |
|
$ | 23.4 | $ | 15.8 | |||
| | | | | | | | |
| | | | | | | | |
| | | | | | | | |
Related parties receivable non-current: |
|||||||
MGE |
$ | — | $ | 111.2 | |||
| | | | | | | | |
| | | | | | | | |
| | | | | | | | |
Related parties payable: |
|||||||
Asarco LLC |
$ | 36.3 | $ | 20.6 | |||
Boutique Bowling de Mexico S.A. de C.V. |
0.2 | 0.2 | |||||
Eolica El Retiro, S.A.P.I. de C.V. |
0.1 | 0.1 | |||||
Ferrocarril Mexicano S.A. de C.V. |
3.0 | — | |||||
Grupo Mexico |
0.1 | 12.0 | |||||
Mexico Transportes Aereos S.A. de C.V. ("Mextransport") |
0.1 | 0.5 | |||||
Mexico Proyectos y Desarrollos S.A. de C.V. and affiliates |
7.8 | 11.8 | |||||
MGE |
13.9 | 23.0 | |||||
Operadora de Cinemas S.A. de C.V. |
0.4 | 0.2 | |||||
Breaker, S.A. de C.V. and affiliates ("Breaker") |
0.3 | 0.3 | |||||
Sempertrans and affiliates |
— | 0.6 | |||||
| | | | | | | | |
|
$ | 62.2 | $ | 69.3 | |||
| | | | | | | | |
| | | | | | | | |
| | | | | | | | |
156
SOUTHERN COPPER CORPORATION AND SUBSIDIARIES
NOTES TO CONSOLIDATED FINANCIAL STATEMENTS (Continued)
NOTE 17—RELATED PARTY TRANSACTIONS: (Continued)
Purchase and sale activity:
Grupo Mexico and affiliates:
The following table summarize the purchase and sale activities with Grupo Mexico and its affiliates in 2016, 2015 and 2014 (in millions):
| |
2016 | 2015 | 2014 | |||||||
|---|---|---|---|---|---|---|---|---|---|---|
Purchase activity |
||||||||||
Asarco LLC |
$ | 30.3 | $ | 32.0 | $ | 47.9 | ||||
Compañia Perforadora Mexico S.A.P.I. de C.V. and affiliates |
0.3 | 0.3 | 3.1 | |||||||
Eolica El Retiro, S.A.P.I. de C.V. |
2.0 | 6.6 | 7.6 | |||||||
Ferrocarril Mexicano, S.A. de C.V. |
42.7 | 27.3 | 22.7 | |||||||
Grupo Mexico |
13.8 | 13.8 | 13.9 | |||||||
Mexico Proyectos y Desarrollos S.A. de C.V. and affiliates |
76.0 | 57.3 | 61.4 | |||||||
MGE |
233.8 | 143.3 | 178.4 | |||||||
| | | | | | | | | | | |
Total purchases |
$ | 398.9 | $ | 280.6 | $ | 335.0 | ||||
| | | | | | | | | | | |
| | | | | | | | | | | |
| | | | | | | | | | | |
Sales activity |
||||||||||
Asarco LLC |
$ | 37.1 | $ | 72.3 | $ | 24.7 | ||||
Compañia Perforadora Mexico S.A.P.I. de C.V. and affiliates |
0.6 | 0.6 | 0.6 | |||||||
Grupo Mexico |
0.6 | 0.5 | — | |||||||
Mexico Proyectos y Desarrollos S.A. de C.V. and affiliates |
0.4 | 0.8 | 0.8 | |||||||
Operadora de Generadoras de Energia Mexico S.A. de C.V |
0.1 | — | — | |||||||
MGE |
95.9 | 81.7 | 96.5 | |||||||
| | | | | | | | | | | |
Total sales |
$ | 134.7 | $ | 155.9 | $ | 122.6 | ||||
| | | | | | | | | | | |
| | | | | | | | | | | |
| | | | | | | | | | | |
Grupo Mexico, the parent and the majority indirect stockholder of the Company, and its affiliates provide various services to the Company. These services are primarily related to accounting, legal, tax, financial, treasury, human resources, price risk assessment and hedging, purchasing, procurement and logistics, sales and administrative and other support services. The Company pays Grupo Mexico for these services and expects to continue these services in the future.
The Company's Mexican operations paid fees for freight services provided by Ferrocarril Mexicano, S.A de C.V., for construction services provided by Mexico Proyectos y Desarrollos, S.A. de C.V. and its affiliates, and for drilling services provided by Compañia Perforadora Mexico S.A.P.I. de C.V. All of these companies are subsidiaries of Grupo Mexico.
The Company's Mexican operations purchased scrap and other residual copper mineral from Asarco, and power from MGE. Both companies are subsidiaries of Grupo Mexico.
In 2005, the Company organized MGE, as a subsidiary of Minera Mexico, for the construction of two power plants to supply power to the Company's Mexican operations. In May 2010, the Company's Mexican operations granted a $350 million line of credit to MGE for the construction of the power
157
SOUTHERN COPPER CORPORATION AND SUBSIDIARIES
NOTES TO CONSOLIDATED FINANCIAL STATEMENTS (Continued)
NOTE 17—RELATED PARTY TRANSACTIONS: (Continued)
plants. That line of credit was due on December 31, 2012 and carried an interest rate of 4.4%. In the first quarter of 2012, Controladora de Infraestructura Energetica Mexico, S. A. de C. V., an indirect subsidiary of Grupo Mexico, acquired 99.999% of MGE through a capital subscription of 1,928.6 million of Mexican pesos (approximately $150 million), reducing Minera Mexico's participation to less than 0.001%. As a consequence of this change in control, MGE became an indirect subsidiary of Grupo Mexico. Additionally, at the same time, MGE paid $150 million to the Company's Mexican operations partially reducing the total debt. At December 31, 2012, the outstanding balance of $184.0 million was restructured as subordinated debt of MGE with an interest rate of 5.75%. In the third quarter of 2016, MGE repaid the outstanding balance of the debt. Related to this loan, the Company recorded interest income of $4.2 million, $9.2 million and $9.4 million in 2016, 2015 and 2014, respectively.
In 2012, the Company signed a power purchase agreement with MGE, whereby MGE will supply some of the Company's Mexican operations with power through 2032. MGE completed construction of its first power plant in June 2013 and the second plant in the second quarter of 2014. These plants are natural gas-fired combined cycle power generating units, with a net total capacity of 516.2 megawatts. The first plant began supplying power to the Company in December 2013, and the second plant began to supply power in June 2015. MGE is supplying approximately 12% of its power output to third-party energy users.
On August 4, 2014, Mexico Generadora de Energia Eolica S. de R.L. de C.V, an indirect subsidiary of Grupo Mexico, located in Oaxaca, Mexico, acquired Eolica el Retiro. Eolica el Retiro is a windfarm that has 37 wind turbines. This company started operations in January 2014 and started to sell power to IMMSA and other subsidiaries of Grupo Mexico in the third quarter of 2014. Eolica el Retiro is supplying approximately 15% of its power output to IMMSA.
The Company sold copper cathodes, rod and anodes, as well as sulfuric acid, silver, gold and lime to Asarco. In addition, the Company received fees for building rental and maintenance services provided to Mexico Proyectos y Desarrollos, S.A. de C.V. and its affiliates and to Perforadora Mexico S.A.P.I de C.V., and for natural gas and services provided by MGE, all subsidiaries of Grupo Mexico.
158
SOUTHERN COPPER CORPORATION AND SUBSIDIARIES
NOTES TO CONSOLIDATED FINANCIAL STATEMENTS (Continued)
NOTE 17—RELATED PARTY TRANSACTIONS: (Continued)
Companies with relationships with the controlling group:
The following table summarize the purchase and sales activities with other Larrea family companies in 2016, 2015 and 2014 (in millions):
| |
2016 | 2015 | 2014 | |||||||
|---|---|---|---|---|---|---|---|---|---|---|
Purchase activity |
||||||||||
Boutique Bowling de Mexico S.A. de C.V. |
$ | 0.4 | $ | 0.4 | $ | — | ||||
Mextransport |
2.0 | 2.0 | 2.5 | |||||||
Operadora de Cinemas S.A. de C.V. |
0.5 | 0.5 | — | |||||||
| | | | | | | | | | | |
Total purchases |
$ | 2.9 | $ | 2.9 | $ | 2.5 | ||||
| | | | | | | | | | | |
| | | | | | | | | | | |
| | | | | | | | | | | |
Sales activity |
||||||||||
Boutique Bowling de Mexico S.A. de C.V. |
$ | 0.2 | $ | 0.3 | $ | — | ||||
Mextransport |
0.2 | 0.3 | 0.3 | |||||||
Operadora de Cinemas S.A. de C.V. |
0.1 | 0.2 | — | |||||||
| | | | | | | | | | | |
Total sales |
$ | 0.5 | $ | 0.8 | $ | 0.3 | ||||
| | | | | | | | | | | |
| | | | | | | | | | | |
| | | | | | | | | | | |
The Larrea family controls a majority of the capital stock of Grupo Mexico, and has extensive interests in other businesses, including aviation, real estate and entertainment. The Company engages in certain transactions in the ordinary course of business with other entities controlled by the Larrea family relating to the lease of office space, air transportation and entertainment.
The Company's Mexican operations paid fees for entertainment services provided by Boutique Bowling de Mexico S.A de C.V. and Operadora de Cinemas S.A. de C.V. Both companies are controlled by the Larrea family.
MexTransport provides aviation services to the Company's Mexican operations. This is a company controlled by the Larrea family.
In addition, the company received fees for building rental and maintenance provided to Boutique Bowling de Mexico S.A. de C.V., Operadora de Cinemas S.A. de C.V. and MexTransport.
Companies with relationships with SCC executive officers:
The following table summarizes the purchase activities with companies with relationships to SCC executive officers in 2016, 2015 and 2014 (in millions):
| |
2016 | 2015 | 2014 | |||||||
|---|---|---|---|---|---|---|---|---|---|---|
Higher Technology S.A.C. |
$ | 1.0 | $ | 1.4 | $ | 3.2 | ||||
Servicios y Fabricaciones Mecanicas S.A.C. |
0.5 | 0.7 | 1.3 | |||||||
Sempertrans |
— | 1.2 | 1.2 | |||||||
Breaker |
0.5 | 5.5 | 10.1 | |||||||
Pigoba, S.A. de C.V. |
— | — | 0.6 | |||||||
| | | | | | | | | | | |
Total purchased |
$ | 2.0 | $ | 8.8 | $ | 16.4 | ||||
| | | | | | | | | | | |
| | | | | | | | | | | |
| | | | | | | | | | | |
The Company purchased industrial materials from Higher Technology S.A.C. and paid fees for maintenance services provided by Servicios y Fabricaciones Mecanicas S.A.C. Mr. Carlos Gonzalez, the son of SCC's Chief Executive Officer, had a proprietary interest in these companies through June 6, 2016.
159
SOUTHERN COPPER CORPORATION AND SUBSIDIARIES
NOTES TO CONSOLIDATED FINANCIAL STATEMENTS (Continued)
NOTE 17—RELATED PARTY TRANSACTIONS: (Continued)
The Company purchased industrial material from Sempertrans and its affiliates, which employed Mr. Alejandro Gonzalez as a sales representative, through August 4, 2015. Also, the Company purchased industrial material from Pigoba, S.A. de C.V., a company in which Mr. Alejandro Gonzalez has a proprietary interest, Mr. Alejandro Gonzalez is the son of SCC's Chief Executive Officer.
The Company purchased industrial material and services from Breaker, S.A. de C.V., a company in which Mr. Jorge Gonzalez, son-in-law of SCC's Chief Executive Officer, has a proprietary interest, and from Breaker Peru S.A.C., a company in which Mr. Jorge Gonzalez, son-in-law and Mr. Carlos Gonzalez, son of SCC's Chief Executive Officer has a proprietary interest.
Equity Investment in Affiliate: The Company has a 44.2% participation in Compañia Minera Coimolache S.A. ("Coimolache"), which it accounts for on the equity method. Coimolache owns Tantahuatay, a gold mine located in the northern part of Peru.
It is anticipated that in the future the Company will enter into similar transactions with these same parties.
NOTE 18—SEGMENT AND RELATED INFORMATION:
Company management views Southern Copper as having three reportable segments and manages it on the basis of these segments. The reportable segments identified by the Company are: the Peruvian operations, the Mexican open-pit operations and the Mexican underground mining operations segment identified as the IMMSA unit.
The three reportable segments identified are groups of mines, each of which constitute an operating segment, with similar economic characteristics, type of products, processes and support facilities, similar regulatory environments, similar employee bargaining contracts and similar currency risks. In addition, each mine within the individual group earns revenues from similar type of customers for their products and services and each group incurs expenses independently, including commercial transactions between groups.
Intersegment sales are based on arm's length prices at the time of sale. These may not be reflective of actual prices realized by the Company due to various factors, including additional processing, timing of sales to outside customers and transportation cost. Added to the segment data is information regarding the Company's sales. The segments identified by the Company are:
- 1.
- Peruvian
operations, which include the Toquepala and Cuajone mine complexes and the smelting and refining plants, including a precious metals plant, industrial
railroad and port facilities that service both mines. The Peruvian operations produce copper, with production of by-products of molybdenum, silver and other material.
- 2.
- Mexican
open-pit operations, which include La Caridad and Buenavista mine complexes and the smelting and refining plants, including a precious metals plant and a
copper rod plant and support facilities that service both mines. The Mexican open-pit operations produce copper, with production of by-products of molybdenum, silver and other material.
- 3.
- Mexican underground mining operations, which include five underground mines that produce zinc, copper, silver and gold, a coal mine which produces coal and coke, and a zinc refinery. This group is identified as the IMMSA unit.
160
SOUTHERN COPPER CORPORATION AND SUBSIDIARIES
NOTES TO CONSOLIDATED FINANCIAL STATEMENTS (Continued)
NOTE 18—SEGMENT AND RELATED INFORMATION: (Continued)
The Peruvian operations include two open-pit copper mines whose mineral output is transported by rail to Ilo, Peru where it is processed at the Company's Ilo smelter and refinery, without distinguishing between the products of the two mines. The resulting product, anodes and refined copper, are then shipped to customers throughout the world. These shipments are recorded as revenue of the Company's Peruvian mines.
The Mexican open-pit segment includes two copper mines whose mineral output is processed in the same smelter and refinery without distinguishing between the products of the two mines. The resultant product, anodes and refined copper, are then shipped to customers throughout the world. These shipments are recorded as revenues of the Company's Mexican open-pit mines.
The Company has determined that it is necessary to classify the Peruvian open-pit operations as a separate operating segment from the Mexican open-pit operations due to the very distinct regulatory and political environments in which they operate. The Company's Senior Management Officers must consider the operations in each country separately when analyzing results of the Company and making key decisions. The open-pit mines in Peru must comply with stricter environmental rules and must continually deal with a political climate that has a very distinct vision of the mining industry as compared to Mexico. In addition, the collective bargaining agreement contracts are negotiated differently in each of the countries. These key differences result in the Company taking varying decisions with regards to open-pit operations in the two countries.
The IMMSA segment includes five mines whose minerals are processed in the same refinery. This segment also includes an underground coal mine. Sales of product from this segment are recorded as revenues of the Company's IMMSA unit. While the Mexican underground mines are subject to a very similar regulatory environment of the Mexican open-pit mines, the nature of the products and processes of two Mexican operations vary distinctly. These differences cause the Company's Senior Management Officers to take a very different approach when analyzing results and making decisions regarding the two Mexican operations.
Financial information is regularly prepared for each of the three segments and the results of the Company's operations are regularly reported to Senior Management on the segment basis. Senior Management of the Company focus on operating income and on total assets as measures of performance to evaluate different segments and to make decisions to allocate resources to the reported segments. These are common measures in the mining industry.
161
SOUTHERN COPPER CORPORATION AND SUBSIDIARIES
NOTES TO CONSOLIDATED FINANCIAL STATEMENTS (Continued)
NOTE 18—SEGMENT AND RELATED INFORMATION: (Continued)
Financial information relating to Company's segments is as follows:
| |
Year Ended December 31, 2016 | |||||||||||||||
|---|---|---|---|---|---|---|---|---|---|---|---|---|---|---|---|---|
| |
Mexican Open-pit |
Mexican IMMSA Unit |
Peruvian Operations |
Corporate, other and eliminations |
Consolidated | |||||||||||
| |
(in millions) |
|||||||||||||||
Net sales outside of segments |
$ | 3.234.3 | $ | 351.1 | $ | 1,794.4 | $ | — | $ | 5,379.8 | ||||||
Intersegment sales |
— | 72.0 | — | (72.0 | ) | — | ||||||||||
Cost of sales (exclusive of depreciation, amortization and depletion) |
1,523.2 | 304.1 | 1,280.2 | (73.4 | ) | 3,034.1 | ||||||||||
Selling, general and administrative |
47.1 | 7.4 | 37.5 | 2.3 | 94.3 | |||||||||||
Depreciation, amortization and depletion |
364.7 | 49.8 | 217.1 | 15.5 | 647.1 | |||||||||||
Exploration |
5.2 | 5.0 | 13.0 | 16.9 | 40.1 | |||||||||||
Environmental reclamation |
— | — | — | — | — | |||||||||||
| | | | | | | | | | | | | | | | | |
Operating income |
$ | 1,294.1 | $ | 56.8 | $ | 246.6 | $ | (33.3 | ) | 1,564.2 | ||||||
| | | | | | | | | | | | | | | | | |
Less: |
||||||||||||||||
Interest, net |
(283.6 | ) | ||||||||||||||
Other income (expense) |
(24.6 | ) | ||||||||||||||
Income taxes |
(501.1 | ) | ||||||||||||||
Equity earnings of affiliate |
23.9 | |||||||||||||||
Non-controlling interest |
(2.3 | ) | ||||||||||||||
| | | | | | | | | | | | | | | | | |
Net income attributable to SCC |
$ | 776.5 | ||||||||||||||
| | | | | | | | | | | | | | | | | |
| | | | | | | | | | | | | | | | | |
| | | | | | | | | | | | | | | | | |
Capital investment |
$ | 537.0 | $ | 35.8 | $ | 541.0 | $ | 4.7 | $ | 1,118.5 | ||||||
Property and mine development, net |
$ | 5,136.8 | $ | 448.7 | $ | 2,949.3 | $ | 231.7 | $ | 8,766.5 | ||||||
Total assets |
$ | 8.174.4 | $ | 825.0 | $ | 4,225.3 | $ | 9.6 | $ | 13,234.3 | ||||||
162
SOUTHERN COPPER CORPORATION AND SUBSIDIARIES
NOTES TO CONSOLIDATED FINANCIAL STATEMENTS (Continued)
NOTE 18—SEGMENT AND RELATED INFORMATION: (Continued)
| |
Year Ended December 31, 2015 | |||||||||||||||
|---|---|---|---|---|---|---|---|---|---|---|---|---|---|---|---|---|
| |
Mexican Open-pit |
Mexican IMMSA Unit |
Peruvian Operations |
Corporate, other and eliminations |
Consolidated | |||||||||||
| |
(in millions) |
|||||||||||||||
Net sales outside of segments |
$ | 2,703.9 | $ | 320.7 | $ | 2,021.3 | $ | — | $ | 5,045.9 | ||||||
Intersegment sales |
— | 67.6 | — | (67.6 | ) | — | ||||||||||
Cost of sales (exclusive of depreciation, amortization and depletion) |
1,390.0 | 323.8 | 1,289.0 | (75.2 | ) | 2,927.6 | ||||||||||
Selling, general and administrative |
50.5 | 6.4 | 41.4 | 1.1 | 99.4 | |||||||||||
Depreciation, amortization and depletion |
265.0 | 34.8 | 228.1 | (17.2 | ) | 510.7 | ||||||||||
Exploration |
7.8 | 9.6 | 11.9 | 19.5 | 48.8 | |||||||||||
Environmental reclamation |
45.0 | — | — | — | 45.0 | |||||||||||
| | | | | | | | | | | | | | | | | |
Operating income |
$ | 945.6 | $ | 13.7 | $ | 450.9 | $ | 4.2 | 1,414.4 | |||||||
| | | | | | | | | | | | | | | | | |
Less: |
||||||||||||||||
Interest, net |
(199.9 | ) | ||||||||||||||
Other income (expense) |
(25.3 | ) | ||||||||||||||
Income taxes |
(464.9 | ) | ||||||||||||||
Equity earnings of affiliate |
16.8 | |||||||||||||||
Non-controlling interest |
(4.7 | ) | ||||||||||||||
| | | | | | | | | | | | | | | | | |
Net income attributable to SCC |
$ | 736.4 | ||||||||||||||
| | | | | | | | | | | | | | | | | |
| | | | | | | | | | | | | | | | | |
| | | | | | | | | | | | | | | | | |
Capital investment(*) |
$ | 820.5 | $ | 39.2 | $ | 285.2 | $ | 105.1 | $ | 1,250.0 | ||||||
Property and mine development, net |
$ | 4,879.3 | $ | 395.8 | $ | 2,583.5 | $ | 404.2 | $ | 8,262.8 | ||||||
Total assets |
$ | 7,459.8 | $ | 787.5 | $ | 3,962.6 | $ | 383.3 | $ | 12,593.2 | ||||||
- (*)
- Corporate, other and eliminations includes $100.4 million purchase of the El Pilar mining property acquisition.
163
SOUTHERN COPPER CORPORATION AND SUBSIDIARIES
NOTES TO CONSOLIDATED FINANCIAL STATEMENTS (Continued)
NOTE 18—SEGMENT AND RELATED INFORMATION: (Continued)
| |
Year Ended December 31, 2014 | |||||||||||||||
|---|---|---|---|---|---|---|---|---|---|---|---|---|---|---|---|---|
| |
Mexican Open-pit |
Mexican IMMSA Unit |
Peruvian Operations |
Corporate, other and eliminations |
Consolidated | |||||||||||
| |
(in millions) |
|||||||||||||||
Net sales outside of segments |
$ | 2,954.6 | $ | 351.3 | $ | 2,481.8 | $ | — | $ | 5,787.7 | ||||||
Intersegment sales |
— | 90.4 | — | (90.4 | ) | — | ||||||||||
Cost of sales (exclusive of depreciation, amortization and depletion) |
1,146.6 | 335.0 | 1,416.6 | (57.7 | ) | 2,840.5 | ||||||||||
Selling, general and administrative |
37.2 | 16.3 | 44.8 | 5.1 | 103.4 | |||||||||||
Depreciation, amortization and depletion |
225.5 | 33.4 | 198.4 | (12.3 | ) | 445.0 | ||||||||||
Exploration |
3.9 | 29.5 | 13.6 | 27.7 | 74.7 | |||||||||||
Environmental reclamation |
91.4 | — | — | — | 91.4 | |||||||||||
| | | | | | | | | | | | | | | | | |
Operating income |
$ | 1,450.0 | $ | 27.5 | $ | 808.4 | $ | (53.2 | ) | 2,232.7 | ||||||
| | | | | | | | | | | | | | | | | |
Less: |
||||||||||||||||
Interest, net |
(123.3 | ) | ||||||||||||||
Other income (expense) |
(40.8 | ) | ||||||||||||||
Income taxes |
(754.6 | ) | ||||||||||||||
Equity earnings of affiliate |
23.9 | |||||||||||||||
Non-controlling interest |
(4.9 | ) | ||||||||||||||
| | | | | | | | | | | | | | | | | |
Net income attributable to SCC |
$ | 1,333.0 | ||||||||||||||
| | | | | | | | | | | | | | | | | |
| | | | | | | | | | | | | | | | | |
| | | | | | | | | | | | | | | | | |
Capital expenditures |
$ | 1,121.3 | $ | 45.7 | $ | 353.8 | $ | 9.0 | $ | 1,529.8 | ||||||
Property and mine development, net |
$ | 4,418.5 | $ | 389.0 | $ | 2,513.6 | $ | 115.3 | $ | 7,436.4 | ||||||
Total assets |
$ | 6,780.4 | $ | 843.5 | $ | 3,828.6 | $ | (58.6 | ) | $ | 11,393.9 | |||||
SALES VALUE PER SEGMENT:
| |
Year Ended December 31, 2016 | |
||||||||||||||
|---|---|---|---|---|---|---|---|---|---|---|---|---|---|---|---|---|
(in millions)
|
Mexican Open-pit |
Mexican IMMSA Unit |
Peruvian Operations |
Corporate, Other & Eliminations |
Total Consolidated |
|||||||||||
Copper |
$ | 2,663.1 | $ | 32.0 | $ | 1,557.7 | $ | (32.0 | ) | $ | 4,220.8 | |||||
Molybdenum |
144.0 | — | 124.0 | — | 268.0 | |||||||||||
Silver |
182.3 | 82.1 | 61.5 | (31.6 | ) | 294.3 | ||||||||||
Zinc |
— | 234.4 | — | — | 234.4 | |||||||||||
Other |
244.9 | 74.6 | 51.2 | (8.4 | ) | 362.3 | ||||||||||
| | | | | | | | | | | | | | | | | |
Total |
$ | 3,234.3 | $ | 423.1 | $ | 1,794.4 | $ | (72.0 | ) | $ | 5,379.8 | |||||
| | | | | | | | | | | | | | | | | |
| | | | | | | | | | | | | | | | | |
| | | | | | | | | | | | | | | | | |
164
SOUTHERN COPPER CORPORATION AND SUBSIDIARIES
NOTES TO CONSOLIDATED FINANCIAL STATEMENTS (Continued)
NOTE 18—SEGMENT AND RELATED INFORMATION: (Continued)
| |
Year Ended December 31, 2015 | |
||||||||||||||
|---|---|---|---|---|---|---|---|---|---|---|---|---|---|---|---|---|
(in millions)
|
Mexican Open-pit |
Mexican IMMSA Unit |
Peruvian Operations |
Corporate, Other & Eliminations |
Total Consolidated |
|||||||||||
Copper |
$ | 2,237.2 | $ | 30.6 | $ | 1,756.9 | $ | (30.6 | ) | $ | 3,994.1 | |||||
Molybdenum |
109.0 | — | 130.0 | — | 239.0 | |||||||||||
Silver |
129.5 | 66.5 | 57.2 | (26.5 | ) | 226.7 | ||||||||||
Zinc |
— | 210.7 | — | — | 210.7 | |||||||||||
Other |
228.2 | 80.5 | 77.2 | (10.5 | ) | 375.4 | ||||||||||
| | | | | | | | | | | | | | | | | |
Total |
$ | 2,703.9 | $ | 388.3 | $ | 2,021.3 | $ | (67.6 | ) | $ | 5,045.9 | |||||
| | | | | | | | | | | | | | | | | |
| | | | | | | | | | | | | | | | | |
| | | | | | | | | | | | | | | | | |
| |
Year Ended December 31, 2014 | |
||||||||||||||
|---|---|---|---|---|---|---|---|---|---|---|---|---|---|---|---|---|
(in millions)
|
Mexican Open-pit |
Mexican IMMSA Unit |
Peruvian Operations |
Corporate, Other & Eliminations |
Total Consolidated |
|||||||||||
Copper |
$ | 2,380.2 | $ | 46.4 | $ | 2,137.9 | $ | (46.4 | ) | $ | 4,518.1 | |||||
Molybdenum |
299.8 | — | 207.1 | — | 506.9 | |||||||||||
Silver |
146.6 | 88.0 | 71.6 | (33.0 | ) | 273.2 | ||||||||||
Zinc |
— | 209.8 | — | — | 209.8 | |||||||||||
Other |
128.0 | 97.5 | 65.2 | (11.0 | ) | 279.7 | ||||||||||
| | | | | | | | | | | | | | | | | |
Total |
$ | 2,954.6 | $ | 441.7 | $ | 2,481.8 | $ | (90.4 | ) | $ | 5,787.7 | |||||
| | | | | | | | | | | | | | | | | |
| | | | | | | | | | | | | | | | | |
| | | | | | | | | | | | | | | | | |
NET SALES AND GEOGRAPHICAL INFORMATION:
Net sales to respective countries for the three years ended December 31, 2016 were as follows:
(in millions)
|
2016 | 2015 | 2014 | |||||||
|---|---|---|---|---|---|---|---|---|---|---|
Mexico |
$ | 1,409.7 | $ | 1,641.0 | $ | 1,708.9 | ||||
United States |
1,050.0 | 862.5 | 1,059.3 | |||||||
Europe |
1,014.9 | 745.1 | 937.5 | |||||||
Japan |
409.8 | 445.9 | 447.8 | |||||||
Singapore |
652.8 | 369.8 | 299.0 | |||||||
Peru |
294.4 | 324.3 | 282.2 | |||||||
Other Asian countries |
185.5 | 189.3 | 187.1 | |||||||
Brazil |
196.0 | 276.4 | 372.4 | |||||||
Chile |
92.4 | 102.0 | 401.5 | |||||||
Other American |
74.3 | 89.6 | 92.0 | |||||||
| | | | | | | | | | | |
Total |
$ | 5,379.8 | $ | 5,045.9 | $ | 5,787.7 | ||||
| | | | | | | | | | | |
| | | | | | | | | | | |
| | | | | | | | | | | |
PROVISIONAL SALES PRICE:
At December 31, 2016, the Company has recorded provisionally priced sales of copper at average forward prices per pound, and molybdenum at the year-end market price per pound. These sales are subject to final pricing based on the average monthly copper prices on the London Metal Exchange ("LME") or New York Commodities Exchange ("COMEX") and Dealer Oxide molybdenum prices in the future month of settlement.
165
SOUTHERN COPPER CORPORATION AND SUBSIDIARIES
NOTES TO CONSOLIDATED FINANCIAL STATEMENTS (Continued)
NOTE 18—SEGMENT AND RELATED INFORMATION: (Continued)
Following are the provisionally priced copper and molybdenum sales outstanding at December 31, 2016:
| |
Sales volume (million lbs.) |
Priced at (per pound) |
Month of settlement | |||||
|---|---|---|---|---|---|---|---|---|
Copper |
81.4 | 2.50 | January through February 2017 | |||||
Molybdenum |
8.1 | 6.69 | January through March 2017 | |||||
Provisional sales price adjustments included in accounts receivable and net sales were as follows at December, 31 (in millions):
| |
At December 31, |
||||||
|---|---|---|---|---|---|---|---|
| |
2016 | 2015 | |||||
Copper |
$ | 6.2 | $ | (6.0 | ) | ||
Molybdenum |
(0.4 | ) | (0.1 | ) | |||
| | | | | | | | |
Total |
$ | 5.8 | $ | (6.1 | ) | ||
| | | | | | | | |
| | | | | | | | |
| | | | | | | | |
Management believes that the final pricing of these sales will not have a material effect on the Company's financial position or results of operations.
LONG-TERM SALES CONTRACTS:
The following are the significant outstanding long-term contracts:
In 2013, a long term copper cathodes sales agreement was signed with Mitsui for five years, with shipments beginning in 2015. Mitsui and the Company will negotiate market terms and conditions for annual contracts no later than November 30 of the year prior to shipment. The contract considers the following annual volumes of copper cathodes; 6,000 tons for 2015 and 48,000 tons for each of the years from 2016 through 2019. The contract volume would increase by 24,000 tons the year after Tia Maria reaches full production capacity. Failure to reach an agreement on market terms would cancel the annual contract but not the long-term agreement. Under the terms of the agreement all shipments would be to Asia and there are no exclusivity rights for Mitsui or commissions included. This contract may be renewed for additional five year periods, upon the agreement of both parties.
Under the terms of a sales contract with Molibdenos y Metales, S.A., SPCC Peru Branch is required to supply approximately 29,380 tons of molybdenum concentrates from 2016 through 2018. This contract may be extended for one more calendar year during each October to maintain a three year period unless either party decides to terminate the agreement. The sale price of the molybdenum concentrates is based on the monthly average of the high and low Metals Week Dealer Oxide quotation. The roasting charge deduction is agreed based on international market terms.
Under the terms of a sales contract with Molymex, S.A. de C.V., Operadora de Minas de Nacozari, S.A. de C.V. and Operadora de Minas e Instalaciones Mineras, S.A. de C. V. are required to supply at least the 80% of their molybdenum concentrates production from 2016 through 2019. The sale price of the molybdenum concentrate is based on the monthly average of the high and low Metals Week Dealer Oxide quotation. The roasting charge deduction is negotiated based on international market terms.
166
SOUTHERN COPPER CORPORATION AND SUBSIDIARIES
NOTES TO CONSOLIDATED FINANCIAL STATEMENTS (Continued)
NOTE 19—QUARTERLY DATA (unaudited)
(in millions, except per share data)
| |
2016 | |||||||||||||||
|---|---|---|---|---|---|---|---|---|---|---|---|---|---|---|---|---|
| |
1st | 2nd | 3rd | 4th | Year | |||||||||||
Net sales |
$ | 1,245.1 | $ | 1,335.1 | $ | 1,400.7 | $ | 1,398.9 | $ | 5,379.8 | ||||||
Gross profit(1) |
$ | 382.9 | $ | 419.0 | $ | 394.7 | $ | 502.0 | $ | 1,698.6 | ||||||
Operating income |
$ | 346.2 | $ | 385.1 | $ | 362.4 | $ | 470.5 | $ | 1,564.2 | ||||||
Net income |
$ | 185.7 | $ | 222.6 | $ | 198.2 | $ | 172.3 | $ | 778.8 | ||||||
Net income attributable to SCC |
$ | 185.1 | $ | 221.9 | $ | 197.6 | $ | 171.9 | $ | 776.5 | ||||||
Per share amounts attributable to SCC: |
||||||||||||||||
Net earnings basic and diluted |
$ | 0.23 | $ | 0.29 | $ | 0.26 | $ | 0.22 | $ | 1.00 | ||||||
Dividend per share |
$ | 0.03 | $ | 0.05 | $ | 0.05 | $ | 0.05 | $ | 0.18 | ||||||
| |
2015 | |||||||||||||||
|---|---|---|---|---|---|---|---|---|---|---|---|---|---|---|---|---|
| |
1st | 2nd | 3rd | 4th | Year | |||||||||||
Net sales |
$ | 1,274.8 | $ | 1,382.9 | $ | 1,133.6 | $ | 1,254.6 | $ | 5,045.9 | ||||||
Gross profit(1) |
$ | 478.0 | $ | 550.7 | $ | 331.3 | $ | 247.6 | $ | 1,607.6 | ||||||
Operating income |
$ | 436.9 | $ | 503.1 | $ | 286.9 | $ | 187.5 | $ | 1,414.4 | ||||||
Net income |
$ | 283.7 | $ | 296.0 | $ | 99.4 | $ | 62.0 | $ | 741.1 | ||||||
Net income attributable to SCC |
$ | 282.4 | $ | 294.7 | $ | 98.4 | $ | 60.9 | $ | 736.4 | ||||||
Per share amounts attributable to SCC: |
||||||||||||||||
Net earnings basic and diluted |
$ | 0.35 | $ | 0.37 | $ | 0.12 | $ | 0.09 | $ | 0.93 | ||||||
Dividend per share |
$ | 0.10 | $ | 0.10 | $ | 0.10 | $ | 0.04 | $ | 0.34 | ||||||
- (1)
- Gross profit is the result of net sales less cost of sales (excluding depreciation, amortization and depletion) and less depreciation, amortization and depletion.
NOTE 20—RESTRUCTURING PLAN:
In 2016, the Company conducted a restructuring plan with the overall goal to improve its sustainable earnings potential, asset utilization and operational performance. The plan implementation began in the first quarter of 2016 and concluded by the end of the third quarter of 2016. The plan focused on achieving the appropriate administrative workforce size, skill requirements, changes in management structure and consolidating functions for efficiency, including staff location and/or relocation. The plan was developed and managed by senior management of the Company's majority shareholder, with assistance from an independent consulting group and was implemented in stages as functional areas of the Company were reviewed.
The total cost of the plan was $6.9 million which was included in selling, general and administrative expenses. As part of the plan, 231 employees, located in Peru and Mexico, accepted the severance package offered by the Company.
NOTE 21—SUBSEQUENT EVENTS
DIVIDENDS:
On January 26, 2017, the Board of Directors authorized a dividend of $0.08 per share payable on February 28, 2017, to shareholders of record at the close of business on February 14, 2017.
167
SOUTHERN COPPER CORPORATION AND SUBSIDIARIES
NOTES TO CONSOLIDATED FINANCIAL STATEMENTS (Continued)
NOTE 21—SUBSEQUENT EVENTS (Continued)
ENVIRONMENTAL MATTERS—MEXICAN OPERATIONS:
On January 26, 2017, PROFEPA issued its final resolution related to the accidental spill that occurred in the Sonora River in 2014 under which it declared all mitigation actions as complete and its investigation procedure is definitely closed. On February 7, 2017, the Company proceeded to close the trust created with the purpose of complying with all remediation activities.
168
OTHER COMPANY INFORMATION:
ANNUAL MEETING
The annual stockholders meeting of Southern Copper Corporation will be held on Thursday, April 27, 2017, at 9:00 am, Mexico City time, at Edificio Parque Reforma, Campos Eliseos No. 400, 9th Floor, Colonia Lomas de Chapultepec, Mexico City, Mexico.
TRANSFER AGENT, REGISTRAR AND STOCKHOLDERS' SERVICES
Computershare
480 Washington Boulevard
Jersey City, NJ 07310-1900
Phone: (866)230-0172
DIVIDEND REINVESTMENT PROGRAM
SCC stockholders can have their dividends automatically reinvested in SCC common shares. SCC pays all administrative and brokerage fees. This plan is administered by Computershare. For more information, contact Computershare at (866)230-0172.
STOCK EXCHANGE LISTING
The principal markets for SCC's common stock are the NYSE and the Lima Stock Exchange. SCC's common stock symbol is SCCO on both the NYSE and the Lima Stock Exchange.
OTHER SECURITIES
The Branch in Peru has issued, in accordance with Peruvian Law, "investment shares" (formerly named labor shares) that are quoted on the Lima Stock Exchange under symbols SPCCPI1 and SPCCPI2. Transfer Agent, registrar and stockholders services are provided by Credicorp Capital, Avenida EI Derby 055, Torre 4, Piso 10, Santiago de Surco, Lima 33, Peru. Telephone (51-1)416-3333, Extensions 32478 and 32441.
OTHER CORPORATE INFORMATION
For other information on the Company or to obtain, free of charge, additional copies of the Annual Report on Form 10-K, contact the Investor Relations Department at:
1440
East Missouri Avenue, Suite 160 Phoenix, Az. 85014, USA
Telephone: (602)264-1375
SOUTHERN COPPER CORPORATION
USA
1440 East Missouri Ave, Suite 160
Phoenix, AZ 85014, U. S. A.
Phone: (602) 264-1375
Fax: (602) 264-1397
169
Mexico
Campos Eliseos N° 400
Colonia Lomas de Chapultepec
Delegacion Miguel Hidalgo
C.P. 11000—MEXICO
Phone: (5255) 1103-5000
Fax: (5255) 1103-5567
Peru
Av. Caminos del Inca 171
Urb. Chacarilla del Estanque
Santiago de Surco
Lima 33—PERU
Phone: (511) 512-0440 Ext 3181
Fax: (511) 512-0492
Website: www.southerncoppercorp.com
Email address: southerncopper@southernperu.com.pe
170
ITEM 9. CHANGES IN AND DISAGREEMENTS WITH ACCOUNT ON ACCOUNTING AND FINANCIAL DISCLOSURE
None
ITEM 9A. CONTROLS AND PROCEDURES
As of December 31, 2016, the Company conducted an evaluation under the supervision and with the participation of the Company's disclosure committee and the Company's management, including the Chief Executive Officer and Chief Financial Officer, of the effectiveness and the design and operation of the Company's disclosure controls and procedures (as defined in Exchange Act Rules 13a-15(e) and 15d-15(e). Based on that evaluation, the Chief Executive Officer and the Chief Financial Officer have concluded that the Company's disclosure controls and procedures are effective as of December 31, 2016, to ensure that information required to be disclosed in reports filed or submitted under the Exchange Act is:
- 1.
- Recorded,
processed, summarized and reported within the time periods specified in the SEC's rules and forms, and
- 2.
- Accumulated and communicated to management, including the Chief Executive Officer and Chief Financial Officer, as appropriate, to allow timely decisions regarding required disclosure.
CHANGES IN INTERNAL CONTROL OVER FINANCIAL REPORTING
There were no changes in the Company's internal control over financial reporting (as such term is defined in Rules 13a-15(f) and 15d-15(f) under the Securities Exchange Act of 1934, as amended) that occurred during the fourth quarter ended December 31,2016 that have materially affected, or are reasonably likely to materially affect, the Company's internal controls over financial reporting,
MANAGEMENT'S REPORT ON INTERNAL CONTROL OVER FINANCIAL REPORTING
Management is responsible for establishing and maintaining adequate internal control over financial reporting (as defined in Exchange Act Rules 13a-15(f) and 15d-15(f)) for the Company.
Because of its inherent limitations, internal control over financial reporting may not prevent or detect misstatements. Also, projections of any evaluation of effectiveness for future periods are subject to the risk that controls may become inadequate because of changes in conditions, or that the degree of compliance with policies or procedures may deteriorate.
Under the supervision and with the participation of the Company's management, including the Chief Executive Officer and Chief Financial Officer, the Company conducted an evaluation of the effectiveness of its internal control over financial reporting based on the framework in Internal Control-Integrated Framework (2013) issued by the Committee of Sponsoring Organization of the Treadway Commission. Based on the evaluation made under this framework, management concluded that as of December 31, 2016 such internal control over financial reporting is effective.
Our internal control over financial reporting as of December 31, 2016 has been audited by Galaz, Yamazaki, Ruiz Urquiza, S.C. member of Deloitte Touche Tohmatsu Limited, an independent registered public accounting firm, as stated in their report which is provided below.
171
REPORT OF INDEPENDENT REGISTERED PUBLIC ACCOUNTING FIRM
To the Board of Directors and Stockholders of Southern Copper Corporation
We have audited the internal control over financial reporting of Southern Copper Corporation and subsidiaries (the "Company") as of December 31, 2016, based on criteria established in Internal Control—Integrated Framework (2013) issued by the Committee of Sponsoring Organizations of the Treadway Commission. The Company's management is responsible for maintaining effective internal control over financial reporting and for its assessment of the effectiveness of internal control over financial reporting, included in the accompanying "Management's Report on Internal Control over Financial Reporting" appearing in Item 9A. Our responsibility is to express an opinion on the Company's internal control over financial reporting based on our audit.
We conducted our audit in accordance with the standards of the Public Company Accounting Oversight Board (United States). Those standards require that we plan and perform the audit to obtain reasonable assurance about whether effective internal control over financial reporting was maintained in all material respects. Our audit included obtaining an understanding of internal control over financial reporting, assessing the risk that a material weakness exists, testing and evaluating the design and operating effectiveness of internal control based on the assessed risk, and performing such other procedures as we considered necessary in the circumstances. We believe that our audit provides a reasonable basis for our opinion.
A Company's internal control over financial reporting is a process designed by, or under the supervision of, the Company's principal executive and principal financial officers, or persons performing similar functions, and effected by the Company's Board of Directors, management, and other personnel to provide reasonable assurance regarding the reliability of financial reporting and the preparation of financial statements for external purposes in accordance with generally accepted accounting principles. A Company's internal control over financial reporting includes those policies and procedures that (1) pertain to the maintenance of records that, in reasonable detail, accurately and fairly reflect the transactions and dispositions of the assets of the Company; (2) provide reasonable assurance that transactions are recorded as necessary to permit preparation of financial statements in accordance with generally accepted accounting principles, and that receipts and expenditures of the Company are being made only in accordance with authorizations of management and directors of the Company; and (3) provide reasonable assurance regarding prevention or timely detection of unauthorized acquisition, use, or disposition of the Company's assets that could have a material effect on the financial statements.
Because of the inherent limitations of internal control over financial reporting, including the possibility of collusion or improper management override of controls, material misstatements due to error or fraud may not be prevented or detected on a timely basis. Also, projections of any evaluation of the effectiveness of the internal control over financial reporting to future periods are subject to the risk that the controls may become inadequate because of changes in conditions, or that the degree of compliance with the policies or procedures may deteriorate.
In our opinion, the Company maintained, in all material respects, effective internal control over financial reporting as of December 31, 2016, based on the criteria established in Internal Control—Integrated Framework (2013) issued by the Committee of Sponsoring Organizations of the Treadway Commission.
We have also audited, in accordance with the standards of the Public Company Accounting Oversight Board (United States), the consolidated financial statements and financial statement schedule as of and for the year ended December 31, 2016 of the Company and our report dated March 1, 2017 expressed an unqualified opinion on those financial statements and financial statement schedule.
Galaz,
Yamazaki, Ruiz Urquiza S.C.
Member de Deloitte Touche Tohmatsu Limited
C.P.C.
Miguel Angel Andrade Leven
Mexico City, Mexico
March 1, 2017
172
As previously reported, in 2012, the Company received approximately $2.1 billion from AMC in satisfaction of the judgment issued pursuant to the decision of the Court of Chancery of Delaware, which concluded that the Company paid an excessive price to AMC in the 2005 merger between the Company and Minera Mexico, S.A. de C.V. (the 2012 Judgment). For U.S. financial and tax reporting purposes, the payment was included as additional paid-in capital on the balance sheet of the Company, which resulted in no taxable income for the Company.
The U.S. Internal Revenue Service (IRS) is currently auditing AMC's 2012 consolidated income tax return, which includes the results of the Company. The Company's and AMC's representatives are discussing with the IRS certain questions relating to potential adjustments to the Company's and AMC's payments pursuant to the 2012 Judgment. The Company and AMC believe that the Company and the consolidated group properly recorded the payments made to, and received by, the Company. If the matter cannot be resolved during the IRS examination process, AMC intents to contest any such adjustments vigorously.
On, February 28, 2017, AMC and the Company entered into a tax agreement (the Tax Agreement), effective as of February 20, 2017, pursuant to which AMC, as the parent of the consolidated group of which the Company is a member and joins in the filing of a U.S. federal income tax return, (a) will be responsible for and discharge, any and all liabilities and payments due to the IRS on account of any incremental tax liabilities of the Company in connection with the potential adjustments being considered by the IRS in connection with the interest of the 2012 Judgment, (b) will not seek reimbursement, contribution or collection of any amounts of money or any other asset in connection therewith from the Company, and (c) will indemnify, defend and hold harmless the Company from any such liability, including the cost of such defense.
For additional information, see Note 8 "Income Taxes" on Item 8 to the Financial Statements and Supplemental Data.
ITEM 10, 11, 12, 13 AND 14
EXECUTIVE OFFICERS OF THE REGISTRANT
Set forth below are the executive officers of the Company, their ages as of January 31, 2017 and their positions.
Name
|
Age | Position | |||
|---|---|---|---|---|---|
German Larrea Mota-Velasco |
63 | Chairman of the Board and Director | |||
Oscar Gonzalez Rocha |
78 | President, Chief Executive Officer and Director | |||
Daniel Muñiz Quintanilla |
43 | Executive Vice President | |||
Raul Jacob Ruisanchez |
58 | Vice President, Finance, Treasurer and Chief Financial Officer | |||
Julian Jorge Lazalde Psihas |
48 | Secretary | |||
Andres Carlos Ferrero Ghislieri |
48 | General Counsel | |||
Lina Vingerhoets Vilca |
55 | Comptroller | |||
Edgard Corrales Aguilar |
61 | Vice President, Exploration | |||
Rafael Lopez Abad |
53 | General Auditor | |||
German Larrea Mota-Velasco has served as our Chairman of the Board since December 1999, Chief Executive Officer from December 1999 to October 2004 and as a member of our Board of Directors since November 1999. He has been Chairman of the board of directors, President and Chief
173
Executive Officer of Grupo Mexico (holding) since 1994. Mr. Larrea has been Chairman of the board of directors and Chief Executive Officer of Grupo Ferroviario Mexicano S.A. de C.V (railroad company) since 1997. Mr. Larrea was previously Executive Vice Chairman of Grupo Mexico and has been a member of the board of directors since 1981. He is also Chairman of the board of directors and Chief Executive Officer of Empresarios Industriales de Mexico, S.A. de C.V. (holding) and Fondo Inmobiliario (real estate company), since 1992. He founded Grupo Impresa, a printing and publishing company in 1978, remaining as the Chairman and Chief Executive Officer until 1989 when the company was sold. He is a director of the Consejo Mexicano de Negocios since 1999, was a director of Banco Nacional de Mexico, S.A. (Citigroup) from 1992 to 2015 and Grupo Televisa, S.A.B. from 1999 to 2014.
Oscar Gonzalez Rocha has served as our President since December 1999 and our President and Chief Executive Officer since October 21, 2004. He has been our Director since November 1999. Mr. Gonzalez Rocha has been the President and Chief Executive Officer of Americas Mining Corporation since November 1, 2014 and the Chief Executive Officer and a director of Asarco LLC (integrated US copper producer), an affiliate of the Company, since August 2010. Previously, he was our President and General Director and Chief Operating Officer from December 1999 to October 20, 2004. He has been a director of Grupo Mexico since 2002. He was General Director of Mexicana de Cobre, S.A. de C.V. from 1986 to 1999 and of Buenavista del Cobre S.A. de C.V. (formerly Mexicana de Cananea, S.A. de C.V.) from 1990 to 1999. He was an alternate director of Grupo Mexico from 1988 to April 2002. Mr. Gonzalez Rocha is a civil engineer with a degree from the Autonomous National University of Mexico ("UNAM") in Mexico City, Mexico.
Daniel Muñiz Quintanilla has been a Director of the Company since May 28, 2008. Effective April 28, 2016, he was elected to hold the office of Executive Vice President of the Company. Mr. Muñiz has been the Chief Financial Officer of Grupo Mexico since April 2007. Prior to joining Grupo Mexico, Mr. Muñiz was a practicing corporate-finance lawyer from 1996 to 2006. During this time he worked at Cortés, Muñiz y Núñez Sarrapy; Mijares, Angoitia, Cortés y Fuentes; and Baker & McKenzie (London and Mexico City offices). He holds a Master's degree in Financial Law from Georgetown University Law Center in Washington D.C., and a Master's degree in Business Administration from Instituto de Empresa in Madrid, Spain.
Raul Jacob Ruisanchez has served as our Vice President, Finance and Chief Financial Officer since April 18, 2013. He was appointed Treasurer of the Company on April 28, 2016. He was our Comptroller from October 27, 2011 until April 18, 2013. He has held various positions focused primarily in financial planning, treasury, corporate finance, investor relations and project evaluation with the Company since 1992. In September 2011, he was appointed Director of Controller and Finance of the Company's Peruvian Branch and Vice President and Chief Financial Officer of Southern Peru Limited, one of our subsidiaries. In 2016 and 2014, Mr. Jacob was considered by Institutional Investor among the top three Chief Financial Officers of the mining industry of Latin America. In 2010, he was ranked among the top three Investor Relations executives of the mining industry of Latin America by the same publication. He is also Vice President of the Peruvian National Mining, Oil and Energy Association and President of its mining chapter. He is currently a member of the consulting board of the MBA program (Finance) of the Universidad del Pacifico in Lima, Peru. Until March of 2010, he was President of the Strategic Studies Center of IPAE, an entrepreneurial association. Between 2004 and 2006, he was the President of the Finance Affairs Committee of the American Chamber of Commerce of Peru. Mr. Jacob holds an economics degree from Universidad del Pacifico, a Master's Degree from the University of Texas (Austin) and a Degree in International Business Management from the Stockholm School of Economics.
Julian Jorge Lazalde Psihas, our newly elected Secretary, has been a Director, Executive Vice President and General Counsel of Asarco LLC since December 2009. Since October 2015 he is also General Counsel of Americas Mining Corporation, both subsidiaries of Grupo Mexico, S.A.B. de C.V., the parent company of the Company. Mr. Lazalde was General Counsel of Asarco Inc., the predecessor
174
of Asarco LLC, from September 2006 until December 2009. Mr. Lazalde holds a law degree from the Autonomous Institute of Mexico, known as ITAM, and has degrees from the Panamerican University in two special areas, tax law and commercial law.
Andres Carlos Ferrero Ghislieri, our new General Counsel, has been a member of the Legal Department of our Peruvian Branch since December 1995. Prior to this, he served as a Technical Advisor to the World Bank's Energy and Mines Technical Assistance Loan (EMTAL) Project assigned to the National Society of Mining, Energy and Petroleum. He was elected Superintendent of the Legal Affairs of the Peruvian Branch in March 2008. He holds a law degree from the University of Lima, Peru and a Master of Law or LLM degree in Resources Law and Policy from Dundee University, United Kingdom.
Lina Vingerhoets Vilca, our new Comptroller, has been the Assistant Comptroller of the Company since April 2015 and Controller of the Peruvian Branch of the Company since July 2015. Ms. Vingerhoets has worked for the Company's Peruvian Branch in various capacities since 1991. From 2013 to 2015, she was in charge of Internal Control. From 2006 to 2015, she was in charge of Accounting Quality and SEC reporting. In addition, she has held other positions in Financial Planning, Finance and Accounting with the Company's Peruvian Branch. Ms. Vingerhoets is a Peruvian certified public accountant and holds Accounting and MBA degrees from the Universidad del Pacifico, in Lima, Peru.
Edgard Corrales Aguilar has served as Vice President, Exploration since July 18, 2013. Mr. Corrales replaces Mr. Remigio Martinez, who was the Corporation's Vice President, Exploration from April 2002 to his retirement in July 2013. Mr. Corrales has been working with the Peruvian Branch of SCC since 1983 in various positions, including as senior geologist of the Toquepala mine, head of the geology department of the Cuajone mine and manager of the exploration department of the Peruvian Branch of SCC. Currently he is Exploration Director of the Peruvian Branch of SCC and general manager of SCC's Branch in Chile. Mr. Corrales has a degree in geology and engineering from the Universidad Nacional San Agustin, Arequipa, Peru and has followed specialized studies at the Catholic University of Caracas, Venezuela and the MacKay School of Mines at the University of Reno, Nevada. He has also completed extensive studies in management at various universities in Peru.
Rafael Lopez Abad, our new General Auditor, with 30 years of auditing experience, has been the Manager of Internal Audit of the Peruvian Branch of the Company since September 1994. Previously he was an auditor for PricewaterhouseCooper and Ernst &Young. Mr. López Abad is a Peruvian certified public accountant with a degree from the University of Saint Martin of Porres, in Lima, Peru. He holds a Master's degree in Communication Science, or MSC, from the Peruvian National Engineering University, School of Mining Engineering and a post-graduate degree from the Superior School for Business Management, known as ESAN, today "Universidad ESAN". He teaches internal auditing post-graduate courses in various prestigious universities in Lima, Peru.
Information in response to the additional disclosure requirements specified by Part III, Items 10, 11, 12, 13 and 14 will be included in a definitive proxy statement, which will be filed pursuant to Regulation 14A of the 1934 Securities Exchange Act, as amended, prior to April 30, 2017, or will be provided by amendment to this Form 10-K, also to be filed no later than April 30, 2017.
The information contained in such definitive proxy statement is incorporated herein by reference, excluding the information under the caption "Compensation Committee Report," which shall not be deemed filed.
175
ITEM 15. EXHIBITS, FINANCIAL STATEMENTS, SCHEDULE.
The following documents are filed as part of this report:
- 1.
- Financial Statements
The following financial statements of Southern Copper Corporation and its subsidiaries are included at the indicated pages of the document as stated below:
- 2.
- Exhibits:
3.1 |
(a) Amended and Restated Certificate of Incorporation, filed on October 11, 2005. (b) Certificate of Amendment of Amended and Restated Certificate of Incorporation dated May 2, 2006. (c) Certificate of Amendment of Amended and Restated Certificate of Incorporation dated May 28, 2008. |
||
3.2 |
By-Laws, as last amended on January 27, 2011. |
||
4.1 |
Indenture governing $200 million 6.375% Notes due 2015, by and among Southern Copper Corporation, The Bank of New York and The Bank of New York (Luxembourg) S.A. |
||
4.2 |
(a) Indenture governing $600 million 7.500% Notes due 2035, by and among Southern Copper Corporation, The Bank of New York and The Bank of New York (Luxembourg) S.A. (b) Indenture governing $400 million 7.500% Notes due 2035, by and among Southern Copper Corporation, The Bank of New York, and The Bank of New York (Luxembourg) S.A. |
||
4.3 |
Form of 6.375% Note (included in Exhibit 4.1). |
||
4.4 |
Form of New 7.500% Note (included in Exhibit 4.2(a)). |
||
4.5 |
Form of New 7.500% Note (included in Exhibit 4.2(b)). |
||
4.6 |
Indenture, dated as of April 16, 2010, between Southern Copper Corporation and Wells Fargo Bank, National Association, as trustee, pursuant to which $400 million of 5.375% Notes due 2020 and $1.1 billion of 6.750% Notes due 2040 were issued. |
176
| 4.7 | First Supplemental Indenture, dated as of April 16, 2010, between Southern Copper Corporation and Wells Fargo Bank, National Association, as trustee, pursuant to which the 5.375% Notes due 2020 were issued. | ||
4.8 |
Second Supplemental Indenture, dated as of April 16, 2010, between Southern Copper Corporation and Wells Fargo Bank, National Association, as trustee, pursuant to which the 6.750% Notes due 2040 were issued. |
||
4.9 |
Form of 5.375% Notes due 2020. |
||
4.10 |
Form of 6.750% Notes due 2040. |
||
4.11 |
Third Supplemental Indenture, dated as of November 8, 2012, between Southern Copper Corporation and Wells Fargo Bank, National Association, as trustee, pursuant to which the 3.500% Notes due 2022 were issued. |
||
4.12 |
Fourth Supplemental Indenture, dated as of November 8, 2012, between Southern Copper Corporation and Wells Fargo Bank, National Association, as trustee, pursuant to which the 5.250% Notes due 2042 were issued. |
||
4.13 |
Form of 3.500% Notes due 2022. |
||
4.14 |
Form of 5.250% Notes due 2042. |
||
4.15 |
Fifth Supplemental Indenture dated as of April 23, 2015, between Southern Copper Corporation and Wells Fargo Bank, National Association, as trustee, pursuant to which the 3.875% Notes due 2025 were issued. |
||
4.16 |
Sixth Supplemental Indenture, dated as of April 23, 2015, between Southern Copper Corporation and Wells Fargo Bank, National Association, as trustee, pursuant to which the 5.875% Notes due 2045 were issued. |
||
4.17 |
Form of 3.875% Notes due 2025. |
||
4.18 |
Form of 5.875% Notes due 2045. |
||
10.1 |
Directors' Stock Award Plan of the Company, as amended through January 30, 2017. |
||
10.2 |
Service Agreement entered into by the Company with a subsidiary of Grupo Mexico S.A.B. de C.V., assigned upon the same terms and conditions to Grupo Mexico S.A.B. de C.V. in February 2004. |
||
10.3 |
Agreement and Plan of Merger, dated as of October 21, 2004, by and among Southern Copper Corporation, SCC Merger Sub, Inc., Americas Sales Company, Inc., Americas Mining Corporation and Minera Mexico S.A. de C.V. |
||
12.1 |
Computation of financial ratios. |
||
14.0 |
Code of Business Conduct and Ethics adopted by the Board of Directors on May 8, 2003 and amended on April 23, 2015. |
||
21.1 |
Subsidiaries of the Company. |
||
23.1 |
Consent of Registered Public Accounting Firm (Galaz, Yamazaki, Ruiz Urquiza, S.C., Member of Deloitte Touche Tohmatsu, Limited). |
||
31.1 |
Certification Pursuant to Section 302 of the Sarbanes-Oxley Act of 2002. |
||
31.2 |
Certification Pursuant to Section 302 of the Sarbanes-Oxley Act of 2002. |
177
| 32.1 | Certification Pursuant to Section 906 of the Sarbanes-Oxley Act of 2002, 18 U.S.C., Section 1350. This document is being furnished in accordance with SEC Release No. 33-8328. | ||
32.2 |
Certification Pursuant to Section 906 of the Sarbanes-Oxley Act of 2002, 18 U.S.C., Section 1350. This document is being furnished in accordance with SEC Release No. 33-8328. |
||
101.INS |
XBRL Instance Document (submitted electronically with this report). |
||
101.SCH |
XBRL Taxonomy Extension Schema Document (submitted electronically with this report). |
||
101.CAL |
XBRL Taxonomy Calculation Linkbase Document (submitted electronically with this report). |
||
101.DEF |
XBRL Taxonomy Extension Definition Linkbase Document (submitted electronically with this report). |
||
101.LAB |
XBRL Taxonomy Label Linkbase Document (submitted electronically with this report). |
||
101.PRE |
XBRL Taxonomy Presentation Linkbase Document (submitted electronically with this report). |
The exhibit listed as 10.1 is the management contract or compensatory plan or arrangement required to be filed pursuant to Item 15(b) of Form 10-K.
Attached as Exhibit 101 to this report are the following documents formatted in XBRL (Extensible Business Reporting Language): (i) the Consolidated Statements of Earnings for the years ended December 31, 2016, 2015 and 2014; (ii) the Consolidated Statements of Comprehensive Income for the years ended December 31, 2016, 2015 and 2014; (iii) the Consolidated Balance Sheets at December 31, 2016 and 2015; (iv) the Consolidated Statements of Cash Flows for the years ended December 31, 2016, 2015 and 2014; (v) the Consolidated Statements of changes in equity for the years ended December 31, 2016, 2015 and 2014, and (vi) the Notes to Consolidated Financial Statements tagged in detail. Users of this data are advised pursuant to Rule 406T of Regulation S-T that this interactive data file is deemed not filed or part of a registration statement or prospectus for purposes of sections 11 or 12 of the Securities Act of 1933, is deemed not filed for purposes of section 18 of the Securities Exchange Act of 1934, and otherwise is not subject to liability under these sections.
178
- 3.
- Schedule II
Valuation and Qualifying Accounts and Reserves (in millions):
| |
Additions | |||||||||||||||
|---|---|---|---|---|---|---|---|---|---|---|---|---|---|---|---|---|
| |
Balance at beginning of period |
Charged to costs and expenses |
Additions | Deduction/ Application |
Balance at end of period |
|||||||||||
Reserve deducted in balance sheet to which applicable: |
||||||||||||||||
Accounts Receivable: |
||||||||||||||||
2016 |
$ | 0.9 | — | — | 0.2 | $ | 0.7 | |||||||||
2015 |
$ | 0.3 | 0.6 | — | — | $ | 0.9 | |||||||||
2014 |
$ | 0.3 | — | — | — | $ | 0.3 | |||||||||
Notes issued under par: |
||||||||||||||||
2016 |
$ | 63.8 | 1.6 | — | — | $ | 62.2 | |||||||||
2015 |
$ | 45.1 | 1.5 | 20.2 | — | $ | 63.8 | |||||||||
2014 |
$ | 46.2 | 1.1 | — | — | $ | 45.1 | |||||||||
179
Pursuant to the requirements of Section 13 or 15(d) of the Securities Exchange Act of 1934, as amended, the Registrant has duly caused this Report on Form 10-K to be signed on its behalf by the undersigned, thereunto duly authorized.
| SOUTHERN COPPER CORPORATION | ||||
| (Registrant) | ||||
By: |
/s/ OSCAR GONZALEZ ROCHA Oscar Gonzalez Rocha President and Chief Executive Officer |
|||
Date: March 1, 2017
Pursuant to requirements of the Securities Exchange Act of 1934, this Report on Form 10-K has been signed below by the following persons on behalf of the Registrant and in the capacities and on the dates indicated.
| /s/ GERMAN LARREA MOTA-VELASCO German Larrea Mota-Velasco |
Chairman of the Board, and Director | |
/s/ OSCAR GONZALEZ ROCHA Oscar Gonzalez Rocha |
President, Chief Executive Officer and Director |
|
/s/ RAUL JACOB RUISANCHEZ Raul Jacob Ruisanchez |
Vice President, Finance, Chief Financial Officer (Principal Financial Officer) |
|
/s/ LINA A. VINGERHOETS VILCA Lina A. Vingerhoets Vilca |
Comptroller (Principal Accounting Officer) |
180
| /s/ GERMAN LARREA MOTA-VELASCO German Larrea Mota-Velasco |
/s/ OSCAR GONZALEZ ROCHA Oscar Gonzalez Rocha |
|
/s/ EMILIO CARRILLO GAMBOA Emilio Carrillo Gamboa |
/s/ DANIEL MUÑIZ QUINTANILLA Daniel Muñiz Quintanilla |
|
/s/ ALFREDO CASAR PEREZ Alfredo Casar Perez |
/s/ L. MIGUEL PALOMINO BONILLA L. Miguel Palomino Bonilla |
|
/s/ GILBERTO PEREZALONSO CIFUENTES Gilberto Perezalonso Cifuentes |
/s/ ENRIQUE CASTILLO SANCHEZ MEJORADA Enrique Castillo Sanchez Mejorada |
|
/s/ CARLOS RUIZ SACRISTAN Carlos Ruiz Sacristan |
/s/ XAVIER GARCIA DE QUEVEDO Xavier Garcia de Quevedo |
Date: March 1, 2017
181
Supplemental information
Southern Copper Corporation
Exhibit Index
| Sequential Exhibit Number |
Document Description | Page Number |
|||||
|---|---|---|---|---|---|---|---|
| 3.1 | (a) Amended and Restated Certificate of Incorporation, filed on October 11, 2005. (Filed as Exhibit 3.1 to the Company's Quarterly Report on Form 10-Q for the third quarter of 2005 and incorporated herein by reference). | ||||||
(b) Certificate of Amendment of Amended and Restated Certificate of Incorporation dated May 2, 2006. (Filed as Exhibit 3.1 to Registration Statement on Form S-4, File No. 333-135170, filed on June 20, 2006 and incorporated herein by reference). |
|||||||
(c) Certificate of Amendment of Amended and Restated Certificate of Incorporation dated May 28, 2008. (Filed as Exhibit 3.1 to the Company's Quarterly Report on Form 10-Q for the second quarter of 2008 and incorporated herein by reference). |
|||||||
3.2 |
By-Laws, as last amended on January 27, 2011. (Filed as Exhibit 3.2 to the Company's 2010 Annual Report on Form 10-K and incorporated herein by reference). |
||||||
4.1 |
Indenture governing $200 million 6.375% Notes due 2015, by and among Southern Copper Corporation, The Bank of New York and The Bank of New York (Luxembourg) S.A. (Filed as Exhibit 4.1 to the Company's Current Report on Form 8-K filed on August 1, 2005 and incorporated by reference). |
||||||
4.2 |
(a) Indenture governing $600 million 7.500% Notes due 2035, by and among Southern Copper Corporation, The Bank of New York and The Bank of New York (Luxembourg) S.A. (Filed as Exhibit 4.2 to the Company's Current Report on Form 8-K filed on August 1, 2005 and incorporated herein by reference). |
||||||
(b) Indenture governing $400 million 7.500% Notes due 2035, by and among Southern Copper Corporation, The Bank of New York, and The Bank of New York (Luxembourg) S.A. (Filed as Exhibit 4.2 to the Company's Current Report on Form 8-K filed on August 1, 2005 and incorporated herein by reference). |
|||||||
4.3 |
Form of 6.375% Note (included in exhibit 4.1). |
||||||
4.4 |
Form of New 7.500% Note (included in Exhibit 4.2(a)). |
||||||
4.5 |
Form of New 7.500% Note (included in Exhibit 4.2(b)) |
||||||
4.6 |
Indenture, dated as of April 16, 2010, between Southern Copper Corporation and Wells Fargo Bank, National Association, as trustee, pursuant to which $400 million of 5.375% Notes due 2020 and $1.1 billion of 6.750% Notes due 2040 were issued. (Filed as Exhibit 4.1 to the Company's Current Report on Form 8-K filed on April 19, 2010 and incorporated herein by reference). |
||||||
182
| Sequential Exhibit Number |
Document Description | Page Number |
|||||
|---|---|---|---|---|---|---|---|
| 4.7 | First Supplemental Indenture dated as of April 16, 2010, between Southern Copper Corporation and Wells Fargo Bank, National Association, as trustee, pursuant to which the 5.375% Notes due 2020 were issued (Filed as an Exhibit to the Company's Current Report on Form 8-K filed on April 19, 2010 and incorporated herein by reference). | ||||||
4.8 |
Second Supplemental Indenture, dated as of April 16, 2010, between Southern Copper Corporation and Wells Fargo Bank, National Association, as trustee, pursuant to which the 6.750% Notes due 2040 were issued. (Filed as an Exhibit to the Company's Current Report on Form 8-K filed on April 19, 2010 and incorporated herein by reference). |
||||||
4.9 |
Form of 5.375% Notes due 2020. (Filed as an Exhibit to the Company's Current Report on Form 8-K filed on April 19, 2010 and incorporated herein by reference). |
||||||
4.10 |
Form of 6.750% Notes due 2040. (Filed as an Exhibit to the Company's Current Report on Form 8-K filed on April 19, 2010 and incorporated herein by reference). |
||||||
4.11 |
Third Supplemental Indenture, dated as of November 8, 2012, between Southern Copper Corporation and Wells Fargo Bank, National Association, as trustee, pursuant to which the 3.500% Notes due 2022 were issued (Filed as an Exhibit to the Company's Current Report on Form 8-K filed on November 9, 2012 and incorporated herein by reference). |
||||||
4.12 |
Fourth Supplemental Indenture, dated as of November 8, 2012, between Southern Copper Corporation and Wells Fargo Bank, National Association, as trustee, pursuant to which the 5.250% Notes due 2042 were issued. (Filed as an Exhibit to the Company's Current Report on Form 8-K filed on November 9, 2012 and incorporated herein by reference). |
||||||
4.13 |
Form of 3.500% Notes due 2022. (Filed as an Exhibit to the Company's Current Report on Form 8-K filed on November 9, 2012 and incorporated herein by reference). |
||||||
4.14 |
Form of 5.250% Notes due 2042. (Filed as an Exhibit to the Company's Current Report on Form 8-K filed on November 9, 2012 and incorporated herein by reference). |
||||||
4.15 |
Fifth Supplemental Indenture dated as of April 23, 2015, between Southern Copper Corporation and Wells Fargo Bank, National Association, as trustee, pursuant to which the 3.875% Notes due 2025 were issued. (Filed as an Exhibit to the Company's Current Report on Form 8-K filed on April 24, 2015 and incorporated herein by reference). |
||||||
4.16 |
Sixth Supplemental Indenture, dated as of April 23, 2015, between Southern Copper Corporation and Wells Fargo Bank, National Association, as trustee, pursuant to which the 5.875% Notes due 2045 were issued. (Filed as an Exhibit to the Company's Current Report on Form 8-K filed on April 24, 2015 and incorporated herein by reference). |
||||||
183
| Sequential Exhibit Number |
Document Description | Page Number |
|||||
|---|---|---|---|---|---|---|---|
| 4.17 | Form of 3.875% Notes due 2025. (Filed as Exhibit A to Exhibit 4.1 to the Company's Current Report on Form 8-K filed on April 24, 2015 and incorporated herein by reference). | ||||||
4.18 |
Form of 5.875% Notes due 2045. (Filed as Exhibit A to Exhibit 4.2 to the Company's Current Report on Form 8-K filed on April 24, 2015 and incorporated herein by reference). |
||||||
10.1 |
Directors' Stock Award Plan of the Company. (Filed as an exhibit to the Company's 2016 Proxy Statement and incorporated herein by reference). The plan expired by its terms on January 30, 2017. A 10-year extension of the plan is being submitted for approval by the Company's stockholders at the 2017 Annual Meeting of Stockholders. |
||||||
10.2 |
Service Agreement entered into by the Company with a subsidiary of Grupo Mexico S.A.B. de C.V., assigned upon the same terms and conditions to Grupo Mexico S.A.B. de C.V. in February 2004. (Filed as Exhibit 10.10 to the Company's 2002 Annual Report on Form 10-K and incorporated herein by reference). |
||||||
10.3 |
Agreement and Plan of Merger, dated as of October 21, 2004, by and among Southern Copper Corporation, SCC Merger Sub, Inc., Americas Sales Company, Inc., Americas Mining Corporation and Minera Mexico S.A. de C.V. (Filed as an Exhibit to Current Report on Form 8-K filed on October 22, 2004 and incorporated herein by reference). |
||||||
12.1 |
Computation of financial ratios (filed herewith). |
||||||
14.0 |
Code of Business Conduct and Ethics adopted by the Board of Directors on May 8, 2003 and amended on April 23, 2015. (Filed as Exhibit 14 to the Company's Current Report on Form 8-K filed April 29, 2015 and incorporated herein by reference). |
||||||
21.1 |
Subsidiaries of the Company (filed herewith). |
||||||
23.1 |
Consent of Registered Public Accounting Firm (Galaz, Yamazaki, Ruiz Urquiza, S.C.—Member of Deloitte Touche Tohmatsu, Limited) (filed herewith). |
||||||
31.1 |
Certification Pursuant to Section 302 of the Sarbanes-Oxley Act of 2002 (filed herewith). |
||||||
31.2 |
Certification Pursuant to Section 302 of the Sarbanes-Oxley Act of 2002 (filed herewith). |
||||||
32.1 |
Certification Pursuant to Section 906 of the Sarbanes-Oxley Act of 2002, 18 U.S.C., section 1350. This document is being furnished in accordance with SEC Release No. 33-8238. |
||||||
32.2 |
Certification Pursuant to Section 906 of the Sarbanes-Oxley Act of 2002, 18 U.S.C., section 1350. This document is being furnished in accordance with SEC Release No. 33-8238. |
||||||
101.INS |
XBRL Instance Document (submitted electronically with this report). |
||||||
101.SCH |
XBRL Taxonomy Extension Schema Document (submitted electronically with this report). |
||||||
184
| Sequential Exhibit Number |
Document Description | Page Number |
|||||
|---|---|---|---|---|---|---|---|
| 101.CAL | XBRL Taxonomy Calculation Linkbase Document (submitted electronically with this report). | ||||||
101.DEF |
XBRL Taxonomy Extension Definition Linkbase Document (submitted electronically with this report). |
||||||
101.LAB |
XBRL Taxonomy Label Linkbase Document (submitted electronically with this report). |
||||||
101.PRE |
XBRL Taxonomy Presentation Linkbase Document (submitted electronically with this report). |
||||||
The exhibit listed as 10.1 is the management contract or compensatory plan or arrangement required to be filed pursuant to Item 15(b) of Form 10-K.
Attached as Exhibit 101 to this report are the following documents formatted in XBRL (Extensible Business Reporting Language): (i) the Consolidated Statements of Earnings for the years ended December 31, 2016, 2015 and 2014; (ii) the Consolidated Statements of Comprehensive Income for the years ended December 31, 2016, 2015 and 2014; (iii) the Consolidated Balance Sheets at December 31, 2016 and 2015; (iv) the Consolidated Statements of Cash Flows for the years ended December 31, 2016, 2015 and 2014; (v) the Consolidated Statements of changes in equity for the years ended December 31, 2016, 2015 and 2014, and (vi) the Notes to Consolidated Financial Statements tagged in detail. Users of this data are advised pursuant to Rule 406T of Regulation S-T that this interactive data file is deemed not filed or part of a registration statement or prospectus for purposes of sections 11 or 12 of the Securities Act of 1933, is deemed not filed for purposes of section 18 of the Securities Exchange Act of 1934, and otherwise is not subject to liability under these sections.
185