Attached files
| file | filename |
|---|---|
| EX-12.1 - EX-12.1 - QTS Realty Trust, Inc. | qts-20161231ex1212f9d71.htm |
| EX-32.2 - EX-32.2 - QTS Realty Trust, Inc. | qts-20161231ex3225395a8.htm |
| EX-32.1 - EX-32.1 - QTS Realty Trust, Inc. | qts-20161231ex321e60ee6.htm |
| EX-31.4 - EX-31.4 - QTS Realty Trust, Inc. | qts-20161231ex3143b989c.htm |
| EX-31.3 - EX-31.3 - QTS Realty Trust, Inc. | qts-20161231ex3133907f5.htm |
| EX-31.2 - EX-31.2 - QTS Realty Trust, Inc. | qts-20161231ex312edd037.htm |
| EX-31.1 - EX-31.1 - QTS Realty Trust, Inc. | qts-20161231ex311c64bdc.htm |
| EX-23.1 - EX-23.1 - QTS Realty Trust, Inc. | qts-20161231ex231c168d9.htm |
| EX-21.1 - EX-21.1 - QTS Realty Trust, Inc. | qts-20161231ex2118dac93.htm |
| EX-10.31 - EX-10.31 - QTS Realty Trust, Inc. | qts-20161231ex1031637ec.htm |
| EX-10.30 - EX-10.30 - QTS Realty Trust, Inc. | qts-20161231ex10305b0dc.htm |
UNITED STATES
SECURITIES AND EXCHANGE COMMISSION
Washington, D.C. 20549
FORM 10-K
(Mark One)
☒ ANNUAL REPORT PURSUANT TO SECTION 13 OR 15(d) OF THE SECURITIES EXCHANGE ACT OF 1934
For the fiscal year ended December 31, 2016
OR
◻ TRANSITION REPORT PURSUANT TO SECTION 13 OR 15(d) OF THE SECURITIES EXCHANGE ACT OF 1934
For the transition period from to
Commission File Number 001-36109
QTS Realty Trust, Inc.
QualityTech, LP
(Exact name of registrant as specified in its charter)
|
Maryland (QTS Realty Trust, Inc.)
Delaware (QualityTech, LP) |
46-2809094 27-0707288
(I.R.S. Employer |
|
12851 Foster Street, Overland Park, Kansas |
|
66213 |
|
(Address of principal executive offices) |
|
(Zip Code) |
(913) 312-5503
(Registrant’s telephone number, including area code)
Securities registered pursuant to Section 12(b) of the Act:
|
Title of Each Class |
|
Name of Each Exchange on Which Registered |
|
Class A common stock, $.01 par value |
|
New York Stock Exchange |
Securities registered pursuant to Section 12(g) of the Act: None
Indicate by check mark if the registrant is a well-known seasoned issuer, as defined in Rule 405 of the Securities Act.
|
QTS Realty Trust, Inc. |
Yes ☒ No ◻ |
QualityTech, LP |
Yes ☒ No ◻ |
Indicate by check mark if the registrant is not required to file reports pursuant to Section 13 or 15(d) of the Act.
|
QTS Realty Trust, Inc. |
Yes ◻ No ☒ |
QualityTech, LP |
Yes ◻ No ☒ |
Indicate by check mark whether the registrant (1) has filed all reports required to be filed by Section 13 or 15(d) of the Securities Exchange Act of 1934 during the preceding 12 months (or for such shorter period that the registrant was required to file such reports), and (2) has been subject to such filing requirements for the past 90 days.
|
QTS Realty Trust, Inc. |
Yes ☒ No ◻ |
QualityTech, LP |
Yes ☒ No ◻ |
Indicate by check mark whether the registrant has submitted electronically and posted on its corporate Web site, if any, every interactive Data File required to be submitted and posted pursuant to Rule 405 of Regulation S-T (§ 232.405 of this chapter) during the preceding 12 months (or for such shorter period that the registrant was required to submit and post such files).
|
QTS Realty Trust, Inc. |
Yes ☒ No ◻ |
QualityTech, LP |
Yes ☒ No ◻ |
Indicate by check mark if disclosure of delinquent filers pursuant to Item 405 of Regulation S-K (§ 229.405 of this chapter) is not contained herein, and will not be contained, to the best of registrant’s knowledge, in definitive proxy or information statements incorporated by reference in Part III of this Form 10-K or any amendment to this Form 10-K. ☒
|
QTS Realty Trust, Inc. ◻ |
QualityTech, LP ◻ |
Indicate by check mark whether the registrant is a large accelerated filer, an accelerated filer, a non-accelerated filer, or a smaller reporting company. See definition of “large accelerated filer,” “accelerated filer” and “smaller reporting company” in Rule 12b-2 of the Exchange Act. (Check one):
QTS Realty Trust, Inc.
|
Large accelerated filer |
☒ |
Accelerated filer |
◻ |
|
|
|
|
|
|
Non-accelerated filer |
◻ (Do not check if a smaller reporting company) |
Smaller reporting company |
◻ |
QualityTech, LP
|
Large accelerated filer |
◻ |
Accelerated filer |
◻ |
|
|
|
|
|
|
Non-accelerated filer |
☒ (Do not check if a smaller reporting company) |
Smaller reporting company |
◻ |
Indicate by check mark whether the Registrant is a shell company (as defined in Rule 12b-2 of the Exchange Act).
|
QTS Realty Trust, Inc. |
Yes ◻ No ☒ |
QualityTech, LP |
Yes ◻ No ☒ |
The aggregate market value of the voting and non-voting common equity held by non-affiliates computed by reference to the price at which the Class A common stock, $.01 par value per share, was last sold at June 30, 2016 was approximately $2.7 billion. There were 47,701,605 shares of Class A common stock and 133,000 shares of Class B common stock, $0.01 par value per share, of the registrant outstanding on February 23, 2017.
Documents Incorporated by Reference
Portions of the Definitive Proxy Statement for our 2017 Annual Meeting of Stockholders are incorporated by reference into Part III of this report. We expect to file our proxy statement within 120 days after December 31, 2016.
1
EXPLANATORY NOTE
This report combines the annual reports on Form 10-K of QTS Realty Trust, Inc. (“QTS”) and QualityTech, LP, a Delaware limited partnership, which is our operating partnership (the “Operating Partnership”). This report also includes the financial statements of QTS and those of the Operating Partnership, although it presents only one set of combined notes for QTS’ financial statements and those of the Operating Partnership.
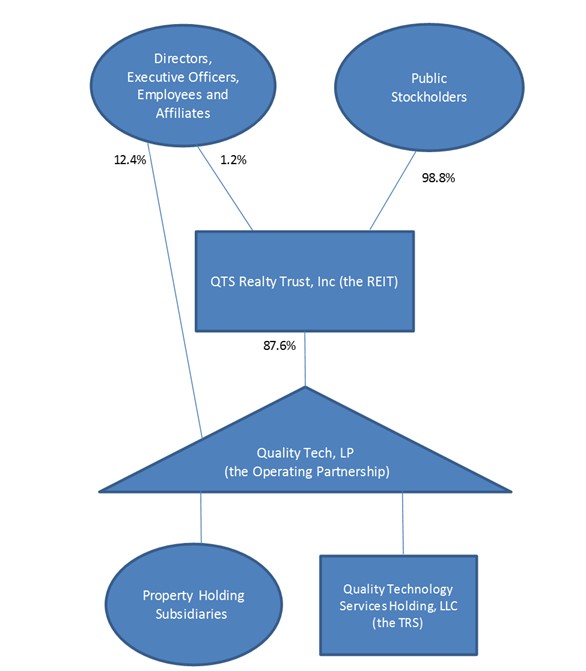
Substantially all of QTS’s assets are held by, and its operations are conducted through, the Operating Partnership. QTS is the sole general partner of the Operating Partnership, and, as of December 31, 2016, its only material asset consisted of its ownership of approximately 87.6% of the Operating Partnership. Management operates QTS and the Operating Partnership as one business. The management of QTS consists of the same employees as the management of the Operating Partnership. QTS does not conduct business itself, other than acting as the sole general partner of the Operating Partnership and issuing public equity from time to time. QTS has not issued or guaranteed any indebtedness. Except for net proceeds from public equity issuances by QTS, which are contributed to the Operating Partnership in exchange for units of limited partnership interest of the Operating Partnership, the Operating Partnership generates all remaining capital required by our business through its operations, the direct or indirect incurrence of indebtedness, and the issuance of partnership units. Therefore, as general partner with control of the Operating Partnership, QTS consolidates the Operating Partnership for financial reporting purposes.
We believe, therefore, that a combined presentation with respect to QTS and the Operating Partnership, including providing one set of notes for the financial statements of QTS and the Operating Partnership, provides the following benefits:
|
· |
enhances investors’ understanding of QTS and the Operating Partnership by enabling investors to view the business as a whole in the same manner as management views and operates the business; |
|
· |
eliminates duplicative disclosure and provides a more streamlined and readable presentation since a substantial portion of the disclosure in this report applies to both QTS and the Operating Partnership; and |
|
· |
creates time and cost efficiencies through the preparation of one presentation instead of two separate presentations. |
In addition, in light of these combined disclosures, we believe it is important for investors to understand the few differences between QTS and the Operating Partnership in the context of how QTS and the Operating Partnership operate as a consolidated company. With respect to balance sheets, the presentation of stockholders’ equity and partners’ capital are the main areas of difference between the consolidated balance sheets of QTS and those of the Operating Partnership. On the Operating Partnership’s consolidated balance sheets, partners’ capital includes partnership units that are owned by QTS and other partners. On QTS’ consolidated balance sheets, stockholders’ equity includes common stock, additional paid-in capital, accumulated other comprehensive income (loss) and accumulated dividends in excess of earnings. The remaining equity reflected on QTS’s consolidated balance sheet is the portion of net assets that are retained by partners other than QTS, referred to as noncontrolling interests. With respect to statements of operations, the primary difference in QTS' Statements of Operations and Comprehensive Income is that for net income (loss), QTS retains its proportionate share of the net income (loss) based on its ownership of the Operating Partnership, with the remaining balance being retained by the Operating Partnership.
In order to highlight the few differences between QTS and the Operating Partnership, there are sections and disclosure in this report that discuss QTS and the Operating Partnership separately, including separate financial statements, separate audit reports, separate controls and procedures sections, separate Exhibit 31 and 32 certifications, and separate presentation of certain accompanying notes to the financial statements, including Note 7 – Partners’ Capital, Equity and Incentive Compensation Plans and Note 15 – Quarterly Financial Information (unaudited). In the sections that combine disclosure for QTS and the Operating Partnership, this report refers to actions or holdings as being actions or holdings of “we,” “our,” “us,” “our company” and “the Company.” Although the Operating Partnership is generally the entity that enters into contracts, holds assets and issues debt, we believe that these general references to “we,” “our,” “us,” “our company” and “the Company” in this context are appropriate because the business is one enterprise operated through the Operating Partnership.
2
SPECIAL NOTE REGARDING FORWARD-LOOKING STATEMENTS
Some of the statements contained in this Form 10-K constitute forward-looking statements within the meaning of the federal securities laws. Forward-looking statements relate to expectations, beliefs, projections, future plans and strategies, anticipated events or trends and similar expressions concerning matters that are not historical facts. In particular, statements pertaining to our capital resources, portfolio performance and results of operations contain forward-looking statements. Likewise, all of our statements regarding anticipated growth in our funds from operations and anticipated market conditions are forward-looking statements. In some cases, you can identify forward-looking statements by the use of forward-looking terminology such as “may,” “will,” “should,” “expects,” “intends,” “plans,” “anticipates,” “believes,” “estimates,” “predicts,” or “potential” or the negative of these words and phrases or similar words or phrases which are predictions of or indicate future events or trends and which do not relate solely to historical matters. You also can identify forward-looking statements by discussions of strategy, plans or intentions.
The forward-looking statements contained in this Form 10-K reflect our current views about future events and are subject to numerous known and unknown risks, uncertainties, assumptions and changes in circumstances that may cause our actual results to differ significantly from those expressed in any forward-looking statement. We do not guarantee that the transactions and events described will happen as described (or that they will happen at all). The following factors, among others, could cause actual results and future events to differ materially from those set forth or contemplated in the forward-looking statements:
|
· |
adverse economic or real estate developments in our markets or the technology industry; |
|
· |
global, national and local economic conditions; |
|
· |
risks related to our international operations; |
|
· |
difficulties in identifying properties to acquire and completing acquisitions; |
|
· |
our failure to successfully develop, redevelop and operate acquired properties or lines of business |
|
· |
significant increases in construction and development costs; |
|
· |
the increasingly competitive environment in which we operate; |
|
· |
defaults on, or termination or non-renewal of, leases by customers; |
|
· |
increased interest rates and operating costs, including increased energy costs; |
|
· |
financing risks, including our failure to obtain necessary outside financing; |
|
· |
decreased rental rates or increased vacancy rates; |
|
· |
dependence on third parties to provide Internet, telecommunications and network connectivity to our data centers; |
|
· |
our failure to qualify and maintain QTS’ qualification as a real estate investment trust (“REIT”); |
|
· |
environmental uncertainties and risks related to natural disasters; |
|
· |
financial market fluctuations; and |
|
· |
changes in real estate and zoning laws, revaluations for tax purposes and increases in real property tax rates. |
While forward-looking statements reflect our good faith beliefs, they are not guarantees of future performance. We disclaim any obligation to publicly update or revise any forward-looking statement to reflect changes in underlying assumptions or factors, of new information, data or methods, future events or other changes. For a further discussion of these and other factors that could cause our future results to differ materially from any forward-looking statements, see the section entitled “Risk Factors.”
3
Unless the context requires otherwise, references in this Form 10-K to “we,” “our,” “us,” “our company” and “the Company” refer to QTS Realty Trust, Inc. (“QTS”), a Maryland corporation, together with its consolidated subsidiaries, including QualityTech, LP, a Delaware limited partnership, which we refer to in this Form 10-K as the “Operating Partnership” or “predecessor.”
Overview
We are a leading provider of secure, compliant data center solutions, hybrid cloud and fully managed services. We refer to our spectrum of core data center products as our “3Cs,” which consist of Custom Data Center (“C1”), Colocation (“C2”) and Cloud and Managed Services (“C3”). Our 3C integrated technology platform provides flexible, scalable, secure IT solutions for web and IT applications. Our Critical Facilities Management (“CFM”) provides increased efficiency and greater performance for third-party data center owners and operators.
We operate a portfolio of 25 data centers located throughout the United States, Canada, Europe and the Asia-Pacific region. Within the United States, we are located in some of the top U.S. data center markets plus other high-growth markets. Our data centers are highly specialized, full-service, mission-critical facilities used by our customers to house, power and cool the networking equipment and computer systems that support their most critical business processes. We believe that our data centers are best-in-class and engineered to adhere to the highest specifications commercially available to customers, providing fully redundant, high-density power and cooling sufficient to meet the needs of major national and international companies and organizations. This is in part reflected by our operating track record of “five-nines” (99.999%) reliability and by our diverse customer base of more than 1,100 customers, including financial institutions, healthcare companies, government agencies, communications service providers, software companies and global Internet companies.
QTS is a Maryland corporation formed on May 17, 2013 and is the sole general partner and majority owner of QualityTech, LP, our operating partnership (the “Operating Partnership”). Substantially all of our assets are held by, and our operations are conducted through, the Operating Partnership. QTS’ Class A common stock trades on the New York Stock Exchange under the ticker symbol “QTS.”
The Operating Partnership is a Delaware limited partnership formed on August 5, 2009 and was QTS’ historical predecessor prior to QTS’s initial public offering on October 15, 2015 (the “IPO”), having operated the Company’s business until the IPO. As of December 31, 2016, QTS owned an approximate 87.6% ownership interest in the Operating Partnership.
We believe that QTS has operated and has been organized in conformity with the requirements for qualification and taxation as a REIT commencing with its taxable year ended December 31, 2013. Our qualification as a REIT, and maintenance of such qualification, depends upon our ability to meet, on a continuing basis, various complex requirements under the Internal Revenue Code of 1986, as amended (the “Code”) relating to, among other things, the sources of our gross income, the composition and values of our assets, our distributions to our stockholders and the concentration of ownership of our equity shares.
Our Portfolio
We develop and operate 25 data centers located throughout the United States, Canada, Europe and the Asia-Pacific region, containing an aggregate of approximately 5.7 million gross square feet of space (approximately 91.9% of which is wholly owned by us), including approximately 2.5 million “basis-of-design” raised floor square feet, which represents the total data center raised floor potential of our existing data center facilities. This represents the maximum amount of space in our existing buildings that could be leased following full build-out, depending on the configuration that we deploy. We build out our data center facilities for both general use (colocation) and for executed leases that require significant amounts of space and power, depending on the needs of each facility at that time. As of December 31, 2016, this space included approximately 1,346,000 raised floor operating net rentable square feet, or NRSF, plus approximately 1.2 million square feet of additional raised floor in our development pipeline, of which approximately 151,000 NRSF is expected to become operational by December 31, 2017. Of the total 1.2 million NRSF in our
4
development pipeline, none was related to customer leases which had been executed as of December 31, 2016 but not yet commenced. Our facilities collectively have access to over 650 megawatts (“MW”) of gross utility power with 600 MW of available utility power. We believe such access to power gives us a competitive advantage in redeveloping data center space, since access to power is usually the most limiting and expensive component in data center redevelopment. At the data centers located on each of our properties, whether owned or leased by us, we provide full-service facilities used by our customers to house, power and cool the networking equipment and computer systems that support many of their most critical business processes, as well as additional services.
We account for the operations of all of our properties in one reporting segment.
Our Customer Base
We provide data center solutions to a diverse set of customers. Our customer base is comprised of companies of all sizes representing an array of industries, each with unique and varied business models and needs. We serve Fortune 1000 companies as well as small and medium businesses (“SMBs”) including financial institutions, healthcare companies, government agencies, communications service providers, software companies and global Internet companies.
Our Custom Data Center, or C1, customers typically are large enterprises with significant IT expertise and specific IT requirements, including financial institutions, “Big Four” accounting firms and the world’s largest global Internet companies, with our median customer utilizing approximately 4,600 square feet. Our Colocation, or C2, customers consist of a wide range of organizations, including major healthcare, telecommunications and software and web-based companies. Our C3 Cloud customers include both large organizations and SMBs seeking to reduce their capital expenditures and outsource their IT infrastructure on a flexible basis. Examples of current C3 Cloud customers include a global financial processing company and various U.S. government agencies.
As a result of our diverse customer base, customer concentration in our portfolio is limited. As of December 31, 2016, only three of our more than 1,100 customers individually accounted for more than 3% of our monthly recurring revenue (“MRR”) (as defined below), with only one greater than 4% which accounted for approximately 13% of our MRR. In addition, approximately 60% of our MRR was attributable to customers who use more than one of our 3Cs products.
Our customer base resides in both domestic and international locations, with MRR from U.S. locations representing $30.3 million and $26.5 million of MRR as of December 31, 2016 and 2015, respectively, and MRR from our international locations representing $0.6 million and $1.0 million of MRR as of December 31, 2016 and 2015, respectively. All our revenues during the year ended December 31, 2014 were attributable to U.S. locations.
Our Structure
Substantially all of our assets are held by, and our operations are conducted through, the Operating Partnership. Our interest in the Operating Partnership entitles us to share in cash distributions from, and in the profits and losses of, the Operating Partnership in proportion to our percentage ownership. As the sole general partner of the Operating Partnership, we generally have the exclusive power under the partnership agreement to manage and conduct the Operating Partnership’s business and affairs.
5
The following diagram depicts our ownership structure, on a non-diluted basis as of December 31, 2016.
Our Competitive Strengths
We believe that we are uniquely positioned in the data center industry and distinguish ourselves from other data center providers through the following competitive strengths:
|
· |
Fully Integrated Platform Offers Scalability and Flexibility to Our Customers and Us. Our differentiated, fully integrated 3Cs approach, allows us to serve a wide variety of customers in a large, addressable market and to scale to the level of IT infrastructure outsourcing desired by our customers. We believe customers will continue to have evolving and diverse IT needs and will prefer providers that offer a portfolio of IT solutions. As of December 31, 2016, approximately 60% of our MRR was attributable to customers who use more than one of our 3Cs products. We believe our ability to offer a full spectrum of 3Cs product offerings enhances our leasing velocity, allows for an individualized pricing mix, results in more balanced lease terms and optimizes cash flows from our assets. We leverage our integrated product mix to offer Critical Facilities Management (“CFM”), the operation of customer-owned data centers, with the combination of real estate ownership and technology services that supports a true enterprise partnership. |
|
· |
Platform Anchored by Strategically Located, Owned “Mega” Data Centers. Our larger “mega” data centers, Atlanta-Metro, Irving, Richmond, Atlanta-Suwanee, Princeton, Piscataway and Chicago, allow us to deliver our fully integrated platform and 3Cs products by building and leasing space more efficiently than in single- |
6
use or smaller data centers. We believe that our data centers are engineered to among the highest specifications commercially available. Our international portfolio of 25 data centers (10 of which are wholly owned, representing 88.1% of our raised square feet, and another is subject to a long-term ground lease), includes 21 data centers that are strategically located throughout the United States. We also own an aggregate of 276.4 acres of additional land adjacent to data center properties that can support the development of up to an additional approximately 2.8 million square feet of raised floor. |
|
· |
Significant Expansion Opportunity within Existing Data Center Facilities at Lower Costs. We have developed substantial expertise in redeveloping facilities through the acquisition and redevelopment of our operating facilities. Our data center redevelopment model is primarily focused on redeveloping space within our current facilities, which allows us to build additional leasable raised floor at a lower incremental cost compared to ground-up development and to rapidly scale our redevelopment in a modular manner to coincide with customer demand and our estimates of optimal product utilization among our C1, C2 and C3 products. |
|
· |
Diversified, High-Quality Customer Base. We have significantly grown our customer base from 510 in 2009 to over 1,100 as of December 31, 2016, with our largest customer accounting for approximately 13% of our MRR. No other customers exceeded 4% of our MRR. Our focus on our customers and our ability to scale with their needs allows us to achieve a low rental churn rate (which is the MRR lost in the period to a customer intending to fully exit our platform in the near term compared to the total MRR at the beginning of the period). For the year ended December 31, 2016, we experienced a rental churn rate of 5.6%. |
|
· |
Robust In-House Sales Capabilities. Our in-house sales force has deep knowledge of our customers’ businesses and IT infrastructure needs and is supported by sophisticated sales management, reporting and incentive systems. Our internal sales force is structured by product offerings, specialized industry segments and, with respect to our C2 product, by geographical region. Therefore, unlike certain other data center companies, we are less dependent on data center brokers to identify and acquire or renew our customers, which we believe is a key enabler of our 3Cs strategy. |
|
· |
Security and Compliance Focused. Our operations and compliance teams, led by seasoned management, are focused on providing a high level of physical security, cybersecurity and compliance solutions in all of our data centers and through our 3Cs offerings. |
|
· |
Balance Sheet Positioned to Fund Continued Growth. As of December 31, 2016 we had approximately $571 million of available liquidity consisting of cash and cash equivalents and the ability to borrow under our unsecured revolving credit facility. As we continue to expand our real estate portfolio and the returns associated with that capacity, we can increase availability by an additional $300 million under the current unsecured credit facility. We believe that we are appropriately capitalized with sufficient funds and available borrowing capacity to pursue our anticipated business and growth strategies. |
|
· |
Founder-Led Management Team with Proven Track Record and Strong Alignment with Our Stockholders. Our senior management team has significant experience in the ownership, management and redevelopment of commercial real estate through multiple business cycles. We believe our executive management team’s experience will enable us to capitalize on industry relationships by providing an ongoing pipeline of attractive leasing and redevelopment opportunities. |
|
· |
Ability to Increase Our Margins through Our Operating Leverage. We anticipate that our business and growth strategies can be substantially supported by our existing platform, will not require significant incremental general and administrative expenditures and will allow us to continue to benefit from operational leverage and increase operating margins. |
|
· |
Continuing to Selectively Expand Our Fully Integrated Platform to Other Strategic Markets. We will continue to selectively pursue attractive opportunities in strategic locations and sectors where we believe our fully integrated platform would give us a competitive advantage in the acquisition and leasing of a facility or portfolio of assets. We also believe we can integrate additional data center facilities into our platform without adding significant incremental headcount or general and administrative expenses. |
7
|
· |
Commitment to Sustainability. We have a commitment to sustainability that focuses on managing our power and space as effectively and efficiently as possible. We believe that our continued efforts and proven results from sustainably redeveloping properties give us a distinct advantage over our competitors in attracting new customers. |
Competition
We compete with developers, owners and operators of data centers and with IT infrastructure companies in the market for data center customers, properties for acquisition and the services of key third-party providers. In addition, we continue to compete with owners and operators of data centers and providers of cloud and managed services that follow other business models and may offer one or more of these services. We believe, however, that our 3Cs product offerings set us apart from our competitors in the data center industry and makes us more attractive to customers, both large and small. In addition, we believe other providers are seeking ways to enter or strengthen their positions in the data center market.
We compete for customers based on factors including location, critical load, NRSF, flexibility and expertise in the design and operation of data centers, as well as our cloud product and the breadth of managed services that we provide. New customers who consider leasing space at our properties and using our products and existing customers evaluating whether to renew or extend a lease also may consider our competitors, including wholesale infrastructure providers and colocation and managed services providers. In addition, our customers may choose to own and operate their own data centers rather than lease from us.
As an owner, developer and operator of data centers and provider of Cloud and Managed Services, we depend on certain third-party service providers, including engineers and contractors with expertise in the development of data centers and the provision of managed services. The level of competition for the services of specialized contractors and other third-party providers increases the cost of engaging such providers and the risk of delays in operating our data centers and completing our development and redevelopment projects. We also rely upon the services of specialized contractors for the provision of internet connectivity and software-related platforms and services. Competition for their services could lead to a negative impact on our business if they became unavailable to us.
In addition, we face competition for the acquisition of additional properties suitable for the development of data centers from real estate developers in our industry and in other industries and from customers who develop their own data center facilities. Such competition may have the effect of reducing the number of available properties for acquisition, increasing the price of any acquisition and reducing the demand for data center space in the markets we seek to serve.
Regulation
General
Data centers in our markets are subject to various laws, ordinances and regulations, including regulations relating to common areas. We believe that each of our properties has the necessary permits and approvals to operate its business.
Americans With Disabilities Act
Our properties must comply with Title III of the Americans With Disabilities Act (“ADA”) to the extent that such properties are “public accommodations” or “commercial facilities” as defined by the ADA. The ADA may require, for example, removal of structural barriers to access by persons with disabilities in certain public areas of our properties where such removal is readily achievable. We believe that our properties are in substantial compliance with the ADA and that we will not be required to make substantial capital expenditures to address the requirements of the ADA. However, noncompliance with the ADA could result in imposition of fines or an award of damages to private litigants. The obligation to make readily achievable accommodations is an ongoing one, and we will continue to assess our properties and to make alterations as appropriate in this respect.
Environmental Matters
Under various federal, state and local laws and regulations, a current or former owner or operator of real property may be liable for the cost to remove or remediate contamination resulting from the presence or discharge of hazardous or
8
toxic substances, wastes or petroleum products on, under, from or in such property. These costs could be substantial, liability under these laws may attach without regard to whether the owner or operator knew of, or was responsible for, the presence of the contaminants, and the liability may be joint and several. Most of our properties presently contain large underground or aboveground fuel storage tanks for emergency power, which is critical to our operations. If any of our tanks has a release of fuel to the environment, we likely would have to pay to clean up the contamination. In addition, prior owners and operators used some of our current properties for industrial and other purposes, which could have resulted in environmental contamination. Moreover, the presence of contamination or the failure to remediate contamination at our properties may (1) expose us to third-party liability, (2) subject our properties to liens in favor of the government for damages and costs the government incurs in connection with the contamination, (3) impose restrictions on the manner in which a property may be used or businesses may be operated, or (4) materially adversely affect our ability to sell, lease or develop the real estate or to borrow using the real estate as collateral. We also may be liable for the costs of remediating contamination at off-site disposal or treatment facilities where we arranged for disposal or treatment of hazardous substances at such facilities, without regard to whether we comply with environmental laws in doing so. Finally, there may be material environmental liabilities at our properties of which we are not aware. Any of these matters could have a material adverse effect on us.
Our properties are subject to federal, state, and local environmental, health, and safety laws and regulations and zoning requirements, including those regarding the handling of regulated substances and wastes, emissions to the environment, and fire codes. For instance, our properties are subject to regulations regarding the storage of petroleum for auxiliary or emergency power and air emissions arising from the use of power generators. In particular, our properties in California are subject to strict emissions limitations for its generators, which could be exceeded if we need to use these generators to supply critical backup power in a manner that results in emissions in excess of California limits. In addition, we lease some of our properties to our customers who also are subject to such environmental, health and safety laws and zoning requirements. If we, or our customers, fail to comply with these various requirements, we might incur costs and liabilities, including governmental fines and penalties. Moreover, we do not know whether existing requirements will change or whether future requirements will require us to make significant unanticipated expenditures that will materially and adversely affect us. Environmental noncompliance liability also could affect a customer’s ability to make rental payments to us. We require our customers to comply with these environmental and health and safety laws and regulations.
See ITEM 1A. RISK FACTORS, Risks Related to the Real Estate Industry, for additional information regarding these risks.
Privacy and Security
We may be directly and/or contractually subject to laws, regulations and policies for protecting sensitive data, consumer privacy and vital national interests. For example, the U.S. government has promulgated regulations and standards subject to authority provided through the enactment of a number of laws, such as the Health Insurance Portability and Accountability Act (“HIPAA”), the Health Information Technology for Economic and Clinical Health Act (“HITECH Act”), the Gramm-Leach-Bliley Act (“GLBA”), and the Federal Information Security Management Act of 2002 (“FISMA”), which require many corporations and federal, state and local governmental entities to control the security of, access to and configuration of their IT systems. A number of states also have enacted laws and regulations that require covered entities, such as data center operators, to implement and maintain security measures to protect certain types of information, such as Social Security numbers, payment card information, and other types of data, from unauthorized use and disclosure. In addition, industry organizations have adopted and implemented various security and compliance policies. For example, the Payment Card Industry Security Standards Council has issued its mandatory Payment Card Industry Data Security Standard (“PCI DSS”) which is applicable to all organizations processing payment card transactions.
In connection with certain of these laws, we are subject to audits and assessments, and we may be required to obtain certain certifications. Audit failure or findings of non-compliance can lead to significant fines or decertification from engaging in certain activities. For example, violations of HIPAA/HITECH Act regulations can lead to fines of up to $1.5 million for all violations of a particular provision in a calendar year and our failure to demonstrate compliance in an annual PCI DSS audit may result in fines and exclusion from payment card networks. Additionally, violations of privacy or security laws, regulations or standards increasingly lead to class-action litigation, which can result in substantial monetary judgments or settlements. We cannot assure you that future laws, regulations and standards, or future
9
interpretations of current laws, regulations and standards, related to privacy and security will not have a material adverse effect on us.
As a company that may process European personal data, we may also be subject to European data protection laws and regulations. The European Union (EU) Commission, Parliament, and Council adopted in April 2016 a new General Data Protection Regulation (GDPR) that will take effect in May 2018. The GDPR will replace the current European privacy regime and will impose new privacy requirements as well as increase the likelihood of applicability of European law to entities established outside the EU but processing data of European data subjects. Under the GDPR, there can be fines of up to 10,000,000 Euros or up to 2 percent of the global sales for certain comparatively minor offenses, or up to 20,000,000 Euros or up to 4 percent of the global sales for more serious offenses.
To facilitate and legitimize the transfer of both client and personnel data from the European Union (“EU”) to the United States, we self-certified to the EU-U.S. Privacy Shield, which requires organizations operating in the United States to provide assurance that they are adhering to relevant European standards for data protection for such transfers. QTS complies with the EU-US Privacy Shield Framework as set forth by the U.S. Department of Commerce regarding the collection, use and retention of personal information transferred from the EU to the United States. QTS has certified to the Department of Commerce that it adheres to the Privacy Shield Principles. However, our self-certification under the EU-U.S. Privacy Shield may not be sufficient to ensure compliance with GDPR. Legal challenges have been brought in European courts seeking to declare the Privacy Shield Framework invalid under European law as a mechanism to legitimize transfers of personal data from the EU to the United States, which could require us to implement alternative means to address European cross border data transfer requirement.
Insurance
We carry comprehensive liability, fire, extended coverage, earthquake, flood, business interruption and rental loss insurance covering all of the properties in our portfolio under a blanket policy. We also carry coverage for general liability, technology professional liability, and cybersecurity. We have selected policy specifications and insured limits that we believe to be appropriate given the relative risk of loss, the cost of the coverage and industry practice and, in the opinion of our management, the properties in our portfolio are currently adequately insured and the risk for any failure related to professional liability or a physical or cybersecurity breach are adequately covered by our insurance. We will not carry insurance for generally uninsured losses such as loss from riots, war, wet or dry rot, vermin and, in some cases, flooding, because such coverage is not available or is not available at commercially reasonable rates. In addition, although we carry earthquake and flood insurance on our properties in an amount and with deductibles that we believe are commercially reasonable, such policies are subject to limitations in certain flood and seismically active zones. Certain of the properties in our portfolio will be located in areas known to be seismically active. See “Risk Factors—Risks Related to the Real Estate Industry—Uninsured and underinsured losses could have a material adverse effect on us.”
Employees
As of December 31, 2016, we employed approximately 780 persons, none of whom were represented by a labor union. We believe our relations with our employees are good.
Offices
Our executive headquarters is located at 12851 Foster Street, Overland Park, Kansas 66213, where our telephone number is (913) 814-9988. We believe that our current offices are adequate for our present operations; however, based on the anticipated growth of our company, we may add regional offices depending upon our future operational needs.
Available Information
Our Internet website address is www.qtsdatacenters.com. You can obtain on our website, free of charge, a copy of our Annual Report on Form 10-K, our quarterly reports on Form 10-Q, our current reports on Form 8-K, and any amendments to those reports, as soon as reasonably practicable after we electronically file such reports or amendments with, or furnish them to, the SEC. Our Internet website and the information contained therein or connected thereto are not intended to be incorporated into this Annual Report on Form 10-K.
10
Also available on our website, free of charge, are copies of our Code of Business Conduct and Ethics, our Corporate Governance Guidelines, and the charters for each of the committees of our board of directors—the Audit Committee, the Nominating and Corporate Governance Committee, and the Compensation Committee.
Set forth below are the risks that we believe are material to our stockholders. You should carefully consider the following risks in evaluating our Company and our business. If any of the risks discussed in this Form 10-K were to occur, our business, prospects, financial condition, liquidity, funds from operations and results of operations and our ability to service our debt and make distributions to our stockholders could be materially and adversely affected, which we refer to herein collectively as a “material adverse effect on us,” the market price of our common stock could decline significantly and you could lose all or part of your investment. Some statements in this Form 10-K, including statements in the following risk factors, constitute forward-looking statements. Please refer to the section entitled “Special Note Regarding Forward-Looking Statements” at the beginning of this Form 10-K.
Risks Related to Our Business and Operations
Because we are focused on the ownership, operation and redevelopment of data centers, any decrease in the demand for data center space or managed services could have a material adverse effect on us.
Because our portfolio of properties consists entirely of data centers, or properties to be converted to data centers, we are subject to risks inherent in investments in a single industry. Adverse developments in the data center market or in the industries in which our customers operate could lead to a decrease in the demand for data center space or managed services, which could have a greater material adverse effect on us than if we owned a more diversified real estate portfolio. These adverse developments could include: a decline in the technology industry, such as a decrease in the use of mobile or web-based commerce, industry slowdowns, business layoffs or downsizing, relocation of businesses, increased costs of complying with existing or new government regulations and other factors; a slowdown in the growth of the Internet generally as a medium for commerce and communication; a downturn in the market for data center space generally such as oversupply of or reduced demand for space; and the rapid development of new technologies or the adoption of new industry standards that render our or our customers’ current products and services obsolete or unmarketable and, in the case of our customers, that contribute to a downturn in their businesses, increasing the likelihood of a default under their leases or that they become insolvent or file for bankruptcy protection. To the extent that any of these or other adverse conditions occur, they are likely to impact market rents for, and cash flows from, our data center space, which could have a material adverse effect on us.
Our data center infrastructure may become obsolete or unmarketable and we may not be able to upgrade our power, cooling, security or connectivity systems cost-effectively or at all.
The markets for the data centers we own and operate, as well as certain of the industries in which our customers operate, are characterized by rapidly changing technology, evolving industry standards, frequent new service introductions, shifting distribution channels and changing customer demands. As a result, the infrastructure at our data centers may become obsolete or unmarketable due to demand for new processes and/or technologies, including, without limitation: (i) new processes to deliver power to, or eliminate heat from, computer systems; (ii) customer demand for additional redundancy capacity; or (iii) new technology that permits lower levels of critical load and heat removal than our data centers are currently designed to provide. In addition, the systems that connect our data centers to the Internet and other external networks may become outdated, including with respect to latency, reliability and diversity of connectivity. When customers demand new processes or technologies, we may not be able to upgrade our data centers on a cost-effective basis, or at all, due to, among other things, increased expenses to us that cannot be passed on to customers or insufficient revenue to fund the necessary capital expenditures. The obsolescence of our power and cooling systems and/or our inability to upgrade our data centers, including associated connectivity, could reduce revenue at our data centers and could have a material adverse effect on us. Furthermore, potential future regulations that apply to industries we serve may require customers in those industries to seek specific requirements from their data centers that we are unable to provide. These may include physical security regulations applicable to the defense industry and government contractors and privacy and security requirements applicable to the financial services and health care industries. If such regulations were adopted, we could lose customers or be unable to attract new customers in certain industries, which could have a material adverse effect on us.
11
We face considerable competition in the data center industry and may be unable to renew existing leases, lease vacant space or re-let space on more favorable terms, or at all, as leases expire, which could have a material adverse effect on us.
Leases representing approximately 18% of our leased raised floor and approximately 36% of our annualized rent (including all month-to-month leases), in each case as of December 31, 2016, will expire by the end of 2017. We compete with numerous developers, owners and operators in the data center industry, including managed service providers and other REITs, some of which own or lease properties similar to ours, or may do so in the future, in the same submarkets in which our properties are located. Our competitors may have significant advantages over us, including greater name recognition, longer operating histories, higher operating margins, pre-existing relationships with current or potential customers, greater financial, marketing and other resources, and access to greater and less expensive power. These advantages could allow our competitors to respond more quickly to strategic opportunities or changes in our industry or markets. If our competitors offer space at rental rates below current market rates or below the rental rates we currently charge our customers, or if our competitors offer products and services in a greater variety, that are more state-of-the-art or that are more competitively priced than the products and services we offer, we may lose customers or be unable to attract new customers without lowering our rental rates and improving the quality, mix and technology of our products and services. We cannot assure you that we will be able to renew leases with our existing customers or re-let space to new customers if our current customers do not renew their leases. Even if our customers renew their leases or we are able to re-let the space, the terms (including rental rates and lease periods) and costs (including capital) of renewal or re-letting may be less favorable than the terms of our current leases. In addition, there can be no assurances that the type of space and/or services currently available at our properties will be sufficient to retain current customers or attract new customers in the future. Finally, although we offer a full spectrum of data center products from Custom Data Centers to Colocation to Cloud and Managed Services, our competitors that specialize in only one of our product and service offerings may have competitive advantages in that space. If rental rates for our properties decline, we are unable to lease vacant space, our existing customers do not renew their leases or we do not re-let space from expiring leases, in each case, on favorable terms, it could have a material adverse effect on us.
The long sales cycle for data center products could have a material adverse effect on us.
A customer’s decision to lease space in one of our data centers and to purchase Cloud and Managed Services typically involves a significant commitment of resources, time-consuming contract negotiations regarding the service level commitments and substantial due diligence on the part of the customer regarding the adequacy of our infrastructure and attractiveness of our products and services. As a result, the leasing of data center space and Cloud and Managed Services has a long sales cycle. Furthermore, we may expend significant time and resources in pursuing a particular sale or customer that may not result in any revenue. Our inability to adequately manage the risks associated with leasing the space and products within our facilities could have a material adverse effect on us.
Our customers may choose to develop new data centers or expand their own existing data centers, which could result in the loss of one or more key customers or reduce demand and pricing for our data centers and could have a material adverse effect on us.
Some of our customers may develop their own data center facilities. Other customers with their own existing data centers may choose to expand their data centers in the future. In the event that any of our key customers were to develop or expand their data centers, it could result in a loss of business to us or put downward pressure on our pricing. If we lose a customer, there is no assurance that we would be able to replace that customer at the same or a higher rate, or at all, which could have a material adverse effect on us.
The bankruptcy, insolvency or financial difficulties of a major customer could have a material adverse effect on us.
The bankruptcy or insolvency of a major customer could have significant consequences for us. If any customer becomes a debtor in a case under the federal Bankruptcy Code, we cannot evict the customer solely because of the bankruptcy. In addition, the bankruptcy court might authorize the customer to reject and terminate its lease with us. Our claim against the customer for unpaid future rent would be subject to a statutory cap that might be substantially less than the remaining rent owed under the lease. In either case, our claim for unpaid rent would likely not be paid in full. If any of our significant customers were to become bankrupt or insolvent or suffer a downturn in their business, they may fail to renew, or reject or terminate, their leases with us and/or fail to pay unpaid or future rent owed to us, which could have a material adverse effect on us.
12
Any inability, temporarily or permanently, to fully and consistently operate either of our Atlanta-Metro and Atlanta-Suwanee properties could have a material adverse effect on us.
Our two largest wholly-owned properties in terms of annualized rent, Atlanta-Metro and Atlanta-Suwanee, collectively accounted for approximately 41% of our annualized rent as of December 31, 2016. Therefore, any inability, temporarily or permanently, to fully and consistently operate either of these properties could have a material adverse effect on us. In addition, because both properties are located in the Atlanta metropolitan area, we are particularly susceptible to adverse developments in that area, including as a result of natural disasters (such as hurricanes, floods, tornadoes and other events), that could cause, among other things, permanent damage to the properties and electrical power outages that may last beyond our backup and alternative power arrangements. Further, Atlanta-Metro and Atlanta-Suwanee account for several of our largest leases in terms of MRR. Any nonrenewal, credit or other issues with large customers could adversely affect the performance of these properties.
We may be adversely affected by the economies and other conditions of the markets in which we operate, particularly in Atlanta and other metropolitan areas, where we have a high concentration of our data center properties.
We are susceptible to adverse economic or other conditions in the geographic markets in which we operate, such as periods of economic slowdown or recession, the oversupply of, or a reduction in demand for, data centers and cloud and managed services in a particular area, industry slowdowns, layoffs or downsizings, relocation of businesses, increases in real estate and other taxes and changing demographics. The occurrence of these conditions in the specific markets in which we have concentrations of properties could have a material adverse effect on us. Our Atlanta area data centers, Atlanta-Metro and Atlanta-Suwanee, and our leased facilities acquired in 2015, which are concentrated in the Northern Virginia area, accounted for approximately 41% and 19%, respectively, of our annualized rent as of December 31, 2016. As a result, we are particularly susceptible to adverse market conditions in these areas. In addition, other geographic markets could become more attractive for developers, operators and customers of data center facilities based on favorable costs and other conditions to construct or operate data center facilities in those markets. For example, some states have created tax incentives for developers and operators to locate data center facilities in their jurisdictions. These changes in other markets may increase demand in those markets and result in a corresponding decrease in demand in our markets. Any adverse economic or real estate developments in the geographic markets in which we have a concentration of properties, or in any of the other markets in which we operate, or any decrease in demand for data center space resulting from the local business climate or business climate in other markets, could have a material adverse effect on us.
We may not be able to compete successfully against current competitors in the Cloud and C3 market.
The market for cloud computing is highly competitive, and the cost to compete is significant. Many of our current competitors have substantially greater financial resources, larger customer bases, longer operating histories, greater brand recognition, and more established relationships in the industry than we do. As a result, we may be unable to compete successfully in this market.
Challenging economic and other market conditions could have a material adverse effect on us.
The cost and availability of credit may be limited if global or national market conditions deteriorate. Furthermore, deteriorating economic and other market conditions that affect our customers could negatively impact commercial real estate fundamentals and result in lower occupancy, lower rental rates and declining values in our real estate portfolio. Additionally, the economic climate could have an impact on our lenders or customers, causing them to fail to meet their obligations to us. A long-term continuance of challenging economic and other market conditions could have a material adverse effect on us.
Future consolidation and competition in our customers’ industries could reduce the number of our existing and potential customers and make us dependent on a more limited number of customers.
Mergers or consolidations in our customers’ industries in the future could reduce the number of our existing and potential customers and make us dependent on a more limited number of customers. If our customers merge with or are acquired by other entities that are not our customers, they may discontinue or reduce the use of our data centers in the future. Any of these developments could have a material adverse effect on us.
13
Our failure to develop and maintain a diverse customer base could have a material adverse effect on us.
Our customers are a mix of C1, C2 and C3 customers. Each type of customer and their leases with us have certain features that distinguish them from our other customers, such as operating margin, space and power requirements and lease term. In addition, our customers engage in a variety of professional, financial, technological and other businesses. A diverse customer base helps to minimize exposure to economic fluctuations in any one industry, business sector or customer type, or any particular customer. Our relative mix of C1, C2 and C3 customers may change over time, as may the industries represented by our customers, the concentration of customers within specified industries and the economic value and risks associated with each customer, and there is no assurance that we will be able to maintain a diverse customer base, which could have a material adverse effect on us.
Our government customers, contracts and subcontracts may subject us to additional risks, including early termination, audits, investigations, sanctions and penalties, which could have a material adverse effect on us.
We derive revenue from contracts with the U.S. government, state and local governments and from subcontracts with government contractors. Some of these customers may be entitled to terminate all or part of their contracts at any time, without cause.
Recently, political pressure has increased for governments and their agencies, both domestically and internationally, to reduce spending and the new administration’s agenda includes reduction in government spending. Some of our federal government contracts and subcontracts are directly or indirectly subject to Congressional approval of appropriations to fund the expenditures under these contracts. Similarly, some of our state and local contracts and subcontracts are subject to government funding authorizations. To the extent that funding underlying any of these government contracts or subcontracts is reduced or eliminated there is an increased risk of termination by the counterparties, which could have a material adverse effect on us.
Government contracts and subcontracts also are generally subject to government audits and investigations. To the extent we fail to comply with laws or regulations related to such contracts, any such audit or investigation of us could result in various civil and criminal penalties and administrative sanctions, including termination of such contracts, refund of a portion of fees received, forfeiture of profits, suspension of payments, fines and suspensions or debarment from future government business, any of which could have a material adverse effect on us.
We derive significant revenue from our largest customers, and the loss or significant reduction in business from one or more of these customers could have a material adverse effect on us.
Our top 10 customers collectively accounted for approximately 36% of our portfolio’s total MRR as of December 31, 2016. We have one customer that accounted for approximately 13% of our MRR as of December 31, 2016. As a result, if we lose and are unable to replace one or more of these customers, if these customers significantly reduce their business with us or default on their obligations to us or if we choose not to enforce, or to enforce less vigorously, any rights that we may have now or in the future against these significant customers because of our desire to maintain our relationship with them, our business, financial condition and results of operations, including the amount of cash available for distribution to our stockholders, could be materially adversely affected
We have increased the proportion of our business associated with Cloud and Managed Services, which has increased our exposure to the risks of those product services, including adverse economic or other conditions or adverse changes in law or other regulations relating to the Internet, communications or information technologies.
Our Cloud and Managed Services business has grown over time, and adverse changes in that product market, such as increased regulation of, an oversupply of or a decrease in demand for, the Cloud and Managed Services market or any other adverse condition, may have a proportionately greater adverse effect on us than in the past. Additionally, the adoption or modification of laws or regulations relating to the Internet, or otherwise relating to our Cloud and Managed Services business, or changes in interpretations of any such existing laws, would have a proportionately greater adverse effect on us than such change would have previously had. Therefore, this increased exposure to the Cloud and Managed Services market could have a material adverse effect on us.
14
Our future growth depends upon the successful expansion or redevelopment of our existing properties, and any delays or unexpected costs in such expansion or redevelopment could have a material adverse effect on us.
We have initiated or are contemplating the redevelopment of multiple of our existing data center properties: Atlanta-Metro, Irving, Richmond, Santa Clara, Piscataway, Chicago, Princeton, Fort Worth, Jersey City and leased facilities acquired in 2015. Our future growth depends upon the successful completion of these efforts. With respect to our current and any future expansions and any new developments or redevelopments, we will be subject to certain risks, including the following:
|
· |
financing risks; |
|
· |
increases in interest rates or credit spreads; |
|
· |
construction and/or lease-up delays; |
|
· |
changes to plans or specifications; |
|
· |
construction site accidents or other casualties; |
|
· |
lack of availability of, and/or increased costs for, specialized data center components, including long lead-time items such as generators; |
|
· |
cost overruns, including construction or labor costs that exceed our original estimates; |
|
· |
contractor and subcontractor disputes, strikes, labor disputes or supply disruptions; |
|
· |
environmental issues, fire, flooding, earthquakes and other natural disasters; |
|
· |
delays with respect to obtaining or the inability to obtain necessary zoning, occupancy, environmental, land use and other governmental permits, and changes in zoning and land use laws, particularly with respect to build-outs at our Santa Clara facility; |
|
· |
failure to achieve expected occupancy and/or rental rate levels within the projected time frame, if at all; and |
|
· |
sub-optimal mix of 3Cs products. |
In addition, with respect to any future developments of new data center properties, we will be subject to risks and, potentially, unanticipated costs associated with obtaining access to a sufficient amount of power from local utilities, including the need, in some cases, to develop utility substations on our properties in order to accommodate our power needs, constraints on the amount of electricity that a particular locality’s power grid is capable of providing at any given time, and risks associated with the negotiation of long-term power contracts with utility providers. We may not be able to successfully negotiate such contracts on favorable terms, or at all. Any inability to negotiate utility contracts on a timely basis or on favorable terms or in volumes sufficient to supply the critical load anticipated for future developments could have a material adverse effect on us.
While we intend to develop data center properties primarily in markets with which we are familiar, we may in the future acquire properties in new geographic markets where we expect to achieve favorable risk-adjusted returns on our investment. We may not possess the same level of familiarity with development or redevelopment in these new markets and therefore cannot assure you that our development activities will generate attractive returns. Furthermore, development and redevelopment activities, regardless of whether they are ultimately successful, also typically require a substantial portion of our management’s time and attention. This may distract our management from focusing on other operational activities of our business.
These and other risks could result in delays, increased costs and a lower stabilized return on invested capital and could prevent completion of our development and expansion projects once undertaken, which could have a material adverse effect on us. In addition, we are expanding the aforementioned properties, and may develop or expand properties in the future, prior to obtaining commitments from customers to lease them. This is known as developing or expanding “on speculation” and involves the risk that we will be unable to attract customers to the properties on favorable terms in a timely manner, if at all. In addition to our internal sales force, through our channels and partners team, we intend to use our existing industry relationships with national technology companies to retain and attract customers for our existing data center properties as well as the expansions and developments of such properties. We believe these industry relationships provide an ongoing pipeline of attractive leasing opportunities, and we intend to capitalize on these relationships in order to increase our leasing network. If our internal sales force or channels and partners team is not successful in leasing new data center space on favorable terms, it could have a material adverse effect on us.
15
Our properties are designed primarily for lease as data centers, which could make it difficult to reposition them if we are not able to lease or re-let available space.
Our properties are highly specialized properties that contain extensive electrical, communications and mechanical systems. Such systems are often custom-designed to house, power and cool certain types of computer systems and networking equipment. Any office space (such as private office space, open office areas and conference centers) located at our properties is merely complementary to such systems, to facilitate our ability to service and maintain them. As a result, our properties are not well-suited for primary use by customers as anything other than data centers. Major renovations and expenditures would be required to convert the properties for use as commercial office space, or for any other use, which would substantially reduce the benefits from such a conversion. In the event of a conversion, the value of our properties may be impaired due to the costs of reconfiguring the real estate for alternate purposes and the removal or modification of the specialized systems and equipment. The highly specialized nature of our data center properties could make it difficult and costly to reposition them if we are not able to lease or re-let available space on favorable terms, or at all, which could have a material adverse effect on us.
We lease space in several locations under long-term non-cancellable lease agreements and the non-renewal or loss of such leases, or the continuing obligations under such leases in the event of a loss of customers or customer revenues, could have a material adverse effect on us.
We lease the space that houses our data centers in several locations under long-term lease agreements. For example, we lease the space housing our data centers in Jersey City, New Jersey and Overland Park, Kansas, where our corporate headquarters is located, under leases expiring (taking into account our extension options) in 2031 and 2023 respectively. We also lease data center space in several locations under non-cancellable leases expiring through 2026 and, in turn, sublease that space to our customers. The landlords could attempt to evict us for reasons beyond our control and we may incur costs if we are forced to vacate this space due to the high costs of relocating the equipment in these facilities and installing the necessary infrastructure in a new data center property. If we are forced to vacate any of these facilities, we could lose customers that chose our services based on our location. In addition, we cannot assure you that we will be able to renew these leases prior to their expiration dates on favorable terms or at all. Certain of such leases relate to data centers owned by companies that may view us as a competitor, which may impact their willingness to extend these leases upon expiration. If we are unable to renew these lease agreements, we could lose a significant number of customers who are unwilling to relocate their equipment to another one of our data center properties, which could have a material adverse effect on us. Even if we are able to renew these leases, the terms and other costs of renewal may be less favorable than our existing lease arrangements. Failure to sufficiently increase revenue from customers at these facilities to offset these projected higher costs could have a material adverse effect on us. Further, we may be unable to maintain good working relationships with our landlords, which would adversely affect our relationship with our customers and could result in the loss of current customers.
In addition, the terms of our customer contracts are, in many cases, of shorter duration than the non-cancellable lease agreements for data center space described above. We are obligated to make payments on these long-term non-cancellable leases regardless of whether our customer contracts are terminated or expire and regardless of whether our customers continue to make payments under their contracts. To the extent we experience a loss of customers or customer revenue, including upon expiration or termination of customer contracts, our continuing obligations under the non-cancellable lease agreements for data center space may result in expenses to us without offsetting revenue, which could have a material adverse effect on us.
The ground sublease structure at our Santa Clara property could prevent us from developing the property as we desire, and we may have to incur additional expenses prior to the end of the ground sublease to restore the property to its prelease state.
Our interest in the Santa Clara property is subject to a ground sublease granted by a third party, as ground sublessor, to our indirect subsidiary Quality Investment Properties Santa Clara, LLC (“QIP Santa Clara”). The ground sublease terminates in 2052 and we have two options to extend the original term for consecutive ten-year terms. The ground sublease structure presents special risks. We, as ground sublessee, will own all improvements on the land, including the buildings in which the data centers are located during the term of the ground sublease. Upon the expiration or earlier termination of the ground sublease, however, the improvements on the land will become the property of the ground sublessor. Unless we purchase a fee interest in the land and improvements subject to the ground sublease, we will not
16
have any economic interest in the land or improvements at the expiration of the ground sublease. Therefore, we will not share in any increase in value of the land or improvements beyond the term of the ground sublease, notwithstanding our capital outlay to purchase our interest in the data center or fund improvements thereon, and will lose our right to use the building on the subleased property. In addition, upon the expiration of the ground sublease, the ground sublessor may require the removal of the improvements or the restoration of the improvements to their condition prior to any permitted alterations at our sole cost and expense. If we do not meet a certain net worth test, we also will be required to provide the ground sublessor with a bond in connection with such removal and restoration requirements. In addition, while we generally have the right to undertake alterations to the demised premises, the ground sublessor has the right to reasonably approve the quality of such work and the form and content of certain financial information of QIP Santa Clara. The ground sublessor need not give its approval to alterations if it or its affiliate determines that the work will have a material adverse impact on the fee interest in property adjacent to the demised premises. In addition, though the ground sublease provides that we may exercise the rights of ground lessor in the event of a rejection of the master ground lease, each of the master ground lease and the ground sublease may be rejected in bankruptcy. Finally, in the event of a condemnation, the ground lessor is entitled to an allocable share of any condemnation proceeds. The ground sublease, however, does contain important nondisturbance protections and provides that, in event of the termination of the master ground lease, the ground sublease will become a direct lease between the ground lessor and QIP Santa Clara.
We depend on third parties to provide Internet, telecommunication and fiber optic network connectivity to the customers in our data centers, and any delays or disruptions in service could have a material adverse effect on us.
Our products and infrastructure rely on third-party service providers. In particular, we depend on third parties to provide Internet, telecommunication and fiber optic network connectivity to the customers in our data centers, and we have no control over the reliability of the services provided by these suppliers. Our customers may in the future experience difficulties due to service failures unrelated to our systems and services. Any Internet, telecommunication or fiber optic network failures may result in significant loss of connectivity to our data centers, which could reduce the confidence of our customers and could consequently impair our ability to retain existing customers or attract new customers and could have a material adverse effect on us.
Similarly, we depend upon the presence of Internet, telecommunications and fiber optic networks serving the locations of our data centers in order to attract and retain customers. The construction required to connect multiple carrier facilities to our data centers is complex, requiring a sophisticated redundant fiber network, and involves matters outside of our control, including regulatory requirements and the availability of construction resources. Each new data center that we develop requires significant amounts of capital for the construction and operation of a sophisticated redundant fiber network. We believe that the availability of carrier capacity affects our business and future growth. We cannot assure you that any carrier will elect to offer its services within our data centers or that once a carrier has decided to provide connectivity to our data centers that it will continue to do so for any period of time. Furthermore, some carriers are experiencing business difficulties or have announced consolidations or mergers. As a result, some carriers may be forced to downsize or terminate connectivity within our data centers, which could adversely affect our customers and could have a material adverse effect on us.
Power outages, limited availability of electrical resources and increased energy costs could have a material adverse effect on us.
Our data centers are subject to electrical power outages, regional competition for available power and increased energy costs. We attempt to limit exposure to system downtime by using backup generators and power supplies generally at a significantly higher operating cost than we would pay for an equivalent amount of power from a local utility. However, we may not be able to limit our exposure entirely even with these protections in place. Power outages, which may last beyond our backup and alternative power arrangements, would harm our customers and our business. During power outages, changes in humidity and temperature can cause permanent damage to servers and other electrical equipment. We could incur financial obligations or be subject to lawsuits by our customers in connection with a loss of power. Any loss of services or equipment damage could reduce the confidence of our customers in our services and could consequently impair our ability to attract and retain customers, which could have a material adverse effect on us.
In addition, power and cooling requirements at our data centers are increasing as a result of the increasing power and cooling demands of modern servers. Since we rely on third parties to provide our data centers with sufficient power to meet our customers’ needs, and we generally do not control the amount of power drawn by our customers, our data centers could have a limited or inadequate amount of electrical resources.
17
We also may be subject to risks and unanticipated costs associated with obtaining power from various utility companies. Utilities that serve our data centers may be dependent on, and sensitive to price increases for, a particular type of fuel, such as coal, oil or natural gas. The price of these fuels and the electricity generated from them could increase as a result of proposed legislative measures related to climate change or efforts to regulate carbon emissions. While our wholesale customers are billed on a pass-through basis for their direct energy usage, our retail customers pay a fixed cost for services, including power, so any excess energy costs above such fixed costs are borne by us. Although, for technical and practical reasons, our retail customers often use less power than the amount we are required to provide pursuant to their leases, there is no assurance that this will always be the case. Although we have a diverse customer base, the concentration and mix of our customers may change and increases in the cost of power at any of our data centers would put those locations at a competitive disadvantage relative to data centers served by utilities that can provide less expensive power. This could adversely affect our relationships with our customers and hinder our ability to operate our data centers, which could have a material adverse effect on us.
We rely on the proper and efficient functioning of computer and data-processing systems, and a large-scale malfunction could have a material adverse effect on us.
Our ability to keep our data centers operating depends on the proper and efficient functioning of computer and data-processing systems. Since computer and data-processing systems are susceptible to malfunctions and interruptions, including those due to equipment damage, power outages, cyber attacks and a range of other hardware, software and network problems, we cannot guarantee that our data centers will not experience such malfunctions or interruptions in the future. Additionally, expansions and developments in the products and services that we offer, including our Cloud and Managed Services, could increasingly add a measure of complexity that may overburden our data center, network resources and human capital, making service interruptions and failures more likely. A significant or large-scale malfunction or interruption of one or more of any of our data centers’ computer or data-processing systems could adversely affect our ability to keep such data centers running efficiently. If a malfunction results in a wider or sustained disruption to business at a property, it could have a material adverse effect on us.
Interruptions in our provision of products or services could result in a loss of customers and damage our reputation, which could have a material adverse effect on us.
Our business and reputation could be adversely affected by any interruption or failure in the provision of products and services, even if such events occur as a result of a natural disaster, human error, landlord maintenance failure, water damage, fiber cuts, extreme temperature or humidity, sabotage, vandalism, terrorist acts, unauthorized entry or other unanticipated problems. If a significant disruption occurs, we may be unable to implement disaster recovery or security measures in a timely manner or, if and when implemented, these measures may not be sufficient or could be circumvented through the reoccurrence of a natural disaster or other unanticipated problem, or as a result of accidental or intentional actions. Furthermore, such disruptions can cause damage to servers and may result in legal liability where interruptions in service violate service commitments in customer leases. Resolving network failures or alleviating security problems also may require interruptions, delays, or cessation of service to our customers. Accordingly, failures in our products and services, including problems at our data centers or network interruptions may result in significant liability, a loss of customers and damage to our reputation, which could have a material adverse effect on us.
Security breaches at our facilities or affecting our networks may result in disclosure of sensitive customer information that could harm our reputation and expose us to liability from customers and government agencies.
Our network could be subject to unauthorized access, computer viruses, cyber attacks or cyber intrusions and other disruptive problems, including malware, computer viruses and attachments to e-mails caused by customers, employees, or others inside or outside of our organization. Because a portion of our business focuses on serving U.S. government agencies and their contractors with a general focus on data security and information technology, we may be especially likely to be targeted by cyber attacks, including by governments, organizations or persons hostile to the U.S. government. Despite our activities to maintain the security and integrity of our networks and related systems, there can be no assurance that these activities will be effective. Unauthorized access, computer viruses, or other disruptive problems could lead to interruptions, delays and cessation of service to our customers and the compromise or loss of sensitive information from our customers or their customers. We routinely process, store and transmit large amounts of data for our customers, which includes sensitive and personally identifiable information. Loss or compromise of this data could cost us both monetarily and in terms of customer goodwill and lost business. Unauthorized access also potentially
18
could jeopardize the security of confidential information of our customers or our customers’ end-users, which might expose us to liability from customers and the government agencies that regulate us or our customers, as well as deter potential customers from renting our space and purchasing our services. For example, violations of HIPAA and its implementing regulations, as amended by the HITECH Act, can lead to fines of up to $1.5 million for identical violations of a particular provision in a calendar year. In addition, we cannot predict how future laws, regulations and standards, or future interpretations of current laws, regulations and standards, related to privacy and security will affect our business and we cannot predict the cost of compliance. We may be required to expend significant financial resources to protect against physical or cybersecurity breaches that could result in the misappropriation of our or our customers’ information. As techniques used to breach security change frequently, and generally are not recognized until launched against a target, we may not be able to implement security measures in a timely manner or, if and when implemented, we may not be able to determine the extent to which these measures could be circumvented. Any internal or external breach in our network could severely harm our business and result in costly litigation and potential liability for us. We also may be liable for, and suffer reputational harm if, any of our third-party service providers or subcontractors suffers security breaches. To the extent our customers demand that we accept unlimited liability and to the extent there is a competitive trend to accept it, such a trend could affect our ability to retain these limitations in our leases at the risk of losing the business. Such a trend may be particularly likely to occur with regard to our Cloud and Managed Services.
The loss of key personnel, including our executive officers, could have a material adverse effect on us.
Our continued success depends, to a significant extent, on the continued services of key personnel, particularly our executive officers, who have extensive market knowledge and long-standing business relationships. In particular, our reputation among and our relationships with our key customers are the direct result of a significant investment of time and effort by these individuals to build our credibility in a highly specialized industry. The loss of services of one or more key members of our executive management team could diminish our business and investment opportunities and our relationships with lenders, business partners and existing and prospective customers and could have a material adverse effect on us.
Any inability to recruit or retain qualified personnel, or maintain access to key third-party service providers and software developers, could have a material adverse effect on us.
We must continue to identify, hire, train, and retain IT professionals, technical engineers, operations employees, and sales and senior management personnel who maintain relationships with our customers and who can provide the technical, strategic and marketing skills required to grow our company, develop and expand our data centers, maximize our rental and services income and achieve the highest sustainable rent levels at each of our facilities. There is a shortage of qualified personnel in these fields, and we compete with other companies for the limited pool of these personnel. Competitive pressures may require that we enhance our pay and benefits package to compete effectively for such personnel. An increase in these costs or our inability to recruit and retain necessary technical, managerial, sales and marketing personnel or to maintain access to key third-party providers could have a material adverse effect on us. For example, for certain C3 products, we partner or collaborate with third parties such as software developers. Our failure to maintain such relationships could impact our ability to provide certain services, in particular, government-related services, which could have a material adverse effect on us.
We may be unable to identify and complete acquisitions on favorable terms or at all, which may inhibit our growth and have a material adverse effect on us.
We continually evaluate the market of available properties and businesses and may acquire additional properties and businesses when opportunities exist. Our ability to acquire properties and businesses on favorable terms is subject to the following significant risks:
|
· |
we may be unable to acquire a desired property or business because of competition from other real estate investors with significant resources and/or access to capital, including both publicly traded REITs and institutional investment funds; |
|
· |
even if we are able to acquire a desired property or business, competition from other potential acquirers may significantly increase the purchase price or result in other less favorable terms; |
|
· |
even if we enter into agreements for the acquisition of a desired property or business, these agreements are subject to customary conditions to closing, including completion of due diligence investigations to our satisfaction, and we may incur significant expenses for properties or businesses we never actually acquire; |
19
|
· |
we may be unable to finance acquisitions on favorable terms or at all; and |
|
· |
we may acquire properties subject to liabilities and without any recourse, or with only limited recourse, with respect to such liabilities such as liabilities for clean-up of environmental contamination, claims by customers, vendors or other persons dealing with the former owners of the properties and claims for indemnification by general partners, directors, officers and others indemnified by the former owners of the properties. |
Any inability to complete property or business acquisitions on favorable terms or at all could have a material adverse effect on us.
We may be unable to successfully integrate and operate acquired properties and achieve the intended benefits of our other acquisitions, which could have a material adverse effect on us.
Even if we are able to make acquisitions on favorable terms, our ability to successfully integrate and operate them is subject to various risks. We may be unable to accomplish the integration of an acquired property smoothly, successfully or within anticipated cost estimates. The diversion of our management’s attention from our operations to any such integration efforts, and any difficulties encountered, could prevent us from realizing the full benefits we anticipated to result from such acquisition and could have a material adverse effect on us. Additional risks include, among others:
|
· |
we may spend more than budgeted amounts to make necessary improvements or renovations to acquired properties, as well as require substantial management time and attention; |
|
· |
the inability to successfully integrate the operations, particularly acquisitions of operating businesses or portfolios of properties, into our existing operations, maintain consistent standards, controls, policies and procedures, or realize the benefits we anticipate of the acquisition within the anticipated timeframe or at all; |
|
· |
the inability to effectively monitor and manage our expanded business, retain customers, suppliers and business partners, attract new customers, retain key employees or attract highly qualified new employees; |
|
· |
anticipated future synergies, accretion, revenues, cost savings or operating metrics may fail to materialize or our estimates thereof may prove to be inaccurate; |
|
· |
the acquired business may fail to perform as expected; |
|
· |
certain portions of businesses we may acquire may be located in new markets, including foreign markets, in which we have not previously operated and in which we may face risks associated with an incomplete knowledge or understanding of the local market; |
|
· |
the market price of our common stock may decline if we do not achieve the benefits we anticipate of the transaction as rapidly or to the extent anticipated by financial or industry analysts or if the effect of the transaction on our financial results is not consistent with the expectations of financial or industry analysts; and |
|
· |
potential unknown liabilities with limited or no recourse against the seller and unforeseen increased expenses related to the acquisitions. |
We cannot assure you that we will be able to complete any integration without encountering difficulties or that any such difficulties will not have a material adverse effect on us. Failure to realize the intended benefits of an acquisition could have a material adverse effect on us.
We have international operations which exposes us to regulatory, currency, legal, tax and other risks distinct from those faced by us in the U.S.
Although our operations are primarily based in the United States, we also have a presence outside of the United States. Foreign operations involve risks not generally associated with investments in the United States, including:
|
· |
our limited knowledge of and relationships with customers, contractors, suppliers or other parties in these markets; |
|
· |
complexity and costs associated with managing international development and operations; |
|
· |
difficulty in hiring qualified management, sales and other personnel and service providers; |
|
· |
differing employment practices and labor issues; |
|
· |
multiple, conflicting and changing legal, regulatory, entitlement and permitting, and tax and treaty environments; |
|
· |
exposure to increased taxation, confiscation or expropriation; |
20
|
· |
currency transfer restrictions and limitations on our ability to distribute cash earned in foreign jurisdictions to the United States; |
|
· |
difficulty in enforcing agreements in non-U.S. jurisdictions, including those entered into in connection with our acquisitions or in the event of a default by one or more of our customers, suppliers or contractors; |
|
· |
compliance with anti-bribery and corruption laws; |
|
· |
local business and cultural factors; and |
|
· |
political and economic instability, including sovereign credit risk, in certain geographic regions. |
In addition, the GDPR, which will take effect in May 2018, will impose new privacy requirements as well as increase the likelihood of applicability of European law to entities established outside the EU but processing data of European data subjects. Also, while we have signed up to the EU-U.S. Privacy Shield Framework, which requires organizations operating in the United States to provide assurance that they are adhering to relevant European standards for data protection for such transfers, legal challenges have been brought in European courts seeking to declare the Privacy Shield Framework invalid under European law as a mechanism to legitimize transfers of personal data from the EU to the United States, which could require us to implement alternative means to address European cross border data transfer requirement. Our self-certification under the EU-U.S. Privacy Shield may not be sufficient to ensure compliance with GDPR. To the extent we are not in compliance with the GDPR, the EU authorities may investigate or bring enforcement actions against us that may result in criminal and administrative sanctions. Such actions could have a material adverse effect on us and harm our reputation
Our inability to overcome these risks could adversely affect our foreign operations and growth prospects and could have a material adverse effect on us.
We are exposed to ongoing litigation and other legal and regulatory actions, which may divert management’s time and attention, require us to pay damages and expenses or restrict the operation of our business.
We are subject to the risk of legal claims and proceedings and regulatory enforcement actions in the ordinary course of our business and otherwise, and we could incur significant liabilities and substantial legal fees as a result of these actions. Our management may devote significant time and attention to the resolution (through litigation, settlement or otherwise) of these actions, which would detract from our management’s ability to focus on our business. Any such resolution could involve payment of damages or expenses by us, which may be significant. In addition, any such resolution could involve our agreement to terms that restrict the operation of our business. The results of legal proceedings cannot be predicted with certainty. We cannot guarantee losses incurred in connection with any current or future legal or regulatory proceedings or actions will not exceed any provisions we may have set aside in respect of such proceedings or actions or will not exceed any available insurance coverage. The occurrence of any of these events could have a material adverse effect on us.
We may be subject to unknown or contingent liabilities related to properties or businesses that we acquire, which may result in damages and investment losses.
Assets and entities that we have acquired or may acquire in the future may be subject to unknown or contingent liabilities for which we may have limited or no recourse against the sellers. Unknown or contingent liabilities might include liabilities for clean-up or remediation of environmental conditions, claims of customers, vendors or other persons dealing with the acquired entities, tax liabilities and other liabilities whether incurred in the ordinary course of business or otherwise. In the future we may enter into transactions with limited representations and warranties or with representations and warranties that do not survive the closing of the transactions, in which event we would have no or limited recourse against the sellers of such properties. While we usually require the sellers to indemnify us with respect to breaches of representations and warranties that survive, such indemnification is often limited and subject to various materiality thresholds, a significant deductible or an aggregate cap on losses. As a result, there is no guarantee that we will recover any amounts with respect to losses due to breaches by the sellers of their representations and warranties. In addition, the total amount of costs and expenses that we may incur with respect to liabilities associated with acquired properties and entities may exceed our expectations. Finally, indemnification agreements between us and the sellers typically provide that the sellers will retain certain specified liabilities relating to the assets and entities acquired by us. While the sellers are generally contractually obligated to pay all losses and other expenses relating to such retained liabilities, there can be no guarantee that such arrangements will not require us to incur losses or other expenses as well. Any of these matters could have a material adverse effect on us.
21
Risks Related to Financing
An inability to access external sources of capital on favorable terms or at all could limit our ability to execute our business and growth strategies.
In order to qualify and maintain our qualification as a REIT, we are required under the Code to distribute at least 90% of our “REIT taxable income” (determined before the deduction for dividends paid and excluding net capital gains) annually. In addition, we will be subject to income tax at regular corporate rates to the extent that we distribute less than 100% of our “REIT taxable income,” including any net capital gains. In addition, QTS will be subject to a 4% nondeductible excise tax on the amount, if any, by which distributions paid by us in any calendar year are less than the sum of 85% of our ordinary income, 95% of our capital gain net income and 100% of our undistributed income from prior years. Because of these distribution requirements, we may not be able to fund future capital needs, including capital for development projects and acquisition opportunities, from operating cash flow. Consequently, we intend to rely on third-party sources of capital to fund a substantial amount of our future capital needs. We may not be able to obtain such financing on favorable terms or at all. Any additional debt we incur will increase our leverage, expose us to the risk of default and impose operating restrictions on us. In addition, any equity financing could be materially dilutive to the equity interests held by our stockholders. Our access to third-party sources of capital depends, in part, on general market conditions, the market’s perception of our growth potential, our leverage, our current and expected results of operations, liquidity, financial condition and cash distributions to stockholders and the market price of our common stock. If we cannot obtain capital when needed, we may not be able to execute our business and growth strategies (including redeveloping or acquiring properties when strategic opportunities exist), satisfy our debt service obligations, make the cash distributions to our stockholders necessary to qualify and maintain our qualification as a REIT (which would expose us to significant penalties and corporate level taxation), or fund our other business needs, which could have a material adverse effect on us.
Our indebtedness outstanding as of December 31, 2016 was approximately $965.8 million, which exposes us to interest rate fluctuations and the risk of default thereunder, among other risks.
Our indebtedness outstanding as of December 31, 2016 was approximately $965.8 million. Approximately $639.0 million of this indebtedness bears interest at a variable rate. Increases in interest rates, or the loss of the benefits of our existing or future hedging agreements, would increase our interest expense, which would adversely affect our cash flow and our ability to service our debt. Our organizational documents contain no limitations regarding the maximum level of indebtedness, as a percentage of our market capitalization or otherwise, that we may incur. We may incur significant additional indebtedness, including mortgage indebtedness, in the future. Our substantial outstanding indebtedness, and the limitations imposed on us by our debt agreements, could have other significant adverse consequences, including the following:
|
· |
our cash flow may be insufficient to meet our required principal and interest payments; |
|
· |
we may use a substantial portion of our cash flows to make principal and interest payments and we may be unable to obtain additional financing as needed or on favorable terms, which could, among other things, have a material adverse effect on our ability to complete our redevelopment pipeline, capitalize upon emerging acquisition opportunities, make cash distributions to our stockholders, or meet our other business needs; |
|
· |
we may be unable to refinance our indebtedness at maturity or the refinancing terms may be less favorable than the terms of our original indebtedness; |
|
· |
we may be forced to dispose of one or more of our properties, possibly on unfavorable terms or in violation of certain covenants to which we may be subject; |
|
· |
we may be required to maintain certain debt and coverage and other financial ratios at specified levels, thereby reducing our financial flexibility; |
|
· |
our vulnerability to general adverse economic and industry conditions may be increased; |
|
· |
greater exposure to increases in interest rates for our variable rate debt and to higher interest expense on future fixed rate debt; |
|
· |
we may be at a competitive disadvantage relative to our competitors that have less indebtedness; |
|
· |
our flexibility in planning for, or reacting to, changes in our business and the markets in which we operate may be limited; and |
|
· |
we may default on our indebtedness by failure to make required payments or violation of covenants, which would entitle holders of such indebtedness and possibly other indebtedness to accelerate the maturity of their |
22
indebtedness and, if such indebtedness is secured, to foreclose on our properties that secure their loans and receive an assignment of our rents and leases. |
The occurrence of any one of these events could have a material adverse effect on us. In addition, any foreclosure on our properties could create taxable income without accompanying cash proceeds, which could adversely affect our ability to meet the REIT distribution requirements imposed by the Code.
The agreements governing our existing indebtedness contain various covenants and other provisions which limit management’s discretion in the operation of our business, reduce our operational flexibility and create default risks.
The agreements governing our existing indebtedness contain, and agreements governing our future indebtedness may contain, covenants and other provisions that impose significant restrictions on us and our subsidiaries. These covenants restrict, among other things, our and our subsidiaries’ ability to:
|
· |
incur restrictions on the payment of dividends or other distributions from subsidiaries of the Operating Partnership; |
|
· |
merge or consolidate with other companies or transfer or sell all or substantially all of our assets. |
These covenants may restrict our ability to engage in certain transactions that may be in our best interest.
Our unsecured credit facility and the indenture governing our 5.875% Senior Notes due 2022 (the “Senior Notes”) also contain provisions that may limit QTS’ ability to make distributions to its stockholders and the Operating Partnership’s ability to make distributions to QTS. The unsecured credit facility generally provides that if a default occurs and is continuing, we will be precluded from making distributions on common stock and partnership interests, as applicable (other than those required to allow QTS to qualify and maintain its status as a REIT, so long as such default does not arise from a payment default or event of insolvency) and lenders under the unsecured credit facility and, potentially, other indebtedness, could accelerate the maturity of the related indebtedness. The unsecured credit facility also contains covenants providing for a maximum distribution of the greater of (i) 95% of our “Funds from Operations” (as defined in the agreement) and (ii) the amount required for us to qualify as a REIT. The indenture governing the Senior Notes contains provisions that restrict the Operating Partnership’s ability to make distributions to QTS, except distributions required to allow QTS to qualify and maintain its status as a REIT, so long as no event of default has occurred and is continuing.
These covenants could impair our ability to grow our business, take advantage of attractive business opportunities or successfully compete. In addition, failure to meet the covenants may result in an event of default under the applicable indebtedness, which could result in the acceleration of the applicable indebtedness and potentially other indebtedness, which could have a material adverse effect on us.
The documents that govern our outstanding indebtedness require that we maintain certain financial ratios and, if we fail to do so, we will be in default under the applicable debt instrument, which in turn could trigger defaults under our other debt instruments, which could result in the maturities of all of our debt obligations being accelerated.
Each of our significant debt instruments requires that we maintain certain financial ratios. In addition, the indenture that governs the Senior Notes requires the Operating Partnership and its restricted subsidiaries to maintain total unencumbered assets of at least 150% of the aggregate principal amount of all of their outstanding unsecured indebtedness. Our ability to comply with these ratios or tests may be affected by events beyond our control, including prevailing economic, financial and industry conditions. A breach of any of these covenants or covenants under any other agreements governing our indebtedness could result in an event of default. Such a default may allow the creditors, if the agreements so provide, to declare the related debt immediately due and payable as well as any other debt to which a cross-acceleration or cross-default provision applies. In addition, lenders may have the right in these circumstances to terminate any commitments they have to provide further borrowings. Our assets and cash flow may not be sufficient to
23
fully repay borrowings under our outstanding debt agreements if accelerated upon an event of default. These events would also have a material adverse effect on our liquidity.
Any hedging transactions involve costs and expose us to potential losses.
Hedging agreements enable us to convert floating rate liabilities to fixed rate liabilities or fixed rate liabilities to floating rate liabilities. Hedging transactions expose us to certain risks, including that losses on a hedge position may reduce the cash available for distribution to stockholders and such losses may exceed the amount invested in such instruments and that counterparties to such agreements could default on their obligations, which could increase our exposure to fluctuating interest rates. In addition, hedging agreements may involve costs, such as transaction fees or breakage costs, if we terminate them. In addition, we have used interest rate swaps in the past to hedge our exposure to interest rate fluctuations and may use interest rate swaps or other forms of hedging again in the future. The REIT rules impose certain restrictions on our ability to utilize hedges, swaps and other types of derivatives to hedge our liabilities. We may use hedging instruments in our risk management strategy to limit the effects of changes in interest rates on our operations. However, future hedges may be ineffective in eliminating all of the risks inherent in any particular position due to the fact that, among other things, the duration of the hedge may not match the duration of the related liability, the credit quality of the hedging counterparty owing money on the hedge may be downgraded to such an extent that it impairs our ability to sell or assign our side of the hedging transaction and the hedging counterparty owing money in the hedging transaction may default on its obligation to pay. The use of derivatives could have a material adverse effect on us.
Risks Related to the Real Estate Industry
The operating performance and value of our properties are subject to risks associated with the real estate industry, and we cannot assure you that we will execute our business and growth strategies successfully.
As a real estate company, we are subject to all of the risks associated with owning and operating real estate, including:
|
· |
adverse changes in international, national or local economic and demographic conditions; |
|
· |
vacancies or our inability to rent space on favorable terms, including possible market pressures to offer customers rent abatements, customer improvements, early termination rights or below-market renewal options; |
|
· |
adverse changes in the financial condition or liquidity of buyers, sellers and customers (including their ability to pay rent to us) of properties, including data centers; |
|
· |
the attractiveness of our properties to customers; |
|
· |
competition from other real estate investors with significant resources and assets to capital, including other real estate operating companies, publicly traded REITs and institutional investment funds; |
|
· |
reductions in the level of demand for data center space; |
|
· |
increases in the supply of data center space; |
|
· |
fluctuations in interest rates, which could have a material adverse effect on our ability, or the ability of buyers and customers of properties, including data centers, to obtain financing on favorable terms or at all; |
|
· |
increases in expenses that are not paid for by or cannot be passed on to our customers, such as the cost of complying with laws, regulations and governmental policies; |
|
· |
the relative illiquidity of real estate investments, especially the specialized real estate properties that we hold and seek to acquire and develop; |
|
· |
changes in, and changes in enforcement of, laws, regulations and governmental policies, including, without limitation, health, safety, environmental, zoning and tax laws, and governmental fiscal policies; |
|
· |
property restrictions and/or operational requirements pursuant to restrictive covenants, reciprocal easement agreements, operating agreements or historical landmark designations; and |
|
· |
civil unrest, acts of war, terrorist attacks and natural disasters, including earthquakes, tornados, hurricanes and floods, which may result in uninsured and underinsured losses. |
In addition, periods of economic slowdown or recession, rising interest rates or declining demand for real estate, or the public perception that any of these events may occur, could result in a general decline in occupancy and rental sales, and therefore revenues, or an increased incidence of defaults under existing leases. Accordingly, we cannot assure you that we will be able to execute our business and growth strategies. Any inability to operate our properties to meet our financial, operational and strategic expectations could have a material adverse effect on us.
24
The illiquidity of real estate investments could significantly impede our ability to respond to adverse changes in economic, financial, investment and other conditions.
Because real estate investments are relatively illiquid, our ability to promptly sell one or more properties in our portfolio in response to changing economic, financial, investment or other conditions is limited. The real estate market is affected by many factors that are beyond our control, including those described above. In particular, data centers represent a particularly illiquid part of the overall real estate market. This illiquidity is driven by a number of factors, including the relatively small number of potential purchasers of such data centers—including other data center operators and large corporate users—and the relatively high cost per square foot to develop data centers, which substantially limits a potential buyer’s ability to purchase a data center property with the intention of redeveloping it for an alternative use, such as an office building, or may substantially reduce the price buyers are willing to pay. Our inability to dispose of properties at opportune times or on favorable terms could have a material adverse effect on us.
In addition, the Code imposes restrictions on a REIT’s ability to dispose of properties that are not applicable to other types of real estate companies. In particular, the tax laws applicable to REITs require that we hold our properties for investment, rather than primarily for sale in the ordinary course of business, which may cause us to forego or defer sales of properties that otherwise would be in our best interest. Therefore, we may not be able to vary our portfolio in response to economic, financial, investment or other conditions promptly or on favorable terms, which could have a material adverse effect on us.
Declining real estate valuations could result in impairment charges, the determination of which involves a significant amount of judgment on our part. Any impairment charge could have a material adverse effect on us.
We review our properties for impairment on a quarterly and annual basis and whenever events or changes in circumstances indicate that the carrying amount may not be recoverable. Indicators of impairment include, but are not limited to, a sustained significant decrease in the market price of or the cash flows expected to be derived from a property. A significant amount of judgment is involved in determining the presence of an indicator of impairment. If the total of the expected undiscounted future cash flows is less than the carrying amount of a property on our balance sheet, a loss is recognized for the difference between the fair value and carrying value of the property. The evaluation of anticipated cash flows requires a significant amount of judgment regarding assumptions that could differ materially from actual results in future periods, including assumptions regarding future occupancy, rental rates and capital requirements. Any impairment charge could have a material adverse effect on us.
Increased tax rates and reassessments could significantly increase our property taxes and have a material adverse effect on us.
Each of our properties is subject to real and personal property taxes. These taxes may increase as tax rates change and as the properties are assessed or reassessed by taxing authorities. It is likely that the properties will be reassessed by taxing authorities as a result of (i) the acquisition of the properties by us and (ii) the informational returns that we must file in connection with the formation transactions. Any increase in property taxes on the properties could have a material adverse effect on us.
If California changes its property tax scheme, our California properties could be subject to significantly higher tax levies.
Owners of California property are subject to particularly high property taxes. Voters in the State of California previously passed Proposition 13, which generally limits annual real estate tax increases to 2% of assessed value per annum. From time to time, various groups have proposed repealing Proposition 13, or providing for modifications such as a “split roll tax,” whereby commercial property, for example, would be taxed at a higher rate than residential property. Given the uncertainty, it is not possible to quantify the risk to us of a tax increase or the resulting impact on us of any increase, but any tax increase could be significant at our California properties.
Uninsured and underinsured losses could have a material adverse effect on us.
We carry comprehensive liability, fire, extended coverage, earthquake, business interruption and rental loss insurance with respect to our properties, and cybersecurity insurance and we plan to obtain similar coverage for properties we acquire in the future. However, certain types of losses, generally of a catastrophic nature, such as earthquakes and floods,
25
may be either uninsurable or not economically insurable. Should a property sustain damage, we may incur losses due to insurance deductibles, to co-payments on insured losses or to uninsured losses. In the event of a substantial property loss, the insurance coverage may not be sufficient to pay the full current market value or current replacement cost of the property. Inflation, changes in building codes and ordinances, environmental considerations, and other factors also might make it infeasible to use insurance proceeds to replace a property after it has been damaged or destroyed. Under such circumstances, the insurance proceeds we receive might not be adequate to restore our economic position with respect to such property. Lenders may require such insurance and our failure to obtain such insurance may constitute default under loan agreements, which could have a material adverse effect on us. Finally, a disruption in the financial markets may make it more difficult to evaluate the stability, net assets and capitalization of insurance companies and any insurer’s ability to meet its claim payment obligations. A failure of an insurance company to make payments to us upon an event of loss covered by an insurance policy could have a material adverse effect on us. In the event of an uninsured or partially insured loss, we could lose some or all of our capital investment, cash flow and revenues related to one or more properties, which could also have a material adverse effect on us.
As the current or former owner or operator of real property, we could become subject to liability for environmental contamination, regardless of whether we caused such contamination, which could have a material adverse effect on us.
Under various federal, state and local statutes, regulations and ordinances relating to the protection of the environment, a current or former owner or operator of real property may be liable for the cost to remove or remediate contamination resulting from the presence or discharge of hazardous substances, wastes or petroleum products on, under, from or in such property. These costs could be substantial, liability under these laws may attach without regard to whether the owner or operator knew of, or was responsible for, the presence of the contaminants, and the liability may be joint and several. Most of our properties presently contain large underground or above ground fuel storage tanks used to fuel generators for emergency power, which is critical to our operations. If any of the tanks that we own or operate releases fuel to the environment, we would likely have to pay to clean up the contamination. In addition, prior owners and operators used some of our current properties for industrial and commercial purposes, which could have resulted in environmental contamination, including our Irving and Richmond data center properties, which were previously used as semiconductor plants. Moreover, the presence of contamination or the failure to remediate contamination at our properties may (1) expose us to third-party liability, (2) subject our properties to liens in favor of the government for damages and costs the government incurs in connection with the contamination, (3) impose restrictions on the manner in which a property may be used or businesses may be operated, or (4) materially adversely affect our ability to sell, lease or develop the real estate or to borrow using the real estate as collateral. In addition, there may be material environmental liabilities at our properties of which we are not aware. We also may be liable for the costs of remediating contamination at off-site facilities at which we have arranged, or will arrange, for disposal or treatment of our hazardous substances without regard to whether we complied or will comply with environmental laws in doing so. Any of these matters could have a material adverse effect on us.
We could become subject to liability for failure to comply with environmental, health and safety requirements or zoning laws, which could cause us to incur additional expenses.
Our properties are subject to federal, state and local environmental, health and safety laws and regulations and zoning requirements, including those regarding the handling of regulated substances and wastes, emissions to the environment and fire codes. For instance, our properties are subject to regulations regarding the storage of petroleum for auxiliary or emergency power and air emissions arising from the use of power generators. In particular, generators at our data center facilities are subject to strict emissions limitations, which could preclude us from using critical back-up systems and lead to significant business disruptions at such facilities and loss of our reputation. If we exceed these emissions limits, we may be exposed to fines and/or other penalties. In addition, we lease some of our properties to our customers who also are subject to such environmental, health and safety laws and zoning requirements. If we, or our customers, fail to comply with these various laws and requirements, we might incur costs and liabilities, including governmental fines and penalties. Moreover, we do not know whether existing laws and requirements will change or, if they do, whether future laws and requirements will require us to make significant unanticipated expenditures that could have a material adverse effect on us. Environmental noncompliance liability also could affect a customer’s ability to make rental payments to us.
26
We could become subject to liability for asbestos-containing building materials in the buildings on our property, which could cause us to incur additional expenses.
Some of our properties may contain, or may have contained, asbestos-containing building materials. Environmental, health and safety laws require that owners or operators of or employers in buildings with asbestos-containing materials (“ACM”) properly manage and maintain these materials, adequately inform or train those who may come into contact with ACM and undertake special precautions, including removal or other abatement, in the event that ACM is disturbed during building maintenance, renovation or demolition. These laws may impose fines and penalties on employers, building owners or operators for failure to comply with these laws. In addition, third parties may seek recovery from employers, owners or operators for personal injury associated with exposure to asbestos. If we become subject to any of these penalties or other liabilities as a result of ACM at one or more of our properties, it could have a material adverse effect on us.
Our properties may contain or develop harmful mold or suffer from other adverse conditions, which could lead to liability for adverse health effects and costs of remediation.
When excessive moisture accumulates in buildings or on building materials, mold growth may occur, particularly if the moisture problem remains undiscovered or is not addressed over a period of time. Some molds may produce airborne toxins or irritants. Indoor air quality issues also can stem from inadequate ventilation, chemical contamination from indoor or outdoor sources and other biological contaminants such as pollen, viruses and bacteria. Indoor exposure to airborne toxins or irritants above certain levels can be alleged to cause a variety of adverse health effects and symptoms, including allergic or other reactions. As a result, the presence of significant mold or other airborne contaminants at any of our properties could require us to undertake a costly remediation program to contain or remove the mold or other airborne contaminants from the affected property or increase indoor ventilation. In addition, the presence of significant mold or other airborne contaminants could expose us to liability from our customers, employees of our customers and others if property damage or personal injury occurs. Thus, conditions related to mold or other airborne contaminants could have a material adverse effect on us.
Laws, regulations or other issues related to climate change could have a material adverse effect on us.
If we, or other companies with which we do business, particularly utilities that provide our facilities with electricity, become subject to laws or regulations related to climate change, it could have a material adverse effect on us. The United States may enact new laws, regulations and interpretations relating to climate change, including potential cap-and-trade systems, carbon taxes and other requirements relating to reduction of carbon footprints and/or greenhouse gas emissions. Other countries have enacted climate change laws and regulations and the United States has been involved in discussions regarding international climate change treaties. The federal government and some of the states and localities in which we operate have enacted certain climate change laws and regulations and/or have begun regulating carbon footprints and greenhouse gas emissions. Although these laws and regulations have not had any known material adverse effect on us to date, they could limit our ability to develop new facilities or result in substantial costs, including compliance costs, retrofit costs and construction costs, monitoring and reporting costs and capital expenditures for environmental control facilities and other new equipment. In addition, these laws and regulations could lead to increased costs for the electricity that we require to conduct our operations. Furthermore, our reputation could be damaged if we violate climate change laws or regulations. We cannot predict how future laws and regulations, or future interpretations of current laws and regulations, related to climate change will affect our business, results of operations, liquidity and financial condition. Lastly, the potential physical impacts of climate change on our operations are highly uncertain, and would be particular to the geographic circumstances in areas in which we operate. These may include changes in rainfall and storm patterns and intensities, water shortages, changing sea levels and changing temperatures. Any of these matters could have a material adverse effect on us.
We may incur significant costs complying with various federal, state and local regulations, which could have a material adverse effect on us.
The properties in our portfolio are subject to various federal, state and local laws, including the Americans with Disabilities Act (“ADA”) as well as state and local fire and life safety requirements. Under the ADA, all places of public accommodation and commercial facilities must meet federal requirements related to access and use by disabled persons. A number of additional federal, state and local regulations may also require modifications to our properties, or restrict our ability to renovate our properties. If we fail to comply with these various requirements, we might incur governmental
27
fines or private damage awards. We cannot predict the ultimate amount of the cost of compliance with the ADA or other legislation. In addition, we do not know whether existing requirements will change, or if they do, whether future requirements will require us to make significant unanticipated expenditures that could have a material adverse effect on us.
Risks Related to Our Organizational Structure
As of December 31, 2016, Chad L. Williams, our Chairman and Chief Executive Officer, owned approximately 12.4% of QTS’ outstanding common stock on a fully diluted basis and has the ability to exercise significant influence on the company and any matter presented to its stockholders.
As of December 31, 2016, Chad L. Williams, our Chairman and Chief Executive Officer owned approximately 12.4% of QTS’ outstanding common stock on a fully diluted basis. No other stockholder is permitted to own more than 7.5% of the aggregate of the outstanding shares of its common stock, except for certain designated investment entities that may own up to 9.8% of the aggregate of the outstanding shares of its common stock, subject to certain conditions, and except as approved by the board of directors pursuant to the terms of QTS’ charter. Consequently, Mr. Williams may be able to significantly influence the outcome of matters submitted for stockholder action, including the election of the board of directors and approval of significant corporate transactions, such as business combinations, consolidations and mergers, as well as the determination of its day-to-day business decisions and management policies. As a result, Mr. Williams could exercise his influence on QTS in a manner that conflicts with the interests of other stockholders. Moreover, if Mr. Williams were to sell, or otherwise transfer, all or a large percentage of his holdings, the market price of QTS’ common stock could decline and QTS could find it difficult to raise the capital necessary for it to execute its business and growth strategies.
In addition to the foregoing, Mr. Williams has a significant vote in matters submitted to a vote of stockholders as a result of his ownership of Class B common stock (which gives Mr. Williams voting power equal to his economic interest in QTS as if he had exchanged all of his OP units for shares of Class A common stock), including the election of directors. Mr. Williams may have interests that differ from holders of QTS’ Class A common stock, including by reason of his remaining interest in the Operating Partnership, and may accordingly vote in ways that may not be consistent with the interests of holders of Class A common stock.
Our tax protection agreement, during its term, could limit our ability to sell or otherwise dispose of certain properties and may require the Operating Partnership to maintain certain debt levels and agree to certain terms with lenders that otherwise would not be required to operate our business.
In connection with the IPO, we entered into a tax protection agreement with Chad L. Williams, our Chairman and Chief Executive Officer, and his affiliates and family members who own OP units that provides that if (1) we sell, exchange, transfer, convey or otherwise dispose of our Atlanta-Metro, Atlanta-Suwanee or Santa Clara data centers in a taxable transaction prior to January 1, 2026, referred to as the protected period, (2) cause or permit any transaction that results in the disposition by Mr. Williams or his affiliates and family members who own OP units of all or any portion of their interests in the Operating Partnership in a taxable transaction during the protected period or (3) fail prior to the expiration of the protected period to maintain approximately $175 million of indebtedness that would be allocable to Mr. Williams and his affiliates for tax purposes or, alternatively, fail to offer Mr. Williams and his affiliates and family members who own OP units the opportunity to guarantee specific types of the Operating Partnership’s indebtedness in order to enable them to continue to defer certain tax liabilities, we will indemnify Mr. Williams and his affiliates and family members who own OP units against certain resulting tax liabilities. Therefore, although it may be in our stockholders’ best interests that we sell, transfer, convey or otherwise dispose of one of these properties, it may be economically prohibitive for us to do so during the protected period because of these indemnity obligations. Moreover, these obligations may require us to maintain more or different indebtedness or agree to terms with our lenders that we would not otherwise agree to. As a result, the tax protection agreement will, during its term, restrict our ability to take actions or make decisions that otherwise would be in our best interests. As of December 31, 2016, our Atlanta-Metro, Atlanta-Suwanee and Santa Clara data centers represented approximately 47% of our annualized rent.
28
QTS’ charter and Maryland law contain provisions that may delay, defer or prevent a change in control of our company, even if such a change in control may be in your interest, and as a result may depress our common stock price.
The stock ownership limits imposed by the Code for REITs and imposed by QTS’ charter may restrict our business combination opportunities that might involve a premium price for shares of our common stock or otherwise be in the best interest of our stockholders.
In order for QTS to maintain its qualification as a REIT under the Code, not more than 50% in value of our outstanding stock may be owned, directly or indirectly, by five or fewer individuals (defined in the Code to include certain entities) at any time during the last half of each taxable year. QTS’ charter, with certain exceptions, authorizes our board of directors to take the actions that are necessary and desirable to preserve our qualification as a REIT. Unless exempted by our board of directors, no person may actually or constructively own more than 7.5% of the aggregate of the outstanding shares of our common stock by value or by number of shares, whichever is more restrictive, or 7.5% of the aggregate of the outstanding shares of our preferred stock by value or by number of shares, whichever is more restrictive. However, certain entities that are defined as designated investment entities in our charter, which generally includes pension funds, mutual funds and certain investment management companies, are permitted to own up to 9.8% of the aggregate of the outstanding shares of our common stock or preferred stock, so long as each beneficial owner of the shares owned by such designated investment entity would satisfy the 7.5% ownership limit if those beneficial owners owned directly their proportionate share of the common stock owned by the designated investment entity.
In addition, QTS’ charter provides an excepted holder limit that allows Chad L. Williams, his family members and entities owned by or for the benefit of them, and any person who is or would be a beneficial owner or constructive owner of shares of our common stock as a result of the beneficial ownership or constructive ownership of shares of our common stock by Chad L. Williams, his family members and certain entities controlled by them, as a group, to own more than 7.5% of the aggregate of the outstanding shares of our common stock, so long as, under the applicable tax attribution rules, no one such excepted holder treated as an individual would hold more than 19.8% of the aggregate of the outstanding shares of our common stock, no two such excepted holders treated as individuals would own more than 27.3% of the aggregate of the outstanding shares of our common stock, no three such excepted holders treated as individuals would own more than 34.8% of the aggregate of the outstanding shares of our common stock, no four such excepted holders treated as individuals would own more than 42.3% of the aggregate of the outstanding shares of our common stock and no five such excepted holders treated as individuals would own more than 49.8% of the aggregate of the outstanding shares of our common stock. Currently, Chad L. Williams would be attributed all of the shares of common stock owned by each such other excepted holder and, accordingly, the Williams excepted holders as a group would not be allowed to own in excess of 19.8% of the aggregate of the outstanding shares of our common stock. If at a later time, there were not one excepted holder that would be attributed all of the shares owned by such excepted holders as a group, the excepted holder limit as applied to the Williams group would not permit each such excepted holder to own 19.8% of the aggregate of the outstanding shares of our common stock. Rather, the excepted holder limit as applied to the Williams group would prevent two or more such excepted holders who are treated as individuals under the applicable tax attribution rules from owning a higher percentage of our common stock than the maximum amount of shares that could be owned by any one such excepted holder (19.8%), plus the maximum amount of shares of common stock that could be owned by any one or more other individual common stockholders who are not excepted holders (7.5%). Our board of directors may, in its sole discretion, grant other exemptions to the stock ownership limits, subject to such conditions and the receipt by our board of directors of certain representations and undertakings.
In addition to these ownership limits, our charter also prohibits any person from (a) beneficially or constructively owning, as determined by applying certain attribution rules of the Code, our stock that would result in us being “closely held” under Section 856(h) of the Code or that would otherwise cause us to fail to qualify as a REIT, (b) transferring stock if such transfer would result in our stock being owned by fewer than 100 persons, (c) beneficially or constructively owning shares of our capital stock that would result in us owning (directly or indirectly) an interest in a tenant if the income derived by us from that tenant for our taxable year during which such determination is being made would reasonably be expected to equal or exceed the lesser of one percent of our gross income or an amount that would cause us to fail to satisfy any of the REIT gross income requirements and (d) beneficially or constructively owning shares of our capital stock that would cause us otherwise to fail to qualify as a REIT. The ownership limits imposed under the Code are based upon direct or indirect ownership by “individuals,” but only during the last half of a tax year. The ownership limits contained in our charter key off of the ownership at any time by any “person,” which term includes entities. These ownership limitations in our charter are common in REIT charters and are intended to provide added
29
assurance of compliance with the tax law requirements, and to minimize administrative burdens. However, the ownership limits on our common stock also might delay, defer or prevent a transaction or a change in control of our company that might involve a premium price for shares of our common stock or otherwise be in the best interest of our stockholders.
Our authorized but unissued shares of common and preferred stock may prevent a change in control of our Company that might involve a premium price for shares of our common stock or otherwise be in the best interest of our stockholders.
QTS’ charter authorizes QTS to issue additional shares of common and preferred stock. In addition, our board of directors may, without stockholder approval, amend QTS’ charter to increase the aggregate number of shares of our common stock or the number of shares of stock of any class or series that we have authority to issue and classify or reclassify any unissued shares of common or preferred stock and set the preferences, rights and other terms of the classified or reclassified shares; provided that our board of directors may not amend QTS’ charter to increase the aggregate number of shares of Class B common stock that we have the authority to issue or reclassify any shares of our capital stock as Class B common stock without stockholder approval. As a result, our board of directors may establish a series of shares of common or preferred stock that could delay, defer or prevent a transaction or a change in control of our company that might involve a premium price for shares of our common stock or otherwise be in the best interest of our stockholders. In addition, any preferred stock that we issue would rank senior to our common stock with respect to the payment of distributions and other amounts (including upon liquidation), in which case we could not pay any distributions on our common stock until full distributions have been paid with respect to such preferred stock.
Certain provisions of Maryland law could inhibit a change in control of our Company.
Certain provisions of the Maryland General Corporation Law (the “MGCL”) may have the effect of deterring a third party from making a proposal to acquire us or of impeding a change in control under circumstances that otherwise could provide the holders of our common stock with the opportunity to realize a premium over the then-prevailing market price of our common stock. Our board of directors may elect to become subject to the “business combination” provisions of the MGCL that, subject to limitations, prohibit certain business combinations (including a merger, consolidation, share exchange, or, in circumstances specified in the statute, an asset transfer or issuance or reclassification of equity securities) between us and an “interested stockholder” (defined generally as any person who beneficially owns 10% or more of our then outstanding voting capital stock or an affiliate or associate of ours who, at any time within the two-year period prior to the date in question, was the beneficial owner of 10% or more of our then-outstanding voting capital stock) or an affiliate thereof for five years after the most recent date on which the stockholder becomes an interested stockholder. After the five-year prohibition, any business combination between us and an interested stockholder generally must be recommended by our board of directors and approved by the affirmative vote of at least (1) 80% of the votes entitled to be cast by holders of outstanding shares of our voting capital stock; and (2) two-thirds of the votes entitled to be cast by holders of voting capital stock of the corporation other than shares held by the interested stockholder with whom or with whose affiliate the business combination is to be effected or held by an affiliate or associate of the interested stockholder. These super-majority vote requirements do not apply if our common stockholders receive a minimum price, as defined under Maryland law, for their shares in the form of cash or other consideration in the same form as previously paid by the interested stockholder for its shares. These provisions of the MGCL do not apply, however, to business combinations that are approved or exempted by a board of directors prior to the time that the interested stockholder becomes an interested stockholder. Pursuant to the statute, our board of directors has by resolution opted out of the business combination provisions of the MGCL and, consequently, the five-year prohibition and the supermajority vote requirements will not apply to business combinations between us and an interested stockholder, unless our board in the future alters or repeals this resolution. We cannot assure that you that our board of directors will not determine to become subject to such business combination provisions in the future. However, an alteration or repeal of this resolution will not have any effect on any business combinations that have been consummated or upon any agreements existing at the time of such modification or repeal.
The “control share” provisions of the MGCL provide that “control shares” of a Maryland corporation (defined as shares which, when aggregated with other shares controlled by the stockholder (except solely by virtue of a revocable proxy), entitle the stockholder to exercise one of three increasing ranges of voting power in electing directors) acquired in a “control share acquisition” (defined as the direct or indirect acquisition of ownership or control of issued and outstanding “control shares”) have no voting rights except to the extent approved by our stockholders by the affirmative vote of at least two-thirds of all the votes entitled to be cast on the matter, excluding votes entitled to be cast by the acquirer of
30
control shares, our officers and our personnel who are also our directors. Our bylaws contain a provision exempting from the control share acquisition statute any and all acquisitions by any person of shares of our stock. There can be no assurance that this provision will not be amended or eliminated at any time in the future.
Certain provisions of the MGCL permit our board of directors, without stockholder approval and regardless of what is currently provided in our charter or bylaws, to adopt certain provisions, some of which (for example, a classified board) we do not yet have, that may have the effect of limiting or precluding a third party from making an acquisition proposal for us or of delaying, deferring or preventing a change in control of our company under circumstances that otherwise could provide the holders of shares of our common stock with the opportunity to realize a premium over the then current market price. For example, our charter contains a provision whereby we have elected to be subject to the provisions of Title 3, Subtitle 8 of the MGCL, which provides that only our board of directors has the authority to fill vacancies on our board of directors.
Certain provisions in the partnership agreement of the Operating Partnership may delay, defer or prevent unsolicited acquisitions of us or changes in our control.
Provisions in the partnership agreement of the Operating Partnership may delay, defer or prevent unsolicited acquisitions of us or changes in our control. These provisions include, among others:
|
· |
redemption rights of qualifying parties; |
|
· |
a requirement that we may not be removed as the general partner of the Operating Partnership without our consent; |
|
· |
transfer restrictions on our OP units; |
|
· |
our inability, as general partner, in some cases, to amend the partnership agreement without the consent of the limited partners; and |
|
· |
the right of the limited partners to consent to transfers of the general partnership interest and mergers under specified circumstances. |
These provisions could discourage third parties from making proposals involving an unsolicited acquisition of us or change of our control, although some stockholders might consider such proposals, if made, desirable.
QTS’ charter and bylaws, the partnership agreement of the Operating Partnership and Maryland law also contain other provisions that may delay, defer or prevent a transaction or a change in control of our company that might involve a premium price for our common stock or that our stockholders otherwise believe to be in their best interests.
Our Chairman and Chief Executive Officer has outside business interests that could require time and attention and may interfere with his ability to devote time to our business.
Chad L. Williams, our Chairman and Chief Executive Officer, has outside business interests that could require his time and attention. These interests include the ownership of our Overland Park, Kansas facility, at which our corporate headquarters is also located (which is leased to us), and certain office and other properties and certain other non-real estate business ventures. Mr. Williams’ employment agreement requires that he devote substantially all of his time to our company, provided that he will be permitted to engage in other specified activities, including the management of personal investments and affairs, including active involvement in real estate or other investments not involving data centers in any material respect. Mr. Williams also may have fiduciary obligations associated with these business interests that interfere with his ability to devote time to our business and that could have a material adverse effect on us.
If we fail to maintain an effective system of integrated internal controls, we may not be able to accurately and timely report our financial results.
An inability to maintain effective disclosure controls and procedures and internal control over financial reporting could adversely affect our results of operation, could cause us to fail to meet our reporting obligations under the Exchange Act on a timely basis or could result in material misstatements or omissions in our Exchange Act reports (including our financial statements), any of which, as well as the perception thereof, could cause investors to lose confidence in the company and could have a material adverse effect on us and cause the market price of our common stock to decline significantly.
31
Conflicts of interest exist or could arise in the future with holders of OP units, which may impede business decisions that could benefit our stockholders.
Conflicts of interest exist or could arise in the future as a result of the relationships between QTS and its affiliates, on the one hand, and the Operating Partnership or any partner thereof, on the other. Our directors and officers have duties to QTS and its stockholders under applicable Maryland law in connection with their management of our company. At the same time, we, as general partner, have fiduciary duties to the Operating Partnership and to its limited partners under Maryland law in connection with the management of the Operating Partnership. QTS’ duties as general partner to the Operating Partnership and its partners may come into conflict with the duties of our directors and officers to our company and our stockholders. These conflicts may be resolved in a manner that is not in the best interest of stockholders.
Additionally, the partnership agreement expressly limits our liability by providing that QTS and its officers, directors, agents and employees will not be liable or accountable to the Operating Partnership for losses sustained, liabilities incurred or benefits not derived if we or such officer, director, agent or employee acted in good faith. In addition, the Operating Partnership is required to indemnify QTS, and its officers, directors, agents, employees and designees to the extent permitted by applicable law from and against any and all claims arising from operations of the Operating Partnership, unless it is established that (1) the act or omission was committed in bad faith, was fraudulent or was the result of active and deliberate dishonesty, (2) the indemnified party received an improper personal benefit in money, property or services or (3) in the case of a criminal proceeding, the indemnified person had reasonable cause to believe that the act or omission was unlawful. The provisions of Maryland law that allow the fiduciary duties of a general partner to be modified by a partnership agreement have not been resolved in a court of law, and we have not obtained an opinion of counsel covering the provisions set forth in the partnership agreement that purport to waive or restrict our fiduciary duties that would be in effect were it not for the partnership agreement.
Our rights and the rights of our stockholders to take action against our directors and officers are limited, which could limit our stockholders’ recourse in the event of actions not in our stockholders’ best interests.
Under Maryland law generally, a director is required to perform his or her duties in good faith, in a manner he or she reasonably believes to be in the best interests of our company and with the care that an ordinarily prudent person in a like position would use under similar circumstances. Under Maryland law, directors are presumed to have acted with this standard of care. In addition, our charter limits the liability of our directors and officers to us and our stockholders for money damages, except for liability resulting from:
|
· |
actual receipt of an improper benefit or profit in money, property or services; or |
|
· |
active and deliberate dishonesty by the director or officer that was established by a final judgment as being material to the cause of action adjudicated. |
QTS’ charter obligates QTS to indemnify its directors and officers for actions taken by them in those capacities to the maximum extent permitted by Maryland law. QTS’ bylaws require it to indemnify each director or officer, to the maximum extent permitted by Maryland law, in the defense of any proceeding to which he or she is made, or threatened to be made, a party by reason of his or her service to us. In addition, QTS may be obligated to advance the defense costs incurred by its directors and officers. As a result, QTS and its stockholders may have more limited rights against its directors and officers than might otherwise exist absent the current provisions in QTS’ charter and bylaws or that might exist with other companies.
Our board of directors may change our policies and practices and enter into new lines of business without a vote of our stockholders, which limits your control of our policies and practices and could have a material adverse effect on us.
Our major policies, including our policies and practices with respect to investments, financing, growth and capitalization, are determined by our board of directors. Our board of directors may change these and other policies from time to time or enter into new lines of business, at any time, without the consent of our stockholders. Accordingly, our stockholders will have limited control over changes in our policies. These changes could result in our making investments and engaging in business activities that are different from, and possibly riskier than, the investments and business activities described in this Form 10-K. A change in our policies and procedures or our entry into new lines of
32
business may increase our exposure to other risks or real estate market fluctuations and could have a material adverse effect on us.
Risks Related to our Class A Common Stock
Our cash available for distribution to stockholders may not be sufficient to pay distributions at expected or REIT-required levels, or at all, and we may need to borrow or rely on other third-party capital in order to make such distributions, as to which no assurance can be given, which could cause the market price of our common stock to decline significantly.
We intend to continue to pay regular quarterly distributions to our stockholders. However, no assurance can be given that our estimated cash available for distribution to our stockholders will be accurate or that our actual cash available for distribution to our stockholders will be sufficient to pay distributions to them at any expected or REIT-required level or at any particular yield, or at all. Accordingly, we may need to borrow or rely on other third-party capital to make distributions to our stockholders, and such third-party capital may not be available to us on favorable terms or at all. As a result, we may not be able to pay distributions to our stockholders in the future. Our failure to pay any such distributions or to pay distributions that fail to meet our stockholders’ expectations from time to time or the distribution requirements for a REIT could cause the market price of our common stock to decline significantly. All distributions will be made at the discretion of our board of directors and will depend on our historical and projected results of operations, liquidity and financial condition, our REIT qualification, our debt service requirements, operating expenses and capital expenditures, prohibitions and other restrictions under financing arrangements and applicable law and other factors as our board of directors may deem relevant from time to time. In addition, we may pay distributions some or all of which may constitute a return of capital. To the extent that we decide to make distributions in excess of our current and accumulated earnings and profits, such distributions would generally be considered a return of capital for federal income tax purposes to the extent of the holder’s adjusted tax basis in its shares. A return of capital is not taxable, but it has the effect of reducing the holder’s adjusted tax basis in its investment. To the extent that distributions exceed the adjusted tax basis of a holder’s shares, they will be treated as gain from the sale or exchange of such shares. If we borrow to fund distributions, our future interest costs would increase, thereby reducing our earnings and cash available for distribution from what they otherwise would have been.
Future issuances or sales of our common stock, or the perception of the possibility of such issuances or sales, may depress the market price of our common stock.
We cannot predict the effect, if any, of our future issuances or sales of our common stock or OP units, or future resales of our common stock or OP units by existing holders, or the perception of such issuances, sales or resales, on the market price of our common stock. Any such future issuances, sales or resales, or the perception that such issuances, sales or resales might occur, could depress the market price of our common stock and also may make it more difficult and costly for us to sell equity or equity-related securities in the future at a time and upon terms that we deem desirable.
As of December 31, 2016, we had 47,698,250 shares of our Class A common stock outstanding. In addition, as of December 31, 2016, we had 133,000 shares of our Class B common stock and 6,783,277 OP units outstanding (each of which may, and in certain cases must, exchange into shares of Class A common stock on a one-for-one basis). Subject to applicable law, our board of directors has the authority, without further stockholder approval, to issue additional shares of common stock and preferred stock on the terms and for the consideration it deems appropriate.
In addition to the restricted stock that we previously have granted to our directors, executive officers and other employees under our equity incentive plan, we may also issue additional shares of our common stock and securities convertible into, or exchangeable or exercisable for, our common stock under our equity incentive plan. We have filed with the SEC a registration statement on Form S-8 covering the common stock issuable under our equity incentive plan. Shares of our common stock covered by such registration statement are eligible for transfer or resale without restriction under the Securities Act, unless held by affiliates. We also may issue from time to time additional shares of our common stock or OP units in connection with acquisitions and may grant registration rights in connection with such issuances pursuant to which we would agree to register the resale of such securities under the Securities Act. In addition, we have granted registration rights to Chad L. Williams, our Chairman and Chief Executive Officer, and others with respect to shares of common stock owned by them or upon redemption of OP units held by them. The market price of our common stock may decline significantly upon the registration of additional shares of our common stock pursuant to these registration rights or future issuances of equity in connection with acquisitions or our equity incentive plan.
33
Future issuances of debt securities, which would rank senior to our common stock upon our liquidation, and future issuances of equity securities (including OP units), which would dilute the holdings of our existing common stockholders and may be senior to our common stock for the purposes of making distributions, periodically or upon liquidation, may negatively affect the market price of our common stock.
In the future, we may issue debt or equity securities or incur other borrowings. Upon our liquidation, holders of our debt securities and other loans and preferred stock will receive a distribution of our available assets before common stockholders. If we incur debt in the future, our future interest costs could increase and adversely affect our results of operations and liquidity.
We are not required to offer any additional equity securities to existing common stockholders on a preemptive basis. Therefore, additional common stock issuances, directly or through convertible or exchangeable securities (including OP units), warrants or options, will dilute the holdings of our existing common stockholders and such issuances, or the perception of such issuances, may reduce the market price of our common stock. Our preferred stock, if issued, would likely have a preference on distribution payments, periodically or upon liquidation, which could eliminate or otherwise limit our ability to make distributions to common stockholders. Because our decision to issue debt or equity securities or incur other borrowings in the future will depend on market conditions and other factors beyond our control, we cannot predict or estimate the amount, timing, nature or success of our future capital-raising efforts. Thus, common stockholders bear the risk that our future issuances of debt or equity securities or our incurrence of other borrowings will negatively affect the market price of our common stock.
The trading volume and market price of our common stock may be volatile and could decline significantly in the future.
The market price of our common stock may be volatile. The stock markets, including the NYSE, on which our common stock is listed, have experienced significant price and volume fluctuations. As a result, the market price of our common stock is likely to be similarly volatile, and could decline significantly, unrelated to our operating performance or prospects. The market price of our common stock could be subject to wide fluctuations in response to a number of factors, including those listed in this “Risk Factors” section of this Form 10-K and others such as:
|
· |
our operating performance and prospects and those of other similar companies; |
|
· |
actual or anticipated variations in our financial condition, liquidity, results of operations, FFO, NOI, EBITDA or MRR in the amount of distributions, if any, paid to our stockholders; |
|
· |
changes in our estimates or those of securities analysts relating to our earnings or other operating metrics; |
|
· |
publication of research reports about us, our significant customers, our competition, data center companies generally, the real estate industry or the technology industry; |
|
· |
additions or departures of key personnel; |
|
· |
the passage of legislation or other regulatory developments that adversely affect us or our industry; |
|
· |
changes in market valuations of similar companies; |
|
· |
adverse market reaction to leverage we may incur or equity we may issue in the future; |
|
· |
actions by institutional stockholders; |
|
· |
actual or perceived accounting issues, including changes in accounting principles; |
|
· |
compliance with NYSE requirements; |
|
· |
our qualification as a REIT; |
|
· |
terrorist acts; |
|
· |
speculation in the press or investment community; |
|
· |
the realization of any of the other risk factors presented in this Form 10-K; |
|
· |
adverse developments in the creditworthiness, business or prospects of one or more of our significant customers; and |
|
· |
general market and economic conditions. |
In the past, securities class action litigation has often been instituted against companies following periods of volatility in the market price of their common stock. This type of litigation, if brought against us, could result in substantial costs and divert our management’s attention and resources, which could have a material adverse effect on us.
34
Increases in market interest rates may cause prospective purchasers to seek higher distribution yields and therefore reduce demand for our common stock and result in a decline in the market price of our common stock.
The price of our common stock may be influenced by our distribution yield (i.e., the amount of our annual or annualized distributions, if any, as a percentage of the market price of our common stock) relative to market interest rates. An increase in market interest rates, which are currently low relative to historical levels, may lead prospective purchasers and holders of our common stock to expect a higher distribution yield, which we may not be able, or may choose not, to satisfy. As a result, prospective purchasers may decide to purchase other securities rather than our common stock, which would reduce the demand for our common stock, and existing holders of our common stock may decide to sell their shares, either of which could result in a decline in the market price of our common stock.
Risks Related to QTS’ Status as a REIT
If QTS does not qualify as a REIT, or fails to remain qualified as a REIT, we will be subject to federal income tax as a regular corporation and could face significant tax liability, which could reduce the amount of cash available for distribution to our stockholders, could have a material adverse effect on QTS, and could adversely affect the Operating Partnership’s ability to service its indebtedness.
QTS elected to be taxed as a REIT, commencing with our taxable year ended December 31, 2013, when we filed our tax return for that year. We believe that we have been organized and have operated and will continue to operate in conformity with the requirements for qualification and taxation as a REIT. QTS’ qualification as a REIT, and maintenance of such qualification, depends upon our ability to meet, on a continuing basis, various complex requirements under the Code relating to, among other things, the sources of its gross income, the composition and values of its assets, its distributions to its stockholders and the concentration of ownership of its equity shares.
Although we have requested a private letter ruling from the IRS in respect of certain limited matters, we have not requested and do not plan to request a ruling from the IRS that QTS qualifies as a REIT, and the statements in this Form 10-K are not binding on the IRS, or any court. If QTS loses its REIT status, we will face serious tax consequences that could adversely affect our ability to raise capital and the Operating Partnership’s ability to service its indebtedness for each of the years involved because:
|
· |
we would not be allowed a deduction for distributions to stockholders in computing our taxable income and would be subject to federal income tax at regular corporate rates and, therefore, would have to pay significant income taxes; |
|
· |
we also could be subject to the federal alternative minimum tax and possibly increased state and local taxes; and |
|
· |
unless we are entitled to relief under applicable statutory provisions, we could not elect to be taxed as a REIT for four taxable years following the year during which it was disqualified. |
In addition, if QTS fails to qualify as a REIT, we will not be required to make distributions to stockholders, and all distributions to stockholders will be subject to tax as dividend income to the extent of its current and accumulated earnings and profits. As a result of all these factors, QTS’ failure to qualify as a REIT could impair our ability to execute our business and growth strategies, as well as make it more difficult for us to raise capital and for the Operating Partnership to service its indebtedness.
Qualifying as a REIT involves highly technical and complex provisions of the Code and therefore, in certain circumstances, may be subject to uncertainty.
In order to qualify as a REIT, QTS must satisfy a number of requirements, including requirements regarding the composition of our assets, the sources of our income and the diversity of our share ownership. Also, we must make distributions to stockholders aggregating annually at least 90% of our “REIT taxable income” (determined without regard to the dividends paid deduction and excluding net capital gain). Compliance with these requirements and all other requirements for qualification as a REIT involves the application of highly technical and complex Code provisions for which there are only limited judicial and administrative interpretations. The complexity of these provisions and of the applicable U.S. Department of the Treasury regulations (“Treasury regulations”) that have been promulgated under the Code is greater in the case of a REIT that, like QTS, holds its assets through a partnership and conducts significant business operations through one or more taxable REIT subsidiaries (each a “TRS”). Even a technical or inadvertent
35
mistake could jeopardize QTS’ REIT status. In addition, the determination of various factual matters and circumstances relevant to REIT qualification is not entirely within our control and may affect its ability to qualify as a REIT. Accordingly, we cannot be certain that our organization and operation will enable QTS to qualify as a REIT for federal income tax purposes.
Even if QTS qualifies as a REIT, we will be subject to some taxes that will reduce our cash flow.
Even if QTS qualifies for taxation as a REIT, we may be subject to certain federal, state and local taxes on our income and assets, including taxes on any undistributed income, tax on income from some activities conducted as a result of a foreclosure, and state or local income, property and transfer taxes. For example, our TRSs and certain of our subsidiaries are subject to federal, state, and local corporate-level income taxes on their net taxable income, if any, which primarily consists of the revenues from the Cloud and Managed Service business. In addition, QTS may incur a 100% excise tax on transactions with our TRSs if they are not conducted on an arms’ length basis. See “The ownership limitation on TRS stock could limit the growth of the Cloud and Managed Services business, and our transactions with our TRSs will cause us to be subject to a 100% penalty tax on certain income or deductions if those transactions are not conducted on arm’s-length terms” below.
Moreover, if we have net income from “prohibited transactions,” that income will be subject to a 100% tax. In general, prohibited transactions are sales or other dispositions by the Operating Partnership of property held primarily for sale to customers in the ordinary course of business. The determination as to whether a particular sale is a prohibited transaction depends on the facts and circumstances related to that sale. The need to avoid prohibited transactions could cause the Operating Partnership to forgo or defer sales of properties that it otherwise would have sold or that might otherwise be in its best interest to sell. In addition, we could, in certain circumstances, be required to pay an excise or penalty tax (which could be significant in amount) in order to utilize one or more relief provisions under the Code to maintain our qualification as a REIT. Any of these taxes would reduce our cash flow and could decrease cash available for distribution to stockholders and decrease cash available to service the Operating Partnership’s indebtedness.
If the structural components of our properties were not treated as real property for purposes of the REIT qualification requirements, QTS could fail to qualify as a REIT, which could have a material adverse effect on us.
A significant portion of the value of our properties is attributable to structural components related to the provision of electricity, heating ventilation and air conditioning, humidification regulation, security and fire protection, and telecommunication services. If rent attributable to personal property leased in connection with a lease of real property is greater than 15% of the total rent attributable to that lease, the portion of total rent that is attributable to the personal property will not be qualifying income for purposes of the REIT income tests. Therefore, if the Operating Partnership’s structural components of the properties are determined not to constitute real property for purposes of the REIT qualification requirements, we could fail to qualify as a REIT, which could have a material adverse impact on us, depress the market price of our common stock, and adversely affect our ability to raise capital as well as the Operating Partnership’s ability to service its indebtedness.
The REIT distribution requirements could adversely affect our ability to grow our business and may force us to seek third-party capital during unfavorable market conditions.
To qualify as a REIT, we generally must distribute to our stockholders at least 90% of its “REIT taxable income” (determined without regard to the dividends paid deduction and excluding net capital gain) each year, and we will be subject to regular corporate income taxes to the extent that we distribute less than 100% of our “REIT taxable income” each year. In addition, we will be subject to a 4% nondeductible excise tax on the amount, if any, by which distributions paid by us in any calendar year are less than the sum of 85% of our ordinary income, 95% of our capital gain net income and 100% of our undistributed income from prior years. In order to maintain our REIT status and avoid the payment of income and excise taxes, we may be forced to seek third-party capital to meet the distribution requirements even if the then-prevailing market conditions are not favorable. These capital needs could result from differences in timing between the recognition of taxable income and the actual receipt of cash or the effect of non-deductible capital expenditures, the creation of reserves or required debt or amortization payments. If we do not have other funds available in these situations, the Operating Partnership could be required to borrow funds on unfavorable terms, or sell assets at disadvantageous prices. In addition, we may be forced to distribute amounts that would otherwise have been invested in future acquisitions to make distributions sufficient to enable us to pay out enough of our taxable income to satisfy the REIT distribution requirement and to avoid corporate income tax and the 4% excise tax in a particular year.
36
Dividends payable by REITs do not qualify for the reduced tax rates available for some dividends, which could depress the market price of our common stock if it is perceived as a less attractive investment.
Dividends payable by REITs generally are not eligible for the preferential tax rates on qualified dividend income. Although this does not adversely affect the taxation of REITs or dividends payable by REITs, it could cause non-corporate taxpayers to perceive investments in REITs to be relatively less attractive than investments in the stock of regular “C” corporations that pay dividends, which could depress the market price of the stock of REITs, including our common stock.
QTS may in the future choose to pay dividends in the form of shares of common stock, in which case stockholders may be required to pay income taxes in excess of the cash dividends they receive.
The Company may seek in the future to distribute taxable dividends that are payable in cash and shares of common stock, at the election of each stockholder. Taxable stockholders receiving such dividends will be required to include the full amount of the dividend as ordinary income to the extent of QTS’ current and accumulated earnings and profits for federal income tax purposes. As a result, stockholders may be required to pay income taxes with respect to such dividends in excess of the cash dividends received. If a U.S. stockholder sells the shares of common stock that it receives as a dividend in order to pay this tax, the sales proceeds may be less than the amount included in income with respect to the dividend, depending on the market price of common stock at the time of the sale. In addition, in such case, a U.S. stockholder could have a capital loss with respect to the common stock sold that could not be used to offset such dividend income. Furthermore, with respect to certain non-U.S. stockholders, the Company may be required to withhold federal income tax with respect to such dividends, including in respect of all or a portion of such dividend that is payable in common stock. In addition, such a taxable share dividend could be viewed as equivalent to a reduction in QTS’ cash distributions, and that factor, as well as the possibility that a significant number of QTS’ stockholders could determine to sell shares of common stock in order to pay taxes owed on dividends, may put downward pressure on the market price of the QTS’ common stock.
Complying with REIT requirements may cause the Operating Partnership to liquidate or forgo otherwise attractive investment opportunities.
To qualify as a REIT, we must ensure that, at the end of each calendar quarter, at least 75% of the value of our assets consists of cash, cash items, government securities and “real estate assets” (as defined in the Code), including certain mortgage loans and securities (the “75% asset test”). The remainder of our investments (other than securities includable in the 75% asset test, and securities issued by our TRSs) generally cannot include more than 10% of the outstanding voting securities of any one issuer or more than 10% of the total value of the outstanding securities of any one issuer. In addition, in general, no more than 5% of the value of our total assets (other than securities includable in the 75% asset test, and securities issued by our TRSs) can consist of the securities of any one issuer no more than 25% (20% for taxable years beginning after December 31, 2017) of the value of our total assets can be represented by securities of one or more TRS, and debt instruments issued by publicly offered REITs, to the extent not secured by real property or interests in real property, cannot exceed 25% of the value of our total assets. If we fail to comply with these requirements at the end of any calendar quarter, we must correct the failure within 30 days after the end of the calendar quarter or qualify for certain statutory relief provisions to avoid losing our REIT qualification and suffering adverse tax consequences. As a result, the Operating Partnership may be required to liquidate or forgo otherwise attractive investment opportunities. These actions could have the effect of reducing our income and amounts available for distribution to our stockholders and the Operating Partnership’s income and amounts available to service its indebtedness.
In addition to the asset tests set forth above, to qualify as a REIT, we must continually satisfy tests concerning, among other things, the sources of our income, the amounts we distribute to our stockholders and the ownership of our stock. The Operating Partnership may be unable to pursue investment opportunities that would be otherwise advantageous to it in order to satisfy the source-of-income or asset-diversification requirements for us to qualify as a REIT. Thus, compliance with the REIT requirements may hinder the Operating Partnership’s ability to make certain attractive investments and, thus, reduce the Operating Partnership’s income and amounts available to service its indebtedness.
37
The ownership limitation on TRS stock could limit the growth of our Cloud and Managed Services business, and our transactions with our TRSs will cause us to be subject to a 100% penalty tax on certain income or deductions if those transactions are not conducted on arm’s-length terms.
The Code provides that no more than 25% (20% for taxable years beginning after December 31, 2017) of the value of a REIT’s assets may consist of shares or securities of one or more TRSs and that at least 75% of its assets must consist of cash, cash items, government securities and “real estate assets” (as defined in the Code). We currently provide our Cloud and Managed Services product, including our hybrid Cloud and IaaS product, to our customers through a TRS, which is 100% owned by our Operating Partnership. Our investment in our TRSs is not a qualifying asset for purposes of the 75% asset test. The 25% (20% for taxable years beginning after December 31, 2017) ownership limitation on TRS stock together with the 75% asset test could limit further growth of our Cloud and Managed Services business. We have monitored and will continue to monitor the value of our respective investments in our TRSs for the purpose of ensuring compliance with the ownership limitations applicable to TRSs. While we believe that the aggregate value of the stock and securities of our TRSs has been and will continue to be less than 25% (20% for tax years beginning after December 31, 2017) of the value of our total assets (including the stock and securities of our TRSs), there can be no assurance that we will be able to comply with this ownership limitation.
In addition, the rules applicable to TRSs impose a 100% excise tax on “redetermined rent,” “redetermined deductions” or “excess interest” to the extent rent paid by a TRS exceeds an arm’s-length amount, and a 100% excise tax on “redetermined TRS service income” (generally, gross income (less deductions allocable thereto) of a TRS attributable to services provided to, or on behalf of, us that is less than the amounts that would have been paid by a REIT to the TRSs if based on arm’s length negotiations). Subsidiaries of our TRSs lease, and in some cases sublease, from us space at certain of our facilities where Cloud and Managed Services are provided. If the rent received on those leases is above market, the amounts paid to such subsidiaries for the Cloud and Managed Services are below market, or the cost reimbursement arrangements between such subsidiaries and us are not an arm’s-length arrangement, we could be subject to the 100% excise tax on a portion of those payments we received from, or expenses deducted by, such subsidiaries.
While we have scrutinized and will continue to scrutinize all of our transactions with our TRSs to ensure that they are entered into on arm’s-length terms to avoid incurring the 100% excise tax described above, there can be no assurance, however, that we will be able to avoid application of the 100% excise tax.
Our TRSs will pay federal, state and local income taxes on their net taxable income, and their after-tax net income will be available for distribution to us but is not required to be distributed. Accordingly, profits from the Cloud and Managed Services product will be subject to regular corporate income tax and will not benefit from the special income tax treatment afforded REITs.
Complying with REIT requirements may limit the Operating Partnership’s ability to hedge effectively and may cause QTS and/or QTS’ TRSs to incur tax liabilities.
The REIT provisions of the Code substantially limit our ability to hedge our assets and liabilities. Any income from a hedging transaction that the Operating Partnership enters into to manage the risk of interest rate changes with respect to borrowings made or to be made to acquire or carry real estate assets (each such hedge, a "Borrowings Hedge"), or manage the risk of certain currency fluctuations (each such hedge, a "Currency Hedge"), does not constitute “gross income” for purposes of the 75% or 95% gross income tests that apply to REITs, provided that certain identification requirements are met. Exclusion from the 95% and 75% gross income tests also applies if the Operating Partnership previously entered into a Borrowings Hedge or a Currency Hedge, a portion of the hedged indebtedness or property is disposed of, and in connection with such extinguishment or disposition the Operating Partnership enter into a new "clearly identified" hedging transaction to offset the prior hedging position. To the extent that the Operating Partnership enters into other types of hedging transactions or fails to properly identify such transaction as hedges, the income is likely to be treated as non-qualifying income for purposes of both of the gross income tests. As a result of these rules, the Operating Partnership may be required to limit its use of advantageous hedging techniques or implement those hedges through a TRS. This could increase the cost of the Operating Partnership’s hedging activities because a TRS may be subject to tax on gains or expose the Operating Partnership to greater risks associated with changes in interest rates than it would otherwise want to bear. In addition, losses in a TRS will generally not provide any current tax benefit, except that such losses could be carried back or forward and therefore be applied against past or future taxable income of the TRSs.
38
If the Operating Partnership fails to qualify as a partnership for federal income tax purposes, QTS would fail to qualify as a REIT and suffer other adverse consequences.
The Operating Partnership believes that it has been organized and operated in a manner so as to be treated as a partnership, and not an association or publicly traded partnership taxable as a corporation for federal income tax purposes. As a partnership, it is not subject to federal income tax on its income. Instead, each of its partners, including QTS, is allocated that partner’s share of the Operating Partnership’s income. No assurance can be provided, however, that the IRS will not challenge its status as a partnership for federal income tax purposes, or that a court would not sustain such a challenge. If the IRS were successful in treating the Operating Partnership as an association or publicly traded partnership taxable as a corporation for federal income tax purposes, QTS would fail to meet the gross income tests and certain of the asset tests applicable to REITs and, accordingly, would cease to qualify as a REIT, which could adversely affect our ability to raise capital and the Operating Partnership’s ability to service its indebtedness. Also, the failure of the Operating Partnership to qualify as a partnership would cause it to become subject to federal corporate income tax, which would reduce significantly the amount of its cash available for debt service and for distribution to its partners, including QTS.
QTS has a carryover tax basis in respect of certain of its assets acquired in connection with the IPO, and the amount that QTS must distribute to its stockholders therefore may be higher.
As a result of the tax-free merger of General Atlantic REIT, Inc. (“GA REIT”) with and into QTS in connection with the IPO, certain of the operating properties, including Atlanta-Metro, Atlanta-Suwanee, Richmond, Santa Clara and Miami, have carryover tax bases that are lower than the fair market values of these properties at the time QTS acquired them in connection with the IPO. As a result of this lower aggregate tax basis, QTS will recognize higher taxable gain upon the sale of these assets, and QTS will be entitled to lower depreciation deductions on these assets than if it had purchased these properties in taxable transactions at the time of the IPO. Lower depreciation deductions and increased gains on sales generally will increase the amount of QTS’ required distribution under the REIT rules.
As a result of our formation transactions, Quality Technology Services Holding, LLC (“QTS Holdings TRS”) may be limited in using certain tax benefits and, consequently, may have greater taxable income and, thus, the Operating Partnership may have less after-tax cash available to service its indebtedness.
If a corporation undergoes an “ownership change” within the meaning of Section 382 of the Code and the Treasury regulations thereunder, such corporation’s ability to use NOLs generated prior to the time of that ownership change may be limited. To the extent the affected corporation’s ability to use NOLs is limited, such corporation’s taxable income may increase. As of December 31, 2016, QTS had approximately $45.5 million of NOLs (all of which are attributable to QTS Holdings TRS (a TRS of QTS)) that will begin to expire in 2029 if not utilized. In general, an ownership change occurs if one or more large stockholders, known as “5% stockholders,” including groups of stockholders that may be aggregated and treated as a single 5% stockholder, increase their aggregate percentage interest in a corporation by more than 50% over their lowest ownership percentage during the preceding three-year period. We believe that the formation transactions caused an ownership change within the meaning of Section 382 of the Code with respect to QTS Holdings TRS. Accordingly, to the extent QTS Holdings TRS have taxable income in future years, its ability to use NOLs incurred prior to our formation transactions in such future years will be limited, and it will have greater taxable income as a result of such limitation. As a result of those limitations, the Operating Partnership may have less after-tax cash available to service its indebtedness.
Legislative or other actions affecting REITs could materially and adversely affect us and our investors as well as the Operating Partnership.
The rules dealing with federal income taxation are constantly under review by persons involved in the legislative process and by the IRS and the U.S. Department of the Treasury. Changes to the tax laws, with or without retroactive application, could materially and adversely affect us and our investors as well as the Operating Partnership. Legislative and regulatory changes, including comprehensive tax reform, may be more likely in the 115th Congress, which convened in January 2017, because the Presidency and both Houses of Congress will be controlled by the same political party. We cannot predict when or if any new federal income tax law, regulation, or administrative interpretation, or any amendment to any existing federal income tax law, regulation or administrative interpretation will be adopted, promulgated or become effective and any such law, regulation, or interpretation may take effect retroactively. New
39
legislation, Treasury regulations, administrative interpretations or court decisions could significantly and negatively affect our ability to qualify as a REIT or the federal income tax consequences of such qualification.
ITEM 1B. UNRESOLVED STAFF COMMENTS
None.
Our Portfolio
We operate a portfolio of 25 data centers located throughout the United States, Canada, Europe and Asia. Within the U.S., we are located in some of the top U.S. data center markets and other high-growth markets. Our data centers are highly specialized, full-service, mission-critical facilities used by our customers to house, power and cool the networking equipment and computer systems that support their most critical business processes.
Operating Properties
The following table presents an overview of the portfolio of operating properties that we own or lease, referred to herein as our operating properties, based on information as of December 31, 2016:
|
|
|
|
|
|
|
Operating Net Rentable Square Feet (Operating NRSF) (3) |
|
|
|
|
|
|
|
|
|
|
|
|||||||
|
Property |
|
Year |
|
Gross |
|
Raised |
|
Office & |
|
Supporting |
|
Total |
|
% Occupied |
|
Annualized |
|
Available |
|
Basis of |
|
Current Raised |
|
|
|
Richmond, VA |
|
2010 |
|
1,318,353 |
|
167,309 |
|
51,093 |
|
178,854 |
|
397,256 |
|
88.6 |
% |
$ |
41,059,731 |
|
110 |
|
557,309 |
|
30.0 |
% |
|
Atlanta, GA (Metro) |
|
2006 |
|
968,695 |
|
452,986 |
|
36,953 |
|
331,426 |
|
821,365 |
|
94.0 |
% |
$ |
92,848,008 |
|
72 |
|
527,186 |
|
85.9 |
% |
|
Irving, TX (10) |
|
2013 |
|
698,000 |
|
123,248 |
|
6,981 |
|
103,259 |
|
233,488 |
|
96.6 |
% |
$ |
29,318,582 |
|
140 |
|
275,701 |
|
44.7 |
% |
|
Princeton, NJ |
|
2014 |
|
553,930 |
|
58,157 |
|
2,229 |
|
111,405 |
|
171,791 |
|
100.0 |
% |
$ |
9,829,070 |
|
22 |
|
158,157 |
|
36.8 |
% |
|
Suwanee, GA |
|
2005 |
|
369,822 |
|
205,608 |
|
8,697 |
|
107,128 |
|
321,433 |
|
79.5 |
% |
$ |
59,206,902 |
|
36 |
|
205,608 |
|
100.0 |
% |
|
Piscataway, NJ |
|
2016 |
|
360,000 |
|
88,820 |
|
14,311 |
|
91,851 |
|
194,982 |
|
83.1 |
% |
$ |
11,585,181 |
|
111 |
|
176,000 |
|
50.5 |
% |
|
Chicago, IL |
|
2014 |
|
467,124 |
|
14,000 |
|
— |
|
18,579 |
|
32,579 |
|
71.0 |
% |
$ |
1,090,728 |
|
8 |
|
208,000 |
|
6.7 |
% |
|
Fort Worth, TX |
|
2016 |
|
261,836 |
|
600 |
|
— |
|
1,100 |
|
1,700 |
|
100.0 |
% |
$ |
216,600 |
|
50 |
|
80,000 |
|
0.8 |
% |
|
Leased facilities acquired in 2015 *** |
|
2015 |
|
166,478 |
|
70,569 |
|
5,418 |
|
32,992 |
|
108,979 |
|
84.2 |
% |
$ |
72,161,646 |
|
20 |
|
94,175 |
|
74.9 |
% |
|
Santa Clara, CA* |
|
2007 |
|
135,322 |
|
55,905 |
|
944 |
|
45,094 |
|
101,943 |
|
83.4 |
% |
$ |
23,772,200 |
|
11 |
|
80,940 |
|
69.1 |
% |
|
Jersey City, NJ** |
|
2006 |
|
122,448 |
|
31,503 |
|
14,208 |
|
41,901 |
|
87,612 |
|
88.7 |
% |
$ |
12,207,463 |
|
7 |
|
52,744 |
|
59.7 |
% |
|
Sacramento, CA |
|
2012 |
|
92,644 |
|
54,595 |
|
2,794 |
|
23,916 |
|
81,305 |
|
43.7 |
% |
$ |
11,523,348 |
|
8 |
|
57,906 |
|
94.3 |
% |
|
Miami, FL |
|
2008 |
|
30,029 |
|
19,887 |
|
— |
|
6,592 |
|
26,479 |
|
66.3 |
% |
$ |
5,088,811 |
|
4 |
|
19,887 |
|
100.0 |
% |
|
Other |
|
Misc |
|
117,406 |
|
2,493 |
|
49,337 |
|
23,482 |
|
75,312 |
|
56.0 |
% |
$ |
774,267 |
|
1 |
|
2,493 |
|
100.0 |
% |
|
|
|
|
|
|
|
|
|
|
|
|
|
|
|
|
|
|
|
|
|
|
|
|
|
|
|
Total |
|
|
|
5,662,087 |
|
1,345,680 |
|
192,965 |
|
1,117,579 |
|
2,656,224 |
|
88.2 |
% |
$ |
370,682,537 |
|
600 |
|
2,496,106 |
|
53.9 |
% |
|
(1) |
Represents the year a property was acquired or, in the case of a property under lease, the year our initial lease commenced for the property. |
|
(2) |
With respect to our owned properties, gross square feet represents the entire building area. With respect to leased properties, gross square feet represents that portion of the gross square feet subject to our lease. This includes 347,261 square feet of our office and support space, which is not included in operating NRSF. |
|
(3) |
Represents the total square feet of a building that is currently leased or available for lease plus developed supporting infrastructure, based on engineering drawings and estimates, but does not include space held for redevelopment or space used for our own office space. |
|
(4) |
Represents management’s estimate of the portion of NRSF of the facility with available power and cooling capacity that is currently leased or readily available to be leased to customers as data center space based on engineering drawings. |
|
(5) |
Represents the operating NRSF of the facility other than data center space (typically office and storage space) that is currently leased or available to be leased. |
|
(6) |
Represents required data center support space, including mechanical, telecommunications and utility rooms, as well as building common areas. |
|
(7) |
Calculated as data center raised floor that is subject to a signed lease for which billing has commenced (955,844 square feet as of December 31, 2016) divided by leasable raised floor based on the current configuration of the properties (1,083,708 square feet as of December 31, 2016), expressed as a percentage. |
|
(8) |
We define annualized rent as MRR multiplied by 12. We calculate MRR as monthly contractual revenue under signed leases as of a particular date, which includes revenue from our C1, C2 and C3 rental activities and cloud and managed services, but excludes customer recoveries, deferred set up fees and other one-time and variable revenues. MRR does not include the impact from booked-not-billed contracts as of a particular date, unless otherwise specifically noted. |
|
(9) |
Represents installed utility power and transformation capacity that is available for use by the facility as of December 31, 2016. |
|
(10) |
This property was previously known as the Dallas-Fort Worth property. |
* Represents facilities that we lease.
** Subject to long term ground lease.
*** Includes 12 facilities. All facilities are leased, including those subject to capital leases.
40
Redevelopment Pipeline
The following table presents an overview of our redevelopment pipeline, based on information as of December 31, 2016.
|
Raised Floor NRSF |
|
|
||||||||
|
Overview as of December 31, 2016 |
|
|
||||||||
|
Property |
|
Current |
|
Under |
|
Future |
|
Basis of Design NRSF |
|
Approximate Adjacent Acreage of Land (3) |
|
Richmond |
|
167,309 |
|
— |
|
390,000 |
|
557,309 |
|
111.1 |
|
Atlanta-Metro |
|
452,986 |
|
30,000 |
|
44,200 |
|
527,186 |
|
6.0 |
|
Irving |
|
123,248 |
|
51,359 |
|
101,094 |
|
275,701 |
|
29.4 |
|
Princeton |
|
58,157 |
|
— |
|
100,000 |
|
158,157 |
|
65.0 |
|
Atlanta-Suwanee |
|
205,608 |
|
— |
|
— |
|
205,608 |
|
15.4 |
|
Piscataway |
|
88,820 |
|
10,000 |
|
77,180 |
|
176,000 |
|
— |
|
Chicago |
|
14,000 |
|
28,000 |
|
166,000 |
|
208,000 |
|
23.0 |
|
Fort Worth |
|
600 |
|
16,000 |
|
63,400 |
|
80,000 |
|
26.5 |
|
Leased facilities acquired in 2015 |
|
70,569 |
|
12,000 |
|
11,606 |
|
94,175 |
|
— |
|
Santa Clara |
|
55,905 |
|
4,000 |
|
21,035 |
|
80,940 |
|
— |
|
Jersey City |
|
31,503 |
|
— |
|
21,241 |
|
52,744 |
|
— |
|
Sacramento |
|
54,595 |
|
— |
|
3,311 |
|
57,906 |
|
— |
|
Miami |
|
19,887 |
|
— |
|
— |
|
19,887 |
|
— |
|
Other |
|
2,493 |
|
— |
|
— |
|
2,493 |
|
— |
|
Totals as of December 31, 2016 |
|
1,345,680 |
|
151,359 |
|
999,067 |
|
2,496,106 |
|
276.4 |
|
(1) |
Reflects NRSF at a facility for which the initiation of substantial activities has begun to prepare the property for its intended use on or before December 31, 2017. |
|
(2) |
Reflects NRSF at a facility for which the initiation of substantial activities has begun to prepare the property for its intended use after December 31, 2017. |
|
(3) |
The total cost basis of adjacent land, which is land available for future development, is approximately $25 million. This is included in land on the Combined Consolidated Balance Sheets. The Basis of Design NRSF does not include any build-out on the adjacent land. |
The table below sets forth our estimated costs for completion of our major redevelopment projects currently under construction and expected to be operational by December 31, 2017 (dollars in millions):
|
|
|
Under Construction Costs (1) |
|||||||||
|
Property |
|
Actual (2) |
|
Estimated Cost |
|
Total |
|
Expected |
|||
|
Atlanta-Metro |
|
$ |
15 |
|
$ |
23 |
|
$ |
38 |
|
Q3 & Q4 2017 |
|
Chicago |
|
|
20 |
|
|
32 |
|
|
52 |
|
Q1 & Q4 2017 |
|
Irving |
|
|
80 |
|
|
35 |
|
|
115 |
|
Q1, Q3 & Q4 2017 |
|
Piscataway |
|
|
5 |
|
|
4 |
|
|
9 |
|
Q3 2017 |
|
Leased facilities acquired in 2015 |
|
|
6 |
|
|
1 |
|
|
7 |
|
Q1 & Q4 2017 |
|
Fort Worth |
|
|
11 |
|
|
12 |
|
|
23 |
|
Q2 & Q4 2017 |
|
Santa Clara |
|
|
4 |
|
|
2 |
|
|
6 |
|
Q3 2017 |
|
Totals |
|
$ |
141 |
|
$ |
109 |
|
$ |
250 |
|
|
|
(1) |
In addition to projects currently under construction, our near-term redevelopment projects are expected to be delivered in a modular manner, and we currently expect to invest additional capital to complete these near term projects. The ultimate timing and completion of, and the commitment of capital to, our future redevelopment projects are within our discretion and will depend upon a variety of factors, including the actual contracts executed, availability of financing and our estimation of the future market for data center space in each particular market. |
|
(2) |
Represents actual costs for NRSF under construction through December 31, 2016. In addition to the $141 million of construction costs incurred through December 31, 2016 for redevelopment expected to be completed by December |
41
31, 2017, as of December 31, 2016 we had incurred $225 million of additional costs (including acquisition costs and other capitalized costs) for other redevelopment projects that are expected to be completed after December 31, 2017. |
|
(3) |
Represents management’s estimate of the additional costs required to complete the current NRSF under development. There may be an increase in costs if customers’ requirements exceed our current basis of design. |
We also own an aggregate of 276.4 acres of additional land adjacent to our Richmond, Atlanta-Metro, Irving, Suwanee, Princeton, Fort Worth and Chicago data center properties which can support the development of over 2.8 million square feet of raised floor.
Customer Diversification
Our portfolio is currently leased to more than 1,100 customers comprised of companies of all sizes representing an array of industries, each with unique and varied business models and needs. The following table sets forth information regarding the 10 largest customers in our portfolio based on annualized rent as of December 31, 2016:
|
Principal Customer Industry |
|
Product |
|
Number |
|
|
Annualized Rent (1) |
|
% of Portfolio Annualized Rent |
|
Weighted Average Remaining Lease Term (Months) (2) |
|
|
Content & Digital Media |
|
C1 |
|
2 |
|
|
$ |
48,092,647 |
|
13.0% |
|
40 |
|
Cloud & IT Services |
|
C1 |
|
2 |
|
|
|
13,905,500 |
|
3.8% |
|
89 |
|
Cloud & IT Services |
|
C1, C3 |
|
3 |
|
|
|
12,392,680 |
|
3.3% |
|
87 |
|
Content & Digital Media |
|
C2, C3 |
|
4 |
|
|
|
9,921,819 |
|
2.7% |
|
8 |
|
Content & Digital Media |
|
C1 |
|
1 |
|
|
|
9,644,400 |
|
2.6% |
|
22 |
|
Government & Security |
|
C2 |
|
2 |
|
|
|
9,405,960 |
|
2.5% |
|
1 |
|
Cloud & IT Services |
|
C1 |
|
1 |
|
|
|
8,851,800 |
|
2.4% |
|
63 |
|
Network |
|
C3 |
|
2 |
|
|
|
8,593,239 |
|
2.3% |
|
15 |
|
Cloud & IT Services |
|
C2, C3 |
|
6 |
|
|
|
7,773,912 |
|
2.1% |
|
9 |
|
Cloud & IT Services |
|
C2, C3 |
|
6 |
|
|
|
5,910,456 |
|
1.6% |
|
11 |
|
Total / Weighted Average |
|
|
|
|
|
|
$ |
134,492,413 |
|
36.3% |
|
40 |
|
(1) |
Annualized rent is presented for leases commenced as of December 31, 2016. We define annualized rent as MRR multiplied by 12. We calculate MRR as monthly contractual revenue under signed leases as of a particular date, which includes revenue from our C1, C2 and C3 rental and cloud and managed services activities, but excludes customer recoveries, deferred set-up fees, variable related revenues, non-cash revenues and other one-time revenues. MRR does not include the impact from booked-not-billed leases as of a particular date unless otherwise specifically noted. This amount reflects the annualized cash rental payments. It does not reflect any accounting associated with any free rent, rent abatements or future scheduled rent increases and also excludes operating expense and power reimbursements. |
|
(2) |
Weighted average based on customer’s percentage of total annualized rent expiring and is as of December 31, 2016. |
The following chart shows the breakdown of all our customers by industry based on annualized rent as of December 31, 2016:
|
Industry |
|
% of Total Annualized Rent |
|
Content & Digital Media |
|
26% |
|
Cloud & IT Services |
|
22% |
|
Financial Services |
|
14% |
|
Government & Security |
|
11% |
|
Network |
|
9% |
|
Healthcare |
|
5% |
|
Retail |
|
5% |
|
Other |
|
8% |
|
Total |
|
100% |
42
Lease Distribution by Product Type
|
Product Type (Square Feet) (1) |
|
Total Leased |
|
% of Portfolio |
|
Annualized |
|
% of Portfolio |
|
|
Cloud Infrastructure |
|
4,521 |
|
0% |
|
$ |
62,898,608 |
|
17% |
|
Colocation Cabinets and Cages |
|
171,485 |
|
18% |
|
|
158,246,036 |
|
43% |
|
Custom Data Centers |
|
779,838 |
|
82% |
|
|
149,537,893 |
|
40% |
|
Portfolio Total |
|
955,844 |
|
100% |
|
$ |
370,682,537 |
|
100% |
|
(1) |
Represents all leases in our portfolio for which billing has commenced as of December 31, 2016. |
|
(2) |
Represents the square footage of raised floor at a property under lease as specified in the lease and that has commenced billing as of December 31, 2016. |
|
(3) |
Annualized rent is presented for leases commenced as of December 31, 2016. We define annualized rent as MRR multiplied by 12. We calculate MRR as monthly contractual revenue under signed leases as of a particular date, which includes revenue from our C1, C2 and C3 rental and cloud and managed services activities, but excludes customer recoveries, deferred set-up fees, variable related revenues, non-cash revenues and other one-time revenues. MRR does not include the impact from booked-not-billed leases as of a particular date, unless otherwise specifically noted. This amount reflects the annualized cash rental payments. It does not reflect any accounting associated with any free rent, rent abatements or future scheduled rent increases and also excludes operating expense and power reimbursements. |
Lease Expirations
The following table sets forth a summary schedule of the lease expirations as of December 31, 2016 at the properties in our portfolio. Unless otherwise stated in the footnotes, the information set forth in the table assumes that customers exercise no renewal options and all early termination rights are exercised:
|
Year of Lease |
|
Number of |
|
Total Raised Floor of Expiring Leases |
|
% of Portfolio |
|
Annualized Rent (2) |
|
% of Portfolio |
|
|
|
Month-to-Month (3) |
|
400 |
|
9,094 |
|
1 |
% |
$ |
15,490,347 |
|
4 |
% |
|
2017 |
|
1,668 |
|
162,471 |
|
17 |
% |
|
118,505,154 |
|
32 |
% |
|
2018 |
|
1,182 |
|
279,506 |
|
29 |
% |
|
97,154,795 |
|
26 |
% |
|
2019 |
|
644 |
|
103,701 |
|
11 |
% |
|
52,485,303 |
|
14 |
% |
|
2020 |
|
171 |
|
45,272 |
|
5 |
% |
|
20,299,266 |
|
6 |
% |
|
2021 |
|
77 |
|
52,396 |
|
6 |
% |
|
13,962,834 |
|
4 |
% |
|
2022 |
|
20 |
|
121,828 |
|
13 |
% |
|
22,015,938 |
|
6 |
% |
|
2023 |
|
11 |
|
51,693 |
|
5 |
% |
|
7,404,127 |
|
2 |
% |
|
2024 |
|
39 |
|
116,814 |
|
12 |
% |
|
21,853,766 |
|
6 |
% |
|
2025 |
|
9 |
|
7,537 |
|
1 |
% |
|
1,511,007 |
|
0 |
% |
|
2026 |
|
1 |
|
32 |
|
0 |
% |
|
— |
|
- |
% |
|
After 2026 |
|
— |
|
— |
|
- |
% |
|
— |
|
- |
% |
|
Portfolio Total |
|
4,222 |
|
950,344 |
|
100 |
% |
$ |
370,682,537 |
|
100 |
% |
|
(1) |
Represents each agreement with a customer signed as of December 31, 2016 for which billing has commenced; a lease agreement could include multiple spaces and a customer could have multiple leases. |
|
(2) |
Annualized rent is presented for leases commenced as of December 31, 2016. We define annualized rent as MRR multiplied by 12. We calculate MRR as monthly contractual revenue under signed leases as of a particular date, which includes revenue from our C1, C2 and C3 rental and cloud and managed services activities, but excludes customer recoveries, deferred set-up fees, variable related revenues, non-cash revenues and other one-time revenues. MRR does not include the impact from booked-not-billed leases as of a particular date, unless otherwise specifically noted. This amount reflects the annualized cash rental payments. It does not reflect any accounting associated with |
43
any free rent, rent abatements or future scheduled rent increases and also excludes operating expense and power reimbursements. |
|
(3) |
Consists of both customer leases whose original contract terms ended on December 31, 2016 and have yet to commence previously signed renewals as well as customers whose leases expired prior to December 31, 2016 and have continued on a month-to-month basis. |
Description of Our Properties
Below is a description of our properties. More detail is provided for the properties that represent more than ten percent of our total assets or accounted for more than ten percent of our aggregate gross revenues or both as of and for the year ended December 31, 2016.
Atlanta-Metro
Our Atlanta, Georgia facility, or Atlanta-Metro, is currently our largest data center based on total operating NRSF. As of December 31, 2016, the property consisted of approximately 969,000 gross square feet with approximately 821,000 total operating NRSF, including approximately 453,000 raised floor operating NRSF. An on-site Georgia Power substation supplies 72 MW of utility power to the facility, which is backed up by diesel generators, and the facility has 120 MW of transformer capacity. The facility also includes a small amount of private “Class A” office space. As of December 31, 2016, the facility was approximately 94% occupied by 227 customers across our 3Cs product offerings.
Portions of the Atlanta-Metro facility are included in our redevelopment pipeline, as we plan to continue to expand the facility in multiple phases. During the year ended December 31, 2016 we placed approximately 20,000 of raised floor NRSF into service. Our current under construction redevelopment plans call for the addition of up to approximately 43,000 total operating NRSF, including approximately 30,000 NRSF of raised floor. We anticipate that this incremental space will cost approximately $23 million in the aggregate based on current estimates (in addition to costs already incurred as of December 31, 2016). Longer term, we can further expand the facility by approximately 73,000 total operating NRSF, of which approximately 44,000 NRSF would be raised floor. Upon completion of the build-out of the facility, we anticipate that the facility would contain approximately 937,000 total operating NRSF, including approximately 527,000 NRSF of raised floor.
In addition, this facility is adjacent to six acres of undeveloped land owned by us that we estimate could be developed to provide, at a minimum, an additional approximately 262,000 total operating NRSF, of which approximately 162,000 NRSF would be raised floor. These six acres of undeveloped land are not included in our current development plans.
We are the beneficial owner of our Atlanta-Metro facility through a bond-financed sale-leaseback structure. This structure is necessary in the State of Georgia to receive property tax abatement. In 2006, the Development Authority of Fulton County (“DAFC”) issued a taxable industrial development revenue bond to us with a face amount of $300 million in exchange for legal title to the facility. The acquisition of the bond by us was “cashless” as the bond was issued to us in exchange for title to the facility. The bond matures on December 1, 2019 and bears interest at a rate of 8% per annum. DAFC leased the facility back to us under a bond lease at a rent equal to the debt service on the bond. The bond lease is a triple net lease, which is standard in conduit financing transactions of this type. The rent under the bond lease payable by us, as lessee, is assigned by DAFC to us, as the bondholder. Because the rent and debt service amounts are equal and offsetting, no cash changes hands between DAFC and us. DAFC is the owner and lessor of the facility, but its rights to receive all rental payments and a security interest in the facility have been pledged to us, as the bondholder, as security for the bond. Therefore, we have complete control over the facility at all times. We have an option to buy the facility for $10 when the bond has been retired (the bond matures on December 1, 2019). If we wish to obtain title earlier, we can do so by simply surrendering and cancelling the bond and paying the $10 option price.
44
Lease Expirations. The following table sets forth a summary schedule of lease expirations for leases in place as of December 31, 2016 at the Atlanta-Metro facility. Unless otherwise stated in the footnotes, the information set forth in the table assumes that customers exercise no renewal options and all early termination rights.
|
|
|
Number of |
|
Total |
|
% of Facility |
|
|
|
|
% of Facility |
|
Year of Lease |
|
Leases |
|
Raised Floor of |
|
Leased |
|
|
Annualized |
|
Annualized |
|
Expiration |
|
Expiring (1) |
|
Expiring Leases |
|
Raised Floor |
|
|
Rent (2) |
|
Rent |
|
Month-to-Month (3) |
|
131 |
|
4,797 |
|
1% |
|
$ |
3,818,813 |
|
4% |
|
2017 |
|
298 |
|
49,064 |
|
13% |
|
|
20,623,605 |
|
22% |
|
2018 |
|
253 |
|
216,131 |
|
59% |
|
|
40,619,654 |
|
44% |
|
2019 |
|
130 |
|
13,888 |
|
4% |
|
|
8,551,175 |
|
9% |
|
2020 |
|
53 |
|
6,611 |
|
2% |
|
|
4,026,942 |
|
4% |
|
2021 |
|
6 |
|
706 |
|
0% |
|
|
469,921 |
|
1% |
|
2022 |
|
14 |
|
64,000 |
|
18% |
|
|
12,601,898 |
|
14% |
|
2023 |
|
1 |
|
9,800 |
|
3% |
|
|
2,136,000 |
|
2% |
|
After 2023 |
|
— |
|
— |
|
—% |
|
|
— |
|
0% |
|
Total |
|
886 |
|
364,997 |
|
100% |
|
$ |
92,848,008 |
|
100% |
|
(1) |
Represents each lease with a customer signed as of December 31, 2016 for which billing has commenced; a lease agreement could include multiple spaces and/or service orders and a customer could have multiple leases. |
|
(2) |
Annualized rent is presented for leases commenced as of December 31, 2016. We define annualized rent as MRR multiplied by 12. We calculate MRR as monthly contractual revenue under signed leases as of a particular date, which includes revenue from our C1, C2 and C3 rental and cloud and managed services activities, but excludes customer recoveries, deferred set-up fees, variable related revenues, non-cash revenues and other one-time revenues. MRR does not include the impact from booked-not-billed leases as of a particular date, unless otherwise specifically noted. This amount reflects the annualized cash rental payments. It does not reflect any accounting associated with any free rent, rent abatements or future scheduled rent increases and also excludes operating expense and power reimbursements. |
|
(3) |
Consists of both customer leases whose original contract terms ended on December 31, 2016 and have yet to commence previously signed renewals as well as customers whose leases expired prior to December 31, 2016 and have continued on a month-to-month basis. We do not typically enter into month-to-month leases. |
Primary Customers. The following table summarizes information regarding primary customers, which are customers occupying 10% or more of the leased raised floor of the Atlanta-Metro facility, as of December 31, 2016:
|
Principal Customer Industry |
|
Lease |
|
Renewal |
|
Annualized Rent (1) |
|
|
% of Facility |
|
|
Content & Digital Media |
|
2018 |
|
1x5 years |
|
$ |
32,756,647 |
|
|
35% |
|
Content & Digital Media |
|
2018 |
|
1x5 years |
|
|
9,644,400 |
|
|
10% |
|
(1) |
Annualized rent is presented for leases commenced as of December 31, 2016. We define annualized rent as MRR multiplied by 12. We calculate MRR as monthly contractual revenue under signed leases as of a particular date, which includes revenue from our C1, C2 and C3 rental and cloud and managed services activities, but excludes customer recoveries, deferred set-up fees, variable related revenues, non-cash revenues and other one-time revenues. MRR does not include the impact from booked-not-billed leases as of a particular date, unless otherwise specifically noted. This amount reflects the annualized cash rental payments. It does not reflect any accounting associated with any free rent, rent abatements or future scheduled rent increases and also excludes operating expense and power reimbursements. |
45
Historical Percentage Leased and Annualized Rental Rates. The following table sets forth the leasable raised floor, percentage leased, annualized rent and annualized rent per leased raised square foot for the Atlanta-Metro facility:
|
Date |
|
Facility Leasable |
|
% Occupied and |
|
Annualized |
|
Annualized Rent |
||
|
December 31, 2016 |
|
388,227 |
|
94% |
|
$ |
92,848,008 |
|
$ |
254 |
|
December 31, 2015 |
|
353,967 |
|
96% |
|
|
82,563,392 |
|
|
243 |
|
December 31, 2014 |
|
329,342 |
|
86% |
|
|
72,920,037 |
|
|
257 |
|
December 31, 2013 |
|
242,468 |
|
100% |
|
|
66,350,200 |
|
|
275 |
|
December 31, 2012 |
|
273,482 |
|
89% |
|
|
54,110,376 |
|
|
222 |
|
(1) |
Calculated as data center raised floor that is subject to a signed lease for which billing has commenced as of the applicable date, divided by leasable raised floor based on the then current configuration of the property, expressed as a percentage. |
|
(2) |
Annualized rent is presented for leases commenced as of the applicable date. We define annualized rent as MRR multiplied by 12. We calculate MRR as monthly contractual revenue under signed leases as of a particular date, which includes revenue from our C1, C2 and C3 rental and cloud and managed services activities, but excludes customer recoveries, deferred set-up fees, variable related revenues, non-cash revenues and other one-time revenues. MRR does not include the impact from booked-not-billed leases as of a particular date, unless otherwise specifically noted. This amount reflects the annualized cash rental payments. It does not reflect any accounting associated with any free rent, rent abatements or future scheduled rent increases and also excludes operating expense and power reimbursements. |
Atlanta-Suwanee
Our Suwanee, Georgia, or Atlanta-Suwanee, facility consists of approximately 370,000 gross square feet, and as of December 31, 2016 it had approximately 321,000 total operating NRSF, including approximately 206,000 raised floor operating NRSF. Georgia Power supplies 36 MW of utility power to the facility, which is backed up by diesel generators. The facility also contains a small amount of “Class A” private office space and our operating service center, which provides 24x7 support to all of our customers and data centers. As of December 31, 2016, the facility was approximately 80% occupied by 335 customers.
Portions of the Atlanta-Suwanee facility were previously included in our redevelopment pipeline. During the year ended December 31, 2016 we placed approximately 20,000 of raised floor NRSF into service. In addition, this facility is adjacent to 15 acres of undeveloped land owned by us that we believe could be developed to provide, at a minimum, an additional approximately 262,000 total operating NRSF, of which approximately would be 162,000 NRSF of raised floor. These 15 acres of undeveloped land are not included in our current development plans.
46
Lease Expirations. The following table sets forth a summary schedule of the lease expirations for leases in place as of December 31, 2016 at the Atlanta-Suwanee facility. Unless otherwise stated in the footnotes, the information set forth in the table assumes that customers exercise no renewal options and all early termination rights.
|
|
|
Number of |
|
Total |
|
% of Facility |
|
|
|
|
% of Facility |
|
Year of Lease |
|
Leases |
|
Raised Floor of |
|
Leased |
|
Annualized |
|
Annualized |
|
|
Expiration |
|
Expiring (1) |
|
Expiring Leases |
|
Raised Floor |
|
Rent (2) |
|
Rent |
|
|
Month-to-Month (3) |
|
57 |
|
1,488 |
|
1% |
|
$ |
2,120,416 |
|
4% |
|
2017 |
|
351 |
|
14,566 |
|
13% |
|
|
13,958,845 |
|
23% |
|
2018 |
|
316 |
|
25,499 |
|
23% |
|
|
17,569,526 |
|
30% |
|
2019 |
|
181 |
|
11,368 |
|
10% |
|
|
11,641,298 |
|
20% |
|
2020 |
|
28 |
|
19,820 |
|
18% |
|
|
6,020,155 |
|
10% |
|
2021 |
|
18 |
|
10,554 |
|
10% |
|
|
4,366,313 |
|
7% |
|
2022 |
|
— |
|
— |
|
0% |
|
|
— |
|
0% |
|
2023 |
|
4 |
|
27,001 |
|
25% |
|
|
3,530,348 |
|
6% |
|
After 2023 |
|
— |
|
— |
|
0% |
|
|
— |
|
0% |
|
Total |
|
955 |
|
110,296 |
|
100% |
|
$ |
59,206,902 |
|
100% |
|
(1) |
Represents each lease with a customer signed as of December 31, 2016 for which billing has commenced; a lease agreement could include multiple spaces and/or service orders and a customer could have multiple leases. |
|
(2) |
Annualized rent is presented for leases commenced as of December 31, 2016. We define annualized rent as MRR multiplied by 12. We calculate MRR as monthly contractual revenue under signed leases as of a particular date, which includes revenue from our C1, C2 and C3 rental and cloud and managed services activities, but excludes customer recoveries, deferred set-up fees, variable related revenues, non-cash revenues and other one-time revenues. MRR does not include the impact from booked-not-billed leases as of a particular date, unless otherwise specifically noted. This amount reflects the annualized cash rental payments. It does not reflect any accounting associated with any free rent, rent abatements or future scheduled rent increases and also excludes operating expense and power reimbursements. |
|
(3) |
Consists of both customer leases whose original contract terms ended on December 31, 2016 and have yet to commence previously signed renewals as well as customers whose leases expired prior to December 31, 2016 and have continued on a month-to-month basis. We do not typically enter into month-to-month leases. |
Primary Customers. The following table summarizes information regarding primary customers, which are customers occupying 10% or more of the leased raised floor of the Atlanta-Suwanee facility, as of December 31, 2016:
|
Principal Customer Industry |
|
Lease |
|
Renewal |
|
Annualized Rent (1) |
|
|
% of Facility |
|
|
Cloud & IT Services |
|
2023 |
|
2x5 years |
|
$ |
3,547,555 |
|
|
6% |
|
Financial Services |
|
2020 |
|
2x5 years |
|
|
2,764,800 |
|
|
5% |
|
(1) |
Annualized rent is presented for leases commenced as of December 31, 2016. We define annualized rent as MRR multiplied by 12. We calculate MRR as monthly contractual revenue under signed leases as of a particular date, which includes revenue from our C1, C2 and C3 rental and cloud and managed services activities, but excludes customer recoveries, deferred set-up fees, variable related revenues, non-cash revenues and other one-time revenues. MRR does not include the impact from booked-not-billed leases as of a particular date, unless otherwise specifically noted. This amount reflects the annualized cash rental payments. It does not reflect any accounting associated with any free rent, rent abatements or future scheduled rent increases and also excludes operating expense and power reimbursements. |
47
Historical Percentage Leased and Annualized Rental Rates. The following table sets forth the leasable raised floor, percentage leased, annualized rent and annualized rent per leased raised square foot for the Atlanta-Suwanee facility:
|
Date |
|
Facility Leasable |
|
% Occupied and |
|
Annualized |
|
|
Annualized Rent |
|
|
December 31, 2016 |
|
138,722 |
|
80% |
|
$ |
59,206,902 |
|
$ |
537 |
|
December 31, 2015 |
|
117,013 |
|
84% |
|
|
56,769,086 |
|
|
576 |
|
December 31, 2014 |
|
116,936 |
|
78% |
|
|
49,061,619 |
|
|
542 |
|
December 31, 2013 |
|
90,741 |
|
87% |
|
|
41,968,647 |
|
|
530 |
|
December 31, 2012 |
|
61,000 |
|
80% |
|
|
34,566,816 |
|
|
712 |
|
(1) |
Calculated as data center raised floor that is subject to a signed lease for which billing has commenced as of the applicable date, divided by leasable raised floor based on the then current configuration of the property, expressed as a percentage. |
|
(2) |
Annualized rent is presented for leases commenced as of the applicable date. We define annualized rent as MRR multiplied by 12. We calculate MRR as monthly contractual revenue under signed leases as of a particular date, which includes revenue from our C1, C2 and C3 rental and cloud and managed services activities, but excludes customer recoveries, deferred set-up fees, variable related revenues, non-cash revenues and other one-time revenues. MRR does not include the impact from booked-not-billed leases as of a particular date, unless otherwise specifically noted. This amount reflects the annualized cash rental payments. It does not reflect any free rent, rent abatements or future scheduled rent increases and also excludes operating expense and power reimbursements. |
Richmond
Our Richmond, Virginia data center is situated on an approximately 220-acre site comprised of three large buildings available for data center redevelopment, each with two to three floors, and an administrative building that also has space available for data center redevelopment. As of December 31, 2016, the data center had approximately 1.3 million gross square feet with approximately 397,000 total operating NRSF, including approximately 167,000 of raised floor operating NRSF. Dominion Virginia Power supplies 110 MW of utility power to the facility, which is backed up by diesel generators. As of December 31, 2016, one of these primary buildings was fully operational as a data center, another was partially operational, and the third was being redeveloped. We believe that our Richmond facility is situated in an ideal location due to its proximity to Washington, DC, which offers numerous sources of demand for our products including the federal government, and provides geographical diversification from the Northern Virginia data center market. There are three core segments that we believe represent the most significant opportunity for our Richmond data center: entities associated with the federal government, given the highly secured nature of this facility and its proximity to Washington, DC; regulated industries, such as financial institutions, given our investments in security and regulatory compliance; and large enterprise customers, given the large scale of this facility. Our Richmond mega data center can accommodate large and growing C1 customers, while also accommodating C2 and C3 customers, at attractive energy costs.
We acquired our Richmond facility in 2010 through a bankruptcy process. We estimate that the former owner, a semiconductor manufacturer, had invested over $1 billion to develop the facility prior to the bankruptcy. Because the facility operated as a semiconductor fabrication facility prior to our acquisition, it had significant pre-existing infrastructure, including 110 MW of utility power, approximately 25,000 tons of chiller capacity, “Class A” private office space and other related supporting infrastructure. As a result, to date the incremental cost to redevelop the facility into a data center has been lower than the typical cost of ground-up data center development or redevelopment of other types of buildings into data centers. As of December 31, 2016, the facility was approximately 89% occupied by 97 customers across our 3Cs product offerings.
We are the fee simple owner of the Richmond facility, and the facility was subject to a $120 million secured credit facility which was terminated in October 2015 in conjunction with an amendment to our unsecured credit facility.
The Richmond facility is included in our redevelopment pipeline, as we plan to expand the facility in multiple phases. During the year ended December 31, 2016 we placed approximately 16,000 of raised floor NRSF into service. Longer term, we can further expand the facility by approximately 888,000 total operating NRSF, of which approximately 390,000 NRSF would be raised floor. Upon completion of the build-out of the facility, we anticipate that the facility would contain approximately 1.3 million total operating NRSF, including approximately 557,000 NRSF of raised floor.
48
In addition, we own approximately 100 acres of undeveloped land on the site that we estimate could be developed to provide, at a minimum, an additional approximately 1.8 million total operating NRSF, of which approximately 1.1 million NRSF would be raised floor. These 100 acres of undeveloped land are not included in our current development plans.
Lease Expirations. The following table sets forth a summary schedule of the lease expirations as of December 31, 2016 at the Richmond facility. Unless otherwise stated in the footnotes, the information set forth in the table assumes that customers exercise no renewal options and all early termination rights.
|
|
|
Number of |
|
Total |
|
% of Facility |
|
|
|
|
% of Facility |
|
Year of Lease |
|
Leases |
|
Raised Floor of |
|
Leased |
|
Annualized |
|
Annualized |
|
|
Expiration |
|
Expiring (1) |
|
Expiring Leases |
|
Raised Floor |
|
Rent (2) |
|
Rent |
|
|
Month-to-Month (3) |
|
30 |
|
288 |
|
0% |
|
$ |
485,736 |
|
1% |
|
2017 |
|
138 |
|
35,203 |
|
28% |
|
$ |
10,099,098 |
|
25% |
|
2018 |
|
100 |
|
13,124 |
|
10% |
|
$ |
8,232,819 |
|
20% |
|
2019 |
|
66 |
|
62,308 |
|
49% |
|
$ |
17,482,482 |
|
43% |
|
2020 |
|
30 |
|
2,504 |
|
2% |
|
$ |
2,141,926 |
|
5% |
|
2021 |
|
8 |
|
2,088 |
|
2% |
|
$ |
950,918 |
|
2% |
|
2022 |
|
— |
|
— |
|
0% |
|
$ |
— |
|
0% |
|
2023 |
|
— |
|
— |
|
0% |
|
$ |
— |
|
0% |
|
2024 |
|
33 |
|
11,070 |
|
9% |
|
$ |
1,666,752 |
|
4% |
|
After 2024 |
|
— |
|
— |
|
0% |
|
|
— |
|
0% |
|
Total |
|
405 |
|
126,585 |
|
100% |
|
$ |
41,059,732 |
|
100% |
|
(1) |
Represents each lease with a customer signed as of December 31, 2016 for which billing has commenced; a lease agreement could include multiple spaces and/or service orders and a customer could have multiple leases. |
|
(2) |
Annualized rent is presented for leases commenced as of December 31, 2016. We define annualized rent as MRR multiplied by 12. We calculate MRR as monthly contractual revenue under signed leases as of a particular date, which includes revenue from our C1, C2 and C3 rental and cloud and managed services activities, but excludes customer recoveries, deferred set-up fees, variable related revenues, non-cash revenues and other one-time revenues. MRR does not include the impact from booked-not-billed leases as of a particular date, unless otherwise specifically noted. This amount reflects the annualized cash rental payments. It does not reflect any accounting associated with any free rent, rent abatements or future scheduled rent increases and also excludes operating expense and power reimbursements. |
|
(3) |
Consists of both customer leases whose original contract terms ended on December 31, 2016 and have yet to commence previously signed renewals as well as customers whose leases expired prior to December 31, 2016 and have continued on a month-to-month basis. We do not typically enter into month-to-month leases. |
Primary Customers. The following table summarizes information regarding primary customers, which are customers occupying 10% or more of the leased raised floor of the Richmond facility, as of December 31, 2016:
|
Principal Customer Industry |
|
Lease |
|
Renewal |
|
Annualized Rent (1) |
|
|
% of Facility |
|
|
Content & Digital Media |
|
2019 |
|
none |
|
$ |
15,336,000 |
|
|
37% |
|
Financial Services |
|
2017 |
|
1x2 years |
|
|
4,447,272 |
|
|
11% |
|
(1) |
Annualized rent is presented for leases commenced as of December 31, 2016. We define annualized rent as MRR multiplied by 12. We calculate MRR as monthly contractual revenue under signed leases as of a particular date, which includes revenue from our C1, C2 and C3 rental and cloud and managed services activities, but excludes customer recoveries, deferred set-up fees, variable related revenues, non-cash revenues and other one-time revenues. MRR does not include the impact from booked-not-billed leases as of a particular date, unless otherwise specifically noted. This amount reflects the annualized cash rental payments. It does not reflect any accounting associated with any free rent, rent abatements or future scheduled rent increases and also excludes operating expense and power reimbursements. |
49
Historical Percentage Leased and Annualized Rental Rates. The following table sets forth the leasable raised floor square footage percentage leased, annualized rent and annualized rent per leased raised square foot for our Richmond facility since acquisition:
|
Date |
|
Facility Leasable |
|
% Occupied and |
|
Annualized |
|
Annualized Rent |
||
|
December 31, 2016 |
|
142,905 |
|
89% |
|
$ |
41,059,731 |
|
$ |
324 |
|
December 31, 2015 |
|
123,394 |
|
89% |
|
|
32,742,001 |
|
|
299 |
|
December 31, 2014 |
|
75,388 |
|
89% |
|
|
19,901,771 |
|
|
297 |
|
December 31, 2013 |
|
64,686 |
|
80% |
|
|
14,860,819 |
|
|
287 |
|
December 31, 2012 |
|
50,665 |
|
83% |
|
|
10,358,160 |
|
|
247 |
|
(1) |
Calculated as data center raised floor that is subject to a signed lease for which billing has commenced as of the applicable date, divided by leasable raised floor based on the then current configuration of the property, expressed as a percentage. |
|
(2) |
Annualized rent is presented for leases commenced as of the applicable date. We define annualized rent as MRR multiplied by 12. We calculate MRR as monthly contractual revenue under signed leases as of a particular date, which includes revenue from our C1, C2 and C3 rental and cloud and managed services activities, but excludes customer recoveries, deferred set-up fees, variable related revenues, non-cash revenues and other one-time revenues. MRR does not include the impact from booked-not-billed leases as of a particular date, unless otherwise specifically noted. This amount reflects the annualized cash rental payments. It does not reflect any accounting associated with any free rent, rent abatements or future scheduled rent increases and also excludes operating expense and power reimbursements. |
Irving
We purchased our Irving facility in February 2013. Prior to our purchase, the facility was operated as a semiconductor fabrication facility. Similar to our Richmond facility, the Irving facility has significant pre-existing infrastructure. Specifically, the Irving facility has diverse feeds of 140 MW of utility power and approximately 698,000 gross square feet on 39 acres. We are the fee simple owner of the Irving facility.
We acquired our Irving facility because we believe that we will be able to execute a redevelopment strategy similar to our Richmond facility. Given the infrastructure that was already in place due to its former use as a semiconductor fabrication facility, we believe that the incremental costs to redevelop data center raised floor space in this facility will be lower compared to typical costs for ground-up development or redevelopments of other building types. In addition, the access to a significant amount of utility power provides the necessary power capacity to support our growth strategy for our Irving data center. Furthermore, we believe that the Dallas market is an important data center market primarily due to its strong business environment and relatively affordable power costs.
The Irving facility is included in our redevelopment pipeline, as we continue to convert the entire facility into an operating data center in multiple phases. The first phase was completed in July 2014, when approximately 28,000 raised floor NRSF was placed into service. We placed an additional approximately 26,000 raised floor NRSF into service during the year ended December 31, 2015. During the year ended December 31, 2016, we placed an additional 69,000 raised floor NRSF into service. Our current under construction redevelopment plans call for the addition of up to approximately 126,000 total operating NRSF, including approximately 51,000 NRSF of raised floor. We anticipate that this expansion will cost (in addition to costs already incurred as of December 31, 2016) approximately $35 million in the aggregate based on current estimates. Longer term, we can further expand the facility by approximately 309,000 total NRSF, of which approximately 101,000 NRSF would be raised floor. Upon completion of the build-out of the facility, we anticipate that the facility would contain approximately 668,000 total operating NRSF, including approximately 276,000 NRSF of raised floor.
We own sufficient undeveloped land on the site, approximately 29 acres, that we believe could also be developed to provide an additional 524,000 total operating NRSF, of which approximately 324,000 NRSF would be raised floor. These 29 acres of undeveloped land are not included in our current development plans.
50
As of December 31, 2016, the facility was approximately 97% occupied by 56 customers.
Lease Expirations. The following table sets forth a summary schedule of the lease expirations for leases in place as of December 31, 2016 at the Irving facility. Unless otherwise stated in the footnotes, the information set forth in the table assumes that customers exercise no renewal options and all early termination rights.
|
|
|
Number of |
|
Total |
|
% of Facility |
|
|
|
|
% of Facility |
|
Year of Lease |
|
Leases |
|
Raised Floor of |
|
Leased |
|
Annualized |
|
Annualized |
|
|
Expiration |
|
Expiring (1) |
|
Expiring Leases |
|
Raised Floor |
|
Rent (2) |
|
Rent |
|
|
Month-to-Month (3) |
|
2 |
|
— |
|
0% |
|
$ |
51,382 |
|
0% |
|
2017 |
|
23 |
|
965 |
|
1% |
|
|
1,154,022 |
|
4% |
|
2018 |
|
45 |
|
752 |
|
1% |
|
|
2,014,383 |
|
7% |
|
2019 |
|
76 |
|
4,140 |
|
4% |
|
|
2,791,458 |
|
10% |
|
2020 |
|
26 |
|
1,975 |
|
2% |
|
|
1,298,636 |
|
4% |
|
2021 |
|
19 |
|
2,056 |
|
2% |
|
|
879,350 |
|
3% |
|
2022 |
|
2 |
|
47,828 |
|
41% |
|
|
8,851,800 |
|
30% |
|
2023 |
|
4 |
|
3,892 |
|
3% |
|
|
408,600 |
|
1% |
|
2024 |
|
4 |
|
47,585 |
|
41% |
|
|
10,357,944 |
|
35% |
|
2025 |
|
9 |
|
7,537 |
|
6% |
|
|
1,511,007 |
|
5% |
|
After 2025 |
|
— |
|
— |
|
0% |
|
|
— |
|
0% |
|
Total |
|
210 |
|
116,730 |
|
100% |
|
$ |
29,318,582 |
|
100% |
|
(1) |
Represents each lease with a customer signed as of December 31, 2016 for which billing has commenced; a lease agreement could include multiple spaces and/or service orders and a customer could have multiple leases. |
|
(2) |
Annualized rent is presented for leases commenced as of December 31, 2016. We define annualized rent as MRR multiplied by 12. We calculate MRR as monthly contractual revenue under signed leases as of a particular date, which includes revenue from our C1, C2 and C3 rental and cloud and managed services activities, but excludes customer recoveries, deferred set-up fees, variable related revenues, non-cash revenues and other one-time revenues. MRR does not include the impact from booked-not-billed leases as of a particular date, unless otherwise specifically noted. This amount reflects the annualized cash rental payments. It does not reflect any accounting associated with any free rent, rent abatements or future scheduled rent increases and also excludes operating expense and power reimbursements. |
|
(3) |
Consists of both customer leases whose original contract terms ended on December 31, 2016 and have yet to commence previously signed renewals as well as customers whose leases expired prior to December 31, 2016 and have continued on a month-to-month basis. We do not typically enter into month-to-month leases. |
Primary Customers. The following table summarizes information regarding primary customers, which are customers occupying 10% or more of the leased raised floor of the Irving facility, as of December 31, 2016:
|
Principal Customer Industry |
|
Lease |
|
Renewal |
|
Annualized Rent (1) |
|
|
% of Facility |
|
|
Cloud & IT Services |
|
2024 |
|
2x5 years |
|
$ |
10,357,944 |
|
|
35% |
|
Cloud & IT Services |
|
2022 |
|
2x5 years |
|
|
8,851,800 |
|
|
30% |
|
(1) |
Annualized rent is presented for leases commenced as of December 31, 2016. We define annualized rent as MRR multiplied by 12. We calculate MRR as monthly contractual revenue under signed leases as of a particular date, which includes revenue from our C1, C2 and C3 rental and cloud and managed services activities, but excludes customer recoveries, deferred set-up fees, variable related revenues, non-cash revenues and other one-time revenues. MRR does not include the impact from booked-not-billed leases as of a particular date, unless otherwise specifically noted. This amount reflects the annualized cash rental payments. It does not reflect any accounting associated with any free rent, rent abatements or future scheduled rent increases and also excludes operating expense and power reimbursements. |
51
Historical Percentage Leased and Annualized Rental Rates. The following table sets forth the leasable raised floor, percentage leased, annualized rent and annualized rent per leased raised square foot for the Irving facility:
|
Date |
|
Facility Leasable |
|
% Occupied and Billing (1) |
|
Annualized Rent (2) |
|
Annualized Rent |
||
|
December 31, 2016 |
|
120,776 |
|
97% |
|
$ |
29,318,582 |
|
$ |
251 |
|
December 31, 2015 |
|
47,722 |
|
90% |
|
|
9,133,696 |
|
|
213 |
|
December 31, 2014 |
|
24,530 |
|
99% |
|
|
2,578,332 |
|
|
107 |
|
(1) |
Calculated as data center raised floor that is subject to a signed lease for which billing has commenced as of the applicable date, divided by leasable raised floor based on the then current configuration of the property, expressed as a percentage. |
|
(2) |
Annualized rent is presented for leases commenced as of the applicable date. We define annualized rent as MRR multiplied by 12. We calculate MRR as monthly contractual revenue under signed leases as of a particular date, which includes revenue from our C1, C2 and C3 rental and cloud and managed services activities, but excludes customer recoveries, deferred set-up fees, variable related revenues, non-cash revenues and other one-time revenues. MRR does not include the impact from booked-not-billed leases as of a particular date, unless otherwise specifically noted. This amount reflects the annualized cash rental payments. It does not reflect any accounting associated with any free rent, rent abatements or future scheduled rent increases and also excludes operating expense and power reimbursements. |
Leased Facilities Acquired in 2015
We acquired leased facilities as part of our acquisition of Carpathia on June 16, 2015. As of December 31, 2016, these leased facilities, including those subject to capital leases, consisted of eight domestic data centers located in Dulles, Virginia; Phoenix, Arizona; San Jose, California; Harrisonburg, Virginia and Ashburn, Virginia; and four international data centers located in Toronto, Canada; Amsterdam, Netherlands; Hong Kong and London, United Kingdom.
These leased facilities consist of approximately 166,000 gross square feet with approximately 109,000 total operating NRSF, including approximately 71,000 raised floor operating NRSF and 20 MW of gross power. The leased facilities are included in our redevelopment pipeline. We can further expand the facilities by approximately 12,000 total NRSF, all of which would be raised floor. Upon completion of the build-out of the facilities, we anticipate that the facilities would contain approximately 121,000 total operating NRSF, including approximately 94,000 NRSF of raised floor.
As of December 31, 2016, the facilities were approximately 84% occupied by 186 customers. The majority of the customers at these facilities are C3 customers which lease small amounts of space.
Lease Expirations. The following table sets forth a summary schedule of the lease expirations for leases in place as of December 31, 2016 at the acquired leased facilities. Unless otherwise stated in the footnotes, the information set forth in the table assumes that customers exercise no renewal options and all early termination rights.
|
|
|
Number of |
|
Total |
|
% of Facility |
|
|
|
|
% of Facility |
|
Year of Lease |
|
Leases |
|
Raised Floor of |
|
Leased |
|
Annualized |
|
Annualized |
|
|
Expiration |
|
Expiring (1) |
|
Expiring Leases |
|
Raised Floor |
|
Rent (2) |
|
Rent |
|
|
Month-to-Month (3) |
|
75 |
|
896 |
|
2% |
|
$ |
5,676,551 |
|
8% |
|
2017 |
|
396 |
|
27,592 |
|
71% |
|
|
45,591,551 |
|
63% |
|
2018 |
|
163 |
|
8,491 |
|
22% |
|
|
14,563,912 |
|
20% |
|
2019 |
|
53 |
|
2,124 |
|
5% |
|
|
4,595,694 |
|
7% |
|
2020 |
|
12 |
|
34 |
|
0% |
|
|
1,650,345 |
|
2% |
|
2021 |
|
2 |
|
8 |
|
0% |
|
|
83,593 |
|
0% |
|
After 2021 |
|
— |
|
— |
|
0% |
|
|
— |
|
0% |
|
Total |
|
701 |
|
39,145 |
|
100% |
|
$ |
72,161,646 |
|
100% |
|
(1) |
Represents each lease with a customer signed as of December 31, 2016 for which billing has commenced; a lease agreement could include multiple spaces and/or service orders and a customer could have multiple leases. |
52
|
(2) |
Annualized rent is presented for leases commenced as of December 31, 2016. We define annualized rent as MRR multiplied by 12. We calculate MRR as monthly contractual revenue under signed leases as of a particular date, which includes revenue from our C1, C2 and C3 rental and cloud and managed services activities, but excludes customer recoveries, deferred set-up fees, variable related revenues, non-cash revenues and other one-time revenues. MRR does not include the impact from booked-not-billed leases as of a particular date, unless otherwise specifically noted. This amount reflects the annualized cash rental payments. It does not reflect any accounting associated with any free rent, rent abatements or future scheduled rent increases and also excludes operating expense and power reimbursements. |
|
(3) |
Consists of both customer leases whose original contract terms ended on December 31, 2016 and have yet to commence previously signed renewals as well as customers whose leases expired prior to December 31, 2016 and have continued on a month-to-month basis. We do not typically enter into month-to-month leases. |
Primary Customers. The following table summarizes information regarding primary customers, which are customers occupying 10% or more of the leased raised floor of the acquired leased facilities, as of December 31, 2016:
|
Principal Customer Industry |
|
Lease |
|
Renewal |
|
Annualized Rent (1) |
|
% of Facility |
||
|
Government & Security |
|
2017 |
|
none |
|
$ |
9,360,000 |
|
|
13% |
|
Cloud & IT Services |
|
2017 |
|
none |
|
|
7,006,392 |
|
|
10% |
|
Other |
|
2017 |
|
2x2 years |
|
|
1,044,013 |
|
|
1% |
|
(1) |
Annualized rent is presented for leases commenced as of December 31, 2016. We define annualized rent as MRR multiplied by 12. We calculate MRR as monthly contractual revenue under signed leases as of a particular date, which includes revenue from our C1, C2 and C3 rental and cloud and managed services activities, but excludes customer recoveries, deferred set-up fees, variable related revenues, non-cash revenues and other one-time revenues. MRR does not include the impact from booked-not-billed leases as of a particular date, unless otherwise specifically noted. This amount reflects the annualized cash rental payments. It does not reflect any accounting associated with any free rent, rent abatements or future scheduled rent increases and also excludes operating expense and power reimbursements. |
Historical Percentage Leased and Annualized Rental Rates. The following table sets forth the leasable raised floor, percentage leased, annualized rent and annualized rent per leased raised square foot for the acquired leased facilities:
|
Date |
|
Facility Leasable |
|
% Occupied and |
|
Annualized |
|
Annualized Rent |
||
|
December 31, 2016 |
|
46,501 |
|
84% |
|
$ |
72,161,646 |
|
$ |
1,843 |
|
December 31, 2015 |
|
44,074 |
|
95% |
|
$ |
84,557,585 |
|
$ |
2,026 |
|
(1) |
Calculated as data center raised floor that is subject to a signed lease for which billing has commenced as of the applicable date, divided by leasable raised floor based on the then current configuration of the property, expressed as a percentage. |
|
(2) |
Annualized rent is presented for leases commenced as of the applicable date. We define annualized rent as MRR multiplied by 12. We calculate MRR as monthly contractual revenue under signed leases as of a particular date, which includes revenue from our C1, C2 and C3 rental and cloud and managed services activities, but excludes customer recoveries, deferred set-up fees, variable related revenues, non-cash revenues and other one-time revenues. MRR does not include the impact from booked-not-billed leases as of a particular date, unless otherwise specifically noted. This amount reflects the annualized cash rental payments. It does not reflect any accounting associated with any free rent, rent abatements or future scheduled rent increases and also excludes operating expense and power reimbursements. |
53
Below is a description of our other properties.
Santa Clara
Our Santa Clara, California facility was acquired in November 2007. The facility, which is owned subject to a long-term ground sublease as described below, consists of two buildings containing approximately 135,000 gross square feet with approximately 102,000 total operating NRSF, including approximately 56,000 raised floor operating NRSF. The facility is situated on a 6.5-acre site in Silicon Valley. Several Silicon Valley Power substations supply 11 MW of utility power to the facility, which is backed up by diesel generators. We believe that Silicon Valley is an ideal data center location due to the large concentration of technology companies and the high local demand for data centers and cloud and managed services.
As of December 31, 2016, the facility was approximately 83% occupied by 104 customers.
The Santa Clara facility is included in our redevelopment pipeline. Our current under construction redevelopment plans call for the addition of up to approximately 4,000 total operating NRSF, all of which is raised floor. We anticipate that this expansion will cost (in addition to costs already incurred as of December 31, 2016) approximately $2 million in the aggregate based on current estimates. Longer term, we can further expand the facility by approximately 21,000 NRSF of raised floor. Upon completion of the build-out of the facility, we anticipate that the facility would contain approximately 131,000 total operating NRSF, including approximately 81,000 NRSF of raised floor.
The Santa Clara facility is subject to a ground lease. We acquired a ground sublease interest in the land on which the Santa Clara facility is located in November 2007. The ground sublease expires in 2052, subject to two 10-year extension options. The current annual rent payable under the ground sublease is approximately $1.2 million, which increases annually by the lesser of 6% or the increase in the Consumer Price Index for the San Francisco Bay area. In addition, in 2018 and 2038, the monthly rent will be adjusted to equal one-twelfth of an amount equal to 8.5% of the product of (i) the then fair market value of the demised premises (without taking into account the value of the improvements existing on the land) calculated on a per square foot basis, and (ii) the net square footage of the demised premises. During the term of the ground lease, we have certain obligations to facilitate the provision of job training, seminars and research opportunities for students of a community college that is adjacent to the property. We are the indirect holder of this ground sublease.
Sacramento
Our Sacramento, California facility, which we acquired in December 2012, is located 120 miles from our Santa Clara facility on a 6.8-acre site. The facility currently consists of approximately 93,000 gross square feet with approximately 81,000 total operating NRSF, including approximately 55,000 raised floor operating NRSF. The Sacramento Municipal Utility District supplies 8 MW of utility power to the facility, which is backed up by diesel generators. The facility is an institutional grade data center with a classic “N+1” design that provides a single extra uninterruptible power supply module for use in the event of a system failure. This facility will provide our regional customer base with business continuity services along with Cloud and Managed Services. We believe the property’s location is a valuable complement to our Santa Clara facility for our customers, as it will allow them to diversify their footprint in the California market with a single provider. We intend to leverage our existing West Coast regional team and our Cloud and Managed Services sales and support staff to cater to customers in this property, many of which already used managed services when we acquired the property.
We are not currently redeveloping the Sacramento facility. Longer term, we can expand the facility by approximately 3,000 NRSF of raised floor. Upon completion of the build-out of the facility, we anticipate that it will contain approximately 84,000 total operating NRSF including approximately 58,000 NRSF of raised floor.
As of December 31, 2016, the facility was approximately 44% occupied by 151 customers. The majority of the customers at this facility are C2 customers which lease small amounts of space. We are the fee simple owner of the Sacramento facility.
54
Miami
Our Miami, Florida facility currently consists of approximately 30,000 gross square feet with approximately 26,000 total operating NRSF, including 20,000 raised floor operating NRSF. The property sits on a 1.6-acre site located at Dolphin Center with 4 MW of utility power supplied by Florida Power & Light and backed up by diesel generators. With a wind rating of 185 miles-per-hour, the facility is built to withstand a Category 5 hurricane. Miami is a strategic location for us because it is a gateway to the South American financial markets and a transcontinental Internet hub. The Miami facility was under development when we acquired it in April 2008, and we completed the build-out in August 2008. Other than normally recurring capital expenditures, we have no current plans to further build-out or expand the Miami facility.
As of December 31, 2016, the facility was approximately 66% occupied by 78 customers. We intend to continue to lease-up this property. We are the fee simple owner of the Miami facility.
Jersey City
Our Jersey City, New Jersey facility is a leased facility that consists of approximately 122,000 gross square feet with approximately 88,000 total operating NRSF, including approximately 32,000 raised floor operating NRSF. The Jersey City facility was originally leased by another party in March 2004 and we acquired the lease in October 2006 when we acquired the lessee. The lease expires in September 2026 and is subject to one five-year extension option. The facility was redeveloped in November 2006, and we subsequently leased it to service customers in New Jersey and New York. The facility is comprised of four floors of a 19 story building located on one city block in the metropolitan New York City area, six miles from Manhattan. PSE&G supplies 7 MW of utility power to the facility, which is backed up by diesel generators. The facility also contains a small amount of “Class A” office space. We believe that the location in Jersey City provides us with a crucial presence in the tri-state area, where space is highly coveted given the strong demand from financial services firms.
We are not currently redeveloping the Jersey City facility. Longer term, we can further expand the facility by approximately 21,000 NRSF of raised floor. Upon completion of the build-out of the facility, we anticipate that the facility would contain approximately 109,000 total operating NRSF, including approximately 53,000 NRSF of raised floor.
As of December 31, 2016, the facility was approximately 89% occupied by 58 customers.
Princeton
Our Princeton, New Jersey facility, which we acquired on June 30, 2014, is located on approximately 194 acres and consists of approximately 554,000 gross square feet, including approximately 58,000 square feet of raised floor, and 22 MW of gross power. Concurrently with acquiring this data center we entered into a 10 year lease for the facility’s 58,000 square feet of raised floor with Atos, an international information technology services company headquartered in Bezos, France. The lease includes a 15 year renewal at the option of Atos.
The Princeton facility is included in our redevelopment pipeline. We can further expand the facility by another approximately 372,000 total operating NRSF, of which approximately 100,000 NRSF would be raised floor. Upon completion of the build-out of the facility, we anticipate that the facility would contain approximately 544,000 total operating NRSF, including approximately 158,000 NRSF of raised floor.
Chicago
Our Chicago facility, which we acquired on July 8, 2014, is the former Sun Times Press facility near downtown Chicago, Illinois. The facility consists of approximately 467,000 gross square feet, including approximately 14,000 raised floor operating NRSF and 24 MW of gross power capacity, with 8 MW of available utility power currently available and another 47 MW available upon request.
The Chicago facility is included in our redevelopment pipeline, as we plan to convert the facility into an operating data center in multiple phases. During the year ended December 31, 2016, we placed approximately 14,000 raised floor NRSF into service. Our current under construction redevelopment plans call for the addition of up to approximately 52,000 total operating NRSF, including approximately 28,000 NRSF of raised floor. We anticipate that this expansion
55
will cost (in addition to costs already incurred as of December 31, 2016) approximately $32 million in the aggregate based on current estimates. Longer term, we can further expand the facility by approximately 341,000 total operating NRSF, of which approximately 166,000 would be raised floor. Upon completion of the build-out of the facility, we anticipate that the facility would contain approximately 374,000 total operating NRSF with raised floor capacity of approximately 208,000 square feet and 37 MW of power.
Piscataway
Our Piscataway, New Jersey facility, which we acquired on June 6, 2016, currently consists of approximately 360,000 gross square feet with approximately 195,000 total operating NRSF, including approximately 89,000 raised floor operating NRSF. The property is located on a 38-acre campus and includes an on-site 112kVA substation as well as solar panel that produce approximately 2 MW of power.
The Piscataway facility is included in our redevelopment pipeline, as we plan to convert the facility into an operating data center in multiple phases. Our current under construction redevelopment plans call for the addition of up to approximately 18,000 total operating NRSF, including approximately 10,000 NRSF of raised floor. We anticipate that this expansion will cost (in addition to costs already incurred as of December 31, 2016) approximately $4 million in the aggregate based on current estimates. Longer term, we can further expand the facility by approximately 141,000 total operating NRSF, of which approximately 77,000 would be raised floor. Upon completion of the build-out of the facility, we anticipate that the facility would contain approximately 336,000 total operating NRSF, including approximately 176,000 NRSF of raised floor.
Fort Worth
Our Forth Worth, Texas facility, which we acquired on December 16, 2016, is located on approximately 53 acres and consists of approximately 262,000 gross square feet, including approximately 600 square feet of raised floor and 8 MW of gross power. The facility is located approximately 20 miles from our Irving, Texas data center.
The Fort Worth facility is included in our redevelopment pipeline, as we plan to convert the facility into an operating data center in multiple phases. Our current under construction redevelopment plans call for the addition of up to approximately 45,000 total operating NRSF, including approximately 16,000 NRSF of raised floor. We anticipate that this expansion will cost (in addition to costs already incurred as of December 31, 2016) approximately $12 million in the aggregate based on current estimates. Longer term, we can further expand the facility by approximately 204,000 total operating NRSF, of which approximately 63,000 would be raised floor. Upon completion of the build-out of the facility, we anticipate that the facility would contain approximately 206,000 total operating NRSF, including approximately 80,000 NRSF of raised floor.
Overland Park
The Overland Park, Kansas facility, known as the J. Williams Technology Center, is a leased facility consisting of approximately 33,000 gross square feet, with approximately 8,000 total operating NRSF, including approximately 2,500 raised floor operating NRSF. The property is located in the Kansas City, Missouri metropolitan area. Kansas City Power & Light supplies approximately 1 MW of utility power, which is backed up by a diesel generator. The J. Williams Technology Center has housed the corporate headquarters of the Quality Group of Companies, LLC. (“QGC”) since September 2003. We lease the facility under a lease with an entity controlled by our Chairman and Chief Executive Officer, which was entered into in January 2009 and expires in December 2018 with one remaining five-year renewal term. This building, while containing a small data center, is primarily utilized as our corporate headquarters. Other than normally recurring capital expenditures and expansion of our own office space at our headquarters, we have no current plans to further build-out or expand the raised floor at our Overland Park data center.
As of December 31, 2016, the facility was approximately 56% occupied by 14 customers.
Lenexa
Our Lenexa, Kansas property is an approximately 35,000 gross square foot facility located in the Kansas City, Missouri metropolitan area. The property was acquired in 2004. The Lenexa property does not currently operate as a data center, nor do we intend to operate it as a data center. We have historically used this property primarily as a warehouse, but
56
currently lease approximately 22,000 square feet to a tenant for general office use, and 12,205 square feet to a tenant as general office and warehouse space. Other than minimal normally recurring capital expenditures, we have no current plans to further build out or expand the Lenexa property.
Duluth, Georgia
On December 30, 2015, we purchased an office building in Duluth, Georgia for $3.8 million. This building is primarily used as additional office space for our operational headquarters.
In the ordinary course of our business, we are subject to claims for negligence and other claims and administrative proceedings, none of which we believe are material or would be expected to have, individually or in the aggregate, a material adverse effect on us. For additional information with respect to current legal proceedings, refer to Item 8 – Note 6 – Commitments and Contingencies in “Financial Statements and Supplementary Data” included in this Annual Report.
ITEM 4. MINE SAFETY DISCLOSURES
Not applicable.
ITEM 5. MARKET FOR REGISTRANT’S COMMON EQUITY, RELATED STOCKHOLDER MATTERS AND ISSUER PURCHASES OF EQUITY SECURITIES
QTS’ common stock is listed on the New York Stock Exchange (“NYSE”) and trades under the symbol “QTS.” QTS’s common stock has been listed and traded on the NYSE since October 9, 2013. As of February 23, 2017, we had 92 holders of record of our common stock. This figure does not reflect the beneficial ownership of shares held in nominee name. The following table sets forth, for the periods indicated, the high and low sale prices in dollars on the NYSE for QTS’ common stock and the dividends we declared with respect to the periods indicated.
|
|
|
Price Range |
|
|
|
||||
|
|
|
High |
|
Low |
|
Dividends declared |
|||
|
2016 |
|
|
|
|
|
|
|
|
|
|
Fourth Quarter |
|
$ |
53.94 |
|
$ |
43.01 |
|
$ |
0.36 |
|
Third Quarter |
|
|
59.41 |
|
|
52.20 |
|
|
0.36 |
|
Second Quarter |
|
|
56.01 |
|
|
46.72 |
|
|
0.36 |
|
First Quarter |
|
|
47.86 |
|
|
40.50 |
|
|
0.36 |
|
|
|
|
|
|
|
|
|
|
|
|
2015 |
|
|
|
|
|
|
|
|
|
|
Fourth Quarter |
|
$ |
46.38 |
|
$ |
41.02 |
|
$ |
0.32 |
|
Third Quarter |
|
|
44.61 |
|
|
36.52 |
|
|
0.32 |
|
Second Quarter |
|
|
38.65 |
|
|
34.91 |
|
|
0.32 |
|
First Quarter |
|
|
40.58 |
|
|
33.65 |
|
|
0.32 |
While we plan to continue to pay quarterly dividends, no assurances can be made as to the frequency or amounts of any future dividends. The payment of common stock dividends is dependent upon our financial condition, operating results and REIT distribution requirements and may be adjusted at the discretion of our board of directors during the year. On February 17, 2017, the Company announced that its board of directors authorized payment of a regular quarterly cash dividend of $0.39 per common share and per unit in the Operating Partnership, payable on April 5, 2017, to stockholders and unit holders of record as of the close of business on March 16, 2017.
QTS also has 133,000 shares of Class B common stock outstanding, which are not listed on any exchange. The Class B common stock is held by one registered holder, Chad L. Williams, our Chairman and Chief Executive Officer.
There is no established public trading market for the Operating Partnership’s limited partnership units. As of February 23, 2017, the Operating Partnership had 14 holders of record of its Class A units. The holders of Class A units of the Operating Partnership received quarterly distributions in same amounts as the common stockholders of QTS (as set forth in the table above) during the two years ended December 31, 2016 and 2015.
57
Distribution Policy
To satisfy the requirements to qualify for taxation as a REIT, and to avoid paying tax on our income, we intend to continue to make regular quarterly distributions of all, or substantially all, of our REIT taxable income (excluding net capital gains) to our stockholders.
All distributions will be made at the discretion of our board of directors and will depend on our historical and projected results of operations, liquidity and financial condition, our REIT qualification, our debt service requirements, operating expenses and capital expenditures, prohibitions and other restrictions under financing arrangements and applicable law and other factors as our board of directors may deem relevant from time to time. We anticipate that our estimated cash available for distribution will exceed the annual distribution requirements applicable to REITs and the amount necessary to avoid the payment of tax on undistributed income. However, under some circumstances, we may be required to make distributions in excess of cash available for distribution in order to meet these distribution requirements and we may need to borrow funds to make certain distributions. If we borrow to fund distributions, our future interest costs would increase, thereby reducing our earnings and cash available for distribution from what they otherwise would have been.
The partnership agreement of the Operating Partnership requires the Operating Partnership to distribute at least quarterly 100% of our “available cash” (as defined in the partnership agreement) to the partners of the Operating Partnership, in accordance with the terms established for the class of partnership interests held by such partner. Furthermore, because QTS intends to continue to qualify as a REIT for tax purposes, QTS is required to make reasonable efforts to distribute available cash (a) to limited partners of the Operating Partnership so as to preclude any such distribution or portion thereof from being treated as part of a sale of property to the Operating Partnership by a limited partner under Section 707 of the Code or the regulations thereunder; provided, however, that neither of QTS nor the Operating Partnership shall have liability to a limited partner under any circumstances as a result of any distribution to a limited partner being so treated, and (b) to QTS, as general partner, in an amount sufficient to enable QTS to make distributions to its stockholders that will enable QTS to (1) satisfy the requirements for qualification as a REIT under the Code and the regulations thereunder, and (2) avoid any federal income or excise tax liability. Consistent with the partnership agreement, we intend to continue to distribute quarterly an amount of our available cash sufficient to enable QTS to pay quarterly dividends to its stockholders in an amount necessary to satisfy the requirements applicable to REITs under the Code and to eliminate federal income and excise tax liability.
Restrictions on Distributions
In addition, our unsecured credit facility and the indenture governing the Senior Notes contain provisions that may limit our ability to make distributions to our stockholders. The unsecured credit facility generally provides that if a default occurs and is continuing, we will be precluded from making distributions on our common stock (other than those required to allow QTS to qualify and maintain its status as a REIT, so long as such default does not arise from a payment default or event of insolvency) and lenders under the facility and, potentially, other indebtedness, could accelerate the maturity of the related indebtedness. The unsecured credit facility also contains covenants providing for a maximum distribution of the greater of (i) 95% of our Funds from Operations (as defined in such agreement) and (ii) the amount required for us to qualify as a REIT. The indenture governing the Senior Notes contains provisions that restrict the Operating Partnership’s ability to make distributions to QTS, except distributions required to allow QTS to qualify and maintain its status as a REIT, so long as no event of default has occurred and is continuing.
Performance Graph
The following line graph sets forth, for the period from October 9, 2013, through December 31, 2016, a comparison of the percentage change in the cumulative total stockholder return on our common stock compared to the cumulative total return of the S&P 500 Market Index and the MSCI US REIT Index (“RMZ”). The graph assumes that $100 was invested on October 9, 2013, in shares of our common stock and each of the aforementioned indices and that all dividends were
58
reinvested without the payment of any commissions. There can be no assurance that the performance of our shares will continue in line with the same or similar trends depicted in the graph below.
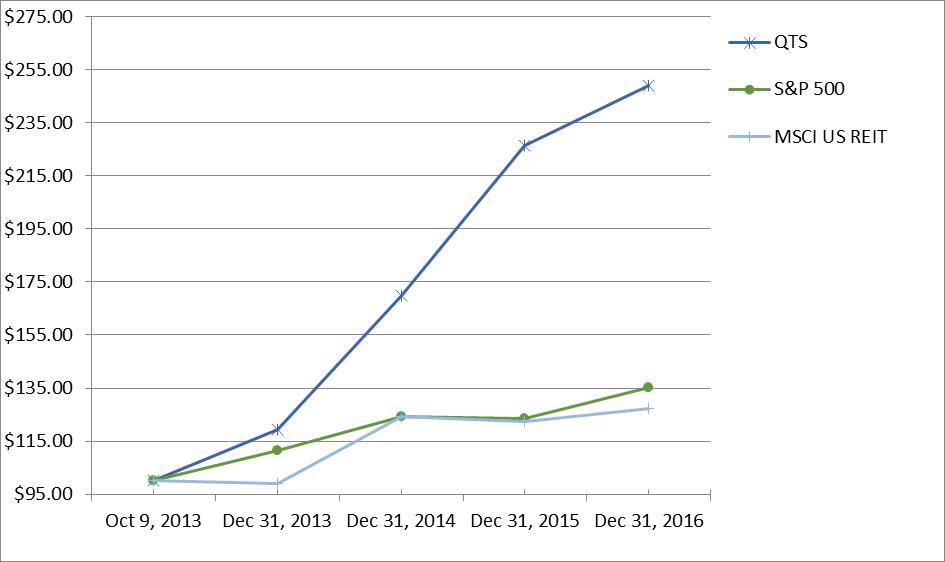
|
Pricing Date |
|
QTS |
|
S&P 500 |
|
MSCI US REIT |
|||
|
Oct 9, 2013 |
|
$ |
100.00 |
|
$ |
100.00 |
|
$ |
100.00 |
|
Dec 31, 2013 |
|
|
119.36 |
|
|
111.59 |
|
|
99.12 |
|
Dec 31, 2014 |
|
|
169.71 |
|
|
124.30 |
|
|
124.18 |
|
Dec 31, 2015 |
|
|
226.23 |
|
|
123.40 |
|
|
122.31 |
|
Dec 31, 2016 |
|
|
249.00 |
|
|
135.16 |
|
|
127.47 |
This performance graph shall not be deemed "filed" for the purposes of Section 18 of the Securities Exchange Act of 1934, as amended, or incorporated by reference into any filing by us under the Securities Act of 1933, as amended, or the Securities Exchange Act, except as shall be expressly set forth by specific reference in such filing.
Unregistered Sales of Equity Securities
QTS did not sell any securities during the fiscal year ended December 31, 2016 that were not registered under the Securities Act of 1933, as amended.
QTS from time to time issues shares of Class A common stock pursuant to the QTS Realty Trust, Inc. 2013 Equity Incentive Plan (the “2013 Equity Incentive Plan”) upon exercise of stock options issued under the 2013 Equity Incentive Plan and upon redemption of Class A units of limited partnership of the Operating Partnership (either through Class A units previously held or those received from conversion of Class O units or Class RS LTIP units from the QualityTech, LP 2010 Equity Incentive Plan). In addition, QTS issued shares of Class A common stock in an underwritten public offering in April of 2016. Pursuant to the partnership agreement of the Operating Partnership, each time QTS issues shares of common stock, the Operating Partnership issues to QTS, its general partner, an equal number of Class A units. The units issued to QTS are not registered under the Securities Act in reliance on Section 4(a)(2) of the Securities Act due to the fact that Class A units were issued only to QTS and therefore, did not involve a public offering. During the year ended December 31, 2016, the Operating Partnership issued 0.1 million Class A units to QTS in connection with such redemptions and stock option exercises and issuances pursuant to the 2013 Equity Incentive Plan, with a value of approximately $7.8 million based on the respective dates of the redemptions and option exercises, as applicable. In addition, during the year ended December 31, 2016, the Operating Partnership issued approximately 6.3 million Class A units to QTS in connection with the underwritten public offering in April of 2016 with a value of approximately $275.8 million.
The Operating Partnership also issues Class A units upon the conversion of Class O units or Class RS LTIP units of the Operating Partnership. During the year ended December 31, 2016, the Operating Partnership issued approximately 56,000 Class A units to holders of Class O units and Class RS LTIP units, excluding units that were then converted to Class A common stock of QTS Realty Trust, Inc. These Class A units were not registered under the Securities Act in
59
reliance on Section 4(a)(2) of the Securities Act due to the fact that Class A units were issued only to the respective holders of Class O units and Class RS LTIP units at the time of conversion and did not involve a public offering.
Repurchases of Equity Securities
During the year ended December 31, 2016, certain of our employees surrendered Class A common stock owned by them to satisfy their statutory minimum federal and state tax obligations in connection with the vesting of restricted common stock under the QTS Realty Trust, Inc. 2013 Equity Incentive Plan.
The following table summarizes all of these repurchases during the year ended December 31, 2016.
|
Period |
|
Total number of shares purchased |
|
Average price |
|
Total number of |
|
Maximum number of |
|
|
January 1, 2016 through January 31, 2016 |
|
— |
|
|
N/A |
|
N/A |
|
N/A |
|
February 1, 2016 through February 29, 2016 |
|
13,806 |
(1) |
$ |
45.05 |
|
N/A |
|
N/A |
|
March 1, 2016 through March 31, 2016 |
|
6,141 |
|
|
46.99 |
|
N/A |
|
N/A |
|
April 1, 2016 through April 30, 2016 |
|
— |
|
|
N/A |
|
N/A |
|
N/A |
|
May 1, 2016 through May 31, 2016 |
|
— |
|
|
N/A |
|
N/A |
|
N/A |
|
June 1, 2016 through June 30, 2016 |
|
7,620 |
|
|
55.36 |
|
N/A |
|
N/A |
|
July 1, 2016 through July 31, 2016 |
|
— |
|
|
N/A |
|
N/A |
|
N/A |
|
August 1, 2016 through August 31, 2016 |
|
1,198 |
|
|
54.52 |
|
N/A |
|
N/A |
|
September 1, 2016 through September 30, 2016 |
|
7,571 |
|
|
53.66 |
|
N/A |
|
N/A |
|
October 1, 2016 through October 31, 2016 |
|
— |
|
|
N/A |
|
N/A |
|
N/A |
|
November 1, 2016 through November 30, 2016 |
|
673 |
|
|
43.33 |
|
N/A |
|
N/A |
|
December 1, 2016 through December 31, 2016 |
|
8,629 |
|
|
49.36 |
|
N/A |
|
N/A |
|
Total |
|
45,638 |
|
$ |
49.50 |
|
N/A |
|
N/A |
|
(1) |
The number of shares purchased represents shares of Class A common stock surrendered by certain of our employees to satisfy their statutory minimum federal and state tax obligations associated with the vesting of restricted common stock. With respect to these shares, the price paid per share is based on the closing price of our Class A common stock as of the date of the determination of the statutory minimum federal income tax. |
ITEM 6. SELECTED FINANCIAL DATA
The following table sets forth selected financial data on a historical basis for QTS and the Operating Partnership, which is our historical predecessor. QTS is the sole general partner and majority owner of the Operating Partnership and as of December 31, 2016, QTS owned an approximate 87.6% ownership interest in the Operating Partnership. Substantially all of our assets are held by, and our operations are conducted through, the Operating Partnership.
The financial data as of December 31, 2016, 2015, 2014 and 2013 and for the period from October 15, 2013 through December 31, 2016 is that of QTS and its majority-owned subsidiaries, which includes the Operating Partnership. Prior to October 15, 2013, QTS did not have any operating activity. The historical financial data for the period ended October 14, 2013 and as of and for the year ended December 31, 2012 have been derived from the Operating Partnership’s financial statements. The historical financial data for the Operating Partnership, which is also QTS’ historical predecessor, is not necessarily indicative of our results of operations, cash flows or financial condition following the completion of our IPO.
The following table sets forth selected financial and operating data on a consolidated basis for QTS and the historical predecessor, the Operating Partnership. The information set forth below should be read in conjunction with “Management’s Discussion and Analysis of Financial Condition and Results of Operations” and the consolidated financial statements and the notes thereto which are included elsewhere in this Form 10-K. The data for QTS and the Operating Partnership are substantially the same with the primary differences being the presentation of stockholders’ equity and partners’ capital, and the allocation of net income (loss), whereby QTS retains its share of the net income (loss) based on its ownership of the Operating Partnership, with the remaining balance being retained by the Operating
60
Partnership. Therefore, the financial and operating data presented in the following tables reflect the results of the Operating Partnership for all periods presented, except where specifically noted.
|
|
|
The Company |
|
Historical Predecessor |
||||||||||||||
|
|
|
|
|
|
|
|
|
|
|
|
For the period |
|
For the period |
|
|
|
||
|
|
|
|
|
|
|
|
|
|
|
|
October 15, 2013 |
|
January 1, 2013 |
|
|
|
||
|
|
|
|
|
|
|
|
|
|
|
|
through |
|
through |
|
Year Ended |
|||
|
|
|
Year Ended December 31, |
|
December 31, |
|
October 14, |
|
December 31, |
||||||||||
|
($ in thousands, except share and per share data) |
|
2016 |
|
2015 |
|
2014 |
|
2013 |
|
2013 |
|
2012 |
||||||
|
Statement of Operations Data |
|
|
|
|
|
|
|
|
|
|
|
|
|
|
|
|
|
|
|
Revenues: |
|
|
|
|
|
|
|
|
|
|
|
|
|
|
|
|
|
|
|
Rental |
|
$ |
295,723 |
|
$ |
230,510 |
|
$ |
175,649 |
|
$ |
33,304 |
|
$ |
112,002 |
|
$ |
120,758 |
|
Recoveries from tenants |
|
|
29,271 |
|
|
22,581 |
|
|
19,194 |
|
|
2,674 |
|
|
10,424 |
|
|
9,294 |
|
Cloud and managed services |
|
|
68,488 |
|
|
51,994 |
|
|
20,231 |
|
|
4,074 |
|
|
13,457 |
|
|
14,497 |
|
Other |
|
|
8,881 |
|
|
5,998 |
|
|
2,715 |
|
|
410 |
|
|
1,542 |
|
|
1,210 |
|
Total revenue |
|
|
402,363 |
|
|
311,083 |
|
|
217,789 |
|
|
40,462 |
|
|
137,425 |
|
|
145,759 |
|
Operating expenses |
|
|
|
|
|
|
|
|
|
|
|
|
|
|
|
|
|
|
|
Property operating costs |
|
|
136,488 |
|
|
104,355 |
|
|
71,518 |
|
|
13,482 |
|
|
47,268 |
|
|
51,506 |
|
Real estate taxes and insurance |
|
|
8,840 |
|
|
5,869 |
|
|
5,116 |
|
|
1,016 |
|
|
3,476 |
|
|
3,632 |
|
Depreciation and amortization |
|
|
124,786 |
|
|
85,811 |
|
|
58,282 |
|
|
11,238 |
|
|
36,120 |
|
|
34,932 |
|
General and administrative |
|
|
83,286 |
|
|
67,783 |
|
|
45,283 |
|
|
8,457 |
|
|
30,726 |
|
|
35,986 |
|
Transaction and integration costs |
|
|
10,906 |
|
|
11,282 |
|
|
1,018 |
|
|
66 |
|
|
52 |
|
|
897 |
|
Restructuring |
|
|
— |
|
|
— |
|
|
1,298 |
|
|
— |
|
|
— |
|
|
3,291 |
|
Total operating expenses |
|
|
364,306 |
|
|
275,100 |
|
|
182,515 |
|
|
34,259 |
|
|
117,642 |
|
|
130,244 |
|
Operating income |
|
|
38,057 |
|
|
35,983 |
|
|
35,274 |
|
|
6,203 |
|
|
19,783 |
|
|
15,515 |
|
Other income and expense: |
|
|
|
|
|
|
|
|
|
|
|
|
|
|
|
|
|
|
|
Interest income |
|
|
3 |
|
|
2 |
|
|
8 |
|
|
1 |
|
|
17 |
|
|
61 |
|
Interest expense |
|
|
(23,159) |
|
|
(21,289) |
|
|
(15,308) |
|
|
(2,049) |
|
|
(16,675) |
|
|
(25,140) |
|
Other (expense) income |
|
|
(192) |
|
|
(468) |
|
|
(871) |
|
|
(153) |
|
|
(3,277) |
|
|
(1,151) |
|
Income (loss) before taxes and gain (loss) on sale of real estate |
|
|
14,709 |
|
|
14,228 |
|
|
19,103 |
|
|
4,002 |
|
|
(152) |
|
|
(10,715) |
|
Tax benefit of taxable REIT subsidiaries |
|
|
9,976 |
|
|
10,065 |
|
|
— |
|
|
— |
|
|
— |
|
|
— |
|
Gain (loss) on sale of real estate |
|
|
— |
|
|
(164) |
|
|
— |
|
|
— |
|
|
— |
|
|
948 |
|
Net income (loss) |
|
|
24,685 |
|
|
24,129 |
|
|
19,103 |
|
|
4,002 |
|
|
(152) |
|
|
(9,767) |
|
Net income attributable to noncontrolling interests (*) |
|
|
(3,160) |
|
|
(3,803) |
|
|
(4,031) |
|
|
(848) |
|
|
— |
|
|
— |
|
Net income (loss) attributable to QTS Realty Trust, Inc (*) |
|
$ |
21,525 |
|
$ |
20,326 |
|
$ |
15,072 |
|
$ |
3,154 |
|
$ |
(152) |
|
$ |
(9,767) |
|
Net income (loss) per share attributable to common shares: (*) |
|
|
|
|
|
|
|
|
|
|
|
|
|
|
|
|
|
|
|
Basic |
|
$ |
0.47 |
|
$ |
0.54 |
|
$ |
0.52 |
|
$ |
0.11 |
|
$ |
N/A |
|
$ |
N/A |
|
Diluted |
|
|
0.46 |
|
|
0.53 |
|
|
0.51 |
|
|
0.11 |
|
|
N/A |
|
|
N/A |
|
|
|
|
|
|
|
|
|
|
|
|
|
|
|
|
|
|
|
|
|
Weighted average common shares outstanding: (*) |
|
|
|
|
|
|
|
|
|
|
|
|
|
|
|
|
|
|
|
Basic |
|
|
46,205,937 |
|
|
37,568,109 |
|
|
29,054,576 |
|
|
28,972,774 |
|
$ |
N/A |
|
$ |
N/A |
|
Diluted |
|
|
53,962,234 |
|
|
45,353,170 |
|
|
37,133,584 |
|
|
36,794,215 |
|
|
N/A |
|
|
N/A |
|
|
|
|
|
|
|
|
|
|
|
|
|
|
|
|
|
|
|
|
|
Dividends declared per common share (*) |
|
$ |
1.44 |
|
$ |
1.28 |
|
$ |
1.16 |
|
$ |
0.24 |
(**) |
$ |
N/A |
|
$ |
N/A |
(*) These line items are not applicable to the Operating Partnership for any periods presented.
(**) The amount relates to the period beginning October 15, 2013 (the closing date of the IPO) through December 31, 2013. Accordingly, the $0.24 dividend declared per common share corresponds to a pro-rated quarterly dividend per common share of $0.29.
61
|
Other Data (unaudited) |
|
|
|
|
|
|
|
|
|
|
|
|
|
|
|
|
|
|
|
FFO (1) |
|
$ |
133,159 |
|
$ |
98,517 |
|
|
70,958 |
|
$ |
14,558 |
|
$ |
31,406 |
|
$ |
20,253 |
|
Operating FFO (1) |
|
|
140,666 |
|
|
103,916 |
|
|
74,145 |
|
|
14,777 |
|
|
34,735 |
|
|
25,568 |
|
Recognized MRR in the period |
|
|
347,331 |
|
|
269,783 |
|
|
188,194 |
|
|
N/A |
|
|
N/A |
|
|
128,533 |
|
MRR (2) |
|
|
30,890 |
|
|
27,489 |
|
|
17,141 |
|
|
14,138 |
|
|
N/A |
|
|
11,857 |
|
NOI (3) |
|
|
257,036 |
|
|
200,859 |
|
|
141,155 |
|
|
25,964 |
|
|
86,681 |
|
|
90,904 |
|
EBITDA (4) |
|
|
162,651 |
|
|
121,162 |
|
|
92,685 |
|
|
17,288 |
|
|
52,626 |
|
|
50,244 |
|
Adjusted EBITDA (4) |
|
|
184,334 |
|
|
140,040 |
|
|
100,025 |
|
|
18,085 |
|
|
57,337 |
|
|
55,330 |
|
|
|
The Company |
|
Historical Predecessor |
|||||||||||
|
|
|
December 31, |
|
December 31, |
|||||||||||
|
($ in thousands) |
|
2016 |
|
2015 |
|
2014 |
|
2013 |
|
2012 |
|||||
|
Balance Sheet Data |
|
|
|
|
|
|
|
|
|
|
|
|
|
|
|
|
Real estate at cost(*) |
|
$ |
1,964,857 |
|
$ |
1,583,153 |
|
$ |
1,177,582 |
|
$ |
905,735 |
|
$ |
734,828 |
|
Net investment in real estate(**) |
|
|
1,647,023 |
|
|
1,343,217 |
|
|
997,415 |
|
|
768,010 |
|
|
631,928 |
|
Total assets |
|
|
2,086,470 |
|
|
1,747,339 |
|
|
1,106,559 |
|
|
831,356 |
|
|
685,443 |
|
Total debt |
|
|
965,826 |
|
|
861,569 |
|
|
637,229 |
|
|
347,877 |
|
|
490,282 |
(*) Reflects undepreciated cost of real estate assets, and does not include real estate intangible assets acquired in connection with acquisitions.
(**) Net investment in real estate includes building and improvements (net of accumulated depreciation), land, and construction in progress.
|
|
|
The Company |
|
Historical Predecessor |
||||||||||||||
|
|
|
|
|
|
|
|
|
|
|
|
For the period |
|
For the period |
|
|
|
||
|
|
|
|
|
|
|
|
|
|
|
|
October 15, 2013 |
|
January 1, 2013 |
|
|
|
||
|
|
|
|
|
|
|
|
|
|
|
|
through |
|
through |
|
Year Ended |
|||
|
|
|
Year Ended December 31, |
|
December 31, |
|
October 14, |
|
December 31, |
||||||||||
|
($ in thousands) |
|
2016 |
|
2015 |
|
2014 |
|
2013 |
|
2013 |
|
2012 |
||||||
|
Cash Flow Data |
|
|
|
|
|
|
|
|
|
|
|
|
|
|
|
|
|
|
|
Cash flow provided by (used for): |
|
|
|
|
|
|
|
|
|
|
|
|
|
|
|
|
|
|
|
Operating activities |
|
$ |
153,794 |
|
$ |
109,258 |
|
$ |
73,757 |
|
$ |
29,635 |
|
$ |
30,511 |
|
$ |
35,098 |
|
Investing activities |
|
|
(452,972) |
|
|
(612,095) |
|
|
(292,209) |
|
|
(47,963) |
|
|
(120,875) |
|
|
(194,927) |
|
Financing activities |
|
|
299,954 |
|
|
500,853 |
|
|
224,030 |
|
|
15,812 |
|
|
89,858 |
|
|
160,719 |
|
(1) |
We calculate FFO in accordance with the standards established by the National Association of Real Estate Investment Trusts, or NAREIT. FFO represents net income (loss) (computed in accordance with GAAP), adjusted to exclude gains (or losses) from sales of property, real estate-related depreciation and amortization and similar adjustments for unconsolidated partnerships and joint ventures. We generally calculate Operating FFO as FFO excluding certain non-routine charges and gains and losses that management believes are not indicative of the results of our operating real estate portfolio. We believe that Operating FFO provides investors with another financial measure that may facilitate comparisons of operating performance between periods and, to the extent other REITs calculate Operating FFO on a comparable basis, between us and these other REITs. |
A reconciliation of net income (loss) to FFO and Operating FFO is presented below:
|
|
|
The Company |
|
Historical Predecessor |
||||||||||||||
|
|
|
|
|
|
|
|
|
|
|
|
For the period |
|
For the period |
|
|
|
||
|
|
|
|
|
|
|
|
|
|
|
|
October 15, 2013 |
|
January 1, 2013 |
|
|
|
||
|
|
|
|
|
|
|
|
|
|
|
|
through |
|
through |
|
Year Ended |
|||
|
|
|
Year Ended December 31, |
|
December 31, |
|
October 14, |
|
December 31, |
||||||||||
|
(unaudited $ in thousands) |
|
2016 |
|
2015 |
|
2014 |
|
2013 |
|
2013 |
|
2012 |
||||||
|
FFO |
|
|
|
|
|
|
|
|
|
|
|
|
|
|
|
|
|
|
|
Net income (loss) |
|
$ |
24,685 |
|
$ |
24,129 |
|
$ |
19,103 |
|
$ |
4,002 |
|
$ |
(152) |
|
$ |
(9,767) |
|
Real estate depreciation and amortization |
|
|
108,474 |
|
|
74,224 |
|
|
51,855 |
|
|
10,556 |
|
|
31,558 |
|
|
30,968 |
|
(Gain) loss on sale of real estate |
|
|
— |
|
|
164 |
|
|
— |
|
|
— |
|
|
— |
|
|
(948) |
|
FFO |
|
$ |
133,159 |
|
$ |
98,517 |
|
$ |
70,958 |
|
$ |
14,558 |
|
$ |
31,406 |
|
$ |
20,253 |
|
Operating FFO |
|
|
|
|
|
|
|
|
|
|
|
|
|
|
|
|
|
|
|
Restructuring costs |
|
|
— |
|
|
— |
|
|
1,298 |
|
|
— |
|
|
— |
|
|
3,291 |
|
Write off of unamortized deferred finance costs |
|
|
193 |
|
|
468 |
|
|
871 |
|
|
153 |
|
|
3,277 |
|
|
1,434 |
|
Integration costs |
|
|
9,568 |
|
|
6,334 |
|
|
— |
|
|
— |
|
|
— |
|
|
— |
|
Transaction costs |
|
|
1,338 |
|
|
4,948 |
|
|
1,018 |
|
|
66 |
|
|
52 |
|
|
897 |
|
Deferred tax benefit associated with transaction and integration costs |
|
|
(3,592) |
|
|
(3,176) |
|
|
— |
|
|
— |
|
|
— |
|
|
— |
|
Non-cash reversal of deferred tax asset valuation allowance |
|
|
— |
|
|
(3,175) |
|
|
— |
|
|
— |
|
|
— |
|
|
— |
|
Unrealized gain on derivatives |
|
|
— |
|
|
— |
|
|
— |
|
|
— |
|
|
— |
|
|
(307) |
|
Operating FFO |
|
$ |
140,666 |
|
$ |
103,916 |
|
$ |
74,145 |
|
$ |
14,777 |
|
$ |
34,735 |
|
$ |
25,568 |
|
|
|
|
|
|
|
|
|
|
|
|
|
|
|
|
|
|
|
|
62
|
(2) |
We calculate MRR as monthly contractual revenue under signed leases as of a particular date, which includes revenue from our C1, C2 and C3 rental and cloud and managed services activities, but excludes customer recoveries, deferred set-up fees, variable related revenues, non-cash revenues and other one-time revenues. MRR does not include the impact from booked-not-billed leases as of a particular date, unless otherwise specifically noted. MRR does not reflect any accounting associated with any free rent, rent abatements or future scheduled rent increases and also excludes operating expense and power reimbursements. Management uses MRR and recognized MRR as supplemental performance measures because they provide a useful measure of increases in contractual revenue from our customer leases. A reconciliation of total revenues to recognized MRR in the period and MRR at period-end is presented below: |
|
|
|
|
|
|
|
|
|
|
|
|
|
|
|
|
|
|
|
|
|
|
|
|
|
|
|
|
|
The Company and |
|
|
|
|
|
|
|
|
|
|
|
|
our Historical |
|
Historical |
||||||
|
|
|
The Company |
|
Predecessor (a) |
|
Predecessor |
|||||||||
|
|
|
Year Ended December 31, |
|
Year Ended December 31, |
|
Year Ended December 31, |
|||||||||
|
(unaudited $ in thousands) |
|
2016 |
|
2015 |
|
2014 |
|
2013 |
|
2012 |
|||||
|
Recognized MRR in the period |
|
|
|
|
|
|
|
|
|
|
|
|
|
|
|
|
Total period revenues (GAAP basis) |
|
$ |
402,363 |
|
$ |
311,083 |
|
$ |
217,789 |
|
$ |
177,887 |
|
$ |
145,759 |
|
Less: Total period recoveries |
|
|
(29,271) |
|
|
(22,581) |
|
|
(19,194) |
|
|
(13,098) |
|
|
(9,294) |
|
Total period deferred setup fees |
|
|
(9,172) |
|
|
(6,042) |
|
|
(4,709) |
|
|
(4,678) |
|
|
(4,317) |
|
Total period straight line rent and other |
|
|
(16,589) |
|
|
(12,677) |
|
|
(5,692) |
|
|
(4,532) |
|
|
(3,615) |
|
Recognized MRR in the period |
|
$ |
347,331 |
|
$ |
269,783 |
|
$ |
188,194 |
|
$ |
155,579 |
|
$ |
128,533 |
|
|
|
|
|
|
|
|
|
|
|
|
|
|
|
|
|
|
MRR at period end* |
|
|
|
|
|
|
|
|
|
|
|
|
|
|
|
|
Total period revenues (GAAP basis) |
|
$ |
402,363 |
|
$ |
311,083 |
|
$ |
217,789 |
|
$ |
177,887 |
|
$ |
145,759 |
|
Less: Total revenues excluding last month |
|
|
(366,385) |
|
|
(280,020) |
|
|
(197,831) |
|
|
(161,670) |
|
|
(132,338) |
|
Total revenues for last month of period |
|
|
35,978 |
|
|
31,063 |
|
|
19,958 |
|
|
16,217 |
|
|
13,421 |
|
Less: Last month recoveries |
|
|
(3,247) |
|
|
(1,415) |
|
|
(1,908) |
|
|
(1,240) |
|
|
(879) |
|
Last month deferred setup fees |
|
|
(968) |
|
|
(716) |
|
|
(372) |
|
|
(370) |
|
|
(441) |
|
Last month straight line rent and other |
|
|
(873) |
|
|
(1,443) |
|
|
(537) |
|
|
(469) |
|
|
(244) |
|
MRR at period end* |
|
$ |
30,890 |
|
$ |
27,489 |
|
$ |
17,141 |
|
$ |
14,138 |
|
$ |
11,857 |
|
* |
Does not include our booked-not-billed MRR balance, which was $3.6 million, $4.0 million, $4.8 million, $2.3 million and $1.1 million as of December 31, 2016, 2015, 2014, 2013, and 2012, respectively. |
|
(a) |
Represents combined results of our Historical Predecessor for the period from January 1, 2013 through October 14, 2013 and the Company for the period from October 15, 2013 through December 31, 2013. Prior to October 15, 2013, the Company did not have any operating activity. |
|
(3) |
We calculate net operating income, or NOI, as net income (loss), excluding: interest expense, interest income, tax expense (benefit) of taxable REIT subsidiaries, depreciation and amortization, write off of unamortized deferred financing costs, gain (loss) on extinguishment of debt, transaction and integration costs, gain (loss) on sale of real estate, restructuring costs and general and administrative expenses. We believe that NOI is another metric that is often utilized to evaluate returns on operating |
63
real estate from period to period and also, in part, to assess the value of the operating real estate. A reconciliation of net income (loss) to NOI is presented below: |
|
|
|
The Company |
|
Historical Predecessor |
||||||||||||||
|
|
|
|
|
|
|
|
|
|
|
|
For the period |
|
For the period |
|
|
|
||
|
|
|
|
|
|
|
|
|
|
|
|
October 15, 2013 |
|
January 1, 2013 |
|
|
|
||
|
|
|
|
|
|
|
|
|
|
|
|
through |
|
through |
|
Year Ended |
|||
|
|
|
Year Ended December 31, |
|
December 31, |
|
October 14, |
|
December 31, |
||||||||||
|
(unaudited $ in thousands) |
|
2016 |
|
2015 |
|
2014 |
|
2013 |
|
2013 |
|
2012 |
||||||
|
Net Operating Income (NOI) |
|
|
|
|
|
|
|
|
|
|
|
|
|
|
|
|
|
|
|
Net income (loss) |
|
$ |
24,685 |
|
$ |
24,129 |
|
$ |
19,103 |
|
$ |
4,002 |
|
$ |
(152) |
|
$ |
(9,767) |
|
Interest expense |
|
|
23,159 |
|
|
21,289 |
|
|
15,308 |
|
|
2,049 |
|
|
16,675 |
|
|
25,140 |
|
Interest income |
|
|
(3) |
|
|
(2) |
|
|
(8) |
|
|
(1) |
|
|
(17) |
|
|
(61) |
|
Depreciation and amortization |
|
|
124,786 |
|
|
85,811 |
|
|
58,282 |
|
|
11,238 |
|
|
36,120 |
|
|
34,932 |
|
Write off of unamortized deferred finance costs |
|
|
193 |
|
|
468 |
|
|
871 |
|
|
153 |
|
|
3,277 |
|
|
1,434 |
|
Tax benefit of taxable REIT subsidiaries |
|
|
(9,976) |
|
|
(10,065) |
|
|
— |
|
|
— |
|
|
— |
|
|
— |
|
Integration costs |
|
|
9,568 |
|
|
6,334 |
|
|
— |
|
|
— |
|
|
— |
|
|
— |
|
Transaction costs |
|
|
1,338 |
|
|
4,948 |
|
|
1,018 |
|
|
66 |
|
|
52 |
|
|
897 |
|
Gain on settlements |
|
|
— |
|
|
— |
|
|
— |
|
|
— |
|
|
— |
|
|
— |
|
(Gain) loss on sale of real estate |
|
|
— |
|
|
164 |
|
|
— |
|
|
— |
|
|
— |
|
|
(948) |
|
Restructuring costs |
|
|
— |
|
|
— |
|
|
1,298 |
|
|
— |
|
|
— |
|
|
3,291 |
|
General and administrative expenses |
|
|
83,286 |
|
|
67,783 |
|
|
45,283 |
|
|
8,457 |
|
|
30,726 |
|
|
35,986 |
|
NOI |
|
$ |
257,036 |
|
$ |
200,859 |
|
$ |
141,155 |
|
$ |
25,964 |
|
$ |
86,681 |
|
$ |
90,904 |
|
Breakdown of NOI by facility: |
|
|
|
|
|
|
|
|
|
|
|
|
|
|
|
|
|
|
|
Atlanta-Metro data center |
|
$ |
81,074 |
|
$ |
69,861 |
|
$ |
60,734 |
|
$ |
11,485 |
|
$ |
40,908 |
|
$ |
42,787 |
|
Atlanta-Suwanee data center |
|
|
45,760 |
|
|
41,088 |
|
|
35,509 |
|
|
7,028 |
|
|
22,127 |
|
|
30,471 |
|
Santa Clara data center |
|
|
13,703 |
|
|
14,352 |
|
|
12,739 |
|
|
2,229 |
|
|
8,710 |
|
|
11,183 |
|
Richmond data center |
|
|
30,752 |
|
|
20,959 |
|
|
14,366 |
|
|
2,415 |
|
|
7,903 |
|
|
6,094 |
|
Sacramento data center |
|
|
7,734 |
|
|
7,516 |
|
|
8,470 |
|
|
1,820 |
|
|
5,879 |
|
|
240 |
|
Princeton data center |
|
|
9,544 |
|
|
9,461 |
|
|
4,828 |
|
|
— |
|
|
— |
|
|
— |
|
Irving data center |
|
|
16,608 |
|
|
5,547 |
|
|
815 |
|
|
— |
|
|
— |
|
|
— |
|
Leased data centers acquired in 2015 |
|
|
41,785 |
|
|
27,595 |
|
|
— |
|
|
— |
|
|
— |
|
|
— |
|
Piscataway data center |
|
|
5,627 |
|
|
— |
|
|
— |
|
|
— |
|
|
— |
|
|
— |
|
Other facilities |
|
|
4,449 |
|
|
4,480 |
|
|
3,694 |
|
|
987 |
|
|
1,154 |
|
|
129 |
|
NOI |
|
$ |
257,036 |
|
$ |
200,859 |
|
$ |
141,155 |
|
$ |
25,964 |
|
$ |
86,681 |
|
$ |
90,904 |
|
(4) |
We calculate EBITDA as net income (loss) adjusted to exclude interest expense and interest income, provision (benefit) for income taxes (including income taxes applicable to sale of assets) and depreciation and amortization. We believe that EBITDA is another metric that is often utilized to evaluate and compare our ongoing operating results and also, in part, to assess the value of our operating portfolio. |
In addition to EBITDA, we calculate an adjusted measure of EBITDA, which we refer to as Adjusted EBITDA, as EBITDA excluding write off of unamortized deferred financing costs, gains (losses) on extinguishment of debt, transaction and integration costs, equity-based compensation expense, restructuring costs, and gain (loss) on sale of real estate. We believe that Adjusted EBITDA provides investors with another financial measure that can facilitate comparisons of operating performance between periods and between REITs.
64
A reconciliation of net income (loss) to EBITDA and Adjusted EBITDA is presented below:
|
|
|
The Company |
|
Historical Predecessor |
||||||||||||||
|
|
|
|
|
|
|
|
|
|
|
|
For the period |
|
For the period |
|
|
|
||
|
|
|
|
|
|
|
|
|
|
|
|
October 15, 2013 |
|
January 1, 2013 |
|
|
|
||
|
|
|
|
|
|
|
|
|
|
|
|
through |
|
through |
|
Year Ended |
|||
|
|
|
Year Ended December 31, |
|
December 31, |
|
October 14, |
|
December 31, |
||||||||||
|
(unaudited $ in thousands) |
|
2016 |
|
2015 |
|
2014 |
|
2013 |
|
2013 |
|
2012 |
||||||
|
EBITDA |
|
|
|
|
|
|
|
|
|
|
|
|
|
|
|
|
|
|
|
Net income (loss) |
|
$ |
24,685 |
|
$ |
24,129 |
|
$ |
19,103 |
|
$ |
4,002 |
|
$ |
(152) |
|
$ |
(9,767) |
|
Interest expense |
|
|
23,159 |
|
|
21,289 |
|
|
15,308 |
|
|
2,049 |
|
|
16,675 |
|
|
25,140 |
|
Interest income |
|
|
(3) |
|
|
(2) |
|
|
(8) |
|
|
(1) |
|
|
(17) |
|
|
(61) |
|
Tax benefit of taxable REIT subsidiaries |
|
|
(9,976) |
|
|
(10,065) |
|
|
— |
|
|
— |
|
|
— |
|
|
— |
|
Depreciation and amortization |
|
|
124,786 |
|
|
85,811 |
|
|
58,282 |
|
|
11,238 |
|
|
36,120 |
|
|
34,932 |
|
EBITDA |
|
|
162,651 |
|
|
121,162 |
|
|
92,685 |
|
|
17,288 |
|
|
52,626 |
|
|
50,244 |
|
|
|
|
|
|
|
|
|
|
|
|
|
|
|
|
|
|
|
|
|
Adjusted EBITDA |
|
|
|
|
|
|
|
|
|
|
|
|
|
|
|
|
|
|
|
Write off of unamortized deferred finance costs |
|
|
193 |
|
|
468 |
|
|
871 |
|
|
153 |
|
|
3,277 |
|
|
1,434 |
|
Integration costs |
|
|
9,568 |
|
|
6,334 |
|
|
— |
|
|
— |
|
|
— |
|
|
— |
|
Transaction costs |
|
|
1,338 |
|
|
4,948 |
|
|
1,018 |
|
|
66 |
|
|
52 |
|
|
897 |
|
Equity-based compensation expense |
|
|
10,584 |
|
|
6,964 |
|
|
4,153 |
|
|
578 |
|
|
1,382 |
|
|
412 |
|
(Gain) loss on sale of real estate |
|
|
— |
|
|
164 |
|
|
— |
|
|
— |
|
|
— |
|
|
(948) |
|
Restructuring costs |
|
|
— |
|
|
— |
|
|
1,298 |
|
|
— |
|
|
— |
|
|
3,291 |
|
Adjusted EBITDA |
|
$ |
184,334 |
|
$ |
140,040 |
|
$ |
100,025 |
|
$ |
18,085 |
|
$ |
57,337 |
|
$ |
55,330 |
65
ITEM 7. MANAGEMENT’S DISCUSSION AND ANALYSIS OF FINANCIAL CONDITION AND RESULTS OF OPERATIONS
The following discussion and analysis covers the financial condition and results of operations of QTS Realty Trust, Inc. You should read the following discussion and analysis in conjunction with the QTS Realty Trust, Inc.’s and QualityTech, LP’s consolidated financial statements and related notes and “Risk Factors” contained elsewhere in this Form 10-K. Some of the information contained in this discussion and analysis or set forth elsewhere in this Form 10-K, including information with respect to our business and growth strategies, our expectations regarding the future performance of our business and the other non-historical statements contained herein are forward-looking statements. See “Special Note Regarding Forward-Looking Statements.” This Form 10-K contains stand-alone audited and unaudited financial statements and other financial data for each of QTS and the Operating Partnership. We believe it is important to show both QTS and the Operating Partnership’s financial statements and for investors to understand the few differences between them in the context of how QTS and the Operating Partnership operate as a consolidated company. See “Explanatory Note” for an explanation of these few differences.
Since the financial data presented in this Item 7 does not contain any differences between QTS and the Operating Partnership, all periods presented reflect the operating results of the Operating Partnership.
Overview
We are a leading owner, developer and operator of state-of-the-art, carrier-neutral, multi-tenant data centers. Our data centers are facilities that house the network and computer equipment of multiple customers and provide access to a range of communications carriers. We have a fully integrated platform through which we own and operate our data centers and provide a broad range of IT infrastructure solutions. We refer to our spectrum of core data center products as our “3Cs,” which consists of Custom Data Center, Colocation and Cloud and Managed Services. We believe that we own and operate one of the largest portfolios of multi-tenant data centers in the United States, as measured by gross square footage, and have the capacity to nearly double our leased raised floor without constructing or acquiring any new buildings.
We operate a portfolio of 25 data centers located throughout the United States, Canada, Europe and the Asia. Within the U.S., we are located in some of the top U.S. data center markets plus other high-growth markets. Our data centers are highly specialized, full-service, mission-critical facilities used by our customers to house, power and cool the networking equipment and computer systems that support their most critical business processes. We believe that our data centers are best-in-class and engineered to adhere to the highest specifications commercially available to customers, providing fully redundant, high-density power and cooling sufficient to meet the needs of major national and international companies and organizations. This is in part reflected by our operating track record of “five-nines” (99.999%) reliability and by our diverse customer base of more than 1,100 customers, including financial institutions, healthcare companies, government agencies, communications service providers, software companies and global Internet companies.
QTS is a Maryland corporation formed on May 17, 2013 and is the sole general partner and majority owner of QualityTech, LP, our operating partnership. Substantially all of our assets are held by, and our operations are conducted through, the Operating Partnership. QTS’ Class A common stock trades on the New York Stock Exchange under the ticker symbol “QTS.” As of December 31, 2016, QTS owned an approximate 87.6% ownership interest in the Operating Partnership.
The Operating Partnership is a Delaware limited partnership formed on August 5, 2009 and was QTS’ historical predecessor prior to the IPO, having operated the Company’s business until the IPO.
We believe that QTS has operated and has been organized in conformity with the requirements for qualification and taxation as a REIT commencing with its taxable year ended December 31, 2013. Our qualification as a REIT, and maintenance of such qualification, depends upon our ability to meet, on a continuing basis, various complex requirements under the Code relating to, among other things, the sources of our gross income, the composition and values of our assets, our distributions to our stockholders and the concentration of ownership of our equity shares.
66
Our Customer Base
We provide data center solutions to a diverse set of customers. Our customer base is comprised of companies of all sizes representing an array of industries, each with unique and varied business models and needs. We serve Fortune 1000 companies as well as small and medium-sized businesses, or SMBs, including financial institutions, healthcare companies, government agencies, communications service providers, software companies and global Internet companies.
Our Custom Data Center, or C1, customers typically are large enterprises with significant IT expertise and specific IT requirements, including financial institutions, “Big Four” accounting firms and the world’s largest global Internet companies. Our Colocation, or C2, customers consist of a wide range of organizations, including major healthcare, telecommunications and software and web-based companies. Our C3 Cloud customers include both large organizations and SMBs seeking to reduce their capital expenditures and outsource their IT infrastructure on a flexible basis. Examples of current C3 Cloud customers include a global financial processing company and various U.S. government agencies.
As a result of our diverse customer base, customer concentration in our portfolio is limited. As of December 31, 2016, only three of our more than 1,100 customers individually accounted for more than 3% of our monthly recurring revenue (“MRR”) (as defined below), with only one greater than 4% which accounted for approximately 13% of our MRR. In addition, approximately 60% of our MRR was attributable to customers who use more than one of our 3Cs products.
Our Portfolio
We develop and operate 25 data centers located throughout the United States, Canada, Europe and Asia, containing an aggregate of approximately 5.7 million gross square feet of space (approximately 91.9% of which is wholly owned by us), including approximately 2.5 million “basis-of-design” raised floor square feet, which represents the total data center raised floor potential of our existing data center facilities. This represents the maximum amount of space in our existing buildings that could be leased following full build-out, depending on the configuration that we deploy. We build out our data center facilities for both general use (colocation) and for executed leases that require significant amounts of space and power, depending on the needs of each facility at that time. As of December 31, 2016, this space included approximately 1,346,000 raised floor operating net rentable square feet, or NRSF, plus approximately 1.2 million square feet of additional raised floor in our development pipeline, of which approximately 151,000 NRSF is expected to become operational by December 31, 2017. Of the total 1.2 million NRSF in our development pipeline, none was related to customer leases which had been executed as of December 31, 2016 but not yet commenced. Our facilities collectively have access to over 650 megawatts (“MW”) of gross utility power with 600 MW of available utility power. We believe such access to power gives us a competitive advantage in redeveloping data center space, since access to power is usually the most limiting and expensive component in data center redevelopment.
Key Operating Metrics
The following sets forth definitions for our key operating metrics. These metrics may differ from similar definitions used by other companies.
Monthly Recurring Revenue (“MRR”). We calculate MRR as monthly contractual revenue under signed leases as of a particular date, which includes revenue from our C1, C2 and C3 rental and cloud and managed services activities, but excludes customer recoveries, deferred set-up fees, variable related revenues, non-cash revenues and other one-time revenues. MRR does not include the impact from booked-not-billed leases as of a particular date, unless otherwise specifically noted. MRR does not reflect any accounting associated with any free rent, rent abatements or future scheduled rent increases and also excludes operating expense and power reimbursements.
Annualized Rent. We define annualized rent as MRR multiplied by 12.
Rental Churn. We define rental churn as the MRR lost in the period from a customer intending to fully exit our platform in the near term compared to the total MRR at the beginning of the period.
Leasable Raised Floor. We define leasable raised floor as the amount of raised floor square footage that we have leased plus the available capacity of raised floor square footage that is in a leasable format as of a particular date and according to a particular product configuration. The amount of our leasable raised floor may change even without completion of new redevelopment projects due to changes in our configuration of C1, C2 and C3 product space.
67
Percentage (%) Occupied and Billing Raised Floor. We define percentage occupied and billing raised floor as the square footage that is subject to a signed lease for which billing has commenced as of a particular date compared to leasable raised floor as of that date, expressed as a percentage.
Booked-not-Billed. We define booked-not-billed as our customer leases that have been signed, but for which lease payments have not yet commenced.
Factors That May Influence Future Results of Operations and Cash Flows
Recent Accounting Pronouncements. We plan to adopt the provisions of ASC Topic 842, Leases, and ASC Topic 606, Revenue from Contracts with Customers, effective January 1, 2018. For additional information with respect to the impact of the standards on our financial condition and results of operations, refer to Item 8 – Note 2 – Summary of Significant Accounting Policies in “Financial Statements and Supplementary Data” included in this Annual Report.
Revenue. Our revenue growth will depend on our ability to maintain the historical occupancy rates of leasable raised floor, lease currently available space, lease new capacity that becomes available as a result of our development and redevelopment activities, attract new customers and continue to meet the ongoing technological requirements of our customers. As of December 31, 2016, we had in place customer leases generating revenue for approximately 88% of our leasable raised floor. Our ability to grow revenue also will be affected by our ability to maintain or increase rental, cloud and managed services rates at our properties. Future economic downturns, regional downturns or downturns in the technology industry, new technological developments, evolving industry demands and other similar factors described above under “Risk Factors” could impair our ability to attract new customers or renew existing customers’ leases on favorable terms, or at all, and could adversely affect our customers’ ability to meet their obligations to us. Negative trends in one or more of these factors could adversely affect our revenue in future periods, which would impact our results of operations and cash flows. We also at times may elect to reclaim space from customers in a negotiated transaction where we believe that we can redevelop and/or re-lease that space at higher rates, which may cause a decrease in revenue until the space is re-leased.
Leasing Arrangements. As of December 31, 2016, 35% of our MRR came from customers which individually occupied greater than or equal to 6,600 square feet of space (or approximately 1 MW of power). As of December 31, 2016, approximately 40% of our MRR was attributable to the metered power model. Under the metered power model, the customer pays us a fixed monthly rent amount, plus reimbursement of certain other operating costs, including actual costs of sub-metered electricity used to power its data center equipment and an estimate of costs for electricity used to power supporting infrastructure for the data center, expressed as a factor of the customer’s actual electricity usage. Fluctuations in our customers’ utilization of power and the supplier pricing of power do not significantly impact our results of operations or cash flows under the metered power model. These leases generally have a minimum term of five years. As of December 31, 2016, 65% of our MRR was leased to customers which individually occupied less than 6,600 square feet of space. As of December 31, 2016, approximately 60% of our MRR was attributable to the gross lease model. Under a gross lease, the customer pays us a fixed rent on a monthly basis, and does not separately reimburse us for operating costs, including utilities, maintenance, repair, property taxes and insurance, as reimbursement for these costs is factored into MRR. However, if customers incur more utility costs than their leases permit, we are able to charge these customers for overages. For leases under the gross lease model, fluctuations in our customers’ utilization of power and the prices our utility providers charge us will impact our results of operations and cash flows. Our leases on a gross lease basis generally have a term of three years or less.
Scheduled Lease Expirations. Our ability to minimize rental churn and customer downgrades at renewal and renew, lease and re-lease expiring space will impact our results of operations and cash flows. Leases which have commenced billing representing approximately 18% and 29% of our total leased raised floor are scheduled to expire during the years ending December 31, 2017 (including all month-to-month leases) and 2018, respectively. These leases also represented approximately 36% and 26%, respectively, of our annualized rent as of December 31, 2016. At expiration, as a general matter, based on current market conditions, we expect that expiring rents will be at or below the then-current market rents.
Acquisitions, Redevelopment and Financing. Our revenue growth also will depend on our ability to acquire and redevelop and subsequently lease data center space at favorable rates. We generally fund the cost of data center acquisition and redevelopment from our net cash provided by operations, credit facilities, other unsecured and secured
68
borrowings or the issuance of additional equity. We believe that we have sufficient access to capital from our current cash and cash equivalents, and borrowings under our credit facilities to fund our redevelopment projects.
Operating Expenses. Our operating expenses generally consist of direct personnel costs, utilities, property and ad valorem taxes, insurance and site maintenance costs and rental expenses on our ground and building leases. In particular, our buildings require significant power to support the data center operations conducted in them. Although substantially all of our long-term leases—leases with a term greater than three years—contain reimbursements for certain operating expenses, we will not in all instances be reimbursed for all of the property operating expenses we incur. We also incur general and administrative expenses, including expenses relating to senior management, our in-house sales and marketing organization, cloud and managed services support personnel and legal, human resources, accounting and other expenses related to professional services. We also will incur additional expenses arising from being a publicly traded company, including employee equity-based compensation. Increases or decreases in our operating expenses will impact our results of operations and cash flows. We expect to incur additional operating expenses as we continue to expand.
General Leasing Activity
During the twelve months ended December 31, 2016, we entered into customer leases representing approximately $4.0 million of incremental MRR, net of downgrades (and representing approximately $48.0 million of annualized rent) at $609 per square foot. In addition, $13.8 million of leasing commissions was associated with new and renewal leasing activity for the twelve months ended December 31, 2016.
During the twelve months ended December 31, 2016, we renewed leases with a total annualized rent of $48.7 million at an average rent per square foot of $623, which was 0.6% higher than the annualized rent prior to renewal. We define renewals as leases where the customer retains the same amount of space before and after renewal, which facilitates rate comparability. Customers that renew with adjustments to square feet are reflected in the net leasing activity discussed above. The rental churn rate for the twelve months ended December 31, 2016 was 5.6%.
During the twelve months ended December 31, 2016, we commenced customer leases representing approximately $10.8 million of incremental MRR (and representing approximately $129.0 million of annualized rent) at $601 per square foot.
As of December 31, 2016, our booked-not-billed MRR balance (which represents customer leases that have been executed, but for which lease payments have not commenced as of December 31, 2016) was approximately $3.6 million, or $43.1 million of annualized rent. This booked-not-billed balanced is expected to contribute an incremental $20.0 million to revenue in 2017 (representing $29.5 million in annualized revenues), an incremental $2.9 million in 2018 (representing $4.6 million in annualized revenues), and an incremental $8.9 million in annualized revenues thereafter.
69
Results of Operations
Year Ended December 31, 2016 Compared to Year Ended December 31, 2015
Changes in revenues and expenses for the year ended December 31, 2016 compared to the year ended December 31, 2015 are summarized below (in thousands):
|
|
|
Year Ended December 31, |
|||||||||
|
|
|
2016 |
|
2015 |
|
$ Change |
|
% Change |
|||
|
Revenues: |
|
|
|
|
|
|
|
|
|
|
|
|
Rental |
|
$ |
295,723 |
|
$ |
230,510 |
|
$ |
65,213 |
|
28% |
|
Recoveries from customers |
|
|
29,271 |
|
|
22,581 |
|
|
6,690 |
|
30% |
|
Cloud and managed services |
|
|
68,488 |
|
|
51,994 |
|
|
16,494 |
|
32% |
|
Other |
|
|
8,881 |
|
|
5,998 |
|
|
2,883 |
|
48% |
|
Total revenues |
|
|
402,363 |
|
|
311,083 |
|
|
91,280 |
|
29% |
|
Operating expenses: |
|
|
|
|
|
|
|
|
|
|
|
|
Property operating costs |
|
|
136,488 |
|
|
104,355 |
|
|
32,133 |
|
31% |
|
Real estate taxes and insurance |
|
|
8,840 |
|
|
5,869 |
|
|
2,971 |
|
51% |
|
Depreciation and amortization |
|
|
124,786 |
|
|
85,811 |
|
|
38,975 |
|
45% |
|
General and administrative |
|
|
83,286 |
|
|
67,783 |
|
|
15,503 |
|
23% |
|
Transaction and integration costs |
|
|
10,906 |
|
|
11,282 |
|
|
(376) |
|
-3% |
|
Total operating expenses |
|
|
364,306 |
|
|
275,100 |
|
|
89,206 |
|
32% |
|
|
|
|
|
|
|
|
|
|
|
|
|
|
Operating income |
|
|
38,057 |
|
|
35,983 |
|
|
2,074 |
|
6% |
|
|
|
|
|
|
|
|
|
|
|
|
|
|
Other income and expense: |
|
|
|
|
|
|
|
|
|
|
|
|
Interest income |
|
|
3 |
|
|
2 |
|
|
1 |
|
50% |
|
Interest expense |
|
|
(23,159) |
|
|
(21,289) |
|
|
(1,870) |
|
9% |
|
Other expense, net |
|
|
(192) |
|
|
(468) |
|
|
276 |
|
-59% |
|
Income before taxes |
|
|
14,709 |
|
|
14,228 |
|
|
481 |
|
3% |
|
Tax benefit of taxable REIT subsidiaries |
|
|
9,976 |
|
|
10,065 |
|
|
(89) |
|
-1% |
|
Loss on sale of real estate |
|
|
— |
|
|
(164) |
|
|
164 |
|
* |
|
Net income |
|
$ |
24,685 |
|
$ |
24,129 |
|
$ |
556 |
|
2% |
*not applicable for comparison
Revenues. Total revenues for the year ended December 31, 2016 were $402.4 million compared to $311.1 million for the year ended December 31, 2015. The increase of $91.3 million, or 29%, was primarily due to a full year impact of the leased facilities acquired in 2015 compared to approximately six and a half months in 2015, which contributed $32.7 million to the increase. In addition, the acquisition of the Piscataway facility contributed $12.6 million in incremental revenue for the year ended December 31, 2016. The balance aggregating $46.0 million related to organic growth in our customer base and placing additional square footage into service in conjunction with the development and expansion of our Irving, Atlanta-Metro, Richmond and Atlanta-Suwanee data centers.
The increase of $81.7 million, or 29%, in combined rental and cloud and managed services revenue was primarily due to the current period including a full year of the leased facilities acquired in 2015 compared to approximately a half year in 2015, which contributed $32.1 million to the increase, as well as the acquisition of the Piscataway facility in 2016 which contributed $7.1 million in incremental revenue for the year ended December 31, 2016. Additional increases, aggregating $42.5 million, are attributable to newly leased space primarily from ongoing expansions in our Atlanta-Metro, Irving and Richmond data centers and increases in rents from previously leased space, net of downgrades at renewal and rental churn.
As of December 31, 2016, our data centers were approximately 88% occupied and billing based on leasable raised floor of approximately 1,084,000 square feet, with approximately 956,000 square feet occupied and paying rent, with an average annualized rent of $390 per leased raised floor square foot including cloud and managed services revenue, or $323 per leased raised floor square foot excluding cloud and managed services revenue. As of December 31, 2016, the average annualized rent for our C1 product, including managed services for our C1 product, was $195 per leased raised
70
floor square foot, and the average annualized rent for our C2 product, including Cloud and managed services combined was $1,246 per leased raised floor square foot. As of December 31, 2015, our data centers were approximately 91% occupied and billing based on leasable raised floor of approximately 839,000 square feet, with approximately 761,000 square feet occupied and paying rent, with an average annualized rent of $433 per leased raised floor square foot including cloud and managed services revenue, or $337 per leased raised floor square foot excluding cloud and managed services revenue. The increase in leasable raised floor between 2015 and 2016 is primarily related to the addition of raised floor square footage from our redevelopment activities primarily in the Irving, Atlanta-Metro, Richmond, Atlanta-Suwanee and Chicago facilities, as well as the acquisition of Piscataway. The decrease in average annualized rent per leased raised floor square foot, both including and excluding cloud and managed services revenue, is primarily due to an increase in mix of C1 customers in our portfolio. As of December 31, 2016, a larger portion of our product mix was attributable to C1 revenue (40% of MRR) compared to December 31, 2015 (34% of MRR). Due to the fact that C1 customers reimburse us for utilities and various other operating expenses and that reimbursement is excluded from the calculation of annualized rent per square foot, this increase in the portion of customer rent which is related to C1 customers has contributed to the weighted average per square foot reduction.
Higher recoveries from customers for the year ended December 31, 2016 compared to the year ended December 31, 2015 were primarily due to reimbursements associated with the acquisition of the Piscataway facility which contributed $5.2 million to the increase. The remaining increase of $1.5 million in recoveries revenue was primarily attributable to the expansion of our Irving data center contributing $1.1 million to the increase and increased utility costs generally related to an increase in utility usage at our Atlanta-Metro data center contributing $1.1 million to the increase, offset by reduced reimbursements of $0.6 million at our Princeton facility due to lower operating costs we incurred from efficiencies gained as well as a $0.1 million decrease at various other facilities. The $2.9 million increase in other revenue for the year ended December 31, 2016 compared to the year ended December 31, 2015 was primarily due to higher straight line rent.
Property Operating Costs. Property operating costs for the year ended December 31, 2016 were $136.5 million compared to property operating costs of $104.4 million for the year ended December 31, 2015, an increase of $32.1 million, or 31%. The breakdown of our property operating costs is summarized in the table below (in thousands):
|
|
|
Year Ended December 31, |
|||||||||
|
|
|
2016 |
|
2015 |
|
$ Change |
|
% Change |
|||
|
Property operating costs: |
|
|
|
|
|
|
|
|
|
|
|
|
Direct payroll |
|
$ |
21,118 |
|
$ |
17,309 |
|
$ |
3,809 |
|
22% |
|
Rent |
|
|
17,705 |
|
|
12,912 |
|
|
4,793 |
|
37% |
|
Repairs and maintenance |
|
|
14,081 |
|
|
9,695 |
|
|
4,386 |
|
45% |
|
Utilities |
|
|
38,753 |
|
|
33,097 |
|
|
5,656 |
|
17% |
|
Management fee allocation |
|
|
20,643 |
|
|
15,185 |
|
|
5,458 |
|
36% |
|
Other |
|
|
24,188 |
|
|
16,157 |
|
|
8,031 |
|
50% |
|
Total property operating costs |
|
$ |
136,488 |
|
$ |
104,355 |
|
$ |
32,133 |
|
31% |
The acquisitions of leased facilities acquired in 2015 and the Piscataway facility contributed $23.2 million to the total increase in property operating costs for the year ended December 31, 2016, of which $1.3 million related to direct payroll, $4.7 million related to rent expense, $3.7 million related to repairs and maintenance, $3.8 million related to utilities, $3.7 million related to management fee allocation and $6.0 million related to other property operating costs, of which $4.1 million were associated with connectivity expenses. Management fee allocation for leased facilities acquired in 2015 is based on 10% of cash revenues for each facility and reflects an allocation of internal charges to cover back-office and service-related costs associated with the day-to-day operations of these data center facilities, with a corresponding offset to general and administrative expenses. The remaining $8.9 million increase in total property operating costs was primarily attributable to expansion of our existing facilities, which included increased direct payroll allocation of $2.5 million throughout our facilities, $0.6 million of increased repairs and maintenance expense which tends to fluctuate from period to period and will increase with the expansion and lease-up of our facilities, increased utility expense of $1.8 million primarily related to the expansion of our Irving data center, and other expenses of $2.3 million. The $2.3 million increase in other expenses was primarily attributable to increased software license costs, increased connectivity expenses and reduced capitalization of temporary and security personnel costs. In addition, management fee allocation increased $1.7 million (exclusive of the increase attributable to leased facilities acquired in 2015 and Piscataway as discussed above). Management fee allocation for the other QTS facilities is based on 4% of cash rental revenues for each facility.
71
Real Estate Taxes and Insurance. Real estate taxes and insurance for the year ended December 31, 2016 were $8.8 million compared to $5.9 million for the year ended December 31, 2015. The increase of $3.0 million, or 51%, was primarily attributable to the acquisition of our Piscataway data center as well as increases in real estate taxes at our Irving data center and leased facilities acquired in 2015.
Depreciation and Amortization. Depreciation and amortization for the year ended December 31, 2016 was $124.8 million compared to $85.8 million for the year ended December 31, 2015. The increase of $39.0 million, or 45%, was primarily due to depreciation expense of $9.7 million and amortization expense of $7.2 million associated with the acquisition of leased facilities acquired in 2015, and depreciation expense of $1.2 million and amortization expense of $3.7 million associated with the Piscataway acquisition. The remaining increase of $17.2 million was due to additional depreciation of $14.7 million, primarily due to additional depreciation of the Irving, Richmond and Atlanta-Metro data centers, as well as higher amortization expense of $2.5 million primarily related to a higher level of leasing commissions. Included in depreciation and amortization above is an increase in the amount of non-real estate depreciation and amortization expense, which increased to $16.3 million for the year ended December 31, 2016 compared to $11.5 million during the year ended December 31, 2015. The increase of $4.8 million, or 41%, was primarily due to a full year impact of the leased facilities acquired in 2015 compared to approximately six and a half months in 2015, contributing a greater level of cloud and managed services customers.
General and Administrative Expenses. General and administrative expenses were $83.3 million for the year ended year ended December 31, 2016 compared to general and administrative expenses of $67.8 million for the year ended December 31, 2015, an increase of $15.5 million, or 23%. The increase in general and administrative expenses was primarily related to the acquisition of leased facilities acquired in 2015 and, to a lesser extent, the ongoing growth of the Company. Inclusive of expenses associated with the acquisition of leased facilities acquired in 2015, the increase in general and administrative expenses was primarily attributable to increased payroll expenses related to sales and marketing personnel of $1.8 million, higher equity-based compensation expense of $3.6 million, higher payroll costs, net of sales and marketing personnel, of $6.7 million, higher software license costs of $1.5 million, increased repairs and maintenance expense of $0.7 million, higher rent expense of $0.7 million, higher temporary personnel and consulting fees of $0.7 million, increased travel expenses of $0.6 million and a $0.1 million increase in other expenses, offset by receipt of litigation settlement proceeds of $0.9 million. Total general and administrative expenses were approximately 20.7% and 21.8% of 2016 and 2015 revenues, respectively.
Transaction and Integration Costs. For the year ended December 31, 2016, we incurred $10.9 million in transaction and integration costs compared to $11.3 million for the year ended December 31, 2015. In the current period, $9.6 million in costs were attributable to integration expenses primarily related to systems integration, duplicate personnel and accelerated depreciation of certain software relating to the leased facilities acquired in 2015, inclusive of an offset of approximately $1.0 million related to the reimbursement of certain escrow funds. The remaining $1.3 million primarily related to transaction costs incurred in the acquisition of the Piscataway and Fort Worth facilities. In the prior period, $4.9 million of expenses were incurred primarily related to the examination and acquisition of our leased facilities acquired in 2015, and $6.3 million related to integration costs related to the leased facilities acquired in 2015. Acquisition-related costs for acquisitions accounted for as a business combination in accordance with ASC 805, Business Combinations, are expensed in the periods in which the costs are incurred and the services are received.
Interest Expense. Interest expense for the year ended December 31, 2016 was $23.2 million compared to $21.3 million for the year ended December 31, 2015. The increase of $1.9 million, or 9%, was due primarily to an increase in the average debt balance of $138.5 million, primarily as a result of our ongoing developments, expansions and acquisitions, partially offset by issuance of additional common shares generating proceeds which were used to repay amounts outstanding under our unsecured revolving credit facility, a decrease in the weighted average interest rate on our borrowings and higher capitalized interest during the current period due to the growth in construction projects. The average debt balance, exclusive of debt issuance costs, for the year ended December 31, 2016 was $870.9 million, with a weighted average interest rate, including the effect of amortization of deferred financing costs, of 3.97%. This compared to an average debt balance of $732.4 million for the year ended December 31, 2015, with a weighted average interest rate, including the effect of interest rate swaps and amortization of deferred financing costs, of 4.24%. Interest capitalized in connection with our redevelopment activities during the years ended December 31, 2016 and December 31, 2015 was $11.4 million and $9.8 million, respectively.
72
Other Expense, Net. Other expense for the year ended December 31, 2016 was $0.2 million compared to other expense of $0.5 million for the year ended December 31, 2015. The decrease in other expense of $0.3 million was due to higher write-offs of unamortized deferred financing costs in 2015 primarily related to the restructuring of our unsecured credit facility in October 2015, and, at the same time, the repayment of our $70 million secured credit facility relating to our Richmond data center.
Tax Benefit of Taxable REIT Subsidiaries. Tax benefit of taxable REIT subsidiaries for the year ended December 31, 2016 was $10.0 million compared to $10.1 million for the year ended December 31, 2015. The current period tax benefit primarily related to recorded operating losses resulting from both current period operating losses and prior period tax provision adjustments. The prior period tax benefit primarily related to recorded operating losses, including transaction and integration costs, as well as the reversal of valuation allowances which were related to deferred tax assets. These deferred tax assets were generally created by net operating losses of the taxable REIT subsidiary, and previously had valuation allowances applied to them in their entirety as there were continuing losses for that entity. With the acquisition of Carpathia, deferred tax liabilities were created, which in turn caused the Company to release the previously recorded valuation allowances during the second quarter of 2015. To the extent that the Company’s taxable REIT subsidiaries continue to generate operating losses, a tax benefit will generally continue to be recognized due to the existing net deferred tax liability.
Net Income. A summary of the components of the increase in net income of $0.6 million for the year ended December 31, 2016 as compared to the year ended December 31, 2015 is as follows (in millions):
|
|
|
$ Change |
|
|
Increase in revenues, net of property operating costs, real estate taxes and insurance |
|
$ |
56.2 |
|
Increase in general and administrative expense |
|
|
(15.5) |
|
Increase in depreciation and amortization |
|
|
(39.0) |
|
Decrease in transaction and integration costs |
|
|
0.4 |
|
Increase in interest expense net of interest income |
|
|
(1.9) |
|
Decrease in tax benefit |
|
|
(0.1) |
|
Decrease in loss on sale of real estate |
|
|
0.2 |
|
Decrease in other expense |
|
|
0.3 |
|
Increase in net income |
|
$ |
0.6 |
73
Year Ended December 31, 2015 Compared to Year Ended December 31, 2014
Changes in revenues and expenses for the year ended December 31, 2015 compared to the year ended December 31, 2014 are summarized below (in thousands):
|
|
|
Year Ended December 31, |
|||||||||
|
|
|
2015 |
|
2014 |
|
$ Change |
|
% Change |
|||
|
Revenues: |
|
|
|
|
|
|
|
|
|
|
|
|
Rental |
|
$ |
230,510 |
|
$ |
175,649 |
|
$ |
54,861 |
|
31% |
|
Recoveries from customers |
|
|
22,581 |
|
|
19,194 |
|
|
3,387 |
|
18% |
|
Cloud and managed services |
|
|
51,994 |
|
|
20,231 |
|
|
31,763 |
|
157% |
|
Other |
|
|
5,998 |
|
|
2,715 |
|
|
3,283 |
|
121% |
|
Total revenues |
|
|
311,083 |
|
|
217,789 |
|
|
93,294 |
|
43% |
|
Operating expenses: |
|
|
|
|
|
|
|
|
|
|
|
|
Property operating costs |
|
|
104,355 |
|
|
71,518 |
|
|
32,837 |
|
46% |
|
Real estate taxes and insurance |
|
|
5,869 |
|
|
5,116 |
|
|
753 |
|
15% |
|
Depreciation and amortization |
|
|
85,811 |
|
|
58,282 |
|
|
27,529 |
|
47% |
|
General and administrative |
|
|
67,783 |
|
|
45,283 |
|
|
22,500 |
|
50% |
|
Restructuring |
|
|
— |
|
|
1,298 |
|
|
(1,298) |
|
* |
|
Transaction and integration costs |
|
|
11,282 |
|
|
1,018 |
|
|
10,264 |
|
1008% |
|
|
|
|
|
|
|
— |
|
|
|
|
|
|
Total operating expenses |
|
|
275,100 |
|
|
182,515 |
|
|
92,585 |
|
51% |
|
|
|
|
|
|
|
|
|
|
|
|
|
|
Operating income |
|
|
35,983 |
|
|
35,274 |
|
|
709 |
|
2% |
|
|
|
|
|
|
|
|
|
|
|
|
|
|
Other income and expense: |
|
|
|
|
|
|
|
|
|
|
|
|
Interest income |
|
|
2 |
|
|
8 |
|
|
(6) |
|
-75% |
|
Interest expense |
|
|
(21,289) |
|
|
(15,308) |
|
|
(5,981) |
|
39% |
|
Other expense, net |
|
|
(468) |
|
|
(871) |
|
|
403 |
|
-46% |
|
Income before taxes |
|
$ |
14,228 |
|
$ |
19,103 |
|
$ |
(4,875) |
|
-26% |
|
Tax benefit of taxable REIT subsidiaries |
|
|
10,065 |
|
|
- |
|
|
10,065 |
|
* |
|
Loss on sale of real estate |
|
|
(164) |
|
|
- |
|
|
(164) |
|
* |
|
Net income |
|
$ |
24,129 |
|
|
19,103 |
|
|
5,026 |
|
26% |
*not applicable for comparison
Revenues. Total revenues for the year ended December 31, 2015 were $311.1 million compared to $217.8 million for the year ended December 31, 2014. The increase of $93.3 million, or 43%, was primarily due to the acquisitions of leased facilities acquired in 2015 and the Princeton facility acquired in 2014, which, combined, contributed $57.6 million in incremental revenue for the year ended December 31, 2015, as well as organic growth in our customer base and placing additional square footage into service in conjunction with the development and expansion of our Irving, Richmond, Atlanta-Suwanee and Atlanta-Metro data centers, which contributed $35.7 million to this increase.
The increase of $86.6 million, or 44%, in combined rental and cloud and managed services revenue was primarily due to the acquisitions of leased facilities acquired in 2015 and the Princeton facility, which contributed $54.5 million in combined rental and cloud and managed services revenue for the year ended December 31, 2015, as well as newly leased space and increases in rents from previously leased space, net of downgrades at renewal and rental churn, which contributed $32.1 million to the increase.
As of December 31, 2015, our data centers were approximately 91% occupied and billing based on leasable raised floor of approximately 839,000 square feet, with approximately 761,000 square feet occupied and paying rent, with an average annualized rent of $433 per leased raised floor square foot including cloud and managed services revenue, or $337 per leased raised floor square foot excluding cloud and managed services revenue. As of December 31, 2015, the average annualized rent for our C1 product, including managed services for our C1 product, was $192 per leased raised floor square foot, and the average annualized rent for our C2 product, including Cloud and managed services combined was $1,256 per leased raised floor square foot. As of December 31, 2014, our data centers were 85% leased based on leasable raised floor of approximately 698,000 square feet, with approximately 594,000 square feet occupied and paying
74
rent, with an average annualized rent of $346 per leased raised floor square foot including cloud and managed services revenue, or $308 per leased raised floor square foot excluding cloud and managed services revenue. The increase in leasable raised floor between 2014 and 2015 is primarily related to the addition of raised floor square footage from our redevelopment activities primarily in the Richmond, Atlanta-Metro, and Irving facilities, as well as the acquisition of leased facilities acquired in 2015. The increase in average annualized rent per leased raised floor square foot, both including and excluding cloud and managed services revenue, is primarily due to the acquisition of leased facilities acquired in 2015. The increase in average annualized rent per leased raised floor square foot including cloud and managed service revenue from $346 to $433 is primarily due to the increase in C3 product mix associated with the acquisition of leased facilities acquired in 2015. As of December 31, 2015, a larger portion of our product mix was attributable to C3 revenue (22% of MRR) compared to December 31, 2014 (11% of MRR). Due to the fact that C3 customers utilize less space than C1/C2 customers in proportion to MRR received, our weighted average rent per square feet price has increased.
Higher recoveries from customers for the year ended December 31, 2015 compared to the year ended December 31, 2014 were primarily due to reimbursements associated with the acquisition of the Princeton facility which contributed $2.8 million to the increase. The remaining increase of $0.6 million in recoveries revenue was primarily attributable to increased utility costs generally related to an increase in usage from customers operating under our metered power model at our Richmond data center contributing $0.6 million to the increase as well as the opening of our Irving data center contributing $0.5 million to the increase. These increases were partially offset by $0.5 million of decreased utility costs generally related to a reduction in usage from customers operating under our metered power model at our Sacramento data center. The $3.3 million increase in other revenue for the year ended December 31, 2015 compared to the year ended December 31, 2014 was primarily due to higher straight line rent.
Property Operating Costs. Property operating costs for the year ended December 31, 2015 were $104.4 million compared to property operating costs of $71.5 million for the year ended December 31, 2014, an increase of $32.8 million, or 46%. The breakdown of our property operating costs is summarized in the table below (in thousands):
|
|
|
Year Ended December 31, |
|||||||||
|
|
|
2015 |
|
2014 |
|
$ Change |
|
% Change |
|||
|
Property operating costs: |
|
|
|
|
|
|
|
|
|
|
|
|
Direct payroll |
|
$ |
17,309 |
|
$ |
11,839 |
|
$ |
5,470 |
|
46% |
|
Rent |
|
|
12,912 |
|
|
4,896 |
|
|
8,016 |
|
164% |
|
Repairs and maintenance |
|
|
9,695 |
|
|
5,630 |
|
|
4,065 |
|
72% |
|
Utilities |
|
|
33,097 |
|
|
29,996 |
|
|
3,101 |
|
10% |
|
Management fee allocation |
|
|
15,185 |
|
|
8,646 |
|
|
6,539 |
|
76% |
|
Other |
|
|
16,157 |
|
|
10,511 |
|
|
5,646 |
|
54% |
|
Total property operating costs |
|
$ |
104,355 |
|
$ |
71,518 |
|
$ |
32,837 |
|
46% |
The acquisitions of leased facilities acquired in 2015 and the Princeton facility contributed $24.7 million to the total increase in property operating costs for the year ended December 31, 2015, of which $3.3 million related to direct payroll, $8.0 million related to rent expense, $2.0 million related to repairs and maintenance, $2.4 million related to utilities, $5.2 million related to management fee allocation and $3.8 million related to other property operating costs. Management fee allocation for leased facilities acquired in 2015 is based on 10% of cash revenues for each facility and reflects an allocation of internal charges to cover back-office and service-related costs associated with the day-to-day operations of our data center facilities, with a corresponding offset to general and administrative expenses. The remaining $8.1 million increase in total property operating costs was primarily attributable to the revenue growth and expansion of our existing facilities, which included increased direct payroll allocation of $2.2 million throughout our facilities, $2.0 million of increased repairs and maintenance expense which tends to fluctuate from period to period and will increase with the expansion and lease-up of our facilities, and a $0.7 million increase in utilities expense primarily related to increased utilities usage in our Richmond and Atlanta-Metro facilities as well as the opening of our Irving data center, offset by reduced utilities usage at our Sacramento data center, reduced utility rates at our Atlanta-Metro and Atlanta-Suwanee facilities as well as a credit received from Georgia Power related to a retroactive adjustment in billing rates for the current year. In addition, management fee allocation increased $1.3 million (exclusive of the increase attributable to leased facilities acquired in 2015 and Princeton as discussed above). Management fee allocation for QTS facilities is based on 4% of cash rental revenues for each facility. The remaining $1.9 million increase in other property operating costs was primarily due to higher software license costs as well as higher outside services expenses from consulting fees and outsourcing of our facility security personnel, which resulted in lower direct payroll costs.
75
Real Estate Taxes and Insurance. Real estate taxes and insurance for the year ended December 31, 2015 were $5.9 million compared to $5.1 million for the year ended December 31, 2014. The increase of $0.8 million, or 15%, was primarily attributable to the acquisition of our Princeton data center as well as an increase in property taxes at our Irving data center.
Depreciation and Amortization. Depreciation and amortization for the year ended December 31, 2015 was $85.8 million compared to $58.3 million for the year ended December 31, 2014. The increase of $27.5 million, or 47%, was primarily due to depreciation expense of $8.9 million and amortization expense of $6.1 million associated with the acquisition of leased facilities acquired in 2015, and depreciation expense of $0.4 million and amortization expense of $1.1 million associated with the Princeton acquisition. The remaining increase of $11.0 million was due to additional depreciation of $10.4 million, primarily due to additional depreciation of the Irving data center, as well as expansion of the Richmond, Atlanta-Metro and Atlanta-Suwanee data centers, and higher amortization expense of $0.6 million primarily related to a higher level of leasing commissions. Included in depreciation and amortization above is an increase in the amount of non-real estate depreciation and amortization expense, which increased to $11.5 million for the year ended December 31, 2015 compared to $6.4 million during the year ended December 31, 2014. The increase of $5.1 million, or 79%, was primarily due to the acquisition of the leased facilities acquired in 2015 which contributed a greater level of cloud and managed services customers.
General and Administrative Expenses. General and administrative expenses were $67.8 million for the year ended year ended December 31, 2015 compared to general and administrative expenses of $45.3 million for the year ended December 31, 2014, an increase of $22.5 million, or 50%, of which the acquisition of leased facilities acquired in 2015 contributed $9.5 million. The remaining increase in general and administrative expenses was attributable to increased advertising expenses of $1.2 million, increased payroll expenses related to sales and marketing personnel of $1.2 million, higher equity-based compensation expense of $2.8 million, higher net payroll costs of $4.0 million, higher temporary personnel and consulting fees of $2.1 million, and other costs of $1.7 million. Other costs were primarily related to increased software license costs, increased travel and entertainment expenses and increased professional fees primarily related to legal expenses, offset by lower repairs and maintenance expense primarily related to computer and software. Total general and administrative expenses were approximately 21.8% and 20.8% of 2015 and 2014 revenues, respectively.
Restructuring Costs. For the year ended December 31, 2014, we incurred $1.3 million in restructuring costs related to severance for various remote employees. No such costs were incurred for the year ended December 31, 2015.
Transaction and Integration Costs. For the year ended December 31, 2015 and 2014 we incurred transaction costs of $4.9 million and $1.0 million, respectively, in costs related to the examination of actual and potential acquisitions. We also recognized $6.3 million in integration costs for the year ended December 31, 2015 related to the acquisition of leased facilities acquired in 2015. Acquisition-related costs for acquisitions accounted for as a business combination in accordance with ASC 805, Business Combinations, are expensed in the periods in which the costs are incurred and the services are received.
Interest Expense. Interest expense for the year ended December 31, 2015 was $21.3 million compared to $15.3 million for the year ended December 31, 2014. The increase of $6.0 million, or 39%, was due primarily to an increase in the average debt balance of $216.8 million, primarily as a result of our ongoing developments and expansions and the acquisition of leased facilities acquired in 2015. In addition, we recognized a full year of interest costs associated with our $300 million aggregate principal amount of Senior Notes issuance in July 2014, and we had a higher revolving credit facility balance in the current year along with the assumption of approximately $43.8 million in capital leases as a result of the Carpathia acquisition on June 16, 2015, partially offset by higher capitalized interest during the period due to the growth in construction projects. The average debt balance for the year ended December 31, 2015 was $732.4 million, with a weighted average interest rate, including the effect of interest rate swaps and amortization of deferred financing costs, of 4.24%. This compared to an average debt balance of $515.6 million for the year ended December 31, 2014, with a weighted average interest rate, including the effect of interest rate swaps and amortization of deferred financing costs, of 4.23%. Interest capitalized in connection with our redevelopment activities during the years ended December 31, 2015 and December 31, 2014 was $9.8 million and $6.5 million, respectively.
Other Expense, Net. Other expense for the year ended December 31, 2015 was $0.5 million compared to other expense of $0.9 million for the year ended December 31, 2014. The decrease in other expense of $0.4 million was due to higher
76
write-offs of unamortized deferred financing costs in 2014 primarily related to the repayment of amounts outstanding under the Unsecured Credit Facility, including $75 million outstanding under the term loan, in connection with the issuance of our Senior Notes in July 2014.
Tax Benefit of Taxable REIT Subsidiaries. Tax benefit of taxable REIT subsidiaries for the year ended December 31, 2015 primarily relates to recorded operating losses, including transaction and integration costs, as well as the reversal of valuation allowances which were related to the deferred tax assets. These deferred tax assets were generally created by net operating losses of the taxable REIT subsidiary, and previously had valuation allowances applied to them in their entirety as there were continuing losses for that entity. With the acquisition of Carpathia, deferred tax liabilities were created, which in turn caused the Company to release the previously recorded valuation allowances of approximately $3.4 million during the second quarter of 2015. To the extent that the Company’s taxable REIT subsidiaries continue to generate operating losses, a tax benefit will continue to be recognized due to the existing net deferred tax liability of $18.8 million at December 31, 2015. No such tax benefit was recorded for the year ended December 31, 2014.
Net Income. A summary of the components of the increase in net income of $5.0 million for the year ended December 31, 2015 as compared to the year ended December 31, 2014 is as follows (in millions):
|
|
|
$ Change |
|
|
Increase in revenues, net of property operating costs, real estate taxes and insurance |
|
$ |
59.7 |
|
Increase in general and administrative expense |
|
|
(22.5) |
|
Increase in depreciation and amortization |
|
|
(27.5) |
|
Decrease in restructuring charges |
|
|
1.3 |
|
Increase in transaction and integration costs |
|
|
(10.3) |
|
Increase in interest expense net of interest income |
|
|
(6.0) |
|
Increase in tax benefit |
|
|
10.1 |
|
Increase in loss on sale of real estate |
|
|
(0.2) |
|
Decrease in other expense |
|
|
0.4 |
|
Increase in net income |
|
$ |
5.0 |
Non-GAAP Financial Measures
We consider the following non-GAAP financial measures to be useful to investors as key supplemental measures of our performance: (1) FFO; (2) Operating FFO; (3) Adjusted Operating FFO; (4) MRR; (5) NOI; (6) EBITDA; and (7) Adjusted EBITDA. These non-GAAP financial measures should be considered along with, but not as alternatives to, net income or loss as a measure of our operating performance. FFO, Operating FFO, Adjusted Operating FFO, MRR, NOI, EBITDA and Adjusted EBITDA, as calculated by us, may not be comparable to FFO, Operating FFO, Adjusted Operating FFO, MRR, NOI, EBITDA and Adjusted EBITDA as reported by other companies that do not use the same definition or implementation guidelines or interpret the standards differently from us.
FFO, Operating FFO and Adjusted Operating FFO
We consider funds from operations (“FFO”) to be a supplemental measure of our performance which should be considered along with, but not as an alternative to, net income (loss) and cash provided by operating activities as a measure of operating performance. We calculate FFO in accordance with the standards established by the National Association of Real Estate Investment Trusts (“NAREIT”). FFO represents net income (loss) (computed in accordance with GAAP), adjusted to exclude gains (or losses) from sales of property, real estate-related depreciation and amortization and similar adjustments for unconsolidated partnerships and joint ventures. Our management uses FFO as a supplemental performance measure because, in excluding real estate-related depreciation and amortization and gains and losses from property dispositions, it provides a performance measure that, when compared year over year, captures trends in occupancy rates, rental rates and operating costs.
Due to the volatility and nature of certain significant charges and gains recorded in our operating results that management believes are not reflective of our core operating performance, management computes an adjusted measure of FFO, which we refer to as Operating funds from operations (“Operating FFO”). We generally calculate Operating FFO as FFO excluding certain non-routine charges and gains and losses that management believes are not indicative of the results of our operating real estate portfolio. We believe that Operating FFO provides investors with another financial
77
measure that may facilitate comparisons of operating performance between periods and, to the extent they calculate Operating FFO on a comparable basis, between REITs.
Adjusted Operating Funds From Operations (“Adjusted Operating FFO”) is a non-GAAP measure that is used as a supplemental operating measure and to provide additional information to users of the financial statements. We calculate Adjusted Operating FFO by adding or subtracting from Operating FFO items such as: maintenance capital investment, paid leasing commissions, amortization of deferred financing costs and bond discount, non-real estate depreciation, straight line rent adjustments, deferred taxes and non-cash compensation.
We offer these measures because we recognize that FFO, Operating FFO and Adjusted Operating FFO will be used by investors as a basis to compare our operating performance with that of other REITs. However, because FFO, Operating FFO and Adjusted Operating FFO exclude real estate depreciation and amortization and capture neither the changes in the value of our properties that result from use or market conditions, nor the level of capital expenditures and capitalized leasing commissions necessary to maintain the operating performance of our properties, all of which have real economic effect and could materially impact our financial condition, cash flows and results of operations, the utility of FFO, Operating FFO and Adjusted Operating FFO as measures of our operating performance is limited. Our calculation of FFO may not be comparable to measures calculated by other companies who do not use the NAREIT definition of FFO or do not calculate FFO in accordance with NAREIT guidance. In addition, our calculations of FFO, Operating FFO and Adjusted Operating FFO are not necessarily comparable to FFO, Operating FFO and Adjusted Operating FFO as calculated by other REITs that do not use the same definition or implementation guidelines or interpret the standards differently from us. FFO, Operating FFO and Adjusted Operating FFO are non-GAAP measures and should not be considered a measure of our results of operations or liquidity or as a substitute for, or an alternative to, net income (loss), cash provided by operating activities or any other performance measure determined in accordance with GAAP, nor is it indicative of funds available to fund our cash needs, including our ability to make distributions to our stockholders.
A reconciliation of net income to FFO, Operating FFO and Adjusted Operating FFO is presented below:
|
|
|
Year Ended December 31, |
|||||||
|
|
|
2016 |
|
2015 |
|
2014 |
|||
|
|
|
(unaudited $ in thousands) |
|||||||
|
FFO |
|
|
|
|
|
|
|
|
|
|
Net income |
|
$ |
24,685 |
|
$ |
24,129 |
|
$ |
19,103 |
|
Real estate depreciation and amortization |
|
|
108,474 |
|
|
74,224 |
|
|
51,855 |
|
Loss on sale of real estate |
|
|
— |
|
|
164 |
|
|
— |
|
FFO |
|
|
133,159 |
|
|
98,517 |
|
|
70,958 |
|
|
|
|
|
|
|
|
|
|
|
|
Operating FFO |
|
|
|
|
|
|
|
|
|
|
Write off of unamortized deferred finance costs |
|
|
193 |
|
|
468 |
|
|
871 |
|
Restructuring costs |
|
|
— |
|
|
— |
|
|
1,298 |
|
Integration costs |
|
|
9,568 |
|
|
6,334 |
|
|
— |
|
Transaction costs |
|
|
1,338 |
|
|
4,948 |
|
|
1,018 |
|
Deferred tax benefit associated with transaction and integration costs |
|
|
(3,592) |
|
|
(3,176) |
|
|
— |
|
Non-cash reversal of deferred tax asset valuation allowance |
|
|
— |
|
|
(3,175) |
|
|
— |
|
Operating FFO |
|
|
140,666 |
|
|
103,916 |
|
|
74,145 |
|
|
|
|
|
|
|
|
|
|
|
|
Adjusted Operating FFO |
|
|
|
|
|
|
|
|
|
|
Maintenance Capex |
|
|
(5,059) |
|
|
(4,745) |
|
|
(2,684) |
|
Leasing commissions paid |
|
|
(18,751) |
|
|
(13,108) |
|
|
(14,219) |
|
Amortization of deferred financing costs and bond discount |
|
|
3,545 |
|
|
3,424 |
|
|
2,774 |
|
Non real estate depreciation and amortization |
|
|
16,313 |
|
|
11,531 |
|
|
6,427 |
|
Straight line rent revenue and expense and other |
|
|
(6,794) |
|
|
(4,402) |
|
|
(1,360) |
|
Tax benefit from operating results |
|
|
(6,384) |
|
|
(3,754) |
|
|
— |
|
Equity-based compensation expense |
|
|
10,584 |
|
|
6,964 |
|
|
4,153 |
|
Adjusted Operating FFO |
|
$ |
134,120 |
|
$ |
99,826 |
|
$ |
69,236 |
78
Monthly Recurring Revenue (MRR) and Recognized MRR
We calculate MRR as monthly contractual revenue under signed leases as of a particular date, which includes revenue from our C1, C2 and C3 rental and cloud and managed services activities, but excludes customer recoveries, deferred set-up fees, variable related revenues, non-cash revenues and other one-time revenues. MRR does not include the impact from booked-not-billed leases as of a particular date, unless otherwise specifically noted.
Separately, we calculate recognized MRR as the recurring revenue recognized during a given period, which includes revenue from our C1, C2 and C3 rental and cloud and managed services activities, but excludes customer recoveries, deferred set-up fees, variable related revenues, non-cash revenues and other one-time revenues.
Management uses MRR and recognized MRR as supplemental performance measures because they provide useful measures of increases in contractual revenue from our customer leases. MRR and recognized MRR should not be viewed by investors as alternatives to actual monthly revenue, as determined in accordance with GAAP. Other companies may not calculate MRR or recognized MRR in the same manner. Accordingly, our MRR and recognized MRR may not be comparable to other companies’ MRR and recognized MRR. MRR and recognized MRR should be considered only as supplements to total revenues as a measure of our performance. MRR and recognized MRR should not be used as measures of our results of operations or liquidity, nor is it indicative of funds available to meet our cash needs, including our ability to make distributions to our stockholders.
A reconciliation of total revenues to recognized MRR in the period and MRR at period end is presented below:
|
|
|
Year Ended December 31, |
|||||||
|
|
|
2016 |
|
2015 |
|
2014 |
|||
|
|
|
(unaudited $ in thousands) |
|||||||
|
Recognized MRR in the period |
|
|
|
|
|
|
|
|
|
|
Total period revenues (GAAP basis) |
|
$ |
402,363 |
|
$ |
311,083 |
|
$ |
217,789 |
|
Less: Total period recoveries |
|
|
(29,271) |
|
|
(22,581) |
|
|
(19,194) |
|
Total period deferred setup fees |
|
|
(9,172) |
|
|
(6,042) |
|
|
(4,709) |
|
Total period straight line rent and other |
|
|
(16,589) |
|
|
(12,677) |
|
|
(5,692) |
|
Recognized MRR in the period |
|
|
347,331 |
|
|
269,783 |
|
|
188,194 |
|
|
|
|
|
|
|
|
|
|
|
|
MRR at period end |
|
|
|
|
|
|
|
|
|
|
Total period revenues (GAAP basis) |
|
$ |
402,363 |
|
$ |
311,083 |
|
$ |
217,789 |
|
Less: Total revenues excluding last month |
|
|
(366,385) |
|
|
(280,020) |
|
|
(197,831) |
|
Total revenues for last month of period |
|
|
35,978 |
|
|
31,063 |
|
|
19,958 |
|
Less: Last month recoveries |
|
|
(3,247) |
|
|
(1,415) |
|
|
(1,908) |
|
Last month deferred setup fees |
|
|
(968) |
|
|
(716) |
|
|
(372) |
|
Last month straight line rent and other |
|
|
(873) |
|
|
(1,443) |
|
|
(537) |
|
MRR at period end * |
|
$ |
30,890 |
|
$ |
27,489 |
|
$ |
17,141 |
*Does not include our booked-not-billed MRR balance, which was $3.6 million, $4.0 million and $4.8 million as of December 31, 2016, 2015 and 2014, respectively.
Net Operating Income (NOI)
We calculate net operating income (“NOI”), as net income (loss), excluding interest expense, interest income, tax expense (benefit) of taxable REIT subsidiaries, depreciation and amortization, write off of unamortized deferred financing costs, gain (loss) on extinguishment of debt, transaction and integration costs, gain (loss) on sale of real estate, restructuring costs and general and administrative expenses. We allocate a management fee charge of 4% of cash revenues for all facilities, with the exception of the leased facilities acquired in 2015 which are allocated a charge of 10% of cash revenues, as a property operating cost and a corresponding reduction to general and administrative expense to cover the day-to-day administrative costs to operate our data centers. The management fee charge is reflected as a reduction to net operating income.
Management uses NOI as a supplemental performance measure because it provides a useful measure of the operating results from our customer leases. In addition, we believe it is useful to investors in evaluating and comparing the
79
operating performance of our properties and to compute the fair value of our properties. Our NOI may not be comparable to other REITs’ NOI as other REITs may not calculate NOI in the same manner. NOI should be considered only as a supplement to net income as a measure of our performance and should not be used as a measure of our results of operations or liquidity or as an indication of funds available to meet our cash needs, including our ability to make distributions to our stockholders. NOI is a measure of the operating performance of our properties and not of our performance as a whole. NOI is therefore not a substitute for net income as computed in accordance with GAAP.
A reconciliation of net income (loss) to NOI is presented below:
|
|
|
Year Ended December 31, |
|||||||
|
|
|
2016 |
|
2015 |
|
2014 |
|||
|
|
|
(unaudited $ in thousands) |
|||||||
|
Net Operating Income (NOI) |
|
|
|
|
|
|
|
|
|
|
Net income |
|
$ |
24,685 |
|
$ |
24,129 |
|
$ |
19,103 |
|
Interest expense |
|
|
23,159 |
|
|
21,289 |
|
|
15,308 |
|
Interest income |
|
|
(3) |
|
|
(2) |
|
|
(8) |
|
Depreciation and amortization |
|
|
124,786 |
|
|
85,811 |
|
|
58,282 |
|
Write off of unamortized deferred finance costs |
|
|
193 |
|
|
468 |
|
|
871 |
|
Tax benefit of taxable REIT subsidiaries |
|
|
(9,976) |
|
|
(10,065) |
|
|
— |
|
Restructuring costs |
|
|
— |
|
|
— |
|
|
1,298 |
|
Integration costs |
|
|
9,568 |
|
|
6,334 |
|
|
— |
|
Transaction costs |
|
|
1,338 |
|
|
4,948 |
|
|
1,018 |
|
Loss on sale of real estate |
|
|
— |
|
|
164 |
|
|
— |
|
General and administrative expenses |
|
|
83,286 |
|
|
67,783 |
|
|
45,283 |
|
NOI (1) |
|
$ |
257,036 |
|
$ |
200,859 |
|
$ |
141,155 |
|
Breakdown of NOI by facility: |
|
|
|
|
|
|
|
|
|
|
Atlanta-Metro data center |
|
$ |
81,074 |
|
$ |
69,861 |
|
$ |
60,734 |
|
Atlanta-Suwanee data center |
|
|
45,760 |
|
|
41,088 |
|
|
35,509 |
|
Santa Clara data center |
|
|
13,703 |
|
|
14,352 |
|
|
12,739 |
|
Richmond data center |
|
|
30,752 |
|
|
20,959 |
|
|
14,366 |
|
Sacramento data center |
|
|
7,734 |
|
|
7,516 |
|
|
8,470 |
|
Princeton data center |
|
|
9,544 |
|
|
9,461 |
|
|
4,828 |
|
Irving data center |
|
|
16,608 |
|
|
5,547 |
|
|
815 |
|
Leased data centers acquired in 2015 |
|
|
41,785 |
|
|
27,595 |
|
|
— |
|
Piscataway data center |
|
|
5,627 |
|
|
— |
|
|
— |
|
Other data centers |
|
|
4,449 |
|
|
4,480 |
|
|
3,694 |
|
NOI (1) |
|
$ |
257,036 |
|
$ |
200,859 |
|
$ |
141,155 |
|
(1) |
Includes facility level general and administrative allocation charges of 4% of cash revenue for all facilities, with the exception of the leased facilities acquired in 2015, which include general and administrative expense allocation charges of 10% of cash revenue. These allocated charges aggregated to $20.6 million, $15.2 million and $8.7 million for the years ended December 31, 2016, 2015 and 2014, respectively. |
Earnings Before Interest, Taxes, Depreciation and Amortization (EBITDA) and Adjusted EBITDA
We calculate EBITDA as net income (loss) adjusted to exclude interest expense and interest income, provision (benefit) for income taxes (including income taxes applicable to sale of assets) and depreciation and amortization. Management believes that EBITDA is useful to investors in evaluating and facilitating comparisons of our operating performance between periods and between REITs by removing the impact of our capital structure (primarily interest expense) and asset base charges (primarily depreciation and amortization) from our operating results.
In addition to EBITDA, we calculate an adjusted measure of EBITDA, which we refer to as Adjusted EBITDA, as EBITDA excluding write off of unamortized deferred financing costs, gains (losses) on extinguishment of debt, transaction and integration costs, equity-based compensation expense, restructuring costs and gain (loss) on sale of real estate. We believe that Adjusted EBITDA provides investors with another financial measure that can facilitate comparisons of operating performance between periods and between REITs.
80
Management uses EBITDA and Adjusted EBITDA as supplemental performance measures as they provide useful measures of assessing our operating results. Other companies may not calculate EBITDA or Adjusted EBITDA in the same manner. Accordingly, our EBITDA and Adjusted EBITDA may not be comparable to others. EBITDA and Adjusted EBITDA should be considered only as supplements to net income (loss) as measures of our performance and should not be used as substitutes for net income (loss), as measures of our results of operations or liquidity or as indications of funds available to meet our cash needs, including our ability to make distributions to our stockholders.
A reconciliation of net income to EBITDA and Adjusted EBITDA is presented below:
|
|
|
Year Ended December 31, |
|||||||
|
|
|
2016 |
|
2015 |
|
2014 |
|||
|
|
|
(unaudited $ in thousands) |
|||||||
|
EBITDA and Adjusted EBITDA |
|
|
|
|
|
|
|
|
|
|
Net income |
|
$ |
24,685 |
|
$ |
24,129 |
|
$ |
19,103 |
|
Interest expense |
|
|
23,159 |
|
|
21,289 |
|
|
15,308 |
|
Interest income |
|
|
(3) |
|
|
(2) |
|
|
(8) |
|
Tax benefit of taxable REIT subsidiaries |
|
|
(9,976) |
|
|
(10,065) |
|
|
— |
|
Depreciation and amortization |
|
|
124,786 |
|
|
85,811 |
|
|
58,282 |
|
EBITDA |
|
|
162,651 |
|
|
121,162 |
|
|
92,685 |
|
|
|
|
|
|
|
|
|
|
|
|
Write off of unamortized deferred finance costs |
|
|
193 |
|
|
468 |
|
|
871 |
|
Equity-based compensation expense |
|
|
10,584 |
|
|
6,964 |
|
|
4,153 |
|
Restructuring costs |
|
|
— |
|
|
— |
|
|
1,298 |
|
Integration costs |
|
|
9,568 |
|
|
6,334 |
|
|
— |
|
Transaction costs |
|
|
1,338 |
|
|
4,948 |
|
|
1,018 |
|
Loss on sale of real estate |
|
|
— |
|
|
164 |
|
|
— |
|
Adjusted EBITDA |
|
$ |
184,334 |
|
$ |
140,040 |
|
$ |
100,025 |
Liquidity and Capital Resources
Short-Term Liquidity
Our short-term liquidity needs include funding capital expenditures for the redevelopment of data center space (a significant portion of which is discretionary), meeting debt service and debt maturity obligations, including interest payments on our Senior Notes, funding distributions to our stockholders and unit holders, utility costs, site maintenance costs, real estate and personal property taxes, insurance, rental expenses, general and administrative expenses and certain recurring and non-recurring capital expenditures.
We expect that we will incur between $325 million and $375 million in capital expenditures through December 31, 2017 in connection with the redevelopment of our data center facilities. We expect to spend approximately $250 million to $300 million of capital expenditures with vendors on redevelopment, and the remainder on other capital expenditures including capitalized overhead costs (including capitalized interest, commissions, payroll and other similar costs), personal property and other less material capital projects. We expect to fund these costs using operating cash flows and draws on our credit facility. A significant portion of these expenditures are discretionary in nature and we may ultimately determine not to make these expenditures or the timing of such expenditures may vary. We continue to evaluate acquisition opportunities, but none are considered probable at this time and therefore the related expenditures are not currently included in these future estimates.
We expect to meet our short-term liquidity needs through operating cash flow, cash and cash equivalents and borrowings under our credit facility.
81
Our cash paid for capital expenditures for the years ended December 31, 2016, 2015 and 2014 are summarized in the table below (in thousands):
|
|
|
Year Ended December 31, |
|||||||
|
|
|
2016 |
|
2015 |
|
2014 |
|||
|
Redevelopment |
|
$ |
203,984 |
|
$ |
261,081 |
|
$ |
148,840 |
|
Acquisitions |
|
|
173,067 |
|
|
292,685 |
|
|
91,064 |
|
Maintenance capital expenditures |
|
|
5,059 |
|
|
4,745 |
|
|
2,684 |
|
Other capital expenditures (1) |
|
|
70,862 |
|
|
54,233 |
|
|
49,620 |
|
Total capital expenditures |
|
$ |
452,972 |
|
$ |
612,744 |
|
$ |
292,208 |
|
|
|
|
|
|
|
|
|
|
|
|
(1) |
Represents capital expenditures for capitalized interest, commissions, personal property, overhead costs and corporate fixed assets. Corporate fixed assets primarily relate to construction of corporate offices, leasehold improvements and product related assets. |
Long-Term Liquidity
Our long-term liquidity needs primarily consist of funds for property acquisitions, scheduled debt maturities, payment of principal at maturity of our Senior Notes, funding payments for capital lease and lease financing obligations, and recurring and non-recurring capital expenditures. We may also pursue additional redevelopment of our Atlanta-Metro, Irving, Richmond, Chicago, Piscataway and Fort Worth data centers and future redevelopment of other space in our portfolio. The redevelopment of this space, including timing, is at our discretion and will depend on a number of factors, including availability of capital and our estimate of the demand for data center space in the applicable market. We expect to meet our long-term liquidity needs with net cash provided by operations, incurrence of additional long-term indebtedness, borrowings under our credit facility and issuance of additional equity or debt securities, subject to prevailing market conditions, as discussed below.
In March 2016, QTS filed an automatic shelf registration statement on Form S-3 with the SEC. Effective upon filing, the shelf provides for the potential sale of an unspecified amount of our Class A common stock, preferred stock, depositary shares representing preferred stock, warrants and rights to purchase our common stock or any combination thereof, subject to the ability of QTS to effect offerings on satisfactory terms based on prevailing conditions. The shelf registration statement is intended to allow us to have the flexibility to raise such funds in one or more offerings should we perceive market conditions to be favorable. Pursuant to this shelf registration, on April 1, 2016, we issued 6,325,000 shares of QTS’ Class A common stock at a price of $45.50 per share in an underwritten public offering, including the exercise in full of the underwriter’s option to purchase an additional 825,000 shares. We used substantially all of the net proceeds of approximately $276 million to repay amounts outstanding under our unsecured revolving credit facility.
Cash
As of December 31, 2016, we had $9.6 million of unrestricted cash and cash equivalents.
The following tables present quarterly cash dividends and distributions paid to QTS’ common stockholders and the Operating Partnership’s unit holders for the years ended December 31, 2016 and 2015:
|
Year Ended December 31, 2016 |
||||||||
|
|
|
|
|
|
|
|
Aggregate |
|
|
|
|
|
|
Per Common Share and |
|
Dividend/Distribution |
||
|
Record Date |
|
Payment Date |
|
Per Unit Rate |
|
Amount (in millions) |
||
|
September 20, 2016 |
|
October 5, 2016 |
|
$ |
0.36 |
|
$ |
19.7 |
|
June 17, 2016 |
|
July 6, 2016 |
|
|
0.36 |
|
|
19.7 |
|
March 18, 2016 |
|
April 5, 2016 |
|
|
0.36 |
|
|
17.4 |
|
December 17, 2015 |
|
January 6, 2016 |
|
|
0.32 |
|
|
15.4 |
|
|
|
|
|
$ |
1.40 |
|
$ |
72.2 |
82
|
Year Ended December 31, 2015 |
||||||||
|
|
|
|
|
|
|
|
Aggregate |
|
|
|
|
|
|
Per Common Share and |
|
Dividend/Distribution |
||
|
Record Date |
|
Payment Date |
|
Per Unit Rate |
|
Amount (in millions) |
||
|
September 18, 2015 |
|
October 6, 2015 |
|
$ |
0.32 |
|
$ |
15.3 |
|
June 19, 2015 |
|
July 8, 2015 |
|
|
0.32 |
|
|
15.3 |
|
March 20, 2015 |
|
April 7, 2015 |
|
|
0.32 |
|
|
13.4 |
|
December 19, 2014 |
|
January 7, 2015 |
|
|
0.29 |
|
|
10.7 |
|
|
|
|
|
$ |
1.25 |
|
$ |
54.7 |
Additionally, on January 5, 2017 we paid our regular quarterly cash dividend of $0.36 per common share and per unit in the Operating Partnership to stockholders and unit holders of record as of the close of business on December 16, 2016.
Indebtedness
As of December 31, 2016, we had approximately $965.8 million of indebtedness, including capital lease obligations.
Unsecured Credit Facility. In May 2013, we entered into a $575 million unsecured credit facility comprised of a five-year $225 million term loan and a four-year $350 million revolving credit facility with a one year extension, subject to satisfaction of certain conditions, and had the ability to expand the total credit facility by an additional $100 million subject to certain conditions set forth in the credit agreement. In July 2014 our term loan was reduced by $75 million to $150 million in connection with the issuance of the Senior Notes. On December 17, 2014, we entered into a third amended and restated credit agreement providing for a $650 million unsecured credit facility comprised of a five-year $100 million term loan maturing December 17, 2019 and a four-year $550 million revolving credit facility maturing December 17, 2018, with the option to extend one year until December 17, 2019, subject to the satisfaction of certain conditions. The lenders under the unsecured credit facility could issue up to $30 million in letters of credit subject to the satisfaction of certain conditions.
In October 2015, we amended and restated our unsecured credit facility, increasing the total capacity by $250 million and extending the term. At the same time, we terminated our secured credit facility relating to the Richmond data center. The amended unsecured credit facility had a total capacity of $900 million and included a $150 million term loan which was expected to mature on December 17, 2020, another $150 million term loan which was expected to mature on April 27, 2021, and a $600 million revolving credit facility which was expected to mature on December 17, 2019, with a one year extension option. The amended unsecured credit facility also included a $200 million accordion feature. Under the amended unsecured credit facility, the capacity could be increased from $900 million to $1.1 billion subject to certain conditions set forth in the credit agreement, including the consent of the administrative agent and obtaining necessary commitments.
In December 2016, we further amended and restated our unsecured credit facility, increasing the total capacity by $300 million and extending the term. The amended unsecured credit facility has a total capacity of $1.2 billion and includes a $300 million term loan which matures on December 17, 2021, another $200 million term loan which matures on April 27, 2022, and a $700 million revolving credit facility which matures on December 17, 2020, with a one year extension option. Amounts outstanding under the amended unsecured credit facility bear interest at a variable rate equal to, at our election, LIBOR or a base rate, plus a spread that will vary depending upon our leverage ratio. For revolving credit loans, the spread ranges from 1.55% to 2.15% for LIBOR loans and 0.55% to 1.15% for base rate loans. For term loans, the spread ranges from 1.50% to 2.10% for LIBOR loans and 0.50% to 1.10% for base rate loans.
Under the amended unsecured credit facility, the capacity may be increased from the current capacity of $1.2 billion to $1.5 billion subject to certain conditions set forth in the credit agreement, including the consent of the administrative agent and obtaining necessary commitments. As of December 31, 2016, the weighted average interest rate for amounts outstanding under our amended unsecured credit facility was 2.22%. We are also required to pay a commitment fee to the lenders assessed on the unused portion of the unsecured revolving credit facility. At our election, we can prepay amounts outstanding under the unsecured credit facility, in whole or in part, without penalty or premium.
Our ability to borrow under the amended unsecured credit facility is subject to ongoing compliance with a number of customary affirmative and negative covenants, including limitations on liens, mergers, consolidations, investments, distributions, asset sales and affiliate transactions, as well as the following financial covenants: (i) the Operating
83
Partnership's and its subsidiaries' consolidated total unsecured debt plus any capitalized lease obligations with respect to the unencumbered asset pool properties may not exceed 60% of the unencumbered asset pool value (or 65% of the unencumbered asset pool value for up to two consecutive fiscal quarters immediately following a material acquisition for which the Operating Partnership has provided written notice to the Agent; provided the two fiscal quarter period includes the quarter in which the material acquisition was consummated); (ii) the unencumbered asset pool debt yield cannot be less than 14% (or 12.5% for the two consecutive fiscal quarters immediately following a material acquisition for which the Operating Partnership has provided written notice to the Agent; provided the two fiscal quarter period includes the quarter in which the material acquisition was consummated); (iii) QTS must maintain a minimum fixed charge coverage ratio (defined as the ratio of consolidated EBITDA, subject to certain adjustments, to consolidated fixed charges) for the prior two most recently-ended calendar quarters of 1.70 to 1.00; (iv) QTS must maintain a maximum debt to gross asset value (as defined in the amended and restated agreement) ratio of 60% (or 65% for the two consecutive fiscal quarters immediately following a material acquisition for which the Operating Partnership has provided written notice to the Agent; provided the two fiscal quarter period includes the quarter in which the material acquisition was consummated); (v) QTS must maintain tangible net worth (as defined in the amended and restated agreement) cannot be less than the sum of $1,179,931,500 plus 75% of the net proceeds from any future equity offerings; and (vi) a maximum distribution payout ratio of the greater of (i) 95% of the our Funds from Operations (as defined in the amended and restated agreement) and (ii) the amount required for the Company to qualify as a REIT under the Code.
The availability under the revolving credit facility is the lesser of (i) $700 million, (ii) 60% of the unencumbered asset pool capitalized value (or 65% of the unencumbered asset pool capitalized value for the two consecutive fiscal quarters immediately following a material acquisition for which the Operating Partnership has provided written notice to the Agent; provided the two fiscal quarter period includes the quarter in which the material acquisition was consummated) and (iii) the amount resulting in an unencumbered asset pool debt yield of 14% (or 12.5% for the two consecutive fiscal quarters immediately following a material acquisition for which the Operating Partnership has provided written notice to the Agent; provided the two fiscal quarter period includes the quarter in which the material acquisition was consummated). In the case of clauses (ii) and (iii) of the preceding sentence, the amount available under the revolving credit facility is adjusted to take into account any other unsecured debt and certain capitalized leases. A material acquisition is an acquisition of properties or assets with a gross purchase price equal to or in excess of 15% of the Operating Partnership's gross asset value (as defined in the amended and restated agreement) as of the end of the most recently ended quarter for which financial statements are publicly available. The availability of funds under our unsecured credit facility depends on compliance with our covenants.
As of December 31, 2016, we had outstanding $639.0 million of indebtedness under the amended unsecured credit facility, consisting of $139.0 million of outstanding borrowings under our unsecured revolving credit facility and $500.0 million outstanding under the term loans, exclusive of net debt issuance costs of $4.1 million. In connection with the unsecured credit facility, as of December 31, 2016, the Company had an additional $1.5 million letter of credit outstanding. In addition, we entered into two additional letters of credit in June 2016 related to our Chicago facility and Piscataway facility in the amounts of $0.5 million and $0.1 million, respectively.
5.875% Senior Notes due 2022. On July 23, 2014, the Operating Partnership and QTS Finance Corporation, a subsidiary of the Operating Partnership formed solely for the purpose of facilitating the offering of the Senior Notes described below (collectively, the “Issuers”), issued $300 million aggregate principal amount of 5.875% Senior Notes due 2022. The Senior Notes have an interest rate of 5.875% per annum and were issued at a price equal to 99.211% of their face value. The proceeds from the offering were used to repay amounts outstanding under the unsecured credit facility, including $75 million outstanding under the term loan. As of December 31, 2016, the discount recorded on the Senior Notes was $1.8 million and the outstanding net debt issuance costs associated with the Senior Notes were $6.1 million.
The Senior Notes are unconditionally guaranteed, jointly and severally, on a senior unsecured basis by all of the Operating Partnership’s existing subsidiaries (other than foreign subsidiaries, receivables entities and 2470 Satellite Boulevard, LLC, which is a Delaware limited liability company formed in December 2015 that acquired an office building in Duluth, Georgia and has de minimis operations) and future subsidiaries that guarantee any indebtedness of QTS, the Issuers or any other subsidiary guarantor. QTS Realty Trust, Inc. does not guarantee the Senior Notes and will not be required to guarantee the Senior Notes except under certain circumstances. The offering was conducted pursuant to Rule 144A of the Securities Act of 1933, as amended, and the Senior Notes were issued pursuant to an indenture,
84
dated as of July 23, 2014, among QTS, the Operating Partnership, QTS Finance Corporation, the guarantors named therein, and Deutsche Bank Trust Company Americas, as trustee (the “Indenture”).
On March 23, 2015, the SEC declared effective the Operating Partnership and QTS Finance Corporation’s registration statement on Form S-4 pursuant to which the Issuers exchanged the originally issued Senior Notes for $300 million of 5.875% Senior Notes due 2022 (the “Exchange Notes”) that are registered under the Securities Act of 1933, as amended. The exchange offer was completed on April 23, 2015, and all outstanding originally issued Senior Notes were tendered. The Exchange Notes did not provide the Company with any additional proceeds and satisfied its obligations under a registration rights agreement entered into in connection with the issuance of the Senior Notes.
The Indenture contains affirmative and negative covenants that, among other things, limit or restrict the Operating Partnership’s ability and the ability of certain of its subsidiaries (“Restricted Subsidiaries”) to: incur additional indebtedness; pay dividends; make certain investments or other restricted payments; enter into transactions with affiliates; enter into agreements limiting the ability of the Operating Partnership’s restricted subsidiaries to pay dividends; engage in sales of assets; and engage in mergers, consolidations or sales of substantially all of their assets. However, certain of these covenants will be suspended if and for so long as the Senior Notes are rated investment grade by specified debt rating services and there is no default under the Indenture. The Operating Partnership and its Restricted Subsidiaries also are required to maintain total unencumbered assets (as defined in the Indenture) of at least 150% of their unsecured debt on a consolidated basis.
The Senior Notes may be redeemed by the Issuers, in whole or in part, at any time prior to August 1, 2017 at a redemption price equal to (i) 100% of principal amount, plus (ii) accrued and unpaid interest to the redemption date, and (iii) a make-whole premium. Thereafter, the Issuers may redeem the Senior Notes prior to maturity at 104.406% of the principal amount at August 1, 2017 and declining ratably to par at August 1, 2020 and thereafter, in each case plus accrued and unpaid interest to the redemption date. At any time prior to August 1, 2017, the Issuers may, subject to certain conditions, redeem up to 35% of the aggregate principal amount of the Senior Notes at 105.875% of the principal amount thereof, plus accrued and unpaid interest to the redemption date, with the net cash proceeds of certain equity offerings consummated by us or the Operating Partnership. Also, upon the occurrence of a change of control of us or the Operating Partnership, holders of the Senior Notes may require the Issuers to repurchase all or a portion of the Senior Notes at a price equal to 101% of the principal amount of the Senior Notes to be repurchased plus accrued and unpaid interest to the repurchase date.
Contingencies
We are subject to various routine legal proceedings and other matters in the ordinary course of business. While resolution of these matters cannot be predicted with certainty, management believes, based upon information currently available, that the final outcome of these proceedings will not have a material adverse effect on our financial condition, liquidity or results of operations.
Contractual Obligations
The following table summarizes our contractual obligations as of December 31, 2016, including the future non-cancellable minimum rental payments required under operating leases and the maturities and scheduled principal repayments of indebtedness and other agreements (in thousands):
|
Obligations |
|
2017 |
|
2018 |
|
2019 |
|
2020 |
|
2021 |
|
Thereafter |
|
Total |
|||||||
|
|
|
|
|
|
|
|
|
|
|
|
|
|
|
|
|
|
|
|
|
|
|
|
Operating Leases |
|
$ |
16,344 |
|
$ |
12,004 |
|
$ |
10,108 |
|
$ |
9,708 |
|
$ |
9,919 |
|
$ |
73,467 |
|
$ |
131,550 |
|
Capital Leases and Lease Financing Obligations |
|
|
12,944 |
|
|
9,370 |
|
|
2,844 |
|
|
2,190 |
|
|
2,388 |
|
|
8,972 |
|
|
38,708 |
|
Future Principal Payments of Indebtedness (1) |
|
|
— |
|
|
— |
|
|
— |
|
|
139,000 |
|
|
300,000 |
|
|
500,000 |
|
|
939,000 |
|
Total (2) |
|
$ |
29,288 |
|
$ |
21,374 |
|
$ |
12,952 |
|
$ |
150,898 |
|
$ |
312,307 |
|
$ |
582,439 |
|
$ |
1,109,258 |
|
(1) |
Does not include discount on Senior Notes reflected at December 31, 2016 or letters of credit of $1.5 million, $0.5 million, and $0.1 million outstanding as of December 31, 2016 under our unsecured credit facility. |
|
(2) |
Total obligations does not include contractual interest that we are required to pay on our long-term debt obligations. Contractual interest payments on our credit facilities, mortgages, capital leases and other financing arrangements |
85
through the scheduled maturity date, assuming no prepayment of debt, are shown below. Interest payments were estimated based on the principal amount of debt outstanding and the applicable interest rate as of December 31, 2016 (in thousands): |
|
2017 |
|
2018 |
|
2019 |
|
2020 |
|
2021 |
|
Thereafter |
|
Total |
|||||||
|
$ |
34,406 |
|
$ |
34,111 |
|
$ |
33,929 |
|
$ |
33,633 |
|
$ |
28,940 |
|
$ |
12,477 |
|
$ |
177,496 |
Off-Balance Sheet Arrangements
Periodically, we utilize derivatives to manage our interest rate exposure. As of December 31, 2016, we did not have any interest rate hedges outstanding.
Cash Flows
|
|
|
Year Ended December 31, |
|||||||
|
(in thousands) |
|
2016 |
|
2015 |
|
2014 |
|||
|
Cash flow provided by (used for): |
|
|
|
|
|
|
|
|
|
|
Operating activities |
|
$ |
153,794 |
|
$ |
109,258 |
|
$ |
73,757 |
|
Investing activities |
|
|
(452,972) |
|
|
(612,095) |
|
|
(292,209) |
|
Financing activities |
|
|
299,954 |
|
|
500,853 |
|
|
224,030 |
Year Ended December 31, 2016 Compared to Year Ended December 31, 2015
Cash flow provided by operating activities was $153.8 million for the year ended December 31, 2016, compared to $109.3 million for the year ended December 31, 2015. The increased cash flow provided by operating activities of $44.5 million was primarily due to an increase in cash operating income of $41.0 million as well as an increase in cash flow associated with net changes in working capital of $3.5 million primarily relating to changes in rents and other receivables, deferred income, advance rents and other assets.
Cash flow used for investing activities decreased by $159.1 million to $453.0 million for the year ended December 31, 2016, compared to $612.1 million for the year ended December 31, 2015. The decrease was primarily due to less net cash paid for acquisitions which was $119.6 million greater in 2015 due to the acquisition of leased facilities acquired in 2015 and lower cash paid for capital expenditures primarily related to higher redevelopment in 2015 of our Irving, Atlanta-Metro, Richmond and Chicago data centers of $40.2 million. These expenditures include capitalized soft costs such as interest, payroll and other costs to redevelop the properties, which were, in the aggregate, $22.4 million and $20.6 million for the years ended December 31, 2016 and 2015, respectively.
Cash flow provided by financing activities was $300.0 million for the year ended December 31, 2016, compared to $500.9 million for the year ended December 31, 2015. The decrease was primarily due to lower net proceeds of $169.2 million under our unsecured credit facility, lower net proceeds from equity offerings of $93.7 million due to equity offerings completed in March and June 2015 compared to only one equity offering in April 2016, as well as an increase in payments of cash dividends to common stockholders of $16.7 million which was due to the increase in shares outstanding related to the April 2016 equity issuance and a higher dividend rate. Partially offsetting this decrease was an increase in mortgage principal debt repayments of $86.6 million due to paying off the Atlanta-Metro equipment loan and Richmond Credit Facility in full during 2015.
Year Ended December 31, 2015 Compared to Year Ended December 31, 2014
Cash flow provided by operating activities was $109.3 million for the year ended December 31, 2015, compared to $73.8 million for the year ended December 31, 2014. The increased cash flow provided by operating activities of $35.5 million was primarily due to an increase in cash operating income of $30.2 million as well as an increase in cash flow associated with net changes in working capital of $5.3 million primarily relating to changes in accounts payable and accrued liabilities, deferred income, other assets and prepaid expenses.
Cash flow used for investing activities increased by $319.9 million to $612.1 million for the year ended December 31, 2015, compared to $292.2 million for the year ended December 31, 2014. The increase was primarily due to higher net cash outflow for acquisitions which was $201.6 million greater in 2015 and higher cash paid for capital expenditures primarily related to redevelopment of our Irving, Atlanta-Metro, Richmond and Chicago data centers of $118.9 million.
86
These expenditures include capitalized soft costs such as interest, payroll and other costs to redevelop properties, which were, in the aggregate, $20.6 million and $17.1 million for the years ended December 31, 2015 and 2014, respectively.
Cash flow provided by financing activities was $500.9 million for the year ended December 31, 2015, compared to $224.0 million for the year ended December 31, 2014. The increase was primarily due to net proceeds from equity offerings completed in March and June 2015 totaling $369.4 million, higher net proceeds of $6.0 million under our unsecured credit facility and Senior Notes (which were issued in 2014) and reduced payments on deferred financing costs of $6.2 million. Partially offsetting this increase was an increase in mortgage principal debt repayments of $84.4 million due to paying off the Atlanta-Metro equipment loan and Richmond Credit Facility in full during 2015, an increase in payments of cash dividends to common stockholders of $13.7 million which was due to the increase in shares outstanding related to the March 2015 and June 2015 equity issuances and a higher dividend rate, and an increase in principal payments on capital lease obligations of $6.9 million.
Critical Accounting Policies
Our discussion and analysis of our financial condition and results of operations is based upon our predecessor’s historical financial statements, which have been prepared in accordance with GAAP. The preparation of these financial statements in conformity with GAAP requires us to make estimates and assumptions that affect the reported amounts of assets and liabilities at the date of the financial statements and the reported amount of revenues and expenses during the reporting period. Actual results may differ from these estimates. We have provided a summary of our significant accounting policies in Note 2 of our audited financial statements included elsewhere in this Form 10-K. We describe below accounting policies that require material subjective or complex judgments and that have the most significant impact on our financial condition and results of operations. Our management evaluates these estimates on an ongoing basis, based upon information currently available and on various assumptions management believes are reasonable as of December 31, 2016.
Real Estate Assets. Real estate assets are reported at cost. All capital improvements for the income-producing properties that extend their useful life are capitalized to individual property improvements and depreciated over their estimated useful lives. Depreciation is generally provided on a straight-line basis over 40 years from the date the property was placed in service. Property improvements are depreciated on a straight-line basis over the life of the respective improvement ranging from 20 to 40 years from the date the components were placed in service. Leasehold improvements are depreciated over the lesser of 20 years or through the end of the respective life of the lease. Repairs and maintenance costs are generally expensed as incurred.
Capitalization of Costs. We capitalize certain redevelopment costs, including internal costs, incurred in connection with redevelopment. The capitalization of costs during the construction period (including interest and related loan fees, property taxes and other direct and indirect costs) begins when redevelopment efforts commence and ends when the asset is ready for its intended use.
Intangible Assets and Liabilities. Intangible assets and liabilities include acquired above-market leases, below-market leases, in-place leases, customer relationships, trade names and platform. Acquired above-market leases are amortized on a straight-line basis as a decrease to rental revenue over the remaining term of the underlying leases. Acquired below-market leases are amortized on a straight-line basis as an increase to rental revenue over the remaining term of the underlying leases, including fixed option renewal periods, if any. Acquired in-place lease costs are amortized as real estate amortization expense on a straight-line basis over the remaining life of the underlying leases. Acquired customer relationships are amortized as real estate amortization expense on a straight-line basis over the expected life of the customer relationship. Should a customer terminate its lease, the unamortized portions of the acquired above-market and below-market leases, acquired in-place lease costs and acquired customer relationships associated with that customer are written off to amortization expense or rental revenue, as indicated above. Acquired trade names are amortized as real estate amortization expense on a straight-line basis over their remaining useful lives. Acquired platform intangibles are amortized as non-real estate amortization expense on a straight-line basis over their remaining useful lives.
Impairment of Long-Lived Assets and Goodwill. Whenever events or changes in circumstances indicate that the carrying amount of the assets may not be recoverable, we assess whether there has been impairment in the value of long-lived assets used in operations or in development and intangible assets. Recoverability of assets to be held and used is generally measured by comparison of the carrying amount to the future net cash flows, undiscounted and without interest, expected to be generated by the asset group. If the net carrying value of the asset exceeds the value of the
87
undiscounted cash flows, the fair value of the asset is assessed and may be considered impaired. An impairment loss is recognized based on the excess of the carrying amount of the impaired asset over its fair value.
The fair value of goodwill is the consideration transferred which is not allocable to identifiable intangible and tangible assets. Goodwill is subject to at least an annual assessment for impairment. As a result of the Carpathia acquisition, the Company recognized approximately $174 million in goodwill. In connection with the goodwill impairment evaluation that the Company performed on October 1, 2016, the Company determined qualitatively that there were no indicators of impairment, thus it did not perform a quantitative analysis.
Deferred Costs. Deferred costs, net on our balance sheet includes both financing costs and leasing costs. Deferred financing costs represent fees and other costs incurred in connection with obtaining debt and are amortized over the term of the loan and are included in interest expense. Deferred leasing costs consist of external fees and internal costs incurred in the successful negotiations of leases and are deferred and amortized to real estate amortization expense over the terms of the related leases on a straight-line basis. If an applicable lease terminates prior to the expiration of its initial term, the carrying amount of the costs are written off to amortization expense.
Deferred Income. Deferred income generally results from non-refundable charges paid by the customer at lease inception to prepare their space for occupancy. We record this initial payment, commonly referred to as set-up fees, as a deferred income liability which amortizes into rental revenue over the term of the related lease on a straight-line basis.
Rental Revenue. We, as a lessor, have retained substantially all the risks and benefits of ownership and account for our leases as operating leases. For lease agreements that provide for scheduled rent increases, rental income is recognized on a straight-line basis over the non-cancellable term of the leases, which commences when control of the space has been provided to the customer. Rental revenue also includes amortization of set-up fees which are amortized over the term of the respective lease, as discussed above.
Recoveries from Customers. Certain customer leases contain provisions under which the customers reimburse us for a portion of the property’s real estate taxes, insurance and other operating expenses, which include certain power and cooling-related charges. The reimbursements are included in revenue as recoveries from customers in the statements of operations and comprehensive income in the period in which the applicable expenditures are incurred. Certain customer leases are structured to provide a fixed monthly billing amount that includes an estimate of various operating expenses, with all revenue from such leases included in rental revenue.
Cloud and Managed Services Revenue. We may provide both our Cloud product and access to our Managed Services to our customers on an individual or combined basis. Service fee revenue is recognized as the revenue is earned, which generally coincides with the services being provided.
Inflation
Substantially all of our long-term leases—leases with a term greater than three years—contain rent increases and reimbursement for certain operating costs. As a result, we believe that we are largely insulated from the effects of inflation over periods greater than three years. Leases with terms of three years or less will be replaced or renegotiated within three years and should adjust to reflect changed conditions, also mitigating the effects of inflation. Moreover, to the extent that there are material increases in utility costs, we generally reserve the right to renegotiate the rate. However, any increases in the costs of redevelopment of our properties will generally result in a higher cost of the property, which will result in increased cash requirements to redevelop our properties and increased depreciation and amortization expense in future periods, and, in some circumstances, we may not be able to directly pass along the increase in these redevelopment costs to our customers in the form of higher rental rates.
Distribution Policy
To satisfy the requirements to qualify as a REIT, and to avoid paying tax on our income, QTS intends to continue to make regular quarterly distributions of all, or substantially all, of its REIT taxable income (excluding net capital gains) to its stockholders.
All distributions will be made at the discretion of our board of directors and will depend on our historical and projected results of operations, liquidity and financial condition, QTS’ REIT qualification, our debt service requirements,
88
operating expenses and capital expenditures, prohibitions and other restrictions under financing arrangements and applicable law and other factors as our board of directors may deem relevant from time to time. We anticipate that our estimated cash available for distribution will exceed the annual distribution requirements applicable to REITs and the amount necessary to avoid the payment of tax on undistributed income. However, under some circumstances, we may be required to make distributions in excess of cash available for distribution in order to meet these distribution requirements and we may need to borrow funds to make certain distributions. If we borrow to fund distributions, our future interest costs would increase, thereby reducing our earnings and cash available for distribution from what they otherwise would have been.
The Operating Partnership also includes certain partners that are subject to a taxable income allocation, however, not entitled to receive recurring distributions. The partnership agreement does stipulate however, to the extent that taxable income is allocated to these partners that the partnership will make a distribution to these partners equal to the lesser of the actual per unit distributions made to Class A partners or an estimated amount to cover federal, state and local taxes on the allocated taxable income. No distributions related to allocated taxable income were made to these partners for the years ended December 31, 2016 and 2015.
ITEM 7A. QUANTITATIVE AND QUALITATIVE DISCLOSURES ABOUT MARKET RISK
Our future income, cash flows and fair values relevant to financial instruments are dependent upon prevailing market interest rates. Market risk refers to the risk of loss from adverse changes in market prices and interest rates. The primary market risk to which we believe we are exposed is interest rate risk. Many factors, including governmental monetary and tax policies, domestic and international economic and political considerations and other factors that are beyond our control, contribute to interest rate risk.
As of December 31, 2016, we had outstanding $639.0 million of consolidated indebtedness that bore interest at variable rates.
We monitor our market risk exposures using a sensitivity analysis. Our sensitivity analysis estimates the exposure to market risk sensitive instruments assuming a hypothetical 1% change in year-end interest rates. A 1% increase in interest rates would increase the interest expense on the $639.0 million of variable indebtedness outstanding as of December 31, 2016 by approximately $6.4 million annually. Conversely, a decrease in the LIBOR rate to 0% would decrease the interest expense on this $639.0 million of variable indebtedness outstanding by approximately $4.9 million annually based on the one month LIBOR rate of approximately 0.8% as of December 31, 2016.
The above analyses do not consider the effect of any change in overall economic activity that could impact interest rates or expected changes associated with future indebtedness. Further, in the event of a change of that magnitude, we may take actions to further mitigate our exposure to the change. However, due to the uncertainty of the specific actions that would be taken and their possible effects, these analyses assume no changes in our financial structure.
ITEM 8. FINANCIAL STATEMENTS AND SUPPLEMENTARY DATA
See Index to the Financial Statements on page F-1.
ITEM 9. CHANGES IN AND DISAGREEMENTS WITH ACCOUNTANTS ON ACCOUNTING AND FINANCIAL DISCLOSURE
None.
ITEM 9A. CONTROLS AND PROCEDURES
QTS Realty Trust, Inc.
Disclosure Controls and Procedures
Based on an evaluation of disclosure controls and procedures for the period ended December 31, 2016, conducted by the Company’s management, with the participation of the Chief Executive Officer and Chief Financial Officer, the Chief Executive Officer and Chief Financial Officer concluded that QTS’ disclosure controls and procedures are effective to
89
ensure that information required to be disclosed by QTS in reports that it files or submits under the Securities Exchange Act of 1934 is accumulated and communicated to the Company’s management (including the Chief Executive Officer and Chief Financial Officer) to allow timely decisions regarding required disclosure, and is recorded, processed, summarized and reported within the time periods specified in Securities and Exchange Commission rules and forms.
Management’s Report on Internal Control Over Financial Reporting
Our management is responsible for establishing and maintaining adequate internal control over financial reporting (as defined in Rule 13a-15(f) and 15d-15(f) of the Exchange Act). Our internal control system was designed to provide reasonable assurance to management and our board of directors regarding the preparation and fair presentation of published financial statements in accordance with generally accepted accounting principles.
As of December 31, 2016, management assessed the effectiveness of QTS Realty Trust, Inc.'s internal control over financial reporting based on the criteria for effective internal control over financial reporting established in Internal Control - Integrated Framework (2013) issued by the Committee of Sponsoring Organizations of the Treadway Commission.
Based on this assessment, management has concluded that, as of December 31, 2016, QTS Realty Trust, Inc.’s internal control over financial reporting was effective to provide reasonable assurance regarding the reliability of our financial reporting and the preparation of financial statements for external purposes in accordance with generally accepted accounting principles.
Because of its inherent limitations, internal control over financial reporting may not prevent or detect misstatements. Also, projections of any evaluation of effectiveness to future periods are subject to the risk that controls may become inadequate because of changes in conditions, or that the degree of compliance with the policies or procedures may deteriorate.
Ernst & Young LLP, an independent registered public accounting firm, has audited QTS Realty Trust, Inc.’s consolidated financial statements included in this Annual Report on Form 10-K and, as part of its audit, has issued its report, included herein on page F-3, on the effectiveness of QTS Realty Trust, Inc.’s internal control over financial reporting.
Changes in Internal Control over Financial Reporting
There were no changes in our internal control over financial reporting during the three-month period ended December 31, 2016 that have materially affected, or are reasonably likely to materially affect, the Company’s internal control over financial reporting.
QualityTech, LP
Disclosure Controls and Procedures
Based on an evaluation of disclosure controls and procedures for the period ended December 31, 2016, conducted by the Company’s management, with the participation of the Chief Executive Officer and Chief Financial Officer, the Chief Executive Officer and Chief Financial Officer concluded that QualityTech, LP’s disclosure controls and procedures are effective to ensure that information required to be disclosed by QualityTech, LP in reports that it files or submits under the Securities Exchange Act of 1934 is accumulated and communicated to the Company’s management (including the Chief Executive Officer and Chief Financial Officer) to allow timely decisions regarding required disclosure, and is recorded, processed, summarized and reported within the time periods specified in Securities and Exchange Commission rules and forms.
Management’s Report on Internal Control Over Financial Reporting
The Company’s management is responsible for establishing and maintaining adequate internal control over financial reporting (as defined in Rule 13a-15(f) and 15d-15(f) of the Exchange Act). Our internal control system was designed to provide reasonable assurance to management and our board of directors regarding the preparation and fair presentation of published financial statements in accordance with generally accepted accounting principles.
90
As of December 31, 2016, management assessed the effectiveness of QualityTech, LP’s internal control over financial reporting based on the criteria for effective internal control over financial reporting established in Internal Control - Integrated Framework (2013) issued by the Committee of Sponsoring Organizations of the Treadway Commission.
Based on this assessment, management has concluded that, as of December 31, 2016, QualityTech, LP’s internal control over financial reporting was effective to provide reasonable assurance regarding the reliability of our financial reporting and the preparation of financial statements for external purposes in accordance with generally accepted accounting principles.
Because of its inherent limitations, internal control over financial reporting may not prevent or detect misstatements. Also, projections of any evaluation of effectiveness to future periods are subject to the risk that controls may become inadequate because of changes in conditions, or that the degree of compliance with the policies or procedures may deteriorate.
Changes in Internal Control over Financial Reporting
There were no changes in QualityTech, LP’s internal control over financial reporting during the three-month period ended December 31, 2016, that have materially affected, or are reasonably likely to materially affect, our internal control over financial reporting.
None.
ITEM 10. DIRECTORS, EXECUTIVE OFFICERS AND CORPORATE GOVERNANCE
The information regarding directors is incorporated herein by reference from the section entitled “Proposal One: Election of Directors—Nominees for Election as Directors” in the Company’s definitive Proxy Statement (“2017 Proxy Statement”) to be filed pursuant to Regulation 14A of the Securities Exchange Act of 1934, as amended, for the Company’s Annual Meeting of Stockholders to be held on May 4, 2017. The 2017 Proxy Statement will be filed within 120 days after the end of the Company’s fiscal year ended December 31, 2016.
The information regarding executive officers is incorporated herein by reference from the section entitled “Executive Officers” in the Company’s 2017 Proxy Statement.
The information regarding compliance with Section 16(a) of the Securities Exchange Act of 1934, as amended, is incorporated herein by reference from the section entitled “Security Ownership of Certain Beneficial Owners and Management—Section 16(a) Beneficial Ownership Reporting Compliance” in the Company’s 2017 Proxy Statement.
The information regarding the Company’s code of business conduct and ethics is incorporated herein by reference from the sections entitled “Corporate Governance and Board Matters—Code of Business Conduct and Ethics” in the Company’s 2017 Proxy Statement.
The information regarding the Company’s audit committee, its members and the audit committee financial experts is incorporated by reference herein from the section entitled “Corporate Governance and Board Matters—Committees of the Board—Audit Committee” in the Company’s 2017 Proxy Statement.
ITEM 11. EXECUTIVE COMPENSATION
The information included under the following captions in the Company’s 2017 Proxy Statement is incorporated herein by reference: “Compensation Discussion and Analysis,” “Compensation Committee Report,” “Compensation of Executive Officers,” “Corporate Governance and Board Matters—Compensation of Directors” and “Corporate Governance and Board Matters—Compensation Committee Interlocks and Insider Participation.”
91
ITEM 12. SECURITY OWNERSHIP OF CERTAIN BENEFICIAL OWNERS AND MANAGEMENT AND RELATED STOCKHOLDER MATTERS
Information regarding security ownership of certain beneficial owners and management is incorporated herein by reference from the section entitled “Security Ownership of Certain Beneficial Owners and Management” and “Compensation of Executive Officers—Equity Compensation Plan Information” in the Company’s 2017 Proxy Statement.
ITEM 13. CERTAIN RELATIONSHIPS AND RELATED TRANSACTIONS, AND DIRECTOR INDEPENDENCE
The information regarding transactions with related persons and director independence is incorporated herein by reference from the sections entitled “Certain Relationships and Related Party Transactions” and “Corporate Governance and Board Matters—Corporate Governance Profile” in the Company’s 2017 Proxy Statement.
ITEM 14. PRINCIPAL ACCOUNTING FEES AND SERVICES
The information regarding principal auditor fees and services and the audit committee’s pre-approval policies are incorporated herein by reference from the sections entitled “Proposal Three: Ratification of the Appointment of Independent Registered Public Accounting Firm—Principal Accountant Fees and Services” and “Proposal Four: Ratification of the Appointment of Independent Registered Public Accounting Firm—Pre-Approval Policies and Procedures” in the Company’s 2017 Proxy Statement.
92
ITEM 15. EXHIBITS, FINANCIAL STATEMENT SCHEDULES
The following is a list of documents filed as a part of this report:
|
(1) |
Financial Statements |
Included herein at pages F-1 through F-39.
|
(2) |
Financial Statement Schedules |
The following financial statement schedules are included herein at pages F-40 through F-42:
Schedule II—Valuation and Qualifying Accounts
Schedule III—Real Estate Investments
All other schedules for which provision is made in Regulation S-X are either not required to be included herein under the related instructions, are inapplicable or the related information is included in the footnotes to the applicable financial statement and, therefore, have been omitted.
|
(3) |
Exhibits |
The exhibits required to be filed by Item 601 of Regulation S-K are listed in the Exhibit Index on pages 96 through 102 of this report, which is incorporated by reference herein.
The Company has chosen not to include a Form 10-K Summary.
93
Pursuant to the requirements of Section 13 or 15(d) of the Securities Exchange Act of 1934, the registrant has duly caused this report to be signed on its behalf by the undersigned, thereunto duly authorized.
|
|
|
QTS Realty Trust, Inc. |
|
|
|
|
|
DATE: March 1, 2017 |
|
/s/ Chad L. Williams |
|
|
|
Chad L. Williams |
|
|
|
Chairman and Chief Executive Officer |
|
|
|
|
|
|
|
|
|
DATE: March 1, 2017 |
|
/s/ William H. Schafer |
|
|
|
William H. Schafer |
|
|
|
Chief Financial Officer |
|
|
|
(Principal Financial Officer and Principal Accounting Officer) |
|
|
|
|
|
|
|
QualityTech, L.P. |
|
|
|
|
|
DATE: March 1, 2017 |
|
/s/ Chad L. Williams |
|
|
|
Chad L. Williams |
|
|
|
Chairman and Chief Executive Officer |
|
|
|
|
|
|
|
|
|
DATE: March 1, 2017 |
|
/s/ William H. Schafer |
|
|
|
William H. Schafer |
|
|
|
Chief Financial Officer |
|
|
|
(Principal Financial Officer and Principal Accounting Officer) |
|
|
|
|
|
|
|
|
Pursuant to the requirements of the Securities Exchange Act of 1934, as amended, this report has been signed below by the following persons on behalf of the registrant and in the capacities on the dates indicated.
|
DATE: March 1, 2017 |
|
/s/ Chad L. Williams |
|
|
|
Chad L. Williams |
|
|
|
Chairman and Chief Executive Officer |
|
|
|
|
|
DATE: March 1, 2017 |
|
/s/ John W. Barter |
|
|
|
John W. Barter |
|
|
|
Director |
|
|
|
|
|
|
|
|
|
DATE: March 1, 2017 |
|
/s/ William O. Grabe |
|
|
|
William O. Grabe |
|
|
|
Director |
|
|
|
|
|
|
|
|
|
DATE: March 1, 2017 |
|
/s/ Catherine R. Kinney |
|
|
|
Catherine R. Kinney |
|
|
|
Director |
|
|
|
|
|
|
|
|
|
DATE: March 1, 2017 |
|
/s/ Peter A. Marino |
|
|
|
Peter A. Marino |
|
|
|
Director |
|
|
|
|
|
|
|
|
|
DATE: March 1, 2017 |
|
/s/ Scott D. Miller |
94
|
|
|
Scott D. Miller |
|
|
|
Director |
|
|
|
|
|
|
|
|
|
DATE: March 1, 2017 |
|
/s/ Philip P. Trahanas |
|
|
|
Philip P. Trahanas |
|
|
|
Director |
|
|
|
|
|
|
|
|
|
DATE: March 1, 2017 |
|
/s/ Stephen E. Westhead |
|
|
|
Stephen E. Westhead |
|
|
|
Director |
95
|
Exhibit |
|
Exhibit Description |
|
|
|
|
|
2.1 |
|
Stock Purchase Agreement dated May 6, 2015 by and among Quality Technology Services Holding, LLC, Carpathia Holdings, LLC and Carpathia Acquisition, Inc. (Incorporated by reference to Exhibit 2.1 to the Current Report on Form 8-K filed with the SEC on May 12, 2015) |
|
|
|
|
|
2.2 |
|
First Amendment to Stock Purchase Agreement dated June 12, 2015 (Incorporated by reference to Exhibit 2.1 to the Current Report on Form 8-K filed with the SEC on June 19, 2015) |
|
|
|
|
|
3.1 |
|
Articles of Amendment and Restatement of QTS Realty Trust, Inc. (Incorporated by reference to Exhibit 3.1 to the Current Report on Form 8-K filed with the SEC on October 17, 2013) |
|
|
|
|
|
3.2 |
|
Amended and Restated Bylaws of QTS Realty Trust, Inc. (Incorporated by reference to Exhibit 3.2 to the Registration Statement on Form S-11/A filed with the SEC on September 26, 2013) |
|
|
|
|
|
4.1 |
|
Form of Specimen Class A Common Stock Certificate (Incorporated by reference to Exhibit 4.1 to the Registration Statement on Form S-11/A filed with the SEC on September 26, 2013) |
|
|
|
|
|
4.2 |
|
Indenture, dated July 23, 2014, by and among QualityTech, LP, QTS Finance Corporation, QTS Realty Trust, Inc., certain subsidiaries of QualityTech, LP and Deutsche Bank Trust Company Americas (Incorporated by reference to Exhibit 4.1 to the Current Report on Form 8-K filed with the SEC on July 25, 2014) |
|
|
|
|
|
4.3 |
|
Supplemental Indenture, dated as of December 22, 2014, by and among QualityTech, LP, QTS Finance Corporation, QTS Realty Trust, Inc., the entities identified therein as Guaranteeing Subsidiaries, the entities identified therein as Subsidiary Guarantors, and Deutsche Bank Trust Company Americas, to the Indenture dated, as of July 23, 2014, by and among QualityTech, LP, and QTS Finance Corporation, as issuers, QTS Realty Trust, Inc., each of the subsidiary guarantors party thereto, and Deutsche Bank Trust Company Americas, as trustee (Incorporated by reference to Exhibit 4.3 to the Annual Report on Form 10-K for the year ended December 31, 2014 filed with the SEC on February 23, 2015) |
|
|
|
|
|
4.4 |
|
Supplemental Indenture, dated as of September 28, 2015, by and among QualityTech, LP, QTS Finance Corporation, QTS Realty Trust, Inc., the entities identified therein as Guaranteeing Subsidiaries, the entities identified therein as Subsidiary Guarantors, and Deutsche Bank Trust Company Americas, to the Indenture dated, as of July 23, 2014, by and among QualityTech, LP, and QTS Finance Corporation, as issuers, QTS Realty Trust, Inc., each of the subsidiary guarantors party thereto, and Deutsche Bank Trust Company Americas, as trustee (Incorporated by reference to Exhibit 4.4 to the Quarterly Report on Form 10-Q filed with the SEC on November 6, 2015) |
|
|
|
|
|
4.5 |
|
Registration Rights Agreement, dated July 23, 2014, by and among QualityTech, LP, QTS Finance Corporation, QTS Realty Trust, Inc., certain subsidiaries of QualityTech, LP and Deutche Bank Securities Inc., KeyBanc Capital Markets Inc., and Merrill Lynch, Pierce, Fenner & Smith Incorporated, on behalf of the initial purchasers (Incorporated by reference to Exhibit 4.2 to the Current Report on Form 8-K filed with the SEC on July 25, 2014) |
|
|
|
|
96
|
4.6 |
|
Supplemental Indenture, dated as of June 23, 2016, by and among QualityTech, LP, QTS Finance Corporation, QTS Realty Trust, Inc., the entities identified therein as Guaranteeing Subsidiaries, the entities identified therein as Subsidiary Guarantors, and Deutsche Bank Trust Company Americas, to the Indenture dated, as of July 23, 2014, by and among QualityTech, LP, and QTS Finance Corporation, as issuers, QTS Realty Trust, Inc., each of the subsidiary guarantors party thereto, and Deutsche Bank Trust Company Americas, as trustee (Incorporated by reference to Exhibit 4.5 to the Quarterly Report on Form 10-Q filed with the SEC on May 5, 2016) |
|
|
|
|
|
10.1 |
|
Fifth Amended and Restated Agreement of Limited Partnership of QualityTech, LP dated October 15, 2013 (Incorporated by reference to Exhibit 10.1 to the Current Report on Form 8-K filed with the SEC on October 17, 2013) |
|
|
|
|
|
10.2 |
|
Employment Agreement dated as of August 15, 2013 by and among QualityTech GP, LLC, QualityTech, LP, Quality Technology Services, LLC and Chad L. Williams† (Incorporate by reference to Exhibit 10.4 to the Registration Statement on Form S-11 filed with the SEC on August 16, 2013) |
|
|
|
|
|
10.3 |
|
Amended and Restated Employment Agreement dated as of August 14, 2013 by and among QualityTech GP, LLC, QualityTech, LP, Quality Technology Services, LLC and William H. Schafer† (Incorporated by reference to Exhibit 10.5 to the Registration Statement on Form S-11 filed with the SEC on August 16, 2013) |
|
|
|
|
|
10.4 |
|
Employment Agreement, dated as of February 16, 2017, by and among QTS Realty Trust, Inc., QualityTech, LP, Quality Technology Services, LLC and William H. Schafer† (Incorporated by reference to Exhibit 10.5 to the Current Report on Form 8-K filed with the SEC on February 21, 2017) |
|
|
|
|
|
10.5 |
|
Employment Agreement dated as of June 15, 2012 by and among QualityTech GP, LLC, QualityTech, LP and James H. Reinhart† (Incorporated by reference to Exhibit 10.6 to the Registration Statement on Form S-11 filed with the SEC on August 16, 2013) |
|
|
|
|
|
10.6 |
|
Amendment No. 1 to Employment Agreement dated as of August 14, 2013 by and among QualityTech GP, LLC, QualityTech, LP, Quality Technology Services, LLC and James H. Reinhart† (Incorporated by reference to Exhibit 10.7 to the Registration Statement on Form S-11 filed with the SEC on August 16, 2013) |
|
|
|
|
|
10.7 |
|
Employment Agreement dated as of June 29, 2012 by and among QualityTech GP, LLC, QualityTech, LP and Daniel T. Bennewitz† (Incorporated by reference to Exhibit 10.8 to the Registration Statement on Form S-11 filed with the SEC on August 16, 2013) |
|
|
|
|
|
10.8 |
|
Amendment No. 1 to Employment Agreement dated as of August 14, 2013 by and among QualityTech GP, LLC, QualityTech, LP, Quality Technology Services, LLC and Daniel T. Bennewitz† (Incorporated by reference to Exhibit 10.9 to the Registration Statement on Form S-11 filed with the SEC on August 16, 2013) |
|
|
|
|
|
10.9 |
|
Employment Agreement dated as of August 1, 2013 by and among QualityTech GP, LLC, QualityTech, LP, Quality Technology Services, LLC and Jeffrey H. Berson† (Incorporated by reference to Exhibit 10.10 to the Registration Statement on Form S-11 filed with the SEC on August 16, 2013) |
|
|
|
|
|
10.10 |
|
Amendment No. 1 to Employment Agreement dated as of August 14, 2013 by and among QualityTech GP, LLC, QualityTech, LP, Quality Technology Services, LLC and Jeffrey H. Berson† (Incorporated by reference to Exhibit 10.11 to the Registration Statement on Form S-11 filed with the SEC on August 16, 2013) |
|
|
|
|
|
10.11 |
|
Employment Agreement dated as of August 14, 2013 by and among QualityTech GP, LLC, QualityTech, LP, Quality Technology Services, LLC and Shirley E. Goza† (Incorporated by reference to Exhibit 10.12 to the Registration Statement on Form S-11 filed with the SEC on August 16, 2013) |
|
|
|
|
97
|
10.12 |
|
Employment Agreement dated as of February 16, 2015 by and among QualityTech, LP, QTS Realty Trust, Inc., Quality Technology Services, LLC and Stanley M. Sword† (Incorporated by reference to Exhibit 10.10 to QualityTech, LP’s Registration Statement on Form S-4/A filed with the SEC on March 19, 2015) |
|
|
|
|
|
10.13 |
|
Employment Agreement dated as of May 6, 2015 by and among QTS Realty Trust, Inc., QualityTech, LP, Quality Technology Services Holding, LLC, Quality Technology Services, LLC, and Jon Greaves† (Incorporated by reference to Exhibit 10.1 to the Quarterly Report on Form 10-Q filed with the SEC on November 9, 2016) |
|
|
|
|
|
10.14 |
|
Amendment No. 1 to Employment Agreement dated as of March 21, 2016 by and among QTS Realty Trust, Inc., QualityTech, LP, Quality Technology Services Holding, LLC, Quality Technology Services, LLC, and Jon Greaves† (Incorporated by reference to Exhibit 10.2 to the Quarterly Report on Form 10-Q filed with the SEC on November 9, 2016) |
|
|
|
|
|
10.15 |
|
Employment Agreement dated as of August 31, 2016 by and among QTS Realty Trust, Inc., QualityTech, LP, Quality Technology Services, LLC, and Steven Bloom† (Incorporated by reference to Exhibit 10.3 to the Quarterly Report on Form 10-Q filed with the SEC on November 9, 2016) |
|
|
|
|
|
10.16 |
|
Indemnification Agreement dated as of September 25, 2013 by and between QTS Realty Trust, Inc. and Chad L. Williams† (Incorporated by reference to Exhibit 10.13 to the Registration Statement on Form S-11/A filed with the SEC on September 26, 2013) |
|
|
|
|
|
10.17 |
|
Indemnification Agreement dated as of September 25, 2013 by and between QTS Realty Trust, Inc. and William H. Schafer† (Incorporated by reference to Exhibit 10.14 to the Registration Statement on Form S-11/A filed with the SEC on September 26, 2013) |
|
|
|
|
|
10.18 |
|
Indemnification Agreement dated as of September 25, 2013 by and between QTS Realty Trust, Inc. and James H. Reinhart† (Incorporated by reference to Exhibit 10.15 to the Registration Statement on Form S-11/A filed with the SEC on September 26, 2013) |
|
|
|
|
|
10.19 |
|
Indemnification Agreement dated as of September 25, 2013 by and between QTS Realty Trust, Inc. and Daniel T. Bennewitz† (Incorporated by reference to Exhibit 10.16 to the Registration Statement on Form S-11/A filed with the SEC on September 26, 2013) |
|
|
|
|
|
10.20 |
|
Indemnification Agreement dated as of September 25, 2013 by and between QTS Realty Trust, Inc. and Jeffrey H. Berson† (Incorporated by reference to Exhibit 10.17 to the Registration Statement on Form S-11/A filed with the SEC on September 26, 2013) |
|
|
|
|
|
10.21 |
|
Indemnification Agreement dated as of September 25, 2013 by and between QTS Realty Trust, Inc. and Shirley E. Goza† (Incorporated by reference to Exhibit 10.18 to the Registration Statement on Form S-11/A filed with the SEC on September 26, 2013) |
|
|
|
|
|
10.22 |
|
Indemnification Agreement dated as of September 25, 2013 by and between QTS Realty Trust, Inc. and John W. Barter† (Incorporated by reference to Exhibit 10.19 to the Registration Statement on Form S-11/A filed with the SEC on September 26, 2013) |
|
|
|
|
|
10.23 |
|
Indemnification Agreement dated as of September 25, 2013 by and between QTS Realty Trust, Inc. and William O. Grabe† (Incorporated by reference to Exhibit 10.20 to the Registration Statement on Form S-11/A filed with the SEC on September 26, 2013) |
|
|
|
|
|
10.24 |
|
Indemnification Agreement dated as of September 25, 2013 by and between QTS Realty Trust, Inc. and Catherine R. Kinney† (Incorporated by reference to Exhibit 10.21 to the Registration Statement on Form S-11/A filed with the SEC on September 26, 2013) |
|
|
|
|
98
|
10.25 |
|
Indemnification Agreement dated as of September 25, 2013 by and between QTS Realty Trust, Inc. and Peter A. Marino† (Incorporated by reference to Exhibit 10.22 to the Registration Statement on Form S-11/A filed with the SEC on September 26, 2013) |
|
|
|
|
|
10.26 |
|
Indemnification Agreement dated as of September 25, 2013 by and between QTS Realty Trust, Inc. and Scott D. Miller† (Incorporated by reference to Exhibit 10.23 to the Registration Statement on Form S-11/A filed with the SEC on September 26, 2013) |
|
|
|
|
|
10.27 |
|
Indemnification Agreement dated as of September 25, 2013 by and between QTS Realty Trust, Inc. and Philip P. Trahanas† (Incorporated by reference to Exhibit 10.24 to the Registration Statement on Form S-11/A filed with the SEC on September 26, 2013) |
|
|
|
|
|
10.28 |
|
Indemnification Agreement dated as of September 25, 2013 by and between QTS Realty Trust, Inc. and Stephen E. Westhead† (Incorporated by reference to Exhibit 10.25 to the Registration Statement on Form S-11/A filed with the SEC on September 26, 2013) |
|
|
|
|
|
10.29 |
|
Indemnification Agreement dated as of February 16, 2015 by and between QTS Realty Trust, Inc. and Stanley M. Sword† (Incorporated by reference to Exhibit 10.18 to the Form 10-K for the year ended December 31, 2015 filed with the SEC on February 29, 2016) |
|
|
|
|
|
10.30 |
|
Indemnification Agreement dated as of March 21, 2016 by and between QTS Realty Trust, Inc. and Jon Greaves† |
|
|
|
|
|
10.31 |
|
Indemnification Agreement dated as of August 31, 2016 by and between QTS Realty Trust, Inc. and Steven Bloom† |
|
|
|
|
|
10.32 |
|
Non-Competition Agreement dated as of June 29, 2012 by and among Quality Technology Services, LLC and James H. Reinhart† (Incorporated by reference to Exhibit 10.14 to the Registration Statement on Form S-11/A filed with the SEC on August 16, 2013) |
|
|
|
|
|
10.33 |
|
Non-Competition Agreement dated as of June 29, 2012 by and among Quality Technology Services, LLC and Daniel T. Bennewitz† (Incorporated by reference to Exhibit 10.15 to the Registration Statement on Form S-11/A filed with the SEC on August 16, 2013) |
|
|
|
|
|
10.34 |
|
Registration Rights Agreement dated October 15, 2013 by and among QTS Realty Trust, Inc. and the parties listed on Schedule I thereto (Incorporated by reference to Exhibit 10.2 to the Current Report on Form 8-K filed with the SEC on October 17, 2013) |
|
|
|
|
|
10.35 |
|
Amended and Restated Registration Rights Agreement dated October 15, 2013 by and among QTS Realty Trust, Inc., QualityTech GP, LLC and GA QTS Interholdco, LLC (Incorporated by reference to Exhibit 10.3 to the Current Report on Form 8-K filed with the SEC on October 17, 2013) |
|
|
|
|
|
10.36 |
|
Amended and Restated Registration Rights Agreement dated October 15, 2013 by and among QTS Realty Trust, Inc., QualityTech GP, LLC, Chad L. Williams and certain entities owned or controlled by Chad L. Williams (Incorporated by reference to Exhibit 10.4 to the Current Report on Form 8-K filed with the SEC on October 17, 2013) |
|
|
|
|
|
10.37 |
|
Tax Protection Agreement dated as of October 15, 2013 by and among QTS Realty Trust, Inc., QualityTech, LP and the signatories party thereto (Incorporated by reference to Exhibit 10.5 to the Current Report on Form 8-K filed with the SEC on October 17, 2013) |
|
|
|
|
|
10.38 |
|
QualityTech, LP 2010 Equity Incentive Plan† (Incorporated by reference to Exhibit 10.20 to the Registration Statement on Form S-11/A filed with the SEC on August 16, 2013) |
|
|
|
|
99
|
10.39 |
|
Amendment No. 1 to Qualitytech, LP 2010 Equity Incentive Plan† (Incorporated by reference to Exhibit 10.21 to the Registration Statement on Form S-11/A filed with the SEC on August 16, 2013) |
|
|
|
|
|
10.40 |
|
Form of Class O Unit Award Agreement (Time-Based Vesting) under QualityTech, LP 2010 Equity Incentive Plan† (Incorporated by reference to Exhibit 10.22 to the Registration Statement on Form S-11/A filed with the SEC on August 16, 2013) |
|
|
|
|
|
10.41 |
|
Form of Class O Unit Award Agreement (Performance-Based Vesting) under QualityTech, LP 2010 Equity Incentive Plan† (Incorporated by reference to Exhibit 10.23 to the Registration Statement on Form S-11/A filed with the SEC on August 16, 2013) |
|
|
|
|
|
10.42 |
|
Form of Class O Unit Award Agreement under QualityTech, LP 2010 Equity Incentive Plan† (Incorporated by reference to Exhibit 10.24 to the Registration Statement on Form S-11/A filed with the SEC on August 16, 2013) |
|
|
|
|
|
10.43 |
|
Form of Class RS Unit Award Agreement (Time-Based Vesting) under QualityTech, LP 2010 Equity Incentive Plan† (Incorporated by reference to Exhibit 10.25 to the Registration Statement on Form S-11/A filed with the SEC on August 16, 2013) |
|
|
|
|
|
10.44 |
|
Form of Class RS Unit Award Agreement (Performance-Based Vesting) under QualityTech, LP 2010 Equity Incentive Plan† (Incorporated by reference to Exhibit 10.26 to the Registration Statement on Form S-11/A filed with the SEC on August 16, 2013) |
|
|
|
|
|
10.45 |
|
QTS Realty Trust, Inc. 2013 Equity Incentive Plan† (Incorporated by reference to Exhibit 10.39 to the Registration Statement on Form S-11/A filed with the SEC on September 26, 2013) |
|
|
|
|
|
10.46 |
|
Amendment No. 1 to QTS Realty Trust, Inc. 2013 Equity Incentive Plan (Incorporated by reference to Exhibit 10.40 to the Annual Report on Form 10-K for the year ended December 31, 2014 filed with the SEC on February 23, 2015)† |
|
|
|
|
|
10.47 |
|
Amendment No. 2 to QTS Realty Trust, Inc. 2013 Equity Incentive Plan (Incorporated by reference to Exhibit 10.1 to the Current Report on Form 8-K filed with the SEC on May 6, 2015)† |
|
|
|
|
|
10.48 |
|
Form of Restricted Shares Agreement under QTS Realty Trust, Inc. 2013 Equity Incentive Plan† (Incorporated by reference to Exhibit 10.1 to the Current Report on Form 8-K filed with the SEC on November 6, 2013) |
|
|
|
|
|
10.49 |
|
Form of Non-Qualified Option Agreement under QTS Realty Trust, Inc. 2013 Equity Incentive Plan† (Incorporated by reference to Exhibit 10.29 to the Registration Statement on Form S-11/A filed with the SEC on August 16, 2013) |
|
|
|
|
|
10.50 |
|
Employee Stock Purchase Plan, effective July 1, 2015 (Incorporated by reference to Exhibit 99.1 to the Registration Statement on Form S-8 filed with the SEC on June 17, 2015) |
|
|
|
|
|
10.51 |
|
Fifth Amended and Restated Credit Agreement dated as of December 20, 2016 by and among QualityTech, LP, as borrower, KeyBank National Association, as agent, the lenders party thereto, KeyBanc Capital Markets, Inc., Merrill Lynch, Pierce, Fenner & Smith Incorporated and TD Securities (USA) LLC, as joint lead arrangers and joint bookrunners, and Bank of America, N.A. and TD Securities (USA) LLC, as co-syndication agents (Incorporated by reference to Exhibit 10.1 to the Current Report on Form 8-K filed with the SEC on December 22, 2016) |
|
|
|
|
|
10.52 |
|
Third Amended and Restated Unconditional Guaranty of Payment and Performance dated as of December 20, 2016 by QTS Realty Trust, Inc. (to KeyBank National Association) (Incorporated by reference to Exhibit 10.2 to the Current Report on Form 8-K filed with the SEC on December 22, 2016) |
|
|
|
|
100
|
10.53 |
|
Ground Lease, dated October 2, 1997, by and between Mission-West Valley Land Corporation, as landlord, and Nexus Properties, Inc., Kinetic Systems, Inc., Digital Square, Inc., R. Darrell Gary, Michael J. Reidy and Michael J. Reidy as trustee of the Ronald Bonaguidi irrevocable trust, together as tenants (Incorporated by reference to Exhibit 10.33 to the Registration Statement on Form S-11/A filed with the SEC on August 16, 2013) |
|
|
|
|
|
10.54 |
|
First Amendment to Ground Lease, dated April 29, 1998, by and between Mission-West Valley Land Corporation, as landlord, and Nexus Properties, Inc., Kinetic Systems, Inc., R. Darrell Gary, Michael J. Reidy and Michael J. Reidy as trustee of the Ronald Bonaguidi irrevocable trust, together as tenants (Incorporated by reference to Exhibit 10.34 to the Registration Statement on Form S-11/A filed with the SEC on August 16, 2013) |
|
|
|
|
|
10.55 |
|
Second Amendment to Ground Lease, dated September 24, 2009, by and between Mission-West Valley Land Corporation, as landlord, and Quality Investment Properties Santa Clara, LLC, Chad L. Williams (Incorporated by reference to Exhibit 10.35 to the Registration Statement on Form S-11/A filed with the SEC on August 16, 2013) |
|
|
|
|
|
10.56 |
|
Third Amendment to Ground Lease, dated November 17, 2011, by and between Mission-West Valley Land Corporation, as landlord, and Quality Investment Properties Santa Clara, LLC, Chad L. Williams (Incorporated by reference to Exhibit 10.36 to the Registration Statement on Form S-11/A filed with the SEC on August 16, 2013) |
|
|
|
|
|
10.57 |
|
Lease Agreement, dated January 1, 2009, by and between Quality Investment Properties-Williams Center, L.L.C. and Quality Technology Services Lenexa, LLC (Incorporated by reference to Exhibit 10.38 to the Registration Statement on Form S-11/A filed with the SEC on August 16, 2013) |
|
|
|
|
|
10.58 |
|
First Amendment to Lease, dated March 1, 2013, by and between Quality Investment Properties-Williams Center, L.L.C. and Quality Technology Services Lenexa, LLC (Incorporated by reference to Exhibit 10.39 to the Registration Statement on Form S-11/A filed with the SEC on August 16, 2013) |
|
|
|
|
|
10.59 |
|
Second Amendment to Lease, dated December 1, 2013, by and between Quality Investment Properties-Williams Center, L.L.C. and Quality Technology Services Lenexa, LLC (Incorporated by reference to Exhibit 10.1 to the Quarterly Report on Form 10-Q filed with the SEC on May 7, 2014) |
|
|
|
|
|
10.60 |
|
Third Amendment to Lease, dated May 1, 2014, by and between Quality Investment Properties-Williams Center, L.L.C. and Quality Technology Services Lenexa, LLC (Incorporated by reference to Exhibit 10.2 to the Quarterly Report on Form 10-Q filed with the SEC on May 7, 2014) |
|
|
|
|
|
10.61 |
|
Contract of Sale by and between Quality Investment Properties East Windsor, LLC and McGraw Hill Financial, Inc. dated as of June 30, 2014 (Incorporated by reference to Exhibit 10.1 to the Current Report on Form 8-K filed with the SEC on July 3, 2014) |
|
|
|
|
|
12.1 |
|
Statement regarding Computation of Ratio of Earnings to Fixed Charges |
|
|
|
|
|
21.1 |
|
List of Subsidiaries of QTS Realty Trust, Inc. and QualityTech, LP |
|
|
|
|
|
23.1 |
|
Consent of Ernst & Young, LLP |
|
|
|
|
|
31.1 |
|
Certification of Chief Executive Officer pursuant to Rule 13a-14(a)/15d-14(a) of the Securities Exchange Act of 1934, as amended, as adopted pursuant to Section 302 of the Sarbanes-Oxley Act of 2002 (QTS Realty Trust, Inc.) |
|
|
|
|
101
|
31.2 |
|
Certification of Chief Financial Officer pursuant to Rule 13a-14(a)/15d-14(a) of the Securities Exchange Act of 1934, as amended, as adopted pursuant to Section 302 of the Sarbanes-Oxley Act of 2002 (QTS Realty Trust, Inc.) |
|
|
|
|
|
31.3 |
|
Certification of Chief Executive Officer pursuant to Rule 13a-14(a)/15d-14(a) of the Securities Exchange Act of 1934, as amended, as adopted pursuant to Section 302 of the Sarbanes-Oxley Act of 2002 (QualityTech, LP) |
|
|
|
|
|
31.4 |
|
Certification of Chief Financial Officer pursuant to Rule 13a-14(a)/15d-14(a) of the Securities Exchange Act of 1934, as amended, as adopted pursuant to Section 302 of the Sarbanes-Oxley Act of 2002 (QualityTech, LP) |
|
|
|
|
|
32.1 |
|
Certification of Chief Executive Officer and Chief Financial Officer pursuant to 18 U.S.C. 1350, as adopted pursuant to Section 906 of the Sarbanes-Oxley Act of 2002 (QTS Realty Trust, Inc.) |
|
|
|
|
|
32.2 |
|
Certification of Chief Executive Officer and Chief Financial Officer pursuant to 18 U.S.C. 1350, as adopted pursuant to Section 906 of the Sarbanes-Oxley Act of 2002 (QualityTech, LP) |
|
|
|
|
|
101 |
|
The following materials from QTS Realty Trust, Inc.’s and QualityTech, LP’s Annual Report on Form 10-K for the year ended December 31, 2016, formatted in XBRL (eXtensible Business Reporting Language): (i) consolidated balance sheets, (ii) consolidated statements of operations and comprehensive income, (iii) consolidated statements of equity and partners’ capital, (iv) consolidated statements of cash flows, and (v) the notes to the consolidated financial statements |
†Denotes a management contract or compensatory plan, contract or arrangement.
102
ITEM 8. FINANCIAL STATEMENTS AND SUPPLEMENTARY DATA
INDEX TO THE CONSOLIDATED FINANCIAL STATEMENTS
Consolidated Financial Statements of QTS Realty Trust, Inc. and QualityTech, LP
|
|
Page |
|
|
|
|
F-2 |
|
|
Consolidated Financial Statements of QTS Realty Trust, Inc.: |
|
|
Consolidated Balance Sheets as of December 31, 2016 and 2015 |
F-5 |
|
F-6 |
|
|
Consolidated Statements of Equity for the years ended December 31, 2016, 2015 and 2014 |
F-7 |
|
Consolidated Statements of Cash Flows for the years ended December 31, 2016, 2015 and 2014 |
F-8 |
|
Consolidated Financial Statements of QualityTech, LP: |
|
|
Consolidated Balance Sheets as of December 31, 2016 and 2015 |
F-10 |
|
F-11 |
|
|
Consolidated Statements of Partners’ Capital for the years ended December 31, 2016, 2015 and 2014 |
F-12 |
|
Consolidated Statements of Cash Flows for the years ended December 31, 2016, 2015 and 2014 |
F-13 |
|
Notes to QTS Realty Trust, Inc. and QualityTech, LP Consolidated Financial Statements |
F-15 |
|
Supplemental Schedule—Schedule II—Valuation and Qualifying Accounts |
F-40 |
|
Supplemental Schedule—Schedule III—Real Estate and Accumulated Depreciation |
F-41 |
F-1
REPORT OF INDEPENDENT REGISTERED PUBLIC ACCOUNTING FIRM
The Board of Directors and Shareholders of QTS Realty Trust, Inc.
We have audited the accompanying consolidated balance sheets of QTS Realty Trust, Inc. as of December 31, 2016 and 2015, and the related consolidated statements of operations and comprehensive income, equity, and cash flows for each of the three years in the period ended December 31, 2016. Our audits also included the financial statement schedules listed in the Index at Item 15(2). These financial statements and financial statement schedules are the responsibility of the Company’s management. Our responsibility is to express an opinion on these consolidated financial statements and financial statement schedule based on our audits.
We conducted our audits in accordance with the standards of the Public Company Accounting Oversight Board (United States). Those standards require that we plan and perform the audit to obtain reasonable assurance about whether the financial statements are free of material misstatement. An audit also includes examining, on a test basis, evidence supporting the amounts and disclosures in the financial statements, assessing the accounting principles used and significant estimates made by management, and evaluating the overall financial statement presentation. We believe that our audits provide a reasonable basis for our opinion.
In our opinion, the financial statements referred to above present fairly, in all material respects, the consolidated financial position of QTS Realty Trust, Inc. as of December 31, 2016 and 2015, and the consolidated results of its operations and its cash flows for each of the three years in the period ended December 31, 2016, in conformity with U.S. generally accepted accounting principles. Also in our opinion, the related financial statement schedules, when considered in relation to the basic financial statements taken as a whole, presents fairly in all material respects, the information set forth therein.
We also have audited, in accordance with the standards of the Public Company Accounting Oversight Board (United States), QTS Realty Trust, Inc.'s internal control over financial reporting as of December 31, 2016, based on criteria established in Internal Control-Integrated Framework issued by the Committee of Sponsoring Organizations of the Treadway Commission (2013 framework) and our report dated March 1, 2017 expressed an unqualified opinion thereon.
/s/ Ernst and Young, LLP
Kansas City, MO
March 1, 2017
F-2
REPORT OF INDEPENDENT REGISTERED PUBLIC ACCOUNTING FIRM
The Board of Directors and Shareholders of QTS Realty Trust, Inc.
We have audited QTS Realty Trust, Inc.’s (the "Company") internal control over financial reporting as of December 31, 2016, based on criteria established in Internal Control—Integrated Framework issued by the Committee of Sponsoring Organizations of the Treadway Commission (2013 framework) (the COSO criteria). QTS Realty Trust, Inc.'s management is responsible for maintaining effective internal control over financial reporting, and for its assessment of the effectiveness of internal control over financial reporting included in the accompanying Management Report on Assessment of Internal Control Over Financial Reporting. Our responsibility is to express an opinion on the company's internal control over financial reporting based on our audit.
We conducted our audit in accordance with the standards of the Public Company Accounting Oversight Board (United States). Those standards require that we plan and perform the audit to obtain reasonable assurance about whether effective internal control over financial reporting was maintained in all material respects. Our audit included obtaining an understanding of internal control over financial reporting, assessing the risk that a material weakness exists, testing and evaluating the design and operating effectiveness of internal control based on the assessed risk, and performing such other procedures as we considered necessary in the circumstances. We believe that our audit provides a reasonable basis for our opinion.
A company's internal control over financial reporting is a process designed to provide reasonable assurance regarding the reliability of financial reporting and the preparation of financial statements for external purposes in accordance with generally accepted accounting principles. A company's internal control over financial reporting includes those policies and procedures that (1) pertain to the maintenance of records that, in reasonable detail, accurately and fairly reflect the transactions and dispositions of the assets of the company; (2) provide reasonable assurance that transactions are recorded as necessary to permit preparation of financial statements in accordance with generally accepted accounting principles, and that receipts and expenditures of the company are being made only in accordance with authorizations of management and directors of the company; and (3) provide reasonable assurance regarding prevention or timely detection of unauthorized acquisition, use, or disposition of the company's assets that could have a material effect on the financial statements.
Because of its inherent limitations, internal control over financial reporting may not prevent or detect misstatements. Also, projections of any evaluation of effectiveness to future periods are subject to the risk that controls may become inadequate because of changes in conditions, or that the degree of compliance with the policies or procedures may deteriorate.
In our opinion, QTS Realty Trust, Inc. maintained, in all material respects, effective internal control over financial reporting as of December 31, 2016, based on the COSO criteria.
We also have audited, in accordance with the standards of the Public Company Accounting Oversight Board (United States), the 2016 consolidated financial statements of QTS Realty Trust, Inc. and our report dated March 1, 2017 expressed an unqualified opinion thereon.
/s/ Ernst and Young, LLP
Kansas City, MO
March 1, 2017
F-3
REPORT OF INDEPENDENT REGISTERED PUBLIC ACCOUNTING FIRM
The Board of Directors and Shareholders of QTS Realty Trust, Inc.
We have audited the accompanying consolidated balance sheets of QualityTech, LP as of December 31, 2016 and 2015, and the related consolidated statements comprehensive income, partners' capital and cash flows for each of the three years in the period ended December 31, 2016. Our audits also included the financial statement schedules listed in the Index at Item 15(2). These financial statements and schedules are the responsibility of the Company's management. Our responsibility is to express an opinion on these financial statements and schedules based on our audits.
We conducted our audits in accordance with the standards of the Public Company Accounting Oversight Board (United States). Those standards require that we plan and perform the audit to obtain reasonable assurance about whether the financial statements are free of material misstatement. An audit includes examining, on a test basis, evidence supporting the amounts and disclosures in the financial statements. An audit also includes assessing the accounting principles used and significant estimates made by management, as well as evaluating the overall financial statement presentation. We believe that our audits provide a reasonable basis for our opinion.
In our opinion, the financial statements referred to above present fairly, in all material respects, the consolidated financial position of QualityTech, LP at December 31, 2016 and 2015, and the consolidated results of its operations and its cash flows for each of the three years in the period ended December 31, 2016, in conformity with U.S. generally accepted accounting principles. Also, in our opinion, the related financial statement schedules, when considered in relation to the basic financial statements taken as a whole, present fairly in all material respects the information set forth therein.
/s/ Ernst and Young, LLP
Kansas City, MO
March 1, 2017
F-4
QTS REALTY TRUST, INC.
CONSOLIDATED FINANCIAL STATEMENTS
(in thousands except share data)
|
ASSETS |
|
December 31, 2016 |
|
December 31, 2015 |
||
|
Real Estate Assets |
|
|
|
|
|
|
|
Land |
|
$ |
74,130 |
|
$ |
57,112 |
|
Buildings and improvements |
|
|
1,524,767 |
|
|
1,180,386 |
|
Less: Accumulated depreciation |
|
|
(317,834) |
|
|
(239,936) |
|
|
|
|
1,281,063 |
|
|
997,562 |
|
Construction in progress |
|
|
365,960 |
|
|
345,655 |
|
Real Estate Assets, net |
|
|
1,647,023 |
|
|
1,343,217 |
|
Cash and cash equivalents |
|
|
9,580 |
|
|
8,804 |
|
Rents and other receivables, net |
|
|
41,540 |
|
|
28,233 |
|
Acquired intangibles, net |
|
|
129,754 |
|
|
115,702 |
|
Deferred costs, net |
|
|
38,507 |
|
|
30,042 |
|
Prepaid expenses |
|
|
6,918 |
|
|
6,502 |
|
Goodwill |
|
|
173,843 |
|
|
181,738 |
|
Other assets, net |
|
|
39,305 |
|
|
33,101 |
|
TOTAL ASSETS |
|
$ |
2,086,470 |
|
$ |
1,747,339 |
|
|
|
|
|
|
|
|
|
LIABILITIES |
|
|
|
|
|
|
|
Unsecured credit facility, net |
|
$ |
634,939 |
|
$ |
520,956 |
|
Senior notes, net of discount and debt issuance costs |
|
|
292,179 |
|
|
290,852 |
|
Capital lease and lease financing obligations |
|
|
38,708 |
|
|
49,761 |
|
Accounts payable and accrued liabilities |
|
|
86,129 |
|
|
95,924 |
|
Dividends and distributions payable |
|
|
19,634 |
|
|
15,378 |
|
Advance rents, security deposits and other liabilities |
|
|
24,893 |
|
|
18,798 |
|
Deferred income taxes |
|
|
15,185 |
|
|
18,813 |
|
Deferred income |
|
|
21,993 |
|
|
16,991 |
|
TOTAL LIABILITIES |
|
|
1,133,660 |
|
|
1,027,473 |
|
EQUITY |
|
|
|
|
|
|
|
Common stock, $0.01 par value, 450,133,000 shares authorized, 47,831,250 and 41,225,784 issued and outstanding as of December 31, 2016 and 2015, respectively |
|
|
478 |
|
|
412 |
|
Additional paid-in capital |
|
|
931,783 |
|
|
670,275 |
|
Accumulated dividends in excess of earnings |
|
|
(97,793) |
|
|
(52,732) |
|
Total stockholders’ equity |
|
|
834,468 |
|
|
617,955 |
|
Noncontrolling interests |
|
|
118,342 |
|
|
101,911 |
|
TOTAL EQUITY |
|
|
952,810 |
|
|
719,866 |
|
TOTAL LIABILITIES AND EQUITY |
|
$ |
2,086,470 |
|
$ |
1,747,339 |
See accompanying notes to financial statements.
F-5
QTS REALTY TRUST, INC.
CONSOLIDATED FINANCIAL STATEMENTS
STATEMENTS OF OPERATIONS AND COMPREHENSIVE INCOME
(in thousands except share and per share data)
|
|
|
The Company |
|||||||
|
|
|
|
|
|
|
|
|
|
|
|
|
|
Year Ended December 31, |
|||||||
|
Revenues: |
|
2016 |
|
2015 |
|
2014 |
|||
|
Rental |
|
$ |
295,723 |
|
$ |
230,510 |
|
$ |
175,649 |
|
Recoveries from customers |
|
|
29,271 |
|
|
22,581 |
|
|
19,194 |
|
Cloud and managed services |
|
|
68,488 |
|
|
51,994 |
|
|
20,231 |
|
Other |
|
|
8,881 |
|
|
5,998 |
|
|
2,715 |
|
Total revenues |
|
|
402,363 |
|
|
311,083 |
|
|
217,789 |
|
Operating Expenses: |
|
|
|
|
|
|
|
|
|
|
Property operating costs |
|
|
136,488 |
|
|
104,355 |
|
|
71,518 |
|
Real estate taxes and insurance |
|
|
8,840 |
|
|
5,869 |
|
|
5,116 |
|
Depreciation and amortization |
|
|
124,786 |
|
|
85,811 |
|
|
58,282 |
|
General and administrative |
|
|
83,286 |
|
|
67,783 |
|
|
45,283 |
|
Restructuring |
|
|
— |
|
|
— |
|
|
1,298 |
|
Transaction and integration costs |
|
|
10,906 |
|
|
11,282 |
|
|
1,018 |
|
Total operating expenses |
|
|
364,306 |
|
|
275,100 |
|
|
182,515 |
|
Operating income |
|
|
38,057 |
|
|
35,983 |
|
|
35,274 |
|
|
|
|
|
|
|
|
|
|
|
|
Other income and expenses: |
|
|
|
|
|
|
|
|
|
|
Interest income |
|
|
3 |
|
|
2 |
|
|
8 |
|
Interest expense |
|
|
(23,159) |
|
|
(21,289) |
|
|
(15,308) |
|
Other expense, net |
|
|
(192) |
|
|
(468) |
|
|
(871) |
|
Income before taxes and loss on sale of real estate |
|
|
14,709 |
|
|
14,228 |
|
|
19,103 |
|
Tax benefit of taxable REIT subsidiaries |
|
|
9,976 |
|
|
10,065 |
|
|
— |
|
Loss on sale of real estate |
|
|
— |
|
|
(164) |
|
|
— |
|
Net income |
|
|
24,685 |
|
|
24,129 |
|
|
19,103 |
|
Net income attributable to noncontrolling interests |
|
|
(3,160) |
|
|
(3,803) |
|
|
(4,031) |
|
Net income attributable to QTS Realty Trust, Inc. |
|
$ |
21,525 |
|
$ |
20,326 |
|
$ |
15,072 |
|
|
|
|
|
|
|
|
|
|
|
|
Net income per share attributable to common shares: |
|
|
|
|
|
|
|
|
|
|
Basic |
|
$ |
0.47 |
|
$ |
0.54 |
|
$ |
0.52 |
|
Diluted |
|
|
0.46 |
|
|
0.53 |
|
|
0.51 |
|
|
|
|
|
|
|
|
|
|
|
|
Weighted average common shares outstanding: |
|
|
|
|
|
|
|
|
|
|
Basic |
|
|
46,205,937 |
|
|
37,568,109 |
|
|
29,054,576 |
|
Diluted |
|
|
53,962,234 |
|
|
45,353,170 |
|
|
37,133,584 |
See accompanying notes to financial statements.
F-6
QTS REALTY TRUST, INC.
CONSOLIDATED FINANCIAL STATEMENTS
CONSOLIDATED STATEMENTS OF EQUITY
(in thousands)
|
|
|
|
|
|
|
|
|
|
|
Accumulated |
|
Accumulated |
|
Total |
|
|
|
|
|
|
|||
|
|
|
Common stock |
|
Additional |
|
other comprehensive |
|
dividends in |
|
stockholders' |
|
Noncontrolling |
|
|
|
||||||||
|
|
|
Shares |
|
Amount |
|
paid-in capital |
|
income (loss) |
|
excess of earnings |
|
equity |
|
interest |
|
Total |
|||||||
|
Balance January 1, 2014 |
|
28,973 |
|
$ |
289 |
|
$ |
318,834 |
|
$ |
(357) |
|
$ |
(3,799) |
|
$ |
314,967 |
|
$ |
84,737 |
|
$ |
399,704 |
|
Issuance of shares through equity award plan |
|
165 |
|
|
5 |
|
|
(5) |
|
|
— |
|
|
— |
|
|
— |
|
|
— |
|
|
— |
|
Reclassification of noncontrolling interest upon conversion of partnership units to common stock |
|
270 |
|
|
— |
|
|
2,811 |
|
|
— |
|
|
— |
|
|
2,811 |
|
|
(2,811) |
|
|
— |
|
Equity-based compensation expense |
|
— |
|
|
— |
|
|
3,277 |
|
|
— |
|
|
— |
|
|
3,277 |
|
|
876 |
|
|
4,153 |
|
Other comprehensive gain |
|
— |
|
|
— |
|
|
— |
|
|
357 |
|
|
— |
|
|
357 |
|
|
96 |
|
|
453 |
|
Dividend to shareholders |
|
— |
|
|
— |
|
|
— |
|
|
— |
|
|
(33,776) |
|
|
(33,776) |
|
|
— |
|
|
(33,776) |
|
Distribution to noncontrolling interest |
|
— |
|
|
— |
|
|
— |
|
|
— |
|
|
— |
|
|
— |
|
|
(9,452) |
|
|
(9,452) |
|
Net income |
|
— |
|
|
— |
|
|
— |
|
|
— |
|
|
15,072 |
|
|
15,072 |
|
|
4,031 |
|
|
19,103 |
|
Balance December 31, 2014 |
|
29,408 |
|
$ |
294 |
|
$ |
324,917 |
|
$ |
— |
|
$ |
(22,503) |
|
$ |
302,708 |
|
$ |
77,477 |
|
$ |
380,185 |
|
|
|
|
|
|
|
|
|
|
|
|
|
|
|
|
|
|
|
|
|
|
|
|
|
|
Issuance of shares through equity award plan |
|
338 |
|
|
3 |
|
|
(3) |
|
|
— |
|
|
— |
|
|
— |
|
|
(644) |
|
|
(644) |
|
Reclassification of noncontrolling interest upon conversion of partnership units to common stock |
|
730 |
|
|
7 |
|
|
9,239 |
|
|
— |
|
|
— |
|
|
9,246 |
|
|
(9,246) |
|
|
— |
|
Equity-based compensation expense |
|
— |
|
|
— |
|
|
5,866 |
|
|
— |
|
|
— |
|
|
5,866 |
|
|
1,098 |
|
|
6,964 |
|
Net proceeds from equity offering |
|
10,750 |
|
|
108 |
|
|
330,256 |
|
|
— |
|
|
— |
|
|
330,364 |
|
|
38,300 |
|
|
368,664 |
|
Dividend to shareholders |
|
— |
|
|
— |
|
|
— |
|
|
— |
|
|
(50,555) |
|
|
(50,555) |
|
|
— |
|
|
(50,555) |
|
Distribution to noncontrolling interests |
|
— |
|
|
— |
|
|
— |
|
|
— |
|
|
— |
|
|
— |
|
|
(8,877) |
|
|
(8,877) |
|
Net income |
|
— |
|
|
— |
|
|
— |
|
|
— |
|
|
20,326 |
|
|
20,326 |
|
|
3,803 |
|
|
24,129 |
|
Balance December 31, 2015 |
|
41,226 |
|
$ |
412 |
|
$ |
670,275 |
|
$ |
— |
|
$ |
(52,732) |
|
$ |
617,955 |
|
$ |
101,911 |
|
$ |
719,866 |
|
|
|
|
|
|
|
|
|
|
|
|
|
|
|
|
|
|
|
|
|
|
|
|
|
|
Net share activity through equity award plan |
|
280 |
|
|
3 |
|
|
(3) |
|
|
— |
|
|
— |
|
|
— |
|
|
(1,726) |
|
|
(1,726) |
|
Equity-based compensation expense |
|
— |
|
|
— |
|
|
9,229 |
|
|
— |
|
|
— |
|
|
9,229 |
|
|
1,355 |
|
|
10,584 |
|
Net proceeds from equity offering |
|
6,325 |
|
|
63 |
|
|
252,282 |
|
|
— |
|
|
— |
|
|
252,345 |
|
|
23,517 |
|
|
275,862 |
|
Dividends to shareholders |
|
— |
|
|
— |
|
|
— |
|
|
— |
|
|
(66,586) |
|
|
(66,586) |
|
|
— |
|
|
(66,586) |
|
Distributions to noncontrolling interests |
|
— |
|
|
— |
|
|
— |
|
|
— |
|
|
— |
|
|
— |
|
|
(9,875) |
|
|
(9,875) |
|
Net income |
|
— |
|
|
— |
|
|
— |
|
|
— |
|
|
21,525 |
|
|
21,525 |
|
|
3,160 |
|
|
24,685 |
|
Balance December 31, 2016 |
|
47,831 |
|
$ |
478 |
|
$ |
931,783 |
|
$ |
— |
|
$ |
(97,793) |
|
$ |
834,468 |
|
$ |
118,342 |
|
$ |
952,810 |
See accompanying notes to financial statements.
F-7
QTS REALTY TRUST, INC.
CONSOLIDATED FINANCIAL STATEMENTS
(in thousands)
|
|
|
Year Ended December 31, |
|||||||
|
Cash flow from operating activities: |
|
2016 |
|
2015 |
|
2014 |
|||
|
Net income (loss) |
|
$ |
24,685 |
|
$ |
24,129 |
|
$ |
19,103 |
|
Adjustments to reconcile net income (loss) to net cash provided by operating activities: |
|
|
|
|
|
|
|
|
|
|
Depreciation and amortization |
|
|
121,464 |
|
|
83,488 |
|
|
55,327 |
|
Amortization of deferred loan costs |
|
|
3,285 |
|
|
3,181 |
|
|
2,673 |
|
Amortization of senior notes discount |
|
|
261 |
|
|
247 |
|
|
98 |
|
Equity-based compensation expense |
|
|
10,584 |
|
|
6,964 |
|
|
4,153 |
|
Bad debt expense |
|
|
1,752 |
|
|
1,323 |
|
|
600 |
|
Write off of deferred loan costs |
|
|
224 |
|
|
468 |
|
|
870 |
|
Deferred tax benefit |
|
|
(10,171) |
|
|
(10,065) |
|
|
— |
|
Loss on sale of property |
|
|
— |
|
|
164 |
|
|
— |
|
Non-cash integration costs |
|
|
1,927 |
|
|
3,117 |
|
|
— |
|
Changes in operating assets and liabilities |
|
|
|
|
|
|
|
|
|
|
Rents and other receivables, net |
|
|
(17,101) |
|
|
(1,138) |
|
|
(1,745) |
|
Prepaid expenses |
|
|
158 |
|
|
(2,182) |
|
|
(1,266) |
|
Other assets |
|
|
(561) |
|
|
(5,016) |
|
|
(73) |
|
Accounts payable and accrued liabilities |
|
|
6,290 |
|
|
8,938 |
|
|
(8,663) |
|
Advance rents, security deposits and other liabilities |
|
|
5,959 |
|
|
(763) |
|
|
41 |
|
Deferred income |
|
|
5,038 |
|
|
(3,597) |
|
|
2,639 |
|
Net cash provided by operating activities |
|
|
153,794 |
|
|
109,258 |
|
|
73,757 |
|
Cash flow from investing activities: |
|
|
|
|
|
|
|
|
|
|
Proceeds from sale of property |
|
|
— |
|
|
648 |
|
|
— |
|
Acquisitions, net of cash acquired |
|
|
(173,067) |
|
|
(292,685) |
|
|
(91,064) |
|
Additions to property and equipment |
|
|
(279,905) |
|
|
(320,058) |
|
|
(201,145) |
|
Net cash used in investing activities |
|
|
(452,972) |
|
|
(612,095) |
|
|
(292,209) |
|
Cash flow from financing activities: |
|
|
|
|
|
|
|
|
|
|
Credit facility proceeds |
|
|
574,000 |
|
|
671,162 |
|
|
270,500 |
|
Senior Notes proceeds |
|
|
— |
|
|
— |
|
|
297,633 |
|
Credit facility repayments |
|
|
(459,002) |
|
|
(386,998) |
|
|
(290,000) |
|
Payment of deferred financing costs |
|
|
(4,177) |
|
|
(3,649) |
|
|
(9,864) |
|
Payment of cash dividends |
|
|
(62,585) |
|
|
(45,892) |
|
|
(32,198) |
|
Distribution to noncontrolling interests |
|
|
(9,619) |
|
|
(8,865) |
|
|
(9,049) |
|
Payments to net settle equity awards |
|
|
(1,726) |
|
|
— |
|
|
— |
|
Principal payments on capital lease obligations |
|
|
(12,600) |
|
|
(7,677) |
|
|
(753) |
|
Mortgage principal debt repayments |
|
|
— |
|
|
(86,600) |
|
|
(2,239) |
|
Equity proceeds, net of costs |
|
|
275,663 |
|
|
369,372 |
|
|
— |
|
Net cash provided by financing activities |
|
|
299,954 |
|
|
500,853 |
|
|
224,030 |
|
|
|
|
|
|
|
|
|
|
|
|
Net (decrease) increase in cash and cash equivalents |
|
|
776 |
|
|
(1,984) |
|
|
5,578 |
|
Cash and cash equivalents, beginning of period |
|
|
8,804 |
|
|
10,788 |
|
|
5,210 |
|
Cash and cash equivalents, end of period |
|
$ |
9,580 |
|
$ |
8,804 |
|
$ |
10,788 |
See accompanying notes to financial statements.
F-8
QTS REALTY TRUST, INC.
CONSOLIDATED FINANCIAL STATEMENTS
STATEMENTS OF CASH FLOW (continued)
(in thousands)
|
|
|
Year Ended December 31, |
|||||||
|
|
|
2016 |
|
2015 |
|
2014 |
|||
|
SUPPLEMENTAL DISCLOSURES OF CASH FLOW INFORMATION |
|
|
|
|
|
|
|
|
|
|
Cash paid for interest (excluding deferred financing costs and amounts capitalized) |
|
$ |
19,897 |
|
$ |
18,027 |
|
$ |
4,950 |
|
Noncash investing and financing activities: |
|
|
|
|
|
|
|
|
|
|
Accrued capital additions |
|
$ |
40,431 |
|
$ |
52,552 |
|
$ |
39,129 |
|
Accrued deferred financing costs |
|
$ |
39 |
|
$ |
1 |
|
$ |
2,858 |
|
Accrued equity issuance costs |
|
$ |
— |
|
$ |
57 |
|
$ |
— |
|
Capital lease and lease financing obligations assumed |
|
$ |
— |
|
$ |
43,832 |
|
$ |
— |
|
|
|
|
|
|
|
|
|
|
|
|
Acquisitions, net of cash acquired: |
|
|
|
|
|
|
|
|
|
|
Land |
|
$ |
7,602 |
|
$ |
3,030 |
|
$ |
17,976 |
|
Buildings, improvements and equipment |
|
|
80,975 |
|
|
80,818 |
|
|
35,865 |
|
Construction in Progress |
|
|
62,884 |
|
|
12,127 |
|
|
17,764 |
|
Rents and other receivables, net |
|
|
(2,042) |
|
|
13,704 |
|
|
— |
|
Acquired intangibles |
|
|
34,521 |
|
|
93,400 |
|
|
16,114 |
|
Deferred costs |
|
|
4,414 |
|
|
— |
|
|
3,345 |
|
Prepaid expenses |
|
|
574 |
|
|
1,653 |
|
|
— |
|
Goodwill |
|
|
(7,895) |
|
|
174,697 |
|
|
— |
|
Other assets |
|
|
309 |
|
|
633 |
|
|
— |
|
Capital lease and lease financing obligations |
|
|
— |
|
|
(43,832) |
|
|
— |
|
Accounts payable and accrued liabilities |
|
|
(922) |
|
|
(8,586) |
|
|
— |
|
Advance rents, security deposits and other liabilities |
|
|
(1,343) |
|
|
(2,468) |
|
|
— |
|
Deferred income |
|
|
35 |
|
|
(10,818) |
|
|
— |
|
Deferred income taxes |
|
|
(6,045) |
|
|
(21,673) |
|
|
— |
|
Total acquisitions, net of cash acquired |
|
$ |
173,067 |
|
$ |
292,685 |
|
$ |
91,064 |
See accompanying notes to financial statements.
F-9
QUALITYTECH, LP
CONSOLIDATED FINANCIAL STATEMENTS
(in thousands except share data)
|
ASSETS |
|
December 31, 2016 |
|
December 31, 2015 |
||
|
Real Estate Assets |
|
|
|
|
|
|
|
Land |
|
$ |
74,130 |
|
$ |
57,112 |
|
Buildings and improvements |
|
|
1,524,767 |
|
|
1,180,386 |
|
Less: Accumulated depreciation |
|
|
(317,834) |
|
|
(239,936) |
|
|
|
|
1,281,063 |
|
|
997,562 |
|
Construction in progress |
|
|
365,960 |
|
|
345,655 |
|
Real Estate Assets, net |
|
|
1,647,023 |
|
|
1,343,217 |
|
Cash and cash equivalents |
|
|
9,580 |
|
|
8,804 |
|
Rents and other receivables, net |
|
|
41,540 |
|
|
28,233 |
|
Acquired intangibles, net |
|
|
129,754 |
|
|
115,702 |
|
Deferred costs, net |
|
|
38,507 |
|
|
30,042 |
|
Prepaid expenses |
|
|
6,918 |
|
|
6,502 |
|
Goodwill |
|
|
173,843 |
|
|
181,738 |
|
Other assets, net |
|
|
39,305 |
|
|
33,101 |
|
TOTAL ASSETS |
|
$ |
2,086,470 |
|
$ |
1,747,339 |
|
|
|
|
|
|
|
|
|
LIABILITIES |
|
|
|
|
|
|
|
Unsecured credit facility, net |
|
|
634,939 |
|
|
520,956 |
|
Senior notes, net of discount and debt issuance costs |
|
|
292,179 |
|
|
290,852 |
|
Capital lease and lease financing obligations |
|
|
38,708 |
|
|
49,761 |
|
Accounts payable and accrued liabilities |
|
|
86,129 |
|
|
95,924 |
|
Dividends and distributions payable |
|
|
19,634 |
|
|
15,378 |
|
Advance rents, security deposits and other liabilities |
|
|
24,893 |
|
|
18,798 |
|
Deferred income taxes |
|
|
15,185 |
|
|
18,813 |
|
Deferred income |
|
|
21,993 |
|
|
16,991 |
|
TOTAL LIABILITIES |
|
|
1,133,660 |
|
|
1,027,473 |
|
PARTNERS' CAPITAL |
|
|
|
|
|
|
|
Partners' capital |
|
|
952,810 |
|
|
719,866 |
|
TOTAL LIABILITIES AND PARTNERS' CAPITAL |
|
$ |
2,086,470 |
|
$ |
1,747,339 |
See accompanying notes to financial statements.
F-10
QUALITYTECH, LP
CONSOLIDATED FINANCIAL STATEMENTS
STATEMENTS OF OPERATIONS AND COMPREHENSIVE INCOME
(in thousands except share and per share data)
|
|
|
Year Ended December 31, |
|||||||
|
Revenues: |
|
2016 |
|
2015 |
|
2014 |
|||
|
Rental |
|
$ |
295,723 |
|
$ |
230,510 |
|
$ |
175,649 |
|
Recoveries from customers |
|
|
29,271 |
|
|
22,581 |
|
|
19,194 |
|
Cloud and managed services |
|
|
68,488 |
|
|
51,994 |
|
|
20,231 |
|
Other |
|
|
8,881 |
|
|
5,998 |
|
|
2,715 |
|
Total revenues |
|
|
402,363 |
|
|
311,083 |
|
|
217,789 |
|
Operating Expenses: |
|
|
|
|
|
|
|
|
|
|
Property operating costs |
|
|
136,488 |
|
|
104,355 |
|
|
71,518 |
|
Real estate taxes and insurance |
|
|
8,840 |
|
|
5,869 |
|
|
5,116 |
|
Depreciation and amortization |
|
|
124,786 |
|
|
85,811 |
|
|
58,282 |
|
General and administrative |
|
|
83,286 |
|
|
67,783 |
|
|
45,283 |
|
Restructuring |
|
|
— |
|
|
— |
|
|
1,298 |
|
Transaction and integration costs |
|
|
10,906 |
|
|
11,282 |
|
|
1,018 |
|
Total operating expenses |
|
|
364,306 |
|
|
275,100 |
|
|
182,515 |
|
Operating income |
|
|
38,057 |
|
|
35,983 |
|
|
35,274 |
|
|
|
|
|
|
|
|
|
|
|
|
Other income and expenses: |
|
|
|
|
|
|
|
|
|
|
Interest income |
|
|
3 |
|
|
2 |
|
|
8 |
|
Interest expense |
|
|
(23,159) |
|
|
(21,289) |
|
|
(15,308) |
|
Other expense, net |
|
|
(192) |
|
|
(468) |
|
|
(871) |
|
Income before taxes and loss on sale of real estate |
|
|
14,709 |
|
|
14,228 |
|
|
19,103 |
|
Tax benefit of taxable REIT subsidiaries |
|
|
9,976 |
|
|
10,065 |
|
|
— |
|
Loss on sale of real estate |
|
|
— |
|
|
(164) |
|
|
— |
|
Net income |
|
$ |
24,685 |
|
$ |
24,129 |
|
$ |
19,103 |
See accompanying notes to financial statements.
F-11
QUALITYTECH, LP
CONSOLIDATED FINANCIAL STATEMENTS
CONSOLIDATED STATEMENTS OF PARTNERS’ CAPITAL
(in thousands)
|
|
|
Limited Partners' Capital |
|
General Partner's Capital |
|
|
|
||||||
|
|
|
Units |
|
Amount |
|
Units |
|
Amount |
|
Total |
|||
|
Balance January 1, 2014 |
|
36,770 |
|
$ |
399,704 |
|
1 |
|
$ |
— |
|
$ |
399,704 |
|
Issuance of shares through equity award plan |
|
165 |
|
|
— |
|
— |
|
|
— |
|
|
— |
|
Equity-based compensation expense |
|
— |
|
|
4,153 |
|
— |
|
|
— |
|
|
4,153 |
|
Other comprehensive gain |
|
— |
|
|
453 |
|
— |
|
|
— |
|
|
453 |
|
Dividend to QTS Realty Trust, Inc. shareholders |
|
— |
|
|
(33,776) |
|
— |
|
|
— |
|
|
(33,776) |
|
Partnership distributions |
|
— |
|
|
(9,452) |
|
— |
|
|
— |
|
|
(9,452) |
|
Net income |
|
— |
|
|
19,103 |
|
— |
|
|
— |
|
|
19,103 |
|
Balance December 31, 2014 |
|
36,935 |
|
$ |
380,185 |
|
1 |
|
$ |
— |
|
$ |
380,185 |
|
|
|
|
|
|
|
|
|
|
|
|
|
|
|
|
Issuance of shares through equity award plan |
|
338 |
|
|
(644) |
|
— |
|
|
— |
|
|
(644) |
|
Equity-based compensation expense |
|
— |
|
|
6,964 |
|
— |
|
|
— |
|
|
6,964 |
|
Net proceeds from QTS Realty Trust, Inc. equity offering |
|
10,750 |
|
|
368,664 |
|
— |
|
|
— |
|
|
368,664 |
|
Dividend to QTS Realty Trust, Inc. |
|
— |
|
|
(50,555) |
|
— |
|
|
— |
|
|
(50,555) |
|
Partnership distributions |
|
— |
|
|
(8,877) |
|
— |
|
|
— |
|
|
(8,877) |
|
Net income |
|
— |
|
|
24,129 |
|
— |
|
|
— |
|
|
24,129 |
|
Balance December 31, 2015 |
|
48,023 |
|
$ |
719,866 |
|
1 |
|
$ |
— |
|
$ |
719,866 |
|
|
|
|
|
|
|
|
|
|
|
|
|
|
|
|
Issuance of shares through equity award plan |
|
280 |
|
|
(1,726) |
|
— |
|
|
— |
|
|
(1,726) |
|
Equity-based compensation expense |
|
— |
|
|
10,584 |
|
— |
|
|
— |
|
|
10,584 |
|
Net proceeds from QTS Realty Trust, Inc. equity offering |
|
6,325 |
|
|
275,862 |
|
— |
|
|
— |
|
|
275,862 |
|
Dividends to QTS Realty Trust, Inc. |
|
— |
|
|
(66,586) |
|
— |
|
|
— |
|
|
(66,586) |
|
Partnership distributions |
|
— |
|
|
(9,875) |
|
— |
|
|
— |
|
|
(9,875) |
|
Net income |
|
— |
|
|
24,685 |
|
— |
|
|
— |
|
|
24,685 |
|
Balance December 31, 2016 |
|
54,628 |
|
$ |
952,810 |
|
1 |
|
$ |
— |
|
$ |
952,810 |
See accompanying notes to financial statements.
F-12
QUALITYTECH, LP
CONSOLIDATED FINANCIAL STATEMENTS
(in thousands)
|
|
|
Year Ended December 31, |
|||||||
|
Cash flow from operating activities: |
|
2016 |
|
2015 |
|
2014 |
|||
|
Net income |
|
$ |
24,685 |
|
$ |
24,129 |
|
$ |
19,103 |
|
Adjustments to reconcile net income to net cash provided by operating activities: |
|
|
|
|
|
|
|
|
|
|
Depreciation and amortization |
|
|
121,464 |
|
|
83,488 |
|
|
55,327 |
|
Amortization of deferred loan costs |
|
|
3,285 |
|
|
3,181 |
|
|
2,673 |
|
Amortization of senior notes discount |
|
|
261 |
|
|
247 |
|
|
98 |
|
Equity-based compensation expense |
|
|
10,584 |
|
|
6,964 |
|
|
4,153 |
|
Bad debt expense |
|
|
1,752 |
|
|
1,323 |
|
|
600 |
|
Write off of deferred loan costs |
|
|
224 |
|
|
468 |
|
|
870 |
|
Deferred tax benefit |
|
|
(10,171) |
|
|
(10,065) |
|
|
— |
|
Loss on sale of property |
|
|
— |
|
|
164 |
|
|
— |
|
Non-cash integration costs |
|
|
1,927 |
|
|
3,117 |
|
|
— |
|
Changes in operating assets and liabilities |
|
|
|
|
|
|
|
|
|
|
Rents and other receivables, net |
|
|
(17,101) |
|
|
(1,138) |
|
|
(1,745) |
|
Accrued interest on member advances |
|
|
— |
|
|
— |
|
|
— |
|
Prepaid expenses |
|
|
158 |
|
|
(2,182) |
|
|
(1,266) |
|
Other assets |
|
|
(561) |
|
|
(5,016) |
|
|
(73) |
|
Accounts payable and accrued liabilities |
|
|
6,290 |
|
|
8,938 |
|
|
(8,663) |
|
Advance rents, security deposits and other liabilities |
|
|
5,959 |
|
|
(763) |
|
|
41 |
|
Deferred income |
|
|
5,038 |
|
|
(3,597) |
|
|
2,639 |
|
Net cash provided by operating activities |
|
|
153,794 |
|
|
109,258 |
|
|
73,757 |
|
Cash flow from investing activities: |
|
|
|
|
|
|
|
|
|
|
Proceeds from sale of property |
|
|
— |
|
|
648 |
|
|
— |
|
Acquisitions, net of cash acquired |
|
|
(173,067) |
|
|
(292,685) |
|
|
(91,064) |
|
Additions to property and equipment |
|
|
(279,905) |
|
|
(320,058) |
|
|
(201,145) |
|
Net cash used in investing activities |
|
|
(452,972) |
|
|
(612,095) |
|
|
(292,209) |
|
Cash flow from financing activities: |
|
|
|
|
|
|
|
|
|
|
Credit facility proceeds |
|
|
574,000 |
|
|
671,162 |
|
|
270,500 |
|
Senior Notes proceeds |
|
|
— |
|
|
— |
|
|
297,633 |
|
Credit facility repayments |
|
|
(459,002) |
|
|
(386,998) |
|
|
(290,000) |
|
Payment of deferred financing costs |
|
|
(4,177) |
|
|
(3,649) |
|
|
(9,864) |
|
Payment of cash dividends |
|
|
(62,585) |
|
|
(45,892) |
|
|
(32,198) |
|
Partnership distributions |
|
|
(9,619) |
|
|
(8,865) |
|
|
(9,049) |
|
Payments to net settle equity awards |
|
|
(1,726) |
|
|
— |
|
|
— |
|
Principal payments on capital lease obligations |
|
|
(12,600) |
|
|
(7,677) |
|
|
(753) |
|
Mortgage principal debt repayments |
|
|
— |
|
|
(86,600) |
|
|
(2,239) |
|
Equity proceeds, net of costs |
|
|
275,663 |
|
|
369,372 |
|
|
— |
|
Net cash provided by financing activities |
|
|
299,954 |
|
|
500,853 |
|
|
224,030 |
|
|
|
|
|
|
|
|
|
|
|
|
Net (decrease) increase in cash and cash equivalents |
|
|
776 |
|
|
(1,984) |
|
|
5,578 |
|
Cash and cash equivalents, beginning of period |
|
|
8,804 |
|
|
10,788 |
|
|
5,210 |
|
Cash and cash equivalents, end of period |
|
$ |
9,580 |
|
$ |
8,804 |
|
$ |
10,788 |
See accompanying notes to financial statements.
F-13
QUALITYTECH, LP
CONSOLIDATED FINANCIAL STATEMENTS
STATEMENTS OF CASH FLOW (continued)
(in thousands)
|
|
|
Year Ended December 31, |
|||||||
|
|
|
2016 |
|
2015 |
|
2014 |
|||
|
SUPPLEMENTAL DISCLOSURES OF CASH FLOW INFORMATION |
|
|
|
|
|
|
|
|
|
|
Cash paid for interest (excluding deferred financing costs and amounts capitalized) |
|
$ |
19,897 |
|
$ |
18,027 |
|
$ |
4,950 |
|
Noncash investing and financing activities: |
|
|
|
|
|
|
|
|
|
|
Accrued capital additions |
|
$ |
40,431 |
|
$ |
52,552 |
|
$ |
39,129 |
|
Accrued deferred financing costs |
|
$ |
39 |
|
$ |
1 |
|
$ |
2,858 |
|
Accrued equity issuance costs |
|
$ |
— |
|
$ |
57 |
|
$ |
— |
|
Capital lease and lease financing obligations assumed |
|
$ |
— |
|
$ |
43,832 |
|
$ |
— |
|
|
|
|
|
|
|
|
|
|
|
|
Acquisitions, net of cash acquired: |
|
|
|
|
|
|
|
|
|
|
Land |
|
$ |
7,602 |
|
$ |
3,030 |
|
$ |
17,976 |
|
Buildings, improvements and equipment |
|
|
80,975 |
|
|
80,818 |
|
|
35,865 |
|
Construction in Progress |
|
|
62,884 |
|
|
12,127 |
|
|
17,764 |
|
Rents and other receivables, net |
|
|
(2,042) |
|
|
13,704 |
|
|
— |
|
Acquired intangibles |
|
|
34,521 |
|
|
93,400 |
|
|
16,114 |
|
Deferred costs |
|
|
4,414 |
|
|
— |
|
|
3,345 |
|
Prepaid expenses |
|
|
574 |
|
|
1,653 |
|
|
— |
|
Goodwill |
|
|
(7,895) |
|
|
174,697 |
|
|
— |
|
Other assets |
|
|
309 |
|
|
633 |
|
|
— |
|
Capital lease and lease financing obligations |
|
|
— |
|
|
(43,832) |
|
|
— |
|
Accounts payable and accrued liabilities |
|
|
(922) |
|
|
(8,586) |
|
|
— |
|
Advance rents, security deposits and other liabilities |
|
|
(1,343) |
|
|
(2,468) |
|
|
— |
|
Deferred income |
|
|
35 |
|
|
(10,818) |
|
|
— |
|
Deferred income taxes |
|
|
(6,045) |
|
|
(21,673) |
|
|
— |
|
Total acquisitions, net of cash acquired |
|
$ |
173,067 |
|
$ |
292,685 |
|
$ |
91,064 |
See accompanying notes to financial statements.
F-14
QTS REALTY TRUST, INC.
QUALITYTECH, LP
NOTES TO CONSOLIDATED FINANCIAL STATEMENTS
1. Description of Business
QTS Realty Trust, Inc. (“QTS”) through its controlling interest in QualityTech, LP (the “Operating Partnership” and collectively with QTS and their subsidiaries, the “Company”) and the subsidiaries of the Operating Partnership, is engaged in the business of owning, acquiring, redeveloping and managing multi-tenant data centers. The Company’s portfolio consists of 25 wholly-owned and leased properties with data centers located throughout the United States, Canada, Europe and Asia.
QTS was formed as a Maryland corporation on May 17, 2013 and completed its initial public offering of 14,087,500 shares of Class A common stock, $0.01 par value per share (the “IPO”), on October 15, 2013. QTS elected to be taxed as a real estate investment trust (“REIT”), for U.S. federal income tax purposes, commencing with its taxable year ended December 31, 2013. As a REIT, QTS generally is not required to pay federal corporate income taxes on its taxable income to the extent it is currently distributed to its stockholders.
The Operating Partnership is a Delaware limited partnership formed on August 5, 2009 and is QTS’ historical predecessor. Concurrently with the completion of the IPO, the Company consummated a series of transactions, including the merger of General Atlantic REIT, Inc. with the Company, pursuant to which it became the sole general partner and majority owner of QualityTech, LP, the Operating Partnership. QTS contributed the net proceeds received from the IPO to the Operating Partnership in exchange for partnership units therein. As of December 31, 2016, QTS owned approximately 87.6% of the interests in the Operating Partnership. Substantially all of QTS’ assets are held by, and QTS’ operations are conducted through, the Operating Partnership. QTS’ interest in the Operating Partnership entitles QTS to share in cash distributions from, and in the profits and losses of, the Operating Partnership in proportion to QTS’ percentage ownership. As the sole general partner of the Operating Partnership, QTS generally has the exclusive power under the partnership agreement of the Operating Partnership to manage and conduct the Operating Partnership’s business and affairs, subject to certain limited approval and voting rights of the limited partners. QTS’ board of directors manages the Company’s business and affairs.
2. Summary of Significant Accounting Policies
Basis of Presentation – The accompanying financial statements have been prepared by management in accordance with accounting principles generally accepted in the United States (“U.S. GAAP”). In the opinion of management, all adjustments (consisting of normal recurring adjustments) considered necessary for a fair presentation have been included.
The accompanying financial statements are presented for both QTS Realty Trust, Inc. and QualityTech, LP. References to “QTS” mean QTS Realty Trust, Inc. and its controlled subsidiaries; and references to the “Operating Partnership” mean QualityTech, LP and its controlled subsidiaries.
In 2016, the Company adopted ASU 2015-02, Amendments to the Consolidation Analysis. This standard amends certain guidance applicable to the consolidation of various legal entities, including variable interest entities (“VIE”). The Company evaluated the application of the ASU and concluded that no change was required to its accounting for its interest in the Operating Partnership. However, under the new guidance, the Operating Partnership now meets the definition and criteria of a VIE and the Company is the primary beneficiary of the VIE. As discussed below, the Company’s only material asset is its ownership interest in the Operating Partnership, and consequently, all of its assets and liabilities represent those assets and liabilities of the Operating Partnership. The Company’s debt is an obligation of the Operating Partnership where the creditors may have recourse, under certain circumstances, against the credit of the Company.
QTS is the sole general partner of the Operating Partnership, and its only material asset consists of its ownership interest in the Operating Partnership. Management operates QTS and the Operating Partnership as one business. The
F-15
management of QTS consists of the same employees as the management of the Operating Partnership. QTS does not conduct business itself, other than acting as the sole general partner of the Operating Partnership and issuing public equity from time to time. QTS has not issued or guaranteed any indebtedness. Except for net proceeds from public equity issuances by QTS, which are contributed to the Operating Partnership in exchange for units of limited partnership interest of the Operating Partnership, the Operating Partnership generates all remaining capital required by the business through its operations, the direct or indirect incurrence of indebtedness, and the issuance of partnership units. Therefore, as general partner with control of the Operating Partnership, QTS consolidates the Operating Partnership for financial reporting purposes.
The Company believes, therefore, that providing one set of notes for the financial statements of QTS and the Operating Partnership provides the following benefits:
|
· |
enhances investors’ understanding of QTS and the Operating Partnership by enabling investors to view the business as a whole in the same manner as management views and operates the business; |
|
· |
eliminates duplicative disclosure and provides a more streamlined and readable presentation since a substantial portion of the disclosure applies to both QTS and the Operating Partnership; and |
|
· |
creates time and cost efficiencies through the preparation of one set of notes instead of two separate sets of notes. |
In addition, in light of these combined notes, the Company believes it is important for investors to understand the few differences between QTS and the Operating Partnership in the context of how QTS and the Operating Partnership operate as a consolidated company. With respect to balance sheets, the presentation of stockholders’ equity and partners’ capital are the main areas of difference between the consolidated balance sheets of QTS and those of the Operating Partnership. On the Operating Partnership’s consolidated balance sheets, partners’ capital includes partnership units that are owned by QTS and other partners. On QTS’ consolidated balance sheets, stockholders’ equity includes common stock, additional paid in capital, accumulated other comprehensive income (loss) and accumulated dividends in excess of earnings. The remaining equity reflected on QTS’s consolidated balance sheet is the portion of net assets that are retained by partners other than QTS, referred to as noncontrolling interests. With respect to statements of operations, the primary difference in QTS' Statements of Operations and Comprehensive Income is that for net income (loss), QTS retains its proportionate share of the net income (loss) based on its ownership of the Operating Partnership, with the remaining balance being retained by the Operating Partnership. These combined notes refer to actions or holdings as being actions or holdings of “the Company.” Although the Operating Partnership is generally the entity that enters into contracts, holds assets and issues debt, management believes that these general references to “the Company” in this context is appropriate because the business is one enterprise operated through the Operating Partnership.
As discussed above, QTS owns no operating assets and has no operations independent of the Operating Partnership and its subsidiaries. Also, the Operating Partnership owns no operating assets and has no operations independent of its subsidiaries. Obligations under the 5.875% Senior Notes due 2022 and the unsecured credit facility, both discussed in Note 5, are fully, unconditionally, and jointly and severally guaranteed by the Operating Partnership’s existing subsidiaries, other than: 1) 2470 Satellite Boulevard, LLC, a subsidiary formed in December 2015 that acquired an office building in Duluth, Georgia and has de minimis operations, and 2) QTS Finance Corporation, the co-issuer of the 5.875% Senior Notes due 2022. As such, condensed consolidating financial information for the guarantors is not being presented in the notes to the consolidated financial statements. However, the indenture governing the 5.875% Senior Notes due 2022 restricts the ability of the Operating Partnership to make distributions to QTS, subject to certain exceptions, including distributions required in order for QTS to maintain its status as a real estate investment trust under the Internal Revenue Code of 1986, as amended (the “Code”).
The consolidated financial statements of QTS Realty Trust, Inc. include the accounts of QTS Realty Trust, Inc. and its majority owned subsidiaries. This includes the operating results of the Operating Partnership for all periods presented.
Use of Estimates – The preparation of financial statements in conformity with U.S. GAAP requires management to make estimates and assumptions that affect the reported amounts of assets and liabilities, disclosure of contingent assets and liabilities at the date of the financial statements and the reported amounts of revenues and expenses during the reporting period. Actual results could differ from those estimates. Significant items subject to such estimates and
F-16
assumptions include the useful lives of fixed assets, allowances for doubtful accounts and deferred tax assets and the valuation of derivatives, real estate assets, acquired intangible assets and certain accruals.
Principles of Consolidation – The consolidated financial statements of QTS Realty Trust, Inc. include the accounts of QTS Realty Trust, Inc. and its majority-owned subsidiaries. The consolidated financial statements of QualityTech, LP include the accounts of QualityTech, LP and its subsidiaries. All significant intercompany accounts and transactions have been eliminated in the financial statements.
Reclassifications – The consolidated balance sheet at December 31, 2015 reflects a reclassification of $3.1 million from Deferred Costs, net to Unsecured Credit Facility, net, and $7.1 million from Deferred Costs, net to Senior Notes, net of discount and debt issuance costs as required by the Company’s adoption of ASU 2015-03, “Interest - Imputation of Interest (Subtopic 835-30): Simplifying the Presentation of Debt Issuance Costs.”
Real Estate Assets – Real estate assets are reported at cost. All capital improvements for the income-producing properties that extend their useful lives are capitalized to individual property improvements and depreciated over their estimated useful lives. Depreciation for real estate assets is generally provided on a straight-line basis over 40 years from the date the property was placed in service. Property improvements are depreciated on a straight-line basis over the life of the respective improvement ranging from 20 to 40 years from the date the components were placed in service. Leasehold improvements are depreciated over the lesser of 20 years or through the end of the respective life of the lease. Repairs and maintenance costs are expensed as incurred. For the year ended December 31, 2016, depreciation expense related to real estate assets and non-real estate assets was $77.5 million and $13.1 million, respectively, for a total of $90.6 million. For the year ended December 31, 2015, depreciation expense related to real estate assets and non-real estate assets was $55.2 million and $9.8 million, respectively, for a total of $65.0 million. For the year ended December 31, 2014, depreciation expense related to real estate assets and non-real estate assets was $39.0 million and $6.4 million, respectively, for a total of $45.4 million. The Company capitalizes certain development costs, including internal costs incurred in connection with development. The capitalization of costs during the construction period (including interest and related loan fees, property taxes and other direct and indirect costs) begins when development efforts commence and ends when the asset is ready for its intended use. Capitalization of such costs, excluding interest, aggregated to $11.0 million, $10.8 million and $10.6 million for the years ended December 31, 2016, 2015 and 2014 respectively. Interest is capitalized during the period of development by first applying the Company’s actual borrowing rate on the related asset and second, to the extent necessary, by applying the Company’s weighted average effective borrowing rate to the actual development and other costs expended during the construction period. Interest is capitalized until the property is ready for its intended use. Interest costs capitalized totaled $11.4 million, $9.8 million and $6.5 million for the years ended December 31, 2016, 2015 and 2014, respectively.
Acquisitions – Acquisitions of real estate and other entities are either accounted for as asset acquisitions or business combinations depending on facts and circumstances. Purchase accounting is applied to the assets and liabilities related to all real estate investments acquired in accordance with the accounting requirements of ASC 805, Business Combinations, which requires the recording of net assets of acquired businesses at fair value. The fair value of the consideration transferred is allocated to the acquired tangible assets, consisting primarily of land, construction in progress, building and improvements, and identified intangible assets and liabilities, consisting of the value of above-market and below-market leases, value of in-place leases, value of customer relationships, trade names, software intangibles and capital leases. The excess of the fair value of liabilities assumed, common stock issued and cash paid over the fair value of identifiable assets acquired is allocated to goodwill, which is not amortized by the Company.
In developing estimates of fair value of acquired assets and assumed liabilities, management analyzed a variety of factors including market data, estimated future cash flows of the acquired operations, industry growth rates, current replacement cost for fixed assets and market rate assumptions for contractual obligations. Such a valuation requires management to make significant estimates and assumptions, particularly with respect to the intangible assets.
The total carrying amount of acquired in-place leases was $32.1 million and $16.9 million and accumulated amortization related to acquired in-place leases was $7.2 million and $2.5 million for the years ended December 31, 2016 and 2015, respectively. Acquired in-place leases are amortized as amortization expense on a straight-line basis over the remaining life of the underlying leases. Amortization of acquired in place lease costs totaled $4.7 million, $1.7 million and $2.2
F-17
million for the years ended December 31, 2016, 2015 and 2014, respectively. This amortization expense is accounted for as real estate amortization expense.
The total carrying amount of customer relationships was $95.7 million and $86.1 million and accumulated amortization related to customer relationships was $12.4 million and $7.7 million for the years ended December 31, 2016 and 2015, respectively. Acquired customer relationships are amortized as amortization expense on a straight-line basis over the expected life of the customer relationship. Amortization of acquired customer relationships totaled $10.1 million, $5.0 million and $1.3 million for the years ended December 31, 2016, 2015 and 2014, respectively. This amortization expense is accounted for as real estate amortization expense. The current period amortization includes a $1.0 million adjustment related to an increase in the purchase price allocation of the acquired customer relationship intangible recorded in the three months ended March 31, 2016, of which $0.7 million related to prior reporting periods. See Note 3 for further detail.
Other acquired intangible assets, which includes platform, above or below market leases, and trade name intangibles, are amortized on a straight-line basis over their respective expected lives. Platform and trade name intangibles are amortized as amortization expense. Platform amortization expense was $3.2 million and $1.7 million for the years ended December 31, 2016 and 2015, respectively. Trade name amortization expense was $1.0 million and $0.6 million for the years ended December 31, 2016 and 2015, respectively. Above or below market leases are amortized as a reduction to or increase in rental revenue as well as a reduction to rent expense over the remaining lease terms. Amortization of above or below market leases recorded as net offsets to rental revenue totaled $0.9 million for the year ended December 31, 2016, with no such costs incurred for the year ended December 31, 2015. Amortization of above or below market leases recorded as offsets to rent expense totaled $0.2 million and $0.1 million for the years ended December 31, 2016 and 2015, respectively. There was no amortization related to platform, trade name, and above or below market lease intangibles for the year ended December 31, 2014. The expense associated with above and below market leases and trade name intangibles is accounted for as real estate expense, whereas the expense associated with the amortization of platform intangibles is accounted for as non-real estate expense.
Net amortization expense related to identifiable intangible assets, including both amortization expense as well as offsets or increases to rental revenue and rent expense, is expected to be approximately $19.0 million, $15.0 million, $12.2 million, $11.8 million and $10.0 million for the years ended December 31, 2017 through December 31, 2021, respectively.
See Note 3 for discussion of the final purchase accounting allocation for the acquisition of Carpathia Hosting, Inc. (“Carpathia”) on June 16, 2015, the preliminary purchase price allocation for the Piscataway, New Jersey facility (the “Piscataway facility”) that the Company acquired on June 6, 2016, as well as the preliminary purchase price allocation for the Fort Worth, Texas facility (the “Fort Worth facility”) that the Company acquired on December 16, 2016.
Impairment of Long-Lived Assets and Goodwill – The Company reviews its long-lived assets for impairment when events or changes in circumstances indicate that the carrying amount of the assets may not be recoverable. Recoverability of assets to be held and used is generally measured by comparison of the carrying amount to the future net cash flows, undiscounted and without interest, expected to be generated by the asset group. If the net carrying value of the asset exceeds the value of the undiscounted cash flows, the fair value of the asset is assessed and may be considered impaired. An impairment loss is recognized based on the excess of the carrying amount of the impaired asset over its fair value. During 2016, the Company elected to write off approximately $1.9 million related to certain software to utilize different solutions, of which approximately $1.0 million related to software for its federal cloud product as well as $0.9 million related to an identify governance access management software. No impairment losses were recorded for the years ended December 31, 2016, 2015 and 2014.
The fair value of goodwill is the consideration transferred which is not allocable to identifiable intangible and tangible assets. Goodwill is subject to an annual assessment for impairment. As a result of the Carpathia acquisition, the Company recognized approximately $173.8 million in goodwill. In connection with the goodwill impairment evaluation that the Company performed on October 1, 2016, the Company determined qualitatively that there were no indicators of impairment, thus it did not perform a quantitative analysis.
F-18
Cash and Cash Equivalents – The Company considers all demand deposits and money market accounts purchased with a maturity date of three months or less at the date of purchase to be cash equivalents. The Company’s account balances at one or more institutions periodically exceed the Federal Deposit Insurance Corporation (“FDIC”) insurance coverage and, as a result, there is concentration of credit risk related to amounts on deposit in excess of FDIC coverage. The Company mitigates this risk by depositing a majority of its funds with several major financial institutions. The Company also has not experienced any losses and, therefore, does not believe that the risk is significant.
Deferred Costs – Deferred costs, net, on the Company’s balance sheets include both financing costs and leasing costs.
As discussed above in Reclassifications, the Company adopted ASU 2015-03 during the year ended December 31, 2016. Pursuant to this updated guidance, debt issuance costs related to revolving debt arrangements are permitted to be deferred and presented as assets on the balance sheet; however, all other debt issuance costs must be recorded as a direct offset to the associated liability. As such, deferred financing costs on the Company’s consolidated balance sheets represent costs incurred in connection with obtaining only revolving debt arrangements. These costs are amortized over the term of the loan and are included in interest expense. Amortization of debt issuance costs, including those costs presented as offsets to the associated liability in the consolidated balance sheet, was $3.3 million, $3.2 million and $2.7 million for the years ended December 31, 2016, 2015 and 2014, respectively. During the year ended December 31, 2016, the Company wrote off unamortized financing costs of $0.2 million to the income statement in connection with the modification of its unsecured credit facility in December 2016 whereby the company increased the total capacity and extended the term for an additional year. During the year ended December 31, 2015, the Company wrote off unamortized financing costs of $0.5 million to the income statement in connection with the repayment of the Atlanta Metro equipment loan in June 2015 as well as the amendment of its unsecured credit facility in October 2015 whereby the Company increased the unsecured credit facility capacity, and, at the same time, terminated its Richmond credit facility. Deferred financing costs related to revolving debt arrangements, net of accumulated amortization are as follows:
|
|
|
December 31, |
|
|
December 31, |
|
|
(dollars in thousands) |
|
2016 |
|
2015 |
||
|
|
|
|
|
|
|
|
|
Deferred financing costs |
|
$ |
7,128 |
|
$ |
6,652 |
|
Accumulated amortization |
|
|
(145) |
|
|
(389) |
|
Deferred financing costs, net |
|
$ |
6,983 |
|
$ |
6,263 |
Deferred leasing costs consist of external fees and internal costs incurred in the successful negotiations of leases and are deferred and amortized over the terms of the related leases on a straight-line basis. If an applicable lease terminates prior to the expiration of its initial term, the carrying amount of the costs are written off to amortization expense. Amortization of deferred leasing costs totaled $15.2 million, $11.8 million and $9.4 million for the years ended December 31, 2016, 2015 and 2014, respectively. Deferred leasing costs, net of accumulated amortization are as follows:
|
|
|
December 31, |
|
December 31, |
||
|
(dollars in thousands) |
|
2016 |
|
2015 |
||
|
|
|
|
|
|
|
|
|
Deferred leasing costs |
|
$ |
50,026 |
|
$ |
36,748 |
|
Accumulated amortization |
|
|
(18,502) |
|
|
(12,970) |
|
Deferred leasing costs, net |
|
$ |
31,524 |
|
$ |
23,778 |
Advance Rents and Security Deposits – Advance rents, typically prepayment of the following month’s rent, consist of payments received from customers prior to the time they are earned and are recognized as revenue in subsequent periods when earned. Security deposits are collected from customers at the lease origination and are generally refunded to customers upon lease expiration.
Deferred Income – Deferred income generally results from non-refundable charges paid by the customer at lease inception to prepare their space for occupancy. The Company records this initial payment, commonly referred to as set-up fees, as a deferred income liability which amortizes into rental revenue over the term of the related lease on a straight-line basis. Deferred income was $22.0 million, $17.0 million and $10.5 million as of December 31, 2016, 2015 and
F-19
2014, respectively. Additionally, $9.4 million, $6.0 million and $4.7 million of deferred income was amortized into revenue for the years ended December 31, 2016, 2015 and 2014, respectively.
Equity-based Compensation – All equity-based compensation is measured at fair value on the grant date or date of modification, as applicable, and recognized in earnings over the requisite service period. Depending upon the settlement terms of the awards, all or a portion of the fair value of equity-based awards may be presented as a liability or as equity in the consolidated balance sheets. Equity-based compensation costs are measured based upon their estimated fair value on the date of grant or modification. Equity-based compensation expense net of forfeited and repurchased awards was $10.6 million, $7.0 million and $4.2 million for the years ended December 31, 2016, 2015 and 2014, respectively.
Rental Revenue – The Company, as a lessor, has retained substantially all of the risks and benefits of ownership and accounts for its leases as operating leases. For lease agreements that provide for scheduled rent increases, rental income is recognized on a straight-line basis over the non-cancellable term of the leases, which commences when control of the space has been provided to the customer. The amount of the straight-line rent receivable on the balance sheets included in rents and other receivables, net was $17.3 million and $9.1 million as of December 31, 2016 and December 31, 2015, respectively. Rental revenue also includes amortization of set-up fees which are amortized over the term of the respective lease as discussed above.
Cloud and Managed Services Revenue – The Company may provide both its cloud product and use of its managed services to its customers on an individual or combined basis. Service fee revenue is recognized as the revenue is earned, which generally coincides with the services being provided.
Allowance for Uncollectible Accounts Receivable – Rents receivable are recognized when due and are carried at cost, less an allowance for doubtful accounts. The Company records a provision for losses on rents receivable equal to the estimated uncollectible accounts, which is based on management’s historical experience and a review of the current status of the Company’s receivables. As necessary, the Company also establishes an appropriate allowance for doubtful accounts for receivables arising from the straight-lining of rents. The aggregate allowance for doubtful accounts was $4.2 million and $5.1 million as of December 31, 2016 and December 31, 2015, respectively.
Capital Leases – The Company evaluates leased real estate to determine whether the lease should be classified as a capital or operating lease in accordance with U.S. GAAP.
The Company periodically enters into capital leases for certain equipment. In addition, through its acquisition of Carpathia on June 16, 2015, the Company is now party to capital leases for property and equipment, as well as financing obligations related to a sale-leaseback transaction. The outstanding liabilities for the capital leases were $18.1 million and $26.9 million as of December 31, 2016 and 2015, respectively. The outstanding liabilities for the lease financing obligations were $20.6 million and $22.8 million as of December 31, 2016 and 2015, respectively. The net book value of the assets associated with these leases was approximately $41.5 million and $51.0 million as of December 31, 2016 and 2015, respectively. Depreciation related to the associated assets is included in depreciation and amortization expense in the Statements of Operations and Comprehensive Income.
See Note 3 for further discussion of the acquisition of Carpathia and Note 5 for further discussion of capital leases and lease financing obligations.
Recoveries from Customers – Certain customer leases contain provisions under which the customers reimburse the Company for a portion of the property’s real estate taxes, insurance and other operating expenses, which include certain power and cooling-related charges. The reimbursements are included in revenue as recoveries from customers in the Statements of Operations and Comprehensive Income in the period the applicable expenditures are incurred. Certain customer leases are structured to provide a fixed monthly billing amount that includes an estimate of various operating expenses, with all revenue from such leases included in rental revenues.
Segment Information – The Company manages its business as one operating segment and thus one reportable segment consisting of a portfolio of investments in data centers located primarily in the United States with others in Canada, Europe and Asia.
F-20
Customer Concentrations – As of December 31, 2016, one of the Company’s customers represented 13.0% of its total monthly rental revenue. No other customers exceeded 4% of total monthly rental revenue.
As of December 31, 2016, nine of the Company’s customers exceeded 5% of total accounts receivable. In aggregate, these nine customers accounted for 73% of total accounts receivable. Two of these nine customers individually exceeded 10% of total accounts receivable.
Income Taxes – The Company has elected for two of its existing subsidiaries to be taxed as taxable REIT subsidiaries pursuant to the REIT rules of the U.S. Internal Revenue Code.
For the taxable REIT subsidiaries, income taxes are accounted for under the asset and liability method. Deferred tax assets and liabilities are recognized for the future tax consequences attributable to differences between the financial statement carrying amounts of existing assets and liabilities and their respective tax bases and operating loss and tax credit carryforwards. Deferred tax assets and liabilities are measured using enacted tax rates expected to apply to taxable income in the years in which those temporary differences are expected to be recovered or settled. The effect on deferred tax assets and liabilities of a change in tax rates is recognized in income in the period that includes the enactment date. Valuation allowances are established when necessary to reduce deferred tax assets to the amount expected to be realized.
As of December 31, 2014, one of the Company’s taxable REIT subsidiaries’ deferred tax assets were primarily the result of U.S. net operating loss carryforwards. A valuation allowance was recorded against its gross deferred tax asset balance as of December 31, 2014. As a result of the acquisition of Carpathia, the Company determined that it is more likely than not that pre-existing deferred tax assets would be realized by the Company, and the valuation allowance was eliminated. The change in the valuation allowance resulting from the change in circumstances was included in income, and recognized as a deferred income tax benefit in the year ended December 31, 2015.
In addition to the deferred income tax benefit recognized in the year ended December 31, 2015 in connection with the elimination of the valuation allowance, a deferred tax benefit was recognized in the year ended December 31, 2016 in connection with recorded operating losses. As of December 31, 2016, this taxable REIT subsidiary has a net deferred tax liability position primarily due to customer-based intangibles acquired as part of the Carpathia acquisition.
Temporary differences and carry forwards which give rise to the deferred tax assets and liabilities are as follows:
|
|
|
For the Year Ended December 31, |
|||||||
|
|
|
2016 |
|
2015 |
|
2014 |
|||
|
Deferred tax liabilities |
|
|
|
|
|
|
|
|
|
|
Property and equipment |
|
$ |
(15,031) |
|
$ |
(16,032) |
|
$ |
(5,784) |
|
Goodwill |
|
|
(1,290) |
|
|
(407) |
|
|
— |
|
Intangibles |
|
|
(24,244) |
|
|
(23,896) |
|
|
— |
|
Other |
|
|
(1,927) |
|
|
(2,350) |
|
|
(1,427) |
|
Gross deferred tax liabilities |
|
|
(42,492) |
|
|
(42,685) |
|
|
(7,211) |
|
Deferred tax assets |
|
|
|
|
|
|
|
|
|
|
Net operating loss carryforwards |
|
|
17,642 |
|
|
14,107 |
|
|
9,137 |
|
Deferred revenue and setup charges |
|
|
4,323 |
|
|
3,747 |
|
|
868 |
|
Leases |
|
|
2,154 |
|
|
3,097 |
|
|
— |
|
Credits |
|
|
492 |
|
|
630 |
|
|
— |
|
Other |
|
|
2,696 |
|
|
2,291 |
|
|
601 |
|
Gross deferred tax assets |
|
|
27,307 |
|
|
23,872 |
|
|
10,606 |
|
Net deferred tax assets |
|
|
(15,185) |
|
|
(18,813) |
|
|
3,395 |
|
Valuation allowance |
|
|
— |
|
|
— |
|
|
(3,395) |
|
Net deferred |
|
$ |
(15,185) |
|
$ |
(18,813) |
|
$ |
— |
F-21
The taxable REIT subsidiaries currently have $45.5 million of net operating loss carryforwards related to federal income taxes that expire in 13-20 years. The taxable REIT subsidiaries also have $50.3 million of net operating loss carryforwards relating to state income taxes that expire in 3-20 years.
The effective tax rate is subject to change in the future due to various factors such as the operating performance of the taxable REIT subsidiaries, tax law changes and future business acquisitions. The Company’s effective tax rates were 46.5%, 34.8% and 0% for the years ended December 31, 2016, 2015 and 2014, respectively. The increase in the effective tax rate in 2016 is primarily due to state tax rate changes and return-to-provision adjustments.
The differences between total income tax expense or benefit and the amount computed by applying the statutory income tax rate to income before provision for income taxes with respect to the TRS activity were as follows:
|
|
|
For the Year Ended December 31, |
|||||||
|
|
|
2016 |
|
2015 |
|
2014 |
|||
|
TRS |
|
|
|
|
|
|
|
|
|
|
Statutory rate of 34% applied to pre-tax income (loss) |
|
$ |
(7,299) |
|
$ |
(6,683) |
|
$ |
(1,793) |
|
Permanent differences, net |
|
|
(2,021) |
|
|
281 |
|
|
128 |
|
State income tax, net of federal benefit |
|
|
(689) |
|
|
(268) |
|
|
(365) |
|
Foreign income tax |
|
|
33 |
|
|
— |
|
|
— |
|
Valuation allowance (decrease) increase |
|
|
— |
|
|
(3,395) |
|
|
2,030 |
|
Total tax expense (benefit) |
|
$ |
(9,976) |
|
$ |
(10,065) |
|
$ |
— |
|
Effective tax rate |
|
|
46.5% |
|
|
34.8% |
|
|
0.0% |
As of December 31, 2016, 2015, and 2014, the Company had no uncertain tax positions. If the Company incurs any interest or penalties on tax liabilities from significant uncertain tax positions, those items will be classified as interest expense and general and administrative expense, respectively, in the Statements of Operations and Comprehensive Income. For the years ended December 31, 2016, 2015 and 2014, the Company had no such interest or penalties.
The Company is not currently under examination by the Internal Revenue Service.
Fair Value Measurements – ASC Topic 820, Fair Value Measurement, emphasizes that fair-value is a market-based measurement, not an entity-specific measurement. Therefore, a fair-value measurement should be determined based on the assumptions that market participants would use in pricing the asset or liability. As a basis for considering market participant assumptions in fair-value measurements, a fair-value hierarchy is established that distinguishes between market participant assumptions based on market data obtained from sources independent of the reporting entity (observable inputs that are classified within Levels 1 and 2 of the hierarchy) and the reporting entity’s own assumptions about market participant assumptions (unobservable inputs classified within Level 3 of the hierarchy).
Level 1 inputs utilize quoted prices (unadjusted) in active markets for identical assets or liabilities that the Company has the ability to access. Level 2 inputs are inputs other than quoted prices included in Level 1 that are observable for the asset or liability, either directly or indirectly. Level 2 inputs may include quoted prices for similar assets and liabilities in active markets, as well as inputs that are observable for the asset or liability (other than quoted prices), such as interest rates, foreign exchange rates, and yield curves that are observable at commonly quoted intervals. Level 3 inputs are unobservable inputs for the asset or liability, which are typically based on an entity’s own assumptions, as there is little, if any, related market activity. In instances where the determination of the fair-value measurement is based on inputs from different levels of the fair-value hierarchy, the level in the fair-value hierarchy within which the entire fair-value measurement falls is based on the lowest level input that is significant to the fair-value measurement in its entirety. The Company’s assessment of the significance of a particular input to the fair-value measurement in its entirety requires judgment, and considers factors specific to the asset or liability.
There are no financial assets or liabilities measured at fair value on a recurring basis on the consolidated balance sheets as of December 31, 2016 and 2015. The Company’s purchase price allocations of Carpathia and Piscataway are fair value estimates that utilized Level 3 inputs and are measured on a non-recurring basis. See Note 3 for further detail.
F-22
Recent Accounting Pronouncements
In May 2014, the FASB issued ASU 2014-09, Revenue from Contracts with Customers (Topic 606), which supersedes the current revenue recognition requirements in ASC 606, Revenue Recognition. Under this new guidance, entities should recognize revenues to depict the transfer of promised goods or services to customers in an amount that reflects the consideration the entity expects to receive in exchange for those goods or services. This ASU also requires enhanced disclosures. In April 2016, the FASB finalized amendments to the guidance on identifying performance obligations and accounting for licenses of intellectual property. In May 2016, the FASB finalized amendments to the guidance related to the assessment of collectibility, the definition of completed contracts at transition, and the measurement of the fair value of non-cash consideration at contract inception. The FASB also added new practical expedients for the presentation of sales taxes collected from customers and the accounting for contract modifications at transition. These amendments are not intended to change the core principles of the standard; however, they are intended to clarify important aspects of the guidance and improve its operability, as well as to address implementation issues. The amendments have the same effective date and transition requirements as the new revenue standard, which is effective for annual and interim periods beginning after December 15, 2017. Early adoption is permitted; however, entities are not permitted to adopt the standard earlier than December 15, 2016, the original effective date. Retrospective and modified retrospective application is allowed.
In February 2016, the FASB issued ASU 2016-02, Leases (Topic 842), which supersedes the current lease guidance in ASC 840, Leases. The core principle of Topic 842 requires lessees to recognize the assets and liabilities that arise from nearly all leases in the statement of financial position. Accounting applied by lessors will remain largely consistent with previous guidance, with additional changes set to align lessor accounting with the revised lessee model and the FASB’s revenue recognition guidance in Topic 606. The amendments in this ASU are effective for fiscal years beginning after December 15, 2018, including interim periods within those fiscal years. Early adoption is permitted.
The Company plans to adopt ASC Topic 842 and ASC Topic 606 effective January 1, 2018. The Company is currently assessing the method of adoption for both standards. The new standard more narrowly defines initial direct costs as only costs that are incremental at the signing of a lease. As the Company does not currently capitalize material non-incremental costs, it expects the impact of this change to be immaterial to the financial statements. As lessee the Company does not anticipate the classification of its leases to change but it will recognize a new initial lease liability and right-of-use asset on the consolidated balance sheet for all operating leases. ASC 606 consolidates and simplifies the accounting for other arrangements such as those within the Company’s cloud and managed services portfolio, and the Company is continuing to evaluate the other impacts of ASC Topic 842 and ASC Topic 606 on its significant accounting policies and consolidated financial statements. The Company will disclose any changes to this analysis if identified.
In April 2015, the FASB issued ASU 2015-03, Interest - Imputation of Interest (Subtopic 835-30): Simplifying the Presentation of Debt Issuance Costs. The amendments in this ASU require that debt issuance costs related to a recognized debt liability be presented in the balance sheet as a direct deduction from the carrying amount of that debt liability, consistent with debt discounts, and not as a separate deferred charge. The recognition and measurement guidance for debt issuance costs are not affected by the amendments in this ASU. In June 2015, the Securities and Exchange Commission (“SEC”) stated that given the absence of authoritative guidance within this ASU for debt issuance costs related to revolving debt arrangements, the SEC staff would not object to an entity deferring and presenting such costs as an asset and subsequently amortizing them ratably over the term of the revolving debt arrangement. This announcement confirms that revolver arrangement costs are not within the scope of this ASU. The amendments in this ASU are effective for financial statements issued for fiscal years beginning after December 15, 2015, and interim periods within those fiscal years. The amendments are required to be applied on a retrospective basis, and upon transition, an entity is required to comply with the applicable disclosures for a change in an accounting principle. The Company adopted this standard in the three months ended March 31, 2016. See Reclassifications in Note 2 for further detail.
In September 2015, the FASB issued ASU 2015-16, Simplifying the Accounting for Measurement-Period Adjustments, that eliminates the requirement to restate prior period financial statements for measurement period adjustments. The new guidance requires that the cumulative impact of a measurement period adjustment (including the impact on prior periods) be recognized in the reporting period in which the adjustment is identified. The amendments in this ASU are effective for fiscal years beginning after December 15, 2015, including interim periods within those fiscal years, and should be
F-23
applied prospectively to adjustments to provisional amounts that occur after the effective date with earlier application permitted for financial statements that have not been issued. The Company adopted this standard during the year ended December 31, 2016, and the effect is reflected in the financial statements accordingly.
In March 2016, the FASB issued ASU 2016-09, Improvements to Employee Share-Based Payment Accounting, which amends ASC 718, Compensation – Stock Compensation. The ASU includes provisions intended to simplify various aspects related to how share-based payments are accounted for and presented in the financial statements, including simplified income tax accounting for stock-based compensation, enhanced tax withholding rules, accounting policy options with regard to forfeitures and clarified guidance on statement of cash flow presentation. ASU 2016-09 is effective for fiscal years beginning after December 15, 2016, including interim periods within those fiscal years. Early adoption is permitted. The Company is currently assessing the impact of this standard on its consolidated financial statements.
In August 2016, the FASB issued ASU 2016-15, Statement of Cash Flows (Topic 230): Classification of Certain Cash Receipts and Cash Payments. The standard provides guidance on eight specific cash flow classification issues including debt prepayment or debt extinguishment costs, contingent consideration payments made after a business combination, and separately identifiable cash flows and application of the predominance principle. The standard will be effective for fiscal years beginning January 1, 2018, and subsequent interim periods. The Company does not expect the provisions of the standard will have a material impact on its consolidated financial statements.
In October 2016, the FASB issued ASU 2016-16, Accounting for Income Taxes: Intra-Entity Asset Transfers of Assets Other than Inventory. Under current GAAP, the tax effects of intra-entity asset transfers are deferred until the transferred asset is sold to a third party or otherwise recovered through use. The new guidance eliminates the exception for all intra-entity sales of assets other than inventory. As a result, a reporting entity would recognize the tax expense from the sale of the asset in the seller’s tax jurisdiction when the transfer occurs, even though the pre-tax effects of that transaction are eliminated in consolidation. Any deferred tax asset that arises in the buyer’s jurisdiction would also be recognized at the time of the transfer. The new guidance will be effective for public business entities in fiscal years beginning after December 15, 2017, including interim periods within those years. Early adoption is permitted, but the guidance can only be adopted in the first interim period of a fiscal year. The Company is currently assessing the impact of this standard on its consolidated financial statements.
In January 2017, the FASB issued guidance codified in ASC Topic 2017-01, Business Combinations (Topic 805): Clarifying the Definition of a Business. The standard changes the definition of a business to assist entities with evaluating when a set of transferred assets and activities is a business. The guidance is effective for public business entities for fiscal years beginning after December 15, 2017, and interim periods within those years. Early adoption is permitted. As a result of this new guidance acquisitions may now result in an asset purchase rather than a business combination.
In January 2017, the FASB issued guidance codified in ASC Topic 2017-04, Intangibles – Goodwill and Other (Topic 350): Simplifying the Test for Goodwill Impairment. The new guidance eliminates the requirement to calculate the implied fair value of goodwill (i.e., Step 2 of today’s goodwill impairment test) to measure a goodwill impairment charge. Instead, entities will record an impairment charge based on the excess of a reporting unit’s carrying amount over its fair value (i.e., measure the charge based on today’s Step 1). The guidance will be applied prospectively and is effective for calendar year-end SEC filers in 2020, with early adoption permitted for annual and interim goodwill impairment testing dates after January 1, 2017. The Company does not expect the provisions of the standard will have a material impact on its consolidated financial statements.
F-24
3. Acquisitions
(All references to square footage, acres and megawatts are unaudited)
Fort Worth Acquisition
On December 16, 2016, the Company completed the acquisition of the Fort Worth facility for approximately $50.1 million (based on the preliminary assessment of the fair value of assets acquired and liabilities assumed). This facility is located in Fort Worth, Texas, and consists of 53 acres and approximately 262,000 gross square feet. This facility has a basis of design of 80,000 square feet, 8 gross MW of current available power with an additional 8 gross MW available for further expansion. This acquisition was funded with a draw on the unsecured revolving credit facility.
The Company accounted for this acquisition in accordance with ASC 805, Business Combinations, as a business combination. The Company is generally valuing the assets acquired and liabilities assumed using Level 3 inputs.
The following table summarizes the consideration for the Fort Worth facility and the preliminary allocation of the fair value of assets acquired and liabilities assumed at the acquisition date (in thousands). This allocation is subject to change pending the final valuation of these assets and liabilities:
|
|
|
Fort Worth Allocation as of |
|
|
Land |
|
$ |
136 |
|
Buildings and improvements |
|
|
610 |
|
Construction in progress |
|
|
48,984 |
|
Acquired intangibles |
|
|
240 |
|
Deferred costs |
|
|
23 |
|
Other assets |
|
|
7 |
|
Net Working Capital |
|
|
86 |
|
Total identifiable assets acquired |
|
$ |
50,086 |
Acquired intangibles are amortized as both amortization expense as well as offsets to rental revenue.
Piscataway Acquisition
On June 6, 2016, the Company completed the acquisition of the Piscataway facility for approximately $125.8 million (based on the preliminary assessment of the fair value of assets acquired and liabilities assumed). This facility is located in the New York metro area on 38 acres and consists of 360,000 gross square feet, including approximately 89,000 square feet of raised floor, and approximately 18 MW of critical power. The Piscataway facility supports future growth with space for an additional approximately 87,000 square feet of raised floor in the existing structure, as well as capacity for over 8 MW of additional critical power. This acquisition was funded with a draw on the unsecured revolving credit facility.
The Company accounted for this acquisition in accordance with ASC 805, Business Combinations, as a business combination. The Company is generally valuing the assets acquired and liabilities assumed using Level 3 inputs.
F-25
The following table summarizes the consideration for the Piscataway facility and the preliminary allocation of the fair value of assets acquired and liabilities assumed at the acquisition date (in thousands). This allocation is subject to change pending the final valuation of these assets and liabilities:
|
|
|
Piscataway Allocation as of |
|
|
Original Allocation Reported as of June 30, 2016 |
|
|
Adjusted Fair Value |
|
|
Land |
|
$ |
7,466 |
|
$ |
7,440 |
|
$ |
26 |
|
Buildings and improvements |
|
|
80,366 |
|
|
78,370 |
|
|
1,996 |
|
Construction in progress |
|
|
13,900 |
|
|
13,900 |
|
|
— |
|
Acquired intangibles |
|
|
19,581 |
|
|
21,668 |
|
|
(2,087) |
|
Deferred costs |
|
|
4,390 |
|
|
4,084 |
|
|
306 |
|
Other assets |
|
|
106 |
|
|
106 |
|
|
— |
|
Total identifiable assets acquired |
|
|
125,809 |
|
|
125,568 |
|
|
241 |
|
|
|
|
|
|
|
|
|
|
|
|
Acquired below market lease |
|
|
809 |
|
|
568 |
|
|
241 |
|
Net working capital |
|
|
2,019 |
|
|
2,019 |
|
|
— |
|
Total liabilities assumed |
|
|
2,828 |
|
|
2,587 |
|
|
241 |
|
|
|
|
|
|
|
|
|
|
|
|
Net identifiable assets acquired |
|
$ |
122,981 |
|
$ |
122,981 |
|
$ |
— |
Acquired intangibles are amortized as both amortization expense as well as offsets to rental revenue. Based on the preliminary purchase price allocation, amortization expenses relative to acquired in place leases are expected to be approximately $4.0 million, $2.9 million, $2.3 million, $1.7 million and $0.5 million for the years ended December 31, 2017 through December 31, 2021, respectively. Additionally, based on the preliminary purchase price allocation, amortization expenses relative to acquired above and below market leases recorded as net offsets to rental revenue are expected to be approximately $1.1 million, $0.7 million, $0.5 million, $0.6 million and $0.0 million for the years ended December 31, 2017 through December 31, 2021, respectively.
Carpathia Acquisition
On June 16, 2015, the Company completed the acquisition of 100% of the outstanding stock of Carpathia Hosting, Inc., a Virginia-based colocation, cloud and managed services provider for approximately $373.6 million (based on the final assessment of the fair value of assets acquired and liabilities assumed). Upon completion of this acquisition, the Company assumed all of the assets and liabilities of Carpathia Acquisition, Inc. Carpathia Acquisition, Inc. and its subsidiaries, including Carpathia, became indirect, wholly-owned subsidiaries of the Company. Carpathia was a provider of colocation, hybrid cloud and Infrastructure-as-a-Service (IaaS) servicing enterprise customers and federal agencies, with a customer base of approximately 230 customers as of June 16, 2015. Carpathia utilized eight domestic data centers located in Dulles, Virginia; Phoenix, Arizona; San Jose, California; Harrisonburg, Virginia and Ashburn, Virginia; and five international data centers located in Toronto, Canada; Amsterdam, Netherlands; Hong Kong; London, United Kingdom; and Sydney, Australia. The Company no longer leases the Sydney, Australia data center.
The Company accounted for this acquisition in accordance with ASC 805, Business Combinations, as a business combination. The Company generally valued the assets acquired and liabilities assumed using Level 3 inputs.
F-26
In June 2016, the Company finalized the Carpathia purchase price allocation. The following table summarizes the consideration for the Carpathia acquisition and the final allocation of the fair value of assets acquired and liabilities assumed at the acquisition date (unaudited and in thousands):
|
|
|
Final Carpathia |
|
|
Land |
|
$ |
1,130 |
|
Buildings and improvements |
|
|
78,898 |
|
Construction in progress |
|
|
12,127 |
|
Acquired intangibles |
|
|
108,100 |
|
Net working capital |
|
|
2,851 |
|
Total identifiable assets acquired |
|
|
203,106 |
|
|
|
|
|
|
Capital lease and lease financing obligations |
|
|
43,832 |
|
Deferred income taxes |
|
|
35,980 |
|
Acquired above market lease |
|
|
2,453 |
|
Total liabilities assumed |
|
|
82,265 |
|
|
|
|
|
|
Net identifiable assets acquired |
|
|
120,841 |
|
Goodwill |
|
|
173,843 |
|
Net assets acquired |
|
$ |
294,684 |
Goodwill recognized in the transaction relates primarily to anticipated operating synergies, Carpathia’s in-place workforce and access to Carpathia’s broader potential customer base. For tax purposes, QTS acquired goodwill with a tax basis of $16.6 million, which is deductible in subsequent periods. Based on the final purchase price allocation, amortization expenses relative to the intangible assets acquired are expected to be approximately $12.2 million, $9.9 million, $8.0 million, $8.0 million and $8.0 million for the years ended December 31, 2017 through December 31, 2021, respectively. Additionally, based on the final purchase price allocation, amortization expenses relative to acquired above market leases recorded as offsets to rent expense are expected to be approximately $0.2 million for each of the years ended December 31, 2017 through December 31, 2021, respectively.
The following table represents the pro forma condensed consolidated statements of operations of the combined entities for the years ended December 31, 2015 and 2014 (in thousands):
|
|
|
|
|
|
(Unaudited) Pro Forma Condensed Consolidated Statements of Operations |
||||
|
|
|
|
|
|
Year Ended December 31, |
||||
|
|
|
|
|
|
2015 |
|
2014 |
||
|
Revenue |
|
|
|
|
$ |
352,529 |
|
$ |
299,906 |
|
Net income |
|
|
|
|
$ |
28,109 |
|
$ |
12,919 |
These amounts have been calculated after applying the Company’s accounting policies, and give effect to the Carpathia acquisition.
The unaudited pro forma condensed consolidated financial information is for comparative purposes only and not necessarily indicative of what actual results of operations of the Company would have been had the transactions noted above been consummated on January 1, 2014, nor does it purport to represent the results of operations for future periods.
F-27
4. Real Estate Assets and Construction in Progress
The following is a summary of properties owned or leased by the Company as of December 31, 2016 and 2015 (in thousands):
As of December 31, 2016:
|
Property Location |
|
Land |
|
Buildings and Improvements |
|
Construction |
|
Total Cost |
||||
|
|
|
|
|
|
|
|
|
|
|
|
|
|
|
Owned Properties |
|
|
|
|
|
|
|
|
|
|
|
|
|
Suwanee, Georgia (Atlanta-Suwanee) |
|
$ |
3,521 |
|
$ |
171,376 |
|
$ |
2,013 |
|
$ |
176,910 |
|
Atlanta, Georgia (Atlanta-Metro) |
|
|
15,397 |
|
|
434,965 |
|
|
32,422 |
|
|
482,784 |
|
Santa Clara, California* |
|
|
— |
|
|
98,708 |
|
|
7,078 |
|
|
105,786 |
|
Richmond, Virginia |
|
|
2,180 |
|
|
237,347 |
|
|
70,580 |
|
|
310,107 |
|
Sacramento, California |
|
|
1,481 |
|
|
62,102 |
|
|
390 |
|
|
63,973 |
|
Princeton, New Jersey |
|
|
20,700 |
|
|
32,788 |
|
|
538 |
|
|
54,026 |
|
Irving, Texas |
|
|
8,606 |
|
|
204,713 |
|
|
69,653 |
|
|
282,972 |
|
Chicago, Illinois |
|
|
9,400 |
|
|
45,848 |
|
|
100,623 |
|
|
155,871 |
|
Piscataway, New Jersey |
|
|
7,466 |
|
|
82,210 |
|
|
17,261 |
|
|
106,937 |
|
Fort Worth, Texas |
|
|
136 |
|
|
610 |
|
|
49,116 |
|
|
49,862 |
|
Miami, Florida |
|
|
1,777 |
|
|
31,170 |
|
|
83 |
|
|
33,030 |
|
Lenexa, Kansas |
|
|
437 |
|
|
3,760 |
|
|
— |
|
|
4,197 |
|
Duluth, Georgia Office Building |
|
|
1,899 |
|
|
1,918 |
|
|
5,672 |
|
|
9,489 |
|
|
|
|
73,000 |
|
|
1,407,515 |
|
|
355,429 |
|
|
1,835,944 |
|
|
|
|
|
|
|
|
|
|
|
|
|
|
|
Leased Properties |
|
|
|
|
|
|
|
|
|
|
|
|
|
Leased facilities acquired in 2015 *** |
|
|
1,130 |
|
|
92,567 |
|
|
7,671 |
|
|
101,368 |
|
Jersey City, New Jersey |
|
|
— |
|
|
23,723 |
|
|
2,332 |
|
|
26,055 |
|
Overland Park, Kansas |
|
|
— |
|
|
962 |
** |
|
528 |
|
|
1,490 |
|
|
|
|
1,130 |
|
|
117,252 |
|
|
10,531 |
|
|
128,913 |
|
|
|
$ |
74,130 |
|
$ |
1,524,767 |
|
$ |
365,960 |
|
$ |
1,964,857 |
* Owned facility subject to long-term ground sublease.
** This does not include the portion of the business that is used for QTS office space or other real estate not used by customers.
*** Includes 12 facilities. All facilities are leased, including those subject to capital leases.
F-28
As of December 31, 2015:
|
Property Location |
|
Land |
|
Buildings and |
|
Construction |
|
Total Cost |
||||
|
|
|
|
|
|
|
|
|
|
|
|
|
|
|
Owned Properties |
|
|
|
|
|
|
|
|
|
|
|
|
|
Suwanee, Georgia (Atlanta-Suwanee) |
|
$ |
3,521 |
|
$ |
150,028 |
|
$ |
15,330 |
|
$ |
168,879 |
|
Atlanta, Georgia (Atlanta-Metro) |
|
|
15,397 |
|
|
406,190 |
|
|
41,835 |
|
|
463,422 |
|
Santa Clara, California* |
|
|
— |
|
|
94,437 |
|
|
1,379 |
|
|
95,816 |
|
Richmond, Virginia |
|
|
2,180 |
|
|
208,654 |
|
|
85,771 |
|
|
296,605 |
|
Sacramento, California |
|
|
1,481 |
|
|
61,462 |
|
|
73 |
|
|
63,016 |
|
Princeton, New Jersey |
|
|
20,700 |
|
|
32,708 |
|
|
422 |
|
|
53,830 |
|
Irving, Texas |
|
|
8,590 |
|
|
71,783 |
|
|
120,331 |
|
|
200,704 |
|
Chicago, Illinois |
|
|
— |
|
|
— |
|
|
70,749 |
|
|
70,749 |
|
Miami, Florida |
|
|
1,777 |
|
|
30,554 |
|
|
144 |
|
|
32,475 |
|
Lenexa, Kansas |
|
|
437 |
|
|
3,511 |
|
|
— |
|
|
3,948 |
|
Duluth, Georgia Office Building |
|
|
1,899 |
|
|
1,920 |
|
|
— |
|
|
3,819 |
|
|
|
|
55,982 |
|
|
1,061,247 |
|
|
336,034 |
|
|
1,453,263 |
|
|
|
|
|
|
|
|
|
|
|
|
|
|
|
Leased Properties |
|
|
|
|
|
|
|
|
|
|
|
|
|
Leased facilities acquired in 2015 *** |
|
|
1,130 |
|
|
89,989 |
|
|
7,196 |
|
|
98,315 |
|
Jersey City, New Jersey |
|
|
— |
|
|
28,228 |
|
|
2,421 |
|
|
30,649 |
|
Overland Park, Kansas |
|
|
— |
|
|
922 |
** |
|
4 |
|
|
926 |
|
|
|
|
1,130 |
|
|
119,139 |
|
|
9,621 |
|
|
129,890 |
|
|
|
$ |
57,112 |
|
$ |
1,180,386 |
|
$ |
345,655 |
|
$ |
1,583,153 |
* Owned facility subject to long-term ground sublease
** This does not include the portion of the business that is used for QTS office space or other real estate not used by customers.
*** Includes 13 facilities. All facilities are leased, including those subject to capital leases.
5. Debt
Below is a listing of the Company’s outstanding debt, including capital leases and lease financing obligations, as of December 31, 2016 and 2015 (in thousands):
|
|
|
Weighted Average |
|
|
|
|
|
|
|
|
|
|
|
Coupon Interest Rate at |
|
|
|
December 31, |
|
December 31, |
||
|
|
|
December 31, 2016 |
|
Maturities |
|
2016 |
|
2015 |
||
|
Unsecured Credit Facility |
|
|
|
|
|
|
|
|
|
|
|
Revolving Credit Facility |
|
2.22% |
|
December 17, 2020 |
|
$ |
139,000 |
|
$ |
224,002 |
|
Term Loan I |
|
2.19% |
|
December 17, 2021 |
|
|
300,000 |
|
|
150,000 |
|
Term Loan II |
|
2.25% |
|
April 27, 2022 |
|
|
200,000 |
|
|
150,000 |
|
Senior Notes |
|
5.88% |
|
August 1, 2022 |
|
|
300,000 |
|
|
300,000 |
|
Capital Lease and Lease Financing Obligations |
|
3.52% |
|
2017 - 2025 |
|
|
38,708 |
|
|
49,761 |
|
|
|
3.39% |
|
|
|
|
977,708 |
|
|
873,763 |
|
Less discount and net debt issuance costs |
|
|
|
|
|
|
(11,882) |
|
|
(12,194) |
|
Total outstanding debt, net |
|
|
|
|
|
$ |
965,826 |
|
$ |
861,569 |
Credit Facilities, Senior Notes and Mortgage Notes Payable
(a) Unsecured Credit Facility – In October 2015, the Company amended and restated its unsecured credit facility, increasing the total capacity by $250 million and extending the term. At the same time, the Company terminated its secured credit facility relating to the Richmond data center. The amended unsecured credit facility had a total capacity
F-29
of $900 million and included a $150 million term loan which was expected to mature on December 17, 2020, another $150 million term loan which was expected to mature on April 27, 2021, and a $600 million revolving credit facility which was expected to mature on December 17, 2019, with a one year extension option. The amended unsecured credit facility also included a $200 million accordion feature. Under the amended unsecured credit facility, the capacity could be increased from $900 million to $1.1 billion subject to certain conditions set forth in the credit agreement, including the consent of the administrative agent and obtaining necessary commitments.
In December 2016, the Company further amended and restated its unsecured credit facility, increasing the total capacity by $300 million and extending the term. The amended unsecured credit facility has a total capacity of $1.2 billion and includes a $300 million term loan which matures on December 17, 2021, another $200 million term loan which matures on April 27, 2022, and a $700 million revolving credit facility which matures on December 17, 2020, with a one year extension option. Amounts outstanding under the amended unsecured credit facility bear interest at a variable rate equal to, at the Company’s election, LIBOR or a base rate, plus a spread that will vary depending upon the Company’s leverage ratio. For revolving credit loans, the spread ranges from 1.55% to 2.15% for LIBOR loans and 0.55% to 1.15% for base rate loans. For term loans, the spread ranges from 1.50% to 2.10% for LIBOR loans and 0.50% to 1.10% for base rate loans. The amended unsecured credit facility also includes a $300 million accordion feature.
Under the amended unsecured credit facility, the capacity may be increased from the current capacity of $1.2 billion to $1.5 billion subject to certain conditions set forth in the credit agreement, including the consent of the administrative agent and obtaining necessary commitments. As of December 31, 2016, the weighted average interest rate for amounts outstanding under the unsecured credit facility was 2.22%. The Company is also required to pay a commitment fee to the lenders assessed on the unused portion of the unsecured revolving credit facility. At the Company’s election, it can prepay amounts outstanding under the unsecured credit facility, in whole or in part, without penalty or premium.
The Company’s ability to borrow under the amended unsecured credit facility is subject to ongoing compliance with a number of customary affirmative and negative covenants, including limitations on liens, mergers, consolidations, investments, distributions, asset sales and affiliate transactions, as well as the following financial covenants: (i) the Operating Partnership's and its subsidiaries' consolidated total unsecured debt plus any capitalized lease obligations with respect to the unencumbered asset pool properties may not exceed 60% of the unencumbered asset pool value (or 65% of the unencumbered asset pool value for up to two consecutive fiscal quarters immediately following a material acquisition for which the Operating Partnership has provided written notice to the Agent; provided the two fiscal quarter period includes the quarter in which the material acquisition was consummated); (ii) the unencumbered asset pool debt yield cannot be less than 14% (or 12.5% for the two consecutive fiscal quarters immediately following a material acquisition for which the Operating Partnership has provided written notice to the Agent; provided the two fiscal quarter period includes the quarter in which the material acquisition was consummated); (iii) QTS must maintain a minimum fixed charge coverage ratio (defined as the ratio of consolidated EBITDA, subject to certain adjustments, to consolidated fixed charges) for the prior two most recently-ended calendar quarters of 1.70 to 1.00; (iv) QTS must maintain a maximum debt to gross asset value (as defined in the amended and restated agreement) ratio of 60% (or 65% for the two consecutive fiscal quarters immediately following a material acquisition for which the Operating Partnership has provided written notice to the Agent; provided the two fiscal quarter period includes the quarter in which the material acquisition was consummated); (v) QTS must maintain tangible net worth (as defined in the amended and restated agreement) cannot be less than the sum of $1,179,931,500 plus 75% of the net proceeds from any future equity offerings; and (vi) a maximum distribution payout ratio of the greater of (i) 95% of the Company’s Funds from Operations (as defined in the amended and restated agreement) and (ii) the amount required for the Company to qualify as a REIT under the Code.
The availability under the revolving credit facility is the lesser of (i) $700 million, (ii) 60% of the unencumbered asset pool capitalized value (or 65% of the unencumbered asset pool capitalized value for the two consecutive fiscal quarters immediately following a material acquisition for which the Operating Partnership has provided written notice to the Agent; provided the two fiscal quarter period includes the quarter in which the material acquisition was consummated) and (iii) the amount resulting in an unencumbered asset pool debt yield of 14% (or 12.5% for the two consecutive fiscal quarters immediately following a material acquisition for which the Operating Partnership has provided written notice to the Agent; provided the two fiscal quarter period includes the quarter in which the material acquisition was consummated). In the case of clauses (ii) and (iii) of the preceding sentence, the amount available under the revolving
F-30
credit facility is adjusted to take into account any other unsecured debt and certain capitalized leases. A material acquisition is an acquisition of properties or assets with a gross purchase price equal to or in excess of 15% of the Operating Partnership's gross asset value (as defined in the amended and restated agreement) as of the end of the most recently ended quarter for which financial statements are publicly available. The availability of funds under the unsecured credit facility depends on compliance with certain covenants.
As of December 31, 2016, the Company had outstanding $639.0 million of indebtedness under the amended unsecured credit facility, consisting of $139.0 million of outstanding borrowings under the unsecured revolving credit facility and $500.0 million outstanding under the term loans, exclusive of net debt issuance costs of $4.1 million. In connection with the unsecured credit facility, as of December 31, 2016, the Company had an additional $1.5 million letter of credit outstanding. In addition, the Company entered into two additional letters of credit in June 2016 related to the Chicago facility and Piscataway facility in the amounts of $0.5 million and $0.1 million, respectively.
(b) Senior Notes – On July 23, 2014, the Operating Partnership and QTS Finance Corporation, a subsidiary of the Operating Partnership formed solely for the purpose of facilitating the offering of the notes described below (collectively, the “Issuers”), issued $300 million aggregate principal amount of 5.875% Senior Notes due 2022 (the “Senior Notes”). The Senior Notes have an interest rate of 5.875% per annum, were issued at a price equal to 99.211% of their face value and mature on August 1, 2022. The proceeds from the offering were used to repay amounts outstanding under the unsecured credit facility, including $75 million outstanding under the term loan. As of December 31, 2016, the discount recorded on the Senior Notes was $1.8 million and the outstanding net debt issuance costs associated with the Senior Notes were $6.1 million.
The Senior Notes are unconditionally guaranteed, jointly and severally, on a senior unsecured basis by all of the Operating Partnership’s existing subsidiaries (other than foreign subsidiaries, receivables entities and 2470 Satellite Boulevard, LLC, which is a Delaware limited liability company formed in December 2015 that acquired an office building in Duluth, Georgia and has de minimis operations) and future subsidiaries that guarantee any indebtedness of QTS Realty Trust, Inc., the Issuers or any other subsidiary guarantor. QTS Realty Trust, Inc. does not guarantee the Senior Notes and will not be required to guarantee the Senior Notes except under certain circumstances. The offering was conducted pursuant to Rule 144A of the Securities Act of 1933, as amended, and the Senior Notes were issued pursuant to an indenture, dated as of July 23, 2014, among the Operating Partnership, QTS Finance Corporation, the Company, the guarantors named therein, and Deutsche Bank Trust Company Americas, as trustee (the “Indenture”).
On March 23, 2015, the SEC declared effective the Operating Partnership and QTS Finance Corporation’s registration statement on Form S-4 pursuant to which the issuers exchanged the originally issued Senior Notes for $300 million of 5.875% Senior Notes due 2022 (the “Exchange Notes”) that are registered under the Securities Act of 1933, as amended. The exchange offer was completed on April 23, 2015, and all outstanding originally issued Senior Notes were tendered. The Exchange Notes did not provide the Company with any additional proceeds and satisfied its obligations under a registration rights agreement entered into in connection with the issuance of the Senior Notes.
The annual remaining principal payment requirements as of December 31, 2016 per the contractual maturities and excluding extension options, capital leases and lease financing obligations, are as follows (in thousands):
|
|
|
|
|
|
2017 |
|
$ |
— |
|
2018 |
|
|
— |
|
2019 |
|
|
— |
|
2020 |
|
|
139,000 |
|
2021 |
|
|
300,000 |
|
Thereafter |
|
|
500,000 |
|
Total |
|
$ |
939,000 |
As of December 31, 2016, the Company was in compliance with all of its covenants.
F-31
Capital Leases
The Company has historically entered into capital leases for certain equipment. In addition, through its acquisition of Carpathia on June 16, 2015, the Company acquired capital leases of both equipment and certain properties. Total outstanding liabilities for capital leases were $18.1 million as of December 31, 2016, of which $11.2 million were assumed through the Carpathia acquisition, all of which was related to the lease of real property. Carpathia had entered into capital lease arrangements for datacenter space under two lease agreements expiring in 2018 and 2019 at its Harrisonburg, Virginia and Ashburn, Virginia locations. Total recurring monthly payments range from approximately $0.2 million to $0.5 million during the terms of the leases, in addition to payments made for utilities. Depreciation related to the associated assets for the capital leases is included in depreciation and amortization expense in the Statements of Operations and Comprehensive Income.
Lease Financing Obligations
Through the acquisition of Carpathia, the Company acquired lease financing obligations totaling $20.6 million at December 31, 2016, of which $19.0 million related to a sale-leaseback transaction where Carpathia has continuing involvement. On December 23, 2011, Carpathia sold the shell of a building and the associated land to an unrelated third party. Carpathia leases the property back and is a party to an agreement with the same third party to construct a new building on the adjoining property for use as a data center. Carpathia is primarily responsible for financing the improvements and outfitting the building with the necessary equipment. The third party leases back the new building in stages to Carpathia as the various stages are completed. In accordance with ASC 840-40, Leases, Carpathia has continuing involvement with the related leased assets; therefore, the Company will continue to account for the existing building shell and the associated land as fixed assets and will capitalize the construction costs of the new building. The financing obligation related to the building and equipment was $17.5 million at December 31, 2016. In addition, due to Carpathia’s continuing involvement, it was required to defer a gain on the sale of the assets. The deferred gain was $1.5 million at December 31, 2016, and is also included in lease financing obligations.
The financing obligation is reduced as rental payments are made on the existing building, which payments started in January 2012. Rental payments, which include amounts attributable to both principal and interest, increased to approximately $0.2 million per month in March 2013, which is when the newly constructed building was inhabited by Carpathia. Depreciation expense on the related asset is included in depreciation and amortization expense in the Statements of Operations and Comprehensive Income.
The Company, through its acquisition of Carpathia, also has a lease financing agreement in connection with a $4.8 million tenant improvement allowance on one of its data center lease agreements. The financing requires monthly payments of principal and interest of less than $0.1 million through February 2019. The outstanding balance on the financing agreement was $1.6 million as of December 31, 2016. Depreciation expense on the related leasehold improvements is included in depreciation and amortization expense in the Statements of Operations and Comprehensive Income.
The following table summarizes the Company’s combined future payment obligations, excluding interest, as of December 31, 2016, on the capital leases and lease financing obligations above (in thousands):
|
|
|
|
|
|
2017 |
|
$ |
12,944 |
|
2018 |
|
|
9,370 |
|
2019 |
|
|
2,844 |
|
2020 |
|
|
2,190 |
|
2021 |
|
|
2,388 |
|
Thereafter |
|
|
8,972 |
|
Total |
|
$ |
38,708 |
F-32
6. Commitments and Contingencies
The Company is subject to various routine legal proceedings and other matters in the ordinary course of business. One of the Company’s subsidiaries, Carpathia Hosting, LLC (“Carpathia”), was named as a defendant in a lawsuit filed in state court in New York. Carpathia’s customer, Portal Healthcare Solutions (“Portal Ascend”) allegedly had a security breach between November 2012 and March 2013. Portal Ascend has agreed to indemnify Carpathia in this litigation and has provided legal counsel to defend Carpathia. The litigation is in the earliest stages, thus this litigation is neither probable nor reasonably estimable.
7. Partners’ Capital, Equity and Incentive Compensation Plans
QualityTech, LP
QTS has the full power and authority to do all the things necessary to conduct the business of the Operating Partnership.
As of December 31, 2016, the Operating Partnership had two classes of limited partnership units outstanding: Class A units of limited partnership interest (“Class A units”) and Class O LTIP units of limited partnership units (“Class O units”). The Operating Partnership previously had outstanding Class RS LTIP units of limited partnership interest (“Class RS units”) which have all been converted to Class A units during the year ended December 31, 2016. The Class A units are now redeemable at any time for cash or shares of Class A common stock of QTS. The Company may in its sole discretion elect to assume and satisfy the redemption amount with cash or its shares. Class RS units or Class O units were issued upon grants made under the QualityTech, LP 2010 Equity Incentive Plan (the “2010 Equity Incentive Plan”). Class RS units and Class O units may be subject to vesting and are pari passu with Class A units. Each Class RS unit and Class O unit is convertible into Class A units by the Operating Partnership at any time or by the holder at any time following full vesting (if such unit is subject to vesting) based on formulas contained in the partnership agreement.
QTS Realty Trust, Inc.
In connection with its IPO, QTS issued Class A common stock and Class B common stock. Class B common stock entitles the holder to 50 votes per share and was issued to enable the Company’s Chief Executive Officer to exchange 2% of his Operating Partnership units so he may have a vote proportionate to his economic interest in the Company. Also in connection with its IPO, QTS adopted the QTS Realty Trust, Inc. 2013 Equity Incentive plan (the “2013 Equity Incentive Plan”), which authorized 1.75 million shares of Class A common stock to be issued under the plan, including options to purchase Class A common stock, restricted Class A common stock, Class O units, and Class RS units. In May 2015, the total number of shares available for issuance under the 2013 Equity Incentive Plan was increased to 4,750,000.
F-33
The following is a summary of award activity under the 2010 Equity Incentive Plan and 2013 Equity Incentive Plan and related information for the years ended December 31, 2016, 2015 and 2014:
|
|
|
|
2010 Equity Incentive Plan |
|
2013 Equity Incentive Plan |
||||||||||||||||||||||
|
|
|
|
|
|
|
|
|
|
|
|
|
|
Weighted |
|
|
|
|
|
|
Weighted |
|
|
|
Weighted |
|||
|
|
|
|
|
|
Weighted |
|
Weighted |
|
|
|
average |
|
|
|
Weighted |
|
average |
|
|
|
average |
||||||
|
|
|
|
Number of |
|
average |
|
Average fair |
|
Number of |
|
Grant date |
|
|
|
average |
|
fair |
|
Restricted |
|
Grant date |
||||||
|
|
|
|
Class O units |
|
exercise price |
|
value |
|
Class RS units |
|
value |
|
Options |
|
exercise price |
|
value |
|
Stock |
|
value |
||||||
|
|
|
|
|
|
|
|
|
|
|
|
|
|
|
|
|
|
|
|
|
|
|
|
|
|
|
|
|
|
Outstanding at January 1, 2014 |
|
|
1,622,747 |
|
$ |
23.44 |
|
$ |
3.84 |
|
173,750 |
|
$ |
24.31 |
|
367,910 |
|
$ |
21.00 |
|
$ |
3.50 |
|
108,629 |
|
$ |
21.00 |
|
Granted |
|
|
— |
|
|
— |
|
|
— |
|
— |
|
|
— |
|
238,039 |
|
|
25.59 |
|
|
4.96 |
|
172,102 |
|
|
32.66 |
|
Exercised/Vested (1) |
|
|
(15,750) |
|
|
20.71 |
|
|
4.75 |
|
— |
|
|
— |
|
(3,000) |
|
|
21.00 |
|
|
3.52 |
|
(25,786) |
|
|
21.00 |
|
Released from restriction (2) |
|
|
— |
|
|
— |
|
|
— |
|
(99,125) |
|
|
24.94 |
|
— |
|
|
— |
|
|
— |
|
— |
|
|
— |
|
Cancelled/Expired (3) |
|
|
(88,280) |
|
|
23.01 |
|
|
5.23 |
|
— |
|
|
— |
|
(18,000) |
|
|
21.00 |
|
|
3.52 |
|
(8,160) |
|
|
21.00 |
|
Outstanding at December 31, 2014 |
|
|
1,518,717 |
|
$ |
23.49 |
|
$ |
3.75 |
|
74,625 |
|
$ |
23.49 |
|
584,949 |
|
$ |
22.87 |
|
$ |
4.10 |
|
246,785 |
|
$ |
29.13 |
|
Granted |
|
|
— |
|
|
— |
|
|
— |
|
— |
|
|
— |
|
317,497 |
|
|
36.16 |
|
|
8.03 |
|
230,271 |
|
|
36.71 |
|
Exercised/Vested (1) |
|
|
(222,499) |
|
|
22.02 |
|
|
4.18 |
|
— |
|
|
— |
|
(23,157) |
|
|
21.30 |
|
|
3.63 |
|
(54,400) |
|
|
28.37 |
|
Released from restriction (2) |
|
|
— |
|
|
— |
|
|
— |
|
(34,750) |
|
|
25.00 |
|
— |
|
|
— |
|
|
— |
|
— |
|
|
— |
|
Cancelled/Expired (3) |
|
|
(3,319) |
|
|
20.00 |
|
|
3.92 |
|
— |
|
|
— |
|
(11,407) |
|
|
21.00 |
|
|
3.52 |
|
(27,748) |
|
|
28.33 |
|
Outstanding at December 31, 2015 |
|
|
1,292,899 |
|
$ |
23.76 |
|
$ |
3.68 |
|
39,875 |
|
$ |
22.18 |
|
867,882 |
|
$ |
27.80 |
|
$ |
5.56 |
|
394,908 |
|
$ |
33.82 |
|
Granted |
|
|
— |
|
|
— |
|
|
— |
|
— |
|
|
— |
|
229,693 |
|
|
45.78 |
|
|
9.91 |
|
237,563 |
|
|
45.53 |
|
Exercised/Vested (1) |
|
|
(158,088) |
|
|
21.56 |
|
|
4.18 |
|
— |
|
|
— |
|
(29,543) |
|
|
25.70 |
|
|
4.96 |
|
(122,136) |
|
|
33.26 |
|
Released from restriction (2) |
|
|
— |
|
|
— |
|
|
— |
|
(39,875) |
|
|
22.18 |
|
— |
|
|
— |
|
|
— |
|
— |
|
|
— |
|
Cancelled/Expired (3) |
|
|
— |
|
|
— |
|
|
— |
|
— |
|
|
— |
|
(9,735) |
|
|
32.14 |
|
|
6.95 |
|
(95,644) |
|
|
33.92 |
|
Outstanding at December 31, 2016 |
|
|
1,134,811 |
|
$ |
24.06 |
|
$ |
3.62 |
|
— |
|
$ |
— |
|
1,058,297 |
|
$ |
31.72 |
|
$ |
6.51 |
|
414,691 |
|
$ |
40.67 |
|
(1) |
This represents the Class A common stock that has been released from restriction and which was not surrendered by the holder to satisfy their statutory minimum federal and state tax obligations associated with the vesting of restricted common stock. This also represents Class O units which were converted to Class A units and Options to purchase Class A common stock which were exercised for their respective columns. |
|
(2) |
This represents Class RS units that upon vesting have converted to Operating Partnership units. |
|
(3) |
Includes restricted Class A common stock surrendered by certain employees to satisfy their statutory minimum federal and state tax obligations associated with the vesting of restricted common stock. |
The assumptions and fair values for Class O units, restricted stock and options to purchase shares of Class A common stock granted for the years ended December 31, 2016, 2015 and 2014 are included in the following table on a per unit basis. Class O units and options to purchase shares of Class A common stock were valued using the Black-Scholes model.
|
|
|
2016 |
|
2015 |
|
2014 |
|||
|
Fair value of restricted stock granted |
|
|
$45.78-$56.28 |
|
|
$35.81-$37.69 |
|
|
$25.51-$35.51 |
|
Fair value of options granted |
|
|
$9.57-$9.97 |
|
|
$8.00-$8.77 |
|
|
$4.94-$5.98 |
|
Expected term (years) |
|
|
5.5-5.9 |
|
|
5.5-6.1 |
|
|
5.5-6.1 |
|
Expected volatility |
|
|
30.7%-31.3% |
|
|
33% |
|
|
33% |
|
Expected dividend yield |
|
|
3.14% |
|
|
3.40%-3.57% |
|
|
4.02%-4.55% |
|
Expected risk-free interest rates |
|
|
1.42%-1.48% |
|
|
1.67%-1.94% |
|
|
1.7%-1.9% |
The following tables summarize information about awards outstanding as of December 31, 2016.
|
|
|
Operating Partnership Awards Outstanding |
|||||
|
|
|
|
|
|
|
|
Weighted average |
|
|
|
|
|
|
Awards |
|
remaining |
|
|
|
Exercise prices |
|
outstanding |
|
vesting period (years) |
|
|
Class O Units |
|
$ |
20.00-25.00 |
|
1,134,811 |
|
— |
|
Total Operating Partnership awards outstanding |
|
|
|
|
1,134,811 |
|
|
F-34
|
|
|
|
QTS Realty Trust, Inc. Awards Outstanding |
||||
|
|
|
|
|
|
|
|
Weighted average |
|
|
|
|
|
|
Awards |
|
remaining |
|
|
|
Exercise prices |
|
outstanding |
|
vesting period (years) |
|
|
Restricted stock |
|
$ |
— |
|
414,691 |
|
1.6 |
|
Options to purchase Class A common stock |
|
$ |
21.00-45.78 |
|
1,058,297 |
|
0.9 |
|
Total QTS Realty Trust, Inc. awards outstanding |
|
|
|
|
1,472,988 |
|
|
All nonvested LTIP unit awards are valued as of the grant date and generally vest ratably over a defined service period. Certain nonvested LTIP unit awards vest on the earlier of achievement by the Company of various performance goals or specified dates in 2015 and 2016. As of December 31, 2016 there were 0.1 million, 0.4 million and 0.4 million nonvested Class O units, restricted Class A common stock and options to purchase Class A common stock outstanding, respectively. As of December 31, 2016, there were no Class RS units outstanding. As of December 31, 2016 the Company had $16.2 million of unrecognized equity-based compensation expense which will be recognized over the remaining vesting period of up to 4 years. The total intrinsic value of the awards outstanding at December 31, 2016 was $66.9 million.
Dividends and Distributions
The following tables present quarterly cash dividends and distributions paid to QTS’ common stockholders and the Operating Partnership’s unit holders for the years ended December 31, 2016 and 2015:
|
Year Ended December 31, 2016 |
||||||||
|
|
|
|
|
|
|
|
Aggregate |
|
|
|
|
|
|
Per Common Share and |
|
Dividend/Distribution |
||
|
Record Date |
|
Payment Date |
|
Per Unit Rate |
|
Amount (in millions) |
||
|
September 20, 2016 |
|
October 5, 2016 |
|
$ |
0.36 |
|
$ |
19.7 |
|
June 17, 2016 |
|
July 6, 2016 |
|
|
0.36 |
|
|
19.7 |
|
March 18, 2016 |
|
April 5, 2016 |
|
|
0.36 |
|
|
17.4 |
|
December 17, 2015 |
|
January 6, 2016 |
|
|
0.32 |
|
|
15.4 |
|
|
|
|
|
$ |
1.40 |
|
$ |
72.2 |
|
Year Ended December 31, 2015 |
||||||||
|
|
|
|
|
|
|
|
Aggregate |
|
|
|
|
|
|
Per Common Share and |
|
Dividend/Distribution |
||
|
Record Date |
|
Payment Date |
|
Per Unit Rate |
|
Amount (in millions) |
||
|
September 18, 2015 |
|
October 6, 2015 |
|
$ |
0.32 |
|
$ |
15.3 |
|
June 19, 2015 |
|
July 8, 2015 |
|
|
0.32 |
|
|
15.3 |
|
March 20, 2015 |
|
April 7, 2015 |
|
|
0.32 |
|
|
13.4 |
|
December 19, 2014 |
|
January 7, 2015 |
|
|
0.29 |
|
|
10.7 |
|
|
|
|
|
$ |
1.25 |
|
$ |
54.7 |
Additionally, on January 5, 2017, the Company paid its regular quarterly cash dividend of $0.36 per common share and per unit in the Operating Partnership to stockholders and unit holders of record as of the close of business on December 16, 2016.
Equity Issuances
In March 2016, QTS filed an automatic shelf registration statement on Form S-3 with the SEC. Effective upon filing, the shelf provides for the potential sale of an unspecified amount of QTS’ Class A common stock, preferred stock, depositary shares representing preferred stock, warrants and rights to purchase QTS common stock or any combination thereof, subject to the ability of QTS to effect offerings on satisfactory terms based on prevailing conditions. Pursuant to this shelf registration, on April 1, 2016, the Company issued 6,325,000 shares of QTS’ Class A common stock at a price of $45.50 per share in an underwritten public offering, including the exercise in full of the underwriters’ option to
F-35
purchase an additional 825,000 shares. The Company used substantially all of the net proceeds of approximately $276 million to repay amounts outstanding under its unsecured revolving credit facility.
QTS Realty Trust, Inc. Employee Stock Purchase Plan
In June 2015, the Company established the QTS Realty Trust, Inc. Employee Stock Purchase Plan (the “Plan”) to give eligible employees the opportunity to purchase, through payroll deductions, shares of the Company’s Class A common stock in the open market by an independent broker selected by the Company’s board of directors or the plan’s administrator. Eligible employees include employees of the Company and its majority-owned subsidiaries (excluding executives) who have been employed for at least thirty days and who perform at least thirty hours of service per week for the Company. The Plan became effective July 1, 2015 and is administered by the board of directors or by a committee of one or more persons appointed by the board of directors. The Company has reserved 250,000 shares for purchase under the Plan and has also agreed to pay the brokerage commissions and fees associated with a Plan participant's purchase of shares. An eligible employee may deduct a minimum of $40 per month and a maximum of $2,000 per month towards the purchase of shares. On June 17, 2015, the Company filed a registration statement on Form S-8 to register the 250,000 shares of the Company’s Class A common stock related to the Plan.
8. Related Party Transactions
The Company periodically executes transactions with entities affiliated with its Chairman and Chief Executive Officer. Such transactions include automobile, furniture and equipment purchases as well as building operating lease payments and receipts, and reimbursement for the use of a private aircraft service by the Company’s officers and directors.
The transactions which occurred during the years ended December 31, 2016, 2015 and 2014 are outlined below (in thousands):
|
|
|
December 31, |
|||||||
|
(dollars in thousands) |
|
2016 |
|
2015 |
|
2014 |
|||
|
|
|
|
|
|
|
|
|
|
|
|
Tax, utility, insurance and other reimbursement |
|
$ |
878 |
|
$ |
589 |
|
$ |
692 |
|
Rent expense |
|
|
1,014 |
|
|
1,014 |
|
|
1,026 |
|
Capital assets acquired |
|
|
323 |
|
|
261 |
|
|
266 |
|
Total |
|
$ |
2,215 |
|
$ |
1,864 |
|
$ |
1,984 |
9. Employee Benefit Plan
The Company sponsors a defined contribution 401(k) retirement plan covering all eligible employees.
Qualified employees may elect to contribute to the 401(k) Plan on a pre-tax basis. The maximum amount of employee contribution is subject only to statutory limitations. Beginning in 2005 the Company made contributions at a rate of 25% of the first 4% of employee compensation contributed. Starting on January 1, 2014, the Company began making contributions at a rate of 50% on an additional 2% of contributions made by employees, up to 6%. As a result, the Company was matching 25% of the first 4% of employee contributions and 50% of employee contributions between 4% and 6% during 2014. Starting on January 1, 2015, the Company revised its contribution structure, and during 2015 was matching 50% of the first 6% of contributions made by employees. Starting on January 1, 2016, the Company revised its contribution structure, and during 2016 was matching 100% of the first 1% of contributions and 50% of the next 5% of contributions made by employees. The Company contributed $2.5 million, $1.3 million and $0.6 million to the 401(k) Plan for the years ended December 31, 2016, 2015 and 2014, respectively.
10. Noncontrolling Interest
Concurrently with the completion of the IPO, QTS consummated a series of transactions pursuant to which QTS became the sole general partner and majority owner of QualityTech, LP, which then became its operating partnership. The previous owners of QualityTech, LP retained 21.2% ownership of the Operating Partnership.
F-36
Commencing at any time beginning November 1, 2014, at the election of the holders of the noncontrolling interest, the Class A units are redeemable for cash or, at the election of the Company, Class A common stock of the Company on a one-for-one basis. During the year ended December 31, 2016, approximately 120,000 Class A units were redeemed for the Company’s Class A common stock. As a result of these redemptions of Class A units into common stock and the issuance of additional common stock, the noncontrolling ownership interest of QualityTech, LP was 12.4% at December 31, 2016 compared to 14.2% at December 31, 2015.
11. Earnings per share of QTS Realty Trust, Inc.
Basic income per share is calculated by dividing the net income attributable to common shares by the weighted average number of common shares outstanding during the period. Diluted income per share adjusts basic income per share for the effects of potentially dilutive common shares.
The computation of basic and diluted net income per share is as follows (in thousands, except per share data):
|
|
|
Year Ended |
|||||||
|
|
|
December 31, |
|||||||
|
|
|
2016 |
|
2015 |
|
2014 |
|||
|
Numerator: |
|
|
|
|
|
|
|
|
|
|
Net income available to common stockholders - basic |
|
$ |
21,525 |
|
$ |
20,326 |
|
$ |
15,072 |
|
Effect of net income attributable to noncontrolling interests |
|
|
3,160 |
|
|
3,803 |
|
|
4,031 |
|
Net income available to common stockholders - diluted |
|
$ |
24,685 |
|
$ |
24,129 |
|
$ |
19,103 |
|
Denominator: |
|
|
|
|
|
|
|
|
|
|
Weighted average shares outstanding - basic |
|
|
46,206 |
|
|
37,568 |
|
|
29,055 |
|
Effect of Class A and Class RS partnership units * |
|
|
6,783 |
|
|
7,029 |
|
|
7,770 |
|
Effect of Class O units and options to purchase Class A common stock on an "as if" converted basis * |
|
|
973 |
|
|
756 |
|
|
309 |
|
Weighted average shares outstanding - diluted |
|
|
53,962 |
|
|
45,353 |
|
|
37,134 |
|
|
|
|
|
|
|
|
|
|
|
|
Net income per share attributable to common stockholders - basic |
|
$ |
0.47 |
|
$ |
0.54 |
|
$ |
0.52 |
|
Net income per share attributable to common stockholders - diluted |
|
$ |
0.46 |
|
$ |
0.53 |
|
$ |
0.51 |
|
* |
The Class A units, Class RS units and Class O units represent limited partnership interests in the Operating Partnership, and are described in more detail in Note 7 |
No securities were antidilutive for the years ended December 31, 2016, 2015 and 2014, and as such, no securities were excluded from the computation of diluted net income per share for those periods.
12. Operating Leases, as Lessee
The Company leases and/or licenses several data center facilities and related equipment, its corporate headquarters and additional office space. Many of the data center facilities that the Company leases were acquired in 2015 through its acquisition of Carpathia. In addition, the Company has entered into a long-term ground sublease for its Santa Clara property through October 2052. Rent expense for the aforementioned leases was $20.1 million, $14.6 million and $5.9 million for the years ended December 31, 2016, 2015 and 2014, respectively, and is classified in property operating costs and general and administrative expenses in the accompanying Statements of Operations and Comprehensive Income. The Company recorded $0.1 million of capitalized rent for the year ended December 31, 2016. The Company recorded
F-37
no capitalized rent for the years ended December 31, 2015 and 2014. The future non-cancellable minimum rental payments required under operating leases and/or licenses at December 31, 2016 are as follows (in thousands):
|
Year Ending December 31, |
|
|
|
|
2017 |
|
$ |
16,344 |
|
2018 |
|
|
12,004 |
|
2019 |
|
|
10,108 |
|
2020 |
|
|
9,708 |
|
2021 |
|
|
9,919 |
|
Thereafter |
|
|
73,467 |
|
Total |
|
$ |
131,550 |
13. Customer Leases, as Lessor
Future minimum lease payments to be received under non-cancelable operating customer leases (inclusive of payments for contracts which have not yet commenced and exclusive of recoveries of operating costs from customers) are as follows for the years ending December 31 (in thousands):
|
2017 |
|
$ |
311,946 |
|
2018 |
|
|
229,567 |
|
2019 |
|
|
149,144 |
|
2020 |
|
|
102,917 |
|
2021 |
|
|
85,467 |
|
Thereafter |
|
|
117,216 |
|
Total |
|
$ |
996,257 |
14. Fair Value of Financial Instruments
ASC Topic 825 requires disclosure of fair value information about financial instruments, whether or not recognized in the consolidated balance sheets, for which it is practicable to estimate that value. In cases where quoted market prices are not available, fair values are based upon the application of discount rates to estimated future cash flows based upon market yields or by using other valuation methodologies. Considerable judgment is necessary to interpret market data and develop estimated fair value. Accordingly, fair values are not necessarily indicative of the amounts the Company could realize on disposition of the financial instruments. The use of different market assumptions and/or estimation methodologies may have a material effect on estimated fair value amounts.
Short-term instruments: The carrying amounts of cash and cash equivalents and restricted cash approximate fair value.
Credit facility and Senior Notes: The Company’s unsecured credit facility did not have interest rates which were materially different than current market conditions and therefore, the fair value approximated the carrying value. The fair value of the Company’s Senior Notes was estimated using Level 2 “significant other observable inputs,” primarily based on quoted market prices for the same or similar issuances. At December 31, 2016, the fair value of the Senior Notes was approximately $304.9 million.
Other debt instruments: The fair value of the Company’s other debt instruments (including capital leases and lease financing obligations) were estimated in the same manner as the unsecured credit facility and mortgage notes payable above. Similarly, each of these instruments did not have interest rates which were materially different than current market conditions and therefore, the fair value of each instrument approximated the respective carrying values.
F-38
15. Quarterly Financial Information (unaudited)
The tables below reflect the selected quarterly information for the years ended December 31, 2016 and 2015 for QTS (in thousands except share data):
|
|
|
Three Months Ended |
||||||||||
|
|
|
December 31, |
|
September 30, |
|
June 30, |
|
March 31, |
||||
|
2016 |
|
|
|
|
|
|
|
|
|
|
|
|
|
Revenues |
|
$ |
105,443 |
|
$ |
103,465 |
|
$ |
98,687 |
|
$ |
94,768 |
|
Operating income |
|
|
11,092 |
|
|
8,505 |
|
|
8,225 |
|
|
10,235 |
|
Net income |
|
|
5,481 |
|
|
6,538 |
|
|
5,807 |
|
|
6,859 |
|
Net income attributable to common shares |
|
|
4,806 |
|
|
5,730 |
|
|
5,100 |
|
|
5,889 |
|
Net income per share attributable to common shares - basic |
|
|
0.10 |
|
|
0.12 |
|
|
0.11 |
|
|
0.14 |
|
Net income per share attributable to common shares - diluted |
|
|
0.10 |
|
|
0.12 |
|
|
0.10 |
|
|
0.14 |
|
|
|
|
|
|
|
|
|
|
|
|
|
|
|
2015 |
|
|
|
|
|
|
|
|
|
|
|
|
|
Revenues |
|
$ |
92,690 |
|
$ |
88,890 |
|
$ |
68,117 |
|
$ |
61,386 |
|
Operating income |
|
|
7,243 |
|
|
11,095 |
|
|
7,266 |
|
|
10,379 |
|
Net income |
|
|
5,334 |
|
|
8,238 |
|
|
5,520 |
|
|
5,037 |
|
Net income attributable to common shares |
|
|
4,603 |
|
|
7,009 |
|
|
4,632 |
|
|
4,082 |
|
Net income per share attributable to common shares - basic |
|
|
0.11 |
|
|
0.17 |
|
|
0.13 |
|
|
0.13 |
|
Net income per share attributable to common shares - diluted |
|
|
0.11 |
|
|
0.17 |
|
|
0.12 |
|
|
0.13 |
The table below reflects the selected quarterly information for the years ended December 31, 2016 and 2015 for the Operating Partnership (in thousands):
|
|
|
Three Months Ended |
||||||||||
|
|
|
December 31, |
|
September 30, |
|
June 30, |
|
March 31, |
||||
|
2016 |
|
|
|
|
|
|
|
|
|
|
|
|
|
Revenues |
|
$ |
105,443 |
|
$ |
103,465 |
|
$ |
98,687 |
|
$ |
94,768 |
|
Operating income |
|
|
11,092 |
|
|
8,505 |
|
|
8,225 |
|
|
10,235 |
|
Net income |
|
|
5,481 |
|
|
6,538 |
|
|
5,807 |
|
|
6,859 |
|
|
|
|
|
|
|
|
|
|
|
|
|
|
|
2015 |
|
|
|
|
|
|
|
|
|
|
|
|
|
Revenues |
|
$ |
92,690 |
|
$ |
88,890 |
|
$ |
68,117 |
|
$ |
61,386 |
|
Operating income |
|
|
7,243 |
|
|
11,095 |
|
|
7,266 |
|
|
10,379 |
|
Net income |
|
|
5,334 |
|
|
8,238 |
|
|
5,520 |
|
|
5,037 |
16. Subsequent Events
On January 5, 2017, the Company paid its regular quarterly cash dividend of $0.36 per common share and per unit in the Operating Partnership to stockholders and unit holders of record as of the close of business on December 16, 2016.
On February 17, 2017, the Company announced that its board of directors authorized payment of a regular quarterly cash dividend of $0.39 per common share and per unit in the Operating Partnership, payable on April 5, 2017, to stockholders and unit holders of record as of the close of business on March 16, 2017.
F-39
QTS REALTY TRUST, INC.
QUALITYTECH, LP
CONSOLIDATED FINANCIAL STATEMENTS
SCHEDULE II – VALUATION AND QUALIFYING ACCOUNTS
December 31, 2016
|
|
|
Balance at |
|
|
|
|
|
|
|
Balance at |
||
|
Year Ended December 31, |
|
beginning of |
|
Charge to |
|
Additions/ |
|
end of |
||||
|
(dollars in thousands) |
|
period |
|
expenses |
|
(Deductions) |
|
period |
||||
|
|
|
|
|
|
|
|
|
|
|
|
|
|
|
Allowance for doubtful accounts |
|
|
|
|
|
|
|
|
|
|
|
|
|
2016 |
|
$ |
5,063 |
|
$ |
1,752 |
|
$ |
(2,598) |
|
$ |
4,217 |
|
2015 |
|
|
3,748 |
|
|
1,323 |
|
|
(8) |
|
|
5,063 |
|
2014 |
|
|
945 |
|
|
600 |
|
|
2,203 |
|
|
3,748 |
|
|
|
|
|
|
|
|
|
|
|
|
|
|
|
Valuation allowance for deferred tax assets |
|
|
|
|
|
|
|
|
|
|
|
|
|
2016 |
|
$ |
— |
|
$ |
— |
|
$ |
— |
|
$ |
— |
|
2015 |
|
|
3,395 |
|
|
— |
|
|
(3,395) |
|
|
— |
|
2014 |
|
|
1,365 |
|
|
— |
|
|
2,030 |
|
|
3,395 |
F-40
QTS REALTY TRUST, INC.
QUALITYTECH, LP
CONSOLIDATED FINANCIAL STATEMENTS
SCHEDULE III – REAL ESTATE INVESTMENTS
December 31, 2016
|
|
|
|
|
|
|
|
|
|
|
|
|
|
|
|
|
|
|
|
|
|
|
|
|
|
|
|
|
|
|
|
|
|
|
|
|
Initial Costs |
|
Costs Capitalized Subsequent to Acquisition |
|
Gross Carrying Amount |
|
|
|
|
|
|||||||||||||||||||||
|
As of December 31, 2016 |
|
|
|
|
|
|
|
|
|
|
|
|
|
|
|
|
|
|
|
|
|
|
|
|
|
|
|
|
Accumulated |
|
|
|
|
(dollars in thousands) |
|
|
|
|
Buildings and |
|
Construction |
|
|
|
|
Buildings and |
|
Construction |
|
|
|
|
Buildings and |
|
Construction |
|
Depreciation and |
|
Date of |
|||||||
|
Property Location |
|
Land |
|
Improvements |
|
in Progress |
|
Land |
|
Improvements |
|
in Progress |
|
Land |
|
Improvements |
|
in Progress |
|
Amortization |
|
Acquisition |
||||||||||
|
Owned Properties |
|
|
|
|
|
|
|
|
|
|
|
|
|
|
|
|
|
|
|
|
|
|
|
|
|
|
|
|
|
|
|
|
|
Suwanee, Georgia |
|
$ |
1,395 |
|
$ |
29,802 |
|
$ |
— |
|
$ |
2,126 |
|
$ |
141,574 |
|
$ |
2,013 |
|
$ |
3,521 |
|
$ |
171,376 |
|
$ |
2,013 |
|
$ |
(59,326) |
|
9/1/2005 |
|
Atlanta, Georgia (Metro) |
|
|
12,647 |
|
|
35,473 |
|
|
— |
|
|
2,750 |
|
|
399,492 |
|
|
32,422 |
|
|
15,397 |
|
|
434,965 |
|
|
32,422 |
|
|
(118,470) |
|
10/3/2006 |
|
Santa Clara, California |
|
|
— |
|
|
15,838 |
|
|
— |
|
|
— |
|
|
82,870 |
|
|
7,078 |
|
|
— |
|
|
98,708 |
|
|
7,078 |
|
|
(33,701) |
|
11/1/2007 |
|
Richmond, Virginia |
|
|
2,000 |
|
|
11,200 |
|
|
— |
|
|
180 |
|
|
226,147 |
|
|
70,580 |
|
|
2,180 |
|
|
237,347 |
|
|
70,580 |
|
|
(36,376) |
|
3/20/2010 |
|
Sacramento, California |
|
|
1,481 |
|
|
52,753 |
|
|
— |
|
|
— |
|
|
9,349 |
|
|
390 |
|
|
1,481 |
|
|
62,102 |
|
|
390 |
|
|
(7,079) |
|
12/21/2012 |
|
Princeton, New Jersey |
|
|
20,700 |
|
|
32,126 |
|
|
— |
|
|
(0) |
|
|
662 |
|
|
538 |
|
|
20,700 |
|
|
32,788 |
|
|
538 |
|
|
(2,169) |
|
6/30/2014 |
|
Irving, Texas |
|
|
— |
|
|
5,808 |
|
|
— |
|
|
8,606 |
|
|
198,905 |
|
|
69,653 |
|
|
8,606 |
|
|
204,713 |
|
|
69,653 |
|
|
(11,465) |
|
2/8/2013 |
|
Chicago, Illinois |
|
|
— |
|
|
— |
|
|
17,764 |
|
|
9,400 |
|
|
45,848 |
|
|
82,859 |
|
|
9,400 |
|
|
45,848 |
|
|
100,623 |
|
|
(853) |
|
7/8/2014 |
|
Piscataway, New Jersey |
|
|
7,466 |
|
|
80,366 |
|
|
13,900 |
|
|
(0) |
|
|
1,844 |
|
|
3,361 |
|
|
7,466 |
|
|
82,210 |
|
|
17,261 |
|
|
(1,240) |
|
6/6/2016 |
|
Fort Worth, Texas |
|
|
136 |
|
|
610 |
|
|
48,984 |
|
|
0 |
|
|
(0) |
|
|
132 |
|
|
136 |
|
|
610 |
|
|
49,116 |
|
|
(8) |
|
12/16/2016 |
|
Miami, Florida |
|
|
1,777 |
|
|
6,955 |
|
|
— |
|
|
— |
|
|
24,215 |
|
|
83 |
|
|
1,777 |
|
|
31,170 |
|
|
83 |
|
|
(9,390) |
|
3/6/2008 |
|
Lenexa, Kansas |
|
|
400 |
|
|
3,100 |
|
|
— |
|
|
37 |
|
|
660 |
|
|
— |
|
|
437 |
|
|
3,760 |
|
|
— |
|
|
(214) |
|
6/3/2011 |
|
Duluth, Georgia Office Building |
|
|
1,899 |
|
|
1,920 |
|
|
— |
|
|
— |
|
|
(2) |
|
|
5,672 |
|
|
1,899 |
|
|
1,918 |
|
|
5,672 |
|
|
(3) |
|
12/30/2015 |
|
|
|
$ |
49,901 |
|
$ |
275,951 |
|
$ |
80,648 |
|
$ |
23,099 |
|
$ |
1,131,563 |
|
$ |
274,781 |
|
$ |
73,000 |
|
$ |
1,407,515 |
|
$ |
355,429 |
|
$ |
(280,294) |
|
|
|
Leased Properties |
|
|
|
|
|
|
|
|
|
|
|
|
|
|
|
|
|
|
|
|
|
|
|
|
|
|
|
|
|
|
|
|
|
Leased facilities acquired in 2015 |
|
|
1,130 |
|
|
78,897 |
|
|
12,127 |
|
|
— |
|
|
13,670 |
|
|
(4,456) |
|
|
1,130 |
|
|
92,567 |
|
|
7,671 |
|
|
(26,956) |
|
6/16/2015 |
|
Jersey City, New Jersey |
|
|
— |
|
|
1,985 |
|
|
— |
|
|
— |
|
|
21,738 |
|
|
2,332 |
|
|
— |
|
|
23,723 |
|
|
2,332 |
|
|
(9,896) |
|
11/1/2006 |
|
Overland Park, Kansas |
|
|
— |
|
|
— |
|
|
— |
|
|
— |
|
|
962 |
|
|
528 |
|
|
— |
|
|
962 |
|
|
528 |
|
|
(687) |
|
|
|
|
|
|
1,130 |
|
|
80,882 |
|
|
12,127 |
|
|
— |
|
|
36,369 |
|
|
(1,596) |
|
|
1,130 |
|
|
117,252 |
|
|
10,531 |
|
|
(37,540) |
|
|
|
|
|
$ |
51,031 |
|
$ |
356,833 |
|
$ |
92,775 |
|
$ |
23,099 |
|
$ |
1,167,933 |
|
$ |
273,185 |
|
$ |
74,130 |
|
$ |
1,524,767 |
|
$ |
365,960 |
|
$ |
(317,834) |
|
|
The aggregate gross cost of the Company’s properties for federal income tax purposes was $1.99 billion (unaudited) as of December 31, 2016.
F-41
The following table reconciles the historical cost and accumulated depreciation for the years ended December 31, 2016, 2015 and 2014 (in thousands):
|
|
|
Year Ended December 31, |
|||||||
|
|
|
2016 |
|
2015 |
|
2014 |
|||
|
Property |
|
|
|
|
|
|
|
|
|
|
Balance, beginning of period |
|
$ |
1,583,153 |
|
$ |
1,177,582 |
|
$ |
905,735 |
|
Disposals |
|
|
(8,946) |
|
|
(5,617) |
|
|
(54) |
|
Additions (acquisitions and improvements) |
|
|
390,650 |
|
|
411,188 |
|
|
271,901 |
|
Balance, end of period |
|
$ |
1,964,857 |
|
$ |
1,583,153 |
|
$ |
1,177,582 |
|
Accumulated depreciation |
|
|
|
|
|
|
|
|
|
|
Balance, beginning of period |
|
$ |
(239,936) |
|
$ |
(180,167) |
|
$ |
(137,725) |
|
Disposals |
|
|
6,761 |
|
|
1,377 |
|
|
39 |
|
Additions (depreciation and amortization expense) |
|
|
(84,659) |
|
|
(61,146) |
|
|
(42,481) |
|
Balance, end of period |
|
$ |
(317,834) |
|
$ |
(239,936) |
|
$ |
(180,167) |
F-42