Attached files
| file | filename |
|---|---|
| EX-99.1 - EXHIBIT 99.1 - Park Hotels & Resorts Inc. | a51518771ex99_1.htm |
| 8-K - PARK HOTELS & RESORTS INC. 8-K - Park Hotels & Resorts Inc. | a51518771.htm |
Exhibit 99.2

Waldorf Astoria Orlando Park Hotels & Resorts at NYSE Hilton Hawaiian Village Waikiki Beach Resort December 31, 2016 Fourth Quarter and Year End 2016Supplemental Data
About Park Hotels & Resorts Inc. and Safe Harbor Disclosure About Park Hotels & Resorts Inc.Park (NYSE: PK) is a leading lodging real estate company with a diverse portfolio of market-leading hotels and resorts with significant underlying real estate value. Park’s portfolio consists of 67 premium-branded hotels and resorts with over 35,000 rooms located in prime U.S. and international markets with high barriers to entry. Over 85% of Park’s rooms are luxury and upper upscale and nearly 90% are located in the United States, including 14 of the top 25 markets as defined by Smith Travel Research (“STR”). Over 70% of Park’s rooms are located in the central business districts of major cities and resort/conference destinations. Park is focused on driving premium long-term total returns by continuing to enhance the value of its existing properties and utilizing its scale to efficiently allocate capital to drive growth while maintaining a strong and flexible balance sheet. Visit www.pkhotelsandresorts.com for more information. Forward-Looking StatementsThis presentation contains forward-looking statements within the meaning of Section 27A of the Securities Act of 1933, as amended, and Section 21E of the Securities Exchange Act of 1934, as amended. Forward-looking statements include, but are not limited to, statements related to Park’s current expectations regarding the performance of its business, financial results, liquidity and capital resources, the effects of competition and the effects of future legislation or regulations and other non-historical statements. Forward-looking statements include all statements that are not historical facts and, in some cases, can be identified by the use of forward-looking terminology such as the words “outlook,” “believes,” “expects,” “potential,” “continues,” “may,” “will,” “should,” “could,” “seeks,” “approximately,” “projects,” “predicts,” “intends,” “plans,” “estimates,” “anticipates” or the negative version of these words or other comparable words. Forward-looking statements involve risks, uncertainties and assumptions. Actual results may differ materially from those expressed in these forward-looking statements. You should not put undue reliance on any forward-looking statements in this presentation. Additional factors that could cause Park’s results to differ materially from those described in the forward-looking statements can be found under the sections entitled “Forward-Looking Statements,” “Risk Factors” and “Management’s Discussion and Analysis of Financial Condition and Results of Operations” (or similar captions) in Park’s Information Statement on Form 10, filed with the SEC, as such factors may be updated from time to time in Park’s periodic filings with the SEC, which are accessible on the SEC’s website at www.sec.gov. Forward-looking statements speak only as of the date on which they are made, and, except as otherwise may be required by law. Park undertakes no obligation to update or revise publicly any guidance or other forward-looking statement, whether as a result of new information, future developments or otherwise, except as required by law.Supplemental Financial InformationPark refers to certain non-generally accepted accounting principles (“GAAP”) financial measures in this presentation, including Funds from Operations (“FFO”) calculated in accordance with the guidelines of the National Association of Real Estate Investment Trusts (“NAREIT”), Adjusted FFO, Earnings before interest expense, taxes and depreciation and amortization (“EBITDA”), Adjusted EBITDA, Hotel Adjusted EBITDA, Hotel Adjusted EBITDA margin, Net debt and Net debt to Adjusted EBITDA ratio. These non-GAAP financial measures should be considered along with, but not as alternatives to, net income (loss) as a measure of its operating performance. Please see the schedules included in this presentation including the “Definitions” section for additional information and reconciliations of such non-GAAP financial measures.
Financial Statements Non-GAAP Financial Measures Guidance Portfolio and Operating Metrics Debt Summary Definitions Table of Contents 4712172830 New York Hilton Midtown Hilton Waikoloa Village Waldorf Astoria Bonnet Creek Orlando

Financial Statements Casa Marina, a Waldorf Astoria Resort Hilton Chicago Parc 55 San Francisco
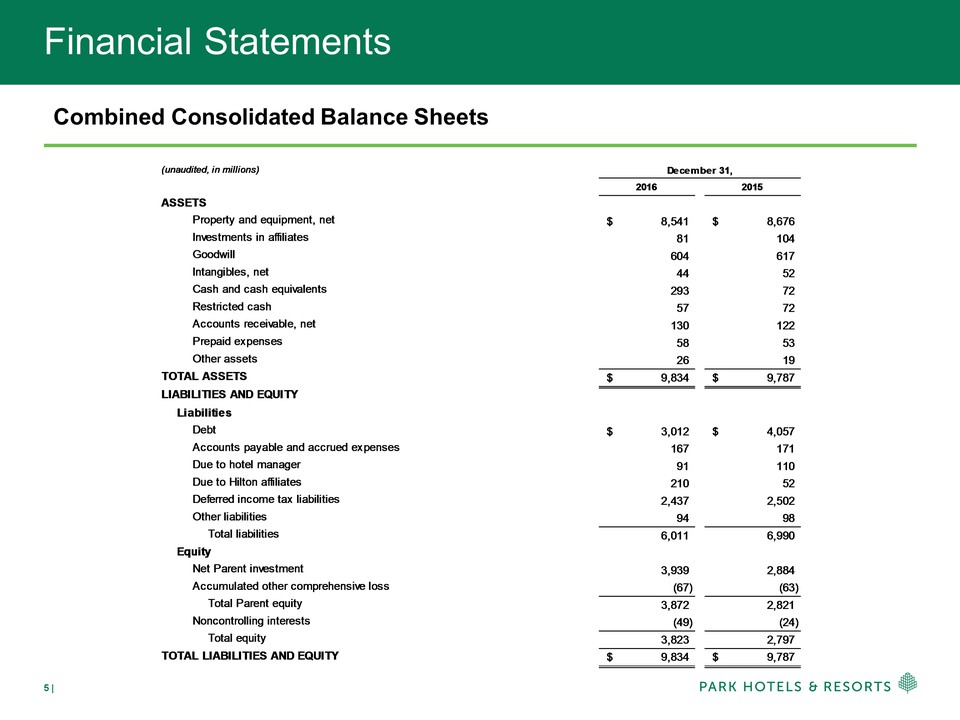
Financial Statements Combined Consolidated Balance Sheets (unaudited, in millions)20162015ASSETSProperty and equipment, net8,541$ 8,676$ Investments in affiliates 81 104Goodwill 604 617Intangibles, net 44 52Cash and cash equivalents 293 72Restricted cash 57 72Accounts receivable, net 130 122Prepaid expenses 58 53Other assets 26 19TOTAL ASSETS9,834$ 9,787$ LIABILITIES AND EQUITYLiabilitiesDebt3,012$ 4,057$ Accounts payable and accrued expenses 167 171Due to hotel manager 91 110Due to Hilton affiliates 210 52Deferred income tax liabilities 2,437 2,502Other liabilities 94 98Total liabilities 6,011 6,990EquityNet Parent investment 3,939 2,884Accumulated other comprehensive loss (67) (63)Total Parent equity 3,872 2,821Noncontrolling interests (49) (24)Total equity 3,823 2,797TOTAL LIABILITIES AND EQUITY9,834$ 9,787$ December 31, Combined Consolidated
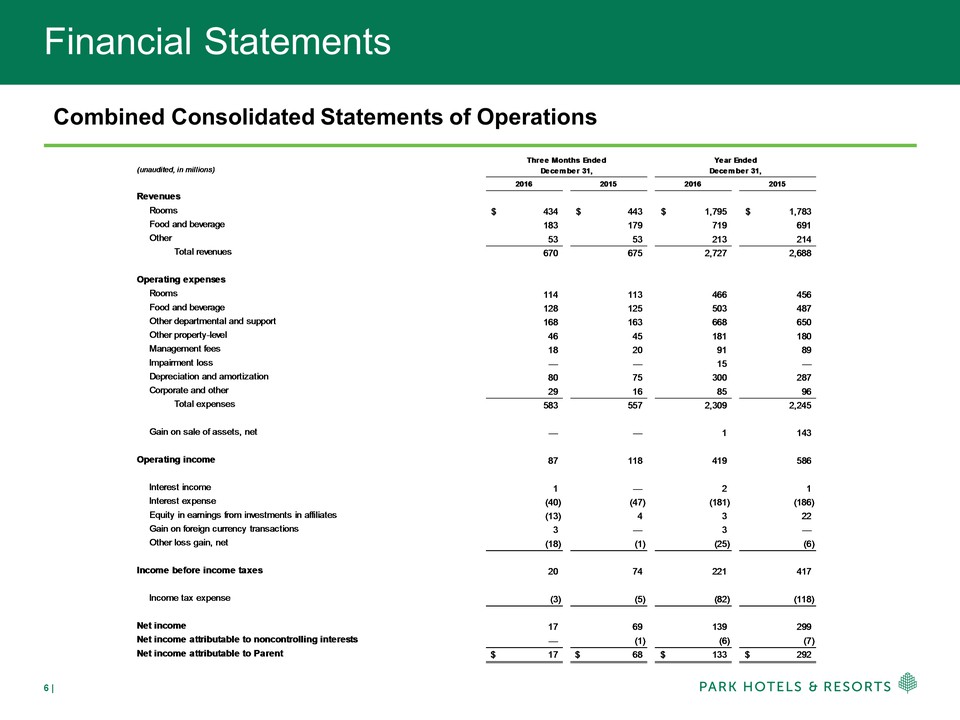
Financial Statements Combined Consolidated Statements of Operations Combined Consolidated Statements of Operations(unaudited, in millions)2016201520162015RevenuesRooms434$ 443$ 1,795$ 1,783$ Food and beverage 183 179 719 691Other 53 53 213 214Total revenues 670 675 2,727 2,688Operating expensesRooms 114 113 466 456Food and beverage 128 125 503 487Other departmental and support 168 163 668 650Other property-level 46 45 181 180Management fees 18 20 91 89Impairment loss — — 15 —Depreciation and amortization 80 75 300 287Corporate and other 29 16 85 96Total expenses 583 557 2,309 2,245Gain on sale of assets, net — — 1 143Operating income 87 118 419 586Interest income 1 — 2 1Interest expense (40) (47) (181) (186)Equity in earnings from investments in affiliates (13) 4 3 22Gain on foreign currency transactions 3 — 3 —Other loss gain, net (18) (1) (25) (6)Income before income taxes 20 74 221 417Income tax expense (3) (5) (82) (118)Net income 17 69 139 299Net income attributable to noncontrolling interests — (1) (6) (7)Net income attributable to Parent17$ 68$ 133$ 292$ Three Months Ended December 31,Year Ended December 31,
Non-GAAP Financial Measures Juniper Cupertino, Curio Collection Caribe Hilton DoubleTree Washington DC – Crystal City
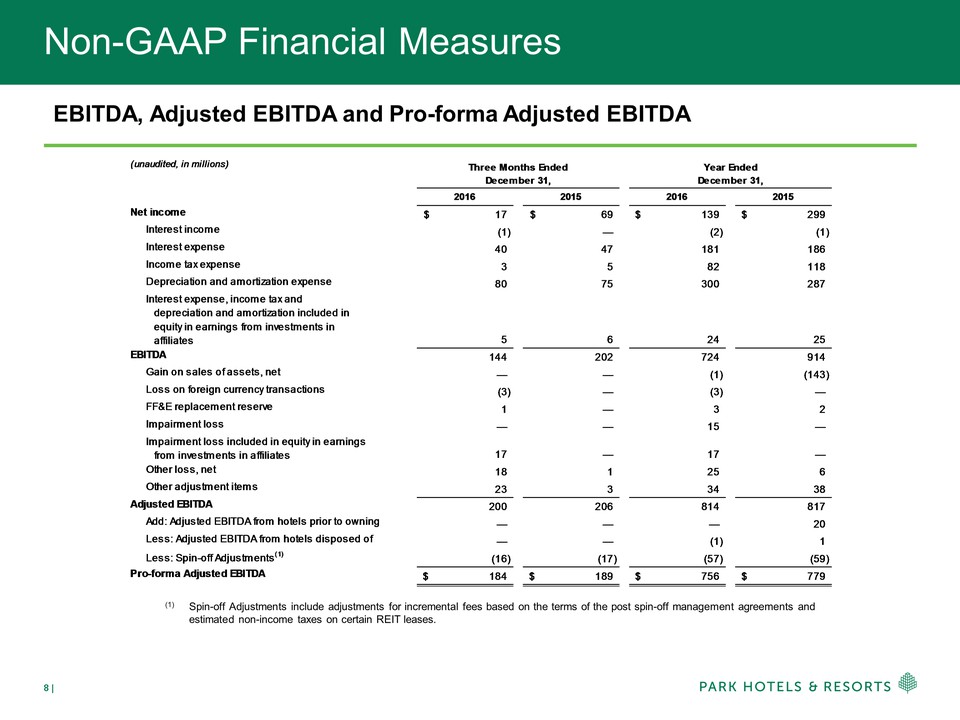
Non-GAAP Financial Measures EBITDA, Adjusted EBITDA and Pro-forma Adjusted EBITDA (1) Spin-off Adjustments include adjustments for incremental fees based on the terms of the post spin-off management agreements and estimated non-income taxes on certain REIT leases.(unaudited, in millions)2016201520162015Net income17$ 69$ 139$ 299$ Interest income (1) — (2) (1)Interest expense 40 47 181 186Income tax expense 3 5 82 118Depreciation and amortization expense 80 75 300 287Interest expense, income tax and depreciation and amortization included in equity in earnings from investments in affiliates 5 6 24 25EBITDA 144 202 724 914Gain on sales of assets, net — — (1) (143)Loss on foreign currency transactions (3) — (3) —FF&E replacement reserve 1 — 3 2Impairment loss — — 15 —Impairment loss included in equity in earnings from investments in affiliates 17 — 17 —Other loss, net 18 1 25 6Other adjustment items 23 3 34 38Adjusted EBITDA 200 206 814 817Add: Adjusted EBITDA from hotels prior to owning — — — 20Less: Adjusted EBITDA from hotels disposed of — — (1) 1Less: Spin-off Adjustments(1) (16) (17) (57) (59)Pro-forma Adjusted EBITDA184$ 189$ 756$ 779$ Year Ended December 31, Three Months Ended December 31, (1)Spin-off Adjustments include adjustments for incremental fees based on the terms of the post spin-off management agreements and estimated non-income taxes on certain REIT leases.
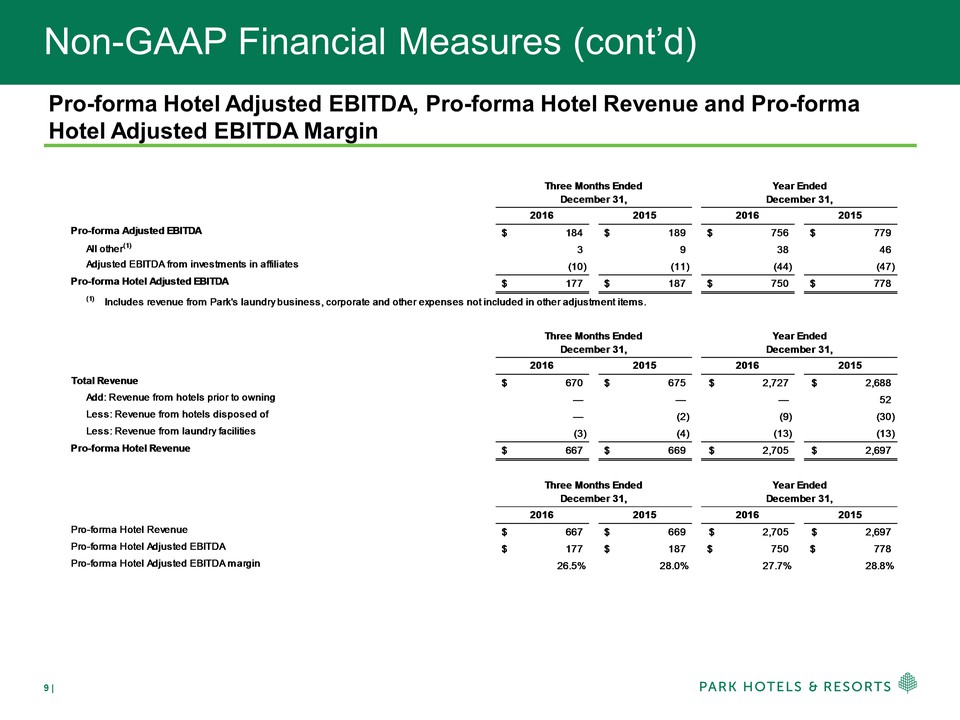
Non-GAAP Financial Measures (cont’d) Pro-forma Hotel Adjusted EBITDA, Pro-forma Hotel Revenue and Pro-forma Hotel Adjusted EBITDA Margin
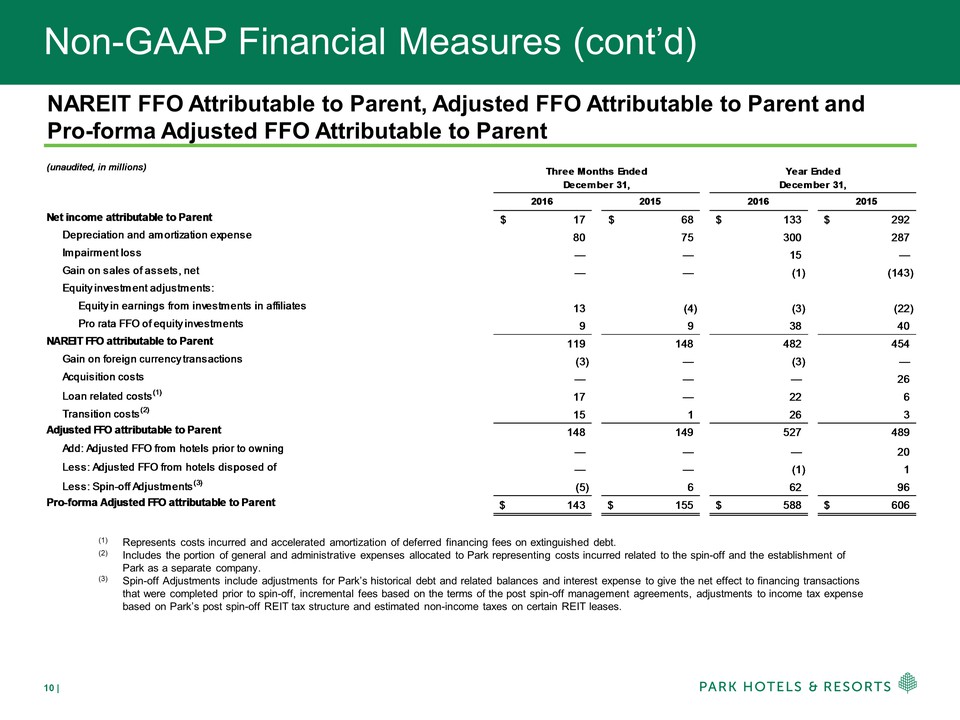
Non-GAAP Financial Measures (cont’d) NAREIT FFO Attributable to Parent, Adjusted FFO Attributable to Parent and Pro-forma Adjusted FFO Attributable to Parent (1) Represents costs incurred and accelerated amortization of deferred financing fees on extinguished debt. (2) Includes the portion of general and administrative expenses allocated to Park representing costs incurred related to the spin-off and the establishment of Park as a separate company. (3) Spin-off Adjustments include adjustments for Park’s historical debt and related balances and interest expense to give the net effect to financing transactions that were completed prior to spin-off, incremental fees based on the terms of the post spin-off management agreements, adjustments to income tax expense based on Park’s post spin-off REIT tax structure and estimated non-income taxes on certain REIT leases. NAREIT FFO Attributable to Parent, Adjusted FFO Attributable to Parent and Pro-forma Adjusted FFO Attributable to Parent (1)Represents costs incurred and accelerated amortization of deferred financing fees on extinguished debt. (2)Includes the portion of general and administrative expenses allocated to Park representing costs incurred related to the spin-off and the establishment of Park as a separate company. (3) Spin-off Adjustments include adjustments for Park’s historical debt and related balances and interest expense to give the net effect to financing transactions that were completed prior to spin-off, incremental fees based on the terms of the post spin-off management agreements, adjustments to income tax expense based on Park’s post spin-off REIT tax structure and estimated non-income taxes on certain REIT leases. (unaudited, in millions)2016201520162015Net income attributable to Parent17$ 68$ 133$ 292$ Depreciation and amortization expense 80 75 300 287Impairment loss — — 15 —Gain on sales of assets, net — — (1) (143)Equity investment adjustments: Equity in earnings from investments in affiliates 13 (4) (3) (22)Pro rata FFO of equity investments 9 9 38 40NAREIT FFO attributable to Parent 119 148 482 454Gain on foreign currency transactions (3) — (3) —Acquisition costs — — — 26Loan related costs(1) 17 — 22 6Transition costs(2) 15 1 26 3Adjusted FFO attributable to Parent 148 149 527 489Add: Adjusted FFO from hotels prior to owning — — — 20Less: Adjusted FFO from hotels disposed of — — (1) 1Less: Spin-off Adjustments(3) (5) 6 62 96Pro-forma Adjusted FFO attributable to Parent143$ 155$ 588$ 606$ Three Months Ended December 31, Year Ended December 31,
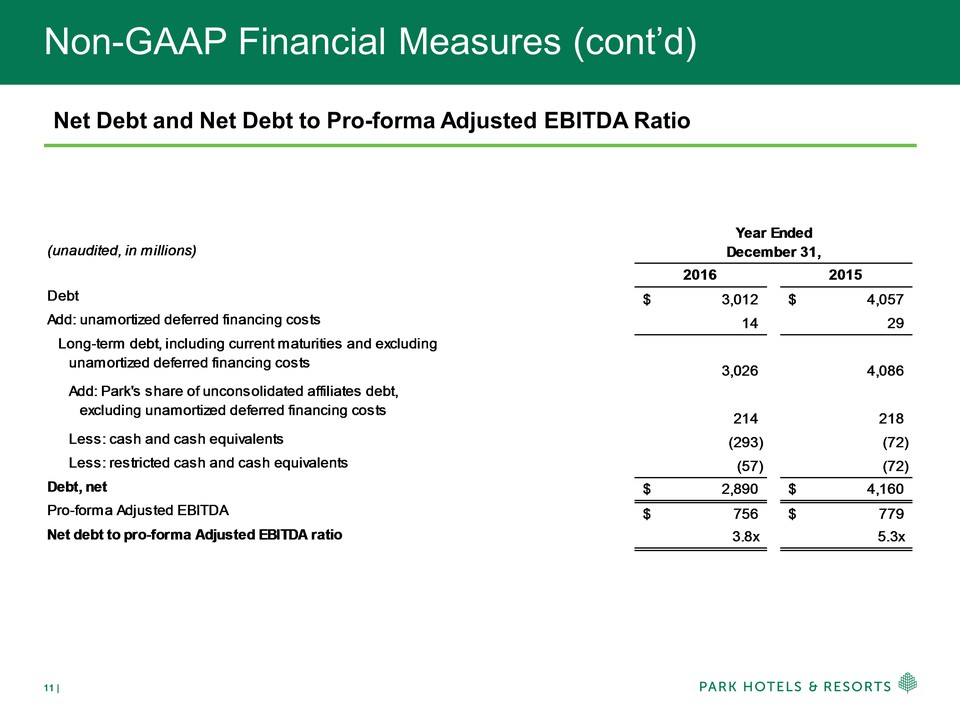
Non-GAAP Financial Measures (cont’d) Net Debt and Net Debt to Pro-forma Adjusted EBITDA Ratio (unaudited, in millions)20162015Debt3,012$ 4,057$ Add: unamortized deferred financing costs 14 29Long-term debt, including current maturities and excluding unamortized deferred financing costs 3,026 4,086Add: Park's share of unconsolidated affiliates debt, excluding unamortized deferred financing costs 214 218Less: cash and cash equivalents (293) (72)Less: restricted cash and cash equivalents (57) (72)Debt, net2,890$ 4,160$ Pro-forma Adjusted EBITDA756$ 779$ Net debt to pro-forma Adjusted EBITDA ratio3.8x5.3xYear EndedDecember 31,

Guidance Hilton San Francisco Union Square Hilton Waikoloa Village Hilton Chicago
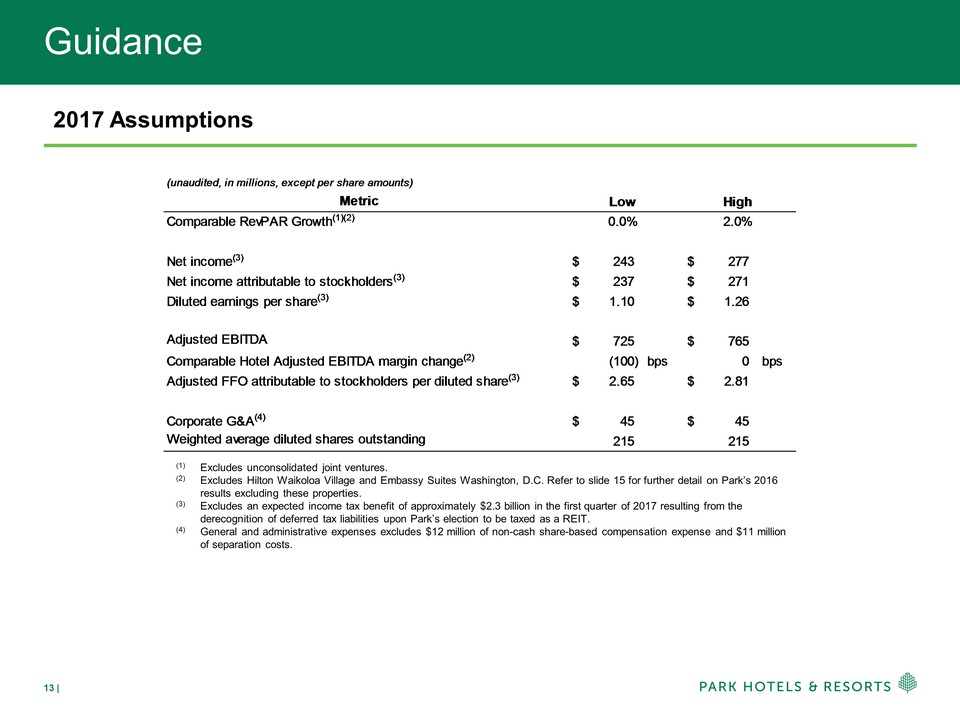
Guidance 2017 Assumptions (1) Excludes unconsolidated joint ventures. (2) Excludes Hilton Waikoloa Village and Embassy Suites Washington, D.C. Refer to slide 15 for further detail on Park’s 2016 results excluding these properties. (3) Excludes an expected income tax benefit of approximately $2.3 billion in the first quarter of 2017 resulting from the derecognition of deferred tax liabilities upon Park’s election to be taxed as a REIT. (4) General and administrative expenses excludes $12 million of non-cash share-based compensation expense and $11 million of separation costs. Comparable RevPAR Growth(1)(2)0.0%2.0%Net income(3)243$ 277$ Net income attributable to stockholders(3)237$ 271$ Diluted earnings per share(3)1.10$ 1.26$ Adjusted EBITDA725$ 765$ Comparable Hotel Adjusted EBITDA margin change(2) (100)bps0bpsAdjusted FFO attributable to stockholders per diluted share(3)2.65$ 2.81$ Corporate G&A(4)45$ 45$ Weighted average diluted shares outstanding 215 215
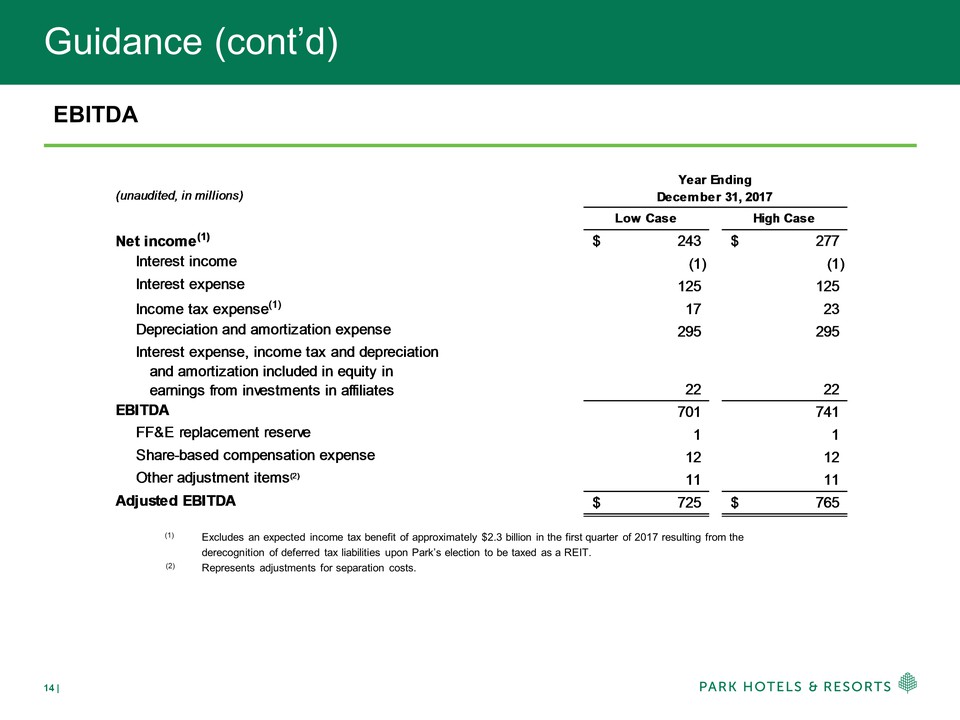
Guidance (cont’d) EBITDA (1) Excludes an expected income tax benefit of approximately $2.3 billion in the first quarter of 2017 resulting from the derecognition of deferred tax liabilities upon Park’s election to be taxed as a REIT. (2) Represents adjustments for separation costs. (unaudited, in millions)Low CaseHigh CaseNet income(1)243$ 277$ Interest income (1) (1)Interest expense 125 125Income tax expense(1) 17 23Depreciation and amortization expense 295 295Interest expense, income tax and depreciation and amortization included in equity in earnings from investments in affiliates 22 22EBITDA 701 741FF&E replacement reserve 1 1Share-based compensation expense 12 12Other adjustment items(2) 11 11Adjusted EBITDA725$ 765$ Year EndingDecember 31, 2017
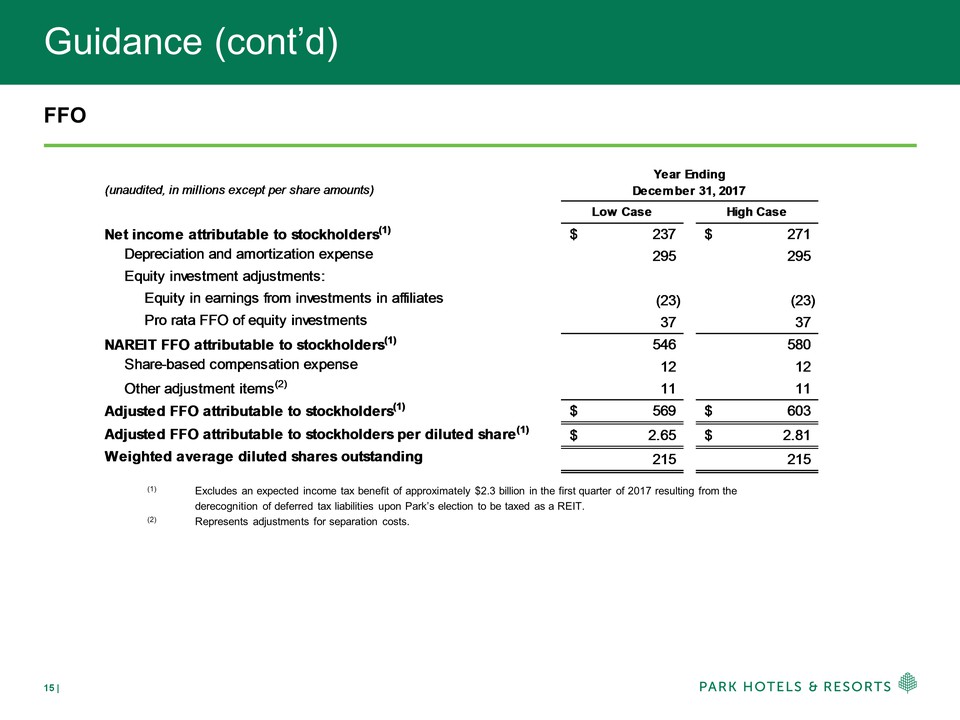
Guidance (cont’d) FFO (1) Excludes an expected income tax benefit of approximately $2.3 billion in the first quarter of 2017 resulting from the derecognition of deferred tax liabilities upon Park’s election to be taxed as a REIT. (2) Represents adjustments for separation costs.(unaudited, in millions except per share amounts)Low CaseHigh CaseNet income attributable to stockholders(1)237$ 271$ Depreciation and amortization expense 295 295Equity investment adjustments:Equity in earnings from investments in affiliates (23) (23)Pro rata FFO of equity investments 37 37NAREIT FFO attributable to stockholders(1) 546 580Share-based compensation expense 12 12Other adjustment items(2) 11 11Adjusted FFO attributable to stockholders(1)569$ 603$ Adjusted FFO attributable to stockholders per diluted share(1)2.65$ 2.81$ Weighted average diluted shares outstanding 215 215Year EndingDecember
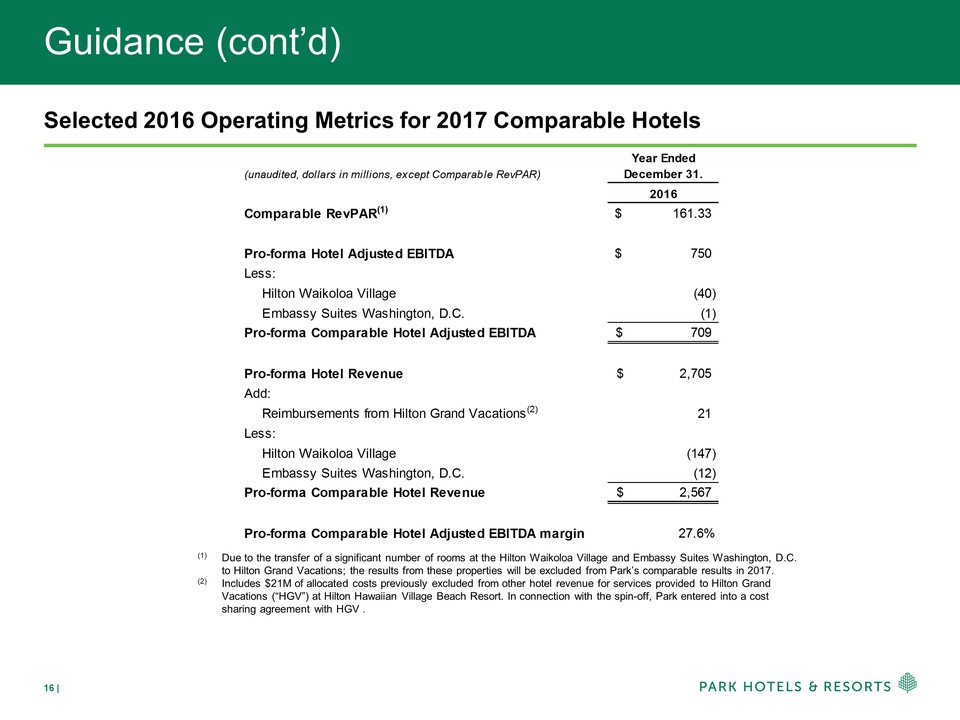
Guidance (cont’d) Selected 2016 Operating Metrics for 2017 Comparable Hotels (1) Due to the transfer of a significant number of rooms at the Hilton Waikoloa Village and Embassy Suites Washington, D.C. to Hilton Grand Vacations; the results from these properties will be excluded from Park’s comparable results in 2017. (2) Includes $21M of allocated costs previously excluded from other hotel revenue for services provided to Hilton Grand Vacations (“HGV”) at Hilton Hawaiian Village Beach Resort. In connection with the spin-off, Park entered into a cost sharing agreement with HGV .(unaudited, dollars in millions, except Comparable RevPAR)Year EndedDecember 31.2016Comparable RevPAR(1)161.33$ Pro-forma Hotel Adjusted EBITDA750$ Less:Hilton Waikoloa Village(40) Embassy Suites Washington, D.C.(1) Pro-forma Comparable Hotel Adjusted EBITDA709$ Pro-forma Hotel Revenue2,705$ Add: Reimbursements from Hilton Grand Vacations(2)21 Less:Hilton Waikoloa Village(147) Embassy Suites Washington, D.C.(12) Pro-forma Comparable Hotel Revenue2,567$ Pro-forma Comparable Hotel Adjusted EBITDA margin27.6%
Portfolio and Operating Metrics Hilton New York Midtown Conrad Dublin Hilton New Orleans Riverside
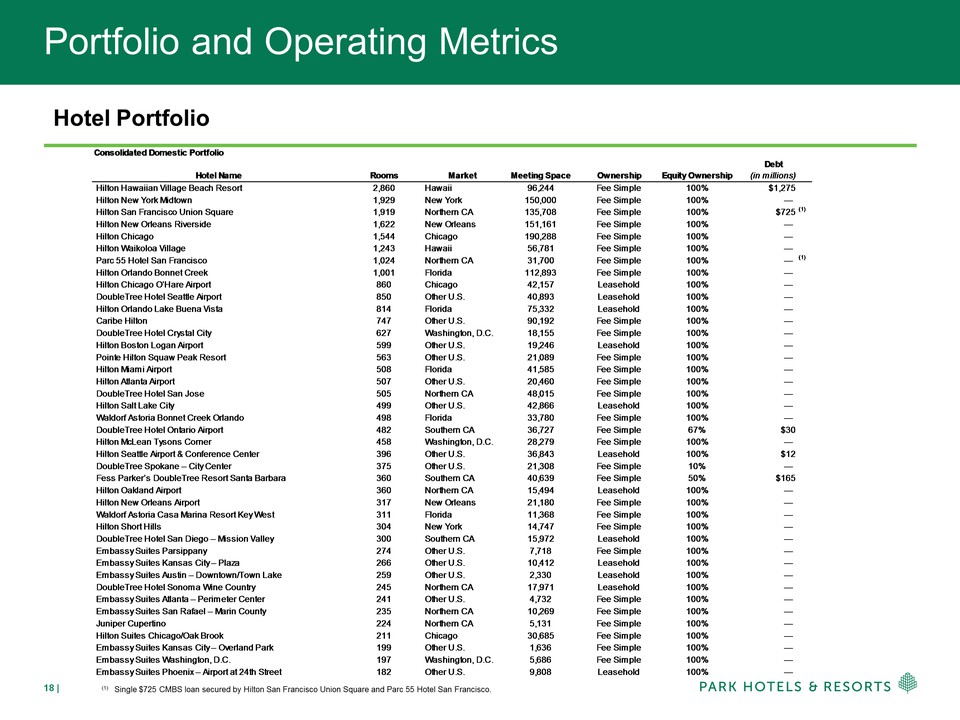
Portfolio and Operating Metrics Hotel Portfolio (1) Single $725 CMBS loan secured by Hilton San Francisco Union Square and Parc 55 Hotel San Francisco. Consolidated Domestic PortfolioHotel NameRoomsMarketMeeting SpaceOwnershipEquity Ownership Hilton Hawaiian Village Beach Resort 2,860Hawaii96,244Fee Simple100%$1,275 Hilton New York Midtown 1,929New York150,000Fee Simple100% — Hilton San Francisco Union Square 1,919Northern CA135,708Fee Simple100%$725(1) Hilton New Orleans Riverside 1,622New Orleans151,161Fee Simple100% — Hilton Chicago 1,544Chicago190,288Fee Simple100% — Hilton Waikoloa Village 1,243Hawaii56,781Fee Simple100% — Parc 55 Hotel San Francisco 1,024Northern CA31,700Fee Simple100% —(1) Hilton Orlando Bonnet Creek 1,001Florida112,893Fee Simple100% — Hilton Chicago O’Hare Airport 860Chicago42,157Leasehold100% — DoubleTree Hotel Seattle Airport 850Other U.S.40,893Leasehold100% — Hilton Orlando Lake Buena Vista 814Florida75,332Leasehold100% — Caribe Hilton 747Other U.S.90,192Fee Simple100% — DoubleTree Hotel Crystal City 627Washington, D.C.18,155Fee Simple100% — Hilton Boston Logan Airport 599Other U.S.19,246Leasehold100% — Pointe Hilton Squaw Peak Resort 563Other U.S.21,089Fee Simple100% — Hilton Miami Airport 508Florida41,585Fee Simple100% — Hilton Atlanta Airport 507Other U.S.20,460Fee Simple100% — DoubleTree Hotel San Jose 505Northern CA48,015Fee Simple100% — Hilton Salt Lake City 499Other U.S.42,866Leasehold100% — Waldorf Astoria Bonnet Creek Orlando 498Florida33,780Fee Simple100% — DoubleTree Hotel Ontario Airport 482Southern CA36,727Fee Simple67%$30 Hilton McLean Tysons Corner 458Washington, D.C.28,279Fee Simple100% — Hilton Seattle Airport & Conference Center 396Other U.S.36,843Leasehold100%$12 DoubleTree Spokane – City Center 375Other U.S.21,308Fee Simple10% — Fess Parker’s DoubleTree Resort Santa Barbara 360Southern CA40,639Fee Simple50%$165 Hilton Oakland Airport 360Northern CA15,494Leasehold100% — Hilton New Orleans Airport 317New Orleans21,180Fee Simple100% — Waldorf Astoria Casa Marina Resort Key West 311Florida11,368Fee Simple100% — Hilton Short Hills 304New York14,747Fee Simple100% — DoubleTree Hotel San Diego – Mission Valley 300Southern CA15,972Leasehold100% — Embassy Suites Parsippany 274Other U.S.7,718Fee Simple100% — Embassy Suites Kansas City – Plaza 266Other U.S.10,412Leasehold100% — Embassy Suites Austin – Downtown/Town Lake 259Other U.S.2,330Leasehold100% — DoubleTree Hotel Sonoma Wine Country 245Northern CA17,971Leasehold100% — Embassy Suites Atlanta – Perimeter Center 241Other U.S.4,732Fee Simple100% — Embassy Suites San Rafael – Marin County 235Northern CA10,269Fee Simple100% — Juniper Cupertino 224Northern CA5,131Fee Simple100% — Hilton Suites Chicago/Oak Brook 211Chicago30,685Fee Simple100% — Embassy Suites Kansas City – Overland Park 199Other U.S.1,636Fee Simple100% — Embassy Suites Washington, D.C. 197Washington, D.C.5,686Fee Simple100% — Embassy Suites Phoenix – Airport at 24th Street 182Other U.S.9,808Leasehold100% —Debt
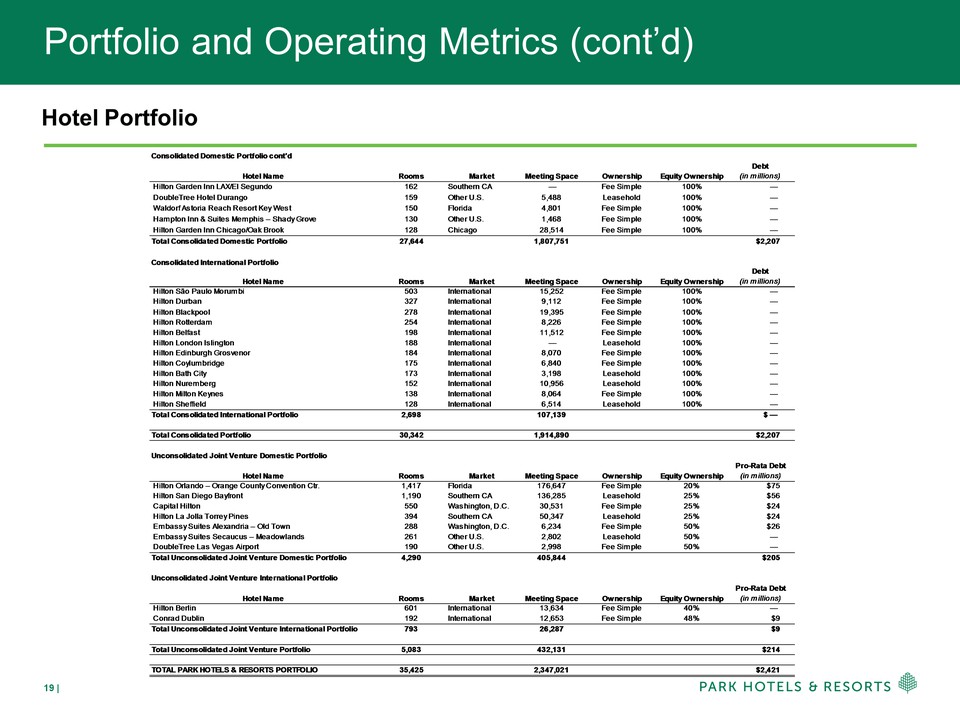
Portfolio and Operating Metrics (cont’d) Hotel Portfolio Consolidated Domestic Portfolio cont'dHotel NameRoomsMarketMeeting SpaceOwnershipEquity Ownership Hilton Garden Inn LAX/El Segundo 162Southern CA —Fee Simple100% — DoubleTree Hotel Durango 159Other U.S.5,488Leasehold100% — Waldorf Astoria Reach Resort Key West 150Florida4,801Fee Simple100% — Hampton Inn & Suites Memphis – Shady Grove 130Other U.S.1,468Fee Simple100% — Hilton Garden Inn Chicago/Oak Brook 128Chicago28,514Fee Simple100% —Total Consolidated Domestic Portfolio27,6441,807,751$2,207Consolidated International PortfolioHotel NameRoomsMarketMeeting SpaceOwnershipEquity Ownership Hilton São Paulo Morumbi 503International15,252Fee Simple100% — Hilton Durban 327International9,112Fee Simple100% — Hilton Blackpool 278International19,395Fee Simple100% — Hilton Rotterdam 254International8,226Fee Simple100% — Hilton Belfast 198International11,512Fee Simple100% — Hilton London Islington 188International —Leasehold100% — Hilton Edinburgh Grosvenor 184International8,070Fee Simple100% — Hilton Coylumbridge 175International6,840Fee Simple100% — Hilton Bath City 173International3,198Leasehold100% — Hilton Nuremberg 152International10,956Leasehold100% — Hilton Milton Keynes 138International8,064Fee Simple100% — Hilton Sheffield 128International6,514Leasehold100% —Total Consolidated International Portfolio2,698107,139 $ —Total Consolidated Portfolio30,3421,914,890$2,207Unconsolidated Joint Venture Domestic PortfolioHotel NameRoomsMarketMeeting SpaceOwnershipEquity Ownership Hilton Orlando – Orange County Convention Ctr.1,417Florida176,647Fee Simple20%$75 Hilton San Diego Bayfront1,190Southern CA136,285Leasehold25%$56 Capital Hilton550Washington, D.C.30,531Fee Simple25%$24 Hilton La Jolla Torrey Pines394Southern CA50,347Leasehold25%$24 Embassy Suites Alexandria – Old Town288Washington, D.C.6,234Fee Simple50%$26 Embassy Suites Secaucus – Meadowlands261Other U.S.2,802Leasehold50% — DoubleTree Las Vegas Airport190Other U.S.2,998Fee Simple50% —Total Unconsolidated Joint Venture Domestic Portfolio4,290405,844$205Unconsolidated Joint Venture International PortfolioHotel NameRoomsMarketMeeting SpaceOwnershipEquity Ownership Hilton Berlin601International13,634Fee Simple40% — Conrad Dublin192International12,653Fee Simple48%$9Total Unconsolidated Joint Venture International Portfolio79326,287$9Total Unconsolidated Joint Venture Portfolio5,083432,131$214TOTAL PARK HOTELS & RESORTS PORTFOLIO35,4252,347,021$2,421
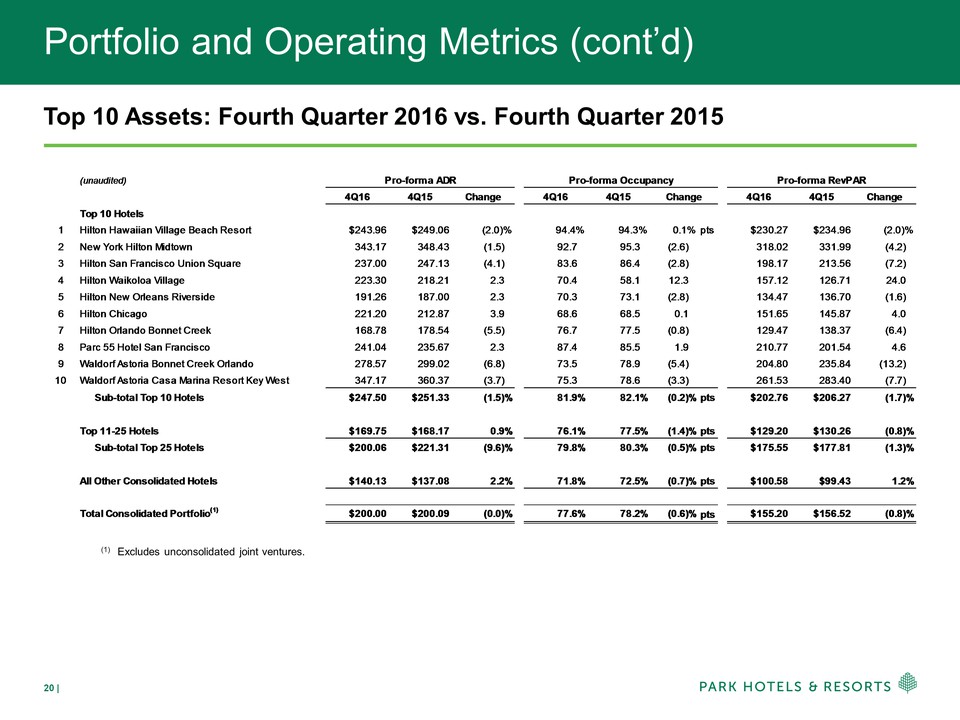
Portfolio and Operating Metrics (cont’d) Top 10 Assets: Fourth Quarter 2016 vs. Fourth Quarter 2015 (1) Excludes unconsolidated joint ventures. (unaudited)4Q164Q15Change4Q164Q154Q164Q15ChangeTop 10 Hotels1Hilton Hawaiian Village Beach Resort$243.96$249.06(2.0)%94.4%94.3%0.1%pts$230.27$234.96(2.0)%2New York Hilton Midtown343.17348.43 (1.5)92.7 95.3 (2.6)318.02331.99 (4.2)3Hilton San Francisco Union Square237.00247.13 (4.1)83.6 86.4 (2.8)198.17213.56 (7.2)4Hilton Waikoloa Village223.30218.21 2.3 70.4 58.1 12.3157.12126.71 24.0 5Hilton New Orleans Riverside191.26187.00 2.3 70.3 73.1 (2.8)134.47136.70 (1.6)6Hilton Chicago221.20212.87 3.9 68.6 68.5 0.1151.65145.87 4.0 7Hilton Orlando Bonnet Creek 168.78178.54 (5.5)76.7 77.5 (0.8)129.47138.37 (6.4)8Parc 55 Hotel San Francisco241.04235.67 2.3 87.4 85.5 1.9210.77201.54 4.6 9Waldorf Astoria Bonnet Creek Orlando278.57299.02 (6.8)73.5 78.9 (5.4)204.80235.84 (13.2)10Waldorf Astoria Casa Marina Resort Key West347.17360.37 (3.7)75.3 78.6 (3.3)261.53283.40 (7.7)Sub-total Top 10 Hotels$247.50$251.33(1.5)%81.9%82.1%(0.2)%pts$202.76$206.27(1.7)%Top 11-25 Hotels$169.75$168.170.9%76.1%77.5%(1.4)%pts$129.20$130.26(0.8)%Sub-total Top 25 Hotels$200.06$221.31(9.6)%79.8%80.3%(0.5)%pts$175.55$177.81(1.3)%All Other Consolidated Hotels$140.13$137.082.2%71.8%72.5%(0.7)%pts$100.58$99.431.2%Total Consolidated Portfolio(1)$200.00$200.09(0.0)%77.6%78.2%(0.6)%pts$155.20$156.52(0.8)%Pro-forma ADRPro-forma RevPARPro-forma OccupancyChange
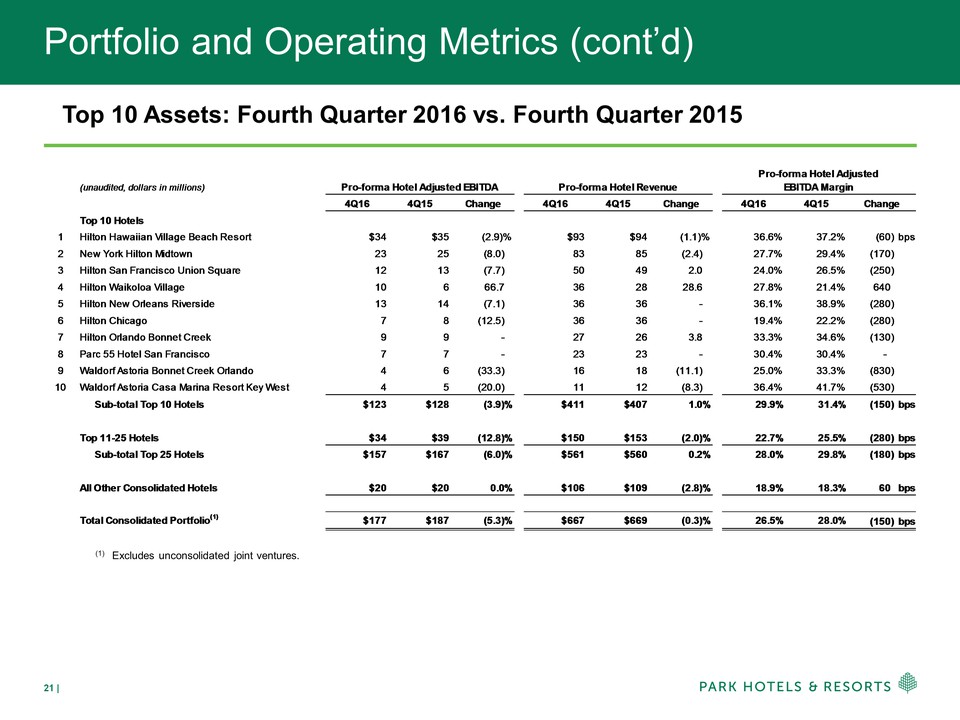
Portfolio and Operating Metrics (cont’d) Top 10 Assets: Fourth Quarter 2016 vs. Fourth Quarter 2015 (1) Excludes unconsolidated joint ventures. (unaudited, dollars in millions)4Q164Q15Change4Q164Q15Change4Q164Q15Top 10 Hotels1Hilton Hawaiian Village Beach Resort$34$35(2.9)%$93$94(1.1)%36.6%37.2%(60) bps2New York Hilton Midtown2325 (8.0)8385 (2.4)27.7%29.4%(170) 3Hilton San Francisco Union Square1213 (7.7)5049 2.0 24.0%26.5%(250) 4Hilton Waikoloa Village106 66.7 3628 28.6 27.8%21.4%640 5Hilton New Orleans Riverside1314 (7.1)3636 – 36.1%38.9%(280) 6Hilton Chicago78 (12.5)3636 – 19.4%22.2%(280) 7Hilton Orlando Bonnet Creek 99 – 2726 3.8 33.3%34.6%(130) 8Parc 55 Hotel San Francisco77 – 2323 – 30.4%30.4% - 9Waldorf Astoria Bonnet Creek Orlando46 (33.3)1618 (11.1)25.0%33.3%(830) 10Waldorf Astoria Casa Marina Resort Key West45 (20.0)1112 (8.3)36.4%41.7%(530) Sub-total Top 10 Hotels$123$128(3.9)%$411$4071.0%29.9%31.4%(150) bpsTop 11-25 Hotels$34$39(12.8)%$150$153(2.0)%22.7%25.5%(280) bpsSub-total Top 25 Hotels$157$167(6.0)%$561$5600.2%28.0%29.8%(180) bpsAll Other Consolidated Hotels$20$200.0%$106$109(2.8)%18.9%18.3%60 bpsTotal Consolidated Portfolio(1)$177$187(5.3)%$667$669(0.3)%26.5%28.0%(150) bpsPro-forma Hotel Adjusted EBITDA MarginChangePro-forma Hotel Adjusted EBITDAPro-forma Hotel Revenue
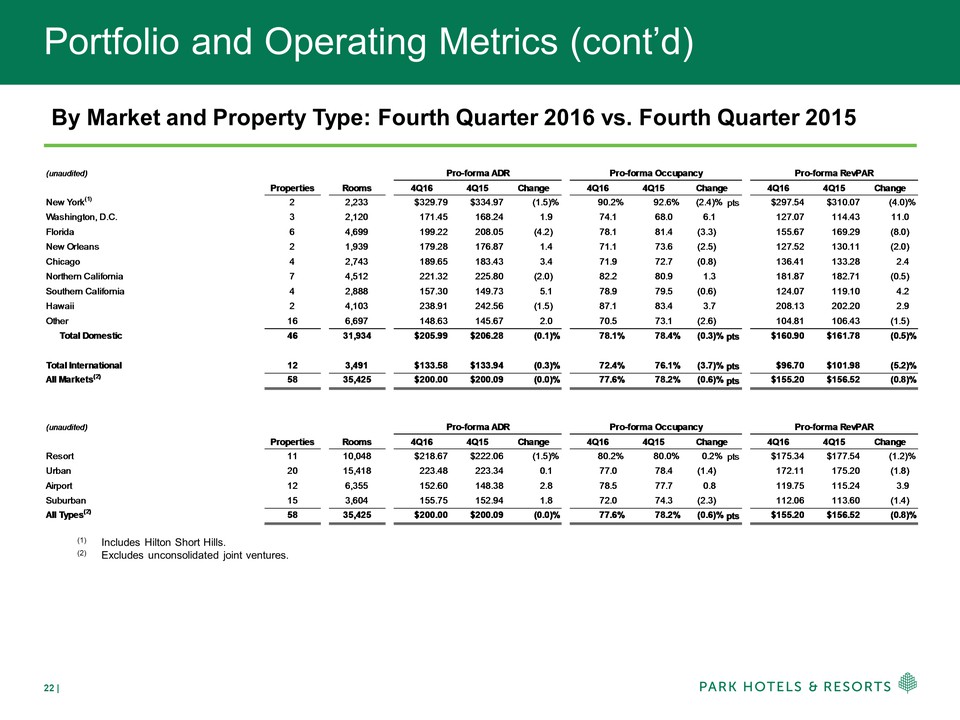
Portfolio and Operating Metrics (cont’d) By Market and Property Type: Fourth Quarter 2016 vs. Fourth Quarter 2015 (1) Includes Hilton Short Hills. (2) Excludes unconsolidated joint ventures. (unaudited)PropertiesRooms4Q164Q15Change4Q164Q154Q164Q15ChangeNew York(1)22,233$329.79$334.97(1.5)%90.2%92.6%(2.4)%pts$297.54$310.07(4.0)%Washington, D.C.32,120171.45168.24 1.9 74.1 68.0 6.1127.07114.43 11.0 Florida64,699199.22208.05 (4.2)78.1 81.4 (3.3)155.67169.29 (8.0)New Orleans21,939179.28176.87 1.4 71.1 73.6 (2.5)127.52130.11 (2.0)Chicago42,743189.65183.43 3.4 71.9 72.7 (0.8)136.41133.28 2.4 Northern California74,512221.32225.80 (2.0)82.2 80.9 1.3181.87182.71 (0.5)Southern California42,888157.30149.73 5.1 78.9 79.5 (0.6)124.07119.10 4.2 Hawaii24,103238.91242.56 (1.5)87.1 83.4 3.7208.13202.20 2.9 Other166,697148.63145.67 2.0 70.5 73.1 (2.6)104.81106.43 (1.5)Total Domestic4631,934$205.99$206.28 (0.1)%78.1%78.4%(0.3)%pts$160.90$161.78(0.5)%Total International 123,491$133.58$133.94(0.3)%72.4%76.1%(3.7)%pts$96.70$101.98(5.2)%All Markets(2)5835,425$200.00$200.09(0.0)%77.6%78.2%(0.6)%pts$155.20$156.52(0.8)%(unaudited)PropertiesRooms4Q164Q15Change4Q164Q154Q164Q15ChangeResort1110,048$218.67$222.06 (1.5)%80.2%80.0%0.2%pts$175.34$177.54(1.2)%Urban2015,418223.48223.34 0.1 77.0 78.4 (1.4)172.11175.20 (1.8)Airport126,355152.60148.38 2.8 78.5 77.7 0.8119.75115.24 3.9 Suburban153,604155.75152.94 1.8 72.0 74.3 (2.3)112.06113.60 (1.4)All Types(2)5835,425$200.00$200.09(0.0)%77.6%78.2%(0.6)%pts$155.20$156.52(0.8)%Pro-forma ADRPro-forma RevPARPro-forma ADRPro-forma RevPARPro-forma OccupancyChangePro-forma OccupancyChange
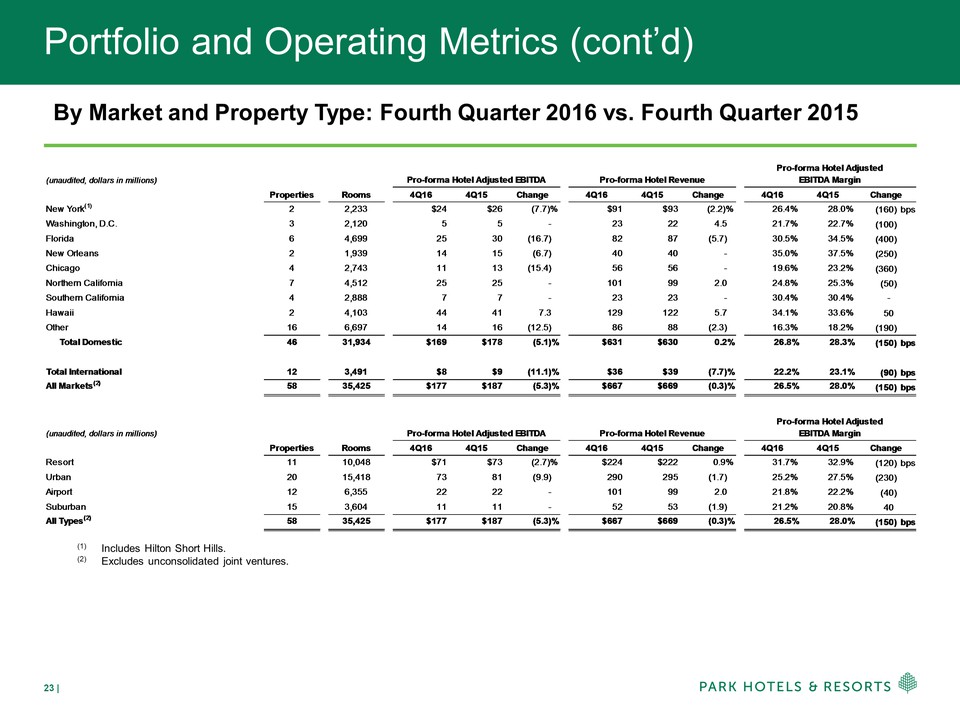
Portfolio and Operating Metrics (cont’d) By Market and Property Type: Fourth Quarter 2016 vs. Fourth Quarter 2015 (1) Includes Hilton Short Hills. (2) Excludes unconsolidated joint ventures. (unaudited, dollars in millions)PropertiesRooms4Q164Q15Change4Q164Q15Change4Q164Q15New York(1)22,233$24$26(7.7)%$91$93(2.2)%26.4%28.0% (160)bpsWashington, D.C.32,12055 – 2322 4.5 21.7%22.7% (100)Florida64,6992530 (16.7)8287 (5.7)30.5%34.5% (400)New Orleans21,9391415 (6.7)4040 – 35.0%37.5% (250)Chicago42,7431113 (15.4)5656 – 19.6%23.2% (360)Northern California74,5122525 – 10199 2.0 24.8%25.3% (50)Southern California42,88877 – 2323 – 30.4%30.4% - Hawaii24,1034441 7.3 129122 5.7 34.1%33.6% 50Other166,6971416 (12.5)8688 (2.3)16.3%18.2% (190)Total Domestic4631,934$169$178(5.1)%$631$6300.2%26.8%28.3% (150)bpsTotal International 123,491$8$9(11.1)%$36$39(7.7)%22.2%23.1% (90)bpsAll Markets(2)5835,425$177$187(5.3)%$667$669(0.3)%26.5%28.0% (150)bps(unaudited, dollars in millions)PropertiesRooms4Q164Q15Change4Q164Q15Change4Q164Q15Resort1110,048$71$73(2.7)%$224$2220.9%31.7%32.9% (120)bpsUrban2015,4187381 (9.9)290295 (1.7)25.2%27.5% (230)Airport126,3552222 – 10199 2.0 21.8%22.2% (40)Suburban153,6041111 – 5253 (1.9)21.2%20.8% 40All Types(2)5835,425$177$187(5.3)%$667$669(0.3)%26.5%28.0% (150)bpsPro-forma Hotel Adjusted EBITDAPro-forma Hotel RevenuePro-forma Hotel Adjusted EBITDAPro-forma Hotel RevenueChangePro-forma Hotel Adjusted EBITDA MarginChange
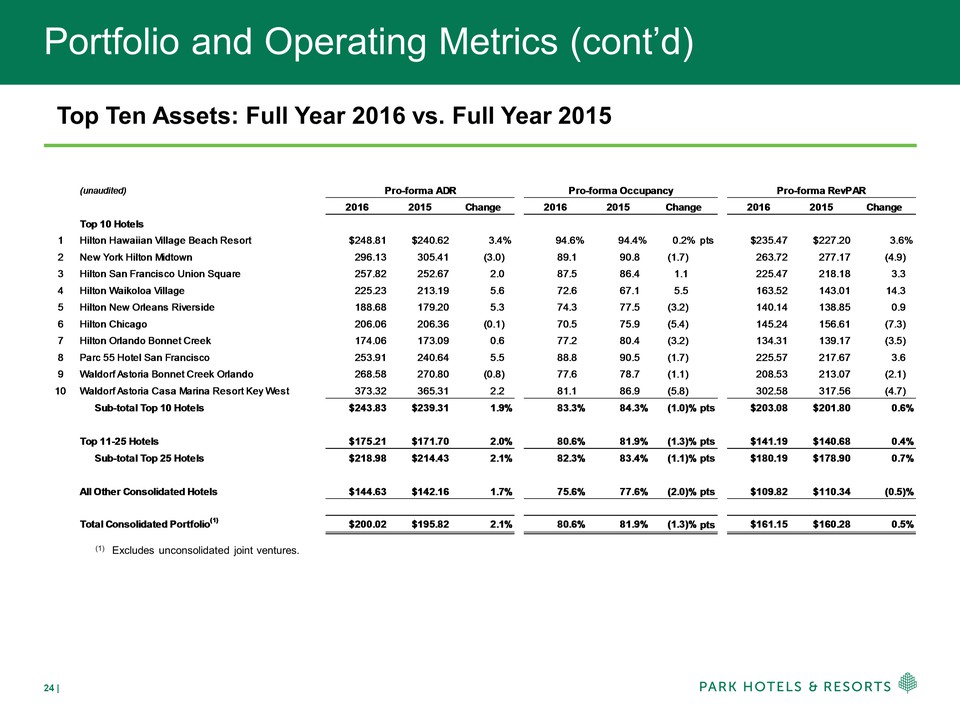
Portfolio and Operating Metrics (cont’d) Top Ten Assets: Full Year 2016 vs. Full Year 2015 (1) Excludes unconsolidated joint ventures. (unaudited)20162015Change2016201520162015ChangeTop 10 Hotels1Hilton Hawaiian Village Beach Resort$248.81$240.623.4%94.6%94.4%0.2%pts$235.47$227.203.6%2New York Hilton Midtown296.13305.41 (3.0)89.1 90.8 (1.7)263.72277.17 (4.9)3Hilton San Francisco Union Square257.82252.67 2.0 87.5 86.4 1.1225.47218.18 3.3 4Hilton Waikoloa Village225.23213.19 5.6 72.6 67.1 5.5163.52143.01 14.3 5Hilton New Orleans Riverside188.68179.20 5.3 74.3 77.5 (3.2)140.14138.85 0.9 6Hilton Chicago206.06206.36 (0.1)70.5 75.9 (5.4)145.24156.61 (7.3)7Hilton Orlando Bonnet Creek 174.06173.09 0.6 77.2 80.4 (3.2)134.31139.17 (3.5)8Parc 55 Hotel San Francisco253.91240.64 5.5 88.8 90.5 (1.7)225.57217.67 3.6 9Waldorf Astoria Bonnet Creek Orlando268.58270.80 (0.8)77.6 78.7 (1.1)208.53213.07 (2.1)10Waldorf Astoria Casa Marina Resort Key West373.32365.31 2.2 81.1 86.9 (5.8)302.58317.56 (4.7)Sub-total Top 10 Hotels$243.83$239.311.9%83.3%84.3%(1.0)%pts$203.08$201.800.6%Top 11-25 Hotels$175.21$171.702.0%80.6%81.9%(1.3)%pts$141.19$140.680.4%Sub-total Top 25 Hotels$218.98$214.432.1%82.3%83.4%(1.1)%pts$180.19$178.900.7%All Other Consolidated Hotels$144.63$142.161.7%75.6%77.6%(2.0)%pts$109.82$110.34(0.5)%Total Consolidated Portfolio(1)$200.02$195.822.1%80.6%81.9%(1.3)%pts$161.15$160.280.5%Pro-forma ADRPro-forma RevPAR
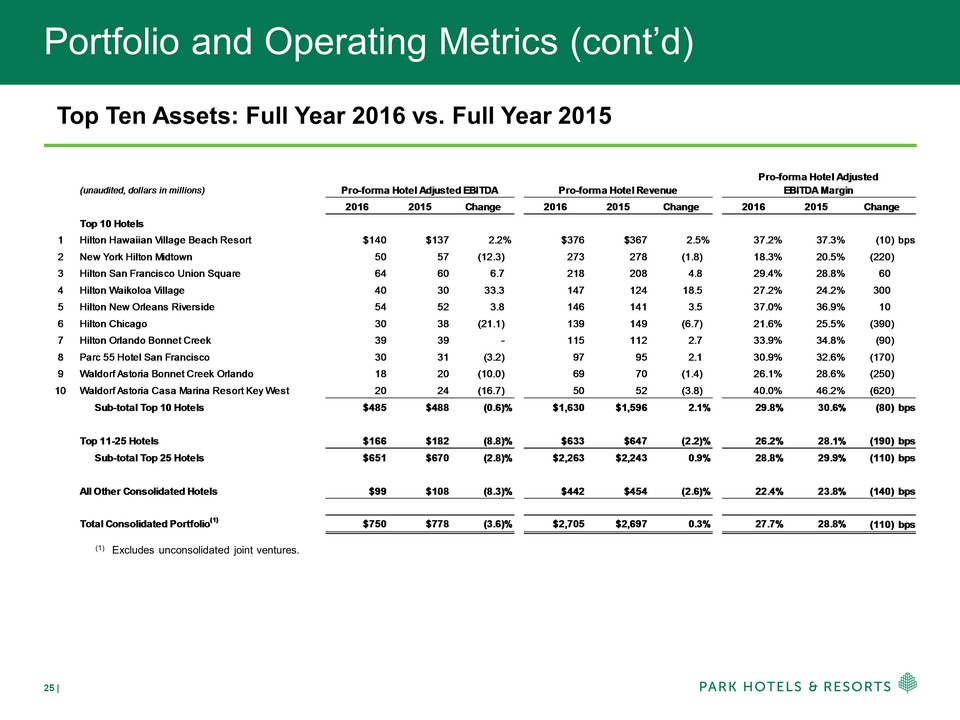
Portfolio and Operating Metrics (cont’d) Top Ten Assets: Full Year 2016 vs. Full Year 2015 (1) Excludes unconsolidated joint ventures. (unaudited, dollars in millions)20162015Change20162015Change20162015Top 10 Hotels1Hilton Hawaiian Village Beach Resort$140$1372.2%$376$3672.5%37.2%37.3%(10) bps2New York Hilton Midtown5057 (12.3)273278 (1.8)18.3%20.5%(220) 3Hilton San Francisco Union Square6460 6.7 218208 4.8 29.4%28.8%60 4Hilton Waikoloa Village4030 33.3 147124 18.5 27.2%24.2%300 5Hilton New Orleans Riverside5452 3.8 146141 3.5 37.0%36.9%10 6Hilton Chicago3038 (21.1)139149 (6.7)21.6%25.5%(390) 7Hilton Orlando Bonnet Creek 3939 - 115112 2.7 33.9%34.8%(90) 8Parc 55 Hotel San Francisco3031 (3.2)9795 2.1 30.9%32.6%(170) 9Waldorf Astoria Bonnet Creek Orlando1820 (10.0)6970 (1.4)26.1%28.6%(250) 10Waldorf Astoria Casa Marina Resort Key West2024 (16.7)5052 (3.8)40.0%46.2%(620) Sub-total Top 10 Hotels$485$488(0.6)%$1,630$1,5962.1%29.8%30.6%(80) bpsTop 11-25 Hotels$166$182(8.8)%$633$647(2.2)%26.2%28.1%(190) bpsSub-total Top 25 Hotels$651$670(2.8)%$2,263$2,2430.9%28.8%29.9%(110) bpsAll Other Consolidated Hotels$99$108(8.3)%$442$454(2.6)%22.4%23.8%(140) bpsTotal Consolidated Portfolio(1)$750$778(3.6)%$2,705$2,6970.3%27.7%28.8%(110) bpsChangePro-forma Hotel Adjusted EBITDA MarginPro-forma Hotel Adjusted EBITDAPro-forma Hotel Revenue
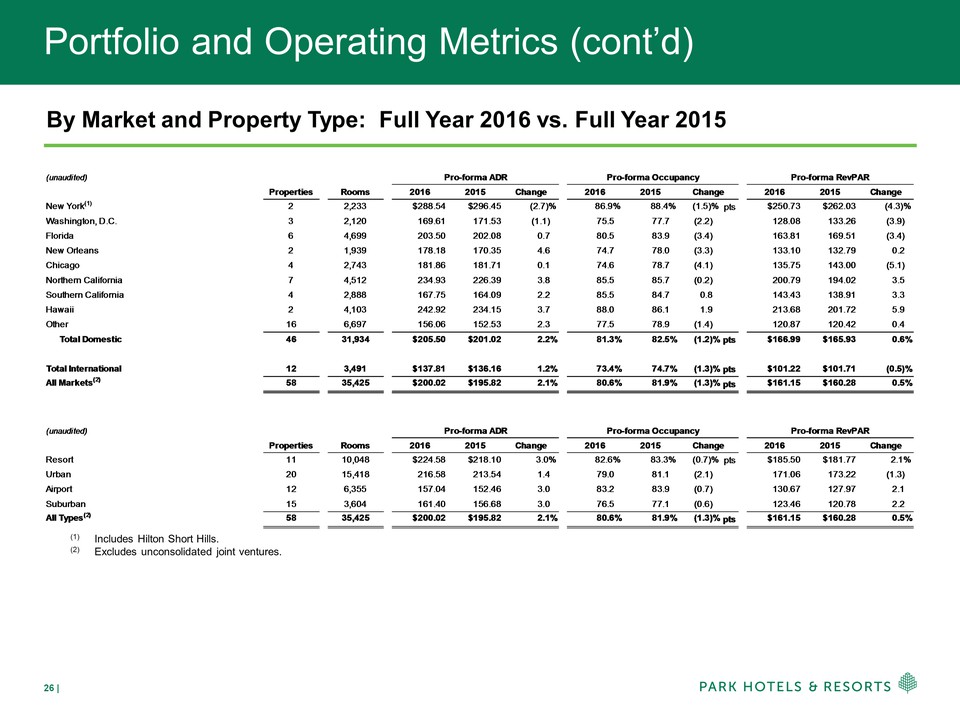
Portfolio and Operating Metrics (cont’d) By Market and Property Type: Full Year 2016 vs. Full Year 2015 (1) Includes Hilton Short Hills. (2) Excludes unconsolidated joint ventures. (unaudited) PropertiesRooms20162015Change2016201520162015ChangeNew York(1)22,233$288.54$296.45(2.7)%86.9%88.4%(1.5)%pts$250.73$262.03(4.3)%Washington, D.C.32,120169.61171.53 (1.1) 75.5 77.7 (2.2)128.08133.26 (3.9)Florida64,699203.50202.08 0.7 80.5 83.9 (3.4)163.81169.51 (3.4)New Orleans21,939178.18170.35 4.6 74.7 78.0 (3.3)133.10132.79 0.2 Chicago42,743181.86181. 71 0.1 74.6 78.7 (4.1)135.75143.00 (5.1)Northern California74,512234.93226.39 3.8 85.5 85.7 (0.2)200.79194.02 3.5 Southern California42,888167.75164.09 2.2 85.5 84.7 0.8143.43138.91 3.3 Hawaii24,103242.92234.15 3.7 88.0 86.1 1.9213.68201.72 5.9 Other166,697156.06152.53 2.3 77.5 78.9 (1.4)120.87120.42 0.4 Total Domestic4631,934$205.50$201.022.2%81.3%82.5%(1.2)%pts $166.99$165.930.6%Total International 123,491$137.81$136.161.2%73.4%74.7%(1.3)%pts$101.22$101.71(0.5)%All Markets(2)5835,425$200.02$195.822.1%80.6%81.9%(1.3)%pts$161.15$160.280.5%(unaudited)PropertiesRooms20162015Change2016201520162015ChangeResort1110,048$224.58$218.103.0%82.6% 83.3%(0.7)%pts$185.50$181.772.1%Urban2015,418216.58213.54 1.4 79.0 81.1 (2.1)171.06173.22 (1.3)Airport126,355157.04152.46 3.0 83.2 83.9 (0.7)130.67127.97 2.1 Suburban153,604161.40156.68 3.0 76.5 77.1 (0.6)123.46120.78 2.2 All Types(2)5835,425$200.02$195.822.1%80.6%81.9%(1.3)%pts$161.15$160.280.5%Pro-forma ADRPro-forma RevPARPro-forma ADRPro-forma RevPAR
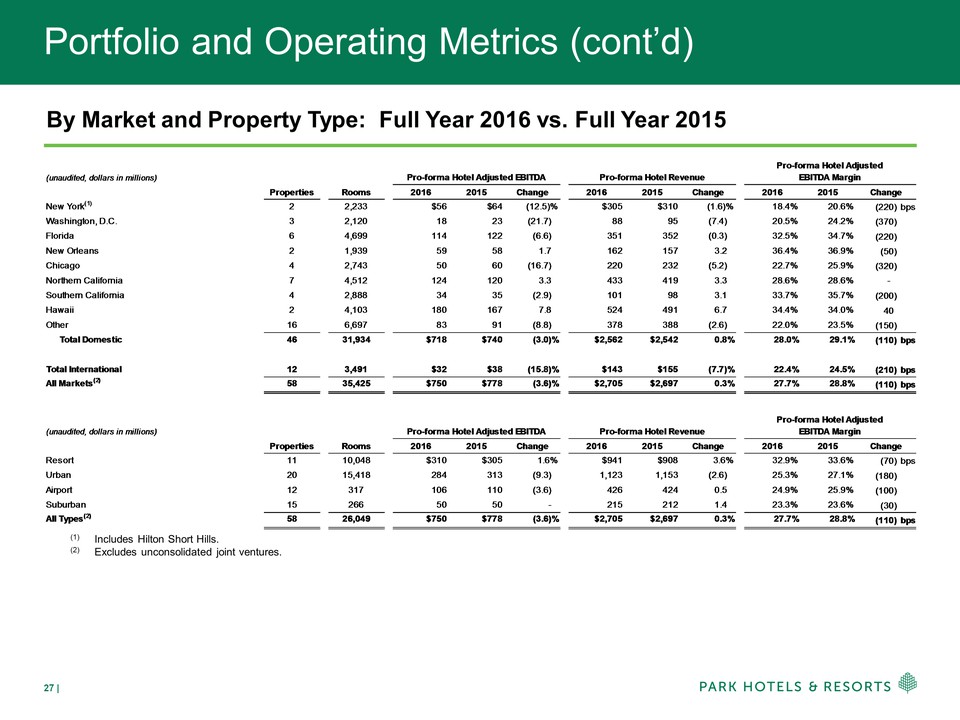
Portfolio and Operating Metrics (cont’d) By Market and Property Type: Full Year 2016 vs. Full Year 2015 (1) Includes Hilton Short Hills. (2) Excludes unconsolidated joint ventures. (unaudited, dollars in millions)PropertiesRooms20162015Change20162015Change20162015New York(1)22,233$56$64(12.5)%$305$310(1.6)%18.4%20.6% (220)bpsWashington, D.C.32,1201823 (21.7)8895 (7.4)20.5%24.2% (370)Florida64,699114122 (6.6)351352 (0.3)32.5%34.7% (220)New Orleans21,9395958 1.7 162157 3.2 36.4%36.9% (50)Chicago42,7435060 (16.7)220232 (5.2)22.7%25.9% (320)Northern California74,512124120 3.3 433419 3.3 28.6%28.6% - Southern California42,8883435 (2.9)10198 3.1 33.7%35.7% (200)Hawaii24,103180167 7.8 524491 6.7 34.4%34.0% 40Other166,6978391 (8.8)378388 (2.6)22.0%23.5% (150)Total Domestic4631,934$718$740(3.0)%$2,562$2,5420.8%28.0%29.1% (110)bpsTotal International 123,491$32$38(15.8)%$143$155(7.7)%22.4%24.5% (210)bpsAll Markets(2)5835,425$750$778(3.6)%$2,705$2,6970.3%27.7%28.8% (110)bps(unaudited, dollars in millions)PropertiesRooms20162015Change20162015Change20162015Resort1110,048$310$3051.6%$941$9083.6%32.9%33.6% (70)bpsUrban2015,418284313 (9.3) 1,123 1,153 (2.6)25.3%27.1% (180)Airport12317106110 (3.6)426424 0.5 24.9%25.9% (100)Suburban152665050 - 215212 1.4 23.3%23.6% (30)All Types(2)5826,049$750$778(3.6)%$2,705$2,6970.3%27.7%28.8% (110)bpsPro-forma Hotel Adjusted EBITDAPro-forma Hotel RevenuePro-forma Hotel Adjusted EBITDAPro-forma Hotel RevenuePro-forma Hotel Adjusted EBITDA MarginPro-forma Hotel Adjusted EBITDA MarginChange
Debt Summary Casa Marina, a Waldorf Astoria Resort Hilton Orlando Bonnet Creek Hilton San Francisco Union Square
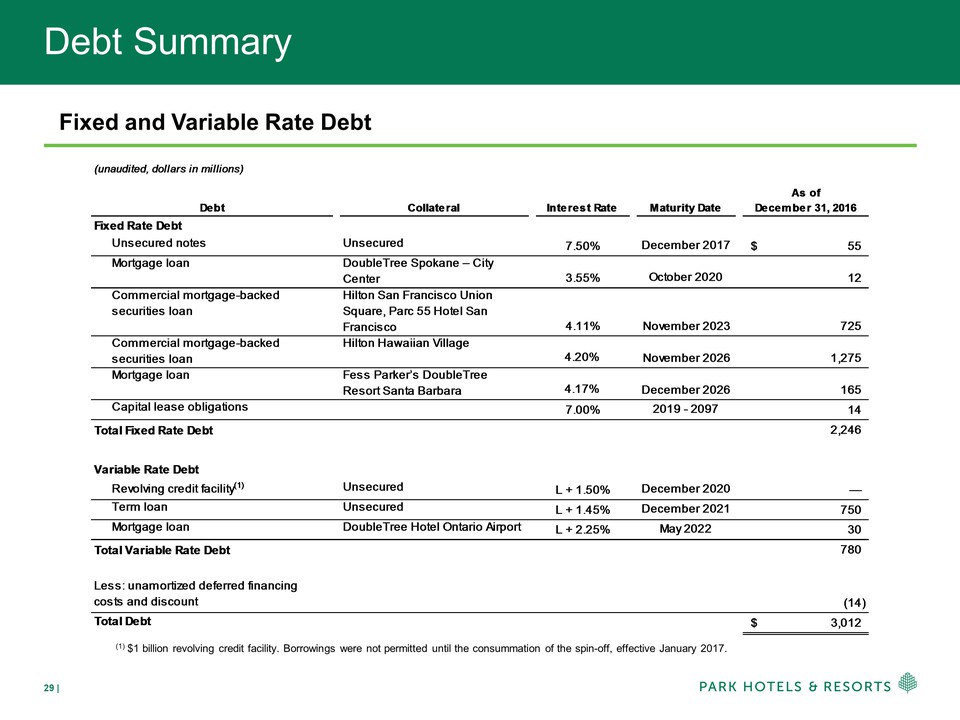
Debt Summary Fixed and Variable Rate Debt (1) $1 billion revolving credit facility. Borrowings were not permitted until the consummation of the spin-off, effective January 2017. (unaudited, dollars in millions)DebtCollateralInterest RateMaturity DateAs ofDecember 31, 2016Fixed Rate DebtUnsecured notes Unsecured7.50%December 201755$ Mortgage loanDoubleTree Spokane – City Center3.55%October 2020 12Commercial mortgage-backed securities loan Hilton San Francisco Union Square, Parc 55 Hotel San Francisco4.11%November 2023 725Commercial mortgage-backed securities loan Hilton Hawaiian Village4.20%November 2026 1,275Mortgage loanFess Parker’s DoubleTree Resort Santa Barbara4.17%December 2026 165Capital lease obligations7.00%2019 - 2097 14 2,246Variable Rate DebtRevolving credit facility(1)UnsecuredL + 1.50%December 2020 —Term loanUnsecuredL + 1.45%December 2021 750Mortgage loanDoubleTree Hotel Ontario AirportL + 2.25%May 2022 30 780Less: unamortized deferred financing costs and discount (14)Total Debt3,012$ Total Variable Rate DebtTotal Fixed Rate

Definitions Hilton Belfast Hilton Durban Hilton New York Midtown
Definitions EBITDA, Adjusted EBITDA, Hotel Adjusted EBITDA and Hotel Adjusted EBITDA MarginEarnings before interest expense, taxes and depreciation and amortization (“EBITDA”), presented herein, reflects net income (loss), excluding interest expense, a provision for income taxes and depreciation and amortization. The Company considers EBITDA to be a useful measure for investors in evaluating and facilitating comparisons of its operating performance between periods and between REITs by removing the impact of the Company’s capital structure (primarily interest expense) and asset base (primarily depreciation and amortization) from its operating results. Adjusted EBITDA, presented herein, is calculated as EBITDA, as previously defined, further adjusted to exclude gains, losses and expenses in connection with: (i) asset dispositions for both consolidated and unconsolidated investments; (ii) foreign currency transactions; (iii) debt restructurings/retirements; (iv) non-cash impairment losses; (v) furniture, fixtures and equipment (“FF&E”) replacement reserves required by certain lease agreements; (vi) reorganization costs; (vii) share-based and certain other compensation expenses; (viii) severance, relocation and other expenses; and (ix) other items.Hotel Adjusted EBITDA measures property-level results before debt service, depreciation and corporate expenses of the Company’s consolidated properties, including both comparable and non-comparable hotels but excluding properties owned by unconsolidated affiliates, and is a key measure of the Company’s profitability. The Company presents Hotel Adjusted EBITDA to help the Company and its investors evaluate the ongoing operating performance of the Company’s consolidated properties. Hotel Adjusted EBITDA margin, is calculated as Hotel Adjusted EBITDA as a percentage of Total Hotel Revenue. EBITDA, Adjusted EBITDA, Hotel Adjusted EBITDA and Hotel Adjusted EBITDA margin are not recognized terms under United States (“U.S.”) GAAP and should not be considered as alternatives to net income (loss) or other measures of financial performance or liquidity derived in accordance with U.S. GAAP. In addition, the Company’s definitions of EBITDA, Adjusted EBITDA, Hotel Adjusted EBITDA and Hotel Adjusted EBITDA margin may not be comparable to similarly titled measures of other companies.The Company believes that EBITDA, Adjusted EBITDA, Hotel Adjusted EBITDA and Hotel Adjusted EBITDA margin provide useful information to investors about the Company and its financial condition and results of operations for the following reasons: (i) EBITDA, Adjusted EBITDA, Hotel Adjusted EBITDA and Hotel Adjusted EBITDA margin are among the measures used by the Company’s management team to evaluate its operating performance and make day-to-day operating decisions; and (ii) EBITDA, Adjusted EBITDA, Hotel Adjusted EBITDA and Hotel Adjusted EBITDA margin are frequently used by securities analysts, investors and other interested parties as a common performance measure to compare results or estimate valuations across companies in the industry.EBITDA, Adjusted EBITDA, Hotel Adjusted EBITDA and Hotel Adjusted EBITDA margin have limitations as analytical tools and should not be considered either in isolation or as a substitute for net income (loss) or other methods of analyzing results as reported under U.S. GAAP.
Definitions (cont’d) NAREIT FFO attributable to Parent, or stockholders, and Adjusted FFO attributable to Parent, or stockholdersNAREIT FFO attributable to Parent, or stockholders, presented herein, is calculated as net income (loss) attributable to Parent, or stockholders, (calculated in accordance with U.S. GAAP), excluding gains (losses) from sales of real estate, the cumulative effect of changes in accounting principles, real estate-related depreciation, amortization and impairments and adjustments for unconsolidated joint ventures. Adjustments for unconsolidated joint ventures are calculated to reflect the Company’s pro rata share of the FFO of those entities on the same basis. The Company calculates NAREIT FFO attributable to Parent, or stockholders, for a given operating period in accordance with the guidelines of the National Association of Real Estate Investment Trusts (“NAREIT”). As noted by NAREIT in its April 2002 “White Paper on Funds From Operations,” since real estate values historically have risen or fallen with market conditions, many industry investors have considered presentation of operating results for real estate companies that use historical cost accounting to be insufficient by themselves. For these reasons, NAREIT adopted the FFO metric in order to promote an industry-wide measure of REIT operating performance.Adjusted FFO attributable to Parent, or stockholders, presented herein, is NAREIT FFO attributable to Parent, or stockholders, as previously defined, further adjusted to exclude: (i) foreign currency (gains) losses; (ii) acquisition costs; (iii) litigation gains and losses; and (iv) other items. In certain circumstances, the Company may also adjust NAREIT FFO attributable to parent, or stockholders, attributable for additional gains or losses that the Company’s management believes are not representative of its current operating performance. NAREIT FFO attributable to Parent, or stockholders, and Adjusted FFO attributable to Parent, or stockholders, are not recognized terms under U.S. GAAP and should not be considered as alternatives to net income (loss) or other measures of financial performance or liquidity derived in accordance with U.S. GAAP. In addition, the Company’s definitions of NAREIT FFO attributable to Parent, or stockholders, and Adjusted FFO attributable to Parent, or stockholders, may not be comparable to similarly titled measures of other companies.The Company believes that NAREIT FFO attributable to Parent, or stockholders, and Adjusted FFO attributable to Parent, or stockholders, provide useful information to investors about the Company and its financial condition and results of operations for the following reasons: (i) these measures are among the measures used by the Company’s management team to evaluate its operating performance and make day-to-day operating decisions; and (ii) these measures are frequently used by securities analysts, investors and other interested parties as a common performance measure to compare results or estimate valuations across companies in the industry.NAREIT FFO attributable to Parent, or stockholders, and Adjusted FFO attributable to Parent, or stockholders, have limitations as analytical tools and should not be considered either in isolation or as a substitute for net income (loss), cash flow or other methods of analyzing results as reported under U.S. GAAP.
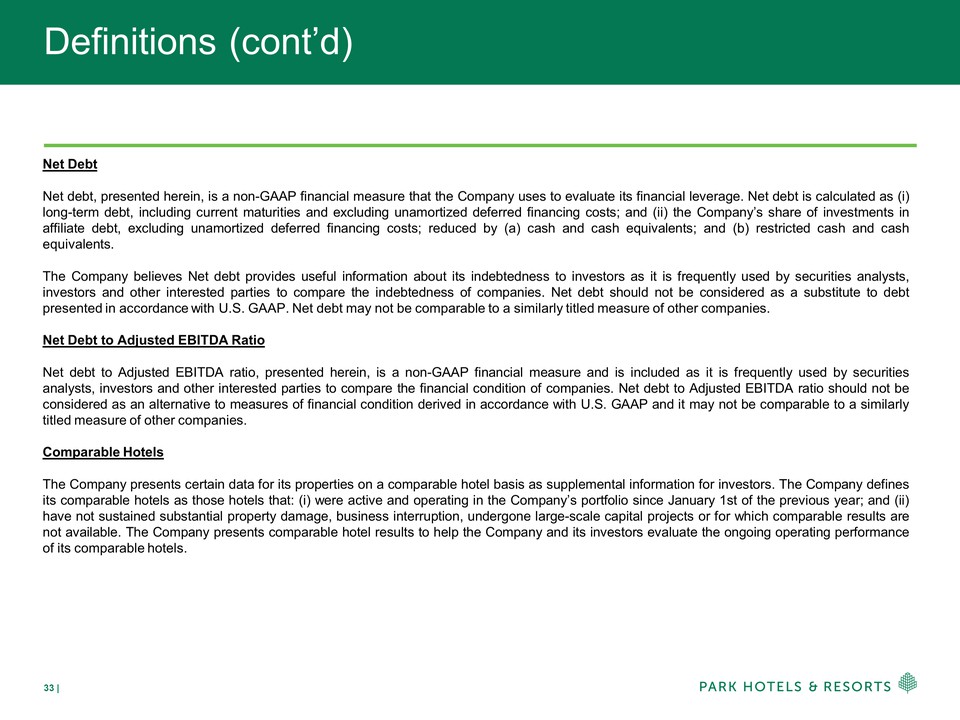
Definitions (cont’d) Net DebtNet debt, presented herein, is a non-GAAP financial measure that the Company uses to evaluate its financial leverage. Net debt is calculated as (i) long-term debt, including current maturities and excluding unamortized deferred financing costs; and (ii) the Company’s share of investments in affiliate debt, excluding unamortized deferred financing costs; reduced by (a) cash and cash equivalents; and (b) restricted cash and cash equivalents.The Company believes Net debt provides useful information about its indebtedness to investors as it is frequently used by securities analysts, investors and other interested parties to compare the indebtedness of companies. Net debt should not be considered as a substitute to debt presented in accordance with U.S. GAAP. Net debt may not be comparable to a similarly titled measure of other companies.Net Debt to Adjusted EBITDA RatioNet debt to Adjusted EBITDA ratio, presented herein, is a non-GAAP financial measure and is included as it is frequently used by securities analysts, investors and other interested parties to compare the financial condition of companies. Net debt to Adjusted EBITDA ratio should not be considered as an alternative to measures of financial condition derived in accordance with U.S. GAAP and it may not be comparable to a similarly titled measure of other companies.Comparable HotelsThe Company presents certain data for its properties on a comparable hotel basis as supplemental information for investors. The Company defines its comparable hotels as those hotels that: (i) were active and operating in the Company’s portfolio since January 1st of the previous year; and (ii) have not sustained substantial property damage, business interruption, undergone large-scale capital projects or for which comparable results are not available. The Company presents comparable hotel results to help the Company and its investors evaluate the ongoing operating performance of its comparable hotels.
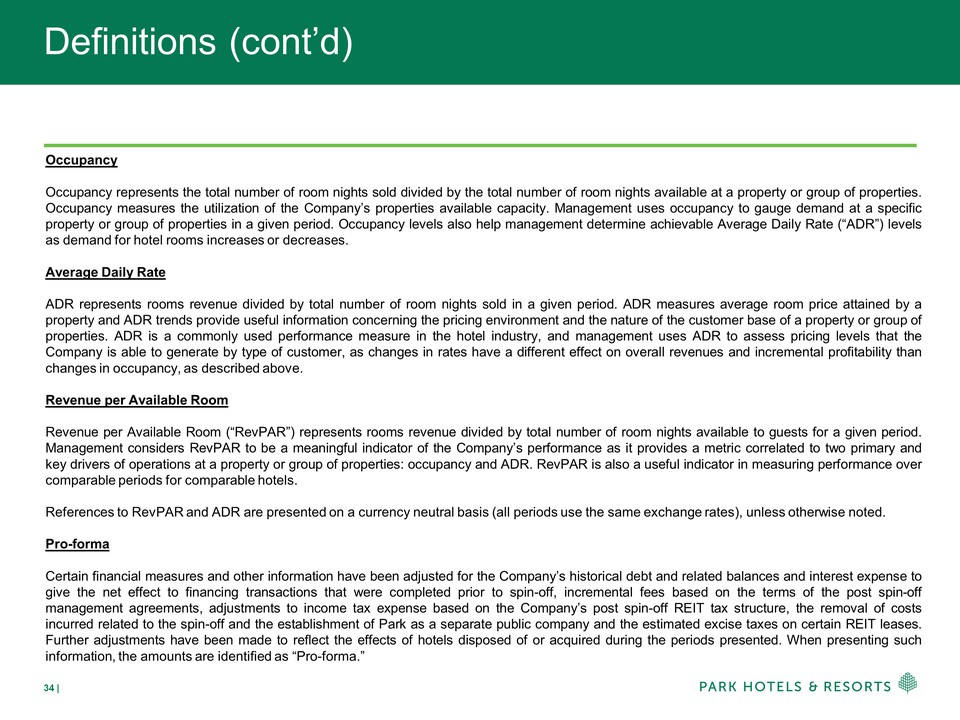
Definitions (cont’d) OccupancyOccupancy represents the total number of room nights sold divided by the total number of room nights available at a property or group of properties. Occupancy measures the utilization of the Company’s properties available capacity. Management uses occupancy to gauge demand at a specific property or group of properties in a given period. Occupancy levels also help management determine achievable Average Daily Rate (“ADR”) levels as demand for hotel rooms increases or decreases.Average Daily RateADR represents rooms revenue divided by total number of room nights sold in a given period. ADR measures average room price attained by a property and ADR trends provide useful information concerning the pricing environment and the nature of the customer base of a property or group of properties. ADR is a commonly used performance measure in the hotel industry, and management uses ADR to assess pricing levels that the Company is able to generate by type of customer, as changes in rates have a different effect on overall revenues and incremental profitability than changes in occupancy, as described above.Revenue per Available RoomRevenue per Available Room (“RevPAR”) represents rooms revenue divided by total number of room nights available to guests for a given period. Management considers RevPAR to be a meaningful indicator of the Company’s performance as it provides a metric correlated to two primary and key drivers of operations at a property or group of properties: occupancy and ADR. RevPAR is also a useful indicator in measuring performance over comparable periods for comparable hotels.References to RevPAR and ADR are presented on a currency neutral basis (all periods use the same exchange rates), unless otherwise noted.Pro-formaCertain financial measures and other information have been adjusted for the Company’s historical debt and related balances and interest expense to give the net effect to financing transactions that were completed prior to spin-off, incremental fees based on the terms of the post spin-off management agreements, adjustments to income tax expense based on the Company’s post spin-off REIT tax structure, the removal of costs incurred related to the spin-off and the establishment of Park as a separate public company and the estimated excise taxes on certain REIT leases. Further adjustments have been made to reflect the effects of hotels disposed of or acquired during the periods presented. When presenting such information, the amounts are identified as “Pro-forma.”
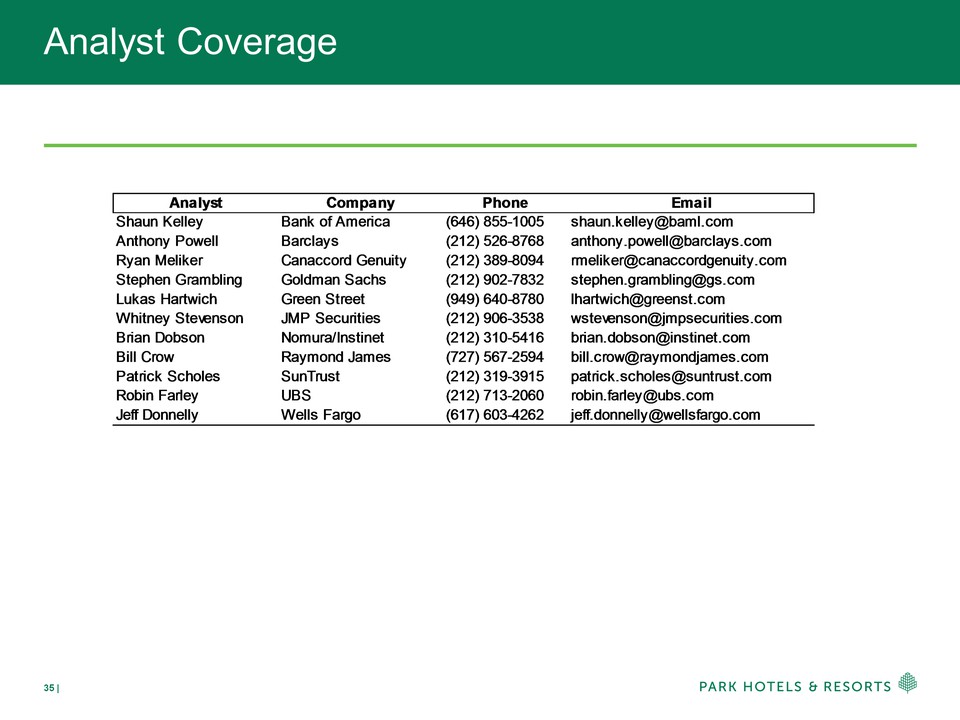
Analyst Coverage Analyst Company Phone Email Shaun Kelley Bank of America(646) 855-1005shaun.kelley@baml.comAnthony Powell Barclays(212) 526-8768anthony.powell@barclays.comRyan Meliker Canaccord Genuity (212) 389-8094rmeliker@canaccordgenuity.comStephen Grambling Goldman Sachs(212) 902-7832stephen.grambling@gs.comLukas HartwichGreen Street(949) 640-8780lhartwich@greenst.comWhitney Stevenson JMP Securities(212) 906-3538wstevenson@jmpsecurities.comBrian Dobson Nomura/Instinet (212) 310-5416brian.dobson@instinet.comBill Crow Raymond James(727) 567-2594bill.crow@raymondjames.comPatrick Scholes SunTrust (212) 319-3915patrick.scholes@suntrust.comRobin Farley UBS(212) 713-2060 robin.farley@ubs.comJeff DonnellyWells Fargo(617) 603-4262jeff.donnelly@wellsfargo.com