Attached files
| file | filename |
|---|---|
| EX-32 - EX-32 - ODP Corp | d323665dex32.htm |
| EX-31.2 - EX-31.2 - ODP Corp | d323665dex312.htm |
| EX-31.1 - EX-31.1 - ODP Corp | d323665dex311.htm |
| EX-23.1 - EX-23.1 - ODP Corp | d323665dex231.htm |
| EX-21 - EX-21 - ODP Corp | d323665dex21.htm |
Table of Contents
UNITED STATES SECURITIES AND EXCHANGE COMMISSION
Washington, DC 20549
FORM 10-K
(Mark One)
| ☒ | Annual Report Pursuant to Section 13 or 15 (d) of the Securities Exchange Act of 1934 |
For the fiscal year ended December 31, 2016
Or
| ☐ | Transition Report Pursuant to Section 13 or 15 (d) of the Securities Exchange Act of 1934 |
For the transition period from to
Commission file number 1-10948
Office Depot, Inc.
(Exact name of registrant as specified in its charter)

| Delaware | 59-2663954 | |
| (State or other jurisdiction of incorporation or organization) |
(I.R.S. Employer Identification No.) | |
| 6600 North Military Trail, Boca Raton, Florida | 33496 | |
| (Address of principal executive offices) | (Zip Code) | |
(561) 438-4800
(Registrant’s telephone number, including area code)
Securities registered pursuant to Section 12(b) of the Act:
| Title of each class |
Name of each exchange on which registered | |
| Common Stock, par value $0.01 per share |
NASDAQ Stock Market |
Securities registered pursuant to Section 12(g) of the Act: None
Indicate by check mark if the registrant is a well-known seasoned issuer, as defined in Rule 405 of the Securities Act. Yes ☒ No ☐
Indicate by check mark if the registrant is not required to file reports pursuant to Section 13 or 15(d) of the Act. Yes ☐ No ☒
Indicate by check mark whether the registrant (1) has filed all reports required to be filed by Section 13 or 15(d) of the Securities Exchange Act of 1934 during the preceding 12 months (or for such shorter period that the registrant was required to file such reports) and (2) has been subject to such filing requirements for the past 90 days: Yes ☒ No ☐
Indicate by check mark whether the registrant has submitted electronically and posted on its corporate Web site, if any, every Interactive Data File required to be submitted and posted pursuant to Rule 405 of Regulation S-T (§ 232.405 of this chapter) during the preceding 12 months (or for such shorter period that the registrant was required to submit and post such files): Yes ☒ No ☐
Indicate by check mark if disclosure of delinquent filers pursuant to Item 405 of Regulation S-K (§ 229.405 of this chapter) is not contained herein, and will not be contained, to the best of registrant’s knowledge, in definitive proxy or information statements incorporated by reference in Part III of this Form 10-K or any amendment to this Form 10-K. ☒
Indicate by check mark whether the registrant is a large accelerated filer, an accelerated filer, a non-accelerated filer or a smaller reporting company. See the definitions of “large accelerated filer” “accelerated filer,” and “smaller reporting company” in Rule 12b-2 of the Exchange Act.
| Large accelerated filer ☒ | Accelerated filer ☐ |
Non-accelerated filer ☐ |
Smaller reporting company ☐ | |||
| (Do not check if a smaller reporting company) | ||||||
Indicate by check mark whether the registrant is a shell company (as defined in Rule 12b-2 of the Act). Yes ☐ No ☒
The aggregate market value of voting stock held by non-affiliates of the registrant as of June 25, 2016 (based on the closing market price on the Composite Tape on June 24, 2016) was approximately $1,829,479,538 (determined by subtracting from the number of shares outstanding on that date the number of shares held by affiliates of Office Depot, Inc.).
The number of shares outstanding of the registrant’s common stock, as of the latest practicable date: At January 28, 2017, there were 514,820,686 outstanding shares of Office Depot, Inc. Common Stock, $0.01 par value.
Documents Incorporated by Reference:
Certain information required for Part III of this Annual Report on Form 10-K is incorporated by reference to the Office Depot, Inc. definitive Proxy Statement for its 2017 Annual Meeting of Shareholders, which shall be filed with the Securities and Exchange Commission pursuant to Regulation 14A of the Securities Act of 1934, as amended, within 120 days of Office Depot, Inc.’s fiscal year end.
Table of Contents
Table of Contents
Forward-Looking Statements
This Annual Report on Form 10-K (“Annual Report”) contains forward-looking statements, within the meaning of the Private Securities Litigation Reform Act of 1995 (the “Reform Act”), that involve risks and uncertainties. These forward-looking statements include both historical information and other information that can be used to infer future performance. Examples of historical information include annual financial statements and the commentary on past performance contained in Part II — Item 7. “Management’s Discussion and Analysis of Financial Condition and Results of Operations” (“MD&A”). While certain information has specifically been identified as being forward-looking in the context of its presentation, we caution you that, with the exception of information that is historical, all the information contained in this Annual Report should be considered to be “forward-looking statements” as referred to in the Reform Act. Without limiting the generality of the preceding sentence, any time we use the words “estimate,” “project,” “intend,” “expect,” “believe,” “anticipate,” “continue” and similar expressions, we intend to clearly express that the information deals with possible future events and is forward-looking in nature. Certain information in our MD&A is clearly forward-looking in nature, and without limiting the generality of the preceding cautionary statements, we specifically advise you to consider all of our MD&A in the light of the cautionary statements set forth herein.
Much of the information in this Annual Report that looks towards future performance of Office Depot, Inc. and its subsidiaries is based on various factors and important assumptions about future events that may or may not actually come true. As a result, our operations and financial results in the future could differ materially and substantially from those we have discussed in this Annual Report. Significant factors that could impact our future results are provided in Part I — Item 1A. “Risk Factors” included in this Annual Report. Other risk factors are incorporated into the text of our MD&A, which should itself be considered a statement of future risks and uncertainties, as well as management’s view of our businesses.
In this Annual Report, unless the context otherwise requires, the “Company,” “Office Depot,” “we,” “us,” and “our” refer to Office Depot, Inc. and its subsidiaries.
The Company
Office Depot provides a broad selection of products and services to consumers and businesses of all sizes. We were incorporated in Delaware in 1986 and opened our first retail store in Fort Lauderdale, Florida. At December 31, 2016, we operated through two reportable segments (or “Divisions”): North American Retail Division and North American Business Solutions Division. Following the third quarter 2016 commitment to sell substantially all of international operations outside of North America, the business formerly reported as the International Division has been reclassified to discontinued operations.
Sales for the Divisions are processed through multiple channels, consisting of office supply stores, a contract sales force, internet sites, an outbound telephone account management sales force, direct marketing catalogs and call centers, all supported by a network of supply chain facilities and delivery operations. Office Depot currently operates under the Office Depot™ and OfficeMax™ brands and utilizes other proprietary company and product brand names, including Grand & Toy™ in Canada.
Our primary public website is www.officedepot.com. The Company’s primary brands are discussed in the “Intellectual Property” section below.
Additional information regarding our Divisions and operations in geographic areas is presented in Part II — Item 7. MD&A and in Note 16, “Segment Information,” of the Consolidated Financial Statements located in Part IV — Item 15. “Exhibits and Financial Statement Schedules” of this Annual Report.
1
Table of Contents
Discontinued Operations
On September 23, 2016, we announced that we had received an irrevocable offer from The AURELIUS Group to acquire substantially all of the business in Europe (the “OD European Business”). The transaction was structured as an equity sale with the buyer acquiring the OD European Business with its operating assets and liabilities. We retained the assets and obligations of a frozen defined benefit pension plan in the United Kingdom.
On December 31, 2016 we completed the sale of the OD European Business to The AURELIUS Group.
In addition to the sale of the OD European Business, we are actively marketing for sale the businesses in South Korea, mainland China, Australia and New Zealand (collectively the “International Sale Group”) and expect to complete the dispositions during 2017. The assets and liabilities of the entities expected to be sold are classified as held for sale and included in discontinued operations. We currently anticipate retaining the sourcing and trading operations of the former International Division, which are presented as Other in Note 16, “Segment Information,” of the Consolidated Financial Statements. Refer to Note 3, “Discontinued Operations” of the Consolidated Financial Statements for additional information.
Termination of Staples Acquisition
On February 4, 2015, Staples, Inc. (“Staples”) and the Company entered into a definitive merger agreement, under which Staples was to acquire all of the outstanding shares of Office Depot and we would become a wholly owned subsidiary of Staples.
On December 7, 2015, the United States Federal Trade Commission (the “FTC”) informed Office Depot and Staples that it intended to block the Staples Acquisition. On the same date, Office Depot and Staples announced their intent to contest the FTC’s decision to challenge the transaction.
On May 10, 2016, the U.S. District Court for the District of Columbia granted the FTC’s request for a preliminary injunction against the proposed acquisition, and as a result, the companies announced the termination of the Staples Merger Agreement. Per the terms of the termination agreement, Staples paid Office Depot a fee of $250 million in cash on May 19, 2016.
Merger
On November 5, 2013, the Company merged with OfficeMax Incorporated (“OfficeMax”).
Refer to Note 2, “Merger, Acquisition Termination, and Restructuring Activity” for additional discussion of this merger (the “Merger”) and termination of the Staples acquisition.
Fiscal Year
Our fiscal year results are based on a 52- or 53-week retail calendar ending on the last Saturday in December. Fiscal year 2016 had 53 weeks and ended on December 31, 2016. Fiscal years 2015 and 2014 consisted of 52 weeks and ended on December 26, 2015 and December 27, 2014, respectively. The Company’s business in Canada follows calendar periods with December 31 year-ends. The difference in reporting periods does not have a significant impact on the Company’s reported results.
North American Retail Division
The North American Retail Division sells a broad assortment of merchandise through our chain of office supply stores throughout the United States, including Puerto Rico and the U.S. Virgin Islands. The retail stores operate under their legacy banners of Office Depot or OfficeMax, though systems, processes and offerings have
2
Table of Contents
converged. We currently offer products and services in the following categories: supplies, technology, and furniture and other. Refer to the “Merchandising” section below for additional product information. Most retail stores also offer copy and print services, as discussed in the “Copy & Print Depot™” section below.
At the end of 2016, the North American Retail Division operated 1,441 office supply stores. The count of open stores may include locations temporarily closed for remodels or other factors. We have a broad representation across North America with the largest concentration of our retail stores in Texas, California, and Florida. The majority of our retail stores are located in leased facilities that currently average over 20,000 square feet.
As part of the integration of the Office Depot and OfficeMax stores, we announced our Real Estate Strategy in 2014, which included the planned closure of 400 stores in North America. During the second quarter of 2016, the Company completed the retail store closures under this program. In execution of this strategy, we closed 51 stores in 2016, 181 stores in 2015 and 168 stores in 2014. Closures included both Office Depot and OfficeMax locations. Implementation of this strategy resulted in charges for facility closures, termination costs, and asset impairments. In August 2016, we announced the Comprehensive Business Review that, among other things, included the anticipated closing of an additional 300 stores over the next three years. We closed 72 stores under this program during 2016 (for a total of 123 stores closed in 2016 under both programs) and anticipate closing approximately 75 during 2017 and the remainder in 2018. Refer to Part II — Item 7. “MD&A” for additional information on the store activity.
Concurrent with announcement of the Comprehensive Business Review, we announced the launch of our “Store of the Future” concept. These converted stores have been redesigned to enhance the customer experience through a curated assortment of products, better product adjacencies, easier navigation and signage and increased space dedicated to expanded services offerings. Many of these stores are approximately 15,000 square feet, which is lower than the existing average. Through the end of 2016, we have converted 25 locations to this new format and anticipate having about 100 stores converted by the end of 2017. We continue to adapt the design for features that have shown to be particularly valuable to shoppers.
To better serve our customers any way they choose to shop, we have embraced an omni-channel focus in our retail, contract and direct channels. For example, we now have a Buy Online-Pickup in Store offering in all locations and have added Buy Online-Ship from Store capability to over half of our locations. These features help provide products to our customers faster and enable us to better manage inventory across the Company. Store delivery is offered in select markets. Sales under these programs are serviced by store employees and fulfilled with store inventory and therefore are reported in the North America Retail Division results, including the computation of comparable store sales.
Refer to the “North American Supply Chain” discussion below for additional information about our supply chain network.
Sales and marketing efforts are integral to understanding the Divisions’ processes and management. These efforts are addressed after the Divisions discussions.
North American Business Solutions Division
The North American Business Solutions Division sells nationally branded and our own brands’ products and services to customers in the United States, including Puerto Rico, and the U.S. Virgin Islands, and Canada. Office Depot customers are primarily served through a dedicated sales force, catalogs, telesales, and electronically through our internet sites. Refer to the “Merchandising” section below for additional product information. The North American Business Solutions Division also offers copy and print services, as discussed in the “Copy & Print Depot™” section below.
Our contract sales channel employs a dedicated inside and field sales force that services the office supply needs to a range of small, medium and large-sized businesses. Our contract business customers also include various
3
Table of Contents
schools and local, state and national governmental agencies. We also enter into agreements with consortiums to sell to various entities and across industries, including governmental and non-profit entities, for non-exclusive buying arrangements. Sales to our contract customers that are fulfilled at Office Depot retail locations are included in the results of our North American Retail Division, while honoring their contract pricing, as applicable. Migration of the legacy OfficeMax customers to Office Depot systems is well underway and progresses with the integration of the supply chain. Customer conversion is anticipated to be substantially complete by the end of 2017, but will continue into 2018.
Our direct sales channel primarily serves small- to medium-sized customers. Direct customers can order products through our public websites, from our catalogs, or by phone. Website functionality provides customers the convenience of using the loyalty program and offers suggestions by product ratings, pricing, and brand, among other features. Customer orders are fulfilled through our common supply chain; refer to the “North American Supply Chain” discussion below for additional information on our supply chain network.
Copy & Print Depot™
Office Depot Copy & Print Depot™ provides printing, digital imaging, reproduction, mailing, shipping through FedEx and the U.S. Postal Service, and other services. We also maintain nationwide availability of personal computer support and network installation service that provides our customers with in-home, in-office and in-store support for their technology needs. Sales are recognized by the respective Division based on how the customer order is serviced.
North American Supply Chain
We operate a network of distribution centers (or “DCs”) and crossdock facilities across the United States, Puerto Rico, and Canada. Our DCs operate to fulfill customer orders while crossdocks are smaller flow-through facilities where merchandise is sorted for distribution and shipped to fulfill the inventory needs of our retail locations. The DC and crossdock facilities’ costs, including real estate, technology, labor and inventory, are allocated to the North American Retail Division and North American Business Solutions Division based on the relative services provided.
Through the end of 2016, the Merger integration has resulted in the closure of 14 DCs and crossdock facilities. The changes to the supply chain related to the merger, including remaining planned closures and system conversions, are anticipated to be completed before the end of 2017.
We believe that inventory held in our DCs is at levels sufficient to meet current and anticipated customer needs. Certain purchases are sent directly from the manufacturer to our customers or retail stores. Some supply chain facilities and some retail locations also house sales offices, showrooms, and administrative offices supporting our contract sales channel.
As of December 31, 2016, we operated 38 DC and crossdock facilities in the United States and Canada. Refer to Item 2. “Properties” for further information.
Out-bound delivery and inbound direct import operations are currently provided by us and third-party carriers. We have increased the number of our owned vehicles during 2016.
Merchandising
Our merchandising strategy is to meet our customers’ needs by offering a broad selection of branded office products, as well as our own branded products and services. The selection of our own branded products has increased in breadth and level of sophistication over time. We currently offer products under various labels, including Office Depot®, OfficeMax®, Foray®, Ativa®, TUL®, Realspace®, WorkPro®, Brenton Studio®, Highmark®, Grand & Toy® and Viking Office Products®.
4
Table of Contents
We generally classify our products into three broad categories: (1) supplies, (2) technology, and (3) furniture and other. The supplies category includes products such as paper, writing instruments, office supplies, cleaning and breakroom items. The technology category includes products such as toner and ink, computers, tablets and accessories, printers, electronic storage, as well as services for technology products. The furniture and other category includes products such as desks, seating, and luggage, as well as sales in our copy and print centers.
Total Company sales by product group were as follows:
| 2016 | 2015 | 2014 | ||||||||||
| Supplies |
45.2 | % | 44.4 | % | 43.6% | |||||||
| Technology |
38.9 | % | 40.2 | % | 41.2% | |||||||
| Furniture and other |
15.9 | % | 15.4 | % | 15.2% | |||||||
|
|
|
|||||||||||
| 100.0 | % | 100.0 | % | 100.0% | ||||||||
|
|
|
|||||||||||
We buy substantially all of our merchandise directly from manufacturers, industry wholesalers, and other primary suppliers, including direct sourcing of our own brands products from domestic and offshore sources. We also enter into arrangements with vendors that can lower our unit product costs if certain volume thresholds or other criteria are met. For additional discussion regarding these arrangements, refer to “Critical Accounting Policies” in Part II — Item 7. “MD&A”.
We operate separate merchandising functions in the United States and Canada. Each group is responsible for selecting, purchasing, managing the product life cycle of our inventory, and managing pricing primarily for retail and direct selling channels. Organizationally, they are aligned under the same Corporate leadership. In recent years, we have increasingly used global offerings across the regions to further reduce our product cost while maintaining product quality.
We operate a global sourcing office in Shenzhen, China, which allows us to better manage our product sourcing, logistics and quality assurance. This office consolidates our purchasing power with Asian factories and, in turn, helps us to increase the scope of our own branded offerings.
Sales and Marketing
The Company regularly assesses consumer shopping behaviors which will help refine our strategy to identify and offer desired product assortment, shopping environment and purchasing methods. Identifying the most desirable and effective way to reach our customers and allowing them to shop through whichever channel they prefer will continue to be a priority in the future. These efforts have impacted the design of our Store of the Future, the extent, format and vehicles we use to advertise to and reach customers, our web page design, promotions and product offerings.
Our marketing programs are designed to attract and retain customers, drive frequency of customer visits, and increase customers’ spend in our stores and websites. We regularly advertise in major newspapers in most of our North American markets. We also advertise through local and national radio, network and cable television advertising campaigns, and direct marketing efforts, such as the internet and social networking. We have shifted some of our marketing efforts in recent periods to digital programs that enhance personalized offerings and promote customer satisfaction.
Our customer loyalty program provides customers with rewards that can be applied to future purchases or other incentives. These programs enable us to market more effectively to our customers and may change as customer preferences shift.
We perform periodic competitive pricing analyses to monitor each market, and prices are adjusted as necessary to further our competitive positioning. We generally target our everyday pricing to be competitive with other resellers of office products.
5
Table of Contents
Our customer acquisition efforts regularly shift to vehicles and formats found to be most productive for reaching the targeted class of customer. We acquire customers through e-mail and social media campaigns, online affiliate connections, on-premises sales calls, outbound sales calls, and catalogs, among others. No single customer in any one Division accounts for more than 10% of our total sales or accounts receivable.
Seasonality
Our business is somewhat seasonal, with sales generally trending lower in the second quarter, following the “back-to-business” sales cycle in the first quarter and preceding the “back-to-school” sales cycle in the third quarter and the holiday sales cycle in the fourth quarter. Certain working capital components may build and recede during the year reflecting established selling cycles. Business cycles can and have impacted our operations and financial position when compared to other periods.
With the exception of online purchases placed or fulfilled in our retail locations, online sales activities are reported in the North American Business Solutions.
Intellectual Property
We currently operate under the Office Depot®, OfficeMax®, and Grand & Toy® brand names. We hold trademark registrations domestically and worldwide and have numerous other applications pending worldwide for the names “Office Depot,” “Viking,” “Ativa,” “Foray,” “Realspace,” “OfficeMax,” “TUL,” “WorkPro,” “Brenton Studio,” “Highmark” and others. As with all domestic trademarks, our trademark registrations in the United States are for a ten year period and are renewable every ten years, prior to their respective expirations, as long as the trademarks are used in the regular course of trade. We also hold issued patents and pending patent applications domestically for certain private brand products, such as shredders, binders, and writing instruments.
Industry and Competition
We operate in a highly competitive environment. We compete with office supply stores, wholesale clubs, discount stores, mass merchandisers, online retailers, food and drug stores, computer and electronics superstores and direct marketing companies. These companies compete with us in substantially all of our current markets. Increased competition in the office products markets, together with increased advertising, and internet-based search tools, has heightened price awareness among end-users. Such heightened price awareness has led to margin pressure on office products and impacted our results. In addition to price, we also compete based on customer service, the quality and extent of product selection and convenience. Other office supply retail companies market similarly to us in terms of store format, pricing strategy, product selection and product availability in the markets where we operate. Some of our competitors are larger than us and have greater financial resources, which provide them with greater purchasing power, increased financial flexibility and more capital resources for expansion and improvement, which may enable them to compete more effectively. We anticipate that in the future we will continue to face high levels of competition from these companies.
We believe our customer service and the efficiency and convenience for our customers from our combined contract and direct distribution channels help our North American Business Solutions Division to compete with other business-to-business office products distributors.
We believe our North American Retail Division segment competes based on convenience, location, the quality of our customer service, our store formats, the range and depth of our merchandise offering and our pricing.
Employees
As of January 28, 2017, we had approximately 38,000 employees in continuing operations.
6
Table of Contents
Environmental Matters
As both a significant user and seller of paper products, we have developed environmental practices that are values-based and market-driven. Our environmental initiatives center on three guiding principles: (1) recycling and pollution reduction; (2) sustainable forest management; and (3) issue awareness and market development for environmentally preferable products. We offer thousands of different products containing recycled content and technology recycling services.
Office Depot continues to implement environmental programs in line with our stated environmental vision to “increasingly buy green, be green and sell green” — including environmental sensitivity in our packaging, operations and sales offerings. We have been commended for our leadership position for our facility design, recycling efforts, and ‘green’ product offerings. Additional information on our achievements and green product offerings can be found at www.officedepotcitizenship.com/planet/ and www.officedepot.com/buygreen.
We are subject to a variety of environmental laws and regulations related to historical OfficeMax operations of paper and forest products businesses and timberland assets. We record environmental and asbestos liabilities, and accrue losses associated with these obligations, when probable and reasonably estimable. We record a separate insurance recovery receivable when considered probable. Refer to Item 3. “Legal Proceedings” for additional information.
Available Information
We make available, free of charge, on the “Investor Relations” section of our website www.officedepot.com, our annual reports on Form 10-K, quarterly reports on Form 10-Q, current reports on Form 8-K and amendments to those reports filed or furnished pursuant to Section 13(a) or 15(d) of the Securities Exchange Act of 1934, as amended (the “Exchange Act”), as soon as reasonably practicable after we electronically file or furnish such materials to the United States Securities and Exchange Commission (“SEC”). In addition, the public may read and copy any of the materials we file with the SEC at the SEC’s Public Reference Room at 100 F Street, NE, Washington DC 20549. The public may obtain information on the operation of the Public Reference Room by calling the SEC at 1-800-SEC-0330. The SEC maintains an internet site that contains reports, proxy and information statements and other information regarding issuers, such as the Company, that file electronically with the SEC. The address of that website is www.sec.gov.
Additionally, our corporate governance materials, including our bylaws, corporate governance guidelines, charters of the Audit, Compensation, Finance, and Corporate Governance and Nominating Committees, and our code of ethical behavior may be found under the “Investor Relations” section of our website, www.officedepot.com.
7
Table of Contents
Our Executive Officers
Michael Allison — Age: 59
Mr. Allison was appointed as our Executive Vice President and Chief People Officer in December 2013. From July 2011 until December 2013, Mr. Allison was our Executive Vice President, Human Resources. Mr. Allison joined Office Depot in September 2006 as Vice President, Human Resources. Prior to joining Office Depot, Mr. Allison served as Executive Vice President of Human Resources for Victoria’s Secret Direct, the direct sales arm of Victoria’s Secret Stores, from February 2001 to September 2005. Prior to Victoria’s Secret, he was Senior Vice President of Human Resources for Bank One, and Senior Vice President and Director of Human Resources for National City Bank.
Tim Beauchamp — Age: 61
Mr. Beauchamp was appointed as our Executive Vice President, Supply Chain in February 2016. Between July 2015 and February 2016, he was Office Depot’s interim head of Supply Chain, working as a consultant for Execution Specialist Group, a consulting firm. Mr. Beauchamp was retired between 2013 and 2015. Prior to that, Mr. Beauchamp served as Chief Logistics Officer at US Food Service from April 2011 to December 2012. Prior to joining US Food Service, Mr. Beauchamp spent more than 15 years in the office products industry where he held a number of leadership roles in operations and logistics at Corporate Express and Staples.
Steve Calkins — Age: 46
Mr. Calkins was appointed as our Executive Vice President, Chief Legal Officer and Corporate Secretary in August 2016. Mr. Calkins previously served as Executive Vice President, Contract Sales from December 2013 to August 2016, during which time he was responsible for our contract business, Canadian operations, print and services and customer service. Prior to this role, Mr. Calkins served as Senior Vice President, North American Business Solutions from April 2011 to December 2013, Vice President, Deputy General Counsel from March 2010 to April 2011, and Vice President, Associate General Counsel from February 2007 to March 2010. Between 2003 and 2007, Mr. Calkins held various leadership positions in the Company’s legal department. Before Office Depot, Mr. Calkins was an attorney with Kilpatrick Townsend & Stockton LLP.
Stephen Hare — Age: 63
Mr. Hare was appointed as our Executive Vice President and Chief Financial Officer in December 2013. Prior to joining the Company, Mr. Hare served as the Senior Vice President and Chief Financial Officer of The Wendy’s Company, a restaurant owner, operator and franchisor, from July 2011 until September 2013. Mr. Hare also served as the Senior Vice President and Chief Financial Officer of Wendy’s/Arby’s Group, Inc., a position he held from October 2008 until July 2011. He also served as Chief Financial Officer of Arby’s Restaurant Group, Inc., a restaurant owner, operator and franchisor (“Arby’s”), from June 2006 until the sale of Arby’s by The Wendy’s Company in July 2011. Prior to joining The Wendy’s Company, Mr. Hare served as an Executive Vice President of Cadmus Communications Corporation (“Cadmus”), a leading publisher of scientific, technical, medical, and scholarly journals, and as President of Publisher Services Group, a division of Cadmus, from January 2003 to June 2006, and as the Executive Vice President, Chief Financial Officer of Cadmus from September 2001 to January 2003. Mr. Hare currently serves as a director of Hanger, Inc., a provider of orthotic and prosthetic products and services that enhance human physical capability.
Rob Koch — Age: 52
Mr. Koch was appointed as our Executive Vice President of Business Development in August 2016. Previously, Mr. Koch served as Senior Vice President of Real Estate from December 2013 to August 2016 and Senior Vice President of Merchandising from 2012 to 2013. Since joining Office Depot in 1994, Mr. Koch has held various positions at the Company with increasing responsibility, including serving as Vice President of North America Retail Finance and Vice President of Financial Planning and Corporate Development.
8
Table of Contents
Ronald Lalla — Age: 58
Mr. Lalla was appointed as our Executive Vice President and Chief Merchandising Officer in December 2013. Mr. Lalla previously served as Executive Vice President and Chief Merchandising Officer for OfficeMax from March 2012 to December 2013. Prior to joining OfficeMax, Mr. Lalla served as Chief Merchandising Officer and Chief Technology Officer for Katz Group, a privately-owned Canadian enterprise with operations in sports and entertainment, real estate and public and private investment, from 2008 to 2011. Mr. Lalla served as Executive Vice President, Global Merchandising at Corporate Express from 2003 to 2008. Prior to joining Corporate Express, Mr. Lalla held various positions with Kmart Corporation from 1990 to 2002.
Troy Rice — Age: 53
Mr. Rice was appointed our Executive Vice President, Chief Operating Officer in August 2016. Mr. Rice has responsibility for our Business Solutions Division, Marketing and Retail. Mr. Rice joined Office Depot in April 2014 as Executive Vice President of Retail. Before joining Office Depot, Mr. Rice served as Executive Vice President of Stores and Services for Toys “R” Us where he worked from 2006 to 2014. Prior to Toys “R” Us, Mr. Rice worked for The Home Depot from 1990 to 2006 where he held a number of leadership roles, leaving as Division President, Northern Division.
Gerry P. Smith — Age 53
Mr. Smith was appointed to serve as Chief Executive Officer and a director of the Company effective February 27, 2017. Prior to joining the Company, Mr. Smith was at Lenovo Group Limited, a $45 billion leading global technology company (“Lenovo”), since 2006. Most recently, Mr. Smith served as Executive Vice President and Chief Operating Officer of Lenovo since 2016 where he was responsible for all operations across Lenovo’s global product portfolio. Prior to assuming this role, also in 2016, Mr. Smith was Executive Vice President and President, Data Center Group. From 2015 to 2016, he served as Chief Operating Officer of the Personal Computing Group and Enterprise Business Group, and from 2013 to 2015 he served as President of the Americas. In these roles, Mr. Smith oversaw Lenovo’s fast-growing enterprise business worldwide and Lenovo’s overall business in the America’s region. Prior to that, Mr. Smith was President, North America and Senior Vice President, Global Operations of Lenovo from 2012 to 2013, and Senior Vice President of Global Supply Chain of Lenovo from 2006 until 2012 where he was responsible for end-to-end supply chain management. Prior to Lenovo, Mr. Smith held a number of executive positions at Dell Inc. from 1994 until 2006, as the company became a global leader in personal computers.
9
Table of Contents
In addition to risks and uncertainties in the ordinary course of business that are common to all businesses, important factors that are specific to our industry and our Company could materially impact our future performance and results. We have provided below a list of risk factors that should be reviewed when considering investing in our securities.
Risks Related to the Staples Acquisition
The terminated Staples Acquisition has adversely affected and may continue to adversely affect our business, results of operations and financial condition.
The pendency of the Staples Acquisition of our company contributed to uncertainty surrounding our business, including affecting our relationships with our existing and future customers, suppliers and employees, which had an adverse effect on our business, results of operations and financial condition. In addition, we allocated significant management resources towards the completion of the transaction. The Staples Merger Agreement was terminated on May 10, 2016 and Staples paid a termination fee to the Company, as required under that Agreement. However, the Company may continue to experience loss of customers, suppliers and employees as a result of that failed merger and attempts to add new customers, suppliers and employees could also be adversely affected. The impact of this terminated transaction could continue to adversely affect our business and results of operations.
Risks Related to Our Business
Our ongoing business is subject to certain risks related to our merger with OfficeMax and other restructuring activities.
We completed a merger with OfficeMax on November 5, 2013, pursuant to which OfficeMax became an indirect, wholly-owned subsidiary of our Company. The Merger involved the integration of two companies that previously operated independently with principal offices in two distinct locations. We have devoted, and will continue to devote, significant management attention and resources to integrating the companies. The combined company is expected to capture more than $750 million in synergy benefits when the integration is fully implemented. We anticipate completing substantially all of the integration activities by the end of 2017.
Additionally, in response to economic and competitive factors in our industry, we may, from time to time, undertake certain restructuring activities within our business divisions to improve our performance. During 2016, we announced the Comprehensive Business Review that, among other things, included the anticipated closure of 300 retail stores over the next three years and certain planned restructuring activity to lower operating costs. During the first quarter of 2017, we implemented the Corporate restructuring portion of the plan. Also as part of the Comprehensive Business Review we decided to pursue strategic alternatives for our international businesses and in the third quarter 2016, committed to a plan to sell substantially all of the business formerly reported as the International Division.
We may not be able to fully achieve the expected Merger synergies or restructuring benefits due to certain risks, among other things, risks that:
| • | the continued integration of the businesses of Office Depot and OfficeMax may take longer, be more difficult, time-consuming or costly to accomplish than expected; |
| • | we may experience business disruption during periods of restructuring activities, including adverse effects on employee retention and loss of employee focus during periods of restructuring activities; |
| • | we may be unable to avoid potential liabilities and unforeseen increased expenses or delays associated with the Merger integration or other restructuring activities, including those under the Comprehensive Business Review; |
10
Table of Contents
| • | there may be unanticipated changes in the markets for the combined Company’s business segments; |
| • | branding or rebranding initiatives may involve substantial costs and may not be favorably received by customers; |
| • | we may be unable to close all of the stores targeted for closure or such store closures may not result in the benefits or cost savings at levels that we anticipate due to factors such as sales transfers to stores remaining open being below our projections and costs to close stores being higher than our projections, because of the terms of the existing lease, the condition of the local property market, demand for the specific property, our relationship with the landlord, the availability of potential sub-lease tenants and employee severance and other costs; |
| • | The decline in purchasing power from reduced sales, store closures and business dispositions may impact our relationships with vendors. We may not be able to receive volume discounts similar to past periods, obtain favorable product selection and availability, negotiate with landlords for favorable lease terms and other variable costs of doing business may be adversely impacted; |
| • | there may be unanticipated downturns in business relationships with customers; |
| • | there may be competitive pressures on the combined Company’s sales and pricing; |
| • | the benefits of any restructuring activity may not be fully realized due to competitive, regulatory or operational difficulties; and |
| • | we may be unable to successfully manage the complex integration of systems, technology, networks and other assets of the combined Company in a manner that minimizes any adverse impact on our customers, vendors, suppliers, employees and other constituencies. |
Accordingly, there can be no assurance that: (i) the Merger and restructuring activities and the Comprehensive Business Review will result in the realization of the full benefits of synergies, innovation and operational efficiencies that we currently expect; (ii) these benefits will be achieved within the anticipated timeframe: (iii) we will be able to fully and accurately measure any such synergies; or (iv) we will be able to implement new strategies to transform the combined Company. Failure to successfully integrate the businesses and realize the projected synergies, innovation and operational efficiencies may have a material adverse effect on our business and results of operations.
Our business is highly competitive and failure to adequately differentiate ourselves or respond to the decline in general office supplies sales or to shifting consumer demands could adversely impact our financial performance.
The office products market is highly competitive and we compete locally, domestically and internationally with office supply resellers, including Staples, wholesale clubs such as Costco, Sam’s Club and BJs, mass merchandisers such as Wal-Mart and Target, computer and electronics superstores such as Best Buy, internet-based companies such as Amazon.com, food and drug stores, discount stores, and direct marketing companies. Many competitors have also increased their presence by broadening their assortments or broadening from retail into the delivery and e-commerce channels, while others have substantially greater financial resources to devote to sourcing, marketing and selling their products. Product pricing is also becoming ever more competitive, particularly among competitors on the internet. In order to achieve and maintain expected profitability levels, we must continue to grow by adding new customers and taking market share from competitors. In addition, consumers are utilizing more technology and purchasing less paper, ink and toner, physical file storage and general office supplies. If we are unable to: (i) provide technology solutions and services that meet consumer
11
Table of Contents
needs; (ii) continuously stock products that are up-to-date and among the latest trends in the rapidly changing technological environment; (iii) differentiate ourselves from other retailers who sell similar products; and (iv) effectively compete, our sales and financial performance could be negatively impacted.
Failure to execute effective advertising efforts may adversely impact the Company’s financial performance.
Effective advertising and marketing efforts play a crucial role in maintaining high customer traffic. The Company focuses on developing new marketing initiatives and maintaining effective promotional strategies that target further growth in the Company’s business. Failure to execute effective advertising efforts to attract new customers or retain existing customers may adversely impact the Company’s financial performance.
If we are unable to successfully maintain a relevant omni-channel experience for our customers, our results of operations could be adversely affected.
With the increasing use of computers, tablets, mobile phones and other devices to shop in our stores and online, we offer full and mobile versions of our website and applications for mobile phones and tablets. In addition, we are increasing the use of social media as a means of interacting with our customers and enhancing their shopping experiences. Omni-channel retailing is rapidly evolving and we must keep pace with the changing expectations of our customers and new developments by our competitors. If we are unable to attract and retain team members or contract third parties with the specialized skills needed to support our omni-channel platforms, or are unable to implement improvements to our customer-facing technology in a timely manner, our ability to compete and our results of operations could be adversely affected. In addition, if our website and our other customer-facing technology systems do not function as designed, the customer experience could be negatively affected, resulting in a loss of customer confidence and satisfaction, and lost sales, which could adversely affect our reputation and results of operations.
Disruptions of our computer systems could adversely affect our operations.
We rely heavily on computer systems to process transactions, manage our inventory and supply-chain and to summarize and analyze our global business. If our systems are damaged or fail to function properly, or, if we do not replace or upgrade certain systems, we may incur substantial costs to repair or replace them and may experience an interruption of our normal business activities or loss of critical data. We are undertaking certain system enhancements and conversions to increase productivity and efficiency, that, if not done properly, could divert the attention of our workforce and constrain for some time our ability to provide the level of service our customers demand. Also, once implemented, the new systems and technology may not provide the intended efficiencies or anticipated benefits, and could add costs and complications to our ongoing operations.
A breach of our information technology systems could adversely affect our reputation, business partner and customer relationships and operations and result in high costs.
Through our sales, marketing activities, and use of third-party information, we collect and store certain personally identifiable information that our customers provide to purchase products or services, enroll in promotional programs, register on our website, or otherwise communicate and interact with us. This may include, but is not limited to, names, addresses, phone numbers, driver license numbers, e-mail addresses, contact preferences, personally identifiable information stored on electronic devices, and payment account information, including credit and debit card information. We also gather and retain information about our employees in the normal course of business. We may share information about such persons with vendors that assist with certain aspects of our business. In addition, our online operations depend upon the secure transmission of confidential information over public networks, such as information permitting cashless payments.
We have instituted safeguards for the protection of such information. These security measures may be compromised as a result of third-party security breaches, burglaries, cyber-attack, errors by employees or
12
Table of Contents
employees of third-party vendors, faulty password management, misappropriation of data by employees, vendors or unaffiliated third-parties, or other irregularity, and result in persons obtaining unauthorized access to our data or accounts. Despite instituted safeguards for the protection of such information, we cannot be certain that all of our systems and those of our vendors and unaffiliated third-parties are entirely free from vulnerability to attack or compromise given that the techniques used to obtain unauthorized access, disable or degrade service, or sabotage systems change frequently. During the normal course of our business, we have experienced and we expect to continue to experience attempts to breach our systems, and we may be unable to protect sensitive data and the integrity of our systems or to prevent fraudulent purchases. Moreover, an alleged or actual security breach that affects our systems or results in the unauthorized release of personally identifiable information could:
| • | materially damage our reputation and brand, negatively affect customer satisfaction and loyalty, expose us to negative publicity, individual claims or consumer class actions, administrative, civil or criminal investigations or actions, and infringe on proprietary information; and |
| • | cause us to incur substantial costs, including but not limited to costs associated with remediation for stolen assets or information, payments of customer incentives for the maintenance of business relationships after an attack, litigation costs, lost revenues resulting from unauthorized use of proprietary information or the failure to retain or attract customers following an attack, and increased cyber security protection costs. While we maintain insurance coverage that may, subject to policy terms and conditions, cover certain aspects of our cyber risks, such insurance coverage may be unavailable or insufficient to cover our losses or all types of claims that may arise in the continually evolving area of cyber risk. |
We do a significant amount of business with government entities, various purchasing consortiums, and through sole- or limited- source distribution arrangements, and loss of this business could negatively impact our results.
One of our largest customer groups consists of various governmental entities, government agencies and non-profit organizations, such as purchasing consortiums. Contracting with U.S. state and local governments is highly competitive, subject to federal and state procurement laws, requires more restrictive contract terms and can be expensive and time-consuming. Bidding such contracts often requires that we incur significant upfront time and expense without any assurance that we will win a contract. Our ability to compete successfully for and retain business with the federal and various state and local governments is highly dependent on cost-effective performance. Our business with governmental entities and agencies is also sensitive to changes in national and international priorities and their respective budgets, which in the current economy continue to decrease. We also service a substantial amount of business through agreements with purchasing consortiums and other sole- or limited-source distribution arrangements. If we are unsuccessful in retaining these customers, or if there is a significant reduction in sales under any of these arrangements, it could adversely impact our business and results of operations.
Macroeconomic conditions have had and may continue to adversely affect our business and financial performance.
Our operating results and performance depend significantly on economic conditions and their impact on business and consumer spending. In the past, the decline in business and consumer spending has caused our comparable store sales to decline from prior periods. Our business and financial performance may continue to be adversely affected by current and future economic conditions, including, without limitation, the level of consumer debt, high levels of unemployment, higher interest rates and the ability of our customers to obtain credit, which may cause a continued or further decline in business and consumer spending.
Increases in fuel and other commodity prices could have an adverse impact on our earnings.
We operate a large network of stores, delivery centers, and delivery vehicles. As such, we purchase significant amounts of fuel needed to transport products to our stores and customers as well as shipping costs to import products from overseas. While we may hedge our anticipated fuel purchases, the underlying commodity costs
13
Table of Contents
associated with this transport activity may be volatile and disruptions in availability of fuel could cause our operating costs to rise significantly to the extent not covered by our hedges. Additionally, other commodity prices, such as paper, may increase and we may not be able to pass along such costs to our customers. Fluctuations in the availability or cost of our energy and other commodity prices could have a material adverse effect on our profitability.
Our business may be adversely affected by the actions of and risks related to the activities of our third-party vendors.
We purchase products for resale under credit arrangements with our vendors and have been able to negotiate payment terms that are approximately equal in length to the time it takes to sell the vendor’s products. When the global economy is experiencing weakness as it has over the last several years, vendors may seek credit insurance to protect against non-payment of amounts due to them. If we continue to experience declining operating performance, and if we experience severe liquidity challenges, vendors may demand that we accelerate our payment for their products or require cash on delivery, which could have an adverse impact on our operating cash flow and result in severe stress on our liquidity. Borrowings under our existing credit facility could reach maximum levels under such circumstances, causing us to seek alternative liquidity measures, but we may not be able to meet our obligations as they become due until we secure such alternative measures.
We use and resell many manufacturers’ branded items and services. As a result, we are dependent on the availability and pricing of key products and services, including ink, toner, paper and technology products. As a reseller, we cannot control the supply, design, function, cost or vendor-required conditions of sale of many of the products we offer for sale. Disruptions in the availability of these products or the products and services we provide to our customers may adversely affect our sales and result in customer dissatisfaction. Further, we cannot control the cost of manufacturers’ products, and cost increases must either be passed along to our customers or will result in erosion of our earnings.
Failure to identify desirable products and make them available to our customers when desired and at attractive prices could have an adverse effect on our business and our results of operations. In addition, a material interruption in service by the carriers that ship goods within our supply chain may adversely affect our sales. Many of our vendors are small or medium sized businesses which are impacted by current macroeconomic conditions, both in the U.S., Asia and other locations. We may have no warning before a vendor fails, which may have an adverse effect on our business and results of operations.
Our product offering also includes many of our own branded products. While we have focused on the quality of our own branded products, we rely on third-party manufacturers for these products. Such third-party manufacturers may prove to be unreliable, the quality of our globally sourced products may not meet our expectations, such products may not meet applicable regulatory requirements which may require us to recall those products, or such products may infringe upon the intellectual property rights of third-parties. Furthermore, economic and political conditions in areas of the world where we source such products may adversely affect the availability and cost of such products. In addition, our own branded products compete with other manufacturers’ branded items that we offer. As we continue to increase the number and types of our own branded products that we sell, we may adversely affect our relationships with our vendors, who may decide to reduce their product offerings through us and may increase their product offerings through our competitors. Finally, if any of our customers are harmed by our own branded products, they may bring product liability and other claims against us. Any of these circumstances could have an adverse effect on our business and results of operations.
Disruption of global sourcing activities and our own brands’ quality concerns could negatively impact brand reputation and earnings.
Economic and civil unrest in areas of the world where we source products, as well as shipping and dockage issues, could adversely impact the availability or cost of our products, or both. Most of our goods imported to the U.S. arrive from Asia through ports located on the U.S. west coast and we are therefore subject to potential disruption due to labor unrest, security issues or natural disasters affecting any or all of these ports. In addition, in
14
Table of Contents
recent years, we have substantially increased the number and types of products that we sell under our own brands including Office Depot ® , OfficeMax ® and other proprietary brands. While we have focused on the quality of our proprietary branded products, we rely on third-parties to manufacture these products. Such third-party manufacturers may prove to be unreliable, the quality of our globally sourced products may vary from our expectations and standards, such products may not meet applicable regulatory requirements which may require us to recall those products, or such products may infringe upon the intellectual property rights of third-parties. Moreover, as we seek indemnities from the manufacturers of these products, the uncertainty of realization of any such indemnity and the lack of understanding of U.S. product liability laws in certain foreign jurisdictions make it more likely that we may have to respond to claims or complaints from our customers.
A downgrade in our credit ratings or a general disruption in the credit markets could make it more difficult for us to access funds, refinance indebtedness, obtain new funding or issue securities.
While Merger- and restructuring-related costs have been significant between 2013 and 2016, historically, we have generated positive cash flow from operating activities and have had access to broad financial markets that provide the liquidity we need to operate our business. Together, these sources have been used to fund operating and working capital needs, as well as invest in business expansion through new store openings, capital improvements and acquisitions. Deterioration in our financial results or the impact of significant Merger, integration and restructuring costs could negatively impact our credit ratings, our liquidity and our access to the capital markets. If we need to refinance all or a portion of that indebtedness, there is no assurance that we will be able to secure such refinancing at the same or more favorable terms than the terms of our existing indebtedness.
A default under our credit facility could significantly restrict our access to funding and adversely impact our operations.
Our asset based credit facility contains a fixed charge coverage ratio covenant that is operative only when borrowing availability is below $125 million or prior to a restricted transaction, such as incurring additional indebtedness, acquisitions, dispositions, dividends, or share repurchases if the Company does not have the required liquidity. The agreement governing our credit facility (the “Amended Credit Agreement” as defined in Note 7, “Debt,” of the Consolidated Financial Statements) also contains representations, warranties, affirmative and negative covenants, and default provisions. A breach of any of these covenants could result in a default under our Amended Credit Agreement. Upon the occurrence of an event of default under our Amended Credit Agreement, the lenders could elect to declare all amounts outstanding to be immediately due and payable and terminate all commitments to extend further credit. If the lenders were to accelerate the repayment of borrowings, we may not have sufficient assets to repay our asset based credit facility and our other indebtedness. Also, should there be an event of default, or a need to obtain waivers following an event of default, we may be subject to higher borrowing costs and/or more restrictive covenants in future periods. Acceleration of our obligations under our credit facilities would permit the holders of our other material debt to accelerate their obligations.
We have incurred significant impairment charges and we continue to incur impairment charges.
In recent years, we recognized significant non-cash asset impairment charges related to under-performing stores in North America. These charges reflect greater than anticipated downturns in sales at certain lower performing stores and in some cases, early closures associated with the Real Estate Strategy and the Comprehensive Business Review. We regularly assess past performance and make estimates and projections of future performance at an individual store level. Reduced sales, our shift in strategy to be less promotional, as well as competitive factors and changes in consumer spending habits resulted in a downward adjustment of anticipated future cash flows for the individual stores that resulted in the impairment. We foresee challenges in the market and economy that could adversely impact our operations. To the extent that forward-looking sales and operating assumptions are not achieved and are subsequently reduced, or if we commit to a more aggressive store downsizing strategy, including allocating capital to further modify store formats, additional impairment charges may result. We have also recognized non-cash asset impairment charges from the abandonment of assets identified as not to be used in
15
Table of Contents
the post-Merger organization and from certain lease-related intangible assets that were deemed unrecoverable based on the Comprehensive Business Review. Additional asset impairments may be recognized based on future decisions and conditions.
Changes in the numerous variables associated with the judgments, assumptions and estimates we make, in assessing the appropriate valuation of our goodwill, including changes resulting from macroeconomic, or disposition of components within reporting units, could in the future require a reduction of goodwill and recognition of related non-cash impairment charges. If we were required to further impair our store assets, our goodwill or intangible assets, it could have a material adverse effect on our business and results of operations.
Our quarterly operating results are subject to fluctuation due to the seasonality of our business.
Our business is somewhat seasonal, with sales generally trending lower in the second quarter, following the “back-to-business” sales cycle in the first quarter and preceding the “back-to-school” sales cycle in the third quarter and the holiday sales cycle in the fourth quarter. As a result, our operating results have fluctuated from quarter to quarter in the past, with sales and profitability being generally stronger in the second half of our fiscal year than the first half of our fiscal year. Factors that could also cause these quarterly fluctuations include: the pricing behavior of our competitors; the types and mix of products sold; the level of advertising and promotional expenses; severe weather; macroeconomic factors that affect consumer confidence; and the other risk factors described in this section. Most of our operating expenses, such as occupancy costs and associate salaries, are not variable, and so short term adjustments to reflect quarterly results are difficult. As a result, if sales in certain quarters are significantly below expectations, we may not be able to proportionately reduce operating expenses for that quarter, and therefore such a sales shortfall would have an adverse effect on our net income for the quarter.
We have retained responsibility for liabilities of acquired companies that may adversely affect our financial results
OfficeMax sponsors defined benefit pension plans covering certain terminated employees, vested employees, retirees, and some active employees (the “Pension Plans”). The Pension Plans are frozen and do not allow new entrants, however, they are under-funded and we may be required to make contributions in subsequent years in order to maintain required funding levels. Required future contributions could have an adverse impact on our cash flows and our financial results. Additional future contributions to the Pension Plans, financial market performance and Internal Revenue Service (“IRS”) funding requirements could materially change these expected payments.
As part of the sale of our business in Europe, we have retained responsibility for the defined benefit plan covering certain employees in the United Kingdom. While the plan is in an asset position at the end of the year 2016, changes in assumptions and actual experience could result in that plan being considered underfunded in the future. Additionally, we have agreed to make contributions to the plan as required by the trustees. Financial performance of the plan and future valuation assumptions could materially change the expected payments. In addition, as part of the sale transaction, the purchaser shall indemnify and hold the Company harmless in connection with any guarantees in place as of September 23, 2016, and given by Company in respect of the liabilities or obligations of the OD European Business. Further, if the purchaser wishes to terminate any such guarantee or cease to comply with any underlying obligation which is subject to such a guarantee, the purchaser shall obtain an unconditional and irrevocable release of the guarantee. However, the Company is contingently liable in the event of a breach by the purchaser of any such obligation.
In connection with OfficeMax’s sale of its paper, forest products and timberland assets in 2004, OfficeMax agreed to assume responsibility for certain liabilities of the businesses sold. These obligations include liabilities related to environmental, asbestos, health and safety, tax, litigation and employee benefit matters. Some of these retained liabilities could turn out to be significant, which could have an adverse effect on our results of operations. Our exposure to these liabilities could harm our ability to compete with other office products distributors, who would not typically be subject to similar liabilities.
16
Table of Contents
Changes in tax laws in any of the jurisdictions in which we operate can cause fluctuations in our overall tax rate impacting our reported earnings.
Our tax rate is derived from a combination of applicable tax rates in the various domestic and international jurisdictions in which we operate. While we have disposed of certain international businesses and are actively marketing for sale other international businesses, we remain subject to international taxes in other businesses. Depending upon the sources of our income, any agreements we may have with taxing authorities in various jurisdictions, and the tax filing positions we take in these jurisdictions, our overall tax rate may fluctuate significantly from other companies or even our own past tax rates. At any given point in time, we base our estimate of an annual effective tax rate upon a calculated mix of the tax rates applicable to our Company and to estimates of the amount of income likely to be generated in any given geography. The loss of or modification to one or more agreements with taxing jurisdictions, whether as a result of a third party challenge, negotiation, or otherwise, a change in the mix of our business from year to year and from country to country, changes in rules related to accounting for income taxes, changes in tax laws in any of the multiple jurisdictions in which we operate, changes in valuation allowances, or adverse outcomes from the tax audits that regularly are in process in any of the jurisdictions in which we operate could result in substantial volatility, including an unfavorable change in our overall tax rate and/or our effective tax rate.
Failure to attract and retain key personnel could have an adverse impact on our business.
We depend on our executive management team and other key personnel, and the recruitment and retention of certain personnel could adversely affect our performance and result in the loss of management continuity and institutional knowledge. We depend heavily upon our retail labor force to identify new customers and provide desired products and personalized customer service to existing customers. The market for qualified employees, with the right talent and competencies, is highly competitive, and may subject us to increased labor costs during periods of low unemployment. The loss of the services of key employees or the inability to attract additional qualified managers for our retail stores and other lines of business may adversely affect our ability to conduct operations in accordance with the standards that we have set.
Although certain members of our executive team have entered into agreements relating to their employment with us, most of our key personnel are not bound by employment agreements, and those with employment or retention agreements are bound only for a limited period of time. If we are unable to retain our key personnel, we may be unable to successfully develop and implement our business plans, which may have an adverse effect on our business and results of operations.
We are subject to legal proceedings and legal compliance risks.
We are involved in various legal proceedings, which from time to time may involve class action lawsuits, state and federal governmental inquiries, audits and investigations, environmental matters, employment, tort, state false claims act, consumer litigation and intellectual property litigation. At times, such matters may involve directors and/or executive officers. Certain of these legal proceedings, including government investigations, may be a significant distraction to management and could expose our Company to significant liability, including settlement expenses, damages, fines, penalties, attorneys’ fees and costs, and non-monetary sanctions, including suspensions and debarments from doing business with certain government agencies, any of which could have a material adverse effect on our business and results of operations.
Failure to successfully manage our business could have an adverse effect on our operations and financial results.
Circumstances outside of our control could negatively impact anticipated store openings, joint ventures, strategic alliances and franchise arrangements. We cannot provide assurance that our new store openings, including some newly sized or formatted stores or retail concepts, will be successful. There may be unintended consequences of adding joint venture, strategic alliances and franchising partners to the Office Depot model, such as the potential for compromised operational control in certain countries and inconsistent international brand image. These joint
17
Table of Contents
venture, strategic alliances and franchise arrangements may also add complexity to our processes, and may require unanticipated operational adjustments in the future that could adversely impact our business and results of operations.
Our international operations subject us to risks as foreign currency fluctuations, potential unfavorable foreign trade policies or unstable political and economic conditions.
Until the disposition of our International Sale Group is complete, we remain subject to various international risks. Additionally, we have operations in Canada and certain global sourcing operations in Asia. Sales from our operations outside the U.S. are denominated in local currency, which must be translated into U.S. dollars for reporting purposes and therefore our consolidated earnings can be significantly impacted by fluctuations in world currency markets. We are required to comply with multiple foreign laws and regulations that may differ substantially from country to country, requiring significant management attention and cost. In addition, the business cultures in certain areas of the world are different than those that prevail in the U.S., and we may be at a competitive disadvantage against other companies that do not have to comply with standards of financial controls or business integrity that we are committed to maintaining as a U.S. publicly traded company.
We may be unable to realize intended benefits from our efforts to divest the International Sale Group.
In order to operate more efficiently, control costs and simplify our business, we intend to sell substantially all of our remaining international business operations located in South Korea, mainland China, Australia and New Zealand during 2017; however, we may not be able to sell one or more of these businesses within the anticipated timeline or at all. We also cannot be sure that the divestitures will be successful in reducing our overall expenses and the expected efficiencies, benefits and cost savings might be delayed or not realized.
Changes in the regulatory environment may increase our expenses and may negatively impact our business.
We are subject to regulations relating to our corporate conduct and the conduct of our business, including securities laws, consumer protection laws, trade regulations, advertising regulations, privacy and cybersecurity laws, and wage and hour regulations and anti-corruption legislation. Certain jurisdictions have taken a particularly aggressive stance with respect to such matters and have implemented new initiatives and reforms, including more stringent regulations, disclosure and compliance requirements. For example, we purchase product both directly and indirectly from sources outside of the United States. As a consequence, trade restrictions, including new or increased tariffs, quotas, embargoes, sanctions, safeguards and customs restrictions, could increase our cost of goods sold or reduce the supply of the products available to us. There is no assurance that any such increased costs could be passed on to our customers, or that we could find alternative products from other sources at comparable prices. To the extent that we are subject to more challenging regulatory environments and enhanced legal and regulatory requirements, such exposure could have a material adverse effect on our business, including the added cost of increased compliance measures that we may determine to be necessary.
We could be adversely affected by violations of the U.S. Foreign Corrupt Practices Act and similar worldwide anti-bribery laws.
The U.S. Foreign Corrupt Practices Act, the U.K. Bribery Act and similar anti-bribery laws in other jurisdictions generally prohibit companies and their intermediaries from making improper payments for the purpose of obtaining or retaining business. Recent years have seen a substantial increase in anti-bribery law enforcement activity with more frequent and aggressive investigations and enforcement proceedings by both the Department of Justice and the U.S. Securities and Exchange Commission, increased enforcement activity by non-U.S. regulators and increases in criminal and civil proceedings brought against companies and individuals. Our policies mandate compliance with all anti-bribery laws. However, we operate in certain countries that are recognized as having governmental and commercial corruption. Our internal control policies and procedures may not always protect us from reckless or criminal acts committed by our employees or third-party intermediaries. Violations of these anti-bribery laws may result in criminal or civil sanctions, which could have a material adverse effect on our business and results of operations.
18
Table of Contents
Increases in the cost of employee health benefits could impact the Company’s financial results and cash flow.
The Company’s expenses relating to employee health benefits are significant. Healthcare costs have risen significantly in recent years, and recent legislative and private sector initiatives regarding healthcare reform have resulted and could continue to result in significant changes to the U.S. healthcare system. Unfavorable changes in the cost of such benefits could have a material adverse effect on the Company’s financial results and cash flow.
Our business could be disrupted due to weather-related factors.
Our operations are heavily concentrated in the Southern and Midwestern U.S. (including Illinois, Ohio, Florida and the Gulf Coast). Because of our concentration in the Southern U.S., we may be more susceptible than some of our competitors to the effects of tropical weather disturbances, such as tornadoes and hurricanes. In addition, winter storm conditions in areas that have a large concentration of our business activities could also result in reduced demand for our products, lost retail sales, supply chain constraints or other business disruptions. We believe that we have taken reasonable precautions to prepare for weather-related events, but our precautions may not be adequate to mitigate the adverse effect of such events in the future.
The unionization of a significant portion of our workforce could increase our overall costs and adversely affect our operations.
We have a large employee base and while our management believes that our employee relations are good, we cannot be assured that we will not experience organization efforts from labor unions. The potential for unionization could increase if federal legislation is passed that would facilitate labor organization. Significant union representation would require us to negotiate wages, salaries, benefits and other terms with many of our employees collectively and could adversely affect our results of operations by significantly increasing our labor costs or otherwise restricting our ability to maximize the efficiency of our operations.
The Company’s stock price has been and may continue to be subject to volatility, and this and other factors may affect elements of the Company’s capital allocation strategy such as share repurchases and dividends.
The Company’s stock price has experienced volatility over time and this volatility may continue, in part due to factors mentioned in this Item 1A. Stock volatility in itself may adversely affect shareholder confidence as well as elements of the Company’s capital allocation strategy.
As part of its capital allocation strategy, the Company’s Board of Directors authorized a stock repurchase program of up to $100 million of our outstanding common stock and in July 2016, the Board of Directors authorized increasing the share repurchase program to $250 million of our outstanding common stock. In addition, the Board of Directors has also authorized a quarterly dividend program. Decisions regarding share repurchases and dividends are within the discretion of the Board of Directors, and will be influenced by a number of factors, including the price of the Company’s common stock, general business and economic conditions, the Company’s financial condition and operating results, the emergence of alternative investment or acquisition opportunities, changes in business strategy and other factors. Changes in, or the elimination of, the Company’s share repurchase programs or its dividend could have an adverse effect on the price of the Company’s common stock.
Disclaimer of Obligation to Update
We assume no obligation (and specifically disclaim any such obligation) to update these Risk Factors or any other forward-looking statements contained in this Annual Report to reflect actual results, changes in assumptions or other factors affecting such forward-looking statements.
Item 1B. Unresolved Staff Comments.
None.
19
Table of Contents
As of December 31, 2016, our wholly-owned entities operated in the following location.
STORES
North American Retail Division
| State |
# |
State |
# | |||
| UNITED STATES: |
||||||
| Alabama |
27 | Montana | 5 | |||
| Alaska |
5 | Nebraska | 10 | |||
| Arizona |
35 | Nevada | 22 | |||
| Arkansas |
12 | New Jersey | 4 | |||
| California |
149 | New Mexico | 11 | |||
| Colorado |
46 | New York | 20 | |||
| District of Columbia |
1 | North Carolina | 49 | |||
| Florida |
145 | North Dakota | 4 | |||
| Georgia |
62 | Ohio | 52 | |||
| Hawaii |
9 | Oklahoma | 17 | |||
| Idaho |
8 | Oregon | 22 | |||
| Illinois |
62 | Pennsylvania | 20 | |||
| Indiana |
24 | Puerto Rico | 12 | |||
| Iowa |
9 | South Carolina | 20 | |||
| Kansas |
13 | South Dakota | 3 | |||
| Kentucky |
18 | Tennessee | 33 | |||
| Louisiana |
39 | Texas | 181 | |||
| Maine |
1 | Utah | 14 | |||
| Maryland |
18 | U.S. Virgin Islands | 2 | |||
| Massachusetts |
5 | Virginia | 40 | |||
| Michigan |
41 | Washington | 39 | |||
| Minnesota |
35 | West Virginia | 5 | |||
| Mississippi |
19 | Wisconsin | 34 | |||
| Missouri |
36 | Wyoming | 3 | |||
|
| ||||||
| TOTAL | 1,441 |
The supply chain facilities which we operate in the United States support our North American Retail and North American Business Solutions Divisions and the facilities in Canada support our North American Business Solutions Division. The following tables set forth the locations of our principal supply chain facilities as of December 31, 2016.
DCs and Crossdock Facilities (United States)
|
|
# |
State |
# | |||
| Arizona |
1 | Maine | 1 | |||
| California |
3 | Minnesota | 1 | |||
| Colorado |
1 | Mississippi | 1 | |||
| Florida |
3 | Ohio | 2 | |||
| Georgia |
2 | Pennsylvania | 3 | |||
| Hawaii |
1 | Puerto-Rico | 1 | |||
| Illinois |
2 | Texas | 3 | |||
| Kansas |
1 | Washington | 2 | |||
|
|
| |||||
| TOTAL | 28 |
20
Table of Contents
DCs and Crossdock Facilities (Canada)
| Country |
# |
|||||
| Canada |
10 |
Our corporate office in Boca Raton, FL consists of approximately 625,000 square feet. This facility is considered to be in good condition, adequate for its purpose and suitably utilized according to the individual nature and requirements of the relevant operations. Although we own a small number of our retail store locations, most of our facilities are leased or subleased.
The Company is involved in litigation arising in the normal course of business. While, from time to time, claims are asserted that make demands for a large sum of money (including, from time to time, actions which are asserted to be maintainable as class action suits), the Company does not believe that contingent liabilities related to these matters (including the matters discussed below), either individually or in the aggregate, will materially affect the Company’s financial position, results of operations or cash flows.
In addition, in the ordinary course of business, sales to and transactions with government customers may be subject to lawsuits, investigations, audits and review by governmental authorities and regulatory agencies, with which the Company cooperates. Many of these lawsuits, investigations, audits and reviews are resolved without material impact to the Company. While claims in these matters may at times assert large demands, the Company does not believe that contingent liabilities related to these matters, either individually or in the aggregate, will materially affect its financial position, results of operations or cash flows.
In addition to the foregoing, OfficeMax is named a defendant in a number of lawsuits, claims, and proceedings arising out of the operation of certain paper and forest products assets prior to those assets being sold in 2004, for which OfficeMax agreed to retain responsibility. Also, as part of that sale, OfficeMax agreed to retain responsibility for all pending or threatened proceedings and future proceedings alleging asbestos-related injuries arising out of the operation of the paper and forest products assets prior to the closing of the sale. The Company has made provision for losses with respect to the pending proceedings. Additionally, as of December 31, 2016, the Company has made provision for environmental liabilities with respect to certain sites where hazardous substances or other contaminants are or may be located. For these environmental liabilities, our estimated range of reasonably possible losses was approximately $10 million to $25 million. The Company regularly monitors its estimated exposure to these liabilities. As additional information becomes known, these estimates may change, however, the Company does not believe any of these OfficeMax retained proceedings are material to the Company’s financial position, results of operations or cash flows
Item 4. Mine Safety Disclosures.
Not applicable.
21
Table of Contents
Item 5. Market for Registrant’s Common Equity, Related Stockholder Matters and Issuer Purchases of Equity Securities.
The Company’s common stock is traded on the NASDAQ Global Select Market under the ticker symbol ODP.
The following table sets forth, for the periods indicated, the high and low sale prices of our common stock and cash dividends paid. These stock prices do not include retail mark-ups, markdowns or commission.
| Sales Price | Cash Dividends |
|||||||||||
| High | Low | |||||||||||
| 53 weeks year ended December 31, 2016 |
||||||||||||
| First Quarter |
$ | 7.20 | $ | 4.83 | $ | — | ||||||
| Second Quarter |
$ | 7.91 | $ | 3.18 | $ | — | ||||||
| Third Quarter |
$ | 3.86 | $ | 3.11 | $ | 0.025 | ||||||
| Fourth Quarter |
$ | 5.22 | $ | 3.01 | $ | 0.025 | ||||||
| 52 weeks year ended December 26, 2015 |
||||||||||||
| First Quarter |
$ | 9.77 | $ | 7.40 | $ | — | ||||||
| Second Quarter |
$ | 9.41 | $ | 8.80 | $ | — | ||||||
| Third Quarter |
$ | 8.98 | $ | 6.64 | $ | — | ||||||
| Fourth Quarter |
$ | 7.99 | $ | 5.24 | $ | — | ||||||
Holders
As of the close of business on January 27, 2017, there were 9,313 holders of record of our common stock. The last reported sale price of the common stock on the NASDAQ on January 27, 2017 was $4.31.
Cash Dividend
Any decision to pay future cash dividends will be at the direction of the Board of Directors and will depend on our operating results, earnings, financial condition and other factors. Payment of dividends is permitted under our existing credit facilities provided that the Company has the required minimum liquidity or fixed charge ratio but may be limited if the Company does not meet the necessary requirements.
Issuer Purchase of Equity Security
In May 2016, our Board of Directors authorized a stock repurchase program of up to $100 million of our outstanding common stock. The stock repurchase authorization permits the Company to repurchase stock from time-to-time through a combination of open market repurchases, privately negotiated transactions, 10b5-1 trading plans, accelerated stock repurchase transactions and/or other derivative transactions. In July 2016, the Board of Directors authorized increasing the share repurchase program to $250 million of our outstanding common stock. The authorization extends to the end of 2018 and may be suspended or discontinued at any time.
22
Table of Contents
The following table summarizes our common stock repurchases during the fourth quarter of 2016.
| Period | Total Number of Shares Purchased (In thousands) |
Average Price Paid per Share (a) |
Total Number of (In thousands) |
Approximate Dollar Value of Shares that May Yet Be Purchased Under the Repurchase Programs (b) (In millions) |
||||||||||||
| September 25 — October 22, 2016 |
4,600 | $ | 3.50 | 4,600 | $ | 153 | ||||||||||
| October 23 — November 19, 2016 |
6,168 | $ | 3.35 | 6,168 | $ | 132 | ||||||||||
| November 20 — December 31, 2016 |
2,895 | $ | 4.88 | 2,895 | $ | 118 | ||||||||||
|
|
|
|||||||||||||||
| Total |
13,663 | |||||||||||||||
|
|
|
|||||||||||||||
The exact number and timing of share repurchases will depend on market conditions and other factors, and will be funded through existing liquidity.
We purchased zero, 7 million, 16 million and 14 million shares during the first, second, third and fourth quarters of fiscal 2016, respectively, at an average weighted price of $3.58 per common share. For the year 2016, we purchased approximately 37 million common shares for total consideration of $132 million. At December 31, 2016, approximately $118 million remains available for additional purchases under the approved program.
23
Table of Contents
Office Depot Stock Comparative Performance Graph
The information contained in the this Office Depot Comparative Performance Graph section shall not be deemed to be filed as part of this Annual Report and does not constitute soliciting material and should not be deemed filed or incorporated by reference into any other filing of the Company under the Securities Act of 1933, as amended, or the Securities Exchange Act of 1934, as amended, except to the extent we specifically incorporate the graph by reference.
The following graph below compares the five-year cumulative total shareholder return on our common stock with the cumulative total returns of the Standard & Poor’s 500 Index (“S&P 500”) of which we are component and the Standard & Poor’s Specialty Stores Index (“S&P Specialty Stores”) of which we are also a component.
The graph assumes an investment of $100 at the close of trading on December 31, 2011 the last trading day of fiscal year 2011, in our common stock, the S&P 500 and the S&P Specialty Stores.
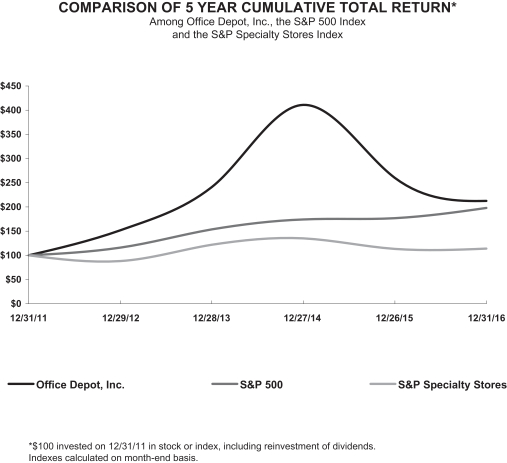
| 12/31/11 | 12/29/12 | 12/28/13 | 12/27/14 | 12/26/15 | 12/31/16 | |||||||||||||||||||
| Office Depot, Inc. |
100.00 | 152.09 | 241.40 | 411.16 | 260.47 | 212.77 | ||||||||||||||||||
| S&P 500 |
100.00 | 116.00 | 153.58 | 174.60 | 177.01 | 198.18 | ||||||||||||||||||
| S&P Specialty Stores |
100.00 | 88.30 | 121.79 | 135.12 | 113.59 | 114.21 | ||||||||||||||||||
The stock price performance included in this graph is not necessarily indicative of future stock price performance.
COMPARISON OF 5 YEAR CUMULATIVE TOTAL RETURN* Among Office Depot, Inc., the S&P 500 Index and the S&P Specialty Stores Index * $100 invested on 12/31/11 in stock or index, including reinvestment of dividends. Indexes calculated on month-end basis.
24
Table of Contents
Item 6. Selected Financial Data.
The following table sets forth selected consolidated financial data at and for each of the five fiscal years in the period ended December 31, 2016. It should be read in conjunction with the Consolidated Financial Statements and Notes thereto in Part IV — Item 15. “Exhibits and Financial Statement Schedules” and Part II — Item 7. “MD&A” of this Annual Report.
The Company has accounted for actual and planned disposition of substantially all of the business formerly presented as the International Division as discontinued operations beginning in 2016. All data for prior periods have been recast.
| (In millions, except per share amounts and statistical data) | 2016(1) | 2015 | 2014 | 2013(5) | 2012 | |||||||||||||||
| Statements of Operations Data: |
||||||||||||||||||||
| Sales |
$ | 11,021 | $ | 11,727 | $ | 12,710 | $ | 8,246 | $ | 7,680 | ||||||||||
| Net income (loss) from continuing operations (2)((3)(4)(5)(6) |
$ | 679 | $ | 92 | $ | (293 | ) | $ | (251 | ) | $ | (32 | ) | |||||||
| Discontinued operations, net of tax |
$ | (150 | ) | $ | (84 | ) | $ | (59 | ) | $ | 231 | $ | (45 | ) | ||||||
| Net income (loss) |
$ | 529 | 8 | $ | (352 | ) | $ | (20 | ) | $ | (77 | ) | ||||||||
| Net income (loss) attributable to Office Depot, Inc. (2)((3)(4)(5)(6) |
$ | 529 | $ | 8 | $ | (354 | ) | $ | (20 | ) | $ | (77 | ) | |||||||
| Net income (loss) available to common shareholders (2)((3)(4)(5)(6) |
$ | 529 | $ | 8 | $ | (354 | ) | $ | (93 | ) | $ | (110 | ) | |||||||
| Net earnings (loss) per share: |
||||||||||||||||||||
| Basic: |
||||||||||||||||||||
| Continuing Operations |
$ | 1.26 | $ | 0.17 | $ | (0.55 | ) | $ | (1.02 | ) | $ | (0.23 | ) | |||||||
| Discontinued Operations |
$ | (0.28 | ) | $ | (0.15 | ) | $ | (0.11 | ) | $ | 0.73 | $ | (0.16 | ) | ||||||
|
|
|
|||||||||||||||||||
| Net basic earnings (loss) per share |
$ | 0.98 | $ | 0.01 | $ | (0.66 | ) | $ | (0.29 | ) | $ | (0.39 | ) | |||||||
|
|
|
|||||||||||||||||||
| Diluted: |
||||||||||||||||||||
| Continuing Operations |
$ | 1.24 | $ | 0.16 | $ | (0.55 | ) | $ | (1.02 | ) | $ | (0.23 | ) | |||||||
| Discontinued Operations |
$ | (0.27 | ) | $ | (0.15 | ) | $ | (0.11 | ) | $ | 0.73 | $ | (0.16 | ) | ||||||
|
|
|
|||||||||||||||||||
| Net diluted earnings (loss) per share |
$ | 0.96 | $ | 0.01 | $ | (0.66 | ) | $ | (0.29 | ) | $ | (0.39 | ) | |||||||
|
|
|
|||||||||||||||||||
| Cash dividends declared per common share |
$ | 0.05 | $ | — | $ | — | $ | — | $ | — | ||||||||||
| Statistical Data: |
||||||||||||||||||||
| Facilities open at end of period: |
||||||||||||||||||||
| United States: |
||||||||||||||||||||
| Office supply stores |
1,441 | 1,564 | 1,745 | 1,912 | 1,112 | |||||||||||||||
| Distribution centers and crossdock facilities |
28 | 33 | 66 | 81 | 15 | |||||||||||||||
|
Other (7): |
||||||||||||||||||||
| Office supply stores |
— | — | — | 19 | — | |||||||||||||||
| Distribution centers and crossdock facilities |
10 | 12 | 12 | 10 | — | |||||||||||||||
| Call centers |
— | — | — | 1 | — | |||||||||||||||
| Total square footage — North American Retail Division (in millions) |
32.4 | 35.4 | 39.6 | 43.6 | 25.5 | |||||||||||||||
| Percentage of sales by segment: |
||||||||||||||||||||
| North American Retail Division |
50.8 | % | 51.2 | % | 52.0 | % | 56.3 | % | 58.0 | % | ||||||||||
| North American Business Solutions Division |
49.0 | % | 48.7 | % | 47.9 | % | 43.6 | % | 41.9 | % | ||||||||||
| Other |
0.2 | % | 0.1 | % | 0.1 | % | 0.1 | % | 0.1 | % | ||||||||||
| Balance Sheet Data: |
||||||||||||||||||||
| Total assets |
$ | 5,540 | 6,442 | $ | 6,757 | $ | 7,365 | $ | 3,966 | |||||||||||
| Long-term recourse debt, net of current maturities |
358 | 628 | 662 | 681 | 467 | |||||||||||||||
| Redeemable preferred stock, net |
— | — | — | — | 386 | |||||||||||||||
| (1) | Includes 53 weeks in accordance with our 52 — 53 week reporting convention. |
25
Table of Contents
| (2) | Fiscal year 2016 Net income (loss), Net income attributable to Office Depot, Inc., and Net income available to common shareholders include $15 million of asset impairment charges, $80 million income of Merger, restructuring, and other operating (income) expenses, net, including $250 million received from Staples as the Termination Fee, and the reversal of $382 million of valuation allowances on deferred tax assets. Refer to MD&A for additional information. |
| (3) | Fiscal year 2015 Net income (loss), Net income attributable to Office Depot, Inc., and Net income available to common shareholders include $13 million of asset impairment charges and $242 million of Merger-related, restructuring, and other operating expenses. Refer to MD&A for additional information. |
| (4) | Fiscal year 2014 Net income (loss), Net income attributable to Office Depot, Inc., and Net income available to common shareholders include $56 million of asset impairment charges, $334 million of Merger-related, restructuring, and other operating expenses, and $81 million of Legal accrual. Refer to MD&A for additional information. |
| (5) | On November 5, 2013, the Company merged with OfficeMax. Statement of operations data and percentage of sales by segment include OfficeMax’s results from the Merger date through December 28, 2013. Balance sheet and facilities data include OfficeMax data as of December 28, 2013. Sales in 2013 include $846 million from OfficeMax operations. Additionally, fiscal year Net income (loss), Net income attributable to Office Depot, Inc., and Net income available to common shareholders includes $26 million of asset impairment charges, and $179 million of Merger-related, restructuring, and other operating expenses. Net income (loss) available to common shareholders includes $45 million of dividends related to the redemption of the redeemable preferred stock. |
| (6) | Fiscal year 2012 Net income (loss), Net income attributable to Office Depot, Inc., and Net income available to common shareholders include $123 million of asset impairment charges, $63 million net gain on purchase price recovery and $17 million of charges related to closure costs and process improvement activity. |
| (7) | Includes Canadian office supply stores, distribution centers and crossdock facilities. Fiscal year 2013 includes 19 stores in Canada operated by our North American Business Solutions Division. These Canadian stores were closed in 2014. |
26
Table of Contents
Item 7. Management’s Discussion and Analysis of Financial Condition and Results of Operations.
Management’s Discussion and Analysis of Financial Condition and Results of Operations (“MD&A”) is intended to provide information to assist readers in better understanding and evaluating our financial condition and results of operations. We recommend reading this MD&A in conjunction with our Consolidated Financial Statements and Notes thereto included in this Form 10-K.
RESULTS OF OPERATIONS
OVERVIEW
Our business is comprised of two reportable segments (or “Divisions”) at year end 2016. The North American Retail Division includes our retail stores in the United States, including Puerto Rico and the U.S. Virgin Islands, which offer office supplies, technology products and solutions, business machines and related supplies, facilities products, and office furniture. Most stores also have a copy and print center offering printing, reproduction, mailing and shipping. The North American Business Solutions Division sells office supply products and services in the United States, including Puerto Rico and the U.S. Virgin Islands, and Canada. North American Business Solutions Division customers are served through dedicated sales forces, through catalogs, telesales, and electronically through our internet sites. During September 2016 we announced the plan to sell substantially all of our foreign business operations that made up the former International Division. On December 31, 2016, the European business of our former International Division was sold. The remaining international operations in South Korea, mainland China, Australia and New Zealand are being actively marketed for sale and have been included in discontinued operations in our Consolidated Financial Statements. Certain operations previously included in the International Division did not meet the criteria as held for sale at December 31, 2016, and have been presented as Other, pending resolution on how these operations will be managed in future periods.
Staples Acquisition
On February 4, 2015, Staples and the Company entered into the Staples Merger Agreement, under which Staples would acquire all of the outstanding shares of Office Depot and the Company would become a wholly owned subsidiary of Staples.
On December 7, 2015, the FTC informed Office Depot and Staples that it intended to block the Staples Acquisition. On the same date, Office Depot and Staples announced their intent to contest the FTC’s decision to challenge the transaction. On May 10, 2016, the U.S. District Court for the District of Columbia granted the FTC’s request for a preliminary injunction against the proposed acquisition, and as a result, the companies terminated the Staples Merger Agreement on May 16, 2016. Pursuant to the terms of the termination agreement, Staples paid Office Depot a Termination Fee of $250 million in cash on May 19, 2016. The Termination Fee more than offset the expenses incurred during the protracted approval consideration process, but not necessarily the business disruption impacts.
Refer to Note 2. “Merger, Acquisition Termination, and Restructuring Activity” in Notes to the Consolidated Financial Statements for additional information.
Comprehensive Business Review
During August 2016, the Company announced the results of a comprehensive business review and strategy (the “Comprehensive Business Review”), which, among other things, included an anticipation of closing approximately 300 additional retail stores in North America over the next three years, anticipated restructuring initiatives to lower operating and general and administrative expenses, and continued exploration of strategic alternatives regarding the European business that had been initiated by Staples as part of their attempt to get European Union regulatory approval of the Staples Acquisition.
27
Table of Contents
Disposition of the International Division — Discontinued Operations
In September 2016, the Company announced that it had received an irrevocable offer to purchase the European business (the “OD European Business”) and, in November 2016, we entered into a definitive sale and purchase agreement (“SPA”) with The AURELUIS Group to sell the OD European Business. On December 31, 2016, the Company closed the transaction contemplated by the SPA, as amended to complete the sale. The Company will retain responsibility for the defined benefit pension plan in the United Kingdom. In addition to approving the sale of the OD European Business, the Company’s Board of Directors in September 2016 approved a plan to sell substantially all of the remaining international operations in South Korea, mainland China, Australia and New Zealand. Actual sales of these disposal groups may be for amounts different from current estimates and recognition of then-current cumulative translation adjustment amounts will likely result in variability in the amounts reported as Discontinued operations, net of taxes in future periods. These remaining operations are included in discontinued operations at year end 2016. We reclassified the financial results of the International Sale Group to Discontinued operations, net of tax in the Consolidated Statements of Operations for all periods presented. The Company also reclassified the related assets and liabilities as current and non-current assets and liabilities of discontinued operations on the accompanying Consolidated Balance Sheets as of December 31, 2016 and December 26, 2015. Cash flows from the Company’s discontinued operations are presented in the Consolidated Statements of Cash Flows for all periods presented.
Refer to Note 3. “Discontinued Operations,” in Notes to the Consolidated Financial Statements for additional information.
Merger
On November 5, 2013, the Company finalized its Merger with OfficeMax. Through the end of 2016, substantial progress has been made on Merger integration activity. During 2016, we completed the store closure program announced under the Real Estate Strategy; store closures under this program were 51, 181, and 168 in 2016, 2015 and 2014, respectively. Through the end of 2016, we have closed 14 distribution centers and cross dock facilities. Supply chain integration is expected to be complete before the end of 2017. Since the Merger date, all retail stores have been converted to common point of sale systems, we successfully launched the co-branded public website (www.officedepot.com), combined operating support functions, transitioned certain contract customers from the OfficeMax to the Office Depot platform, and made significant progress on identifying customer preferences and developing methods to service their needs. The North American Business Solutions customer migrations follow completion of the supply chain integration and are anticipated to be substantially complete by the end of 2017, with some activity in 2018. We estimate we have achieved over $700 million in annual run rate synergy benefits from the OfficeMax integration through the end of 2016.
28
Table of Contents
Continuing Operations
A summary of certain factors impacting operating results from continuing operations for the 53-week period ended December 31, 2016 (also referred to as “2016”) and the 52-week period ended December 26, 2015 (also referred to as “2015”) is provided below.
Sales reported for 2016 compared to the prior year were significantly affected by the retail store closures in the North American Retail Division and the prolonged Staples Acquisition attempt in the contract channel of the North American Business Solutions Division. The 53rd week in 2016 increased total Company sales by approximately $143 million and increased operating income by approximately $15 million.
| (In millions) | 2016 | 2015 | Change | |||||||||
| Sales |
||||||||||||
| North American Retail Division |
$ | 5,603 | $ | 6,004 | (7 | )% | ||||||
| Change in comparable store sales |
(2 | )% | ||||||||||
| North American Business Solutions Division |
5,400 | 5,708 | (5 | )% | ||||||||
| Change in constant currencies |
(5 | )% | ||||||||||
| Other |
18 | 15 | 20 | % | ||||||||
|
|
|
|||||||||||
| Total |
$ | 11,021 | $ | 11,727 | (6 | )% | ||||||
|
|
|
|||||||||||
Other Significant Factors Impacting Total Company Results and Liquidity
| • | Gross margin increased 16 basis points in 2016 compared to 2015, with increases in both the North American Retail Division and the North American Business Solution Division. |
| • | Total Company Selling, general and administrative expenses decreased in 2016 compared to 2015, reflecting the closure of stores in North America, lower payroll and advertising expenses, operational efficiencies and synergies. As a percentage of sales, total Selling, general and administrative expenses decreased in 2016 compared to 2015 by 34 basis points. |
| • | Merger, restructuring and other operating (income) expense, net in 2016, amounted to income of $(80) million compared to expenses of $242 million in 2015. In 2016, this line item includes $64 million of expenses related to Merger activities, a net credit of $(192) million related to the Staples Acquisition, reflecting the $250 million termination fee payment received from Staples, and $48 million of expenses associated with the Comprehensive Business Review that was initiated in August 2016. Additional integration and restructuring expenses are expected to be incurred through 2017. Refer to Note 2. “Merger, Acquisition Termination, and Restructuring Activity” in the Notes to the Consolidated Financial Statements for additional information. |
| • | The effective tax rate for 2016 was (48)%, primarily impacted by the reversal of a substantial portion of our U.S. federal and state valuation allowance as we concluded that it was more likely than not that a benefit from the related deferred tax assets would be realizable. This conclusion was based on a detailed evaluation of all available positive and negative evidence, and the weight of such evidence, the current financial position and results of operations for the current and preceding years, and the expectation of continued earnings. We determined that approximately $382 million of our U.S. federal and state valuation allowance should be reversed in 2016. |
| • | Diluted earnings per share from continuing operations was $1.24 in 2016 compared to $0.16 in 2015. |
| • | Diluted earnings per share from discontinued operations was a loss of $0.27 in 2016 compared to a loss of $0.15 in 2015. |
| • | Net diluted earnings per share was $0.96 in 2016 compared to $0.01 in 2015. |
29
Table of Contents
| • | At December 31, 2016, we had $763 million in cash and cash equivalents and $1.0 billion available under the Amended Credit Agreement. Cash provided by operating activities of continuing operations was $492 million for 2016 compared to $138 million for 2015. |
| • | During 2016, we paid a cash dividend on our common stock of $0.025 per share in both the third and fourth quarters of 2016, resulting in an aggregate cash payment during 2016 of $26 million. |
| • | During 2016, we redeemed the $250 million, 9.75% senior secured notes due 2019 at a price equal to 104.875% of the principal amount for a total consideration of $262 million plus accrued interest of $12 million. The premium paid, along with the expensing of remaining unamortized issue costs, resulted in a $15 million loss on extinguishment of debt. |
| • | During 2016, we purchased 37 million shares of Office Depot common stock under our share repurchase program, resulting in returning $132 million to shareholders. |
| • | Fiscal year 2016 is a 53-week year under our retail calendar. Our fourth quarter included 14 weeks and ended on December 31, 2016. |
OPERATING RESULTS
Discussion of additional income and expense items, including material charges and credits and changes in interest and income taxes follows our review of segment results.
NORTH AMERICAN RETAIL DIVISION
| (In millions) | 2016 | 2015 | 2014 | |||||||||
| Sales |
$ | 5,603 | $ | 6,004 | $ | 6,528 | ||||||
| % change |
(7)% | (8)% | 41% | |||||||||
| Division operating income |
$ | 299 | $ | 310 | $ | 126 | ||||||
| % of sales |
5% | 5% | 2% | |||||||||
| Comparable store sales (decline) |
(2)% | — | % | (2)% | ||||||||
Sales in our North American Retail Division decreased 7% and 8% in 2016 and 2015, respectively, and increased 41% in 2014. During the second quarter of 2016, we completed our 400 store closure program associated with the 2014 Real Estate Strategy. In August 2016, we announced plans to close an additional 300 retail locations through 2018 as part of the Comprehensive Review. Store closure activity is shown in the table below. Of the sales decline in Fiscal 2016, 6% was driven by closed stores and a 2% decline in comparable store sales. These factors were partially offset by a 1% increase in sales due to 2016 including one additional fiscal week as compared to Fiscal 2015. Comparable store sales declines include the sales transfer benefit from closed stores into stores that remained open. The sales decline during 2015 was largely due to our store closure program. The 41% increase in sales during 2014 reflects the first full year of sales following the OfficeMax Merger.
Our comparable store sales relate to stores that have been open for at least one year. Stores are removed from the comparable sales calculation one month prior to closing, as sales during that period are largely non-comparable clearance activity, and during periods of store remodeling and if significantly downsized. Our measure of comparable store sales has been applied consistently across periods, but may differ from measures used by other companies.
Comparable store sales in 2016 decreased 2%, reflecting flat average order value, lower store traffic and transaction counts compared to prior year, partially offset by higher conversion rates. Comparable store sales decreased in ink, toner, computers and technology products. Sales increased in furniture, copy and print services,
30
Table of Contents
and cleaning/breakroom products. The North American Retail Division continued to benefit from the increasing trend of omni-channel transactions where customers order online for pick up in the stores. The Buy Online-Pickup in Store sales increased over 50% to approximately $115 million in 2016 compared to the prior year. During 2016, the Company also began offering Buy Online-Ship from Store. These sales are included the North American Retail Division sales, including our comparable store calculations, as they are fulfilled with store inventory and serviced by Retail Division employees. We expect these activities and trends to continue in 2017. Additionally, comparable store sales calculations continue to be positively affected from customers transferring from closed to nearby stores which remained open, although the impact decreases after the one year anniversary of the store closure. The average sales transfer rate achieved to date under the store closure programs is estimated to be over 30%. Future store closures under the Comprehensive Business Review may have lower sales transfer rates as the distance between stores being closed to stores remaining open increases.
Comparable store sales in 2015 were flat. As we implemented the Real Estate Strategy, comparable store sales calculations were positively affected from customers transferring from closed to nearby stores which remained open. The 2015 results reflected increases in supplies, furniture, copy and print services, ink and toner and declines in computer and related technology products. In 2015, transaction counts increased and average order values decreased compared to prior year. The increase in transaction counts resulted from increased traffic in the stores due to sales transfers resulting from store closures and improvements in customer in-store experience. Additionally 2015 sales include an increase in online sales picked up by customers in stores. The decrease in average order values in 2015 reflect, in part, declines in technology sales, as customers continue to reduce purchases in this overall category partially offset by the increase in average sale prices on furniture products.
The North American Retail Division reported operating income of $299 million in 2016, compared to $310 million in 2015 and $126 million in 2014. Division operating income in 2015 included benefits from favorable legal settlements of $16 million relating to labor matters and $23 million relating to certain product manufacturers’ pricing practices. Excluding those items, Division operating income improved in 2016 compared to 2015, reflecting a slight increase in gross margin and lower occupancy costs, as well as lower selling, general and administrative expenses, from both store closures and increased efficiency. The 53rd week also positively impacted Division results by approximately $14 million.
Store closures contributed to declines in 2015 of occupancy, payroll and other store operating costs. Beyond the impact from store closures, operating costs decreased from lower advertising and payroll expenses, as well as continued synergy impacts from the Merger. Additionally, the 2015 division operating income was favorably affected by an increase in gross margin rates and the favorable legal settlements referred to above.
At the end of 2016, we operated 1,441 retail stores in the United States, Puerto Rico and the U.S. Virgin Islands. Store opening and closing activity for the last three years has been as follows:
| Open at Beginning of Period |
Closed | Opened | Open at End of Period |
|||||||||||||
| 2014 |
1,912 | 168 | 1 | 1,745 | ||||||||||||
| 2015 |
1,745 | 181 | — | 1,564 | ||||||||||||
| 2016 |
1,564 | 123 | — | 1,441 | ||||||||||||
Charges associated with store closures under the Real Estate Strategy and the Comprehensive Business Review will be reported as appropriate in Asset impairments and Merger, restructuring and other operating (income) expenses, net in the Consolidated Statements of Operations. These charges will be reflected in Corporate reporting, and not included in the determination of Division income in future periods. Refer to “Corporate and other” discussion below for additional information of expenses incurred to date.
31
Table of Contents
NORTH AMERICAN BUSINESS SOLUTIONS DIVISION
| (In millions) | 2016 | 2015 | 2014 | |||||||||
| Sales |
$ | 5,400 | $ | 5,708 | $ | 6,013 | ||||||
| % change |
(5)% | (5)% | 68% | |||||||||
| Division operating income |
$ | 265 | $ | 226 | $ | 232 | ||||||
| % of sales |
5% | 4% | 4% | |||||||||
Sales in our North American Business Solutions Division in U.S. dollars decreased by 5% in 2016 and 5% in 2015 and increased 68% in 2014. The increase in 2014 reflects the first full year of sales following the OfficeMax Merger. Fiscal year 2016 included 53 weeks under our retail calendar which added $56 million when compared to the 52 weeks of the prior year. In 2016 and 2015, on a constant currency basis, sales decreased 5% and 4%, respectively, representing decreases in both contract and direct channels. Changes in constant currencies are computed by excluding the impact of foreign currency exchange rates fluctuations. In future periods, Division results will continue to be impacted by changes in foreign currency exchange rates associated with the Canadian business.
The decline in the contract channel sales continues to reflect the impact of customer attrition and fewer customer additions during the period of business disruption related to the prolonged Staples Acquisition attempt, as well as competitive pressures in certain supplies and technology categories. Changes to the sales model and future product offerings expansion are aimed at reducing the rate of sales decline, but the impact of the Staples Acquisition attempt disruption will continue to affect prior year comparisons until lost accounts are replaced. Additionally, new customers typically require an integration period before reaching their buying potential and having a positive impact on sales trends. In the direct channel, the ongoing reduction in catalog and call center sales contributed to the Division’s overall decline. Also, the decommissioning of legacy OfficeMax e-commerce sites contributed to the direct channel decline but had a positive impact on overall operating income. Sales placed online but picked up in stores continued to increase in 2016 and are reported as sales in the North American Retail Division. On a product category basis for the North American Business Solutions Division, sales increased in cleaning/breakroom, were essentially flat in copy and print, and decreased in furniture and across the other primary product categories. Sales of paper, toner, and ink continued to trend lower over the three years.
Sales in 2014 increased in the contract and direct channels and were primarily due to the addition of OfficeMax sales. Direct channel sales also increased during 2014, reflecting efforts to enhance the internet shopping offering and experience. The increased online sales were partially offset by reduced call center sales. Sales in the merged business in Canada declined in the second half of 2014 compared to the first half of 2014, in part reflecting the closing of Grand & Toy retail stores during the second quarter of 2014.
Division operating income was $265 million in 2016, $226 million in 2015, and $232 million in 2014. Division operating income as a percentage of sales was 5% in 2016 and 4% in 2015 and 2014. The increase in operating income was primarily the result of lower selling, general and administrative expenses, including payroll and integration synergy benefits, which, together with an increased gross margin rate, more than offset the negative flow through impact of the decline in sales. The 53rd week also positively impacted Division results by approximately $4 million.
In 2014, the Company closed 19 Grand & Toy stores in Canada that were added as part of the Merger. These locations primarily serviced small business customers and, accordingly, were included in results of the North America Business Solutions Division.
OTHER
| (In millions) | 2016 | 2015 | 2014 | |||||||||
| Sales |
$ | 18 | $ | 15 | $ | 14 | ||||||
| Other operating income |
$ | 1 | $ | 3 | $ | 1 | ||||||
32
Table of Contents
Global sourcing operations of the Asia/Pacific region did not meet the held for sale criteria at December 31, 2016, and are presented as continuing operations. The operations primarily relate to the sale of products to former joint venture partners. Intercompany transactions are eliminated. The future prospects and reporting of this business are being evaluated.
CORPORATE
The line items in our Consolidated Statements of Operations impacted by these Corporate activities are presented in the table below, followed by a narrative discussion of the significant matters. These activities are managed at the Corporate level and, accordingly, are not included in the determination of Division income for management reporting or external disclosures.
| (In millions) | 2016 | 2015 | 2014 | |||||||||
| Asset impairments |
$ | 15 | $ | 13 | $ | 56 | ||||||
| Merger, restructuring, and other operating (income) expenses, net |
(80 | ) | 242 | 334 | ||||||||
| Legal accrual |
— | — | 81 | |||||||||
|
|
|
|||||||||||
| Total charges and credits impact on Operating income (loss) |
$ | (65 | ) | $ | 255 | $ | 471 | |||||
|
|
|
|||||||||||
In addition to these charges and credits, certain Selling, general and administrative expenses are not allocated to the Divisions and are managed at the Corporate level. Those expenses are addressed in the section “Unallocated Costs” below.
Asset Impairments, Merger, Restructuring, Other Charges and Credits
In recent years, we have taken actions to adapt to changing and competitive conditions. These actions include closing stores and distribution centers, consolidating functional activities, eliminating redundant positions, disposing of businesses and assets, and taking actions to improve process efficiencies. These actions have resulted in significant charges associated with the Merger, Real Estate Strategy, the Staples Acquisition and the Comprehensive Business Review. Certain of these activities are expected to continue in future periods and result in additional charges.
Asset impairments
Asset impairment charges are comprised of following:
| (In millions) | 2016 | 2015 | 2014 | |||||||||
| North America stores |
$ | 8 | $ | 12 | $ | 26 | ||||||
| Software |
— | — | 25 | |||||||||
| Intangible assets |
7 | 1 | 5 | |||||||||
|
|
|
|||||||||||
| Total Asset impairments |
$ | 15 | $ | 13 | $ | 56 | ||||||
|
|
|
|||||||||||
North America stores
The impairment of store assets reflects the impact of shortening the anticipated use periods of certain retail store locations in accordance with the Comprehensive Business Review, as well as lower anticipated cash flows, primarily from lower future sales projections.
As a result of declining sales in recent periods and adoption of our Real Estate Strategy in 2014 and the Comprehensive Business Review in 2016, the Company has regularly conducted a detailed store impairment analysis. The analysis includes estimates of store-level sales, gross margins, direct expenses, exercise of future
33
Table of Contents
lease renewal options where applicable, and resulting cash flows and, by their nature, include judgments about how current initiatives will impact future performance. If the anticipated cash flows of a store cannot support the carrying value of its assets, the assets are impaired and written down to estimated fair value.
The projections prepared for the 2016 analysis assumed declining sales over the forecast period. Gross margin and operating cost assumptions have been held at levels consistent with recent actual results and planned activities. Estimated cash flows were discounted at 13% in 2016, 12% in 2015 and 13% in 2014. The impairment charges include amounts to bring the location’s assets to estimated fair value based on projected operating cash flows or residual value, as appropriate. The Company continues to capitalize additions to previously-impaired operating stores and tests for subsequent impairment. The 2014 store impairment charge also includes $1 million related to the closure of stores in Canada.
As implementation of the remaining supply chain integration, which is expected to be complete in 2017, and the Comprehensive Business Review continues, we are likely to experience volatility in results. In addition to charges for severance and facility closure costs that will be recognized as decisions are made, we may experience volatility from the timing of recognition of impairment charges, as well as credits related to capital leases and deferred rent accounts when the leases are terminated or modified.
Software impairments
As part of the integration process during 2014, the Company decided to convert certain websites and other information technology applications to common platforms resulting in a $25 million charge to the write off of capitalized software.
Intangible assets
Following identification of retail stores for closure as part of our Real Estate Strategy and Comprehensive Business Review, the related favorable lease assets recorded in the Merger were assessed for accelerated amortization or impairment. Considerations included the projected cash flows discussed above, planned closures and the likelihood of sublease under renewal options or returning the property to the landlord. Impairment of $7 million, $1 million, and $5 million were recognized during 2016, 2015, and 2014, respectively, when the intangible asset could not be recovered by projected cash flows.
Overall
The Company will continue to evaluate initiatives to improve performance and lower operating costs. To the extent that forward-looking sales and operating assumptions are not achieved and are subsequently reduced, or in certain circumstances, even if performance is as anticipated, additional impairment charges may result. However, at the end of 2016, the impairment analysis reflects the Company’s best estimate of future performance.
34
Table of Contents
Merger, restructuring and other operating (income) expenses, net
The table below summarizes the major components of Merger, restructuring and other operating (income) expenses, net.
| (In millions) | 2016 | 2015 | 2014 | |||||||||
| Merger expenses |
||||||||||||
| Severance, retention, and relocation |
$ | — | $ | 15 | $ | 148 | ||||||
| Transaction and integration |
37 | 81 | 124 | |||||||||
| Facility closure, contract termination, and other expenses, net |
27 | 44 | 62 | |||||||||
|
|
|
|||||||||||
| Total Merger related expenses |
64 | 140 | 334 | |||||||||
|
|
|
|||||||||||
| Staples Acquisition (income) expenses |
||||||||||||
| Retention |
15 | 65 | — | |||||||||
| Transaction |
43 | 37 | — | |||||||||
| Termination Fee |
(250 | ) | — | — | ||||||||
|
|
|
|||||||||||
| Total Staples Acquisition (income) expenses |
(192 | ) | 102 | — | ||||||||
|
|
|
|||||||||||
| Comprehensive Business Review expenses |
||||||||||||
| Severance |
22 | — | — | |||||||||
| Facility closure, contract termination, professional fees and other expenses, net |
26 | — | — | |||||||||
|
|
|
|||||||||||
| Total Comprehensive Business Review expenses |
48 | — | — | |||||||||
|
|
|
|||||||||||
| Total Merger, restructuring and other operating (income) expenses, net |
$ | (80 | ) | $ | 242 | $ | 334 | |||||
|
|
|
|||||||||||
Merger related expenses
Severance, retention, relocation in 2015 and 2014 reflect expenses incurred for the integration of staff functions and includes termination benefits for certain retail and supply chain closures. Such benefits were accrued through the anticipated facility closure date. Severance calculations considered factors such as the expected timing of store closures, terms of existing severance plans, expected employee turnover and attrition.
Transaction and integration expenses include integration-related professional fees, incremental temporary contract labor, salary and benefits for employees dedicated to Merger activity, travel costs, non-capitalizable software integration costs, and other direct costs to combine the companies. Such costs are being recognized as incurred.
Facility closure, contract termination, and other costs, net primarily relate to facility closure accruals, contract termination cost, gains and losses on asset dispositions, and accelerated depreciation. Facility closure expenses include amounts incurred by the Company to close retail stores in the United States as part of the Real Estate Strategy, as well as supply chain facilities. During 2016 and 2015, the Company recognized gains of $1 million and $36 million, respectively, from the sale of warehouse facilities that had been classified as assets held for sale. The gains are included in Merger, restructuring and other operating (income) expenses, net, as the dispositions were part of the supply chain integration associated with the Merger.
We expect that Merger-related expenses to be substantially completed in 2017.
Staples Acquisition (income) expenses
Expenses include retention accruals and transaction costs, including costs associated with regulatory filings and professional fees, offset by the Termination Fee income.
35
Table of Contents
Comprehensive Business Review expenses
Expenses associated with implementing the Comprehensive Business Review include severance, facility closure costs, contract termination, accelerated depreciation, professional fees, relocation and disposal gains and losses, as well as other costs associated with the store closures. The Company has closed 72 stores since announcing this initiative. Restructuring expenses also include severance and reorganization costs associated with reductions in staff functions that continued into the first quarter of 2017. Severance costs are being accrued through the anticipated facility closure or termination date and consider timing, terms of existing severance plans, expected employee turnover and attrition.
Refer to Note 2, “Merger, Acquisition Termination, and Restructuring Activity” in Notes to the Consolidated Financial Statements for additional information.
Legal Accrual
In June 2014, the Company participated in a non-binding, voluntary mediation in which the Company negotiated a potential settlement to resolve the Sherwin lawsuit. During 2014, the Company recorded an $81 million legal accrual which included the potential settlement, as well as attorneys’ fees and other related legal matters. On December 19, 2014, Office Depot and the plaintiffs executed a Settlement Agreement to resolve the lawsuit. Pursuant to the terms of the Settlement Agreement, the Company agreed to pay the plaintiffs $68 million to settle the matter (the “Settlement Amount”), as well as $9 million in legal fees, costs, and expenses. In exchange for, and in consideration of, the Company’s agreement to pay the Settlement Amount, the plaintiffs agreed to dismiss their action against the Company with prejudice. In February 2015, the court entered orders approving the settlement and dismissing the case with prejudice. The Settlement Amount and the related fees were paid during the second quarter of 2015.
Unallocated Costs
The Company allocates to the Divisions functional support costs that are considered to be directly or closely related to segment activity. Those allocated costs are included in the measurement of Division operating income. Other companies may charge more or less of functional support costs to their segments, and our results, therefore, may not be comparable to similarly titled measures used by other companies. The unallocated costs primarily consist of the buildings used for the Company’s corporate headquarters and personnel not directly supporting the Divisions, including certain executive, finance, audit and similar functions. Additionally, the European pension plan that has been retained by the Company, as well as certain general and administrative costs previously allocated to the International Division that have been excluded from the discontinued operations measurement, have been included in Corporate unallocated costs in all periods presented. Unallocated costs were $99 million, $101 million, and $124 million in 2016, 2015, and 2014, respectively. The decreases in 2016 and 2015 resulted primarily from synergies achieved at the corporate functional level following the Merger, including the integration of the corporate headquarters and lower software amortization, partially offset by costs associated with executive transition and $3 million of costs associated with the 53rd week in 2016.
Other Income and Expense
| (In millions) | 2016 | 2015 | 2014 | |||||||||
| Interest income |
$ | 22 | $ | 22 | $ | 22 | ||||||
| Interest expense |
(80 | ) | (91 | ) | (87 | ) | ||||||
| Loss on extinguishment of debt |
(15 | ) | — | — | ||||||||
| Other income, net |
1 | 1 | 2 | |||||||||
Interest income includes $20 million in 2016 and $21 million in 2015 and 2014, related to OfficeMax Timber Notes, including amortization of the fair value adjustment recorded in purchase accounting. Interest expense
36
Table of Contents
includes non-recourse debt interest, including amortization of the fair value adjustment recorded in purchase accounting, amounting to $19 million in 2016 and 2015 compared to $20 million in 2014, Refer to Note 6, “Timber Notes/Non-Recourse Debt,” in Notes to Consolidated Financial Statements for additional information. Interest expense in 2014 also includes a $9 million reversal of previously accrued interest expense on uncertain tax positions following resolution of the related matter.
The Company redeemed $250 million of 9.75% Senior Notes due 2019 in the third quarter of 2016. Loss on extinguishment of debt includes the early redemption premium of 4.875% of the principal amount and the current recognition of deferred debt costs. The redemption is expected to lower future annual interest expense by approximately $24 million.
Discontinued Operations
Refer to Note 3. “Discontinued Operations,” in Notes to the Consolidated Financial Statements.
Income Taxes
| (In millions) | 2016 | 2015 | 2014 | |||||||||
| Income tax expense (benefit) |
$ | (220 | ) | $ | 23 | $ | 2 | |||||
| Effective income tax rate* |
(48 | )% | 20 | % | (1 | )% | ||||||
| * | Income taxes as a percentage of income (loss) from continuing operations before income taxes. |
The decrease in income tax expense from 2015 to 2016 is primarily related to the reversal of a substantial portion of our U.S. federal and state valuation allowance. The increase in income tax expense from 2014 to 2015 is primarily related to increased profitability in the U.S. resulting in increased current tax provision. The impact of the increased profitability was partially offset by incurred charges related to certain Staples Acquisition expenses that are not deductible for tax purposes, which increased the effective tax rate for 2015. With the termination of the Staples Merger Agreement in 2016, a large portion of these expenses became deductible in 2016, resulting in a lower effective tax rate for 2016. In addition, the 2015 effective tax rate includes income tax expense on a foreign exchange gain associated with the restructuring of certain intercompany financing.
The 2014 effective tax rate is negative because we recognized tax expense in jurisdictions with pretax income but were precluded from recognizing deferred tax benefits on pretax losses in the U.S. and certain foreign jurisdictions with valuation allowances. In addition, no benefit was recognized for certain non-deductible expenses, including foreign interest expense.
Following the recognition of significant valuation allowances in 2009, we have regularly experienced substantial volatility in our effective tax rate in interim periods and across years. Because deferred income tax benefits cannot be recognized in several jurisdictions, changes in the amount, mix and timing of pretax earnings among jurisdictions can have a significant impact on the overall effective tax rate. This interim and full year volatility is likely to continue in future periods until the valuation allowances can be fully released.
The Company has significant deferred tax assets in the U.S. against which valuation allowances have been established to reduce such deferred tax assets to the amount that is more likely than not to be realized. The establishment of valuation allowances requires significant judgment and is impacted by various estimates. Both positive and negative evidence, as well as the objectivity and verifiability of that evidence, is considered in determining the appropriateness of recording a valuation allowance on deferred tax assets. An accumulation of recent pre-tax losses is considered strong negative evidence in that evaluation. As of the third quarter of 2016, the Company concluded that it was more likely than not that a benefit from a substantial portion of its U.S. federal and state deferred tax assets would be realized. This conclusion was based on a detailed evaluation of all available positive and negative evidence and the weight of such evidence, the current financial position and
37
Table of Contents
results of operations for the current and preceding years, and the expectation of continued earnings. The Company determined that approximately $382 million of its U.S. federal and state valuation allowance should be reversed in 2016.
Due to the completion of the Internal Revenue Service (“IRS”) examination for 2014, the Company’s balance of unrecognized tax benefits decreased by $4 million during 2016, which did impact income tax expense by $3 million due to an offsetting change in valuation allowance. During 2015, the IRS examination of the OfficeMax 2012 U.S. federal income tax return concluded, which resulted in a $6 million decrease in tax credit carryforwards. Such decrease had no impact on income tax expense due to an offsetting change in valuation allowance. It is not reasonably possible that certain tax positions will be resolved within the next 12 months, which would decrease the Company’s balance of unrecognized tax benefits. Additionally, the Company anticipates that it is reasonably possible that new issues will be raised or resolved by tax authorities that may require changes to the balance of unrecognized tax benefits; however, an estimate of such changes cannot reasonably be made.
Refer to Note 8, “Income Taxes,” in the Notes to Consolidated Financial Statements for additional tax discussion.
LIQUIDITY AND CAPITAL RESOURCES
Liquidity
At December 31, 2016, we had $763 million in cash and equivalents and another $1.0 billion available under the Amended Credit Agreement (as defined in Note 7, “Debt,” of the Consolidated Financial Statements) based on the December 2016 borrowing base certificate, for a total liquidity of $1.8 billion. We currently believe that our cash on hand, availability of funds under the Amended Credit Agreement, and full year cash flows generated from operations will be sufficient to fund our working capital, capital expenditures, debt repayment, common stock purchases, cash dividends on common stock, and Merger integration and restructuring expenses for at least the next twelve months.
No amounts were drawn under the Amended Credit Agreement during 2016 and there were no amounts outstanding at December 31, 2016. There were letters of credit outstanding under the Amended Credit Agreement at the end of the year totaling $83 million.
The Company was in compliance with all applicable financial covenants at December 31, 2016.
We have incurred significant expenses associated with the Merger, integration and restructuring actions and expect to incur an additional $45 million in 2017. Additionally, in August 2016, we announced plans to lower operating costs under the Comprehensive Business Review. The Company expects to deliver over $250 million in annual benefits by the end of 2018 with about half of those benefits anticipated to be realized in 2017. In addition, the Company estimates it will incur up to approximately $125 million in costs and capital expenditures to implement the cost savings programs, with the majority of those costs incurred through 2017.
In 2017, the Company expects capital expenditures to be approximately $200 million, including investments to support the Company’s critical priorities and the Store of the Future test format. These expenditures will be funded through available cash and operating cash flows.
The Company expects total sales in 2017 to be lower than 2016, primarily due to the impact of store closures, period year contract customer losses, one less selling week and continued challenging market conditions.
On May 16, 2016, Staples and Office Depot terminated the Staples Merger Agreement. Pursuant to the terms of the termination agreement, Staples paid Office Depot a Termination Fee of $250 million in cash on May 19, 2016.
38
Table of Contents
On May 27, 2016 the Board of Directors authorized a stock repurchase program of up to $100 million of our outstanding common stock, par value $0.01 per share. On July 28, 2016, the Board of Directors authorized increasing the current common stock repurchase program from $100 million to $250 million. The stock repurchase authorization permits us to repurchase stock from time-to-time through a combination of open market repurchases, privately negotiated transactions, 10b5-1 trading plans, accelerated stock repurchase transactions and/or other derivative transactions. The program extends through the end of 2018 and may be suspended or discontinued at any time. The exact number and timing of share repurchases will depend on market conditions and other factors, and will be funded through existing liquidity.
Under the $250 million stock repurchase program, during 2016, the Company purchased approximately 37 million shares at cost of $132 million As of December 31, 2016, $118 million remained available for future purchases.
In February 2017, we provided our draft working capital calculation to the Purchaser of the OD European Business and have recorded a $70 million payable as of December 31, 2016. The Purchasers has 20 days to review the draft calculation and accept or provide written notice and details of reasons for not accepting. If the parties do not agree on the amount within 15 days of that notice, the SPA provides for a dispute resolution process. If there is no dispute, the working capital payment is to be paid within 15 days of the Purchaser’s acceptance of the draft calculation.
On February 14, 2017, the Company announced that its Board of Directors declared a cash dividend on the Company’s common stock of $0.025 per share, payable on March 15, 2017, to shareholders of record at the close of business on March 3, 2017.
Cash Flows
Cash provided by (used in) operating, investing and financing activities of continuing operations is summarized as follows:
| (In millions) | 2016 | 2015 | 2014 | |||||||||
| Operating activities |
$ | 492 | $ | 138 | 93 | |||||||
| Investing activities |
(84 | ) | (58 | ) | (5 | ) | ||||||
| Financing activities |
(475 | ) | (26 | ) | 17 | |||||||
Operating Activities from Continuing Operations
During 2016, cash provided by operating activities of continuing operations was $492 million compared to $138 million during 2015. Operating activities include outflows related to Merger, restructuring, integration and Staples Acquisition activities in 2016 and 2015, as well as the receipt of the $250 million Termination Fee.
Changes in net working capital for 2016 resulted in a $279 million use of cash as compared to $303 million in 2015 and $38 million in 2014. The 2016 period includes a discretionary funding of approximately $24 million to receive trustee approval to transfer the UK pension plan retained as part of the sale of the OD European Business. After this transfer, the plan was in a $48 million net asset position at December 31, 2016. Additionally, 2016 reflects a greater decrease in inventory compared to the prior year offset by a greater decrease in accounts payable and other accrued liabilities. Fiscal year 2016 includes payment of retention awards associated with the Staples Acquisition attempt, Merger and integration-related payments, as well as accrued incentives. The working capital factors in 2015 includes $77 million settlement payment of the Legal Accrual, the payment of the 2014 accrued incentive pay, and a net use of cash in integration related activities. Additionally, inventory levels were higher at year-end 2015 when compared to the 2014 period, impacted by the supply chain integration.
The timing of changes in working capital is subject to variability during the year and across years depending on a variety of factors, including period end sales, the flow of goods, credit terms, timing of promotions, vendor
39
Table of Contents
production planning, new product introductions and working capital management. For our accounting policy on cash management, refer to Note 1, “Summary of Significant Accounting Policies,” of the Consolidated Financial Statements.
Investing Activities from Continuing Operations
Cash used in investing activities of continuing operations were $84 million and $58 million in 2016 and 2015, respectively. During 2016 and 2015, capital expenditures were $111 million and $144 million, respectively. During 2015, $9 million was used for acquisition of an interior furniture business. These outflows for 2016 and 2015 were partially offset by $27 million and $95 million, respectively, of the disposition of assets and other, primarily, the sale of warehouse facilities that previously were classified as held for sale. The use of cash in 2014 reflects $96 million of capital expenditures, partially offset by $43 million proceeds from the disposition of Grupo OfficeMax, $43 million proceeds from the sale of Boise Cascade Company common stock, and $5 million proceeds from the disposition of assets and other.
Financing Activities from Continuing Operations
Cash used in financing activities of continuing operations was $475 million in 2016 compared to $26 million in 2015. During 2016, we used $132 million to repurchase our common stock and $26 million to pay cash dividends to our shareholders. We also redeemed the $250 million, 9.75% Senior Secured Notes due in 2019. The redemption resulted in a $15 million loss on the extinguishment of debt, including $12 million of cash premium paid and $3 million in deferred debt issue costs. We also made net payments on short-and long-term debt of $49 million in 2016. During 2015, payments on short- and long-term borrowings were $32 million, partially offset by employee share-based transactions of $7 million. The 2014 source of cash resulted from net proceeds from exercise of employee share-based transactions of $39 million and proceeds from borrowings of $4 million. Payments on long and short-term borrowings were $26 million during 2014.
Discontinued Operations
Cash provided by (used in) operating, investing and financing activities of discontinued operations is summarized as follows:
| (In millions) | 2016 | 2015 | 2014 | |||||||||
| Operating activities of discontinued operations |
$ | (122 | ) | $ | (12 | ) | $ | 62 | ||||
| Investing activities of discontinued operations |
(70 | ) | (16 | ) | (22 | ) | ||||||
| Financing activities of discontinued operations |
5 | 1 | (2 | ) | ||||||||
Until individual disposal groups are sold, cash may move between discontinued operations entities and continuing operations entities. Intercompany transactions are eliminated in consolidation and balances are satisfied on or before closings.
Off-Balance Sheet Arrangements
As of December 31, 2016, we lease retail stores and other facilities and equipment under operating lease agreements, which are included in the table below. In addition, Note 15, “Commitments and Contingencies,” of the Consolidated Financial Statements describes certain of our arrangements that contain indemnifications.
40
Table of Contents
Contractual Obligations
The following table summarizes our contractual cash obligations at December 31, 2016, and the effect such obligations are expected to have on liquidity and cash flow in future periods. Some of the figures included in this table are based on management’s estimates and assumptions about these obligations, including their duration, the possibility of renewal, anticipated actions by third parties and other factors. Because these estimates and assumptions are necessarily subjective, the amounts we will actually pay in future periods may vary from those reflected in the table.
| Payments Due by Period | ||||||||||||||||||||
| (In millions) | Total | 2017 | 2018- 2019 |
2020- 2021 |
Thereafter | |||||||||||||||
| Contractual Obligations |
||||||||||||||||||||
| Recourse debt: |
||||||||||||||||||||
| Long-term debt obligations(1) |
$ | 333 | $ | 15 | $ | 30 | $ | 39 | $ | 249 | ||||||||||
| Capital lease obligations(2) |
219 | 38 | 65 | 53 | 63 | |||||||||||||||
| Non-recourse debt(3) |
868 | 40 | 80 | 748 | — | |||||||||||||||
| Operating lease obligations(4) |
1,587 | 486 | 644 | 284 | 173 | |||||||||||||||
| Purchase obligations(5) |
51 | 47 | 4 | — | — | |||||||||||||||
|
|
|
|||||||||||||||||||
| Total contractual cash obligations |
$ | 3,058 | $ | 626 | $ | 823 | $ | 1,124 | $ | 485 | ||||||||||
|
|
|
|||||||||||||||||||
| (1) | Long-term obligations consist primarily of expected payments (principal and interest) on our $186 million of revenue bonds at various interest rates. |
| (2) | The present value of these obligations is included on our Consolidated Balance Sheets. Refer to Note 7, “Debt,” of the Consolidated Financial Statements for additional information about our capital lease obligations. |
| (3) | There is no recourse against the Company on the Securitization Notes as recourse is limited to proceeds from the pledged Installment Notes receivable and underlying guaranty. The non-recourse debt remains outstanding until it is legally extinguished, which will be when paid in cash or when the Installment Notes and related guaranty is transferred to and accepted by the Securitization Note holders. Interest payments on non-recourse debt will be completely offset by interest income received on the Installment Notes. |
| (4) | The operating lease obligations presented reflect future minimum lease payments due under the non-cancelable portions of our leases, as of December 31, 2016. Some of our retail store leases require percentage rentals on sales above specified minimums and contain escalation clauses. The minimum lease payments shown in the table above do not include contingent rental expense and have not been reduced by sublease income of $31 million. Some lease agreements provide us with the option to renew the lease or purchase the leased property. Our future operating lease obligations would change if we exercised these renewal options and if we entered into additional operating lease agreements. Our operating lease obligations are described in Note 9, “Leases,” of the Consolidated Financial Statements. |
| (5) | Purchase obligations include all commitments to purchase goods or services of either a fixed or minimum quantity that are enforceable and legally binding on us that meet any of the following criteria: (1) they are non-cancelable, (2) we would incur a penalty if the agreement was cancelled, or (3) we must make specified minimum payments even if we do not take delivery of the contracted products or services. If the obligation is non-cancelable, the entire value of the contract is included in the table. If the obligation is cancelable, but we would incur a penalty if cancelled, the dollar amount of the penalty is included as a purchase obligation. |
If we can unilaterally terminate the agreement simply by providing a certain number of days notice or by paying a termination fee, we have included the amount of the termination fee or the amount that would be paid over the “notice period.” As of December 31, 2016, purchase obligations include marketing services, outsourced accounting services, certain fixed assets and software licenses, service and maintenance contracts for information technology and communication. Contracts that can be unilaterally terminated without a penalty have not been included.
41
Table of Contents
Our Consolidated Balance Sheet as of December 31, 2016 includes $361 million classified as Deferred income taxes and other long-term liabilities. Deferred income taxes and other long-term liabilities primarily consist of net long-term deferred income taxes, deferred lease credits, long-term restructuring accruals, certain liabilities under our deferred compensation plans, accruals for uncertain tax positions, and environmental accruals. Certain of these liabilities have been excluded from the above table as either the amounts are fully funded or the timing and/or the amount of any cash payment is uncertain. Refer to Note 2, “Merger, Acquisition Termination, and Restructuring Activity,” for a discussion of our restructuring accruals and Note 8, “Income Taxes,” of the Consolidated Financial Statements for additional information regarding our deferred tax positions and accruals for uncertain tax positions.
Our Consolidated Balance Sheet as of December 31, 2016 also includes $143 million of current and non-current pension and postretirement obligations, which is also excluded from the table above, as the timing of the cash payments is uncertain. Our estimate is that payments in future years will total $222 million. This estimate represents the minimum contributions required per Internal Revenue Service funding rules and the Company’s estimated future payments under pension and postretirement plans. Actuarially-determined liabilities related to pension and postretirement benefits are recorded based on estimates and assumptions. Key factors used in developing estimates of these liabilities include assumptions related to discount rates, rates of return on investments, healthcare cost trends, benefit payment patterns and other factors. Changes in assumptions related to the measurement of funded status could have a material impact on the amount reported.
In addition to the above, we have outstanding letters of credit totaling $83 million at December 31, 2016.
CRITICAL ACCOUNTING POLICIES AND ESTIMATES
Our Consolidated Financial Statements have been prepared in accordance with accounting principles generally accepted in the United States of America. Preparation of these statements requires management to make judgments and estimates. Some accounting policies and estimates have a significant impact on amounts reported in these financial statements. A summary of significant accounting policies can be found in Note 1, “Summary of Significant Accounting Policies,” of the Consolidated Financial Statements. We have also identified certain accounting policies and estimates that we consider critical to understanding our business and our results of operations and we have provided below additional information on those policies. No significant changes have been made during 2016 to the methodologies used in preparing the estimates discussed below.
Vendor arrangements — Inventory purchases from vendors are generally under arrangements that automatically renew until cancelled with periodic updates or annual negotiated agreements. Many of these arrangements require the vendors to make payments to us or provide credits to be used against purchases if and when certain conditions are met. We refer to these arrangements as “vendor programs.” Vendor programs fall into two broad categories, with some underlying sub-categories. The first category is volume-based rebates. Under those arrangements, our product costs per unit decline as higher volumes of purchases are reached. Current accounting rules provide that companies with a reasonable basis for estimating their full year purchases, and therefore the ultimate rebate level, can use that estimate to value inventory and cost of goods sold throughout the year. We believe our history of purchases with many vendors provides us with a basis for our estimates of purchase volume. If the anticipated volume of purchases is not reached, however, or if we form the belief at any point in the year that it is not likely to be reached, cost of goods sold and the remaining inventory balances are adjusted to reflect that change in our outlook. We review sales projections and related purchases against vendor program estimates at least quarterly and adjust these balances accordingly.
The second broad category of arrangements with our vendors is event-based programs. These arrangements can take many forms, including advertising support, special pricing offered by certain of our vendors for a limited time, payments for special placement or promotion of a product, reimbursement of costs incurred to launch a vendor’s product, and various other special programs. These payments are classified as a reduction of costs of goods sold or inventory, based on the nature of the program and the sell-through of the inventory. Some arrangements may meet the specific, incremental, identifiable cost criteria that allow for direct operating expense offset, but such arrangements are not significant.
42
Table of Contents
Vendor programs are recognized throughout the year based on judgment and estimates and amounts due from vendors are generally settled throughout the year based on purchase volumes. The final amounts due from vendors are generally known soon after year-end. Substantially all vendor program receivables outstanding at the end of the year are settled within the three months following year-end. We believe that our historical collection rates of these receivables provide a sound basis for our estimates of anticipated vendor payments throughout the year.
Long-lived asset impairments — Long-lived assets with identifiable cash flows are reviewed for possible impairment whenever events or changes in circumstances indicate that the carrying amount of such assets may not be recoverable. We access recovery of the asset or asset groups using estimates of cash flows directly associated with the future use and eventual disposition of the asset or asset groups. If undiscounted cash flows are insufficient to recover the asset, impairment is measured as the difference between the asset’s estimated fair value (generally, the discounted cash flows or its salvage value) and its carrying value, and any costs of disposition. Factors that could trigger an impairment assessment include, among others, a significant change in the extent or manner in which an asset is used or the business climate that could affect the value of the asset. As restructuring activities continue, the Company may identify assets or asset groups for sale or abandonment and incur impairment charges.
Because of the period of declining sales and following identification in 2014 of the Real Estate Strategy and subsequently in 2016 the Comprehensive Business Review, store assets have been reviewed periodically throughout the year for recoverability of their asset carrying amounts. The frequency of this test may change in future periods if performance warrants. The analysis uses input from retail store operations and the Company’s accounting and finance personnel that organizationally report to the chief financial officer. These projections are based on management’s estimates of store-level sales, gross margins, direct expenses, and resulting cash flows and, by their nature, include judgments about how current initiatives will impact future performance. If the anticipated cash flows of a store cannot support the carrying value of its assets, the assets are written down to estimated fair value. Store asset impairment charges of $8 million, $12 million and $26 million for 2016, 2015 and 2014, respectively, are included in Asset impairments in the Consolidated Statements of Operations. Based on the fourth quarter 2016 analysis, a 100 basis point further decrease in next year sales, combined with a 50 basis point decrease in gross margin from the rates utilized in our analysis, would have increased the impairment charge by $2 million. Further, a 100 basis point decrease in sales for all periods would have increased the impairment charge by $5 million.
Important assumptions used in these projections include an assessment of future overall economic conditions, our ability to control future costs, maintain aspects of positive performance, and successfully implement initiatives designed to enhance sales and gross margins. To the extent that management’s estimates of future performance are not realized, future assessments could result in material impairment charges.
Goodwill and other intangible assets — Indefinite-lived intangible assets, such as goodwill, are tested at least annually for impairment and definite-lived intangible assets are reviewed to ensure the remaining useful lives are appropriate. An impairment analysis may be conducted between annual tests if events or circumstances suggest an intangible asset may not be recoverable.
The Company elected to perform its 2016 goodwill impairment test using a quantitative discounted cash flow analysis supplemented with market comparison data. Goodwill at one reporting unit included in discontinued operations was fully impaired based on this analysis. However, the estimated fair value of each reporting unit in continuing operations substantially exceeded its carrying value at the test date, which was the first day of the third quarter.
Other intangible assets primarily include favorable lease assets and customer relationship values. The favorable lease assets were established in the Merger for individual leases with rental rates below current market rates for comparable properties and assumed renewal of all available options. The favorable lease assets are being
43
Table of Contents
amortized over the same periods. Should the Company decide to close a facility prior to the full contemplated term, recovery of the intangible asset will be subject to then-current sublease prospects. During 2016, the Company recognized $7 million of impairment of favorable lease assets because of closure activity.
At December 31, 2016, the net carrying amount of customer relationships in the North America contract channel totaled $21 million, primarily related to the Merger. The original valuation assumed continuation of attrition rates previously experienced with the contract business and synergy benefits from the Merger. If the Company experiences an unanticipated decline in sales or profitability associated with these customers, the remaining useful life will be reassessed and either acceleration of amortization or impairment could result. Additionally, intangible assets associated with favorable lease agreements at the Merger date totaled $12 million at December 31, 2016. To the extent the Company decides to close these locations prior to the end of the lease term and suitable sublease arrangements are not secured, these assets may be impaired in future periods. The Company regularly reviews these assets for either acceleration of amortization or impairment.
Closed store accruals — During 2014, the Company developed the Real Estate Strategy that included closing of at least 400 retail stores in the United States through 2016. During the third quarter of 2016, we announced the Comprehensive Business Strategy which includes closing an additional 300 retail store locations through 2018. At the point of closure, we recognize a liability for the remaining costs related to the property, reduced by an estimate of any sublease income. The calculation of this liability requires us to make assumptions and to apply judgment regarding the remaining term of the lease (including vacancy period), anticipated sublease income, and costs associated with vacating the premises. Lease commitments with no economic benefit to the Company are discounted at the credit-adjusted discount rate at the time of each location closure. With assistance from independent third parties to assess market conditions, we periodically review these judgments and estimates and adjust the liability accordingly. Future fluctuations in the economy and the market demand for commercial properties could result in material changes in this liability.
Costs associated with facility closures that are related to Merger and restructuring activities are presented in Merger, restructuring and other operating activities, net in our Consolidated Statements of Operations. Costs associated with facility closures that are deemed operational are included in Selling, general and administrative expenses.
Income taxes — Income tax accounting requires management to make estimates and apply judgments to events that will be recognized in one period under rules that apply to financial reporting and in a different period in our tax returns. In particular, judgment is required when estimating the value of future tax deductions, tax credits, and the realizability of net operating loss carryforwards (NOLs), as represented by deferred tax assets. When we believe the realization of all or a portion of a deferred tax asset is not likely, we establish a valuation allowance. Changes in judgments that increase or decrease these valuation allowances impact current earnings. The Company has significant deferred tax assets in the U.S. against which valuation allowances have been established to reduce such deferred tax assets to the amount that is more likely than not to be realized. The establishment of valuation allowances requires significant judgment and is impacted by various estimates. Both positive and negative evidence, as well as the objectivity and verifiability of that evidence, is considered in determining the appropriateness of recording a valuation allowance on deferred tax assets. An accumulation of recent pre-tax losses is considered strong negative evidence in that evaluation. As of the third quarter of 2016, the Company concluded that it was more likely than not that a benefit from a substantial portion of its U.S. federal and state deferred tax assets would be realized. This conclusion was based on a detailed evaluation of all available positive and negative evidence and the weight of such evidence, the current financial position and results of operations for the current and preceding years, and the expectation of continued earnings. The Company determined that approximately $382 million of its U.S. federal and state valuation allowance should be reversed in 2016. The remaining change in valuation allowance was offset by changes in the uncertain tax positions.
In addition to judgments associated with valuation allowances, our current tax provision can be affected by our mix of income and identification or resolution of uncertain tax positions. Because income from domestic and
44
Table of Contents
international sources may be taxed at different rates, the shift in mix during a year or over years can cause the effective tax rate to change. We base our rate during the year on our best estimate of an annual effective rate, and update that estimate quarterly, with the cumulative effect of a change in the anticipated annual rate reflected in the tax provision of that period. Such changes can result in significant interim reporting volatility. This volatility can result from changes in our projected earnings levels, the mix of income, the impact of valuation allowances in certain jurisdictions and the interim accounting rules applied to entities expected to pay taxes on a full year basis, but recognizing losses in an interim period.
SIGNIFICANT TRENDS, DEVELOPMENTS AND UNCERTAINTIES
Competitive Factors — Over the years, we have seen continued development and growth of competitors in all segments of our business. In particular, mass merchandisers and warehouse clubs, as well as grocery and drugstore chains, have increased their assortment of home office merchandise, attracting additional back-to-school customers and year-round casual shoppers. Warehouse clubs have expanded beyond their in-store assortment by adding catalogs and websites from which a much broader assortment of products may be ordered. We also face competition from other office supply stores that compete directly with us in numerous markets. This competition is likely to result in increased competitive pressures on pricing, product selection and services provided. Many of these retail competitors, including discounters, warehouse clubs, and drug stores and grocery chains, carry basic office supply products. Some of them also feature technology products. Many of them may price certain of these offerings lower than we do, but they have not shown an indication of greatly expanding their somewhat limited product offerings at this time. This trend towards a proliferation of retailers offering a limited assortment of office products is a potentially serious trend in our industry that could shift purchasing away from office supply specialty retailers and adversely impact our results.
We have seen substantial growth in the number of competitors that offer office products over the internet, as well as the breadth and depth of their product offerings. In addition to large numbers of smaller internet providers featuring special price incentives and one-time deals (such as close-outs), we are experiencing strong competitive pressures from large internet providers such as Amazon and Walmart that offer a full assortment of office products through direct sales and, in the case of Amazon, acting as a “storefront” for other specialty office product providers. Another trend in our industry has been consolidation, as competitors in office supply stores and the copy/print channel have been acquired and consolidated into larger, well-capitalized corporations. This trend towards consolidation, coupled with acquisitions by financially strong organizations, is potentially a significant trend in our industry that could impact our results.
Additionally, consumers are utilizing more technology and purchasing less paper, ink and toner, physical file storage and general office supplies.
We regularly consider these and other competitive factors when we establish both offensive and defensive aspects of our overall business strategy and operating plans.
Economic Factors — Our customers in the North American Retail Division and certain of our customers in the North American Business Solutions Division are predominantly small and home office businesses. Accordingly, spending by these customers is affected by macroeconomic conditions, such as changes in the housing market and commodity costs, credit availability and other factors. The downturn in the global economy experienced in recent years negatively impacted our sales and profits.
Liquidity Factors — Our cash flow from operating activities, available cash and cash equivalents, and access to broad financial markets provides the liquidity we need to operate our business and fund integration and restructuring activities. Together, these sources have been used to fund operating and working capital needs, as well as invest in business expansion through new store openings, capital improvements and acquisitions. We have in place a $1.2 billion asset based credit facility to provide liquidity, subject to availability as specified in the agreement.
45
Table of Contents
MARKET SENSITIVE RISKS AND POSITIONS
We have adopted an enterprise risk management process patterned after the principles set out by the Committee of Sponsoring Organizations (COSO). Management utilizes a common view of exposure identification and risk management. A process is in place for periodic risk reviews and identification of appropriate mitigation strategies.
We have market risk exposure related to interest rates, foreign currency exchange rates, and commodities. Market risk is measured as the potential negative impact on earnings, cash flows or fair values resulting from a hypothetical change in interest rates or foreign currency exchange rates over the next year. Interest rate changes on obligations may result from external market factors, as well as changes in our credit rating. We manage our exposure to market risks at the corporate level. The portfolio of interest-sensitive assets and liabilities is monitored to provide liquidity necessary to satisfy anticipated short-term needs. Our risk management policies allow the use of specified financial instruments for hedging purposes only; speculation on interest rates, foreign currency rates, or commodities is not permitted.
Interest Rate Risk
We are exposed to the impact of interest rate changes on cash, cash equivalents, debt obligations, and defined benefit pension and other postretirement plans.
The impact on cash and cash equivalents held at December 31, 2016 from a hypothetical 10% decrease in interest rates would be a decrease in interest income of less than $1 million.
46
Table of Contents
The following table provides information about our debt portfolio outstanding as of December 31, 2016, that is sensitive to changes in interest rates. The following table does not include our obligations for pension plans and other postretirement benefits, although market risk also arises within our defined benefit pension plans to the extent that the obligations of the pension plans are not fully matched by assets with determinable cash flows. We sponsor U.S. defined benefit pension plans covering certain terminated employees, vested employees, retirees, and some active employees. These plans were acquired in the Merger transaction and had been frozen since 2004. Our active employees and all inactive participants who are covered by these plans are no longer accruing additional benefits. However, the pension plans obligations are still subject to change due to fluctuations in long-term interest rates as well as factors impacting actuarial valuations, such as retirement rates and pension plan participants’ increased life expectancies. In addition to changes in pension plan obligations, the amount of plan assets available to pay benefits, contribution levels and expense are also impacted by the return on the pension plan assets. The pension plan assets include U.S. equities, international equities, global equities and fixed-income securities, the cash flows of which change as equity prices and interest rates vary. The risk is that market movements in equity prices and interest rates could result in assets that are insufficient over time to cover the level of projected obligations. This in turn could result in significant changes in pension expense and funded status, further impacting future required contributions. Management, together with the trustees who act on behalf of the pension plan beneficiaries, assess the level of this risk using reports prepared by independent external actuaries and investment advisors and take action, where appropriate, in terms of setting investment strategy and agreed contribution levels. In addition, as part of the disposition of the OD European Business, we retained the frozen defined pension covering a limited number of employees in Europe. This plan is in a net funded position at December 31, 2016 but is subject to risks similar to those discussed above with regard to the U.S. defined benefit plan.
| 2016 | 2015 | |||||||||||||||||||||||
| (In millions) | Carrying Value |
Fair Value |
Risk Sensitivity |
Carrying Value |
Fair Value |
Risk Sensitivity |
||||||||||||||||||
| Financial assets: |
||||||||||||||||||||||||
| Timber notes receivable |
$ | 885 | $ | 884 | $ | 13 | $ | 905 | $ | 909 | $ | 17 | ||||||||||||
| Financial liabilities: |
||||||||||||||||||||||||
| Recourse debt: |
||||||||||||||||||||||||
| Senior Secured Notes, due 2019 |
$ | — | $ | — | $ | — | $ | 250 | $ | 265 | $ | 4 | ||||||||||||
| 7.35% debentures, due 2016 |
$ | — | $ | — | $ | — | $ | 18 | $ | 18 | $ | — | ||||||||||||
| Revenue bonds, due in varying amounts periodically through 2029 |
$ | 186 | $ | 181 | $ | 6 | $ | 186 | $ | 186 | $ | 6 | ||||||||||||
| American & Foreign Power Company, Inc. 5% debentures, due 2030 |
$ | 14 | $ | 12 | $ | 1 | $ | 14 | $ | 13 | $ | 1 | ||||||||||||
| Non-recourse debt |
$ | 798 | $ | 800 | $ | 11 | $ | 819 | $ | 825 | $ | 15 | ||||||||||||
The risk sensitivity of fixed rate debt reflects the estimated increase in fair value from a 50 basis point decrease in interest rates, calculated on a discounted cash flow basis. The sensitivity of variable rate debt reflects the possible increase in interest expense during the next period from a 50 basis point change in interest rates prevailing at year-end.
Foreign Exchange Rate Risk
We conduct business through entities in Canada where their functional currency is the Canadian dollar. We continue to assess our exposure to foreign currency fluctuations against the U.S. dollar. As of December 31, 2016, a 10% change in the applicable foreign exchange rates would have resulted in an increase or decrease in our pretax earnings of $1 million.
47
Table of Contents
Commodities Risk
We operate a large network of stores and delivery centers. As such, we purchase fuel needed to transport products to our stores and customers as well as pay shipping costs to import products from overseas. We are exposed to potential changes in the underlying commodity costs associated with this transport activity.
We enter into economic hedge transactions for a portion of our anticipated fuel consumption. These arrangements are marked to market at each reporting period. Some of these arrangements may not be designated as hedges for accounting purposes and changes in value are recognized in current earnings through the Cost of goods sold and occupancy costs line on the Consolidated Statements of Operations. Those that are designated as hedges for accounting purposes are also marked to market at each reporting period, with the change in value deferred in accumulated other comprehensive income until the related fuel is consumed. At December 31, 2016, we had entered into contracts for approximately 2 million gallons of fuel that will be settled in January 2017. Currently, these economic hedging transactions are not considered material. As of December 31, 2016, excluding the impact of any hedge transaction, a 10% change in domestic commodity costs would have resulted in an increase or decrease in our operating profit of less than $1 million.
INFLATION AND SEASONALITY
Although we cannot determine the precise effects of inflation on our business, we do not believe inflation has had a material impact on our sales or the results of our operations. We consider our business to be somewhat seasonal, with sales generally trending lower in the second quarter, following the “back-to-business” sales cycle in the first quarter and preceding the “back-to-school” sales cycle in the third quarter and the holiday sales cycle in the fourth quarter. Certain working capital components may build and recede during the year reflecting established selling cycles. Business cycles can and have impacted our operations and financial position when compared to other periods.
NEW ACCOUNTING STANDARDS
In May 2014, the Financial Accounting Standards Board (the “FASB”) issued an accounting standards update that supersedes most current revenue recognition guidance and modifies the accounting for certain costs associated with revenue generation. The core principle of this guidance is that an entity should recognize revenue to depict the transfer of promised goods or services to customers in an amount that reflects the consideration to which the entity expects to be entitled in exchange for those goods or services. The guidance provides a number of steps to apply to achieve that principle and requires additional disclosures. The standard was originally to be effective for the Company’s first quarter of 2017. In July 2015, the FASB approved a one year extension to the required implementation date but also permitted companies to adopt the standard at the original effective date of 2017. Adoption before the original effective date of 2017 is not permitted. The new standard may be applied retrospectively to each prior period presented or retrospectively with a cumulative effect recognized as of the date of adoption.
The Company continues to assess the impact this new standard will have on its Consolidated Financial Statements and has not yet decided on which adoption alternative to apply upon adoption in the first quarter of 2018. Based on its ongoing assessment, the Company expects that the new standard will at least impact the following areas:
| • | the loyalty programs will be presented as a reduction of revenue, rather than as cost accruals as is permitted under existing accounting rules; |
| • | costs associated with product catalogs will be expensed as incurred, rather than capitalized and amortized over the anticipated benefit period; |
48
Table of Contents
| • | the timing of revenue recognition will be accelerated for items where the Company’s performance obligation is complete, such as certain commission arrangements, and delayed where performance obligations remain, such as certain coupons and incentives offered from time-to-time. |
The Company has not yet quantified these expected impacts; however, the loyalty program charged to cost of goods sold in 2016 were approximately $60 million and would lower sales under the new standard by approximately $75 million, with approximately 75% related to retail sales and the remainder direct channel sales. The potential timing impacts of the change in expense recognition for catalog costs would impact the North America Business Solutions Division.
In February 2016, the FASB issued an accounting standards update which will require lessees to recognize most leases on their balance sheets related to the rights and obligations created by those leases. The accounting treatment for lessors will remain relatively unchanged. The accounting standards update also requires additional qualitative and quantitative disclosures related to the nature, timing and uncertainty of cash flows arising from leases. The guidance is effective for fiscal years beginning after December 15, 2018, and interim periods within those fiscal years. Early adoption is permitted. Lessees and lessors are required to use a modified retrospective transition method for existing leases and accordingly, apply the new accounting model for the earliest year presented in the financial statements. The Company is currently evaluating the impact the adoption of this new standard will have on its Consolidated Financial Statements but anticipates it will result in significant right of use assets and related liabilities associated with our operating leases. Substantially all of the Company’s retail store locations and supply chain facilities are subject to operating lease arrangements. The Company has not yet decided on the period of adoption. Refer to Note 7, “Debt,” and Note 9, “Leases,” of the Consolidated Financial Statements for additional information.
In March 2016, the FASB issued an accounting standards update as part of its simplification initiative. The new standard will modify several aspects of the accounting and reporting for employee share-based payments and related tax accounting impacts, including the presentation in the statements of operations and cash flows of certain tax benefits or deficiencies and employee tax withholdings, as well as the accounting for award forfeitures over the vesting period. The new standard is effective for fiscal years beginning after December 15, 2016 and interim periods within those fiscal years. The Company anticipates the new standard will result in volatility to income tax expense upon the prospective recognition of excess tax benefit and tax deficiency related to share-based payments. Prior period amounts associated with these components have not been significant; however, similar future period impacts cannot be assured.
Item 7A. Quantitative and Qualitative Disclosures About Market Risk.
Refer to information in the “Market Sensitive Risks and Positions” subsection of Part II — Item 7. “MD&A” of this Annual Report.
Item 8. Financial Statements and Supplementary Data.
Refer to Part IV — Item 15(a) of this Annual Report.
Item 9. Changes in and Disagreements with Accountants on Accounting and Financial Disclosure.
None.
Item 9A. Controls and Procedures.
Disclosure Controls and Procedures
Based on management’s evaluation which included the participation of the Company’s Chief Executive Officer (“CEO”) and Chief Financial Officer (“CFO”), as of December 31, 2016, the Company’s CEO and CFO
49
Table of Contents
concluded that the Company’s disclosure controls and procedures (as defined in Rules 13a-15(e) and 15d-15(e) under the Securities Exchange Act of 1934, as amended (“the Act”)), were effective to provide reasonable assurance that information required to be disclosed by the Company in reports that the Company files or submits under the Act is recorded, processed, summarized and reported within the time periods specified in SEC rules and forms and that such information is accumulated and communicated to the Company’s management, including the CEO and CFO, to allow timely decisions regarding required disclosures.
Changes in Internal Controls
There have been no changes in the Company’s internal control over financial reporting that occurred during the Company’s most recent fiscal quarter that have materially affected, or are reasonably likely to materially affect, the Company’s internal control over financial reporting.
Management’s Report on Internal Control Over Financial Reporting
Management of Office Depot is responsible for establishing and maintaining adequate internal control over financial reporting as defined in Rule 13a-15(f) under the Act. Our Internal Control structure is designed to provide reasonable assurance to our management and the Board of Directors regarding the reliability of financial reporting and the preparation and fair presentation of published financial statements.
Because of inherent limitations, internal control over financial reporting may not prevent or detect misstatements. Projections of any evaluation of effectiveness to future periods are subject to the risks that controls may become inadequate because of changes in conditions, or that the degree of compliance with the policies or procedures may deteriorate.
In evaluating our Internal Control, we used the criteria set forth by the Committee of Sponsoring Organizations of the Treadway Commission (COSO) in Internal Control — Integrated Framework (2013). Based on our assessment, management has concluded that the Company’s internal control over financial reporting was effective as of December 31, 2016.
Our internal control over financial reporting as of December 31, 2016, has been audited by Deloitte & Touche LLP, an independent registered public accounting firm, as stated in their report provided below.
50
Table of Contents
REPORT OF INDEPENDENT REGISTERED PUBLIC ACCOUNTING FIRM
To the Board of Directors and Stockholders of
Office Depot, Inc.
Boca Raton, Florida
We have audited the internal control over financial reporting of Office Depot, Inc. and subsidiaries (the “Company”) as of December 31, 2016, based on criteria established in Internal Control-Integrated Framework (2013) issued by the Committee of Sponsoring Organizations of the Treadway Commission. The Company’s management is responsible for maintaining effective internal control over financial reporting and for its assessment of the effectiveness of internal control over financial reporting, included in the accompanying Management’s Report on Internal Control Over Financial Reporting. Our responsibility is to express an opinion on the Company’s internal control over financial reporting based on our audit.
We conducted our audit in accordance with the standards of the Public Company Accounting Oversight Board (United States). Those standards require that we plan and perform the audit to obtain reasonable assurance about whether effective internal control over financial reporting was maintained in all material respects. Our audit included obtaining an understanding of internal control over financial reporting, assessing the risk that a material weakness exists, testing and evaluating the design and operating effectiveness of internal control based on the assessed risk, and performing such other procedures as we considered necessary in the circumstances. We believe that our audit provides a reasonable basis for our opinion.
A company’s internal control over financial reporting is a process designed by, or under the supervision of, the company’s principal executive and principal financial officers, or persons performing similar functions, and effected by the company’s board of directors, management, and other personnel to provide reasonable assurance regarding the reliability of financial reporting and the preparation of financial statements for external purposes in accordance with generally accepted accounting principles. A company’s internal control over financial reporting includes those policies and procedures that (1) pertain to the maintenance of records that, in reasonable detail, accurately and fairly reflect the transactions and dispositions of the assets of the company; (2) provide reasonable assurance that transactions are recorded as necessary to permit preparation of financial statements in accordance with generally accepted accounting principles, and that receipts and expenditures of the company are being made only in accordance with authorizations of management and directors of the company; and (3) provide reasonable assurance regarding prevention or timely detection of unauthorized acquisition, use, or disposition of the company’s assets that could have a material effect on the financial statements.
Because of the inherent limitations of internal control over financial reporting, including the possibility of collusion or improper management override of controls, material misstatements due to error or fraud may not be prevented or detected on a timely basis. Also, projections of any evaluation of the effectiveness of the internal control over financial reporting to future periods are subject to the risk that the controls may become inadequate because of changes in conditions, or that the degree of compliance with the policies or procedures may deteriorate.
In our opinion, the Company maintained, in all material respects, effective internal control over financial reporting as of December 31, 2016, based on the criteria established in Internal Control-Integrated Framework (2013) issued by the Committee of Sponsoring Organizations of the Treadway Commission.
We have also audited, in accordance with the standards of the Public Company Accounting Oversight Board (United States), the consolidated financial statements as of and for the fiscal year ended December 31, 2016 of the Company and our report dated March 1, 2017 expressed an unqualified opinion on those financial statements.
/s/ DELOITTE & TOUCHE LLP
Certified Public Accountants
Boca Raton, Florida
March 1, 2017
51
Table of Contents
Item 10. Directors, Executive Officers and Corporate Governance.
Information concerning our executive officers is set forth in Part 1 — Item 1. “Business” of this Annual Report under the caption “Executive Officers of the Registrant.”
Information required by this item with respect to our directors and the nomination process will be contained under the heading “Election of Directors” in the proxy statement for our 2017 Annual Meeting of Shareholders to be filed with the SEC (the “Proxy Statement”) within 120 days after the end of our fiscal year, which information is incorporated by reference in this Annual Report.
Information required by this item with respect to our audit committee and our audit committee financial experts will be contained in the Proxy Statement under the heading “Committees of Our Board of Directors — Audit Committee” and is incorporated by reference in this Annual Report.
Information required by this item with respect to compliance with Section 16(a) of the Exchange Act will be contained in the Proxy Statement under the heading “Section 16(a) Beneficial Ownership Reporting Compliance” and is incorporated by reference in this Annual Report.
Our Code of Ethical Behavior is in compliance with applicable rules of the SEC that apply to our principal executive officer, our principal financial officer, and our principal accounting officer or controller, or persons performing similar functions. A copy of the Code of Ethical Behavior is available free of charge on the “Investor Relations” section of our website at www.officedepot.com. We intend to satisfy any disclosure requirement under Item 5.05 of Form 8-K regarding an amendment to, or waiver from, a provision of this Code of Ethical Behavior by posting such information on our website at the address and location specified above.
Item 11. Executive Compensation.
Information required by this item with respect to executive compensation and director compensation will be contained in the Proxy Statement under the headings “Compensation Discussion & Analysis” and “Director Compensation,” respectively, and is incorporated by reference in this Annual Report.
The information required by this item with respect to compensation committee interlocks and insider participation will be contained in the Proxy Statement under the heading “Compensation Committee Interlocks and Insider Participation” and is incorporated by reference in this Annual Report.
The compensation committee report required by this item will be contained in the Proxy Statement under the heading “Compensation Committee Report” and is incorporated by reference in this Annual Report.
The information required by this item with respect to compensation policies and practices as they relate to the Company’s risk management will be contained in the Proxy Statement under the heading “Board of Directors’ Role in Risk Oversight” and is incorporated by reference in this Annual Report.
Item 12. Security Ownership of Certain Beneficial Owners and Management and Related Stockholder Matters.
Information required by this item with respect to securities authorized for issuance under the Company’s equity compensation plans is contained in the Proxy Statement under the heading “Equity Compensation Plan Information” and is incorporated herein by reference in this Annual Report.
Information required by this item with respect to security ownership of certain beneficial owners and management will be contained in the Proxy Statement under the heading “Stock Ownership Information” and is incorporated by reference in this Annual Report.
52
Table of Contents
Item 13. Certain Relationships and Related Transactions, and Director Independence.
Information required by this item with respect to such contractual relationships and director independence will be contained in the Proxy Statement under the headings “Related Person Transactions Policy” and “Director Independence,” respectively, and is incorporated by reference in this Annual Report.
Item 14. Principal Accountant Fees and Services.
Information with respect to principal accounting fees and services and pre-approval policies will be contained in the Proxy Statement under the headings “Audit & Other Fees” and “Audit Committee Pre-Approval Policies and Procedures” respectively, and is incorporated by reference in this Annual Report.
53
Table of Contents
Item 15. Exhibits and Financial Statement Schedules.
| (a) | The following documents are filed as a part of this report: |
| 1. | The financial statements listed in “Index to Financial Statements.” |
| 2. | All other financial statements are omitted because the required information is not applicable, or because the information is included in the “Consolidated Financial Statements or the Notes to the Consolidated Financial Statements.” |
| 3. | The exhibits listed in “Index to Exhibits.” |
None.
54
Table of Contents
Pursuant to the requirements of Section 13 or 15(d) of the Securities Exchange Act of 1934, the registrant has duly caused this report to be signed on its behalf by the undersigned, thereunto duly authorized on this 1st day of March 2017.
| OFFICE DEPOT, INC. | ||
| By: | /s/ GERRY P. SMITH | |
| Gerry P. Smith | ||
| Chief Executive Officer | ||
Pursuant to the requirements of the Securities Exchange Act of 1934, this report has been signed below by the following persons on behalf of the registrant in the capacities indicated on March 1, 2017.
| Signature | Capacity | |
| /s/ GERRY P. SMITH Gerry P. Smith |
Chief Executive Officer (Principal Executive Officer) | |
| /s/ STEPHEN E. HARE Stephen E. Hare |
Executive Vice President and Chief Financial Officer (Principal Financial Officer) | |
| /s/ KIM MOEHLER Kim Moehler |
Senior Vice President and Chief Accounting Officer (Principal Accounting Officer) | |
| /s/ JOSEPH S. VASSALLUZZO Joseph S. Vassalluzzo |
Chairman, Board of Directors | |
| /s/ WARREN BRYANT Warren Bryant |
Director | |
| /s/ KRISTIN A. CAMPBELL Kristin A. Campbell |
Director | |
| /s/ RAKESH GANGWAL Rakesh Gangwal |
Director | |
| /s/ CYNTHIA T. JAMISON Cynthia T. Jamison |
Director | |
| /s/ FRANCESCA RUIZ DE LUZURIAGA Francesca Ruiz de Luzuriaga |
Director | |
| /s/ V. JAMES MARINO V. James Marino |
Director | |
| /s/ MICHAEL J. MASSEY Michael J. Massey |
Director | |
| /s/ DAVID M. SZYMANSKI David M. Szymanski |
Director | |
| /s/ NIGEL TRAVIS Nigel Travis |
Director | |
55
Table of Contents
| Page | ||
| 57 | ||
| 58 | ||
| 59 | ||
| 60 | ||
| 61 | ||
| 62 | ||
| 63 |
56
Table of Contents
REPORT OF INDEPENDENT REGISTERED PUBLIC ACCOUNTING FIRM
To the Board of Directors and Stockholders of
Office Depot, Inc.
Boca Raton, Florida
We have audited the accompanying consolidated balance sheets of Office Depot, Inc. and subsidiaries (the “Company”) as of December 31, 2016 and December 26, 2015, and the related consolidated statements of operations, comprehensive income (loss), stockholders’ equity, and cash flows for each of the three fiscal years in the period ended December 31, 2016. These financial statements are the responsibility of the Company’s management. Our responsibility is to express an opinion on these financial statements based on our audits.
We conducted our audits in accordance with the standards of the Public Company Accounting Oversight Board (United States). Those standards require that we plan and perform the audit to obtain reasonable assurance about whether the financial statements are free of material misstatement. An audit includes examining, on a test basis, evidence supporting the amounts and disclosures in the financial statements. An audit also includes assessing the accounting principles used and significant estimates made by management, as well as evaluating the overall financial statement presentation. We believe that our audits provide a reasonable basis for our opinion.
In our opinion, such consolidated financial statements present fairly, in all material respects, the financial position of Office Depot, Inc. and subsidiaries as of December 31, 2016 and December 26, 2015, and the results of their operations and their cash flows for each of the three fiscal years in the period ended December 31, 2016, in conformity with accounting principles generally accepted in the United States of America.
We have also audited, in accordance with the standards of the Public Company Accounting Oversight Board (United States), the Company’s internal control over financial reporting as of December 31, 2016, based on the criteria established in Internal Control-Integrated Framework (2013) issued by the Committee of Sponsoring Organizations of the Treadway Commission and our report dated March 1, 2017 expressed an unqualified opinion on the Company’s internal control over financial reporting.
/s/ DELOITTE & TOUCHE LLP
Certified Public Accountants
Boca Raton, Florida
March 1, 2017
57
Table of Contents
CONSOLIDATED STATEMENTS OF OPERATIONS
(In millions, except per share amounts)
| 2016 | 2015 | 2014 | ||||||||||
| Sales |
$ | 11,021 | $ | 11,727 | $ | 12,710 | ||||||
| Cost of goods sold and occupancy costs |
8,313 | 8,864 | 9,734 | |||||||||
|
|
|
|||||||||||
| Gross profit |
2,708 | 2,863 | 2,976 | |||||||||
| Selling, general and administrative expenses |
2,242 | 2,425 | 2,733 | |||||||||
| Asset impairments |
15 | 13 | 56 | |||||||||
| Merger, restructuring, and other operating (income) expenses, net |
(80 | ) | 242 | 334 | ||||||||
| Legal accrual |
— | — | 81 | |||||||||
|
|
|
|||||||||||
| Operating income (loss) |
531 | 183 | (228 | ) | ||||||||
| Other income (expense): |
||||||||||||
| Interest income |
22 | 22 | 22 | |||||||||
| Interest expense |
(80 | ) | (91 | ) | (87 | ) | ||||||
| Loss on extinguishment of debt |
(15 | ) | — | — | ||||||||
| Other income, net |
1 | 1 | 2 | |||||||||
|
|
|
|||||||||||
| Income (loss) from continuing operations before income taxes |
459 | 115 | (291 | ) | ||||||||
| Income tax expense (benefit) |
(220 | ) | 23 | 2 | ||||||||
|
|
|
|||||||||||
| Net income (loss) from continuing operations |
679 | 92 | (293 | ) | ||||||||
| Discontinued operations, net of tax |
(150 | ) | (84 | ) | (59 | ) | ||||||
|
|
|
|||||||||||
| Net income (loss) |
529 | 8 | (352 | ) | ||||||||
| Less: Results attributable to the noncontrolling interests |
— | — | 2 | |||||||||
|
|
|
|||||||||||
| Net income (loss) attributable to Office Depot, Inc. |
$ | 529 | $ | 8 | $ | (354 | ) | |||||
|
|
|
|||||||||||
| Basic earnings(loss) per common share |
||||||||||||
| Continuing operations |
$ | 1.26 | $ | 0.17 | $ | (0.55 | ) | |||||
| Discontinued operations |
(0.28 | ) | (0.15 | ) | (0.11 | ) | ||||||
|
|
|
|||||||||||
| Net basic earnings (loss) per common share |
$ | 0.98 | $ | 0.01 | $ | (0.66 | ) | |||||
|
|
|
|||||||||||
| Diluted earnings (loss) per common share |
||||||||||||
| Continuing operations |
$ | 1.24 | $ | 0.16 | $ | (0.55 | ) | |||||
| Discontinued operations |
(0.27 | ) | (0.15 | ) | (0.11 | ) | ||||||
|
|
|
|||||||||||
| Net diluted earnings (loss) per common share |
$ | 0.96 | $ | 0.01 | $ | (0.66 | ) | |||||
|
|
|
|||||||||||
| Dividends per common share |
$ | 0.05 | $ | — | $ | — | ||||||
The accompanying notes to consolidated financial statements are an integral part of these statements
58
Table of Contents
CONSOLIDATED STATEMENTS OF COMPREHENSIVE INCOME (LOSS)
(In millions)
| 2016 | 2015 | 2014 | ||||||||||
| Net income (loss) |
$ | 529 | $ | 8 | $ | (352 | ) | |||||
| Other comprehensive income (loss), net of tax, where applicable: |
||||||||||||
| Foreign currency translation adjustments |
(11 | ) | (78 | ) | (78 | ) | ||||||
| Reclassification of foreign currency translation adjustments realized upon disposal of business |
(164 | ) | — | — | ||||||||
| Change in deferred pension, net of $14 million, $1 million and $1 million of deferred income taxes in 2016, 2015 and 2014, respectively |
16 | 1 | (87 | ) | ||||||||
|
|
|
|||||||||||
| Total other comprehensive (loss), net of tax, where applicable |
(159 | ) | (77 | ) | (165 | ) | ||||||
|
|
|
|||||||||||
| Comprehensive income (loss) |
370 | (69 | ) | (517 | ) | |||||||
| Comprehensive income attributable to the noncontrolling interest |
— | — | 2 | |||||||||
|
|
|
|||||||||||
| Comprehensive income (loss) attributable to Office Depot, Inc. |
$ | 370 | $ | (69 | ) | $ | (519 | ) | ||||
|
|
|
|||||||||||
The accompanying notes to consolidated financial statements are an integral part of these statements.
59
Table of Contents
CONSOLIDATED BALANCE SHEETS
(In millions, except shares and par value)
| December 31, 2016 |
December 26, 2015 |
|||||||
| ASSETS |
||||||||
| Current assets: |
||||||||
| Cash and cash equivalents |
$ | 763 | $ | 860 | ||||
| Receivables, net |
687 | 746 | ||||||
| Inventories |
1,279 | 1,406 | ||||||
| Prepaid expenses and other current assets |
102 | 92 | ||||||
| Current assets of discontinued operations |
142 | 956 | ||||||
|
|
|
|||||||
| Total current assets |
2,973 | 4,060 | ||||||
| Property and equipment, net |
601 | 665 | ||||||
| Goodwill |
363 | 363 | ||||||
| Other intangible assets, net |
33 | 53 | ||||||
| Timber notes receivable |
885 | 905 | ||||||
| Deferred income taxes |
466 | 11 | ||||||
| Other assets |
219 | 203 | ||||||
| Non-current assets of discontinued operations |
— | 182 | ||||||
|
|
|
|||||||
| Total assets |
$ | 5,540 | $ | 6,442 | ||||
|
|
|
|||||||
| LIABILITIES AND STOCKHOLDERS’ EQUITY |
||||||||
| Current liabilities: |
||||||||
| Trade accounts payable |
$ | 893 | $ | 987 | ||||
| Accrued expenses and other current liabilities |
1,002 | 1,074 | ||||||
| Income taxes payable |
3 | 9 | ||||||
| Short-term borrowings and current maturities of long-term debt |
29 | 51 | ||||||
| Current liabilities of discontinued operations |
104 | 622 | ||||||
|
|
|
|||||||
| Total current liabilities |
2,031 | 2,743 | ||||||
| Deferred income taxes and other long-term liabilities |
361 | 421 | ||||||
| Pension and postretirement obligations, net |
140 | 182 | ||||||
| Long-term debt, net of current maturities |
358 | 628 | ||||||
| Non-recourse debt |
798 | 819 | ||||||
| Non-current liabilities of discontinued operations |
— | 46 | ||||||
|
|
|
|||||||
| Total liabilities |
3,688 | 4,839 | ||||||
|
|
|
|||||||
| Commitments and contingencies |
||||||||
| Stockholders’ equity: |
||||||||
| Common stock — authorized 800,000,000 shares of $.01 par value; issued shares — 557,892,568 at December 31, 2016 and 554,835,306 at December 26, 2015 |
6 | 6 | ||||||
| Additional paid-in capital |
2,618 | 2,607 | ||||||
| Accumulated other comprehensive income (loss) |
(129 | ) | 30 | |||||
| Accumulated deficit |
(453 | ) | (982 | ) | ||||
| Treasury stock, at cost — 42,802,998 shares at December 31, 2016 and 5,915,268 shares at December 26, 2015 |
(190 | ) | (58 | ) | ||||
|
|
|
|||||||
| Total stockholders’ equity |
1,852 | 1,603 | ||||||
|
|
|
|||||||
| Total liabilities and stockholders’ equity |
$ | 5,540 | $ | 6,442 | ||||
|
|
|
|||||||
The accompanying notes to consolidated financial statements are an integral part of these statements.
60
Table of Contents
CONSOLIDATED STATEMENTS OF CASH FLOWS
(In millions)
| 2016 | 2015 | 2014 | ||||||||||
| Cash flows from operating activities of continuing operations: |
||||||||||||
| Net income (loss) |
$ | 529 | $ | 8 | $ | (352 | ) | |||||
| Loss from discontinued operations, net of tax |
(150 | ) | (84 | ) | (59 | ) | ||||||
|
|
|
|||||||||||
| Net income from continuing operations |
679 | 92 | (293 | ) | ||||||||
|
|
|
|||||||||||
| Adjustments to reconcile net income (loss) to net cash provided by operating activities: |
||||||||||||
| Depreciation and amortization |
181 | 253 | 277 | |||||||||
| Charges for losses on inventories and receivables |
78 | 53 | 52 | |||||||||
| Asset impairments |
15 | 13 | 56 | |||||||||
| Compensation expense for share-based payments |
40 | 41 | 35 | |||||||||
| Loss on extinguishment of debt |
15 | — | — | |||||||||
| Deferred income taxes and deferred tax asset valuation allowances |
(231 | ) | 1 | (1 | ) | |||||||
| Loss (gain) on disposition of assets |
(9 | ) | (36 | ) | 7 | |||||||
| Other |
3 | 24 | (2 | ) | ||||||||
| Changes in assets and liabilities: |
||||||||||||
| Decrease (increase) in receivables |
55 | 55 | (20 | ) | ||||||||
| Decrease (increase) in inventories |
56 | (99 | ) | (8 | ) | |||||||
| Net decrease (increase) in prepaid expenses and other assets |
(51 | ) | 20 | 23 | ||||||||
| Net decrease in trade accounts payable, accrued expenses and other current and other long-term liabilities |
(339 | ) | (279 | ) | (33 | ) | ||||||
|
|
|
|||||||||||
| Total adjustments |
(187 | ) | 46 | 386 | ||||||||
|
|
|
|||||||||||
| Net cash provided by operating activities of continuing operations |
492 | 138 | 93 | |||||||||
|
|
|
|||||||||||
| Cash flows from investing activities of continuing operations: |
||||||||||||
| Capital expenditures |
(111 | ) | (144 | ) | (96 | ) | ||||||
| Proceeds from sale of joint ventures, net |
— | — | 43 | |||||||||
| Proceeds from sale of available for sale securities |
— | — | 43 | |||||||||
| Acquisition, net of cash acquired |
— | (9 | ) | — | ||||||||
| Proceeds from disposition of assets and other |
27 | 95 | 5 | |||||||||
|
|
|
|||||||||||
| Net cash used in investing activities of continuing operations |
(84 | ) | (58 | ) | (5 | ) | ||||||
|
|
|
|||||||||||
| Cash flows from financing activities of continuing operations: |
||||||||||||
| Net proceeds from employee share-based transactions |
— | 7 | 39 | |||||||||
| Debt retirement |
(250 | ) | — | — | ||||||||
| Debt related fees |
(6 | ) | (1 | ) | — | |||||||
| Cash used in extinguishment of debt |
(12 | ) | — | — | ||||||||
| Cash dividends on common stock |
(26 | ) | — | — | ||||||||
| Proceeds from issuance of borrowings |
— | — | 4 | |||||||||
| Net payments on long and short-term borrowings |
(49 | ) | (32 | ) | (26 | ) | ||||||
| Repurchase of common stock for treasury |
(132 | ) | — | — | ||||||||
|
|
|
|||||||||||
| Net cash (used in) provided by financing activities of continuing operations |
(475 | ) | (26 | ) | 17 | |||||||
|
|
|
|||||||||||
| Cash flows from discontinued operations: |
||||||||||||
| Operating activities of discontinued operations |
(122 | ) | (12 | ) | 62 | |||||||
| Investing activities of discontinued operations |
(70 | ) | (16 | ) | (22 | ) | ||||||
| Financing activities of discontinued operations |
5 | 1 | (2 | ) | ||||||||
|
|
|
|||||||||||
| Net cash used in discontinued operations |
(187 | ) | (27 | ) | 38 | |||||||
| Effect of exchange rate changes on cash and cash equivalents |
(8 | ) | (29 | ) | (27 | ) | ||||||
| Net increase (decrease) in cash and cash equivalents |
(262 | ) | (2 | ) | 116 | |||||||
| Cash and cash equivalents at beginning of period |
1,069 | 1,071 | 955 | |||||||||
|
|
|
|||||||||||
| Cash and cash equivalents at end of period |
807 | 1,069 | 1,071 | |||||||||
| Cash and cash equivalents of discontinued operations |
(44 | ) | (209 | ) | (247 | ) | ||||||
|
|
|
|||||||||||
| Cash and cash equivalents at the end of period — continued operations |
$ | 763 | $ | 860 | $ | 824 | ||||||
|
|
|
|||||||||||
| Supplemental information on operating, investing, and financing activities |
||||||||||||
| Cash interest paid, net of amounts capitalized and Timber notes/Non-recourse debt |
$ | 63 | $ | 67 | $ | 68 | ||||||
| Cash taxes paid (refunded) |
$ | 48 | $ | — | $ | (20 | ) | |||||
| Non-cash asset additions under capital leases |
$ | 9 | $ | 25 | $ | 19 | ||||||
The accompanying notes to consolidated financial statements are an integral part of these statements.
61
Table of Contents
CONSOLIDATED STATEMENTS OF STOCKHOLDERS’ EQUITY
(In millions, except share amounts)
| Common Stock Shares |
Common Stock Amount |
Additional Paid-in Capital |
Accumulated Other Comprehensive Income |
Accumulated Deficit |
Treasury Stock |
Noncontrolling Interest |
Total Equity |
|||||||||||||||||||||||||
| Balance at December 28, 2013 |
536,629,760 | $ | 5 | $ | 2,480 | $ | 272 | $ | (636 | ) | $ | (58 | ) | $ | 1 | $ | 2,064 | |||||||||||||||
| Decrease in subsidiary shares from noncontrolling interests |
— | — | — | — | — | — | (1 | ) | (1 | ) | ||||||||||||||||||||||
| Net loss |
— | — | — | — | (354 | ) | — | — | (354 | ) | ||||||||||||||||||||||
| Other comprehensive loss |
— | — | — | (165 | ) | — | — | — | (165 | ) | ||||||||||||||||||||||
| Forfeiture of restricted stock |
(742,823 | ) | — | — | — | — | — | — | — | |||||||||||||||||||||||
| Exercise and release of incentive stock (including income tax benefits and withholding) |
15,210,600 | 1 | 38 | — | — | — | — | 39 | ||||||||||||||||||||||||
| Amortization of long-term incentive stock grants |
— | — | 38 | — | — | — | — | 38 | ||||||||||||||||||||||||
|
|
|
|||||||||||||||||||||||||||||||
| Balance at December 27, 2014 |
551,097,537 | $ | 6 | $ | 2,556 | $ | 107 | $ | (990 | ) | $ | (58 | ) | $ | — | $ | 1,621 | |||||||||||||||
| Net income |
— | — | — | — | 8 | — | — | 8 | ||||||||||||||||||||||||
| Other comprehensive loss |
— | — | — | (77 | ) | — | — | — | (77 | ) | ||||||||||||||||||||||
| Forfeiture of restricted stock |
(80,170 | ) | — | — | — | — | — | — | — | |||||||||||||||||||||||
| Exercise and release of incentive stock (including income tax benefits and withholding) |
3,817,939 | — | 7 | — | — | — | — | 7 | ||||||||||||||||||||||||
| Amortization of long-term incentive stock grants |
— | — | 44 | — | — | — | — | 44 | ||||||||||||||||||||||||
|
|
|
|||||||||||||||||||||||||||||||
| Balance at December 26, 2015 |
554,835,306 | $ | 6 | $ | 2,607 | $ | 30 | $ | (982 | ) | $ | (58 | ) | $ | — | $ | 1,603 | |||||||||||||||
| Net income |
— | — | — | — | 529 | — | — | 529 | ||||||||||||||||||||||||
| Other comprehensive loss |
— | — | — | (159 | ) | — | — | — | (159 | ) | ||||||||||||||||||||||
| Forfeiture of restricted stock |
(6,945 | ) | — | — | — | — | — | — | — | |||||||||||||||||||||||
| Exercise and release of incentive stock (including income tax benefits and withholding) |
3,064,207 | — | (2 | ) | — | — | — | — | (2 | ) | ||||||||||||||||||||||
| Amortization of long-term incentive stock grants |
— | — | 39 | — | — | — | — | 39 | ||||||||||||||||||||||||
| Dividends paid on common stock |
— | — | (26 | ) | — | — | — | — | (26 | ) | ||||||||||||||||||||||
| Repurchase of common stock |
— | — | — | — | — | (132 | ) | — | (132 | ) | ||||||||||||||||||||||
|
|
|
|||||||||||||||||||||||||||||||
| Balance at December 31, 2016 |
557,892,568 | $ | 6 | $ | 2,618 | $ | (129 | ) | $ | (453 | ) | $ | (190 | ) | $ | — | $ | 1,852 | ||||||||||||||
|
|
|
|||||||||||||||||||||||||||||||
The accompanying notes to consolidated financial statements are an integral part of these statements.
62
Table of Contents
NOTES TO CONSOLIDATED FINANCIAL STATEMENTS
NOTE 1. SUMMARY OF SIGNIFICANT ACCOUNTING POLICIES
Nature of Business: Office Depot, Inc. including consolidated subsidiaries (“Office Depot” or the “Company”) is a global supplier of office products and services. The Company currently operates under several banners, including Office Depot ® and OfficeMax® and utilizes several proprietary company and product brand names. The Company’s common stock is traded on the NASDAQ Global Select Market under the ticker symbol ODP. Office Depot currently operates through wholly-owned entities and participates in other ventures and alliances. The Company’s corporate headquarters is located in Boca Raton, FL, and the Company’s primary website is www.officedepot.com.
At December 31, 2016, the Company sold to customers through two reportable segments (or “Divisions”): North American Retail Division and North American Business Solutions Division. In September 2016, the Company’s Board of Directors committed to a plan to sell substantially all of the operations formerly presented as the International Division. Accordingly, that business is presented herein as discontinued operations. Refer to Note 3 for Discontinued Operations information and Note 16 for Segment information.
On February 4, 2015, Staples, Inc. (“Staples”) and the Company announced that the companies entered into a definitive merger agreement (the “Staples Merger Agreement”), under which Staples would acquire all of the outstanding shares of Office Depot and the Company would become a wholly owned subsidiary of Staples (the “Staples Acquisition”). On December 7, 2015, the United States Federal Trade Commission (the “FTC”) informed Office Depot and Staples that it intended to block the Staples Acquisition. On the same date, Office Depot and Staples announced their intent to contest the FTC’s decision to challenge the transaction. On May 10, 2016, the U.S. District Court for the District of Columbia granted the FTC’s request for a preliminary injunction against the proposed acquisition, and as a result, the companies terminated the Staples Merger Agreement on May 16, 2016.
On November 5, 2013, the Company merged with OfficeMax Incorporated (“OfficeMax”); refer to Note 2 for additional discussion of this merger (the “Merger”).
Basis of Presentation: The consolidated financial statements of Office Depot include the accounts of all wholly owned and financially controlled subsidiaries prior to disposition. Also, the variable interest entities formed by OfficeMax in prior periods solely related to the Timber Notes and Non-recourse debt are consolidated because the Company is the primary beneficiary. Refer to Note 6 for additional information. The Company owns 88% of a subsidiary that formerly owned assets in Cuba, which were confiscated by the Cuban government in the 1960’s. Due to various asset restrictions, the fair value of this investment is not determinable and no amounts are included in the consolidated financial statements. Intercompany transactions have been eliminated in consolidation.
Fiscal Year: Fiscal years are based on a 52- or 53-week period ending on the last Saturday in December. Fiscal year 2016 includes 53 weeks and fiscal years 2015 and 2014 include 52 weeks. Certain international locations operate on a calendar year basis; however, the reporting difference had no impact in 2016 and is not considered significant in other periods.
Estimates and Assumptions: The preparation of financial statements in conformity with accounting principles generally accepted in the United States of America requires management to make estimates and assumptions that affect the reported amounts of assets and liabilities and disclosure of contingent assets and liabilities at the date of the consolidated financial statements and the reported amounts of revenues and expenses during the reporting period. Actual results could differ from those estimates.
63
Table of Contents
OFFICE DEPOT, INC.
NOTES TO CONSOLIDATED FINANCIAL STATEMENTS (Continued)
Discontinued Operations: In September 2016, the Company’s Board of Directors committed to a plan to sell substantially all of the international operations formerly reported as the International Division. The planned dispositions represented a strategic shift that would have a major impact on the Company’s operations and financial results and accordingly, the Company presented these operations as discontinued operations beginning in the third quarter of 2016. The Company applied held for sale accounting criteria and measured the four individual disposal groups at the lower of carrying value of fair value less costs to sell. The OD European Business was sold on December 31, 2016. Refer to Note 3 for additional disclosures about the discontinued operations.
In December 2016, while preparing for and performing the controls associated the disposition of the Company’s business in Europe, we identified an error, which was not material to the overall presentation, in the loss on classification of certain foreign businesses as discontinued operations in the Company’s third quarter 2016 interim condensed consolidated financial statements. The unaudited Quarterly Financial Data included in Note 17 have been revised to reflect correction of the error described above. Refer to Note 17 for additional information.
Foreign Currency: International operations use local currencies as their functional currency. Assets and liabilities are translated into U.S. dollars using the exchange rate at the balance sheet date. Revenues, expenses and cash flows are translated at average monthly exchange rates, or rates on the date of the transaction for certain significant items. Translation adjustments resulting from this process are recorded in Stockholders’ equity as a component of Accumulated other comprehensive income (loss).
Foreign currency transaction gains or losses are recorded in the Consolidated Statements of Operations in Other income (expense), net or Cost of goods sold and occupancy costs, depending on the nature of the transaction. Foreign currency transaction gains or losses related to discontinued operations in Note 3 are presented in the loss on sale or held for sale classifications.
Cash and Cash Equivalents: All short-term highly liquid investments with original maturities of three months or less from the date of acquisition are classified as cash equivalents. Amounts in transit from banks for customer credit card and debit card transactions are classified as cash. The banks process the majority of these amounts within two business days.
Amounts not yet presented for payment to zero balance disbursement accounts of $58 million and $32 million at December 31, 2016 and December 26, 2015, respectively, are presented in Trade accounts payable and Accrued expenses and other current liabilities.
At December 31, 2016, cash and cash equivalents from continuing operations but held outside the United States amounted to $84 million. Additionally, $44 million of cash held outside the United States was included in current assets of discontinued operations.
Receivables: Trade receivables, net, totaled $415 million and $471 million at December 31, 2016 and December 26, 2015, respectively. An allowance for doubtful accounts has been recorded to reduce receivables to an amount expected to be collectible from customers. The allowance at December 31, 2016 and December 26, 2015 was $12 million and $9 million, respectively.
Exposure to credit risk associated with trade receivables is limited by having a large customer base that extends across many different industries and geographic regions. However, receivables may be adversely affected by an economic slowdown in the United States or internationally. No single customer accounted for more than 10% of total sales or receivables in 2016, 2015 or 2014.
64
Table of Contents
OFFICE DEPOT, INC.
NOTES TO CONSOLIDATED FINANCIAL STATEMENTS (Continued)
Other receivables were $272 million and $275 million at December 31, 2016 and December 26, 2015, respectively, of which $223 million and $233 million, respectively, are amounts due from vendors under purchase rebate, cooperative advertising and various other marketing programs.
Inventories: Inventories are stated at the lower of cost or market value and are reduced for inventory losses based on estimated obsolescence and the results of physical counts. In-bound freight is included as a cost of inventories. Also, cash discounts and certain vendor allowances that are related to inventory purchases are recorded as a product cost reduction. The weighted average method is used throughout the Company to determine the cost of inventory.
Income Taxes: Income taxes are accounted for under the asset and liability method. This approach requires the recognition of deferred tax assets and liabilities attributable to differences between the carrying amounts and the tax bases of assets and liabilities and operating loss and tax credit carryforwards. Valuation allowances are recorded to reduce deferred tax assets to the amount believed to be more likely than not to be realized. The Company recognizes tax benefits from uncertain tax positions when it is more likely than not that the position will be sustained upon examination. Interest related to income tax exposures is included in interest expense in the Consolidated Statements of Operations. Refer to Note 8 for additional information on income taxes.
Property and Equipment: Property and equipment additions are recorded at cost. Depreciation and amortization is recognized over the estimated useful lives using the straight-line method. The useful lives of depreciable assets are estimated to be 15-30 years for buildings and 3-10 years for furniture, fixtures and equipment. Computer software is amortized over three years for common office applications, five years for larger business applications and seven years for certain enterprise-wide systems. Leasehold improvements are amortized over the shorter of the estimated economic lives of the improvements or the terms of the underlying leases, including renewal options considered reasonably assured. The Company capitalizes certain costs related to internal use software that is expected to benefit future periods. These costs are amortized using the straight-line method over the 3 to 7 year expected life of the software. Major repairs that extend the useful lives of assets are capitalized and amortized over the estimated use period. Routine maintenance costs are expensed as incurred.
Goodwill and Other Intangible Assets: Goodwill is the excess of the cost of an acquisition over the fair value assigned to net tangible and identifiable intangible assets of the business acquired. The Company reviews goodwill for impairment annually or sooner if indications of possible impairment are identified. The annual review period for the goodwill is as of the first day of the third quarter. The Company elected to conduct a quantitative assessment of possible goodwill impairment in 2016. In periods that a quantitative test is used, the Company estimates the reporting unit’s fair value using discounted cash flow analysis and market-based evaluations, when available. If the reporting unit’s carrying value exceeds its fair value, an impairment charge is recognized to the extent that the carrying amount of goodwill exceeds its implied fair value. This method of estimating fair value requires assumptions, judgments and estimates of future performance. The Company may assess goodwill for possible impairment in future periods by considering qualitative factors, rather than this quantitative test.
Amortizable intangible assets are periodically reviewed to determine whether events and circumstances warrant a revision to the remaining period of amortization or asset impairment. Certain locations identified for closure resulted in impairment of favorable lease assets.
Impairment of Long-Lived Assets: Long-lived assets with identifiable cash flows are reviewed for possible impairment whenever events or changes in circumstances indicate that the carrying amount of such assets may not be recoverable. Because of recent operating results, implementation of the post-Merger real estate strategy (the “Real Estate Strategy”) and the Comprehensive Business Review initiated in the third quarter of fiscal 2016,
65
Table of Contents
OFFICE DEPOT, INC.
NOTES TO CONSOLIDATED FINANCIAL STATEMENTS (Continued)
retail store long-lived assets have been regularly reviewed for impairment indicators. Impairment is assessed at the individual store level which is the lowest level of identifiable cash flows, and considers the estimated undiscounted cash flows over the asset’s remaining life. If estimated undiscounted cash flows are insufficient to recover the investment, an impairment loss is recognized equal to the difference between the estimated fair value of the asset and its carrying value, net of salvage, and any costs of disposition. The fair value estimate is generally the discounted amount of estimated store-specific cash flows.
Facility Closure and Severance Costs: Store performance is regularly reviewed against expectations and stores not meeting performance requirements may be closed. During 2014, the Company implemented the Real Estate Strategy which among other initiatives included closing 400 retail store locations; the store closures were completed in 2016. During the third quarter of 2016, the Company initiated the Comprehensive Business Review and announced the closure of approximately 300 retail stores locations to be completed by 2018. Refer to Note 2 for additional information.
Costs associated with facility closures, principally accrued lease costs, are recognized when the facility is no longer used in an operating capacity or when a liability has been incurred. Store assets are also reviewed for possible impairment, or reduction of estimated useful lives.
Accruals for facility closure costs are based on the future commitments under contracts, adjusted for assumed sublease benefits and discounted at the Company’s credit-adjusted risk-free rate at the time of closing. Accretion expense is recognized over the life of the contractual payments. Additionally, the Company recognizes charges to terminate existing commitments and charges or credits to adjust remaining closed facility accruals to reflect current expectations. Accretion expense and adjustments to facility closure costs are presented in the Consolidated Statements of Operations in Selling, general and administrative expenses if the related facility was closed as part of ongoing operations or in Merger, restructuring and other operating (income) expenses, net, if the related facility was closed as part of the Merger, Real Estate Strategy or Comprehensive Business Review. Refer to Note 2 for additional information on accrued expenses relating to closed facilities. The short-term and long-term components of this liability are included in Accrued expenses and other current liabilities and Deferred income taxes and other long-term liabilities, respectively, on the Consolidated Balance Sheets.
Employee termination costs covered under written and substantive plans are accrued when probable and estimable and consider continuing service requirements, if any. Additionally, incremental one-time employee benefit costs are recognized when the key terms of the arrangements have been communicated to affected employees. Amounts are recognized when communicated or over the remaining service period, based on the terms of the arrangements.
Accrued Expenses: Included in Accrued expenses and other current liabilities in the Consolidated Balance Sheets are accrued payroll-related amounts of $176 million and $221 million at December 31, 2016 and December 26, 2015, respectively.
Fair Value of Financial Instruments: The Company measures fair value as the price that would be received to sell an asset or paid to transfer a liability in an orderly transaction between market participants at the measurement date. In developing its fair value estimates, the Company uses the following hierarchy:
| Level 1 | Quoted prices in active markets for identical assets or liabilities. | |
| Level 2 | Observable market based inputs or unobservable inputs that are corroborated by market data. | |
| Level 3 | Significant unobservable inputs that are not corroborated by market data. Generally, these fair value measures are model-based valuation techniques such as discounted cash flows or option pricing models using own estimates and assumptions or those expected to be used by market participants. | |
66
Table of Contents
OFFICE DEPOT, INC.
NOTES TO CONSOLIDATED FINANCIAL STATEMENTS (Continued)
The fair values of cash and cash equivalents, receivables, trade accounts payable and accrued expenses and other current liabilities approximate their carrying values because of their short-term nature. Refer to Note 14 for further fair value information.
Revenue Recognition: Revenue is recognized at the point of sale for retail transactions and at the time of successful delivery for contract, catalog and internet sales. Shipping and handling fees are included in Sales with the related costs included in Cost of goods sold and occupancy costs in the Consolidated Statements of Operations. Service revenue is recognized in Sales as the services are rendered. The Company recognizes sales on a gross basis when it is considered the primary obligor in the transaction and on a net basis when it is considered to be acting as an agent. Sales taxes collected are not included in reported Sales. The Company uses judgment in estimating sales returns, considering numerous factors such as historical sales return rates. The Company also records reductions to revenue for customer programs and incentive offerings including special pricing agreements, certain promotions and other volume-based incentives.
A liability for future performance is recognized when gift cards are sold and the related revenue is recognized when gift cards are redeemed as payment for products or when the likelihood of gift card redemption is considered remote. Gift cards do not have an expiration date. The Company recognizes the estimated portion of the gift card program liability that will not be redeemed, or the breakage amount, in proportion to usage.
Cost of Goods Sold and Occupancy Costs: Cost of goods sold and occupancy costs include:
| - | inventory costs (as discussed above); |
| - | outbound freight; |
| - | employee and non-employee receiving, distribution, and occupancy costs (rent), including real estate taxes and common area costs, of inventory-holding and selling locations; and |
| - | identifiable employee-related costs associated with services provided to customers. |
Selling, General and Administrative Expenses: Selling, general and administrative expenses include amounts incurred related to expenses of operating and support functions, including:
| - | employee payroll and benefits, including variable pay arrangements; |
| - | advertising; |
| - | store and field support; |
| - | executive management and various staff functions, such as information technology, human resources functions, finance, legal, internal audit, and certain merchandising and product development functions; |
| - | other operating costs incurred relating to selling activities; and |
| - | closed defined benefit pension and postretirement plans. |
Selling, general and administrative expenses are included in the determination of Division operating income to the extent those costs are considered to be directly or closely related to segment activity and through allocation of support costs.
Merger, Restructuring, and Other Operating (Income) Expenses, net: Merger, restructuring, and other operating (income) expenses, net in the Consolidated Statements of Operations includes amounts related to the Merger, the Staples Acquisition and the Comprehensive Business Review. The line items include charges and,
67
Table of Contents
OFFICE DEPOT, INC.
NOTES TO CONSOLIDATED FINANCIAL STATEMENTS (Continued)
where applicable, credits for components such as: employee termination and retention, transaction and integration-related professional fees, facility closure costs, gains and losses on asset dispositions, and other incremental costs directly related to these activities, which are offset by termination fees. This presentation is used to separate these significant and unusual impacts from captions that are more directly related to ongoing operations. Changes in estimates and accruals related to these activities are also reflected on this line.
Merger, restructuring, and other operating (income) expenses, net are not included in the measure of Division operating income. Refer to Note 2 for additional information.
Advertising: Advertising costs are charged either to Selling, general and administrative expenses when incurred or, in the case of direct marketing advertising, capitalized and amortized in proportion to the related revenues over the estimated life of the materials, which range from several months to up to one year.
Advertising expense recognized was $272 million in 2016, $285 million in 2015 and $350 million in 2014. Prepaid advertising costs were $11 million as of December 31, 2016 and December 26, 2015, and $16 million as of December 27, 2014.
Share-Based Compensation: Compensation expense for all share-based awards expected to vest is measured at fair value on the date of grant and recognized on a straight-line basis over the related service period. The Black-Scholes valuation model is used to determine the fair value of stock options. The fair value of restricted stock and restricted stock units, including performance-based awards, is determined based on the Company’s stock price on the date of grant. Share-based awards with market conditions, such as total shareholder return, are valued using a Monte Carlo simulation as measured on the grant date.
Self-insurance: Office Depot is primarily self-insured for workers’ compensation, auto and general liability and employee medical insurance programs. The Company has stop-loss coverage to limit the exposure arising from these claims. Self-insurance liabilities are based on claims filed and estimates of claims incurred but not reported. These liabilities are not discounted.
Vendor Arrangements: The Company enters into arrangements with substantially all significant vendors that provide for some form of consideration to be received from the vendors. Arrangements vary, but some specify volume rebate thresholds, advertising support levels, as well as terms for payment and other administrative matters. The volume-based rebates, supported by a vendor agreement, are estimated throughout the year and reduce the cost of inventory and cost of goods sold during the year. This estimate is regularly monitored and adjusted for current or anticipated changes in purchase levels and for sales activity. Other promotional consideration received is event-based or represents general support and is recognized as a reduction of Cost of goods sold and occupancy costs or Inventories, as appropriate, based on the type of promotion and the agreement with the vendor. Certain arrangements meet the specific, incremental, identifiable criteria that allow for direct operating expense offset, but such arrangements are not significant.
Pension and Other Postretirement Benefits: The Company sponsors certain closed U.S. and international defined benefit pension plans, certain closed U.S. retiree medical benefit and life insurance plans, as well as a Canadian retiree medical benefit plan open to certain employees.
The Company recognizes the funded status of its defined benefit pension, retiree medical benefit and life insurance plans in the Consolidated Balance Sheets, with changes in the funded status recognized primarily through accumulated other comprehensive income (loss), net of tax, in the year in which the changes occur. Actuarially-determined liabilities related to pension and postretirement benefits are recorded based on estimates and assumptions. Factors used in developing estimates of these liabilities include assumptions related to discount
68
Table of Contents
OFFICE DEPOT, INC.
NOTES TO CONSOLIDATED FINANCIAL STATEMENTS (Continued)
rates, rates of return on investments, healthcare cost trends, benefit payment patterns and other factors. The Company also updates periodically its assumptions about employee retirement factors, mortality, and turnover. Refer to Note 12 for additional details.
Environmental and Asbestos Matters: Environmental and asbestos liabilities relate to acquired legacy paper and forest products businesses and timberland assets. The Company accrues for losses associated with these obligations when probable and reasonably estimable. These liabilities are not discounted. A receivable for insurance recoveries is recorded when probable.
Acquisitions: The Company applies the acquisition method of accounting for acquisitions, including mergers where the Company is considered the accounting acquirer. As such, the total consideration is allocated to the fair value of assets acquired and liabilities assumed at the point the Company obtains control of the entity.
Leasing Arrangements: The Company conducts a substantial portion of its business in leased properties. Some of the Company’s leases contain escalation clauses and renewal options. The Company recognizes rental expense for leases that contain predetermined fixed escalation clauses on a straight-line basis over the expected term of the lease.
The expected term of a lease is calculated from the date the Company first takes possession of the facility, including any periods of free rent, and extends through the non-cancellable period and any option or renewal periods management believes are reasonably assured of being exercised. Rent abatements and escalations are considered in the calculation of minimum lease payments in the Company’s lease classification assessment and in determining straight-line rent expense for operating leases. Straight-line rent expense is also adjusted to reflect any allowances or reimbursements provided by the lessor. When required under lease agreements, estimated costs to return facilities to original condition are accrued over the lease period.
Derivative Instruments and Hedging Activities: The Company records derivative instruments on the balance sheet at fair value. Changes in the fair value of derivative instruments are recorded in current income or deferred in accumulated other comprehensive income, depending on whether a derivative is designated as, and is effective as, a hedge and on the type of hedging transaction. Changes in fair value of derivatives that are designated as cash flow hedges are deferred in accumulated other comprehensive income until the underlying hedged transactions are recognized in earnings, at which time any deferred hedging gains or losses are also recorded in earnings. If a derivative instrument is designated as a fair value hedge, changes in the fair value of the instrument are reported in current earnings and offset the change in fair value of the hedged assets, liabilities or firm commitments. At December 31, 2016 and December 26, 2015, the fair value of derivative instruments were not considered material and the Company had no material hedge transactions in 2016, 2015 or 2014.
New Accounting Standards: In May 2014, the Financial Accounting Standards Board (“FASB”) issued an accounting standards update that supersedes most current revenue recognition guidance and modifies the accounting for certain costs associated with revenue generation. The core principle of this guidance is that an entity should recognize revenue to depict the transfer of promised goods or services to customers in an amount that reflects the consideration to which the entity expects to be entitled in exchange for those goods or services. The guidance provides a number of steps to apply to achieve that principle and requires additional disclosures. The standard was originally to be effective for the Company’s first quarter of 2017. In July 2015, the FASB approved a one year extension to the required implementation date but also permitted companies to adopt the standard at the original effective date of 2017. Adoption before the original effective date of 2017 is not permitted. The new revenue standard may be applied retrospectively to each prior period presented or retrospectively with the cumulative effect recognized as of the date of adoption.
69
Table of Contents
OFFICE DEPOT, INC.
NOTES TO CONSOLIDATED FINANCIAL STATEMENTS (Continued)
The Company continues to assess the impact this new standard will have on its Consolidated Financial Statements and has not yet decided on which adoption alternative to apply upon adoption in the first quarter of 2018. However, based on this ongoing assessment, the Company expects that the new standard will require the impacts of its loyalty programs to be presented as a reduction of revenue, rather than as cost accruals as is permitted under existing accounting rules. Also, costs associated with catalogs will be expensed as incurred, rather than capitalized and amortized over the anticipated benefit period. Additionally, the timing of revenue recognition will be accelerated for items where the Company’s performance obligation is complete, such as certain commission arrangements, and delayed where performance obligations remain, such as certain coupons and incentives offered from time-to-time.
In February 2016, the FASB issued an accounting standards update which will require lessees to recognize most leases on their balance sheets related to the rights and obligations created by those leases. The accounting treatment for lessors will remain relatively unchanged. The accounting standards update also requires additional qualitative and quantitative disclosures related to the nature, timing and uncertainty of cash flows arising from leases. The guidance is effective for fiscal years beginning after December 15, 2018, and interim periods within those fiscal years. Early adoption is permitted. Lessees and lessors are required to use a modified retrospective transition method for existing leases and accordingly, apply the new accounting model for the earliest year presented in the financial statements. The Company is currently evaluating the impact the adoption of this new standard will have on its Consolidated Financial Statements but anticipates it will result in significant right of use assets and related liabilities associated with our operating leases. Substantially all of the Company’s retail store locations and supply chain facilities are subject to operating lease arrangements. Refer to Note 7 for existing capital lease balances and Note 9 for the undiscounted amount of non-cancelable minimum lease payments of operating leases that will be subjected to this new accounting standard. The Company currently anticipates adopting the standard in the first quarter of 2019.
In March 2016, the FASB issued an accounting standards update as part of its simplification initiative. The new standard will modify several aspects of the accounting and reporting for employee share-based payments and related tax accounting impacts, including the presentation in the statements of operations and cash flows of certain tax benefits or deficiencies and employee tax withholdings, as well as the accounting for award forfeitures over the vesting period. The new standard is effective for fiscal years beginning after December 15, 2016 and will be adopted by the Company in the first quarter of 2017. The Company anticipates the new standard will result in volatility to income tax expense upon the prospective recognition of excess tax benefit and tax deficiency related to share-based payments. Prior period amounts associated with these components have not been significant; however, similar future period impacts cannot be assured.
NOTE 2. MERGER, ACQUISITION TERMINATION, AND RESTRUCTURING ACTIVITY
In recent years, the Company has taken actions to adapt to changing and competitive conditions. These actions include closing facilities, consolidating functional activities, eliminating redundant positions, disposing of businesses and assets, and taking actions to improve process efficiencies.
Merger
In 2013, the OfficeMax merger was completed and integration activities similar to the actions described above began. The Company also assumed certain restructuring liabilities previously recorded by OfficeMax. In mid-2014, the Company’s Real Estate Strategy identified 400 retail stores for closure and integration of the supply chain. During the second quarter of 2016, the Company completed the retail store closures under this program. The changes to the supply chain are anticipated to be complete in 2017.
70
Table of Contents
OFFICE DEPOT, INC.
NOTES TO CONSOLIDATED FINANCIAL STATEMENTS (Continued)
Staples Acquisition and Merger Agreement Termination
On February 4, 2015, Staples and the Company announced that the companies had entered into the Staples Merger Agreement, under which Staples would acquire all of the outstanding shares of Office Depot and the Company would become a wholly owned subsidiary of Staples.
On December 7, 2015, the FTC informed Office Depot and Staples that it intended to block the Staples Acquisition. On the same date, Office Depot and Staples announced their intent to contest the FTC’s decision to challenge the transaction. On May 10, 2016, the U.S. District Court for the District of Columbia granted the FTC’s request for a preliminary injunction against the proposed acquisition, and as a result, the companies terminated the Staples Merger Agreement on May 16, 2016. Per the terms of the termination agreement, Staples paid Office Depot a Termination Fee of $250 million in cash on May 19, 2016, which is included in Merger, restructuring and other operating (income) expenses, net in the Consolidated Statements of Operations and in Net cash provided by operating activities of continuing operations in the Consolidated Statements of Cash Flows.
Comprehensive Business Review
During August 2016, the Company announced the results of a comprehensive business review and strategy (the “Comprehensive Business Review”), which, among other things, included an anticipation of closing approximately 300 additional retail stores in North America over the next three years, anticipated restructuring initiatives to lower operating and general and administrative expenses, and continued exploration of strategic alternatives regarding the European business that had been initiated by Staples as part of their attempt to get European Union regulatory approval of the Staples Acquisition.
71
Table of Contents
OFFICE DEPOT, INC.
NOTES TO CONSOLIDATED FINANCIAL STATEMENTS (Continued)
Merger, Restructuring, and Other Operating (Income) Expenses, net
The Company presents Merger, restructuring and other operating (income) expenses, net on a separate line in the Consolidated Statements of Operations to identify these activities apart from the expenses incurred to sell to and service its customers. These expenses are not included in the determination of Division operating income. The table below summarizes the major components of Merger, restructuring and other operating (income) expenses, net.
| (In millions) | 2016 | 2015 | 2014 | |||||||||
| Merger expenses: |
||||||||||||
| Severance, retention, and relocation |
$ | — | $ | 15 | $ | 148 | ||||||
| Transaction and integration |
37 | 81 | 124 | |||||||||
| Facility closure, contract termination, and other expenses, net |
27 | 44 | 62 | |||||||||
|
|
|
|||||||||||
| Total Merger related expenses |
64 | 140 | 334 | |||||||||
|
|
|
|||||||||||
| Staples Acquisition (income) expenses: |
||||||||||||
| Retention |
15 | 65 | — | |||||||||
| Transaction |
43 | 37 | — | |||||||||
| Termination Fee |
(250 | ) | — | — | ||||||||
|
|
|
|||||||||||
| Total Staples Acquisition (income) expenses |
(192 | ) | 102 | — | ||||||||
|
|
|
|||||||||||
| Comprehensive Business Review expenses: |
||||||||||||
| Severance |
22 | — | — | |||||||||
| Facility closure, contract termination, professional fees and other expenses, net |
26 | — | — | |||||||||
|
|
|
|||||||||||
| Total Comprehensive Business Review expenses |
48 | — | — | |||||||||
|
|
|
|||||||||||
| Total Merger, restructuring and other operating (income) expenses, net |
$ | (80 | ) | $ | 242 | $ | 334 | |||||
|
|
|
|||||||||||
Merger related expenses
Severance, retention, and relocation expenses include amounts incurred for the integration of staff functions and include termination benefits for certain retail and supply chain closures. Such benefits are being accrued through the anticipated facility closure dates. Severance calculations consider factors such as the expected timing of facility closures, terms of existing severance plans, expected employee turnover and attrition.
Transaction and integration expenses include integration-related professional fees, incremental temporary contract labor, salary and benefits for employees dedicated to the Merger activity, travel costs, non-capitalizable software integration costs, and other direct costs to combine the companies. Such costs are being recognized as incurred.
Facility closure, contract termination and other expenses, net primarily relate to facility closure accruals, contract termination costs, gains and losses on asset dispositions, and accelerated depreciation. Facility closure expenses include amounts incurred by the Company to close retail stores in the United States as part of the Real Estate Strategy, as well as supply chain facilities. The Company closed 51, 181 and 168 retail stores in 2016, 2015 and 2014, respectively. During 2016 and 2015, the Company recognized gains of $1 million and $36 million, respectively, from the sale of warehouse facilities that had been classified as assets held for sale. The gains are included in Merger, restructuring and other operating (income) expenses, net, as the dispositions were part of the supply chain integration associated with the Merger.
72
Table of Contents
OFFICE DEPOT, INC.
NOTES TO CONSOLIDATED FINANCIAL STATEMENTS (Continued)
Staples Acquisition (income) expense
Expenses include retention accruals, transaction costs, including costs associated with regulatory filings and professional fees and are offset by the Termination Fee income.
Comprehensive Business Review expenses
Expenses associated with implementing the Comprehensive Business Review include severance, facility closure costs, contract termination, accelerated depreciation, professional fees, relocation and disposal gains and losses, as well as other costs associated with the store closures. The Company has closed 72 stores since announcing this initiative. Restructuring expenses also include severance and reorganization costs associated with reductions in staff functions that continued into the first quarter of 2017. Severance costs are being accrued through the anticipated facility closure or termination date and consider timing, terms of existing severance plans, expected employee turnover and attrition.
Asset impairments related to the restructuring initiatives are not included in the table above. Refer to Note 14 for further information.
73
Table of Contents
OFFICE DEPOT, INC.
NOTES TO CONSOLIDATED FINANCIAL STATEMENTS (Continued)
Merger and Restructuring Accruals
Activity in the merger and restructuring accruals in 2016 and 2015 is presented in the table below. The total of $(80) million in income presented in Merger, restructuring and other operating (income) expenses, net in the 2016 Consolidated Statements of Operation, includes the $250 million Termination Fee income. There were $170 million of expense incurred in 2016 of which $70 million relate to Merger and restructuring liabilities and are included as Charges incurred in the table below. The remaining $100 million expense is comprised of $43 million for Staples Acquisition transactions expenses, $37 million of Merger transaction and integration expenses and $20 million in property expenses, professional fees, non-cash items and other expenses. For 2015, of the total $242 million Merger, restructuring and other expenses incurred, $158 million is related to merger or restructuring liabilities and are included as Charges incurred in the table below. The remaining $84 million incurred in 2015 is comprised of $81 million Merger transaction and integration expenses, $37 million Staples Acquisition transaction expenses, and $2 million associated primarily with fixed assets and rent related expenses, partially offset by the $36 million gain on the disposition of the warehouse facilities which resulted from the supply chain integration. These charges are excluded from the table below because they are expensed as incurred, non-cash, or otherwise not associated with the merger and restructuring balance sheet accounts.
| (In millions) | Beginning Balance |
Charges Incurred |
Cash Payments |
Lease Accretion and Other Adjustments |
Ending Balance |
|||||||||||||||
| 2016 |
||||||||||||||||||||
| Termination benefits: |
||||||||||||||||||||
| Merger-related accruals |
$ | 16 | $ | — | $ | (9 | ) | $ | (2 | ) | $ | 5 | ||||||||
| Comprehensive Business Review |
— | 19 | (11 | ) | — | 8 | ||||||||||||||
| Lease and contract obligations, accruals for facilities closures and other costs: |
||||||||||||||||||||
| Merger-related accruals |
77 | 22 | (62 | ) | 3 | 40 | ||||||||||||||
| Comprehensive Business Review |
— | 19 | (6 | ) | — | 13 | ||||||||||||||
| Other restructuring accruals |
14 | (2 | ) | (8 | ) | 1 | 5 | |||||||||||||
| Acquired entity accruals |
25 | (3 | ) | (7 | ) | 3 | 18 | |||||||||||||
| Staples acquisition related accruals |
64 | 15 | (79 | ) | — | — | ||||||||||||||
|
|
|
|||||||||||||||||||
| Total |
$ | 196 | $ | 70 | $ | (182 | ) | $ | 5 | $ | 89 | |||||||||
|
|
|
|||||||||||||||||||
| 2015 |
||||||||||||||||||||
| Termination benefits: |
||||||||||||||||||||
| Merger-related accruals |
$ | 31 | $ | 16 | $ | (31 | ) | $ | — | $ | 16 | |||||||||
| Lease and contract obligations, accruals for facilities closures and other costs: |
||||||||||||||||||||
| Merger-related accruals |
71 | 76 | (70 | ) | — | 77 | ||||||||||||||
| Other restructuring accruals |
23 | (1 | ) | (10 | ) | 2 | 14 | |||||||||||||
| Acquired entity accruals |
36 | 3 | (15 | ) | 1 | 25 | ||||||||||||||
| Staples acquisition related accruals |
— | 64 | — | — | 64 | |||||||||||||||
|
|
|
|||||||||||||||||||
| Total merger and restructuring accruals |
$ | 161 | $ | 158 | $ | (126 | ) | $ | 3 | $ | 196 | |||||||||
|
|
|
|||||||||||||||||||
The short-term and long-term components of these liabilities are included in Accrued expenses and other current liabilities and Deferred income taxes and other long-term liabilities, respectively, on the Consolidated Balance Sheets.
74
Table of Contents
OFFICE DEPOT, INC.
NOTES TO CONSOLIDATED FINANCIAL STATEMENTS (Continued)
NOTE 3. DISCONTINUED OPERATIONS
In the second quarter of 2016, following termination of the Staples Agreement, the Company disclosed its intention to explore strategic alternatives regarding its European business of the International Division.
On September 23, 2016, the Company announced that it had received an irrevocable offer from Aurelius Rho Invest DS GmbH, a subsidiary of The AURELIUS Group (the “Purchaser”) to acquire the Company’s European business operations (the “OD European Business”). The transaction was structured as an equity sale with the Purchaser acquiring the OD European Business with its operating assets and liabilities.
In addition to approving the sale of the OD European Business in the third quarter of 2016, the Company’s Board of Directors approved a plan to sell substantially all of the remaining operations of the International Division. On December 31, 2016, the Company closed the sale of the OD European Business contemplated by the Sale and Purchase Agreement dated November 22, 2016 as amended to complete the sale (the “SPA”). Approximately $70 million has been accrued at December 31, 2016 under a working capital adjustment provision. The draft working capital adjustment submitted by the Company to the Purchaser is subject to a dispute resolution provision as provided for in the SPA. The Company is actively marketing for sale the businesses in South Korea, mainland China, Australia and New Zealand and expects to complete the dispositions within the one year period associated with held for sale assets. Collectively, the OD European Business sale and other planned dispositions represent a strategic shift that has a major impact on the Company’s operations and financial results and has been accounted for as discontinued operations. The retained sourcing and trading operations of the former International Division are presented as Other in Note 16, Segment Information.
The Company has presented the operating results of the OD European Business as well as the entities to be sold within discontinued operations, net of tax in the Consolidated Statements of Operations for all periods presented. The related assets and liabilities of the disposal groups are presented as current and non-current assets and liabilities of discontinued operations in the Consolidated Balance Sheets as of December 31, 2016 and December 26, 2015. Cash flows from the Company’s discontinued operations are presented in the Consolidated Statements of Cash Flows for all periods. Certain portions of the former International Division assets and operations are being retained or did not meet the held for sale criteria at December 31, 2016 and, therefore, remain in continuing operations.
The loss on classification as discontinued operations relating to the remaining entities was measured at the lower of carrying value or estimated fair value less costs to sell and is included in the valuation allowance in the balance sheet as shown below. Completion of the sale of the remaining international operations may be for amounts different from the current estimates and will be evaluated each reporting period until the dispositions are complete.
In accordance with the Company’s annual goodwill impairment test $15 million of goodwill in the Australia/New Zealand reporting unit was considered impaired in the third quarter of 2016 based on a decrease in the long-term projected cash flows and related estimated terminal value of that business.
Restructuring charges incurred by the International Division that previously had been presented as part of Corporate costs have been included in the measurement and presentation of discontinued operations in all periods presented.
The SPA contains customary warranties of the Company and the Purchaser, with the Company’s warranties limited to an aggregate of EUR 10 million. The Company will provide various transition and product sourcing services to the Purchaser for a period of six to 24 months under a separate agreement after the closing. Also, as part of the disposition, the Company retained responsibility for the frozen defined benefits pension plan in the United Kingdom.
75
Table of Contents
OFFICE DEPOT, INC.
NOTES TO CONSOLIDATED FINANCIAL STATEMENTS (Continued)
As part of the OD European Business sale transaction, the Purchaser shall indemnify and hold the Company harmless in connection with any guarantees in place as of September 23, 2016 and given by Company in respect of the liabilities or obligations of the OD European Business. Further, if the Purchaser wishes to terminate any such guarantee or cease to comply with any underlying obligation which is subject to such a guarantee, the Purchaser shall obtain an unconditional and irrevocable release of the guarantee. However, the Company is contingently liable in the event of a breach by the Purchaser of any such obligation. The Company does not believe it is probable it would be required to perform under any of these guarantees or such underlying obligations.
The major components of Discontinued operations, net of tax presented in the Consolidated Statements of Operations for the years ended December 31, 2016, December 26, 2015 and December 27, 2014 include the following.
| (In millions) | 2016 | 2015 | 2014 | |||||||||
| Sales |
$ | 2,564 | $ | 2,758 | $ | 3,386 | ||||||
| Cost of goods sold and occupancy costs |
2,019 | 2,119 | 2,586 | |||||||||
| Operating expenses |
573 | 617 | 746 | |||||||||
| Asset impairments |
90 | — | 32 | |||||||||
| Restructuring charges |
11 | 90 | 69 | |||||||||
| Interest income |
1 | 2 | 2 | |||||||||
| Interest expense |
(5 | ) | (2 | ) | (2 | ) | ||||||
| Other income (expense), net |
(2 | ) | — | (2 | ) | |||||||
| Loss on sale or held for sale classification |
(223 | ) | — | — | ||||||||
| Income tax expense (benefit) |
(208 | ) | 16 | 10 | ||||||||
|
|
|
|||||||||||
| Discontinued operations, net of tax |
$ | (150 | ) | $ | (84 | ) | $ | (59 | ) | |||
|
|
|
|||||||||||
Disposition of the OD European Business on December 31, 2016 resulted in a pre-tax loss on sale of $108 million and is included in the table above. The tax benefit associated with discontinued operations differs from the statutory rate due to the mix of earnings and loss in the various jurisdictions, the impact of various permanent items and other factors.
76
Table of Contents
OFFICE DEPOT, INC.
NOTES TO CONSOLIDATED FINANCIAL STATEMENTS (Continued)
Assets and liabilities of discontinued operations presented in the Consolidated Balance Sheets at December 31, 2016, and December 26, 2015 are included in the following table. As the sale of the OD European Business was completed before year end 2016, accordingly, the assets and liabilities of that business are not included as of December 31, 2016.
| (In millions) | 2016 | 2015 | ||||||
| Assets |
||||||||
| Cash and cash equivalents |
$ | 44 | $ | 209 | ||||
| Receivables, net |
88 | 420 | ||||||
| Inventories |
82 | 292 | ||||||
| Prepaid expenses and other current assets |
4 | 35 | ||||||
| Property and equipment, net |
31 | — | ||||||
| Other assets |
6 | — | ||||||
| Valuation allowance |
(113 | ) | — | |||||
|
|
|
|||||||
| Current assets of discontinued operations |
$ | 142 | $ | 956 | ||||
|
|
|
|||||||
| Property and equipment, net |
$ | — | $ | 119 | ||||
| Goodwill |
— | 15 | ||||||
| Other assets |
— | 48 | ||||||
|
|
|
|||||||
| Non-current assets of discontinued operations |
$ | — | $ | 182 | ||||
|
|
|
|||||||
| Liabilities |
||||||||
| Trade accounts payable |
$ | 60 | $ | 331 | ||||
| Accrued expenses and other current liabilities |
27 | 282 | ||||||
| Income taxes payable |
2 | 4 | ||||||
| Short-term borrowings and current maturities of long-term debt |
9 | 5 | ||||||
| Deferred income taxes and other long-term liabilities |
6 | — | ||||||
|
|
|
|||||||
| Current liabilities of discontinued operations |
$ | 104 | $ | 622 | ||||
|
|
|
|||||||
| Deferred income taxes and other long-term liabilities |
$ | — | $ | 40 | ||||
| Long-term debt, net of current maturities |
— | 6 | ||||||
|
|
|
|||||||
| Non-current liabilities of discontinued operations |
$ | — | $ | 46 | ||||
|
|
|
|||||||
Cash flows from discontinued operations included depreciation and amortization of $19 million, $30 million, and $36 million for the years ended December 31, 2016, December 26, 2015 and December 27, 2014 respectively, as well as capital expenditures of $9 million, $19 million, and $27 million for the years ended December 31, 2016, December 26, 2015 and December 27, 2014, respectively.
NOTE 4. PROPERTY AND EQUIPMENT
Property and equipment consists of:
| (In millions) | December 31, 2016 |
December 26, 2015 |
||||||
| Land |
$ | 46 | $ | 50 | ||||
| Buildings |
279 | 284 | ||||||
| Leasehold improvements |
685 | 695 | ||||||
| Furniture, fixtures and equipment |
1,155 | 1,099 | ||||||
|
|
|
|||||||
| 2,165 | 2,128 | |||||||
| Less accumulated depreciation |
(1,564 | ) | (1,463 | ) | ||||
|
|
|
|||||||
| Total |
$ | 601 | $ | 665 | ||||
|
|
|
|||||||
77
Table of Contents
OFFICE DEPOT, INC.
NOTES TO CONSOLIDATED FINANCIAL STATEMENTS (Continued)
The above table of property and equipment includes assets held under capital leases as follows:
| (In millions) | December 31, 2016 |
December 26, 2015 |
||||||
| Buildings |
$ | 191 | $ | 192 | ||||
| Furniture, fixtures and equipment |
85 | 80 | ||||||
|
|
|
|||||||
| 276 | 272 | |||||||
| Less accumulated depreciation |
(165 | ) | (141 | ) | ||||
|
|
|
|||||||
| Total |
$ | 111 | $ | 131 | ||||
|
|
|
|||||||
Depreciation expense was $124 million in 2016, $172 million in 2015, $183 million in 2014.
Included in furniture, fixtures and equipment above are capitalized software costs of $476 million and $443 million at December 31, 2016 and December 26, 2015, respectively. The unamortized amounts of the capitalized software costs are $89 million and $96 million at December 31, 2016 and December 26, 2015, respectively. Amortization of capitalized software costs totaled $47 million, $67 million and $76 million in 2016, 2015 and 2014, respectively. Software development costs that do not meet the criteria for capitalization are expensed as incurred.
Estimated future amortization expense related to capitalized software at December 31, 2016 is as follows:
| (In millions) | ||||
| 2017 |
$ | 35 | ||
| 2018 |
25 | |||
| 2019 |
15 | |||
| 2020 |
9 | |||
| 2021 |
5 | |||
The weighted average remaining amortization period for capitalized software is 2.8 years.
Other assets held for sale
Certain facilities that are part of continuing operations, but have been identified for closure through integration and other activities, have been accounted for as assets held for sale. Assets held for sale primarily consist of supply chain facilities and are presented in Prepaid expenses and other current assets in the Consolidated Balance Sheets. The assets held for sale activity in 2016 is presented in the table below.
| (In millions) | ||||
| Balance as of December 26, 2015 |
$ | 30 | ||
| Additions |
6 | |||
| Dispositions |
(13 | ) | ||
|
|
|
|||
| Balance as of December 31, 2016 |
$ | 23 | ||
|
|
|
|||
Gain on dispositions associated with the Merger or restructuring activities will be recognized at the Corporate level and included when realized in Merger, restructuring and other operating (income) expenses, net in the Consolidated Statements of Operations. Losses, if any, are recognized when classified as held for sale. Gains or losses associated with dispositions of properties not associated with Merger or restructuring activities will be presented as a component of operations when the related accounting criteria are met. Refer to Note 2 for further information on Merger, restructuring and other operating (income) expenses, net, including gains realized related to disposition of held for sale assets.
78
Table of Contents
OFFICE DEPOT, INC.
NOTES TO CONSOLIDATED FINANCIAL STATEMENTS (Continued)
NOTE 5. GOODWILL AND OTHER INTANGIBLE ASSETS
Goodwill
The components of goodwill by segment are provided in the following table:
| (In millions) | North Retail |
North Business Division |
Corporate | Total | ||||||||||||
| Balance as of December 26, 2015 |
$ | 78 | $ | 285 | $ | — | $ | 363 | ||||||||
|
|
|
|||||||||||||||
| Balance as of December 31, 2016 |
$ | 78 | $ | 285 | $ | — | $ | 363 | ||||||||
|
|
|
|||||||||||||||
Goodwill in the North American Business Solutions Division in the table above is net of $349 million of accumulated impairment loss recognized in 2008.
Intangible Assets
Definite-lived intangible assets are reviewed periodically to determine whether events and circumstances indicate the carrying amount may not be recoverable or the remaining period of amortization should be revised. In connection with implementing the Real Estate Strategy and the Comprehensive Business Review, the Company recognized impairment charges associated with favorable leases at closing locations in 2016, 2015 and 2014 totaling $7 million, $1 million and $5 million, respectively. These impairment charges are presented in Asset impairments in the Consolidated Statements of Operations. Refer to Note 14 for additional information on fair value measurement.
Definite-lived intangible assets, which are included in Other intangible assets, net in the Consolidated Balance Sheets, are as follows:
| December 31, 2016 | ||||||||||||
| (In millions) | Gross Carrying Value |
Accumulated Amortization |
Net Carrying Value |
|||||||||
| Customer relationships |
$ | 74 | $ | (53 | ) | $ | 21 | |||||
| Favorable leases |
18 | (6 | ) | 12 | ||||||||
|
|
|
|||||||||||
| Total |
$ | 92 | $ | (59 | ) | $ | 33 | |||||
|
|
|
|||||||||||
| December 26, 2015 | ||||||||||||
| (In millions) | Gross Carrying Value |
Accumulated Amortization |
Net Carrying Value |
|||||||||
| Customer relationships |
$ | 74 | $ | (44 | ) | $ | 30 | |||||
| Favorable leases |
30 | (7 | ) | 23 | ||||||||
| Trade names |
8 | (8 | ) | — | ||||||||
|
|
|
|||||||||||
| Total |
$ | 112 | $ | (59 | ) | $ | 53 | |||||
|
|
|
|||||||||||
Definite-lived intangible assets generally are amortized using the straight-line method. The pattern of benefit associated with one customer relationship asset recognized as part of the Merger warranted a three-year accelerated declining balance method. Favorable leases are amortized using the straight-line method over the lives of the individual leases, including option renewals anticipated in the original valuation. The remaining weighted average amortization periods for customer relationships and favorable leases are 5 years, and 16 years, respectively.
79
Table of Contents
OFFICE DEPOT, INC.
NOTES TO CONSOLIDATED FINANCIAL STATEMENTS (Continued)
Amortization of intangible assets was $10 million in 2016, $13 million in 2015 and $18 million in 2014. Intangible assets amortization expenses are included in the Consolidated Statements of Operations in Selling, general and administrative expenses. Amortization of favorable leases is included in rent expense. Refer to Note 9 for further detail.
Estimated future amortization expense for the intangible assets is as follows:
| (In millions) | ||||
| 2017 |
$ | 7 | ||
| 2018 |
5 | |||
| 2019 |
4 | |||
| 2020 |
4 | |||
| 2021 |
4 | |||
| Thereafter |
9 | |||
|
|
|
|||
| Total |
$ | 33 | ||
|
|
|
|||
NOTE 6. TIMBER NOTES/NON-RECOURSE DEBT
As part of the Merger, the Company also acquired credit-enhanced timber installment notes with an original principal balance of $818 million (the “Installment Notes”) that were part of the consideration received in exchange for OfficeMax’s sale of timberland assets in October 2004. The Installment Notes were issued by a single-member limited liability company formed by affiliates of Boise Cascade, L.L.C. (the “Note Issuers”). The Installment Notes are non-amortizing obligations bearing interest at 4.98% and maturing in 2020. In order to support the issuance of the Installment Notes, the Note Issuers transferred a total of $818 million in cash to Wells Fargo & Company (“Wells Fargo”) (which at the time was Wachovia Corporation). Wells Fargo issued a collateral note (the “Collateral Note”) to the Note Issuers. Concurrently with the issuance of the Installment Notes and the Collateral Note, Wells Fargo guaranteed the respective Installment Notes and the Note Issuers pledged the Collateral Note as security for the performance of the obligations under the Installment Notes. As all amounts due on the Installment Notes are current and the Company has no reason to believe that the Company will not be able to collect all amounts due according to the contractual terms of the Installment Notes, the Installment Notes are reported as Timber Notes in the Consolidated Balance Sheets in the amount of $885 million and $905 million at December 31, 2016 and December 26, 2015, respectively, which represents the original principal amount of $818 million plus a fair value adjustment recorded through purchase accounting in connection with the Merger. The premium is amortized under the effective interest method as a component of interest income through the maturity date.
Also as part of the Merger, the Company acquired non-recourse debt that OfficeMax issued under the structure of the timber note transactions. In December 2004, the interests in the Installment Notes and related guarantee were transferred to wholly-owned bankruptcy remote subsidiaries in a securitization transaction. The subsidiaries pledged the Installment Notes and related guarantee and issued for cash securitized notes (the “Securitization Notes”) in the amount of $735 million supported by the Wells Fargo guaranty. Recourse on the Securitization Notes is limited to the proceeds of the applicable pledged Installment Notes and underlying Wells Fargo guaranty, and therefore there is no recourse against the Company. The Securitization Notes are non-amortizing and pay interest of 5.42% through maturity in 2019. The Securitization Notes are reported as Non-recourse debt in the Company’s Consolidated Balance Sheets in the amount of $798 million and $819 million at December 31, 2016 and December 26, 2015, respectively, which represents the original principal amount of $735 million plus a fair value adjustment recorded through purchase accounting in connection with the Merger. The premium is amortized under the effective interest method as a component of interest expense through the maturity date. Refer to Note 7 for additional information.
80
Table of Contents
OFFICE DEPOT, INC.
NOTES TO CONSOLIDATED FINANCIAL STATEMENTS (Continued)
The Installment Notes and related Securitization Notes are scheduled to mature in 2020 and 2019, respectively. The Securitization Notes have an initial term that is approximately three months shorter than the Installment Notes.
The sale of the timberlands in 2004 generated a tax gain for OfficeMax and a related deferred tax liability was recognized. The timber installment notes structure allowed the deferral of the resulting tax liability until 2020, the maturity date for the Installment Notes. At December 31, 2016, there is a deferred tax liability of $260 million related to the Installment Notes that will become due upon maturity.
NOTE 7. DEBT
Debt consists of the following:
| (In millions) | December 31, 2016 |
December 26, 2015 |
||||||
| Recourse debt: |
||||||||
| Short-term borrowings and current maturities of long-term debt: |
||||||||
| Capital lease obligations |
$ | 27 | $ | 29 | ||||
| 7.35% debentures, due 2016 |
— | 18 | ||||||
| Other current maturities of long-term debt |
2 | 4 | ||||||
|
|
|
|||||||
| Total |
$ | 29 | $ | 51 | ||||
|
|
|
|||||||
| Long-term debt, net of current maturities: |
||||||||
| Senior Secured Notes, due 2019 |
$ | — | $ | 250 | ||||
| Unamortized debt issuance cost |
— | (3 | ) | |||||
|
|
|
|||||||
| Senior Secured Notes, due 2019, net |
— | 247 | ||||||
|
|
|
|||||||
| Revenue bonds, due in varying amounts periodically through 2029 |
186 | 186 | ||||||
| American & Foreign Power Company, Inc. 5% debentures, due 2030 |
14 | 14 | ||||||
| Capital lease obligations |
146 | 169 | ||||||
| Other |
12 | 12 | ||||||
|
|
|
|||||||
| Total |
$ | 358 | $ | 628 | ||||
|
|
|
|||||||
| Non-recourse debt: |
||||||||
| 5.42% Securitization Notes, due 2019 — Refer to Note 6 |
$ | 735 | $ | 735 | ||||
| Unamortized premium |
63 | 84 | ||||||
|
|
|
|||||||
| Total |
$ | 798 | $ | 819 | ||||
|
|
|
|||||||
The Company was in compliance with all applicable financial covenants of existing loan agreements at December 31, 2016.
Amended Credit Agreement
On May 25, 2011, the Company entered into an Amended and Restated Credit Agreement with a group of lenders. Additional amendments to the Amended and Restated Credit Agreement have been entered into and were effective February 2012, March 2013, November 2013, May 2015, May 2016 and December 2016 (the Amended and Restated Credit Agreement including all amendments is referred to as the “Amended Credit Agreement”). The Amended Credit Agreement provides for an asset based, multi-currency revolving credit facility of up to $1.2 billion (the “Facility”). The Amended Credit Agreement also provides that the Facility may
81
Table of Contents
OFFICE DEPOT, INC.
NOTES TO CONSOLIDATED FINANCIAL STATEMENTS (Continued)
be increased by up to $250 million, subject to certain terms and conditions, including obtaining increased commitments from existing or new lenders. The amount that can be drawn on the Facility at any given time is determined based on percentages of certain accounts receivable, inventory and credit card receivables (the “Borrowing Base”). The Facility includes a sub-facility of up to $200 million which is available to the Company and certain of the Company’s European and Canadian subsidiaries (the “European Borrowers”). Certain of the Company’s domestic subsidiaries guaranty the obligations under the Facility (the “Domestic Guarantors”). The Amended Credit Agreement also provides for a letter of credit sub-facility of up to $400 million, as well as a swingline loan sub-facility of up to $125 million to the Company and an additional swingline loan sub-facility of up to $25 million to the European Borrowers. All loans borrowed under the Facility may be borrowed, repaid and reborrowed from time to time until the maturity date of May 13, 2021 as provided in the Amended Credit Agreement.
In conjunction with the sale of the OD European business on December 31, 2016, the European parties to the facility were removed from the agreement and all first priority liens on related European assets were released.
All amounts borrowed under the Facility, as well as the obligations of the Domestic Guarantors, are secured by a first priority lien on the Company’s and such Domestic Guarantors’ accounts receivables, inventory, cash, cash equivalents and deposit. All amounts borrowed by the European Borrowers under the Facility are secured by a lien on such European Borrowers’ accounts receivable, inventory, cash, cash equivalents and deposit accounts, as well as certain other assets. At the Company’s option, borrowings made pursuant to the Facility bear interest at either, (i) the alternate base rate (defined as the higher of the Prime Rate (as announced by the Agent), the Federal Funds Rate plus 1/2 of 1% and the one month Adjusted LIBO Rate (defined below) and 1%) or (ii) the Adjusted LIBO Rate (defined as the LIBO Rate as adjusted for statutory revenues) plus, in either case, a certain margin based on the aggregate average availability under the Facility.
The Amended Credit Agreement also contains representations, warranties, affirmative and negative covenants, and default provisions which are conditions precedent to borrowing. The most significant of these covenants and default provisions include limitations in certain circumstances on acquisitions, dispositions, share repurchases and the payment of cash dividends.
The Facility also includes provisions whereby if the global availability is less than $150 million, or the European availability is below $25 million, the Company’s cash collections go first to the agent to satisfy outstanding borrowings. Further, if total availability falls below $125 million, a fixed charge coverage ratio test is required. Any event of default that is not cured within the permitted period, including non-payment of amounts when due, any debt in excess of $25 million becoming due before the scheduled maturity date, or the acquisition of more than 40% of the ownership of the Company by any person or group, within the meaning of the Securities and Exchange Act of 1934, could result in a termination of the Facility and all amounts outstanding becoming immediately due and payable.
At December 31, 2016, the Company had $1.0 billion of available credit under the Facility based on the December 2016 Borrowing Base certificate. At December 31, 2016, no amounts were outstanding under the Facility. Letters of credit outstanding under the Facility totaled $83 million. There were no borrowings under the Facility during 2016.
Senior Secured Notes
On September 15, 2016, the Company redeemed its outstanding 9.75% Senior Secured Notes due 2019 (the “Senior Secured Notes”) which had an aggregate principal outstanding of $250 million. The Notes were redeemed for cash at the outstanding principal amount plus a $12 million premium calculated as 4.875% of the principal amount. The total payment amounted to $262 million, plus accrued interest. The premium and
82
Table of Contents
OFFICE DEPOT, INC.
NOTES TO CONSOLIDATED FINANCIAL STATEMENTS (Continued)
recognition of the remaining deferred debt issue costs totaled $15 million and are presented as Loss on extinguishment of debt in the Consolidated Statements of Operations for 2016. The $12 million cash premium paid is reported in financing activities in the Consolidated Statements of Cash Flows.
Other Short- and Long-Term Debt
As a result of the Merger, the Company assumed the liability for the amounts in the table above related to the (i) 7.35% debentures, due 2016, which were paid in full at maturity in February 2016, (ii) Revenue bonds, due in varying amounts periodically through 2029, and (iii) American & Foreign Power Company, Inc. 5% debentures, due 2030.
Capital Lease Obligations
Capital lease obligations primarily relate to buildings and equipment.
Refer to Note 6 for further information on non-recourse debt.
Schedule of Debt Maturities
Aggregate annual maturities of recourse debt and capital lease obligations are as follows:
| (In millions) | ||||
| 2017 |
$ | 39 | ||
| 2018 |
35 | |||
| 2019 |
33 | |||
| 2020 |
38 | |||
| 2021 |
28 | |||
| Thereafter |
260 | |||
|
|
|
|||
| Total |
433 | |||
| Less amount representing interest on capital leases |
(46 | ) | ||
|
|
|
|||
| Total |
387 | |||
| Less: |
||||
| Current portion |
(29 | ) | ||
|
|
|
|||
| Total long-term debt |
$ | 358 | ||
|
|
|
|||
NOTE 8. INCOME TAXES
The components of income (loss) from continuing operations before income taxes consisted of the following:
| (In millions) | 2016 | 2015 | 2014 | |||||||||
| United States |
$ | 445 | $ | 122 | $ | (286 | ) | |||||
| Foreign |
14 | (7 | ) | (5 | ) | |||||||
|
|
|
|||||||||||
| Total income (loss) from continuing operations before income taxes |
$ | 459 | $ | 115 | $ | (291 | ) | |||||
|
|
|
|||||||||||
83
Table of Contents
OFFICE DEPOT, INC.
NOTES TO CONSOLIDATED FINANCIAL STATEMENTS (Continued)
The income tax expense related to income (loss) from continuing operations consisted of the following:
| (In millions) | 2016 | 2015 | 2014 | |||||||||
| Current: |
||||||||||||
| Federal |
$ | 17 | $ | 18 | $ | (2 | ) | |||||
| State |
6 | 4 | (1 | ) | ||||||||
| Foreign |
3 | 1 | 3 | |||||||||
| Deferred : |
||||||||||||
| Federal |
(210 | ) | (1 | ) | — | |||||||
| State |
(37 | ) | 2 | 3 | ||||||||
| Foreign |
1 | (1 | ) | (1 | ) | |||||||
|
|
|
|||||||||||
| Total income tax expense (benefit) |
$ | (220 | ) | $ | 23 | $ | 2 | |||||
|
|
|
|||||||||||
The following is a reconciliation of income taxes at the U.S. Federal statutory rate to the provision for income taxes:
| (In millions) | 2016 | 2015 | 2014 | |||||||||
| Federal tax computed at the statutory rate |
$ | 160 | $ | 40 | $ | (102 | ) | |||||
| State taxes, net of Federal benefit |
(20 | ) | 5 | 1 | ||||||||
| Foreign income taxed at rates other than Federal |
— | 6 | 8 | |||||||||
| Increase (decrease) in valuation allowance |
(349 | ) | (46 | ) | 85 | |||||||
| Non-deductible Merger expenses |
— | 11 | — | |||||||||
| Other non-deductible expenses |
3 | 4 | 13 | |||||||||
| Non-taxable income and additional deductible expenses |
(13 | ) | (2 | ) | (2 | ) | ||||||
| Change in unrecognized tax benefits |
(3 | ) | — | — | ||||||||
| Tax expense from intercompany transactions |
— | 6 | — | |||||||||
| Subpart F and dividend income, net of foreign tax credits |
2 | 1 | 2 | |||||||||
| Other items, net |
— | (2 | ) | (3 | ) | |||||||
|
|
|
|||||||||||
| Income tax expense (benefit) |
$ | (220 | ) | $ | 23 | $ | 2 | |||||
|
|
|
|||||||||||
The effective tax rate for 2016 was primarily impacted by the change in the Company’s U.S. federal and state valuation allowance. In 2016, the Company experienced a lower than expected effective rate due to the realization of certain deferred tax assets during the year whose benefits were limited in prior periods due to the valuation allowance. In addition, the Company recognized a discrete non-cash income tax benefit for the reversal of the majority of the remaining U.S. federal and state valuation allowance. The effective tax rate for 2016 was also impacted by the deductibility of certain formerly non-deductible expenses primarily related to the Staples Acquisition. In 2015, the Company incurred charges related to certain Staples Acquisition expenses that are not deductible for tax purposes, which increased the effective tax rate for 2015. With the termination of the merger agreement in 2016, a large portion of these expenses became deductible in 2016, resulting in a lower effective tax rate for 2016. In addition, the 2015 effective tax rate includes U.S. income tax expense on a foreign exchange gain associated with the restructuring of certain intercompany financing. In 2014, the Company recognized income tax expense on a pretax loss due to deferred tax benefits not being recognized on pretax losses in certain tax jurisdictions with valuation allowances, while income tax expense was recognized in tax jurisdictions with pretax income.
The Company operates in several foreign jurisdictions with income tax rates that differ from the U.S. Federal statutory rate, which resulted in an expense for all years presented in the effective tax rate reconciliation. Significant foreign tax jurisdictions for which the Company realized such expense are Canada and Puerto Rico after the sale of the other international operations.
84
Table of Contents
OFFICE DEPOT, INC.
NOTES TO CONSOLIDATED FINANCIAL STATEMENTS (Continued)
Due to valuation allowances against the Company’s deferred tax assets, no income tax benefit was initially recognized in the 2015 or 2014 Consolidated Statement of Operations related to stock-based compensation expense due to the Company’s inability to utilize them to offset current income taxes payable. However, due to the profitable tax-paying position in the U.S. in 2015, the Company realized an income tax benefit of $3 million for the utilization of net operating loss carryforwards that had resulted from excess stock-based compensation deductions for which no benefit was previously recorded. The Company also realized an income tax benefit of $2 million for excess stock-based compensation deductions resulting from the exercise and vesting of equity awards during 2016 and $7 million for excess stock-based compensation deductions resulting from the exercise and vesting of equity awards during 2015. These income tax benefits were recorded as increases to additional paid-in capital in 2015 and 2016.
The components of deferred income tax assets and liabilities consisted of the following:
| (In millions) | December 31, 2016 |
December 26, 2015 |
||||||
| U.S. and foreign loss carryforwards |
$ | 275 | $ | 79 | ||||
| Deferred rent credit |
61 | 68 | ||||||
| Pension and other accrued compensation |
134 | 200 | ||||||
| Accruals for facility closings |
29 | 43 | ||||||
| Inventory |
20 | 19 | ||||||
| Self-insurance accruals |
29 | 33 | ||||||
| Deferred revenue |
24 | 45 | ||||||
| U.S. and foreign income tax credit carryforwards |
197 | 223 | ||||||
| Allowance for bad debts |
5 | 12 | ||||||
| Accrued expenses |
28 | 32 | ||||||
| Basis difference in fixed assets |
69 | 73 | ||||||
| Other items, net |
5 | — | ||||||
|
|
|
|||||||
| Gross deferred tax assets |
876 | 827 | ||||||
| Valuation allowance |
(140 | ) | (522 | ) | ||||
|
|
|
|||||||
| Deferred tax assets |
736 | 305 | ||||||
|
|
|
|||||||
| Internal software |
5 | 5 | ||||||
| Installment gain on sale of timberlands |
260 | 263 | ||||||
| Deferred Subpart F income |
— | 27 | ||||||
| Undistributed foreign earnings |
8 | 2 | ||||||
|
|
|
|||||||
| Deferred tax liabilities |
273 | 297 | ||||||
|
|
|
|||||||
| Net deferred tax assets |
$ | 463 | $ | 8 | ||||
|
|
|
|||||||
As of December 31, 2016 and December 26, 2015, deferred income tax liabilities amounting to $3 million and $2 million, respectively, are included in Deferred income taxes and other long-term liabilities.
As of December 31, 2016, the Company has utilized all of its U.S. Federal net operating loss (“NOL”) carryforwards. The Company has $91 million of foreign and $1.2 billion of state NOL carryforwards. Of the foreign NOL carryforwards, $35 million can be carried forward indefinitely, none will expire in 2017 and the remaining balance will expire between 2018 and 2036. Of the state NOL carryforwards, $37 million will expire in 2017, and the remaining balance will expire between 2018 and 2036. The Company has capital loss carryover available to offset future capital gains generated of $555 million which expires in 2021. The Company also has $89 million of U.S. Federal alternative minimum tax credit carryforwards, which can be used to reduce future regular federal income tax, if any, over an indefinite period. Additionally, the Company has $96 million of U.S.
85
Table of Contents
OFFICE DEPOT, INC.
NOTES TO CONSOLIDATED FINANCIAL STATEMENTS (Continued)
Federal foreign tax credit carryforwards, which expire between 2019 and 2026, and $13 million of state and foreign tax credit carryforwards, $3 million of which can be carried forward indefinitely, and the remaining balance will expire between 2023 and 2027.
As of December 31, 2016, the Company has not triggered an “ownership change” as defined in Internal Revenue Code Section 382 or other similar provisions that would limit the use of NOL and tax credit carryforwards. However, if the Company were to experience an ownership change in future periods, the Company’s deferred tax assets and income tax expense may be negatively impacted. Deferred income taxes have been provided on all undistributed earnings of foreign subsidiaries.
The following summarizes the activity related to valuation allowances for deferred tax assets:
| (In millions) | 2016 | 2015 | 2014 | |||||||||
| Beginning balance |
$ | 522 | $ | 571 | $ | 448 | ||||||
| Additions, charged to expense |
— | — | 123 | |||||||||
| Reductions |
(382 | ) | (49 | ) | — | |||||||
|
|
|
|||||||||||
| Ending balance |
$ | 140 | $ | 522 | $ | 571 | ||||||
|
|
|
|||||||||||
The Company has significant deferred tax assets in the U.S. against which valuation allowances have been established to reduce such deferred tax assets to the amount that is more likely than not to be realized. The establishment of valuation allowances requires significant judgment and is impacted by various estimates. Both positive and negative evidence, as well as the objectivity and verifiability of that evidence, is considered in determining the appropriateness of recording a valuation allowance on deferred tax assets. An accumulation of recent pre-tax losses is considered strong negative evidence in that evaluation. As of the third quarter of 2016, the Company concluded that it was more likely than not that a benefit from a substantial portion of its U.S. federal and state deferred tax assets would be realized. This conclusion was based on a detailed evaluation of all available positive and negative evidence and the weight of such evidence, the current financial position and results of operations for the current and preceding years, and the expectation of continued earnings. The Company determined that approximately $382 million of its U.S. federal and state valuation allowance should be reversed in 2016.
After the 2016 reversal, the Company will have a U.S. valuation allowance for certain U.S. federal credits and certain state tax attributes. The remaining valuation allowances relate to deferred tax assets that require certain types of income or for income to be earned in certain jurisdictions in order to be realized. It is reasonably possible that a portion of the remaining valuation allowance may be released in the future based upon continued profitability. The Company will continue to assess the realizability of its deferred tax assets in the U.S. and remaining foreign jurisdictions in future periods.
The Company’s total valuation allowance decreased by $382 million during 2016. The Company recognized income tax benefit of $349 million associated with the release of valuation allowances in the U.S. federal and state jurisdictions in 2016 because the realizability of the related deferred tax assets was more likely than not.
86
Table of Contents
OFFICE DEPOT, INC.
NOTES TO CONSOLIDATED FINANCIAL STATEMENTS (Continued)
The following table summarizes the activity related to unrecognized tax benefits:
| (In millions) | 2016 | 2015 | 2014 | |||||||||
| Beginning balance |
$ | 18 | $ | 22 | $ | 15 | ||||||
| Increase related to current year tax positions |
1 | 1 | 6 | |||||||||
| Increase related to prior year tax positions |
— | 1 | 4 | |||||||||
| Decrease related to prior year tax positions |
— | (5 | ) | (2 | ) | |||||||
| Decrease related to lapse of statute of limitations |
— | (1 | ) | — | ||||||||
| Decrease related to settlements with taxing authorities |
(5 | ) | — | (1 | ) | |||||||
|
|
|
|||||||||||
| Ending balance |
$ | 14 | $ | 18 | $ | 22 | ||||||
|
|
|
|||||||||||
Due to the completion of the Internal Revenue Service (“IRS”) examination for 2014, the Company’s balance of unrecognized tax benefits decreased by $4 million during 2016, which did impact income tax expense by $3 million due to an offsetting change in valuation allowance. Included in the balance of $14 million at December 31, 2016, are $7 million of unrecognized tax benefits that, if recognized, would affect the effective tax rate. The difference of $7 million primarily results from tax positions which if sustained would be offset by changes in valuation allowance. It is not anticipated that certain tax positions will be resolved within the next 12 months, which would decrease the Company’s balance of unrecognized tax benefits. Additionally, the Company anticipates that it is reasonably possible that new issues will be raised or resolved by tax authorities that may require changes to the balance of unrecognized tax benefits; however, an estimate of such changes cannot reasonably be made.
The Company recognizes interest related to unrecognized tax benefits in interest expense and penalties in the provision for income taxes. The Company recognized interest and penalty expense of $3 million and $2 million in 2016 and 2015, respectively. The Company recognized a net interest and penalty benefit of $9 million in 2014 due to settlements reached with certain taxing authorities. The Company had approximately $6 million accrued for the payment of interest and penalties as of December 31, 2016, which is not included in the table above.
The Company files a U.S. federal income tax return and other income tax returns in various states and foreign jurisdictions. With few exceptions, the Company is no longer subject to U.S. federal and state and local income tax examinations for years before 2014 and 2009, respectively. During 2015, the IRS examination of the OfficeMax 2012 U.S. federal income tax return concluded, which resulted in a $6 million decrease in tax credit carryforwards. Such decrease had no impact on income tax expense due to an offsetting change in valuation allowance. The acquired OfficeMax U.S. consolidated group is no longer subject to U.S. federal and state and local income tax examinations for years before 2013 and 2006, respectively. The U.S. federal income tax returns for 2015 are currently under review. Generally, the Company is subject to routine examination for years 2008 and forward in its international tax jurisdictions.
NOTE 9. LEASES
The Company leases retail stores and other facilities, vehicles, and equipment under operating lease agreements. Facility leases typically are for a fixed non-cancellable term with one or more renewal options. In addition to minimum rentals, the Company is required to pay certain executory costs such as real estate taxes, insurance and common area maintenance on most of the facility leases. Many lease agreements contain tenant improvement allowances, rent holidays, and/or rent escalation clauses. Certain leases contain provisions for additional rent to be paid if sales exceed a specified amount, though such payments have been immaterial during the years presented.
87
Table of Contents
OFFICE DEPOT, INC.
NOTES TO CONSOLIDATED FINANCIAL STATEMENTS (Continued)
For tenant improvement allowances, scheduled rent increases, and rent holidays, a deferred rent liability is recognized and amortized over the terms of the related leases as a reduction of rent expense. Rent related accruals totaled $196 million and $221 million at December 31, 2016 and December 26, 2015, respectively. The short-term and long-term components of these liabilities are included in Accrued expenses and other current liabilities and Deferred income taxes and other long-term liabilities, respectively, on the Consolidated Balance Sheets.
Rent expense, including equipment rental, was $484 million, $513 million, $602 million in 2016, 2015 and 2014, respectively. Rent expense was reduced by sublease income of $2 million in 2016, $4 million in 2015 and $5 million in 2014.
Future minimum lease payments due under the non-cancelable portions of leases as of December 31, 2016 include facility leases that were accrued as store closure costs and are as follows:
| (In millions) | ||||
| 2017 |
$ | 486 | ||
| 2018 |
369 | |||
| 2019 |
275 | |||
| 2020 |
180 | |||
| 2021 |
104 | |||
| Thereafter |
173 | |||
|
|
|
|||
| 1,587 | ||||
| Less sublease income |
(31 | ) | ||
|
|
|
|||
| Total |
$ | 1,556 | ||
|
|
|
|||
These minimum lease payments do not include contingent rental payments that may be due based on a percentage of sales in excess of stipulated amounts.
As of December 31, 2016 and December 26, 2015, unfavorable lease deferred credit for store leases with terms above market value amounted to $10 million and $18 million, respectively, and are included in Deferred income taxes and other long-term liabilities in the Consolidated Balance Sheets. The unfavorable lease values are amortized on a straight-line basis over the lives of the leases, unless the facility has been identified for closure under the Real Estate Strategy or Comprehensive Business Review. In 2016, 2015 and 2014, the net amortization of favorable and unfavorable lease values reduced rent expense by $4 million, $6 million and $7 million, respectively. Refer to Note 5 for further information favorable leases.
The Company has capital lease obligations primarily related to buildings and equipment. Refer to Note 7 for further details on amounts due related to capital lease obligations.
NOTE 10. STOCKHOLDERS’ EQUITY
Preferred Stock
As of December 31, 2016 and December 26, 2015, there were 1,000,000 shares of $0.01 par value preferred stock authorized; no shares were issued and outstanding.
88
Table of Contents
OFFICE DEPOT, INC.
NOTES TO CONSOLIDATED FINANCIAL STATEMENTS (Continued)
Treasury Stock
In May 2016, the Company’s Board of Directors authorized a stock repurchase program of up to $100 million of its outstanding common stock. During July 2016, the Board of Directors authorized increasing the share repurchase program to $250 million of its outstanding common stock. The stock repurchase authorization permits the Company to repurchase stock from time-to-time through a combination of open market repurchases, privately negotiated transactions, 10b5-1 trading plans, accelerated stock repurchase transactions and/or other derivative transactions. The authorization extends through the end of 2018 and may be suspended or discontinued at any time. The exact timing of share repurchases will depend on market conditions and other factors, and will be funded through existing liquidity.
Under the stock repurchase program, the Company purchased approximately 37 million shares at a cost of $132 million. As of December 31, 2016, $118 million remains available for repurchase under the current authorization.
At December 31, 2016, there were 43 million common shares held in treasury. The Company’s Amended Credit Facility includes certain covenants on restricted payments which include common stock repurchases, based on the Company’s liquidity and borrowing availability. The restrictions include the following: the Company may not acquire any equity interests in an aggregate amount exceeding approximately $125 million during any fiscal year provided that; (i) no default or event of default shall have occurred and be continuing, and; (ii) liquidity shall be at least $500 million, including aggregate availability of at least $400 million. There were no repurchases of common stock in 2015. Refer to Note 7 for additional information.
Accumulated Other Comprehensive Income
With the disposition of the OD European Business on December 31, 2016, the CTA balance associated with that business was recognized in earnings. Balances associated with the remaining disposal groups in discontinued operations will be recognized in earrings during the period in which those dispositions are completed. Accumulated other comprehensive income activity, net of tax, where applicable, is provided in the following tables:
| (In millions) | Foreign Currency Translation Adjustments |
Change in Deferred Pension |
Total | |||||||||
| Balance at December 26, 2015 |
$ | 108 | $ | (78 | ) | $ | 30 | |||||
| Other comprehensive income (loss) activity before reclassifications |
(11 | ) | 30 | 19 | ||||||||
| Reclassification of foreign currency translation adjustments realized upon disposal of business (a) |
(164 | ) | — | (164 | ) | |||||||
| Tax impact |
— | (14 | ) | (14 | ) | |||||||
|
|
|
|||||||||||
| Net year-to-date other comprehensive income |
(175 | ) | 16 | (159 | ) | |||||||
|
|
|
|||||||||||
| Balance at December 31, 2016 |
$ | (67 | ) | $ | (62 | ) | $ | (129 | ) | |||
|
|
|
|||||||||||
| (a) | Amounts in parentheses indicate an increase to earnings. |
89
Table of Contents
OFFICE DEPOT, INC.
NOTES TO CONSOLIDATED FINANCIAL STATEMENTS (Continued)
| (In millions) | Foreign Currency Translation Adjustments |
Change in Deferred Pension |
Total | |||||||||
| Balance at December 27, 2014 |
$ | 186 | $ | (79 | ) | $ | 107 | |||||
| Other comprehensive income (loss) activity before reclassifications |
(78 | ) | 2 | (76 | ) | |||||||
| Reclassification of foreign currency translation adjustments realized upon disposal of business (a) |
— | — | — | |||||||||
| Tax impact |
— | (1 | ) | (1 | ) | |||||||
|
|
|
|||||||||||
| Net year-to-date other comprehensive income |
(78 | ) | 1 | (77 | ) | |||||||
|
|
|
|||||||||||
| Balance at December 26, 2015 |
$ | 108 | $ | (78 | ) | $ | 30 | |||||
|
|
|
|||||||||||
| (a) | Amounts in parentheses indicate an increase to earnings. |
The component balances are net of immaterial tax impacts, where applicable.
NOTE 11. STOCK-BASED COMPENSATION
Long-Term Incentive Plans
During 2015, the Company’s Board of Directors adopted, and the shareholders approved, the Office Depot, Inc. 2015 Long-Term Incentive Plan (the “Plan”). The Plan replaces the Office Depot, Inc. 2007 Long-Term Incentive Plan, as amended, and the 2003 OfficeMax Incentive and Performance Plan (both referred to as the “Prior Plans”). No additional awards were granted under the Prior Plans effective April 27, 2015, the effective date of the Plan. The Plan permits the issuance of stock options, nonqualified stock options, stock appreciation rights, restricted stock, restricted stock units, performance shares, and other equity-based incentive awards. Employee share-based awards are generally issued in the first quarter of the year.
Stock Options
The Company’s stock option exercise price for each grant of a stock option shall not be less than 100% of the fair market value of a share of common stock on the date the option is granted. Options granted under the Prior Plans have vesting periods ranging from one to five years and from one to three years after the date of grant, provided that the individual is continuously employed with the Company. Following the date of grant, all options granted under the Prior Plans expire in no more than ten years. No stock options were granted in 2016, 2015 or 2014.
A summary of the activity in the stock option awards for the last three years is presented below.
| 2016 | 2015 | 2014 | ||||||||||||||||||||||
| Shares | Weighted Average Exercise Price |
Shares | Weighted Average Exercise Price |
Shares | Weighted Average Exercise Price |
|||||||||||||||||||
| Outstanding at beginning of year |
5,779,597 | $ | 4.53 | 8,602,626 | $ | 4.53 | 22,702,534 | $ | 4.48 | |||||||||||||||
| Granted |
— | — | — | — | — | — | ||||||||||||||||||
| Forfeited |
(108,818 | ) | 5.04 | (574,967 | ) | 9.29 | (1,323,664 | ) | 10.46 | |||||||||||||||
| Exercised |
(1,614,243 | ) | 1.89 | (2,248,062 | ) | 3.34 | (12,776,244 | ) | 3.83 | |||||||||||||||
|
|
|
|||||||||||||||||||||||
| Outstanding at end of year |
4,056,536 | $ | 5.56 | 5,779,597 | $ | 4.53 | 8,602,626 | $ | 4.53 | |||||||||||||||
|
|
|
|||||||||||||||||||||||
90
Table of Contents
OFFICE DEPOT, INC.
NOTES TO CONSOLIDATED FINANCIAL STATEMENTS (Continued)
The following table summarizes information about stock options outstanding and exercisable at December 31, 2016.
| Options Outstanding | Options Exercisable | |||||||||||||||||||||||
| Range of Exercise Prices |
Number Outstanding |
Weighted Average Remaining Contractual Life (in years) |
Weighted Average Exercise Price |
Number Exercisable |
Weighted Average Remaining Contractual Life (in years) |
Weighted Average Exercise Price |
||||||||||||||||||
| $0.83—$3.00 |
183,862 | 1.71 | 1.64 | 183,862 | 1.71 | 1.64 | ||||||||||||||||||
| 3.01—5.12 |
569,901 | 1.02 | 4.34 | 569,901 | 1.02 | 4.34 | ||||||||||||||||||
| 5.13 |
183,993 | 0.43 | 5.13 | 183,993 | 0.43 | 5.13 | ||||||||||||||||||
| 5.14—8.00 |
2,806,280 | 5.05 | 5.64 | 2,806,280 | 5.05 | 5.64 | ||||||||||||||||||
| 8.01—11.27 |
312,500 | 0.18 | 9.64 | 312,500 | 0.18 | 9.64 | ||||||||||||||||||
|
|
|
|||||||||||||||||||||||
| $0.83—$11.27 |
4,056,536 | 3.76 | 5.56 | 4,056,536 | 3.76 | 5.56 | ||||||||||||||||||
|
|
|
|||||||||||||||||||||||
The intrinsic value of options exercised in 2016, 2015 and 2014, was $5 million, $12 million and $27 million, respectively. The aggregate intrinsic value of options outstanding and exercisable at December 31, 2016 was $0.7 million and $0.7 million, respectively.
At December 31, 2016, all outstanding stock options were vested and all related compensation expense had been recognized. The number of exercisable options was 4.1 million and 5.1 million shares of common stock at December 31, 2016 and December 26, 2015, respectively.
Restricted Stock and Restricted Stock Units
In 2016, the Company granted 10.1 million shares of restricted stock and restricted stock units to eligible employees which included 0.4 million shares granted to the Board of Directors. The Board of Directors are granted restricted stock units as part of their annual compensation which vest immediately on the grant date with distribution to occur following their separation from service with the Company. Restricted stock grants to Company employees typically vest annually over a three-year service period. A summary of the status of the Company’s nonvested shares and changes during 2016, 2015 and 2014 is presented below.
| 2016 | 2015 | 2014 | ||||||||||||||||||||||
| Shares | Weighted Average Grant- Date Price |
Shares | Weighted Average Grant- Date Price |
Shares | Weighted Average Grant- Date Price |
|||||||||||||||||||
| Outstanding at beginning of year |
9,588,889 | $ | 6.07 | 10,708,372 | $ | 4.65 | 10,207,546 | $ | 4.76 | |||||||||||||||
| Granted |
10,099,481 | 3.53 | 2,886,640 | 9.43 | 5,809,821 | 4.33 | ||||||||||||||||||
| Vested |
(3,521,765 | ) | 5.31 | (3,370,569 | ) | 4.46 | (4,179,789 | ) | 4.75 | |||||||||||||||
| Forfeited |
(3,418,814 | ) | 4.51 | (635,554 | ) | 5.94 | (1,129,206 | ) | 3.65 | |||||||||||||||
|
|
|
|||||||||||||||||||||||
| Outstanding at end of year |
12,747,791 | $ | 4.41 | 9,588,889 | $ | 6.07 | 10,708,372 | $ | 4.65 | |||||||||||||||
|
|
|
|||||||||||||||||||||||
As of December 31, 2016, there was approximately $27 million of total unrecognized compensation cost related to nonvested restricted stock. This expense, net of forfeitures, is expected to be recognized over a weighted-average period of approximately 2 years. Total outstanding shares of 12.7 million include 3.1 million granted to members of the Board of Directors that have vested but will not be issued until separation from service and 9.6 million unvested shares granted to employees. Of the 9.6 million unvested shares at year end, the Company estimates that 9.2 million shares will vest. The total fair value of shares at the time they vested during 2016 was $19 million.
91
Table of Contents
OFFICE DEPOT, INC.
NOTES TO CONSOLIDATED FINANCIAL STATEMENTS (Continued)
Performance-Based Incentive Program
The Company has a performance-based long-term incentive program consisting of performance stock units. Payouts under this program are based on achievement of certain financial targets set by the Board of Directors and are subject to additional service vesting requirements, generally three years from the grant date.
A summary of the activity in the performance-based long-term incentive program since inception is presented below.
| 2016 | 2015 | 2014 | ||||||||||||||||||||||
| Shares | Weighted Average Grant- Price |
Shares | Weighted Average Grant- Price |
Shares | Weighted Average Grant- Price |
|||||||||||||||||||
| Outstanding at beginning of the year |
8,589,114 | $ | 5.95 | 6,808,964 | $ | 4.43 | 3,076,292 | $ | 4.45 | |||||||||||||||
| Granted |
9,635,184 | 3.37 | 2,745,303 | 9.45 | 5,289,047 | 4.55 | ||||||||||||||||||
| Vested |
(161,408 | ) | 4.32 | (283,244 | ) | 3.98 | (1,246,006 | ) | 3.74 | |||||||||||||||
| Forfeited |
(4,320,506 | ) | 5.69 | (681,909 | ) | 5.67 | (310,369 | ) | 4.16 | |||||||||||||||
|
|
|
|||||||||||||||||||||||
| Outstanding at end of the year |
13,742,384 | 4.66 | 8,589,114 | $ | 5.95 | 6,808,964 | $ | 4.43 | ||||||||||||||||
|
|
|
|||||||||||||||||||||||
As of December 31, 2016, there was approximately $29 million of total unrecognized compensation expense related to the performance-based long-term incentive program. This expense, net of forfeitures, is expected to be recognized over a weighted-average period of approximately 1.9 years. Forfeitures in the table above include adjustments to the share impact of anticipated performance achievement. Of the 13.7 million shares outstanding at year end, the Company estimates that 12.9 million shares will vest. The total fair value of shares at the time they vested during 2016 was $0.7 million.
NOTE 12. EMPLOYEE BENEFIT PLANS
Pension and Other Postretirement Benefit Plans
Pension and Other Postretirement Benefit Plans — North America
The Company has retirement obligations under OfficeMax’s U.S. pension plans. The Company sponsors these defined benefit pension plans covering certain terminated employees, vested employees, retirees and some active employees. In 2004 or earlier, OfficeMax’s pension plans were closed to new entrants and the benefits of eligible participants were frozen. Under the terms of these plans, the pension benefit for employees was based primarily on the employees’ years of service and benefit plan formulas that varied by plan. The Company’s general funding policy is to make contributions to the plans in amounts that are within the limits of deductibility under current tax regulations, and not less than the minimum contribution required by law.
Additionally, under previous OfficeMax arrangements, the Company has responsibility for sponsoring retiree medical benefit and life insurance plans including plans related to operations in the U.S. and Canada (referred to as “Other Benefits” in the tables below). The type of retiree benefits and the extent of coverage vary based on employee classification, date of retirement, location, and other factors. All of these postretirement medical plans are unfunded. The Company explicitly reserves the right to amend or terminate its retiree medical and life insurance plans at any time, subject only to constraints, if any, imposed by the terms of collective bargaining agreements. Amendment or termination may significantly affect the amount of expense incurred.
92
Table of Contents
OFFICE DEPOT, INC.
NOTES TO CONSOLIDATED FINANCIAL STATEMENTS (Continued)
Obligations and Funded Status
The following table provides a reconciliation of changes in the projected benefit obligation and the fair value of plans assets, as well as the funded status of the plans to amounts recognized on the Company’s Consolidated Balance Sheets. Pension plans with benefit obligations and accumulated benefit obligations exceed plan assets in all individual plans.
| Pension Benefits | Other Benefits | |||||||||||||||
| (In millions) | 2016 | 2015 | 2016 | 2015 | ||||||||||||
| Changes in projected benefit obligation: |
||||||||||||||||
| Obligation at beginning of period |
$ | 1,094 | $ | 1,218 | $ | 13 | $ | 17 | ||||||||
| Service cost |
7 | 3 | — | — | ||||||||||||
| Interest cost |
45 | 46 | 1 | 1 | ||||||||||||
| Actuarial (gain) loss |
(8 | ) | (78 | ) | — | (2 | ) | |||||||||
| Currency exchange rate change |
— | — | — | (2 | ) | |||||||||||
| Benefits paid |
(138 | ) | (95 | ) | (1 | ) | (1 | ) | ||||||||
|
|
|
|||||||||||||||
| Obligation at end of period |
$ | 1,000 | $ | 1,094 | $ | 13 | $ | 13 | ||||||||
|
|
|
|||||||||||||||
| Change in plan assets: |
||||||||||||||||
| Fair value of plan assets at beginning of period |
$ | 922 | $ | 1,039 | $ | — | $ | — | ||||||||
| Actual return (loss) on plan assets |
84 | (30 | ) | — | — | |||||||||||
| Employer contribution |
2 | 8 | 1 | 1 | ||||||||||||
| Benefits paid |
(138 | ) | (95 | ) | (1 | ) | (1 | ) | ||||||||
|
|
|
|||||||||||||||
| Fair value of plan assets at end of period |
870 | 922 | — | — | ||||||||||||
|
|
|
|||||||||||||||
| Net liability recognized at end of period |
$ | (130 | ) | $ | (172 | ) | $ | (13 | ) | $ | (13 | ) | ||||
|
|
|
|||||||||||||||
The following table shows the amounts recognized in the Consolidated Balance Sheets related to the Company’s North America defined benefit pension and other postretirement benefit plans as of year-ends:
| Pension Benefits | Other Benefits | |||||||||||||||
| (In millions) | 2016 | 2015 | 2016 | 2015 | ||||||||||||
| Noncurrent assets |
$ | — | $ | — | $ | — | $ | — | ||||||||
| Current liabilities |
(2 | ) | (3 | ) | (1 | ) | (1 | ) | ||||||||
| Noncurrent liabilities |
(128 | ) | (169 | ) | (12 | ) | (12 | ) | ||||||||
|
|
|
|||||||||||||||
| Net amount recognized |
$ | (130 | ) | $ | (172 | ) | $ | (13 | ) | $ | (13 | ) | ||||
|
|
|
|||||||||||||||
Components of Net Periodic Cost (Benefit)
The components of net periodic cost (benefit) are as follows:
| Pension Benefits | Other Benefits | |||||||||||||||||||||||
| (In millions) | 2016 | 2015 | 2014 | 2016 | 2015 | 2014 | ||||||||||||||||||
| Service cost |
$ | 7 | $ | 3 | $ | 3 | $ | — | $ | — | $ | — | ||||||||||||
| Interest cost |
45 | 46 | 52 | 1 | 1 | 1 | ||||||||||||||||||
| Expected return on plan assets |
(55 | ) | (56 | ) | (62 | ) | — | — | — | |||||||||||||||
|
|
|
|||||||||||||||||||||||
| Net periodic cost (benefit) |
$ | (3 | ) | $ | (7 | ) | $ | (7 | ) | $ | 1 | $ | 1 | $ | 1 | |||||||||
|
|
|
|||||||||||||||||||||||
93
Table of Contents
OFFICE DEPOT, INC.
NOTES TO CONSOLIDATED FINANCIAL STATEMENTS (Continued)
Other changes in plan assets and benefit obligations recognized in other comprehensive loss (income) are as follows:
| Pension Benefits | Other Benefits | |||||||||||||||||||||||
| (In millions) | 2016 | 2015 | 2014 | 2016 | 2015 | 2014 | ||||||||||||||||||
| Accumulated other comprehensive loss (income) at beginning of year |
$ | 76 | $ | 67 | $ | (26 | ) | $ | (1 | ) | $ | 1 | $ | — | ||||||||||
| Net loss (gain) |
(38 | ) | 9 | 93 | — | (2 | ) | 1 | ||||||||||||||||
|
|
|
|||||||||||||||||||||||
| Accumulated other comprehensive loss (income) at end of year |
$ | 38 | $ | 76 | $ | 67 | $ | (1 | ) | $ | (1 | ) | $ | 1 | ||||||||||
|
|
|
|||||||||||||||||||||||
Less than $1 million of the accumulated other comprehensive loss is expected to be recognized as components of net periodic cost during 2017.
Accumulated other comprehensive loss (income) as of year-ends 2016 and 2015 consist of net losses (gains).
Assumptions
The assumptions used in accounting for the Company’s plans are estimates of factors including, among other things, the amount and timing of future benefit payments. The following table presents the key weighted average assumptions used in the measurement of the Company’s benefit obligations as of year-ends:
| Other Benefits | ||||||||||||||||||||||||||||||||||||
| Pension Benefits | United States | Canada | ||||||||||||||||||||||||||||||||||
| 2016 | 2015 | 2014 | 2016 | 2015 | 2014 | 2016 | 2015 | 2014 | ||||||||||||||||||||||||||||
| Discount rate |
4.11 | % | 4.33 | % | 3.91 | % | 3.60 | % | 3.70 | % | 3.40 | % | 3.80 | % | 4.00 | % | 4.00% | |||||||||||||||||||
The following table presents the weighted average assumptions used in the measurement of net periodic benefit:
| Other Benefits | ||||||||||||||||||||||||||||||||||||
| Pension Benefits | United States | Canada | ||||||||||||||||||||||||||||||||||
| 2016 | 2015 | 2014 | 2016 | 2015 | 2014 | 2016 | 2015 | 2014 | ||||||||||||||||||||||||||||
| Discount rate |
4.33 | % | 3.91 | % | 4.84 | % | 3.70 | % | 3.40 | % | 4.00 | % | 4.00 | % | 4.00 | % | 4.80% | |||||||||||||||||||
| Expected long-term rate of return on plan assets |
6.00 | % | 5.85 | % | 6.50 | % | — | % | — | % | — | % | — | % | — | % | —% | |||||||||||||||||||
For pension benefits, the selected discount rates (which is required to be the rates at which the projected benefit obligations could be effectively settled as of the measurement date) are based on the rates of return for a theoretical portfolio of high-grade corporate bonds (rated AA- or better) with cash flows that generally match expected benefit payments in future years. In selecting bonds for this theoretical portfolio, the Company focuses on bonds that match cash flows to benefit payments and limit the concentration of bonds by issuer. To the extent scheduled bond proceeds exceed the estimated benefit payments in a given period; the yield calculation assumes those excess proceeds are reinvested at an assumed forward rate. The implied forward rate used in the bond model is based on the Citigroup Pension Discount Curve as of the last day of the year. The selected discount rate for other benefits is from a discount rate curve matched to the assumed payout of related obligations.
The expected long-term rates of return on plan assets assumptions are based on the weighted average of expected returns for the major asset classes in which the plans’ assets are held. Asset-class expected returns are based on long-term historical returns, inflation expectations, forecasted gross domestic product and earnings growth, as well as other economic factors. The weights assigned to each asset class are based on the Company’s investment strategy. The weighted average expected return on plan assets used in the calculation of net periodic pension cost for 2017 is 5.76%.
94
Table of Contents
OFFICE DEPOT, INC.
NOTES TO CONSOLIDATED FINANCIAL STATEMENTS (Continued)
Obligation and costs related to the Canadian retiree health plan are impacted by changes in trend rates.
The following table presents the assumed healthcare cost trend rates used in measuring the Company’s postretirement benefit obligations at year-ends:
| 2016 | 2015 | 2014 | ||||||||||
| Weighted average assumptions as of year-end: |
||||||||||||
| Healthcare cost trend rate assumed for next year |
5.90 | % | 6.20 | % | 6.40% | |||||||
| Rate to which the cost trend rate is assumed to decline (the ultimate trend rate) |
4.50 | % | 4.50 | % | 4.50% | |||||||
| Year that the rate reaches the ultimate trend rate |
2022 | 2022 | 2022 | |||||||||
A 1% change in the assumed healthcare cost trend rates would impact operating income by less than $1 million.
The Company reassessed the mortality assumptions to measure the North American pension and other postretirement benefit plan obligations at year end 2016, adopting the most applicable mortality tables and improvement factors released in 2016 by The Society of Actuaries’ Retirement Plan Experience Committee. As a result of this assumption change, pension and other postretirement benefit plan obligations decreased by $19 million and less than $1 million, respectively. As a result of the mortality assumption change in 2015, pension and other postretirement benefit plan obligations decreased by $25 million and less than $1 million, respectively.
Plan Assets
The allocation of pension plan assets by category at year-ends is as follows:
| 2016 | 2015 | |||||||
| Money market funds |
3 | % | 2% | |||||
| Equity securities |
11 | 9 | ||||||
| Fixed-income securities |
50 | 57 | ||||||
| Mutual funds |
36 | 31 | ||||||
| Other |
— | 1 | ||||||
|
|
|
|||||||
| 100 | % | 100% | ||||||
The Employee Benefit Committee is responsible for establishing and overseeing the implementation of the investment policy for the Company’s pension plans. The investment policy is structured to optimize growth of the pension plan trust assets, while minimizing the risk of significant losses, in order to enable the plans to satisfy their benefit payment obligations over time. The Company uses benefit payments and Company contributions as its primary rebalancing mechanisms to maintain the asset class exposures within the guideline ranges established under the investment policy.
The current asset allocation guidelines set forth an U.S. equity range of 13% to 23%, an international equity range of 8% to 18%, a global equity range of 5% to 15% and a fixed-income range of 53% to 63%. Asset-class positions within the ranges are continually evaluated and adjusted based on expectations for future returns, the funded position of the plans and market risks. Occasionally, the Company may utilize futures or other financial instruments to alter the pension trust’s exposure to various asset classes in a lower-cost manner than trading securities in the underlying portfolios.
Generally, quoted market prices are used to value pension plan assets. Equities, some fixed-income securities, publicly traded investment funds, and U.S. government obligations are valued by reference to published market
95
Table of Contents
OFFICE DEPOT, INC.
NOTES TO CONSOLIDATED FINANCIAL STATEMENTS (Continued)
prices. Investments in certain restricted stocks are valued at the quoted market price of the issuer’s unrestricted common stock less an appropriate discount. If a quoted market price for unrestricted common stock of the issuer is not available, restricted common stocks are valued at a multiple of current earnings less an appropriate discount. The multiple chosen is consistent with multiples of similar companies based on current market prices.
The following table presents the pension plan assets by level within the fair value hierarchy at year-ends.
| (In millions) | Fair Value Measurements 2016 | |||||||||||||||
| Asset Category | Total | Quoted Prices in Active Markets for Identical Assets (Level 1) |
Significant Observable Inputs (Level 2) |
Significant Unobservable Inputs (Level 3) |
||||||||||||
| Money market funds |
$ | 25 | $ | — | $ | 25 | $ | — | ||||||||
| Equity securities |
||||||||||||||||
| U.S. large-cap |
29 | 29 | — | — | ||||||||||||
| U.S. small and mid-cap |
4 | 4 | — | — | ||||||||||||
| International |
60 | 60 | — | — | ||||||||||||
|
|
|
|||||||||||||||
| Total equity securities |
93 | 93 | — | — | ||||||||||||
|
|
|
|||||||||||||||
| Fixed-income securities |
||||||||||||||||
| Corporate bonds |
407 | — | 407 | — | ||||||||||||
| Government securities |
14 | — | 14 | — | ||||||||||||
| Other fixed-income |
16 | — | 16 | — | ||||||||||||
|
|
|
|||||||||||||||
| Total fixed-income securities |
437 | — | 437 | — | ||||||||||||
|
|
|
|||||||||||||||
| Other |
||||||||||||||||
| Mutual funds |
312 | — | 312 | — | ||||||||||||
| Other, including plan receivables and payables |
3 | 3 | — | — | ||||||||||||
|
|
|
|||||||||||||||
| Total other |
315 | 3 | 312 | — | ||||||||||||
|
|
|
|||||||||||||||
| $ | 870 | $ | 96 | $ | 774 | $ | — | |||||||||
|
|
|
|||||||||||||||
96
Table of Contents
OFFICE DEPOT, INC.
NOTES TO CONSOLIDATED FINANCIAL STATEMENTS (Continued)
| Fair Value Measurements 2015 | ||||||||||||||||
| Asset Category | Total | Quoted Prices in Active Markets for Identical Assets (Level 1) |
Significant Observable Inputs (Level 2) |
Significant Unobservable Inputs (Level 3) |
||||||||||||
| Money market funds |
$ | 19 | $ | — | $ | 19 | $ | — | ||||||||
| Equity securities |
||||||||||||||||
| U.S. large-cap |
25 | 25 | — | — | ||||||||||||
| U.S. small and mid-cap |
4 | 4 | — | — | ||||||||||||
| International |
58 | 58 | — | — | ||||||||||||
|
|
|
|||||||||||||||
| Total equity securities |
87 | 87 | — | — | ||||||||||||
|
|
|
|||||||||||||||
| Fixed-income securities |
||||||||||||||||
| Corporate bonds |
485 | — | 485 | — | ||||||||||||
| Government securities |
10 | — | 10 | — | ||||||||||||
| Other fixed-income |
24 | — | 24 | — | ||||||||||||
|
|
|
|||||||||||||||
| Total fixed-income securities |
519 | — | 519 | — | ||||||||||||
|
|
|
|||||||||||||||
| Other |
||||||||||||||||
| Equity mutual funds |
290 | — | 290 | — | ||||||||||||
| Other, including plan receivables and payables |
7 | 7 | — | — | ||||||||||||
|
|
|
|||||||||||||||
| Total other |
297 | 7 | 290 | — | ||||||||||||
|
|
|
|||||||||||||||
| $ | 922 | $ | 94 | $ | 828 | $ | — | |||||||||
|
|
|
|||||||||||||||
Purchases and sales of securities are recorded on a trade-date basis. Interest income is recorded on the accrual basis. Dividends are recorded on the ex-dividend date.
Cash Flows
Pension plan contributions include required statutory minimum amounts and, in some years, additional discretionary amounts. In 2016, the Company contributed $3 million to these pension plans. Pension contributions for the full year of 2017 are estimated to be $3 million. The Company may elect at any time to make additional voluntary contributions.
Qualified pension benefit payments are paid from the assets held in the plan trust, while nonqualified pension and other benefit payments are paid by the Company. Anticipated benefit payments by year are as follows:
| (in millions) | Pension Benefits |
Other Benefits |
||||||
| 2017 |
$ | 87 | $ | 1 | ||||
| 2018 |
85 | 1 | ||||||
| 2019 |
82 | 1 | ||||||
| 2020 |
80 | 1 | ||||||
| 2021 |
77 | 1 | ||||||
| Next five years |
346 | 4 | ||||||
Pension Plan — UK
The Company has a frozen defined benefit pension plan covering a limited number of employees in the United Kingdom. As part of the disposition of the OD European Business in 2016, the Company retained responsibility for this plan. The European entity contributed GBP 20 million to the plan prior to the transfer.
97
Table of Contents
OFFICE DEPOT, INC.
NOTES TO CONSOLIDATED FINANCIAL STATEMENTS (Continued)
Obligations and Funded Status
The following table provides a reconciliation of changes in the projected benefit obligation, the fair value of plan assets and the funded status of the plan to amounts recognized on the Company’s Consolidated Balance Sheets.
| (In millions) | 2016 | 2015 | ||||||
| Changes in projected benefit obligation: |
||||||||
| Obligation at beginning of period |
$ | 210 | $ | 239 | ||||
| Service cost |
— | — | ||||||
| Interest cost |
7 | 9 | ||||||
| Benefits paid |
(6 | ) | (7 | ) | ||||
| Actuarial (gain) loss |
59 | (20 | ) | |||||
| Currency translation |
(40 | ) | (11 | ) | ||||
|
|
|
|||||||
| Obligation at end of period |
230 | 210 | ||||||
|
|
|
|||||||
| Changes in plan assets: |
||||||||
| Fair value of plan assets at beginning of period |
240 | 257 | ||||||
| Actual return on plan assets |
62 | 2 | ||||||
| Company contributions |
29 | — | ||||||
| Benefits paid |
(6 | ) | (7 | ) | ||||
| Currency translation |
(47 | ) | (12 | ) | ||||
|
|
|
|||||||
| Fair value of plan assets at end of period |
278 | 240 | ||||||
|
|
|
|||||||
| Net asset recognized at end of period |
$ | 48 | $ | 30 | ||||
|
|
|
|||||||
In the Consolidated Balance Sheets, the net funded amounts are classified as a non-current asset in the caption Other assets.
Components of Net Periodic Benefit
The components of net periodic benefit are presented below:
| (In millions) | 2016 | 2015 | 2014 | |||||||||
| Service cost |
$ | — | $ | — | $ | — | ||||||
| Interest cost |
7 | 9 | 10 | |||||||||
| Expected return on plan assets |
(10 | ) | (14 | ) | (14 | ) | ||||||
|
|
|
|||||||||||
| Net periodic pension benefit |
$ | (3 | ) | $ | (5 | ) | $ | (4 | ) | |||
|
|
|
|||||||||||
Included in Accumulated other comprehensive income were deferred losses of $1 million in 2016 and deferred gains of $7 million in 2015. The deferred loss is not expected to be amortized into income during 2017.
Assumptions
Assumptions used in calculating the funded status and net periodic benefit included:
| 2016 | 2015 | 2014 | ||||||||||
| Expected long-term rate of return on plan assets |
4.07 | % | 4.78 | % | 5.55% | |||||||
| Discount rate |
2.70 | % | 3.90 | % | 3.80% | |||||||
| Inflation |
3.20 | % | 3.00 | % | 3.10% | |||||||
98
Table of Contents
OFFICE DEPOT, INC.
NOTES TO CONSOLIDATED FINANCIAL STATEMENTS (Continued)
The long-term rate of return on assets assumption has been derived based on long-term UK government fixed income yields, having regard to the proportion of assets in each asset class. The funds invested in equities have been assumed to return 4.0% above the return on UK government securities of appropriate duration. A return equal to a 15 year AA bond index is assumed for funds invested in corporate bonds. Allowance is made for expenses of 0.5% of assets.
Plan Assets
The allocation of Plan assets is as follows:
| 2016 | 2015 | |||||||
| Cash |
9 | % | —% | |||||
| Equity securities |
21 | % | 50% | |||||
| Fixed-income securities |
70 | % | 50% | |||||
|
|
|
|||||||
| Total |
100 | % | 100% | |||||
|
|
|
|||||||
A committee, comprised of representatives of the Company and of this plan, is responsible for establishing and overseeing the implementation of the investment policy for this plan. The plan’s investment policy and strategy are to ensure assets are available to meet the obligations to the beneficiaries and to adjust plan contributions accordingly. The plan trustees are also committed to reducing the level of risk in the plan over the long term, while retaining a return above that of the growth of liabilities. The investment strategy is based on plan funding levels, which determine the asset target allocation into matching or growth investments. Matching investments are intended to provide a return similar to the increase in the plan liabilities. Growth investments are assets intended to provide a return in excess of the increase in liabilities. At December 31, 2016, the asset target allocation was in accordance with the investment strategy. Asset-class allocations within the ranges are continually evaluated and adjusted based on expectations for future returns, the funded position of the plan and market risks.
99
Table of Contents
OFFICE DEPOT, INC.
NOTES TO CONSOLIDATED FINANCIAL STATEMENTS (Continued)
The following table presents the pension plan assets by level within the fair value hierarchy.
| (In millions) | Fair Value Measurements 2016 |
|||||||||||||||
| Asset Category | Total | Quoted Prices in Active Markets for Identical Assets (Level 1) |
Significant Observable Inputs (Level 2) |
Significant Unobservable Inputs (Level 3) |
||||||||||||
| Cash |
$ | 25 | $ | 25 | $ | — | $ | — | ||||||||
| Equity securities |
||||||||||||||||
| Developed market equity funds |
19 | 19 | — | — | ||||||||||||
| Emerging market equity funds |
7 | 7 | — | — | ||||||||||||
| Mutual funds real estate |
7 | — | — | 7 | ||||||||||||
| Mutual funds |
27 | — | 27 | — | ||||||||||||
|
|
|
|||||||||||||||
| Total equity securities |
60 | 26 | 27 | 7 | ||||||||||||
|
|
|
|||||||||||||||
| Fixed-income securities |
||||||||||||||||
| UK debt funds |
62 | — | 62 | — | ||||||||||||
| Liability term matching debt funds |
109 | — | 109 | — | ||||||||||||
| Emerging market debt fund |
2 | — | 2 | — | ||||||||||||
| High yield debt |
20 | — | 20 | — | ||||||||||||
|
|
|
|||||||||||||||
| Total fixed-income securities |
193 | — | 193 | — | ||||||||||||
|
|
|
|||||||||||||||
| Total |
$ | 278 | $ | 51 | $ | 220 | $ | 7 | ||||||||
|
|
|
|||||||||||||||
| (In millions) | Fair Value Measurements 2015 |
|||||||||||||||
| Asset Category | Total | Quoted Prices in Active Markets for Identical Assets (Level 1) |
Significant Observable Inputs (Level 2) |
Significant Unobservable Inputs (Level 3) |
||||||||||||
| Cash |
$ | — | $ | — | $ | — | $ | — | ||||||||
| Equity securities |
||||||||||||||||
| Developed market equity funds |
70 | 70 | — | — | ||||||||||||
| Emerging market equity funds |
15 | 15 | — | — | ||||||||||||
| Mutual funds real estate |
8 | — | — | 8 | ||||||||||||
| Mutual funds |
27 | — | 27 | — | ||||||||||||
|
|
|
|||||||||||||||
| Total equity securities |
120 | 85 | 27 | 8 | ||||||||||||
|
|
|
|||||||||||||||
| Fixed-income securities |
||||||||||||||||
| UK debt funds |
25 | — | 25 | — | ||||||||||||
| Liability term matching debt funds |
71 | — | 71 | — | ||||||||||||
| Emerging market debt fund |
8 | — | 8 | — | ||||||||||||
| High yield debt |
16 | — | 16 | — | ||||||||||||
|
|
|
|||||||||||||||
| Total fixed-income securities |
120 | — | 120 | — | ||||||||||||
|
|
|
|||||||||||||||
| Total |
$ | 240 | $ | 85 | $ | 147 | $ | 8 | ||||||||
|
|
|
|||||||||||||||
100
Table of Contents
OFFICE DEPOT, INC.
NOTES TO CONSOLIDATED FINANCIAL STATEMENTS (Continued)
The following is a reconciliation of the change in fair value of the pension plan assets calculated based on Level 3 inputs; during 2016, there was no change in the fair value of the pension plan assets or transfers of assets valued based on Level 3 inputs.
| (In millions) | Total | |||
| Balance at December 26, 2015 |
$ | 8 | ||
| Currency translation |
(1 | ) | ||
|
|
|
|||
| Balance at December 31, 2016 |
$ | 7 | ||
|
|
|
|||
Cash Flows
Anticipated benefit payments for the European pension plan, at 2016 year-end exchange rates, are as follows:
| (In millions) | Benefit Payments |
|||
| 2017 |
$ | 6 | ||
| 2018 |
6 | |||
| 2019 |
6 | |||
| 2020 |
7 | |||
| 2021 |
7 | |||
| Next five years |
36 | |||
Retirement Savings Plans
The Company also sponsors defined contribution plans for most of its employees. Eligible Company employees may participate in the Office Depot, Inc. Retirement Savings Plans (a plan for U.S. employees and a plan for Puerto Rico employees). All of the Company’s defined contribution plans (the “401(k) Plans”) allow eligible employees to contribute a percentage of their salary, commissions and bonuses in accordance with plan limitations and provisions of Section 401(k) of the Internal Revenue Code and the Company makes partial matching contributions to each plan subject to the limits of the respective 401(k) Plans. Matching contributions are invested in the same manner as the participants’ pre-tax contributions. The 401(k) Plans also allow for a discretionary matching contribution in addition to the normal match contributions if approved by the Board of Directors.
Office Depot and OfficeMax previously sponsored non-qualified deferred compensation plans that allowed certain employees, who were limited in the amount they could contribute to their respective 401(k) plans, to defer a portion of their earnings and receive a Company matching amount. Both plans are closed to new contributions.
During 2016, 2015 and 2014, $20 million, $20 million and $14 million, respectively, were recorded as compensation expense for the Company’s contributions to these plans.
101
Table of Contents
OFFICE DEPOT, INC.
NOTES TO CONSOLIDATED FINANCIAL STATEMENTS (Continued)
NOTE 13. EARNINGS PER SHARE
The following table presents the calculation of net earnings (loss) per common share — basic and diluted:
| (In millions, except per share amounts) | 2016 | 2015 | 2014 | |||||||||
| Basic Earnings Per Share |
||||||||||||
| Numerator: |
||||||||||||
| Net income (loss) from continuing operations |
$ | 679 | $ | 92 | $ | (293 | ) | |||||
| Loss from discontinued operations, net of tax |
(150 | ) | (84 | ) | (59 | ) | ||||||
| Less: Results attributable to the noncontrolling interests |
— | — | 2 | |||||||||
|
|
|
|||||||||||
| Net income (loss) to Office Depot, Inc. |
$ | 529 | $ | 8 | $ | (354 | ) | |||||
|
|
|
|||||||||||
| Denominator: |
||||||||||||
| Weighted-average shares outstanding |
539 | 547 | 535 | |||||||||
| Basic earnings (loss) per share: |
||||||||||||
| Continuing operations |
$ | 1.26 | $ | 0.17 | $ | (0.55 | ) | |||||
| Discontinued operations |
(0.28 | ) | (0.15 | ) | (0.11 | ) | ||||||
|
|
|
|||||||||||
| Net earnings (loss) |
$ | 0.98 | $ | 0.01 | $ | (0.66 | ) | |||||
|
|
|
|||||||||||
| Diluted Earnings Per Share |
||||||||||||
| Numerator: |
||||||||||||
| Net income (loss) from continuing operations |
$ | 679 | $ | 92 | $ | (293 | ) | |||||
| Loss from discontinued operations, net of tax |
(150 | ) | (84 | ) | (59 | ) | ||||||
| Less: Results attributable to the noncontrolling interests |
— | — | 2 | |||||||||
|
|
|
|||||||||||
| Net income (loss) to Office Depot, Inc. |
$ | 529 | $ | 8 | $ | (354 | ) | |||||
|
|
|
|||||||||||
| Denominator: |
||||||||||||
| Weighted-average shares outstanding |
539 | 547 | 535 | |||||||||
| Effect of dilutive securities: |
||||||||||||
| Stock options and restricted stock |
10 | 8 | — | |||||||||
|
|
|
|||||||||||
| Diluted weighted-average shares outstanding |
549 | 555 | 535 | |||||||||
| Diluted earnings (loss) per share |
||||||||||||
| Continuing operations |
$ | 1.24 | $ | 0.16 | $ | (0.55 | ) | |||||
| Discontinued operations |
(0.27 | ) | (0.15 | ) | (0.11 | ) | ||||||
|
|
|
|||||||||||
| Net earnings (loss) |
$ | 0.96 | $ | 0.01 | $ | (0.66 | ) | |||||
|
|
|
|||||||||||
Potentially dilutive stock options and restricted stock of 8 million shares were excluded from the diluted loss per share calculation in 2014 because of the net loss in the periods.
Awards of options and nonvested shares representing an additional 6 million, 4 million and 9 million shares of common stock were outstanding for the years ended December 31, 2016, December 26, 2015 and December 27, 2014, respectively, but were not included in the computation of diluted weighted-average shares outstanding because their effect would have been antidilutive.
NOTE 14. DERIVATIVE INSTRUMENTS AND FAIR VALUE MEASUREMENTS
Derivative Instruments and Hedging Activities
As a global supplier of office products and services the Company is exposed to risks associated with changes in foreign currency exchange rates, fuel and other commodity prices and interest rates. Depending on the exposure,
102
Table of Contents
OFFICE DEPOT, INC.
NOTES TO CONSOLIDATED FINANCIAL STATEMENTS (Continued)
settlement timeframe and other factors, the Company may enter into derivative transactions to mitigate those risks. Financial instruments authorized under the Company’s established risk management policy include spot trades, swaps, options, caps, collars, forwards and futures. Use of derivative financial instruments for speculative purposes is expressly prohibited by the Company’s policies. The Company may designate and account for such qualifying arrangements as hedges or reflect current mark-to-market impacts of non-qualifying economic hedge arrangements currently in earnings. As of December 31, 2016, the foreign exchange contracts extend through December 2017 and fuel contracts extended through January 2017.
The fair values of the Company’s foreign currency contracts and fuel contracts are the amounts receivable or payable to terminate the agreements at the reporting date, taking into account current interest rates, exchange rates and commodity prices. The values are based on market-based inputs or unobservable inputs that are corroborated by market data. Amounts associated with derivative instruments were not significant. At December 31, 2016 and December 26, 2015, Accrued expenses and other liabilities in the Consolidated Balance Sheets included less than $1 million and $2 million related to derivative fuel contracts. The Company’s foreign currency risk will be substantially reduced upon completion of the sale of the discontinued operations.
Financial Instruments
The fair values of cash and cash equivalents, receivables, trade accounts payable and accrued expenses and other current liabilities approximate their carrying values because of their short-term nature.
The following table presents information about financial instruments at the balance sheet dates indicated.
| 2016 | 2015 | |||||||||||||||
| (In millions) | Carrying Value |
Fair Value |
Carrying Value |
Fair Value |
||||||||||||
| Timber notes receivable |
$ | 885 | $ | 884 | $ | 905 | $ | 909 | ||||||||
| Company-owned life insurance |
89 | 89 | 88 | 88 | ||||||||||||
| Financial liabilities: |
||||||||||||||||
| Recourse debt: |
||||||||||||||||
| 9.75% Senior Secured Notes, due 2019 |
— | — | 250 | 265 | ||||||||||||
| 7.35% debentures, due 2016 |
— | — | 18 | 18 | ||||||||||||
| Revenue bonds, due in varying amounts periodically through 2029 |
186 | 181 | 186 | 186 | ||||||||||||
| American & Foreign Power Company, Inc. 5% debentures, due 2030 |
14 | 12 | 14 | 13 | ||||||||||||
| Non-recourse debt |
798 | 800 | 819 | 825 | ||||||||||||
The following methods and assumptions were used to estimate the fair value of each class of financial instruments:
| • | Timber notes receivable: Fair value is determined as the present value of expected future cash flows discounted at the current interest rate for loans of similar terms with comparable credit risk (Level 2 measure). |
| • | Company-owned life insurance: The fair value of the company-owned life insurance policies is derived using determinable net cash surrender value (Level 2 measure). |
| • | Recourse debt: Recourse debt for which there were no transactions on the measurement date was valued based on quoted market prices near the measurement date when available or by discounting the future cash flows of each instrument using rates based on the most recently observable trade or using rates currently offered to the Company for similar debt instruments of comparable maturities (Level 2 measure). |
103
Table of Contents
OFFICE DEPOT, INC.
NOTES TO CONSOLIDATED FINANCIAL STATEMENTS (Continued)
| • | Non-recourse debt: Fair value is estimated by discounting the future cash flows of the instrument at rates currently available to the Company for similar instruments of comparable maturities (Level 2 measure). |
Fair Value Estimates Used in Impairment Analyses
All impairment charges discussed in the sections below are presented in Asset impairments in the Consolidated Statements of Operations.
Retail Stores
Because of declining sales in recent periods and adoption of the Real Estate Strategy in 2014 and the Comprehensive Business Review in 2016, the Company has conducted a detailed store impairment analysis multiple times each year. The analysis uses input from retail store operations and the Company’s accounting and finance personnel that organizationally report to the chief financial officer. These Level 3 projections are based on management’s estimates of store-level sales, gross margins, direct expenses, exercise of future lease renewal options where applicable, and resulting cash flows and, by their nature, include judgments about how current initiatives will impact future performance. If the anticipated cash flows of a store cannot support the carrying value of its assets, the assets are impaired and written down to estimated fair value using Level 3 measure. The Company recognized store asset impairment charges of $8 million, $12 million and $26 million in 2016, 2015 and 2014, respectively.
The projections prepared for the 2016 analysis assumed declining sales over the forecast period. Gross margin and operating cost assumptions have been held at levels consistent with recent actual results and planned activities. Estimated cash flows were discounted at 13% in 2016, 12% in 2015 and 13% in 2014. The impairment charges include amounts to bring the location’s assets to estimated fair value based on projected operating cash flows or residual value, as appropriate. Assets added to previously impaired locations, whether for Division-wide enhancements or specific location betterments, are capitalized and subsequently tested for impairment. For the fourth quarter 2016 calculation, a 100 basis point decrease in next year sales combined with a 50 basis point decrease in next year gross margin would have increased the impairment by approximately $2 million. Further, a 100 basis point decrease in sales for all future periods would increase the impairment by $5 million.
The Company will continue to evaluate initiatives to improve performance and lower operating costs. To the extent that forward-looking sales and operating assumptions are not achieved and are subsequently reduced, additional impairment charges may result. However, at the end of 2015, the impairment analysis reflects the Company’s best estimate of future performance.
Intangible Assets
Definite-lived intangible assets — Following identification of retail stores for closure as part of the Real Estate Strategy and Comprehensive Business Review, the related favorable lease assets were assessed for accelerated amortization or impairment. Considerations included the Level 3 projected cash flows discussed above, the net book value of operating assets and favorable lease assets and likely sublease over the option period after closure or return of property to landlords. Impairment charges of $7 million, $1 million and $5 million were recognized during 2016, 2015 and 2014, respectively.
Asset impairment charges for 2014 include $25 million resulting from a decision to convert certain websites to a common platform and to write off capitalized software following certain information technology platform decisions related to the Merger.
104
Table of Contents
OFFICE DEPOT, INC.
NOTES TO CONSOLIDATED FINANCIAL STATEMENTS (Continued)
Indefinite-lived intangible assets — Goodwill associated with the Merger has been allocated to the reporting units for the purposes of the annual goodwill impairment test. The estimated fair values of the reporting units in continuing operations at the 2016 test date were substantially in excess of their carrying values.
NOTE 15. COMMITMENTS AND CONTINGENCIES
Commitments
On June 25, 2011, OfficeMax, with which the Company merged in November 2013, entered into a paper supply contract with Boise White Paper, L.L.C. (“Boise Paper”), under which OfficeMax agreed to purchase office papers from Boise Paper, and Boise Paper has agreed to supply office paper to OfficeMax, subject to the terms and conditions of the paper supply contract. The paper supply contract replaced the previous supply contract executed in 2004 with Boise Paper. The Company assumed the commitment under a paper supply contract to buy OfficeMax’s North American requirements for office paper, subject to certain conditions, including conditions under which the Company may purchase paper from paper producers other than Boise Paper. The paper supply contract’s term will expire on December 31, 2017, followed by a gradual reduction of the Company’s purchase requirements over a two year period thereafter. However, if certain circumstances occur, the agreement may be terminated earlier. If terminated, it will be followed by a gradual reduction of the Company’s purchase requirements over a two year period. Purchases under the agreement were $585 million in 2016, $612 million in 2015 and $647 million in 2014.
Indemnifications
Indemnification obligations may arise from the Asset Purchase Agreement between OfficeMax Incorporated, OfficeMax Southern Company, Minidoka Paper Company, Forest Products Holdings, L.L.C. and Boise Land & Timber Corp. The Company has agreed to provide indemnification with respect to a variety of obligations. These indemnification obligations are subject, in some cases, to survival periods, deductibles and caps. At December 31, 2016, the Company is not aware of any material liabilities arising from these indemnifications.
Legal Matters
The Company is involved in litigation arising in the normal course of business. While, from time to time, claims are asserted that make demands for a large sum of money (including, from time to time, actions which are asserted to be maintainable as class action suits), the Company does not believe that contingent liabilities related to these matters (including the matters discussed below), either individually or in the aggregate, will materially affect the Company’s financial position, results of operations or cash flows.
In addition, in the ordinary course of business, sales to and transactions with government customers may be subject to lawsuits, investigations, audits and review by governmental authorities and regulatory agencies, with which the Company cooperates. Many of these lawsuits, investigations, audits and reviews are resolved without material impact to the Company. While claims in these matters may at times assert large demands, the Company does not believe that contingent liabilities related to these matters, either individually or in the aggregate, will materially affect its financial position, results of operations or cash flows.
In addition to the foregoing, OfficeMax is named a defendant in a number of lawsuits, claims, and proceedings arising out of the operation of certain paper and forest products assets prior to those assets being sold in 2004, for which OfficeMax agreed to retain responsibility. Also, as part of that sale, OfficeMax agreed to retain responsibility for all pending or threatened proceedings and future proceedings alleging asbestos-related injuries
105
Table of Contents
OFFICE DEPOT, INC.
NOTES TO CONSOLIDATED FINANCIAL STATEMENTS (Continued)
arising out of the operation of the paper and forest products assets prior to the closing of the sale. The Company has made provision for losses with respect to the pending proceedings. Additionally, as of December 31, 2016, the Company has made provision for environmental liabilities with respect to certain sites where hazardous substances or other contaminants are or may be located. For these environmental liabilities, our estimated range of reasonably possible losses was approximately $10 million to $25 million. The Company regularly monitors its estimated exposure to these liabilities. As additional information becomes known, these estimates may change, however, the Company does not believe any of these OfficeMax retained proceedings are material to the Company’s financial position, results of operations or cash flows
NOTE 16. SEGMENT INFORMATION
Following the application of discontinued operations accounting for substantially all of the businesses formerly presented as the International Division, the Company has two reportable segments: North American Retail Division and North American Business Solutions Division. The North American Retail Division includes retail stores in the United States, including Puerto Rico and the U.S. Virgin Islands, which offer office supplies, technology products and solutions, business machines and related supplies, facilities products, and office furniture. Most stores also have a copy and print center offering printing, reproduction, mailing and shipping. The North American Business Solutions Division sells office supply products and services throughout North America, including the United States, Puerto Rico, the U.S. Virgin Islands and Canada. North American Business Solutions Division customers are served through dedicated sales forces, through catalogs, telesales, and electronically through its internet sites.
The retained operations previously included in the International Division are not significant at December 31, 2016 and have been presented as Other, pending management assessment of the future of this business and how it will be managed.
The office supply products and services offered across all operating segments are similar. The Company’s two operating segments are the two reportable segments. The North American Retail Division and North American Business Solutions Division are managed separately, primarily because of the way customers are reached and served. Due to the sale of the Company’s interest in Grupo OfficeMax in August 2014, the joint venture’s results have been reported as the Corporate level to align with how this information was presented for management reporting. The accounting policies for each segment are the same as those described in Note 1. Division operating income is determined based on the measure of performance reported internally to manage the business and for resource allocation. This measure charges to the respective Divisions those expenses considered directly or closely related to their operations and allocates support costs. Certain operating expenses and credits are not allocated to the Divisions including Asset impairments, Merger, restructuring and other operating (income) expenses, net, and Legal accrual, as well as expenses and credits retained at the Corporate level, including certain management costs and legacy pension and environmental matters. Other companies may charge more or less of these items to their segments and results may not be comparable to similarly titled measures used by other entities.
106
Table of Contents
OFFICE DEPOT, INC.
NOTES TO CONSOLIDATED FINANCIAL STATEMENTS (Continued)
A summary of significant accounts and balances by segment, reconciled to consolidated totals, after the elimination of discontinued operations for all periods is as follows.
| (In millions) | North American Retail |
North American Business Solutions |
Other | Corporate, Eliminations, and |
Consolidated Total |
|||||||||||||||||||
| Sales |
2016 | $ | 5,603 | $ | 5,400 | $ | 18 | $ | — | $ | 11,021 | |||||||||||||
| 2015 | 6,004 | 5,708 | 15 | — | 11,727 | |||||||||||||||||||
| 2014 | 6,528 | 6,013 | 14 | 155 | 12,710 | |||||||||||||||||||
| Division operating income |
2016 | 299 | 265 | 1 | — | 565 | ||||||||||||||||||
| 2015 | 310 | 226 | 3 | — | 539 | |||||||||||||||||||
| 2014 | 126 | 232 | 1 | — | 359 | |||||||||||||||||||
| Capital expenditures |
2016 | 58 | 42 | — | 11 | 111 | ||||||||||||||||||
| 2015 | 56 | 70 | — | 18 | 144 | |||||||||||||||||||
| 2014 | 44 | 29 | — | 23 | 96 | |||||||||||||||||||
| Depreciation and amortization |
2016 | 90 | 69 | — | 22 | 181 | ||||||||||||||||||
| 2015 | 130 | 82 | — | 41 | 253 | |||||||||||||||||||
| 2014 | 140 | 85 | — | 52 | 277 | |||||||||||||||||||
| Charges for losses on receivables and inventories |
2016 | 58 | 20 | — | — | 78 | ||||||||||||||||||
| 2015 | 42 | 11 | — | — | 53 | |||||||||||||||||||
| 2014 | 48 | 4 | — | — | 52 | |||||||||||||||||||
| Assets |
2016 | 1,542 | 1,713 | 4 | 2,281 | 5,540 | ||||||||||||||||||
| 2015 | 1,625 | 1,607 | 4 | 3,206 | 6,442 | |||||||||||||||||||
| 2014 | 1,736 | 1,687 | 4 | 3,330 | 6,757 | |||||||||||||||||||
| * | Amounts included in “Corporate, Eliminations, and Discontinued Operations” consist of (i) assets (including all cash and cash equivalents) and depreciation related to corporate activities of continuing operations, (ii) assets of discontinued operations amounting to $142 million, $1.1 billion and $1.2 billion for the years ended December 31, 2016, December 26, 2015 and December 27, 2014, respectively, and (iii) accounts and balances associated with Grupo OfficeMax prior to disposition. |
A reconciliation of the measure of Division operating income to Consolidated income (loss) from continuing operations before income taxes is as follows:
| (In millions) | 2016 | 2015 | 2014 | |||||||||
| Division operating income |
$ | 565 | $ | 539 | $ | 359 | ||||||
| Add/(subtract): |
||||||||||||
| Other operating income (loss) |
— | — | 8 | |||||||||
| Asset impairments |
(15 | ) | (13 | ) | (56 | ) | ||||||
| Merger, restructuring, and other operating income (expenses), net |
80 | (242 | ) | (334 | ) | |||||||
| Legal accrual |
— | — | (81 | ) | ||||||||
| Unallocated expenses |
(99 | ) | (101 | ) | (124 | ) | ||||||
| Interest income |
22 | 22 | 22 | |||||||||
| Interest expense |
(80 | ) | (91 | ) | (87 | ) | ||||||
| Loss on extinguishment of debt |
(15 | ) | — | — | ||||||||
| Other income (expense), net |
1 | 1 | 2 | |||||||||
|
|
|
|||||||||||
| Income (loss) from continuing operations before income taxes |
$ | 459 | $ | 115 | $ | (291 | ) | |||||
|
|
|
|||||||||||
107
Table of Contents
OFFICE DEPOT, INC.
NOTES TO CONSOLIDATED FINANCIAL STATEMENTS (Continued)
There is no single customer that accounts for 10% or more of the Company’s total sales.
The Company classifies products into three broad categories: (1) supplies, (2) technology, and (3) furniture and other. The supplies category includes products such as paper, writing instruments, office supplies, cleaning and breakroom items. The technology category includes products such as toner and ink, computers, tablets and accessories, printers, electronic storage, as well as services for technology products. The furniture and other category includes products such as desks, seating, and luggage, as well as sales in our copy and print centers.
Total Company sales by product category were as follows:
| 2016 | 2015 | 2014 | ||||||||||
| Supplies |
45.2% | 44.4% | 43.6% | |||||||||
| Technology |
38.9% | 40.2% | 41.2% | |||||||||
| Furniture and other |
15.9% | 15.4% | 15.2% | |||||||||
|
|
|
|||||||||||
| 100.0% | 100.0% | 100.0% | ||||||||||
|
|
|
|||||||||||
As of December 31, 2016, goodwill totaled $363 million, of which $78 million was recorded in the North American Retail Division and $285 million in the North American Solutions Division.
NOTE 17. QUARTERLY FINANCIAL DATA (UNAUDITED)
| (In millions, except per share amounts) | First Quarter | Second Quarter | Third Quarter(3) | Fourth Quarter | ||||||||||||
| Fiscal Year Ended December 31, 2016* |
||||||||||||||||
| Net sales |
$ | 2,876 | $ | 2,583 | $ | 2,836 | $ | 2,725 | ||||||||
| Gross profit |
715 | 613 | 726 | 653 | ||||||||||||
| Operating income |
85 | 271 | 117 | 57 | ||||||||||||
| Net income from continuing operations(1) |
62 | 232 | 330 | 55 | ||||||||||||
| Discontinued operations, net of tax |
(16 | ) | (22 | ) | (137 | ) | 25 | |||||||||
| Net income (loss) |
46 | 210 | 193 | 80 | ||||||||||||
| Basic earnings (loss) per share(2) |
||||||||||||||||
| Continuing operations |
$ | 0.11 | $ | 0.42 | $ | 0.62 | $ | 0.11 | ||||||||
| Discontinued operations |
$ | (0.03 | ) | $ | (0.04 | ) | $ | (0.26 | ) | $ | 0.05 | |||||
|
|
|
|||||||||||||||
| Basic earnings per share |
$ | 0.08 | $ | 0.38 | $ | 0.36 | $ | 0.15 | ||||||||
| Diluted earnings (loss) per share(2) |
||||||||||||||||
| Continuing operations |
$ | 0.11 | $ | 0.41 | $ | 0.61 | $ | 0.10 | ||||||||
| Discontinued operations |
$ | (0.03 | ) | $ | (0.04 | ) | $ | (0.25 | ) | $ | 0.05 | |||||
|
|
|
|||||||||||||||
| Diluted earnings per share |
$ | 0.08 | $ | 0.38 | $ | 0.35 | $ | 0.15 | ||||||||
| * | Due to rounding, the sum of the quarterly amounts may not equal the reported amounts for the year. The first quarter and second quarter amounts reflect application of discontinued operations accounting that was effective in the third quarter. |
| (1) | In the first, second, third and fourth quarters of 2016, captions include pre-tax Merger, restructuring, and other operating expenses, net totaling $40 million, $(193) million, $31 million and $43 million, respectively, and asset impairments of $0 million, $0 million, $9 million and $6 million, respectively. The second quarter of 2016 Merger, restructuring and other operating expenses, net includes $250 million Termination Fee received pursuant to termination of the Staples Merger Agreement. The third quarter and fourth quarters include non-cash tax benefits of approximately $240 million and $140 million, respectively, from the release of valuation allowances on deferred tax assets. |
108
Table of Contents
OFFICE DEPOT, INC.
NOTES TO CONSOLIDATED FINANCIAL STATEMENTS (Continued)
| (2) | The sum of the quarterly earnings per share does not equal the annual earnings per share due to differences in quarterly and annual weighted-average shares outstanding. |
| (3) | The amounts in the table above for the third quarter 2016 are as corrected to adjust for an error that was not material to the overall presentation. When the Company committed to a plan to sell substantially all of the business formerly reported as the International Division, it provided reference to the cumulative translation adjustment (“CTA”) balance that existed at the end of the third quarter 2016, but did not include CTA in its impairment analysis. As a result, the loss amount of Discontinued operations, net of tax was overstated. The measurement has been corrected for the full year 2016 amounts. This correcting adjustment is provided below and would impact the same captioned line items in various portions of the third quarter financial statements by the same amount, as well as the current assets of discontinued operations, accumulated deficit and totals including those accounts. |
| Third Quarter 2016 | Year-to-Date Third Quarter 2016 | |||||||||||||||||||||||
| ($ in Millions, except per share) | As Reported |
Adjustment | As Corrected |
As Reported |
Adjustment | As Corrected |
||||||||||||||||||
| Discontinued operations, net of tax |
$ | (286 | ) | $ | 149 | $ | (137 | ) | $ | (324 | ) | $ | 149 | $ | (175 | ) | ||||||||
| Net income (loss) |
$ | 44 | $ | 149 | $ | 193 | $ | 300 | $ | 149 | $ | 449 | ||||||||||||
| Basic earnings (loss) per share |
||||||||||||||||||||||||
| Discontinued operations |
$ | (0.54 | ) | $ | 0.28 | $ | (0.26 | ) | $ | (0.60 | ) | $ | 0.28 | $ | (0.32 | ) | ||||||||
|
|
|
|||||||||||||||||||||||
| Net earnings (loss) |
$ | 0.08 | $ | 0.28 | $ | 0.36 | $ | 0.55 | $ | 0.27 | $ | 0.82 | ||||||||||||
|
|
|
|||||||||||||||||||||||
| Diluted earnings per share |
||||||||||||||||||||||||
| Discontinued operations |
$ | (0.54 | ) | $ | 0.29 | $ | (0.25 | ) | $ | (0.60 | ) | $ | 0.28 | $ | (0.32 | ) | ||||||||
|
|
|
|||||||||||||||||||||||
| Net earnings (loss) |
$ | 0.08 | $ | 0.27 | $ | 0.35 | $ | 0.54 | $ | 0.27 | $ | 0.81 | ||||||||||||
|
|
|
|||||||||||||||||||||||
| (In millions, except per share amounts) | First Quarter | Second Quarter | Third Quarter | Fourth Quarter | ||||||||||||
| Fiscal Year Ended December 26, 2015* |
||||||||||||||||
| Net sales |
$ | 3,131 | $ | 2,784 | $ | 3,046 | $ | 2,767 | ||||||||
| Gross profit |
761 | 659 | 787 | 656 | ||||||||||||
| Operating income (loss) |
88 | (27 | ) | 81 | 42 | |||||||||||
| Net income (loss) from continuing operations(1) |
49 | (31 | ) | 42 | 31 | |||||||||||
| Discontinued operations, net of tax |
(4 | ) | (27 | ) | (36 | ) | (16 | ) | ||||||||
| Net income (loss)(1) |
45 | (58 | ) | 6 | 15 | |||||||||||
| Basic earnings (loss) per share(2) |
||||||||||||||||
| Continuing operations |
$ | 0.09 | $ | (0.06 | ) | $ | 0.08 | $ | 0.06 | |||||||
| Discontinued operations |
$ | (0.01 | ) | $ | (0.05 | ) | $ | (0.07 | ) | $ | (0.03 | ) | ||||
|
|
|
|||||||||||||||
| Basic earnings per share |
$ | 0.08 | $ | (0.11 | ) | $ | 0.01 | $ | 0.03 | |||||||
| Diluted earnings (loss) per share(2) |
||||||||||||||||
| Continuing operations |
$ | 0.09 | $ | (0.06 | ) | $ | 0.08 | $ | 0.06 | |||||||
| Discontinued operations |
$ | (0.01 | ) | $ | (0.05 | ) | $ | (0.07 | ) | $ | (0.03 | ) | ||||
|
|
|
|||||||||||||||
| Diluted earnings per share |
$ | 0.08 | $ | (0.11 | ) | $ | 0.01 | $ | 0.03 | |||||||
| * | Due to rounding, the sum of the quarterly amounts may not equal the reported amounts for the year. The amounts reflect application of discontinued operations accounting. |
| (1) | In the first, second, third and fourth quarters of 2015, captions include pre-tax Merger, restructuring, and other operating expenses, net totaling $29 million, $96 million, $79 million and $38 million, respectively, and asset impairments of $5 million, $4 million, $1 million and $3 million, respectively. |
| (2) | The sum of the quarterly earnings per share does not equal the annual earnings per share due to differences in quarterly and annual weighted-average shares outstanding. |
109
Table of Contents
INDEX TO EXHIBITS FOR OFFICE DEPOT 10-K(1)
| Exhibit Number |
Exhibit | |
| 2.1 | Agreement and Plan of Merger, dated February 20, 2013, by and among Office Depot, Inc., Dogwood Merger Sub LLC, Mapleby Holdings Merger Corporation, Mapleby Merger Corporation and OfficeMax Incorporated (Incorporated by reference from Office Depot, Inc.’s Current Report on Form 8-K, filed with the SEC on February 22, 2013). | |
| 2.2 | Stock Purchase and Transaction Agreement by and among Office Depot, Inc., Office Depot Delaware Overseas Finance No. 1, LLC, Grupo Gigante S.A.B. de C.V. and Hospitalidad y Servicios Especializados Gigante, S.A. de C.V dated as of June 3, 2013 (Incorporated by reference from Office Depot, Inc.’s Current Report on Form 8-K, filed with the SEC on July 15, 2013). | |
| 2.3 | Agreement and Plan of Merger, dated as of February 4, 2015, by and among Office Depot, Inc., Staples, Inc. and Staples AMS, Inc. (Incorporated by reference from Office Depot, Inc.’s Current Report on Form 8-K, filed with the SEC on February 4, 2015). | |
| 2.4 | Termination Agreement, dated as of May 16, 2016, by and among Office Depot, Inc., Staples, Inc. and Staples AMS, Inc. (Incorporated by reference from Office Depot Inc.’s Current Report on Form 8-K, filed with the SEC on May 17, 2016). | |
| 2.5 | Sale and Purchase Agreement Relating to the Transfer of the Partnership Interests in Office Depot (Netherlands) C.V., dated as of November 22, 2016, by and among Office Depot Foreign Holdings LP, LLC, Office Depot Foreign Holdings GP, LLC, Office Depot, Inc., Aurelius Rho Invest NL DS B.V. and Aurelius Rho Invest NL Two B.V. (Incorporated by reference from Office Depot Inc.’s Current Report on Form 8-K, filed with the SEC on January 5, 2017). | |
| 2.6 | Amendment Agreement Relating to the Transfer of the Partnership Interests in Office Depot (Netherlands) C.V., dated as of December 31, 2016, by and among Office Depot Foreign Holdings LP, LLC, Office Depot Foreign Holdings GP, LLC, Office Depot, Inc., Aurelius Rho Invest NL DS B.V. and Aurelius Rho Invest NL Two B.V. (Incorporated by reference from Office Depot Inc.’s Current Report on Form 8-K, filed with the SEC on January 5, 2017). | |
| 3.1 | Amended and Restated Bylaws (Incorporated by reference from Office Depot, Inc.’s Current Report on Form 8-K, filed with the SEC on February 4, 2015). | |
| 3.2 | Amendment to the Amended and Restated Bylaws of Office Depot, Inc. (Incorporated by reference from Office Depot Inc.’s Current Report on Form 8-K, filed with the SEC on October 30, 2015). | |
| 3.3 | Amended and Restated Bylaws of Office Depot, Inc. (Incorporated by reference from Office Depot Inc.’s Current Report on Form 8-K, filed with the SEC on August 2, 2016). | |
| 3.4 | Restated Certificate of Incorporation (Incorporated by reference from the respective annex to the Proxy Statement for Office Depot, Inc.’s 1995 Annual Meeting of Stockholders, filed with the SEC on April 20, 1995). | |
| 3.5 | Amendment to Restated Certificate of Incorporation (Incorporated by reference from Office Depot, Inc.’s Quarterly Report on Form 10-Q, filed with the SEC on November 10, 1998). | |
| 4.1 | Form of Certificate representing shares of Common Stock (Incorporated by reference from the respective exhibit to Office Depot, Inc.’s Registration Statement No. 33-39473 on Form S-4, filed with the SEC on March 15, 1991). | |
| 4.2 | Indenture, dated as of March 14, 2012, relating to the $250 million 9.75% Senior Secured Notes due 2019, among Office Depot, Inc., the Guarantors named therein and U.S. Bank National Association (Incorporated by reference from Office Depot, Inc.’s Current Report on Form 8-K, filed with the SEC on March 15, 2012). | |
110
Table of Contents
| Exhibit Number |
Exhibit | |
| 4.3 | Supplemental Indenture, dated as of February 22, 2013, between Office Depot, Inc., eDepot, LLC, the other Guarantors party thereto and U.S. Bank National Association, relating to the 9.75% Senior Notes due 2019 (Incorporated by reference from Office Depot, Inc.’s Annual Report on Form 10-K, filed with the SEC on February 25, 2014). | |
| 4.4 | Second Supplemental Indenture, dated as of November 22, 2013, between Office Depot Inc., Mapleby Holdings Merger Corporation, OfficeMax Incorporated, OfficeMax Southern Company, OfficeMax Nevada Company, OfficeMax North America, Inc., Picabo Holdings, Inc., BizMart, Inc., BizMart (Texas), Inc., OfficeMax Corp., OMX, Inc., the other Guarantors party thereto and U.S. Bank National Association, relating to the 9.75% Senior Notes due 2019 (Incorporated by reference from Office Depot, Inc.’s Annual Report on Form 10-K, filed with the SEC on February 25, 2014). | |
| 4.5 | Form of Notes representing $250 million aggregate principal amount of 9.75% Senior Secured Notes due March 15, 2019 (Incorporated by reference from Office Depot, Inc.’s Quarterly Report on Form 10-Q, filed with the SEC on May 1, 2012). | |
| 4.6(2) | Trust Indenture between Boise Cascade Corporation (now OfficeMax Incorporated) and Morgan Guaranty Trust Company of New York, Trustee, dated October 1, 1985, as amended (Incorporated by reference from OfficeMax Incorporated’s Registration Statement No. 33-5673 on Form S-3, filed with the SEC on May 13, 1986). | |
| 4.7 | Indenture dated as of December 21, 2004 by and between OMX Timber Finance Investments I, LLC, as the Issuer and Wells Fargo Bank Northwest, N.A., as Trustee (Incorporated by reference from OfficeMax Incorporated’s Registration Statement No. 333-162866 on Form S-1/A, filed with the SEC on December 14, 2009). | |
| 4.8 | Installment Note for $559,500,000 between Boise Land & Timber, L.L.C. (Maker) and Boise Cascade Corporation (now OfficeMax Incorporated) (Initial Holder) dated October 29, 2004 (Incorporated by reference from OfficeMax Incorporated’s Quarterly Report on Form 10-Q, filed with the SEC on November 9, 2004). | |
| 4.9 | Installment Note for $258,000,000 between Boise Land & Timber, L.L.C. (Maker) and Boise Southern Company (Initial Holder) dated October 29, 2004 (Incorporated by reference from OfficeMax Incorporated’s Quarterly Report on Form 10-Q, filed with the SEC on November 9, 2004). | |
| 10.1 | Lease Agreement dated November 10, 2006, by and between Office Depot, Inc. and Boca 54 North LLC (Incorporated by reference from Office Depot, Inc.’s Annual Report on Form 10-K, filed with the SEC on February 24, 2009). | |
| 10.2 | First Amendment to Lease dated July 3, 2007, by and between Office Depot, Inc. and Boca 54 North LLC (Incorporated by reference from Office Depot, Inc.’s Annual Report on Form 10-K, filed with the SEC on February 24, 2009). | |
| 10.3 | Office Depot, Inc. 2015 Long-Term Incentive Plan (Incorporated by reference from Office Depot, Inc.’s Registration Statement on Form S-8, filed with the SEC on June 19, 2015). | |
| 10.4 | Office Depot, Inc. 2007 Long-Term Incentive Plan (Incorporated by reference from the respective appendix to the Proxy Statement for Office Depot, Inc.’s 2007 Annual Meeting of Shareholders, filed with the SEC on April 2, 2007).* | |
| 10.5 | 2008 Office Depot, Inc. Bonus Plan for Executive Management Employees (Incorporated by reference from the respective appendix to the Proxy Statement for Office Depot, Inc.’s 2008 Annual Meeting of Shareholders, filed with the SEC on March 13, 2008).* | |
111
Table of Contents
| Exhibit Number |
Exhibit | |
| 10.6 | Office Depot Corporate Annual Bonus Plan (Incorporated by reference from Office Depot, Inc.’s Current Report on Form 8-K, filed with the SEC on June 22, 2015). | |
| 10.7 | Change of Control Agreement, dated as of December 14, 2007, by and between Office Depot, Inc. and Steven M. Schmidt (Incorporated by reference from Office Depot, Inc.’s Quarterly Report on Form 10-Q, filed with the SEC on July 28, 2009).* | |
| 10.8 | Amendment to Employment Offer Letter Agreement, dated December 31, 2008, by and between Office Depot, Inc. and Steven Schmidt (Incorporated by reference from Office Depot, Inc.’s Annual Report on Form 10-K, filed with the SEC on February 23, 2010).* | |
| 10.9 | Employment Offer Letter Agreement, dated July 10, 2007, by and between Office Depot, Inc. and Steven Schmidt (Incorporated by reference from Office Depot, Inc.’s Annual Report on Form 10-K, filed with the SEC on February 23, 2010).* | |
| 10.10 | Office Depot, Inc. Amended Long-Term Incentive Plan (Incorporated by reference from Office Depot, Inc.’s Current Report on Form 8-K, filed with the SEC on April 26, 2010).* | |
| 10.11 | Office Depot, Inc. Amended Long-Term Equity Incentive Plan, as revised and amended effective April 21, 2010 (Incorporated by reference from Office Depot, Inc.’s Current Report on Form 8-K, filed with the SEC on April 26, 2010).* | |
| 10.12 | Form of Associate Non-Competition, Confidentiality and Non-Solicitation Agreement between Office Depot, Inc. and certain executives (Incorporated by reference from Office Depot, Inc.’s Annual Report on Form 10-K, filed with the SEC on February 22, 2011).* | |
| 10.13 | Form of Change in Control Agreement between Office Depot, Inc. and certain executives (Incorporated by reference from Office Depot, Inc.’s Current Report on Form 8-K, filed with the SEC on December 21, 2010).* | |
| 10.14 | Form of Waiver, dated as of March 30, 2011 (Incorporated by reference from Office Depot, Inc.’s Current Report on Form 8-K, filed with the SEC on April 1, 2011). | |
| 10.15 | First Amendment to the Office Depot, Inc. 2007 Long-Term Incentive Plan (Incorporated by reference from Office Depot, Inc.’s Current Report on Form 8-K, filed with the SEC on April 25, 2011).* | |
| 10.16 | Form of Amended and Restated Credit Agreement, dated as of May 25, 2011, among Office Depot, Inc. and certain of its European subsidiaries as Borrowers, JPMorgan Chase Bank, N.A., as Administrative Agent and U.S. Collateral Agent, JPMorgan Chase Bank N.A., London Branch, as European Administrative and European Collateral Agent, and the other lenders referred to therein (Incorporated by reference from Office Depot, Inc.’s Quarterly Report on Form 10-Q, filed with the SEC on July 26, 2011).** | |
| 10.17 | Form of Second Amended and Restated Credit Agreement, dated as of May 13, 2016, among Office Depot, Inc. and certain of its European subsidiaries as Borrowers, JPMorgan Chase Bank, N.A., as Administrative Agent and U.S. Collateral Agent, JPMorgan Chase Bank N.A., London Branch, as European Administrative and European Collateral Agent, and the other lenders referred to therein (Incorporated by reference from Office Depot Inc.’s Current Report on Form 8-K, filed with the SEC on May 17, 2016). | |
| 10.18 | Letter Agreement between Office Depot, Inc. and Elisa D. Garcia dated May 15, 2007 (Incorporated by reference from Office Depot, Inc.’s Annual Report on Form 10-K, filed with the SEC on February 28, 2012).* | |
112
Table of Contents
| Exhibit Number |
Exhibit | |
| 10.19 | Amendment to Letter Agreement between Office Depot, Inc. and Elisa D. Garcia effective December 31, 2008 (Incorporated by reference from Office Depot, Inc.’s Annual Report on Form 10-K, filed with the SEC on February 28, 2012).* | |
| 10.20 | Retention Agreement between Office Depot, Inc. and Elisa D. Garcia dated November 2, 2010 (Incorporated by reference from Office Depot, Inc.’s Annual Report on Form 10-K, filed with the SEC on February 28, 2012).* | |
| 10.21 | First Amendment, dated February 24, 2012, to the Amended and Restated Credit Agreement, dated as of May 25, 2011, among Office Depot, Inc. and certain of its European subsidiaries as Borrowers, JPMorgan Chase Bank, N.A., as Administrative Agent and U.S. Collateral Agent, JPMorgan Chase Bank N.A., London Branch, as European Administrative and European Collateral Agent, and the other lenders referred to therein (Incorporated by reference from Office Depot, Inc.’s Annual Report on Form 10-K, filed with the SEC on February 28, 2012). | |
| 10.22 | Form of Restricted Stock Awards for Executives (time vested) (Incorporated by reference from Office Depot, Inc.’s Quarterly Report on Form 10-Q, filed with the SEC on May 1, 2012).* | |
| 10.23 | Form of Restricted Stock Award for Executives (performance/time vested) (Incorporated by reference from Office Depot, Inc.’s Quarterly Report on Form 10-Q, filed with the SEC on May 1, 2012).* | |
| 10.24 | Form of Restricted Stock Award Agreement (Incorporated by reference from Office Depot, Inc.’s Registration Statement on Form S-8, filed with the SEC on June 19, 2015). | |
| 10.25 | Financing Agreement by and between Office Depot BS and ABN AMRO Commercial Finance, dated September 24, 2012 (Incorporated by reference from Office Depot Inc.’s Annual Report on Form 10-K, filed with the SEC on February 20, 2013). | |
| 10.26 | Amendment No. 1 to Financing Agreement by and between Office Depot BS and ABN AMRO Commercial Finance, dated September 24, 2012 (Incorporated by reference from Office Depot Inc.’s Annual Report on Form 10-K, filed with the SEC on February 20, 2013). | |
| 10.27 | Letter Agreement between the Company and Stephen E. Hare (Incorporated by reference from Office Depot, Inc.’s Current Report on Form 8-K, filed with the SEC on December 5, 2013).* | |
| 10.28 | 2013 Non-Qualified Stock Option Award Agreement between the Company and Stephen E. Hare (Incorporated by reference from Office Depot, Inc.’s Current Report on Form 8-K, filed with the SEC on December 5, 2013).* | |
| 10.29 | 2013 Restricted Stock Unit Award Agreement between the Company and Stephen E. Hare (Incorporated by reference from Office Depot, Inc.’s Current Report on Form 8-K, filed with the SEC on December 5, 2013).* | |
| 10.30 | 2013 Performance Share Award Agreement between the Company and Stephen E. Hare (Incorporated by reference from Office Depot, Inc.’s Current Report on Form 8-K, filed with the SEC on December 5, 2013).* | |
| 10.31 | Employment Agreement between the Company and Roland C. Smith (Incorporated by reference from Office Depot, Inc.’s Current Report on Form 8-K, filed with the SEC on November 18, 2013).* | |
| 10.32 | First Amendment to Employment Agreement between the Company and Roland C. Smith (Incorporated by reference from Office Depot, Inc.’s Current Report on Form 8-K, filed with the SEC on August 22, 2016).* | |
113
Table of Contents
| Exhibit Number |
Exhibit | |
| 10.33 | 2013 Non-Qualified Stock Option Award Agreement between the Company and Roland C. Smith (Incorporated by reference from Office Depot, Inc.’s Current Report on Form 8-K, filed with the SEC on November 18, 2013).* | |
| 10.34 | 2013 Restricted Stock Unit Award Agreement between the Company and Roland C. Smith (Incorporated by reference from Office Depot, Inc.’s Current Report on Form 8-K, filed with the SEC on November 18, 2013).* | |
| 10.35 | Employment Agreement between the Company and Gerry P. Smith (Incorporated by reference from Office Depot Inc.’s Current Report on Form 8-K, filed with the SEC on January 30, 2017).* | |
| 10.36 | 2017 Non-Qualified Stock Option Award Agreement between the Company and Gerry P. Smith (Incorporated by reference from Office Depot, Inc.’s Current Report on Form 8-K, filed with the SEC on January 30, 2017).* | |
| 10.37 | 2017 Restricted Stock Unit Award Agreement between the Company and Gerry P. Smith (Incorporated by reference from Office Depot, Inc.’s Current Report on Form 8-K, filed with the SEC on January 30, 2017).* | |
| 10.38 | Form of Restricted Stock Unit Award Agreement (Incorporated by reference from Office Depot, Inc.’s Registration Statement on Form S-8, filed with the SEC on June 19, 2015). | |
| 10.39 | 2013 Performance Share Award Agreement between the Company and Roland C. Smith (Incorporated by reference from Office Depot, Inc.’s Current Report on Form 8-K, filed with the SEC on November 18, 2013).* | |
| 10.40 | 2003 OfficeMax Incentive and Performance Plan (amended and restated effective as of April 29, 2013) (Incorporated by reference to Appendix A to the Definitive Proxy Statement of OfficeMax filed with the SEC on March 19, 2013).* | |
| 10.41 | Amendment to the 2003 OfficeMax Incentive and Performance Plan dated November 6, 2013 (Incorporated by reference from Office Depot, Inc.’s Form S-8, filed with the SEC on November 8, 2013).* | |
| 10.46 | Form of Letter Agreement (amending the Change in Control Agreements with each of Michael D. Newman, Elisa D. Garcia and Steve M. Schmidt) (Incorporated by reference from Office Depot, Inc.’s Current Report on Form 8-K, filed with the SEC on February 26, 2013).* | |
| 10.47 | Amendment to the Change in Control Agreement between Office Depot, Inc. and Steven M. Schmidt, dated April 7, 2015 (Incorporated by reference from Office Depot Inc.’s Annual Report on Form 10-K/A, filed with the SEC on April 22, 2016).* | |
| 10.48 | Office Depot Omnibus Amendment to Outstanding Equity and Long-Term Incentive Awards (Incorporated by reference from Office Depot, Inc.’s Current Report on Form 8-K, filed with the SEC on February 26, 2013).* | |
| 10.49 | Form of Second Amendment, dated as of March 4, 2013, to the Amended and Restated Credit Agreement dated as of May 25, 2011, as amended by the First Amendment to the Amended and Restated Credit Agreement, dated as of February 24, 2012, among Office Depot, Inc., and certain of its European subsidiaries as Borrowers, JPMorgan Chase Bank, N.A., as Administrative Agent and U.S. Collateral Agent, JPMorgan Chase Bank N.A., London Branch, as European Administrative and European Collateral Agent, and the other lenders referred to therein (Incorporated by reference from Office Depot, Inc.’s Current Report on Form 8-K, filed with the SEC on March 6, 2013). | |
114
Table of Contents
| Exhibit Number |
Exhibit | |
| 10.50 | Form of Third Amendment, dated as of November 5, 2013, to the Amended and Restated Credit Agreement dated as of May 25, 2011, as amended by the First Amendment to the Amended and Restated Credit Agreement, dated as of February 24, 2012 and the Second Amendment to the Amended and Restated Credit Agreement, dated as of March 4, 2013, among Office Depot, Inc., and certain of its European subsidiaries as Borrowers, JPMorgan Chase Bank, N.A., as Administrative Agent and U.S. Collateral Agent, JPMorgan Chase Bank N.A., London Branch, as European Administrative and European Collateral Agent, and the other lenders referred to therein (Incorporated by reference from Office Depot, Inc.’s Annual Report on Form 10-K, filed with the SEC on February 25, 2014). | |
| 10.51 | Form of Fourth Amendment, dated as of May 1, 2015, to the Amended and Restated Credit Agreement dated as of May 25, 2011, as amended by the First Amendment to the Amended and Restated Credit Agreement, dated as of February 24, 2012, the Second Amendment to the Amended and Restated Credit Agreement, dated as of March 4, 2013 and the Third Amendment to the Amended and Restated Credit Agreement, dated as of November 1, 2013, among Office Depot, Inc., and certain of its European subsidiaries as Borrowers, JPMorgan Chase Bank, N.A., as Administrative Agent and U.S. Collateral Agent, JPMorgan Chase Bank N.A., London Branch, as European Administrative and European Collateral Agent, and the other lenders referred to therein (Incorporated by reference from Office Depot, Inc’s Quarterly Report on Form 10-Q, filed with the SEC on May 5, 2015). | |
| 10.52 | Paper Purchase Agreement dated June 25, 2011 between Boise White Paper, L.L.C. and OfficeMax Incorporated (Incorporated by reference from OfficeMax Incorporated’s Quarterly Report on Form 10-Q/A, filed with the SEC on October 24, 2011).** | |
| 10.54 | Retention Agreement between Office Depot, Inc. and Mr. Steven M. Schmidt dated April 7, 2015 (Incorporated by reference from Office Depot Inc.’s Annual Report on Form 10-K/A, filed with the SEC on April 22, 2016).* | |
| 10.55 | Second Amendment to 2013 Performance Share Award Agreement between Office Depot, Inc. and Roland C. Smith (Incorporated by reference from Office Depot’s Quarterly Report on Form 10-Q, filed with the SEC on May 6, 2014). | |
| 10.56 | Form of Agreement For Cash Settled Short-Term Performance Award For Executive Officers (Incorporated by reference from Office Depot Inc.’s Quarterly Report on Form 10-Q, filed with the SEC on August 4, 2015.) | |
| 10.57 | Award Agreement for 2014 Cash-Settled Performance Award between Office Depot, Inc. and Roland C. Smith (Incorporated by reference from Office Depot’s Quarterly Report on Form 10-Q, filed with the SEC on May 6, 2014). | |
| 10.58 | Second Amendment to 2013 Performance Share Award Agreement between Office Depot, Inc. and Stephen E. Hare (Incorporated by reference from Office Depot’s Quarterly Report on Form 10-Q, filed with the SEC on May 6, 2014). | |
| 10.59 | Form of 2014 Restricted Stock Award Agreement (Incorporated by reference from Office Depot’s Quarterly Report on Form 10-Q, filed with the SEC on May 6, 2014). | |
| 10.60 | Form of 2014 Performance Share Award Agreement (Incorporated by reference from Office Depot’s Quarterly Report on Form 10-Q, filed with the SEC on May 6, 2014). | |
| 10.61 | Second Amendment to the Office Depot, Inc. 2007 Long-Term Incentive Plan (Incorporated by reference from Office Depot’s Quarterly Report on Form 10-Q, filed with the SEC on May 6, 2014). | |
115
Table of Contents
| Exhibit Number |
Exhibit | |
| 10.62 | Letter Agreement between Office Depot, Inc. and Mark Cosby dated July 14, 2014 (Incorporated by reference from Office Depot’s Current Report on Form 8-K, filed with the SEC on July 21, 2014). | |
| 10.63 | Sign-On Bonus Agreement between Office Depot, Inc. and Mark Cosby dated July 14, 2014 (Incorporated by reference from Office Depot’s Current Report on Form 8-K, filed with the SEC on July 21, 2014). | |
| 10.64 | The Office Depot, Inc. Executive Change in Control Severance Plan effective August 1, 2014 (Incorporated by reference from Office Depot’s Current Report on Form 8-K, filed with the SEC on August 7, 2014). | |
| 10.65 | Form of Notice of Selection for Participation in Executive Change in Control Severance Plan and Notice of Non-Renewal of Change in Control Agreement (Incorporated by reference from Office Depot’s Current Report on Form 8-K, filed with the SEC on August 7, 2014). | |
| 10.66 | Form of Settlement Agreement (Incorporated by reference from Office Depot’s Current Report on Form 8-K, filed with the SEC on December 23, 2014) | |
| 10.67 | Securityholders Agreement among Boise Cascade Corporation (now OfficeMax Incorporated), Forest Products Holdings, L.L.C., and Boise Cascade Holdings, L.L.C., dated October 29, 2004 (Incorporated by reference from OfficeMax Incorporated’s Quarterly Report on Form 10-Q, filed with the SEC on November 9, 2004). | |
| 10.68 | Director Stock Compensation Plan, as amended through September 26, 2003 (Incorporated by reference from OfficeMax Incorporated’s Annual Report on Form 10-K, filed with the SEC on March 2, 2004).* | |
| 10.69 | 2003 Director Stock Compensation Plan, as amended through September 26, 2003 (Incorporated by reference from OfficeMax Incorporated’s Annual Report on Form 10-K, filed with the SEC on March 2, 2004).* | |
| 10.70 | Amendment to the OfficeMax Incorporated 2003 Director Stock Compensation Plan (Incorporated by reference from OfficeMax Incorporated’s Current Report on Form 8-K, filed with the SEC on February 20, 2007).* | |
| 10.71 | Form of 2007 Directors’ Restricted Stock Unit Award Agreement (Incorporated by reference from OfficeMax Incorporated’s Current Report on Form 8-K, filed with the SEC on August 1, 2007).* | |
| 10.72 | Form of 2008 Director Restricted Stock Unit Award Agreement (Incorporated by reference from OfficeMax Incorporated’s Current Report on Form 8-K, filed with the SEC on July 29, 2008).* | |
| 10.73 | Form of 2009 Nonqualified Stock Option Award Agreement (Incorporated by reference from OfficeMax Incorporated’s Current Report on Form 8-K, filed with the SEC on February 18, 2009).* | |
| 10.74 | Form of 2009 Director Restricted Stock Unit Award Agreement (Incorporated by reference from OfficeMax Incorporated’s Current Report on Form 8-K, filed with the SEC on July 28, 2009).* | |
| 10.75 | Form of 2010 Nonqualified Stock Option Award Agreement (Incorporated by reference from OfficeMax Incorporated’s Current Report on Form 8-K, filed with the SEC on February 16, 2010).* | |
| 10.76 | Form of 2010 Director Restricted Stock Unit Award Agreement (Incorporated by reference from OfficeMax Incorporated’s Current Report on Form 8-K, filed with the SEC on August 3, 2010).* | |
116
Table of Contents
| Exhibit Number |
Exhibit | |
| 10.77 | Form of 2011 Nonqualified Stock Option Award Agreement (Incorporated by reference from OfficeMax Incorporated’s Current Report on Form 8-K, filed with the SEC on February 15, 2011).* | |
| 10.78 | Form of 2011 Director Restricted Stock Unit Award Agreement (Incorporated by reference from OfficeMax Incorporated’s Current Report on Form 8-K, filed with the SEC on August 2, 2011).* | |
| 10.79 | Form of 2012 Nonqualified Stock Option Award Agreement (Incorporated by reference from OfficeMax Incorporated’s Current Report on Form 8-K, filed with the SEC on February 22, 2012).* | |
| 10.80 | Form of 2012 Performance-Based RSU Award Agreement (Incorporated by reference from OfficeMax Incorporated’s Current Report on Form 8-K, filed with the SEC on February 22, 2012).* | |
| 10.81 | Form of 2012 Performance Unit Award Agreement (Incorporated by reference from OfficeMax Incorporated’s Current Report on Form 8-K, filed with the SEC on February 22, 2012).* | |
| 10.82 | Form of 2012 Director Restricted Stock Unit Award Agreement (Incorporated by reference from OfficeMax Incorporated’s Current Report on Form 8-K, filed with the SEC on July 31, 2012).* | |
| 10.83 | First Amendment to Paper Purchase Agreement dated June 20, 2013 between Boise White Paper, L.L.C. and OfficeMax Incorporated (Incorporated by reference from OfficeMax Incorporated’s Quarterly Report on Form 10-Q, filed with the SEC on August 6, 2013).** | |
| 10.84 | Fourth Amended and Restated Operating Agreement of Boise Cascade Holdings, L.L.C. (Incorporated by reference from OfficeMax Incorporated’s Current Report on Form 8-K, filed with the SEC on March 4, 2013). | |
| 10.85 | 2005 Directors Deferred Compensation Plan (Incorporated by reference from OfficeMax Incorporated’s Current Report on Form 8-K, filed with the SEC on December 15, 2004).* | |
| 10.86(3) | Deferred Compensation and Benefits Trust, as amended for the Form of Sixth Amendment dated May 1, 2001 (Incorporated by reference from OfficeMax Incorporated’s Quarterly Report on Form 10-Q, filed with the SEC on November 13, 2001).* | |
| 10.87 | 2001 Board of Directors Deferred Compensation Plan, as amended through September 26, 2003 (Incorporated by reference from OfficeMax Incorporated’s Annual Report on Form 10-K, filed with the SEC on March 2, 2004).* | |
| 10.88 | Amendment to OfficeMax Incorporated 2005 Directors Deferred Compensation Plan (Incorporated by reference from OfficeMax Incorporated’s Quarterly Report on Form 10-Q, filed with the SEC on November 6, 2008).* | |
| 21 | List of Office Depot, Inc.’s Subsidiaries | |
| 23.1 | Consent of Independent Registered Public Accounting Firm | |
| 31.1 | Certification of CEO required by Securities and Exchange Commission Rule 13a-14(a) or 15d-14(a) | |
| 31.2 | Certification of CFO required by Securities and Exchange Commission Rule 13a-14(a) or 15d-14(a) | |
| 32 | Certification of CEO and CFO Pursuant to 18 U.S.C. Section 1350, as Adopted Pursuant to Section 906 of the Sarbanes-Oxley Act of 2002 | |
| (101.INS) | XBRL Instance Document | |
| (101.SCH) | XBRL Taxonomy Extension Schema Document | |
| (101.CAL) | XBRL Taxonomy Extension Calculation Linkbase Document | |
| (101.DEF) | XBRL Taxonomy Extension Definition Linkbase Document | |
117
Table of Contents
| Exhibit Number |
Exhibit | |
| (101.LAB) | XBRL Taxonomy Extension Label Linkbase Document | |
| (101.PRE) | XBRL Taxonomy Extension Presentation Linkbase Document | |
| * | Management contract or compensatory plan or arrangement. |
| ** | Denotes that confidential portions of this exhibit have been omitted in reliance on Rule 24b-2 of the Securities Exchange Act of 1934. The confidential portions have been submitted separately to the Securities and Exchange Commission. |
| (1) | As noted herein, certain documents incorporated by reference in this Exhibit Index have been filed previously by Office Depot, Inc. with the Securities and Exchange Commission, Commission file number 1-10948 and certain documents have been filed previously by OfficeMax Incorporated with the Securities and Exchange Commission, Commission file number 1-5057. |
| (2) | The Trust Indenture between Boise Cascade Corporation (now OfficeMax Incorporated) and Morgan Guaranty Trust Company of New York, Trustee, dated October 1, 1985, as amended, was filed as exhibit 4 in OfficeMax Incorporated’s Registration Statement on Form S-3 No. 33-5673, filed May 13, 1986. The Trust Indenture has been supplemented on seven occasions as follows: The First Supplemental Indenture, dated December 20, 1989, was filed as exhibit 4.2 in OfficeMax Incorporated’s Pre-Effective Amendment No. 1 to the Registration Statement on Form S-3 No. 33-32584, filed December 20, 1989. The Second Supplemental Indenture, dated August 1, 1990, was filed as exhibit 4.1 in OfficeMax Incorporated’s Current Report on Form 8-K filed on August 10, 1990. The Third Supplemental Indenture, dated December 5, 2001, between Boise Cascade Corporation and BNY Western Trust Company, as trustee, to the Trust Indenture dated as of October 1, 1985, between Boise Cascade Corporation and U.S. Bank Trust National Association (as successor in interest to Morgan Guaranty Trust Company of New York) was filed as exhibit 99.2 in OfficeMax Incorporated’s Current Report on Form 8-K filed on December 10, 2001. The Fourth Supplemental Indenture dated October 21, 2003, between Boise Cascade Corporation and U.S. Bank Trust National Association was filed as exhibit 4.1 in OfficeMax Incorporated’s Current Report on Form 8-K filed on October 20, 2003. The Fifth Supplemental Indenture dated September 16, 2004, among Boise Cascade Corporation, U.S. Bank Trust National Association and BNY Western Trust Company was filed as exhibit 4.1 to OfficeMax Incorporated’s Current Report on Form 8-K filed on September 22, 2004. The Sixth Supplemental Indenture dated October 29, 2004, between OfficeMax Incorporated and U.S. Bank Trust National Association was filed as exhibit 4.1 to OfficeMax Incorporated’s Current Report on Form 8-K filed on November 4, 2004. The Seventh Supplemental Indenture, made as of December 22, 2004, between OfficeMax Incorporated and U.S. Bank Trust National Association was filed as exhibit 4.1 to OfficeMax Incorporated’s Current Report on Form 8-K filed on December 22, 2004. Each of the documents referenced in this footnote is incorporated herein by reference. |
| (3) | The Deferred Compensation and Benefits Trust, as amended and restated as of December 13, 1996, was filed as exhibit 10.18 in OfficeMax Incorporated’s Annual Report on Form 10-K for the fiscal year ended December 31, 1996. Amendment No. 4, dated July 29, 1999, to the Deferred Compensation and Benefits Trust was filed as exhibit 10.18 in OfficeMax Incorporated’s Annual Report on Form 10-K for the fiscal year ended December 31, 1999. Amendment No. 5, dated December 6, 2000, to the Deferred Compensation and Benefits Trust was filed as exhibit 10.18 in OfficeMax Incorporated’s Annual Report on Form 10-K for the fiscal year ended December 31, 2000. Amendment No. 6, dated May 1, 2001, to the Deferred Compensation and Benefits Trust was filed as exhibit 10 in OfficeMax Incorporated’s Quarterly Report on Form 10-Q for the quarter ended September 30, 2001. Each of the documents referenced in this footnote is incorporated herein by reference. |
118