Attached files
| file | filename |
|---|---|
| EX-32.1 - EXHIBIT 32.1 - NEUSTAR INC | exhibit321form10-k2016.htm |
| EX-31.2 - EXHIBIT 31.2 - NEUSTAR INC | exhibit312form10-k2016.htm |
| EX-31.1 - EXHIBIT 31.1 - NEUSTAR INC | exhibit311form10-k2016.htm |
| EX-23.1 - EXHIBIT 23.1 - NEUSTAR INC | exhibit231form10-k2016.htm |
| EX-21.1 - EXHIBIT 21.1 - NEUSTAR INC | exhibit211form10-k2016.htm |
UNITED STATES
SECURITIES AND EXCHANGE COMMISSION
Washington, D.C. 20549
Form 10-K
þ | ANNUAL REPORT PURSUANT TO SECTION 13 OR 15(D) OF THE SECURITIES EXCHANGE ACT OF 1934 |
For the fiscal year ended December 31, 2016
Or
¨ | TRANSITION REPORT PURSUANT TO SECTION 13 OR 15(D) OF THE SECURITIES EXCHANGE ACT OF 1934 |
For the transition period from to
Commission File No. 001-32548
NeuStar, Inc.
(Exact name of registrant as specified in its charter)
Delaware | 52-2141938 | |
State or other jurisdiction of incorporation or organization) | (I.R.S. Employer Identification No.) | |
21575 Ridgetop Circle Sterling, Virginia | 20166 | |
(Address of principal executive offices) | (Zip Code) | |
(571) 434-5400
(Registrant’s telephone number, including area code)
Securities registered pursuant to Section 12(b) of the Act:
Title of Each Class | Name of Each Exchange on Which Registered | |
Class A Common Stock | New York Stock Exchange | |
Securities registered pursuant to Section 12(g) of the Act:
None
Indicate by check mark if the registrant is a well-known seasoned issuer, as defined in Rule 405 of the Securities Act. Yes þ No ¨
Indicate by check mark if the registrant is not required to file reports pursuant to Section 13 or Section 15(d) of the Act. Yes ¨ No þ
Indicate by check mark whether the registrant (1) has filed all reports required to be filed by Section 13 or 15(d) of the Securities Exchange Act of 1934 during the preceding 12 months (or for such shorter period that the registrant was required to file such reports), and (2) has been subject to such filing requirements for the past 90 days. Yes þ No ¨
Indicate by check mark whether the registrant has submitted electronically and posted on its corporate Web site, if any, every Interactive Data File required to be submitted and posted pursuant to Rule 405 of Regulation S-T during the preceding 12 months (or for such shorter period that the registrant was required to submit and post such files). Yes þ No ¨
Indicate by check mark if disclosure of delinquent filers pursuant to Item 405 of Regulation S-K is not contained herein, and will not be contained, to the best of registrant’s knowledge, in definitive proxy or information statements incorporated by reference in Part III of this Form 10-K or any amendment to this Form 10-K. ¨
Indicate by check mark whether the registrant is a large accelerated filer, an accelerated filer, a non-accelerated filer, or a smaller reporting company. See the definitions of “large accelerated filer,” “accelerated filer” and “smaller reporting company” in Rule 12b-2 of the Exchange Act. (Check one):
Large accelerated filer | þ | Accelerated filer | ¨ | |||
Non-accelerated filer | ¨ | (Do not check if a smaller reporting company) | Smaller reporting company | ¨ | ||
Indicate by check mark whether the registrant is a shell company (as defined in Rule 12b-2 of the Exchange Act). Yes ¨ No þ
On February 24, 2017, 55,150,233 shares of NeuStar Class A common stock were outstanding and 1,864 shares of NeuStar Class B common stock were outstanding. The aggregate market value of the NeuStar common equity held by non-affiliates as of June 30, 2016 was approximately $1.9 billion.
DOCUMENTS INCORPORATED BY REFERENCE:
None.
TABLE OF CONTENTS
Item | Description | Page |
1. | ||
1A. | ||
1B. | ||
2. | ||
3. | ||
4. | ||
5. | ||
6. | ||
7. | ||
7A. | ||
8. | ||
9. | ||
9A. | ||
9B. | ||
10. | ||
11. | ||
12. | ||
13. | ||
14. | ||
15. | ||
16. | ||
Unless the context requires otherwise, references in this report to “Neustar,” “we,” “us,” the “Company” and “our” refer to NeuStar, Inc. and its consolidated subsidiaries.
INTRODUCTORY NOTE
On December 14, 2016, we announced that we entered into a definitive merger agreement to be acquired by a private investment group led by Golden Gate Capital. Under the terms of the merger agreement, our stockholders will be entitled to receive $33.50 per share following the closing of the proposed merger. The merger, which is expected to close no later than the end of the third quarter of 2017, is subject to approval by our stockholders, regulatory approvals and other customary closing conditions.
Prior to entering into the merger agreement, we announced on June 21, 2016 our intention to separate into two independent and publicly traded companies through a tax-free spin-off. One company would have consisted of the majority of our information services, including Marketing Services, Security Services and related Data Services. The other company would have focused on providing Order Management and Numbering Services, including Local Number Portability Administration, number administration and ancillary numbering services as well as order and inventory management solutions.
PART I
ITEM 1. | BUSINESS |
Our Business
We help clients grow and guard their business with the most complete understanding of how to connect people, places, and things using our authoritative OneIDTM system. As the leader in connection sciences, we use our expertise in real-time addressing, authentication, and analytics to provide marketing, risk security, registry, and communications solutions to over 11,000 clients. Our cloud-based platforms and differentiated data sets offer informative, real-time analytics, which enable clients to make actionable, data-driven decisions. We provide chief marketing officers a comprehensive suite of services to plan their media spend, identify and locate desired customers, invest effectively in marketing campaigns, deliver relevant offers and measure the performance of these activities. Security professionals use our solutions to maximize web performance and protect against malicious attacks. We enable the exchange of essential operating information across multiple carriers to provision and manage services, assisting clients with fast and accurate order processing and immediate routing of customer inquiries. We provide communications service providers in the United States critical infrastructure that enables the dynamic routing of calls and text messages.
We incorporated in Delaware in 1998. Our principal executive offices are located at 21575 Ridgetop Circle, Sterling, Virginia, 20166, and our telephone number at that address is (571) 434-5400.
Our Services
Marketing Services
Our Marketing Services empower clients to make informed and high impact decisions in real time to promote their business, increase customer retention, achieve greater campaign success and increase their marketing return on investment, as well as mitigate risk and fraud. Using these services, our clients can plan and execute marketing strategies and measure the effectiveness of advertising campaigns across multiple channels with advanced marketing analytics, custom segmentation and media optimization. Marketers also use our omni-channel workflow solutions to tailor their media spend, efficiently reach specific audiences, and measure campaign performance across an array of devices.
Our Marketing Services provide:
• | Customer Intelligence. We provide authoritative, cloud-based solutions that enable marketers to identify, verify and segment existing and potential customers in real-time for both marketing initiatives and for fraud and risk mitigation. Using a privacy-by-design foundation, these solutions provide clients with a comprehensive view of their customers and prospects most likely to purchase their products and services based on attributes such as demographics, geography, and buying propensities. Our services enable clients to plan data-driven marketing strategies, develop high-impact advertising and lead generation campaigns and execute informed media planning for consistent execution across multiple channels to increase customer conversions. |
3
• | Activation. Our activation services enable marketers to maximize the impact of online display ad targeting for specific prospect audiences and customers. Our predictive segmentation and geo-targeting capabilities enable clients to reach online customers with relevant messages, by deploying criteria based on buying propensity, geography or a combination of each, in a privacy-compliant manner. |
• | Media Intelligence. We provide a platform that enables marketers to plan and allocate their marketing spend across sales channels and media platforms. We provide measurement and attribution capabilities to optimize marketing effectiveness. Our solutions connect proprietary customer data, such as sales, pricing, promotions, and distribution, with external factors, such as macro-economic conditions, competition, and weather, to tailor marketing spending plans and measure the resulting business impact. Our platform links actual business performance, such as sales and profitability, to every facet of the marketing plan across offline and online channels. |
Security Services
We direct and manage the flow of Internet traffic, resolve Internet queries and provide security protection against cyber attacks. We also manage authoritative domain-name registries.
Our Security Services provide:
• | DNS Services. Our domain name systems, or DNS, solutions protect our client’s Internet ecosystem and defend most standard transmission control protocol based applications, including, among others, websites, email servers, application programming interfaces, and databases. Our managed and recursive DNS services deliver fast, accurate responses to online queries with the scalability that today’s enterprises demand. In addition, we provide load-testing analysis to help an enterprise prepare for peak loads on new and existing systems. |
• | DDoS Protection. We provide cloud-based Distributed Denial of Service, or DDoS, protection services that help our clients reduce risk, downtime and revenue loss from cyber attacks. Our extensive diagnostics and multi-domain views give clients a holistic perspective both inside and outside their firewalls. We also provide early detection and alerting against cyber attacks, and provide advanced services that strengthen and protect an enterprise’s defenses against such attacks. |
• | Domain Name Registries. We operate the authoritative registries of Internet domain names for the .biz, .us, .co, .au, and .travel top-level domains, and provide international registry gateways. We also provide back-end support for generic top-level domains, or gTLDs, such as .nyc. All Internet communications routed to any of these domains must query a copy of our directory to ensure that the communication is routed to the appropriate destination. |
Data Services
We manage large, complex and hard-to-replicate data sets that enable clients to process decisions and transactions in real time. Our workflow solutions enable the exchange of essential operating information with multiple carriers in order to provision and manage services. Our clients use our services to support multiple applications that rely on high speed, reliable and secure transfer of critical information.
Our Data Services provide:
• | Carrier Provisioning. We provide network services that enable our carrier customers to exchange essential operating information with multiple carriers to provision and manage services for their subscribers. In addition, we offer inventory management services that allow our carrier customers to manage efficiently their assigned telephone numbers and associated resources. |
• | Caller Authentication. We provide authoritative, accurate and current caller-name data and related information to communications service providers. We also store and publish caller-name data on behalf of our carrier customers. |
• | User Authentication and Rights Management. We operate the user authentication and rights management system, which supports the UltraViolet™ digital content locker that consumers use to access their entertainment content. We operate a managed service that offers a global routing and addressing solution to help clients optimize their evolving interconnected business. |
NPAC Services
Number portability administration center, or NPAC, Services include the dynamic routing of calls and text messages among all competing communications service providers in the United States and related connection services and system
4
enhancements. We operate and maintain authoritative databases that help manage the increasing complexity in the telecommunications industry. Our NPAC Services provide the foundation for subscriber acquisition in a robust and competitive telecommunications market. These services support the industry’s needs for real-time network and resource optimization, and also support additional services including public safety, law enforcement, emergency preparedness, disaster recovery, and efficient telephone number utilization. The NPAC is the world’s largest and most complex number management system with connections to over 4,800 individual customers in the United States and is a critical component of the national telecommunications network infrastructure.
Operations
Sales Force and Marketing
We operate a unified marketing and sales organization in order to promote more effectively our brand and go to market with our solutions. Our sales and marketing teams are aligned by industry vertical. This model allows us to deliver solutions that address the most critical challenges of our clients’ business. Our experienced sales and marketing staff have extensive knowledge of the industries we serve and understand how our products and services address our clients’ priorities and needs. We employ a wide array of direct and indirect sales approaches and marketing strategies, and we base our strategy on our analysis of market requirements, client needs, and industry direction. As of December 31, 2016, our sales and marketing organization consisted of 555 people who work together to offer our clients advanced services and solutions.
Operational Capabilities
We provide our services through our state-of-the-art data centers and remotely hosted computer hardware located in third-party facilities throughout the world. Our data centers, including third-party facilities, are custom designed for processing and transmitting high volumes of transaction-related, time-sensitive data in a highly secure environment. We are committed to employing best-of-breed tools and equipment for application development, infrastructure management, operations and information security management. In general, we subscribe to the highest level of service and responsiveness available from each third-party vendor that we use. Further, to protect the integrity and ensure the reliability of our systems, the major components of our networks are generally designed with the intention of eliminating any single point of failure.
We consistently meet and frequently exceed our contractual service level requirements. Our performance results for certain services are monitored internally and are subjected to independent audits on a regular basis.
Research and Development
We maintain a research and development group, the principal function of which is to develop new and innovative services and make improvements to existing services, oversee quality control processes and perform application testing. Our processes surrounding the development of new services and improvements to existing services focus on resolving the challenges our clients face. We employ industry experts in areas of technology that we believe are key to solving these challenges. Our quality control and application testing processes focus predominantly on resolving highly technical issues that are integral to the performance of our services and solutions. These issues are identified through both internal and external feedback mechanisms, and continuous testing of our applications and systems to ensure uptime commensurate with the service level standards we have agreed to provide to our clients. As of December 31, 2016, we had 173 employees dedicated to research and development, including software engineers, quality assurance engineers, technical project managers and documentation specialists. Our research and development expense was $27.7 million, $25.7 million and $28.2 million for the years ended December 31, 2014, 2015 and 2016, respectively.
Clients and Markets
We primarily serve clients in the following industries:
• | Communications. Our clients include telecommunications services providers, as well as emerging providers of voice over Internet protocol, or VoIP, services, social media, and message aggregation. Within this industry, we provide services in numbering, caller authentication, carrier provisioning, and marketing analytics. |
• | Financial Services. Our clients span several financial sectors, including retail banking, collections, insurance, credit cards and investments. Within this industry, we provide verification for risk and compliance mitigation, web infrastructure protection, demographic analytics, digital marketing and measurement, and call center experience optimization. |
• | Media and Advertising. Our clients include both the buy-side and sell-side of the advertising and media landscapes, including advertisers, agencies, ad enablers, publishers and performance marketing providers. Within this industry, |
5
we provide marketing solutions that enable identification and audience targeting, optimization of media investments and measurement of campaign effectiveness.
• | Retail and eCommerce. Our clients include department stores, travel and hospitality companies, consumer packaged goods providers, educational institutions and auto parts manufacturers. Within this industry, we primarily provide marketing data analytics, media intelligence platform services, and Internet infrastructure services. |
• | Internet. Our clients include eCommerce, consumer Internet services (e.g. social networks), and online gaming companies. Within this industry, we primarily provide security services such as managed DNS, website personalization, and protection against cyber attacks, as well as marketing analytics and measurement. |
• | Technology. Our clients include hardware, consumer electronics, software, SaaS companies and high-tech manufacturers. Within this industry, we primarily provide security services such as protection against cyber attacks and website personalization, as well as call center optimization. |
No single corporate entity accounted for more than 10% of our total revenue in 2016. Our clients include corporate entities, each of which is separately billed for the services we provide, regardless of whether it may be affiliated with one or more of our other clients. The amount of our revenue derived from clients inside the United States was $901.1 million, $973.6 million and $1,110.2 million for the years ended December 31, 2014, 2015 and 2016, respectively. The amount of our revenue derived from clients outside the United States was $62.5 million, $76.3 million and $99.7 million for the years ended December 31, 2014, 2015 and 2016, respectively. The amount of our revenue derived under our contracts with North American Portability Management LLC, or NAPM, an industry group that represents all telecommunications service providers in the United States, was $474.8 million, $507.1 million and $512.3 million for the years ended December 31, 2014, 2015 and 2016, respectively, and represented 49%, 48% and 42% of our revenue for the years ended December 31, 2014, 2015 and 2016, respectively. Our total revenue from our contracts with the NAPM includes revenue from our NPAC Services, transition services, connection services related to our NPAC Services and NPAC-related system enhancements.
We currently operate in one operating segment. A single management team reports to the chief operating decision maker who manages the entire business. We do not operate any separate lines of businesses or separate business entities with respect to the sale and support of our services. For further discussion of enterprise-wide results, including goodwill and intangible assets, revenue, total long-lived assets, as well as information concerning our international operations, see Note 4 and Note 15 to our Consolidated Financial Statements in Item 8 of Part II of this report.
Competition
We have a number of competitors for our services:
• | Marketing Services. Our primary competitors include Acxiom Corporation, Adobe Systems Incorporated, salesforce.com, inc., and Oracle Corporation, which compete with us in customer intelligence, activation, and media intelligence. |
• | Security Services. Our competitors include Akamai Technologies, Inc. which competes with us in services that protect against cyber attacks. With respect to our registries, our primary competitors include VeriSign, Inc. and Afilias Limited. With respect to our managed DNS services, our competitors include VeriSign, Inc., Cloudflare, Inc., and Cisco Systems, Inc. |
• | Data Services. Our competitors include AT&T Inc., Ericsson, Synchronoss Technologies, Inc. and Syniverse Technologies, LLC. |
• | NPAC Services. We are currently the only provider of Local Number Portability Administrator, or LNPA, services in the United States. On March 26, 2015, the Federal Communications Commission, or FCC, approved the selection by the North American Numbering Council, or NANC, of Telcordia, d/b/a iconectiv, a wholly owned subsidiary of Ericsson, to serve as the LNPA for the next contract term. On July 1, 2016, the NAPM provided us with a notice of non-renewal informing us of its election not to renew our master contracts to provide LNPA services that were due to expire on September 30, 2016. We will continue to provide LNPA services and transition services at the pricing terms under the current contracts until the NAPM provides at least one termination notice, which must establish a termination date that is 180 days after the date of notice. On July 25, 2016, the FCC approved a Master Services Agreement between Telcordia and the NAPM to serve as the next LNPA. On August 31, 2016, the NAPM’s Transition Oversight Manager, or TOM, announced that it plans for the LNPA transition from us to Telcordia to be complete by May 25, 2018. (For more information regarding the selection process, see “Risk Factors — Risks Related to Our Business — When our seven contracts with North American |
6
Portability Management LLC are terminated, the timing of which is uncertain, our revenue and profitability will be materially adversely affected.” in Item 1A of this report).
With respect to our contracts to act as the North American Number Plan Administrator, the National Pooling Administrator, and the operator of the authoritative registry for the .us, .co, .au and .biz Internet domain names, the relevant counterparty could elect not to exercise the extension period under the contract, if applicable, or could allow the contract to terminate in accordance with its terms. If any of these contracts were allowed to terminate, or otherwise were not extended, we could be required to compete with other providers for the right to continue to provide the services we are currently providing under these contracts.
Competitive factors in the market for our services include breadth and quality of services offered, reliability, security, cost-efficiency, privacy compliance and client support. Our ability to compete successfully depends on numerous factors, both within and outside our control, including:
• | our responsiveness to clients’ needs; |
• | our ability to support existing and new industry standards and protocols; |
• | our ability to continue to develop technical innovations and invest in product development; and |
• | the quality, reliability, security and price-competitiveness of our services. |
We may not be able to compete successfully against current or future competitors and competitive pressures that we face may materially and adversely affect our business. See “Risk Factors — Risks Related to Our Business — The markets for our services are competitive, and if we do not adapt our organization and services to meet rapid technological and market change, we could lose clients or market share.” in Item 1A of this report.
Employees
As of December 31, 2016, we had 1,988 employees. None of our employees are currently represented by a labor union. We have not experienced any work stoppages and consider our relationship with our employees to be good.
Contracts
We provide many of our services pursuant to private commercial and government contracts. Specifically, in the United States, we provide centralized wireline and wireless number portability services pursuant to seven regional contracts with the NAPM, and implement the allocation of pooled blocks of telephone numbers and manage the North American Numbering Plan pursuant to contracts with the FCC. Although the FCC has plenary authority over the administration of telephone number portability, it is not a party to our contracts with the NAPM. The FCC has delegated limited oversight responsibilities to the NANC, which reviews and oversees the NAPM’s management of these contracts. See — “Regulatory Environment — Telephone Numbering.”
Our seven regional contracts with the NAPM provide for an annual fixed-fee pricing model under which the annual fixed fee, or Base Fee, was set at $465.8 million, $496.1 million and $496.1 million in 2014, 2015 and 2016, respectively. If the actual volume of transactions in a given year is above or below the contractually established volume range for that year, the Base Fee may be adjusted up or down, respectively, with any such adjustment being applied in the following year.
Under the fixed-fee model, our fees are billed to telecommunications service providers based on their allocable share of the total annual charges. This allocable share is based on each respective telecommunications service provider’s share of the aggregate end-user services revenue of all U.S. telecommunications service providers, as determined by the FCC. Under these contracts, we also bill to our clients a revenue recovery collections fee, or RRC fee, equal to a percentage of monthly billings, which is available to us if any telecommunications service provider fails to pay its allocable share of total transaction charges. If the RRC fee proves insufficient for that purpose, these contracts also provide for the recovery of such differences from the remaining telecommunications service providers. Under these contracts, users of our NPAC Services also pay fees to connect to our data center and additional fees for reports that we generate at the user’s request.
As noted above, on July 1, 2016, we received a notice of non-renewal from the NAPM informing us of its election not to renew our master agreements to provide LNPA services that were due to expire on September 30, 2016. On July 25, 2016 the FCC issued an Order approving the proposed contract between the NAPM and a competitor to serve as the next LNPA. On September 29, 2016, the NAPM provided notice to extend the term of our master contracts and opted not to license the source code that we use to provide services to the NAPM. We will continue to provide services and transition services at the pricing terms under the current contracts until the NAPM provides at least one termination notice to us, which must establish a
7
termination date that is 180 days after the date of notice. (See “Risk Factors — Risks Related to Our Business — When our seven contracts with North American Portability Management LLC are terminated, the timing of which is uncertain, our revenue and profitability will be materially adversely affected.” in Item 1A of this report).
We also provide wireline and wireless number portability and network management services in Canada pursuant to a contract with the Canadian LNP Consortium Inc., a private corporation composed of telecommunications service providers who participate in number portability in Canada. The Canadian Radio-Television and Telecommunications Commission oversees the Canadian LNP Consortium’s management of this contract. We bill each telecommunications service provider for our services under this contract primarily on a per-transaction basis. In November 2016, this contract was amended to continue through December 31, 2028. The services we provide under the contracts with the NAPM and the Canadian LNP Consortium are subject to rigorous performance standards, and we are subject to corresponding penalties for failure to meet those standards.
We serve as the North American Numbering Plan Administrator and the National Pooling Administrator pursuant to two separate contracts with the FCC. Under these contracts, we administer the assignment and implementation of new area codes in North America, the allocation of central office codes (which are the prefixes following the area codes) to telecommunications service providers in the United States, and the assignment and allocation of pooled blocks of telephone numbers in the United States in a manner designed to conserve telephone number resources. The North American Numbering Plan Administration contract is a fixed-fee government contract that was originally awarded by the FCC to us in 2003. In July 2012, we were awarded a new contract to serve as the North American Numbering Plan Administrator for a term not to exceed five years. The National Pooling Administration contract was originally awarded to us by the FCC in 2001. Under this contract, we perform the administrative functions associated with the allocation of pooled blocks of telephone numbers in the United States. The terms of this contract provide for a fixed fee associated with the administration of the pooling system. In July 2013, the FCC awarded us a new contract to continue as the National Pooling Administrator. The initial contract term was one year, commencing in July 2013, with three possible one-year extensions exercisable at the election of the FCC. The FCC has exercised the first three options, the most recent in July 2016, extending the current contract through July 14, 2017.
We are the operator of the .biz Internet top-level domain by contract with the Internet Corporation for Assigned Names and Numbers, or ICANN. The .biz contract was originally granted to us in May 2001. In August 2013, the .biz contract was extended through June 30, 2019. Similarly, pursuant to a contract with the U.S. Department of Commerce, originally awarded in October 2001, we operate the .us Internet top-level domain. The Department of Commerce recently conducted a competitive procurement process with respect to this contract, and as a result of this competitive process, we were awarded the contract on February 28, 2014. This new contract is for a term of three years, with two additional one-year extension options exercisable at the election of the Department of Commerce. The Department of Commerce exercised the first option in January 2017, extending the current contract through February 28, 2018.
The .biz and .us contracts allow us to provide domain name registration services to domain name registrars, who pay us on a per-name basis.
Regulatory Environment
Telephone Numbering
Overview. Congress enacted the Telecommunications Act of 1996 to remove barriers to entry in the communications market. Among other things, the Telecommunications Act of 1996 mandates portability of telephone numbers and requires traditional telephone companies to provide non-discriminatory access and interconnection to potential competitors. The FCC has plenary jurisdiction over issues relating to telephone numbers, including telephone number portability and the administration of telephone number resources. Under this authority, the FCC promulgated regulations governing the administration of telephone numbers and telephone number portability. In 1995, the FCC established the NANC, a federal advisory committee, to advise and make recommendations to the FCC on telephone numbering issues, including telephone number resources administration and telephone number portability. The members of the NANC include representatives from local exchange carriers, interexchange carriers, wireless providers, VoIP providers, manufacturers, state regulators, consumer groups, and telecommunications associations.
Telephone Number Portability. The Telecommunications Act of 1996 requires telephone number portability, which is the ability of users of telecommunications services to retain existing telephone numbers without impairment of quality, reliability, or convenience when switching from one telecommunications service provider to another. Through a competitive proposal process, a consortium of service providers representing the communications industry selected us to develop, build and operate a solution to enable telephone number portability in the United States. We ultimately entered into seven regional contracts to administer the system that we developed, after which the NANC recommended to the FCC, and the FCC approved, our selection to serve as a neutral administrator of telephone number portability. The FCC also directed the seven original regional entities, each comprising a consortium of service providers operating in the respective regions, to manage and oversee the
8
administration of telephone number portability, subject to NANC oversight. Under the rules and policies adopted by the FCC, the NAPM, as successor in interest to the seven regional consortiums, has the power and authority to manage and negotiate changes to the current master agreements.
On November 3, 2005, BellSouth Corporation, or BellSouth, filed a petition with the FCC seeking changes in the way our clients are billed for services provided by us under our contracts with the NAPM. In response to the BellSouth petition, the FCC requested comments from interested parties. As of February 24, 2017, the FCC had not initiated a formal rulemaking process and the BellSouth petition remains pending. Similarly, on May 20, 2011, Verizon Communications Inc. and Verizon Wireless Inc. filed a joint petition, the Verizon Petition, with the FCC seeking a ruling that certain carrier initiated modifications of NPAC records be excluded from the costs of the shared NPAC database and be paid for instead by the provider that caused such costs to be incurred. In response to the Verizon Petition, the FCC requested comments from interested parties. On April 18, 2013, the FCC initiated a rulemaking concerning interconnected VoIP providers direct access to telephone numbers in which it asked for comment on the question of whether the FCC should initiate a rulemaking to examine the FCC’s cost allocation rules for number administration, portability and pooling more generally. As of February 24, 2017, the FCC had not initiated a formal rulemaking process and the Verizon Petition remains pending.
After the amendment of our contracts with the NAPM in September 2006, Telcordia Technologies, Inc., d/b/a iconectiv, a wholly owned subsidiary of the Swedish telecommunications equipment manufacturer, Ericsson, filed a petition with the FCC requesting an order that would require the NAPM to conduct a new bidding process to appoint a provider of telephone number portability services in the United States. In response to our amendment of these contracts in January 2009, Telcordia filed another petition asking that the FCC abrogate these contracts and initiate a government-managed procurement in their place. As part of the order selecting iconectiv as the next LNPA, the FCC granted these petitions to the extent consistent with its order and otherwise denied these petitions. (See “Risk Factors — Risks Related to Our Business — When our seven contracts with North American Portability Management LLC are terminated, the timing of which is uncertain, our revenue and profitability will be materially adversely affected.” in Item 1A of this report).
North American Numbering Plan Administrator and National Pooling Administrator. We have contracts with the FCC to act as the North American Numbering Plan Administrator and the National Pooling Administrator, and we must comply with the rules and regulations of the FCC that govern our operations in each capacity. We are charged with administering numbering resources in an efficient and non-discriminatory manner, in accordance with FCC rules and industry guidelines developed primarily by the Industry Numbering Committee. These guidelines provide governing principles and procedures to be followed in the performance of our duties under these contracts. The communications industry regularly reviews and revises these guidelines to adapt to changed circumstances or as a result of the experience of industry participants in applying the guidelines. A committee of the NANC evaluates our performance against these rules and guidelines each year and provides an annual review to the NANC and the FCC. If we violate these rules and guidelines, or if we fail to perform at required levels, the FCC may reevaluate our fitness to serve as the North American Numbering Plan Administrator and the National Pooling Administrator and may terminate our contracts or impose fines. The division of the NANC responsible for reviewing our performance as the North American Numbering Plan Administrator and the National Pooling Administrator has determined that, with respect to our performance in 2015, we “met” our performance guidelines under each such respective review. Similar reviews of our performance in 2016 have not yet been completed.
Neutrality. Under FCC rules and orders establishing the qualifications and obligations of the North American Numbering Plan Administrator and National Pooling Administrator, and under our contracts with the NAPM to provide telephone number portability services, we are required to comply with neutrality regulations and policies. Under these neutrality requirements, we are required to operate our numbering plan, pooling administration and number portability functions in a neutral and impartial manner, which means that we cannot favor any particular telecommunications service provider, telecommunications industry segment or technology or group of telecommunications consumers over any other telecommunications service provider, industry segment, technology or group of consumers in the conduct of those businesses. We are examined periodically on our compliance with these requirements by independent third parties. The combined effect of our contracts and the FCC’s regulations and orders requires that we:
• | not be a telecommunications service provider, which is generally defined by the FCC as an entity that offers telecommunications services to the public at large, and is, therefore, providing telecommunications services on a common carrier basis, or an interconnected VoIP provider; |
• | not be an affiliate of a telecommunications service provider or VoIP provider, which means, among other things, that we: |
• | must restrict the beneficial ownership of our capital stock by telecommunications service providers, VoIP providers or affiliates of a telecommunications service provider or VoIP provider; and |
9
• | may not otherwise, directly or indirectly, control, be controlled by, or be under common control with, a telecommunications service provider or VoIP provider; |
• | not derive a majority of our revenue from any single telecommunications service provider; and |
• | not be subject to undue influence by parties with a vested interest in the outcome of numbering administration and activities. Notwithstanding our satisfaction of the other neutrality criteria above, the NANC or the FCC could determine that we are subject to such undue influence. The NANC may conduct an evaluation to determine whether we meet this “undue influence” criterion. |
We are required to maintain confidentiality of competitive client information obtained during the conduct of our business. In addition, as part of our neutrality framework, we are required to comply with a code of conduct that is designed to ensure our continued neutrality. Among other things, our code of conduct, which was approved by the FCC, requires that:
• | we never, directly or indirectly, show any preference or provide any special consideration to any telecommunications service provider; |
• | we prohibit access by our stockholders to user data and proprietary information of telecommunications service providers served by us (other than access of employee stockholders that is incidental to the performance of our numbering administration duties); |
• | our stockholders take steps to ensure that they do not disclose to us any user data or proprietary information of any telecommunications service provider in which they hold an interest, other than the sharing of information in connection with the performance of our numbering administration duties; |
• | we not share confidential information about our business services and operations with employees of any telecommunications service provider; |
• | we refrain from simultaneously employing, whether on a full-time or part-time basis, any individual who is an employee of a telecommunications service provider and that none of our employees hold any interest, financial or otherwise, in any company that would violate these neutrality standards; |
• | we prohibit any individual who serves in the management of any of our stockholders from being involved directly in our day-to-day operations; |
• | we implement certain requirements regarding the composition of our Board of Directors; |
• | no member of our Board of Directors simultaneously serves on the Board of Directors of a telecommunications service provider; and |
• | we hire an independent party to conduct a quarterly neutrality audit to ensure that we and our stockholders comply with all the provisions of our code of conduct. |
In connection with the neutrality requirements imposed by our code of conduct and under our contracts, we are subject to a number of neutrality audits that are performed on a quarterly and annual basis. In connection with these audits, all of our employees, directors and officers must sign a neutrality certification that states that they are familiar with our neutrality requirements and have not violated them. Failure to comply with applicable neutrality requirements could result in government fines, corrective measures, curtailment of contracts or even the revocation of contracts. See “Risk Factors — Risks Related to Our Business — Failure to comply with neutrality requirements could result in loss of significant contracts.” in Item 1A of this report.
In contemplation of the initial public offering of our securities, we sought and obtained FCC approval for a “safe harbor” from previous orders of the FCC that allowed us to consummate the initial public offering for our securities but required us to seek prior approval from the FCC for any change in our overall ownership structure, corporate structure, bylaws, or distribution of equity interests, as well as certain types of transactions, including the issuance of indebtedness by us. Under the safe harbor order, we are required to maintain provisions in our organizational and other corporate documents that require us to comply with all applicable neutrality rules and orders. We are no longer required to seek prior approval from the FCC for many of these changes and transactions, although we are required to provide notice of such changes or transactions. In addition, we are subject to the following requirements under the safe harbor order:
• | we may not issue more than 50% of our aggregate outstanding indebtedness to any telecommunications service provider; |
10
• | we may not acquire any equity interest in a telecommunications service provider or an affiliate of a telecommunications service provider without prior approval of the FCC; |
• | we must restrict any telecommunications service provider or affiliate of a telecommunications service provider from acquiring or beneficially owning 5% or more of our outstanding capital stock; |
• | we must report to the FCC the names of any telecommunications service providers or telecommunications service provider affiliates that own a 5% or greater interest in our Company; |
• | we must make beneficial ownership records available to our auditors, and must certify upon request that we have no actual knowledge of any ownership of our outstanding capital stock by a telecommunications service provider or telecommunications service provider affiliate other than as previously disclosed; and |
• | we must make our debt records available to our auditors and certify that no telecommunications service provider holds more than 50% of our aggregate outstanding indebtedness. |
Internet Domain Name Registrations
We are also subject to government and industry regulation under our Internet registry contracts with the U.S. government and ICANN, the industry organization responsible for regulation of Internet top-level domains. We are the operator of the .biz Internet domain under a contract with ICANN, as described above under “Contracts.” Similarly, pursuant to a contract with the U.S. Department of Commerce, we operate the .us Internet domain registry. This contract is also described above under “Contracts.” Under each of these registry service contracts, we are required to:
• | provide equal access to all registrars of domain names; |
• | comply with Internet standards established by the industry; and |
• | implement additional policies as they are adopted by the U.S. government or ICANN. |
Intellectual Property
Our success depends in part upon our proprietary technology and patents. We rely principally upon trade secret and copyright law to protect our technology, including our software, network design, and subject matter expertise. We enter into confidentiality and license agreements with our employees, consultants, outsourcing suppliers, partners, distributors, clients, and potential clients and limit access to and distribution of our software, documentation, and other proprietary information. We believe, however, that because of the rapid pace of technological change, these legal protections for our services are less significant factors in our success than the knowledge, ability, and experience of our employees and the timeliness and quality of our services.
Available Information and Exchange Certifications
We maintain an Internet website at www.neustar.biz. Information contained on, or that may be accessed through, our website is not part of this report. Our annual report on Form 10-K, quarterly reports on Form 10-Q, current reports on Form 8-K and amendments to reports filed or furnished pursuant to Sections 13(a) and 15(d) of the Securities Exchange Act of 1934, as amended, are available, free of charge, on the Investor Relations section of our website under the heading “SEC Filings by NeuStar,” as soon as reasonably practicable after we electronically file such reports with, or furnish those reports to, the U.S. Securities and Exchange Commission, or the SEC. Our Principles of Corporate Governance, Board of Directors committee charters (including the charters of the Audit Committee, Compensation Committee, and Nominating and Corporate Governance Committee) and code of ethics entitled “Corporate Code of Business Conduct” also are available on the Investor Relations section of our website. Stockholders may request free copies of these documents, including a copy of our annual report on Form 10-K, by sending a written request to our Corporate Secretary at NeuStar, Inc., 21575 Ridgetop Circle, Sterling, VA 20166. In the event that we make any changes to, or provide any waivers from, the provisions of our Corporate Code of Business Conduct, we intend to disclose these events on our website or in a report on Form 8-K within four business days of such event.
We have filed, as exhibits to this Annual Report on Form 10-K, the certification of our principal executive officer and principal financial officer regarding the quality of our public disclosures, which is required to be filed with the SEC, under Section 302 of the Sarbanes Oxley Act of 2002.
11
Cautionary Note Regarding Forward-Looking Statements
This report contains forward-looking statements. In some cases, you can identify forward-looking statements by terminology such as “may,” “will,” “should,” “expects,” “intends,” “plans,” “anticipates,” “believes,” “estimates,” “predicts,” “potential,” “continue” or the negative of these terms or other comparable terminology. These statements relate to future events or our future financial performance and involve known and unknown risks, uncertainties and other factors that may cause our actual results, levels of activity, performance or achievements to differ materially from any future results, levels of activity, performance or achievements expressed or implied by these forward-looking statements. Many of these risks are beyond our ability to control or predict. These risks and other factors include those listed under “Risk Factors” in Item 1A of this report and elsewhere in this report and include:
• | the occurrence of any event, change or other circumstance that could give rise to the termination of the merger agreement; |
• | the failure to satisfy required closing conditions under the merger agreement, including, without limitation, obtaining required regulatory approvals and the approval of our stockholders, or the failure to complete the merger in a timely manner; |
• | risks related to disruption of management’s attention from our ongoing business operations due to the pendency of the merger; |
• | the effect of the announcement of the merger on our operating results and businesses generally and our relationships with employees, customers, suppliers and regulators; |
• | the outcome of any legal proceedings that may be instituted against us and others relating to the merger agreement; |
• | the impact of the pending merger on our strategic plans and operations and our ability to respond effectively to competitive pressures, industry developments and future opportunities; |
• | termination, modification, expiration or non-renewal of (or announcements related to any of the foregoing) our contracts to provide telephone number portability and other directory services; |
• | failures or interruptions of our systems and services; |
• | loss of, or damage to, a data center; |
• | security or privacy breaches; |
• | adverse changes in statutes or regulations affecting the communications industry; |
• | our failure to adapt to rapid technological change in the communications industry; |
• | competition from our clients’ in-house systems or from other providers of information services; |
• | our failure to achieve or sustain market acceptance at desired pricing levels; |
• | a decline in the volume of transactions we handle; |
• | inability to manage our growth; |
• | economic, political, regulatory and other risks in the regions and industries in which we operate; |
• | inability to obtain sufficient capital to fund our operations, capital expenditures and expansion; |
• | loss of members of senior management, or inability to recruit and retain skilled employees; |
• | failure to comply with neutrality requirements, |
• | risks related to our indebtedness and the impact that it may have on our functional and operating activities; |
• | inability to protect our intellectual property; |
• | inability to obtain accurate data required for our information services; |
• | disruption, increased costs and other risks related to our international expansion; and |
12
• | risks relating to the integration of acquired businesses, including the ability of acquired businesses to retain their existing business relationships and key employees. |
ITEM 1A. | RISK FACTORS |
The following sets forth risk factors associated with our business. The risks set forth below could materially affect our business, financial condition and future results and are not the only risks facing us. Additional risks and uncertainties not currently known to us or that we currently deem to be immaterial also may materially and adversely affect our business, financial condition or operating results.
Risks related to the merger
We may not complete the merger within the time frame we anticipate or at all, which could have an adverse effect on our business, financial results and/or operations.
Completion of the merger is subject to a number of closing conditions, including obtaining approval of our stockholders and receipt of required regulatory approvals. Each party’s obligation to consummate the merger is also subject to the accuracy of the representations and warranties of the other party (subject to certain qualifications and exceptions) and the performance in all material respects of the other party’s covenants under the merger agreement, including, with respect to us, covenants regarding operation of our business prior to closing. In addition, the merger agreement may be terminated under certain specified circumstances, including, but not limited to, a change in the recommendation of our Board of Directors or a termination of the merger agreement by us to enter into an agreement for a “Superior Proposal,” as defined in the merger agreement. As a result, we cannot assure you that the merger will be completed, even if our stockholders approve the merger, or that, if completed, it will be exactly on the terms set forth in the merger agreement or within the expected time frame.
If the merger is not completed within the expected time frame or at all, we may be subject to a number of material risks. The price of our common stock may decline to the extent that current market prices reflect a market assumption that the merger will be completed. We could be required to reimburse certain expenses of Aerial Topco, L.P., or Parent, of up to $7.5 million or pay Parent a termination fee of up to $120 million if the merger agreement is terminated under specific circumstances described in the merger agreement. The failure to complete the merger may result in negative publicity and negatively affect our relationship with our stockholders, employees and clients. We may also be required to devote significant time and resources to litigation related to any failure to complete the merger or related to any enforcement proceeding commenced against us to perform our obligations under the merger agreement.
The merger agreement provides us with limited remedies in the event of a breach by Parent that results in termination of the merger agreement, including the right to a reverse termination fee payable under certain specified circumstances. We cannot assure you that a remedy will be available to us in the event of such a breach or that the damages we incur in connection with such breach will not exceed the amount of the reverse termination fee. In addition, Parent requires significant third-party debt financing to complete the merger and in the event that the Parent’s lenders do not provide such debt financing, we may only be entitled to receive the reverse termination fee as provided under the merger agreement.
The announcement and pendency of the merger could adversely affect our business, financial results and/or operations.
Our efforts to complete the merger could cause substantial disruptions in, and create uncertainty surrounding, our business, which may materially adversely affect our results of operation and our business. Uncertainty as to whether the merger will be completed may affect our ability to recruit prospective employees or to retain and motivate existing employees. Employee retention may be particularly challenging while the merger is pending because employees may experience uncertainty about their roles following the merger. A substantial amount of our management’s and employees’ attention is being directed toward the completion of the merger and thus is being diverted from our day-to-day operations. Uncertainty as to our future could adversely affect our business and our relationship with clients and potential clients. For example, clients and other counterparties may defer decisions concerning working with us, or seek to change existing business relationships with us. Changes to or termination of existing business relationships could adversely affect our revenue, earnings and financial condition, as well as the market price of our common stock. The adverse effects of the pendency of the merger could be exacerbated by any delays in completion of the merger or termination of the merger agreement.
While the merger agreement is in effect, we are subject to restrictions on our business activities.
While the merger agreement is in effect, we are subject to restrictions on our business activities, including, among other things, restrictions on our ability to acquire other businesses and assets, dispose of our assets, make investments, enter into certain contracts, repurchase or issue securities, pay dividends, make capital expenditures, take certain actions relating to
13
intellectual property, amend our organizational documents and incur indebtedness. These restrictions could prevent us from pursuing strategic business opportunities, taking actions with respect to our business that we may consider advantageous and responding effectively and/or timely to competitive pressures and industry developments, and may as a result materially adversely affect our business, results of operations and financial condition.
In certain instances, the merger agreement requires us to pay a termination fee to Parent, which could affect the decisions of a third party considering making an alternative acquisition proposal.
Under the terms of the merger agreement, we may be required to pay Parent a termination fee of up to $120 million if the merger agreement is terminated under specific circumstances. In particular, we may be obligated to pay Parent a termination fee of $120 million if Parent terminates the merger agreement following an adverse recommendation change by our Board of Directors relating to certain intervening events regarding the NPAC contracts described in the merger agreement, or a termination fee of $60 million in the event that we were to terminate the merger agreement to enter into an agreement for a “Superior Proposal,” as defined in the merger agreement. This payment could affect the structure, pricing and terms proposed by a third party seeking to acquire or merge with us and could discourage a third party from making a competing acquisition proposal, including a proposal that would be more favorable to our stockholders than the merger.
We have incurred, and will continue to incur, direct and indirect costs as a result of the merger.
We have incurred, and will continue to incur, significant costs and expenses, including fees for professional services and other transaction costs, in connection with the merger. We must pay substantially all of these costs and expenses whether or not the merger is completed. There are a number of factors beyond our control that could affect the total amount or the timing of these costs and expenses.
Legal proceedings in connection with the merger, the outcomes of which are uncertain, could delay or prevent the completion of the merger.
Since the announcement of the merger agreement on December 14, 2016, two putative class actions have been filed in the United States District Court for the District of Delaware in connection with the proposed merger. One lawsuit was filed against us and the members of our Board of Directors and alleges that the proxy statement seeking stockholder adoption of the merger agreement is materially misleading. The other lawsuit was filed against us, the members of our Board of Directors, and other parties to the merger agreement and alleges that the merger consideration is inadequate and the proxy statement is materially misleading. Among other remedies, the plaintiffs in both lawsuits seek to enjoin the merger. These legal proceedings could delay or prevent the merger from becoming effective.
Risks related to our business
The loss of, or damage to, a data center or any other failure or interruption to our system architecture and / or network infrastructure could materially harm our revenue and impair our ability to conduct our operations.
Because most of the services we provide require our clients to query a copy of our continuously updated databases and directories to obtain necessary routing, operational and marketing data, the integrity of our data centers, including network elements managed by third parties throughout the world, and the systems through which we deliver our services are essential to our business. Notably, certain of our data centers and related systems are essential to the orderly operation of the U.S. telecommunications system because they enable carriers to ensure that telephone calls are routed to the appropriate destinations.
Our system architecture is integral to our ability to process a high volume of transactions in a timely and effective manner. Moreover, both we and our clients rely on hardware, software and other computer technology and equipment developed, supported and maintained by third-party providers. We could experience failures or interruptions of our systems and services, or other problems in connection with our operations, as a result of, for example:
• | damage to, or failure of, our computer software or hardware or our connections to, and outsourced service arrangements with, third parties; |
• | failure of, or defects in, the third-party systems, software or equipment on which we or our clients rely to access our data centers and other systems; |
• | errors in the processing of data by our systems; |
• | computer viruses, malware or software defects; |
14
• | physical or electronic break-ins, sabotage, distributed denial of service, or DDoS, penetration attacks, intentional acts of vandalism and similar events; |
• | increased capacity demands or changes in systems requirements of our clients; |
• | virtual hijacking of traffic destined to our systems; and |
• | power loss, communications failures, pandemics, wars, acts of terrorism, political unrest or other man-made or natural disasters. |
We may not have sufficient redundant systems or back-up facilities to allow us to receive and process data if one or more of the foregoing events occurs. Further, increases in the scope of services that we provide increase the complexity of our network infrastructure. As the scope of services we provide expands or changes in the future, we may be required to make significant expenditures to establish new data centers and acquire additional network capacity from which we may provide services. Moreover, as we add clients, expand our service offerings and increase our visibility in the market we may become a more likely target of attacks similar to those listed in the bullets above. The number of electronic attacks and viruses grows significantly every year, as does the sophistication of these attacks. For example, undetected attackers may be able to monitor unencrypted Internet traffic anywhere in the world and modify it before it reaches our destination, and these attackers may harm our clients by stealing personal or proprietary information, Internet email or IP addresses. If we are not able to react to threats quickly and effectively and stop attackers from exploiting vulnerabilities or circumventing our security measures, the integrity of our systems and networks, and those of our clients and trading partners, may be adversely affected. If we cannot adequately secure and protect the ability of our data centers, offices, networks and related systems to perform consistently at a high level and without interruptions, or if we otherwise fail to meet our clients’ expectations:
• | our reputation may be damaged, which may adversely affect our ability to market our services and attract or retain clients; |
• | we may be subject to significant penalties or damages claims, under our contracts or otherwise, including the requirement to pay substantial penalties related to service level requirements in our contracts; |
• | we may be required to make significant expenditures to repair or replace equipment, third-party systems or an entire data center, to establish new data centers and systems from which we may provide services or to take other required corrective action; or |
• | one or more of our significant contracts may be terminated early, or may not be renewed. |
Any of these consequences would adversely affect our revenue, performance and business prospects.
When our seven contracts with North American Portability Management LLC are terminated, the timing of which is uncertain, our revenue and profitability will be materially adversely affected.
We cannot be certain when our contracts to provide local number portability services will be terminated. On July 1, 2016, we received a notice of non-renewal from the NAPM informing us of its election not to renew the master agreements that were due to expire on September 30, 2016. On September 29, 2016, the NAPM provided notice to extend the term of these master contracts and opted not to license the source code that we use to provide services to the NAPM. In order to continue to receive the pricing terms under the current contracts, the NAPM must provide us with at least one termination notice during the current term, which must establish a termination date that is 180 days after the date of notice. We cannot be certain how long we will provide LNPA services; however, we will continue to provide services to the NAPM for as long as it requires. On April 20, 2016, the NAPM Transition Oversight Manager, or TOM, published a preliminary overall transition timeline that showed the transition period extending through the third quarter of 2017. Further, during its webinar on June 21, 2016, the TOM stated that the preliminary transition timeline would likely be revised to account for delays in the transition process. On July 25, 2016 the FCC issued an Order approving the proposed contract between the NAPM and a competitor. On August 31, 2016, the TOM published a revised transition timeline that showed the transition period extending until May 25, 2018.
Once the contracts terminate, our annual revenue will decrease by approximately $500 million. As a result of the uncertain contract end date and due to our cost structure, which is organized by function, the impact of the termination of the contracts on our income from operations is not currently quantifiable. At the time of termination, our revenue and profitability will depend on the success of our remaining business. If we are not able to replace this lost revenue and adjust our operating plans to support our remaining business, our total revenue and profitability may be materially adversely affected.
15
We are exposed to risks related to cybersecurity and protection of confidential information.
Our operations rely on the secure processing, storage and transmission of confidential, sensitive, proprietary and other types of information relating to our products and services and confidential and sensitive information about our clients and others. We expend significant resources on security measures to protect our data and infrastructure against security breaches and cyber attacks and use a complex system of internal processes and software controls along with policies, procedures and training to protect the confidentiality of client data and sensitive information. The cyber risks we face range from cyber attacks common to most industries, to more advanced threats that target us due to our sales of security-related solutions. Breaches of our technology and systems or those of our third party service providers and vendors, whether from circumvention of security systems, denial of service attacks or other cyber-attacks, hacking, computer viruses or malware, technical malfunction, employee error, malfeasance, physical breaches, system disruptions or other actions could cause material interruptions or malfunctions of our products and services or those of third party service providers and may compromise the confidentiality and integrity of confidential or sensitive information regarding our business or clients. Any material incidents or even a perceived breach of our security measures could cause us to experience reputational harm, loss of clients, regulatory actions, sanctions or other statutory penalties, litigation, liability for failure to safeguard our clients’ information or financial losses that are either not insured against or not fully covered through any insurance we maintain. As a global company, we could also be impacted by existing and proposed U.S. and foreign laws and regulations, as well as government policies and practices related to cybersecurity, privacy and data protection. Any of the foregoing could materially impact our business, operating results or financial condition.
A significant decline in the volume of transactions we handle could have a material adverse effect on our results of operations.
Under our contracts with the NAPM, we earn revenue for NPAC Services on an annual, fixed-fee basis. However, in the event that the volume of transactions in a given year is above or below the contractually established volume range for that year, the fixed-fee may be adjusted up or down, respectively, with any such adjustment being applied to the following year’s invoices. In addition, under our contract with the Canadian LNP Consortium Inc., we earn revenue on a per transaction basis. As a result, if industry participants in the United States reduce their usage of our services in a particular year to levels below the established volume range for that year or if industry participants in Canada reduce their usage of our services from their current levels, our revenue and results of operations may suffer. For example, consolidation in the industry could result in a decline in transactions if the remaining carriers decide to handle changes to their networks internally rather than use the services that we provide. Moreover, if customer turnover among carriers in the industry stabilizes or declines, or if carriers do not compete vigorously to lure customers away from their competitors, use of our telephone number portability and other services may decline. If carriers develop internal systems to address their infrastructure needs, or if the cost of such transactions makes it impractical for a given carrier to use our services for these purposes, we may experience a reduction in transaction volumes. Carriers might be able to charge consumers directly for our services, which could also have an adverse impact on transaction volumes. Finally, the trends that we believe will drive the future demand for our services, such as the emergence of IP services, growth of wireless services, consolidation in the industry, and pressure on carriers to reduce costs, may not actually result in increased demand for our existing services or for the ancillary directory services that we expect to offer, which would harm our future revenue and growth prospects.
Certain of our client contracts may be terminated or modified at any time prior to their completion, which could lead to an unexpected loss of revenue, adversely affect our operating performance and damage our reputation.
In addition to our contracts with the NAPM, we provide other revenue-generating services to clients in the communications sector and a wide variety of other sectors, trade associations, and government agencies. For example, we serve as the provider of NPAC Services in Canada; as operator of the .biz registry under contract with ICANN; as operator of the .co registry under a contract with the government of Colombia; as the operator of the .au registry; and as the provider of information services to a wide variety of major corporations, major retailers and marketers. Each of these contracts provides for early termination in limited circumstances, most notably if we are in default. In addition, our contracts to serve as the North American Numbering Plan Administrator and as the National Pooling Administrator, each of which is with the U.S. government, may be terminated by the government at will.
If we fail to meet the expectations of the FCC, the U.S. Department of Commerce or any of our other clients that has the right to unilaterally terminate their contracts with us for any reason, including for performance-related or other reasons, the clients may unilaterally terminate the contracts or require us to modify the contracts in ways unfavorable to us, either of which could lead to an unexpected loss of revenue and adversely affect our operating performance. The loss or significant modification of a major contract also could cause us to suffer a loss of reputation that would make it more difficult for us to compete for contracts to provide similar services in the future. Further, a termination arising out of our default under a contract could expose us to liability for breach of contract.
16
Failure to comply with neutrality requirements could result in loss of significant contracts.
Pursuant to orders and regulations of the U.S. government and provisions contained in our contracts with the NAPM, we must comply with certain ongoing neutrality requirements, meaning generally that we cannot favor any particular telecommunications service provider, interconnected VoIP provider, telecommunications industry segment, technology, or group of telecommunications consumers over any other telecommunications or VoIP service provider, industry segment, technology, or group of consumers in the conduct of our business. The FCC oversees our compliance with the neutrality requirements applicable to us in connection with some of the services we provide. We provide to the FCC and the NANC, a federal advisory committee established by the FCC to advise and make recommendations on telephone numbering issues, regular certifications relating to our compliance with these requirements. Our ability to comply with the neutrality requirements to which we are subject may be affected by the activities of our stockholders or lenders. For example, if the ownership of our capital stock subjects us to undue influence by parties with a vested interest in the outcome of numbering administration, the FCC could determine that we are not in compliance with our neutrality obligations. Our failure to continue to comply with the neutrality requirements to which we are subject under applicable orders and regulations of the U.S. government and commercial contracts may result in fines, corrective measures, termination of our contracts, or exclusion from bidding on future contracts, any one of which could have a material adverse effect on our results of operations.
Regulatory and statutory changes that affect us or the communications industry in general may increase our costs or otherwise adversely affect our business.
Certain of our domestic operations and many of our clients’ operations are subject to regulation by the FCC and other federal, state and local agencies. As communications technologies and the communications industry continue to evolve, the statutes governing the communications industry or the regulatory policies of the FCC may change. If such statutory or regulatory changes were to occur, the demand for many of our services could change in ways that we cannot predict and our revenue could decline, or our costs could increase due to such changes. These risks include the ability of the federal government, most notably the FCC, the Department of Commerce and the Federal Trade Commission, to:
• | increase or change regulatory oversight over services we provide; |
• | prohibit us from entering into new contracts or extending existing contracts to provide services to the communications industry based on actual or suspected violations of our neutrality requirements, business performance concerns, or other reasons; |
• | adopt or modify statutes, regulations, policies, procedures or programs in a way that could cause changes to our operations or costs or the operations of our clients (e.g., regulatory changes to support IP Transition); |
• | appoint, or cause others to appoint, substitute or add additional parties to perform the services that we currently provide; and |
• | prohibit or restrict the provision or export of new or expanded services under our contracts, or prevent the introduction of other services not under the contracts based upon restrictions within the contracts or in FCC policies. |
In addition, we are subject to risks arising out of the delegation of the Department of Commerce’s responsibilities for the domain name system to ICANN. Changes in the regulations or statutes to which our clients are subject could cause our clients to alter or decrease the services they purchase from us. We cannot predict when, or upon what terms and conditions, further regulation, deregulation or litigation designed to delay or prevent the introduction of new top-level domains might occur or the effect future regulation or deregulation may have on our business.
Further, the current regulatory environment for Internet communications, products and services generally is uncertain and various laws and governmental regulations, both in the U.S. and abroad, governing Internet related services, related communications services and information technologies remain largely unsettled. It may take several years to determine whether and how existing and future laws, such as those governing intellectual property, privacy, libel, telecommunications services and taxation, apply to the Internet and to related products and services such as ours, and substantial resources may be required to comply with regulations or bring any non-compliant business practices into compliance with such regulations. For example, on October 27, 2016, the FCC adopted new rules governing the use and disclosure of Customer Proprietary Network Information in the context of broadband Internet access services, as well as associated customer privacy and data security rules. These rules may make it more expensive and/or more difficult for broadband providers to collect and use customer data, which may, in turn, make it more expensive and/or difficult for us to acquire such data from broadband providers for use in our information services. Our failure or the failure of our clients and others with whom we transact business to comply with existing or future regulatory or other legal requirements could materially adversely affect our business, financial condition and results of operations.
17
If we are unable to protect our intellectual property rights adequately, the value of our services and solutions could be diminished.
Our success is dependent in part on obtaining, maintaining and enforcing our proprietary rights and our ability to avoid infringing on the proprietary rights of others. While we take precautionary steps to protect our technological advantages and intellectual property and rely in part on patent, trademark, trade secret and copyright laws, the precautionary steps we have taken may not completely protect our intellectual property rights. Effectively policing our intellectual property is time consuming and costly, and the steps taken by us may not prevent infringement of our intellectual property or proprietary rights in our products, technology and trademarks, particularly in foreign countries where in many instances the local laws or legal systems do not offer the same level of protection as in the United States. Further, because patent applications in the United States are maintained in secrecy until either the patent application is published or a patent is issued, we may not be aware of third-party patents, patent applications and other intellectual property relevant to our services and solutions that may block our use of our intellectual property or may be used by third parties who compete with our services and solutions. As we expand our business and introduce new services and solutions, there may be an increased risk of infringement and other intellectual property claims by third-parties. From time to time, we and our clients may receive claims alleging infringement of intellectual property rights, or may become aware of certain third-party patents that may relate to our services and solutions. Additionally, we monitor our use of open source software to avoid uses that would require us to disclose our proprietary source code or violate applicable open source licenses, but if we engaged in such uses inadvertently, we could be required to take remedial action or release certain of our proprietary source code. These scenarios could have a material adverse effect on our business, financial condition and operating results.
Additionally, some of our client agreements require that we indemnify our clients for infringement claims resulting from their use of our intellectual property embedded in their products. Any litigation regarding patents or other intellectual property could be costly and time consuming and could divert our management and key personnel from our business operations. The complexity of the technology involved, and the number of parties holding intellectual property within the communications industry, increase the risks associated with intellectual property litigation. Moreover, the commercial success of our services and solutions may increase the risk that an infringement claim may be made against us. Royalty or licensing arrangements, if required, may not be available on terms acceptable to us, if at all. Any infringement claim successfully asserted against us or against a client for which we have an obligation to defend could result in costly litigation, the payment of substantial damages, and an injunction that prohibits us from continuing to offer the service or solution in question, any of which could have a material adverse effect on our business, financial condition and operating results.
The markets for our services are competitive, and if we do not adapt our organization and services to meet rapid technological and market change, we could lose clients or market share.
Our future growth is largely dependent upon our ability to continue to adapt our products, services, and organization to meet the demands of rapidly evolving markets and industry standards. We compete against well-funded providers of data registry, information services, as well as communications software companies and system integrators. In addition, our industry is characterized by rapid technological change, evolving industry standards, and frequent new service offerings. Significant technological changes could make our technology and services obsolete.
Accordingly, our future success depends on our ability to: (i) adapt our products, services, organization, workforce, and sales strategies to fit the rapidly changing needs of current and future clients; (ii) identify emerging technological and other trends in our target markets; and (iii) develop or acquire and bring to market competitive products and services quickly and cost-effectively by continually improving the features, functionality, reliability and responsiveness of our services, and by developing new features, services and applications to meet changing client needs. Our ability to take advantage of opportunities in the market may require us to invest considerable resources adapting our organization and capabilities to support development of products and systems that can support new services or be integrated with new technologies and incur other expenses well in advance of our ability to generate revenue from these services. These development efforts may divert resources from other potential investments in our businesses, management time and attention from other matters, and may not lead to the development of new products or services on a timely basis.
We cannot guarantee that we will be able to adapt to these challenges or respond successfully or in a cost-effective way, particularly in the early stages of launching a new service. Further, we may experience delays in the development of one or more features of our solutions, which could materially reduce the potential benefits to us for providing these services. Potential clients may not adopt our solutions and we may not be able to reach acceptable contract terms with clients to provide these services.
As a result, the failure to effectively adapt our organization, products and services to the needs of our markets or the failure of our offerings to gain market acceptance, could significantly reduce our revenues, increase our operating costs or
18
otherwise materially and adversely affect our business, financial condition, results of operations and cash flows. Our failure to adapt to meet market demand in a cost-effective manner could adversely affect our ability to compete and retain clients or market share.
If we are not able to obtain the data required to provide our information services, or we obtain inaccurate data, our operating results could be adversely affected.
Much of the data that we use in connection with our information services is purchased or licensed from third parties, obtained from public record sources or provided to us as part of a broader business relationship with a client. Our contracts with third party data providers contain service level requirements, but do not guarantee, nor can we ensure, that the data provided under such contracts will be accurate. If we are not able to obtain this data on favorable economic terms or otherwise, or link to this data, or if the data we obtain is inaccurate, our ability to provide information services to our clients could be materially adversely impacted, which could result in decreased revenue, net income and earnings per share.
Regulatory and statutory requirements, changes in requirements regarding privacy and data protection or public perceptions of data usage may increase our costs or otherwise adversely affect our business.
Our business operations are subject to a variety of complex privacy and data protection laws and regulations in the United States at both the state and federal levels, and in other jurisdictions. These statutory and regulatory requirements are evolving, increasing in complexity and number, and may change significantly. How companies collect, process, use, store, share or transmit personal data is subject to increasing scrutiny by governments as well as the public, which could influence the adoption of legislation or regulation. Certain collection and use of personal data may engender distrust of businesses based on such activities, which may lead to additional governmental restrictions on and reduced demand for our information services. New statutory or regulatory developments could restrict how we collect, manage, aggregate and use information. There may be conflicts among the privacy and data protections laws adopted by the various countries in which we operate. Judicial and regulatory application and interpretation of these statutory and regulatory requirements are often uncertain and could be interpreted in ways that could restrict our use of data to provide information services to our clients or otherwise harm our business. We may need to incur significant costs or modify our business practices and/or our services in order to comply with existing or revised laws and regulations, or to adapt to changing public attitudes about data usage. For example, we previously relied on a common European Union - United States “safe harbor” framework for the transfer of certain personal information from the European Union to the United States. In October 2015, the European Court of Justice ruled that the safe harbor framework was invalid. As a result, regulators in individual European Union member states will retain control over data privacy requirements and we may be subject to additional obligations that could require us to change our business practices and/or incur additional costs. In addition, on October 27, 2016, the FCC adopted new rules to govern the use and disclosure of Customer Proprietary Network Information in the context of broadband Internet access services, as well as associated customer privacy and data security rules. These rules may make it more expensive and/or more difficult for broadband providers to collect and use customer data, which may, in turn, make it more expensive and/or difficult for us to acquire such data from broadband providers for use in our information services. Any restrictions on our ability to provide services to clients or costs to modify our business practices and/or services could have a material adverse effect on our results of operations or prospects. If we are not able to comply with applicable laws, we may be subject to significant monetary penalties, orders demanding that we cease alleged noncompliant activities, fines and/or criminal prosecution in one or more jurisdictions. These or other remedies could have a material adverse effect on our results of operation or financial condition. Our failure or alleged failure to comply with privacy and data protection laws, or with public attitudes about data usage, including any perception of our practices as an invasion of privacy, could harm our reputation, result in legal actions against us by governmental authorities or private claimants or cause us to lose clients, any of which could have a material adverse effect on our results of operations or prospects.
If we are unable to manage our costs and maintain our quality of service, our profits could be adversely affected.
Historically, sustaining our growth has placed significant demands on our management as well as on our administrative, operational and financial resources. For us to continue to manage our expanded operations, as well as any future growth, we must continue to improve our operational, financial and management information systems and expand, motivate and manage our workforce. If our quality of service is compromised because we are unable to successfully manage our costs, or if new systems that we implement in connection with any future restructuring to assist in managing our operations do not produce the expected benefits, we may experience higher turnover in our client base and our revenue and profits could be adversely affected.
Changes in our tax rates or exposure to additional income tax liabilities could affect our profitability. In addition, audits by tax authorities could result in additional tax payments for prior periods.
We are subject to income taxes in the U.S. and in various non-U.S. jurisdictions. Our effective tax rate can be affected by changes in our mix of earnings in countries with differing statutory tax rates (including as a result of business acquisitions and
19
dispositions), changes in the valuation of deferred tax assets and liabilities, establishment of accruals related to contingent tax liabilities and period-to-period changes in such accruals, the expiration of statutes of limitations, the implementation of tax planning strategies and changes in tax laws. The impact of these factors may be substantially different from period to period. Due to the ambiguity of tax laws and the subjectivity of factual interpretations, our estimates of income tax liabilities may differ from actual payments or assessments. In addition, our income tax returns are subject to ongoing audits by U.S. federal, state and local tax authorities and by non-U.S. tax authorities. If these audits result in payments or assessments different from our reserves, our future results may include unfavorable adjustments to our tax liabilities, which may negatively affect our results of operations. Moreover, indemnification rights that we may have in respect of tax liabilities may be insufficient or unavailable to protect us against such liabilities.
Our operating results and margins could fluctuate due to factors relating to stock-based compensation.
Similar to many other companies, we use stock awards as a form of compensation for certain employees and non-employee directors. We must recognize the fair value of all stock-based awards, including grants of employee stock options, in our financial statements. The valuation model we use to estimate the fair value of our stock-based awards requires us to make several estimates and assumptions, such as the expected holding period of the awards and expected price volatility of our common stock. The amount we recognize for stock-based compensation expense could vary materially depending on changes in these estimates and assumptions. Other factors that could impact the amount of stock-based compensation expense we recognize include changes in the mix and type of stock-based awards we grant, changes in our compensation plans or tax rate, changes in the award forfeiture rate and differences in our company’s actual operating results compared to management’s estimates for performance-based awards.
Changes in accounting principles and guidance, or their interpretation, could result in unfavorable accounting charges or effects, including changes to previously filed financial statements.
We prepare our consolidated financial statements in accordance with U.S. generally accepted accounting principles, or U.S. GAAP. These principles are subject to interpretation by the SEC and various bodies formed to interpret and create appropriate accounting principles and guidance. A change in these principles or guidance, or in their interpretations, may have a significant effect on our reported results and may retroactively affect previously reported results.
We must recruit and retain skilled employees to succeed in our business, and our failure to recruit and retain qualified employees could harm our ability to maintain and grow our business.
We believe that our success depends upon the continued contributions of our management team and other key employees, including our engineering, product, sales and marketing and operations personnel. Our success is also contingent upon our continuing ability to recruit, hire, develop, motivate and retain highly skilled employees for all areas of our organization. Any of the following factors may affect our ability to motivate and retain our existing employees and recruit new employees:
• | competition for employees with the skills we require to operate and grow our business is intense, and, as a result, our competitors may seek to hire our key employees; |
• | despite our comprehensive compensation packages, we may not be successful in attracting new employees and retaining and motivating our existing employees; and |
• | any adverse change in reputation, whether as a result of an unfavorable outcome of our petition for review of the FCC Order, decrease in revenue due to the termination of our contracts with the NAPM, or a decline in the market price of our common stock. |
Our ability to maintain and grow our business and to compete effectively could be impaired if we are unable to retain and motivate our existing employees and recruit new employees. If we are unable to retain existing employees, we may incur additional costs to recruit and train new employees, which may decrease our profits.
Our failure to achieve or sustain market acceptance of our services at desired pricing levels could impact our ability to maintain profitability or positive cash flow.
Our competitors and clients may cause us to reduce the prices we charge for our services and solutions. The primary sources of pricing pressure include:
• | competitors offering our clients services at reduced prices, or bundling and pricing services in a manner that makes it difficult for us to compete; |
• | clients with a significant volume of transactions may have enhanced leverage in pricing negotiations with us; and |
20
• | potential clients may find it economically advantageous to handle certain functions internally instead of using our services. |
We may not be able to offset the effects of any price reductions by increasing the number of transactions we handle or the number of clients we serve, by generating higher revenue from enhanced services or by reducing our costs.
Our expansion into international markets may be subject to uncertainties that could increase our costs to comply with regulatory requirements in foreign jurisdictions, disrupt our operations, and require increased focus from our management.
We currently provide services to clients located in various international locations and, with our acquisitions in 2015 of Bombora Technologies Pty Ltd. and MarketShare Partners, LLC, we intend to pursue additional international business opportunities, either in transactions permitted under the merger agreement or otherwise, if the merger is not consummated. International operations and business expansion plans are subject to numerous additional risks, including:
• | economic and political risks in foreign jurisdictions in which we operate or seek to operate; |
• | difficulties in enforcing contracts and collecting receivables through foreign legal systems; |
• | differences in foreign laws and regulations, including foreign tax, intellectual property, privacy, labor and contract law, as well as unexpected changes in legal and regulatory requirements; |
• | differing technology standards and pace of adoption; |
• | export restrictions on encryption and other technologies; |
• | fluctuations in currency exchange rates and any imposition of currency exchange controls; |
• | increased competition by local, regional, or global companies; |
• | difficulties in maintaining positive relationships with foreign governments and government officials; and |
• | difficulties associated with managing a large organization spread throughout various countries. |
If we continue to expand our business globally, our success will depend, in large part, on our ability to anticipate and effectively manage these and other risks associated with our international operations. However, any of these factors could adversely affect our international operations and, consequently, our operating results.
If we are not successful in growing our information services at the rate that we anticipate, our operating results could be negatively impacted.
Our ability to successfully grow our information services depends on a number of different factors, including market acceptance of our information services, the expansion of our information services capabilities and geographic coverage, and continued public and regulatory acceptance of data usage for the provision of our information services solutions, among others. If we are not successful in growing our information services business at the rate that we anticipate, we may not meet expected growth and gross margin projections or expectations, and our operating results, prospects and the market price of our securities could be adversely affected.
We may be unable to complete acquisitions, or we may undertake acquisitions that increase our costs or liabilities or are disruptive to our business.
We have made a number of acquisitions in the past, and will continue to pursue acquisitions selectively in the future either in transactions permitted under the merger agreement or otherwise, if the merger is not consummated. We may not be able to locate acquisition candidates at prices that we consider appropriate or on terms that are satisfactory to us. If we do identify an appropriate acquisition candidate, we may not be able to successfully negotiate the terms of the acquisition or, if the acquisition occurs, integrate the acquired business into our existing business. Acquisitions of businesses or other material operations may require additional debt or equity financing, resulting in additional leverage or dilution to our stockholders.
We may not be able to successfully integrate the operations of businesses that we acquired or realize the anticipated benefits of the acquisitions, which could have a material adverse effect on our business and results of operations.
Integration of acquired business operations, including our acquisition in 2015 of MarketShare Partners, LLC, is a time consuming process that could disrupt our business by diverting significant management attention and resources away from day-to-day operations. The difficulties of integration may be increased by the necessity of coordinating geographically dispersed
21
organizations, integrating personnel with disparate business backgrounds and combining different corporate cultures. It is also possible that the integration process could result in the loss of key employees, the disruption of each company’s ongoing businesses or inconsistencies in standards, controls, procedures and policies that adversely affect our ability to maintain relationships with clients, suppliers, distributors, creditors, or lessors, or to achieve the anticipated benefits of the acquisition. Further, if we cannot successfully integrate an acquired company’s internal control over financial reporting, the reliability of our financial statements may be impaired and we may not be able to meet our reporting obligations under applicable law. Any such impairment or failure could cause investor confidence and, in turn, the market price of our common stock, to be materially adversely affected.
Even if we are able to integrate acquired businesses successfully, we may not realize the full benefits of the cost efficiencies or synergies or other benefits that we anticipated when selecting our acquisition candidates or that these benefits will be achieved within a reasonable period of time. In addition, businesses we acquire may not be able to retain their existing business relationships, customers and/or key employees. We may be required to invest significant capital and resources after the acquisition to maintain or grow the businesses that we acquire. In addition, we may need to record write-downs from impairments of goodwill, intangible assets, or long-lived assets, or record adjustments to the purchase price that occur after the closing of the transaction, which could reduce our future reported earnings. If we fail to successfully integrate and support the operations of the businesses we acquire, or if anticipated revenue enhancements and cost savings are not realized from these acquired businesses, our business, results of operations and financial condition would be materially adversely affected. Further, acquired businesses may have liabilities, neutrality-related risks or adverse operating issues that we fail to discover through due diligence prior to the acquisition. These liabilities could include employment, retirement or severance-related obligations under applicable law, other benefits arrangements, legal claims, warranty or similar liabilities to clients, claims by or amounts owed to vendors, tax liabilities or other amounts owed by the acquired companies. The failure to discover such issues prior to such acquisition, should they be significant, could have a material adverse effect on our business and results of operations.
Failure to maintain effective internal controls over financial reporting could have a material adverse effect on our business, operating results and stock price.
Section 404 of the Sarbanes-Oxley Act of 2002 requires that we include in our annual report a report containing management’s assessment of the effectiveness of our internal controls over financial reporting as of the end of our fiscal year and a statement as to whether or not such internal controls are effective. Compliance with these requirements has resulted in, and is likely to continue to result in, significant costs and the commitment of time and operational resources. Changes in our business, including certain initiatives to transform business processes, to invest in information systems or to transition certain functions to third party resources or providers, will necessitate modifications to our internal control systems, processes and information systems as we optimize our business and operations. We cannot be certain that our current design for internal control over financial reporting, or any additional changes to be made, will be sufficient to enable management to determine that our internal controls are effective for any period, or on an ongoing basis. If we are unable to assert that our internal controls over financial reporting are effective, market perception of our financial condition and the trading price of our stock may be adversely affected, and client perception of our business may suffer.
Risks related to financial market conditions
We may be unable to raise additional capital, if needed, or to raise capital on favorable terms.
The general economic and capital market conditions in the United States and other parts of the world deteriorated significantly in 2008, adversely affecting access to capital and increasing the cost of capital. Although conditions have improved, a large degree of uncertainty remains both domestically and abroad, which continues to adversely impact access to, and the cost of, capital. If funds generated by our operations or available under our credit facilities are insufficient to fund our future activities, including acquisitions, organic business ventures, or capital expenditures, we may need to raise additional funds through public or private equity or debt financing.
Risks related to the notes and our other indebtedness
Our indebtedness could adversely affect our financial condition and prevent us from fulfilling our obligations under the notes.
As of December 31, 2016, borrowings under our credit facilities and Senior Notes were approximately $829.0 million, and we had unused revolving commitments of $97.0 million (after giving effect to borrowings of $85.0 million and $18.0 million of outstanding letters of credit). In addition, our credit facilities allow us to request one or more increases to the available term commitments in an amount such that, after giving effect to such increases, either (a) the aggregate amount of increases does not exceed $400 million or (b) our consolidated secured leverage ratio on a pro forma basis after giving effect to
22
any such increase is below 2.50 to 1.00. As of December 31, 2016, the total amount of such potential incremental increases we could request was approximately $829.8 million.
Subject to the limits contained in the credit agreement that governs our credit facilities, the indenture that governs the Senior Notes, our other debt instruments, and subject to the restrictions under the merger agreement on our ability to incur debt, we may be able to incur substantial additional debt from time to time to finance investments or acquisitions, or for other general corporate purposes. If we do so, the risks related to our level of debt could intensify. Our level of debt could have important consequences to the holders of our securities, including the following:
• | making it more difficult for us to satisfy our obligations with respect to the Senior Notes and our other debt; |
• | limiting our ability to obtain additional financing to fund future acquisitions or other general corporate requirements; |
• | requiring a substantial portion of our cash flows to be dedicated to debt service payments instead of other purposes, thereby reducing the amount of cash flows available for acquisitions and other general corporate purposes; |
• | increasing our vulnerability to general adverse economic and industry conditions; |
• | exposing us to the risk of increased interest rates as certain of our borrowings, including borrowings under our credit facilities are at variable rates of interest; |
• | limiting our flexibility in planning for and reacting to changes in the industry in which we compete; |
• | placing us at a disadvantage compared to other, less leveraged competitors; and |
• | increasing our cost of borrowing. |
In addition, the indenture that governs the Senior Notes and the credit agreement that governs our credit facilities contain restrictive covenants that limit our ability to engage in activities that may be in our long-term best interest. Our failure to comply with those covenants could result in an event of default, which, if not cured or waived, could result in the acceleration of the repayment of all our debt.
We may not be able to generate sufficient cash to service all of our indebtedness, and may be forced to take other actions to satisfy our obligations under our indebtedness, which may not be successful.
Our ability to make scheduled payments on or refinance our debt obligations depends on our financial condition and operating performance, which are subject to prevailing economic and competitive conditions and to certain financial, business, legislative, regulatory and other factors beyond our control, including the uncertainty regarding future extensions of our contracts with the NAPM. We may be unable to maintain a level of cash flows from operating activities sufficient to permit us to pay the principal, premium, if any, and interest on our indebtedness.
If our cash flows and capital resources are insufficient to fund our debt service obligations, we could face substantial liquidity problems and could be forced to reduce or delay investments and capital expenditures or to dispose of material assets or operations, seek additional debt or equity capital or restructure or refinance our indebtedness. We may not be able to effect any such alternative measures, if necessary, on commercially reasonable terms or at all and, even if successful, those alternative actions may not allow us to meet our scheduled debt service obligations. While the merger agreement is in effect, we are restricted from disposing of certain assets. In addition, the credit agreement that governs our credit facilities and the indenture that governs the Senior Notes restrict our ability to dispose of assets and use the proceeds from those dispositions and also restrict our ability to raise debt or equity capital to be used to repay other indebtedness when it becomes due. We may not be able to consummate those dispositions or to obtain proceeds in an amount sufficient to meet any debt service obligations then due.
Our inability to generate sufficient cash flows to satisfy our debt obligations would materially and adversely affect our financial position and results of operations and our ability to satisfy our debt obligations.
If we cannot make scheduled payments on our debt, we will be in default and holders of the Senior Notes could declare all outstanding principal and interest to be due and payable, the lenders under our credit facilities could terminate their commitments to loan money, the lenders could foreclose against the assets securing their borrowings and we could be forced into bankruptcy or liquidation.
23
Our variable rate indebtedness subjects us to interest rate risk, which could cause our debt service obligations to increase significantly.
Borrowings under our credit facilities are at variable rates of interest and expose us to interest rate risk. If interest rates were to increase, our debt service obligations on the variable rate indebtedness would increase even though the amount borrowed remained the same, and our net income and cash flows, including cash available for servicing our indebtedness, will correspondingly decrease. Assuming all loans are fully drawn, each quarter point change in interest rates would result in a change of approximately $1.4 million in annual interest expense on our indebtedness under our credit facilities. In the future, we may enter into interest rate swaps that involve the exchange of floating for fixed rate interest payments in order to reduce interest rate volatility. However, we may not maintain interest rate swaps with respect to all of our variable rate indebtedness, and any swaps we enter into may not fully mitigate our interest rate risk.
A lowering or withdrawal of the ratings assigned to our debt securities by rating agencies may increase our future borrowing costs and reduce our access to capital.
Our debt currently has a non-investment grade rating, and any rating assigned could be lowered or withdrawn entirely by a rating agency if, in that rating agency’s judgment, future circumstances relating to the basis of the rating, such as adverse changes, so warrant. Any downgrade by either Standard & Poor’s or Moody’s could increase the interest rate on our credit facilities, result in higher borrowing costs and decrease earnings. Any future adverse changes to our ratings likely would make it more difficult or more expensive for us to obtain additional debt financing.
Risks Related to Our Common Stock
Our common stock price may be volatile.
The market price of our Class A common stock has fluctuated, and may continue to fluctuate, widely. Fluctuations in the market price of our Class A common stock could be caused by many things, including:
• | our perceived prospects and the prospects of the Telecom, Internet and data analytics industries in general; |
• | differences between our actual financial and operating results and those expected by investors and analysts; |
• | changes in analysts’ recommendations or projections; |
• | uncertainty about the length of the remaining term under our contracts with the NAPM; |
• | an unfavorable outcome, or uncertainty about the outcome, of our legal challenge to the FCC Order approving a new LNPA; |
• | the perceived likelihood of consummating the merger; |
• | changes in general valuations for communications and data analytics companies; |
• | adoption or modification of regulations, policies, procedures or programs applicable to our business; |
• | sales of our Class A common stock by our officers, directors or principal stockholders; |
• | sales of significant amounts of our Class A common stock in the public market, or the perception that such sales may occur; |
• | sales of our Class A common stock due to a required divestiture under the terms of our certificate of incorporation; and |
• | changes in general economic or market conditions and broad market fluctuations. |
Each of these factors, among others, could have a material adverse effect on the market price of our Class A common stock. Recently, the stock market in general has experienced extreme price fluctuations. This volatility has had a substantial effect on the market prices of securities issued by many companies for reasons unrelated to the operating performance of the specific companies. Some companies that have had volatile market prices for their securities have had securities class action suits filed against them. Such a lawsuit was filed against us in July 2014. While this lawsuit was dismissed, if another class action lawsuit were to be filed against us, regardless of the outcome, it could result in substantial costs and a diversion of our management’s attention and resources. This could have a material adverse effect on our business, prospects, financial condition and results of operations.
24
Delaware law and provisions in our certificate of incorporation and bylaws could make a merger, tender offer or proxy contest difficult, and the market price of our Class A common stock may be lower as a result.
We are a Delaware corporation, and the anti-takeover provisions of the Delaware General Corporation Law may discourage, delay or prevent a change in control by prohibiting us from engaging in a business combination with an interested stockholder for a period of three years after the person becomes an interested stockholder, even if a change of control would be beneficial to our existing stockholders. In addition, our certificate of incorporation and bylaws may discourage, delay or prevent a change in our management or control over us that stockholders may consider favorable. Our certificate of incorporation and bylaws:
• | authorize the issuance of “blank check” preferred stock that could be issued by our Board of Directors to thwart a takeover attempt; |
• | prohibit cumulative voting in the election of directors, which would otherwise enable holders of less than a majority of our voting securities to elect some of our directors; |
• | require that directors only be removed from office for cause; |
• | provide that vacancies on the Board of Directors, including newly-created directorships, may be filled only by a majority vote of directors then in office; |
• | disqualify any individual from serving on our board if such individual’s service as a director would cause us to violate our neutrality requirements; |
• | limit who may call special meetings of stockholders; |
• | prohibit stockholder action by written consent, requiring all actions to be taken at a meeting of the stockholders; and |
• | establish advance notice requirements for nominating candidates for election to the Board of Directors or for proposing matters that can be acted upon by stockholders at stockholder meetings. |
In addition, our certificate of incorporation and bylaws used to provide for a classified Board of Directors, which will be phased out beginning with the annual meeting of stockholders in 2017 and will no longer be in effect at the time of our annual meeting of stockholders in 2019.
In order to comply with our neutrality requirements, our certificate of incorporation contains ownership and transfer restrictions relating to telecommunications service providers, VoIP providers and their respective affiliates, which may inhibit potential acquisition bids that our stockholders may consider favorable, and the market price of our Class A common stock may be lower as a result.
In order to comply with neutrality requirements imposed by the FCC in its orders and rules, no entity that qualifies as a “telecommunications service provider,” “VoIP provider” or an affiliate of a telecommunications service provider or VoIP provider, as defined under the Communications Act of 1934 and FCC rules and orders, may beneficially own 5% or more of our capital stock. In general, a telecommunications service provider is an entity that offers telecommunications services to the public at large, and is, therefore, providing telecommunications services on a common carrier basis. In general, a VoIP provider is an entity that provides two-way voice communications over a broadband connection and interconnects with the public switched telephone network.
Moreover, a party will be deemed to be an affiliate of a telecommunications service provider or a VoIP provider if that party controls, is controlled by, or is under common control with, a telecommunications service provider or a VoIP provider, respectively. A party is deemed to control another if that party, directly or indirectly:
• | owns 10% or more of the total outstanding equity of the other party; |
• | has the power to vote 10% or more of the securities having ordinary voting power for the election of the directors or management of the other party; or |
• | has the power to direct or cause the direction of the management and policies of the other party. |
As a result of this regulation, subject to limited exceptions, our certificate of incorporation (a) prohibits any telecommunications service provider, VoIP provider or affiliate of a telecommunications service provider or VoIP provider from beneficially owning, directly or indirectly, 5% or more of our outstanding capital stock and (b) empowers our Board of Directors to determine whether any particular holder of our capital stock is a telecommunications service provider, VoIP
25
provider or an affiliate of a telecommunications service provider or VoIP provider. Among other things, our certificate of incorporation provides that:
• | if one of our stockholders experiences a change in status or other event that results in the stockholder violating this restriction, or if any transfer of our stock occurs that, if effective, would violate the 5% restriction, we may elect to purchase the excess shares (i.e., the shares that cause the violation of the restriction) or require that the excess shares be sold to a third-party whose ownership will not violate the restriction; |
• | pending a required divestiture of these excess shares, the holder whose beneficial ownership violates the 5% restriction may not vote the shares in excess of the 5% threshold; and |
• | if our Board of Directors, or its permitted designee, determines that a transfer, attempted transfer or other event violating this restriction has taken place, we must take whatever action we deem advisable to prevent or refuse to give effect to the transfer, including refusal to register the transfer, disregard of any vote of the shares by the prohibited owner, or the institution of proceedings to enjoin the transfer. |
Any person who acquires, or attempts or intends to acquire, beneficial ownership of our stock that will or may violate this restriction must notify us as provided in our certificate of incorporation. In addition, any person who becomes the beneficial owner of 5% or more of our stock must notify us and certify that such person is not a telecommunications service provider, VoIP provider or an affiliate of a telecommunications service provider or VoIP provider. If a 5% stockholder fails to supply the required certification, we are authorized to treat that stockholder as a prohibited owner - meaning, among other things, that we may elect to require that the excess shares be sold. We may request additional information from our stockholders to ensure compliance with this restriction. Our board will treat any “group,” as that term is defined in Section 13(d)(3) of the Securities Exchange Act of 1934, as a single person for purposes of applying the ownership and transfer restrictions in our certificate of incorporation.
Nothing in our certificate of incorporation restricts our ability to purchase shares of our capital stock. If a purchase by us of shares of our capital stock results in a stockholder’s percentage interest in our outstanding capital stock increasing to over the 5% threshold, such stockholder must deliver the required certification regarding such stockholder’s status as a telecommunications service provider, VoIP provider or affiliate of a telecommunications service provider or VoIP provider. In addition, to the extent that a repurchase by us of shares of our capital stock causes any stockholder to violate the restrictions on ownership and transfer contained in our certificate of incorporation, that stockholder will be subject to all of the provisions applicable to prohibited owners, including required divestiture and loss of voting rights.
These restrictions and requirements may:
• | discourage industry participants that might have otherwise been interested in acquiring us from making a tender offer or proposing some other form of transaction that could involve a premium price for our shares or otherwise be in the best interests of our stockholders; and |
• | discourage investment in us by other investors who are telecommunications service providers or VoIP providers or who may be deemed to be affiliates of a telecommunications service provider or VoIP provider, which may decrease the demand for our Class A common stock and cause the market price of our Class A common stock to be lower. |
ITEM 1B. | UNRESOLVED STAFF COMMENTS |
None.
26
ITEM 2. | PROPERTIES |
Our principal executive offices are located at 21575 Ridgetop Circle, Sterling, Virginia, 20166, and our telephone number at that address is (571) 434-5400. As of December 31, 2016, we leased approximately 665,000 square feet of space, primarily in the United States, and to a lesser extent in Europe, Australia and Colombia, in support of general office and sales operations. We own a 54,000 square foot facility in Englewood, Colorado. As of February 24, 2017, we believe that our facilities have sufficient capacity to meet the current and projected needs of our business. We periodically evaluate the adequacy of existing facilities and the availability of additional facilities, and we believe that additional or alternative space, if needed, will be available as needed in the future on commercially reasonable terms. The following table lists our major locations that are primarily used for administrative, sales, marketing, support and research and development operations:
Leased Property Locations | Approximate Square Footage | |||
Sterling, VA, United States | 192,000 | |||
McLean, VA, United States | 44,000 | |||
California, United States | 268,300 | |||
Kentucky, United States | 36,000 | |||
Illinois, United States | 3,500 | |||
Utah, United States | 8,000 | |||
District of Colombia, United States | 13,000 | |||
New York, United States | 30,000 | |||
Australia | 15,000 | |||
Costa Rica | 13,000 | |||
India | 20,400 | |||
Owned Property Locations | Approximate Square Footage | |||
Colorado, United States | 54,000 | |||
Upon expiration of the property leases, we expect to obtain renewals or to lease alternative space. Lease expiration dates range from 2017 through 2024.
ITEM 3. | LEGAL PROCEEDINGS |
On April 6, 2015, we filed a Petition for Review asking the U.S. Court of Appeals for the District of Columbia Circuit to “hold unlawful, vacate, enjoin, and set aside” the FCC Order issued on March 27, 2015, approving a recommendation by the NANC for a competitor to serve as the next LNPA. Among other things, we believe the FCC Order violates the notice and comment rulemaking requirements of the Administrative Procedure Act, violates the FCC’s rules by selecting an entity that is not impartial or neutral to serve as the next LNPA and is arbitrary, capricious, an abuse of discretion or otherwise contrary to law. On June 19, 2015, the Court of Appeals granted the requests made by third-party petitioners to intervene in the case. On July 21, 2015, the Court of Appeals dismissed the FCC’s motion to hold the case in abeyance pending further FCC action and ruled that the issues raised in the FCC’s motion to dismiss should be addressed in the parties’ briefs on the merits. We filed our initial brief on September 21, 2015, the briefing schedule concluded on December 17, 2015, and oral argument before the Court of Appeals took place on September 13, 2016.
We, along with other parties to the merger agreement and our Board of Directors, have been named as defendants in a class action complaint filed on January 20, 2017, in the United States District Court for the District of Delaware, entitled Parshall v. NeuStar, Inc. et al., Case 1:17-cv-00060-LPS. We and our Board also have been named as defendants in a class action complaint filed on February 1, 2017, in the United States District Court for the District of Delaware, entitled Rubin v. NeuStar, Inc. et al., Case 1:17-cv-00104. The complaints allege violations of the federal securities laws by the defendants in connection with the preliminary proxy statement on Schedule 14A filed by us with the SEC with a filing date of January 7, 2017. The complaints seek, among other things, an injunction preventing the consummation of the merger, rescission of the merger if it is consummated or rescissory damages, and attorneys’ fees and costs. We believe that the respective allegations asserted against us in the lawsuits are without merit and intend to defend against the lawsuits vigorously. Similar cases may also be filed in connection with the proposed merger.
27
ITEM 4. | MINE SAFETY DISCLOSURES |
Not applicable.
28
PART II
ITEM 5. | MARKET FOR REGISTRANT’S COMMON EQUITY, RELATED STOCKHOLDER MATTERS AND ISSUER PURCHASES OF EQUITY SECURITIES |
Market for Our Common Stock
Since June 29, 2005, our Class A common stock has traded on the New York Stock Exchange under the symbol “NSR.” As of February 24, 2017, our Class A common stock was held by 75 stockholders of record. The following table sets forth the per-share range of the high and low sales prices of our Class A common stock as reported on the New York Stock Exchange for the periods indicated:
High | Low | ||
Fiscal year ended December 31, 2015 | |||
First quarter | $28.30 | $20.32 | |
Second quarter | $31.40 | $24.43 | |
Third quarter | $32.66 | $25.35 | |
Fourth quarter | $30.11 | $22.35 | |
Fiscal year ended December 31, 2016 | |||
First quarter | $28.00 | $20.00 | |
Second quarter | $26.19 | $21.92 | |
Third quarter | $27.75 | $22.62 | |
Fourth quarter | $33.50 | $21.10 | |
There is no established public trading market for our Class B common stock. As of February 24, 2017, our Class B common stock was held by 3 stockholders of record.
Dividends
We did not pay any cash dividends on our Class A or Class B common stock in 2015 or 2016 and we do not expect to pay any cash dividends on our common stock for the foreseeable future. Our credit facilities limit our ability to declare or pay dividends to an amount up to $100 million per year. We currently intend to retain any future earnings to finance our operations and growth. We are limited by Delaware law in the amount of dividends we can pay. Any future determination to pay cash dividends will be at the discretion of our Board of Directors and will depend on earnings, financial condition, operating results, capital requirements, any contractual restrictions and other factors that our Board of Directors deems relevant.
Purchases of Equity Securities
The following table is a summary of our repurchases of common stock during each of the three months in the quarter ended December 31, 2016:
Month | Total Number of Shares Purchased (1) | Average Price Paid per Share | |||||
October 1 through October 31, 2016 | 21,652 | $ | 23.05 | ||||
November 1 through November 30, 2016 | 3,229 | 22.50 | |||||
December 1 through December 31, 2016 | 88,039 | 31.03 | |||||
Total | 112,920 | $ | 29.26 | ||||
(1) | The number of shares purchased represents shares of common stock tendered by employees to us to satisfy the employees’ minimum tax withholding obligations arising as a result of vesting of restricted stock grants under our stock incentive plan. We purchased these shares for their fair market value on the vesting date. |
29
Performance Graph
The following chart compares Neustar’s cumulative stockholder return on its common stock over the last five fiscal years compared with $100 invested in the Russell 2000 Index and the NYSE TMT Index, an Index of Technology, Media and Telecommunications companies, each over that same period. The comparison assumes reinvestment of dividends. The stock performance in the graph is included to satisfy our SEC disclosure requirements, and is not intended to forecast or to be indicative of future performance.
This performance graph shall not be deemed to be incorporated by reference into our SEC filings and shall not constitute soliciting material or otherwise be considered filed under the Securities Act of 1933, as amended, or the Securities Exchange Act of 1934, as amended.
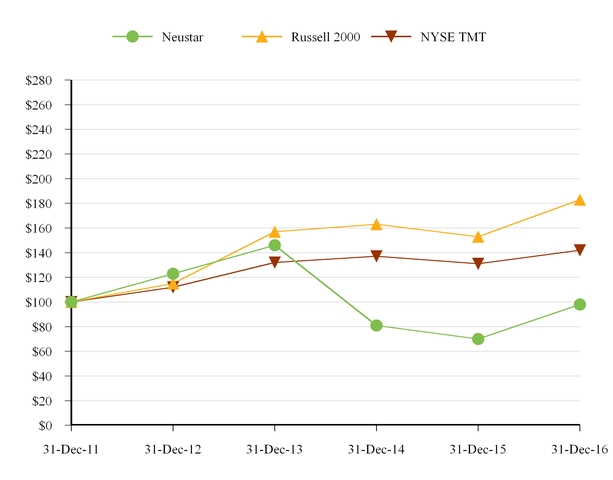
ITEM 6. | SELECTED FINANCIAL DATA |
The tables below present selected consolidated statements of operations data and selected consolidated balance sheet data for each year in the five year period ended December 31, 2016. The selected consolidated statements of operations data for each of the three years ended December 31, 2014, 2015 and 2016, and the selected consolidated balance sheet data as of December 31, 2015 and 2016, have been derived from, and should be read together with, our audited consolidated financial statements and related notes appearing in this report. The selected consolidated statements of operations data for each of the two years ended December 31, 2012 and 2013, and the selected consolidated balance sheet data as of December 31, 2012, 2013 and 2014, have been derived from our audited consolidated financial statements and related notes not included in this report.
30
The following information should be read together with, and is qualified in its entirety by reference to, the more detailed information contained in “Management’s Discussion and Analysis of Financial Condition and Results of Operations” in Item 7 of this report and our consolidated financial statements and related notes in Item 8 of this report.
Year Ended December 31, | ||||||||||||||||||||
2012 | 2013 | 2014 | 2015 | 2016 | ||||||||||||||||
(in thousands, except per share data) | ||||||||||||||||||||
Consolidated Statements of Operations Data: | ||||||||||||||||||||
Revenue | $ | 831,388 | $ | 902,041 | $ | 963,588 | $ | 1,049,958 | $ | 1,209,847 | ||||||||||
Operating expense: | ||||||||||||||||||||
Cost of revenue (excluding depreciation and amortization shown separately below) | 185,965 | 212,572 | 247,115 | 286,236 | 369,104 | |||||||||||||||
Sales and marketing | 163,729 | 178,017 | 198,142 | 206,292 | 215,563 | |||||||||||||||
Research and development | 29,794 | 27,993 | 27,739 | 25,677 | 28,159 | |||||||||||||||
General and administrative | 81,797 | 93,930 | 104,970 | 118,648 | 111,694 | |||||||||||||||
Depreciation and amortization | 92,955 | 100,233 | 117,785 | 122,691 | 164,081 | |||||||||||||||
Restructuring charges | 489 | 2 | 6,521 | 3,858 | 14,712 | |||||||||||||||
Separation costs | — | — | — | — | 14,512 | |||||||||||||||
554,729 | 612,747 | 702,272 | 763,402 | 917,825 | ||||||||||||||||
Income from operations | 276,659 | 289,294 | 261,316 | 286,556 | 292,022 | |||||||||||||||
Other (expense) income: | ||||||||||||||||||||
Interest and other expense | (34,155 | ) | (34,527 | ) | (26,218 | ) | (33,578 | ) | (68,915 | ) | ||||||||||
Interest and other income | 596 | 357 | 445 | 552 | 340 | |||||||||||||||
Income before income taxes | 243,100 | 255,124 | 235,543 | 253,530 | 223,447 | |||||||||||||||
Provision for income taxes | 87,013 | 92,372 | 71,849 | 78,068 | 54,801 | |||||||||||||||
Net income | $ | 156,087 | $ | 162,752 | $ | 163,694 | $ | 175,462 | $ | 168,646 | ||||||||||
Net income per common share: | ||||||||||||||||||||
Basic | $ | 2.34 | $ | 2.52 | $ | 2.84 | $ | 3.21 | $ | 3.10 | ||||||||||
Diluted | $ | 2.30 | $ | 2.46 | $ | 2.75 | $ | 3.14 | $ | 3.04 | ||||||||||
Weighted average common shares outstanding: | ||||||||||||||||||||
Basic | 66,737 | 64,463 | 57,647 | 54,643 | 54,413 | |||||||||||||||
Diluted | 67,956 | 66,108 | 59,535 | 55,904 | 55,516 | |||||||||||||||
31
As of December 31, | ||||||||||||||||||||
2012 | 2013 | 2014 | 2015 | 2016 | ||||||||||||||||
(in thousands) | ||||||||||||||||||||
Consolidated Balance Sheet Data: | ||||||||||||||||||||
Cash, cash equivalents and short-term investments | $ | 343,921 | $ | 223,309 | $ | 326,577 | $ | 89,097 | $ | 45,773 | ||||||||||
Working capital (deficit) | 368,326 | 264,245 | 342,700 | (81,428 | ) | (21,461 | ) | |||||||||||||
Goodwill and intangible assets | 860,665 | 920,102 | 994,891 | 1,716,262 | 1,592,939 | |||||||||||||||
Total assets | 1,509,635 | 1,486,813 | 1,723,290 | 2,202,247 | 2,098,712 | |||||||||||||||
Deferred revenue, excluding current portion | 9,922 | 12,061 | 27,017 | 22,998 | 22,437 | |||||||||||||||
Long-term note payable and capital lease obligations, excluding current portion | 563,348 | 591,900 | 765,359 | 959,340 | 702,946 | |||||||||||||||
Total stockholders’ equity | 646,608 | 589,574 | 619,483 | 723,499 | 921,301 | |||||||||||||||
ITEM 7. | MANAGEMENT’S DISCUSSION AND ANALYSIS OF FINANCIAL CONDITION AND RESULTS OF OPERATIONS |
You should read the following discussion and analysis in conjunction with the information set forth under “Selected Financial Data” in Item 6 of this report and our consolidated financial statements and related notes in Item 8 of this report. The statements in this discussion related to our expectations regarding our future performance, liquidity and capital resources, and other non-historical statements in this discussion, are forward-looking statements. These forward-looking statements are subject to numerous risks and uncertainties, including, but not limited to, the risks and uncertainties described in “Risk Factors” in Item 1A of this report and “Business — Cautionary Note Regarding Forward-Looking Statements” in Item 1 of this report. Our actual results may differ materially from those contained in or implied by any forward-looking statements.
Overview
Merger Agreement
We announced on December 14, 2016 that we entered into a definitive merger agreement to be acquired by a private investment group led by Golden Gate Capital. Under the terms of the merger agreement, our stockholders will be entitled to receive $33.50 per share following the closing of the proposed merger. The merger is expected to close no later than the end of the third quarter of 2017. The merger is subject to approval by our stockholders, regulatory approvals and other customary closing conditions.
Prior to entering into the merger agreement, we announced on June 21, 2016 our intention to separate into two independent and publicly traded companies through a tax-free spin-off. One company would have consisted of the majority of our information services, including Marketing Services, Security Services and related Data Services. The other company would have focused on providing Order Management and Numbering Services, including Local Number Portability Administration, number administration and ancillary numbering services as well as order and inventory management solutions.
2016 Activity
During 2016, we expanded our competitive solutions by integrating the acquisitions from 2015 and entering into new strategic partnerships. Revenue for the year increased 15.2% to $1,209.8 million as compared to $1,050.0 million in 2015. This increase in revenue was driven by a 58.0% increase in Marketing Services revenue to $269.1 million as compared to $170.4 million in 2015, a 21.5% increase in Security Services revenue to $204.1 million as compared to $168.0 million in 2015, a 9.7% increase in Data Services revenue to $224.3 million as compared to $204.5 million in 2015, and a 1.0% increase in NPAC Services revenue to $512.3 million as compared to $507.1 million in 2015.
In addition to our continued growth in revenue, we improved our financial structure through the refinancing of our credit facilities. Specifically, we amended the terms of our 2013 Credit Facility to include a lower interest rate of LIBOR plus 325 basis points, subject to a pricing grid, and a reduced annual amortization of 22% until the end of 2017 and 10% thereafter. We also extended the maturity date by one year to January 22, 2019. This refinancing provides us with a lower cost of debt and greater financial flexibility.
On March 26, 2015, the FCC approved a competitor to serve as the next LNPA and authorized the NAPM to begin contract negotiations with that competitor. On April 6, 2015, we filed a Petition for Review asking the U.S. Court of Appeals
32
for the District of Columbia Circuit to “hold unlawful, vacate, enjoin, and set aside” the FCC’s Order approving the North American Numbering Counsel’s recommendation. On June 19, 2015, the Court of Appeals granted the requests made by third-party petitioners to intervene in the case. On July 21, 2015, the Court of Appeals dismissed the FCC’s motion to hold the case in abeyance pending further FCC action and ruled that the issues raised in the FCC’s motion to dismiss should be addressed in the parties’ briefs on the merits. We filed our initial brief on September 21, 2015, the briefing schedule concluded on December 17, 2015, and oral argument before the Court of Appeals took place on September 13, 2016.
On April 7, 2015, we amended our seven regional contracts with the NAPM. Under this amendment, we will provide LNPA services for an annual fixed fee of $496.1 million until the termination of these contracts. In addition to LNPA services, we are providing certain transition services under this amendment on a cost-plus basis. On July 1, 2016, we received a notice of non-renewal from the NAPM informing us of its election not to renew the master agreements that were due to expire on September 30, 2016. On July 25, 2016 the FCC issued an Order approving the proposed contract between the NAPM and a competitor to serve as the next LNPA. On September 29, 2016, the NAPM provided notice to extend the term of our master contracts with the NAPM and opted not to license the source code that we use to provide services to the NAPM. We will continue to provide services and transition services at the pricing terms under the current contracts until the NAPM provides at least one termination notice to us, which must establish a termination date that is 180 days after the date of notice. We cannot be certain how long we will provide LNPA services; however, we will continue to provide services under the current terms of the NAPM contracts for as long as required by the NAPM. On April 20, 2016, the NAPM Transition Oversight Manager, or TOM, published a transition timeline which extends the transition through the third quarter of 2017. The TOM subsequently issued a revised timeline that extends the transition through May 25, 2018.
Prior to the April 2015 amendment, we provided LNPA services under our contracts with the NAPM for a fixed fee with a 6.5% annual price escalator. These contracts were due to expire on June 30, 2015. The 2015 LNPA service fixed fee under the prior contract terms represents the impact of a 6.5% annual escalator on the 2014 LNPA service fixed fee of $465.8 million, resulting in a 2015 LNPA service fixed fee of $496.1 million. Under the April 7, 2015 amendment, the annual LNPA service fixed fee remains the same at $496.1 million for the duration of the amended term of the contracts.
Loss of the NPAC contracts will have a material adverse impact on our future operating results when compared to our current financial profile. We expect to lose approximately $500 million of annual revenue and this loss will adversely impact our income from operations and operating margin. Additionally, this loss may have a disproportionate material negative impact on our operating margin because of the largely fixed and shared cost structure that is designed to support all of our services. As a result of the uncertain contract end date and due to our cost structure, which is organized by function, we are currently analyzing the impact of the termination of the contracts on our income from operations in an effort to quantify such impacts. Our disclosure will expand as we evaluate the cost structure that will be in place to support our ongoing business or as we learn more about the timing of the contract termination.
Given the facts and circumstances described above, we determined that the structure of our organization is appropriate at this time.
Our Company
We were founded to meet the technical and operational challenges of the communications industry when the U.S. government mandated local number portability in 1996. We provide the authoritative solution that the communications industry relies upon to meet this mandate. Since then, we have grown to offer a broad range of real-time information services, including marketing services, security services, and data services.
Our costs and expenses consist of cost of revenue, sales and marketing, research and development, general and administrative, depreciation and amortization, restructuring charges and separation costs.
Cost of revenue includes all direct materials costs, direct labor costs, and indirect costs related to the generation of revenue such as indirect labor, outsourced services, materials and supplies, payment processing fees, and general facilities costs. Our primary cost of revenue is personnel costs associated with service implementation, product maintenance, client deployment and client care, including salaries, stock-based compensation and other personnel-related expense. In addition, cost of revenue also includes costs relating to our information technology and systems department, including data costs, network costs, data center maintenance, database management, data processing costs and general facilities costs. Cost of revenue also includes costs relating to developing modifications and enhancements of our existing technology and services, as well as royalties paid to third parties and registry gateway services.
Sales and marketing expense consists of personnel costs, such as salaries, sales commissions, travel, stock-based compensation, and other personnel-related expense; costs associated with attending and sponsoring trade shows; facilities costs;
33
professional fees; costs of marketing programs, such as Internet and print marketing programs, as well as costs for product branding, market analysis and forecasting; and client relationship management.
Research and development expense consists primarily of personnel costs, including salaries, stock-based compensation and other personnel-related expense; contractor costs; and the costs of facilities, and computer and support services used in service and technology development.
General and administrative expense consists primarily of personnel costs, including salaries, stock-based compensation, and other personnel-related expense, for our executive, administrative, legal, finance and human resources functions. General and administrative expense also includes facilities, support services and professional services fees.
Depreciation and amortization relates to amortization of identifiable intangibles, impairments of long-lived intangible assets and the depreciation of our property and equipment, including our network infrastructure and facilities related to our services.
Restructuring charges relate to the costs associated with the termination of certain employees and reduction in or closure of leased facilities.
Separation costs relate to our former intention to separate our company into two independent publicly-traded companies. These costs include professional fees for outside advisory services including legal, finance, accounting and related services.
Critical Accounting Policies and Estimates
The discussion and analysis of our financial condition and results of operations are based on our consolidated financial statements, which have been prepared in accordance with U.S. generally accepted accounting principles, or U.S. GAAP. The preparation of these financial statements in accordance with U.S. GAAP requires us to utilize accounting policies and make certain estimates and assumptions that affect the reported amounts of assets and liabilities, the disclosure of contingencies as of the date of the financial statements and the reported amounts of revenue and expense during a fiscal period. The U.S. Securities and Exchange Commission, or SEC, considers an accounting policy to be critical if it is important to a company’s financial condition and results of operations, and if it requires significant judgment and estimates on the part of management in its application. We have discussed the selection and development of the critical accounting policies with the audit committee of our Board of Directors, and the audit committee has reviewed our related disclosures in this report.
Although we believe that our judgments and estimates are appropriate and reasonable, actual results may differ from those estimates. In addition, while we have used our best estimates based on the facts and circumstances available to us at the time, we reasonably could have used different estimates in the current period. Changes in the accounting estimates we use are reasonably likely to occur from period to period, which may have a material impact on the presentation of our financial condition and results of operations. If actual results or events differ materially from those contemplated by us in making these estimates, our reported financial condition and results of operations could be materially affected. See the information in our filings with the SEC from time to time and Item 1A of this report, “Risk Factors,” for certain matters that may bear on our results of operations.
Revenue Recognition
We provide wireline and wireless number portability, implement the allocation of pooled blocks of telephone numbers and provide network management services pursuant to seven contracts with the NAPM. The aggregate fees for transactions processed under the contracts are determined by an annual fixed-fee pricing model. If actual volume of transactions in a given year is above or below the contractually established volume range for that year, the annual fixed fee may be adjusted up or down, respectively. At each reporting period, we assess the volume of transactions in comparison to the contractually established volume range for that year and determine the probability of an adjustment, either up or down, to the annual fixed fee. If we determine an adjustment is probable and measurable, we record the adjustment to revenue in the reporting period in which our assessment is made. We have not recorded any adjustments to the annual fixed fee since the inception of these contract terms in January 2009.
For more information regarding our revenue recognition policy, please see Note 2 to our Consolidated Financial Statements in Item 8 of Part II of this report.
Service Level Standards
Some of our private commercial contracts require us to meet minimum service level standards and impose corresponding penalties for failure to meet those standards. We record a provision for these performance-related penalties when we become aware that we have failed to meet required service levels, which results in a corresponding reduction of our revenue.
34
Goodwill and Intangible Assets
In accordance with the Intangibles-Goodwill and Other Topic of the Financial Accounting Standards Board, or FASB, Accounting Standards Codification, or ASC, we test our goodwill for impairment on an annual basis, or on an interim basis if an event occurs or circumstances change that indicate an impairment may have occurred.
Our 2016 annual goodwill impairment analysis, which we performed for our single reporting unit as of October 1, 2016, did not result in an impairment charge. We compared our enterprise value to our reporting unit carrying value as of October 1, 2016. As a result of this analysis, we determined that the estimated fair value of our reporting unit was substantially in excess of the carrying value. We believe that the assumptions and estimates used to determine the estimated fair value of our reporting unit are reasonable; however, there are a number of factors, including factors outside of our control, such as stock price volatility, that could cause actual results to differ from our estimates.
The fair value of our goodwill and intangible assets could be impacted by future adverse changes including, but not limited to: (a) a significant adverse change in the business climate; (b) a substantial decline in our market capitalization, (c) an adverse action or assessment by a regulator; (d) unanticipated competition and loss of customer contracts; (e) loss of key personnel; or (f) a realignment of our resources or restructuring in response to changes to industry and market conditions. Future adverse changes could cause the fair value of our reporting unit or intangible assets to fall below their respective carrying values, resulting in a potential impairment charge. In addition, changes in our organizational structure or how our management allocates resources and assesses performance could cause us to have more than one operating segment or reporting unit and require a reallocation and impairment analysis of our goodwill and intangible assets under a new organizational structure.
An impairment charge could have a material effect on our consolidated financial statements because of the significance of goodwill and intangible assets to our consolidated balance sheet. As of December 31, 2016, we had $1.17 billion of goodwill and $424.0 million of intangible assets.
Accounts Receivable, Revenue Recovery Collections, and Allowance for Doubtful Accounts
Accounts receivable are recorded at the invoiced amount and do not bear interest. In accordance with our contracts with the NAPM, we bill a revenue recovery collections fee, or RRC fee, equal to a percentage of monthly billings to our clients. The aggregate RRC fees collected may be used to offset uncollectible receivables from an individual client. On August 1, 2015, the RRC rate was increased from to 0.50% to 0.75% and remained at that level through December 31, 2016. Any accrued RRC fees in excess of uncollectible receivables are paid back to the clients annually on a pro rata basis. All other receivables related to services not covered by the RRC fees are evaluated and, if deemed not collectible, are appropriately reserved.
Income Taxes
We recognize deferred tax assets and liabilities based on temporary differences between the financial reporting bases and the tax bases of assets and liabilities. These deferred tax assets and liabilities are measured using the enacted tax rates and laws that will be in effect when such amounts are expected to reverse or be utilized. The realization of deferred tax assets is contingent upon the generation of future taxable income. When appropriate, we recognize a valuation allowance to reduce such deferred tax assets to amounts that are more likely than not to be ultimately realized. The calculation of deferred tax assets, including valuation allowances, and liabilities requires us to apply significant judgment related to such factors as the application of complex tax laws, changes in tax laws and our future operations. We review our deferred tax assets on a quarterly basis to determine if a valuation allowance is required based upon these factors. Changes in our assessment of the need for a valuation allowance could give rise to a change in such allowance, potentially resulting in additional expense or benefit in the period of change.
Our income tax provision includes U.S. federal, state, local and foreign income taxes and is based on pre-tax income or loss. In determining the annual effective income tax rate, we analyzed various factors, including our annual earnings and taxing jurisdictions in which the earnings were generated, the impact of state and local income taxes and our ability to use tax credits and net operating loss carryforwards.
We assess uncertain tax positions and recognize income tax benefits when, based on the technical merits of a tax position, we believe that if a dispute arose with the taxing authority and was taken to a court of last resort, it is more likely than not (i.e., a probability of greater than 50 percent) that the tax position would be sustained as filed. If a position is determined to be more likely than not of being sustained, the reporting enterprise should recognize the largest amount of tax benefit that is greater than 50 percent likely of being realized upon ultimate settlement with the taxing authority. Our practice is to recognize interest and penalties related to income tax matters in income tax expense.
35
We file income tax returns in the United States Federal jurisdiction and in many state and foreign jurisdictions. The tax years 2009 through 2015 remain open to examination by the major taxing jurisdictions to which we are subject. During 2016, the IRS completed an examination of the 2010 federal income tax return of Neustar Information Services, Inc. No adjustments were made as a result of the audit. The IRS also initiated an examination of the 2012 federal income tax return of Neustar, Inc. and its subsidiaries. The examination was completed with no adjustments.
Consolidated Results of Operations
Year Ended December 31, 2015 Compared to the Year Ended December 31, 2016
The following table presents an overview of our results of operations for the years ended December 31, 2015 and 2016.
Years Ended December 31, | ||||||||||||||
2015 | 2016 | 2015 vs. 2016 | ||||||||||||
$ | $ | $ Change | % Change | |||||||||||
(in thousands, except per share data) | ||||||||||||||
Revenue | $ | 1,049,958 | $ | 1,209,847 | $ | 159,889 | 15.2 | % | ||||||
Operating expense: | ||||||||||||||
Cost of revenue (excluding depreciation and amortization shown separately below) | 286,236 | 369,104 | 82,868 | 29.0 | % | |||||||||
Sales and marketing | 206,292 | 215,563 | 9,271 | 4.5 | % | |||||||||
Research and development | 25,677 | 28,159 | 2,482 | 9.7 | % | |||||||||
General and administrative | 118,648 | 111,694 | (6,954 | ) | (5.9 | )% | ||||||||
Depreciation and amortization | 122,691 | 164,081 | 41,390 | 33.7 | % | |||||||||
Restructuring charges | 3,858 | 14,712 | 10,854 | 281.3 | % | |||||||||
Separation costs | — | 14,512 | 14,512 | 100.0 | % | |||||||||
763,402 | 917,825 | 154,423 | 20.2 | % | ||||||||||
Income from operations | 286,556 | 292,022 | 5,466 | 1.9 | % | |||||||||
Other (expense) income: | ||||||||||||||
Interest and other expense | (33,578 | ) | (68,915 | ) | (35,337 | ) | 105.2 | % | ||||||
Interest income | 552 | 340 | (212 | ) | (38.4 | )% | ||||||||
Income before income taxes | 253,530 | 223,447 | (30,083 | ) | (11.9 | )% | ||||||||
Provision for income taxes | 78,068 | 54,801 | (23,267 | ) | (29.8 | )% | ||||||||
Net income | $ | 175,462 | $ | 168,646 | $ | (6,816 | ) | (3.9 | )% | |||||
Net income per share: | ||||||||||||||
Basic | $ | 3.21 | $ | 3.10 | ||||||||||
Diluted | $ | 3.14 | $ | 3.04 | ||||||||||
Weighted average common shares outstanding: | ||||||||||||||
Basic | 54,643 | 54,413 | ||||||||||||
Diluted | 55,904 | 55,516 | ||||||||||||
36
Revenue
Revenue. Revenue increased $159.9 million driven by revenue from acquisitions closed in 2015 and demand for our Marketing and Security Services. Revenue from our Marketing Services increased $98.7 million driven by an increase in revenue of $60.6 million from the acquisition of MarketShare Partners, LLC, or MarketShare, completed on December 9, 2015, and increased demand for our services that help clients make informed and high impact decisions to promote their products and services.
Security Services revenue increased $36.1 million driven by an increase in revenue of $29.6 million from domain name registries and an increase in revenue of $6.5 million resulting from demand for our DNS services. The increase in revenue of $29.6 million from domain name registries was driven by $17.8 million from the acquisition of Bombora Technologies, completed on July 30, 2015, which included $4.1 million in revenue resulting from the consolidation of the customer base. The remaining increase in domain name registries was driven by the sale of a block of domain names and continued growth in the number of domain names under management.
Data Services revenue increased $19.8 million driven by an increase of $70.9 million due to an increase in revenue of $61.0 million from the caller authentication assets we acquired from Transaction Network Services, Inc., or TNS, on December 18, 2015, offset by a $45.5 million decrease in revenue from the expiration of our contract to serve as the registry operator for U.S. Common Short Codes in 2015. In addition, revenue from user authentication and rights managements services decreased $5.2 million, and revenue from carrier provisioning services decreased $0.4 million.
Revenue from our NPAC Services increased $5.2 million driven by revenue from transition services under our contracts to provide LNPA services.
Expense
Cost of revenue. Cost of revenue increased $82.9 million, including $74.0 million of operating expense related to the acquisitions completed in 2015. This increase of $82.9 million was due to an increase of $45.8 million in costs related to our information technology and systems and an increase of $30.3 million in personnel and personnel-related expense. The increase in costs related to our information technology and systems was driven by increased data processing, telecommunications, maintenance and hardware costs. The increase of $30.3 million in personnel and personnel-related expense was due to a $28.4 million increase in personnel costs driven by headcount growth and a $1.9 million increase in stock-based compensation. In addition, royalty costs increased $3.0 million and contractor costs increased $3.8 million.
Sales and marketing. Sales and marketing expense increased $9.3 million, including $32.8 million of operating expense related to the acquisitions completed in 2015. This increase of $9.3 million was due to an increase of $15.8 million in personnel and personnel-related expense and an increase of $1.3 million in maintenance and general facilities costs. The increase of $15.8 million in personnel and personnel-related expense was due to a $15.0 million increase in personnel costs and a $0.8 million increase in stock-based compensation. These increases were partially offset by a $7.8 million decrease in advertising and marketing costs, driven by a decrease in costs associated with NPAC-related campaigns.
Research and development. Research and development expense increased $2.5 million, including $4.4 million of operating expense related to the acquisitions completed in 2015. The overall increase of $2.5 million was due to personnel and personnel-related expense.
General and administrative. General and administrative expense decreased $7.0 million, including an increase of $4.8 million of operating expense related to the acquisitions completed in 2015. This overall decrease of $7.0 million was due to a decrease of $9.7 million in professional fees, partially offset by an increase of $1.4 million in personnel and personnel related costs and an increase of $1.3 million in general facilities and other costs. The decrease of $9.7 million in professional fees was driven by a decrease of $13.4 million in costs incurred to pursue new business opportunities, a decrease of $2.1 million in NPAC-related legal fees, and a decrease in other professional fees. These decreases were partially offset by an increase of $4.8 million in merger-related costs.
Depreciation and amortization. Depreciation and amortization expense increased $41.4 million, including $28.2 million in depreciation and amortization expense related to assets acquired as part of our 2015 acquisitions. During the third quarter, we recorded an $11.1 million impairment charge to write down long-lived intangible assets. Amortization expense increased $27.5 million related to other acquired intangible assets. In addition, depreciation expense increased $2.8 million.
Restructuring charges. Restructuring charges increased $10.9 million due to plans initiated in 2016 to achieve efficiencies in connection with the integration of our recent acquisitions and the review of our go-to-market strategy.
37
Separation costs. During the year ended December 31, 2016, we incurred separation costs of $14.5 million. Separation costs related to activities supporting the planned separation including professional fees for outside advisory services including legal, finance, accounting and related services. As a result of the execution of the merger agreement, the Company is focusing on completing the merger.
Interest and other expense. Interest and other expense increased $35.3 million due an increase of $32.9 million in interest expense, a $3.0 million increase in losses on debt modification and extinguishment and a net decrease of $0.2 million in gains on asset disposals. These increases were partially offset by a decrease of $0.8 million in foreign currency transaction losses. The increase in interest expense was driven by borrowings under our Amended 2013 Credit Facilities. On September 28, 2016, we amended our credit facilities and among other things, consolidated the remaining principal outstanding under our 2013 Term Facility and our 2015 Incremental Term Facility into a single term loan facility, or the Amended 2013 Term Facility.
Interest income. Interest income for the year ended December 31, 2016 was comparable to that recorded for the year ended December 31, 2015.
Provision for income taxes. Our effective tax rate, including discrete items, for the year ended December 31, 2016 was 24.5%, a decrease from 30.8% for the year ended December 31, 2015. During the third quarter of 2016, we liquidated one of our domestic subsidiaries for tax purposes. We intend to treat the common stock of this subsidiary as worthless for income tax purposes on our 2016 U.S. federal and state income tax returns. During the year ended December 31, 2016, we recorded a discrete tax benefit of $22.8 million related to this worthless stock deduction. Excluding all discrete tax items, our annual effective tax rate was approximately 36.5% and 35.4% for the years ended December 31, 2016 and 2015, respectively.
38
Year Ended December 31, 2014 Compared to the Year Ended December 31, 2015
The following table presents an overview of our results of operations for the years ended December 31, 2014 and 2015.
Years Ended December 31, | ||||||||||||||
2014 | 2015 | 2014 vs. 2015 | ||||||||||||
$ | $ | $ Change | % Change | |||||||||||
(in thousands, except per share data) | ||||||||||||||
Revenue | $ | 963,588 | $ | 1,049,958 | $ | 86,370 | 9.0 | % | ||||||
Operating expense: | ||||||||||||||
Cost of revenue (excluding depreciation and amortization shown separately below) | 247,115 | 286,236 | 39,121 | 15.8 | % | |||||||||
Sales and marketing | 198,142 | 206,292 | 8,150 | 4.1 | % | |||||||||
Research and development | 27,739 | 25,677 | (2,062 | ) | (7.4 | )% | ||||||||
General and administrative | 104,970 | 118,648 | 13,678 | 13.0 | % | |||||||||
Depreciation and amortization | 117,785 | 122,691 | 4,906 | 4.2 | % | |||||||||
Restructuring charges | 6,521 | 3,858 | (2,663 | ) | (40.8 | )% | ||||||||
702,272 | 763,402 | 61,130 | 8.7 | % | ||||||||||
Income from operations | 261,316 | 286,556 | 25,240 | 9.7 | % | |||||||||
Other (expense) income: | ||||||||||||||
Interest and other expense | (26,218 | ) | (33,578 | ) | (7,360 | ) | 28.1 | % | ||||||
Interest income | 445 | 552 | 107 | 24.0 | % | |||||||||
Income before income taxes | 235,543 | 253,530 | 17,987 | 7.6 | % | |||||||||
Provision for income taxes | 71,849 | 78,068 | 6,219 | 8.7 | % | |||||||||
Net income | $ | 163,694 | $ | 175,462 | $ | 11,768 | 7.2 | % | ||||||
Net income per share: | ||||||||||||||
Basic | $ | 2.84 | $ | 3.21 | ||||||||||
Diluted | $ | 2.75 | $ | 3.14 | ||||||||||
Weighted average common shares outstanding: | ||||||||||||||
Basic | 57,647 | 54,643 | ||||||||||||
Diluted | 59,535 | 55,904 | ||||||||||||
Revenue
Revenue. Revenue increased $86.4 million driven by strong demand for our Security and Marketing Services and a $32.3 million increase in revenue from NPAC Services. Security Services revenue increased $27.7 million driven by an increase in revenue of $18.9 million from domain name registries and an increase in revenue of $8.8 million driven by demand for our DNS services. In particular, the increase in revenue from domain name registries was driven by the addition of new top-level domains, of which $7.3 million is due to the acquisition of Bombora in July 2015 and $5.2 million to the incremental revenue from the acquisition of .CO Internet in April 2014. Revenue from our Marketing Services increased $23.4 million driven by increased demand for our services that help clients make informed and high impact decisions to promote their products and services including $2.7 million from the acquisition of MarketShare in December 2015. Data Services revenue increased $3.0 million. In particular, revenue from user authentication and rights management services increased $7.3 million, including $6.3 million of revenue due to the recognition of deferred revenue upon the expiration of our contract to serve as the registry operator for U.S. Common Short Codes. In addition, revenue from caller authentication services increased $5.0 million, of which $2.1 million was due to the acquisition of the caller authentication assets from TNS. These increases were partially offset by a decrease of $9.3 million in revenue from carrier provisioning services driven by the completion of client projects and consolidation of the customer base.
39
Expense
Cost of revenue. Cost of revenue increased $39.1 million due to an increase of $17.3 million in costs related to our information technology and systems, an increase of $15.1 million in personnel and personnel-related expense, an increase of $5.8 million in royalty costs, and an increase of $0.9 million in contractor costs incurred to support business operations. The increase in costs related to our information technology and systems was driven by increased data processing, telecommunications, and maintenance costs. Personnel and personnel-related expense increased due to headcount growth from acquisitions and to support our business growth. Of the total increase in royalty costs, $5.5 million was driven by the recognition of deferred costs upon the expiration of our contract to serve as the registry operator for U.S. Common Short Codes.
Sales and marketing. Sales and marketing expense increased $8.2 million due to an increase of $6.4 million in personnel and personnel-related expense, an increase of $2.9 million in advertising and marketing costs, partially offset by a decrease of $1.1 million in maintenance and general facilities costs. The increase in advertising and marketing costs was driven by an increase of $7.1 million in costs associated with advertising campaigns to drive brand awareness and other professional fees, partially offset by a decrease of $4.2 million in costs associated with NPAC-related campaigns.
Research and development. Research and development expense decreased $2.1 million due to a decrease of $1.6 million in personnel and personnel-related expense and a decrease of $0.5 million in maintenance and general facilities costs.
General and administrative. General and administrative expense increased $13.7 million due to an increase of $14.5 million in professional fees, an increase of $2.0 million in maintenance and other administrative costs, partially offset by a decrease of $2.8 million in personnel and personnel-related expense. The increase in professional fees was driven by an increase in costs of $10.9 million incurred to pursue new business opportunities and an increase in costs of $3.6 million incurred to support corporate initiatives.
Depreciation and amortization. Depreciation and amortization expense increased $4.9 million due to an increase of $4.3 million in amortization expense related to acquired intangible assets. In addition, depreciation expense increased $0.6 million.
Restructuring charges. Restructuring expense decreased $2.7 million. Restructuring charges recorded during 2014 were related to our 2014 restructuring program, which aligned our resources to serve our clients more effectively. The plan was completed as of December 31, 2014. Restructuring charges recorded during 2015 were related to our 2015 restructuring program, which was implemented in the fourth quarter to create greater efficiencies.
Interest and other expense. Interest and other expense increased $7.4 million due to a $3.3 million loss on debt modification and extinguishment, recorded in the fourth quarter of 2015 and incurred in connection with the 2015 Incremental Term Facility, and an increase of $2.2 million foreign currency transaction losses. In addition, interest expense increased $3.4 million driven by additional borrowings under the 2015 Incremental Term Facility and an increase in the interest rate under our 2013 Term Facility. The increase in interest and other expense was partially offset by a net decrease of $1.5 million in losses on asset disposals.
Interest income. Interest income for the year ended December 31, 2015 was comparable to that recorded for the year ended December 31, 2014.
Provision for income taxes. Our effective tax rate for the year ended December 31, 2015 increased to 30.8% from 30.5% for the year ended December 31, 2014, primarily due to a discrete benefit for our domestic production activities deduction recorded during the year ended December 31, 2014, which was not applicable for the year ended December 31, 2015. Excluding discrete tax items, our annual effective tax rate was approximately 35.4% and 35.7% for the years ended December 31, 2015 and 2014, respectively.
Liquidity and Capital Resources
Our principal source of liquidity is cash provided by our operating activities. Our principal uses of cash were for debt service requirements and capital expenditures. We anticipate that our principal uses of cash in the future will be for debt service requirements and capital expenditures.
Total cash and cash equivalents were $45.8 million at December 31, 2016, a decrease of $43.3 million from $89.1 million at December 31, 2015. This decrease in cash and cash equivalents was due to cash used for principal payments under our credit facilities and capital expenditures, partially offset by cash provided by operations. We believe that our existing cash and cash equivalents, cash from operations and available borrowings under our credit facilities will be sufficient to fund our operations for the next twelve months.
40
Credit Facilities
On January 22, 2013, we entered into a credit facility that provided for a $325 million senior secured term loan facility, or 2013 Term Facility, and a $200 million senior secured revolving credit facility, or the 2013 Revolving Facility, and together with the 2013 Term Facility, the 2013 Credit Facilities. In addition, we closed an offering of $300 million aggregate principal amount of senior notes, or Senior Notes. On December 9, 2015, we amended our 2013 Credit Facilities to provide for a $350 million incremental term loan, or the 2015 Incremental Term Facility. On September 28, 2016 we further amended our 2013 Credit Facilities (as amended, the “Amended 2013 Credit Facilities”) to (i) extend the maturity date of the 2013 Revolving Facility to January 22, 2019, (ii) consolidate the remaining principal outstanding under our 2013 Term Facility and our 2015 Incremental Term Facility into a single term loan facility of $499 million and extend the maturity date of the consolidated term loans to January 22, 2019, (iii) set the annual amortization percentage of the Amended 2013 Term Facility at 22% through December 31, 2017 and 10% thereafter and (iv) lower the Eurodollar rate margin and base rate margin for the Amended 2013 Term Facility to (a) if the Consolidated Leverage Ratio (as defined in the Credit Agreement) is less than 2 to 1 after March 1, 2017, 3.00% and 2.00%, respectively, and (b) if the Consolidated Leverage Ratio is 2 to 1 or greater, 3.25% and 2.25%, respectively. For further discussion of this debt, see Note 7 to our Consolidated Financial Statements in Item 8 of Part II of this report.
Discussion of Cash Flows
2016 compared to 2015
Cash flows from operations
Net cash provided by operating activities for the year ended December 31, 2016 was $335.5 million, as compared to $355.3 million for the year ended December 31, 2015. This $19.9 million decrease in net cash provided by operating activities was the result of a decrease in net income of $6.8 million, an increase in non-cash adjustments of $93.5 million and a decrease in net changes in operating assets and liabilities of $106.5 million.
Non-cash adjustments increased $93.5 million, driven by an increase of $41.4 million in depreciation and amortization expense, an increase of $35.6 million in deferred income taxes, an increase of $13.3 million in amortization of deferred financing costs and original issue discount on debt, an increase in loss on debt modification and extinguishment of $3.0 million, an increase of $2.1 million in stock-based compensation, and a decrease of $0.7 million in gains on asset disposals. These total increases of $96.1 million in non-cash adjustments were partially offset by a decrease of $2.2 million in the provision for doubtful accounts and an increase of $0.3 million in tax benefit from equity awards.
Cash provided by net changes in operating assets and liabilities decreased $106.5 million primarily due to a decrease of $51.4 million in accounts payable and accrued expenses, a net decrease of $36.5 million in accounts and unbilled receivables, a decrease of $9.6 million in income taxes, a decrease of $9.3 million in deferred costs, a decrease of $6.4 million in prepaid expenses and other current assets, and a decrease of $2.1 million in other liabilities. These total decreases of $115.3 million in net changes in operating assets and liabilities were partially offset by an increase of $5.0 million in deferred revenue and an increase of $3.8 million in other assets.
Cash flows from investing
Net cash used in investing activities for the year ended December 31, 2016 was $57.5 million, as compared to $790.4 million for year ended December 31, 2015. This $732.9 million decrease in net cash used in investing activities was due to a decrease of $758.3 million in cash used for acquisitions, partially offset by an increase of $25.4 million in cash used for purchases of property and equipment.
Cash flows from financing
Net cash used in financing activities was $321.9 million for the year ended December 31, 2016, as compared to net cash provided of $196.8 million for the year ended December 31, 2015. This $518.7 million net increase in net cash used in financing activities was due to a decrease of $350.0 million in proceeds from our 2015 Incremental Term Facility, an increase of $288.5 million in principal payments under our Amended 2013 Credit Facilities, a decrease of $8.4 million in cash proceeds from the issuance of stock, and an increase of $0.9 million in cash used in principal repayments on capital lease obligations. These total increases of $647.8 million in cash used in financing activities were partially offset by a decrease of $113.4 million in cash used for share repurchases and for the net down of employee shares, a decrease of $15.1 million in debt issuance costs, an increase of $0.3 million in tax benefit from equity awards, and cash provided of $0.3 million due to a net change in restricted cash.
41
2015 compared to 2014
Cash flows from operations
Net cash provided by operating activities for the year ended December 31, 2015 was $355.3 million, as compared to $319.7 million for year ended December 31 2014. This $35.7 million increase in net cash provided by operating activities was the result of an increase in net income of $11.8 million, an increase in net changes in operating assets and liabilities of $24.1 million and a decrease in non-cash adjustments of $0.2 million.
Non-cash adjustments decreased $0.2 million primarily due to a decrease of $23.6 million in stock-based compensation and a net decrease of $1.7 million in loss (gain) on asset disposals. These decreases of $25.3 million were partially offset by an increase of $12.4 million in deferred income taxes, an increase of $4.9 million in depreciation and amortization expense, a loss on debt modification and extinguishment of $3.3 million recorded in the fourth quarter related to our 2015 Incremental term Facility, an increase of $2.4 million in the provision for doubtful accounts, a decrease of $1.1 million in tax benefit from equity awards, and an increase of $1.0 million in amortization of deferred financing costs and original issue discount on debt.
Net changes in operating assets and liabilities increased $24.1 million primarily due to an increase of $50.9 million in accounts payable and accrued expenses, an increase of $6.5 million in income taxes, an increase of $4.3 million in other assets and an increase of $2.5 million in deferred costs. These total increases of $64.2 million in net changes in operating assets and liabilities were partially offset by a decrease of $14.2 million in other liabilities, a decrease of $12.8 million in prepaid expenses and other current assets, a decrease of $9.0 million in deferred revenue, a decrease of $3.1 million in accounts and unbilled receivables and a decrease of $1.0 million in notes receivable.
Cash flows from investing
Net cash used in investing activities for the year ended December 31, 2015 was $790.4 million, as compared to $180.9 million for year ended December 31, 2014. This $609.6 million increase in net cash used in investing activities was due to an increase of $637.6 million in cash used for acquisitions, partially offset by a decrease of $28.0 million in cash used for purchases of property and equipment.
Cash flows from financing
Net cash provided by financing activities was $196.8 million for the year ended December 31, 2015, as compared to net cash used of $33.6 million for the year ended December 31, 2014. This $230.4 million increase in net cash provided by financing activities was primarily the result of net proceeds of $149.7 million from the 2015 Incremental Term Facility and a $84.1 million decrease in cash used for share repurchases and for the net down of employee shares. These total net increases in cash provided by financing activities of $233.8 million were partially offset by a decrease of $1.1 million in tax benefit from equity awards, a decrease of $1.1 million in cash proceeds from the issuance of stock, an increase of $0.8 million in cash used in principal repayments on capital lease obligations, and an increase of $0.3 million in restricted cash.
Contractual Obligations
Our principal commitments consist of obligations under our Senior Notes, Amended 2013 Credit Facilities, and leases for office space, computer equipment and furniture and fixtures. The following table summarizes our long-term contractual obligations as December 31, 2016:
Payments Due by Period | |||||||||||||||||||
Total | Less Than 1 Year | 2-3 Years | 4-5 Years | More Than 5 Years | |||||||||||||||
(in thousands) | |||||||||||||||||||
Capital lease obligations | $ | 1,484 | $ | 1,484 | $ | — | $ | — | $ | — | |||||||||
Operating lease obligations | 133,016 | 23,886 | 44,455 | 36,957 | 27,718 | ||||||||||||||
Amended 2013 Term Facility(1) | 473,944 | 126,141 | 347,803 | — | — | ||||||||||||||
Amended 2013 Revolving Facility(1) | 93,574 | 4,355 | 89,219 | — | — | ||||||||||||||
Senior Notes(1) | 381,825 | 13,500 | 27,000 | 27,000 | 314,325 | ||||||||||||||
Total | $ | 1,083,843 | $ | 169,366 | $ | 508,477 | $ | 63,957 | $ | 342,043 | |||||||||
(1) | Interest expense related to the Amended 2013 Term Facility has been calculated using a rate of 4.0%. Interest expense related to the Senior Notes has been calculated using a fixed 4.5% interest rate. Interest expense related to the Amended 2013 Revolving Facility has been calculated using a rate of 3.6%. |
42
Some of our commercial commitments are secured by standby letters of credit. The following is a summary of our commercial commitments secured by standby letters of credit by commitment date as of December 31, 2016:
Total | Less Than 1 Year | 1-3 Years | 4-5 Years | More Than 5 Years | |||||||||||||||
(in thousands) | |||||||||||||||||||
Standby letters of credit | $ | 19,473 | $ | 19,377 | $ | 96 | $ | — | $ | — | |||||||||
The amounts presented in the tables above may not necessarily reflect our actual future cash funding requirements because the actual timing of the future payments made may vary from the stated contractual obligation. As of December 31, 2016, we had $7.5 million of unrecognized tax benefits recorded in other long-term liabilities along with interest and penalties accrued thereon and $35.1 million of long-term deferred tax liabilities. Due to the uncertainty with respect to the timing of payments in individual years in connection with these tax liabilities, we are unable to make reasonably reliable estimates of the period of cash settlement with the respective taxing authority. Therefore, we have not included these amounts in the contractual obligations table above. See Note 11 to the consolidated financial statements in Item 8 of Part II of this report for a discussion on income taxes.
Effect of Inflation
Inflation generally affects us by increasing our cost of labor and equipment. We do not believe that inflation had any material effect on our results of operations during the years ended December 31, 2014, 2015 and 2016.
Off-Balance Sheet Arrangements
We had no off-balance sheet arrangements as of December 31, 2015 and 2016.
ITEM 7A. | QUANTITATIVE AND QUALITATIVE DISCLOSURES ABOUT MARKET RISK |
We are exposed to a variety of market risks, including changes in interest rates affecting the return on our Amended 2013 Credit Facilities and foreign currency fluctuations.
As of December 31, 2016, borrowings under our Amended 2013 Credit Facilities were approximately $829.0 million. A hypothetical change in interest rates by 100 basis points would not have a material impact on our financial position.
We have accounts on our foreign subsidiaries’ ledgers which are maintained in the respective subsidiary’s local foreign currency and translated into the United States dollar. As a result, we are exposed to movements in the exchange rates of various currencies against the United States dollar and against the currencies of other countries in which we sell services. As of December 31, 2016, our assets and liabilities related to non-dollar denominated currencies were primarily related to intercompany payables and receivables. An increase or decrease of 10% in foreign exchange rate would not have a material impact on our financial position.
Because our sales and expense are primarily denominated in local currency, the impact of foreign currency fluctuations on sales and expenses has not been material, and we do not employ measures intended to manage foreign exchange rate risk.
43
ITEM 8. | FINANCIAL STATEMENTS AND SUPPLEMENTARY DATA |
INDEX TO CONSOLIDATED FINANCIAL STATEMENTS
Page | |
44
REPORT OF INDEPENDENT REGISTERED PUBLIC ACCOUNTING FIRM
Board of Directors and Stockholders
NeuStar, Inc.
We have audited the accompanying consolidated balance sheets of NeuStar, Inc. as of December 31, 2015 and 2016, and the related consolidated statements of operations, comprehensive income, stockholders’ equity, and cash flows for each of the three years in the period ended December 31, 2016. Our audits also included the financial statement schedule listed in the Index at Item 15(a)(2). These financial statements and schedule are the responsibility of the Company’s management. Our responsibility is to express an opinion on these financial statements and schedule based on our audits.
We conducted our audits in accordance with the standards of the Public Company Accounting Oversight Board (United States). Those standards require that we plan and perform the audit to obtain reasonable assurance about whether the financial statements are free of material misstatement. An audit includes examining, on a test basis, evidence supporting the amounts and disclosures in the financial statements. An audit also includes assessing the accounting principles used and significant estimates made by management, as well as evaluating the overall financial statement presentation. We believe that our audits provide a reasonable basis for our opinion.
In our opinion, the financial statements referred to above present fairly, in all material respects, the consolidated financial position of NeuStar, Inc. at December 31, 2015 and 2016, and the consolidated results of its operations and its cash flows for each of the three years in the period ended December 31, 2016, in conformity with U.S. generally accepted accounting principles. Also, in our opinion, the related financial statement schedule, when considered in relation to the basic financial statements taken as a whole, presents fairly in all material respects the information set forth therein.
We also have audited, in accordance with the standards of the Public Company Accounting Oversight Board (United States), NeuStar, Inc.’s internal control over financial reporting as of December 31, 2016, based on criteria established in Internal Control — Integrated Framework issued by the Committee of Sponsoring Organizations of the Treadway Commission (2013 framework) and our report dated March 1, 2017 expressed an unqualified opinion thereon.
/s/ Ernst & Young LLP
Baltimore, Maryland
March 1, 2017
45
NEUSTAR, INC.
CONSOLIDATED BALANCE SHEETS
(in thousands, except share and per share data)
December 31, | |||||||
2015 | 2016 | ||||||
ASSETS | |||||||
Current assets: | |||||||
Cash and cash equivalents | $ | 89,097 | $ | 45,773 | |||
Restricted cash | 2,363 | 2,283 | |||||
Accounts receivable, net of allowance for doubtful accounts of $4,512 and $6,572, respectively | 167,593 | 207,595 | |||||
Unbilled receivables | 17,712 | 19,795 | |||||
Prepaid expenses and other current assets | 30,216 | 41,680 | |||||
Deferred costs | 6,676 | 11,469 | |||||
Income taxes receivable | 5,883 | 13,586 | |||||
Total current assets | 319,540 | 342,181 | |||||
Property and equipment, net | 147,764 | 145,821 | |||||
Goodwill | 1,186,983 | 1,168,982 | |||||
Intangible assets, net | 529,279 | 423,957 | |||||
Other assets, long-term | 18,681 | 17,771 | |||||
Total assets | $ | 2,202,247 | $ | 2,098,712 | |||
See accompanying notes.
46
NEUSTAR, INC.
CONSOLIDATED BALANCE SHEETS
(in thousands, except share and per share data)
December 31, | |||||||
2015 | 2016 | ||||||
LIABILITIES AND STOCKHOLDERS’ EQUITY | |||||||
Current liabilities: | |||||||
Accounts payable | $ | 28,392 | $ | 21,095 | |||
Accrued expenses | 134,632 | 134,545 | |||||
Deferred revenue | 91,006 | 91,188 | |||||
Notes payable | 131,272 | 103,725 | |||||
Capital lease obligations | 4,791 | 1,457 | |||||
Other liabilities | 10,875 | 11,632 | |||||
Total current liabilities | 400,968 | 363,642 | |||||
Deferred revenue, long-term | 22,998 | 22,437 | |||||
Notes payable, long-term | 957,509 | 702,946 | |||||
Capital lease obligations, long-term | 1,831 | — | |||||
Deferred income tax liabilities, long-term | 38,701 | 35,088 | |||||
Other liabilities, long-term | 56,741 | 53,298 | |||||
Total liabilities | 1,478,748 | 1,177,411 | |||||
Commitments and contingencies | — | — | |||||
Stockholders’ equity: | |||||||
Preferred stock, $0.001 par value; 100,000,000 shares authorized; no shares issued and outstanding as of December 31, 2015 and 2016 | — | — | |||||
Class A common stock, par value $0.001; 200,000,000 shares authorized; 80,233,896 and 82,136,230 shares issued; and 53,516,287 and 54,896,659 outstanding at December 31, 2015 and 2016, respectively | 80 | 82 | |||||
Class B common stock, par value $0.001; 100,000,000 shares authorized; 2,270 and 1,864 shares issued and outstanding at December 31, 2015 and 2016, respectively | — | — | |||||
Additional paid-in capital | 729,273 | 771,450 | |||||
Treasury stock, 26,717,609 and 27,239,571 shares at December 31, 2015 and 2016, respectively, at cost | (920,439 | ) | (933,581 | ) | |||
Accumulated other comprehensive loss | (1,904 | ) | (1,785 | ) | |||
Retained earnings | 916,489 | 1,085,135 | |||||
Total stockholders’ equity | 723,499 | 921,301 | |||||
Total liabilities and stockholders’ equity | $ | 2,202,247 | $ | 2,098,712 | |||
See accompanying notes.
47
NEUSTAR, INC.
CONSOLIDATED STATEMENTS OF OPERATIONS
(in thousands, except per share data)
Year Ended December 31, | |||||||||||
2014 | 2015 | 2016 | |||||||||
Revenue | $ | 963,588 | $ | 1,049,958 | $ | 1,209,847 | |||||
Operating expense: | |||||||||||
Cost of revenue (excluding depreciation and amortization shown separately below) | 247,115 | 286,236 | 369,104 | ||||||||
Sales and marketing | 198,142 | 206,292 | 215,563 | ||||||||
Research and development | 27,739 | 25,677 | 28,159 | ||||||||
General and administrative | 104,970 | 118,648 | 111,694 | ||||||||
Depreciation and amortization | 117,785 | 122,691 | 164,081 | ||||||||
Restructuring charges | 6,521 | 3,858 | 14,712 | ||||||||
Separation costs | — | — | 14,512 | ||||||||
702,272 | 763,402 | 917,825 | |||||||||
Income from operations | 261,316 | 286,556 | 292,022 | ||||||||
Other (expense) income: | |||||||||||
Interest and other expense | (26,218 | ) | (33,578 | ) | (68,915 | ) | |||||
Interest income | 445 | 552 | 340 | ||||||||
Income before income taxes | 235,543 | 253,530 | 223,447 | ||||||||
Provision for income taxes | 71,849 | 78,068 | 54,801 | ||||||||
Net income | $ | 163,694 | $ | 175,462 | $ | 168,646 | |||||
Net income per common share: | |||||||||||
Basic | $ | 2.84 | $ | 3.21 | $ | 3.10 | |||||
Diluted | $ | 2.75 | $ | 3.14 | $ | 3.04 | |||||
Weighted average common shares outstanding: | |||||||||||
Basic | 57,647 | 54,643 | 54,413 | ||||||||
Diluted | 59,535 | 55,904 | 55,516 | ||||||||
See accompanying notes.
48
NEUSTAR, INC.
CONSOLIDATED STATEMENTS OF COMPREHENSIVE INCOME
(in thousands)
Year Ended December 31, | |||||||||||
2014 | 2015 | 2016 | |||||||||
Net income | $ | 163,694 | $ | 175,462 | $ | 168,646 | |||||
Other comprehensive (loss) income, net of tax: | |||||||||||
Available for sale investments, net of tax: | |||||||||||
Change in net unrealized gains (losses), net of tax | 112 | (58 | ) | 53 | |||||||
Reclassification for (gains) losses included in net income, net of tax | (26 | ) | (62 | ) | 2 | ||||||
Net change in unrealized gains (losses) on investments, net of tax | 86 | (120 | ) | 55 | |||||||
Foreign currency translation adjustment, net of tax: | |||||||||||
Change in foreign currency translation adjustment, net of tax | (1,219 | ) | (1,696 | ) | 64 | ||||||
Reclassification adjustment included in net income, net of tax | 285 | 1,557 | — | ||||||||
Foreign currency translation adjustment, net of tax | (934 | ) | (139 | ) | 64 | ||||||
Other comprehensive (loss) income, net of tax | (848 | ) | (259 | ) | 119 | ||||||
Comprehensive income | $ | 162,846 | $ | 175,203 | $ | 168,765 | |||||
See accompanying notes.
49
NEUSTAR, INC.
CONSOLIDATED STATEMENTS OF STOCKHOLDERS’ EQUITY
(in thousands)
Class A Common Stock | Class B Common Stock | Additional Paid-in Capital | Treasury Stock | Accumulated Other Comprehensive Loss | Retained Earnings | Total Stockholders’ Equity | |||||||||||||||||||||||||||
Shares | Amount | Shares | Amount | ||||||||||||||||||||||||||||||
Balance at December 31, 2013 | 87,148 | $ | 87 | 3 | $ | — | $ | 602,796 | $ | (893,852 | ) | $ | (797 | ) | $ | 881,340 | $ | 589,574 | |||||||||||||||
Issuance of shares from employee equity plans | 832 | 1 | — | — | 5,893 | 5,100 | — | — | 10,994 | ||||||||||||||||||||||||
Stock-based compensation expense | — | — | — | — | 64,379 | — | — | — | 64,379 | ||||||||||||||||||||||||
Common stock repurchase | (7,063 | ) | (7 | ) | — | — | — | — | — | (199,852 | ) | (199,859 | ) | ||||||||||||||||||||
Common stock received for tax withholding | — | — | — | — | — | (9,768 | ) | — | — | (9,768 | ) | ||||||||||||||||||||||
Net excess tax benefit from stock option exercises | — | — | — | — | 1,317 | — | — | — | 1,317 | ||||||||||||||||||||||||
Net income | — | — | — | — | — | — | — | 163,694 | 163,694 | ||||||||||||||||||||||||
Other comprehensive loss | — | — | — | — | — | — | (848 | ) | — | (848 | ) | ||||||||||||||||||||||
Balance at December 31, 2014 | 80,917 | 81 | 3 | — | 674,385 | (898,520 | ) | (1,645 | ) | 845,182 | 619,483 | ||||||||||||||||||||||
Issuance of shares from employee equity plans | 2,511 | 2 | — | — | 10,425 | 5,055 | — | — | 15,482 | ||||||||||||||||||||||||
Issuance of shares for business acquisitions | 572 | 1 | — | — | 13,331 | — | — | — | 13,332 | ||||||||||||||||||||||||
Stock-based compensation expense | — | — | — | — | 40,810 | — | — | — | 40,810 | ||||||||||||||||||||||||
Conversion of Class B common stock to Class A common stock | 1 | — | (1 | ) | — | — | — | — | — | — | |||||||||||||||||||||||
Common stock repurchase | (3,767 | ) | (4 | ) | — | — | — | — | — | (104,155 | ) | (104,159 | ) | ||||||||||||||||||||
Common stock received for tax withholding | — | — | — | — | — | (26,974 | ) | — | — | (26,974 | ) | ||||||||||||||||||||||
Net excess tax benefit (shortfall) from stock option exercises | — | — | — | — | (9,678 | ) | — | — | — | (9,678 | ) | ||||||||||||||||||||||
Net income | — | — | — | — | — | — | — | 175,462 | 175,462 | ||||||||||||||||||||||||
Other comprehensive loss | — | — | — | — | — | — | (259 | ) | — | (259 | ) | ||||||||||||||||||||||
Balance at December 31, 2015 | 80,234 | 80 | 2 | — | 729,273 | (920,439 | ) | (1,904 | ) | 916,489 | 723,499 | ||||||||||||||||||||||
Issuance of shares from employee equity plans | 1,902 | 2 | — | — | 2,480 | 4,824 | — | — | 7,306 | ||||||||||||||||||||||||
Stock-based compensation expense | — | — | — | — | 42,874 | — | — | — | 42,874 | ||||||||||||||||||||||||
Common stock received for tax withholding | — | — | — | — | — | (17,966 | ) | — | — | (17,966 | ) | ||||||||||||||||||||||
Net excess tax benefit (shortfall) from stock option exercises | — | — | — | — | (3,177 | ) | — | — | — | (3,177 | ) | ||||||||||||||||||||||
Net income | — | — | — | — | — | — | — | 168,646 | 168,646 | ||||||||||||||||||||||||
Other comprehensive income | — | — | — | — | — | — | 119 | — | 119 | ||||||||||||||||||||||||
Balance at December 31, 2016 | 82,136 | $ | 82 | 2 | $ | — | $ | 771,450 | $ | (933,581 | ) | $ | (1,785 | ) | $ | 1,085,135 | $ | 921,301 | |||||||||||||||
See accompanying notes.
50
NEUSTAR, INC.
CONSOLIDATED STATEMENTS OF CASH FLOWS
(in thousands)
Year Ended December 31, | |||||||||||
2014 | 2015 | 2016 | |||||||||
Operating activities: | |||||||||||
Net income | $ | 163,694 | $ | 175,462 | $ | 168,646 | |||||
Adjustments to reconcile net income to net cash provided by operating activities: | |||||||||||
Depreciation and amortization | 117,785 | 122,691 | 164,081 | ||||||||
Stock-based compensation | 64,379 | 40,810 | 42,874 | ||||||||
Loss on debt modification and extinguishment | — | 3,326 | 6,354 | ||||||||
Amortization of deferred financing costs and original issue discount on debt | 3,385 | 4,380 | 17,665 | ||||||||
Tax benefit from equity awards | (1,495 | ) | (361 | ) | (681 | ) | |||||
Deferred income taxes | (34,668 | ) | (22,265 | ) | 13,289 | ||||||
Provision for doubtful accounts | 7,015 | 9,399 | 7,200 | ||||||||
Loss (gain) on disposal of assets | 1,057 | (678 | ) | — | |||||||
Changes in operating assets and liabilities, net of acquisitions: | |||||||||||
Accounts receivable | (8,973 | ) | (11,197 | ) | (48,411 | ) | |||||
Unbilled receivables | (1,865 | ) | (2,757 | ) | (2,085 | ) | |||||
Notes receivable | 1,008 | — | — | ||||||||
Prepaid expenses and other current assets | 8,100 | (4,716 | ) | (11,155 | ) | ||||||
Deferred costs | 377 | 2,875 | (6,468 | ) | |||||||
Income taxes | (7,485 | ) | (989 | ) | (10,587 | ) | |||||
Other assets | (3,907 | ) | 402 | 4,219 | |||||||
Other liabilities | 13,533 | (666 | ) | (2,777 | ) | ||||||
Accounts payable and accrued expenses | (6,051 | ) | 44,860 | (6,491 | ) | ||||||
Deferred revenue | 3,773 | (5,237 | ) | (204 | ) | ||||||
Net cash provided by operating activities | 319,662 | 355,339 | 335,469 | ||||||||
Investing activities: | |||||||||||
Purchases of property and equipment | (60,161 | ) | (32,137 | ) | (57,547 | ) | |||||
Businesses acquired, net of cash acquired | (120,698 | ) | (758,295 | ) | 12 | ||||||
Net cash used in investing activities | (180,859 | ) | (790,432 | ) | (57,535 | ) | |||||
Financing activities: | |||||||||||
Decrease (increase) in restricted cash | 130 | (172 | ) | 80 | |||||||
Proceeds from note payable | 175,000 | 350,000 | — | ||||||||
Payments under notes payable obligations | (8,125 | ) | (8,125 | ) | (296,610 | ) | |||||
Principal repayments on capital lease obligations | (3,466 | ) | (4,306 | ) | (5,179 | ) | |||||
Debt issuance costs | — | (25,274 | ) | (10,201 | ) | ||||||
Proceeds from issuance of stock | 10,994 | 9,915 | 1,540 | ||||||||
Tax benefit from equity awards | 1,495 | 361 | 681 | ||||||||
Repurchase of restricted stock awards and common stock | (209,627 | ) | (125,563 | ) | (12,201 | ) | |||||
Net cash (used in) provided by financing activities | (33,599 | ) | 196,836 | (321,890 | ) | ||||||
Effect of foreign exchange rates on cash and cash equivalents | (1,936 | ) | 777 | 632 | |||||||
Net increase (decrease) in cash and cash equivalents | 103,268 | (237,480 | ) | (43,324 | ) | ||||||
Cash and cash equivalents at beginning of year | 223,309 | 326,577 | 89,097 | ||||||||
Cash and cash equivalents at end of year | $ | 326,577 | $ | 89,097 | $ | 45,773 | |||||
Supplemental cash flow information: | |||||||||||
Cash paid for interest | $ | 15,846 | $ | 16,878 | $ | 37,696 | |||||
Cash paid for income taxes | $ | 107,231 | $ | 108,290 | $ | 53,550 | |||||
Non-cash investing activities: | |||||||||||
Property and equipment acquired under capital leases | $ | 8,460 | $ | 683 | $ | — | |||||
Accounts payable incurred to purchase property and equipment | $ | 1,842 | $ | 4,468 | $ | 2,230 | |||||
51
1. DESCRIPTION OF BUSINESS AND ORGANIZATION
NeuStar, Inc. (the Company or Neustar) helps clients grow and guard their business with the most complete understanding of how to connect people, places, and things using its authoritative OneIDTM system. As the leader in connection sciences, the Company uses its expertise in real-time addressing, authentication, and analytics to provide marketing, risk security, registry, and communications solutions to over 11,000 clients. The Company's cloud-based platforms and differentiated data sets offer informative, real-time analytics, which enable clients to make actionable, data-driven decisions. The Company provides chief marketing officers a comprehensive suite of services to plan their media spend, identify and locate desired customers, invest effectively in marketing campaigns, deliver relevant offers and measure the performance of these activities. Security professionals use the Company's solutions to maximize web performance and protect against malicious attacks. The Company enables the exchange of essential operating information across multiple carriers to provision and manage services, assisting clients with fast and accurate order processing and immediate routing of customer inquiries. The Company provides communications service providers in the United States critical infrastructure that enables the dynamic routing of calls and text messages.
On December 14, 2016, the Company entered into an Agreement and Plan of Merger (the Merger Agreement), with Aerial Topco, L.P. (the Parent), and Aerial Merger Sub, Inc., a subsidiary of Parent (Merger Sub), and, together with Parent, the Acquiring Parties, pursuant to which, subject to the satisfaction or waiver of the conditions therein, Merger Sub will merge with and into Neustar. As a result of the merger, the Company will become a wholly-owned subsidiary of Parent. Parent and Merger Sub were formed by Golden Gate Private Equity, Inc. and GIC Special Investments Pte Ltd. The Merger Agreement was unanimously approved by the members of the Board of Directors (the Board) and the Board recommended approval of the Merger Agreement to the Company’s stockholders.
Prior to entering into the Merger Agreement, the Company announced on June 21, 2016 its intention to separate into two independent and publicly traded companies through a tax-free spin-off.
2. SUMMARY OF SIGNIFICANT ACCOUNTING POLICIES
Basis of Presentation and Consolidation
The consolidated financial statements include the accounts of the Company and its wholly-owned subsidiaries. All material intercompany transactions and accounts have been eliminated in consolidation. The Company consolidates investments where it has a controlling financial interest. The usual condition for controlling financial interest is ownership of a majority of the voting interest and, therefore, as a general rule, ownership, directly or indirectly, of more than 50% of the outstanding voting shares is a condition indicating consolidation. The Company does not have any variable interest entities.
Use of Estimates
The preparation of financial statements in conformity with U.S. generally accepted accounting principles (U.S. GAAP) requires management to make estimates and assumptions that affect the reported amounts of assets and liabilities, the disclosure of contingent assets and liabilities at the date of the financial statements and the reported amounts of revenue and expense during the reporting periods. Significant estimates and assumptions are inherent in the analysis and the measurement of deferred tax assets; the identification and quantification of income tax liabilities due to uncertain tax positions; and recoverability of goodwill. The Company bases its estimates on historical experience and assumptions that it believes are reasonable. Actual results could differ from those estimates.
Fair Value of Financial Instruments
Fair value is the price that would be received in the sale of an asset or paid to transfer a liability in an orderly transaction between market participants at the measurement date. The Fair Value Measurements and Disclosure Topic of Financial Accounting Standards Board (FASB) Accounting Standards Codification (ASC) establishes a fair value hierarchy that prioritizes the inputs to valuation techniques used to measure fair value and requires that assets and liabilities carried at fair value be classified and disclosed in one of the following three categories:
• | Level 1. Observable inputs, such as quoted prices in active markets; |
• | Level 2. Inputs, other than quoted prices in active markets, that are observable either directly or indirectly; and |
52
• | Level 3. Unobservable inputs for which there is little or no market data, which require the reporting entity to develop its own assumptions. |
The Company evaluates assets and liabilities subject to fair value measurements on a recurring and non-recurring basis to determine the appropriate level at which to classify them for each reporting period. Due to their short-term nature, the carrying amounts reported in the accompanying consolidated financial statements approximate the fair value for cash and cash equivalents, accounts receivable, accounts payable and accrued expenses. The Company determines the fair value of its term loan facilities, the 2013 Term Facility (as defined in Note 7), the 2015 Incremental Term Facility (as defined in Note 7), and the Amended 2013 Term Facility (as defined in Note 7), using pricing service quotations as quoted by Bloomberg (Level 2) (see Note 7). The Company believes the carrying value of its Amended 2013 Revolving Facility (as defined in Note 7) approximates the fair value of the debt as the term and interest rate approximates the market rate (Level 2) (see Note 7). The Company determines the fair value of its Senior Notes using a secondary market price on the last trading day in each period as quoted by Bloomberg (Level 2) (see Note 7).
The estimated fair values of the Company’s financial instruments are as follows (in thousands):
December 31, | |||||||||||||||
2015 | 2016 | ||||||||||||||
Carrying Amount | Fair Value | Carrying Amount | Fair Value | ||||||||||||
2013 Term Facility (including current portion, net of discount) | $ | 300,328 | $ | 296,013 | $ | — | $ | — | |||||||
2015 Incremental Term Facility (including current portion, net of discount) | 337,947 | 341,326 | — | — | |||||||||||
2013 Amended Term Facility (including current portion, net of discount) | — | — | 437,815 | 439,480 | |||||||||||
2013 Revolving Facility | 175,000 | 175,000 | — | — | |||||||||||
Amended 2013 Revolving Facility | — | — | 85,000 | 85,000 | |||||||||||
Senior Notes (including current portion) | 300,000 | 249,000 | 300,000 | 305,733 | |||||||||||
Cash and Cash Equivalents
The Company considers all highly liquid investments, which are investments that are readily convertible into cash and have original maturities of three months or less at the time of purchase, to be cash equivalents.
Restricted Cash
As of December 31, 2015 and 2016, cash of $2.4 million and $2.3 million, respectively, was restricted as collateral for certain of the Company’s outstanding letters of credit and for deposits on leased facilities.
Concentrations of Credit Risk
Financial instruments that are potentially subject to a concentration of credit risk consist principally of cash, cash equivalents, and accounts receivable. The Company’s cash management and investment policies are in place to restrict placement of these instruments with only financial institutions evaluated as highly creditworthy.
With respect to accounts receivable, the Company performs ongoing evaluations of its clients, generally granting uncollateralized credit terms to its clients, and maintains an allowance for doubtful accounts based on historical experience and management’s expectations of future losses. Clients under the Company’s contracts with North American Portability Management LLC (NAPM) are charged a Revenue Recovery Collection (RRC) fee (see “Accounts Receivable, Revenue Recovery Collections and Allowance for Doubtful Accounts” below).
Accounts Receivable, Revenue Recovery Collections and Allowance for Doubtful Accounts
Accounts receivable are recorded at the invoiced amount and do not bear interest. In accordance with the Company’s contracts with the NAPM, the Company bills an RRC fee to offset uncollectible receivables from any individual client. The RRC fee is based on a percentage of monthly billings. On July 1, 2013 the RRC fee was reduced from 0.65% to 0.50% and remained at that level through July 31, 2015. On August 1, 2015, the RRC fee was increased to 0.75%. The RRC fees are recorded as an accrued expense when collected. If the RRC fee is insufficient, the uncollectible amounts can be recovered from
53
the clients. Any accrued RRC fees in excess of uncollectible receivables are paid back to the clients annually on a pro rata basis. RRC fees of $3.2 million and $4.0 million are included in accrued expenses as of December 31, 2015 and 2016, respectively. All other receivables related to services not covered by the RRC fees are evaluated and, if deemed not collectible, are reserved. The Company recorded an allowance for doubtful accounts of $4.5 million and $6.6 million as of December 31, 2015 and 2016, respectively. Bad debt expense amounted to $7.0 million, $9.4 million and $7.2 million for the years ended December 31, 2014, 2015 and 2016, respectively.
Deferred Financing Costs
Direct and incremental costs related to the issuance of debt are capitalized as deferred financing costs and are reported as a reduction to notes payable on the Company’s consolidated balance sheets. The Company amortizes deferred financing costs using the effective-interest method and records such amortization as interest expense. Amortization of debt discount and annual commitment fees for unused portions of available borrowings are also recorded as interest expense.
Property and Equipment
Property and equipment, including leasehold improvements and assets acquired through capital leases, are recorded at cost, net of accumulated depreciation and amortization. Depreciation and amortization of property and equipment are determined using the straight-line method over the estimated useful lives of the assets, as follows:
Computer hardware | 3 – 5 years | ||
Equipment | 5 years | ||
Furniture and fixtures | 5 – 7 years | ||
Leasehold improvements | Lesser of related lease term or useful life | ||
Building | 30 years | ||
Amortization expense of assets acquired through capital leases is included in depreciation and amortization expense in the consolidated statements of operations. Replacements and major improvements are capitalized; maintenance and repairs are charged to expense as incurred. Impairments of long-lived assets are determined in accordance with the Property, Plant and Equipment Topic of the FASB ASC.
The Company capitalizes software development and acquisition costs in accordance with the Intangibles — Goodwill and Other, Internal-Use Software Topic of the FASB ASC, which requires the capitalization of costs incurred in connection with developing or obtaining software for internal use. Costs incurred to develop the internal-use software are capitalized, while costs incurred for planning the project and for post-implementation training and maintenance are expensed as incurred. The capitalized costs of purchased technology and software development are amortized using the straight-line method over an estimated useful life of three to five years. During the years ended December 31, 2015 and 2016, the Company capitalized costs related to internal use software of $21.3 million and $27.4 million, respectively. Amortization expense related to internal use software for the years ended December 31, 2014, 2015 and 2016 was $29.4 million, $25.3 million and $25.2 million, respectively, and is included in depreciation and amortization expense in the consolidated statements of operations.
Segment Reporting
Operating segments are components of an enterprise about which discrete financial information is available that is evaluated regularly by the chief operating decision maker (CODM) in deciding how to allocate resources and in assessing performance. As of December 31, 2015 and 2016, the Company’s organizational structure and internal financial reporting was aligned by functional area to reflect the manner in which the CODM allocates resources and assesses performance. This alignment by functional area resulted in a single operating segment and single reporting unit.
Goodwill
Goodwill represents the excess of the purchase price over the fair value of assets acquired, as well as other identifiable intangible assets. In accordance with the Intangibles — Goodwill and Other Topic of the FASB ASC, goodwill and indefinite-lived intangible assets are not amortized, but are reviewed for impairment at least annually and upon the occurrence of events or changes in circumstances that would reduce the fair value of such assets below their carrying amount. For the purposes of the Company’s annual impairment tests completed on October 1, 2015 and October 1, 2016, the Company identified and assigned goodwill to one reporting unit (see Note 4).
54
Goodwill is tested for impairment at the reporting unit level using a two-step approach. The first step is to compare the fair value of a reporting unit’s net assets, including assigned goodwill, to the book value of its net assets, including assigned goodwill. For the Company’s impairment analysis completed as of October 1, 2015 and October 1, 2016, the fair value of the single reporting unit was based upon the Company’s enterprise value, which was substantially in excess of the carrying value. If the fair value of the reporting unit is greater than its net book value, the assigned goodwill is not considered impaired. If the fair value is less than the reporting unit’s net book value, the Company performs a second step to measure the amount of the impairment, if any. The second step is to compare the book value of the reporting unit’s assigned goodwill to the implied fair value of the reporting unit’s goodwill, using a theoretical purchase price allocation. If the carrying value of goodwill exceeds the implied fair value, an impairment has occurred and the Company is required to record a write-down of the carrying value and charge the impairment as an operating expense in the period the determination is made. There were no goodwill impairment charges recognized during the years ended December 31, 2014, 2015 and 2016.
Identifiable Intangible Assets
Identifiable intangible assets are amortized over their respective estimated useful lives using a method of amortization that reflects the pattern in which the economic benefits of the intangible assets are consumed or otherwise used and are periodically reviewed for impairment. There were no intangible asset impairment charges recognized during the years ended December 31, 2014 and 2015. During the year ended December 31, 2016, the Company recorded an intangible asset impairment charge of $11.1 million (see “Impairment of Long-Lived Assets” below).
The Company’s identifiable intangible assets are amortized as follows:
Years | Method | |||
Acquired technologies | 3 – 8 | Straight-line | ||
Client lists and relationships | 3 – 13 | Straight-line | ||
Trade names and trademarks | 3 | Straight-line | ||
Non-compete agreement | 3 | Straight-line | ||
Amortization expense related to identifiable intangible assets is included in depreciation and amortization expense in the consolidated statements of operations.
Impairment of Long-Lived Assets
In accordance with Property, Plant and Equipment Topic of the FASB ASC, the Company reviews long-lived assets and certain identifiable intangible assets for impairment whenever events or changes in circumstances indicate the carrying amount of an asset may not be recoverable. The Company measures recoverability of assets to be held and used by comparing the carrying amount of the assets to future undiscounted net cash flows expected to be generated by the assets. Recoverability measurement and estimating undiscounted cash flows is performed at the lowest possible level for which there are identifiable cash flows. If the carrying amount of the assets exceeds the future undiscounted cash flows expected to be generated by those assets, such assets fail the recoverability test and an impairment charge would be recognized, measured as the amount by which the carrying amount of the assets exceeds the fair value. Assets to be disposed of are recorded at the lower of the carrying amount or fair value less costs to sell.
During the year ended December 31, 2016, the Company determined that it would discontinue the use of certain technology acquired from Aggregate Knowledge, Inc. (AKI). The Company performed an impairment analysis and concluded that the carrying amount of the AKI asset group exceeded the estimated future undiscounted cash flows of the AKI asset group. The Company performed a recoverability test using the cost replacement method, determined that the fair value of these long-lived assets was less than the carrying value, and recorded a total impairment charge of $11.1 million, consisting of charges of $10.1 million to write down the carrying value of acquired technology and $1.0 million to write down the carrying value of customer lists and relationships (see Note 4). This $11.1 million impairment charge is included in depreciation and amortization expense in the consolidated statement of operations.
Revenue Recognition
The Company recognizes revenue when the price is fixed or determinable, persuasive evidence of an arrangement exists, services have been performed, and collectability is reasonably assured. The Company assesses whether the price is fixed or determinable based on the contractual payment terms and whether the sales is price is subject to refund or adjustment.
55
For revenue arrangements that consist of monthly recurring fees for an established amount of transactions, the Company recognizes the monthly fee as services are provided. For transactions in excess of the established amount of transactions, the Company recognizes revenue on a per-transaction basis.
Revenue derived from the real-time and batch delivery of data for marketing analytics is recorded upon delivery of such data to the client. Revenue associated with engagements requiring periodic updates of data over the course of the service period, where cash is received or collectible in advance, are recorded as deferred revenue, and recognized on a straight-line basis over the service period, which is usually twelve months.
For revenue arrangements with separate deliverables, the consideration is allocated based on the relative selling price for each deliverable. The selling price for each contract deliverable can be established based on vendor specific objective evidence (VSOE) or if VSOE is not available, third-party evidence (TPE) is used. An estimate of selling price (ESP) is used if neither VSOE nor TPE is available. VSOE, when determinable, is established based on the Company’s pricing for the specific service sold separately. In determining whether VSOE exists, the Company utilizes a bell-shape curve approach. This approach drives the requirement for a substantial majority of actual selling prices for a service to fall within a narrow range of the median pricing.
Client set-up and implementation fees are not considered separate deliverables. These fees are deferred and recognized on a straight-line basis over the term of the contract, ranging from one to three years. The Company also receives annual technology fees from certain clients in exchange for access to intellectual property, standard technical support, emergency 24-hour support, and system upgrades on a when-and-if-available basis. These technology fees are not considered separate deliverables. As a result, technology fees are deferred and recognized on a straight-line basis over the service period, which is usually twelve months.
Under its seven contracts with the NAPM, the Company provides number portability administration center services. As discussed below under the heading “Revenue Recognition - Significant Contracts,” the Company determined the fixed and determinable fee on an annual basis and recognized such fee on a straight-line basis over twelve months.
The Company also generates revenue from its telephone number administration services under two government contracts: North American Numbering Plan Administrator (NANPA) and National Pooling Administrator (NPA). Under its NANPA contract, the Company earns a fixed annual fee and recognizes this fee as revenue on a straight-line basis as services are provided. Under its NPA contract, the Company earns a fixed fee associated with administration of the pooling system. The Company recognizes revenue for this contract on a straight-line basis over the term of the contract.
Professional Services
The Company’s professional services revenue is comprised of fees for consulting services that support a client’s pre- and post- implementation activities, including plan and design, optimization, support and training services. Consulting services may be provided on a stand-alone basis or bundled within a multiple element arrangement. For consulting services provided on a stand-alone basis, revenue is recognized as services are performed. For consulting services bundled within a multiple element arrangement, the services are evaluated for separability by determining if they have stand-alone value to the client. The selling price for the consulting services is established using the VSOE, TPE, ESP hierarchy. For consulting services with no stand-alone value, the contract fee allocated to the consulting services is combined with the consideration from the undelivered elements in the arrangement and recognized as revenue when all other revenue recognition criteria have been met.
Significant Contracts
The Company provides number portability administration center (NPAC) services (NPAC Services), which include wireline and wireless number portability, implementation of the allocation of pooled blocks of telephone numbers and network management services in the United States pursuant to seven contracts with the NAPM, an industry group that represents all telecommunications service providers in the United States. The aggregate fees for transactions processed under these contracts are determined by an annual fixed-fee pricing model under which the annual fixed fee (Base Fee) was set at $465.8 million, $496.1 million and $496.1 million in 2014, 2015 and 2016, respectively. In the event that the volume of transactions in a given year is above or below the contractually established volume range for that year, the Base Fee may be adjusted up or down, respectively, with any such adjustment being applied against invoices in the following year. The Company determines the fixed and determinable fee under these contracts on an annual basis at the beginning of each year and recognizes this fee on a straight-line basis over twelve months.
The total amount of revenue derived under the Company’s contracts with the NAPM, which is comprised of fees for NPAC Services, transition services, connection service fees related to the Company’s NPAC Services and fees for system
56
enhancements, was approximately $474.8 million, $507.1 million and $512.3 million for the years ended December 31, 2014, 2015 and 2016, respectively.
Fees under the Company’s contracts with the NAPM are billed to telecommunications service providers based on their allocable share of the total transaction charges. This allocable share is based on each respective telecommunications service provider’s share of the aggregate end-user services revenue of all U.S. telecommunications service providers, as determined by the Federal Communications Commission. The Company also bills an RRC fee equal to a percentage of monthly billings to its clients, which is available to the Company if any client under the contracts to provide NPAC Services fails to pay its allocable share of total transactions charges.
On April 7, 2015, the Company amended its seven regional contracts with the NAPM. Under the amendment contracts, the Company will provide Local Number Portability Administrator (LNPA) services for an annual fixed fee of $496.1 million until the termination of these contracts. On July 1, 2016, the Company received a notice of non-renewal from the NAPM informing the Company of its election not to renew the master agreements that were due to expire on September 30, 2016. On September 29, 2016, the NAPM provided notice to extend the term of these master contracts and opted not to license the source code that the Company uses to provide services to the NAPM. The Company will continue to provide services and transition services at the pricing terms under the current contracts until the NAPM provides at least one termination notice to the Company, which must establish a termination date that is 180 days after the date of notice.
Loss of the NPAC contracts will have a material adverse impact on the Company’s future operating results when compared to its current financial profile. The Company expects to lose approximately $500 million of annual revenue and this loss will adversely impact its income from operations and operating margin. Additionally, this loss may have a disproportionate material negative impact on the Company’s operating margin because of the largely fixed and shared cost structure that is designed to support all of the Company’s services.
Service Level Standards
Some of the Company’s private commercial contracts require the Company to meet service level standards and impose corresponding penalties on the Company if the Company fails to meet those standards. The Company records a provision for these performance-related penalties in the period in which it becomes aware that it has failed to meet required service levels, triggering the requirement to pay a penalty, which results in a corresponding reduction to revenue.
Cost of Revenue and Deferred Costs
Cost of revenue includes all direct materials costs, direct labor costs, and indirect costs related to the generation of revenue such as indirect labor, outsourced services, materials and supplies, payment processing fees, and general facilities cost. The Company’s primary cost of revenue is personnel costs associated with service implementation, product maintenance, client deployment and client care, including salaries, stock-based compensation and other personnel-related expense. In addition, cost of revenue includes costs relating to developing modifications and enhancements of the Company’s existing technology and services, as well as royalties paid to third parties and registry gateway services. Cost of revenue also includes costs relating to the Company’s information technology and systems department, including network costs, data center maintenance, database management, data processing costs and general facilities costs.
Deferred costs represent direct labor related to professional services incurred for the setup and implementation of contracts. These costs are recognized in cost of revenue on a straight-line basis over the contract term. Deferred costs also include royalties paid related to third parties and registry gateway services, which are recognized in cost of revenue on a straight-line basis over the contract term. Deferred costs are classified as such on the consolidated balance sheets.
Research and Development
The Company expenses its research and development costs as they are incurred. Research and development expense consists primarily of personnel costs, including salaries, stock-based compensation and other personnel-related expense, consulting fees, and the costs of facilities and computer and support services used in service and technology development.
Separation Costs
In the second quarter of 2016, the Company announced a plan to separate into two independent and publicly traded companies. Separation costs were expensed as incurred and included professional fees for outside advisory services including legal, finance, accounting and related services.
57
Advertising
The Company expenses advertising costs as they are incurred. Advertising expense was approximately $17.8 million, $15.9 million and $4.8 million for the years ended December 31, 2014, 2015 and 2016, respectively.
Stock-Based Compensation
The Company accounts for its stock-based compensation plans under the recognition and measurement provisions of the Compensation — Stock Compensation Topic of the FASB ASC. The Company estimates the value of stock option awards and awards under the Company’s employee stock purchase plan using the Black-Scholes option-pricing model. The fair value of restricted stock units is measured by reference to the closing market price of the Company’s common stock price on the date of grant. For stock-based awards subject to graded vesting, the Company has utilized the “straight-line” method for allocating compensation cost by period. The Company presents benefits of tax deductions in excess of the compensation cost recognized (excess tax benefits) as a financing cash inflow with a corresponding operating cash outflow.
Basic and Diluted Net Income per Common Share
In accordance with the Earnings Per Share Topic of the FASB ASC, unvested share-based payment awards that contain non-forfeitable rights to dividends or dividend equivalents (whether paid or unpaid) are participating securities that should be included in the computation of earnings per share under the two-class method. The Company’s restricted stock awards are considered to be participating securities because they contain non-forfeitable rights to cash dividends, if declared and paid. In lieu of presenting earnings per share pursuant to the two-class method, the Company has included shares of unvested restricted stock awards in the computation of basic net income per common share as the resulting earnings per share would be the same under both methods.
Basic net income per common share is computed by dividing net income by the weighted-average number of common shares and participating securities outstanding during the period. Unvested restricted stock units and performance vested restricted stock units (PVRSUs) are excluded from the computation of basic net income per common share because the underlying shares have not yet been earned by the stockholder and are not participating securities. Shares underlying stock options are also excluded because they are not considered outstanding shares. Diluted net income per common share assumes dilution and is computed based on the weighted-average number of common shares outstanding after consideration of the dilutive effect of stock options, unvested restricted stock units and PVRSUs. The effect of dilutive securities is computed using the treasury stock method and average market prices during the period. Dilutive securities with performance conditions are excluded from the computation until the performance conditions are met.
Income Taxes
The Company accounts for income taxes in accordance with the Income Taxes Topic of the FASB ASC. Deferred income tax assets and liabilities are determined based on temporary differences between the financial reporting bases and the tax bases of assets and liabilities. Deferred income tax assets are also recognized for tax net operating loss carryforwards. These deferred income tax assets and liabilities are measured using the enacted tax rates and laws that will be in effect when such amounts are expected to be reversed or utilized. Valuation allowances are provided to reduce such deferred income tax assets to amounts more likely than not to be ultimately realized.
The income tax provision includes U.S. federal, state, local and foreign income taxes and is based on pre-tax income or loss. In determining the annual effective income tax rate, the Company analyzes various factors, including the Company’s annual earnings and taxing jurisdictions in which the earnings will be generated, the impact of state and local income taxes and the ability of the Company to use tax credits and net operating loss carryforwards.
The Company assesses uncertain tax positions in accordance with income tax accounting standards. Under these standards, income tax benefits should be recognized when, based on the technical merits of a tax position, the Company believes that if a dispute arose with the taxing authority and were taken to a court of last resort, it is more likely than not (i.e., a probability of greater than 50 percent) that the tax position would be sustained as filed. If a position is determined to be more likely than not of being sustained, the reporting enterprise should recognize the largest amount of tax benefit that is greater than 50 percent likely of being realized upon ultimate settlement with the taxing authority. The Company’s practice is to recognize interest and penalties related to income tax matters in income tax expense.
58
Foreign Currency
Assets and liabilities of consolidated foreign subsidiaries, whose functional currency is the local currency, are translated to U.S. dollars at fiscal year-end exchange rates. Revenue and expense items are translated to U.S. dollars at the average rates of exchange prevailing during the fiscal year. The adjustment resulting from translating the financial statements of such foreign subsidiaries to U.S. dollars is reflected as a foreign currency translation adjustment and reported as a component of accumulated other comprehensive loss.
Transactions denominated in currencies other than the functional currency are recorded based on exchange rates at the time such transactions arise. Subsequent changes in exchange rates result in transaction gains or losses, which are reflected within interest and other expense in the consolidated statements of operations.
Comprehensive Income
Comprehensive income is comprised of net earnings and other comprehensive income (loss), which includes certain changes in equity that are excluded from income. The Company includes unrealized holding gains and losses on available-for-sale securities, if any, and foreign currency translation adjustments in other comprehensive income (loss) in the consolidated statements of comprehensive income. Comprehensive income was approximately $162.8 million, $175.2 million and $168.8 million for the years ended December 31, 2014, 2015 and 2016, respectively.
Recent Accounting Pronouncements - Adopted
In August 2014, the FASB issued ASU 2014-15, Presentation of Financial Statements - Going Concern (Subtopic 205-40), which requires an entity's management to evaluate the entity's ability to continue as a going concern within one year after the date that the financial statements are issued. The guidance is effective for annual periods ending after December 15, 2016 and interim periods within annual periods beginning after December 15, 2016. The Company adopted ASU 2014-15 for the year ending December 31, 2016. The Company's adoption of this ASU did not impact its consolidated financial statements.
In April 2015, the FASB issued ASU 2015-03, Simplifying the Presentation of Debt Issuance Costs. ASU 2015-03 requires debt issuance costs related to a recognized debt liability to be presented in the balance sheet as a direct deduction from the carrying value of that debt liability, consistent with debt discounts. The guidance is effective retrospectively for fiscal years, and interim periods within those years, beginning after December 15, 2015. Adoption prior to that date is permitted for financial statements that have not been previously issued. The Company adopted ASU 2015-03 in the fourth quarter of 2015. The Company’s adoption of ASU 2015-03 resulted in a balance sheet reclassification to present deferred financing costs of $18.8 million as a deduction from the carrying value of the debt as of December 31, 2014 (see Note 7).
In September 2015, the FASB issued ASU 2015-16, Simplifying the Accounting for Measurement-Period Adjustments (Topic 805): Business Combinations, which requires that an acquirer recognize adjustments to provisional amounts that are identified during the measurement period in the reporting period in which the adjustment amounts are determined. The standard is effective for fiscal years beginning after December 15, 2015, including interim periods within those fiscal years. The guidance is to be applied prospectively to adjustments to provisional amounts that occur after the effective date of the standard, with earlier application permitted for financial statements that have not been issued. The Company’s adoption of this ASU did not impact its consolidated financial statements.
In November 2015, the FASB issued ASU No. 2015-17, Balance Sheet Classification of Deferred Taxes. ASU 2015-17 requires deferred tax liabilities and assets to be classified as noncurrent in the consolidated balance sheet. The standard is effective for financial statements issued for annual periods beginning after December 15, 2016, and interim periods within those annual periods. Early adoption is permitted for financial statements that have not been previously issued. The ASU may be applied either prospectively to all deferred tax liabilities and assets or retrospectively to all periods presented. The Company adopted ASU 2015-17 on a prospective basis in the fourth quarter of 2015. Prior periods were not retrospectively adjusted.
Recent Accounting Pronouncements - Not Yet Effective
In May 2014, the FASB issued ASU 2014-09, Revenue from Contracts with Customers (Topic 606). Under this standard, revenue is recognized when promised goods or services are transferred to customers in an amount that reflects the consideration to which a company expects to be entitled in exchange for those goods or services. On July 9, 2015, the FASB deferred the effective dates of the standard by one year. As a result, the standard will be effective for annual and interim periods beginning after December 15, 2017. Companies may adopt the standard as early as the original effective date (i.e. annual reporting periods beginning after December 15, 2016). Early adoption prior to that date is not permitted. The standard allows for either
59
full retrospective adoption, meaning the standard is applied to all of the periods presented, or a modified retrospective adoption, meaning the standard is applied only to the most current period presented.
In preparation for the adoption of the new accounting standard on January 1, 2018, the Company reviewed a representative sample of its client contracts and is evaluating the provisions contained therein in light of the five-step model specified by the new guidance. That five-step model includes: (1) determination of whether a contract exists; (2) identification of the performance obligations in the contract; (3) determination of the transaction price; (4) allocation of the transaction price to the performance obligations in the contract; and (5) recognition of revenue when (or as) the performance obligation is satisfied. The Company is also evaluating the impact of the new standard on its current practices, such as accounting for sales commissions. Under this new guidance, sales commission expenditures will be recorded as an asset and recognized as an operating expense over the period that the Company expects to recover the costs. Currently, the Company expenses sales commissions as incurred. The Company has not yet quantified the potential impact of this or other potential impacts of the new guidance. The Company is also continuing to evaluate the approach that it will use when transitioning to this new guidance.
In February 2016, the FASB issued ASU 2016-02, Leases. ASU 2016-02 requires that long-term lease arrangements be recognized on the balance sheet. The standard is effective for interim and annual periods beginning after December 31, 2018, and early adoption is permitted. The Company is currently evaluating the impact of adoption on its consolidated financial statements.
In March 2016, the FASB issued ASU No. 2016-09, Compensation-Stock Compensation (Topic 718). This standard makes several modifications to Topic 718 related to the accounting for forfeitures, employer tax withholding on share-based compensation and the financial statement presentation of excess tax benefits or deficiencies. ASU 2016-09 also clarifies the statement of cash flows presentation for certain components of share-based awards. The standard is effective for interim and annual reporting periods beginning after December 15, 2016, although early adoption is permitted. The Company currently intends to adopt this standard on January 1, 2017 and is currently evaluating the impact of the adoption of this ASU on its consolidated financial statements.
In August 2016, the FASB issued ASU No. 2016-15, Statement of Cash Flows (Topic 230): Classification of Certain Cash Receipts and Cash Payments. This standard clarifies how certain cash receipts and cash payments should be classified on the statement of cash flows. The standard is effective for interim and annual reporting periods beginning after December 15, 2017, although early adoption is permitted. The Company currently intends to adopt this standard on January 1, 2018 and is currently evaluating the impact of adoption on its consolidated financial statements.
In February 2017, the FASB issued ASU No. 2017-04, Intangibles - Goodwill and Other (Topic 350): Simplifying the Test for Goodwill Impairment. This standard simplifies the accounting for goodwill impairment by requiring impairment charges to be based on the first step in the current two-step impairment test under Accounting Standards Codification 350. The standard will be applied prospectively and is effective for annual and interim impairment tests performed in periods beginning after December 15, 2019. Early adoption is permitted for annual and interim goodwill impairment testing dates after January 1, 2017. The Company does not expect the adoption of this ASU to have a material impact on its consolidated financial statements.
3. ACQUISITIONS
The application of the acquisition method of accounting for business combinations requires management to make significant estimates and assumptions in the determination of the fair value of the assets acquired and liabilities assumed in order to properly allocate purchase price consideration. These assumptions and estimates include a market participant’s expected use of the asset and the appropriate discount rates from a market participant’s perspective. The Company’s estimates are based on historical experience and information obtained from the management of the acquired company and are determined with assistance from an independent third-party. The Company’s significant assumptions and estimates made in connection with the application of the acquisition method of accounting for business combinations include the cash flows that an acquired asset is expected to generate in the future, the weighted-average cost of capital, long-term projected revenue and growth rates and estimated replacement costs of assets.
.CO Internet Acquisition
On April 14, 2014, the Company acquired .CO Internet S.A.S (.CO Internet) and certain associated assets. .CO Internet is the exclusive operator of the worldwide registry for Internet addresses with the “.co” top-level domain. This acquisition expanded the Company’s registry services, which includes the .biz and .us top-level domains. Total consideration for this purchase, which was subject to certain customary working capital adjustments, included cash consideration of $113.7 million, of which $86.7 million was paid at closing and $27.0 million was deposited into escrow for the satisfaction of potential
60
indemnification claims and certain performance obligations. In addition, the Company may be required to make a contingent payment of up to $6.0 million prior to or during the first quarter of 2020 in the event that the sellers satisfy certain post-closing performance obligations. The transaction was accounted for under the acquisition method of accounting in accordance with Business Combination Topic of the FASB ASC.
Of the total preliminary purchase price of $114.8 million, which reflected initial estimates of .CO Internet’s closing date working capital, the Company recorded $85.1 million of definite-lived intangible assets and $36.3 million of goodwill. During 2014, the Company adjusted the amounts recorded as preliminary purchase price and goodwill based upon the finalization of the acquired company’s working capital as of the closing. As of December 31, 2015, the final purchase price was $118.1 million and the adjusted goodwill balance was $39.6 million. The goodwill is expected to be deductible for tax purposes. During 2014, the Company recorded $2.1 million of acquisition costs in general and administrative expense related to this transaction.
Goodwill represents the excess of the .CO Internet purchase price over the estimated fair value of the net assets acquired. The opportunity to gain .CO Internet’s innovative domain marketing capabilities and to expand the Company’s registry services, among other factors, were the reasons for the establishment of the purchase price, resulting in the recognition of goodwill.
Bombora Acquisition
On July 30, 2015, the Company acquired Bombora Technologies Pty Ltd (Bombora). Bombora is the registry services provider for the “.au” top-level domain and many other top-level domains. This acquisition expanded the Company’s registry services, which includes the .biz, .us and .co top-level domains. Total consideration for this purchase, which was subject to certain customary working capital adjustments, included cash consideration of $87.4 million, of which $55.5 million was paid to the sellers at closing and $31.9 million was deposited into escrow pending the satisfaction of certain performance obligations. The transaction was accounted for under the acquisition method of accounting in accordance with the Business Combination Topic of the FASB ASC.
The total preliminary purchase price was $91.8 million, consisting of cash consideration of $87.4 million and contingent consideration of $4.4 million, which is the estimated fair value of such consideration as of the acquisition date. During 2015, the Company adjusted the amounts recorded as preliminary purchase price and goodwill based upon the finalization of the acquired company’s working capital and the valuation of certain acquired deferred income tax assets as of closing. As of December 31, 2015, the adjusted preliminary purchase price was $87.7 million. During 2016, the Company completed the allocation of the purchase price, which did not result in any material changes to either the purchase price or the preliminary valuation of acquired assets and assumed liabilities. Pro forma financial information for this acquisition has not been presented because the financial impact is not material.
Of the total purchase price of $87.7 million, the Company recorded $44.9 million of definite-lived intangible assets, $65.7 million of goodwill, and $22.9 million of net liabilities. The definite-lived intangible assets consist of $37.8 million of client relationships and $7.1 million of acquired technology. The Company is amortizing client relationships on a straight-line basis over an estimated useful life of 5 to 13 years. Acquired technology is being amortized on a straight-line basis over an estimated useful life of 3 to 5 years. The goodwill is not expected to be deductible for tax purposes. During the year ended December 31, 2015, the Company recorded $2.0 million of acquisition costs in general and administrative expense related to this transaction.
Goodwill represents the excess of the Bombora preliminary purchase price over the estimated fair value of the net assets acquired. This acquisition further positions the Company as a leader in launching and operating top-level-domains. The opportunity to expand the Company’s registry services, among other factors, were the reasons for the establishment of the purchase price, resulting in the recognition of goodwill.
MarketShare Acquisition
On December 9, 2015, the Company completed its acquisition of MarketShare Partners, LLC (MarketShare), a marketing analytics technology provider to major brands. The acquisition of MarketShare expanded the Company’s marketing services by creating a complete data-driven solution for Chief Marking Officers (CMOs) as they plan, optimize and allocate their entire marketing budget and resources across all channels. The combination of the Company’s leadership in authoritative identity, audience targeting and segmentation as well as real-time media measurement, together with MarketShare’s expertise in predictive analytics, enables the Company to provide a single solution that solves CMOs’ critical resource allocation challenges. CMOs are able to look across their entire business, from campaign planning to execution, online to offline, to get a
61
complete, accurate reading of what is driving their sales and effectively allocate their resources across all sales channels as well as media platforms.
The transaction was accounted for under the acquisition method of accounting in accordance with the Business Combination Topic of the FASB ASC. The total preliminary purchase price was $442.4 million, consisting of cash consideration of $429.1 million and non-cash consideration of $13.3 million paid in shares of NeuStar Class A Common Stock, which shares are subject to certain transfer restrictions. During the year ended December 31, 2016, the Company recorded working capital and escrow adjustments of $1.3 million, reducing the final purchase price to $441.1 million. In addition, the Company adjusted the preliminary valuation of acquired assets and assumed liabilities based upon new information that was received pertaining to acquisition date fair values. During the year ended December 31, 2016, the company adjusted the preliminary valuation of the deferred tax asset balance by $16.0 million, the accounts payable and accrued expenses balance by $1.1 million, and the accounts receivable balance by $0.3 million.
Of the total cash consideration, $53.7 million was deposited in escrow, of which $45.0 million will be available to satisfy indemnification claims (Indemnity Escrow) and $5.8 million was available to holders of unvested MarketShare equity awards in the event such holders’ employment is terminated without cause within the first six months following December 9, 2015 (Equity Escrow). An additional $2.5 million and $0.4 million of the purchase consideration was deposited into separate escrow accounts and will be available to fund purchase price adjustments required under the purchase agreement and to reimburse certain costs and expenses of the stockholder representative, respectively. As of December 31, 2016, $42.7 million remained in escrow. During the year ended December 31, 2015, the Company recorded $8.7 million of acquisition costs in general and administrative expense related to this acquisition.
Under the acquisition method of accounting, the total preliminary purchase price was allocated to MarketShare’s net tangible and intangible assets acquired and assumed liabilities based on their estimated fair values as of December 9, 2015. The following table summarizes the final purchase price allocation based on the estimated fair value of the acquired assets and assumed liabilities and reflects the measurement period adjustments recorded during the year ended December 31, 2016 (in thousands):
Cash and cash equivalents | $ | 7,504 | |
Accounts receivable | 8,954 | ||
Prepaids and other assets | 6,344 | ||
Accounts payable and accrued expenses | (9,414 | ) | |
Deferred revenue | (2,062 | ) | |
Deferred tax asset | 5,133 | ||
Net tangible assets acquired | 16,459 | ||
Client relationships | 30,000 | ||
Acquired identified technology | 100,000 | ||
Goodwill | 294,627 | ||
Total purchase price allocation | $ | 441,086 | |
The Company allocated $130.0 million of the total purchase price to definite-lived intangible assets acquired, consisting of client relationships and acquired technology. Client relationships represent agreements with existing MarketShare customers. The Company utilized a replacement cost and lost profits methodology to estimate the fair value the client relationships. Under this method, the Company’s significant assumptions and estimates included costs associated with recreating the client relationship, and the revenue projected to be lost while the client relationships are recreated. The value of client relationships is being amortized on a straight-line basis over the estimated useful life of 10 years.
Acquired technology represents technology that had reached technological feasibility and for which development has been completed as of the date of the acquisition. The Company utilized the excess earnings methodology, a variation of the income approach, to estimate the fair value of the acquired technology. Under this method, the Company’s significant assumptions and estimates included projected revenue, an obsolescence factor, contributory asset charge, discount rate and tax amortization benefit. The value of the acquired technology is being amortized on a straight-line basis over the estimated useful life of 8 years.
Goodwill represents the excess of the MarketShare purchase price over the estimated fair value of the net assets acquired.
62
With this acquisition, the Company has the ability to provide CMOs a comprehensive suite of services to plan their media spend, identify and locate desired customers, invest in the right marketing campaigns, deliver relevant offers and measure the performance of these activities. The opportunity to offer this comprehensive suite of services, among other factors, were the reasons for the establishment of the purchase price, resulting in the recognition of a significant amount of goodwill. As of December 31, 2016, of the total goodwill balance of $294.6 million, approximately $203.0 million is expected to be deductible for tax purposes.
The total purchase price included non-cash consideration of $13.3 million in shares of NeuStar Class A Common Stock. The fair value of the NeuStar Class A Common Stock was determined using Neustar’s closing stock price of $23.31 as reported on the New York Stock Exchange on December 9, 2015, the date of the acquisition.
Pro Forma Financial Information for the MarketShare Acquisition
The following unaudited pro forma financial information summarizes the Company’s results of operations for the period indicated as if the Company’s acquisition of MarketShare had been completed as of the beginning of the earliest period presented. These pro forma amounts (unaudited and in thousands) are not indicative of the results that would have actually been obtained if the acquisition occurred as of the beginning of the periods presented and should not be construed as representative of the future consolidated results of operations or financial condition of the combined entity. The pro forma financial information for all periods presented also includes the effect of the related 2015 acquisition financing, amortization expense from the acquired intangible assets, adjustments to interest expense and related tax effects.
Year Ended December 31, | |||||||
2014 | 2015 | ||||||
Pro forma revenue | $ | 1,010,647 | $ | 1,101,391 | |||
Pro forma income from operations | $ | 227,435 | $ | 262,512 | |||
Pro forma net income | $ | 115,287 | $ | 124,145 | |||
Caller Authentication Assets Acquisition
On December 18, 2015, the Company acquired caller authentication assets from Transaction Network Services, Inc. for approximately $220.0 million in cash. The acquisition of these assets accelerates the Company’s ability to launch next generation mobile identity solutions for service providers, businesses and consumers. These mobile identity solutions include subscriber data storage and management, caller authentication and verification services. Total consideration for this purchase, which was subject to certain customary working capital adjustments, included cash consideration of $220.0 million, of which $22.0 million was deposited into escrow to satisfy post-closing indemnification claims. The transaction was accounted for under the acquisition method of accounting in accordance with the Business Combination Topic of the FASB ASC.
Of the total preliminary purchase price of $220.0 million, the Company recorded $111.9 million of definite-lived intangible assets, $108.0 million of goodwill and $0.1 million of net assets. During 2016, the Company completed the allocation of the purchase price, which did not result in any material changes to either the purchase price or the preliminary valuation of acquired assets and assumed liabilities.
The definite-lived intangible assets consist of $98.0 million of client relationships and $13.9 million of acquired technology. The Company is amortizing client relationships on a straight-line basis over an estimated useful life of 10 years. Acquired technology is being amortized on a straight-line basis over an estimated useful life of 5 years. The goodwill is expected to be deductible for tax purposes. During the year ended December 31, 2015, the Company recorded $1.8 million of acquisition costs in general and administrative expense related to this transaction.
Goodwill represents the excess of the preliminary purchase price of the caller authentication assets over the estimated fair value of the net assets acquired. With this acquisition, the Company has enhanced its position in the caller authentication market that includes subscriber data storage, database management, caller authentication and verification services. The opportunity to expand the Company’s caller authentication services, among other factors, were the reasons for the establishment of the purchase price, resulting in the recognition of goodwill.
63
4. GOODWILL AND INTANGIBLE ASSETS
Goodwill
The changes in the carrying amount of the Company’s goodwill for the year ended December 31, 2015 is as follows (in thousands):
December 31, 2014(1) | Acquisitions(2) | Adjustments | Disposals(3) | Foreign Currency Translation | December 31, 2015 | ||||||||||||||||||
Gross goodwill | $ | 782,871 | $ | 500,534 | $ | (1,149 | ) | $ | (1,236 | ) | $ | (435 | ) | $ | 1,280,585 | ||||||||
Accumulated impairments | (93,602 | ) | — | — | — | — | (93,602 | ) | |||||||||||||||
Net goodwill | $ | 689,269 | $ | 500,534 | $ | (1,149 | ) | $ | (1,236 | ) | $ | (435 | ) | $ | 1,186,983 | ||||||||
(1) Balance as originally reported prior to the reflection of measurement period adjustments.
(2) See Note 3 for a discussion of acquisitions.
(3) Reflects the goodwill associated with the Company’s sale of certain Data Services assets and liabilities used to deliver lawful intercept services.
The changes in the carrying amount of the Company’s goodwill for the year ended December 31, 2016 is as follows (in thousands):
December 31, 2015 | Adjustments(1) | Foreign Currency Translation | December 31, 2016 | ||||||||||||
Gross goodwill | $ | 1,280,585 | $ | (17,497 | ) | $ | (504 | ) | $ | 1,262,584 | |||||
Accumulated impairments | (93,602 | ) | — | — | (93,602 | ) | |||||||||
Net goodwill | $ | 1,186,983 | $ | (17,497 | ) | $ | (504 | ) | $ | 1,168,982 | |||||
(1) See Note 3 for a discussion of goodwill adjustments made during the measurement period.
The Company’s 2015 and 2016 annual goodwill impairment analysis was performed as of October 1 in each respective year and did not result in an impairment charge.
As of the date of the Company’s 2016 annual impairment test, the estimated fair value for the Company’s reporting unit was substantially in excess of the carrying value. The Company believes that the assumptions and estimates used to determine the estimated fair value of its reporting unit are reasonable; however, there are a number of factors, including factors outside of the Company’s control, such as stock price volatility, that could cause actual results to differ from the Company’s estimates. Such differences may be material. Changes in estimates and assumptions could have a significant impact on whether or not an impairment charge is recognized and also the magnitude of any such charge.
Any changes to the Company’s key assumptions about its business and its prospects, or changes in market conditions, could cause the fair value of its reporting unit to fall below its carrying value, resulting in a potential impairment charge. In addition, changes in the Company’s organizational structure or how the Company’s management allocates resources and assesses performance could result in a change of its operating segments or reporting units, requiring a reallocation and an interim impairment analysis of goodwill. A goodwill impairment charge could have a material effect on the Company’s consolidated financial statements because of the significance of goodwill to its consolidated balance sheet.
64
Intangible Assets
Intangible assets consist of the following (in thousands):
December 31, | Weighted- Average Amortization Period (in years) | ||||||||
2015 | 2016 | ||||||||
Intangible assets: | |||||||||
Client lists and relationships | $ | 578,085 | $ | 575,168 | 8.9 | ||||
Accumulated amortization | (196,806 | ) | (258,482 | ) | |||||
Client lists and relationships, net | 381,279 | 316,686 | |||||||
Acquired technology | 214,212 | 204,024 | 6.3 | ||||||
Accumulated amortization | (66,335 | ) | (96,753 | ) | |||||
Acquired technology, net | 147,877 | 107,271 | |||||||
Trade name | 8,030 | 8,011 | 3.0 | ||||||
Accumulated amortization | (7,919 | ) | (8,011 | ) | |||||
Trade name, net | 111 | — | |||||||
Non-compete agreement | 100 | 100 | 3.0 | ||||||
Accumulated amortization | (88 | ) | (100 | ) | |||||
Non-compete agreement, net | 12 | — | |||||||
Intangible assets, net | $ | 529,279 | $ | 423,957 | |||||
During the year ended December 31, 2015, the Company acquired the following intangible assets (in thousands) (see Note 3).
For the Year Ended December 31, | |||
2015 | |||
Intangible assets acquired: | |||
Client lists and relationships | $ | 171,267 | |
Acquired technology | 122,300 | ||
Total intangible assets acquired | $ | 293,567 | |
During year ended December 31, 2016, the Company performed a recoverability test of its AKI asset group and determined that the fair value of these long-lived assets was less than the carrying value. The Company recorded an impairment charge of $11.1 million, consisting of charges of $10.1 million to write down the carrying value of acquired technology and $1.0 million to write down the carrying value of customer lists and relationships. This $11.1 million impairment charge is included in depreciation and amortization expense in the consolidated statement of operations.
Amortization expense related to intangible assets, which is included in depreciation and amortization expense, was approximately $62.3 million, $66.6 million and $94.0 million for the years ended December 31, 2014, 2015 and 2016, respectively. Amortization expense related to intangible assets for the years ended December 31, 2017, 2018, 2019, 2020, 2021 and thereafter is expected to be approximately $82.2 million, $79.0 million, $72.7 million, $43.6 million, $37.0 million and $109.5 million, respectively. Intangible assets as of December 31, 2016 will be fully amortized during the year ended December 31, 2028.
65
5. PROPERTY AND EQUIPMENT
Property and equipment consists of the following (in thousands):
December 31, | |||||||
2015 | 2016 | ||||||
Computer hardware | $ | 163,087 | $ | 184,265 | |||
Equipment | 3,811 | 4,498 | |||||
Furniture and fixtures | 14,213 | 12,168 | |||||
Leasehold improvements | 68,117 | 67,714 | |||||
Construction in-progress | 4,455 | 6,283 | |||||
Capitalized software | 195,022 | 222,219 | |||||
Building | 4,072 | 4,072 | |||||
Land | 271 | 271 | |||||
453,048 | 501,490 | ||||||
Accumulated depreciation and amortization | (305,284 | ) | (355,669 | ) | |||
Property and equipment, net | $ | 147,764 | $ | 145,821 | |||
The Company entered into capital lease obligations of $0.7 million during the year ended December 31, 2015, primarily for computer hardware. During the year ended December 31, 2016, the Company did not enter into capital lease obligations. Amortization expense of assets recorded under capital leases is included in depreciation and amortization expense.
As of December 31, 2015 and 2016, unamortized capitalized software costs were $37.6 million and $40.0 million, respectively. Amortization of capitalized software costs for the years ended December 31, 2014, 2015 and 2016 was $29.4 million, $25.3 million and $25.2 million, respectively.
Depreciation and amortization expense related to property and equipment for the years ended December 31, 2014, 2015 and 2016 was $52.7 million, $56.1 million and $58.9 million, respectively.
6. ACCRUED EXPENSES
Accrued expenses consist of the following (in thousands):
December 31, | |||||||
2015 | 2016 | ||||||
Accrued compensation | $ | 84,757 | $ | 85,089 | |||
RRC reserve | 3,159 | 3,962 | |||||
Accrued interest | 7,190 | 6,105 | |||||
Other | 39,526 | 39,389 | |||||
Total | $ | 134,632 | $ | 134,545 | |||
66
7. NOTES PAYABLE
Notes payable consist of the following (in thousands):
December 31, | |||||||
2015 | 2016 | ||||||
2013 Term Facility (net of discount) | $ | 300,328 | $ | — | |||
2013 Term Facility deferred financing fees | (1,683 | ) | — | ||||
2015 Incremental Term Facility (net of discount) | 337,947 | — | |||||
2015 Incremental Term Facility deferred financing fees | (9,012 | ) | — | ||||
Amended 2013 Term Facility (net of discount) | — | 437,815 | |||||
Amended 2013 Term Facility deferred financing fees | — | (5,016 | ) | ||||
2013 Revolving Facility | 175,000 | — | |||||
2013 Revolving deferred financing fees | (2,162 | ) | — | ||||
Amended 2013 Revolving Facility | — | 85,000 | |||||
Amended 2013 Revolving Facility deferred financing fees | — | (916 | ) | ||||
Senior Notes | 300,000 | 300,000 | |||||
Senior Notes deferred financing fees | (11,637 | ) | (10,212 | ) | |||
Total | 1,088,781 | 806,671 | |||||
Less: current portion, net of discount | (131,272 | ) | (103,725 | ) | |||
Long-term portion | $ | 957,509 | $ | 702,946 | |||
Credit Facilities and Senior Notes
On January 22, 2013, the Company entered into a credit facility that provided for a $325 million senior secured term loan facility (2013 Term Facility) and a $200 million senior secured revolving credit facility (2013 Revolving Facility, and together with the 2013 Term Facility, the 2013 Credit Facilities). In addition, the Company closed an offering of $300 million aggregate principal amount of senior notes (Senior Notes).
On December 9, 2015, the Company amended its 2013 Credit Facilities to provide for (i) the permissibility of an incremental term facility, (ii) the addition of a senior secured leverage financial maintenance covenant; (iii) streamlined conditions for the incurrence of an incremental term facility to be used for a permitted acquisition; (iv) a required escrow and prepayment (such prepayment to be for the benefit of the incremental facility lenders) by the Company under certain specified circumstances; and (v) certain tax related changes favorable to the Company to the terms of the Credit Agreement and related security agreement.
On December 9, 2015, the Company borrowed $350 million under the incremental term facility (the 2015 Incremental Term Facility). The proceeds of the 2015 Incremental Term Facility were used to consummate the acquisition of MarketShare and to pay related fees and expenses.
On September 28, 2016, the Company entered into the third amendment to the 2013 Credit Facilities to (i) extend the maturity date of the 2013 Revolving Facility (the Amended 2013 Revolving Facility) to January 22, 2019, (ii) consolidate the remaining principal balance outstanding under the 2013 Term Facility and the 2015 Incremental Term Facility into a single term loan facility of $499 million and extend the maturity date of the consolidated term loans to January 22, 2019 (the Amended 2013 Term Facility, and together with the Amended 2013 Revolving Facility, the Amended 2013 Credit Facilities) and provide a maturity date of January 22, 2019, (iii) set the annual amortization percentage of the Amended 2013 Term Facility at 22% through December 31, 2017 and 10% thereafter and (iv) lower the Eurodollar rate margin and base rate margin for the Amended 2013 Term Facility to (a) if the Consolidated Leverage Ratio (as defined in the Credit Agreement) is less than 2 to 1 after March 1, 2017, 3% and 2%, respectively, and (b) if the Consolidated Leverage Ratio is 2 to 1 or greater, 3.25% and 2.25%, respectively.
The Company may voluntarily prepay the borrowings under the Amended 2013 Credit Facilities at any time in minimum amounts of $1 million or an integral multiple of $500,000 in excess thereof. The Amended 2013 Credit Facilities provide for mandatory prepayments with the net cash proceeds of certain debt issuances, insurance receipts, and dispositions. The Amended 2013 Credit Facilities also contain certain events of default, upon the occurrence of which, and so long as such event
67
of default is continuing, the amounts outstanding may, at the option of the required lenders, accrue interest at an increased rate and payments of such outstanding amounts could be accelerated, or other remedies undertaken.
As of December 31, 2016, outstanding borrowings under the Amended 2013 Revolving Facility were $85.0 million and available borrowings under the same facility were $97.0 million, exclusive of outstanding letters of credit totaling $18.0 million.
Senior Notes
On January 22, 2013, the Company closed an offering of $300 million aggregate principal amount of 4.50% senior notes due 2023. The Senior Notes are the general unsecured senior obligations of the Company and are guaranteed on a senior unsecured basis by certain of its domestic subsidiaries, or the Subsidiary Guarantors. Interest is payable on the Senior Notes semi-annually in arrears at an annual rate of 4.50%, on January 15 and July 15 of each year, beginning on July 15, 2013. If the Company experiences certain changes of control together with a ratings downgrade, it will be required to offer to purchase all of the Senior Notes then outstanding at a purchase price equal to 101.00% of the principal amount thereof, plus accrued and unpaid interest, if any, to the date of purchase. If the Company sells certain assets and does not repay certain debt or reinvest the proceeds of such sales within certain time periods, it will be required to offer to repurchase the Senior Notes with such proceeds at 100.00% of their principal amount, plus accrued and unpaid interest, if any, to the date of purchase.
The Senior Notes contain customary events of default, including among other things, payment default, failure to provide certain notices and defaults related to bankruptcy events. The Senior Notes also contain customary negative covenants.
Future Principal Payments
Future principal payments under the Amended 2013 Credit Facilities and the Senior Notes as of December 31, 2016, are as follows (in thousands):
2017 | $ | 109,757 | |
2018 | 49,889 | ||
2019 | 369,369 | ||
2020 | — | ||
2021 | — | ||
Thereafter | 300,000 | ||
Total future principal payments | $ | 829,015 | |
Debt Refinancing Costs
On December 9, 2015, the Company amended its 2013 Credit Facilities to include the 2015 Incremental Term Facility. In applying debt modification accounting, the Company recorded $3.3 million in interest and other expense, comprised of $2.5 million in loss on debt extinguishment and $0.8 million in debt modification expense, in connection with this refinancing event.
On September 28, 2016, the Company further amended its 2013 Credit Facilities. In applying debt modification accounting, the Company recorded $6.4 million in interest and other expense, comprised of $6.0 million in loss on debt extinguishment and $0.4 million in debt modification expense, in connection with this refinancing event.
68
8. COMMITMENTS AND CONTINGENCIES
Capital Leases
The following is a schedule of future minimum lease payments due under capital lease obligations as of December 31, 2016 (in thousands):
2017 | $ | 1,484 | |
2018 | — | ||
Total minimum lease payments | 1,484 | ||
Less: amounts representing interest | (27 | ) | |
Present value of minimum lease payments | 1,457 | ||
Less: current portion | (1,457 | ) | |
Capital lease obligation, long-term | $ | — | |
The following assets are capitalized under capital leases at the end of each period presented (in thousands):
December 31, | |||||||
2015 | 2016 | ||||||
Equipment and hardware | $ | 44,984 | $ | 44,984 | |||
Furniture and fixtures | 1,053 | 1,053 | |||||
Subtotal | 46,037 | 46,037 | |||||
Less: accumulated amortization | (38,713 | ) | (42,051 | ) | |||
Net assets under capital leases | $ | 7,324 | $ | 3,986 | |||
Operating Leases
The Company leases office space under noncancelable operating lease agreements. The leases terminate at various dates through 2024 and generally provide for scheduled rent increases.
The Company leases 91,574 square feet of office space for its corporate headquarters in Sterling, Virginia from a third party. The initial term of the lease commenced on October 1, 2010 and terminates January 31, 2021. The Company has two five-year options to renew the lease, and the rent for the applicable renewal term will be determined if and when the Company exercises its applicable option to renew the lease. The Company recognizes rent incentives and leasehold improvements funded by landlord incentives on a straight-line basis, as a reduction of rent expense, over the initial term of the lease.
Future minimum lease payments under noncancelable operating leases as of December 31, 2016, are as follows (in thousands):
2017 | $ | 23,886 | |
2018 | 22,551 | ||
2019 | 21,904 | ||
2020 | 20,733 | ||
2021 | 16,224 | ||
Thereafter | 27,718 | ||
$ | 133,016 | ||
Future minimum sublease receipts under noncancelable operating leases for the years ended December 31, 2017, 2018, and 2019, are expected to be approximately $6.5 million, $5.9 million, and $4.6 million, respectively.
Rent expense was $14.1 million, $11.5 million, and $15.4 million for the years ended December 31, 2014, 2015 and 2016, respectively.
69
Contingencies
The Company, along with other parties to the merger agreement and its Board of Directors, have been named as defendants in a class action complaint filed on January 20, 2017, in the United States District Court for the District of Delaware, entitled Parshall v. NeuStar, Inc. et al., Case 1:17-cv-00060-LPS. The Company and its Board also have been named as defendants in a class action complaint filed on February 1, 2017, in the United States District Court for the District of Delaware, entitled Rubin v. NeuStar, Inc. et al., Case 1:17-cv-00104. The complaints allege violations of the federal securities laws by the defendants in connection with the preliminary proxy statement on Schedule 14A filed by the Company with the SEC with a filing date of January 7, 2017. The complaints seek, among other things, an injunction preventing the consummation of the merger, rescission of the merger if it is consummated or rescissory damages, and attorneys’ fees and costs. The Company believes that the respective allegations asserted against it in the lawsuits are without merit and intend to defend against the lawsuits vigorously. Similar cases may also be filed in connection with the proposed merger. Reserves are established in connection with contingencies when a loss is probable and the amount of such loss can be reasonably estimated. At December 31, 2016 no reserves were recorded related to this matter. The determination of probability and the estimation of the actual amount of any such losses are inherently unpredictable, and it is therefore possible that the eventual outcome could differ.
9. RESTRUCTURING CHARGES
2016 Restructuring
During the year ended December 31, 2016, the Company initiated restructuring programs to achieve efficiencies in connection with the integration of recent acquisitions and review of the Company's go-to-market strategy. The Company recorded restructuring charges of $14.7 million. As of December 31, 2016, the plan was complete and no further charges are expected.
Summary of Accrued Restructuring
Accrued restructuring costs are recorded in other current liabilities presented in the Company’s consolidated balance sheets. The additions and adjustments to the accrued restructuring liability related to the Company’s restructuring plans as described above for the years ended December 31, 2015 and December 31, 2016 are as follows (in thousands):
December 31, 2014 | Additional Costs | Cash Payments | December 31, 2015 | ||||||||||||
2014 Restructuring: | |||||||||||||||
Severance and severance-related costs | $ | 374 | $ | — | $ | (374 | ) | $ | — | ||||||
Lease and Facility exit costs | 136 | — | (136 | ) | $ | — | |||||||||
2015 Restructuring: | |||||||||||||||
Severance and severance-related costs | — | 3,858 | (499 | ) | 3,359 | ||||||||||
Total restructuring | $ | 510 | $ | 3,858 | $ | (1,009 | ) | $ | 3,359 | ||||||
December 31, 2015 | Additional Costs | Cash Payments | Adjustments | December 31, 2016 | |||||||||||||||
2015 Restructuring: | |||||||||||||||||||
Severance and severance-related costs | $ | 3,359 | $ | — | $ | (3,359 | ) | $ | — | $ | — | ||||||||
2016 Restructuring: | |||||||||||||||||||
Severance and severance-related costs | — | 14,836 | (10,391 | ) | (124 | ) | 4,321 | ||||||||||||
Total restructuring | $ | 3,359 | $ | 14,836 | $ | (13,750 | ) | $ | (124 | ) | $ | 4,321 | |||||||
70
10. INTEREST AND OTHER EXPENSE
Interest and other expense consists of the following (in thousands):
Year Ended December 31, | |||||||||||
2014 | 2015 | 2016 | |||||||||
Interest and other expense: | |||||||||||
Interest expense | $ | 24,864 | $ | 28,209 | $ | 61,155 | |||||
Loss on debt modification and extinguishment | — | 3,326 | 6,354 | ||||||||
Loss (gain) on asset disposals | 1,302 | (193 | ) | (23 | ) | ||||||
Foreign currency transaction loss | 104 | 2,236 | 1,429 | ||||||||
Other | (52 | ) | — | — | |||||||
Total interest and other expense | $ | 26,218 | $ | 33,578 | $ | 68,915 | |||||
Interest expense includes the amortization of loan origination fees and deferred financing costs related to the Company’s credit facilities (see Note 7).
11. INCOME TAXES
The components of income before provision for income taxes are as follows (in thousands):
Year Ended December 31, | |||||||||||
2014 | 2015 | 2016 | |||||||||
Domestic | $ | 233,274 | $ | 249,851 | $ | 211,591 | |||||
Foreign | 2,269 | 3,679 | 11,856 | ||||||||
Income before provision for income taxes | $ | 235,543 | $ | 253,530 | $ | 223,447 | |||||
The provision for income taxes consists of the following components (in thousands):
Year Ended December 31, | |||||||||||
2014 | 2015 | 2016 | |||||||||
Current: | |||||||||||
Federal | $ | 84,553 | $ | 77,941 | $ | 32,692 | |||||
State | 16,559 | 14,153 | 2,824 | ||||||||
Foreign | 5,405 | 8,655 | 5,998 | ||||||||
Total current | 106,517 | 100,749 | 41,514 | ||||||||
Deferred: | |||||||||||
Federal | (29,039 | ) | (17,163 | ) | 12,946 | ||||||
State | (5,653 | ) | (2,646 | ) | 1,439 | ||||||
Foreign | 24 | (2,872 | ) | (1,098 | ) | ||||||
Total deferred | (34,668 | ) | (22,681 | ) | 13,287 | ||||||
Total provision for income taxes | $ | 71,849 | $ | 78,068 | $ | 54,801 | |||||
71
A reconciliation of the statutory United States income tax rate to the effective income tax rate follows:
Year Ended December 31, | ||||||||
2014 | 2015 | 2016 | ||||||
Statutory federal tax rate | 35.0 | % | 35.0 | % | 35.0 | % | ||
State taxes (net of federal benefit) | 3.8 | 3.5 | 3.4 | |||||
Domestic production activities deduction | (6.5 | ) | (3.8 | ) | (1.6 | ) | ||
Settlements and statute expirations | — | (3.6 | ) | (1.4 | ) | |||
Worthless stock deduction | — | — | (10.2 | ) | ||||
Change in valuation allowance | (0.4 | ) | — | — | ||||
Other | (1.4 | ) | (0.3 | ) | (0.7 | ) | ||
Effective tax rate | 30.5 | % | 30.8 | % | 24.5 | % | ||
During 2014, the Company recorded $12.2 million of discrete tax benefits primarily associated with a change in estimate of its domestic production activities deduction for the years 2009 through 2013. During 2015, the Company recorded $11.6 million of discrete tax benefits primarily associated with the recognition of unrecorded tax benefits upon the completion of an Internal Revenue Service audit of the Company’s federal income tax returns for the years ended December 31, 2009 through December 31, 2012. During 2016, the Company recorded $27.2 million of discrete tax benefits primarily associated with a worthless stock deduction related to the liquidation of one of the Company's domestic subsidiaries for tax purposes. The Company intends to treat the common stock of this subsidiary as worthless for income tax purposes on its 2016 U.S. federal and state tax returns.
72
The Company realized certain tax benefits attributable to stock-based compensation, of which the excess tax benefit over the amount recorded for financial reporting purposes was $1.5 million for the year ended December 31, 2014 and has been recorded as an increase to additional paid-in capital. For the years ended December 31, 2015 and 2016, the Company had tax shortfalls of $9.2 million and $2.9 million, respectively, each of which was recorded as a decrease to additional paid-in capital. Deferred income taxes reflect the net tax effects of temporary differences between the carrying amount of assets and liabilities for financial reporting purposes and the amounts used for income tax purposes. Significant components of the Company’s net deferred income taxes are as follows (in thousands):
December 31, | |||||||
2015 | 2016 | ||||||
Deferred tax assets: | |||||||
Domestic NOL carryforwards | $ | 27,041 | $ | 21,638 | |||
Foreign NOL carryforwards | 6,557 | 7,276 | |||||
Deferred revenue | 15,519 | 12,939 | |||||
Accrued compensation | 5,832 | 7,899 | |||||
Stock-based compensation expense | 23,964 | 19,824 | |||||
Foreign currency translation adjustments | 1,122 | 1,355 | |||||
Deferred rent | 9,489 | 9,899 | |||||
Basis differences in notes payable | 6,213 | — | |||||
Other | 7,803 | 7,512 | |||||
Total deferred tax assets | 103,540 | 88,342 | |||||
Valuation allowance | (8,552 | ) | (8,607 | ) | |||
Total deferred tax assets, net | 94,988 | 79,735 | |||||
Deferred tax liabilities: | |||||||
Unbilled receivables | (6,842 | ) | (7,525 | ) | |||
Depreciation and amortization | (41,931 | ) | (50,628 | ) | |||
Identifiable intangible assets | (81,851 | ) | (47,267 | ) | |||
Basis differences in notes payable | — | (3,953 | ) | ||||
Deferred costs | (3,065 | ) | (5,450 | ) | |||
Total deferred tax liabilities | (133,689 | ) | (114,823 | ) | |||
Net deferred tax liabilities | $ | (38,701 | ) | $ | (35,088 | ) | |
As of December 31, 2016, the Company had U.S. net operating loss carryforwards for federal tax purposes of approximately $56.1 million which expire, if unused, in various years from 2021 to 2036. As of December 31, 2016, the Company had $31.2 million of net operating losses that are ultimately available for carryforward indefinitely under U.K. tax law and the Company has a full valuation allowance against its deferred tax asset associated with its U.K. net operating loss carryforwards. As of December 31, 2016, the Company had other foreign net operating loss carryforwards of approximately $5.8 million, of which $2.2 million can be carried forward indefinitely under current local tax laws and $3.6 million which expire, if unused, in years beginning 2017.
As of December 31, 2016, the amount of earnings from foreign subsidiaries that the Company considers indefinitely reinvested and for which deferred taxes have not been provided was approximately $3.0 million. It is not practicable to determine the income tax liability that would be payable if such earnings were not indefinitely reinvested.
73
As of December 31, 2015 and 2016, the Company had unrecognized tax benefits of $7.5 million and $7.5 million, respectively, of which $6.9 million and $6.9 million, respectively, would affect the Company’s effective tax rate if recognized. The net change in the liability for unrecognized income tax benefits is as follows (in thousands):
Balance at January 1, 2014 | $ | 6,817 | |
Increase related to current year tax positions | 3,116 | ||
Increase related to prior year tax positions | 4,939 | ||
Reductions due to lapse in statutes of limitations | (1,190 | ) | |
Settlements | (78 | ) | |
Balance at December 31, 2014 | 13,604 | ||
Increase related to current year tax positions | 1,742 | ||
Increase related to prior year tax positions | 282 | ||
Positions assumed in acquisitions | 1,368 | ||
Reductions due to lapse in statutes of limitations | (115 | ) | |
Settlements | (9,374 | ) | |
Balance at December 31, 2015 | 7,507 | ||
Increase related to current year tax positions | 1,218 | ||
Increase related to prior year tax positions | 540 | ||
Reductions due to lapse in statutes of limitations | (1,295 | ) | |
Settlements | (488 | ) | |
Balance at December 31, 2016 | $ | 7,482 | |
The Company recognizes interest and penalties related to uncertain tax positions in income tax expense. During the years ended December 31, 2014 and 2016, potential interest and penalties were insignificant. During the year ended December 31, 2015 the Company recognized potential interest and penalties of $2.3 million, including interest and penalties related to uncertain tax positions of acquired companies.
The Company files income tax returns in the United States federal jurisdiction and in many state and foreign jurisdictions. The tax years 2009 through 2015 remain open to examination by the major taxing jurisdictions to which the Company is subject. During 2016, the IRS completed an examination of the 2010 federal income tax return of Neustar Information Services, Inc. No adjustments were made as a result of the audit. The IRS also initiated an examination of the 2012 federal income tax return of Neustar, Inc. and its subsidiaries. The examination was completed with no adjustments.
The Company anticipates that total unrecognized tax benefits will decrease by approximately $2.0 million over the next 12 months due to the expiration of certain statutes of limitations and settlement of tax audits.
12. STOCKHOLDERS’ EQUITY
Preferred Stock
The Company is authorized to issue up to 100,000,000 shares of preferred stock, $0.001 par value per share, in one or more series, to establish from time to time the number of shares to be included in each series, and to fix the rights, preferences, privileges, qualifications, limitations and restrictions of the shares of each wholly unissued series. As of December 31, 2015 and 2016, there are no shares of preferred stock issued or outstanding.
Common Stock
The Company is authorized to issue up to 200,000,000 shares of Class A common stock, $0.001 par value per share and 100,000,000 shares of Class B common stock, $0.001 par value per share. Each holder of Class A and Class B common stock is entitled to one vote for each share of common stock held on all matters submitted to a vote of stockholders. Subject to preferences that may apply to shares of preferred stock outstanding at the time, the holders of Class A and Class B common stock are entitled to receive dividends out of assets legally available at the time and in the amounts as the Company’s Board of Directors may from time to time determine.
74
Stock-Based Compensation
The Company maintains six compensation plans: the NeuStar, Inc. 1999 Equity Incentive Plan (1999 Plan); the NeuStar, Inc. 2005 Stock Incentive Plan (2005 Plan); the Amended and Restated NeuStar, Inc. 2009 Stock Incentive Plan (2009 Plan); the Targus Information Corporation Amended and Restated 2004 Stock Incentive Plan (TARGUSinfo Plan); the AMACAI Information Corporation 2004 Stock Incentive Plan (AMACAI Plan) (collectively, the Plans), and the Neustar, Inc. Employee Stock Purchase Plan (ESPP). The Company may grant to its directors, employees and consultants awards under the 2009 Plan in the form of incentive stock options, nonqualified stock options, stock appreciation rights, shares of restricted stock, restricted stock units, performance vested restricted stock units (PVRSUs) and other stock-based awards. As of December 31, 2016, a total of 6,259,454 shares were available for grant or award under the 2009 Plan.
The Company’s ESPP permits employees to purchase shares of common stock at a 15% discount from the market price of the stock at the beginning or at the end of a six-month purchase period, whichever is less. The six-month purchase periods begin on May 1 and November 1 each year. During the year ended December 31, 2016, the Company issued 189,848 shares under the ESPP. As of December 31, 2016, a total of 87,716 shares were available to be issued under the ESPP.
The term of any stock option granted under the Plans may not exceed ten years. The exercise price per share for options granted under the Plans may not be less than 100% of the fair market value of the common stock on the option grant date. The Board of Directors or Compensation Committee of the Board of Directors determines the vesting schedule of the options, with a maximum vesting period of ten years. Options granted generally vest with respect to 25% of the shares underlying the option award on the first anniversary of the grant date and 2.083% of the shares on the last day of each succeeding calendar month thereafter. The options expire seven to ten years from the date of grant and are forfeitable upon termination of an option holder’s service.
The Company has granted and may in the future grant restricted stock to directors, employees and consultants. The Board of Directors or Compensation Committee of the Board of Directors determines the vesting schedule of the restricted stock, with a maximum vesting period of ten years. Restricted stock granted generally vests in equal annual installments over a three to four-year term.
Stock-based compensation expense recognized for the years ended December 31, 2014, 2015 and 2016 was $64.4 million, $41.0 million, and $42.9 million, respectively. As of December 31, 2016, total unrecognized compensation expense was estimated at $41.4 million, which the Company expects to recognize over a weighted average period of approximately 1.29 years. Total unrecognized compensation expense as of December 31, 2016 is estimated based on outstanding non-vested stock options, non-vested restricted stock units and non-vested PVRSUs. Stock-based compensation expense may increase or decrease in future periods for subsequent grants or forfeitures.
Stock Options
The Company utilizes the Black-Scholes option pricing model to estimate the fair value of stock options granted. The weighted-average grant date fair value of options granted during the year ended December 31, 2014 was $5.70. No stock options were granted during the years ended December 31, 2015 and 2016. The following are the weighted-average assumptions used in valuing the stock options granted during the year ended December 31, 2014, and a discussion of the Company’s assumptions.
Year Ended December 31, 2014 | ||
Dividend yield | — | % |
Expected volatility | 27.83 | % |
Risk-free interest rate | 1.06 | % |
Expected life of options (in years) | 3.35 | |
Dividend yield — The Company has never declared or paid dividends on its common stock and does not anticipate paying dividends in the foreseeable future.
Expected volatility — Volatility is a measure of the amount by which a financial variable such as a share price has fluctuated (historical volatility) or is expected to fluctuate (expected volatility) during a period. The Company considered the historical volatility of its stock price over a term similar to the expected life of the grant in determining its expected volatility.
75
Risk-free interest rate — The risk-free interest rate is based on U.S. Treasury bonds issued with similar life terms to the expected life of the grant.
Expected life of the options — The expected life is the period of time that options granted are expected to remain outstanding. The Company determined the expected life of stock options based on the weighted average of (a) the time-to-settlement from grant of historically settled options and (b) a hypothetical holding period for the outstanding vested options as of the date of fair value estimation. The hypothetical holding period is the amount of time the Company assumes a vested option will be held before the option is exercised. To determine the hypothetical holding period, the Company assumes that an unexercised option will be exercised at the midpoint of the time between the date of fair value estimation and the remaining contractual life of the unexercised option.
The following table summarizes the Company’s stock option activity:
Shares | Weighted- Average Exercise Price | Aggregate Intrinsic Value (in millions) | Weighted Average Remaining Contractual Life (in years) | |||||||||
Outstanding at December 31, 2013 | 2,037,118 | $ | 24.70 | |||||||||
Options granted | 580,000 | 26.44 | ||||||||||
Options exercised | (332,142 | ) | 22.87 | |||||||||
Options forfeited | (241,071 | ) | 26.90 | |||||||||
Outstanding at December 31, 2014 | 2,043,905 | 25.23 | ||||||||||
Options granted | — | — | ||||||||||
Options exercised | (503,053 | ) | 25.01 | |||||||||
Options forfeited | (183,948 | ) | 29.74 | |||||||||
Outstanding at December 31, 2015 | 1,356,904 | $ | 24.70 | |||||||||
Options granted | — | — | ||||||||||
Options exercised | (191,651 | ) | 18.43 | |||||||||
Options forfeited | (177,269 | ) | 26.76 | |||||||||
Outstanding at December 31, 2016 | 987,984 | $ | 25.55 | $ | 7.8 | 2.4 | ||||||
Exercisable at December 31, 2016 | 881,644 | $ | 25.45 | $ | 7.0 | 2.2 | ||||||
Exercisable at December 31, 2015 | 1,066,900 | $ | 24.23 | $ | 1.7 | 2.2 | ||||||
Exercisable at December 31, 2014 | 1,424,154 | $ | 24.67 | $ | 4.5 | 2.2 | ||||||
The aggregate intrinsic value of options exercised for the years ended December 31, 2014, 2015 and 2016 was $2.6 million, $1.7 million, and $1.4 million, respectively.
The following table summarizes information regarding options outstanding at December 31, 2016:
Options Outstanding | Weighted- Average Remaining Contractual Life (in years) | Options Exercisable | |||||||||||||
Range of Exercise Price | Number of Options Outstanding | Weighted- Average Exercise Price | Number of Options Exercisable | Weighted- Average Exercise Price | |||||||||||
$9.10 – $15.50 | 1,824 | $ | 10.43 | 1.1 | 1,824 | $ | 10.43 | ||||||||
$15.51 – $18.10 | 16,995 | 17.28 | 2.9 | 16,995 | 17.28 | ||||||||||
$18.11 – $21.10 | 44,744 | 19.17 | 3.9 | 44,744 | 19.17 | ||||||||||
$21.11 – $24.10 | 180,979 | 22.82 | 0.2 | 180,979 | 22.82 | ||||||||||
$24.11 – $26.44 | 330,613 | 26.42 | 4.4 | 224,273 | 26.41 | ||||||||||
$26.45 – $30.13 | 358,927 | 26.46 | 1.2 | 358,927 | 26.46 | ||||||||||
$30.14 – $32.02 | 53,902 | 31.85 | 4.6 | 53,902 | 31.85 | ||||||||||
987,984 | $ | 25.55 | 2.4 | 881,644 | $ | 25.45 | |||||||||
76
Restricted Stock Awards
The following table summarizes the Company’s non-vested restricted stock activity:
Shares | Weighted- Average Grant Date Fair Value | Aggregate Intrinsic Value (in millions) | ||||||||
Outstanding at December 31, 2013 | 154,772 | $ | 26.24 | |||||||
Restricted stock granted | — | — | ||||||||
Restricted stock vested | (102,775 | ) | 25.92 | |||||||
Restricted stock forfeited | (12,803 | ) | 25.76 | |||||||
Outstanding at December 31, 2014 | 39,194 | 27.21 | ||||||||
Restricted stock granted | — | — | ||||||||
Restricted stock vested | (34,269 | ) | 26.57 | |||||||
Restricted stock forfeited | (4,925 | ) | 31.64 | |||||||
Outstanding at December 31, 2015 | — | $ | — | $ | — | |||||
As of December 31, 2015, there were no remaining non-vested restricted stock awards. During the year ended December 31, 2016, there was no restricted stock award activity.
The total aggregate intrinsic value of restricted stock vested during the years ended December 31, 2014 and 2015 was approximately $3.4 million and $1.0 million, respectively. During the years ended December 31, 2014 and 2015, the Company repurchased 38,852 and 13,207 shares of common stock, respectively, for an aggregate purchase price of $1.3 million and $0.4 million, respectively, pursuant to the participants’ rights under the Company’s stock incentive plans to elect to use common stock to satisfy their minimum tax withholding obligations.
Performance Vested Restricted Stock Units
During 2012, the Company issued awards of PVRSUs to eligible employees under a 2012 long-term incentive plan. These awards were multi-year grants, structurally different than previous awards, and specifically designed to motivate employees to execute the Company’s transformation strategy to become a global leader in information services. The structure of these awards is described in more detail below under 2012 Long-Term Incentive Program. In addition to the issuance of awards under the 2012 long-term incentive plan, the Company issued awards to eligible new and existing employees in each of 2013, 2014 and 2015. The structure of these awards is further described below under Long-Term Incentive Program.
2012 Long-Term Incentive Program
For executive management, the awarded PVRSUs were subject to five one-year performance periods, the first of which began on January 1, 2012 and ended December 31, 2012 and the last of which began on January 1, 2016 and ended on December 31, 2016. Each executive was eligible to earn up to 150% of one-fifth of the award with respect to each annual performance period subject to the achievement of the respective performance goals for each one-year performance period. For non-executive management, the PVRSUs awarded were subject to three one-year performance periods, the first of which began on January 1, 2012 and ended December 31, 2012 and the last of which began on January 1, 2014 and ended on December 31, 2014. Each non-executive was eligible to earn up to 150% of one-third of the award with respect to each annual performance period subject to the achievement of the respective performance goals for each one-year performance period. For both executive and non-executive management, the performance goals for each of the 2012, 2013 and 2014 performance periods were: (i) Non-NPAC Revenue, (ii) Total Revenue, and (iii) Adjusted Net Income. For executive management, the performance goals for the 2015 and 2016 performance periods were: (i) Non-NPAC Revenue, (ii) Total Revenue, and (iii) Adjusted Net Income.
Subject to each participant’s continued service and to certain other terms and conditions, the portion of the award earned (a) by executive management with respect to the first three performance periods vested on January 1, 2015, and the portion of the award earned with respect to the fourth and fifth performance period vested on January 1, 2016 and 2017, respectively; and (b) by non-executive management with respect to all three performance periods, 75% of the earned amount vested on the first business day of 2015, and the remaining 25% of the earned amount vested on the first business day of 2016. Compensation expense related to these awards was recognized over the requisite service period based on the Company’s estimate of the achievement of the performance target and the length of the vesting period.
77
Long-Term Incentive Program
The awarded PVRSUs are subject to three one-year performance periods. Each participant is eligible to earn up to 150% of one-third of the award with respect to each annual performance period, subject to the achievement of the respective performance goals for each one-year performance period. The performance goals for each of the 2014, 2015 and 2016 performance periods were: (i) Non-NPAC Revenue, (ii) Total Revenue, and (iii) Adjusted Net Income. The performance goals for the future one-year performance periods will consist of financial measures, weights and payouts to be established no later than 90 days after the beginning of each such period.
Subject to each participant’s continued service and to certain other terms and conditions, the portion of the award, if any, earned will vest on March 1 in the year following the respective annual performance period. Compensation expense related to these awards is recognized over the requisite service period based on the Company’s estimate of the achievement of the performance target and the length of the vesting period.
Non-Vested PVRSU Activity
The fair value of a PVRSU is measured by reference to the closing market price of the Company’s common stock on the date of the grant. The Company recognizes the estimated fair value of PVRSUs, net of estimated forfeitures, as stock-based compensation expense over the vesting period, which considers each performance period or tranche separately, based upon the Company’s determination of the level of achievement of the performance target. As of December 31, 2016, the level of achievement of the performance target awards for PVRSUs’ 2014, 2015 and 2016 performance years was 123.5%, 130.9% and 93.0%, respectively.
During 2016, the Company revised its estimate of the level of achievement of the performance target awards for the PVRSUs performance year of 2016 from 100% of target to reflect the final achievement of 93.0% of target. The Company’s consolidated net income for the year ended December 31, 2016 was $168.6 million and diluted earnings per share was $3.04 per share. If the Company had continued to use the previous estimate of the level of achievement of 100% of the performance target for the PVRSUs performance year of 2016, the as adjusted net income for the year ended December 31, 2016 would have been approximately $168.0 million and the as adjusted diluted earnings per share would have been approximately $3.03 per share.
The following table summarizes the Company’s non-vested PVRSU activity:
Shares | Weighted- Average Grant Date Fair Value | Aggregate Intrinsic Value (in millions) | ||||||||
Non-vested December 31, 2013 | 1,440,467 | $ | 39.04 | |||||||
Granted | 963,479 | 34.11 | ||||||||
Vested | (312,676 | ) | 32.26 | |||||||
Forfeited | (280,318 | ) | 37.91 | |||||||
Non-vested December 31, 2014 | 1,810,952 | 37.76 | ||||||||
Granted | 1,435,835 | 26.16 | ||||||||
Vested | (1,718,280 | ) | 37.37 | |||||||
Forfeited | (161,935 | ) | 31.67 | |||||||
Non-vested December 31, 2015 | 1,366,572 | 26.78 | ||||||||
Granted | 1,146,829 | 24.15 | ||||||||
Vested | (916,795 | ) | 28.46 | |||||||
Forfeited | (429,667 | ) | 25.76 | |||||||
Non-vested December 31, 2016 | 1,166,939 | $ | 23.25 | $ | 39.0 | |||||
During the years ended December 31, 2015 and 2016, the Company granted 1,435,835 and 1,146,829 PVRSUs, respectively, with an aggregate fair value of $37.6 million and $27.7 million, respectively. The total aggregate intrinsic value of PVRSUs vested during the years ended December 31, 2014, 2015 and 2016 was approximately $13.4 million, $45.8 million and $23.0 million, respectively. During the years ended December 31, 2013, 2014 and 2016, the Company repurchased 122,312, 683,127 and 357,373 shares of common stock, respectively, for an aggregate purchase price of $5.1 million,
78
$18.2 million and $9.0 million, respectively, pursuant to the participants’ rights under the Plans to elect to use common stock to satisfy their minimum tax withholding obligations.
Restricted Stock Units
The following table summarizes the Company’s restricted stock units activity:
Shares | Weighted- Average Grant Date Fair Value | Aggregate Intrinsic Value (in millions) | ||||||||
Outstanding at December 31, 2013 | 1,378,162 | $ | 40.23 | |||||||
Granted | 43,201 | 28.80 | ||||||||
Vested | (200,283 | ) | 37.75 | |||||||
Forfeited | (149,266 | ) | 44.80 | |||||||
Outstanding at December 31, 2014 | 1,071,814 | 39.60 | ||||||||
Granted | 1,486,374 | 26.54 | ||||||||
Vested | (294,992 | ) | 42.10 | |||||||
Forfeited | (189,076 | ) | 33.68 | |||||||
Outstanding at December 31, 2015 | 2,074,120 | 30.42 | ||||||||
Granted | 1,287,549 | 24.16 | ||||||||
Vested | (793,482 | ) | 30.91 | |||||||
Forfeited | (341,239 | ) | 27.15 | |||||||
Outstanding at December 31, 2016 | 2,226,948 | $ | 27.13 | $ | 74.4 | |||||
During the years ended December 31, 2014, 2015 and 2016, the Company granted 43,201, 1,486,374 and 1,287,549 restricted stock units, respectively, to certain employees with an aggregate fair value of $1.2 million, $39.4 million and $31.1 million, respectively.
The restricted stock units issued to non-management directors of the Company’s Board of Directors will fully vest on the earlier of the first anniversary of the date of grant or the day preceding the date in the following calendar year on which the Company’s annual meeting of stockholders is held. Upon vesting of restricted stock units, each director’s restricted stock units will automatically be converted into deferred stock units and will be delivered to the director in shares of the Company’s stock six months following the director’s termination of board service unless a director elected near-term delivery, in which case the vested restricted stock units will be delivered on August 15 in the year following the initial grant.
Employee Stock Purchase Plan
The Company estimated the fair value of stock-based compensation expense associated with its ESPP using the Black-Scholes option pricing model, with the following weighted-average assumptions:
Year Ended December 31, 2016 | ||
Dividend yield | — | % |
Expected volatility | 37.61 | % |
Risk-free interest rate | 0.35 | % |
Expected life of employee stock purchase plan options (in months) | 6 | |
Dividend yield - The Company has never declared or paid dividends on its common stock and does not anticipate paying dividends in the foreseeable future.
Expected volatility - Volatility is a measure of the amount by which a financial variable such as a share price has fluctuated (historical volatility) or is expected to fluctuate (expected volatility) during a period. The Company considered the historical volatility of its stock price over a term similar to the expected life of the option to purchase shares under the ESPP during a 6 month purchase period.
79
Risk-free interest rate - The risk-free interest rate is based on U.S. Treasury bonds issued with similar life terms to the expected life of the ESPP options.
Expected life of ESPP options - The expected life of ESPP options was based on the six-month purchase period.
Share Repurchase Programs
2014 Share Repurchase Plan
On January 29, 2014, the Company announced that its Board of Directors authorized a $200 million share repurchase program. The program commenced on January 30, 2014 and expired on December 31, 2014. Share repurchases under the program were completed in accordance with Rule 10b5-1 and Rule 10b-18 of the Securities and Exchange Act of 1934 (the “Exchange Act”). All repurchased shares were retired. The Company repurchased 7.1 million shares of its Class A common stock at an average price of $28.30 per share for a total purchase price of $199.9 million. As of September 30, 2014, the share repurchase program was complete.
2015 Share Repurchase Plan
On March 26, 2015, the Company announced that its Board of Directors authorized a $150 million share repurchase program. The program commenced on March 27, 2015 and was terminated on November 4, 2015. Share repurchases under the program were completed in accordance with Rule 10b5-1 and Rule 10b-18 of the Exchange Act. All repurchased shares were retired. During the year ended December 31, 2015, the Company repurchased 3.8 million shares of its Class A common stock at an average price of $27.65 per share for a total purchase price of $104.2 million.
13. BASIC AND DILUTED NET INCOME PER COMMON SHARE
The following table provides a reconciliation of the numerators and denominators used in computing basic and diluted net income per common share (in thousands, except per share data):
Year Ended December 31, | |||||||||||
2014 | 2015 | 2016 | |||||||||
Computation of basic net income per common share: | |||||||||||
Net income | $ | 163,694 | $ | 175,462 | $ | 168,646 | |||||
Weighted average common shares and participating securities outstanding — basic | 57,647 | 54,643 | 54,413 | ||||||||
Basic net income per common share | $ | 2.84 | $ | 3.21 | $ | 3.10 | |||||
Computation of diluted net income per common share: | |||||||||||
Weighted average common shares and participating securities outstanding — basic | 57,647 | 54,643 | 54,413 | ||||||||
Effect of dilutive securities: | |||||||||||
Stock-based awards | 1,888 | 1,261 | 1,103 | ||||||||
Weighted average common shares outstanding — diluted | 59,535 | 55,904 | 55,516 | ||||||||
Diluted net income per common share | $ | 2.75 | $ | 3.14 | $ | 3.04 | |||||
Diluted net income per common share reflects the potential dilution of common stock equivalents such as options, to the extent the impact is dilutive. The Company used income from continuing operations as the control number in determining whether potential common shares were dilutive or anti-dilutive.
Total awards to purchase an aggregate of 1,176,879, 1,187,611 and 1,257,545 shares were excluded from the calculation of the denominator for diluted net income per common share due to their anti-dilutive effect for the years ended December 31, 2014, 2015, and 2016, respectively.
80
14. ACCUMULATED OTHER COMPREHENSIVE LOSS
The following table provides a reconciliation of the changes in accumulated other comprehensive loss, net of tax, by component (in thousands):
Gains and Losses on Investments | Currency Translation Adjustment | Total | |||||||||
Balance at December 31, 2013 | $ | (14 | ) | $ | (783 | ) | $ | (797 | ) | ||
Other comprehensive income (loss) | 86 | (934 | ) | (848 | ) | ||||||
Balance at December 31, 2014 | 72 | (1,717 | ) | (1,645 | ) | ||||||
Other comprehensive loss | (120 | ) | (139 | ) | (259 | ) | |||||
Balance at December 31, 2015 | (48 | ) | (1,856 | ) | (1,904 | ) | |||||
Other comprehensive income | 55 | 64 | 119 | ||||||||
Balance at December 31, 2016 | $ | 7 | $ | (1,792 | ) | $ | (1,785 | ) | |||
15. SEGMENT INFORMATION
The Company engages in business activities as a single entity and the chief operating decision maker reviews consolidated operating results and allocates resources based on consolidated reports. The Company has a single operating segment.
Enterprise-Wide Disclosures
Revenue by geographical areas is based on the billing addresses of the Company's clients. Geographic area revenue and service revenue from external clients for the years ended December 31, 2014, 2015 and 2016, and geographic area long-lived assets as of December 31, 2015 and 2016 are as follows (in thousands):
Year Ended December 31, | |||||||||||
2014 | 2015 | 2016 | |||||||||
Revenue by geographical areas: | |||||||||||
United States | $ | 901,136 | $ | 973,628 | $ | 1,110,150 | |||||
International | 62,452 | 76,330 | 99,697 | ||||||||
Total revenue | $ | 963,588 | $ | 1,049,958 | $ | 1,209,847 | |||||
Revenue by service: | |||||||||||
Marketing Services | $ | 146,991 | $ | 170,368 | $ | 269,114 | |||||
Security Services | 140,315 | 167,995 | 204,132 | ||||||||
Data Services | 201,438 | 204,461 | 224,276 | ||||||||
NPAC Services | 474,844 | 507,134 | 512,325 | ||||||||
Total revenue | $ | 963,588 | $ | 1,049,958 | $ | 1,209,847 | |||||
December 31, | |||||||
2015 | 2016 | ||||||
Property and equipment, net | |||||||
United States | $ | 145,077 | $ | 143,560 | |||
Australia | 2,171 | 1,378 | |||||
Other | 516 | 883 | |||||
Total property and equipment, net | $ | 147,764 | $ | 145,821 | |||
16. EMPLOYEE BENEFIT PLANS
The Company has a 401(k) Profit-Sharing Plan for the benefit of all employees who meet certain eligibility requirements. This plan covers substantially all of the Company’s full-time employees. The Company makes matching and other
81
discretionary contributions under this plan, as determined by the Board of Directors. The Company recognized contribution expense totaling $7.5 million, $8.1 million and $9.8 million for the years ended December 31, 2014, 2015 and 2016, respectively.
17. SUPPLEMENTAL GUARANTOR INFORMATION
The following schedules present condensed consolidating financial information of the Company as of December 31, 2015 and 2016 and for the years ended December 31, 2014, 2015 and 2016 for (a) Neustar, Inc., the parent company; (b) certain of the Company’s 100% owned domestic subsidiaries (collectively, the Subsidiary Guarantors); and (c) certain wholly-owned domestic and foreign subsidiaries of the Company (collectively, the Non-Guarantor Subsidiaries). Investments in subsidiaries are accounted for using the equity method; accordingly, entries necessary to consolidate the parent company and all of the guarantor and non-guarantor subsidiaries are reflected in the eliminations column. Intercompany amounts that will not be settled between entities are treated as contributions or distributions for purposes of these consolidated financial statements. The guarantees, as outlined in Note 7, are full and unconditional and joint and several. A Subsidiary Guarantor will be released from its obligations under the Senior Notes when: (a) the Subsidiary Guarantor is sold or sells substantially all of its assets; (b) the Subsidiary Guarantor is designated as an unrestricted subsidiary as defined by the Senior Notes; (c) the Subsidiary Guarantor’s guarantee of indebtedness under the Senior Notes is released (other than discharge through repayment); or (d) the requirements for legal or covenant defeasance or discharge of the indenture have been satisfied.
82
CONDENSED CONSOLIDATED BALANCE SHEET
DECEMBER 31, 2015
(in thousands)
NeuStar, Inc. | Guarantor Subsidiaries | Non-Guarantor Subsidiaries | Eliminations | Consolidated | |||||||||||||||
ASSETS | |||||||||||||||||||
Current assets: | |||||||||||||||||||
Cash and cash equivalents | $ | 48,061 | $ | 27,092 | $ | 13,944 | $ | — | $ | 89,097 | |||||||||
Restricted cash | 1,260 | 1,103 | — | — | 2,363 | ||||||||||||||
Accounts receivable, net | 91,899 | 71,062 | 4,632 | — | 167,593 | ||||||||||||||
Unbilled receivables | 2,357 | 14,694 | 661 | — | 17,712 | ||||||||||||||
Prepaid expenses and other current assets | 23,080 | 8,551 | 1,868 | (3,283 | ) | 30,216 | |||||||||||||
Deferred costs | 1,119 | 2,876 | 2,681 | — | 6,676 | ||||||||||||||
Income taxes receivable | 10,661 | — | — | (4,778 | ) | 5,883 | |||||||||||||
Intercompany receivable | 26,030 | — | — | (26,030 | ) | — | |||||||||||||
Total current assets | 204,467 | 125,378 | 23,786 | (34,091 | ) | 319,540 | |||||||||||||
Property and equipment, net | 135,445 | 9,302 | 3,017 | — | 147,764 | ||||||||||||||
Goodwill | 94,153 | 984,017 | 108,813 | — | 1,186,983 | ||||||||||||||
Intangible assets, net | 13,751 | 462,848 | 52,680 | — | 529,279 | ||||||||||||||
Net investments in subsidiaries | 1,545,227 | — | — | (1,545,227 | ) | — | |||||||||||||
Other assets, long-term | 16,071 | 1,283 | 2,635 | (1,308 | ) | 18,681 | |||||||||||||
Total assets | $ | 2,009,114 | $ | 1,582,828 | $ | 190,931 | $ | (1,580,626 | ) | $ | 2,202,247 | ||||||||
LIABILITIES AND STOCKHOLDERS’ EQUITY | |||||||||||||||||||
Current liabilities: | |||||||||||||||||||
Accounts payable | $ | 18,945 | $ | 7,522 | $ | 1,925 | $ | — | $ | 28,392 | |||||||||
Accrued expenses | 98,761 | 29,262 | 6,609 | — | 134,632 | ||||||||||||||
Income taxes payable | — | 3,068 | 1,496 | (4,564 | ) | — | |||||||||||||
Deferred revenue | 24,929 | 46,153 | 19,924 | — | 91,006 | ||||||||||||||
Notes payable | 131,272 | — | 3,283 | (3,283 | ) | 131,272 | |||||||||||||
Capital lease obligations | 3,927 | — | 864 | — | 4,791 | ||||||||||||||
Other liabilities | 9,937 | 279 | 659 | — | 10,875 | ||||||||||||||
Intercompany payable | — | 18,199 | 7,831 | (26,030 | ) | — | |||||||||||||
Total current liabilities | 287,771 | 104,483 | 42,591 | (33,877 | ) | 400,968 | |||||||||||||
Deferred revenue, long-term | 8,239 | 9,734 | 5,025 | — | 22,998 | ||||||||||||||
Notes payable, long-term | 957,509 | — | — | — | 957,509 | ||||||||||||||
Capital lease obligations, long-term | 1,825 | — | 6 | — | 1,831 | ||||||||||||||
Deferred income tax liabilities, long-term | — | 42,865 | 7,658 | (11,822 | ) | 38,701 | |||||||||||||
Other liabilities, long-term | 41,978 | 8,652 | 6,111 | — | 56,741 | ||||||||||||||
Total liabilities | 1,297,322 | 165,734 | 61,391 | (45,699 | ) | 1,478,748 | |||||||||||||
Total stockholders’ equity | 711,792 | 1,417,094 | 129,540 | (1,534,927 | ) | 723,499 | |||||||||||||
Total liabilities and stockholders’ equity | $ | 2,009,114 | $ | 1,582,828 | $ | 190,931 | $ | (1,580,626 | ) | $ | 2,202,247 | ||||||||
83
CONDENSED CONSOLIDATED BALANCE SHEET
DECEMBER 31, 2016
(in thousands)
NeuStar, Inc. | Guarantor Subsidiaries | Non-Guarantor Subsidiaries | Eliminations | Consolidated | |||||||||||||||
ASSETS | |||||||||||||||||||
Current assets: | |||||||||||||||||||
Cash and cash equivalents | $ | 21,871 | $ | 15,037 | $ | 8,865 | $ | — | $ | 45,773 | |||||||||
Restricted cash | 1,260 | 1,023 | — | — | 2,283 | ||||||||||||||
Accounts receivable, net | 100,686 | 102,565 | 4,344 | — | 207,595 | ||||||||||||||
Unbilled receivables | 3,829 | 14,652 | 1,314 | — | 19,795 | ||||||||||||||
Prepaid expenses and other current assets | 32,799 | 7,039 | 1,842 | — | 41,680 | ||||||||||||||
Deferred costs | 2,232 | 5,964 | 3,273 | — | 11,469 | ||||||||||||||
Income taxes receivable | 17,481 | — | 1,007 | (4,902 | ) | 13,586 | |||||||||||||
Intercompany receivable | 9,990 | 1,365 | — | (11,355 | ) | — | |||||||||||||
Total current assets | 190,148 | 147,645 | 20,645 | (16,257 | ) | 342,181 | |||||||||||||
Property and equipment, net | 133,759 | 9,636 | 2,426 | — | 145,821 | ||||||||||||||
Goodwill | 94,153 | 968,116 | 106,713 | — | 1,168,982 | ||||||||||||||
Intangible assets, net | 10,967 | 368,068 | 44,922 | — | 423,957 | ||||||||||||||
Net investments in subsidiaries | 1,490,889 | — | — | (1,490,889 | ) | — | |||||||||||||
Other assets, long-term | 11,686 | 3,206 | 2,879 | — | 17,771 | ||||||||||||||
Total assets | $ | 1,931,602 | $ | 1,496,671 | $ | 177,585 | $ | (1,507,146 | ) | $ | 2,098,712 | ||||||||
LIABILITIES AND STOCKHOLDERS’ EQUITY | |||||||||||||||||||
Current liabilities: | |||||||||||||||||||
Accounts payable | $ | 10,733 | $ | 9,578 | $ | 784 | $ | — | $ | 21,095 | |||||||||
Accrued expenses | 84,782 | 41,458 | 8,305 | — | 134,545 | ||||||||||||||
Income taxes payable | — | 4,902 | — | (4,902 | ) | — | |||||||||||||
Deferred revenue | 24,503 | 48,753 | 17,932 | — | 91,188 | ||||||||||||||
Notes payable | 103,725 | 6,849 | 3,141 | (9,990 | ) | 103,725 | |||||||||||||
Capital lease obligations | 1,457 | — | — | — | 1,457 | ||||||||||||||
Other liabilities | 6,564 | 4,936 | 132 | — | 11,632 | ||||||||||||||
Intercompany payable | 938 | — | 427 | (1,365 | ) | — | |||||||||||||
Total current liabilities | 232,702 | 116,476 | 30,721 | (16,257 | ) | 363,642 | |||||||||||||
Deferred revenue, long-term | 8,426 | 8,360 | 5,651 | — | 22,437 | ||||||||||||||
Notes payable, long-term | 702,946 | — | — | — | 702,946 | ||||||||||||||
Deferred income tax liabilities, long-term | 9,493 | 19,616 | 5,979 | — | 35,088 | ||||||||||||||
Other liabilities, long-term | 41,411 | 5,313 | 6,574 | — | 53,298 | ||||||||||||||
Total liabilities | 994,978 | 149,765 | 48,925 | (16,257 | ) | 1,177,411 | |||||||||||||
Total stockholders’ equity | 936,624 | 1,346,906 | 128,660 | (1,490,889 | ) | 921,301 | |||||||||||||
Total liabilities and stockholders’ equity | $ | 1,931,602 | $ | 1,496,671 | $ | 177,585 | $ | (1,507,146 | ) | $ | 2,098,712 | ||||||||
84
CONDENSED CONSOLIDATED STATEMENT OF OPERATIONS
YEAR ENDED DECEMBER 31, 2014
(in thousands)
NeuStar, Inc. | Guarantor Subsidiaries | Non-Guarantor Subsidiaries | Eliminations | Consolidated | |||||||||||||||
Revenue | $ | 675,857 | $ | 301,167 | $ | 14,484 | $ | (27,920 | ) | $ | 963,588 | ||||||||
Operating expense: | |||||||||||||||||||
Cost of revenue (excluding depreciation and amortization shown separately below) | 162,696 | 98,001 | 10,567 | (24,149 | ) | 247,115 | |||||||||||||
Sales and marketing | 142,215 | 57,879 | 1,629 | (3,581 | ) | 198,142 | |||||||||||||
Research and development | 25,516 | 2,190 | 33 | — | 27,739 | ||||||||||||||
General and administrative | 95,343 | 8,956 | 861 | (190 | ) | 104,970 | |||||||||||||
Depreciation and amortization | 48,954 | 67,464 | 1,367 | — | 117,785 | ||||||||||||||
Restructuring charges | 3,842 | 2,442 | 237 | — | 6,521 | ||||||||||||||
478,566 | 236,932 | 14,694 | (27,920 | ) | 702,272 | ||||||||||||||
Income (loss) from operations | 197,291 | 64,235 | (210 | ) | — | 261,316 | |||||||||||||
Other (expense) income: | |||||||||||||||||||
Interest and other expense | (26,377 | ) | 52 | 107 | — | (26,218 | ) | ||||||||||||
Interest income | 418 | 9 | 18 | — | 445 | ||||||||||||||
Income (loss) before income taxes and equity income in consolidated subsidiaries | 171,332 | 64,296 | (85 | ) | — | 235,543 | |||||||||||||
Provision for income taxes | 35,893 | 35,179 | 777 | — | 71,849 | ||||||||||||||
Income (loss) before equity income in consolidated subsidiaries | 135,439 | 29,117 | (862 | ) | — | 163,694 | |||||||||||||
Equity income in consolidated subsidiaries | 28,255 | 1,345 | — | (29,600 | ) | — | |||||||||||||
Net income (loss) | $ | 163,694 | $ | 30,462 | $ | (862 | ) | $ | (29,600 | ) | $ | 163,694 | |||||||
Comprehensive income (loss) | $ | 163,138 | $ | 30,725 | $ | (1,417 | ) | $ | (29,600 | ) | $ | 162,846 | |||||||
85
CONDENSED CONSOLIDATED STATEMENT OF OPERATIONS
YEAR ENDED DECEMBER 31, 2015
(in thousands)
NeuStar, Inc. | Guarantor Subsidiaries | Non-Guarantor Subsidiaries | Eliminations | Consolidated | |||||||||||||||
Revenue | $ | 713,860 | $ | 347,043 | $ | 27,248 | $ | (38,193 | ) | $ | 1,049,958 | ||||||||
Operating expense: | |||||||||||||||||||
Cost of revenue (excluding depreciation and amortization shown separately below) | 185,058 | 115,025 | 18,407 | (32,254 | ) | 286,236 | |||||||||||||
Sales and marketing | 148,710 | 62,004 | 1,253 | (5,675 | ) | 206,292 | |||||||||||||
Research and development | 21,712 | 3,945 | 20 | — | 25,677 | ||||||||||||||
General and administrative | 105,887 | 12,416 | 609 | (264 | ) | 118,648 | |||||||||||||
Depreciation and amortization | 52,624 | 65,742 | 4,325 | — | 122,691 | ||||||||||||||
Restructuring charges | 3,858 | — | — | — | 3,858 | ||||||||||||||
517,849 | 259,132 | 24,614 | (38,193 | ) | 763,402 | ||||||||||||||
Income from operations | 196,011 | 87,911 | 2,634 | — | 286,556 | ||||||||||||||
Other (expense) income: | |||||||||||||||||||
Interest and other expense | (32,604 | ) | 334 | (1,308 | ) | — | (33,578 | ) | |||||||||||
Interest income | 482 | 153 | (83 | ) | — | 552 | |||||||||||||
Income before income taxes and equity income in consolidated subsidiaries | 163,889 | 88,398 | 1,243 | — | 253,530 | ||||||||||||||
Provision for income taxes | 50,238 | 27,048 | 782 | — | 78,068 | ||||||||||||||
Income before equity income in consolidated subsidiaries | 113,651 | 61,350 | 461 | — | 175,462 | ||||||||||||||
Equity income in consolidated subsidiaries | 61,811 | 1,007 | — | (62,818 | ) | — | |||||||||||||
Net income | $ | 175,462 | $ | 62,357 | $ | 461 | $ | (62,818 | ) | $ | 175,462 | ||||||||
Comprehensive income | $ | 175,434 | $ | 62,179 | $ | 408 | $ | (62,818 | ) | $ | 175,203 | ||||||||
86
CONDENSED CONSOLIDATED STATEMENT OF OPERATIONS
YEAR ENDED DECEMBER 31, 2016
(in thousands)
NeuStar, Inc. | Guarantor Subsidiaries | Non-Guarantor Subsidiaries | Eliminations | Consolidated | |||||||||||||||
Revenue | $ | 679,922 | $ | 521,888 | $ | 59,771 | $ | (51,734 | ) | $ | 1,209,847 | ||||||||
Operating expense: | |||||||||||||||||||
Cost of revenue (excluding depreciation and amortization shown separately below) | 167,738 | 218,108 | 24,660 | (41,402 | ) | 369,104 | |||||||||||||
Sales and marketing | 131,360 | 85,662 | 7,545 | (9,004 | ) | 215,563 | |||||||||||||
Research and development | 22,342 | 3,880 | 1,937 | — | 28,159 | ||||||||||||||
General and administrative | 97,504 | 13,251 | 2,267 | (1,328 | ) | 111,694 | |||||||||||||
Depreciation and amortization | 55,138 | 99,369 | 9,574 | — | 164,081 | ||||||||||||||
Restructuring charges | 7,776 | 6,190 | 746 | — | 14,712 | ||||||||||||||
Separation costs | 14,512 | — | — | — | 14,512 | ||||||||||||||
496,370 | 426,460 | 46,729 | (51,734 | ) | 917,825 | ||||||||||||||
Income from operations | 183,552 | 95,428 | 13,042 | — | 292,022 | ||||||||||||||
Other (expense) income: | |||||||||||||||||||
Interest and other expense | (67,550 | ) | (2,159 | ) | 794 | — | (68,915 | ) | |||||||||||
Interest income | 1,630 | 420 | (1,710 | ) | — | 340 | |||||||||||||
Income before income taxes and equity income in consolidated subsidiaries | 117,632 | 93,689 | 12,126 | — | 223,447 | ||||||||||||||
Provision (benefit) for income taxes | 16,660 | 39,313 | (1,172 | ) | — | 54,801 | |||||||||||||
Income before equity income in consolidated subsidiaries | 100,972 | 54,376 | 13,298 | — | 168,646 | ||||||||||||||
Equity income in consolidated subsidiaries | 67,674 | 320 | — | (67,994 | ) | — | |||||||||||||
Net income | $ | 168,646 | $ | 54,696 | $ | 13,298 | $ | (67,994 | ) | $ | 168,646 | ||||||||
Comprehensive income | $ | 168,932 | $ | 54,705 | $ | 13,122 | $ | (67,994 | ) | $ | 168,765 | ||||||||
87
CONDENSED CONSOLIDATED STATEMENT OF CASH FLOWS
YEAR ENDED DECEMBER 31, 2014
(in thousands)
NeuStar, Inc. | Guarantor Subsidiaries | Non-Guarantor Subsidiaries | Eliminations | Consolidated | |||||||||||||||
Net cash provided by (used in) operating activities | $ | 296,280 | $ | 191,873 | $ | (1,255 | ) | $ | (167,236 | ) | $ | 319,662 | |||||||
Investing activities: | |||||||||||||||||||
Purchases of property and equipment | (58,174 | ) | (1,833 | ) | (154 | ) | — | (60,161 | ) | ||||||||||
Businesses acquired, net of cash acquired | (120,698 | ) | — | — | — | (120,698 | ) | ||||||||||||
Net cash used in investing activities | (178,872 | ) | (1,833 | ) | (154 | ) | — | (180,859 | ) | ||||||||||
Financing activities: | |||||||||||||||||||
Decrease in restricted cash | — | 127 | 3 | — | 130 | ||||||||||||||
Proceeds from note payable | 175,000 | — | — | — | 175,000 | ||||||||||||||
Payments under notes payable obligations | (8,125 | ) | — | — | — | (8,125 | ) | ||||||||||||
Principal repayments on capital lease obligations | (3,466 | ) | — | — | — | (3,466 | ) | ||||||||||||
Proceeds from issuance of stock | 10,994 | — | — | — | 10,994 | ||||||||||||||
Tax benefit from equity awards | 1,490 | — | 5 | — | 1,495 | ||||||||||||||
Repurchase of restricted stock awards and common stock | (209,627 | ) | — | — | — | (209,627 | ) | ||||||||||||
(Distribution to) investment by parent | — | (171,322 | ) | 4,086 | 167,236 | — | |||||||||||||
Net cash (used in) provided by financing activities | (33,734 | ) | (171,195 | ) | 4,094 | 167,236 | (33,599 | ) | |||||||||||
Effect of foreign exchange rates on cash and cash equivalents | (1,068 | ) | (314 | ) | (554 | ) | — | (1,936 | ) | ||||||||||
Net increase in cash and cash equivalents | 82,606 | 18,531 | 2,131 | — | 103,268 | ||||||||||||||
Cash and cash equivalents at beginning of period | 214,959 | 1,075 | 7,275 | — | 223,309 | ||||||||||||||
Cash and cash equivalents at end of period | $ | 297,565 | $ | 19,606 | $ | 9,406 | $ | — | $ | 326,577 | |||||||||
88
CONDENSED CONSOLIDATED STATEMENT OF CASH FLOWS
YEAR ENDED DECEMBER 31, 2015
(in thousands)
NeuStar, Inc. | Guarantor Subsidiaries | Non-Guarantor Subsidiaries | Eliminations | Consolidated | |||||||||||||||
Net cash (used in) provided by operating activities | $ | (394,901 | ) | $ | 600,268 | $ | 98,832 | $ | 51,140 | $ | 355,339 | ||||||||
Investing activities: | |||||||||||||||||||
Purchases of property and equipment | (30,304 | ) | (1,833 | ) | — | — | (32,137 | ) | |||||||||||
Businesses acquired, net of cash acquired | (16,949 | ) | (641,228 | ) | (100,118 | ) | — | (758,295 | ) | ||||||||||
Net cash used in investing activities | (47,253 | ) | (643,061 | ) | (100,118 | ) | — | (790,432 | ) | ||||||||||
Financing activities: | |||||||||||||||||||
Increase in restricted cash | — | (172 | ) | — | — | (172 | ) | ||||||||||||
Proceeds from note payable | 350,000 | — | — | — | 350,000 | ||||||||||||||
Payments under notes payable obligations | (8,125 | ) | — | — | — | (8,125 | ) | ||||||||||||
Principal repayments on capital lease obligations | (4,306 | ) | — | — | — | (4,306 | ) | ||||||||||||
Debt issuance costs | (25,274 | ) | — | — | — | (25,274 | ) | ||||||||||||
Proceeds from issuance of stock | 9,915 | — | — | — | 9,915 | ||||||||||||||
Tax benefit from equity awards | 361 | — | — | — | 361 | ||||||||||||||
Repurchase of restricted stock awards and common stock | (125,563 | ) | — | — | — | (125,563 | ) | ||||||||||||
Investment by parent | — | 50,166 | 974 | (51,140 | ) | — | |||||||||||||
Net cash provided by financing activities | 197,008 | 49,994 | 974 | (51,140 | ) | 196,836 | |||||||||||||
Effect of foreign exchange rates on cash and cash equivalents | (4,358 | ) | 285 | 4,850 | — | 777 | |||||||||||||
Net (decrease) increase in cash and cash equivalents | (249,504 | ) | 7,486 | 4,538 | — | (237,480 | ) | ||||||||||||
Cash and cash equivalents at beginning of period | 297,565 | 19,606 | 9,406 | — | 326,577 | ||||||||||||||
Cash and cash equivalents at end of period | $ | 48,061 | $ | 27,092 | $ | 13,944 | $ | — | $ | 89,097 | |||||||||
89
CONDENSED CONSOLIDATED STATEMENT OF CASH FLOWS
YEAR ENDED DECEMBER 31, 2016
(in thousands)
NeuStar, Inc. | Guarantor Subsidiaries | Non-Guarantor Subsidiaries | Eliminations | Consolidated | |||||||||||||||
Net cash provided by (used in) operating activities | $ | 352,959 | $ | 193,461 | $ | (6,561 | ) | $ | (204,390 | ) | $ | 335,469 | |||||||
Investing activities: | |||||||||||||||||||
Purchases of property and equipment | (55,714 | ) | (1,833 | ) | — | — | (57,547 | ) | |||||||||||
Businesses acquired, net of cash acquired | 12 | — | — | — | 12 | ||||||||||||||
Net cash used in investing activities | (55,702 | ) | (1,833 | ) | — | — | (57,535 | ) | |||||||||||
Financing activities: | |||||||||||||||||||
Decrease in restricted cash | — | 80 | — | — | 80 | ||||||||||||||
Payments under notes payable obligations | (296,610 | ) | — | — | — | (296,610 | ) | ||||||||||||
Debt issuance costs | (10,201 | ) | — | — | — | (10,201 | ) | ||||||||||||
Principal repayments on capital lease obligations | (5,179 | ) | — | — | — | (5,179 | ) | ||||||||||||
Proceeds from issuance of stock | 1,540 | — | — | — | 1,540 | ||||||||||||||
Tax benefit from equity awards | 681 | — | — | — | 681 | ||||||||||||||
Repurchase of restricted stock awards and common stock | (12,201 | ) | — | — | — | (12,201 | ) | ||||||||||||
Distribution to parent | — | (203,772 | ) | (618 | ) | 204,390 | — | ||||||||||||
Net cash used in financing activities | (321,970 | ) | (203,692 | ) | (618 | ) | 204,390 | (321,890 | ) | ||||||||||
Effect of foreign exchange rates on cash and cash equivalents | (1,477 | ) | 9 | 2,100 | — | 632 | |||||||||||||
Net decrease in cash and cash equivalents | (26,190 | ) | (12,055 | ) | (5,079 | ) | — | (43,324 | ) | ||||||||||
Cash and cash equivalents at beginning of period | 48,061 | 27,092 | 13,944 | — | 89,097 | ||||||||||||||
Cash and cash equivalents at end of period | $ | 21,871 | $ | 15,037 | $ | 8,865 | $ | — | $ | 45,773 | |||||||||
90
18. QUARTERLY FINANCIAL INFORMATION (UNAUDITED)
The following is unaudited quarterly financial information for the two year period ended December 31, 2016. In management’s opinion, the unaudited financial information has been prepared on the same basis as the audited information and includes all adjustments (consisting only of normal recurring adjustments) necessary for fair presentation of the quarterly financial information presented.
Quarter Ended | |||||||||||||||
Mar. 31, 2015 | Jun. 30, 2015 | Sep. 30, 2015 | Dec. 31, 2015 | ||||||||||||
(in thousands, except per share data) | |||||||||||||||
Summary consolidated statement of operations: | |||||||||||||||
Revenue | $ | 251,388 | $ | 256,767 | $ | 261,653 | $ | 280,150 | |||||||
Income from operations | 79,461 | 78,110 | 80,736 | 48,249 | |||||||||||
Net income | 46,214 | 45,058 | 50,282 | 33,908 | |||||||||||
Net income per common share - basic | $ | 0.83 | $ | 0.81 | $ | 0.93 | $ | 0.64 | |||||||
Net income per common share - diluted | $ | 0.81 | $ | 0.80 | $ | 0.91 | $ | 0.62 | |||||||
Quarter Ended | |||||||||||||||
Mar. 31, 2016 | Jun. 30, 2016 | Sep. 30, 2016 | Dec. 31, 2016 | ||||||||||||
(in thousands, except per share data) | |||||||||||||||
Summary consolidated statement of operations: | |||||||||||||||
Revenue | $ | 287,298 | $ | 297,565 | $ | 300,081 | $ | 324,903 | |||||||
Income from operations | 64,411 | 71,366 | 67,151 | 89,094 | |||||||||||
Net income | 31,375 | 38,121 | 53,031 | 46,119 | |||||||||||
Net income per common share - basic | $ | 0.58 | $ | 0.70 | $ | 0.97 | $ | 0.84 | |||||||
Net income per common share - diluted | $ | 0.57 | $ | 0.69 | $ | 0.96 | $ | 0.82 | |||||||
91
ITEM 9. | CHANGES IN AND DISAGREEMENTS WITH ACCOUNTANTS ON ACCOUNTING AND FINANCIAL DISCLOSURE |
Not applicable.
ITEM 9A. | CONTROLS AND PROCEDURES |
Attached as exhibits to this Form 10-K are certifications of our Chief Executive Officer and Chief Financial Officer, which are required in accordance with Rule 13a-14 of the Securities Exchange Act of 1934, as amended. This “Controls and Procedures” section includes information concerning the controls and controls evaluation referred to in the certifications. The report of Ernst & Young LLP, our independent registered public accounting firm, regarding its audit of our internal control over financial reporting is set forth below in this section. This section should be read in conjunction with the certifications and the Ernst & Young report for a more complete understanding of the topics presented.
Evaluation of Disclosure Controls and Procedures
We conducted an evaluation of the effectiveness of the design and operation of our “disclosure controls and procedures” as of the end of the period covered by this Form 10-K. The controls evaluation was conducted under the supervision and with the participation of management, including our Chief Executive Officer and Chief Financial Officer. Disclosure controls are controls and procedures designed to reasonably assure that information required to be disclosed in our reports filed under the Securities Exchange Act of 1934, such as this Form 10-K, is recorded, processed, summarized and reported within the time periods specified in the SEC’s rules and forms. Disclosure controls are also designed to reasonably assure that such information is accumulated and communicated to our management, including the Chief Executive Officer and Chief Financial Officer, as appropriate to allow timely decisions regarding required disclosure. Our quarterly evaluation of disclosure controls includes an evaluation of some components of our internal control over financial reporting, and internal control over financial reporting is also separately evaluated on an annual basis for purposes of providing the management report which is set forth below.
The evaluation of our disclosure controls included a review of the controls’ objectives and design, our implementation of the controls and their effect on the information generated for use in this Form 10-K. In the course of the controls evaluation, we reviewed identified data errors, control problems or indications of potential fraud and, where appropriate, sought to confirm that appropriate corrective actions, including process improvements, were being undertaken. This type of evaluation is performed on a quarterly basis so that the conclusions of management, including the Chief Executive Officer and Chief Financial Officer, concerning the effectiveness of the disclosure controls can be reported in our periodic reports on Form 10-Q and Form 10-K. Many of the components of our disclosure controls are also evaluated on an ongoing basis by our finance organization. The overall goals of these various evaluation activities are to monitor our disclosure controls, and to modify them as necessary. Our intent is to maintain the disclosure controls as dynamic systems that change as conditions warrant.
Based upon the controls evaluation, our Chief Executive Officer and Chief Financial Officer have concluded that, as of the end of the period covered by this Form 10-K, our disclosure controls were effective to provide reasonable assurance that information required to be disclosed in our report filed under the Securities Exchange Act of 1934 is recorded, processed, summarized and reported within the time periods specified by the SEC, and that material information related to NeuStar and its consolidated subsidiaries is made known to management, including the Chief Executive Officer and Chief Financial Officer, particularly during the period when our periodic reports are being prepared. We reviewed the results of management’s evaluation with the Audit Committee of our Board of Directors.
Management Report on Internal Control Over Financial Reporting
Our management is responsible for establishing and maintaining effective internal control over financial reporting to provide reasonable assurance regarding the reliability of our financial reporting and the preparation of financial statements for external purposes in accordance with U.S. GAAP. Internal control over financial reporting includes those policies and procedures that (i) pertain to the maintenance of records that in reasonable detail accurately and fairly reflect the transactions and dispositions of the assets of the Company; (ii) provide reasonable assurance that transactions are recorded as necessary to permit preparation of financial statements in accordance with U.S. GAAP; and (iii) provide reasonable assurance regarding authorization to effect the acquisition, use or disposition of Company assets, as well as the prevention or timely detection of unauthorized acquisition, use or disposition of the Company’s assets that could have a material effect on the consolidated financial statements.
Management assessed our internal control over financial reporting as of December 31, 2016, the end of our fiscal year. Management based its assessment on criteria established in Internal Control — Integrated Framework issued by the Committee
92
of Sponsoring Organizations of the Treadway Commission (2013 framework). Management’s assessment included evaluation of such elements as the design and operating effectiveness of key financial reporting controls, process documentation, accounting policies and our overall control environment. This assessment is supported by testing and monitoring performed by our finance organization.
Based on this assessment, management has concluded that our internal control over financial reporting was effective as of the end of the fiscal year to provide reasonable assurance regarding the reliability of financial reporting and the preparation of financial statements for external reporting purposes in accordance with U.S. GAAP.
Our independent registered public accounting firm, Ernst & Young LLP, independently assessed the effectiveness of the Company’s internal control over financial reporting. Ernst & Young has issued an attestation report, which is included at the end of this section.
Inherent Limitations on Effectiveness of Controls
A control system, no matter how well designed and operated, can provide only reasonable, not absolute, assurance that the control system’s objectives will be met. The design of a control system must reflect the fact that there are resource constraints, and the benefits of controls must be considered relative to their costs. Other inherent limitations include the realities that judgments in decision-making can be faulty and that breakdowns can occur because of simple error or mistake. Controls can also be circumvented by the individual acts of some persons, by collusion of two or more people, or by management override of the controls. Projections of any evaluation of controls effectiveness to future periods are subject to risks. Over time, controls may become inadequate because of changes in conditions or deterioration in the degree of compliance with policies or procedures.
Changes in Internal Control over Financial Reporting
On a quarterly basis we evaluate any changes to our internal control over financial reporting to determine if material changes occurred. There were no changes in our internal controls over financial reporting during the quarterly period ended December 31, 2016 that have materially affected, or are reasonably likely to materially affect, our internal control over financial reporting.
93
REPORT OF INDEPENDENT REGISTERED PUBLIC ACCOUNTING FIRM
Board of Directors and Stockholders
NeuStar, Inc.
We have audited NeuStar, Inc.’s internal control over financial reporting as of December 31, 2016, based on criteria established in Internal Control — Integrated Framework issued by the Committee of Sponsoring Organizations of the Treadway Commission (2013 framework) (the COSO criteria). NeuStar, Inc.’s management is responsible for maintaining effective internal control over financial reporting, and for its assessment of the effectiveness of internal control over financial reporting included in the accompanying Management Report on Internal Control Over Financial Reporting. Our responsibility is to express an opinion on the company’s internal control over financial reporting based on our audit.
We conducted our audit in accordance with the standards of the Public Company Accounting Oversight Board (United States). Those standards require that we plan and perform the audit to obtain reasonable assurance about whether effective internal control over financial reporting was maintained in all material respects. Our audit included obtaining an understanding of internal control over financial reporting, assessing the risk that a material weakness exists, testing and evaluating the design and operating effectiveness of internal control based on the assessed risk, and performing such other procedures as we considered necessary in the circumstances. We believe that our audit provides a reasonable basis for our opinion.
A company’s internal control over financial reporting is a process designed to provide reasonable assurance regarding the reliability of financial reporting and the preparation of financial statements for external purposes in accordance with generally accepted accounting principles. A company’s internal control over financial reporting includes those policies and procedures that (1) pertain to the maintenance of records that, in reasonable detail, accurately and fairly reflect the transactions and dispositions of the assets of the company; (2) provide reasonable assurance that transactions are recorded as necessary to permit preparation of financial statements in accordance with generally accepted accounting principles, and that receipts and expenditures of the company are being made only in accordance with authorizations of management and directors of the company; and (3) provide reasonable assurance regarding prevention or timely detection of unauthorized acquisition, use, or disposition of the company’s assets that could have a material effect on the financial statements.
Because of its inherent limitations, internal control over financial reporting may not prevent or detect misstatements. Also, projections of any evaluation of effectiveness to future periods are subject to the risk that controls may become inadequate because of changes in conditions, or that the degree of compliance with the policies or procedures may deteriorate.
In our opinion, NeuStar, Inc. maintained, in all material respects, effective internal control over financial reporting as of December 31, 2016, based on the COSO criteria.
We also have audited, in accordance with the standards of the Public Company Accounting Oversight Board (United States), the consolidated balance sheets of NeuStar, Inc. as of December 31, 2015 and 2016, and the related consolidated statements of operations, comprehensive income, stockholders’ equity, and cash flows for each of the three years in the period ended December 31, 2016 and our report dated March 1, 2017 expressed an unqualified opinion thereon.
/s/ ERNST & YOUNG LLP
Baltimore, Maryland
March 1, 2017
94
ITEM 9B. | OTHER INFORMATION |
None.
PART III
ITEM 10. | DIRECTORS, EXECUTIVE OFFICERS AND CORPORATE GOVERNANCE |
BOARD OF DIRECTORS
Name and Age as of March 1, 2017 | Position, Principal Occupation, Business Experience and Directorships | |
Paul D. Ballew Age 53 | Mr. Ballew has served as a director of Neustar since 2015. Since December 2014, Mr. Ballew has served as Global Chief Data and Analytics Officer at the Ford Motor Company, a global automotive and mobility company. From 2012 to 2015, Mr. Ballew was Chief Data, Insights & Analytics Officer at Dun & Bradstreet Corporation, a source of commercial information and insight on businesses. Prior to joining Dun & Bradstreet, Mr. Ballew held senior positions in data and customer analytics at Nationwide Mutual Insurance Company, General Motors Corporation, and JD Power Associates, as well as having been an economist at the Federal Reserve Bank of Chicago. Mr. Ballew was selected as a director because of his extensive experience in identity management, customer marketing and security services. Mr. Ballew also provides valuable insight regarding the Company’s current products and services and the future technological needs of the Company and the industry. Through his years of executive and technological leadership, Mr. Ballew provides the Board with operations and technology experience, as well as important perspectives on innovation, management development, and global challenges and opportunities. | |
James G. Cullen Age 74 | Mr. Cullen has served as a director of Neustar since 2005 and as our Chairman of the Board since 2010. Mr. Cullen retired as President and Chief Operating Officer of Bell Atlantic Corporation, a local telephone exchange carrier, in 2000. He had assumed those positions in 1998, after having been Vice Chairman since 1995 and, prior to that, President since 1993. He was President and Chief Executive Officer of Bell Atlantic-New Jersey, Inc. from 1989 to 1993. Mr. Cullen is also a director, finance committee member and investment committee member of Prudential Financial, Inc., chairman of the nominating/corporate governance committee and non-executive Chairman of the Board of Agilent Technologies, Inc., a director, nominating/corporate governance committee member and chairman of the compensation committee of Keysight Technologies, Inc., a director, compensation committee member and chairman of the nominating and corporate governance committee of Avinger, Inc., and, through April of 2015, a director and chairman of the audit committee of Johnson & Johnson. Mr. Cullen was selected as a director because of his expansive knowledge of the communications industry, his executive leadership experience, his financial expertise, and his background serving on the boards of large, multinational public companies. Mr. Cullen’s ability to communicate and encourage discussion, together with his experience as a senior director on other boards, makes him an effective Chairman for the Board. | |
95
Name and Age as of March 1, 2017 | Position, Principal Occupation, Business Experience and Directorships | |
Joel P. Friedman Age 69 | Mr. Friedman has served as a director of Neustar since 2006. As the former President of the Business Process Outsourcing, or BPO, organization of Accenture Ltd., a consulting services company, a position he held from 2002 until his retirement in 2005, Mr. Friedman was responsible for overseeing Accenture’s portfolio of BPO businesses as well as fueling new innovation and growth in BPO. He was a member of Accenture’s Board of Directors until February 2005 and also served on that company’s Executive Committee and Global Leadership Council. Over the course of his 34-year career with Accenture, a national consulting firm, Mr. Friedman held a variety of senior leadership roles. He was a partner in Accenture’s Corporate Development organization; served as managing general partner of the company’s former venture capital business, Accenture Technology Ventures; led Accenture’s banking and capital markets program; and was instrumental in founding and managing Accenture’s strategy consulting practice. Mr. Friedman is also a director, governance committee member and chairman of the finance committee of SVB Financial Group. Mr. Friedman was selected as a director because of the valuable management experience he brings to the Board. Over the course of his career, Mr. Friedman has led and directed complex business organizations and gained significant experience in corporate development, strategic consulting, compensation and employee management. | |
Mark N. Greene Age 62 | Dr. Greene has served as a director of our company since April 2012. From December 2012 to September 2015, Dr. Greene served as the Chief Executive Officer and a director of OpenLink Financial LLC, a provider of software solutions for transaction lifecycle management. From 2008 to 2012, Dr. Greene served on the board of directors of Capella Education Co. From 2007 to 2012, Dr. Greene was the Chief Executive Officer and a director of Fair Isaac Corporation, or FICO, a provider of credit scoring, decision management, fraud detection and credit risk score services. From 1995 through 2007, Dr. Greene held various positions with International Business Machines Corp., a global technology company, including Vice President of Sales and Distribution for Financial Services and General Manager of Global Banking. Dr. Greene is also a member of the board of directors of Renaissance Learning Inc. and OpenLink Financial LLC. Dr. Greene was selected as a director because of his extensive management experience and knowledge of analytics. Over the course of his career, Dr. Greene has led and directed complex business organizations and gained significant experience in capital markets, consulting e-commerce software, strategy, sales and marketing and distribution. | |
Lisa A. Hook Age 59 | Ms. Hook has served as a director of Neustar since November 2010, as Chief Executive Officer since October 2010, and as President since joining Neustar in January 2008. Prior to joining Neustar, Ms. Hook served as President and Chief Executive Officer of Sunrocket, Inc., a voice over IP, or VOIP, service provider, from 2006 to 2007. From 2001 to 2004, she held several executive-level posts at America Online, Inc., a web services company, including President, AOL Broadband, Premium and Developer Services; President, AOL Anywhere; and Senior Vice President and Chief Operating Officer, AOL Mobile. After leaving America Online in 2004, Ms. Hook briefly consulted for AOL and served on various corporate boards. Earlier, she was partner at Brera Capital Partners, LLC and managing director at Alpine Capital Group LLC. Ms. Hook also served in executive and special advisory roles at Time Warner, Inc., was legal adviser to the Chairman of the Federal Communications Commission, and was a senior attorney at Viacom International, Inc. Ms. Hook also serves on the board of directors of Vantiv, Inc. and previously served on the boards of directors of RELX PLC, RELX NV and RELX Group plc (formerly, Reed Elsevier PLC, Reed Elsevier NV and Reed Elsevier Group plc, respectively) from 2006 to April 2016. Ms. Hook was selected as CEO and director of Neustar because of her rich knowledge of the company, having served as Neustar’s President, combined with her proven ability to realign corporate strengths with evolving market opportunities. Ms. Hook brings almost 30 years of senior management experience in the communications, media and technology industries as well as extensive experience on corporate boards. | |
96
Name and Age as of March 1, 2017 | Position, Principal Occupation, Business Experience and Directorships | |
Ross K. Ireland Age 70 | Mr. Ireland has served as a director of Neustar since 2006. Mr. Ireland retired as Senior Executive Vice President of Services and Chief Technology Officer of SBC Communications Inc., a telecommunications services provider, in 2004. He assumed these positions in 1997 when Pacific Telesis Group merged with SBC Communications Inc. He served Pacific Telesis Group in various capacities from 1966 to 1997, including as Vice President and Chief Technology Officer from 1990 to 1997. Mr. Ireland was also a member of the Board of Directors of the Alliance for Telecommunications Industry Solutions, or ATIS, a not-for-profit corporation that provides telecom industry standards and industry operating practices, from 1990 through 2004, including as the Chairman of the Board of ATIS from 2000 through 2004. From 2008 to 2013, Mr. Ireland served as a director, audit committee member, compensation committee member and nominating and corporate governance committee member of Adtran, Inc. Mr. Ireland was selected as a director because of his extensive knowledge of the telecommunications industry and its standards and practices, in addition to his broad technological expertise and senior leadership. Through his service on other company boards, Mr. Ireland also brings valuable experience in audit, compensation and governance matters. | |
Paul A. Lacouture Age 66 | Mr. Lacouture has served as a director of Neustar since 2007. Mr. Lacouture retired as Executive Vice President of Engineering and Technology for Verizon Telecom, a telecommunications services provider, in 2007, a position he had held since 2006. From 2000 to 2006, he was president of the Verizon Network Services Group, a telecommunications services provider. Prior to the Bell Atlantic/GTE merger in July 2000, Mr. Lacouture was president of the Network Services group at Bell Atlantic. Mr. Lacouture was selected as a director based on his many years of experience in the telecommunications industry and his knowledge and understanding of our client base. Mr. Lacouture also provides valuable insight regarding the Company’s current products and services, as well as the future technological needs of the Company and the industry. | |
Deborah Rieman Age 66 | Dr. Rieman has served as a director of Neustar since 2015. Dr. Rieman is retired as the executive chairman of MetaMarkets Group, a real-time analytics platform for the digital advertising space, in September 2015. Previously, she was managing director of Equus Management Company, a private investment fund. From 1995 to 1999, she served as president and chief executive officer of Check Point Software Technologies, Incorporated, an international provider of software and combined hardware and software products. Dr. Rieman is also a director, audit committee member and chairman of the compensation committee of Corning, Inc. Dr. Rieman previously served on the Board of Directors of Keynote Systems from 2002 to 2012. Dr. Rieman was selected as a director based on her significant expertise in information technology, innovation and entrepreneurial endeavors to the Board and skills related to her Ph.D. in mathematics. She is also the former president and chief executive officer of a software company specializing in security and has experience in technology development, marketing, business development and support, investor relations and investing. The Board also benefits from Dr. Rieman's experience as a public company director and audit committee and compensation committee member. | |
97
Name and Age as of March 1, 2017 | Position, Principal Occupation, Business Experience and Directorships | |
Michael J. Rowny Age 66 | Mr. Rowny has served as a director of Neustar since 2006. Mr. Rowny has been Chairman of Rowny Capital, a private equity firm, since 1999. From 1994 to 1999, and previously from 1983 to 1986, Mr. Rowny was with MCI Communications Corporation in positions including President and Chief Executive Officer of MCI’s International Ventures, Alliances and Correspondent group; acting Chief Financial Officer; Senior Vice President of Finance; and Treasurer. His extensive career in business and government has included positions as Chairman and Chief Executive Officer of the Ransohoff Company, Chief Executive Officer of Hermitage Holding Company, Executive Vice President and Chief Financial Officer of ICF Kaiser International, Inc., Vice President of the Bendix Corporation, and Deputy Staff Director of The White House. Mr. Rowny is also a director and audit committee member of Ciena Corporation. Mr. Rowny was selected as a director because of his extensive executive leadership and international experience, his financial expertise, and his understanding of business opportunities, both as concerns acquisition targets and the industry in general. The Board also benefits from Mr. Rowny’s experience as a public company director and audit committee member. | |
Hellene S. Runtagh Age 68 | Ms. Runtagh has served as a director of Neustar since 2006. Ms. Runtagh retired from her position as President and Chief Executive Officer of Berwind Group, a diverse company with global businesses in pharmaceutical services, life science automation, industrial manufacturing, real estate, and natural resources, in 2002. Prior to joining Berwind in 2001, Ms. Runtagh was with Universal Studios, where she last served as Executive Vice President. In this role, Ms. Runtagh was responsible for Studio, Consumer Products, Interactive Games, Information Technology, Online Operations, and retail operations at Universal Studios. Prior to joining Universal Studios, Ms. Runtagh spent 25 years at General Electric Company, or GE, where she served as President and Chief Executive Officer of GE Information Services and held general management roles with GE Capital and GE’s software businesses. Ms. Runtagh has also held numerous leadership positions, including international operations, marketing and manufacturing, for multiple high technology GE businesses. Ms. Runtagh is also a director, nominating and governance committee member and compensation and executive development committee member of Lincoln Electric Holdings, Inc. and a director, audit committee member and compensation committee member of Harman International Industries, Inc. Ms. Runtagh previously served on the boards of directors of Avaya Inc. from 2003 to 2007, IKON Office Solutions, Inc. from 2007 to 2008 and Covad Communications Group, Inc. from 1999 to 2006. Ms. Runtagh was selected as a director based on her strong record of senior-level experience and her insight into the considerations necessary to run a successful, diverse global business. Ms. Runtagh’s service on other public company boards also allows her to provide the Board with a variety of perspectives on important corporate governance, audit and compensation issues. | |
EXECUTIVE OFFICERS AND MANAGEMENT
Below is information, including biographical information, about our current senior executives (other than Ms. Hook, whose biographical information appears above).
Name | Age(1) | Position | ||
Paul S. Lalljie | 44 | Senior Vice President and Chief Financial Officer | ||
Leonard J. Kennedy | 65 | Senior Vice President and General Counsel | ||
Steven J. Edwards | 58 | Senior Vice President, Data Solutions | ||
Venkat Achanta | 44 | Senior Vice President, Chief Data & Analytics Officer | ||
Brian Foster | 47 | Senior Vice President, Information Services | ||
Henry Skorny | 52 | Senior Vice President, Internet of Things | ||
(1) | As of March 1, 2017. |
98
Paul S. Lalljie has served as our Senior Vice President and Chief Financial Officer since June 2009. Prior to becoming our Senior Vice President and Chief Financial Officer, Mr. Lalljie served as our Senior Vice President, Interim Chief Financial Officer and Treasurer from January 2009 to June 2009 and as our Vice President, Financial Planning & Analysis and Treasurer from December 2006 to January 2009. From 2000 through December 2006, Mr. Lalljie served in a variety of roles in corporate finance at the Company, including accounting, financial planning and analysis, treasury and investor relations.
Leonard J. Kennedy has served as Senior Vice President and General Counsel since May 2013. Prior to joining us, Mr. Kennedy served, from June 2012 to May 2013, as a Senior Advisor and Counselor to the Director of the Consumer Financial Protection Bureau, or CFPB, and, from January 2011 to June 2012, as the General Counsel of the CFPB. From August of 2005 to October 2008, Mr. Kennedy served as Senior Vice President and General Counsel, Corporate Secretary and Chief Government Affairs Officer of Sprint-Nextel Corporation. From January 2001 to August 2005, Mr. Kennedy served as Senior Vice President and General Counsel of Nextel Corporation.
Steven J. Edwards has served as Senior Vice President, Data Solutions since October 2013. Prior to serving as our Senior Vice President, Data Solutions, Mr. Edwards served, since 2011, as our Senior Vice President, Carrier Services. Prior to becoming our Senior Vice President, Carrier Services, Mr. Edwards served in a variety of Carrier Services roles from August 2008 through August 2011. Prior to joining Neustar, from 2007 to 2008 Mr. Edwards was Chief Operating Officer at Regenesis Power LLC, a renewable energy venture, where he was responsible for developing Regenesis Power’s business model, operations and project financing. From 2004 to 2007, Mr. Edwards served as Chief Marketing Officer for Sonus Networks Inc., a provider of carrier-grade VoIP technology, where he was responsible for market strategy, product management, business development, partner channels, and product and corporate marketing. Prior to Sonus Networks Inc., he was Vice President of indirect sales and channel development at AT&T Business Services and was President of BT Visual Images, a BT Group company.
Venkat Achanta has served as Senior Vice President, Chief Data and Analytics Officer, since July 2016. Prior to serving as our Senior Vice President, Chief Data and Analytics Officer, Mr. Achanta served, from 2014 to 2016, as the Chief Data Officer at Wal-Mart Stores Inc., a retail and wholesale business, where he was responsible for all data and analytics delivery platforms across the company. From 2013 to 2014, Mr. Achanta served as Global Head of Analytics and Big Data at AIG, an insurance company, where he was responsible for all analytics and big data delivery platforms across the company. From 2010 to 2013, Mr. Achanta served as Vice President, Enterprise Data Services at Capital One Financial Corporation, a diversified financial services holding company, where he was responsible for enterprise data services. Prior to Capital One, he was Vice President, Global Product Development and Delivery at Experian plc.
Henry Skorny has served as our Senior Vice President, Internet of Things, since April 2015. Prior to joining us, Mr. Skorny served, from 2011 to 2015, as the Vice President of Software & Services Group and General Manager of the Intel Services Division at Intel Corporation, a multinational technology company, and, from 2009 to 2011, as the Chief Strategy Officer & SVP, Cloud Computing at RealNetworks, Inc., a provider of Internet streaming media delivery software and services From 2007 to 2008, Mr. Skorny served as Executive Vice President at Oz Communications Inc. and CEO & President of Thumbspeed Inc.
Brian Foster has served as Senior Vice President, Information Services, since June 2015. Prior to joining us, Mr. Foster served, from 2013 to 2015, as Chief Technology Officer at Damballa Inc., a computer security company, where he was responsible for advanced research, product strategy, and engineering. From 2012 to 2013, Mr. Foster served as Senior Vice President, Consumer and Mobile Product Management, at McAfee/Intel, a cyber-security company, where he was responsible for the strategy and development of McAfee’s complete portfolio of security solutions. Prior to serving as Senior Vice President, Consumer and Mobile Product Management at McAfee/Intel, Mr. Foster served in a variety of roles in product management at McAfee.
Director Nomination Process
As of the date of this report, there have been no material changes to the procedures by which stockholders may recommend nominees to our Board as described in the section entitled “Nominations for Election of Directors” in our Definitive Proxy Statement filed with the SEC on April 29, 2016.
Audit Committee
Our Board of Directors has a standing Audit Committee established in accordance with Section 3(a)(58)(a) of the Exchange Act. In fiscal 2016, the Audit Committee membership was as follows: Messrs. Rowny (Chair), Ballew and Friedman and Ms. Runtagh. Our board of directors has determined that each member of the Audit Committee currently and during fiscal 2016 met the applicable independence, experience and other requirements of the Exchange Act, New York Stock Exchange and the SEC. Our board of directors has determined that Mr. Rowny is an “audit committee financial expert” as defined by
99
applicable New York Stock Exchange and SEC rules. The Board has determined that each member of the Audit Committee is independent, as defined by the Company’s director independence standards and the rules of the New York Stock Exchange and the Securities and Exchange Commission, and that Mr. Rowny is an “audit committee financial expert” as defined by the Securities and Exchange Commission.
The members of the Audit Committee as of the date of Annual Report on Form 10-K are Messrs. Rowny (Chair), Ballew and Friedman and Ms. Runtagh.
Code of Business Conduct
Our Board has adopted a Corporate Code of Business Conduct (the “Code”) applicable to all of our directors, senior executives, employees and contractors providing services to or on behalf of the Company.
The Code embodies general principles such as compliance with laws, acting with honesty and integrity, avoidance of conflicts of interest, maintenance of accurate and timely financial and business records, use of the Company’s assets, working with customers, suppliers and governments, prohibition of political contributions on behalf of the Company, and protecting the Company’s information and information regarding other companies. All directors, senior executives, employees and contractors are obligated to report violations and suspected violations of the Code in accordance with the reporting procedures described in the Code.
Our Code is available on our website at www.neustar.biz under the captions “Company - Investor Relations - Corporate Information - Code of Conduct.” We intend to disclose on this website any amendments to the Code or grants of waivers from provisions of the Code that require disclosure under applicable Securities and Exchange Commission rules. A free printed copy is available to any stockholder who requests it from us.
SECTION 16(a) BENEFICIAL OWNERSHIP REPORTING COMPLIANCE
Section 16(a) of the Exchange Act requires our directors, senior executives and beneficial owners of greater than 10 percent of our common stock (the “Reporting Persons”) to file reports of holdings and transactions in Neustar common stock with the Securities and Exchange Commission and the New York Stock Exchange.
Based solely on these reports and other information provided to us by the Reporting Persons, we believe that all Reporting Persons timely filed the required reports during fiscal year 2016, except for Brian Foster, Hank Skorny, and Venkat Achanta, who each had one late Section 16(a) filing, due to an administrative error by the Company.
100
ITEM 11. | EXECUTIVE COMPENSATION |
Executive Summary
Compensation Strategy
The main objectives of our pay-for-performance compensation program are to:
• | motivate our executives to maximize stockholder value; |
• | provide compensation that varies based on performance; and |
• | compete for and retain managerial talent, without promoting unreasonable risk taking. |
These guiding principles apply to all of our executive pay practices discussed.
On December 14, 2016, we announced that we entered into a definitive merger agreement to be acquired by a private investment group led by Golden Gate Capital. Under the terms of the merger agreement, our stockholders will be entitled to receive $33.50 per share following the closing of the proposed merger. The merger, which is expected to close no later than the end of the third quarter of 2017, is subject to approval by our stockholders, regulatory approvals and other customary closing conditions.
Named Executive Officers
Our NEOs for 2016 are: our President and Chief Executive Officer, Lisa Hook; our Senior Vice President and Chief Financial Officer, Paul Lalljie; our Senior Vice President and General Counsel, Leonard J. Kennedy; our Senior Vice President Data Strategy, Steven Edwards; and our Chief Data and Analytics Officer, Venkat Achanta. Mr. Achanta joined the Company in July 2016.
101
Pay-for Performance Analysis
Our executive compensation program reflects a strong pay-for-performance alignment tied with Company and stock price performance. Consistent with our executive compensation philosophy, a significant majority of our NEOs’ total direct compensation for 2016 was at risk. Total direct compensation includes base salary, 2016 target annual cash incentive awards, and the allocable portion of PVRSUs, RSUs and cash retention awards.
Over 92% of our CEO’s target total direct compensation (and 86% of our other NEO’s target total direct compensation) is at-risk, aligning pay with results | |
Annual Cash Incentive Compensation: • Tied to Company and individual performance• Designed to reward achievement of annual performance goals that we consider important contributors to stockholder value• Performance goals and targets are established by the Compensation Committee at the beginning of each year• The Compensation Committee approves annual cash incentive award payouts based on the level of achievement of pre-established performance goals | Long-Term Equity-Based Incentive Compensation: • Variable compensation designed to reward contributions to our long-term strategic, financial and operational success, motivate future performance, align the interests of senior executives with those of stockholders and retain key senior executives through the term of the awards• PVRSUs are fully at risk and depend upon the achievement of key performance measures that drive value for our stockholders thus aligning the interests of our senior executives with our stockholders• Award levels and types of equity granted take into consideration market data about our competitors, market practice and the value of existing grants held by senior executives and the vesting profiles of such grants• Restricted stock units serve both to reward and retain senior executives over the term of the awards |
Performance Goals: The Compensation Committee sets annual performance targets for these programs at the beginning of the year based on then-current expectations of the business environment and strategic goals. | |
2016 Say-on-Pay Vote
Our current policy is to hold an annual advisory vote to approve senior executive compensation. At our 2016 Annual Meeting of Stockholders, our say-on-pay proposal received support from approximately 46% of our stockholders who voted at the meeting. We took into consideration these results when reviewing and designing our compensation program for 2017; however, in light of strategic alternatives that were being considered in 2016, which included the previously planned separation and ultimately resulted in the contemplated merger, we did not make any specific changes to our compensation program as a result of the 2016 say-on-pay vote.
Compensation Objectives and Guiding Principles
Our senior executive compensation program is based on the following:
• | Pay for Performance: The primary objective of our compensation programs is to motivate, recognize and reward superior performance and individual contributions. |
• | Alignment of Interests: We seek to align the interests of our senior executives with those of our stockholders. |
• | Attraction, Motivation, and Retention of Talent: Our senior executive compensation programs are designed to help us attract, motivate and retain key management talent who drive profitability and the creation of stockholder value. |
102
Implementing Compensation Objectives
Determining Compensation
In making compensation decisions, we review the performance of the Company and each senior executive. We also consider the senior executive’s level of responsibility, the importance of the senior executive’s role in achieving our corporate objectives, and the senior executive’s long‑term potential, while taking into account his or her current compensation, value of outstanding equity awards and stock ownership levels, and our stock selling restrictions for senior executives. Finally, we weigh competitive practices, relevant business and organizational changes, retention needs and internal pay equity.
In order to attract, retain and motivate the best management talent, we believe that we must provide a total compensation package that is competitive relative to our peers. To address this challenge, the Compensation Committee considers practices of specific companies that we identified as our peers for executive compensation in 2016 (the “2016 Peer Group”), as well as additional sources of market intelligence.
Each year, the Compensation Committee reviews the peer group as well as other compensation data with the assistance of its external compensation consultant and makes changes as appropriate in order to ensure it continues to appropriately reflect the competitive market to attract, retain and motivate senior executive talent. For 2016, working with Meridian Compensation Partners LLC (“Meridian”), the Compensation Committee removed Informatica Corporation from the Peer Group, and added CoreLogic Inc. and CoStar Group Inc. The Compensation Committee selected the 2016 Peer Group based on multiple factors, including business similarities and broadly comparable financial profiles (i.e., revenue, market capitalization, enterprise value and growth profiles). The 2016 Peer Group that was used for evaluating 2016 senior executive compensation was as follows:
Akamai Technologies, Inc. | CommVault Systems Inc. |
comScore Inc. | CoreLogic Inc. |
CoStar Group Inc. | Equifax Inc. |
ExlService Holdings Inc. | FactSet Research Systems Inc. |
FireEye Inc. | Fortinet Inc. |
IHS Inc. | Jack Henry & Associates, Inc. |
Red Hat, Inc. | TiVo Corporation |
Solera Holdings, Inc. | Synchronoss Technologies |
Syntel, Inc. | Verint Systems Inc. |
VeriSign, Inc. | Verisk Analytics, Inc. |
12 Global Inc. | |
When the Compensation Committee evaluated the 2016 Peer Group, our revenues were positioned at approximately the 53rd percentile compared to the group, our net income was at approximately the 58th percentile, our market capitalization was at approximately the 3rd percentile, our EBITDA margin was at approximately the 88th percentile, and our three-year annualized revenue growth was at approximately the 64th percentile.
In addition to specific peer company data, we considered the compensation survey conducted by Radford, a nationally recognized consulting firm, with a focus on surveys of companies in the high technology sector that have revenues comparable to ours.
After reviewing the survey and peer group data described above, we determined the approximate range within which to target total direct compensation for our senior executives for 2016. Within that range, we incorporated flexibility to respond to and adjust for the evolving business environment and our specific hiring and retention needs.
As described below, individual levels varied from the targeted position for each of the elements of total direct compensation based on the Compensation Committee’s overall subjective evaluation of individual performance, senior executive responsibilities relative to benchmark position responsibilities, and individual skill set and experience.
Role of Compensation Committee and Management
The Compensation Committee has primary responsibility for overseeing the design and implementation of our senior executive compensation programs. The Compensation Committee, with input from the other independent directors, evaluates the performance of the CEO. The Compensation Committee then recommends CEO compensation to the independent directors for approval. The CEO and the Compensation Committee together review the performance of our other senior executives, and the Compensation Committee determines their compensation based on recommendations from the CEO and the Senior Vice
103
President, Human Resources. The CEO, CFO and Senior Vice President, Human Resources also provide information and recommendations to the Compensation Committee regarding Company financial targets under our incentive plans and the cost of the senior executive compensation programs. The other senior executives do not play a role in their own individual compensation determinations, other than discussing individual performance objectives and their performance as compared to their performance objectives with the CEO.
As part of its responsibility for overseeing our compensation programs, the Compensation Committee assists management and the Board in evaluating risks associated with our compensation policies and practices. Compensation risk is discussed in more detail below.
Role of Compensation Consultants
With respect to decisions for 2016 target compensation of the NEOs, competitive review of senior executive and non-employee director compensation programs and peer group review for 2016, the Compensation Committee retained Meridian to review market trends and advise the Compensation Committee. Meridian is the sole compensation consultant of the Compensation Committee. Our Compensation Committee has concluded that Meridian is independent.
The Compensation Committee is directly responsible for the appointment, compensation and oversight of Meridian. Meridian reported directly to the Compensation Committee, although the Compensation Committee instructed Meridian to work with management to compile information and to gain an understanding of the Company and any Company-related issues for consideration by the Compensation Committee, including market trends.
Compensation-Related Governance Policies
Clawbacks
Pursuant to our current clawback provisions, equity grants to senior executives, including our NEOs, contain provisions under which the Company may claw back shares (or the value thereof) if a senior executive engages in fraud, dishonesty, willful misconduct or any other activity deemed detrimental to the Company (including, where permitted by applicable law, any violation of the non-compete, non-solicit, confidentiality, non-disparagement and other obligations included in grant agreements). In addition, we will seek to recover incentive compensation granted to any senior executive as required by any clawback provision or policy prescribed by law or NYSE listing standards.
Stock Ownership and Holding Guidelines
The Company’s stock ownership guidelines apply to senior executive officers of the Company who are required to file reports with the SEC under Section 16 of the Securities and Exchange Act of 1934, as determined by the Board from time to time (the “Executives”), and members of the Board that are not employees of the Company (together with the Executives, the “Participants”). The guidelines are designed to increase Participants’ equity stakes in the Company and to align Participants’ interests more closely with those of our stockholders.
Participants are expected to hold shares of our stock with a value equal to a multiple of (a) salary for the Executives, and (b) the annual retainer for Board service, for the non-employee directors. Each Participant’s required share ownership level is coupled with a retention ratio, as shown in the following table:
Position | Required Share Ownership Level | Retention Ratio Prior to Meeting Guideline | ||
CEO | Shares with a value equal to five times (5x) base salary | 50% | ||
All other Section 16 Officers | Shares with a value equal to three times (3x) base salary | 50% | ||
Non-Employee Directors | Shares with a value equal to five times (5x) the annual retainer of $60,000 | 50% | ||
Shares counted toward meeting the ownership guidelines include shares owned outright by the Participant or his or her spouse, including shares acquired upon the exercise of stock options and shares delivered upon vesting of restricted stock, RSUs or PVRSUs; performance shares earned by the Participant; PVRSUs with respect to which the performance goals have been met but the vesting date has not yet occurred; vested, but unexercised stock options; deferred stock units, including performance shares that have been earned but converted to deferred stock units; shares held in trust that are included in the Participant’s Section 16 ownership reports filed with the Securities and Exchange Commission; and shares held in the Executive’s retirement accounts. Unvested stock options and RSUs or PVRSUs with respect to which the performance goals have not been met do not count toward meeting the ownership guidelines.
104
The guidelines provide that each Participant is expected to retain a percentage (the “retention ratio”) of the after-tax shares received in connection with awards under the Company’s equity compensation program until his or her required ownership level as described in the table above is achieved. For purposes of applying the retention ratio, shares will be calculated using a blended tax rate, and the value of each share will be calculated based on the closing price per share of the stock on the exercise or vesting date, as applicable. Additionally, for purposes of calculating the retention ratio, equity held by an individual prior to becoming a Participant is not subject to the retention ratio.
After a Participant attains his or her required ownership level, the Participant must continue to maintain the required ownership level until he or she is no longer an executive officer who is required to file Section 16 reports with the Securities and Exchange Commission, or a non-employee director, as applicable.
All sales of stock by a Participant are subject to the Company’s policy prohibiting insider trading.
Hedging and Pledging Policies
It is against Company policy for any employee to engage in short-term, speculative or hedging transactions in our securities. Employees are prohibited from trading in puts or calls in our securities and from selling our securities short. Employees are also prohibited from including our securities in a margin account or pledging our securities as collateral for a loan. None of our NEOs have hedged or pledged our securities. Any violation of our policy may result in disciplinary action, including dismissal for cause.
Compensation of the Named Executive Officers
In determining total compensation for our NEOs for 2016, the Compensation Committee reviewed independent market data (at the end of 2015 and early 2016), as well as then-current pay levels of the Company’s senior executives, the Company’s pay philosophy and corporate performance, and the individual performance of the Company’s senior executives.
Base Salary
The Compensation Committee (and the independent directors, in the case of the CEO) approved 2016 base salaries for the NEOs in February 2016. Mr. Achanta's base salary, payable in accordance with his employment offer letter, was approved in connection with his hire following the arms-length negotiation of the terms of his compensation package with the Company.
The following table sets forth the 2016 base salaries for the NEOs:
Name | 2016 Salary | % Increase in Salary 2016 vs. 2015 | |||||
Lisa Hook | $ | 750,000 | 0.0 | % | |||
Paul Lalljie | $ | 500,000 | 4.2 | % | |||
Leonard J. Kennedy | $ | 440,000 | 2.3 | % | |||
Steven Edwards | $ | 400,000 | 0.0 | % | |||
Venkat Achanta | $ | 500,000 | N/A | ||||
Annual Cash Incentive Compensation
The Compensation Committee sets annual performance targets at the beginning of the year based on then-current expectations of the business environment and strategic goals.
The Compensation Committee set performance goals and targets for our 2016 annual cash incentive compensation and weighted a majority of the awards towards the achievement of the Company’s goals. For each of the NEO’s, 70 percent of the annual cash incentive was based upon the Company’s performance, and 30 percent was based on individual performance.
105
The following table sets forth the 2016 annual target cash incentive for the NEOs:
Name | 2015 Target Annual Cash Incentive as percent of Base Salary | 2016 Target Annual Cash Incentive as percent of Base Salary | % Change 2016 vs. 2015 | |||||
Lisa Hook | 125% | 125% | 0.0 | % | ||||
Paul Lalljie | 100% | 100% | 0.0 | % | ||||
Leonard J. Kennedy | 70% | 70% | 0.0 | % | ||||
Steven Edwards | 70% | 70% | 0.0 | % | ||||
Venkat Achanta | N/A | 100% | N/A | |||||
In February 2016, the Compensation Committee established the performance targets for the 2016 Annual Cash Incentive Metrics. The targets for the 2016 Annual Cash Incentive Metrics were set by the Compensation Committee to align the senior executives' interests with the stockholders’ interests in top-line growth and strong profitability. The targets for the 2016 Annual Cash Incentive Metrics were non-GAAP measures of Adjusted Total Revenue of $1,240 million and Adjusted EBITDA of $565 million. For this purpose, (i) Adjusted Total Revenue is total revenue adjusted for acquisitions and the impact of divestitures, and (ii) Adjusted EBITDA is net income plus depreciation and amortization, interest expense and income, other predefined expense (income), provision for income taxes, stock-based compensation expense, restructuring charges, and is adjusted for the impact associated with the annual cash incentive achievement above or below 100% of targets and predefined adjustments, including fees associated with the NPAC vendor selection process.
In January 2017, the Compensation Committee determined that in light of the pendency of the contemplated merger and the terms and conditions of the definitive agreement negotiated in connection therewith, which provided that the Company’s annual cash bonus pool would be funded at 100% of target, the annual incentive compensation for the NEOs for 2016 would no longer be payable based upon the performance metrics described above. Instead, the Compensation Committee awarded annual incentive compensation assuming that the Company performance metrics had been achieved at 100% of target (consistent with the terms of the merger agreement) and that the individual performance goals for each NEO had been achieved at 75% of target. As a result, the Compensation Committee (and the independent directors, in the case of Ms. Hook) determined the NEO's earned the following amounts under the annual cash incentive compensation plan for 2016:
Name | Target Award | Assessment of Performance Against Corporate Goals | Assessment of Performance Against Individual Goals | Calculated Award | Calculated Award as % of Target | Discretionary Bonus | Actual Payout | |||||||||||||||||
Lisa Hook | $ | 937,500 | 100.0 | % | 75.0 | % | $ | 867,188 | 92.5 | % | — | $ | 867,188 | |||||||||||
Paul Lalljie | $ | 500,000 | 100.0 | % | 75.0 | % | $ | 462,500 | 92.5 | % | — | $ | 462,500 | |||||||||||
Leonard J. Kennedy | $ | 308,000 | 100.0 | % | 75.0 | % | $ | 284,900 | 92.5 | % | — | $ | 284,900 | |||||||||||
Steven Edwards | $ | 280,000 | 100.0 | % | 75.0 | % | $ | 259,000 | 92.5 | % | — | $ | 259,000 | |||||||||||
Venkat Achanta(1) | $ | 217,808 | 100.0 | % | 75.0 | % | $ | 201,473 | 92.5 | % | — | $ | 201,473 | |||||||||||
(1) | The target award and calculated award for Mr. Achanta were prorated for the number of days he worked during 2016. |
Cash Retention Awards
To address retention risks in 2015, the Compensation Committee developed and approved a long-term retention plan (authorized under the Company's Corporate Bonus Plan) for certain of its senior executives to provide for the continued execution of the Company's transformational strategy and to mitigate the impacts of a step down in compensation. Ms. Hook and Messrs. Lalljie, Kennedy and Edwards participated in this long-term retention plan. Mr. Achanta did not participate in this long-term retention plan as he was hired in 2016. The long-term retention plan provides for cash awards, one-half of which vested in July 2016 and one-half of which is eligible to vest in July 2017, subject to continued employment and the achievement of information services revenue equal to or in excess of $500 million in 2015, adjusted for the impact of divestitures, and compliance with non-compete, non-solicitation and other customary restrictive covenants.
In February 2016, the Compensation Committee reviewed and certified that the achievement of the information services revenue goal had been achieved based on actual 2015 performance.
106
Equity Compensation (Long-Term Incentive Plan)
2012 Equity Grants
In 2012, the Compensation Committee developed and approved a long-term equity plan for our senior executives, including our NEOs, to support our transformational strategic plan to become a premier real-time information services company. These multi-year awards were a combination of restricted stock units (“RSUs”) and performance restricted stock units (“PVRSUs”), which vest over five years with performance targets that are evaluated annually at the beginning of each year by the Compensation Committee. The 2012 awards were designed to motivate and retain senior executives to achieve strategic, financial, and operational targets over a five-year period, which align with the Company's 2011 transformational strategic plan and the interests of our long-term stockholders. For each of the NEOs, 80% of the value of their 2012 equity compensation award was in the form of PVRSUs, and 20% was in the form of RSUs. This weighting provided a dual focus for our NEOs on both stockholder value creation and long-term operating performance. The RSUs granted in 2012 vest ratably over five years. One-fifth of the PVRSUs awarded in 2012 was allocated to each of five single-year performance periods, the first of which began on January 1, 2012 and ended December 31, 2012, and the last of which began on January 1, 2016 and ended on December 31, 2016. The portion of the PVRSUs earned with respect to the first three performance periods cliff-vested on January 1, 2015 and the portion of the award earned with respect to the fourth performance period vested on January 1, 2016, and the portion of the award earned with respect to the final performance period vested on January 1, 2017.
2015 Equity Grants
In February 2015, the Compensation Committee approved a long-term incentive grant, with annual performance targets, for our senior executives, including our NEOs, to support our transformation into a leading provider of information services.
Other than the sign-on awards granted to Mr. Kennedy in 2013 (as discussed below), there were no equity programs for our named executive officers in 2013 or 2014 as the 2012 multi-year award was intended to cover the 2013 and 2014 periods.
The 2015 awards were designed to motivate and retain senior executives to achieve strategic, financial, and operational targets over a three‑year period, which align their interests with those of our long-term stockholders and encourage retention over a multi-year period. These multi-year awards are a combination of PVRSUs and RSUs. For each of the NEOs other than Mr. Achanta who was hired in 2016, 80 percent of the value of their 2015 equity compensation award was in the form of PVRSUs, and 20 percent was in the form of RSUs. This weighting between PVRSUs and RSUs provided a dual focus for our NEOs on both stockholder value creation and long‑term operating performance, each consistent with our strategic, market and financial goals and our retention needs. The RSUs granted in 2015 vest annually in equal installments over three years. One‑third of the PVRSUs granted in 2015 was allocated to each of three single-year performance periods, the first of which began on January 1, 2015 and ended December 31, 2015, and the last of which began on January 1, 2017 and ends on December 31, 2017. The portion of the PVRSUs, if any, earned with respect to each of the performance periods will vest on March 1, 2018.
In the case of PVRSUs, the Compensation Committee sets each annual performance target at the start of the respective performance period. This permits the Compensation Committee, on an annual basis, to continue to align the performance targets with the strategic goals and the priorities of long-term stockholders as they evolve.
2016 Equity Grants
In February 2016, the Board approved awards of RSUs and PVRSUs to our NEOs. The terms and conditions of these 2016 RSU and PVRSU awards are substantially similar to the terms and conditions of the 2015 RSU and PVRSU Awards, except that to better align the terms of the equity grants with market practice, among other things, the 2016 awards modify the definitions “cause” and “good reason” to be more consistent with those in our 2016 Severance Plan (as described below); provide certain NEOs with rights to benefits upon a qualifying retirement under certain conditions; include a “better-of” cutback provision with respect to excess parachute payments under Sections 280G and 4999 of the Internal Revenue Code of 1986, as amended (the “Code”); and provide for clawback of compensation in the event of a named executive officer’s breach of restrictive covenants. Please see “Potential Payments upon Termination or Change of Control” below for additional information with respect to these cause, good reason, retirement and cutback provisions.
2016 PVRSU Vesting
The Compensation Committee determined that the portion of the PVRSU awards granted in 2016, as well as the portion of the PVRSUs granted in 2012 and 2015 and the portion of the sign-on award granted to Mr. Kennedy in 2013 (each discussed in further detail in prior year proxy statements), in each case allocated to performance in 2016 would be tied to three non-GAAP
107
metrics: adjusted total revenue, weighted at 15 percent of the PVRSU awards; adjusted non-NPAC revenue, weighted at 35 percent of the PVRSU awards; and adjusted net income, weighted at 50 percent of the PVRSU awards; each adjusted for predefined measures (the “2016 PVRSU Metrics”). The targets for the 2016 PVRSU Metrics were set by the Compensation Committee to align the senior executives’ interests with the stockholders’ interests of diversifying revenue, driving top-line growth and delivering strong profitability. Each NEO may earn up to 150 percent of the PVRSUs allocated to each annual performance period subject to the achievement of the respective performance goals for each such performance period.
The table below shows how our 2016 performance compared with the targets set by the Compensation Committee.
Non-GAAP Performance Measure | Target | Performance | Percentage Weighting | Payout Percentage | Funding | ||||||||||||
(in thousands, except percentages) | |||||||||||||||||
Adjusted Total Revenue(1) | $ | 1,240,000 | $ | 1,209,847 | 15.0 | % | 75.7 | % | 11.4 | % | |||||||
Adjusted Non-NPAC Revenue(2) | $ | 735,000 | $ | 697,522 | 35.0 | % | 74.5 | % | 26.1 | % | |||||||
Adjusted Net Income(3) | $ | 288,000 | $ | 294,418 | 50.0 | % | 111.1 | % | 55.5 | % | |||||||
2016 PVRSU Funding | 93.0 | % | |||||||||||||||
(1) | Adjusted total revenue is total revenue adjusted for acquisitions and the impact of divestitures. The Company did not have any adjustments to the total revenue measure for the year ended December 31, 2016 and the amount reflected is the same as GAAP results. Payout percentage is the product of the actual performance and the linear interpolation of payouts ranging from 50% to 150% for corresponding performances between 95% and 105%. |
(2) | Adjusted non-NPAC revenue is adjusted total revenue excluding revenue derived under our contracts with the NAPM, NPAC-related connection services fees and system enhancements and transition services revenue. A reconciliation of our GAAP results to our non-GAAP results can be found in Table 1 under the section “Reconciliation of Non-GAAP Measures” below. Payout percentage is the product of the actual performance and the linear interpolation of payouts ranging from 50% to 150% for corresponding performances between 90% and 110%. |
(3) | Adjusted net income is net income, adjusted for non-cash items, acquisitions and divestitures, and other defined non-recurring items, including fees associated with the NPAC vendor selection process. A reconciliation of our GAAP results to our non-GAAP results can be found in Table 2 under the section “Reconciliation of Non-GAAP Measures” below. Payout percentage is the product of the actual performance and the linear interpolation of payouts ranging from 50% to 150% for corresponding performances between 90% and 110%. |
As reflected in the table above, PVRSUs in respect of 2016 performance were earned, based on actual 2016 performance, at 93.0 percent of the target award levels.
Long-Term Incentive Awards Treatment in Connection with the Merger
The merger agreement provides for the accelerated vesting and cash-out of all Company equity awards.
Severance and Change in Control Arrangements
As discussed under “Potential Payments upon Termination or Change in Control” below, we maintain severance and equity award arrangements that provide benefits to key management employees, including our NEOs, if specified termination or change-in-control events occur.
Other Compensation
Other benefits provided to the NEOs for 2016 include Company contributions to 401(k) plan accounts, which are available to all of our employees, and certain relocation expenses and associated taxes.
Tax Deductibility of Compensation
In general, Section 162(m) of the Internal Revenue Code of 1986, as amended, imposes a limit of $1 million on the amount that a publicly held corporation may deduct for federal income tax purposes for compensation paid to the company’s “covered employees” (generally, its chief executive officer and three other executive officers (other than its chief financial officer) whose
108
compensation is disclosed). This limitation does not apply to compensation that meets the requirements under Section 162(m) for “qualifying performance‑based” compensation (i.e., compensation paid only if performance meets pre‑established, objective goals established by a compensation committee that is comprised solely of two or more “outside directors,” based on criteria approved by stockholders). With respect to the deductibility limit of Section 162(m) of the Internal Revenue Code of 1986, as amended, we generally try to preserve the federal income tax deductibility of compensation paid when it is appropriate and is in our best interest. However, we reserve the right to authorize the payment of non-deductible compensation if we deem that it is appropriate to do so under the circumstances. As a result of the payment of bonuses to certain executives, the Company may incur additional immaterial tax liabilities under 162(m).
COMPENSATION COMMITTEE REPORT
The Compensation Committee has reviewed the Compensation Discussion & Analysis set forth above and has discussed that Analysis with management. Based on its review and discussion with management, the Compensation Committee recommended to the Board of Directors that the Compensation Discussion & Analysis be included in the Company’s Annual Report on Form 10-K for 2017. The following independent directors, who comprise the Compensation Committee, provide this report:
Paul A. Lacouture, Chair
James G. Cullen
Mark N. Greene
Ross K. Ireland
Deborah D. Rieman
The Compensation Committee Report does not constitute soliciting material, and shall not be deemed to be filed or incorporated by reference into any other filing under the Securities Act of 1933, as amended, or the Securities Exchange Act of 1934, as amended, except to the extent that we specifically incorporate the Compensation Committee Report by reference therein.
COMPENSATION RISK
Our compensation programs are designed to balance risk and reward in relation to the Company’s overall business strategy. Management assessed, and the Compensation Committee reviewed, our senior executive and broad-based compensation and benefits programs. Based on this assessment, we have concluded that our compensation policies and practices do not create risks that are reasonably likely to have a material adverse effect on us. Among the program attributes that discourage inappropriate risk-taking are:
• | the balance between annual and long-term compensation, including the fact that a significant portion of compensation is delivered in the form of equity incentives that vest over several years; |
• | the use of multiple financial metrics for performance-based awards and the use of individual goals under our annual cash incentive program; |
• | strong governance policies applicable to our NEOs, other executives, sales force and commissions process, including our compensation recovery (clawback) provisions, which serve as a deterrent to activities that could harm us; |
• | the Compensation Committee’s ability to modify annual cash incentives to reflect the quality of earnings, individual performance, and other factors that it believes should influence compensation; |
• | the use of graded payout curves and capped incentive awards; |
• | our policy against short-term or speculative transactions in our securities; and |
• | our stock ownership guidelines and management stock selling restrictions encourage a longer-term perspective and align the interests of senior executives and the Board, as applicable, with other stockholders. |
Compensation Committee Interlocks and Insider Participation
The members of our Compensation Committee during 2016 were Messrs. Cullen, Ireland, and Lacouture and Drs. Greene and Rieman. No Member of the Compensation Committee during 2016 has been an officer or employee of Neustar or any of our
109
subsidiaries at any time. None of our senior executives serve as a member of the board of directors or compensation committee of any other company that has one or more senior executives serving as a member of our Board or Compensation Committee.
EXECUTIVE COMPENSATION TABLES AND DISCUSSION
Summary Compensation Table
The following table sets forth all compensation paid by us, for the period shown, to our principal executive officer, our principal financial officer and our next three most highly compensated named executive officers. The amounts reported in the Salary column represent base salaries paid to each of the named executive officers for the listed fiscal year. The amounts shown in the Stock Awards and Option Awards columns reflect the grant date fair value of equity awards for 2016 and prior years, not the actual amounts paid to or that may be realized by the named executive officers.
Name and Principal Position | Year | Salary ($) | Bonus(1) ($) | Stock Awards(2) ($) | Option Awards ($) | Non-Equity Incentive Plan Compensation(3) ($) | All Other Compensation(4) ($) | Total ($) | |||||||||||
Lisa Hook President and Chief Executive Officer | 2016 | 750,072 | 867,188 | 5,511,752 | (5) | — | 2,000,000 | 15,900 | 9,144,912 | ||||||||||
2015 | 778,902 | — | 4,257,336 | — | 1,419,469 | 15,900 | 6,471,607 | ||||||||||||
2014 | 747,796 | — | 2,483,150 | — | 980,000 | 15,600 | 4,226,546 | ||||||||||||
Paul Lalljie SVP and Chief Financial Officer | 2016 | 499,784 | 462,500 | 2,873,315 | (6) | — | 1,000,000 | 15,900 | 4,851,499 | ||||||||||
2015 | 498,511 | — | 2,128,517 | — | 762,768 | 15,900 | 3,405,696 | ||||||||||||
2014 | 478,707 | — | 1,241,575 | — | 631,728 | 15,600 | 2,367,610 | ||||||||||||
Leonard J. Kennedy SVP and General Counsel | 2016 | 439,950 | 284,900 | 1,213,888 | (7) | — | 1,900,000 | 15,900 | 3,854,638 | ||||||||||
2015 | 446,596 | — | 955,230 | — | 455,744 | 15,900 | 1,873,470 | ||||||||||||
2014 | 430,057 | — | 310,114 | — | 328,421 | 15,600 | 1,084,192 | ||||||||||||
Steven Edwards SVP Data Solutions | 2016 | 400,109 | 259,000 | 1,088,866 | (8) | — | 500,000 | 591,717 | 2,839,692 | ||||||||||
2015 | 415,422 | — | 837,593 | — | 423,948 | 28,993 | 1,705,956 | ||||||||||||
2014 | 398,434 | — | 476,711 | — | 336,449 | 57,642 | 1,269,236 | ||||||||||||
Venkat Achanta Chief Data and Analytics Officer | |||||||||||||||||||
2016 | 211,599 | 596,473 | (9) | 1,607,960 | (10) | — | — | 137,761 | 2,553,793 | ||||||||||
(1) | Reported amounts (a) include amounts earned with respect to the year shown but paid in the year shown and/or the following year, and (b) exclude amounts earned with respect to performance in the previous year but paid in the year shown. With respect to Mr. Achanta, the amount paid was pro-rated based upon Mr. Achanta’s hire date. Please see “Compensation of the Named Executive Officers -- Annual Cash Incentive Compensation” above for more information regarding bonuses earned with respect to 2016. |
(2) | This column represents the aggregate grant date fair value of RSUs and PVRSUs granted to the named executive officers in the year shown, computed in accordance with Financial Accounting Standards Board Accounting Standards Codification, or FASB ASC, Topic Compensation — Stock Compensation. For information about the assumptions and underlying calculations upon which we base grant date fair value, see Note 12 to our Consolidated Financial Statements in Item 8 of Part II of this report. These amounts may not correspond to the actual value that will be recognized by the NEOs. |
(3) | The 2016 reported amounts within this column represent the first installment of the cash retention awards paid in the year shown. The remaining installment will become payable in July 2017, or if earlier, upon completion of the merger. With respect to Mr. Kennedy, the Company accelerated the payment of $950,000 that would otherwise have been paid in July 2017 in order to mitigate the impact of any excise tax imposed pursuant to Code Section 280G. The 2015 and 2014 reported amounts (a) include amounts earned with respect to the year shown but paid in the year shown and/or the following year, and (b) exclude amounts earned with respect to performance in the previous year but paid in the year shown. |
(4) | See the All Other Compensation table below. |
110
(5) | Consistent with FASB ASC Topic Compensation — Stock Compensation, the grant date fair value of Ms. Hook’s PVRSUs was computed based on target performance. If maximum performance had been used, the grant date fair value of the units awarded to Ms. Hook in 2016 would have been $7,713,185. |
(6) | Consistent with FASB ASC Topic Compensation — Stock Compensation, the grant date fair value of Mr. Lalljie’s PVRSUs was computed based on target performance. If maximum performance had been used, the grant date fair value of the units awarded to Mr. Lalljie in 2016 would have been $4,007,604. |
(7) | Consistent with FASB ASC Topic Compensation — Stock Compensation, the grant date fair value of Mr. Kennedy’s PVRSUs was computed based on target performance. If maximum performance had been used, the grant date fair value of the units awarded to Mr. Kennedy in 2016 would have been $1,694,856. |
(8) | Consistent with FASB ASC Topic Compensation — Stock Compensation, the grant date fair value of Mr. Edwards’s PVRSUs was computed based on target performance. If maximum performance had been used, the grant date fair value of the units awarded to Mr. Edwards in 2016 would have been $1,522,411. |
(9) | Amount includes a sign-on bonus of $395,000 paid to Mr. Achanta which was set forth in his offer letter. |
(10) | Consistent with FASB ASC Topic Compensation — Stock Compensation, the grant date fair value of Mr. Achanta’s PVRSUs was computed based on target performance. If maximum performance had been used, the grant date fair value of the units awarded to Mr. Achanta in 2016 would have been $1,801,208. |
All Other Compensation
The following table describes the components of All Other Compensation in the Summary Compensation Table for each NEO for 2016.
Name | Company Contributions to Individual’s 401(k) Account ($) | Other Benefits(1) ($) | Total ($) | |||||
Lisa Hook | 15,900 | — | 15,900 | |||||
Paul Lalljie | 15,900 | — | 15,900 | |||||
Leonard J. Kennedy | 15,900 | — | 15,900 | |||||
Steven Edwards | — | 591,717 | (2) | 591,717 | ||||
Venkat Achanta | 11,539 | 126,223 | (3) | 137,762 | ||||
(1) | This column includes the total value of other benefits (including perquisites and personal benefits) paid to each named executive officer. To the extent that the total value of perquisites and other personal benefits was less than $10,000, the value of such benefits has been omitted in accordance with Securities and Exchange Commission rules. |
(2) | Other benefits for Mr. Edwards are composed of reimbursement of relocation expenses and associated taxes. |
(3) | Other benefits for Mr. Achanta are composed of reimbursement of relocation expenses and associated taxes. |
2016 Grants of Plan-Based Awards
The following table provides information regarding each plan-based award granted to a named executive officer in 2016. All non-equity incentive plan awards were granted pursuant to the Company’s Corporate Bonus Plan. All equity awards were
111
granted pursuant to the Amended and Restated 2009 Stock Incentive Plan.
Name | Grant Date | Estimated Possible Payouts Under Non-Equity Incentive Plan Awards(1) | Estimated Future Payouts Under Equity Incentive Plan Awards(2) | All Other Stock Awards (#) | All Other Option Awards (#) | Exercise Price of Option Awards ($) | Grant Date Fair Value of Stock and Option Awards ($) | ||||||||||||||||||||||||||
Thres- hold ($) | Target ($) | Maxi- mum ($) | Thres- hold (#) | Target (#) | Maxi- mum (#) | ||||||||||||||||||||||||||||
Lisa Hook | — | — | 937,500 | 1,687,500 | — | — | — | — | — | — | — | ||||||||||||||||||||||
2/23/2016 | — | — | — | 61,584 | 123,708 | 185,562 | — | — | — | 2,924,457 | |||||||||||||||||||||||
4/8/2016 | — | — | — | 30,864 | 61,729 | 92,593 | — | — | — | 1,478,410 | |||||||||||||||||||||||
4/8/2016 | — | — | — | — | — | — | 46,300 | — | — | 1,108,885 | |||||||||||||||||||||||
Paul Lalljie | — | — | 500,000 | 900,000 | — | — | — | — | — | — | — | ||||||||||||||||||||||
2/23/2016 | — | — | — | 30,926 | 61,853 | 92,779 | — | — | — | 1,462,205 | |||||||||||||||||||||||
4/8/2016 | — | — | — | 16,834 | 33,669 | 50,503 | — | — | — | 806,373 | |||||||||||||||||||||||
4/8/2016 | — | — | — | — | — | — | 25,250 | — | — | 604,738 | |||||||||||||||||||||||
Leonard J. Kennedy | — | — | 308,000 | 554,400 | — | — | — | — | — | — | — | ||||||||||||||||||||||
2/23/2016 | — | — | — | 13,239 | 26,478 | 39,717 | — | — | — | 625,940 | |||||||||||||||||||||||
4/8/2016 | — | — | — | 7,014 | 14,029 | 21,043 | — | — | — | 335,995 | |||||||||||||||||||||||
4/8/2016 | — | — | — | — | — | — | 10,520 | — | — | 251,954 | |||||||||||||||||||||||
Steven Edwards | — | — | 280,000 | 504,000 | — | — | — | — | — | — | — | ||||||||||||||||||||||
2/23/2016 | — | — | — | 12,085 | 24,171 | 36,256 | — | — | — | 571,402 | |||||||||||||||||||||||
4/8/2016 | — | — | — | 6,173 | 12,346 | 18,519 | — | — | — | 295,687 | |||||||||||||||||||||||
4/8/2016 | — | — | — | — | — | — | 9,260 | — | — | 221,777 | |||||||||||||||||||||||
Venkat Achanta | — | — | 217,808 | 392,054 | — | — | — | — | — | — | — | ||||||||||||||||||||||
7/27/2016 | — | — | — | 7,920 | 15,840 | 23,760 | — | — | — | 386,496 | |||||||||||||||||||||||
7/27/2016 | — | — | — | — | — | — | 50,060 | — | — | 1,221,464 | |||||||||||||||||||||||
(1) | These columns show the amounts of annual cash incentive compensation that each named executive officer could have received if various levels of performance had been achieved. Amounts are based on executive base salaries and target bonus as of December 31, 2016. Each executive’s actual payout for 2016 is set forth in the Summary Compensation Table above. |
(2) | These columns show the number of shares that each NEO could receive under PVRSUs granted in 2016 if various levels of performance are achieved. The vesting of the PVRSUs is described under “Equity Compensation (Long-Term Incentive Plan” above. |
112
Outstanding Equity Awards at December 31, 2016
The following table provides information regarding unexercised stock options, unvested stock, and equity incentive plan awards outstanding as of December 31, 2016 for each named executive officer.
Option Awards | Stock Awards(1) | |||||||||||||||||||||||
Name | Number of Securities Underlying Unexercised Options (#) Exercisable | Number of Securities Underlying Unexercised Options (#) Unexercisable | Option Exercise Price ($) | Option Expiration Date | Number of Shares or Units of Stock That Have Not Vested (#) | Market Value of Shares or Units of Stock That Have Not Vested ($) | Equity Incentive Plan Awards: Number of Unearned Shares, Units or Other Rights That Have Not Vested (#) | Equity Incentive Plan Awards: Market or Payout Value of Unearned Shares, Units or Other Rights That Have Not Vested ($) | ||||||||||||||||
Lisa Hook | 82,500 | — | 22.82 | 2/23/17 | — | — | — | — | ||||||||||||||||
118,624 | — | 26.45 | 2/22/18 | — | — | — | — | |||||||||||||||||
44,484 | — | 26.45 | 2/22/18 | — | — | — | — | |||||||||||||||||
— | — | — | — | 17,752 | (2) | 592,917 | — | — | ||||||||||||||||
— | — | — | — | 66,037 | (3) | 2,205,636 | — | — | ||||||||||||||||
— | — | — | — | 26,354 | (4) | 880,224 | — | — | ||||||||||||||||
— | — | — | — | 68,982 | (5) | 2,303,999 | — | — | ||||||||||||||||
— | — | — | — | 49,010 | (6) | 1,636,934 | — | — | ||||||||||||||||
— | — | — | — | — | — | 52,702 | (7) | 1,760,247 | ||||||||||||||||
— | — | — | — | 46,300 | (8) | 1,546,420 | — | — | ||||||||||||||||
— | — | — | — | 57,407 | (9) | 1,917,394 | — | — | ||||||||||||||||
— | — | — | — | — | — | 123,461 | (10) | 4,123,598 | ||||||||||||||||
Paul Lalljie | 59,110 | — | 22.82 | 2/23/17 | — | — | — | — | ||||||||||||||||
55,600 | — | 26.45 | 2/22/18 | — | — | — | — | |||||||||||||||||
— | — | — | — | 8,876 | (11) | 296,458 | — | — | ||||||||||||||||
— | — | — | — | 33,018 | (12) | 1,102,801 | — | — | ||||||||||||||||
— | — | — | — | 13,174 | (13) | 440,012 | — | — | ||||||||||||||||
— | — | — | — | 34,490 | (14) | 1,151,966 | — | — | ||||||||||||||||
— | — | — | — | 24,504 | (15) | 818,434 | — | — | ||||||||||||||||
— | — | — | — | — | — | 26,349 | (16) | 880,057 | ||||||||||||||||
— | — | — | — | 25,250 | (17) | 843,350 | — | — | ||||||||||||||||
— | — | — | — | 31,312 | (18) | 1,045,821 | — | — | ||||||||||||||||
— | — | — | — | — | — | 62,341 | (19) | 2,249,190 | ||||||||||||||||
Leonard J. Kennedy | — | — | — | — | 2,770 | (20) | 92,518 | — | — | |||||||||||||||
— | — | — | — | 12,370 | (21) | 413,158 | — | — | ||||||||||||||||
— | — | — | — | 6,587 | (22) | 220,006 | — | — | ||||||||||||||||
— | — | — | — | 12,253 | (23) | 409,250 | — | — | ||||||||||||||||
— | — | — | — | 17,247 | (24) | 573,050 | — | — | ||||||||||||||||
— | — | — | — | — | — | 13,178 | (25) | 440,145 | ||||||||||||||||
— | — | — | — | 10,520 | (26) | 351,368 | — | — | ||||||||||||||||
— | — | — | — | 13,214 | (27) | 441,348 | — | — | ||||||||||||||||
— | — | — | — | — | — | 28,061 | (28) | 937,238 | ||||||||||||||||
Steven Edwards | 3,273 | — | 21.06 | 9/11/18 | — | — | — | — | ||||||||||||||||
13,655 | — | 22.82 | 2/23/17 | — | — | — | — | |||||||||||||||||
19,712 | — | 26.45 | 2/22/18 | — | — | — | — | |||||||||||||||||
— | — | — | — | 3,408 | (29) | 113,827 | — | — | ||||||||||||||||
— | — | — | — | 12,677 | (30) | 423,412 | — | — | ||||||||||||||||
— | — | — | — | 5,274 | (31) | 176,152 | — | — | ||||||||||||||||
— | — | — | — | 13,795 | (32) | 460,753 | — | — | ||||||||||||||||
— | — | — | — | 9,801 | (33) | 327,353 | — | — | ||||||||||||||||
— | — | — | — | — | — | 10,542 | (34) | 352,103 | ||||||||||||||||
— | — | — | — | 9,260 | (35) | 309,284 | — | — | ||||||||||||||||
— | — | — | — | 11,481 | (36) | 383,465 | — | — | ||||||||||||||||
— | — | — | — | — | — | 24,694 | (37) | 824,779 | ||||||||||||||||
Venkat Achanta | — | — | — | — | 38,180 | (38) | 1,275,212 | — | — | |||||||||||||||
— | — | — | — | 11,880 | (39) | 396,792 | — | — | ||||||||||||||||
— | — | — | — | 14,731 | (40) | 492,015 | — | — | ||||||||||||||||
— | — | — | — | — | — | 31,680 | (41) | 1,058,112 | ||||||||||||||||
113
(1) | The merger agreement provides for the accelerated vesting and cash-out of all Company outstanding equity awards. |
(2) | RSUs were granted in February 2012. 17,752 RSUs vested on January 1, 2017. |
(3) | PVRSUs were awarded in February 2012 and vested on January 1, 2017 at 93% of target based on the achievement of 2016 adjusted total revenue, adjusted non-NPAC revenue and adjusted net income goals. |
(4) | RSUs were granted in April 2015. 13,176 RSUs vested on March 1, 2017. The remaining shares will vest on March 1, 2018. |
(5) | PVRSUs were awarded in April 2015 and will vest on March 1, 2018 at 130.9% of target based on achievement of 2015 adjusted total revenue, adjusted non-NPAC revenue and adjusted net income goals. |
(6) | PVRSUs were awarded in April 2015 and will vest on March 1, 2018 at 93% of target based on achievement of 2016 adjusted total revenue, adjusted non-NPAC revenue and adjusted net income goals. |
(7) | PVRSUs were awarded in April 2015. 52,702 PVRSUs will vest on March 1, 2018, based on, and subject to, the achievement of adjusted total revenue, adjusted non-NPAC revenue and adjusted net income goals. The number of units reported is based on maximum performance at 150%, as required by Securities and Exchange Commission rules, and does not necessarily reflect the actual payout to be received by Ms. Hook. |
(8) | RSUs were granted in April 2016. 15,433 RSUs vested on March 1, 2017. The remaining shares will vest in annual installments through March 1, 2019. |
(9) | PVRSUs were awarded in April 2016 and will vest on March 1, 2019 at 93% of target based on achievement of 2016 adjusted total revenue, adjusted non-NPAC revenue and adjusted net income goals. |
(10) | PVRSUs were awarded in April 2016. 123,461 PVRSUs will vest on March 1, 2019, based on, and subject to, the achievement of adjusted total revenue, adjusted non-NPAC revenue and adjusted net income goals. The number of units reported is based on maximum performance at 150%, as required by Securities and Exchange Commission rules, and does not necessarily reflect the actual payout to be received by Ms. Hook. |
(11) | RSUs were granted in February 2012. 8,876 RSUs vested on January 1, 2017. |
(12) | PVRSUs were awarded in February 2012 and vested on January 1, 2017 at 93% of target based on the achievement of 2016 adjusted total revenue, adjusted non-NPAC revenue and adjusted net income goals. |
(13) | RSUs were granted in April 2015. 6,586 RSUs vested on March 1, 2017. The remaining shares will vest on March 1, 2018. |
(14) | PVRSUs were awarded in April 2015 and will vest on March 1, 2018 at 130.9% of target based on achievement of 2015 adjusted total revenue, adjusted non-NPAC revenue and adjusted net income goals. |
(15) | PVRSUs were awarded in April 2015 and will vest on March 1, 2018 at 93% of target based on achievement of 2016 adjusted total revenue, adjusted non-NPAC revenue and adjusted net income goals. |
(16) | PVRSUs were awarded in April 2015. 26,349 PVRSUs will vest on March 1, 2018, based on, and subject to, the achievement of adjusted total revenue, adjusted non-NPAC revenue and adjusted net income goals. The number of units reported is based on maximum performance at 150%, as required by Securities and Exchange Commission rules, and does not necessarily reflect the actual payout to be received by Mr. Lalljie. |
(17) | RSUs were granted in April 2016. 8,416 RSUs vested on March 1, 2017. The remaining shares will vest in annual installments through March 1, 2019. |
(18) | PVRSUs were awarded in April 2016 and will vest on March 1, 2019 at 93% of target based on achievement of 2016 adjusted total revenue, adjusted non-NPAC revenue and adjusted net income goals. |
(19) | PVRSUs were awarded in April 2016. 67,341 PVRSUs will vest on March 1, 2019, based on, and subject to, the achievement of adjusted total revenue, adjusted non-NPAC revenue and adjusted net income goals. The number of units reported is based on maximum performance at 150%, as required by Securities and Exchange Commission rules, and does not necessarily reflect the actual payout to be received by Mr. Lalljie. |
(20) | RSUs were granted in June 2013. 2,770 RSUs vested on January 1, 2017. |
(21) | PVRSUs were awarded in June 2013 and vested on January 1, 2017 at 93% of target based on the achievement of 2016 adjusted total revenue, adjusted non-NPAC revenue and adjusted net income goals. |
114
(22) | RSUs were granted in April 2015. 3,293 RSUs vested on March 1, 2017. The remaining shares will vest on March 1, 2018. |
(23) | PVRSUs were awarded in April 2015 and will vest on March 1, 2018 at 130.9% of target based on achievement of 2015 adjusted total revenue, adjusted non-NPAC revenue and adjusted net income goals. |
(24) | PVRSUs were awarded in April 2015 and will vest on March 1, 2018 at 93% of target based on achievement of 2016 adjusted total revenue, adjusted non-NPAC revenue and adjusted net income goals. |
(25) | PVRSUs were awarded in April 2015. 13,178 PVRSUs will vest on March 1, 2018, based on, and subject to, the achievement of adjusted total revenue, adjusted non-NPAC revenue and adjusted net income goals. The number of units reported is based on maximum performance at 150%, as required by Securities and Exchange Commission rules, and does not necessarily reflect the actual payout to be received by Mr. Kennedy. |
(26) | RSUs were granted in April 2016. 3,506 RSUs vested on March 1, 2017. The remaining shares will vest in annual installments through March 1, 2019. |
(27) | PVRSUs were awarded in April 2016 and will vest on March 1, 2019 at 93% of target based on achievement of 2016 adjusted total revenue, adjusted non-NPAC revenue and adjusted net income goals. |
(28) | PVRSUs were awarded in April 2016. 28,061 PVRSUs will vest on March 1, 2019, based on, and subject to, the achievement of adjusted total revenue, adjusted non-NPAC revenue and adjusted net income goals. The number of units reported is based on maximum performance at 150%, as required by Securities and Exchange Commission rules, and does not necessarily reflect the actual payout to be received by Mr. Kennedy. |
(29) | RSUs were granted in February 2012. 3,408 RSUs vested on January 1, 2017. |
(30) | PVRSUs were awarded in February 2012 and vested on January 1, 2017 at 93% of target based on the achievement of 2016 adjusted total revenue, adjusted non-NPAC revenue and adjusted net income goals. |
(31) | RSUs were granted in April 2015. 2,636 RSUs vested on March 1, 2017. The remaining shares will vest on March 1, 2018. |
(32) | PVRSUs were awarded in April 2015 and will vest on March 1, 2018 at 130.9% of target based on achievement of 2015 adjusted revenue, adjusted non-NPAC revenue and adjusted net income goals. |
(33) | PVRSUs were awarded in April 2015 and will vest on March 1, 2018 at 93% of target based on achievement of 2016 adjusted total revenue, adjusted non-NPAC revenue and adjusted net income goals. |
(34) | PVRSUs were awarded in April 2015. 10,542 PVRSUs will vest on March 1, 2018, based on, and subject to, the achievement of adjusted total revenue, adjusted non-NPAC revenue and adjusted net income goals. The number of units reported is based on maximum performance at 150%, as required by Securities and Exchange Commission rules, and does not necessarily reflect the actual payout to be received by Mr. Edwards. |
(35) | RSUs were granted in April 2016. 3,086 RSUs vested on March 1, 2017. The remaining shares will vest in annual installments through March 1, 2019. |
(36) | PVRSUs were awarded in April 2016 and will vest on March 1, 2019 at 93% of target based on achievement of 2016 adjusted total revenue, adjusted non-NPAC revenue and adjusted net income goals. |
(37) | PVRSUs were award in April 2016. 24,694 PVRSUs will vest on March 1, 2019, based on, and subject to, the achievement of adjusted total revenue, adjusted non-NPAC revenue and adjusted net income goals. The number of units reported is based on maximum performance at 150%, as required by Securities and Exchange Commission rules, and does not necessarily reflect the actual payout to be received by Mr. Edwards. |
(38) | RSUs were granted in July 2016. 14,852 RSUs vested on January 31, 2017 and the remaining shares will vest on January 31, 2018 |
(39) | RSUs were granted in July 2016. 3,960 RSUs will vest on July 25, 2017. The remaining shares will vest in annual installments through July 25, 2019. |
(40) | PVRSUs were awarded in July 2016 and will vest on March 1, 2019 at 93% of target based on achievement of 2016 adjusted total revenue, adjusted non-NPAC revenue and adjusted net income goals. |
115
(41) | PVRSUs were awarded in July 2016. 31,680 PVRSUs will vest on March 1, 2019, based on, and subject to, the achievement of adjusted total revenue, adjusted non-NPAC revenue and adjusted net income goals. The number of units reported is based on maximum performance at 150%, as required by Securities and Exchange Commission rules, and does not necessarily reflect the actual payout to be received by Mr. Achanta. |
2016 Option Exercises and Stock Vested
The following table provides information regarding option exercises and stock vested during the last fiscal year for each named executive officer.
Name | Option Awards | Stock Awards | |||||||||
Number of Shares Acquired on Exercise (#) | Value Realized on Exercise ($) | Number of Shares Acquired on Vesting (#) | Value Realized on Vesting ($) | ||||||||
Lisa Hook | 89,800 | 755,218 | 123,877 | 3,072,223 | |||||||
Paul Lalljie | 15,000 | 81,900 | 61,936 | 1,536,048 | |||||||
Leonard J. Kennedy | — | — | 23,475 | 583,174 | |||||||
Steven Edwards | — | — | 23,888 | 592,504 | |||||||
Venkat Achanta | — | — | — | — | |||||||
2016 Nonqualified Deferred Compensation
The NeuStar, Inc. Deferred Compensation Plan, which was adopted in 2008 and amended and restated in 2014, permits employees at the Vice President level and above, including the NEOs, to defer certain elements of compensation in order to delay taxation on such amounts. None of our NEOs participated in this plan in 2016. The plan permits deferral of up to 75% of base salary and up to 90% of annual cash incentive awards and bonuses. We may elect to provide matching contributions to the extent that deferrals under the plan have the effect of reducing a participant’s 401(k) compensation (and thus the matching contribution offered to all employees under our 401(k) plan), although we have not done so to date.
Amounts deferred or matched under the plan are credited with investment earnings based on the performance of investment options selected by the participants. Available investment options represent a range of asset classes, including cash, bond, value, index and growth funds. Participants may change their investment elections at any time. In general, deferrals and earnings are distributed to participants either at a specific date prior to retirement or termination of employment or at retirement or termination, as designated by the participant. Participants also may designate the form (lump sum or installments) of their distributions.
Potential Payments upon Termination or Change in Control
2016 Key Employee Severance Pay Plan
In early 2016, as part of our ongoing review of our executive compensation program, the Board, upon the recommendation of our Compensation Committee, determined that it was appropriate to align our executive severance plan with market practice and adopted the 2016 Key Employee Severance Pay Plan (the “2016 Severance Plan”), which amended, restated and replaced the NeuStar 2010 Key Employee Severance Pay Plan. The 2016 Severance Plan modifies the terms and conditions of the prior plan by:
• | revising the definitions of “cause” and “good reason,” as described below; |
• | providing for severance of one-hundred percent of annual salary and target annual bonus, payable over twelve months (or for the CEO, one-hundred fifty percent of annual salary and target annual bonus, payable over eighteen months); provided that in connection with a qualifying termination during the two-year period following a corporate transaction constituting a change in control, the severance will equal 150% of the annual salary and average annual bonus, payable over twelve months (or for the CEO, 200% of such amount, payable over eighteen months); |
• | conforming the duration of the post-termination non-compete and non-solicitation restricted period to match the period over which severance is payable (subject to the Compensation Committee’s ability to extend the post-termination non-compete and non-interference restrictions by up to an additional one-year period, as long as the Company pays additional cash severance during any such extended period); and |
• | adding a net “better-of” cutback provision which would reduce the aggregate payments payable to the key employee, under the Plan or otherwise, in connection with change in control under Code Section 280G, to the maximum amount |
116
that would result in no such payments being subject to excise tax under Code Section 4999, if such reduction would result in a greater amount of such payments, on a net after-tax basis, than without such reduction.
“Cause” for purposes of the 2016 Severance Plan generally means a willful and continued failure to attempt in good faith to substantially perform duties or a willful refusal to follow material directives; the commission of fraud, embezzlement or material dishonesty against Company property or personnel; willful misconduct that would reasonably be expected to result in material harm to the business, reputation, assets, properties, prospects, results of operations or financial condition of the Company as a whole; conviction of a felony or a crime of moral turpitude resulting in material harm to the Company; or a material breach of a material written agreement or employment-related policy.
Also, “good reason” for purposes of the 2016 Severance Plan generally means a material diminution in duties, responsibilities or authorities; a material reduction in annual base salary or annual or long-term incentive compensation opportunities; a material reduction in benefits, in the aggregate, under the Company’s material employee benefits arrangements; a relocation to any office location more than 50 miles away from the existing primary work location; or the Company’s material breach of the 2016 Severance Plan or any other material agreement or arrangement with the Company. However, in each case, “good reason” under the 2016 Severance Plan would be deemed to exist solely to the extent the applicable triggering event occurred within two years after a change in control or other qualifying corporate transaction. However, in connection with the approval and adoption of the 2016 Severance Plan, the Company entered into individual letter agreements with each of Ms. Hook, Mr. Lalljie and Mr. Kennedy which modified the definition of “good reason” applicable to each of them for purposes of the 2016 Severance Plan, by eliminating the requirement that the triggering event occur solely within the two-year period after a corporate transaction, thereby imparting good reason protection irrespective of whether a corporate transaction has occurred.
Long-Term Award Agreements
Notwithstanding the vesting terms described in the footnotes below to the contrary, the vesting of all outstanding equity awards will accelerate in connection with the merger, as described above.
Under our long-term incentive compensation plans and the NEOs’ option agreements, if we experience a change in control or other qualifying corporate transaction, all of the options will vest in full, unless the options are assumed or continued by the surviving company, or unless the surviving company substitutes the options with substantially equivalent options. If the surviving company assumes or replaces the options, the options will vest and become exercisable if the senior executive’s employment is terminated within two years of the corporate transaction, unless the senior executive’s employment is terminated by the surviving company for cause or by the senior executive without good reason.
Under the NEOs’ RSU agreements, if the NEO’s employment is terminated, other than by the Company for cause or by the NEO without good reason, any unvested RSUs that would have vested during the 12 months after such separation from the Company shall immediately vest, and the remainder of any unvested RSUs shall immediately be forfeited. In addition, the RSUs will vest in full if the NEO’s employment is terminated within two years of a corporate transaction, unless the NEO’s employment is terminated by the surviving company for cause or by the NEO without good reason. The RSUs shall immediately vest in full in the event that the surviving company does not assume the RSUs.
For PVRSUs granted since 2012, under the NEOs’ PVRSU agreements, if the NEO’s employment is terminated, other than by the Company for cause or by the NEO without good reason, any PVRSUs that have been earned but not yet vested that would have vested during the 12 months after such separation from the Company shall immediately vest, and the remainder of any unvested PVRSUs shall immediately be forfeited. In the event the NEO dies or becomes disabled prior to any vesting, the NEO or the NEO’s legal representative will receive a pro-rata payment as if the target level of performance set forth in the agreement had been attained or where the performance period has ended prior to the qualifying event, a pro-rata payment based on actual performance. Additionally, if we experience a change in control or other qualifying corporate transaction, the PVRSUs will be converted without proration into shares of restricted stock that vest on the original vesting date, subject to the senior executive’s continued service. The number of shares of restricted stock into which the PVRSUs convert will be determined as set forth in the agreement. The restricted stock will vest in full if the senior executive’s employment is terminated within two years of the corporate transaction, unless the senior executive’s employment is terminated by the surviving company for cause or by the senior executive without good reason. The restricted stock shall immediately vest in full in the event that the surviving company does not assume the restricted stock.
Our Amended and Restated 2009 Stock Incentive Plan generally defines “cause” as an employee’s insubordination, dishonesty, fraud, moral turpitude, willful misconduct, or willful failure or refusal to attempt to perform his or her duties or responsibilities for any reason other than illness or incapacity. Under the 2005 Stock Incentive Plan, “cause” generally means an employee’s insubordination, dishonesty, fraud, incompetence, moral turpitude, willful misconduct, refusal to attempt to perform
117
his or her duties or responsibilities, or materially unsatisfactory performance of his or her duties. For purposes of our RSU and PVRSUs issued in early 2016, the definition of “cause” is substantially similar to the definition in our 2016 Severance Plan, as described above.
For purposes of our equity awards issued in 2016 and prior years, “good reason” generally means any of the following events and the Company’s or a successor company’s failure to cure such event within 30 days of receiving notice from the employee: (i) a reduction in base salary, except pursuant to a policy generally applicable to senior management resulting in a reduction of 10% or less; (ii) the successor company’s failure to provide employee benefits that are substantially comparable to those provided prior to the change in control; (iii) the successor company requiring the employee to be based at an office location that is more than 50 miles further from the employee’s existing office location; or (iv) a material breach by the successor company of its obligations under the plans. Qualifying corporate transactions include a merger or consolidation where the Company’s stockholders prior to the transaction do not own a majority of the shares of the surviving company in approximately the same proportion as before the transaction, the replacement of a majority of our Board of Directors, the sale of all or substantially all of our assets, the liquidation or dissolution of the Company, or the acquisition of a majority of our outstanding stock.
For purposes of our RSUs and PVRSUs issued in early 2016, the definition of “good reason” is substantially similar to the definition in our 2016 Severance Plan, as described above.
In addition, RSUs and PVRSUs issued in early 2016 to our NEOs provide that, in connection with a “qualifying retirement,” a pro-rata portion of any unvested RSUs that would have become vested on the next scheduled vesting date will vest, and the remaining unvested RSUs will be forfeited; any earned PVRSUs (i.e., those for which the performance criteria have been achieved or exceeded, but vesting remains subject to satisfaction of the continued employment conditions) will immediately vest; and a pro-rata portion (based on the number of days employed during the performance period) of any unearned PVRSUs will become vested and payable following the close of the applicable performance periods, to the extent earned based on actual performance for the performance period. For purposes of these RSU and PVRSUs, a “qualifying retirement” generally means termination of employment or service with the Company and/or its affiliates due to an employee’s resignation after they have (1) reached fifty-five years of age, (2) completed at least five years of service with the Company and its affiliates and (3) have a combined age and years of completed service with the Company and its affiliates of at least sixty-five years; provided that employees must have provided the Company with at least twelve months’ prior written notice of their intent to voluntary terminate their employment due to a Retirement.
Under the NEOs’ agreements relating to options, RSUs and PVRSUs granted since 2012, benefits are contingent upon the senior executive’s compliance with certain prohibitions on disclosure of confidential information and disparagement of us. In addition, where permitted by applicable law, the senior executive must agree not to compete with us or to engage in solicitation during the 18-month period following termination of employment. However, in the case of our RSU and PVRSUs issued in early 2016, we have reduced the post-termination restricted period to 12-months to more closely align with the 12-month additional vesting period in our equity awards and the 12-month base severance period for our named executive officers (other than Ms. Hook) under the 2016 Key Employee Severance Pay Plan, as described above.
Under the NEOs’ 2016 long-term incentive cash retention awards, if we experience a change in control, or if the NEO’s employment is terminated other than for cause or due to the NEO’s death or disability, the cash awards will become payable within thirty days of such change in control or employment termination.
The RSU and PVRSU awards granted to NEOs in early 2016 contain a net “better-of” cutback provision which provides for the reduction in the aggregate payments payable to the employee, whether under the award or otherwise, in connection with change in control under Section 280G of the Internal Revenue Code of 1986, as amended, to the maximum amount that would result in no such payments being subject to excise tax under Code Section 4999, if such reduction would result in a greater amount of such payments, on a net after-tax basis, than without such reduction.
Potential Payments as of December 31, 2016
The following tables show the value of the potential payments and benefits our named executive officers would receive in various scenarios involving a termination of their employment or a change in control or other qualifying corporate transaction, assuming a December 31, 2016 triggering date and, where applicable, using a price per share for our common stock of $33.40 (the closing market price as reported on the New York Stock Exchange for December 30, 2016). The following tables have been prepared based on SEC rules and subject to the assumption that the triggering events for such payments and benefits occurred on December 31, 2016. As a result, the tables below do not reflect the actual amounts that may become payable to the named executive officers in connection with the merger.
118
Lisa Hook
Payments Upon Termination | Voluntary Termination ($) | Termination By Employee for Good Reason ($) | Involuntary Termination Without Cause ($) | Involuntary Termination for Cause ($) | Retirement ($) | Change in Control Event ($) | Double-Trigger Change in Control Event ($) | Death ($) | Disability ($) | |||||||||||||||
Severance Payments | — | 5,433,043 | (1) | 5,433,043 | (2) | — | — | 2,000,000 | (3) | 6,579,564 | (4) | 2,000,000 | (3) | 2,000,000 | (3) | |||||||||
RSUs | — | — | 1,548,457 | — | 420,882 | — | 3,019,560 | (5) | 1,548,457 | 1,548,457 | ||||||||||||||
PVRSUs | — | — | 2,205,636 | — | 1,917,394 | — | 13,947,807 | (6) | 8,020,086 | (7) | 8,020,086 | (7) | ||||||||||||
Total | — | 5,433,043 | 9,187,136 | — | 2,338,276 | 2,000,000 | 23,546,931 | 11,568,543 | 11,568,543 | |||||||||||||||
(1) | Under the 2016 Key Employee Severance Pay Plan, if termination is due to a reduction in annual base salary or Target Bonus opportunity, the prior salary and Target Bonus are used to calculate the severance payment. Includes $34,605 for reimbursement of the premium for 18 months of continuation coverage under our medical plan. |
(2) | Represents the amount payable pursuant to the 2016 Key Employee Severance Pay Plan, assuming the Compensation Committee did not elect to extend benefits for an additional period. Includes $34,605 for reimbursement of the premium for 18 months of continuation coverage under our medical plan. |
(3) | Represents the remaining installment payable pursuant to the terms of Ms. Hook’s long-term cash retention award. In order to be eligible for this cash retention award, each NEO entered into a non-compete and non-solicitation agreement, which protects confidential and proprietary information and other business interest. These agreements were drafted in consultation with our compensation consultants and include customary provisions for an information services company. For example, these agreements include robust non-competition and non-solicitation provisions and incorporate recent legal developments related to enforceability. |
(4) | Represents the amount payable pursuant to the 2016 Key Employee Severance Pay Plan if Ms. Hook were not offered comparable employment with a successor or if she experienced a qualifying termination following the change in control. Includes $34,605 for reimbursement of the premium for 18 months of continuation coverage under our medical plan. |
(5) | Reflects the fair market value as of December 31, 2016 of all RSUs, the vesting of which would accelerate if Ms. Hook experienced a qualifying termination following the change in control. |
(6) | Reflects the fair market value of the underlying shares as of December 31, 2016 of all PVRSUs, which would be converted into shares of RSUs upon a change in control based on actual performance for PVRSUs granted in 2015 and 2016 and on target performance for PVRSUs with performance goals for the years ended 2017 and 2018. The vesting of the RSUs would accelerate if Ms. Hook experienced a qualifying termination following the change in control. |
(7) | Represents a pro-rata payment based on actual performance for PVRSUs granted in 2015 and 2016 and on target performance for PVRSUs with performance goals for the years ended 2017 and 2018. |
Paul Lalljie
Payments Upon Termination | Voluntary Termination ($) | Termination By Employee for Good Reason ($) | Involuntary Termination Without Cause ($) | Involuntary Termination for Cause ($) | Retirement ($) | Change in Control Event ($) | Double-Trigger Change in Control Event ($) | Death ($) | Disability ($) | |||||||||||||||
Severance Payments | — | 2,485,564 | (1) | 2,485,564 | (2) | — | — | 1,000,000 | (3) | 3,164,062 | (4) | 1,000,000 | (3) | 1,000,000 | (3) | |||||||||
RSUs | — | — | 797,525 | — | — | — | 1,579,820 | (5) | 797,525 | 797,525 | ||||||||||||||
PVRSUs | — | — | 1,102,801 | — | — | — | 7,248,368 | (6) | 4,101,509 | (7) | 4,101,509 | (7) | ||||||||||||
Total | — | 2,485,564 | 4,385,890 | — | — | 1,000,000 | 11,992,250 | 5,899,034 | 5,899,034 | |||||||||||||||
(1) | Under the 2016 Key Employee Severance Pay Plan, if termination is due to a reduction in annual base salary or Target Bonus opportunity, the prior salary and Target Bonus are used to calculate the severance payment. Includes $23,064 for reimbursement of the premium for 12 months of continuation coverage under our medical plan. |
119
(2) | Represents the amount payable pursuant to the 2016 Key Employee Severance Pay Plan, assuming the Compensation Committee did not elect to extend benefits for an additional period. Includes $23,064 for reimbursement of the premium for 12 months of continuation coverage under our medical plan. |
(3) | Represents the remaining installment payable pursuant to the terms of Mr. Lalljie’s long-term cash retention award. In order to be eligible for this cash retention award, each NEO entered into a non-compete and non-solicitation agreement, which protects confidential and proprietary information and other business interest. These agreements were drafted in consultation with our compensation consultants and include customary provisions for an information services company. For example, these agreements include robust non-competition and non-solicitation provisions and incorporate recent legal developments related to enforceability. |
(4) | Represents the amount payable pursuant to the 2016 Key Employee Severance Pay Plan if Mr. Lalljie were not offered comparable employment with a successor or if he experienced a qualifying termination following the change in control. Includes $23,064 for reimbursement of the premium for 12 months of continuation coverage under our medical plan. |
(5) | Reflects the fair market value as of December 31, 2016 of all RSUs, the vesting of which would accelerate if Mr. Lalljie experienced a qualifying termination following the change in control. |
(6) | Reflects the fair market value of the underlying shares as of December 31, 2016 of all PVRSUs, which would be converted into shares of RSUs upon a change in control based on actual performance for PVRSUs granted in 2015 and 2016 and on target performance for PVRSUs with performance goals for the years ended 2017 and 2018. The vesting of the RSUs would accelerate if Mr. Lalljie experienced a qualifying termination following the change in control. |
(7) | Represents a pro-rata payment based on actual performance for PVRSUs granted in 2015 and 2016 and on target performance for PVRSUs with performance goals for the years ended 2017 and 2018. |
Leonard J. Kennedy
Payments Upon Termination | Voluntary Termination ($) | Termination By Employee for Good Reason ($) | Involuntary Termination Without Cause ($) | Involuntary Termination for Cause ($) | Retirement ($) | Change in Control Event ($) | Double-Trigger Change in Control Event ($) | Death ($) | Disability ($) | |||||||||||||||||
Severance Payments | — | 1,055,964 | (1) | 1,055,964 | (2) | — | — | — | 1,502,497 | (3) | — | — | ||||||||||||||
RSUs | — | — | 319,605 | — | — | — | 663,892 | (4) | 319,605 | 319,605 | ||||||||||||||||
PVRSUs | — | — | 413,158 | — | — | — | 3,211,577 | (5) | 1,345,964 | (6) | 1,345,964 | (6) | ||||||||||||||
Total | — | 1,055,964 | 1,788,727 | — | — | — | 5,377,966 | 1,665,569 | 1,665,569 | |||||||||||||||||
(1) | Under the 2016 Key Employee Severance Pay Plan, if termination is due to a reduction in annual base salary or Target Bonus opportunity, the prior salary and Target Bonus are used to calculate the severance payment. Includes $23,064 for reimbursement of the premium for 12 months of continuation coverage under our medical plan. |
(2) | Represents the amount payable pursuant to the 2016 Key Employee Severance Pay Plan, assuming the Compensation Committee did not elect to extend benefits for an additional period. Includes $23,064 for reimbursement of the premium for 12 months of continuation coverage under our medical plan. |
(3) | Represents the amount payable pursuant to the 2016 Key Employee Severance Pay Plan if Mr. Kennedy were not offered comparable employment with a successor or if he experienced a qualifying termination following the change in control. Includes $23,064 for reimbursement of the premium for 12 months of continuation coverage under our medical plan. |
(4) | Reflects the fair market value as of December 31, 2016 of all RSUs, the vesting of which would accelerate if Mr. Kennedy experienced a qualifying termination following the change in control. |
(5) | Reflects the fair market value of the underlying shares as of December 31, 2016 of all PVRSUs, which would be converted into shares of RSUs upon a change in control based on actual performance for PVRSUs granted in 2015 and 2016 and on target performance for PVRSUs with performance goals for the years ended 2017 and 2018. The vesting of the RSUs would accelerate if Mr. Kennedy experienced a qualifying termination following the change in control. |
(6) | Represents a pro-rata payment based on actual performance for PVRSUs granted in 2015 and 2016 and on target performance for PVRSUs with performance goals for the years ended 2017 and 2018. |
120
Steven Edwards
Payments Upon Termination | Voluntary Termination ($) | Termination By Employee for Good Reason ($) | Involuntary Termination Without Cause ($) | Involuntary Termination for Cause ($) | Retirement ($) | Change in Control Event ($) | Double-Trigger Change in Control Event ($) | Death ($) | Disability ($) | |||||||||||||||
Severance Payments | — | — | 1,461,752 | (1) | — | — | 500,000 | (2) | 1,891,452 | (3) | 500,000 | (2) | 500,000 | (2) | ||||||||||
RSUs | — | — | 304,942 | — | 84,160 | — | 599,263 | (4) | 304,942 | 304,942 | ||||||||||||||
PVRSUs | — | — | 423,412 | — | 383,465 | — | 2,771,866 | (5) | 1,586,300 | (6) | 1,586,300 | (6) | ||||||||||||
Total | — | — | 2,190,106 | — | 467,625 | 500,000 | 5,262,581 | 2,391,242 | 2,391,242 | |||||||||||||||
(1) | Represents the amount payable pursuant to the 2016 Key Employee Severance Pay Plan, assuming the Compensation Committee did not elect to extend benefits for an additional period. Includes $22,752 for reimbursement of the premium for 12 months of continuation coverage under our medical plan. |
(2) | Represents the remaining installment payable pursuant to the terms of Mr. Edwards’ long-term cash retention award. In order to be eligible for this cash retention award, each NEO entered into a non-compete and non-solicitation agreement, which protects confidential and proprietary information and other business interest. These agreements were drafted in consultation with our compensation consultants and include customary provisions for an information services company. For example, these agreements include robust non-competition and non-solicitation provisions and incorporate recent legal developments related to enforceability. |
(3) | Represents the amount payable pursuant to the 2016 Key Employee Severance Pay Plan if Mr. Edwards were not offered comparable employment with a successor or if he experienced a qualifying termination following the change in control. Includes $22,752 for reimbursement of the premium for 12 months of continuation coverage under our medical plan. |
(4) | Reflects the fair market value as of December 31, 2016 of all RSUs, the vesting of which would accelerate if Mr. Edwards experienced a qualifying termination following the change in control. |
(5) | Reflects the fair market value of the underlying shares as of December 31, 2016 of all PVRSUs, which would be converted into shares of restricted stock upon a change in control based on actual performance for PVRSUs granted in 2015 and 2016 and on target performance for PVRSUs with performance goals for the years ended 2017 and 2018. The vesting of the RSUs would accelerate if Mr. Edwards experienced a qualifying termination following the change in control. |
(6) | Represents a pro-rata payment based on actual performance for PVRSUs granted in 2015 and 2016 and on target performance for PVRSUs with performance goals for the years ended 2017 and 2018. |
Venkat Achanta
Payments Upon Termination | Voluntary Termination ($) | Termination By Employee for Good Reason ($) | Involuntary Termination Without Cause ($) | Involuntary Termination for Cause ($) | Retirement ($) | Change in Control Event ($) | Double-Trigger Change in Control Event ($) | Death ($) | Disability ($) | ||||||||||||||||||
Severance Payments | — | — | 942,345 | (1) | — | — | — | 1,301,249 | (2) | — | — | ||||||||||||||||
RSUs | — | — | 628,321 | — | — | — | 1,672,004 | (3) | 628,321 | 628,321 | |||||||||||||||||
PVRSUs | — | — | — | — | — | — | 1,550,127 | (4) | 516,709 | (5) | 516,709 | (5) | |||||||||||||||
Total | — | — | 1,570,666 | — | — | — | 4,523,380 | 1,145,030 | 1,145,030 | ||||||||||||||||||
(1) | Represents the amount payable pursuant to the 2016 Key Employee Severance Pay Plan, assuming the Compensation Committee did not elect to extend benefits for an additional period. Includes $23,064 for reimbursement of the premium for 12 months of continuation coverage under our medical plan. |
(2) | Represents the amount payable pursuant to the 2016 Key Employee Severance Pay Plan if Mr. Achanta were not offered comparable employment with a successor or if he experienced a qualifying termination following the change in control. Includes $23,064 for reimbursement of the premium for 12 months of continuation coverage under our medical plan. |
(3) | Reflects the fair market value as of December 31, 2016 of all RSUs, the vesting of which would accelerate if Mr. Achanta experienced a qualifying termination following the change in control. |
121
(4) | Reflects the fair market value of the underlying shares as of December 31, 2016 of all PVRSUs, which would be converted into shares of restricted stock upon a change in control based on actual performance for PVRSUs granted in 2015 and 2016 and on target performance for PVRSUs with performance goals for the year ended 2017 and 2018. The vesting of the RSUs would accelerate if Mr. Achanta experienced a qualifying termination following the change in control. |
(5) | Represents a pro-rata payment based on actual performance for PVRSUs granted in 2016 and on target performance for PVRSUs with performance goals for the years ended 2017 and 2018. |
2016 DIRECTOR COMPENSATION
The Compensation Committee, with the assistance and advice of its external consultant, evaluates the compensation of our non-employee directors at least annually and recommends changes to the Board when appropriate. As with our executive compensation program, the non-employee director compensation program emphasizes equity incentives. This reflects our belief that equity awards align the interests of our non-employee directors with those of our stockholders. Accordingly, the majority of our non-employee directors’ compensation is comprised of equity awards.
Cash Compensation. Our policy with respect to non-employee director compensation, as approved by the Board in June 2016, provides that non-employee directors will receive an annual retainer of $70,000. The Chairman of the Board will receive an additional retainer of $75,000, and committee chairs will receive additional retainers as follows: $22,500 for the Audit Committee and Compensation Committee Chairs; $15,000 for the Nominating and Corporate Governance Committee Chair; and $10,000 for the Neutrality Committee Chair. Committee members (other than the chair) will receive additional retainers as follows: $10,000 for Audit Committee and Compensation Committee members; $7,500 for Nominating and Corporate Governance Committee members; and $5,000 for Neutrality Committee members. Cash compensation is generally paid to directors quarterly in arrears. Directors are also reimbursed for expenses related to attending Board and committee meetings.
Equity Compensation. Our director compensation program, as approved by the Board in June 2016, provides that our non-employee directors also receive an annual RSU grant equal to $185,000 divided by the 30-day moving average stock price of the Class A Common Stock as of the market close on the last business day of the fiscal quarter prior to the date of grant. Such grants are made on the day following the annual meeting of stockholders. Subject to the treatment described above in the event of the earlier consummation of the merger, these RSUs vest in full on the earlier of the first anniversary of the date of grant or the day preceding the next year’s annual meeting of stockholders. Upon vesting, certain director’s RSUs will be deferred into deferred stock units, which will be delivered to the director in shares of our Class A common stock six months following the director’s termination of Board service unless the director elected near-term delivery.
The following table sets forth all compensation paid by us to the non-management members of our Board of Directors for services provided during the last fiscal year.
Name | Fees Earned or Paid in Cash ($) | Stock Awards(1) ($) | Total ($) | ||||||
Paul D. Ballew | 78,000 | 184,918 | (2) | 262,918 | |||||
James G. Cullen | 153,000 | 184,918 | (3) | 337,918 | |||||
Joel P. Friedman | 78,000 | 184,918 | (4) | 262,918 | |||||
Mark N. Greene | 83,000 | 184,918 | (5) | 267,918 | |||||
Ross K. Ireland | 93,000 | 184,918 | (6) | 277,918 | |||||
Paul A. Lacouture | 98,000 | 184,918 | (7) | 282,918 | |||||
Deborah D. Rieman | 80,912 | 184,918 | (8) | 265,830 | |||||
Michael J. Rowny | 98,000 | 184,918 | (9) | 282,918 | |||||
Hellene S. Runtagh | 85,500 | 184,918 | (10) | 270,418 | |||||
(1) | For information about the assumptions and underlying calculations upon which we base grant date fair value, see Note 12 to our Consolidated Financial Statements in Item 8 of Part II of this report. |
(2) | As of December 31, 2016, Mr. Ballew held restricted stock representing 7,786 shares of our Class A common stock. |
122
(3) | As of December 31, 2016, Mr. Cullen held restricted stock representing 7,786 shares of our Class A common stock and deferred stock units representing 29,110 shares of our Class A common stock. |
(4) | As of December 31, 2016, Mr. Friedman held restricted stock representing 7,786 shares of our Class A common stock and deferred stock units representing 29,476 shares of our Class A common stock. |
(5) | As of December 31, 2016, Dr. Greene held restricted stock representing 7,786 shares of our Class A common stock. |
(6) | As of December 31, 2016, Mr. Ireland held restricted stock representing 7,786 shares of our Class A common stock and deferred stock units representing 35,529 shares of our Class A common stock. |
(7) | As of December 31, 2016, Mr. Lacouture held restricted stock representing 7,786 shares of our Class A common stock and deferred stock units representing 40,900 shares of our Class A common stock. |
(8) | As of December 31, 2016, Ms. Rieman held restricted stock representing 7,786 shares of our Class A common stock. |
(9) | As of December 31, 2016, Mr. Rowny held restricted stock representing 7,786 shares of our Class A common stock and deferred stock units representing 52,740 shares of our Class A common stock. |
(10) | As of December 31, 2016, Ms. Runtagh held restricted stock representing 7,786 shares of our Class A common stock and deferred stock units representing 45,168 shares of our Class A common stock. |
Deferred Compensation
The NeuStar, Inc. Deferred Compensation Plan permits non-employee directors to defer certain elements of compensation in order to delay taxation on such amounts. Specifically, the plan permits deferral of up to 100% of director fees, including Board, Chairman, committee chair, and committee member retainers. Amounts deferred under the plan are credited with investment earnings based on investment options selected by the participants. None of the directors participated in the plan during 2016.
Board Stock Ownership Guidelines
The non-employee directors are subject to the Company’s stock ownership guidelines discussed under “Stock Ownership Guidelines” above.
RECONCILATION OF NON-GAAP MEASURES
Table 1
Reconciliation of Adjusted non-NPAC Revenue for 2016 PVRSUs
Year Ended December 31, 2016 | |||
(in thousands, unaudited) | |||
Total revenue | $ | 1,209,847 | |
Less: NPAC revenue (1) | (512,325 | ) | |
Adjusted non-NPAC revenue for 2016 PVRSU performance measure | $ | 697,522 | |
(1) Total revenue excluding revenue derived under our contracts with the NAPM, NPAC-related connection service fees, system enhancements and transition services.
123
Table 2
Reconciliation of Adjusted Net Income for 2016 PVRSUs
Year Ended December 31, 2016 | |||
(in thousands, unaudited) | |||
Net income | $ | 168,646 | |
Add: Stock-based compensation | 42,874 | ||
Add: Amortization of acquired intangible assets | 94,042 | ||
Add: Impairment of long-lived assets | 11,104 | ||
Add: Loss on debt modification and extinguishment | 6,354 | ||
Add: Restructuring charges (1) | 4,904 | ||
Add: Fees related to the NPAC vendor selection process | 9,049 | ||
Add: Separation costs | 14,512 | ||
Add: Merger-related costs | 4,836 | ||
Less: Adjustment for provision for income taxes | (61,903 | ) | |
Adjusted net income for 2016 PVRSU performance measure | $ | 294,418 | |
(1) This adjustment is one-third of actual restructuring charges as defined in the plan.
124
ITEM 12. | SECURITY OWNERSHIP OF CERTAIN BENEFICIAL OWNERS AND MANAGEMENT AND RELATED STOCKHOLDER MATTERS |
BENEFICIAL OWNERSHIP OF SHARES OF COMMON STOCK
The following table sets forth information regarding ownership of our common stock as of February 24, 2017 by holders of more than 5% of our combined classes of common stock, each of our directors and named executive officers, and all of our directors and executive officers as a group. None of these holders beneficially owns Class B common stock. The information in this table is based on our records, information filed with the Securities and Exchange Commission and information provided to us, except where otherwise noted. Except as otherwise indicated, (i) each person has sole voting and investment power (or shares such powers with his or her spouse) with respect to the shares set forth in the following table, and (ii) the business address of each person shown below is 21575 Ridgetop Circle, Sterling, Virginia 20166.
Name of Beneficial Owner | Number of Shares Beneficially Owned | Percent of Class (1) | |||
5% owners | |||||
PRIMECAP Management Company(2) | 7,302,746 | 13.24 | % | ||
The Vanguard Group(3) | 4,362,681 | 7.91 | % | ||
BlackRock, Inc.(4) | 2,999,531 | 5.44 | % | ||
Prescott General Partners, LLC(5) | 2,941,045 | 5.33 | % | ||
Directors, nominees and named executive officers | |||||
Lisa Hook, President and Chief Executive Officer, Director | 636,387 | (6) | 1.15 | % | |
Paul Lalljie, SVP and Chief Financial Officer | 308,883 | (7) | * | ||
Leonard J. Kennedy, SVP and General Counsel | 51,959 | (8) | * | ||
Steven Edwards, SVP, Data Solutions | 87,846 | (9) | * | ||
Venkat Achanta, SVP, Chief Data & Analytics Officer | 9,813 | * | |||
James Cullen, Chairman of the Board | 56,142 | (10) | * | ||
Paul Ballew, Director | 6,512 | * | |||
Joel Friedman, Director | 56,508 | (11) | * | ||
Mark Greene, Director | 20,613 | * | |||
Ross Ireland, Director | 56,142 | (12) | * | ||
Paul Lacouture, Director | 51,087 | (13) | * | ||
Deborah Rieman, Director | 6,516 | * | |||
Michael Rowny, Director | 57,508 | (14) | * | ||
Hellene Runtagh, Director | 56,508 | (15) | * | ||
Directors, nominees and executive officers as a group (14 persons) | 1,462,428 | (16) | 2.62 | % | |
* | Denotes less than 1% ownership. |
(1) | Percentages are based on 55,150,233 shares of Class A common stock and 1,864 shares of Class B common stock outstanding on February 24, 2017 (reflecting total outstanding shares less 27,422,961 shares of Class A common stock held in treasury) plus, as to the holder thereof only and no other person, the number of shares (if any) that the person has the right to acquire as of February 24, 2017 or within 60 days from such date April 25, 2017 through the exercise of stock options or similar rights. |
(2) | Beneficial ownership information is based on a Schedule 13G/A that is effective as of December 31, 2016 and was filed with the Securities and Exchange Commission by PRIMECAP Management Company (“PRIMECAP”). PRIMECAP is an investment adviser and has sole dispositive power with respect to 7,302,746 shares of our common stock and sole voting power with respect to 5,184,679 shares of our common stock. The business address of PRIMECAP is 177 E. Colorado Blvd., 11th Floor, Pasadena, California 91105. |
125
(3) | Beneficial ownership information is based on a Schedule 13G/A that is effective as of December 31, 2016 and was filed with the SEC by The Vanguard Group (“Vanguard”). Vanguard is an investment adviser and has sole dispositive power with respect to 4,279,608 shares of our common stock, shared dispositive power with respect to 83,073 shares of our common stock, sole voting power with respect to 74,507 shares of our common stock and shared voting power with respect to 7,225 shares of our common stock. The business address of Vanguard is 100 Vanguard Blvd., Malvern, Pennsylvania 19355. |
(4) | Beneficial ownership information is based on a Schedule 13G/A that is effective as of December 31, 2016 and was filed with the SEC by BlackRock, Inc. (“BlackRock”). BlackRock is a parent holding company or control person with respect to the reported shares for the accounts of other persons who have the right to receive, and the power to direct the receipt of, dividends and proceeds from the sale of such shares. BlackRock has sole dispositive power with respect to 2,999,531 shares of our common stock and sole voting power with respect to 2,923,471 shares of our common stock. The business address of BlackRock is 55 East 52nd Street, New York, New York 10022. |
(5) | Beneficial ownership information is based on a Schedule 13G/A that is effective as of December 31, 2016 and was filed with the SEC by Prescott General Partners LLC (“Prescott”). Prescott is an investment adviser, and all of the shares reported as beneficially owned by Prescott are owned by its clients, who have the right to receive dividends and proceeds from the sale of such shares. In its role as investment adviser, Prescott has shared dispositive power with respect to 2,941,045 shares of our common stock and shared voting power with respect to 2,941,045 shares of our common stock. The business address of Prescott is 2200 Butts Road, Suite 320, Boca Raton, Florida 33431. |
(6) | Includes 163,108 shares of common stock subject to options that are exercisable as of February 24, 2017 or within 60 days from such date and 94,646 shares of common stock issuable upon settlement of PVRSUs and RSUs that will vest within 60 days of February 24, 2017. |
(7) | Includes 55,600 shares of common stock subject to options that are exercisable as of February 24, 2017 or within 60 days from such date and 48,020 shares of common stock issuable upon settlement of PVRSUs and RSUs that will vest within 60 days of February 24, 2017. |
(8) | Includes 19,169 shares of common stock issuable upon settlement of PVRSUs and RSUs that will vest within 60 days of February 24, 2017. |
(9) | Includes 22,985 shares of common stock subject to options that are exercisable as of February 24, 2017 or within 60 days from such date and 18,399 shares of common stock issuable upon settlement of PVRSUs and RSUs that will vest within 60 days of February 24, 2017. |
(10) | Consists of 29,110 deferred stock units held in accordance with our outside director compensation policy and are vested as of February 24, 2017 or within 60 days from such date. |
(11) | Consists of 29,476 deferred stock units held in accordance with our outside director compensation policy and are vested as of February 24, 2017 or within 60 days from such date. |
(12) | Consists of 35,529 deferred stock units held in accordance with our outside director compensation policy and are vested as of February 24, 2017 or within 60 days from such date. |
(13) | Consists of 40,900 deferred stock units held in accordance with our outside director compensation policy and are vested as of February 24, 2017 or within 60 days from such date. |
(14) | Consists of 52,740 deferred stock units held in accordance with our outside director compensation policy and are vested as of February 24, 2017 or within 60 days from such date. |
(15) | Consists of 45,168 deferred stock units held in accordance with our outside director compensation policy and are vested as of February 24, 2017 or within 60 days from such date. |
(16) | Includes (a) 241,693 shares of common stock subject to options that are exercisable as of February 24, 2017 or within 60 days from such date, (b) 180,234 shares of common stock issuable upon settlement of RSUs and PVRSUs that will vest within 60 days of February 24, 2017, and (c) 232,923 deferred stock units held in accordance with our outside director compensation policy and are vested as of February 24, 2017 or within 60 days from such date. |
EQUITY COMPENSATION PLAN INFORMATION
We currently maintain six compensation plans under which shares of our Class A common stock have been authorized for issuance to directors, employees and consultants: the 1999 Equity Incentive Plan, the 2005 Stock Incentive Plan, the Amended
126
and Restated 2009 Stock Incentive Plan, the AMACAI Information Corporation 2004 Stock Incentive Plan (the “AMACAI Plan”), the Targus Information Corporation Amended and Restated 2004 Stock Incentive Plan (the “TARGUSinfo Plan”), and the NeuStar, Inc. Employee Stock Purchase Plan (the “ESPP”). The 1999 Equity Incentive Plan, the 2005 Stock Incentive Plan, the Amended and Restated 2009 Stock Incentive Plan, and the ESPP were approved by our stockholders, and the AMACAI Plan and the TARGUSinfo Plan were approved by the stockholders of AMACAI Information Corporation and TARGUSinfo, respectively. We assumed the AMACAI Plan and the TARGUSinfo Plan upon our acquisition of TARGUSinfo in November 2011. We will not make any further awards under the 1999 Equity Incentive Plan, the 2005 Stock Incentive Plan, the TARGUSinfo Plan or the AMACAI Plan. The following table provides information as of December 31, 2016 about outstanding options and shares reserved for issuance under the plans.
Plan Category | Number of securities to be issued upon exercise of outstanding options, warrants and rights | Weighted-average exercise price of outstanding options, warrants and rights | Number of securities remaining available for future issuance under equity compensation plans (excluding securities reflected in column (a)) | |||||||
(a) | (b) | (c) | ||||||||
Equity compensation plans approved by security holders | 4,268,599 | (1) | $ | 25.70 | (2) | 6,347,170 | (3) | |||
Equity compensation plans not approved by security holders | 113,272 | $ | 24.38 | — | ||||||
Total | 4,381,871 | $ | 25.55 | 6,347,170 | ||||||
(1) | Includes (a) 2,226,948 shares of Class A common stock underlying restricted stock units issued to our non-management directors and employees, and (b) 1,166,939 shares of Class A common stock, which represents the number of shares deliverable in respect of the performance-vested restricted stock units that were outstanding as of December 31, 2016. |
(2) | Excludes (a) 2,226,948 shares of Class A common stock underlying restricted stock units issued to our non-management directors and employees, and (b) 1,166,939 shares of Class A common stock, which represents the number of shares deliverable in respect of the performance-vested restricted stock units that were outstanding as of December 31, 2016. |
(3) | Includes (a) 6,259,454 shares of Class A common stock that may be issued under the Amended and Restated 2009 Stock Incentive Plan pursuant to awards of stock options, stock appreciation rights, restricted stock, restricted stock units, performance awards and other stock-based awards, and (b) 87,716 shares that may be issued under the ESPP. |
ITEM 13. | CERTAIN RELATIONSHIPS AND RELATED TRANSACTIONS AND DIRECTOR INDEPENDENCE |
CERTAIN RELATIONSHIPS AND RELATED PARTY TRANSACTIONS
Policies and Procedures for Review of Transactions with Related Persons
The Company has adopted a written Corporate Code of Business Conduct, which is available on our website at www.neustar.biz under the captions “Company — Investor Relations — Corporate Information — Code of Conduct”. The Code provides that the personal activities and relationships of directors, officers and employees must not conflict, or appear to conflict, with the interests of the Company. Any potential conflict of interest that involves an officer of the Company or a subsidiary — including any transaction between the Company and a third party in which the officer has a direct or indirect interest — must be approved in advance by the General Counsel and Chief Executive Officer of the Company. Any potential conflict of interest that involves a director or an executive officer of the Company must be approved by the Board or the Audit Committee.
Loans from the Company to directors and senior executives are prohibited by the Code. Loans from the Company to other officers and employees must be approved in advance by the Board or the Audit Committee.
All prior approvals required pursuant to the Code must be obtained in writing.
127
ITEM 14. | PRINCIPAL ACCOUNTING FEES AND SERVICES |
Audit and Non-Audit Fees
The following table presents fees billed for professional audit services rendered by Ernst & Young LLP for the audit of the Company’s annual financial statements and internal control over financial reporting for the years ended December 31, 2015 and December 31, 2016, and fees billed for audit-related, tax, and other services rendered by Ernst & Young LLP during those periods. All of these fees were approved by the Audit Committee.
2015 | 2016 | ||||||
Audit fees(1) | $ | 2,458,000 | $ | 2,620,282 | |||
Audit-related fees(2) | 430,000 | 390,000 | |||||
Tax fees(3) | 483,600 | 721,796 | |||||
Subtotal | 3,371,600 | 3,732,078 | |||||
All other fees(4) | 1,995 | 1,995 | |||||
Total fees | $ | 3,373,595 | $ | 3,734,073 | |||
(1) | Audit fees consisted principally of work performed in connection with the audit of our consolidated financial statements, work on the audit of internal control over financial reporting required by Section 404 of the Sarbanes-Oxley Act of 2002, statutory audits required by certain jurisdictions in which the Company operates, and review of the unaudited quarterly financial statements. |
(2) | Audit-related fees consisted principally of audits that we were required to conduct in connection with our requirements under the rules, regulations and orders of the Federal Communications Commission, as well as certain of our contracts. |
(3) | For fiscal 2016, tax fees were comprised of fees related to tax consulting of $420,986 and tax compliance of $300,810. For fiscal 2015, tax fees were comprised of fees related to tax consulting of $268,436 and tax compliance of $215,164. |
(4) | Other fees consisted of miscellaneous other permissible services not included in the first three categories and were immaterial for 2015 and 2016. |
Policy on Audit Committee Pre-Approval of Audit and Permissible Non-Audit Services of Independent Registered Public Accounting Firm
Pursuant to the Audit Committee Charter, Audit Committee policy and the requirements of law, the Audit Committee pre-approves all audit and permissible non-audit services to be provided by our independent registered public accounting firm. This pre-approval applies to audit services, audit-related services, tax services and other services. In some cases, the full Audit Committee provides pre-approval for up to a year related to a particular defined task or scope of work, subject to a specific budget. In other cases, the chairman of the Audit Committee has the delegated authority from the Audit Committee to pre-approve services, and the chairman then communicates such pre-approvals to the full Audit Committee. To avoid potential conflicts of interest, the law prohibits a publicly traded company from obtaining certain non-audit services from its independent audit firm. We obtain these services from other service providers as needed.
PART IV
ITEM 15. | EXHIBITS, FINANCIAL STATEMENT SCHEDULES |
(a) | Documents filed as part of this report: |
(1)
Page | |
Report of Independent Registered Public Accounting Firm | |
Consolidated Financial Statements covered by the Report of Independent Registered Public Accounting Firm: | |
Consolidated Balance Sheets as of December 31, 2015 and 2016 | |
Consolidated Statements of Operations for the years ended December 31, 2014, 2015 and 2016 | |
Consolidated Statements of Comprehensive Income for the years ended December 31, 2014, 2015 and 2016 | |
Consolidated Statements of Stockholders’ Equity for the years ended December 31, 2014, 2015 and 2016 | |
Consolidated Statements of Cash Flows for the years ended December 31, 2014, 2015 and 2016 | |
Notes to Consolidated Financial Statements | |
(2)
Schedule for the three years ended December 31, 2014, 2015 and 2016:
II — Valuation and Qualifying Accounts | |
(a) (3) and (b) Exhibits required by Item 601 of Regulation S-K:
128
NEUSTAR, INC.
SCHEDULE II — VALUATION AND QUALIFYING ACCOUNTS
As of December 31, | |||||||||||
2014 | 2015 | 2016 | |||||||||
(in thousands) | |||||||||||
Allowance for Doubtful Accounts | |||||||||||
Beginning balance | $ | 2,507 | $ | 3,154 | $ | 4,512 | |||||
Additions | 7,015 | 9,399 | 7,200 | ||||||||
Reductions(1) | (6,368 | ) | (8,041 | ) | (5,140 | ) | |||||
Ending balance | $ | 3,154 | $ | 4,512 | $ | 6,572 | |||||
Deferred Tax Asset Valuation Allowance | |||||||||||
Beginning balance | $ | 2,821 | $ | 4,584 | $ | 8,552 | |||||
Additions | 2,841 | 4,001 | 749 | ||||||||
Reductions | (1,078 | ) | (33 | ) | (694 | ) | |||||
Ending balance | $ | 4,584 | $ | 8,552 | $ | 8,607 | |||||
(1) | Includes the reinstatement and subsequent collections of account receivable that were previously written-off. |
ITEM 15. | FORM 10-K SUMMARY |
None.
Exhibit Index
See exhibits listed under the Exhibit Index below.
129
SIGNATURES
Pursuant to the requirements of Section 13 or 15(d) of the Securities Exchange Act of 1934, the registrant has duly caused this report to be signed on its behalf by the undersigned, thereunto duly authorized on March 1, 2017.
NEUSTAR, INC. | |||
By: | /s/ Lisa A. Hook | ||
Lisa A. Hook | |||
President and Chief Executive Officer | |||
We, the undersigned directors and officers of NeuStar, Inc., hereby severally constitute Lisa A. Hook and Paul S. Lalljie, and each of them singly, our true and lawful attorneys with full power to them and each of them to sign for us, in our names in the capacities indicated below, any and all amendments to this Annual Report on Form 10-K filed with the Securities and Exchange Commission.
Pursuant to the requirements of the Securities Act of 1934, this report has been signed below by the following persons on behalf of the registrant and in the capacities indicated on March 1, 2017.
Signature | Title |
/s/ Lisa A. Hook | President, Chief Executive Officer (Principal Executive Officer) and Director |
Lisa A. Hook | |
/s/ Paul S. Lalljie | Senior Vice President and Chief Financial Officer (Principal Financial Officer and Principal Accounting Officer) |
Paul S. Lalljie | |
/s/ James G. Cullen | Chairman, Board of Directors |
James G. Cullen | |
/s/ Paul D. Ballew | Director |
Paul D. Ballew | |
/s/ Joel P. Friedman | Director |
Joel P. Friedman | |
/s/ Mark N. Greene | Director |
Mark N. Greene | |
/s/ Ross K. Ireland | Director |
Ross K. Ireland | |
/s/ Paul A. Lacouture | Director |
Paul A. Lacouture | |
/s/ Deborah D. Rieman | Director |
Deborah D. Rieman | |
/s/ Michael J. Rowny | Director |
Michael J. Rowny | |
/s/ Hellene S. Runtagh | Director |
Hellene S. Runtagh | |
130
Exhibit Index
Exhibits identified in parentheses below are on file with the SEC and are incorporated herein by reference. All other exhibits are provided as part of this electronic submission.
Exhibit Number | Description of Exhibit | |
(2.1) | Agreement and Plan of Merger, dated as of October 10, 2011, by and among NeuStar, Inc., Tumi Merger Sub, Inc., Targus Information Corporation and Michael M. Sullivan, as Stockholder Representative, incorporated herein by reference to Exhibit 2.1 to our Current Report on Form 8-K, filed October 11, 2011.* | |
(2.2) | Asset Purchase Agreement, dated as of September 9, 2015, by and among NeuStar, Inc. and Transaction Network Services, Inc., incorporated by reference to Exhibit 2.1 to our Current Report on Form 8-K filed September 9, 2015.* | |
(2.3) | Securities Purchase Agreement, dated as of November 5, 2015, by and among NeuStar, MarketShare, the Sellers (as defined therein), the Warrant Holders (as defined therein), and Shareholder Representative Services LLC, as the Sellers Representative, incorporated by reference to Exhibit 2.1 to our Current Report on Form 8-K Filed November 6, 2015.* | |
(2.4) | Agreement and Plan of Merger, dated as of December 14, 2016 by and among Aerial Topco, L.P., Aerial Merger Sub, Inc. incorporated herein by reference to Exhibit 2.1 to our Current Report on Form 8-K, filed December 14, 2016.* | |
(3.1) | Third Restated Certificate of Incorporation, incorporated herein by reference to Exhibit 3.1.2 to our Quarterly Report on Form 10-Q, filed October 29, 2015. | |
(3.2) | Amended and Restated Bylaws, incorporated herein by reference to Exhibit 3.2 to our Quarterly Report on Form 10-Q, filed October 29, 2015. | |
(3.3) | Amendment to Amended and Restated Bylaws, incorporated herein by reference to Exhibit 3.1 to our Current Report on Form 8-K, filed December 14, 2016. | |
(4.1) | Indenture, dated as of January 22, 2013, among NeuStar, Inc., each of the subsidiary guarantors party thereto and The Bank of New York Mellon Trust Company, N.A., as trustee, incorporated herein by reference to Exhibit 99.1 to our Current Report on Form 8-K, filed January 22, 2013. | |
(10.1) | Contractor services agreement entered into the 7th day of November 1997 by and between NeuStar, Inc. and North American Portability Management LLC, as amended, incorporated herein by reference to (a) Exhibit 10.1 to our Quarterly Report on Form 10-Q, filed August 15, 2005; (b) Exhibit 10.1.1. to our Annual Report on Form 10-K, filed March 29, 2006; (c) Exhibit 10.1.2 to our Quarterly Report on Form 10-Q, filed August 14, 2006; (d) Exhibit 10.1.3 to our Quarterly Report on Form 10-Q, filed August 14, 2006**; (e) Exhibit 99.1 to our Current Report on Form 8-K, filed September 22, 2006; (f) Exhibit 10.1.1 to our Annual Report on Form 10-K, filed March 1, 2007; (g) Exhibit 10.1.2 to our Quarterly Report on Form 10-Q, filed November 5, 2007**, (h) Exhibit 10.1.1 to our Annual Report on Form 10-K, filed February 28, 2008, (i) Exhibit 10.1.2 to our Quarterly Report on Form 10-Q, filed November 10, 2008; (j) Exhibit 99.1 to our Current Report on Form 8-K, filed on January 28, 2009; (k) Exhibit 10.1.3 to our Quarterly Report on Form 10-Q, filed on August 4, 2009; and (l) Exhibit 10.1.4 to our Quarterly Report on Form 10-Q, filed on October 30, 2009, (m) Exhibit 10.1.1 to our Annual Report on form 10-K, filed February 26, 2010; (n) Exhibit 10.1.2 to our Quarterly Report on Form 10-Q, filed on July 28, 2010; (o) Exhibit 10.1.1 to our Quarterly Report on Form 10-Q, filed April 27, 2011; and (p) Exhibit 10.1.1 to our Quarterly Report on Form 10-Q, filed November 5, 2012; (q) Exhibit 10.1.1** to our Annual Report on Form 10-K, filed February 28, 2013; (r) Exhibit 10.1.2 to our Quarterly Report on Form 10-Q, filed May 2, 2013; (s) Exhibits 10.1.3**, 10.1.4** and 10.1.5, respectively, to our Quarterly Report on Form 10-Q, filed July 30, 2013; (t) Exhibit 10.1.6** to our Quarterly Report on Form 10-Q, filed October 30, 2013; (w) Exhibit 10.1.2 to our Annual Report on Form 10-K, filed February 28, 2014; (x) Exhibit 99.1 to our Current Report on Form 8-K filed on April 8, 2015; (y) Exhibit 10.1.1 to our Quarterly Report on Form 10-Q filed on July 30, 2015, and (z) Exhibit 10.1.1 to our Annual Report on Form 10-K filed on February 29, 2016. | |
(10.2) | NeuStar, Inc. 1999 Equity Incentive Plan (the “1999 Plan”), incorporated herein by reference to Exhibit 10.8 to Amendment No. 3 to our Registration Statement on Form S-1, filed May 27, 2005 (File No. 333-123635).† | |
(10.3) | NeuStar, Inc. 2005 Stock Incentive Plan (the “2005 Plan”), incorporated herein by reference to Exhibit 10.51 to our Quarterly Report on Form 10-Q, filed August 8, 2007.† | |
(10.4) | TARGUS Information Corporation Amended and Restated 2004 Stock Incentive Plan, incorporated herein by reference to Exhibit 99.1 to our Registration Statement on Form S-8, filed November 18, 2011 (File No. 333-177979).† | |
131
Exhibit Number | Description of Exhibit | |
(10.5) | AMACAI Information Corporation 2004 Stock Incentive Plan, incorporated by reference to Exhibit 99.1 to our Registration Statement on Form S-8, filed November 14, 2011 (File No. 333-177976).† | |
(10.6) | Loudoun Tech Center Office Lease by and between Merritt-LT1, LLC, Landlord, and NeuStar, Inc., Tenant, incorporated herein by reference to Exhibit 99.1 to our Current Report on Form 8-K, filed on June 2, 2009. | |
(10.7) | Loudoun Tech Center Office Lease by and between Merritt-LT1, LLC, Landlord, and NeuStar, Inc., Tenant, incorporated herein by reference to (a) Exhibit 10.37 to Amendment No. 2 to our Registration Statement on Form S-1, filed May 11, 2005 (File No. 333-123635) and (b) Exhibit 99.2 to our Current Report on Form 8-K, filed June 2, 2009. | |
(10.8) | Lease, dated January 20, 2010, by and between Ridgetop Three, L.L.C. and NeuStar, Inc., incorporated herein by reference to (a) Exhibit 99.1 to our Current Report on Form 8-K, filed January 20, 2010, and (b) Exhibit 10.61.1 to our Quarterly Report on Form 10-Q, filed October 28, 2010. | |
(10.9) | Credit Agreement dated as of January 22, 2013 among NeuStar, Inc., Morgan Stanley Senior Funding Inc., as Administrative Agent, Initial Swing Line Bank and Collateral Agent, and the guarantors, other agents and lenders party thereto, incorporated herein by reference to Exhibit 10.3 to our Current Report on Form 8-K, filed January 22, 2013. | |
(10.10) | Security Agreement dated January 22, 2013 among NeuStar, Inc., Morgan Stanley Senior Funding Inc., as Collateral Agent for the secured parties thereto, and the subsidiaries of NeuStar, Inc. party thereto, incorporated herein by reference to Exhibit 10.3 to our Current Report on Form 8-K, filed January 22, 2013. | |
(10.11) | NeuStar, Inc. 2016 Key Employee Severance Pay Plan, incorporated herein by reference to Exhibit 10.11 to our Annual Report on Form 10-K, filed February 29, 2016.† | |
(10.12) | Side Letter to NeuStar, Inc. 2016 Key Employee Severance Pay Plan, incorporated herein by reference to Exhibit 10.12 to our Annual Report on Form 10-K, filed February 29, 2016.† | |
(10.13) | Executive Relocation Policy, incorporated herein by reference to Exhibit 10.29 to our Quarterly Report on Form 10-Q, filed August 4, 2009.† | |
(10.14) | Form of Nonqualified Stock Option Agreement under the 2005 Plan, incorporated herein by reference to Exhibit 99.4 to our Current Report on Form 8-K, filed March 5, 2007.† | |
(10.15) | Form of Incentive Stock Option Agreement under the 2005 Plan, incorporated herein by reference to Exhibit 10.47 to Amendment No. 3 to our Registration Statement on Form S-1, filed May 27, 2005 (File No. 333-123635).† | |
(10.16) | Form of Indemnification Agreement, incorporated by reference to Exhibit 10.15 to NeuStar, Inc.’s Annual Report on Form 10-K, filed February 29, 2012.† | |
(10.17) | Summary Description of Non-Management Director Compensation incorporated herein by reference to Exhibit 10.17 to our Quarterly Report on Form 10-Q, filed April 28, 2016.† | |
(10.18) | Forms of Directors’ Restricted Stock Unit Agreement, incorporated herein by reference to (a) Exhibit 99.2 to our Current Report on Form 8-K, filed April 14, 2006;(b) Exhibit 10.36 to our Quarterly Report on Form 10-Q, filed August 4, 2009; (c) Exhibit 10.46 to our Quarterly Report on Form 10-Q, filed July 28, 2011; (d) Exhibit 10.47 to our Quarterly Report on Form 10-Q, filed July 28, 2011; (e) Exhibit 10.38 to our Quarterly Report on Form 10-Q, filed July 26, 2012; and (f) Exhibit 10.39 to our Quarterly Report on Form 10-Q, filed July 26, 2012.† | |
(10.19) | Form of Performance Award Agreement under the NeuStar, Inc. 2005 Stock Incentive Plan, as amended, incorporated herein by reference to Exhibit 99.1 to our Current Report on Form 8-K/A, filed February 28, 2008.† | |
(10.2) | Form of Restricted Stock Agreement under the NeuStar, Inc. 2005 Stock Incentive Plan, as amended, incorporated herein by reference to Exhibit 99.2 to our Current Report on Form 8-K/A, filed February 28, 2008.† | |
(10.21) | Second Form of Restricted Stock Agreement under the NeuStar, Inc. 2005 Stock Incentive Plan, as amended, incorporated herein by reference to Exhibit 99.3 to our Current Report on Form 8-K/A, filed February 28, 2008.† | |
(10.22) | Form of Nonqualified Stock Option Agreement under the NeuStar, Inc. 2009 Stock Incentive Plan, incorporated by reference from Exhibit 99.2 to our Current Report on Form 8-K, filed December 15, 2009. † | |
(10.23) | Form of Performance Award Agreement under the NeuStar, Inc. 2009 Stock Incentive Plan, incorporated herein by reference to Exhibit 99.1 to our Current Report on Form 8-K, filed March, 1, 2010. † | |
132
Exhibit Number | Description of Exhibit | |
(10.24) | Form of Restricted Stock Agreement under the NeuStar, Inc. 2009 Stock Incentive Plan, incorporated herein by reference to Exhibit 99.2 to our Current Report on Form 8-K, filed March 1, 2010. † | |
(10.25) | Form of Performance Award Agreement under the NeuStar, Inc. 2009 Stock Incentive Plan, as amended, incorporated herein by reference to Exhibit 10.46 to our Quarterly Report on Form 10-Q, filed April 27, 2011. † | |
(10.26) | Form of Restricted Stock Agreement under the NeuStar, Inc. 2009 Stock Incentive Plan, as amended incorporated herein by reference to Exhibit 10.47 to our Quarterly Report on Form 10-Q, filed April 27, 2011. † | |
(10.27) | Form of Nonqualified Stock Option Agreement under the NeuStar, Inc. 2009 Stock Incentive Plan, incorporated herein by reference from Exhibit 10.48 to our Quarterly Report on Form 10-Q, filed April 27, 2011. † | |
(10.28) | NeuStar, Inc. Deferred Compensation Plan incorporated herein by reference from Exhibit 10.27 to our Annual Report on Form 10-K, filed February 13, 2015.† | |
(10.29) | Form of Agreement Respecting Noncompetition, Nonsolicitation and Confidentiality, incorporated herein by reference to Exhibit 10.41 to our Quarterly Report on Form 10-Q, filed May 12, 2008. | |
(10.3) | Employment Agreement, made as of January 15, 2009, by and between NeuStar, Inc. and Paul Lalljie, incorporated herein by reference to Exhibit 99.2 to our Current Report on Form 8-K, filed January 15, 2009, as superseded by Compensation Agreement, made as of December 9, 2009, by and between Neustar, Inc. and Paul Lalljie, incorporated herein by reference to Exhibit 99.1 to our Current Report on From 8-K, filed on December 15, 2009.† | |
(10.31) | NeuStar, Inc. 2009 Performance Achievement Reward Plan, incorporated herein by reference to Exhibit 99.1 to our Current Report on Form 8-K, filed February 27, 2009.† | |
(10.32) | Amended and Restated NeuStar, Inc. Corporate Bonus Plan (formerly known as the 2009 Performance Achievement Award Plan), incorporated herein by reference to Annex B to NeuStar’s Definitive Proxy Statement on Schedule 14A, filed April 17, 2014.† | |
(10.33) | Form of Performance Award Agreement under the NeuStar, Inc. 2005 Stock Incentive Plan, incorporated herein by reference to Exhibit 99.2 to our Current Report on Form 8-K, filed February 27, 2009.† | |
(10.34) | Form of Performance Award Agreement under the NeuStar, Inc. 2009 Stock Incentive Plan, incorporated herein by reference to Exhibit 99.3 to our Current Report on Form 8-K, filed December 15, 2009.† | |
(10.35) | NeuStar, Inc. 2009 Stock Incentive Plan, incorporated herein by reference to Exhibit 99.1 to our Current Report on Form 8-K, filed on April 13, 2009.† | |
(10.36) | Amended and Restated NeuStar. Inc. 2009 Stock Incentive Plan, incorporated herein by reference to Annex B to our Definitive Proxy Statement on Schedule 14A, filed on April 17, 2015.† | |
(10.37) | Form of Agreement Respecting Noncompetition, Nonsolicitation and Nondisparagement, incorporated herein by reference to Exhibit 10.42 to our Annual Report on Form 10-K, filed February 25, 2011.† | |
(10.38) | Board Stock Ownership Guidelines, incorporated herein by reference to Exhibit 10.43 to our Annual Report on Form 10-K, filed February 25, 2011. | |
(10.39) | Form of Performance Award Agreement under the NeuStar, Inc. 2005 Stock Incentive Plan, as amended, incorporated herein by reference to Exhibit 99.3 to our Current Report on Form 8-K, filed July 13, 2007.† | |
(10.40) | Form of Restricted Stock Agreement under the NeuStar, Inc. 2005 Stock Incentive Plan, incorporated by reference to Exhibit 10.45 to Amendment No. 3 to our Registration Statement on Form S-1, filed May 27, 2005 (File No. 333-123635).† | |
(10.41) | Amended and Restated NeuStar, Inc. 2009 Stock Incentive Plan. † | |
(10.42) | NeuStar, Inc. Employee Stock Purchase Plan. † | |
(10.43) | Registration Rights Agreement, dated January 22, 2013, among NeuStar, Inc., the guarantors signatory hereto and J.P. Morgan Securities LLC, Morgan Stanley & Co. LLC and RBC Capital Markets, LLC, incorporated by reference to Exhibit 10.1 to our Current Report on Form 8-K, filed January 22, 2013. | |
(10.44) | Form of Restricted Stock Unit Award Agreement, incorporated by reference to Exhibit 99.1 to our Current Report on Form 8-K,filed March 2, 2012. † | |
133
Exhibit Number | Description of Exhibit | |
(10.45) | Form of Performance-Vested Restricted Stock Unit Award Agreement, incorporated by reference to Exhibit 99.2 to our Current Report on Form 8-K,filed March 2, 2012. † | |
(10.46) | Amendment No. 1 to the Credit Agreement and Security Agreement, dated as of December 9, 2015, by and among NeuStar, Inc., certain subsidiaries of NeuStar, Inc. party thereto as Guarantors, Morgan Stanley Senior Funding, Inc., as Administrative Agent and Collateral Agent, and the Lenders party thereto, incorporated by reference to Exhibit 10.1 to our Current Report on Form 8-K, filed on December 9, 2015. | |
(10.47) | Amendment No. 2 to Credit Agreement dated as of December 9, 2015, by and among NeuStar, Inc., certain subsidiaries of NeuStar, Inc. party thereto as Guarantors, Morgan Stanley Senior Funding, Inc., as Administrative Agent, Collateral Agent and Lead Arranger, the other Lead Arrangers party thereto, the Increasing Lenders party thereto, and the Assuming Lenders party thereto, incorporated by reference to Exhibit 10.2 to our Current Report on Form 8-K, filed on December 9, 2015. | |
(10.48) | Amendment No. 3 to Credit Agreement dated as of September 28, 2016, by and among NeuStar, Inc., certain subsidiaries of NeuStar, Inc. party thereto as Guarantors, Morgan Stanley Senior Funding, Inc., as Administrative Agent, Collateral Agent and Lead Arranger, the other Lead Arrangers party thereto, the Joint Bookrunners party thereto, the Co-Syndication Agents thereto, and the Co-Document agents thereto incorporated herein by reference to Exhibit 10.1 to our Current Report on Form 8-K, filed on September 28, 2016. | |
(10.49) | Amended and Restated NeuStar. Inc. 2009 Stock Incentive Plan, incorporated herein by reference to Annex B to our Definitive Proxy Statement on Schedule 14A, filed on April 29, 2016.† | |
(10.50) | Form of Performance-Vested Restricted Stock Unit Award Agreement, incorporated herein by reference to Exhibit 10.48 to our Quarterly Report on Form 10-Q, filed on July 28, 2016.† | |
(10.51) | Form of Restricted Stock Unit Award Agreement, incorporated herein by reference to Exhibit 10.49 to our Quarterly Report on Form 10-Q, filed on July 28, 2016.† | |
21.1 | Subsidiaries of NeuStar, Inc. | |
23.1 | Consent of Ernst & Young LLP, independent registered public accounting firm. | |
24.1 | Power of Attorney (included on the signature page herewith). | |
31.1 | Chief Executive Officer Certification pursuant to Section 302 of the Sarbanes-Oxley Act of 2002. | |
31.2 | Chief Financial Officer Certification pursuant to Section 302 of the Sarbanes-Oxley Act of 2002. | |
32.1 | Certification of Chief Executive Officer and Chief Financial Officer pursuant to 18 U.S.C. Section 1350, as adopted pursuant to Section 906 of the Sarbanes-Oxley Act of 2002. | |
(99.1) | Update to the Functional Requirements Specification, which is attached as Exhibit B to the contractor services agreement by and between NeuStar, Inc. and North American Portability Management, LLC. | |
(99.2) | Update to the Interoperable Interface Specification, which is attached as Exhibit C to the contractor services agreement by and between NeuStar, Inc. and North American Portability Management, LLC. | |
101.INS | XBRL Instance Document | |
101.SCH | XBRL Taxonomy Extension Schema | |
101.CAL | XBRL Taxonomy Extension Calculation | |
101.DEF | XBRL Taxonomy Extension Definition | |
101.LAB | XBRL Taxonomy Extension Label | |
101.PRE | XBRL Taxonomy Extension Presentation | |
* | Schedules have been omitted pursuant to Item 601(b)(2) of Regulation S-K. Neustar hereby undertakes to furnish copies of any of the omitted schedules upon request by the Securities and Exchange Commission. | |
** | Confidential treatment has been requested for portions of this document. The omitted portions of this document have been filed with the Securities and Exchange Commission. | |
† | Compensation arrangement. | |
134