Attached files
| file | filename |
|---|---|
| EX-32.1 - EX-32.1 - MKS INSTRUMENTS INC | d326475dex321.htm |
| EX-31.2 - EX-31.2 - MKS INSTRUMENTS INC | d326475dex312.htm |
| EX-31.1 - EX-31.1 - MKS INSTRUMENTS INC | d326475dex311.htm |
| EX-23.1 - EX-23.1 - MKS INSTRUMENTS INC | d326475dex231.htm |
| EX-21.1 - EX-21.1 - MKS INSTRUMENTS INC | d326475dex211.htm |
| EX-10.10 - EX-10.10 - MKS INSTRUMENTS INC | d326475dex1010.htm |
| EX-10.8 - EX-10.8 - MKS INSTRUMENTS INC | d326475dex108.htm |
Table of Contents
UNITED STATES SECURITIES AND EXCHANGE COMMISSION
WASHINGTON, D.C. 20549
Form 10-K
(MARK ONE)
| ☒ | ANNUAL REPORT PURSUANT TO SECTION 13 OR 15(d) OF THE SECURITIES EXCHANGE ACT OF 1934 |
For the fiscal year ended December 31, 2016
or
| ☐ | TRANSITION REPORT PURSUANT TO SECTION 13 OR 15(d) OF THE SECURITIES EXCHANGE ACT OF 1934 |
For the transition period from to
Commission File number 0-23621
MKS INSTRUMENTS, INC.
(Exact Name of Registrant as Specified in Its Charter)
| Massachusetts | 04-2277512 | |
| (State or other Jurisdiction of Incorporation or Organization) |
(IRS Employer Identification No.) | |
| 2 Tech Drive, Suite 201, Andover, Massachusetts | 01810 | |
| (Address of Principal Executive Offices) | (Zip Code) | |
(978) 645-5500
(Registrant’s Telephone Number, including area code)
Securities registered pursuant to Section 12(b) of the Act:
| Title of class |
Name of exchange on which registered | |
| Common Stock, no par value | NASDAQ Global Select Market |
Securities registered pursuant to Section 12(g) of the Act: None
Indicate by check mark if the registrant is a well-known seasoned issuer, as defined in Rule 405 of the Securities Act. Yes ☒ No ☐
Indicate by check mark if the registrant is not required to file reports pursuant to Section 13 or Section 15(d) of the Act. Yes ☐ No ☒
Indicate by check mark whether the registrant (1) has filed all reports required to be filed by Section 13 or 15(d) of the Securities Exchange Act of 1934 during the preceding 12 months (or for such shorter period that the registrant was required to file such reports), and (2) has been subject to such filing requirements for the past 90 days. Yes ☒ No ☐
Indicate by check mark whether the registrant has submitted electronically and posted on its corporate Web site, if any, every Interactive Data File required to be submitted and posted pursuant to Rule 405 of Regulation S-T (§ 232.405 of this chapter) during the preceding 12 months (or for such shorter period that the registrant was required to submit and post such files). Yes ☒ No ☐
Indicate by check mark if disclosure of delinquent filers pursuant to Item 405 of Regulation S-K (§ 229.405 of this chapter) is not contained herein, and will not be contained, to the best of registrant’s knowledge, in definitive proxy or information statements incorporated by reference in Part III of this Form 10-K or any amendment to this Form 10-K. ☒
Indicate by check mark whether the registrant is a large accelerated filer, an accelerated filer, a non-accelerated filer, or a smaller reporting company. See the definitions of “large accelerated filer,” “accelerated filer” and “smaller reporting company” in Rule 12b-2 of the Exchange Act. (Check one):
| Large accelerated filer ☒ | Accelerated filer ☐ | Non-accelerated filer ☐ | Smaller reporting company ☐ | |||
| (Do not check if a smaller reporting company) | ||||||
Indicate by check mark whether the registrant is a shell company (as defined in Rule 12b-2 of the Exchange Act). Yes ☐ No ☒
Aggregate market value of the voting and non-voting common equity held by nonaffiliates of the registrant as of June 30, 2016 based on the closing price of the registrant’s common stock on such date as reported by the NASDAQ Global Select Market: $2,306,662,236.
Number of shares outstanding of the issuer’s common stock, no par value, as of February 22, 2017: 53,824,189
DOCUMENTS INCORPORATED BY REFERENCE
Portions of the definitive Proxy Statement for MKS’ Annual Meeting of Stockholders to be held on May 10, 2017 are incorporated by reference into Part III of this Form 10-K.
Table of Contents
1
Table of Contents
SPECIAL NOTE REGARDING FORWARD-LOOKING STATEMENTS
This Annual Report on Form 10-K contains “forward-looking statements” within the meaning of the Private Securities Litigation Reform Act of 1995, Section 27A of the Securities Act and Section 21E of the Securities Exchange Act. When used herein, the words “believe,” “anticipate,” “plan,” “expect,” “estimate,” “intend,” “may,” “see,” “will,” “would” and similar expressions are intended to identify forward-looking statements although not all forward-looking statements contain these identifying words. These forward-looking statements reflect management’s current opinions and are subject to certain risks and uncertainties that could cause actual results to differ materially from those stated or implied. MKS assumes no obligation to update this information. Risks and uncertainties include, but are not limited to, those discussed in the section entitled “Risk Factors” of this annual report on Form 10-K.
| Item 1. | Business |
MKS Instruments, Inc. (“MKS” or the “Company”) was founded in 1961 as a Massachusetts corporation. We are a global provider of instruments, subsystems and process control solutions that measure, control, power, deliver, monitor and analyze critical parameters of advanced manufacturing processes to improve process performance and productivity. Our products are derived from our core competencies in automation and control, gas composition analysis, lasers, materials delivery, optics, photonics, pressure, power, reactive gas and vacuum. We also provide services relating to the maintenance and repair of our products, software, service and maintenance, installation services and training.
Recent Events
On April 29, 2016, we completed our acquisition of Newport Corporation (“Newport”) pursuant to an Agreement and Plan of Merger dated as of February 22, 2016 (the “Newport Merger”). At the effective time of the Newport Merger, each share of Newport’s common stock issued and outstanding as of immediately prior to the effective time of the Newport Merger was converted into the right to receive $23.00 in cash, without interest and subject to deduction for any required withholding tax. We paid to the former Newport stockholders aggregate consideration of approximately $905 million, excluding related transaction fees and expenses, and repaid approximately $93 million of Newport’s U.S. indebtedness outstanding as of immediately prior to the effective time of the Newport Merger. We funded the payment of the aggregate consideration with a combination of our available cash on hand of approximately $240 million and the proceeds from the senior secured term loan facility in the principal amount of $780 million described below.
Newport is a global supplier of advanced-technology products and systems to customers in the scientific research and defense/security, microelectronics, life and health sciences and industrial manufacturing markets.
Effective April 29, 2016, in conjunction with our acquisition of Newport, we changed the structure of our reportable segments based upon our organizational structure and how our Chief Operating Decision Maker (“CODM”) utilizes information provided to allocate resources and make decisions. Our two reportable segments are the Vacuum & Analysis segment and the Light & Motion segment. The Vacuum & Analysis segment represents the legacy MKS business and the Light & Motion segment represents the legacy Newport business.
The Vacuum & Analysis segment provides a broad range of instruments, components, subsystems and software which are derived from our core competencies in pressure measurement and control, flow measurement and control, gas and vapor delivery, gas composition analysis, residual gas analysis, leak detection, control and information technology, ozone generation and delivery, RF & DC power, reactive gas generation and vacuum technology. The Light & Motion segment provides a broad range of instruments, components and subsystems which are derived from our core competencies in lasers, photonics and optics.
2
Table of Contents
We group our products into seven product groups based upon the similarity of the product function, type of product and manufacturing processes. These seven groups are: Analytical and Controls Solutions Products; Materials Delivery Solutions Products; Power, Plasma and Reactive Gas Solutions Products; Pressure and Vacuum Measurement Products; Photonics Products; Optics Products; and Laser Products. The Analytical and Controls Solutions Products, Materials Delivery Solutions Products, Power, Plasma and Reactive Gas Solutions Products and the Pressure and Vacuum Measurement Products are included in the Vacuum & Analysis segment and the Photonics Products, Optics Products and Lasers Products are included in the Light & Motion segment.
For further information on our segments, see Note 21 to the Notes to the Consolidated Financials contained in this Annual Report on Form 10-K.
We file reports, proxy statements and other documents with the Securities and Exchange Commission (“SEC”). You may read and copy any document we file at the SEC Headquarters at the SEC’s Public Reference Room at 100 F Street, NE, Washington, D.C. 20549. You should call 1-800-SEC-0330 for more information on the public reference room. Our SEC filings are also available to you on the SEC’s internet site at http://www.sec.gov.
Our internet address is http://www.mksinst.com. We are not including the information contained in our website as part of, or incorporating it by reference into, this annual report on Form 10-K. We make available free of charge through our internet site our Annual Reports on Form 10-K, Quarterly Reports on Form 10-Q, Current Reports on Form 8-K and amendments to these reports filed or furnished pursuant to Section 13(a) or 15(d) of the Securities Exchange Act of 1934, as amended (the “Exchange Act”), as soon as reasonably practicable after we electronically file such materials with, or furnish them to, the SEC.
Markets and Applications
Since our inception, we have focused on satisfying the needs of our customers by establishing long-term collaborative relationships. We have a diverse base of customers and our primary served markets are manufacturers of capital equipment for semiconductor manufacturing, electronic thin films, life and health sciences, process and industrial technologies, as well as research and defense. Approximately 58%, 69% and 70% of our net revenues for the years 2016, 2015 and 2014, respectively, were from sales to semiconductor capital equipment manufacturers and semiconductor device manufacturers. As a result of our acquisition of Newport, we estimate that sales to semiconductor capital equipment manufacturers and semiconductor device manufacturers could account for approximately 50% of our total sales in future periods.
Approximately 42%, 31% and 30% of our net revenues in the years 2016, 2015 and 2014, respectively, were from other advanced manufacturing applications. These include, but are not limited to, electronic thin films, life and health sciences, process and industrial technologies, as well as research and defense.
A significant portion of our net revenues are from sales to customers in international markets. For the years ended December 31, 2016, 2015 and 2014, international net revenues accounted for approximately 48%, 44% and 43% of our total net revenues, respectively. A significant portion of our international net revenues were in Korea, Japan and Israel. We expect that international net revenues will continue to represent a significant percentage of our total net revenues.
Semiconductor Manufacturing Applications
The majority of our sales are derived from products sold to semiconductor capital equipment manufacturers and semiconductor device manufacturers. Our products are used in the major semiconductor processing steps such as depositing thin films of material onto silicon wafer substrates, etching, cleaning, lithography, metrology and inspection. In addition, we provide specialized instruments and software to monitor and analyze process performance.
3
Table of Contents
We anticipate that the semiconductor manufacturing market will continue to account for a substantial portion of our sales. While the semiconductor device manufacturing market is global, major semiconductor capital equipment manufacturers are concentrated in Japan, Korea, Taiwan, the United States and China.
Other Markets
In addition to semiconductor manufacturing, our products are used in the manufacture of electronic thin films, life and health sciences, process and industrial technologies, as well as research and defense.
Electronic Thin Films
Electronic Thin Films are a primary component of numerous electronic products including flat panel displays, light emitting diodes, solar cells and data storage media. Major manufacturers of Electronic Thin Film equipment are concentrated in China, Japan, Korea, Taiwan and the United States.
Life and Health Sciences
Our products for Life and Health Sciences are used in a diverse array of applications including bioimaging, medical instrument sterilization, medical device manufacturing, analytical, diagnostic and surgical instrumentation, consumable medical supply manufacturing and pharmaceutical production. Our Life and Health Sciences customers are located globally.
Process and Industrial Technologies
Process and Industrial Technologies encompasses a wide range of diverse applications such as architectural glass coating, laser marking, measurement and scribing, natural gas and oil production and environmental monitoring. Process and Industrial Technologies manufacturers are located in developed and developing countries across the globe.
Government and Research
In addition, our products are sold to government, university and industrial laboratories for applications involving research and development in materials science, physical chemistry, photonics, optics and electronics materials. Our products are also sold for monitoring and defense applications including surveillance, imaging and infrastructure protection. Major equipment and process providers and research laboratories are concentrated in China, Europe, Japan, Korea and the United States.
Product Groups
Vacuum and Analysis Segment
The Vacuum and Analysis segment includes Analytical and Control Solutions; Materials Delivery Solutions; Power, Plasma and Reactive Gas Generation Solutions; and Pressure and Vacuum Measurement Solutions.
Analytical and Control Solutions. Our Analytical and Control Solutions products include gas analyzers, automation control products, IO modules, automation software, data analytics software, and precision machined components and electromechanical assemblies.
Materials Delivery Solutions. Our Materials Delivery Solutions products include flow and valve technologies as well as integrated pressure measurement and control subsystems to provide customers with precise control capabilities that are optimized for a given application.
4
Table of Contents
Power, Plasma and Reactive Gas Solutions. Our Power, Plasma and Reactive Gas Solutions products include power delivery, plasma and reactive gas generation products used in semiconductor and other thin film applications and in medical imaging equipment applications.
Power Delivery Products. We design and manufacture microwave, direct current and radio frequency power delivery systems as well as radio frequency matching networks and metrology products. In the semiconductor, thin film and other market sectors, our power supplies are used to provide energy to various etching, stripping and deposition processes. Our power amplifiers are also used in medical imaging equipment.
Plasma and Reactive Gas Generation Products. We design and manufacture reactive gas generation products, which create reactive species. A reactive species is an atom or molecule in an unstable state, which is used to facilitate various chemical reactions in the processing of thin films (deposition of films, etching and cleaning of films and surface modifications). A number of different technologies are used to create reactive gas including different plasma technologies and barrier discharge technologies.
Pressure and Vacuum Measurement Solutions. Our Pressure and Vacuum Measurement Solutions products consist of direct and indirect pressure measurement and integrated process solutions. Each of our pressure measurement and vacuum product lines consist of products that are designed for a variety of pressure ranges and accuracies.
Light and Motion Segment
The Light and Motion segment includes Lasers, Optics and Photonics solutions.
Lasers. Our Laser products include lasers and laser-based systems including ultrafast lasers and amplifiers, fiber lasers, diode-pumped solid-state lasers, high-energy pulsed lasers and tunable lasers. In addition to providing a wide range of standard and configured laser products and accessories to our end-user customers, we also work closely with our original equipment manufacturer (“OEM”) customers to develop lasers and laser system designs optimized for their product and technology roadmaps.
Optics. Our Optics products include precision optics and lens assemblies, thin-film filters and coatings, replicated mirrors and ruled and holographic diffraction gratings. We also design, develop and manufacture subsystems and subassemblies that integrate our broad portfolio of products and technologies into solutions that meet the specific application requirements of our OEM and select end-user customers.
Photonics. Our Photonics products include photonics instruments and systems, vibration and motion control as well as three-dimensional non-contact measurement sensors and equipment.
Customers
We sell our products to thousands of customers worldwide, in a wide range of end markets. Our largest customers include leading semiconductor capital equipment manufacturers such as Applied Materials, Inc. and Lam Research Corporation. Revenues from our top ten customers accounted for approximately 39%, 49% and 50% of net revenues for the years 2016, 2015 and 2014, respectively. Applied Materials, Inc. accounted for approximately 14%, 18% and 19% and Lam Research Corporation accounted for 11%, 13% and 13% of our net revenues for the years 2016, 2015 and 2014, respectively. As a result of the acquisition of Newport, we expect our customer concentration percentage to decrease.
Sales, Marketing, Service and Support
Our worldwide sales, marketing, service and support organization is critical to our strategy of maintaining close relationships with semiconductor capital equipment and device manufacturers and manufacturers of other
5
Table of Contents
advanced applications. We market and sell our products and services through our global direct sales organization, an international network of independent distributors and sales representatives, our websites and product catalogs. As of December 31, 2016, we had 459 sales employees worldwide, located in China, Germany, France, Italy, Japan, Korea, the Netherlands, Singapore, Sweden, Israel, Taiwan, the United Kingdom and the United States. We maintain a marketing staff that identifies customer requirements, assists in product planning and specifications, and focuses on future trends in semiconductor and other markets.
As semiconductor device manufacturers have become increasingly sensitive to the significant costs of system downtime, they have required that suppliers offer comprehensive local repair, field service and customer support. Manufacturers require close support to enable them to repair, modify, upgrade and retrofit their equipment to improve yields and adapt new materials or processes. To meet these market requirements, we provide technical support from offices located in China, Germany, Japan, Korea, Singapore, Taiwan, the United Kingdom and the United States. We provide repair and calibration services at twenty-nine internal service depots and six authorized service providers located worldwide. We typically provide warranties for one to three years, depending upon the type of product, with the majority of our products ranging from one to two years. We typically provide warranty on our repair services for periods ranging from 90 days to up to one year, depending upon the type of repair.
Research and Development
Our products incorporate sophisticated technologies to measure, control, power, deliver, monitor and analyze complex semiconductor and other advanced manufacturing processes, thereby enhancing uptime, yield and throughput for our customers. Our products have continuously advanced as we strive to meet our customers’ evolving needs. We have developed, and continue to develop, new products to address industry trends, such as the shrinking of integrated circuit critical dimensions and technology inflections, and, in the flat panel display and solar markets, the transition to larger substrate sizes, which require more advanced process control technology. In addition, we have developed, and continue to develop, products that support the migration to new classes of materials, ultra-thin layers, and new 3D structures that are used in small geometry manufacturing. We involve our marketing, engineering, manufacturing and sales personnel in the development of new products in order to reduce the time to market for new products. Our employees also work closely with our customers’ development personnel, helping us to identify and define future technical needs on which to focus research and development efforts. We support research at academic institutions targeted at advances in materials science and semiconductor process development.
As of December 31, 2016, we had 680 research and development employees, primarily located in the United States, France and Israel. Our research and development expenses were $110.6 million, $68.3 million and $62.9 million for the years 2016, 2015 and 2014, respectively. Our research and development efforts include numerous projects, none of which are individually material, and generally have a duration of 3 to 30 months depending upon whether the product is an enhancement of existing technology or a new product. Our current initiatives include projects to enhance the performance characteristics of older products, to develop new products and to integrate various technologies into subsystems.
Manufacturing
Our manufacturing facilities are located in the United States, China, Mexico, Korea, Germany, Austria, France, Romania, the United Kingdom, Israel and Italy. Manufacturing activities include the assembly and testing of components and subassemblies, which are integrated into our products. We outsource some of our subassembly work. We purchase a wide range of electronic, optical, mechanical and electrical components, some of which are designed to our specifications. We consider our lean manufacturing techniques and responsiveness to customers’ significantly fluctuating product demands to be a competitive advantage. As of December 31, 2016, we had 2,859 manufacturing-related employees, located primarily in North America (United States) and Asia (primarily, China and Israel).
6
Table of Contents
Backlog
At December 31, 2016, our backlog of unfilled orders for all products and services was $338 million, compared to $93 million at December 31, 2015. The increase in backlog of $245 million in 2016 compared to 2015 is primarily attributed to the Newport Merger, which accounted for $218 million of the increase. The remainder of the increase of $27 million is attributed to an increase in business levels for the Vacuum & Analysis segment in 2016 compared to 2015. As of December 31, 2016, approximately $316 million of our consolidated backlog was scheduled to be shipped on or before December 31, 2017. In general, we schedule production of our products based upon our customers’ delivery requirements. Our lead times are very short, as a large portion of our orders are received and shipped within 90 days. While backlog is calculated on the basis of firm orders, orders may be subject to cancellation or delay, in many cases, by the customer with limited or no penalty. Our backlog at any particular date, therefore, is not necessarily indicative of actual sales which may be generated for any succeeding period. Historically, our backlog levels have fluctuated based upon the ordering patterns of our customers and changes in our manufacturing capacity.
Competition
The market for our products is highly competitive. Principal competitive factors include:
| • | historical customer relationships; |
| • | product quality, performance and price; |
| • | breadth of product line; |
| • | manufacturing capabilities; and |
| • | customer service and support. |
Although we believe that we compete favorably with respect to these factors, there can be no assurance that we will continue to do so.
We encounter substantial competition in most of our product lines, although no single competitor competes with us across all product lines. Certain of our competitors may have greater financial and other resources than we do. In some cases, competitors are smaller than we are, but are well established in specific product niches. For example, Hitachi Ltd. and Horiba Ltd. offer materials delivery products that compete with our product line of mass flow controllers. Nor-Cal Products, Inc. and VAT, Inc. offer products that compete with our vacuum components. Inficon, Inc. offers products that compete with our vacuum measurement and gas analysis products and our vacuum gauging products. Advanced Energy Industries, Inc. offers products that compete with our power delivery and reactive gas generator products.
Ametek, Inc. offers products that compete with our optics and photonics products. Coherent, Inc. offers products that compete with our lasers and photonics instruments. Excelitas Technologies Corp. offers products that compete with our laser and optics products. IDEX Corporation offers products that compete with our lasers, optics, and photonics subsystems. IPG Photonics, Inc. offers products that compete with our laser products. Jenoptik AG offers products that compete with our laser, optics, and photonics products. PI miCos GmbH offers products that compete with our photonics products. Thorlabs, Inc. offers products that compete with our optics, lasers and photonics products. Trumpf Group offers products that compete with our laser products.
Patents and Other Intellectual Property Rights
We rely on a combination of patent, copyright, trademark and trade secret laws and license agreements to establish and protect our proprietary rights. As of December 31, 2016, we owned 531 U.S. patents and 1,020 foreign patents that expire at various dates through 2035. As of December 31, 2016, we had 103 pending U.S. patent applications. Foreign counterparts of certain U.S. applications have been filed or may be filed at the appropriate time.
7
Table of Contents
We require each of our employees, including our executive officers, to enter into standard agreements pursuant to which the employee agrees to keep confidential all of our proprietary information and to assign to us all inventions while they are employed by us.
Employees
As of December 31, 2016, we employed 4,667 persons. We believe that our ongoing success depends upon our continued ability to attract and retain highly skilled employees for whom competition is intense. None of our employees is represented by a labor union or is party to a collective bargaining agreement. We believe that our employee relations are good.
Other Acquisitions
On March 17, 2015, we acquired Precisive, LLC (“Precisive”) for $12.1 million, net of cash acquired of $0.4 million. Precisive is an innovative developer of optical analyzers based on Turnable Filter Spectroscopy, which provide real-time gas analysis in the natural gas and hydrocarbon processing industries, including refineries, hydrocarbon processing plants, gas-to-power machines, biogas processes and fuel gas transportation and metering, while delivering customers a lower total cost of ownership.
On May 30, 2014, we acquired Granville-Phillips, a division of Brooks Automation, Inc., for $87 million. Granville-Phillips is a leading global provider of vacuum measurement and control instruments to the semiconductor, thin film and general industrial markets.
| Item 1A. | Risk Factors |
The following describes certain risks we face in our business. Additional risks that we do not yet know of or that we currently believe are immaterial may also impair our business. If any of the events or circumstances described in the following risks actually occurs, our business, financial condition or results of operations could suffer, and the trading price of our common stock could decline. In assessing these risks, investors should also refer to the other information contained or incorporated by reference in this report and our other filings with the Securities and Exchange Commission.
Our business depends substantially on capital spending in the semiconductor industry, which is characterized by periodic fluctuations that may cause a reduction in demand for our products.
Approximately 58%, 69% and 70% of our net revenues for the years 2016, 2015 and 2014, respectively, were from sales to semiconductor capital equipment manufacturers and semiconductor device manufacturers. On a pro forma basis, assuming our acquisition of Newport occurred on January 1, 2016 rather than April 29, 2016, approximately 54% of our combined net revenues for 2016 would have been from such customers. While our acquisition of Newport has reduced our concentration of customers in these markets, we anticipate that sales to such customers will continue to account for a substantial portion of our net revenues. Our business depends upon the capital expenditures of semiconductor device manufacturers, which in turn depends upon the demand for semiconductors.
The semiconductor industry is characterized by rapid technological change, frequent product introductions, changing customer requirements and evolving industry standards. Because our customers face uncertainties with regard to the growth and requirements of these markets, their products and components may not achieve, or continue to achieve, anticipated levels of market acceptance. If our customers are unable to deliver products that gain market acceptance, it is likely that these customers will not purchase our products or will purchase smaller quantities of our products. We often invest substantial resources in developing our products and subsystems in advance of significant sales of these products and subsystems to such customers. A failure on the part of our
8
Table of Contents
customers’ products to gain market acceptance, or a failure of the semiconductor market to grow would have a significant negative effect on our business, financial condition and results of operations.
The semiconductor industry has historically been characterized by sudden and severe cyclical variations in product supply and demand. The timing, severity and duration of these market cycles are difficult to predict, and we may not be able to respond effectively to these cycles. The cyclicality of the semiconductor market is demonstrated by the changes in sales to semiconductor capital equipment and device manufacturers in past years. For example, our sales to semiconductor capital equipment manufacturers and semiconductor device manufacturers increased compared to the prior year by 33%, 3% and 19% in 2016, 2015 and 2014, respectively. The 33% increase in 2016 was mainly attributable to sales by Newport following our acquisition of Newport in April 2016. On a pro forma basis, assuming the acquisition of Newport had occurred on January 1, 2015, our 2016 increase would have been 14%.
During semiconductor market downturns, periods of overcapacity have resulted in rapid and significantly reduced demand for our products, which may result in lower gross margins due to reduced absorption of manufacturing overhead, as our ability to rapidly and effectively reduce our cost structure in response to such downturns is limited by the fixed nature of many of our expenses in the near term. Further, our ability to reduce our long-term expenses is constrained by our need to continue our investment in next-generation product technology and to support and service our products. In addition, due to the relatively long manufacturing lead times for some of the products and subsystems we sell to this market, we may incur expenditures or purchase raw materials or components for products we are unable to sell. Accordingly, downturns in the semiconductor capital equipment market may materially harm our business, financial condition and operating results. Conversely, when upturns in this market occur, we may have difficulty rapidly and effectively increasing our manufacturing capacity to meet sudden increases in customer demand. If we fail to do so we may lose business to our competitors and our relationships with our customers may be harmed. In addition, many semiconductor manufacturers have operations and customers in Asia, a region that in past years has experienced serious economic problems including currency devaluations, debt defaults, lack of liquidity and recessions.
The Newport Merger involves numerous risks, and we may not be able to effectively integrate Newport’s business and operations or realize the expected benefits from the acquisition, which could materially harm our operating results.
Our April 2016 acquisition of Newport has significantly increased our size, including with respect to revenue, product offerings, number of employees and facilities. Newport’s products and technology, and certain of its markets and customer base, are significantly different from our historical experience. Combining our businesses could make it more difficult to maintain relationships with customers, employees or suppliers. Integrating Newport’s business and operations with ours is complex, challenging and time-consuming and requires significant efforts and expenditures, and we may not be able to achieve the integration in an effective, complete, timely or cost-efficient manner.
Potential risks related to our acquisition of Newport include our ability to:
| • | expand our financial and management controls and reporting systems and procedures to integrate and manage Newport; |
| • | integrate our information technology systems to enable the management and operation of the combined business; |
| • | realize expected synergies and cost savings resulting from the acquisition; |
| • | maintain and improve Newport’s operations while integrating our combined manufacturing organization; |
| • | avoid lost revenue due to customer confusion and misinformation regarding the transaction, and retain and expand Newport’s customer base while aligning our sales efforts; |
9
Table of Contents
| • | avoid lost revenue resulting from the distraction or confusion of our personnel as a consequence of the acquisition and ongoing integration efforts; |
| • | retain key Newport personnel; |
| • | recognize and capitalize on anticipated product sales and technology enhancement opportunities presented by our combined businesses; |
| • | adequately familiarize ourselves with Newport’s products and technology and certain of its markets and customer base such that we can manage Newport’s business effectively; and |
| • | successfully integrate our respective corporate cultures such that we achieve the benefits of acting as a unified company. |
Other potential risks related to our acquisition of Newport include:
| • | the assumption of unknown or contingent liabilities, or other unanticipated events or circumstances; and |
| • | the potential to incur or record significant cash or non-cash charges or write down the carrying value of intangible assets and goodwill obtained in the Newport acquisition, which could adversely impact our cash flow or lower our earnings in the period or periods for which we incur such charges or write down such assets. |
If we are unable to successfully or timely integrate the operations of Newport’s business into our business, we may be unable to realize the revenue growth, synergies and other anticipated benefits resulting from the acquisition and our business could be adversely affected. Additionally, we have incurred and will continue to incur transaction-related costs, including legal, regulatory and other costs associated with implementing integration plans, including facilities and systems consolidation costs and employment-related costs. Although we expect that the elimination of duplicative costs, as well as the realization of other efficiencies related to the integration of the businesses, should allow us to offset transaction and integration-related costs over time, this net benefit may not be achieved in the near term, or at all. Further, we may not realize the expected benefits from the acquisition. Newport’s business and operations may not achieve the anticipated revenues and operating results. We may in the future choose to close or divest certain sectors or divisions of Newport, which could require us to record losses and/or spend cash relating to such closures or divestitures. Any of the foregoing risks could materially harm our business, financial condition and results of operations.
The terms of our term loan credit facility and asset-based revolving credit facility impose significant financial obligations and risks upon us, limit our ability to take certain actions, and could discourage a change in control.
In April 2016, we obtained a term loan credit facility and a revolving credit facility in connection with financing our acquisition of Newport, and we subsequently amended the term loan facility in June and December 2016 to reduce the interest rate spread. The term loan credit facility, as amended in December 2016, provides us with senior secured financing of $628 million with a term of seven years. The revolving credit facility provides us with senior secured financing of up to $50 million, subject to a borrowing base limitation.
Our indebtedness under these credit facilities has increased our interest expense and could have the effect, among other things, of reducing our flexibility to respond to changing business and economic conditions. Our indebtedness could also reduce funds available for working capital, capital expenditures, acquisitions and other general corporate purposes and may create competitive disadvantages relative to other companies with lower debt levels. If we do not achieve the expected benefits and cost savings from the acquisition, or if the financial performance of the combined company does not meet current expectations, then our ability to service our indebtedness may be adversely impacted.
A significant portion of the amounts outstanding under the credit facilities bear interest at variable interest rates. If interest rates increase, variable rate debt will create higher debt service requirements, which could
10
Table of Contents
adversely affect our cash flows. In addition, our credit ratings affect the cost and availability of future borrowings and, accordingly, our cost of capital. Our ratings of our indebtedness reflect each nationally recognized statistical rating organization’s opinion of our financial strength, operating performance and ability to meet our debt obligations. There can be no assurance that we will achieve a particular rating or maintain a particular rating in the future. Moreover, we may be required to raise substantial additional financing to fund working capital, capital expenditures, acquisitions or other general corporate requirements. Our ability to arrange additional financing or refinancing will depend on, among other factors, our financial position and performance, as well as prevailing market conditions and other factors beyond our control. There can be no assurance that we will be able to obtain additional financing or refinancing on terms acceptable to us or at all.
The term loan credit facility and the revolving credit facility contain a number of negative covenants that, among other things and subject to certain exceptions, restrict our ability and/or our subsidiaries’ ability to:
| • | incur additional indebtedness; |
| • | pay certain dividends on our capital stock or redeem, repurchase or retire certain capital stock or certain other indebtedness; |
| • | make certain investments, loans and acquisitions; |
| • | engage in certain transactions with our affiliates; |
| • | sell assets, including capital stock of our subsidiaries; |
| • | materially alter the business we conduct; |
| • | consolidate or merge; |
| • | incur liens; and |
| • | engage in sale-leaseback transactions. |
These covenants restrict our ability to engage in or benefit from these actions, thereby limiting our flexibility in planning for, or reacting to, changes and opportunities in the markets in which we compete, such as limiting our ability to engage in mergers and acquisitions. This could place us at a competitive disadvantage.
The term loan credit agreement and the revolving credit agreement contain customary events of default, including:
| • | failure to make required payments; |
| • | failure to comply with certain agreements or covenants; |
| • | materially breaching any representation or warranty made or deemed made in connection with the respective credit facility; |
| • | failure to pay, or cause acceleration of, certain other indebtedness; |
| • | certain events of bankruptcy and insolvency; |
| • | failure to pay certain judgments; and |
| • | a change in control of us. |
Our ability to repay any amounts owed under these credit facilities will depend upon our future cash balances. The amount of cash available for repayment of these amounts will depend on our usage of our existing cash balances and our operating performance and ability to generate cash flow from operations in future periods, which will be subject to financial, business and other factors affecting our operations, many of which are beyond our control. We cannot provide any assurances that we will generate sufficient cash flow from operations to
11
Table of Contents
service our debt obligations. Any failure to repay these obligations as they become due would result in an event of default under the credit facilities.
Further, because a change in control of us constitutes an event of default under these credit facilities, this would likely be a significant deterrent to a potential acquirer, as any potential acquisition would trigger an event of default, unless the lenders agreed to waive such event of default. We cannot guarantee that any such waiver would be obtained.
If an event of default occurs, the lenders may end their obligation to make loans to us under the credit facilities, and may declare any outstanding indebtedness under the credit facilities immediately due and payable. In such case, we would need to obtain additional financing or significantly deplete our available cash, or both, in order to repay this indebtedness. Any additional financing may not be available on reasonable terms or at all, and significant depletion of our available cash could harm our ability to fund our operations or execute our broader corporate objectives. If we were unable to repay outstanding indebtedness following an event of default, then in addition to other available rights and remedies, the lenders could initiate foreclosure proceedings on substantially all of our assets. Any such foreclosure proceedings or other rights and remedies successfully implemented by the lenders in an event of default would have a material adverse effect on our business, financial condition and results of operations.
Our quarterly operating results have fluctuated, and are likely to continue to vary significantly, which may result in volatility in the market price of our common stock.
A substantial portion of our shipments occurs shortly after an order is received, and therefore we generally operate with a relatively low level of backlog. As a result, a decrease in demand for our products from one or more customers could occur with limited advance notice and could have a material adverse effect on our results of operations in any particular period. Further, with respect to certain of our business lines, we often recognize a significant portion of net revenues in the last month of each fiscal quarter, due in part to the tendency of some customers to wait until late in a quarter to commit to purchase certain of our products as a result of capital expenditure approvals and constraints occurring at the end of a quarter, or the hope of obtaining more favorable pricing from a competitor seeking the business. Thus, variations in timing of sales can cause significant fluctuations in our quarterly sales, gross margin and profitability. Orders expected to ship in one period could shift to another period due to changes in the timing of our customers’ purchase decisions, rescheduled delivery dates requested by our customers, manufacturing capacity constraints or logistics delays. Our operating results for a particular quarter or year may be adversely affected if our customers, particularly our largest customers, cancel or reschedule orders, or if we cannot fill orders in time due to capacity constraints or unexpected delays in manufacturing, testing, shipping or product acceptance. Also, we base our manufacturing plans on our forecasted product mix. If the actual product mix varies significantly from our forecast, we may not be able to fill some orders, which would result in delays in the shipment of our products and could shift sales to a subsequent period. A significant percentage of our expenses are fixed and based in part on expectations of future net revenues. The inability to adjust spending quickly enough to compensate for any shortfall would magnify the adverse impact of a shortfall in net revenues on our results of operations. Factors that could cause fluctuations in our financial results include:
| • | a worldwide economic slowdown or disruption in the global financial markets; |
| • | fluctuations in our customers’ capital spending, industry cyclicality (particularly in the semiconductor industry), market seasonality (particularly in the scientific research market), levels of government funding available to our customers (particularly in the life sciences and research markets) and other economic conditions within the markets we serve; |
| • | the timing of the receipt of orders within a given period and the level of orders from major customers; |
| • | demand for our products and the products sold by our customers; |
| • | shipment delays; |
12
Table of Contents
| • | disruption in sources of supply; |
| • | production capacity constraints; |
| • | specific features requested by customers; |
| • | the timing and level of cancellations and delays of orders in backlog for our products; |
| • | the timing of product shipments and revenue recognition within a given quarter; |
| • | variations in the mix of products we sell; |
| • | changes in our pricing practices or in the pricing practices of our competitors or suppliers; |
| • | our timing in introducing new products; |
| • | engineering and development investments relating to new product introductions, and significant changes to our manufacturing and outsourcing operations; |
| • | market acceptance of any new or enhanced versions of our products; |
| • | timing of new product introductions by our competitors; |
| • | timing and level of inventory obsolescence, scrap and warranty expenses; |
| • | the availability, quality and cost of components and raw materials we use to manufacture our products; |
| • | changes in our effective tax rates; |
| • | changes in our capital structure, including cash, marketable securities and debt balances, and changes in interest rates; |
| • | changes in bad debt expense based on the collectability of our accounts receivable; |
| • | timing, type, and size of acquisitions and divestitures, and related expenses and charges; |
| • | fluctuations in currency exchange rates, particularly the Korean won, Japanese yen and Euro as compared with the U.S. dollar; |
| • | our expense levels; |
| • | impairment of goodwill and amortization of intangible assets; and |
| • | fees, expenses and settlement costs or judgments against us relating to litigation. |
As a result of the factors discussed above, it is likely that we may in the future experience quarterly or annual fluctuations, and that, in one or more future quarters, our operating results may fall below the expectations of public market analysts or investors. In any such event, the price of our common stock could fluctuate or decline significantly. Consequently, we believe that quarter-to-quarter and year-to-year comparisons of our results of operations, or any other similar period-to-period comparisons, may not be reliable indicators of our future performance.
The loss of net revenues from any one of our major customers would likely have a material adverse effect on us.
Our top ten customers accounted for approximately 39%, 49% and 50% of our net revenues for the years 2016, 2015 and 2014, respectively. One customer, Applied Materials, Inc., accounted for approximately 14%, 18% and 19% of our net revenues for the years 2016, 2015 and 2014, respectively, and another customer, Lam Research Corporation, accounted for 11%, 13% and 13% of our net revenues for the years 2016, 2015 and 2014, respectively. In any one reporting period, a single customer or several customers may contribute even a larger percentage of our consolidated revenues. Although our acquisition of Newport has reduced our customer concentration somewhat, the loss of a major customer or any reduction in orders by these customers, including
13
Table of Contents
reductions due to market or competitive conditions, would likely have a material adverse effect on our business, financial condition and results of operations. None of our significant customers has entered into an agreement with us requiring it to purchase any minimum quantity of our products. The demand for our products from our semiconductor capital equipment customers depends on the cyclicality of our served markets, specifically semiconductor device manufacturer customers.
Attempts to lessen the adverse effect of any loss or reduction of net revenues through the rapid addition of new customers could be difficult because a relatively small number of companies dominate the semiconductor equipment market. Further, prospective customers typically require lengthy qualification periods prior to placing volume orders with a new supplier. Our future success will continue to depend upon:
| • | our ability to maintain relationships with existing key customers; |
| • | our ability to attract new customers and satisfy any required qualification periods; |
| • | our ability to introduce new products in a timely manner for existing and new customers; and |
| • | the successes of our customers in creating demand for their capital equipment products that incorporate our products. |
As part of our business strategy, we have entered into and may enter into or seek to enter into business combinations and acquisitions that may be difficult to identify and complete, challenging and costly to integrate, disruptive to our business and our management, and/or dilutive to stockholder value.
Since our inception, we have made acquisitions and, as a part of our business strategy, we may enter into additional business combinations and acquisitions. Our ability to successfully identify suitable acquisition targets, complete acquisitions on acceptable terms, and efficiently and effectively integrate our acquired businesses into our organization is critical to our growth. We may not be able to identify target companies that meet our strategic objectives or successfully negotiate and complete acquisitions with companies we have identified on acceptable terms. Additionally, our credit facilities only permit us to make acquisitions under certain circumstances, and restrict our ability to incur additional indebtedness. Further, the process of integrating acquired companies into our operations requires significant resources and is time consuming, expensive and disruptive to our business. We may not realize the benefits we anticipate from these acquisitions because of the following significant challenges:
| • | the difficulty of integrating the operations, technology and personnel of the acquired companies; |
| • | the potential disruption of our ongoing business and distraction of management; |
| • | possible internal control weaknesses of the acquired companies; |
| • | significant expenses related to the acquisitions; |
| • | potential unknown liabilities associated with acquired businesses; |
| • | potentially incompatible cultural differences between the two companies; |
| • | incorporating the acquired company’s technology and products into our current and future product lines, and successfully generating market demand for these expanded product lines; |
| • | potential additional geographic dispersion of operations; |
| • | the difficulty in achieving anticipated synergies and efficiencies; |
| • | the difficulty in leveraging the acquired company’s and our combined technologies and capabilities across our product lines and customer base; |
| • | potential sales disruptions as a result of integrating the acquired company’s sales channels with our sales channels; and |
14
Table of Contents
| • | our ability to retain key customers, suppliers and employees of an acquired company. |
We may also be placed at a competitive disadvantage by selling products in markets and geographies that are new to us. In addition, if we are not successful in completing acquisitions that we may pursue in the future, we may be required to re-evaluate our growth strategy, and we may incur substantial expenses and devote significant management time and resources in seeking to complete proposed acquisitions that may not generate benefits for us.
In addition, with future acquisitions, we could use substantial portions of our available cash as all or a portion of the purchase price. We could also issue additional securities as consideration for these acquisitions, which could cause significant stockholder dilution, or obtain additional debt financing, which could reduce our future cash flow, without achieving the desired accretion to our business. Further, our prior acquisitions and any future acquisitions may not ultimately help us achieve our strategic goals and may pose other risks to us.
As a result of our previous acquisitions, we have several different decentralized operating and accounting systems. We will need to continue to modify our accounting policies, internal controls, procedures and compliance programs to provide consistency across all of our operations. In order to increase efficiency and operating effectiveness and improve corporate visibility into our decentralized operations, we are currently implementing two worldwide Enterprise Resource Planning (“ERP”) systems, one for our Vacuum & Analysis segment and one for our Light & Motion segment. We expect to continue to implement the ERP systems in phases over the next few years. Any future implementations may risk potential disruption of our operations during the conversion periods and the implementations could require significantly more management time and higher implementation costs than currently estimated.
An inability to convince semiconductor device manufacturers to specify the use of our products to our customers that are semiconductor capital equipment manufacturers would weaken our competitive position.
The markets for our products, in particular the semiconductor capital equipment market, are highly competitive. Our competitive success often depends upon factors outside of our control. For example, in some cases, particularly with respect to mass flow controllers, semiconductor device manufacturers may direct semiconductor capital equipment manufacturers to use a specified supplier’s product in their equipment. Accordingly, for such products, our success will depend in part on our ability to have semiconductor device manufacturers specify that our products be used at their semiconductor fabrication facilities. In addition, we may encounter difficulties in changing established relationships of competitors that already have a large installed base of products within such semiconductor fabrication facilities.
If our products are not designed into successive generations of our customers’ products, we will lose significant net revenues during the lifespan of those products.
New products designed by capital equipment manufacturers typically have a lifespan of five to ten years. Our success depends on our products being designed into new generations of equipment. We must develop products that are technologically advanced so that they are positioned to be chosen for use in each successive generation of capital equipment. If customers do not choose our products, our net revenues may be reduced during the lifespan of our customers’ products. In addition, we must make a significant capital investment to develop products for our customers well before our products are introduced and before we can be sure that we will recover our capital investment through sales to the customers in significant volume. We are thus also at risk during the development phase that our products may fail to meet our customers’ technical or cost requirements and may be replaced by a competitive product or alternative technology solution. If that happens, we may be unable to recover our development costs.
15
Table of Contents
The semiconductor industry is subject to rapid demand shifts which are difficult to predict. As a result, our inability to expand our manufacturing capacity or reduce our fixed costs in response to these rapid shifts may cause a reduction in our market share.
Our ability to increase sales of certain products depends in part upon our ability to expand our manufacturing capacity for such products in a timely manner. If we are unable to expand our manufacturing capacity on a timely basis or to manage such expansion effectively, our customers could implement our competitors’ products and, as a result, our market share could be reduced. Because the semiconductor industry is subject to rapid demand shifts, which are difficult to foresee, we may not be able to increase capacity quickly enough to respond to a rapid increase in demand. Additionally, capacity expansion could increase our fixed operating expenses and if sales levels do not increase to offset the additional expense levels associated with any such expansion, our business, financial condition and results of operations could be materially adversely affected.
Many of the markets and industries that we serve are subject to rapid technological change, and if we fail to introduce new and innovative products or improve our existing products, or if the adoption or applications we serve is not successful, our business, financial condition and results of operations will be harmed.
Many of our markets are characterized by rapid technological advances, evolving industry standards, shifting customer needs, new product introductions and enhancements, and the periodic introduction of disruptive technology that displaces current technology due to a combination of price, performance and reliability. As a result, many of the products in our markets can become outdated quickly and without warning. We depend, to a significant extent, upon our ability to enhance our existing products, to anticipate and address the demands of the marketplace for new and improved and disruptive technologies, either through internal development or by acquisitions, and to be price competitive. If we or our competitors introduce new or enhanced products, it may cause our customers to defer or cancel orders for our existing products. If we or our competitors introduce disruptive technology that displaces current technology, existing product platforms or lines of business from which we generate significant revenue may be rendered obsolete.
Because many of our products are sophisticated and complex, they can be difficult to design and manufacture, and we may experience delays in introducing new products or enhancements to our existing products. If we do not introduce our new products or enhancements into the marketplace in a timely fashion, our customers may choose to purchase our competitors’ products. Certain of our markets, in particular the semiconductor capital equipment market, experience severe cyclicality in capital spending, so if we fail to introduce new products in a timely manner we may miss market upturns, or may fail to have our products or subsystems designed into our customers’ products. We may not be successful in acquiring, developing, manufacturing or marketing new products and technologies on a timely or cost-effective basis. If we fail to adequately introduce new, competitive products and technologies on a timely basis, our business, financial condition and results of operations will be harmed.
Further, we are constantly investing in products for emerging applications, and we expect to generate increasingly significant revenue levels from sales of products for these applications. These applications are evolving, and the extent to which they achieve widespread adoption or significant growth is uncertain. Many factors may affect the viability of widespread adoption or growth of these applications, including their cost-effectiveness, performance and reliability compared to alternatives. If these applications or our products for these applications are not widely adopted or fail to grow as we project, we will not generate the revenue growth we anticipate from sales of our products for these emerging applications, and our results of operations could be harmed.
Because the sales cycle for some of our products is long and difficult to predict, and certain of our orders are subject to rescheduling or cancellation, we may experience fluctuations in our operating results.
Many of our products are complex and customers for these products require substantial time to qualify our products and make purchase decisions. In addition, some of our sales to defense and security customers are under
16
Table of Contents
major defense programs that involve lengthy competitive bidding and qualification processes. These customers often perform, or require us to perform, extensive configuration, testing and evaluation of our products before committing to purchasing them, which can require a significant upfront investment by us. The sales cycle for these products from initial contact through shipment varies significantly, is difficult to predict and can last more than a year. If we fail to anticipate the likelihood, costs, or timing associated with sales of these products, our business and results of operations would be harmed.
Our orders are generally subject to rescheduling without penalty or cancellation without penalty other than reimbursement for certain labor and material costs. We from time to time experience order rescheduling and cancellations, which can result in fluctuation of our operating results from period to period.
Certain of our markets, sales regions and customers may be adversely affected by a lack of government funding and the availability of credit.
Our worldwide sales to customers in the scientific research, defense and life and health sciences markets rely to a large extent on government funding for research and defense-related programs. Any decline in government funding as a result of reduced budgets in connection with fiscal austerity measures or other causes would likely result in reduced sales of our products that are purchased either directly or indirectly with government funding, which would have an adverse impact on our results of operations.
Ongoing concerns regarding the global availability of credit also may make it more difficult for our customers to raise capital, whether debt or equity, to finance their projects and purchases of capital equipment. Delays in our customers’ ability to obtain such financing, or the unavailability of such financing, could adversely affect sales of our products and systems, including, but not limited to, high-value lasers and systems, and therefore harm our business and operating results.
We offer products for multiple markets and must face the challenges of supporting the distinct needs of each of the markets we serve.
We offer products for a number of markets. Because we operate in multiple markets, we must work constantly to understand the needs, standards and technical requirements of many different applications within these markets, and must devote significant resources to developing different products for these markets. Product development is costly and time consuming. We must anticipate trends in our customers’ industries and develop products before our customers’ products are commercialized. If we do not accurately predict our customers’ needs and future activities, we may invest substantial resources in developing products that do not achieve broad market acceptance. Our decision to continue to offer products to a given market or to penetrate new markets is based in part on our judgment of the size, growth rate and other factors that contribute to the attractiveness of a particular market. If our product offerings in any particular market are not competitive or our analyses of a market are incorrect, our business, financial condition and results of operations would be harmed.
Manufacturing interruptions or delays could affect our ability to meet customer demand and lead to higher costs, while the failure to estimate customer demand accurately could result in excess or obsolete inventory.
Our business depends on its timely supply of equipment, services and related products that meet the rapidly changing technical and volume requirements of our customers, which depends in part on the timely delivery of parts, components and subassemblies (parts) from suppliers, including contract manufacturers. Cyclical industry conditions and the volatility of demand for manufacturing equipment increase capital, technical, operational and other risks for us and for companies throughout our supply chain. We may also experience significant interruptions of our manufacturing operations, delays in our ability to deliver products or services, increased costs or customer order cancellations as a result of:
| • | volatility in the availability and cost of materials, including rare earth elements; |
17
Table of Contents
| • | information technology or infrastructure failures; and |
| • | natural disasters or other events beyond our control (such as earthquakes, floods or storms, regional economic downturns, pandemics, social unrest, political instability, terrorism, or acts of war), particularly where we or our subcontractors and contract manufacturers conduct manufacturing. |
In addition, if we need to rapidly increase our business and manufacturing capacity to meet increases in demand or expedited shipment schedules, this may exacerbate any interruptions in our manufacturing operations and supply chain and the associated effect on our working capital. Moreover, if actual demand for our products is different than expected, we may purchase more/fewer parts than necessary or incur costs for canceling, postponing or expediting delivery of parts. If we purchase inventory in anticipation of customer demand that does not materialize, or if our customers reduce or delay orders, we may incur excess inventory charges. Any or all of these factors could materially and adversely affect our business, financial condition and results of operations.
A material amount of our assets represents goodwill and intangible assets, and our net income would be reduced if our goodwill or intangible assets become impaired.
As of December 31, 2016, our goodwill and intangible assets, net, represented approximately $997 million, or 45% of our total assets. Goodwill is generated in our acquisitions when the cost of an acquisition exceeds the fair value of the net tangible and identifiable intangible assets we acquire. Goodwill is subject to an impairment analysis at least annually based on the fair value of the reporting unit. Intangible assets relate primarily to the developed technologies, customer relationships and patents and trademarks acquired by us as part of our acquisitions of other companies and are subject to an impairment analysis whenever events or changes in circumstances exist that indicate that the carrying value of the intangible asset might not be recoverable. We will continue to monitor and evaluate the carrying value of goodwill and intangible assets. If market and economic conditions or business performance deteriorate, the likelihood that we would record an impairment charge would increase, which impairment charge could materially and adversely affect our results of operations.
We operate in highly competitive industries.
The markets for our products are intensely competitive, and we believe that competition from both new and existing competitors will increase in the future. Principal competitive factors include:
| • | historical customer relationships; |
| • | product quality, performance and price; |
| • | breadth of product line; |
| • | manufacturing capabilities; and |
| • | customer service and support. |
Although we believe that we compete favorably with respect to these factors, we may not be able to continue to do so. We encounter substantial competition in most of our product lines. Certain of our competitors may enjoy greater name recognition and have greater financial, technical, marketing and other resources than we have, and some may have lower material costs than ours due to their control over sources of components and raw materials. In some cases, competitors are smaller than we are, but well established in specific product niches. We may encounter difficulties in changing established relationships of competitors with a large installed base of products at such customers’ fabrication facilities. In addition, our competitors can be expected to continue to improve the design and performance of their products. Competitors may develop products that offer price, performance or technological features superior to those of our products. If our competitors develop superior products, we may lose existing customers and market share. Further, technological advances in our served markets may cause one or more of our portfolio of products to be displaced over time. We also face competition
18
Table of Contents
in some of our markets from our existing and potential customers who have developed or may develop products that are competitive to ours, or who engage subcontract manufacturers or system integrators to manufacture products or systems on their behalf.
We face significant risks from doing business internationally.
Our business is subject to risks inherent in conducting business globally. International revenues account for a significant portion of total net sales, with a substantial portion of such sales originating in Asia (especially Korea, Japan, Israel, China and Taiwan) and Europe (especially France and Germany). We expect that international revenues will continue to account for a significant percentage of total net sales for the foreseeable future, and that in particular, the proportion of our sales to Asian customers will continue to increase. Additionally, we have substantial international manufacturing, sales and administrative operations, with significant facilities and employee populations in Europe, Israel and Asia. Our international operations expose us to various risks, which include:
| • | adverse changes or instability in the political or economic conditions in countries or regions where we manufacture or sell our products; |
| • | challenges of administering our diverse business and product lines globally; |
| • | the actions of government regulatory authorities, including embargoes, executive orders, import and export restrictions, tariffs, currency controls, trade restrictions and trade barriers, license requirements, environmental and other regulatory requirements and other rules and regulations applicable to the manufacture, import and export of our products, all of which are complicated and potentially conflicting, often require significant investments in cost, time and resources for compliance, and may impose strict and severe penalties for noncompliance; |
| • | greater risk of violations of applicable U.S. and international anti-corruption laws by our employees, sales representatives, distributors or other agents; |
| • | longer accounts receivable collection periods and longer payment cycles; |
| • | overlapping, differing or more burdensome tax structures; |
| • | adverse currency exchange rate fluctuations; |
| • | reduced or inconsistent protection of intellectual property; |
| • | shipping and other logistics complications; |
| • | the imposition of restrictions on currency conversion or the transfer of funds; |
| • | costs associated with the repatriation of our overseas earnings; |
| • | the expropriation of private enterprises; |
| • | more complex and burdensome labor laws and practices in countries where we have employees; |
| • | cultural and management style differences; |
| • | preference for locally-produced products; |
| • | changes in labor conditions and difficulties in staffing and managing foreign operations, including, but not limited to, the formation of labor unions; |
| • | difficulties in staffing and managing each of our individual international operations; and |
| • | increased risk of exposure to civil unrest, terrorist and military activities. |
If we experience any of the risks associated with international business, our business, financial condition and results of operations could be significantly harmed.
19
Table of Contents
In particular, we have significant facilities and operations and a considerable number of employees in Israel. A number of our products are manufactured in facilities located in Israel. The Middle East remains a volatile region, and the future of peace efforts between Israel and neighboring countries remains extremely uncertain. Any armed conflicts or significant political instability in the region is likely to negatively affect business conditions and could significantly disrupt our operations in Israel, which would negatively impact our business. Further, many of our employees in Israel are subject to being called for active duty under emergency circumstances. If a military conflict or war arises, these individuals could be required to serve in the military for extended periods of time, and our operations in Israel could be disrupted by the absence of one or more key employees or a significant number of other employees for a significant period of time. Any such disruption could adversely affect our business.
Our failure to successfully manage our offshore manufacturing locations or the transition of certain of our manufacturing operations to other locations and/or to contract manufacturers could harm our business, financial condition and results of operations.
As part of our continuous cost-reduction efforts, we have outsourced a portion of our manufacturing and service to a subcontractor in Mexico, and we continue to relocate the manufacture of certain of our existing product lines and subassemblies to, and initiate the manufacture of certain new products in, our facilities in China, Israel and Romania and selected contract manufacturers in Asia. In the future, we may expand the level of manufacturing and certain other operations that we perform offshore in order to take advantage of cost efficiencies available to us in those countries. However, we may not achieve the significant cost savings or other benefits that we would anticipate from moving manufacturing and other operations to a lower cost region. Additionally, if we are unable to successfully manage the relocation or initiation of the manufacture of these products, our business, financial condition and results of operations could be harmed.
In particular, transferring product lines to other manufacturing locations and/or to our contract manufacturers’ facilities often requires us to transplant complex manufacturing equipment and processes across a large geographical distance and to train a completely new workforce concerning the use of this equipment and these processes. In addition, certain of our customers may require the requalification of products supplied to them in connection with the relocation of manufacturing operations. If we are unable to manage this transfer and training smoothly and comprehensively, or if we are unable to complete the requalification of products in a timely manner, we could suffer manufacturing and supply chain delays, excessive product defects, harm to our results of operations and our reputation with our customers, and loss of customers. We also may not realize the cost and tax advantages that we currently anticipate from locating operations in Mexico, China, Israel and Romania. For example, we are experiencing rising material, labor and shipping costs in China and the potential for new tariffs on our products manufactured in Mexico.
Additionally, qualifying contract manufacturers and commencing volume production are expensive and time-consuming activities, and there is no guarantee we will continue to do so successfully. Further, our reliance on contract manufacturers reduces our control over the assembly process, quality assurance, production costs and material and component supply for our products. If we fail to manage our relationship with our contract manufacturers, or if any of the contract manufacturers experience financial difficulty, or delays, disruptions, capacity constraints or quality control problems in their operations, our ability to ship products to our customers could be impaired and our competitive position and reputation could be harmed. Further, if we or our contract manufacturers are unable to negotiate with suppliers for reduced component costs, our operating results could be harmed.
In addition, our contract manufacturers may terminate our agreements with them upon prior notice to us or immediately for reasons such as if we become insolvent, or if we fail to perform a material obligation under the agreements. If we are required to change contract manufacturers or assume internal manufacturing operations for any reason, including the termination of one of our contracts, we will likely suffer manufacturing and shipping delays, lost revenue, increased costs and damage to our customer relationships, any of which could harm our business, financial condition and results of operations.
20
Table of Contents
Our products could contain defects, which would increase our costs and seriously harm our business, operating results, financial condition and customer relationships.
Many of our products are inherently complex in design and, in some cases, require ongoing regular maintenance. Further, the manufacture of these products often involves a highly complex and precise process and the utilization of specially qualified components that conform to stringent specifications. As a result of the technical complexity of these products, design defects, changes in our or our suppliers’ manufacturing processes or the inadvertent use of defective or nonconforming materials by us or our suppliers could adversely affect our manufacturing yields and product reliability. This could in turn harm our business, operating results, financial condition and customer relationships.
We provide warranties for our products, and we accrue allowances for estimated warranty costs at the time we recognize revenue for the sale of the products. The determination of such allowances requires us to make estimates of product return rates and expected costs to repair or replace the products under warranty. We establish warranty reserves based on historical warranty costs for our products. If actual return rates or repair and replacement costs differ significantly from our estimates, our results of operations could be negatively impacted.
Our customers may discover defects in our products after the products have been fully deployed and operated under peak stress conditions. In addition, some of our products are combined with products from other suppliers, which may contain defects. As a result, should problems occur, it may be difficult to identify the source of the problem. If we are unable to identify and fix defects or other problems, we could experience, among other things:
| • | loss of customers; |
| • | increased costs of product returns and warranty expenses; |
| • | increased costs required to analyze and mitigate the defects or problems; |
| • | damage to our reputation; |
| • | failure to attract new customers or achieve market acceptance; |
| • | diversion of development and engineering resources; and/or |
| • | legal action by our customers. |
The occurrence of any one or more of the foregoing factors could seriously harm our business, financial condition and results of operations.
Our products are subject to potential product liability claims which, if successful, could have a material adverse effect on our business, financial condition and results of operations.
Certain of our products may be hazardous if not operated properly or if defective. In addition, some of our products, such as certain ultrafast lasers, are used in medical applications where malfunctions could result in serious injury. We are exposed to significant risks for product liability claims if death, personal injury or property damage results from the use of our products. We may experience material product liability losses in the future. We currently maintain insurance against product liability claims. However, our insurance coverage may not continue to be available on terms that we accept, if at all. This insurance coverage also may not adequately cover liabilities that we incur. Further, if our products are defective, we may be required to recall or redesign these products. A successful claim against us that exceeds our insurance coverage level or that is not covered by insurance, or any product recall, could have a material adverse effect on our business, financial condition and results of operations.
21
Table of Contents
We are subject to international trade compliance regulations, and violations of those regulations could result in fines or trade restrictions, which could have a material adverse effect on us.
We are subject to trade compliance laws in both the United States and other jurisdictions where we operate. For example, exports of our products and technology developed or manufactured in the U.S. are subject to export controls imposed by the U.S. Government and administered by the U.S. Departments of Commerce, State and Treasury. Similar export regulations govern exports of our products and technology developed or manufactured in certain other countries, including Austria, France, Germany, Israel and Romania. In certain instances, these regulations may require obtaining licenses from the administering agency prior to exporting products or technology to international locations or foreign nationals, including foreign nationals employed by us in the United States and abroad. For products and technology subject to the U.S. Export Administration Regulations administered by the U.S. Department of Commerce’s Bureau of Industry and Security, the requirement for a license is dependent on the type and end use of the product and technology, the final destination and the identity and nationality of the end user. Virtually all exports from the United States of defense articles subject to the International Traffic in Arms Regulations, administered by the Department of State’s Directorate of Defense Trade Controls, require a license. The Israeli Ministry of Economy and the Defense Export Control Agency of the Israeli Ministry of Defense administer similar export regulations and license requirements, which apply to many of our products and technology developed or manufactured in Israel. Obtaining export licenses can be difficult and time-consuming, and we may not be successful in obtaining them. Failure to obtain export licenses to enable product and technology exports could reduce our revenue, harm our relationships with our customers and could adversely affect our business, financial condition and results of operations. Compliance with export regulations may also subject us to additional fees and costs. The absence of comparable export restrictions on competitors in other countries may adversely affect our competitive position. In addition, if we or our international representatives or distributors fail to comply with any of these export regulations, we or they could be subject to civil and criminal, monetary and non-monetary penalties, disruptions to our business, restrictions on our ability to export products and technology and damage to our reputation, and our business and results of operations could be significantly harmed. While we have implemented policies and procedures to comply with these laws, we cannot be certain that our employees, contractors, suppliers or agents will not violate such laws or our policies. For example, as a result of a 2012 U.S. Government investigation, a former employee of our Shanghai office and a third party not affiliated with us were imprisoned for export violations relating to the sale of certain of our products. We were not a target of the government’s investigation and we cooperated fully with the government’s investigation. In addition, although we conducted our own internal investigation and took corrective human resources actions and have, since 2012, implemented additional export compliance procedures, we cannot be certain these efforts will be sufficient to avoid similar situations in the future.
Unfavorable currency exchange rate fluctuations may lead to lower operating margins or may cause us to raise or reduce prices, which could result in reduced sales.
Currency exchange rate fluctuations could have an adverse effect on our net revenues and results of operations and we could experience losses with respect to our hedging activities. Unfavorable currency fluctuations could require us to increase or decrease prices to foreign customers, which could result in lower net revenues from such customers. Alternatively, if we do not adjust the prices for our products in response to unfavorable currency fluctuations, our results of operations could be adversely affected by declining net revenues or profit margins for our products in international markets when the sales are translated into U.S. dollars. Such exchange rate fluctuations could also increase the costs and expenses of our non-U.S. operations when translated into U.S. dollars or require us to modify our current business practices. In addition, most sales made by our foreign subsidiaries are denominated in the currency of the country in which these products are sold and the currency they receive in payment for such sales could be less valuable at the time of receipt as a result of exchange rate fluctuations. We enter into forward foreign exchange contracts to reduce a portion of our currency exposure arising from intercompany sales of inventory as well as intercompany accounts receivable and intercompany loans. However, we cannot be certain that our efforts will be adequate to protect us against significant currency fluctuations or that such efforts will not expose us to additional exchange rate risks.
22
Table of Contents
Changes in tax rates or tax regulation could affect results of operations.
As a global company, we are subject to taxation in the United States and various other countries. Significant judgment is required to determine and estimate worldwide tax liabilities. Our future annual and quarterly effective tax rates could be affected by numerous factors, including changes in the applicable tax laws; composition of pre-tax income in countries with differing tax rates; and/or valuation of our deferred tax assets and liabilities. In addition, we are subject to regular examination by the United States Internal Revenue Service and state, local and foreign tax authorities. We regularly assess the likelihood of favorable or unfavorable outcomes resulting from these examinations to determine the adequacy of our provision for income taxes. Although we believe our tax estimates are reasonable, there can be no assurance that any final determination will not be materially different from the treatment reflected in our historical income tax provisions and accruals, which could materially and adversely affect our financial condition and results of operations.
Key personnel may be difficult to attract and retain.
Our ability to maintain and grow our business is directly related to the service of our employees in each area of our business. Our future performance will be directly tied to our ability to hire, train, motivate and retain qualified personnel, including highly skilled technical, financial, managerial and sales and marketing personnel. Competition for personnel in the technology marketplace is intense, and we cannot be certain that we will be successful in attracting and retaining such personnel. We have from time to time in the past experienced attrition in certain key positions, and we expect to continue to experience this attrition in the future. The absence of incentive plan bonuses and equity award vesting as a result of not meeting certain financial performance targets could adversely affect our ability to attract new employees and to retain and motivate our existing employees. If we are unable to hire sufficient numbers of employees with the experience and skills we need or to retain and motivate our existing employees, our business and results of operations would be harmed.
A breach of our operational or security systems could negatively affect our business and results of operations.
We rely on various information technology networks and systems, some of which are managed by third parties, to process, transmit and store electronic information, including confidential data, and to carry out and support a variety of business activities, including manufacturing, research and development, supply chain management, sales and accounting. A failure in or a breach of our operational or security systems or infrastructure, or those of our suppliers and other service providers, including as a result of cyber-attacks, could disrupt our business, result in the disclosure or misuse of proprietary or confidential information, damage our reputation, cause losses and increase our costs.
Our proprietary technology is important to the continued success of our business. Our failure to protect this proprietary technology may significantly impair our competitive position.
Our success and ability to compete depend in large part upon protecting our proprietary technology. We rely on a combination of patent, trademark and trade secret protection and nondisclosure agreements to protect our proprietary rights. The steps we have taken may not be sufficient to prevent the misappropriation of our intellectual property, particularly in countries outside the United States, where the laws may not protect our proprietary rights as fully as in the United States. Patent and trademark laws and trade secret protection may not be adequate to deter third party infringement or misappropriation of our patents, trademarks and similar proprietary rights. In addition, patents issued to us may be challenged, invalidated or circumvented. Our rights granted under those patents may not provide competitive advantages to us, and the claims under our patent applications may not be allowed. We have in the past and may in the future be subject to or may initiate interference proceedings in the United States Patent and Trademark Office, which can demand significant financial and management resources. The process of seeking patent protection can be time consuming and expensive and patents may not be issued from currently pending or future applications. Moreover, our existing patents or any new patents that may be issued may not be sufficient in scope or strength to provide meaningful
23
Table of Contents
protection or any commercial advantage to us. We may initiate claims or litigation against third parties for infringement of our proprietary rights in order to determine the scope and validity of our proprietary rights or the proprietary rights of our competitors, which claims could result in costly litigation, the diversion of our technical and management personnel and the assertion of counterclaims by the defendants, including counterclaims asserting invalidity of our patents. We will take such actions where we believe that they are of sufficient strategic or economic importance to us to justify the cost. For example, in 2012 we filed a lawsuit against Lighthouse Photonics Incorporated asserting infringement of certain of our patents by that company’s laser products, which we settled on confidential terms in August 2014. If we are unsuccessful at effectively protecting our intellectual property, our business, financial condition and results of operations could be harmed.
We have experienced, and may in the future experience, intellectual property infringement claims, which could be costly and time consuming to defend and may produce outcomes that could have a material adverse effect on our business, financial condition or results of operations.
We have from time to time received claims from third parties alleging that we are infringing certain trademarks, patents or other intellectual property rights held by them. Such infringement claims have in the past and may in the future result in litigation. Any such litigation could be protracted and costly, and we could become subject to damages for infringement, or to an injunction preventing us from selling one or more of our products or using one or more of our trademarks. Such claims could also result in the necessity of obtaining a license relating to one or more of our products or current or future technologies, which may not be available on commercially reasonable terms or at all. Any intellectual property litigation and the failure to obtain necessary licenses or other rights or develop substitute technology may divert management’s attention from other matters and could have a material adverse effect on our business, financial condition and results of operations. In addition, the terms of our customer contracts typically require us to indemnify the customer in the event of any claim of infringement brought by a third party based on our products. Any claims of this kind may have a material adverse effect on our business, financial condition or results of operations.
The market price of our common stock has fluctuated and may continue to fluctuate for reasons over which we have no control.
The stock market has from time to time experienced, and is likely to continue to experience, extreme price and volume fluctuations. Prices of securities of technology companies have been especially volatile and have often fluctuated for reasons that are unrelated to the operating performance of the companies. Historically, the market price of shares of our common stock has fluctuated greatly and could continue to fluctuate due to a variety of factors. In the past, companies that have experienced volatility in the market price of their stock have been the objects of securities class action litigation. If we were the object of securities class action litigation, it could result in substantial costs and a diversion of our management’s attention and resources.
We may not pay dividends on our common stock.
Holders of our common stock are only entitled to receive such dividends when and if they are declared by our board of directors. Further, our credit facilities restrict our ability to pay dividends on our capital stock under certain circumstances. Although we have declared cash dividends on our common stock since 2011, we are not required to do so and we may reduce or eliminate our cash dividend in the future. This could adversely affect the market price of our common stock.
Our dependence on sole and limited source suppliers, and international suppliers, could affect our ability to manufacture products and systems.
We rely on sole and limited source suppliers and international suppliers for a few of our components and subassemblies that are critical to the manufacturing of our products due to unique component designs as well as
24
Table of Contents
specialized quality and performance requirements needed to manufacture our products. This reliance involves several risks, including the following:
| • | the potential inability to obtain an adequate supply of required components; |
| • | reduced control over pricing and timing of delivery of components; and |
| • | the potential inability of our suppliers to develop technologically advanced products to support our growth and development of new products. |
We believe we could obtain and qualify alternative sources for most sole and limited source and international supplier parts; however, the transition time may be long if we were required to obtain alternative sources. Seeking alternative sources for these parts could require us to redesign our systems, resulting in increased costs and likely shipping delays. In such an event, any inability to redesign our systems could result in further costs and shipping delays. These increased costs would decrease our profit margins if we could not pass the costs to our customers. Further, shipping delays could damage our relationships with current and potential customers and have a material adverse effect on our business and results of operations.
In addition, we obtain some of the critical capital equipment we use to manufacture certain of our products from sole or limited sources due to the unique nature of the equipment. In some cases, such equipment can only be serviced by the manufacturer or a very limited number of service providers due to the complex and specialized nature of the equipment. If service and/or spare parts for such equipment become unavailable, such equipment could be rendered inoperable, which could cause delays in the production of our products, and could require us to procure alternate equipment, if available, which would likely involve long lead times and significant additional cost, and could harm our results of operations.
We are subject to environmental regulations. If we fail to comply with these regulations, our business could be harmed.
Our operations are subject to various federal, state, local and international regulations relating to the protection of the environment, including those governing discharges of pollutants into the air and water, the management and disposal of hazardous substances and waste and the cleanup of contaminated sites. In the United States, we are subject to the federal regulation and control of the Environmental Protection Agency (“EPA”), and we are subject to comparable authorities in other countries. Some of our operations require environmental permits and controls to prevent and reduce air and water pollution, and these permits are subject to modification, renewal and revocation by issuing authorities. Future developments, administrative actions or liabilities relating to environmental matters could have a material adverse effect on our business, results of operations or financial condition.
Although we believe that our safety procedures for using, handling, storing and disposing of such materials comply with the standards required by state and federal laws and regulations, we cannot completely eliminate the risk of accidental contamination or injury from these materials. We have been, and may in the future be, subject to claims by employees or third parties alleging such contamination or injury, and could be liable for damages, which liability could exceed the amount of our liability insurance coverage (if any) and the resources of our business.
Certain portions of the soil at Spectra-Physics’ former facility located in Mountain View, California, and certain portions of the aquifer surrounding the facility, through which contaminated groundwater flowed, are part of an EPA-designated Superfund site and are subject to a cleanup and abatement order from the California Regional Water Quality Control Board. Spectra-Physics, which Newport acquired in 2004, along with other entities with facilities located near the Mountain View, California facility, were identified as Responsible Parties with respect to this Superfund site, due to releases of hazardous substances during the 1960s, 1970s and 1980s. Spectra-Physics and the other Responsible Parties entered into a cost-sharing agreement covering the costs of
25
Table of Contents
remediating the off-site groundwater impact. The site is mature, and investigations, monitoring and remediation efforts by the Responsible Parties have been ongoing for approximately 30 years. However, we will likely be subject to additional remediation obligations in the future if the EPA and the California Regional Water Quality Control Board determine that the site cleanup requires additional measures to ensure that it meets current standards for environmental contamination. In addition to our investigation, monitoring and remediation obligations, we may be liable for property damage or personal injury claims relating to this site. While we are not aware of any material claims at this time, such claims could be made against us in the future. We have certain ongoing costs related to investigation, monitoring and remediation of the site that have been fairly consistent and not material in the recent past. However, our ultimate costs of remediation and other potential liabilities are difficult to predict. If significant costs or other liability relating to this site arise in the future, our business, financial condition and results of operations could be adversely affected.
The environmental regulations that we are subject to include a variety of federal, state, local and international environmental regulations that restrict the use and disposal of materials used in the manufacture of our products or require design changes or recycling of our products. If we fail to comply with any present or future regulations, we could be subject to future liabilities, the suspension of manufacturing or a prohibition on the sale of products we manufacture. In addition, such regulations could restrict our ability to equip our facilities or could require us to acquire costly equipment, or to incur other significant expenses to comply with environmental regulations, including expenses associated with the recall of any non-compliant product and the management of historical waste.
Governmental entities at all levels are continuously enacting new environmental regulations, and it is initially difficult to anticipate how such regulations will be implemented and enforced. We continue to evaluate the requirements for compliance with such regulations as they are enacted. For example, the European Union has enacted the Restriction on the Use of Certain Hazardous Substances in Electrical and Electronic Equipment Directive (“RoHS”) and the Waste Electrical and Electronic Equipment Directive (“WEEE”) for implementation in each European Union member country. RoHS regulates the use of certain hazardous substances in certain products, and WEEE requires the collection, reuse and recycling of waste from certain products. Effective January 2013, RoHS was recast to expand the scope of equipment subject to the directive and impose new compliance requirements, and most European Union member states implemented the recast directive during 2013. WEEE was also recast to expand the scope of equipment subject to the directive and impose increased combined reuse/recycling and collection targets, among other revisions, and European Union member states began to implement the recast directive in 2014. Certain of our products sold in these countries are or will become subject to RoHS and WEEE requirements. We will continue to monitor RoHS and WEEE guidance in individual jurisdictions to determine our responsibilities. In some instances, we are not directly responsible for compliance with RoHS and WEEE because certain of our products are currently outside the scope of the directives. However, because the scope of the directives continues to expand, we will likely be directly or contractually subject to certain provisions of such regulations in the case of many of our products. In addition, certain of our customers, particularly OEM customers whose end products may be subject to these directives, may require that the products we supply to them comply with these directives. Further, final legislation from individual jurisdictions that have not yet implemented the directives may impose different or additional responsibilities upon us. We are also aware of similar legislation that is currently in force or being considered in various states within the United States, as well as other countries, such as Japan, China and South Korea. These regulations may require us to redesign our products or source alternative components to ensure compliance with applicable requirements, for example by mandating the use of different types of materials in certain components. Any such redesign or alternative sourcing may increase the cost of our products, adversely impact the performance of our products, add greater testing lead-times for product introductions, or in some cases limit the markets for certain products. Our failure to comply with any of such regulatory requirements or contractual obligations could result in our being directly or indirectly liable for costs, fines or penalties and third-party claims, and could jeopardize our ability to conduct business in certain countries.
26
Table of Contents
Regulations and customer demands related to conflict minerals and hazardous materials may adversely affect us.
The Dodd-Frank Wall Street Reform and Consumer Protection Act and the implementing regulations subsequently adopted by the SEC impose disclosure requirements regarding the use in our products of “conflict minerals” mined from the Democratic Republic of Congo and adjoining countries, whether or not the components of our products are manufactured by us or third parties. In addition, certain of our customers have requested that we disclose to them our use of numerous hazardous materials in our products. Our supply chain is very complex and the implementation of these requirements could adversely affect the sourcing, availability and pricing of materials used in the manufacture of our products. In addition, there are additional costs associated with complying with the disclosure requirements and customer requests, such as costs related to our due diligence to determine the source of any “conflict minerals” or the identity of any hazardous materials used in our products. We face the additional challenge that many of our suppliers, both domestic and foreign, are not obligated by the new “conflict minerals” law to investigate their own supply chain. Despite our due diligence efforts, we may be unable to verify the origin of all “conflict minerals” used in our products and/or the use of one or more hazardous materials in our products. As a result, we may be unable to certify that our products are “conflict-free” and/or free of certain hazardous materials. If we are unable to meet our customer requirements, customers may discontinue purchasing from us, which could adversely impact our business, financial condition or operating results.
Some provisions of our restated articles of organization, as amended, our amended and restated by-laws and Massachusetts law could discourage potential acquisition proposals and could delay or prevent a change in control.
Anti-takeover provisions could diminish the opportunities for stockholders to participate in tender offers, including tender offers at a price above the then current market price of our common stock. Such provisions may also inhibit increases in the market price of our common stock that could result from takeover attempts. For example, while we have no present plans to issue any preferred stock, our board of directors, without further stockholder approval, may issue preferred stock that could have the effect of delaying, deterring or preventing a change in control of us. The issuance of preferred stock could adversely affect the voting power of the holders of our common stock, including the loss of voting control to others. In addition, our amended and restated by-laws provide for a classified board of directors consisting of three classes. Our classified board could also have the effect of delaying, deterring or preventing a change in control of our Company.
Changes in financial accounting standards may adversely affect our reported results of operations.
A change in accounting standards or practices could have a significant effect on our reported results and may even affect our reporting of transactions completed before the change is effective. New accounting pronouncements and varying interpretations of existing accounting pronouncements have occurred and may occur in the future. Such changes may adversely affect our reported financial results or may impact our related business practice.
Item 1B. Unresolved Staff Comments
None.
27
Table of Contents
| Item 2. | Properties |
The following table provides information concerning MKS’ principal and certain other owned and leased facilities as of December 31, 2016:
| Country |
City | Sq. Ft. | Activity |
Reportable Segment |
Lease Expires |
|||||||||
| CHINA |
Shenzhen | 242,000 | Manufacturing | Vacuum & Analysis | August 31, 2025 | |||||||||
| Wuxi | 64,500 | Manufacturing | Light & Motion | October 31, 2021 | ||||||||||
| FRANCE |
Beaune-la Roland | 86,000 | Manufacturing, Research and Development | Light & Motion | Owned | |||||||||
| ISRAEL |
Jerusalem | 80,300 | Manufacturing, Sales, Research and Development | Light & Motion | (1 | ) | ||||||||
| MEXICO |
Nogales | 124,200 | Manufacturing, Service | Vacuum & Analysis | August 31, 2023 | |||||||||
| S. KOREA |
Kyunggi | 54,700 | Sales, Customer Support, Service | Vacuum & Analysis | February 15, 2027 | |||||||||
| UNITED STATES |
Andover, MA | 123,700 | Corporate Headquarters, Manufacturing, Research and Development | Vacuum & Analysis | (2 | ) | ||||||||
| Boulder, CO | 86,000 | Manufacturing, Customer Support, Service, Research and Development | Vacuum & Analysis | (3 | ) | |||||||||
| Franklin, MA | 55,600 | Manufacturing, Customer Support, Research and Development | Light & Motion | January 31, 2026 | ||||||||||
| Irvine, CA | 254,900 | Manufacturing, Research and Development | Light & Motion | (4 | ) | |||||||||
| Longmont, CO | 60,900 | Manufacturing, Customer Support, Service, Research and Development | Vacuum & Analysis | February 29, 2020 | ||||||||||
| Methuen, MA | 85,000 | Manufacturing, Customer Support, Service, Research and Development | Vacuum & Analysis | Owned | ||||||||||
| Rochester, NY | 52,000 | Manufacturing, Customer Support, Research and Development | Light & Motion | (5 | ) | |||||||||
| Rochester, NY | 156,000 | Manufacturing, Sales, Customer Support, Service, Research and Development | Vacuum & Analysis | Owned | ||||||||||
| Santa Clara, CA | 139,500 | Manufacturing, Customer Support, Research and Development | Light & Motion | March 31, 2021 | ||||||||||
| Wilmington, MA | 118,000 | Manufacturing, Customer Support, Service, Research and Development | Vacuum & Analysis | Owned | ||||||||||
| (1) | MKS owns one facility with 35,600 square feet and leases two other facilities with 31,100 square feet and 13,600 square feet with a lease expiration date of December 31, 2018 and March 18, 2017, respectively. |
| (2) | MKS owns one facility with 82,000 square feet and leases another facility with 41,700 square feet with a lease expiration date of October 31, 2027. |
| (3) | MKS owns one facility with 47,000 square feet and leases another facility with 39,000 square feet with a lease expiration date of May 31, 2020. |
| (4) | MKS leases a facility with 212,300 square feet with a lease expiration date of February 28, 2022. MKS leases another facility with 42,600 square feet with a lease expiration date of February 28, 2022, which is currently vacant. |
| (5) | MKS owns one facility with 12,000 square feet and leases another facility with 40,000 square feet with a lease expiration date of July 31, 2019. |
In addition to the material manufacturing and other operations conducted at the above listed leased or owned facilities, MKS also provides manufacturing, worldwide sales, customer support and services from various other leased and owned facilities throughout the world not listed in the table above. See “Business—Sales, Marketing, Service and Support.”
| Item 3. | Legal Proceedings |
On March 9, 2016, a putative class action lawsuit captioned Dixon Chung v. Newport Corp., et al, Case No. A-16-733154-C, was filed in the District Court, Clark County, Nevada on behalf of a putative class of stockholders of Newport for claims related to the Merger Agreement between us, Newport, and by and among the Company, PSI Equipment, Inc., a wholly owned subsidiary of the Company (“Merger Sub”). The complaint,
28
Table of Contents
filed on March 9, 2016, named as defendants us, Newport and Merger Sub, and certain then-current and former members of Newport’s former board of directors. The complaint alleges that the named directors breached their fiduciary duties to Newport’s stockholders by agreeing to sell Newport through an inadequate and unfair process, which led to inadequate and unfair consideration, and by agreeing to unfair deal protection devices. The complaint also alleges that we, Newport, and Merger Sub aided and abetted the named directors’ alleged breaches of their fiduciary duties. The complaint seeks injunctive relief, including to enjoin or rescind the Merger Agreement, monetary damages, and an award of attorneys’ and other fees and costs, among other relief. On March 25, 2016, the plaintiff in the Chung action filed an amended complaint, which adds certain allegations, including that the preliminary proxy statement filed by Newport on March 15, 2016 (the “Proxy”) omitted material information. The amended complaint also names as defendants us, Newport, Merger Sub, and then-current members of Newport’s board of directors.
Also on March 25, 2016, a second putative class action complaint captioned Hubert C. Pincon v. Newport Corp., et al., Case No. A-16-734039-B, was filed in the District Court, Clark County, Nevada, on behalf of a putative class of Newport’s stockholders for claims related to the Merger Agreement. The complaint names as defendants us, Newport, and Merger Sub and the then-current members of Newport’s former board of directors. It alleges that the named directors breached their fiduciary duties to Newport’s stockholders by agreeing to sell Newport through an inadequate and unfair process, which led to inadequate and unfair consideration, by agreeing to unfair deal protection devices, and by omitting material information from the Proxy. The complaint also alleges that we, Newport, and Merger Sub aided and abetted the named directors’ alleged breaches of their fiduciary duties. The complaint seeks injunctive relief, including to enjoin or rescind the Merger Agreement, and an award of attorneys’ and other fees and costs, among other relief.
On April 14, 2016, the Court granted plaintiffs’ motion to consolidate the Pincon and Chung actions and appointed counsel in the Pincon action as lead counsel. Also on April 14, 2016, the Court granted plaintiffs’ motion for expedited discovery and scheduled a hearing on plaintiffs’ anticipated motion for a preliminary injunction for April 25, 2016. On April 20, 2016, plaintiffs filed a motion to vacate the hearing on their anticipated motion for a preliminary injunction and notified the Court that they did not presently intend to file a motion for a preliminary injunction regarding the Merger Agreement. On April 22, 2016, the Court vacated the hearing on plaintiffs’ anticipated motion for a preliminary injunction. In August, plaintiffs completed the expedited discovery that the Court ordered.
On October19, 2016, plaintiffs filed an amended complaint captioned In re Newport Corporation Shareholder Litigation, Case No. A-16-733154-B, in the District Court, Clark County, Nevada, on behalf of a class of Newport’s stockholders for claims related to the Merger Agreement. The complaint names as defendants us, Newport, and the then-current members of Newport’s former board of directors. It alleges that the named directors breached their fiduciary duties to Newport’s stockholders by agreeing to sell Newport through an inadequate and unfair process, which led to inadequate and unfair consideration, by agreeing to unfair deal protection devices, and by omitting material information from the Proxy. The complaint also alleges that we and Newport aided and abetted the named directors’ alleged breaches of their fiduciary duties. The complaint seeks monetary damages, including pre- and post-judgment interest. On December 9, 2016, both we and the Newport defendants filed motions to dismiss. Plaintiffs filed an opposition to the motions to dismiss on January 13, 2017. On February 3, 2017, we and the Newport defendants filed their reply briefs in support of their motions to dismiss. A hearing on the motions to dismiss was held on February 15, 2017.
We believe that the claims asserted in the amended complaint have no merit and we intend to defend vigorously against these claims.
We are subject to various legal proceedings and claims, which have arisen in the ordinary course of business. In the opinion of management, the ultimate disposition of these matters will not have a material adverse effect on our results of operations, financial condition or cash flows.
| Item 4. | Mine Safety Disclosures |
Not applicable.
29
Table of Contents
| Item 5. | Market for the Registrant’s Common Equity, Related Stockholder Matters and Issuer Purchases of Equity Securities |
Price Range of Common Stock
Our common stock is traded on the NASDAQ Global Select Market under the symbol MKSI. On February 22, 2017, the closing price of our common stock, as reported on the NASDAQ Global Select Market, was $68.45 per share. The following table sets forth for the periods indicated the high and low sales prices per share of our common stock as reported by the NASDAQ Global Select Market.
| 2016 | 2015 | |||||||||||||||
| High | Low | High | Low | |||||||||||||
| First Quarter |
$ | 38.14 | $ | 30.67 | $ | 36.97 | $ | 32.94 | ||||||||
| Second Quarter |
43.06 | 35.02 | 39.65 | 32.73 | ||||||||||||
| Third Quarter |
54.73 | 41.34 | 38.51 | 31.62 | ||||||||||||
| Fourth Quarter |
61.30 | 46.51 | 38.25 | 29.00 | ||||||||||||
On February 22, 2017, we had approximately 99 stockholders of record.
Dividend Policy and Cash Dividends
Holders of our common stock are entitled to receive dividends when and if they are declared by our board of directors. During 2016, our board of directors declared a cash dividend of $0.17 per share during the first, second, third and fourth quarters of 2016, which totaled $36.4 million or $0.68 per share. During 2015, our board of directors declared a cash dividend of $0.165 per share during the first quarter of 2015 and a cash dividend of $0.17 per share during each of the second, third and fourth quarters of 2015, which totaled $36.0 million or $0.675 per share.
Future dividend declarations, if any, as well as the record and payment dates for such dividends, are subject to the final determination of our board of directors. The board of directors intends to declare and pay cash dividends on our common stock based on the financial conditions and results of operations of the Company, although it has no obligation to do so. Our credit facilities contain covenants that restrict our ability to grant cash dividends in certain circumstances.
On February 13, 2017, our board of directors declared a quarterly cash dividend of $0.175 per share to be paid on March 10, 2017 to shareholders of record as of February 27, 2017.
Purchase of Equity Shares
On July 25, 2011, our board of directors approved and on July 27, 2011, we publicly announced, a share repurchase program for the repurchase of up to an aggregate of $200 million of our outstanding common stock from time to time in open market purchases, privately negotiated transactions or through other appropriate means (the “Program”). The timing and quantity of any shares repurchased will depend upon a variety of factors, including business conditions, stock market conditions and business development activities, including, but not limited to, merger and acquisition opportunities. These repurchases may be commenced, suspended or discontinued at any time without prior notice. During the twelve months ended December 31, 2016, we repurchased approximately 45,000 shares of our common stock for $1.5 million at an average price of $34.50 per share. We have repurchased approximately 1,770,000 shares of our common stock for approximately $52.0 million pursuant to the Program since its adoption.
30
Table of Contents
Comparative Stock Performance
The following graph compares the cumulative total shareholder return (assuming reinvestment of dividends) from investing $100 on December 31, 2011, and plotted at the last trading day of each of the fiscal years ended December 31, 2012, 2013, 2014, 2015 and 2016, in each of MKS’ common stock; a peer group index which represents a combination of all companies comprising the Morningstar Semiconductor Equipment & Materials Industry Group Index and Morningstar Scientific & Technical Instruments Industry Group Index, published by Zacks Investment Research, Inc., with these indices weighted one-half (1/2) and one-half (1/2), respectively, as our peer group has changed from the prior year as a result of the Newport Merger; and the NASDAQ Market Index. In our Annual Report on Form 10-K for the period ended December 31, 2015, the Morningstar Semiconductor Equipment & Materials Industry Group Index was our peer group index in the prior year and as such, we have included this in the chart below for comparative purposes. The stock price performance on the graph below is not necessarily indicative of future price performance. Our common stock is listed on the NASDAQ Global Select Market under the ticker symbol MKSI.
Performance Graph
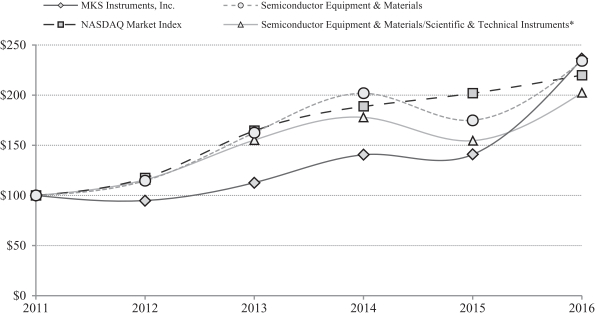
| 2011 | 2012 | 2013 | 2014 | 2015 | 2016 | |||||||||||||||||||
| MKS Instruments, Inc. | $ | 100.00 | $ | 94.84 | $ | 112.66 | $ | 140.71 | $ | 141.05 | $ | 236.47 | ||||||||||||
| NASDAQ Market Index | $ | 100.00 | $ | 117.45 | $ | 164.57 | $ | 188.84 | $ | 201.98 | $ | 219.89 | ||||||||||||
| Morningstar Semiconductor Equipment & Materials Industry Group | $ | 100.00 | $ | 114.72 | $ | 162.53 | $ | 201.98 | $ | 174.91 | $ | 234.22 | ||||||||||||
| Morningstar Semiconductor Equipment & Materials/Scientific & Technical Instruments | $ | 100.00 | $ | 115.83 | $ | 155.34 | $ | 178.00 | $ | 154.60 | $ | 202.60 | ||||||||||||
| * | Semiconductor Equipment & Materials and Scientific & Technical Instruments indices weighted 1/2 and 1/2, respectively. |
31
Table of Contents
| Item 6. | Selected Financial Data |
Selected Consolidated Financial Data
| Years Ended December 31, | ||||||||||||||||||||
| 2016 | 2015 | 2014 | 2013 | 2012 | ||||||||||||||||
| (in thousands, except per share data) | ||||||||||||||||||||
| Statement of Operations Data(1) |
||||||||||||||||||||
| Net revenues |
$ | 1,295,342 | $ | 813,524 | $ | 780,869 | $ | 669,420 | $ | 643,508 | ||||||||||
| Gross profit(2) |
565,619 | 362,872 | 337,766 | 266,574 | 269,479 | |||||||||||||||
| Income from operations(3) |
157,267 | 156,612 | 135,142 | 58,387 | 74,223 | |||||||||||||||
| Net income(4) |
$ | 104,809 | $ | 122,297 | $ | 115,778 | $ | 35,776 | $ | 48,029 | ||||||||||
| Basic net income per share |
$ | 1.96 | $ | 2.30 | $ | 2.17 | $ | 0.67 | $ | 0.91 | ||||||||||
| Diluted net income per share |
$ | 1.94 | $ | 2.28 | $ | 2.16 | $ | 0.67 | $ | 0.90 | ||||||||||
| Cash dividends paid per common share |
$ | 0.68 | $ | 0.675 | $ | 0.655 | $ | 0.64 | $ | 0.62 | ||||||||||
| Balance Sheet Data(1) |
||||||||||||||||||||
| Cash and cash equivalents |
$ | 228,623 | $ | 227,574 | $ | 305,437 | $ | 288,902 | $ | 287,588 | ||||||||||
| Short-term investments(5) |
189,463 | 430,663 | 286,795 | 361,120 | 339,811 | |||||||||||||||
| Working capital(5) |
761,469 | 848,527 | 791,665 | 811,214 | 801,029 | |||||||||||||||
| Total assets |
2,212,242 | 1,273,347 | 1,224,044 | 1,213,018 | 1,152,562 | |||||||||||||||
| Short-term debt(6) |
10,993 | — | — | — | — | |||||||||||||||
| Long-term debt, net(6) |
601,229 | — | — | — | — | |||||||||||||||
| Other liabilities |
131,921 | 21,482 | 38,595 | 63,073 | 61,095 | |||||||||||||||
| Stockholders’ equity |
$ | 2,212,242 | $ | 1,160,881 | $ | 1,081,822 | $ | 1,021,523 | $ | 1,012,156 | ||||||||||
| (1) | The Statement of Operations Data and the Balance Sheet Data for 2016 include statement of operations data and assets and liabilities acquired as a result of the acquisition of Newport in April 2016. |
| (2) | Gross profit for 2016 includes a $15.1 million charge for the amortization of the inventory step-up to fair value related to our acquisition of Newport in April 2016. |
| (3) | Income from operations for 2016 includes a $15.1 million charge for the amortization of the inventory step-up to fair value, $27.3 million of acquisition and integration costs from our acquisition of Newport and $5.0 million of an asset impairment charge. Income from operations for 2015 includes $2.1 million of restructuring charges. Income from operations for 2014 includes $2.5 million of restructuring charges. Income from operations for 2013 includes $2.6 million of costs and other benefits related to the retirement of the Company’s Chief Executive Officer in the fourth quarter of 2013, $1.4 million of restructuring charges and $1.1 million from an insurance reimbursement related to a 2012 litigation settlement. Income from operations for 2012 includes $5.3 million for payment of litigation settlement and $1.3 million of acquisition related costs from our acquisition of Plasmart, Inc. in 2012. |
| (4) | Net income for 2016 includes charges, net of tax, $9.8 million of amortization of inventory step-up to fair value, $19.0 million of acquisition and integration costs, $5.0 million of an asset impairment charge and a $2.0 million withholding tax on dividends. These charges are offset by a tax benefit of $5.0 million for a legal entity restructuring. Net income for 2015 includes charges, net of tax, of $1.4 million of restructuring costs. Net income for 2015 also includes $7.7 million in tax credits for reserve releases related to the settlement of tax audits. Net income for 2014 includes charges, net of tax, of $1.5 million of restructuring costs. Net income for 2014 also includes $14.6 million in tax credits for reserve releases related to the settlement of tax audits and the expiration of the statute of limitations. Net income for 2013 includes charges, net of tax, of $1.6 million of costs and other benefits related to the retirement of the Company’s Chief Executive Officer and $0.9 million of restructuring costs and a benefit, net of tax, of $0.7 million from an insurance reimbursement related to a 2012 litigation settlement. Net income for 2012 includes charges, net of tax, of $3.3 million for a litigation settlement and $0.8 million of acquisition related costs. |
32
Table of Contents
| (5) | Effective December 31, 2015, the Company changed the method of classification of its investments previously classified as long-term investments to short-term investments within current assets. For the years ended December 31, 2014, 2013 and 2012, short-term investments have been re-classified to include investments with contractual maturities greater than one year from the date of purchase as management had the ability and intent, if necessary, to liquidate any of its cash equivalents and investments in order to meet the Company’s liquidity needs in the next twelve months. Accordingly, working capital includes investments with contractual maturities greater than one year from the date of purchase. |
| (6) | Short-term and long-term debt includes $6.3 million and $600.7 million, respectively, related to the Term Loan Credit Agreement used to partially finance the acquisition of Newport in April 2016. |
33
Table of Contents
| Item 7. | Management’s Discussion and Analysis of Financial Condition and Results of Operations |
Overview
We are a global provider of instruments, subsystems and process control solutions that measure, control, power, deliver, monitor and analyze critical parameters of advanced manufacturing processes to improve process performance and productivity. Our products are derived from our core competencies in automation and control, gas composition analysis, lasers, materials delivery, optics, photonics, pressure, power, reactive gas and vacuum. We also provide services relating to the maintenance and repair of our products, software maintenance, installation services and training.
Our primary served markets are manufacturers of capital equipment for semiconductor manufacturing, electronic thin films, life and health sciences, process and industrial technologies, as well as research and defense.
Acquisition of Newport Corporation
On April 29, 2016, we completed our acquisition of Newport Corporation (“Newport”) pursuant to an Agreement and Plan of Merger dated as of February 22, 2016 (the “Newport Merger”). At the effective time of the Newport Merger, each share of Newport’s common stock issued and outstanding as of immediately prior to the effective time of the Newport Merger was converted into the right to receive $23.00 in cash, without interest and subject to deduction for any required withholding tax. We paid to the former Newport stockholders aggregate consideration of approximately $905 million, excluding related transaction fees and expenses, and repaid approximately $93 million of Newport’s U.S. indebtedness outstanding as of immediately prior to the effective time of the Newport Merger. We funded the payment of the aggregate consideration with a combination of our available cash on hand of approximately $240 million and the proceeds from the senior secured term loan facility of $780 million described below.
Newport is a global supplier of advanced-technology products and systems to customers in the scientific research and defense/security, microelectronics, life and health sciences and industrial manufacturing markets.
Effective April 29, 2016, in conjunction with our acquisition of Newport, we changed the structure of our reportable segments based upon our organizational structure and how our Chief Operating Decision Maker (“CODM”) utilizes information provided to allocate resources and make decisions. Our two reportable segments are the Vacuum & Analysis segment and the Light & Motion segment. The Vacuum & Analysis segment represents the legacy MKS business and the Light & Motion segment represents the legacy Newport business.
The Vacuum & Analysis segment provides a broad range of instruments, components, subsystems and software which are derived from our core competencies in pressure measurement and control, flow measurement and control, gas and vapor delivery, gas composition analysis, residual gas analysis, leak detection, control and information technology, ozone generation and delivery, RF & DC power, reactive gas generation and vacuum technology. The Light & Motion segment provides a broad range of instruments, components and subsystems which are derived from our core competencies in lasers, photonics and optics.
We have a diverse base of customers and our primary served markets are manufacturers of capital equipment for semiconductor manufacturing, electronic thin films, life and health sciences, process and industrial technologies, as well as research and defense. Approximately 58%, 69% and 70% of our net revenues for the years 2016, 2015 and 2014, respectively, were from sales to semiconductor capital equipment manufacturers and semiconductor device manufacturers. As a result of our acquisition of Newport, we estimate that sales to semiconductor capital equipment manufacturers and semiconductor device manufacturers could account for approximately 50% of our total sales in future periods.
Approximately 42%, 31% and 30% of our net revenues in the years 2016, 2015 and 2014, respectively, were from other advanced manufacturing applications. These include, but are not limited to, thin films, life and health sciences, process and industrial technologies, as well as research and defense.
34
Table of Contents
Net revenues from semiconductor capital equipment manufacture and semiconductor device manufacture customers increased by $186 million or 33% in 2016 compared to 2015 and increased $17 million or 3% in 2015 compared to 2014. The increase in 2016 compared to 2015 is attributed to net semiconductor revenues from the Newport Merger of $103 million and net semiconductor revenues from the legacy MKS business (Vacuum & Analysis segment), which increased $83 million or 15% in 2016 compared to 2015. The semiconductor capital equipment industry is subject to rapid demand shifts, which are difficult to predict, and we are uncertain as to the timing or extent of future demand or any future weakness in the semiconductor capital equipment industry.
Our net revenues from customers in other advanced markets, which exclude semiconductor capital equipment and semiconductor device manufacture customers, increased by $296 million or 118% in 2016 compared to 2015 and increased $15 million or 6% in 2015 compared to 2014. The increase in 2016 compared to 2015 is primarily attributed to revenues from customers in other advanced markets from the Newport Merger of $320 million. This increase is offset by a decrease in net revenues from customers in other advanced markets from the legacy MKS business (Vacuum & Analysis segment) of $24 million or 9%, mainly related to the general industrial, medical and solar markets. Revenues from customers in other advanced markets are made up of many different markets, including general industrial, life sciences, defense, research and solar. Some of these markets are project-based and our revenues can fluctuate quarter to quarter.
A significant portion of our net revenues are from sales to customers in international markets. For the years ended December 31, 2016, 2015 and 2014, international net revenues accounted for approximately 48%, 44% and 43% of our total net revenues, respectively. A significant portion of our international net revenues were in Korea, Japan and Israel. We expect that international net revenues will continue to represent a significant percentage of our total net revenues. Long-lived assets, located in the United States, were $123 million, $57 million and $58 million as of December 31, 2016, 2015 and 2014, respectively, excluding goodwill and intangibles and long-term tax-related accounts. Long-lived assets, located outside of the United States, were $78 million, $15 million, and $17 million as of December 31, 2016, 2015 and 2014, respectively, excluding goodwill and intangibles and long-term tax-related accounts.
On March 17, 2015, we acquired Precisive, LLC (“Precisive”) for $12.1 million, net of $0.4 million of cash acquired. Precisive is an innovative developer of optical analyzers based on Tunable Filter Spectroscopy, which provide real-time gas analysis in the natural gas and hydrocarbon processing industries, including refineries, hydrocarbon processing plants, gas-to-power machines, biogas processes and fuel gas transportation and metering, while delivering customers a lower total cost of ownership.
On May 30, 2014, we acquired Granville-Phillips, a division of Brooks Automation, Inc., for $87 million. Granville-Phillips is a leading global provider of vacuum measurement and control instruments to the semiconductor, thin film and general industrial markets.
Critical Accounting Policies and Estimates
Management’s Discussion and Analysis of Financial Condition and Results of Operations discuss our consolidated financial statements, which have been prepared in accordance with accounting principles generally accepted in the United States. The preparation of these financial statements requires management to make estimates and assumptions that affect the reported amounts of assets and liabilities and the disclosure of contingent liabilities at the date of the financial statements and the reported amounts of revenues and expenses during the reporting period. On an on-going basis, we evaluate our estimates and judgments, including those related to revenue recognition, allowance for doubtful accounts, pension plan valuations, inventory, warranty costs, stock-based compensation expense, intangible assets, goodwill and other long-lived assets, in-process research and development and income taxes. We base our estimates and judgments on historical experience and on various other factors that are believed to be reasonable under the circumstances, the results of which form the basis for making judgments about the carrying values of assets and liabilities that are not readily apparent from other sources. Actual results may differ from these estimates under different assumptions or conditions.
35
Table of Contents
We believe the following critical accounting policies affect the most significant judgments, assumptions and estimates we use in preparing our consolidated financial statements:
Revenue Recognition and Allowance for Doubtful Accounts. Revenue from product sales is recorded upon transfer of title and risk of loss to the customer provided that there is evidence of an arrangement, the sales price is fixed or determinable, and collection of the related receivable is reasonably assured. In most transactions, we have no obligations to our customers after the date products are shipped other than pursuant to warranty obligations. We do not frequently enter into arrangements with multiple deliverables; however, for those revenue arrangements with multiple deliverables, we allocate revenue to each element based upon its relative selling price using vendor-specific objective evidence (“VSOE”), or third-party evidence (“TPE”) or based upon the relative selling price using estimated prices if VSOE or TPE does not exist. Under Accounting Standards Codification (“ASC”) 605-25, Revenue Recognition—Multiple Elements, we recognize revenue and related costs for arrangements with multiple deliverables as each element is delivered or completed based upon the lesser of its relative selling price, determined based upon the price that would be charged on a standalone basis, or the amount contractually due upon delivery of each element. If a portion of the total contract price is not payable until installation is complete, we do not recognize such portion as revenue until completion of installation. Some services, such as installation, are not often sold by us or our competitors on a stand-alone basis. Therefore, we calculate the estimated selling price based on specific facts and circumstances for each service. For example, the relative selling price for installation is determined by estimating the installation hours for a particular product, using historical experience, multiplied by the standards service billing rate. Under ASC 605-20, Revenue Recognition – Services, revenue for separately priced extended warranties and product maintenance contracts are excluded from the scope of ASC 605-25 and the selling price (without regard to the allocation methodology under ASC 605-25) is recognized over the related contract periods. Shipping and handling fees billed to customers, if any, are recognized as revenue. The related shipping and handling costs are recognized in cost of sales.
We monitor and track the amount of product returns, provide for sales return allowances and reduce revenue at the time of shipment for the estimated amount of such future returns, based on historical experience. While product returns have historically been within our expectations and the provisions established, there is no assurance that we will continue to experience the same return rates that we have in the past. Any significant increase in product return rates could have a material adverse impact on our operating results for the period or periods in which such returns materialize.
While we maintain a credit approval process, significant judgments are made by management in connection with assessing our customers’ ability to pay at the time of shipment. Despite this assessment, from time to time, our customers are unable to meet their payment obligations. We continuously monitor our customers’ credit worthiness, and use our judgment in establishing a provision for estimated credit losses based upon our historical experience and any specific customer collection issues that we have identified. While such credit losses have historically been within our expectations and the provisions established, there is no assurance that we will continue to experience the same credit loss rates that we have in the past. A significant change in the liquidity or financial position of our customers could have a material adverse impact on the collectability of accounts receivable and our future operating results.
Inventory. We value our inventory at the lower of cost (first-in, first-out method) or market. We regularly review inventory quantities on hand and record a provision to write-down excess and obsolete inventory to its estimated net realizable value, if less than cost, based primarily on our estimated forecast of product demand. Once our inventory value is written-down and a new cost basis has been established, the inventory value is not increased due to demand increases. Demand for our products can fluctuate significantly. A significant increase in the demand for our products could result in a short-term increase in the cost of inventory purchases as a result of supply shortages or a decrease in the cost of inventory purchases as a result of volume discounts, while a significant decrease in demand could result in an increase in the charges for excess inventory quantities on hand. In addition, our industry is subject to technological change, new product development and product technological
36
Table of Contents
obsolescence that could result in an increase in the amount of obsolete inventory quantities on hand. Therefore, any significant unanticipated changes in demand or technological developments could have a significant impact on the value of our inventory and our reported operating results. For 2016, 2015 and 2014, our charges for excess and obsolete inventory totaled $16.0 million, $13.6 million and $12.1 million, respectively.
Warranty Costs. We provide for the estimated costs to fulfill customer warranty obligations upon the recognition of the related revenue. We provide warranty coverage for our products for periods ranging from 12 to 36 months, with the majority of our products for periods ranging from 12 to 24 months. Short-term accrued warranty obligations, which expire within one year, are included in other current liabilities and long-term accrued warranty obligations are included in other liabilities in the consolidated balance sheet. We estimate the anticipated costs of repairing our products under such warranties based on the historical costs of the repairs and any known specific product issues. The assumptions we use to estimate warranty accruals are re-evaluated periodically in light of actual experience and, when appropriate, the accruals are adjusted. Our determination of the appropriate level of warranty accrual is based upon estimates. Should product failure rates differ from our estimates, actual costs could vary significantly from our expectations. Defective products will be either repaired or replaced, generally at our option, upon meeting certain criteria.
Pension Plans. Several of our non-U.S. subsidiaries have defined benefit pension plans covering substantially all full-time employees of those subsidiaries. Some of the plans are unfunded, as permitted under the plans and applicable laws. For financial reporting purposes, the calculation of net periodic pension costs is based upon a number of actuarial assumptions, including a discount rate for plan obligations, an assumed rate of return on pension plan assets and an assumed rate of compensation increase for employees covered by the plan. All of these assumptions are based upon our judgment, considering all known trends and uncertainties. Actual results that differ from these assumptions would impact future expense recognition and the cash funding requirements of our pension plans.
Stock-Based Compensation Expense. We record compensation expense for all share-based compensation awards to employees and directors based upon the estimated fair market value of the underlying instrument. Accordingly, share-based compensation cost is measured at the grant date, based upon the fair value of the award.
We typically issue restricted stock units (“RSUs”) as stock-based compensation. We also provide employees the opportunity to purchase shares through an Employee Stock Purchase Plan (“ESPP”). For RSUs, the fair value is the stock price on the date of grant. We estimate the fair value of stock appreciation rights and shares issued under our ESPP, using the Black Scholes pricing model, which is affected by our stock price as well as assumptions regarding a number of complex and subjective variables. These variables include our expected stock price volatility over the term of the awards, expected life, risk free interest rate and expected dividends. Management determined that blended volatility, a combination of historical and implied volatility, is more reflective of market conditions and a better indicator of expected volatility than historical or implied volatility alone. We are also required to estimate forfeitures at the time of grant and revise those estimates in subsequent periods if actual forfeitures differ from those estimates.
Certain RSUs involve stock to be issued upon the achievement of performance conditions (“performance shares”) under our stock incentive plans. Such performance shares become available subject to time-based vesting conditions if, and to the extent that, financial or operational performance criteria for the applicable period are achieved. Accordingly, the number of performance shares earned will vary based on the level of achievement of financial or operational performance objectives for the applicable period. Until such time that our performance can ultimately be determined, each quarter we estimate the number of performance shares to be earned based on an evaluation of the probability of achieving the performance objectives. Such estimates are revised, if necessary, in subsequent periods when the underlying factors change our evaluation of the probability of achieving the performance objectives. Accordingly, share-based compensation expense associated with performance shares may differ significantly from the amount recorded in the current period.
37
Table of Contents
As part of the Newport Merger, we assumed the outstanding stock appreciation rights of Newport (“SARs”). For SARs, the converted number of shares, fair value, vesting schedule and expiration dates are all based on the original grant date information. The stock-based compensation reflects the remaining fair value for all unvested SARs as of the acquisition date, recognized over the remaining time to vest.
The assumptions used in calculating the fair value of share-based payment awards represents management’s best estimates, but these estimates involve inherent uncertainties and the application of management’s judgment. As a result, if factors change and we use different assumptions, our stock-based compensation expense could be materially different in the future.
Intangible Assets, Goodwill and Other Long-Lived Assets. As a result of our acquisitions, we have identified intangible assets and generated significant goodwill. Definite-lived intangible assets are valued based on estimates of future cash flows and amortized over their estimated useful life. Goodwill and indefinite-lived intangible assets are subject to annual impairment testing as well as testing upon the occurrence of any event that indicates a potential impairment. Intangible assets and other long-lived assets are also subject to an impairment test if there is an indicator of impairment. The carrying value and ultimate realization of these assets is dependent upon estimates of future earnings and benefits that we expect to generate from their use. If our expectations of future results and cash flows are significantly diminished, intangible assets and goodwill may be impaired and the resulting charge to operations may be material. When we determine that the carrying value of intangibles or other long-lived assets may not be recoverable based upon the existence of one or more indicators of impairment, we use the projected undiscounted cash flow method to determine whether an impairment exists, and then measure the impairment using discounted cash flows. To measure impairment for goodwill, we compare the fair value of our reporting units by measuring discounted cash flows to the book value of the reporting units. Goodwill would be impaired if the resulting implied fair value was less than the recorded book value of the goodwill.
The estimation of useful lives and expected cash flows require us to make significant judgments regarding future periods that are subject to some factors outside of our control. Changes in these estimates can result in significant revisions to the carrying value of these assets and may result in material charges to the results of operations.
We have elected to perform our annual goodwill impairment test as of October 31 of each year, or more often if events or circumstances indicate that there may be impairment. Goodwill is the amount by which the cost of acquired net assets exceeded the fair value of those net assets on the date of acquisition. We allocate goodwill to reporting units at the time of acquisition or when there is a change in the reporting structure and base that allocation on which reporting units will benefit from the acquired assets and liabilities. In 2015, we reallocated our goodwill based upon a change in our reporting structure. There was no goodwill impairment as a result of this change in reporting units. Reporting units are defined as operating segments or one level below an operating segment, referred to as a component. The estimated fair value of our reporting units was based on discounted cash flow models derived from internal earnings and internal and external market forecasts. Determining fair value requires the exercise of significant judgment, including judgments about appropriate discount rates, perpetual growth rates and the amount and timing of expected future cash flows. Discount rates are based on a weighted average cost of capital (“WACC”), which represents the average rate a business must pay its providers of debt and equity. The WACC used to test goodwill is derived from a group of comparable companies. Assumptions in estimating future cash flows are subject to a high degree of judgment and complexity. We make every effort to forecast these future cash flows as accurately as possible with the information available at the time the forecast is developed.
We have the option of first assessing qualitative factors to determine whether it is necessary to perform the current two-step impairment test or we can perform the two-step impairment test without performing the qualitative assessment. For the reporting units that did not experience any significant adverse changes in their business or reporting structures or any other adverse changes, and the reporting unit’s fair value substantially
38
Table of Contents
exceeded its carrying value from when the previous Step 1 analysis was performed, we performed the qualitative “Step 0” assessment. In performing the qualitative Step 0 assessment, we considered certain events and circumstances specific to the reporting unit and to the entity as a whole, such as macroeconomic conditions, industry and market considerations, overall financial performance and cost factors when evaluating whether it is more likely than not that the fair value of the reporting unit is less than its carrying amount. For the remaining reporting units that did not meet these criteria we performed the two-step goodwill impairment test. Under the two-step goodwill impairment test, we compared the fair value of each reporting unit to its respective carrying amount, including goodwill. If the carrying value of the reporting unit exceeds the fair value, the second step of the goodwill impairment test must be completed to measure the amount of impairment loss, if any. The second step compares the implied fair value of goodwill with the carrying value of goodwill. The implied fair value is determined by allocating the fair value of the reporting unit to all of the assets and liabilities of that unit, the excess of the fair value over amounts assigned to its assets and liabilities is the implied fair value of goodwill. If the implied fair value of goodwill is less than the carrying value of goodwill, an impairment loss is recognized equal to the difference.
As of October 31, 2016, we performed our annual impairment assessment of goodwill and determined that it is more likely than not that the fair values of the reporting units exceed their carrying amount. We will continue to monitor and evaluate the carrying value of goodwill. If market and economic conditions or business performance deteriorate, this could increase the likelihood of us recording an impairment charge. However, management believes it is not reasonably likely that an impairment will occur at any of its reporting units over the next twelve months.
In-Process Research and Development. We value tangible and intangible assets acquired through our business acquisitions, including in-process research and development (“IPR&D”), at fair value. We determine IPR&D through established valuation techniques for various projects for the development of new products and technologies and capitalize IPR&D as an intangible asset. If the projects are completed, the intangible asset will be amortized to earnings over the expected life of the completed product. If the R&D projects are abandoned, we will write-off the related intangible asset.
The value of IPR&D is determined using the income approach, which discounts expected future cash flows from projects under development to their net present value. Each project is analyzed and estimates and judgments are made to determine the technological innovations included in the utilization of core technology, the complexity, cost, time to complete development, any alternative future use or current technological feasibility and the stage of completion.
Income Taxes. We evaluate the realizability of our net deferred tax assets and assess the need for a valuation allowance on a quarterly basis. The future benefit to be derived from our deferred tax assets is dependent upon our ability to generate sufficient future taxable income in each jurisdiction of the right type to realize the assets. We record a valuation allowance to reduce our net deferred tax assets to the amount that is more likely than not to be realized. To the extent we established a valuation allowance, an expense is recorded within the provision for income taxes line in the consolidated statements of operations and comprehensive income. In future periods, if we were to determine that it was more likely than not that we would not be able to realize the recorded amount of our remaining net deferred tax assets, an adjustment to the valuation allowance would be recorded as an increase to income tax expense in the period such determination was made.
Accounting for income taxes requires a two-step approach to recognize and measure uncertain tax positions. The first step is to evaluate the tax position for recognition by determining if, based on the technical merits, it is more likely than not that the position will be sustained upon audit, including resolutions of related appeals or litigation processes, if any. The second step is to measure the tax benefit as the largest amount that is more than 50% likely of being realized upon ultimate settlement. We re-evaluate these uncertain tax positions on a quarterly basis. This evaluation is based on factors including, but not limited to, changes in facts or circumstances, changes in tax law, effectively settled issues under audit and new audit activity. Any change in these factors could result in the recognition of a tax benefit or an additional charge to the tax provision.
39
Table of Contents
Results of Operations
The following table sets forth, for the periods indicated, the percentage of total net revenues of certain line items included in our consolidated statements of operations and comprehensive income data:
| Years Ended December 31, | ||||||||||||
| 2016 | 2015 | 2014 | ||||||||||
| Net revenues: |
||||||||||||
| Product |
87.5 | % | 85.7 | % | 86.3 | % | ||||||
| Service |
12.5 | 14.3 | 13.7 | |||||||||
|
|
|
|
|
|
|
|||||||
| Total net revenues |
100.0 | % | 100.0 | % | 100.0 | % | ||||||
| Cost of revenues: |
||||||||||||
| Product |
48.5 | 45.9 | 47.9 | |||||||||
| Service |
7.8 | 9.5 | 8.8 | |||||||||
|
|
|
|
|
|
|
|||||||
| Total cost of revenues |
56.3 | % | 55.4 | % | 56.7 | % | ||||||
|
|
|
|
|
|
|
|||||||
| Gross profit |
43.7 | % | 44.6 | % | 43.3 | % | ||||||
| Research and development |
8.5 | 8.4 | 8.1 | |||||||||
| Selling, general and administrative |
17.7 | 15.9 | 16.9 | |||||||||
| Acquisition and integration costs |
2.1 | — | 0.1 | |||||||||
| Asset impairment |
0.4 | — | — | |||||||||
| Restructuring |
— | 0.2 | 0.3 | |||||||||
| Amortization of intangible assets |
2.8 | 0.8 | 0.6 | |||||||||
|
|
|
|
|
|
|
|||||||
| Income from operations |
12.2 | % | 19.3 | % | 17.3 | % | ||||||
| Interest income |
— | 0.3 | 0.1 | |||||||||
| Interest expense |
2.3 | — | — | |||||||||
| Other expense, net |
— | — | — | |||||||||
|
|
|
|
|
|
|
|||||||
| Income before income taxes |
9.9 | % | 19.6 | % | 17.4 | % | ||||||
| Provision for income taxes |
1.8 | 4.6 | 2.6 | |||||||||
|
|
|
|
|
|
|
|||||||
| Net income |
8.1 | % | 15.0 | % | 14.8 | % | ||||||
|
|
|
|
|
|
|
|||||||
Year Ended December 31, 2016, Compared to 2015 and 2014
Net Revenues
| Years Ended December 31, | ||||||||||||
| (Dollars in millions) | 2016 | 2015 | 2014 | |||||||||
| Product |
$ | 1,134.0 | $ | 697.1 | $ | 673.8 | ||||||
| Service |
161.3 | 116.4 | 107.1 | |||||||||
|
|
|
|
|
|
|
|||||||
| Total net revenues |
$ | 1,295.3 | $ | 813.5 | $ | 780.9 | ||||||
|
|
|
|
|
|
|
|||||||
Product revenues increased $436.9 million during 2016 compared to 2015. This increase was primarily attributed to the Newport Merger, as sales by Newport accounted for product revenues of $387.1 million during 2016. Product revenues increased for our legacy MKS business (Vacuum & Analysis segment) by $49.8 million during 2016, compared to 2015, primarily due to an increase in product revenues from our semiconductor capital equipment and semiconductor device manufacture customers of $71.3 million, primarily due to volume, offset by a decrease in product revenues from our other advanced markets of $21.5 million, primarily related to volume decreases in the solar, thin film and data storage markets.
Product revenues increased $23.3 million during 2015 compared to 2014. Product revenues related to our semiconductor capital equipment manufacturer and semiconductor device manufacturer customers increased by
40
Table of Contents
$9.4 million in 2015 compared to 2014, mainly as a result of volume increases. Our product revenues for all other markets which exclude semiconductor capital equipment and semiconductor device product applications, increased by $13.9 million in 2015 compared to 2014. The increase in our non-semiconductor markets was primarily attributed to volume increases of $13.2 million in our solar market and $12.3 million in our data storage market. These increases were partially offset by a decrease of $11.8 million in our general industrial markets.
Service revenues consisted mainly of fees for services related to the repair of our products, software license and maintenance, installation services and training. Service revenues increased $44.9 million during 2016 compared to 2015. This increase was primarily attributed to the Newport Merger, as revenues associated with Newport services accounted for $35.8 million of service revenues for 2016. Service revenues increased for our legacy MKS business (Vacuum & Analysis segment) by $9.1 million during 2016, compared to the 2015, primarily due to service revenues from the semiconductor markets of $11.5 million, offset by a decrease in service revenues from other advanced markets of $2.4 million. Service revenues increased $9.3 million during 2015 compared to 2014. This increase was primarily attributed to increases in the semiconductor markets, which increased $8.1 million.
Total international net revenues, including product and service, were $619.7 million for 2016 or 47.8% of net revenues, compared to $355.2 million for 2015, or 43.7% of net revenues, and $332.4 million, or 42.6% of net revenues for 2014. The increase of $264.5 million in 2016 mainly relates to $186.4 million from our Newport Merger. The majority of our foreign revenues are from sales to customers in Asia, primarily in Korea, Japan and Israel.
The following table sets forth our net revenues by reportable segment:
Net Revenues
| Years Ended December 31, | ||||||||||||
| (Dollars in millions) | 2016 | 2015 | 2014 | |||||||||
| Vacuum & Analysis |
$ | 872.3 | $ | 813.5 | $ | 780.9 | ||||||
| Light & Motion |
423.0 | — | — | |||||||||
|
|
|
|
|
|
|
|||||||
| Total net revenues |
$ | 1,295.3 | $ | 813.5 | $ | 780.9 | ||||||
|
|
|
|
|
|
|
|||||||
Net revenues for our Vacuum & Analysis segment increased $58.8 million in 2016 compared to 2015, primarily due to an increase in net revenues from our semiconductor capital equipment manufacture and semiconductor device manufacture customers of $82.8 million, offset by a decrease in revenues of $24.0 million from our other advanced markets, primarily related to volume decreases in the solar, thin film and data storage markets. Net revenues for our Vacuum & Analysis segment increased $32.6 million in 2015 compared to 2014. This increase was attributed to an increase in net revenues from our semiconductor capital equipment and semiconductor device manufacture customers of $17.5 million and an increase in net revenues of $15.2 million from our other advanced markets, primarily related to increases in our solar markets.
Net revenues from our Light & Motion segment were $423.0 million for 2016. This segment represents the Newport business, which was acquired during the second quarter of 2016, including sales in the scientific research, microelectronics, life science and industrial markets.
41
Table of Contents
The following is gross profit as a percentage of net revenues by product and service:
Gross Profit
| Years Ended December 31, | % Points Change in 2016 |
% Points Change in 2015 |
||||||||||||||||||
| (As a percentage of net revenues) | 2016 | 2015 | 2014 | |||||||||||||||||
| Product |
44.6 | % | 46.4 | % | 44.5 | % | (1.8 | )% | 1.9 | % | ||||||||||
| Service |
36.9 | 34.0 | 35.6 | 2.9 | (1.6 | ) | ||||||||||||||
|
|
|
|
|
|
|
|
|
|
|
|||||||||||
| Total gross profit percentage |
43.7 | % | 44.6 | % | 43.3 | % | (0.9 | )% | 1.3 | % | ||||||||||
|
|
|
|
|
|
|
|
|
|
|
|||||||||||
Gross profit on product revenues decreased by 1.8 percentage points during 2016 compared to 2015. The decrease was primarily due to a decrease of 3.8 percentage points due to higher material costs, mainly related to $15.1 million of purchase accounting inventory step-up adjustments related to the Newport Merger, a net decrease of 2.3 percentage points due to higher overhead costs related to the Newport Merger and a net decrease of 0.9 percentage points due to unfavorable product mix, partially offset by an increase of 5.0 percentage points due to higher revenue volumes, mainly due to the Newport Merger.
Gross profit on product revenues increased by 1.9 percentage points during 2015 compared to 2014. The increase was primarily due to an increase of 1.2 percentage points due to favorable product mix and 0.9 percentage points due to higher revenue volumes.
Cost of service revenues consists primarily of costs for providing services for repair and training which includes salaries, related expenses and other overhead costs. Service gross profit for 2016 increased by 2.9 percentage points during 2016 compared to 2015. The increase was primarily due to a net increase of 3.0 percentage points due to net favorable direct labor and overhead absorption, partially offset by 1.4 percentage points due to unfavorable product mix.
Service gross profit for 2015 decreased by 1.6 percentage points primarily due to a decrease of 2.3 percentage points due to unfavorable product mix.
The following is gross profit as a percentage of net revenues by reportable segment:
Gross Profit
| Years Ended December 31, | % Points Change in 2016 |
% Points Change in 2015 |
||||||||||||||||||
| (As a percentage of net revenues) | 2016 | 2015 | 2014 | |||||||||||||||||
| Vacuum & Analysis |
44.5 | % | 44.6 | % | 43.3 | % | (0.1 | )% | 1.3 | % | ||||||||||
| Light & Motion |
41.9 | — | — | 100.0 | — | |||||||||||||||
|
|
|
|
|
|
|
|
|
|
|
|||||||||||
| Total net revenues |
43.7 | % | 44.6 | % | 43.3 | % | (0.9 | )% | 1.3 | % | ||||||||||
|
|
|
|
|
|
|
|
|
|
|
|||||||||||
Gross profit for our Vacuum & Analysis segment remained relatively flat in 2016 compared to 2015, where increases in margin from increased revenues were offset by unfavorable product mix. Gross profit for our Vacuum & Analysis segment increased by 1.3 percentage points in 2015 compared to 2014, primarily due to an increase of 0.7 percentage points due to higher revenue volumes and 0.7 percentage points due to favorable product mix.
Gross profit for our Light & Motion segment was 41.9% of net revenues in 2016. This included charges of $15.1 million of inventory step-up amortization, related to the Newport Merger. Excluding these inventory step-up amortization charges the gross profit would have been 45.5%. The Light & Motion segment was established in the second quarter of 2016 as a result of the Newport Merger.
42
Table of Contents
Research and Development
| Years Ended December 31, | ||||||||||||
| (Dollars in millions) | 2016 | 2015 | 2014 | |||||||||
| Research and development expenses |
$ | 110.6 | $ | 68.3 | $ | 62.9 | ||||||
Research and development expenses increased $42.3 million during 2016 compared to 2015. The increase was primarily attributed to $38.6 million from the Newport Merger, and consisted primarily of $28.9 million of compensation costs and related benefits, $3.8 million of project materials and $2.7 million of occupancy costs. The remaining increase of $3.7 million related to the legacy MKS business (Vacuum & Analysis segment) consisted primarily of $2.0 million compensation costs and related benefits and $1.4 million for project materials.
Research and development expenses increased $5.4 million during 2015 compared to 2014. The increase was primarily attributed to an increase of $2.4 million in compensation related costs, primarily due to strategic headcount additions, including variable compensation and fringe benefits and an increase of $1.6 million in project materials.
Our research and development is primarily focused on developing and improving our instruments, components, subsystems and process control solutions to improve process performance and productivity.
We have thousands of products and our research and development efforts primarily consist of a large number of projects related to these products, none of which is individually material to us. Current projects typically have durations of 3 to 30 months depending upon whether the product is an enhancement of existing technology or a new product. Our current initiatives include projects to enhance the performance characteristics of older products, to develop new products and to integrate various technologies into subsystems. These projects support in large part, the transition in the semiconductor industry to smaller integrated circuit geometries and in the flat panel display and solar markets to larger substrate sizes, which require more advanced process control technology. Research and development expenses consist primarily of salaries and related expenses for personnel engaged in research and development, fees paid to consultants, material costs for prototypes and other expenses related to the design, development, testing and enhancement of our products.
We believe that the continued investment in research and development and ongoing development of new products are essential to the expansion of our markets, and we expect to continue to make significant investment in research and development activities. We are subject to risks if products are not developed in a timely manner, due to rapidly changing customer requirements and competitive threats from other companies and technologies. Our success primarily depends on our products being designed into new generations of equipment for the semiconductor industry and other advanced technology markets. We develop products that are technologically advanced so that they are positioned to be chosen for use in each successive generation of semiconductor capital equipment. If our products are not chosen to be designed into our customers’ products, our net revenues may be reduced during the lifespan of those products.
Selling, General and Administrative
| Years Ended December 31, | ||||||||||||
| (Dollars in millions) | 2016 | 2015 | 2014 | |||||||||
| Selling, general and administrative expenses |
$ | 229.2 | $ | 129.1 | $ | 131.8 | ||||||
Selling, general and administrative expenses increased $100.1 million during 2016 compared to 2015. The increase was primarily attributed to $89.0 million from the Newport Merger, and consisted primarily of $55.4 million of compensation costs and related benefits, $6.5 million of consulting and professional fees, $5.9 million related to depreciation expense, $5.0 million related to commissions expense and $3.5 million for travel and
43
Table of Contents
entertainment-related expenses. The remaining increase of $11.1 million related to the legacy MKS business (Vacuum & Analysis segment) consisted primarily of $9.2 million of compensation costs and related benefits and $1.2 million of fees and expenses related to two repricings of our senior secured Term Loan Facility (as defined below).
Selling, general and administrative expenses decreased $2.7 million during 2015 compared to 2014. The decrease was primarily attributed to a $2.0 million decrease in consulting and professional fees and $1.1 million related to favorable foreign exchange. These decreases were partially offset by a $1.0 million increase in compensation related costs, including variable compensation and fringe benefits.
Acquisition and Integration Costs
| Years Ended December 31, | ||||||||||||
| (Dollars in millions) | 2016 | 2015 | 2014 | |||||||||
| Acquisition and integration costs |
$ | 27.3 | $ | — | $ | 0.5 | ||||||
We incurred $27.3 million of acquisition and integration costs in 2016 related to the Newport Merger. These costs were primarily related to legal and other professional fees as well as compensation expenses related to change in control agreements for certain executives of Newport. We incurred $0.5 million in 2014, comprised primarily of legal and filing fees related to the acquisition of Granville-Phillips.
Restructuring
| Years Ended December 31, | ||||||
| (Dollars in millions) | 2016 | 2015 | 2014 | |||
| Restructuring | $ 0.6 | $ 2.1 | $ 2.5 | |||
During 2016, we recorded $0.6 million of restructuring charges primarily related to the closing of one of our international facilities.
During 2015, we recorded $2.1 million of restructuring charges primarily related to severance costs associated with a reduction in headcount of 266 people, primarily related to the outsourcing of a non-core foreign manufacturing process and the consolidation of certain foreign manufacturing locations. These restructuring activities were substantially complete by December 31, 2015.
During 2014, we recorded $2.5 million of restructuring charges primarily for severance-related costs related to a reduction in headcount of approximately 131 people throughout our Company. This restructuring was substantially complete at December 31, 2014.
Asset Impairment
| Years Ended December 31, | ||||||||||||
| (Dollars in millions) | 2016 | 2015 | 2014 | |||||||||
| Asset impairment |
$ | 5.0 | $ | — | $ | — | ||||||
An asset impairment charge of $5.0 million was recognized in 2016 on our investment in a private company.
Amortization of Intangible Assets
| Years Ended December 31, | ||||||||||||
| (Dollars in millions) | 2016 | 2015 | 2014 | |||||||||
| Amortization of intangible assets |
$ | 35.7 | $ | 6.8 | $ | 4.9 | ||||||
44
Table of Contents
Amortization increased by $28.9 million during 2016 compared to 2015. This increase was primarily attributed to the amortization of $29.0 million of intangible assets, acquired through the Newport Merger.
Amortization increased by $1.9 million during 2015 compared to 2014. This increase was primarily attributed to the amortization of intangible assets acquired through our acquisition of Precisive in 2015 and our acquisition of Granville-Phillips in 2014.
Interest Expense, Net
| Years Ended December 31, | ||||||||||||
| (Dollars in millions) | 2016 | 2015 | 2014 | |||||||||
| Interest expense (income), net |
$ | 28.0 | ($ | 2.9 | ) | ($ | 1.3 | ) | ||||
Interest expense, net, increased by $30.9 million during 2016 compared to 2015. This increase is primarily attributed to $30.4 million of interest expense related to our Term Loan Credit Agreement. Net interest income for 2015 increased $1.6 million compared to 2014. This increase is attributed to a change in the mix of our investment portfolio as well as larger average investment balances.
Other Expense, Net
| Years Ended December 31, | ||||||||||||
| (Dollars in millions) | 2016 | 2015 | 2014 | |||||||||
| Other expense, net |
$ | 1.2 | $ | — | $ | — | ||||||
Other expense, net, for 2016 includes $2.8 million of foreign exchange losses and other income, net of $1.6 million, primarily attributed to $1.3 million of net proceeds received from a Company-owned life insurance policy. In 2016, we reclassified the impact of foreign exchange losses (gains), from selling, general and administrative expenses to other expense (income), net. The net foreign exchange gains and losses included in selling, general and administrative expenses for the year ended December 31, 2015 and 2014 were a loss of $1.4 million and a loss of $0.3 million, respectively.
Provision for Income Taxes
| Years Ended December 31, | ||||||||||||
| (Dollars in millions) | 2016 | 2015 | 2014 | |||||||||
| Provision for income taxes |
$ | 23.2 | $ | 37.2 | $ | 20.6 | ||||||
The provision for income taxes in each of 2016, 2015 and 2014 are comprised of U.S. federal, state and foreign income taxes.
Our effective tax rate for the years 2016, 2015 and 2014 was 18.1%, 23.3%, and 15.1%, respectively. The effective tax rate in 2016, and related income tax expense, was lower than the U.S. statutory tax rate primarily due to the geographic mix of income and profits earned by the Company’s international subsidiaries being taxed at rates lower than the U.S. statutory tax rate, foreign tax credits and research credits, release of tax reserves and the deduction for domestic production activities. These were partially offset by an increase in the valuation allowance related to certain deferred tax assets and non-deductible acquisition costs.
The effective tax rate in 2015, and related income tax expense, was lower than the U.S. statutory tax rate primarily due to the release of income tax reserves related to the effective settlement of a U.S. tax audit. The 2015 effective tax rate also benefited from foreign earnings taxed at lower rates, the deduction for domestic production activities, and the research credit offset by state income taxes.
45
Table of Contents
The effective tax rate in 2014, and related income tax expense, was lower than the U.S. statutory tax rate primarily due to the release of income tax reserves related to the effective settlement of various foreign and U.S. tax audits. The effective tax rate for 2014 also benefited from a release of income tax reserves related to the expiration of the statute of limitations for a previously open tax year, a benefit resulting from foreign tax credits recognized on the payment of a dividend from a foreign subsidiary and a benefit from a change in tax election resulting in the recording of a deferred tax asset for previously unavailable foreign net operating losses. The 2014 effective tax rate also benefited from foreign earnings taxed at lower rates, the deduction for domestic production activities, and a research credit offset by state income taxes.
Our effective tax rate has been impacted on a year-to-year basis by the expiration and extension of certain U.S. tax benefits. The tax benefits expired, but were reinstated in past years. The net impact of these tax benefits was approximately 1% for both 2015 and 2014. As part of the 2015 extension, some of the tax benefits, including the research credit that accounts for most of our benefit related to the expiring and reinstated provisions, were made permanent.
At December 31, 2016, the total amount of gross unrecognized tax benefits, which excludes interest and penalties, was approximately $25.5 million. At December 31, 2015, our total amount of gross unrecognized tax benefits, which excludes interest and penalties, was approximately $4.3 million. The net increase at December 31, 2016 from December 31, 2015 was primarily attributable to the addition of historical gross unrecognized tax benefits for Newport and its subsidiaries which were included as a result of the acquisition of Newport in April 2016. At December 31, 2016, excluding interest and penalties, there were $18.4 million of net unrecognized tax benefits that, if recognized, would impact our annual effective tax rate. We accrue interest and, if applicable, penalties for any uncertain tax positions. Interest and penalties are classified as a component of income tax expense. At December 31, 2016, 2015 and 2014, we had accrued interest on unrecognized tax benefits of approximately $0.5 million, $0.2 million and $0.6 million, respectively.
Over the next 12 months it is reasonably possible that we may recognize approximately $3.1 million of previously net unrecognized tax benefits, excluding interest and penalties, related to state and foreign tax positions as a result of the expiration of statutes of limitation. We are subject to examination by U.S. federal, state and foreign tax authorities. The United States Internal Revenue Service commenced an examination of our U.S. federal tax filings for tax years 2011 through 2013 during the quarter ended March 31, 2015. This audit was effectively settled during the quarter ended December 31, 2015 upon our acceptance of the income tax examination changes. As part of the audit, we consented to extend the U.S. statute of limitations for tax year 2011. The U.S. statute of limitations for tax year 2011 expired September 30, 2016.
We also effectively settled another U.S. federal income tax examination, for tax years 2007 through 2009, during the quarter ended December 31, 2014 upon receipt of an audit approval letter from the Joint Committee on Taxation. The statute of limitations for tax years 2007 through 2009 expired on December 31, 2015.
The U.S. statute of limitations remains open for tax years 2013 through present. The statute of limitations for our tax filings in other jurisdictions varies between fiscal years 2007 through present. We also have certain federal credit carry-forwards and state tax loss and credit carry-forwards that are open to examination for tax years 2000 through the present.
On a quarterly basis, we evaluate both positive and negative evidence that affects the realizability of net deferred tax assets and assess the need for a valuation allowance. The future benefit to be derived from our deferred tax assets is dependent upon our ability to generate sufficient future taxable income in each jurisdiction of the right type to realize the assets. In 2016, we increased our valuation allowance by $6.4 million primarily due to the addition of historical deferred tax valuation allowances for Newport and its subsidiaries which were included as a result of the acquisition of Newport in April 2016. During 2015, we decreased our valuation allowance by $20.6 million, primarily related to the expiration of U.S. capital loss carry-forwards. We decreased our valuation allowance for 2014 by $0.3 million, primarily related to the effective settlement of a foreign tax audit.
46
Table of Contents
In 2016 we recorded a net benefit to income tax expense of $2.6 million, excluding interest and penalties, primarily due to the expiration of the statute of limitations related to previously open tax years. For 2015, we recorded a net benefit to income tax expense of $7.3 million, excluding interest and penalties, primarily due to reserve releases related to the effective settlement of a U.S. income tax audit. During 2014, we recorded a net benefit to income tax expense of $13.4 million, excluding interest and penalties, due to reserve releases related to the effective settlement of various U.S. and foreign audits along with the expiration of the statute of limitations related to a previously open tax year.
Our future effective tax rate depends on various factors, including the impact of tax legislation, the geographic composition of our pre-tax income, and changes in tax reserves for unrecognized tax benefits. We monitor these factors and timely adjust our estimates of the effective tax rate accordingly. We expect that the geographic mix of pre-tax income will continue to have a favorable impact on our effective tax rate, however the geographic mix of pre-tax income can change based on multiple factors resulting in changes to the effective tax rate in future periods.
Additionally, the effective tax rate could be adversely affected by changes in the valuation of deferred tax assets and liabilities. In particular, the carrying value of deferred tax assets, which are predominantly in the United States, is dependent on our ability to generate sufficient future taxable income in the United States.
While we believe we have adequately provided for all tax positions, amounts asserted by taxing authorities could materially differ from our accrued positions as a result of uncertain and complex application of tax law and regulations.
Additionally, the recognition and measurement of certain tax benefits include estimates and judgment by management. Accordingly, we could record additional provisions or benefits for U.S. federal, state, and foreign tax matters in future periods as new information becomes available.
Liquidity and Capital Resources
Cash, cash equivalents and short-term marketable investments, excluding restricted cash, totaled $418.1 million at December 31, 2016, a decrease of $240.1 million compared to $658.2 million at December 31, 2015. This decrease is primarily related to cash and investments used for the Newport Merger. Aside from the Newport Merger, the primary driver in our current and anticipated future cash flows is and will continue to be cash generated from operations, consisting primarily of our net income, excluding non-cash changes and changes in operating assets and liabilities. In periods when our sales are growing, higher sales to customers will result in increased trade receivables, and inventories will generally increase as we build products for future sales. This may result in lower cash generated from operations. Conversely, in periods when our sales are declining, our trade accounts receivable and inventory balances will generally decrease, resulting in increased cash from operations.
Net cash provided by operating activities was $180.1 million for 2016 and resulted primarily from net income of $104.8 million, which included non-cash net charges of $97.6 million, partially offset by an increase in working capital of $22.3 million. The increase in working capital consisted primarily of an increase in trade accounts receivable of $58.1 million, an increase in inventories of $13.8 and an increase in current and non-current assets of $12.2 million. These increases were partially offset by an increase in income taxes of $30.9 million, accounts payable of $16.2 million, an increase in accrued compensation of $11.0 million and an increase in other current and non-current liabilities of $3.7 million.
Net cash provided by operating activities was $138.3 million for 2015 and resulted primarily from net income of $122.3 million, which included non-cash net charges of $48.2 million, partially offset by an increase in working capital of $32.2 million. The increase in working capital consisted primarily of an increase in inventories of $14.5 million, a decrease in accounts payable of $10.6 million, a decrease in income taxes of $8.5
47
Table of Contents
million, a decrease in other current and non-current liabilities of $2.8 million and an increase in other current and non-current assets of $1.5 million. These increases were partially offset by an increase in accrued compensation of $3.3 million and a decrease in trade accounts receivable of $2.3 million.
Net cash used in investing activities was $727.0 million for 2016 and resulted primarily from $939.6 million of cash, primarily used for the acquisition of Newport and $19.1 million used for the purchase of production-related equipment, partially offset by net proceeds from sales and maturities of investments of $231.5 million. Net cash used in investing activities was $167.4 million for 2015 and resulted primarily from $9.9 million of cash primarily used for the acquisition of Precisive, $12.4 million used for the purchase of production-related equipment and $145.1 million from net purchases of investments.
Net cash provided by financing activities was $554.3 million for 2016 and resulted primarily from net proceeds of $598.5 million, primarily related to the Term Loan Facility used to finance the Newport Merger, partially offset by dividend payments made to common stockholders of $36.4 million, restricted cash of $5.9 million for collateral cash deposits relating to letters of credit and net payments related to tax payments made for employee stock awards of $1.9 million. Net cash used in financing activities was $47.1 million for 2015 and consisted primarily of $36.0 million in dividend payments made to common stockholders and $13.3 million for the repurchase of common stock.
On July 25, 2011, our board of directors approved a share repurchase program for the repurchase of up to an aggregate of $200 million of our common stock from time to time in open market purchases, privately negotiated transactions or through other appropriate means. The timing and quantity of any shares repurchased will depend upon a variety of factors, including business conditions, stock market conditions and business development activities, including, but not limited to, merger and acquisition opportunities. These repurchases may be commenced, suspended or discontinued at any time without prior notice. During 2016, we repurchased approximately 45,000 shares of our common stock for $1.5 million at an average price of $34.50 per share. During 2015, we repurchased approximately 369,000 shares of our common stock for $13.3 million at an average price of $36.01 per share.
Holders of our common stock are entitled to receive dividends when and if they are declared by our board of directors. For the year ended December 31, 2016, we paid cash dividends of $36.4 million in aggregate, or $0.68 per share. For the year ended December 31, 2015, we paid cash dividends of $36.0 million in aggregate, or $0.675 per share. Future dividend declarations, if any, as well as the record and payment dates for such dividends, are subject to the final determination of our board of directors. In addition, under the terms of our senior secured term loan facility and our senior secured asset-based revolving credit facility, we may be restricted from paying dividends under certain circumstances.
On February 13, 2017, our board of directors declared a quarterly cash dividend of $0.175 per share to be paid on March 10, 2017 to shareholders of record as of February 27, 2017.
On April 27, 2016, we invested $9.3 million for a minority interest in a private company, which operates in the field of semiconductor process equipment instrumentation. We accounted for this investment using the cost method of accounting. During the fourth quarter of 2016, we recognized an impairment loss on this investment of $5.0 million.
Term Loan Credit Agreement
In connection with the completion of the Newport Merger, we entered into a term loan credit agreement (the “Credit Agreement”) with Barclays Bank PLC, as administrative agent and collateral agent, and the lenders from time to time party thereto (the “Lenders”), that provided senior secured financing of $780.0 million, subject to increase at our option in accordance with the Credit Agreement (the “Term Loan Facility”). Borrowings under the Term Loan Facility bear interest per annum at one of the following rates selected by the Company: (a) a base
48
Table of Contents
rate determined by reference to the highest of (1) the federal funds effective rate plus 0.50%, (2) the “prime rate” quoted in The Wall Street Journal, (3) a LIBOR rate determined by reference to the costs of funds for U.S. dollar deposits for an interest period of one month adjusted for certain additional costs, plus 1.00%, and (4) a floor of 1.75%, plus, in each case, an applicable margin of 3.00%; or (b) a LIBOR rate determined by reference to the costs of funds for U.S. dollar deposits for the interest period relevant to such borrowing adjusted for certain additional costs, subject to a LIBOR rate floor of 0.75%, plus an applicable margin of 4.00%. We have elected the interest rate as described in clause (b). The Term Loan Facility was issued with original issue discount of 1.00% of the principal amount thereof.
In June 2016, we entered into Amendment No. 1 (the “Re-pricing Amendment 1”) to the Credit Agreement by and among the Company, the Lenders and Barclays Bank PLC, as administrative agent and collateral agent for the Lenders. The Re-pricing Amendment 1 decreased the applicable margin for borrowings under our Term Loan Facility to 2.50% for base rate borrowings and 3.50% for LIBOR borrowings and extended the period during which a prepayment premium may be required for a “Re-pricing Transaction” (as defined in the Credit Agreement) until six months after the effective date of the Re-pricing Amendment 1. In connection with the execution of the Re-pricing Amendment 1, we paid a prepayment premium of 1.00%, or $7.3 million, as well as certain fees and expenses of the administrative agent and the Lenders, in accordance with the terms of the Credit Agreement. Immediately prior to the effectiveness of the Re-pricing Amendment 1, we prepaid $50.0 million of principal under the Credit Agreement. In September 2016, we prepaid an additional $60.0 million under the Credit Agreement.
In December 2016, we entered into Amendment No. 2 (the “Re-pricing Amendment 2”) to the Credit Agreement by and among the Company, the Lenders and Barclays Bank PLC, as administrative agent and collateral agent for the Lenders (as amended from time to time, including Re-pricing Amendment No. 1). The Re-pricing Amendment 2 decreased the applicable margin for the Company’s term loan under the Credit Agreement to 2.75% for LIBOR borrowings with a LIBOR floor of 0.75% and 1.75% for base rate borrowings with a base rate floor of 1.75% and reset the period during which a prepayment premium may be required for a “Re-pricing Transaction” (as defined in the Credit Agreement) until six months after the effective date of the Re-pricing Amendment. In November 2016, prior to the effectiveness of the Re-pricing Amendment 2, we prepaid an additional $40.0 million of principal under the Credit Agreement. After total 2016 prepayments of $150.0 million and regularly scheduled principal payments of $3.4 million, the total outstanding principal balance was $626.6 million as of December 31, 2016.
In September 2016, we entered into an interest rate swap agreement, which has a maturity date of September 30, 2020, to fix the rate on $335.0 million of the outstanding balance of the Credit Agreement. The rate is fixed at 1.198% per annum plus the credit spread of 3.50%.
We incurred $28.7 million of deferred finance fees, original issue discount and a re-pricing fee related to the term loans, which are included in long-term debt in the accompanying consolidated balance sheets and will be amortized to interest expense over the estimated life of the term loans using the effective interest method. A portion of these fees have been written-off in connection with the various debt prepayments during 2016. The remaining balance of the deferred finance fees, original issue discount and re-pricing fee related to the Term Loan was $19.6 million as of December 31, 2016.
Under the Credit Agreement, we are required to prepay outstanding term loans, subject to certain exceptions, with portions of our annual excess cash flow as well as with the net cash proceeds of certain asset sales, certain casualty and condemnation events and the incurrence or issuance of certain debt. We are also required to make scheduled quarterly payments each equal to 0.25% of the original principal amount of the term loans made on the closing date with such original principal amount reduced by any such prepayments (including the $150.0 million prepaid to date in 2016), with the balance due on the seventh anniversary of the closing date.
49
Table of Contents
All obligations under the Term Loan Facility are guaranteed by certain of our domestic subsidiaries, and are secured by substantially all of our assets and the assets of such subsidiaries, subject to certain exceptions and exclusions.
The Credit Agreement contains customary representations and warranties, affirmative and negative covenants and provisions relating to events of default. If an event of default occurs, the Lenders under the Term Loan Facility will be entitled to take various actions, including the acceleration of amounts due under the Term Loan Facility and all actions generally permitted to be taken by a secured creditor. At December 31, 2016, we are in compliance with all covenants under the Credit Agreement.
Senior Secured Asset-Based Revolving Credit Facility
In connection with the completion of the Newport Merger, we also entered into an asset-based credit agreement with Deutsche Bank AG New York Branch, as administrative agent and collateral agent, the other borrowers from time to time party thereto, and the lenders and letters of credit issuers from time to time party thereto (the “ABL Facility”), that provides senior secured financing of up to $50.0 million, subject to a borrowing base limitation. The borrowing base for the ABL Facility at any time equals the sum of: (a) 85% of certain eligible accounts; plus (b) subject to certain notice and field examination and appraisal requirements, the lesser of (i) the lesser of (A) 65% of the lower of cost or market value of certain eligible inventory and (B) 85% of the net orderly liquidation value of certain eligible inventory and (ii) 30% of the borrowing base; minus (c) reserves established by the administrative agent; provided that until the administrative agent’s receipt of a field examination of accounts receivable the borrowing base shall be equal to 70% of the book value of certain eligible accounts. The ABL Facility includes borrowing capacity in the form of letters of credit up to $15.0 million. We have not drawn against the ABL Facility.
Borrowings under the ABL Facility bear interest per annum at one of the following rates selected by us: (a) a base rate determined by reference to the highest of (1) the federal funds effective rate plus 0.50%, (2) the “prime rate” quoted in The Wall Street Journal, and (3) a LIBOR rate determined by reference to the costs of funds for U.S. dollar deposits for an interest period of one month adjusted for certain additional costs, plus 1.00%, plus, in each case, an initial applicable margin of 0.75%; and (b) a LIBOR rate determined by reference to the costs of funds for U.S. dollar deposits for the interest period relevant to such borrowing adjusted for certain additional costs, plus an initial applicable margin of 1.75%. Commencing with the completion of the first fiscal quarter ending after the closing of the ABL Facility, the applicable margin for borrowings thereunder is subject to upward or downward adjustment each fiscal quarter, based on the average historical excess availability during the preceding quarter.
We have incurred $1.2 million of costs in connection with the ABL Facility, which were capitalized and included in other assets in the accompanying consolidated balance sheets and will be amortized to interest expense using the straight-line method over the contractual term of five years of the ABL Facility.
In addition to paying interest on outstanding principal under the ABL Facility, we are required to pay a commitment fee in respect of the unutilized commitments thereunder. The initial commitment fee is 0.375% per annum. The total commitment fee recognized in interest expense in 2016 was $0.1 million. Commencing with the completion of the first fiscal quarter ending after the closing of the ABL Facility, the commitment fee is subject to downward adjustment based on the amount of average unutilized commitments for the three-month period immediately preceding such adjustment date. We must also pay customary letter of credit fees and agency fees.
Lines of Credit and Short-Term Borrowing Arrangements
One of our Japanese subsidiaries has lines of credit and short-term borrowing arrangements with two financial institutions which arrangements generally expire and are renewed at three-month intervals. The lines of credit provided for aggregate borrowings as of December 31, 2016 of up to an equivalent of $19.7 million U.S.
50
Table of Contents
dollars. One of the borrowing arrangements has an interest rate based on the Tokyo Interbank Offer Rate at the time of borrowing and the other has an interest rate based on the Japanese Short-term Prime Lending Rate. There were no borrowings outstanding under these arrangements at December 31, 2016 and 2015.
We assumed various revolving lines of credit and a financing facility with the completion of the Newport Merger. These revolving lines of credit and financing facility have no expiration date and provided for aggregate borrowings as of December 31, 2016 of up to an equivalent of $10.7 million U.S. dollars. These lines of credit have a base interest rate of 1.25% plus a Japanese Yen overnight LIBOR rate.
One of our Austrian subsidiaries has four outstanding loans from the Austrian government to fund research and development. These loans are unsecured and do not require principal repayment as long as certain conditions are met. Interest on these loans is payable semi-annually. The interest rates associated with these loans range from 0.75%-2.00%.
We have provided financial guarantees for certain unsecured borrowings and have standby letters of credit, some of which do not have fixed expiration dates. At December 31, 2016, our maximum exposure as a result of these financial guarantees and standby letters of credit was approximately $5.7 million.
Our total cash and cash equivalents and short-term marketable investments at December 31, 2016 consisted of $193.5 million held in the United States and $224.6 million held by our foreign subsidiaries, substantially all of which would be subject to tax in the United States if returned to the United States. We believe that our current cash and investments position and available borrowing capacity, together with the cash anticipated to be generated from our operations, will be sufficient to satisfy our estimated working capital, planned capital expenditure requirements, and any future cash dividends declared by our board of directors or share repurchases through at least the next 12 months and the foreseeable future.
Future contractual obligations as of December 31, 2016 are as follows:
| Payment Due By Period | ||||||||||||||||||||||||
| Less than | After | |||||||||||||||||||||||
| Contractual Obligations (In thousands) |
Total | 1 Year | 2-3 years | 4-5 years | 5 years | Other (1) | ||||||||||||||||||
| Operating lease obligations |
$ | 67,303 | $ | 16,586 | $ | 27,156 | $ | 18,131 | $ | 5,430 | $ | — | ||||||||||||
| Purchase obligations(2) |
247,563 | 202,167 | 18,068 | 17,957 | 9,371 | — | ||||||||||||||||||
| Pension obligations |
29,305 | 2,298 | 5,370 | 6,153 | 15,484 | — | ||||||||||||||||||
| Debt |
631,864 | 10,993 | 13,069 | 12,606 | 595,196 | — | ||||||||||||||||||
| Other long-term liabilities reflected on the Balance Sheet under U.S. GAAP(3) |
102,616 | 842 | 11,884 | 1,152 | 72,539 | 16,199 | ||||||||||||||||||
|
|
|
|
|
|
|
|
|
|
|
|
|
|||||||||||||
| Total |
$ | 1,078,651 | $ | 232,886 | $ | 75,547 | $ | 55,999 | $ | 698,020 | $ | 16,199 | ||||||||||||
|
|
|
|
|
|
|
|
|
|
|
|
|
|||||||||||||
| (1) | This balance relates to our reserve for uncertain tax positions. |
| (2) | As of December 31, 2016, we have entered into purchase commitments for certain inventory components and other equipment and services used in our normal operations. The majority of these purchase commitments covered by these arrangements are for periods of one to three years and aggregate to approximately $220.2 million. |
| (3) | The majority of this balance relates to deferred tax liabilities. |
Derivatives
We enter into derivative instruments for risk management purposes only, including derivatives designated as hedging instruments and those utilized as economic hedges. We operate internationally, and in the normal course of business, are exposed to fluctuations in interest rates and foreign exchange rates. These fluctuations can
51
Table of Contents
increase the costs of financing, investing and operating the business. We have used derivative instruments, such as forward contracts and foreign currency option contracts and an interest rate hedge to manage certain foreign currency exposure.
By nature, all financial instruments involve market and credit risks. We enter into derivative instruments with major investment grade financial institutions and no collateral is required. We have policies to monitor the credit risk of these counterparties. While there can be no assurance, we do not anticipate any material non-performance by any of these counterparties.
We hedge a portion of our forecasted foreign currency denominated intercompany sales of inventory, over a maximum period of eighteen months, using forward foreign exchange contracts accounted for as cash-flow hedges related to Japanese, South Korean, British, Euro and Taiwanese currencies. To the extent these derivatives are effective in offsetting the variability of the hedged cash flows, and otherwise meet the hedge accounting criteria, changes in the derivatives’ fair value are not included in current earnings but are included in accumulated other comprehensive income in stockholders’ equity. These changes in fair value will subsequently be reclassified into earnings, as applicable, when the forecasted transaction occurs. To the extent that a previously designated hedging transaction is no longer an effective hedge, any ineffectiveness measured in the hedging relationship is recorded currently in earnings in the period it occurs. The cash flows resulting from forward exchange contracts are classified in the consolidated statements of cash flows as part of cash flows from operating activities. We do not enter into derivative instruments for trading or speculative purposes.
We also enter into forward exchange contracts to hedge certain balance sheet amounts and foreign currency option contracts related to the Israeli Shekel. To the extent the hedge accounting criteria is not met, the related foreign currency forward contracts and foreign currency option contracts are considered as economic hedges and changes in the fair value of these contracts are recorded immediately in earnings in the period in which they occur. These include hedges that are used to reduce exchange rate risks arising from the change in fair value of certain foreign currency-denominated assets and liabilities (i.e., payables, receivables) and other economic hedges where the hedge accounting criteria were not met.
We had forward exchange contracts with notional amounts totaling $120.2 million outstanding at December 31, 2016 of which $50.0 million were outstanding to exchange Korean Won to U.S. dollars and $30.5 million were outstanding to exchange Japanese Yen to U.S. dollars. We had forward exchange contracts with notional amounts totaling $90.0 million outstanding at December 31, 2015 of which $34.8 million were outstanding to exchange Korean Won to U.S. dollars and $26.8 million were outstanding to exchange Japanese Yen to U.S. dollars.
As of December 31, 2016, the unrealized gain that will be reclassified from accumulated other comprehensive income to earnings over the next twelve months is immaterial. Gains and losses on forward exchange contracts that qualify for hedge accounting are classified in cost of products in 2016, 2015 and 2014 and totaled a loss of $1.4 million, a gain of $3.5 million and a loss of $0.2 million, respectively. There were no ineffective portions of the derivatives recorded in selling, general and administrative costs in 2016, 2015 and 2014.
We hedge certain intercompany accounts receivable and intercompany loans with forward exchange contracts. Typically, as these derivatives hedge existing amounts that are denominated in foreign currencies, the derivatives do not qualify for hedge accounting. Realized and unrealized gains and losses on forward exchange contracts that do not qualify for hedge accounting are recognized currently in earnings. The net foreign exchange loss on these derivatives was immaterial in each of 2016, 2015 and 2014. Starting in 2016, foreign currency gains or losses are classified in other expense, net, while in 2015 and 2014 these gains or losses were classified in selling, general and administrative expenses. The cash flows resulting from forward exchange contracts are classified in our consolidated statements of cash flows as part of cash flows from operating activities. We do not hold or issue derivative financial instruments for trading purposes.
52
Table of Contents
Off-Balance Sheet Arrangements
We do not have any financial partnerships with unconsolidated entities, such as entities often referred to as structured finance, special purpose entities or variable interest entities which are often established for the purpose of facilitating off-balance sheet arrangements or other contractually narrow or limited purposes. Accordingly, we are not exposed to any financing, liquidity, market or credit risk that could arise if we had such relationships.
Recently Issued Accounting Pronouncements
In January 2017, the Financial Accounting Standards Board (“FASB”) issued Accounting Standards Update (“ASU”) 2017-04, “Intangibles-Goodwill and Other (Topic 350).” This standard simplifies how an entity is required to test goodwill for impairment by eliminating Step 2 from the goodwill impairment test. Step 2 measures a goodwill impairment loss by comparing the implied fair value of a reporting unit’s goodwill with the carrying amount of goodwill. The provisions of this ASU are effective for annual or any interim goodwill impairment tests in fiscal years beginning after December 15, 2019. Early adoption is permitted for interim or annual goodwill impairment tests performed on testing dates after January 1, 2017. We are currently evaluating the requirements of this ASU and have not yet determined its impact on our consolidated financial statements.
In November 2016, the FASB issued ASU 2016-18, “Statement of Cash Flows (Topic 230)-Restricted Cash,” an amendment to ASU 2016-15. This standard requires that a statement of cash flows explain the change during the period in the total of cash, cash equivalents and amounts generally described as restricted cash and restricted cash equivalents. Therefore, amounts generally described as restricted cash and restricted cash equivalents should be included with cash and cash equivalents when reconciling the beginning-of-period and end-of-period total amounts shown on the statement of cash flows. Early adoption is permitted. The provisions of this ASU are effective for annual periods beginning after December 15, 2017, including interim periods within those fiscal years and should be applied at the time of adoption of ASU 2016-15. We do not expect adoption of this ASU to have a material impact on our consolidated financial statements.
In October 2016, the FASB issued ASU 2016-16, “Income Taxes (Topic 740)-Intra-Entity Transfer of Assets Other Than Inventory.” This standard requires that an entity recognize the income tax consequences of an intra-entity transfer of an asset other than inventory when the transfer occurs as opposed to when the assets have been sold to an outside party. The provisions of this ASU are effective for annual periods beginning after December 15, 2017, including interim periods within those fiscal years and early adoption is permitted. We are currently evaluating the requirements of this ASU and have not yet determined its impact on our consolidated financial statements.
In August 2016, the FASB issued ASU 2016-15, “Statement of Cash Flows (Topic 230)-Classification of Certain Cash Receipts and Cash Payments.” This standard addresses eight specific cash flow issues with the objective of addressing the diversity in practice in how certain cash receipts and cash payments are presented and classified in the statement of cash flows under Topic 230. The provisions of this ASU are effective for annual periods beginning after December 15, 2017, including interim periods within those fiscal years. We are currently evaluating the requirements of this ASU and have not yet determined its impact on our consolidated financial statements.
In May 2016, the FASB issued ASU 2016-12, “Revenue from Contracts with Customers (Topic 606)-Narrow-Scope Improvements and Practical Expedients,” an amendment to ASU 2014-09. This standard is intended to reduce the cost and complexity of applying the revenue recognition guidance and result in a more consistent application of the revenue recognition rules. The amendment clarifies the implementation guidance on collectability, non-cash consideration and the presentation of sales and other similar taxes, as well as transitional guidance related to completed contracts. The provisions of this ASU are effective for annual periods beginning after December 15, 2017, including interim periods within those fiscal years and should be applied at the time of the adoption of ASU 2014-09. Early adoption is not permitted. We are currently evaluating the requirements of this ASU and have not yet determined its impact on our consolidated financial statements.
53
Table of Contents
In April 2016, the FASB issued ASU 2016-10, “Revenue from Contracts with Customers (Topic 606)-Identifying Performance Obligations and Licensing,” an amendment to ASU 2014-09. This standard clarifies the implementation guidance on identifying performance obligations and licensing. Specifically, the amendment reduces the cost and complexity of identifying promised goods or services and improves the guidance for determining whether promises are separately identifiable. The amendment also provides implementation guidance on determining whether an entity’s promise to grant a license provides a customer with either a right to use the entity’s intellectual property (which is satisfied at a point in time) or a right to access the entity’s intellectual property (which is satisfied over time). The provisions of this ASU are effective for annual periods beginning after December 15, 2017, including interim periods within those fiscal years and should be applied at the time of the adoption of ASU 2014-09. Early adoption is not permitted. We are currently evaluating the requirements of this ASU and have not yet determined its impact on our consolidated financial statements.
In March 2016, the FASB issued ASU 2016-08, “Revenue from Contracts with Customers (Topic 606)-Principal versus Agent,” an amendment to ASU 2014-09. This standard clarifies the application of principal versus agent guidance, identification of the units of accounting, as well as application of the control principle to certain types of arrangements within the scope of the guidance. The provisions of this ASU are effective for annual periods beginning after December 15, 2017, including interim periods within those fiscal years and should be applied at the time of the adoption of ASU 2014-09. Early adoption is not permitted. We are currently evaluating the requirements of this ASU and have not yet determined its impact on our consolidated financial statements.
In March 2016, the FASB issued ASU 2016-09, “Compensation—Stock Compensation (Topic 718)—Improvements to Employee Share-Based Payment Accounting.” This standard simplifies several aspects of the accounting for share-based payment transactions, including the income tax consequences, classification of awards as either equity or liabilities, and classification on the statement of cash flows. The provisions of this ASU are effective for annual periods beginning after December 15, 2016, including interim periods within those fiscal years and early adoption is permitted. This ASU will be adopted in the first quarter of 2017 and is expected to result in a material benefit to our tax provision and result in a reduction to the tax rate in our consolidated financial statements.
In February 2016, the FASB issued ASU 2016-02, “Leases (Topic 842).” This standard requires the recognition of lease assets and liabilities for all leases, with certain exceptions, on the balance sheet. In transition, lessees and lessors are required to recognize and measure leases at the beginning of the earliest period presented using a modified retrospective approach. This ASU is effective for annual periods beginning after December 15, 2018, including interim periods within those fiscal years. We are currently evaluating the requirements of this ASU and have not yet determined its impact on our consolidated financial statements.
In January 2016, the FASB issued ASU 2016-01, “Financial Instruments—Overall (Subtopic 825-10): Recognition and Measurement of Financial Assets and Financial Liabilities.” This ASU provides guidance for the recognition, measurement, presentation, and disclosure of financial instruments. The new pronouncement revises accounting related to equity investments and the presentation of certain fair value changes for financial assets and liabilities measured at fair value. Among other things, it amends the presentation and disclosure requirements of equity securities that do not result in consolidation and are not accounted for under the equity method. Changes in the fair value of these equity securities will be recognized directly in net income. This pronouncement is effective for annual periods beginning after December 15, 2017, including interim periods within those fiscal years. We do not expect adoption of this ASU to have a material impact on our consolidated financial statements.
In July 2015, the FASB issued ASU 2015-11, “Inventory (Topic 330)—Simplifying the Measurement of Inventory.” The amendments in this ASU apply to all inventory that is measured using first-in, first-out or average cost. The new standard requires that an entity measure inventory within the scope of this update at the lower of cost and net realizable value. Net realizable value is the estimated selling prices in the ordinary course
54
Table of Contents
of business, less reasonably predictable costs of completion, disposal, and transportation. The amendments in this ASU are effective for fiscal years beginning after December 15, 2016, including interim periods within those fiscal years. We will adopt this ASU during the first quarter of 2017 and adoption is not expected to have a material impact on our consolidated financial statements.
In August 2014, the FASB issued ASU 2014-15, “Presentation of Financial Statements—Going Concern (Subtopic 205-40): Disclosure of Uncertainties about an Entity’s Ability to Continue as a Going Concern.” Under the new guidance, management will be required to assess an entity’s ability to continue as a going concern, and to provide related footnote disclosures in certain circumstances. The provisions of this ASU are effective for annual periods ending after December 15, 2016, and for annual and interim periods thereafter. We will adopt this ASU during the first quarter of 2017 and adoption is not expected to have an impact on our consolidated financial statements.
In May 2014, the FASB issued ASU 2014-09, “Revenue from Contracts with Customers (Topic 606),” which supersedes all existing revenue recognition requirements, including most industry-specific guidance. This standard requires a company to recognize revenue when it transfers goods and services to customers in an amount that reflects the consideration that the company expects to be entitled to in exchange for those goods or services. The ASU also requires additional disclosure about the nature, amount, timing and uncertainty of revenue and cash flows arising from customer contracts, including significant judgments and assets recognized from costs incurred to obtain or fulfill a contract. This pronouncement is effective for annual reporting periods beginning after December 15, 2017, including interim periods within that reporting period. The two permitted transition methods under the new standard are the full retrospective method, in which case the standard would be applied to each prior reporting period presented, or the modified retrospective method, in which case the cumulative effect of applying the standard would be recognized at the date of initial application. The Company has not yet selected a transition method. We are currently evaluating the requirements of this ASU and have not yet determined its impact on our consolidated financial statements.
| Item 7A. | Quantitative and Qualitative Disclosures about Market Risk |
Market Risk and Sensitivity Analysis
Our primary exposures to market risks include fluctuations in interest rates on our Term Loan Facility and investment portfolio, as well as fluctuations in foreign currency exchange rates.
Foreign Exchange Rate Risk
We mainly enter into forward exchange contracts to reduce currency exposure arising from intercompany sales of inventory. We also enter into forward exchange contracts to reduce foreign exchange risks arising from the change in fair value of certain foreign currency denominated assets and liabilities.
We had forward exchange contracts with notional amounts totaling $120.2 million outstanding and a net fair value asset of $2.4 million at December 31, 2016. We had forward exchange contracts with notional amounts totaling $90.0 million outstanding and a net fair value asset of $1.2 million at December 31, 2015. The potential fair value loss for a hypothetical 10% adverse change in the currency exchange rate on our forward exchange contracts at December 31, 2016 and 2015 would be immaterial.
Interest Rate Risk
We hold our cash, cash equivalents and short-term investments for working capital purposes. Some of the securities we invest in are subject to market risk. This means that a change in prevailing interest rates may cause the principal amount of such investments to fluctuate. To minimize this risk, we maintain our portfolio of cash, cash equivalents and short-term investments in a variety of securities including money market funds and
55
Table of Contents
government debt securities. Due to the short-term nature of these instruments, we believe that we do not have any material exposure to changes in the fair value of our investment portfolio as a result of changes in interest rates. Declines in interest rates, however, would reduce future interest income. The effect of a hypothetical 10% increase or decrease in overall interest rates would not have had a material impact on our operating results or the total fair value of the portfolio.
We are exposed to market risks related to fluctuations in interest rates related to our Term Loan Facility. As of December 31, 2016, we owed $607.0 million with $335.0 million at a fixed interest rate of 4.7% and $272.0 at a variable interest rate of 3.50%. We performed a sensitivity analysis on the outstanding portion of our debt obligations as of December 31, 2016. Should the current average rate increase or decrease by 10%, the resulting annual increase or decrease to interest expense would be approximately $1.0 million as of December 31, 2016.
From time to time, we have outstanding lines of credit and short-term borrowings with variable interest rates, primarily denominated in Japanese Yen. As of December 31, 2016, $4.7 million was outstanding under these arrangements. These lines of credit have a base interest rate of 1.25% plus a Japanese Yen overnight LIBOR rate. A 10% change in interest rates would not have had a material impact on our operating results.
56
Table of Contents
| Item 8. | Financial Statements and Supplementary Data |
Report of Independent Registered Public Accounting Firm
To the Board of Directors and Stockholders of
MKS Instruments, Inc.
In our opinion, the consolidated financial statements listed in the index appearing under Item 15(a) (1) present fairly, in all material respects, the financial position of MKS Instruments, Inc. and its subsidiaries as of December 31, 2016 and 2015, and the results of their operations and their cash flows for each of the three years in the period ended December 31, 2016 in conformity with accounting principles generally accepted in the United States of America. In addition, in our opinion, the financial statement schedule listed in the index appearing under Item 15(a)(2) presents fairly, in all material respects, the information set forth therein when read in conjunction with the related consolidated financial statements. Also in our opinion, the Company maintained, in all material respects, effective internal control over financial reporting as of December 31, 2016, based on criteria established in Internal Control—Integrated Framework (2013) issued by the Committee of Sponsoring Organizations of the Treadway Commission (COSO). The Company’s management is responsible for these financial statements and financial statement schedule, for maintaining effective internal control over financial reporting and for its assessment of the effectiveness of internal control over financial reporting, included in Management’s Report on Internal Control over Financial Reporting appearing under Item 9A. Our responsibility is to express opinions on these financial statements, on the financial statement schedule, and on the Company’s internal control over financial reporting based on our integrated audits. We conducted our audits in accordance with the standards of the Public Company Accounting Oversight Board (United States). Those standards require that we plan and perform the audits to obtain reasonable assurance about whether the financial statements are free of material misstatement and whether effective internal control over financial reporting was maintained in all material respects. Our audits of the financial statements included examining, on a test basis, evidence supporting the amounts and disclosures in the financial statements, assessing the accounting principles used and significant estimates made by management, and evaluating the overall financial statement presentation. Our audit of internal control over financial reporting included obtaining an understanding of internal control over financial reporting, assessing the risk that a material weakness exists, and testing and evaluating the design and operating effectiveness of internal control based on the assessed risk. Our audits also included performing such other procedures as we considered necessary in the circumstances. We believe that our audits provide a reasonable basis for our opinions.
A company’s internal control over financial reporting is a process designed to provide reasonable assurance regarding the reliability of financial reporting and the preparation of financial statements for external purposes in accordance with generally accepted accounting principles. A company’s internal control over financial reporting includes those policies and procedures that (i) pertain to the maintenance of records that, in reasonable detail, accurately and fairly reflect the transactions and dispositions of the assets of the company; (ii) provide reasonable assurance that transactions are recorded as necessary to permit preparation of financial statements in accordance with generally accepted accounting principles, and that receipts and expenditures of the company are being made only in accordance with authorizations of management and directors of the company; and (iii) provide reasonable assurance regarding prevention or timely detection of unauthorized acquisition, use, or disposition of the company’s assets that could have a material effect on the financial statements.
Because of its inherent limitations, internal control over financial reporting may not prevent or detect misstatements. Also, projections of any evaluation of effectiveness to future periods are subject to the risk that controls may become inadequate because of changes in conditions, or that the degree of compliance with the policies or procedures may deteriorate.
57
Table of Contents
As described in Management’s Report on Internal Control over Financial Reporting, management has excluded Newport Corporation from its assessment of internal control over financial reporting as of December 31, 2016 because it was acquired by the Company in a purchase business combination during 2016. We have also excluded Newport Corporation from our audit of internal control over financial reporting. Newport Corporation is a wholly-owned subsidiary whose total assets and total revenues represent 22% and 33%, respectively, of the related consolidated financial statement amounts as of and for the year ended December 31, 2016.
/s/ PricewaterhouseCoopers LLP
Boston, Massachusetts
March 1, 2017
58
Table of Contents
MKS Instruments, Inc.
| December 31, | ||||||||
| 2016 | 2015 | |||||||
| (in thousands, except share data) | ||||||||
| ASSETS | ||||||||
| Current assets: |
||||||||
| Cash and cash equivalents |
$ | 228,623 | $ | 227,574 | ||||
| Restricted cash |
5,287 | — | ||||||
| Short-term investments |
189,463 | 430,663 | ||||||
| Trade accounts receivable, net of allowance for doubtful accounts of $3,909 and $1,760 at December 31, 2016 and 2015, respectively |
248,757 | 101,883 | ||||||
| Inventories |
275,869 | 152,631 | ||||||
| Income tax receivable |
4,604 | 8,682 | ||||||
| Other current assets |
46,166 | 18,078 | ||||||
|
|
|
|
|
|||||
| Total current assets |
998,769 | 939,511 | ||||||
| Property, plant and equipment, net |
174,559 | 68,856 | ||||||
| Goodwill |
588,585 | 199,703 | ||||||
| Intangible assets, net |
408,004 | 44,027 | ||||||
| Long-term investments |
9,858 | — | ||||||
| Other assets |
32,467 | 21,250 | ||||||
|
|
|
|
|
|||||
| Total assets |
$ | 2,212,242 | $ | 1,273,347 | ||||
|
|
|
|
|
|||||
| LIABILITIES AND STOCKHOLDERS’ EQUITY | ||||||||
| Current liabilities: |
||||||||
| Short-term borrowings and current portion of long-term debt |
$ | 10,993 | $ | — | ||||
| Accounts payable |
69,337 | 23,177 | ||||||
| Accrued compensation |
67,728 | 28,424 | ||||||
| Income taxes payable |
22,794 | 4,024 | ||||||
| Deferred revenue |
14,463 | 7,189 | ||||||
| Other current liabilities |
51,985 | 28,170 | ||||||
|
|
|
|
|
|||||
| Total current liabilities |
237,300 | 90,984 | ||||||
| Long-term debt, net |
601,229 | — | ||||||
| Non-current deferred taxes |
66,446 | 2,655 | ||||||
| Non-current accrued compensation |
44,714 | 13,395 | ||||||
| Other liabilities |
20,761 | 5,432 | ||||||
|
|
|
|
|
|||||
| Total liabilities |
970,450 | 112,466 | ||||||
| Commitments and contingencies (Note 23) |
||||||||
| Stockholders’ equity: |
||||||||
| Preferred stock, $0.01 par value, 2,000,000 shares authorized; none issued and outstanding |
— | — | ||||||
| Common stock, no par value, 200,000,000 shares authorized; 53,672,861 and 53,199,720 shares issued and outstanding at December 31, 2016 and 2015, respectively |
113 | 113 | ||||||
| Additional paid-in capital |
777,482 | 744,725 | ||||||
| Retained earnings |
494,744 | 427,214 | ||||||
| Accumulated other comprehensive loss |
(30,547 | ) | (11,171 | ) | ||||
|
|
|
|
|
|||||
| Total stockholders’ equity |
1,241,792 | 1,160,881 | ||||||
|
|
|
|
|
|||||
| Total liabilities and stockholders’ equity |
$ | 2,212,242 | $ | 1,273,347 | ||||
|
|
|
|
|
|||||
The accompanying notes are an integral part of the consolidated financial statements.
59
Table of Contents
MKS Instruments, Inc.
Consolidated Statements of Operations and Comprehensive Income
| Years Ended December 31, | ||||||||||||
| 2016 | 2015 | 2014 | ||||||||||
| (in thousands, except per share data) | ||||||||||||
| Net Revenues: |
||||||||||||
| Products |
$ | 1,134,013 | $ | 697,104 | $ | 673,819 | ||||||
| Services |
161,329 | 116,420 | 107,050 | |||||||||
|
|
|
|
|
|
|
|||||||
| Total net revenues |
1,295,342 | 813,524 | 780,869 | |||||||||
| Cost of revenues: |
||||||||||||
| Cost of products |
627,850 | 373,764 | 374,200 | |||||||||
| Cost of service |
101,873 | 76,888 | 68,903 | |||||||||
|
|
|
|
|
|
|
|||||||
| Total cost of revenues (exclusive of amortization shown separately below) |
729,723 | 450,652 | 443,103 | |||||||||
| Gross profit |
565,619 | 362,872 | 337,766 | |||||||||
| Research and development |
110,579 | 68,305 | 62,888 | |||||||||
| Selling, general and administrative |
229,171 | 129,087 | 131,828 | |||||||||
| Acquisition and integration costs |
27,279 | 30 | 499 | |||||||||
| Restructuring |
642 | 2,074 | 2,464 | |||||||||
| Asset impairment |
5,000 | — | — | |||||||||
| Amortization of intangible assets |
35,681 | 6,764 | 4,945 | |||||||||
|
|
|
|
|
|
|
|||||||
| Income from operations |
157,267 | 156,612 | 135,142 | |||||||||
| Interest income |
2,560 | 2,999 | 1,323 | |||||||||
| Interest expense |
30,611 | 143 | 72 | |||||||||
| Other expense, net |
1,239 | — | — | |||||||||
|
|
|
|
|
|
|
|||||||
| Income before income taxes |
127,977 | 159,468 | 136,393 | |||||||||
| Provision for income taxes |
23,168 | 37,171 | 20,615 | |||||||||
|
|
|
|
|
|
|
|||||||
| Net income |
$ | 104,809 | $ | 122,297 | $ | 115,778 | ||||||
|
|
|
|
|
|
|
|||||||
| Other comprehensive income: |
||||||||||||
| Changes in value of financial instruments designated as cash flow hedges, net of tax expense (benefit)(1) |
$ | 3,380 | $ | (469 | ) | $ | 1,210 | |||||
| Foreign currency translation adjustments, net of tax of $0 for 2016, 2015 and 2014 |
(22,713 | ) | (8,301 | ) | (14,707 | ) | ||||||
| Unrecognized pension loss, net of tax benefit(2) |
(266 | ) | — | — | ||||||||
| Unrealized gain (loss) on investments, net of tax expense (benefit)(3) |
223 | (317 | ) | (460 | ) | |||||||
|
|
|
|
|
|
|
|||||||
| Total comprehensive income |
$ | 85,433 | $ | 113,210 | $ | 101,821 | ||||||
|
|
|
|
|
|
|
|||||||
| Net income per share: |
||||||||||||
| Basic |
$ | 1.96 | $ | 2.30 | $ | 2.17 | ||||||
|
|
|
|
|
|
|
|||||||
| Diluted |
$ | 1.94 | $ | 2.28 | $ | 2.16 | ||||||
|
|
|
|
|
|
|
|||||||
| Cash dividends paid per common share |
$ | 0.68 | $ | 0.675 | $ | 0.655 | ||||||
|
|
|
|
|
|
|
|||||||
| Weighted average common shares outstanding: |
||||||||||||
| Basic |
53,472 | 53,282 | 53,232 | |||||||||
|
|
|
|
|
|
|
|||||||
| Diluted |
54,051 | 53,560 | 53,515 | |||||||||
|
|
|
|
|
|
|
|||||||
| (1) | Tax expense (benefit) was $2,535, $(85) and $144 for the years ended December 31, 2016, 2015 and 2014, respectively. |
| (2) | Tax benefit was $(199) for the year ended December 31, 2016 and $0 for 2015 and 2014. |
| (3) | Tax expense (benefit) was $167, $(58), and $(55) for the years ended December 31, 2016, 2015 and 2014, respectively. |
The accompanying notes are an integral part of the consolidated financial statements.
60
Table of Contents
MKS Instruments, Inc.
Consolidated Statements of Stockholders’ Equity
| Common Stock | Additional Paid-In Capital |
Retained Earnings |
Accumulated Other Comprehensive Income/(Loss) |
Total Stockholders’ Equity |
||||||||||||||||||||
| (in thousands, except share data) | Shares | Amount | ||||||||||||||||||||||
| Balance at December 31, 2013 |
53,363,450 | $ | 113 | $ | 730,571 | $ | 278,966 | $ | 11,873 | $ | 1,021,523 | |||||||||||||
| Net issuance under stock-based plans |
519,128 | 2,492 | 2,492 | |||||||||||||||||||||
| Stock-based compensation |
11,315 | 11,315 | ||||||||||||||||||||||
| Tax effect from stock-based plans |
331 | 331 | ||||||||||||||||||||||
| Stock repurchase |
(727,912 | ) | (9,977 | ) | (10,832 | ) | (20,809 | ) | ||||||||||||||||
| Cash dividend |
(34,851 | ) | (34,851 | ) | ||||||||||||||||||||
| Comprehensive income (net of tax): |
||||||||||||||||||||||||
| Net income |
115,778 | 115,778 | ||||||||||||||||||||||
| Other comprehensive loss |
(13,957 | ) | (13,957 | ) | ||||||||||||||||||||
|
|
|
|
|
|
|
|
|
|
|
|
|
|||||||||||||
| Balance at December 31, 2014 |
53,154,666 | $ | 113 | $ | 734,732 | $ | 349,061 | $ | (2,084 | ) | $ | 1,081,822 | ||||||||||||
| Net issuance under stock-based plans |
414,187 | 1,262 | 1,262 | |||||||||||||||||||||
| Stock-based compensation |
13,013 | 13,013 | ||||||||||||||||||||||
| Tax effect from stock-based plans |
837 | 837 | ||||||||||||||||||||||
| Stock repurchase |
(369,133 | ) | (5,119 | ) | (8,175 | ) | (13,294 | ) | ||||||||||||||||
| Cash dividend |
(35,969 | ) | (35,969 | ) | ||||||||||||||||||||
| Comprehensive income (net of tax): |
||||||||||||||||||||||||
| Net income |
122,297 | 122,297 | ||||||||||||||||||||||
| Other comprehensive loss |
(9,087 | ) | (9,087 | ) | ||||||||||||||||||||
|
|
|
|
|
|
|
|
|
|
|
|
|
|||||||||||||
| Balance at December 31, 2015 |
53,199,720 | $ | 113 | $ | 744,725 | $ | 427,214 | $ | (11,171 | ) | $ | 1,160,881 | ||||||||||||
| Net issuance under stock-based plans |
517,939 | 6,902 | 6,902 | |||||||||||||||||||||
| Stock-based compensation |
25,228 | 25,228 | ||||||||||||||||||||||
| Tax effect from stock-based plans |
1,254 | 1,254 | ||||||||||||||||||||||
| Stock repurchase |
(44,798 | ) | (627 | ) | (918 | ) | (1,545 | ) | ||||||||||||||||
| Cash dividend |
(36,361 | ) | (36,361 | ) | ||||||||||||||||||||
| Comprehensive income (net of tax): |
||||||||||||||||||||||||
| Net income |
104,809 | 104,809 | ||||||||||||||||||||||
| Other comprehensive loss |
(19,376 | ) | (19,376 | ) | ||||||||||||||||||||
|
|
|
|
|
|
|
|
|
|
|
|
|
|||||||||||||
| Balance at December 31, 2016 |
53,672,861 | $ | 113 | $ | 777,482 | $ | 494,744 | $ | (30,547 | ) | $ | 1,241,792 | ||||||||||||
|
|
|
|
|
|
|
|
|
|
|
|
|
|||||||||||||
The accompanying notes are an integral part of the consolidated financial statements.
61
Table of Contents
MKS Instruments, Inc.
Consolidated Statements of Cash Flows
| Years Ended December 31, | ||||||||||||
| 2016 | 2015 | 2014 | ||||||||||
| (in thousands) | ||||||||||||
| Cash flows from operating activities: |
||||||||||||
| Net income |
$ | 104,809 | $ | 122,297 | $ | 115,778 | ||||||
| Adjustments to reconcile net income to net cash provided by operating activities: |
||||||||||||
| Depreciation and amortization |
65,926 | 22,103 | 20,514 | |||||||||
| Amortization of inventory step-up adjustment to fair value |
15,090 | — | 2,179 | |||||||||
| Amortization of debt issuance cost and original issue discount |
9,265 | — | — | |||||||||
| Stock-based compensation |
25,228 | 13,013 | 11,315 | |||||||||
| Provision for excess and obsolete inventory |
16,039 | 13,602 | 12,131 | |||||||||
| Provision for doubtful accounts |
1,109 | (255 | ) | 668 | ||||||||
| Deferred income taxes |
(38,822 | ) | 410 | 5,264 | ||||||||
| Excess tax benefits from stock-based compensation |
(1,468 | ) | (904 | ) | (447 | ) | ||||||
| Impairment of investment |
5,000 | — | — | |||||||||
| Other |
256 | 275 | 139 | |||||||||
| Changes in operating assets and liabilities: |
||||||||||||
| Trade accounts receivable |
(58,111 | ) | 2,334 | 6,103 | ||||||||
| Inventories |
(13,798 | ) | (14,501 | ) | (23,089 | ) | ||||||
| Income taxes |
30,914 | (8,462 | ) | (32,744 | ) | |||||||
| Other current and non-current assets |
(12,165 | ) | (1,526 | ) | (325 | ) | ||||||
| Accrued compensation |
10,965 | 3,335 | (13,563 | ) | ||||||||
| Other current and non-current liabilities |
3,681 | (2,797 | ) | 3,469 | ||||||||
| Accounts payable |
16,180 | (10,629 | ) | (5,478 | ) | |||||||
|
|
|
|
|
|
|
|||||||
| Net cash provided by operating activities |
180,098 | 138,295 | 101,914 | |||||||||
|
|
|
|
|
|
|
|||||||
| Cash flows from investing activities: |
||||||||||||
| Acquisition of business, net of cash acquired |
(939,591 | ) | (9,910 | ) | (86,950 | ) | ||||||
| Purchases of investments |
(268,458 | ) | (385,999 | ) | (360,813 | ) | ||||||
| Maturities of investments |
160,917 | 179,285 | 249,359 | |||||||||
| Sales of investments |
338,996 | 61,659 | 185,186 | |||||||||
| Purchases of property, plant and equipment |
(19,123 | ) | (12,414 | ) | (13,183 | ) | ||||||
| Other |
273 | 8 | 1,593 | |||||||||
|
|
|
|
|
|
|
|||||||
| Net cash used in investing activities |
(726,986 | ) | (167,371 | ) | (24,808 | ) | ||||||
|
|
|
|
|
|
|
|||||||
| Cash flows from financing activities: |
||||||||||||
| Restricted cash |
(5,860 | ) | — | — | ||||||||
| Proceeds from short-term borrowings |
18,964 | — | — | |||||||||
| Payments on short-term borrowings |
(11,742 | ) | — | — | ||||||||
| Net proceeds from long-term borrowings |
744,653 | — | — | |||||||||
| Payments of long-term borrowings |
(153,395 | ) | — | — | ||||||||
| Repurchases of common stock |
(1,545 | ) | (13,294 | ) | (20,809 | ) | ||||||
| Net proceeds related to employee stock awards |
(1,922 | ) | 1,262 | 2,492 | ||||||||
| Dividend payments |
(36,361 | ) | (35,969 | ) | (34,851 | ) | ||||||
| Excess tax benefit from stock-based compensation |
1,468 | 904 | 447 | |||||||||
|
|
|
|
|
|
|
|||||||
| Net cash provided by (used in) financing activities |
554,260 | (47,097 | ) | (52,721 | ) | |||||||
|
|
|
|
|
|
|
|||||||
| Effect of exchange rate changes on cash and cash equivalents |
(6,323 | ) | (1,690 | ) | (7,850 | ) | ||||||
|
|
|
|
|
|
|
|||||||
| Increase (decrease) in cash and cash equivalents |
1,049 | (77,863 | ) | 16,535 | ||||||||
| Cash and cash equivalents at beginning of year |
227,574 | 305,437 | 288,902 | |||||||||
|
|
|
|
|
|
|
|||||||
| Cash and cash equivalents at end of year |
$ | 228,623 | $ | 227,574 | $ | 305,437 | ||||||
|
|
|
|
|
|
|
|||||||
| Supplemental disclosure of cash flow information: |
||||||||||||
| Cash paid during the period for: |
||||||||||||
| Interest |
$ | 20,839 | $ | 34 | $ | 44 | ||||||
| Income taxes |
$ | 44,967 | $ | 43,239 | $ | 47,948 | ||||||
The accompanying notes are an integral part of the consolidated financial statements.
62
Table of Contents
MKS INSTRUMENTS, INC.
NOTES TO CONSOLIDATED FINANCIAL STATEMENTS
(in thousands, except share and per share data)
| 1) | Business Description |
MKS Instruments, Inc. (“MKS” or the “Company”) was founded in 1961 and is a global provider of instruments, subsystems and process control solutions that measure, control, power, deliver, monitor and analyze critical parameters of advanced manufacturing processes to improve process performance and productivity. The Company’s products are derived from its core competencies in automation and control, gas composition analysis, lasers, materials delivery, optics, photonics, pressure, power, reactive gas and vacuum. The primary served markets are manufacturers of capital equipment for semiconductor manufacturing, electronic thin films, life and health sciences, process and industrial technologies, as well as research and defense. The Company groups its products into seven product groups based upon the similarity of the product function, type of product and manufacturing processes. These seven groups are: Analytical and Controls Solutions Products; Materials Delivery Solutions Products; Power, Plasma and Reactive Gas Solutions Products; Pressure and Vacuum Measurement Products; Photonics Products; Optics Products; and Lasers Products.
The Company has two reportable segments: Vacuum & Analysis and Light & Motion.
| 2) | Basis of Presentation |
The consolidated financial statements include the accounts of MKS Instruments, Inc. and its wholly owned subsidiaries. All intercompany accounts and transactions have been eliminated in consolidation.
Use of Estimates
The consolidated financial statements have been prepared in accordance with accounting principles generally accepted in the United States of America (“U.S. GAAP”). The preparation of these financial statements requires management to make estimates and assumptions that affect the reported amounts of assets and liabilities and the disclosure of contingent liabilities at the date of the financial statements and the reported amounts of revenues and expenses during the reporting period. On an on-going basis, management evaluates its estimates and judgments, including those related to revenue recognition and allowance for doubtful accounts, inventory valuation, warranty costs, stock-based compensation, intangible assets, goodwill, other long-lived assets, in process research and development and other acquisition expenses and income taxes. Management bases its estimates and judgments on historical experience and on various other factors that are believed to be reasonable under the circumstances, the results of which form the basis for making judgments about the carrying values of assets and liabilities that are not readily apparent from other sources. Actual results may differ from these estimates under different assumptions or conditions.
| 3) | Summary of Significant Accounting Policies |
Revenue Recognition and Accounts Receivable Allowances
Revenue from product sales is recorded upon transfer of title and risk of loss to the customer provided that there is evidence of an arrangement, the sales price is fixed or determinable, and collection of the related receivable is reasonably assured. In most transactions, the Company has no obligations to customers after the date products are shipped other than pursuant to warranty obligations. In some instances, the Company provides installation, training, support and services to customers after the product has been shipped. For those revenue arrangements with multiple deliverables, the Company allocates revenue to each element based upon its relative selling price using vendor-specific objective evidence (“VSOE”), or third-party evidence (“TPE”) or based upon the relative selling price using estimated prices if VSOE or TPE does not exist. The Company then recognizes
63
Table of Contents
MKS INSTRUMENTS, INC.
NOTES TO CONSOLIDATED FINANCIAL STATEMENTS — (continued)
(in thousands, except share and per share data)
revenue on each deliverable in accordance with its policies for product and service revenue recognition. The Company provides for the estimated costs to fulfill customer warranty obligations upon the recognition of the related revenue. Shipping and handling fees, if any, billed to customers are recognized as revenue. The related shipping and handling costs are recognized in cost of revenues. Accounts receivable allowances include sales returns and bad debt allowances. The Company monitors and tracks the amount of product returns and reduces revenue at the time of shipment for the estimated amount of such future returns, based on historical experience. The Company makes estimates evaluating its allowance for doubtful accounts. The Company continuously monitors collections and payments from its customers and maintains a provision for estimated credit losses based upon its historical experience and any specific customer collection issues that it has identified.
Research and Development
Research and development costs are expensed as incurred and consist mainly of compensation-related expenses and project materials. The Company’s research and development efforts include numerous projects, which generally have a duration of 3 to 30 months. Acquired in-process research and development (“IPR&D”) expenses, which are capitalized at fair value as an intangible asset until the related project is completed, are then amortized over the estimated useful life of the product. The Company monitors projects and, if they are abandoned, the Company immediately writes them off.
Advertising Costs
Advertising costs are expensed as incurred and were $1,137 in 2016 and immaterial in 2015 and 2014. The increase in 2016 compared to 2015, is due to the Newport Merger which accounted for $992 of the increase.
Stock-Based Compensation
The accounting for share-based compensation expense requires the measurement and recognition of compensation expense for all share-based payment awards made to employees and directors based on estimated fair values. For restricted stock units (“RSUs”), the fair value is the fair value on the date of grant that normally vests over a three year period. The Company also provides employees the opportunity to purchase shares through an employee stock purchase plan. For shares issued under its employee stock purchase plan, the Company has estimated the fair value on the date of grant using the Black Scholes pricing model, which is affected by the Company’s stock price as well as assumptions regarding a number of complex and subjective variables. These variables include the Company’s expected stock price volatility over the term of the awards, expected life, risk-free interest rate and expected dividends. The Company is also required to estimate forfeitures at the time of grant and revise those estimates in subsequent periods if actual forfeitures differ from those estimates.
Management determined that blended volatility, a combination of historical and implied volatility, is more reflective of market conditions and a better indicator of expected volatility than historical or implied volatility alone. The assumptions used in calculating the fair value of share-based payment awards represent management’s best estimates, but these estimates involve inherent uncertainties and the application of management judgment. As a result, if factors change and the Company uses different assumptions, its stock-based compensation expense could be materially different in the future.
Accumulated Other Comprehensive Income
For foreign subsidiaries where the functional currency is the local currency, assets and liabilities are translated into U.S. dollars at the current exchange rate on the balance sheet date. Revenue and expenses are
64
Table of Contents
MKS INSTRUMENTS, INC.
NOTES TO CONSOLIDATED FINANCIAL STATEMENTS — (continued)
(in thousands, except share and per share data)
translated at average rates of exchange prevailing during the year. Translation adjustments resulting from this process are recorded to Accumulated Other Comprehensive Income (“OCI”). Unrealized gains and losses on securities classified as available-for-sale and unrecognized pension gains and losses are included in OCI in consolidated stockholders’ equity. For derivative instruments designated as cash-flow hedges, the effective portion of the derivative’s gain (loss) is initially reported as a component of OCI and is subsequently recognized in earnings when the hedged exposure is recognized in earnings.
Net Income Per Share
Basic net income per share is based on the weighted average number of common shares outstanding, and diluted net income per share is based on the weighted average number of common shares outstanding and all potential dilutive common equivalent shares outstanding. The dilutive effect of options is determined under the treasury stock method using the average market price for the period. Common equivalent shares are included in the per share calculations when the effect of their inclusion would be dilutive.
Cash and Cash Equivalents and Investments
All highly liquid investments with a maturity date of three months or less at the date of purchase are considered to be cash equivalents. The appropriate classification of investments in securities is determined at the time of purchase. Debt securities that the Company does not have the intent and ability to hold to maturity are classified as “available-for-sale” and are carried at fair value.
Effective December 31, 2015, the Company changed the method of classification of its investments previously classified as long-term investments to short-term investments within current assets and the balances for the prior year have been reclassified to conform to the current year’s presentation. This new method classifies these securities as current or long-term based on the nature of the securities and the availability for use in current operations while the prior classification was based on the maturity dates of the investments. The Company believes this method is preferable because it is more reflective of the Company’s assessment of its overall liquidity position.
The Company reviews its investment portfolio on a quarterly basis to identify and evaluate individual investments that have indications of possible impairment. The factors considered in determining whether a loss is other-than-temporary include: the length of time and extent to which fair market value has been below the cost basis, the financial condition and near-term prospects of the issuer, credit quality, and the Company’s ability to hold the investment for a period of time sufficient to allow for any anticipated recovery in fair value.
Concentrations of Credit Risk
The Company’s significant concentrations of credit risk consist principally of cash and cash equivalents, investments, forward exchange contracts and trade accounts receivable. The Company maintains cash and cash equivalents with financial institutions including some banks with which it had borrowings. The Company maintains investments primarily in U.S. Treasury and government agency securities and corporate debt securities. The Company enters into forward currency contracts with high credit-quality financial institutions in order to minimize credit risk exposure. The Company’s customers are primarily concentrated in the semiconductor industry, and a limited number of customers account for a significant portion of the Company’s revenues. The Company regularly monitors the creditworthiness of its customers and believes it has adequately provided for potential credit loss exposures. Credit is extended for all customers based primarily on financial condition, and collateral is not required.
65
Table of Contents
MKS INSTRUMENTS, INC.
NOTES TO CONSOLIDATED FINANCIAL STATEMENTS — (continued)
(in thousands, except share and per share data)
The Company had one customer comprising 14%, 18% and 19% of net revenues for 2016, 2015 and 2014, respectively, and another customer comprising 11%, 13% and 13% of net revenues for 2016, 2015 and 2014, respectively. During the years 2016, 2015 and 2014, approximately 58%, 69% and 70% of the Company’s net revenues, respectively, were from sales to semiconductor capital equipment manufacturers and semiconductor device manufacturers. One customer comprised 10% or more of the Company’s accounts receivable balance as of December 31, 2016.
Inventories
Inventories are stated at the lower of cost or market, cost being determined using a standard costing system which approximates cost based on a first-in, first-out method. The Company regularly reviews inventory quantities on hand and records a provision to write-down excess and obsolete inventory to its estimated net realizable value, if less than cost, based primarily on its estimated forecast of product demand.
Property, Plant and Equipment
Property, plant and equipment are stated at cost. Expenditures for major renewals and betterments that extend the useful lives of property, plant and equipment are capitalized. Expenditures for maintenance and repairs are charged to expense as incurred. When assets are sold or otherwise disposed of, the cost and related accumulated depreciation are eliminated from the accounts and any resulting gain or loss is recognized in earnings.
Depreciation is provided on the straight-line method over the estimated useful lives of twenty to thirty-one and one-half years for buildings and three to ten years for machinery and equipment, furniture and fixtures and office equipment, which includes enterprise resource planning software. Leasehold improvements are amortized over the shorter of the lease term or the estimated useful life of the leased asset.
Intangible Assets
Intangible assets resulting from the acquisitions of businesses are estimated by management based on the fair value of assets acquired. These include acquired customer lists, technology, patents, trade names, covenants not to compete and IPR&D. Intangible assets are amortized from one to twelve years on a straight-line basis which represents the estimated periods of benefit and the expected pattern of consumption.
Goodwill
Goodwill is the amount by which the cost of acquired net assets exceeded the fair value of those net assets on the date of acquisition. The Company allocates goodwill to reporting units at the time of acquisition or when there is a change in the reporting structure and bases that allocation on which reporting units will benefit from the acquired assets and liabilities. Reporting units are defined as operating segments or one level below an operating segment, referred to as a component. In 2015, the Company reallocated its goodwill based upon a change in its reporting structure. There was no goodwill impairment as a result of this change in reporting units. The Company assesses goodwill for impairment on an annual basis as of October 31 or more frequently when events and circumstances occur indicating that the recorded goodwill may be impaired.
The estimated fair value of the Company’s reporting units were based on discounted cash flow models derived from internal earnings and internal and external market forecasts. Determining fair value requires the
66
Table of Contents
MKS INSTRUMENTS, INC.
NOTES TO CONSOLIDATED FINANCIAL STATEMENTS — (continued)
(in thousands, except share and per share data)
exercise of significant judgment, including judgments about appropriate discount rates, perpetual growth rates and the amount and timing of expected future cash flows. Discount rates are based on a weighted average cost of capital (“WACC”), which represents the average rate a business must pay its providers of debt and equity. The WACC used to test goodwill is derived from a group of comparable companies. Assumptions in estimating future cash flows are subject to a high degree of judgment and complexity. The Company makes every effort to forecast these future cash flows as accurately as possible with the information available at the time the forecast is developed.
The Company has the option of first assessing qualitative factors to determine whether it is necessary to perform the current two-step impairment test or the Company can perform the two-step impairment test without performing the qualitative assessment. For the reporting units that did not experience any significant adverse changes in their business or reporting structures or any other adverse changes, and the reporting unit’s fair value substantially exceeded its amount from the prior year assessment, the Company performed the qualitative “Step 0” assessment. In performing the qualitative Step 0 assessment, the Company considered certain events and circumstances specific to the reporting unit and to the entity as a whole, such as macroeconomic conditions, industry and market considerations, overall financial performance and cost factors when evaluating whether it is more likely than not that the fair value of the reporting unit is less than its carrying amount. For the remaining reporting units that did not meet these criteria, the Company performed the two-step goodwill impairment test. Under the two-step goodwill impairment test, the Company compared the fair value of each reporting unit to its respective carrying amount, including goodwill. If the fair value of the reporting unit exceeds the fair value, the second step of the goodwill impairment test must be completed to measure the amount of impairment loss, if any. The second step compares the implied fair value of goodwill with the carrying value of goodwill. The implied fair value is determined by allocating the fair value of the reporting unit to all of the assets and liabilities of that unit, the excess of the fair value of the amounts assigned to its assets and liabilities is the implied fair value of goodwill. If the implied fair value of goodwill is less than the carrying amount of goodwill, an impairment loss is recognized equal to the difference.
As of October 31, 2016, the Company performed its annual impairment assessment of goodwill and determined that it is more likely than not that the fair values of the reporting units exceed their carrying amount.
Impairment of Long-Lived Assets
The Company evaluates the recoverability of its long-lived assets whenever events and changes in circumstances indicate that the carrying amount of an asset may not be fully recoverable. This periodic review may result in an adjustment of estimated depreciable lives or asset impairment. When indicators of impairment are present, the carrying values of the asset are evaluated in relation to their operating performance and future undiscounted cash flows of the underlying business. If the future undiscounted cash flows are less than their carrying value, impairment exists. The impairment is measured as the difference between the carrying value and the fair value of the underlying asset. Fair values are based on estimates of market prices and assumptions concerning the amount and timing of estimated future cash flows and assumed discount rates, reflecting varying degrees of perceived risk.
Foreign Exchange
The functional currency of the majority of the Company’s foreign subsidiaries is the applicable local currency. For those subsidiaries, assets and liabilities are translated to U.S. dollars at year-end exchange rates. Income and expense accounts are translated at the average exchange rates prevailing during the year. The
67
Table of Contents
MKS INSTRUMENTS, INC.
NOTES TO CONSOLIDATED FINANCIAL STATEMENTS — (continued)
(in thousands, except share and per share data)
resulting translation adjustments are included in accumulated other comprehensive income (loss) in consolidated stockholders’ equity. Foreign exchange transaction gains and losses are classified in other income/expense in the statement of Foreign exchange transaction gains and losses, which arise from transaction activity, are reflected in selling, general and administrative expenses in the statement of operations.
Net foreign exchange losses resulting from re-measurement were $2,823 and are included in other expense (income) for the year ended December 31, 2016. Net foreign exchange losses resulting from re-measurement were $1,388 and $314 for the years ended December 31, 2015 and 2014, respectively and were included in selling, general and administrative expenses. These amounts do not reflect the corresponding gain (loss) from foreign exchange contracts. See Note 7 “Derivatives” regarding foreign exchange contracts.
In 2016, we reclassified the impact of foreign exchange losses (gains), from selling, general and administrative expenses to other expense (income), net.
Income Taxes
The Company records income taxes using the asset and liability method. Deferred income tax assets and liabilities are recognized for the future tax consequences attributable to differences between the financial statement carrying amounts of existing assets and liabilities and their respective income tax bases, and also for operating loss and tax credit carry-forwards. On a quarterly basis, the Company evaluates both the positive and negative evidence that affects the realizability of net deferred tax assets and assesses the need for a valuation allowance. The future benefit to be derived from its deferred tax assets is dependent upon its ability to generate sufficient future taxable income in each jurisdiction of the right type to realize the assets. The Company records a valuation allowance to reduce its net deferred tax assets to the amount that is more likely than not to be realized. To the extent the Company establishes a valuation allowance an expense will be recorded as a component of the provision for income taxes on the statement of operations.
During 2014, the Company decreased its valuation allowance by $339 primarily related to the effective settlement of a foreign tax audit. As a result, the valuation allowance was $26,763 at December 31, 2014. During 2015, the Company decreased its valuation allowance by $20,636 primarily related to the expiration of U.S. capital loss carry-forwards. As a result, the valuation allowance was $6,127 at December 31, 2015. During 2016, the Company increased its valuation allowance by $6,400 primarily related to the addition of historical valuation allowances for Newport and its subsidiaries which were included as a result of the acquisition in April 2016. As a result, the valuation allowance was $12,527 at December 31, 2016.
Accounting for income taxes requires a two-step approach to recognize and measure uncertain tax positions. The first step is to evaluate the tax position for recognition by determining if, based on the technical merits, it is more likely than not that the position will be sustained upon audit, including resolutions of related appeals or litigation processes, if any. The second step is to measure the tax benefit as the largest amount that is more than 50% likely of being realized upon ultimate settlement. The Company re-evaluates these uncertain tax positions on a quarterly basis. This evaluation is based on factors including, but not limited to, changes in facts or circumstances, changes in tax law, effectively settled issues under audit and new audit activity. Any change in these factors could result in the recognition of a tax benefit or an additional charge to the tax provision.
| 4) | Recently Issued Accounting Pronouncements |
In January 2017, the Financial Accounting Standards Board (“FASB”) issued Accounting Standards Update (“ASU”) 2017-04, “Intangibles-Goodwill and Other (Topic 350).” This standard simplifies how an entity is
68
Table of Contents
MKS INSTRUMENTS, INC.
NOTES TO CONSOLIDATED FINANCIAL STATEMENTS — (continued)
(in thousands, except share and per share data)
required to test goodwill for impairment by eliminating Step 2 from the goodwill impairment test. Step 2 measures a goodwill impairment loss by comparing the implied fair value of a reporting unit’s goodwill with the carrying amount of goodwill. The provisions of this ASU are effective for annual or any interim goodwill impairment tests in fiscal years beginning after December 15, 2019. Early adoption is permitted for interim or annual goodwill impairment tests performed on testing dates after January 1, 2017. The Company is currently evaluating the requirements of this ASU and has not yet determined its impact on the Company’s consolidated financial statements.
In November 2016, the FASB issued ASU 2016-18, “Statement of Cash Flows (Topic 230)-Restricted Cash,” an amendment to ASU 2016-15. This standard requires that a statement of cash flows explain the change during the period in the total of cash, cash equivalents and amounts generally described as restricted cash and restricted cash equivalents. Therefore, amounts generally described as restricted cash and restricted cash equivalents should be included with cash and cash equivalents when reconciling the beginning-of-period and end-of-period total amounts shown on the statement of cash flows. Early adoption is permitted. The provisions of this ASU are effective for annual periods beginning after December 15, 2017, including interim periods within those fiscal years and should be applied at the time of adoption of ASU 2016-15. The Company does not expect adoption of this ASU to have a material impact on the Company’s consolidated financial statements.
In October 2016, the FASB issued ASU 2016-16, “Income Taxes (Topic 740)-Intra-Entity Transfer of Assets Other Than Inventory.” This standard requires that an entity recognize the income tax consequences of an intra-entity transfer of an asset other than inventory when the transfer occurs as opposed to when the assets have been sold to an outside party. The provisions of this ASU are effective for annual periods beginning after December 15, 2017, including interim periods within those fiscal years and early adoption is permitted. The Company is currently evaluating the requirements of this ASU and has not yet determined its impact on the Company’s consolidated financial statements.
In August 2016, the FASB issued ASU 2016-15, “Statement of Cash Flows (Topic 230)-Classification of Certain Cash Receipts and Cash Payments.” This standard addresses eight specific cash flow issues with the objective of addressing the diversity in practice in how certain cash receipts and cash payments are presented and classified in the statement of cash flows under Topic 230. The provisions of this ASU are effective for annual periods beginning after December 15, 2017, including interim periods within those fiscal years. The Company is currently evaluating the requirements of this ASU and has not yet determined its impact on the Company’s consolidated financial statements.
In May 2016, the FASB issued ASU 2016-12, “Revenue from Contracts with Customers (Topic 606)—Narrow-Scope Improvements and Practical Expedients,” an amendment to ASU 2014-09. This standard is intended to reduce the cost and complexity of applying the revenue recognition guidance and result in a more consistent application of the revenue recognition rules. The amendment clarifies the implementation guidance on collectability, non-cash consideration and the presentation of sales and other similar taxes, as well as transitional guidance related to completed contracts. The provisions of this ASU are effective for annual periods beginning after December 15, 2017, including interim periods within those fiscal years and should be applied at the time of the adoption of ASU 2014-09. Early adoption is not permitted. The Company is currently evaluating the requirements of this ASU and has not yet determined its impact on the Company’s consolidated financial statements.
In April 2016, the FASB issued ASU 2016-10, “Revenue from Contracts with Customers (Topic 606)—Identifying Performance Obligations and Licensing,” an amendment to ASU 2014-09. This standard clarifies the
69
Table of Contents
MKS INSTRUMENTS, INC.
NOTES TO CONSOLIDATED FINANCIAL STATEMENTS — (continued)
(in thousands, except share and per share data)
implementation guidance on identifying performance obligations and licensing. Specifically, the amendment reduces the cost and complexity of identifying promised goods or services and improves the guidance for determining whether promises are separately identifiable. The amendment also provides implementation guidance on determining whether an entity’s promise to grant a license provides a customer with either a right to use the entity’s intellectual property (which is satisfied at a point in time) or a right to access the entity’s intellectual property (which is satisfied over time). The provisions of this ASU are effective for annual periods beginning after December 15, 2017, including interim periods within those fiscal years and should be applied at the time of the adoption of ASU 2014-09. Early adoption is not permitted. The Company is currently evaluating the requirements of this ASU and has not yet determined its impact on the Company’s consolidated financial statements.
In March 2016, the FASB issued ASU 2016-08, “Revenue from Contracts with Customers (Topic 606)-Principal versus Agent,” an amendment to ASU 2014-09. This standard clarifies the application of principal versus agent guidance, identification of the units of accounting, as well as application of the control principle to certain types of arrangements within the scope of the guidance. The provisions of this ASU are effective for annual periods beginning after December 15, 2017, including interim periods within those fiscal years and should be applied at the time of the adoption of ASU 2014-09. Early adoption is not permitted. The Company is currently evaluating the requirements of this ASU and has not yet determined its impact on the Company’s consolidated financial statements.
In March 2016, the FASB issued ASU 2016-09, “Compensation—Stock Compensation (Topic 718)—Improvements to Employee Share-Based Payment Accounting.” This standard simplifies several aspects of the accounting for share-based payment transactions, including the income tax consequences, classification of awards as either equity or liabilities, and classification on the statement of cash flows. The provisions of this ASU are effective for annual periods beginning after December 15, 2016, including interim periods within those fiscal years and early adoption is permitted. This ASU will be adopted in the first quarter of 2017 and is expected to result in a material benefit to our tax provision and result in a reduction of the tax rate in the Company’s consolidated financial statements.
In February 2016, the FASB issued ASU 2016-02, “Leases (Topic 842).” This standard requires the recognition of lease assets and liabilities for all leases, with certain exceptions, on the balance sheet. In transition, lessees and lessors are required to recognize and measure leases at the beginning of the earliest period presented using a modified retrospective approach. This ASU is effective for annual periods beginning after December 15, 2018, including interim periods within those fiscal years. The Company is currently evaluating the requirements of this ASU and has not yet determined its impact on the Company’s consolidated financial statements.
In January 2016, the FASB issued ASU 2016-01, “Financial Instruments—Overall (Subtopic 825-10): Recognition and Measurement of Financial Assets and Financial Liabilities.” This ASU provides guidance for the recognition, measurement, presentation, and disclosure of financial instruments. The new pronouncement revises accounting related to equity investments and the presentation of certain fair value changes for financial assets and liabilities measured at fair value. Among other things, it amends the presentation and disclosure requirements of equity securities that do not result in consolidation and are not accounted for under the equity method. Changes in the fair value of these equity securities will be recognized directly in net income. This pronouncement is effective for annual periods beginning after December 15, 2017, including interim periods within those fiscal years. The Company does not expect adoption of this ASU to have a material impact on the Company’s consolidated financial statements.
70
Table of Contents
MKS INSTRUMENTS, INC.
NOTES TO CONSOLIDATED FINANCIAL STATEMENTS — (continued)
(in thousands, except share and per share data)
In July 2015, the FASB issued ASU 2015-11, “Inventory (Topic 330)—Simplifying the Measurement of Inventory.” The amendments in this ASU apply to all inventory that is measured using first-in, first-out or average cost. The new standard requires that an entity measure inventory within the scope of this update at the lower of cost and net realizable value. Net realizable value is the estimated selling prices in the ordinary course of business, less reasonably predictable costs of completion, disposal, and transportation. The amendments in this ASU are effective for fiscal years beginning after December 15, 2016, including interim periods within those fiscal years. The Company will adopt this ASU during the first quarter of 2017 and adoption is not expected to have a material impact on the Company’s consolidated financial statements.
In August 2014, the FASB issued ASU 2014-15, “Presentation of Financial Statements—Going Concern (Subtopic 205-40): Disclosure of Uncertainties about an Entity’s Ability to Continue as a Going Concern.” Under the new guidance, management will be required to assess an entity’s ability to continue as a going concern, and to provide related footnote disclosures in certain circumstances. The provisions of this ASU are effective for annual periods ending after December 15, 2016, and for annual and interim periods thereafter. The Company will adopt this ASU during the first quarter of 2017 and adoption is not expected to have an impact on the Company’s consolidated financial statements.
In May 2014, the FASB issued ASU 2014-09, “Revenue from Contracts with Customers (Topic 606),” which supersedes all existing revenue recognition requirements, including most industry-specific guidance. This standard requires a company to recognize revenue when it transfers goods and services to customers in an amount that reflects the consideration that the company expects to be entitled to in exchange for those goods or services. The ASU also requires additional disclosure about the nature, amount, timing and uncertainty of revenue and cash flows arising from customer contracts, including significant judgments and assets recognized from costs incurred to obtain or fulfill a contract. This pronouncement is effective for annual reporting periods beginning after December 15, 2017, including interim periods within that reporting period. The two permitted transition methods under the new standard are the full retrospective method, in which case the standard would be applied to each prior reporting period presented, or the modified retrospective method, in which case the cumulative effect of applying the standard would be recognized at the date of initial application. The Company has not yet selected a transition method. The Company is currently evaluating the requirements of this ASU and has not yet determined its impact on the Company’s consolidated financial statements.
| 5) | Investments |
Investments classified as short-term consists of the following:
| Years Ended December 31, | ||||||||
| Available-for-sale investments: |
2016 | 2015 | ||||||
| Time deposits and certificates of deposit |
$ | 23,818 | $ | 11,892 | ||||
| Bankers’ acceptance drafts |
1,439 | 728 | ||||||
| Asset-backed securities |
36,809 | 124,997 | ||||||
| Commercial paper |
24,381 | — | ||||||
| Corporate obligations |
46,707 | 165,109 | ||||||
| Municipal bonds |
591 | 8,355 | ||||||
| Promissory note |
675 | — | ||||||
| U.S. treasury obligations |
25,414 | — | ||||||
| U.S. agency obligations |
29,629 | 119,582 | ||||||
|
|
|
|
|
|||||
| $ | 189,463 | $ | 430,663 | |||||
|
|
|
|
|
|||||
71
Table of Contents
MKS INSTRUMENTS, INC.
NOTES TO CONSOLIDATED FINANCIAL STATEMENTS — (continued)
(in thousands, except share and per share data)
Investments classified as long-term consists of the following:
| Years Ended December 31, | ||||||||
| Available-for-sale investments: |
2016 | 2015 | ||||||
| Group insurance contracts |
$ | 5,558 | $ | — | ||||
| Cost method investments: |
||||||||
| Minority interest in a private company(1) |
4,300 | — | ||||||
|
|
|
|
|
|||||
| $ | 9,858 | $ | — | |||||
|
|
|
|
|
|||||
| (1) | In April of 2016 the Company invested $9,300 for a minority interest in a private company. During 2016, the Company recognized $5,000 of impairment charges related to this cost method investment. |
The following table shows the gross unrealized gains and (losses) aggregated by investment category for available-for-sale investments:
| As of December 31, 2016: |
Cost | Gross Unrealized Gains |
Gross Unrealized (Losses) |
Estimated Fair Value |
||||||||||||
| Short-term investments: |
||||||||||||||||
| Available-for-sale investments: |
||||||||||||||||
| Time deposits and certificates of deposit |
$ | 23,818 | $ | — | $ | — | $ | 23,818 | ||||||||
| Bankers acceptance drafts |
1,439 | — | — | 1,439 | ||||||||||||
| Asset-backed securities |
36,847 | 6 | (44 | ) | 36,809 | |||||||||||
| Commercial paper |
24,423 | — | (42 | ) | 24,381 | |||||||||||
| Corporate obligations |
46,700 | 21 | (14 | ) | 46,707 | |||||||||||
| Municipal bonds |
591 | — | — | 591 | ||||||||||||
| Promissory note |
675 | — | — | 675 | ||||||||||||
| U.S. treasury obligations |
25,414 | — | — | 25,414 | ||||||||||||
| U.S. agency obligations |
29,631 | 8 | (10 | ) | 29,629 | |||||||||||
|
|
|
|
|
|
|
|
|
|||||||||
| $ | 189,538 | $ | 35 | $ | (110 | ) | $ | 189,463 | ||||||||
|
|
|
|
|
|
|
|
|
|||||||||
| As of December 31, 2016: |
Cost | Gross Unrealized Gains |
Gross Unrealized (Losses) |
Estimated Fair Value |
||||||||||||
| Long-term investments: |
||||||||||||||||
| Available-for-sale investments: |
||||||||||||||||
| Group insurance contracts |
$ | 6,276 | $ | — | $ | (718 | ) | $ | 5,558 | |||||||
| Cost method investments: |
||||||||||||||||
| Minority interest in a private company(1) |
4,300 | — | — | 4,300 | ||||||||||||
|
|
|
|
|
|
|
|
|
|||||||||
| $ | 10,576 | $ | — | $ | (718 | ) | $ | 9,858 | ||||||||
|
|
|
|
|
|
|
|
|
|||||||||
| (1) | In April of 2016 the Company invested $9,300 for a minority interest in a private company. During 2016, the Company recognized $5,000 of impairment charges related to this cost method investment. |
72
Table of Contents
MKS INSTRUMENTS, INC.
NOTES TO CONSOLIDATED FINANCIAL STATEMENTS — (continued)
(in thousands, except share and per share data)
| As of December 31, 2015: |
Cost | Gross Unrealized Gains |
Gross Unrealized (Losses) |
Estimated Fair Value |
||||||||||||
| Short-term investments: |
||||||||||||||||
| Available-for-sale investments: |
||||||||||||||||
| Time deposits and certificates of deposit |
$ | 11,893 | $ | — | $ | (1 | ) | $ | 11,892 | |||||||
| Bankers acceptance drafts |
728 | — | — | 728 | ||||||||||||
| Asset-backed securities |
125,271 | — | (274 | ) | 124,997 | |||||||||||
| Corporate obligations |
165,445 | 5 | (341 | ) | 165,109 | |||||||||||
| Municipal bonds |
8,346 | 13 | (4 | ) | 8,355 | |||||||||||
| U.S. agency obligations |
119,699 | 3 | (120 | ) | 119,582 | |||||||||||
|
|
|
|
|
|
|
|
|
|||||||||
| $ | 431,382 | $ | 21 | $ | (740 | ) | $ | 430,663 | ||||||||
|
|
|
|
|
|
|
|
|
|||||||||
The tables above, which show the gross unrealized gains and (losses) aggregated by investment category for available-for-sale investments as of December 31, 2016 and 2015, reflect the inclusion within short-term investments of investments with contractual maturities greater than one year from the date of purchase. Management has the ability, if necessary, to liquidate any of its investments in order to meet the Company’s liquidity needs in the next 12 months. Accordingly, those investments with contractual maturities greater than one year from the date of purchase are classified as short-term on the accompanying balance sheets.
Interest income is accrued as earned. Dividend income is recognized as income on the date the stock trades “ex-dividend.” The cost of marketable securities sold is determined by the specific identification method and realized gains or losses are reflected in income and was not material in 2016, 2015 and 2014.
| 6) | Fair Value Measurements |
In accordance with the provisions of fair value accounting, a fair value measurement assumes that the transaction to sell an asset or transfer a liability occurs in the principal market for the asset or liability or, in the absence of a principal market, the most advantageous market for the asset or liability and defines fair value based upon an exit price model.
73
Table of Contents
MKS INSTRUMENTS, INC.
NOTES TO CONSOLIDATED FINANCIAL STATEMENTS — (continued)
(in thousands, except share and per share data)
The fair value measurement guidance establishes a fair value hierarchy which requires an entity to maximize the use of observable inputs and minimize the use of unobservable inputs when measuring fair value. The guidance describes three levels of inputs that may be used to measure fair value:
| Level 1 |
Quoted prices in active markets for identical assets or liabilities as of the reporting date. Active markets are those in which transactions for the asset or liability occur in sufficient frequency and volume to provide pricing information on an ongoing basis. | |
| Level 2 |
Observable inputs other than Level 1 prices, such as quoted prices for similar assets or liabilities; quoted prices in markets that are not active; or other inputs that are observable or can be corroborated by observable market data for substantially the full term of the assets or liabilities. Level 2 assets and liabilities include debt securities with quoted prices that are traded less frequently than exchange-traded instruments or securities or derivative contracts that are valued using a pricing model with inputs that are observable in the market or can be derived principally from or corroborated by observable market data. | |
| Level 3 |
Unobservable inputs that are supported by little or no market activity and that are significant to the fair value of the assets or liabilities. Level 3 assets and liabilities include financial instruments whose value is determined using pricing models, discounted cash flow methodologies, or similar techniques, as well as instruments for which the determination of fair value requires significant management judgment or estimation. |
In certain cases, the inputs used to measure fair value may fall into different levels of the fair value hierarchy. In such cases, the Company categorizes such assets and liabilities based on the lowest level input that is significant to the fair value measurement in its entirety. The Company’s assessment of the significance of a particular input to the fair value measurement in its entirety requires judgment and considers factors specific to the asset.
74
Table of Contents
MKS INSTRUMENTS, INC.
NOTES TO CONSOLIDATED FINANCIAL STATEMENTS — (continued)
(in thousands, except share and per share data)
Assets and liabilities of the Company measured at fair value on a recurring basis as of December 31, 2016, are summarized as follows:
| Fair Value Measurements at Reporting Date Using | ||||||||||||||||
| Description |
December 31, 2016 |
Quoted Prices in Active Markets for Identical Assets (Level 1) |
Significant Other Observable Inputs (Level 2) |
Significant Unobservable Inputs (Level 3) |
||||||||||||
| Assets: |
||||||||||||||||
| Cash equivalents: |
||||||||||||||||
| Money market funds |
$ | 10,155 | $ | 10,155 | $ | — | $ | — | ||||||||
| Time deposits and certificates of deposit |
4,900 | — | 4,900 | — | ||||||||||||
| Bankers acceptance drafts |
448 | — | 448 | — | ||||||||||||
| Commercial paper |
11,828 | — | 11,828 | — | ||||||||||||
| Corporate obligations |
2,025 | — | 2,025 | — | ||||||||||||
| U.S. agency obligations |
3,899 | — | 3,899 | — | ||||||||||||
| Restricted cash – money market funds |
5,287 | 5,287 | — | — | ||||||||||||
| Available-for-sale securities: |
||||||||||||||||
| Time deposits and certificates of deposit |
23,818 | — | 23,818 | — | ||||||||||||
| Bankers acceptance drafts |
1,439 | — | 1,439 | — | ||||||||||||
| Asset-backed securities |
36,809 | — | 36,809 | — | ||||||||||||
| Commercial paper |
24,381 | — | 24,381 | — | ||||||||||||
| Corporate obligations |
46,707 | — | 46,707 | — | ||||||||||||
| Municipal bonds |
591 | — | 591 | — | ||||||||||||
| Promissory note |
675 | — | 675 | — | ||||||||||||
| U.S. treasury obligations |
25,414 | — | 25,414 | — | ||||||||||||
| U.S. agency obligations |
29,629 | — | 29,629 | — | ||||||||||||
| Group insurance contracts |
5,558 | — | 5,558 | — | ||||||||||||
| Derivatives — currency forward contracts |
2,985 | — | 2,985 | — | ||||||||||||
| Derivatives — options contracts |
4 | — | 4 | — | ||||||||||||
| Funds in investments and other assets: |
||||||||||||||||
| Israeli pension assets |
13,910 | — | 13,910 | — | ||||||||||||
| Derivatives — interest rate |
4,900 | — | 4,900 | — | ||||||||||||
| Restricted cash — non-current |
573 | 573 | — | — | ||||||||||||
|
|
|
|
|
|
|
|
|
|||||||||
| Total assets |
$ | 255,935 | $ | 16,015 | $ | 239,920 | $ | — | ||||||||
|
|
|
|
|
|
|
|
|
|||||||||
| Liabilities: |
||||||||||||||||
| Derivatives — currency forward contracts |
543 | — | 543 | — | ||||||||||||
| Derivatives — options contracts |
16 | — | 16 | — | ||||||||||||
|
|
|
|
|
|
|
|
|
|||||||||
| Total liabilities |
$ | 559 | $ | — | $ | 559 | $ | — | ||||||||
|
|
|
|
|
|
|
|
|
|||||||||
75
Table of Contents
MKS INSTRUMENTS, INC.
NOTES TO CONSOLIDATED FINANCIAL STATEMENTS — (continued)
(in thousands, except share and per share data)
| Fair Value Measurements at Reporting Date Using | ||||||||||||||||
| Description |
December 31, 2016 |
Quoted Prices in Active Markets for Identical Assets (Level 1) |
Significant Other Observable Inputs (Level 2) |
Significant Unobservable Inputs (Level 3) |
||||||||||||
| Reported as follows: |
||||||||||||||||
| Assets: |
||||||||||||||||
| Cash and cash equivalents(1) |
$ | 33,255 | $ | 10,155 | $ | 23,100 | $ | — | ||||||||
| Restricted cash |
5,287 | 5,287 | — | — | ||||||||||||
| Short-term investments |
189,463 | — | 189,463 | — | ||||||||||||
| Other current assets |
2,989 | — | 2,989 | — | ||||||||||||
|
|
|
|
|
|
|
|
|
|||||||||
| Total current assets |
$ | 230,994 | $ | 15,442 | $ | 215,552 | $ | — | ||||||||
|
|
|
|
|
|
|
|
|
|||||||||
| Long-term investments(2) |
$ | 5,558 | $ | — | $ | 5,558 | $ | — | ||||||||
| Other long-term assets |
18,810 | — | 18,810 | — | ||||||||||||
| Restricted cash—non-current |
573 | 573 | — | — | ||||||||||||
|
|
|
|
|
|
|
|
|
|||||||||
| Total long-term assets |
$ | 24,941 | $ | 573 | $ | 24,368 | $ | — | ||||||||
|
|
|
|
|
|
|
|
|
|||||||||
| Liabilities: |
||||||||||||||||
| Other current liabilities |
$ | 559 | $ | — | $ | 559 | $ | — | ||||||||
|
|
|
|
|
|
|
|
|
|||||||||
| (1) | The cash and cash equivalent amounts presented in the table above do not include cash of $192,432 and non-negotiable time deposits of $2,936 as of December 31, 2016. |
| (2) | The long-term investments presented in the table above do not include our minority interest investment in a private company, which is accounted for under the cost method. |
76
Table of Contents
MKS INSTRUMENTS, INC.
NOTES TO CONSOLIDATED FINANCIAL STATEMENTS — (continued)
(in thousands, except share and per share data)
Assets and liabilities of the Company measured at fair value on a recurring basis as of December 31, 2015, are summarized as follows:
| Fair Value Measurements at Reporting Date Using | ||||||||||||||||
| Description |
December 31, 2015 |
Quoted Prices in Active Markets for Identical Assets (Level 1) |
Significant Other Observable Inputs (Level 2) |
Significant Unobservable Inputs (Level 3) |
||||||||||||
| Assets: |
||||||||||||||||
| Cash equivalents: |
||||||||||||||||
| Money market funds |
$ | 106,099 | $ | 106,099 | $ | — | $ | — | ||||||||
| Bankers acceptance drafts |
11 | — | 11 | — | ||||||||||||
| Corporate obligations |
330 | — | 330 | — | ||||||||||||
| Available-for-sale securities: |
||||||||||||||||
| Time deposits and certificates of deposit |
11,892 | — | 11,892 | — | ||||||||||||
| Bankers acceptance drafts |
728 | — | 728 | — | ||||||||||||
| Asset-backed securities |
124,997 | — | 124,997 | — | ||||||||||||
| Corporate obligations |
165,109 | — | 165,109 | — | ||||||||||||
| Municipal bonds |
8,355 | — | 8,355 | — | ||||||||||||
| U.S. agency obligations |
119,582 | — | 119,582 | — | ||||||||||||
| Derivatives—currency forward contracts |
1,486 | — | 1,486 | — | ||||||||||||
|
|
|
|
|
|
|
|
|
|||||||||
| Total assets |
$ | 538,589 | $ | 106,099 | $ | 432,490 | $ | — | ||||||||
|
|
|
|
|
|
|
|
|
|||||||||
| Liabilities: |
||||||||||||||||
| Derivatives — currency forward contracts |
$ | 263 | $ | — | $ | 263 | $ | — | ||||||||
|
|
|
|
|
|
|
|
|
|||||||||
| Reported as follows: |
||||||||||||||||
| Assets: |
||||||||||||||||
| Cash and cash equivalents (1) |
$ | 106,440 | $ | 106,099 | $ | 341 | $ | — | ||||||||
| Short-term investments |
430,663 | — | 430,663 | — | ||||||||||||
| Other current assets |
1,486 | — | 1,486 | — | ||||||||||||
|
|
|
|
|
|
|
|
|
|||||||||
| $ | 538,589 | $ | 106,099 | $ | 432,490 | $ | — | |||||||||
|
|
|
|
|
|
|
|
|
|||||||||
| Liabilities: |
||||||||||||||||
| Other current liabilities |
$ | 263 | $ | — | $ | 263 | $ | — | ||||||||
|
|
|
|
|
|
|
|
|
|||||||||
| (1) | The cash and cash equivalent amounts presented in the table above do not include cash of $110,118 and non-negotiable time deposits of $11,016 as of December 31, 2015. |
77
Table of Contents
MKS INSTRUMENTS, INC.
NOTES TO CONSOLIDATED FINANCIAL STATEMENTS — (continued)
(in thousands, except share and per share data)
Money Market Funds
Money market funds are cash and cash equivalents, and are classified within Level 1 of the fair value hierarchy.
Restricted Cash
The Company has letters of credit, which require it to maintain specified cash deposit balances, consisting mainly of money market funds, as collateral. Such amounts have been classified as restricted cash and are classified as Level 1.
Available-For-Sale Investments
As of December 31, 2016, available-for-sale investments consisted of time deposits and drafts denominated in the Euro currency, certificates of deposit, bankers acceptance drafts, asset-backed securities (which include auto loans, credit card receivables and equipment trust receivables), corporate obligations, municipal bonds and U.S. agency obligations.
The Company measures its debt and equity investments at fair value. The Company’s available-for-sale investments are classified within Level 1 and Level 2 of the fair value hierarchy.
Israeli Pension Assets
Israeli pension assets represent investments in mutual funds, government securities and other time deposits. These investments are set aside for the retirement benefit of the employees at the Company’s Israeli subsidiaries. These funds are classified within Level 2 of the fair value hierarchy.
Derivatives
As a result of the Company’s global operating activities, the Company is exposed to market risks from changes in foreign currency exchange rates, which may adversely affect its operating results and financial position. When deemed appropriate, the Company minimizes its risks from foreign currency exchange rate fluctuations through the use of derivative financial instruments. The principal market in which the Company executes its foreign currency contracts is the institutional market in an over-the-counter environment with a relatively high level of price transparency. The market participants usually are large commercial banks. The forward foreign currency exchange contracts are valued using broker quotations, or market transactions and are classified within Level 2 of the fair value hierarchy.
| 7) | Derivatives |
The Company enters into derivative instruments for risk management purposes only, including derivatives designated as hedging instruments and those utilized as economic hedges. The Company operates internationally and, in the normal course of business, is exposed to fluctuations in interest rates and foreign exchange rates. These fluctuations can increase the costs of financing, investing and operating the business. The Company has used derivative instruments, such as forward contracts and foreign currency option contracts, to manage certain foreign currency exposure.
By nature, all financial instruments involve market and credit risks. The Company enters into derivative instruments with major investment grade financial institutions, for which no collateral is required. The Company
78
Table of Contents
MKS INSTRUMENTS, INC.
NOTES TO CONSOLIDATED FINANCIAL STATEMENTS — (continued)
(in thousands, except share and per share data)
has policies to monitor the credit risk of these counterparties. While there can be no assurance, the Company does not anticipate any material non-performance by any of these counterparties.
Interest Rate Swap Agreement
On September 30, 2016, the Company entered into an interest rate swap agreement to fix the rate on approximately 50% of its remaining outstanding term loan balance, as described further in Note 15. This hedge fixes the interest rate paid on the hedged debt at 1.198% per annum plus the credit spread of 3.50% through September 30, 2020. The interest rate swap will be recorded at fair value on the balance sheet and changes in the fair value will be recognized in OCI. To the extent that this arrangement is no longer an effective hedge, any ineffectiveness measured in the hedging relationship is recorded currently in earnings in the period it occurs. The notional amount of this transaction was $335,000 and had a fair value of $4,900 at December 31, 2016.
Foreign Exchange Contracts
The Company hedges a portion of its forecasted foreign currency-denominated intercompany sales of inventory, over a maximum period of eighteen months, using forward foreign exchange contracts accounted for as cash-flow hedges related to Japanese, South Korean, British, Euro and Taiwanese currencies. To the extent these derivatives are effective in off-setting the variability of the hedged cash flows, and otherwise meet the hedge accounting criteria, changes in the derivatives’ fair value are not included in current earnings but are included in OCI in stockholders’ equity. These changes in fair value will subsequently be reclassified into earnings, as applicable, when the forecasted transaction occurs. To the extent that a previously designated hedging transaction is no longer an effective hedge, any ineffectiveness measured in the hedging relationship will be recorded currently in earnings in the period in which it occurs. The cash flows resulting from forward exchange contracts are classified in the consolidated statements of cash flows as part of cash flows from operating activities. The Company does not enter into derivative instruments for trading or speculative purposes.
The Company also enters into forward exchange contracts to hedge certain balance sheet amounts and foreign currency option contracts related to the Israeli Shekel. To the extent the hedge accounting criteria is not met, the related foreign currency forward contracts and foreign currency option contracts are considered as economic hedges and changes in the fair value of these contracts are recorded immediately in earnings in the period in which they occur. These include hedges that are used to reduce exchange rate risks arising from the change in fair value of certain foreign currency-denominated assets and liabilities (i.e., payables, receivables) and other economic hedges where the hedge accounting criteria were not met.
As of December 31, 2016 and 2015, the Company had outstanding forward foreign exchange contracts with gross notional values of $120,208 and $89,989, respectively. The following tables provide a summary of the primary net hedging positions and corresponding fair values held as of December 31, 2016 and 2015:
| December 31, 2016 | ||||||||
| Currency Hedged (Buy/Sell) |
Gross Notional Value |
Fair Value (1) | ||||||
| U.S. Dollar/Japanese Yen |
$ | 30,522 | $ | 763 | ||||
| U.S. Dollar/South Korean Won |
50,049 | 1,342 | ||||||
| U.S. Dollar/Euro |
18,040 | 156 | ||||||
| U.S. Dollar/U.K. Pound Sterling |
6,067 | 117 | ||||||
| U.S. Dollar/Taiwan Dollar |
15,530 | 64 | ||||||
|
|
|
|
|
|||||
| Total |
$ | 120,208 | $ | 2,442 | ||||
|
|
|
|
|
|||||
79
Table of Contents
MKS INSTRUMENTS, INC.
NOTES TO CONSOLIDATED FINANCIAL STATEMENTS — (continued)
(in thousands, except share and per share data)
| December 31, 2015 | ||||||||
| Currency Hedged (Buy/Sell) |
Gross Notional Value |
Fair Value (1) | ||||||
| U.S. Dollar/Japanese Yen |
$ | 26,848 | $ | (136 | ) | |||
| U.S. Dollar/South Korean Won |
34,777 | 915 | ||||||
| U.S. Dollar/Euro |
10,987 | 19 | ||||||
| U.S. Dollar/U.K. Pound Sterling |
4,587 | 61 | ||||||
| U.S. Dollar/Taiwan Dollar |
12,790 | 364 | ||||||
|
|
|
|
|
|||||
| Total |
$ | 89,989 | $ | 1,223 | ||||
|
|
|
|
|
|||||
| (1) | Represents the receivable (payable) amount included in the consolidated balance sheet. |
The following table provides a summary of the fair value amounts of the Company’s derivative instruments:
| Years Ended December 31, | ||||||||
| Derivatives Designated as Hedging Instruments |
2016 | 2015 | ||||||
| Derivative assets: |
||||||||
| Forward exchange contracts(1) |
$ | 2,985 | $ | 1,486 | ||||
| Foreign currency option contracts(1) |
4 | — | ||||||
| Foreign currency interest rate hedge(2) |
4,900 | — | ||||||
| Derivative liabilities: |
||||||||
| Forward exchange contracts(1) |
(543 | ) | (263 | ) | ||||
| Foreign currency option contracts(1) |
(16 | ) | — | |||||
|
|
|
|
|
|||||
| Total net derivative asset designated as hedging instruments |
$ | 7,330 | $ | 1,223 | ||||
|
|
|
|
|
|||||
| (1) | The derivative asset of $2,989 and derivative liability of $(559) related to the foreign exchange contracts and foreign currency option contracts are classified in other current assets and other current liabilities in the consolidated balance sheet as of December 31, 2016. The derivative asset of $1,486 and derivative liability of $(263) are classified in other current assets and other current liabilities in the consolidated balance sheet as of December 31, 2015. These foreign exchange contracts are subject to a master netting agreement with one financial institution. However, the Company has elected to record these contracts on a gross basis in the balance sheet. |
| (2) | The foreign currency interest rate hedge asset of $4,900 is classified in other assets in the consolidated balance sheet as of December 31, 2016. |
The net amount of existing gains as of December 31, 2016 that is expected to be reclassified from OCI into earnings within the next 12 months is immaterial.
The following table provides a summary of the (losses) gains on derivatives designated as hedging instruments:
| Years Ended December 31, | ||||||||||||
| Derivatives Designated as Cash Flow Hedging Instruments |
2016 | 2015 | 2014 | |||||||||
| Forward exchange contracts: |
||||||||||||
| Net gain (loss) recognized in OCI(1) |
$ | 5,914 | $ | (3,748 | ) | $ | (984 | ) | ||||
| Net (loss) gain reclassified from OCI into income(2) |
$ | (1,414 | ) | $ | 3,520 | $ | (160 | ) | ||||
| (1) | Net change in the fair value of the effective portion classified in OCI. |
| (2) | Effective portion classified as cost of products in 2016, 2015 and 2014. |
80
Table of Contents
MKS INSTRUMENTS, INC.
NOTES TO CONSOLIDATED FINANCIAL STATEMENTS — (continued)
(in thousands, except share and per share data)
The following table provides a summary of (losses) gains on derivatives not designated as hedging instruments:
| Years Ended December 31, | ||||||||||||
| Derivatives Not Designated as Hedging Instruments |
2016 | 2015 | 2014 | |||||||||
| Forward exchange contracts: |
||||||||||||
| Net (loss) gain recognized in income(1) |
$ | (31 | ) | $ | (40 | ) | $ | 101 | ||||
| (1) | The Company enters into foreign exchange contracts to hedge against changes in the balance sheet for certain subsidiaries and also enters into foreign currency option contracts to mitigate the risk associated with certain foreign currency transactions in the ordinary course of business. These derivatives are not designated as hedging instruments and gains or losses from these derivatives are recorded immediately in other expense, net in 2016 and in selling, general and administrative expenses in 2015 and 2014. |
| 8) | Inventories |
Inventories consist of the following:
| Years Ended December 31, | ||||||||
| 2016 | 2015 | |||||||
| Raw material |
$ | 150,150 | $ | 78,352 | ||||
| Work-in-process |
39,105 | 23,297 | ||||||
| Finished goods |
86,614 | 50,982 | ||||||
|
|
|
|
|
|||||
| $ | 275,869 | $ | 152,631 | |||||
|
|
|
|
|
|||||
Inventory-related excess and obsolete charges of $16,039, $13,602 and $12,131 were recorded in cost of products in the years ended December 31, 2016, 2015 and 2014, respectively.
| 9) | Property, Plant and Equipment |
Property, plant and equipment consist of the following:
| Years Ended December 31, | ||||||||
| 2016 | 2015 | |||||||
| Land |
$ | 11,115 | $ | 8,535 | ||||
| Buildings |
100,169 | 68,881 | ||||||
| Machinery and equipment |
297,342 | 119,739 | ||||||
| Furniture and fixtures, office equipment and software |
139,392 | 61,490 | ||||||
| Leasehold improvements |
63,431 | 21,303 | ||||||
| Construction in progress |
6,592 | 4,171 | ||||||
|
|
|
|
|
|||||
| 618,041 | 284,119 | |||||||
| Less: accumulated depreciation |
443,482 | 215,263 | ||||||
|
|
|
|
|
|||||
| $ | 174,559 | $ | 68,856 | |||||
|
|
|
|
|
|||||
81
Table of Contents
MKS INSTRUMENTS, INC.
NOTES TO CONSOLIDATED FINANCIAL STATEMENTS — (continued)
(in thousands, except share and per share data)
Depreciation of property, plant and equipment totaled $30,245, $15,339 and $15,569 for the years ended 2016, 2015 and 2014, respectively.
| 10) | Acquisitions |
Newport Corporation
On April 29, 2016, the Company completed its acquisition of Newport Corporation (“Newport”) pursuant to an Agreement and Plan of Merger, dated as of February 22, 2016 (the “Merger Agreement”), by and among the Company, PSI Equipment, Inc., a wholly owned subsidiary of the Company (“Merger Sub”), and Newport (the “Newport Merger”). At the effective time of the Newport Merger and pursuant to the terms and conditions of the Merger Agreement, each share of Newport’s common stock that was issued and outstanding immediately prior to the effective time of the Newport Merger was converted into the right to receive $23.00 in cash, without interest and subject to deduction for any required withholding tax.
Newport’s innovative solutions leverage its expertise in advanced technologies, including lasers, photonics and precision motion equipment, and optical components and sub-systems, to enhance the capabilities and productivity of its customers’ manufacturing, engineering and research applications. Newport is a global supplier of advanced-technology products and systems to customers in the scientific research and defense/security, microelectronics, life and health sciences and industrial manufacturing markets.
The purchase price of Newport consisted of the following:
| Cash paid for outstanding shares(1) |
$ | 905,254 | ||
| Settlement of share-based compensation awards(2) |
8,824 | |||
| Cash paid for Newport debt(3) |
93,200 | |||
|
|
|
|||
| Total purchase price |
$ | 1,007,278 | ||
|
|
|
|||
| Less: cash and cash equivalents acquired |
(61,463 | ) | ||
|
|
|
|||
| Total purchase price, net of cash and cash equivalents acquired |
$ | 945,815 | ||
|
|
|
| (1) | Represents cash paid of $23.00 per share for approximately 39,359,000 shares of Newport common stock, without interest and subject to a deduction for any required withholding tax. |
| (2) | Represents the vested but not issued portion of Newport share-based compensation awards as of the acquisition date of April 29, 2016. |
| (3) | Represents the cash paid for the outstanding balance of Newport’s senior secured revolving credit agreement. |
The Company funded the payment of the aggregate consideration with a combination of the Company’s available cash on hand and the proceeds from the Company’s senior secured term loan facility, as described in Note 15.
Under the acquisition method of accounting, the total estimated acquisition consideration is allocated to the acquired tangible and intangible assets and assumed liabilities of Newport based on their fair values as of the acquisition date. Any excess of the acquisition consideration over the fair value of assets acquired and liabilities assumed is allocated to goodwill. Goodwill and intangible assets will not be amortizable for tax purposes.
82
Table of Contents
MKS INSTRUMENTS, INC.
NOTES TO CONSOLIDATED FINANCIAL STATEMENTS — (continued)
(in thousands, except share and per share data)
The following table summarizes the allocation of the purchase price to the fair values assigned to assets acquired and liabilities assumed at the date of the Newport Merger:
| Current assets (including cash) |
$ | 186,137 | ||
| Inventory |
142,714 | |||
| Intangible assets |
404,506 | |||
| Goodwill |
396,027 | |||
| Property, plant and equipment |
119,932 | |||
| Long-term assets |
22,725 | |||
|
|
|
|||
| Total assets acquired |
1,272,041 | |||
| Current liabilities |
95,156 | |||
| Intangible liability |
4,302 | |||
| Other long-term liabilities |
165,305 | |||
|
|
|
|||
| Total liabilities assumed |
264,763 | |||
|
|
|
|||
| Fair value of assets acquired and liabilities assumed |
1,007,278 | |||
|
|
|
|||
| Less: cash and cash equivalents acquired |
(61,463 | ) | ||
|
|
|
|||
| Total purchase price, net of cash and cash equivalents acquired |
$ | 945,815 | ||
|
|
|
For the year ended December 31, 2016, the Company recorded $15,090 of incremental cost of sale charges associated with the fair value write-up of inventory acquired in the Newport Merger.
The fair value write-up of acquired property, plant and equipment of $36,242 will be amortized over the useful life of the asset. Property, plant and equipment is valued at its value-in-use, unless there was a known plan to dispose of the asset.
The acquired intangible assets are being amortized on a straight-line basis, which approximates the economic use of the asset.
The following table reflects the allocation of the acquired intangible assets and liabilities and related estimate of useful lives:
| Order backlog |
$ | 12,100 | 1 year | |||||
| Customer relationships |
247,793 | 6-18 years | ||||||
| Trademarks and trade names |
55,900 | Indefinite | ||||||
| Developed technology |
75,386 | 4-8 years | ||||||
| In-process research and development |
6,899 | Undefined(1) | ||||||
| Leasehold interest (favorable) |
6,428 | 4-5 years | ||||||
|
|
|
|||||||
| Total intangible assets |
$ | 404,506 | ||||||
|
|
|
|||||||
| Leasehold interest (unfavorable) |
$ | 4,302 | ||||||
|
|
|
| (1) | The useful lives of in-process research and development will be defined in the future upon further evaluation of the status of these programs. |
The fair value of the acquired intangibles was determined using the income approach. In performing these valuations, the key underlying probability-adjusted assumptions of the discounted cash flows were projected
83
Table of Contents
MKS INSTRUMENTS, INC.
NOTES TO CONSOLIDATED FINANCIAL STATEMENTS — (continued)
(in thousands, except share and per share data)
revenues, gross margin expectations and operating cost estimates. The valuations were based on the information that was available as of the acquisition date and the expectations and assumptions that have been deemed reasonable by the Company’s management. There are inherent uncertainties and management judgment required in these determinations. This acquisition resulted in a purchase price that exceeded the estimated fair value of tangible and intangible assets, the excess amount of which was allocated to goodwill.
While the Company uses its best estimates and assumptions as part of the purchase price allocation process to value the assets acquired and liabilities assumed on the acquisition date, its estimates and assumptions are subject to refinement. Fair value estimates are based on a complex series of judgments about future events and uncertainties and rely heavily on estimates and assumptions. The judgments used to determine the estimated fair value assigned to each class of assets acquired and liabilities assumed, as well as asset lives, can materially impact the Company’s results of operations. The finalization of the purchase accounting assessment has resulted in changes in the valuation of assets acquired and liabilities assumed during 2016. As a result, during the measurement period, which may be up to one year from the acquisition date, the Company has recorded adjustments to the assets acquired and liabilities assumed with a corresponding offset to goodwill to reflect additional information received about facts and circumstances which existed at the date of acquisition. The Company recorded adjustments to the assets acquired and liabilities assumed subsequent to the purchase price allocation period in the Company’s operating results in the period in which the adjustments were determined. The size and breadth of the Newport Merger necessitates the use of this measurement period to adequately analyze and assess a number of the factors used in establishing the fair value of certain tangible and intangible assets acquired and liabilities assumed as of the acquisition date and the related tax impacts of any changes made. The Company believes that the measurement period is complete as of December 31, 2016.
The Company believes the amount of goodwill relative to identifiable intangible assets relates to several factors including: (1) potential buyer-specific synergies related to market opportunities for a combined product offering; and (2) potential to leverage the Company’s sales force to attract new customers and revenue and cross sell to existing customers.
The results of this acquisition were included in the Company’s consolidated operations beginning on April 29, 2016. Newport constitutes the Company’s Light & Motion reportable segment (see Note 21).
Certain executives from Newport had severance provisions in their respective Newport employment agreements. The agreements included terms that are accounted for as dual-trigger arrangements. Through the Company’s acquisition accounting, the expense relating to these benefits was recognized in the combined entity’s financial statements; however, the benefit itself will not be distributed until the final provision is met by each eligible executive. The Company recorded costs of $5,816 and $3,334 as compensation expense and stock-based compensation expense, respectively, for the twelve months ended December 31, 2016 in connection with these severance provisions. The shares underlying the restricted stock units and stock appreciation rights that are eligible for accelerated vesting if the executive exercises his rights are not issued as of each reporting period-end and are excluded from the computation of basic earnings per share and included in the computation of diluted earnings per share for such reporting period.
Pro Forma Results
The following unaudited pro forma financial information presents the combined results of operations of the Company as if the Newport Merger had occurred on January 1, 2015. The unaudited pro forma financial information is not necessarily indicative of what the Company’s condensed consolidated results of operations
84
Table of Contents
MKS INSTRUMENTS, INC.
NOTES TO CONSOLIDATED FINANCIAL STATEMENTS — (continued)
(in thousands, except share and per share data)
actually would have been had the acquisition occurred at the beginning of each year. In addition, the unaudited pro forma financial information does not attempt to project the future results of operations of the combined company.
| Years Ended December 31, | ||||||||
| 2016 | 2015 | |||||||
| Total net revenues |
$ | 1,475,637 | $ | 1,412,748 | ||||
| Net income |
111,076 | 69,096 | ||||||
|
|
|
|
|
|||||
| Net income per share: |
||||||||
| Basic |
$ | 2.08 | $ | 1.30 | ||||
|
|
|
|
|
|||||
| Diluted |
$ | 2.06 | $ | 1.29 | ||||
|
|
|
|
|
|||||
The unaudited pro forma financial information above gives effect primarily to the following:
| (1) | Incremental amortization and depreciation expense related to the estimated fair value of identifiable intangible assets and property, plant and equipment from the purchase price allocation. |
| (2) | Revenue adjustments as a result of the reduction in deferred revenue related to its estimated fair value. |
| (3) | Incremental interest expense related to the Company’s term loan credit agreement. |
| (4) | The exclusion of acquisition costs and inventory step-up amortization from the year ended December 31, 2016 and the addition of these items to the year ended December 31, 2015. |
| (5) | The estimated tax impact of the above adjustments. |
Cost Method Investment in a Private Company
On April 27, 2016, the Company invested $9,300 for a minority interest in a private company, which operates in the field of semiconductor process equipment instrumentation. The Company accounted for this investment using the cost method of accounting. During the fourth quarter of 2016, the Company recognized an impairment loss on this investment of $5,000 based upon financial information of this private company.
Precisive, LLC
On March 17, 2015, the Company acquired Precisive, LLC (“Precisive”) for $12,085, net of cash acquired of $435. The purchase price included a deferred payment amount of $2,600 to cover any potential indemnification claims, which amount was paid to the sellers in the second quarter of 2016. Precisive is an innovative developer of optical analyzers based on Tunable Filter Spectroscopy, which provide real-time gas analysis in the natural gas and hydrocarbon processing industries, including refineries, hydrocarbon processing plants, gas-to-power machines, biogas processes and fuel gas transportation and metering, while delivering customers a lower total cost of ownership.
85
Table of Contents
MKS INSTRUMENTS, INC.
NOTES TO CONSOLIDATED FINANCIAL STATEMENTS — (continued)
(in thousands, except share and per share data)
The following table summarizes the estimated fair value of the assets acquired and liabilities assumed at the date of the Precisive acquisition:
| Current assets |
$ | 693 | ||
| Non-current assets |
18 | |||
| Intangible assets |
5,110 | |||
| Goodwill |
7,042 | |||
|
|
|
|||
| Total assets acquired |
12,863 | |||
|
|
|
|||
| Total current liabilities assumed |
343 | |||
|
|
|
|||
| Fair value of asset acquired and liabilities assumed |
12,520 | |||
|
|
|
|||
| Less: cash acquired |
(435 | ) | ||
|
|
|
|||
| Total purchase price, net of cash acquired |
$ | 12,085 | ||
|
|
|
Substantially all of the purchase price is deductible for tax purposes. The following table reflects the allocation of the acquired intangible assets and related estimates of useful lives. These acquired intangibles will be amortized on a straight-line basis, which approximates the pattern of use.
| Order backlog |
$ | 50 | 18 months | |||
| Customer relationships |
1,430 | 8 years | ||||
| Exclusive patent license |
2,600 | 10 years | ||||
| Trade names |
210 | 10 years | ||||
| Developed technology |
820 | 10 years | ||||
|
|
|
|||||
| Total intangible assets |
$ | 5,110 | ||||
|
|
|
The fair value of the acquired intangibles was determined using the income approach. The Precisive acquisition resulted in a purchase price that exceeded the estimated fair value of tangible and intangible assets, the excess amount of which was allocated to goodwill. The Company believes the amount of goodwill relative to identifiable intangible assets relates to several factors including: (1) potential buyer-specific synergies related to market opportunities for a combined product offering; (2) potential to leverage the Company’s sales force and intellectual property to attract new customers and revenue; and (3) potential to strengthen and expand into new but complementary markets, including targeting new applications such as natural gas processing, hydrocarbon processing and other oil and gas segments.
The results of this acquisition were included in the Company’s consolidated operations beginning on March 17, 2015. Precisive is included in the Company’s Instruments, Control and Vacuum Products group within the Vacuum & Analysis segment.
Granville-Phillips
On May 30, 2014, the Company acquired Granville-Phillips, a division of Brooks Automation, Inc., for $86,950. Granville-Phillips is a leading global provider of vacuum measurement and control instruments to the semiconductor, thin film and general industrial markets. The acquisition reflects the Company’s strategy to grow our semiconductor business, while diversifying into other high growth advanced markets.
86
Table of Contents
MKS INSTRUMENTS, INC.
NOTES TO CONSOLIDATED FINANCIAL STATEMENTS — (continued)
(in thousands, except share and per share data)
The following table summarizes the estimated fair value of the assets acquired and liabilities assumed at the date of acquisition:
| Inventory |
$ | 5,198 | ||
| Property and equipment |
299 | |||
| Other assets |
191 | |||
| Intangible assets |
38,850 | |||
| Goodwill |
42,587 | |||
| Warranty liability |
(175 | ) | ||
|
|
|
|||
| Total purchase price |
$ | 86,950 | ||
|
|
|
Substantially all of the purchase price was deductible for tax purposes. The following table reflects the allocation of the acquired intangible assets and related estimates of useful lives. These acquired intangibles are being amortized on a straight-line basis.
| Customer relationships |
$ | 21,250 | 7 years | |||
| Trademark and trade names |
1,900 | 12 years | ||||
| Developed technology |
15,700 | 9-12 years | ||||
|
|
|
|||||
| Total intangible assets |
$ | 38,850 | ||||
|
|
|
This transaction resulted in an amount of purchase price that exceeded the estimated fair value of tangible and intangible assets, which was allocated to goodwill. The Company believes that the amount of goodwill relative to identifiable intangible assets relates to several factors including: (1) potential buyer-specific synergies related to market opportunities for a combined product offering; (2) potential to leverage the Company’s sales force and intellectual property to attract new customers and revenue and (3) potential to strengthen the Company’s position in the vacuum gauge market.
The results of this acquisition were included in the Company’s consolidated operations beginning on May 30, 2014. The pro forma consolidated statements reflecting the operating results of Granville-Phillips, had it been acquired as of January 1, 2013, would not differ materially from the operating results of the Company as reported for the year ended December 31, 2014. Granville-Phillips is included in the Company’s Instruments, Control and Vacuum Products group and the Vacuum & Analysis segment.
11) Goodwill and Intangible Assets
Goodwill
The Company’s methodology for allocating the purchase price relating to purchase acquisitions is determined through established and generally accepted valuation techniques. Goodwill is measured as the excess of the cost of the acquisition over the sum of the amounts assigned to tangible and identifiable intangible assets acquired less liabilities assumed. The Company assigns assets acquired (including goodwill) and liabilities assumed to one or more reporting units as of the date of acquisition. Typically acquisitions relate to a single reporting unit and thus do not require the allocation of goodwill to multiple reporting units. If the products obtained in an acquisition are assigned to multiple reporting units, the goodwill is distributed to the respective reporting units as part of the purchase price allocation process.
87
Table of Contents
MKS INSTRUMENTS, INC.
NOTES TO CONSOLIDATED FINANCIAL STATEMENTS — (continued)
(in thousands, except share and per share data)
Goodwill and purchased intangible assets with indefinite useful lives are not amortized, but are reviewed for impairment annually during the fourth quarter of each fiscal year and whenever events or changes in circumstances indicate that the carrying value of an asset may not be recoverable. The process of evaluating the potential impairment of goodwill and intangible assets requires significant judgment. The Company regularly monitors current business conditions and other factors including, but not limited to, adverse industry or economic trends, restructuring actions and lower projections of profitability that may impact future operating results.
The changes in the carrying amount of goodwill and accumulated impairment losses were as follows:
| 2016 | 2015 | |||||||||||||||||||||||
| Gross Carrying Amount |
Accumulated Impairment Loss |
Net | Gross Carrying Amount |
Accumulated Impairment Loss |
Net | |||||||||||||||||||
| Beginning balance at January 1 |
$ | 339,117 | $ | (139,414 | ) | $ | 199,703 | $ | 331,795 | $ | (139,414 | ) | $ | 192,381 | ||||||||||
| Acquired goodwill(1) |
396,027 | — | 396,027 | 8,017 | — | 8,017 | ||||||||||||||||||
| Foreign currency translation |
(7,145 | ) | — | (7,145 | ) | (695 | ) | — | (695 | ) | ||||||||||||||
|
|
|
|
|
|
|
|
|
|
|
|
|
|||||||||||||
| Ending balance at December 31 |
$ | 727,999 | $ | (139,414 | ) | $ | 588,585 | $ | 339,117 | $ | (139,414 | ) | $ | 199,703 | ||||||||||
|
|
|
|
|
|
|
|
|
|
|
|
|
|||||||||||||
| (1) | During 2016, the Company recorded $396,027 of goodwill related to the Newport Merger. During 2015, the Company recorded $7,042 of goodwill related to the acquisition of Precisive. During 2015, the Company recorded a purchase accounting adjustment of $975 primarily related to an inventory valuation adjustment related to an acquisition that occurred in 2014. |
Intangible Assets
The Company is required to test certain long-lived assets when indicators of impairment are present. For the purposes of the impairment test, long-lived assets are grouped with other assets and liabilities at the lowest level for which identifiable cash flows are largely independent of the cash flows of other assets and liabilities. There were no intangible asset impairment charges in 2016, 2015 or 2014.
Components of the Company’s acquired intangible assets are comprised of the following:
| As of December 31, 2016 |
Gross | Accumulated Amortization |
Foreign Currency Translation |
Net | ||||||||||||
| Completed technology(1) |
$ | 176,586 | $ | (97,707 | ) | $ | (1,068 | ) | $ | 77,811 | ||||||
| Customer relationships(1) |
285,044 | (29,709 | ) | (3,404 | ) | 251,931 | ||||||||||
| Patents, trademarks, trade names and other(1) |
111,723 | (33,397 | ) | (64 | ) | 78,262 | ||||||||||
|
|
|
|
|
|
|
|
|
|||||||||
| $ | 573,353 | $ | (160,813 | ) | $ | (4,536 | ) | $ | 408,004 | |||||||
|
|
|
|
|
|
|
|
|
|||||||||
| (1) | During 2016, the Company recorded $404,506 of separately identified intangible assets related to the Newport Merger, of which $75,386 was completed technology, $247,793 was customer relationships and $81,327 was patents, trademarks, trade names, in-process research and development and other. The Company also recorded $4,302 of unfavorable lease commitments, which is recorded in other liabilities in the balance sheet. |
88
Table of Contents
MKS INSTRUMENTS, INC.
NOTES TO CONSOLIDATED FINANCIAL STATEMENTS — (continued)
(in thousands, except share and per share data)
| As of December 31, 2015 |
Gross | Accumulated Amortization |
Foreign Currency Translation |
Net | ||||||||||||
| Completed technology(1) |
$ | 101,200 | $ | (82,330 | ) | $ | (272 | ) | $ | 18,598 | ||||||
| Customer relationships(1) |
37,251 | (16,345 | ) | 10 | 20,916 | |||||||||||
| Patents, trademarks, trade names and other(1) |
30,396 | (25,888 | ) | 5 | 4,513 | |||||||||||
|
|
|
|
|
|
|
|
|
|||||||||
| $ | 168,847 | $ | (124,563 | ) | $ | (257 | ) | $ | 44,027 | |||||||
|
|
|
|
|
|
|
|
|
|||||||||
| (1) | During 2015, the Company recorded $5,110 of separately identified intangible assets related to the acquisition of Precisive, of which $820 was completed technology, $1,430 was customer relationships and $2,860 was patents, trademarks, trade names and other. |
Aggregate amortization expense related to acquired intangible assets for the years 2016, 2015 and 2014 was $35,681, $6,764 and $4,945, respectively. The amortization expense in 2016 is net of $569 amortization income from unfavorable lease commitments. Aggregate net amortization expense related to acquired intangible assets and unfavorable lease commitments for future years is:
| Year |
Amount | |||
| 2017 |
$ | 45,252 | ||
| 2018 |
42,563 | |||
| 2019 |
39,450 | |||
| 2020 |
27,580 | |||
| 2021 |
19,708 | |||
| Thereafter |
173,871 | |||
12) Other Assets
| Years Ended December 31, | ||||||||
| 2016 | 2015 | |||||||
| Other Assets: |
||||||||
| Long-term deferred tax asset |
$ | 5,092 | $ | 19,252 | ||||
| Other |
27,375 | 1,998 | ||||||
|
|
|
|
|
|||||
| Total other assets |
$ | 32,467 | $ | 21,250 | ||||
|
|
|
|
|
|||||
| 13) | Other Liabilities |
| Years Ended December 31, | ||||||||
| 2016 | 2015 | |||||||
| Other Current Liabilities: |
||||||||
| Product warranties |
$ | 8,200 | $ | 5,205 | ||||
| Other |
43,785 | 22,965 | ||||||
|
|
|
|
|
|||||
| Total other current liabilities |
$ | 51,985 | $ | 28,170 | ||||
|
|
|
|
|
|||||
| Other Liabilities: |
||||||||
| Long-term income taxes payable |
$ | 11,622 | $ | 4,483 | ||||
| Other |
9,139 | 949 | ||||||
|
|
|
|
|
|||||
| Total other liabilities |
$ | 20,761 | $ | 5,432 | ||||
|
|
|
|
|
|||||
89
Table of Contents
MKS INSTRUMENTS, INC.
NOTES TO CONSOLIDATED FINANCIAL STATEMENTS — (continued)
(in thousands, except share and per share data)
| 14) | Product Warranties |
The Company provides for the estimated costs to fulfill customer warranty obligations upon the recognition of the related revenue. While the Company engages in extensive product quality programs and processes, including actively monitoring and evaluating the quality of its component suppliers, the Company’s warranty obligation is affected by shipment volume, product failure rates, utilization levels, material usage and supplier warranties on parts delivered to the Company. Should actual product failure rates, utilization levels, material usage, or supplier warranties on parts differ from the Company’s estimates, revisions to the estimated warranty liability would be required. The product warranty liability is included in other current liabilities in the consolidated balance sheets.
Product warranty activities were as follows:
| Years Ended December 31, | ||||||||
| 2016 | 2015 | |||||||
| Beginning balance |
$ | 5,205 | $ | 6,266 | ||||
| Product warranty liability from Newport Merger |
3,040 | — | ||||||
| Provisions for product warranties |
8,858 | 4,343 | ||||||
| Direct charges to warranty liability |
(8,685 | ) | (5,296 | ) | ||||
| Foreign currency translation |
(157 | ) | (108 | ) | ||||
|
|
|
|
|
|||||
| Ending balance |
$ | 8,261 | $ | 5,205 | ||||
|
|
|
|
|
|||||
| 15) | Debt |
Term Loan Credit Agreement
In connection with the completion of the Newport Merger, the Company entered into a term loan credit agreement (the “Credit Agreement”) with Barclays Bank PLC, as administrative agent and collateral agent, and the lenders from time to time party thereto (the “Lenders”), that provided senior secured financing of $780,000, subject to increase at the Company’s option in accordance with the Credit Agreement (the “Term Loan Facility”). Borrowings under the Term Loan Facility bear interest per annum at one of the following rates selected by the Company: (a) a base rate determined by reference to the highest of (1) the federal funds effective rate plus 0.50%, (2) the “prime rate” quoted in The Wall Street Journal, (3) a LIBOR rate determined by reference to the costs of funds for U.S. dollar deposits for an interest period of one month adjusted for certain additional costs, plus 1.00%, and (4) a floor of 1.75%, plus, in each case, an applicable margin of 3.00%; or (b) a LIBOR rate determined by reference to the costs of funds for U.S. dollar deposits for the interest period relevant to such borrowing adjusted for certain additional costs, subject to a LIBOR rate floor of 0.75%, plus an applicable margin of 4.00%. The Company has elected the interest rate as described in clause (b). The Term Loan Facility was issued with original issue discount of 1.00% of the principal amount thereof.
On June 9, 2016, the Company entered into Amendment No. 1 (the “Re-pricing Amendment 1”) to the Credit Agreement by and among the Company, the Lenders and Barclays Bank PLC, as administrative agent and collateral agent for the Lenders. The Re-pricing Amendment 1 decreased the applicable margin for borrowings under the Company’s Term Loan Facility to 2.50% for base rate borrowings and 3.50% for LIBOR borrowings and extended the period during which a prepayment premium may be required for a “Re-pricing Transaction” (as defined in the Credit Agreement) until six months after the effective date of the Re-pricing Amendment 1. In
90
Table of Contents
MKS INSTRUMENTS, INC.
NOTES TO CONSOLIDATED FINANCIAL STATEMENTS — (continued)
(in thousands, except share and per share data)
connection with the execution of the Re-pricing Amendment 1, the Company paid a prepayment premium of 1.00%, or $7,300, as well as certain fees and expenses of the administrative agent and the Lenders, in accordance with the terms of the Credit Agreement. Immediately prior to the effectiveness of the Re-pricing Amendment 1, the Company prepaid $50,000 of principal under the Credit Agreement. In September 2016, the Company prepaid an additional $60,000 under the Credit Agreement.
On December 14, 2016, the Company entered into Amendment No. 2 (the “Re-pricing Amendment 2”) to the Credit Agreement by and among the Company, the Lenders and Barclays Bank PLC, as administrative agent and collateral agent for the Lenders (as amended from time to time, including Re-pricing Amendment No. 1). The Re-pricing Amendment 2 decreased the applicable margin for the Company’s term loan under the Credit Agreement to 2.75% for LIBOR borrowings with a LIBOR floor of 0.75% and 1.75% for base rate borrowings with a base rate floor of 1.75% and reset the period during which a prepayment premium may be required for a “Re-pricing Transaction” (as defined in the Credit Agreement) until six months after the effective date of the Re-pricing Amendment. In November 2016, prior to the effectiveness of the Re-pricing Amendment 2, the Company prepaid an additional $40,000 of principal under the Credit Agreement. After total 2016 prepayments of $150,000 and regularly scheduled principal payments of $3,395, the total outstanding principal balance was $626,605 as of December 31, 2016.
On September 30, 2016, the Company entered into an interest rate swap agreement, which has a maturity date of September 30, 2020, to fix the rate on $335,000 of the outstanding balance of the Credit Agreement. The rate is fixed at 1.198% per annum plus the credit spread of 3.50%.
The Company incurred $28,747 of deferred finance fees, original issue discount and a re-pricing fee related to the term loans, which are included in long-term debt in the accompanying consolidated balance sheets and will be amortized to interest expense over the estimated life of the term loans using the effective interest method. A portion of these fees have been written-off in connection with the various debt prepayments during 2016. The remaining balance of the deferred finance fees, original issue discount and re-pricing fee related to the Term Loan was $19,642 as of December 31, 2016.
Under the Credit Agreement, the Company is required to prepay outstanding term loans, subject to certain exceptions, with portions of its annual excess cash flow as well as with the net cash proceeds of certain asset sales, certain casualty and condemnation events and the incurrence or issuance of certain debt. The Company is also required to make scheduled quarterly payments each equal to 0.25% of the original principal amount of the term loans made on the closing date with such original principal amount reduced by any such prepayments (including the $150,000 prepaid to date in 2016), with the balance due on the seventh anniversary of the closing date.
All obligations under the Term Loan Facility are guaranteed by certain of the Company’s domestic subsidiaries, and are secured by substantially all of the Company’s assets and the assets of such subsidiaries, subject to certain exceptions and exclusions.
The Credit Agreement contains customary representations and warranties, affirmative and negative covenants and provisions relating to events of default. If an event of default occurs, the Lenders under the Term Loan Facility will be entitled to take various actions, including the acceleration of amounts due under the Term Loan Facility and all actions generally permitted to be taken by a secured creditor. At December 31, 2016, the Company is in compliance with all covenants under the Credit Agreement.
91
Table of Contents
MKS INSTRUMENTS, INC.
NOTES TO CONSOLIDATED FINANCIAL STATEMENTS — (continued)
(in thousands, except share and per share data)
Senior Secured Asset-Based Revolving Credit Facility
In connection with the completion of the Newport Merger, the Company also entered into an asset-based credit agreement with Deutsche Bank AG New York Branch, as administrative agent and collateral agent, the other borrowers from time to time party thereto, and the lenders and letters of credit issuers from time to time party thereto (the “ABL Facility”), that provides senior secured financing of up to $50,000, subject to a borrowing base limitation. The borrowing base for the ABL Facility at any time equals the sum of: (a) 85% of certain eligible accounts; plus (b) subject to certain notice and field examination and appraisal requirements, the lesser of (i) the lesser of (A) 65% of the lower of cost or market value of certain eligible inventory and (B) 85% of the net orderly liquidation value of certain eligible inventory and (ii) 30% of the borrowing base; minus (c) reserves established by the administrative agent; provided that until the administrative agent’s receipt of a field examination of accounts receivable the borrowing base shall be equal to 70% of the book value of certain eligible accounts. The ABL Facility includes borrowing capacity in the form of letters of credit up to $15,000. The Company has not drawn against the ABL Facility.
Borrowings under the ABL Facility bear interest per annum at one of the following rates selected by the Company: (a) a base rate determined by reference to the highest of (1) the federal funds effective rate plus 0.50%, (2) the “prime rate” quoted in The Wall Street Journal, and (3) a LIBOR rate determined by reference to the costs of funds for U.S. dollar deposits for an interest period of one month adjusted for certain additional costs, plus 1.00%, plus, in each case, an initial applicable margin of 0.75%; and (b) a LIBOR rate determined by reference to the costs of funds for U.S. dollar deposits for the interest period relevant to such borrowing adjusted for certain additional costs, plus an initial applicable margin of 1.75%. Commencing with the completion of the first fiscal quarter ending after the closing of the ABL Facility, the applicable margin for borrowings thereunder is subject to upward or downward adjustment each fiscal quarter, based on the average historical excess availability during the preceding quarter.
The Company incurred $1,201 of costs in connection with the ABL Facility, which were capitalized and included in other assets in the accompanying consolidated balance sheets and will be amortized to interest expense using the straight-line method over the contractual term of five years of the ABL Facility.
In addition to paying interest on outstanding principal under the ABL Facility, the Company is required to pay a commitment fee in respect of the unutilized commitments thereunder. The initial commitment fee is 0.375% per annum. The total commitment fee recognized in interest expense in 2016 was $128. Commencing with the completion of the first fiscal quarter ending after the closing of the ABL Facility, the commitment fee is subject to downward adjustment based on the amount of average unutilized commitments for the three-month period immediately preceding such adjustment date. The Company must also pay customary letter of credit fees and agency fees.
Lines of Credit and Short-Term Borrowing Arrangements
One of the Company’s Japanese subsidiaries has lines of credit and short-term borrowing arrangements with two financial institutions which arrangements generally expire and are renewed at three-month intervals. The lines of credit provided for aggregate borrowings as of December 31, 2016 of up to an equivalent of $19,675 U.S. dollars. One of the borrowing arrangements has an interest rate based on the Tokyo Interbank Offer Rate at the time of borrowing and the other has an interest rate based on the Japanese Short-term Prime Lending Rate. There were no borrowings outstanding under these arrangements at December 31, 2016 and 2015.
92
Table of Contents
MKS INSTRUMENTS, INC.
NOTES TO CONSOLIDATED FINANCIAL STATEMENTS — (continued)
(in thousands, except share and per share data)
The Company assumed various revolving lines of credit and a financing facility with the completion of the Newport Merger. These revolving lines of credit and financing facility have no expiration date and provided for aggregate borrowings as of December 31, 2016 of up to an equivalent of $10,693 U.S. dollars. These lines of credit have a base interest rate of 1.25% plus a Japanese Yen overnight LIBOR rate.
One of the Company’s Austrian subsidiaries has four outstanding loans from the Austrian government to fund research and development. These loans are unsecured and do not require principal repayment as long as certain conditions are met. Interest on these loans is payable semi-annually. The interest rates associated with these loans range from 0.75%—2.00%.
| Short-term debt: | December 31, 2016 | |||
| Japanese lines of credit |
$ | 4,245 | ||
| Japanese receivables financing facility |
458 | |||
| Other debt |
8 | |||
| Current portion of Term Loan Facility |
6,282 | |||
|
|
|
|||
| $ | 10,993 | |||
|
|
|
|||
| Long-term debt: | December 31, 2016 | |||
| Austrian loans due through March 2020 |
$ | 548 | ||
| Term Loan Facility, net(1) |
600,681 | |||
|
|
|
|||
| Other debt |
$ | 601,229 | ||
|
|
|
|||
| (1) | Net of deferred financing fees, original issuance discount and re-pricing fee of $19,642. |
The Company recognized interest expense of $30,611 in 2016, primarily related to the Term Loan Facility.
Contractual maturities of the Company’s debt obligations as of December 31, 2016 are as follows:
| Year |
Amount | |||
| 2017 |
$ | 10,993 | ||
| 2018 |
6,388 | |||
| 2019 |
6,681 | |||
| 2020 |
6,324 | |||
| 2021 |
6,282 | |||
| Thereafter |
595,196 | |||
93
Table of Contents
MKS INSTRUMENTS, INC.
NOTES TO CONSOLIDATED FINANCIAL STATEMENTS — (continued)
(in thousands, except share and per share data)
| 16) | Income Taxes |
A reconciliation of the Company’s effective tax rate to the U.S. federal statutory rate is as follows:
| Years Ended December 31, | ||||||||||||
| 2016 | 2015 | 2014 | ||||||||||
| U.S. Federal income tax statutory rate |
35.0 | % | 35.0 | % | 35.0 | % | ||||||
| Federal tax credits |
(1.8 | ) | (1.2 | ) | (1.0 | ) | ||||||
| State income taxes, net of federal benefit |
0.8 | 1.3 | 2.0 | |||||||||
| Effect of foreign operations taxed at various rates |
(12.7 | ) | (6.4 | ) | (7.3 | ) | ||||||
| Qualified production activity tax benefit |
(2.9 | ) | (1.6 | ) | (1.8 | ) | ||||||
| Deferred tax asset valuation allowance |
2.1 | — | (0.5 | ) | ||||||||
| Release of income tax reserves (including interest) |
(2.4 | ) | (4.8 | ) | (10.7 | ) | ||||||
| Foreign dividends, net of foreign tax credits |
(2.2 | ) | 0.7 | (1.0 | ) | |||||||
| Acquisition and integration related costs |
1.5 | — | — | |||||||||
| Other |
0.7 | 0.3 | 0.4 | |||||||||
|
|
|
|
|
|
|
|||||||
| 18.1 | % | 23.3 | % | 15.1 | % | |||||||
|
|
|
|
|
|
|
|||||||
The components of income from continuing operations before income taxes and the related provision for income taxes consist of the following:
| Years Ended December 31, | ||||||||||||
| 2016 | 2015 | 2014 | ||||||||||
| Income from continuing operations before income taxes: |
||||||||||||
| United States |
$ | 42,491 | $ | 90,401 | $ | 86,015 | ||||||
| Foreign |
85,486 | 69,067 | 50,378 | |||||||||
|
|
|
|
|
|
|
|||||||
| $ | 127,977 | $ | 159,468 | $ | 136,393 | |||||||
|
|
|
|
|
|
|
|||||||
| Current taxes: |
||||||||||||
| United States |
$ | 17,693 | $ | 15,813 | $ | 8,361 | ||||||
| State |
2,359 | 2,927 | 1,124 | |||||||||
| Foreign |
41,938 | 18,021 | 5,866 | |||||||||
|
|
|
|
|
|
|
|||||||
| 61,990 | 36,761 | 15,351 | ||||||||||
| Deferred taxes: |
||||||||||||
| United States |
(23,604 | ) | (862 | ) | 8,908 | |||||||
| State and Foreign |
(15,218 | ) | 1,272 | (3,644 | ) | |||||||
|
|
|
|
|
|
|
|||||||
| (38,822 | ) | 410 | 5,264 | |||||||||
|
|
|
|
|
|
|
|||||||
| Provision for income taxes |
$ | 23,168 | $ | 37,171 | $ | 20,615 | ||||||
|
|
|
|
|
|
|
|||||||
94
Table of Contents
MKS INSTRUMENTS, INC.
NOTES TO CONSOLIDATED FINANCIAL STATEMENTS — (continued)
(in thousands, except share and per share data)
The significant components of the deferred tax assets and deferred tax liabilities are as follows:
| Years Ended December 31, | ||||||||
| 2016 | 2015 | |||||||
| Deferred tax assets: |
||||||||
| Carry-forward losses and credits |
$ | 50,673 | $ | 8,531 | ||||
| Inventory and warranty reserves |
24,253 | 15,404 | ||||||
| Accrued expenses and other reserves |
16,176 | 2,343 | ||||||
| Stock-based compensation |
8,995 | 3,713 | ||||||
| Executive supplemental retirement benefits |
6,888 | 3,947 | ||||||
|
|
|
|
|
|||||
| Total deferred tax assets |
$ | 106,985 | $ | 33,938 | ||||
|
|
|
|
|
|||||
| Deferred tax liabilities: |
||||||||
| Acquired intangible assets |
(127,571 | ) | (9,434 | ) | ||||
| Depreciation and amortization |
(16,428 | ) | (1,724 | ) | ||||
| Loan costs |
(7,282 | ) | — | |||||
| Unrealized gain |
(3,195 | ) | — | |||||
| Other |
(1,336 | ) | (57 | ) | ||||
|
|
|
|
|
|||||
| Total deferred tax liabilities |
(155,812 | ) | (11,215 | ) | ||||
|
|
|
|
|
|||||
| Valuation allowance |
(12,527 | ) | (6,127 | ) | ||||
|
|
|
|
|
|||||
| Net deferred tax (liabilities) assets |
$ | (61,354 | ) | $ | 16,596 | |||
|
|
|
|
|
|||||
As of December 31, 2016, the Company had federal, state and foreign gross research and other tax credit carry-forwards of $63,925. These credit carry-forwards will expire at various dates through 2036. The Company also had federal, state and foreign gross net operating loss carry-forwards of $50,434. Included in the total carry-forward are $28,476 of losses that can be carried forward indefinitely while the remaining losses of $21,958 begin to expire in 2020.
Although the Company believes that its tax positions are consistent with applicable U.S. federal, state and international laws, it maintains certain tax reserves as of December 31, 2016 in the event its tax positions were to be challenged by the applicable tax authority and additional tax assessed on audit.
A reconciliation of the beginning and ending amount of gross unrecognized tax benefits is as follows:
| Years Ended December 31, | ||||||||||||
| 2016 | 2015 | 2014 | ||||||||||
| Balance at beginning of year |
$ | 4,332 | $ | 19,610 | $ | 47,684 | ||||||
| Decreases for prior years |
(195 | ) | (26 | ) | (13 | ) | ||||||
| Increases for the current year |
23,940 | 322 | 550 | |||||||||
| Reductions related to settlements with taxing authorities |
— | (15,370 | ) | (18,235 | ) | |||||||
| Reductions related to expiration of statute of limitations |
(2,612 | ) | (204 | ) | (10,376 | ) | ||||||
|
|
|
|
|
|
|
|||||||
| Balance at end of year |
$ | 25,465 | $ | 4,332 | $ | 19,610 | ||||||
|
|
|
|
|
|
|
|||||||
As of December 31, 2016, the total amount of gross unrecognized tax benefits, which excludes interest and penalties, was $25,465. As of December 31, 2015, the total amount of gross unrecognized tax benefits, which
95
Table of Contents
MKS INSTRUMENTS, INC.
NOTES TO CONSOLIDATED FINANCIAL STATEMENTS — (continued)
(in thousands, except share and per share data)
excludes interest and penalties, was $4,332. The net increase from December 31, 2015 was primarily attributable to the addition of historical unrecognized tax benefits for Newport and its subsidiaries which were included as a result of the acquisition of Newport in April 2016. As of December 31, 2016, excluding interest and penalties, there are $18,417 of net unrecognized tax benefits that, if recognized, would impact the Company’s annual effective tax rate. In 2016, the Company recorded a net benefit to income tax expense of $2,606, excluding interest and penalties, due to the release of income tax reserves related to the expiration of certain statutes of limitation.
The Company accrues interest and, if applicable, penalties for any uncertain tax positions. Interest and penalties are classified as a component of income tax expense. As of December 31, 2016, 2015 and 2014, the Company had accrued interest on unrecognized tax benefits of approximately $491, $157 and $578, respectively.
Over the next 12 months it is reasonably possible that the Company may recognize approximately $3,100 of previously net unrecognized tax benefits, excluding interest and penalties, related to state and foreign tax positions as a result of the expiration of statutes of limitation. The Company is subject to examination by U.S. federal, state and foreign tax authorities. The United States Internal Revenue Service commenced an examination of our U.S. federal tax filings for tax years 2011 through 2013 during the quarter ended March 31, 2015. This audit was effectively settled during the quarter ended December 31, 2015 upon the Company’s acceptance of the income tax examination changes. As part of the audit the Company consented to extend the U.S. statute of limitations for tax year 2011. The U.S. statute of limitations for tax year 2011 expired September 30, 2016.
The Company also effectively settled another U.S. federal income tax examination, for tax years 2007 through 2009, during the quarter ended December 31, 2014 upon receipt of an audit approval letter from the Joint Committee on Taxation. The statute of limitations for tax years 2007 through 2009 expired on December 31, 2015.
The U.S. statute of limitations remains open for tax years 2013 through present. The statute of limitations for tax filings in other jurisdictions varies between fiscal years 2007 through present. The company also has certain federal credit carry-forwards and state tax loss and credit carry-forwards that are open for examination for tax years 2000 through the present.
On a quarterly basis, the Company evaluates both positive and negative evidence that affects the realizability of net deferred tax assets and assesses the need for a valuation allowance. The future benefit to be derived from its deferred tax assets is dependent upon its ability to generate sufficient future taxable income to realize the assets.
During 2016, the Company increased its valuation allowance by $6,400 primarily related to the addition of historical valuation allowances for Newport and its subsidiaries which were included as a result of the acquisition in April 2016. During 2015, the Company decreased its valuation allowance by $20,636, primarily related to the expiration of U.S. capital loss carry-forwards. During 2014, the Company decreased its valuation allowance by $339, primarily related to the effective settlement of a foreign tax audit.
Through December 31, 2016, the Company has not provided deferred income taxes on the undistributed earnings of its foreign subsidiaries because such earnings are intended to be permanently reinvested outside of the United States. Determination of the potential deferred income tax liability on these undistributed earnings is not practicable because such liability, if any, is dependent on circumstances existing and tax planning choices available when remittance occurs. At December 31, 2016, the Company had approximately $545,000 of undistributed earnings in its foreign subsidiaries which are considered to be indefinitely reinvested.
96
Table of Contents
MKS INSTRUMENTS, INC.
NOTES TO CONSOLIDATED FINANCIAL STATEMENTS — (continued)
(in thousands, except share and per share data)
The Company’s Israeli subsidiaries have elected to be treated under a preferential Israeli tax regime under which their taxable income is taxed at reduced tax rates. These reduced rates range anywhere between 9% and 16%. One of the Company’s Israeli subsidiaries effectively settled an examination for tax years 2009 through 2011 during the quarter ended March 31, 2014.
| 17) | Stockholders’ Equity |
Stock Repurchase Program
On July 25, 2011, the Company’s board of directors approved a share repurchase program for the repurchase of up to an aggregate of $200,000 of its outstanding common stock from time to time in open market purchases, privately negotiated transactions or through other appropriate means. The timing and quantity of any shares repurchased will depend upon a variety of factors, including business conditions, stock market conditions and business development activities, including, but not limited to, merger and acquisition opportunities. These repurchases may be commenced, suspended or discontinued at any time without prior notice. The Company has repurchased approximately 1,770,000 shares of common stock for approximately $52,000 pursuant to the program since its adoption.
During 2016, the Company repurchased 44,798 shares of its common stock for $1,545 at an average price of $34.50 per share. During 2015, the Company repurchased 369,133 shares of its common stock for $13,294 at an average price of $36.01 per share.
Cash Dividends
Holders of the Company’s common stock are entitled to receive dividends when and if they are declared by the Company’s board of directors. During 2016, the Company’s board of directors declared a cash dividend of $0.17 per share during the first, second, third and fourth quarters, which totaled $36,361. During 2015, the Company’s board of directors declared a cash dividend of $0.165 per share during the first quarter of 2015 and a cash dividend of $0.17 per share during the second, third and fourth quarters of 2015, which totaled $35,969.
Future dividend declarations, if any, as well as the record and payment dates for such dividends, are subject to the final determination of the Company’s board of directors.
On February 13, 2017, the Company’s board of directors declared a quarterly cash dividend of $0.175 per share to be paid on March 10, 2017 to shareholders of record as of February 27, 2017.
| 18) | Stock-Based Compensation |
Employee Stock Purchase Plans
The Company’s Fourth Restated 1999 Employee Stock Purchase Plan (the “Purchase Plan”) authorized the issuance of up to an aggregate of 1,950,000 shares of common stock to participating employees. Offerings under the Purchase Plan commenced on June 1 and December 1 of each year and terminated the following November 30 and May 31, respectively. Under the Purchase Plan, eligible employees purchased shares of common stock through payroll deductions of up to 10% of their compensation or up to an annual maximum amount of $21,250. The price at which an employee’s purchase option was exercised was the lower of (1) 85% of the closing price of the common stock on the NASDAQ Global Select Market on the day that each offering commenced, or (2) 85% of the closing price on the day that each offering terminated. During 2014, the Company
97
Table of Contents
MKS INSTRUMENTS, INC.
NOTES TO CONSOLIDATED FINANCIAL STATEMENTS — (continued)
(in thousands, except share and per share data)
issued 69,474 shares of common stock to employees who participated in the Purchase Plan at an exercise price of $24.52 per share. As of June 1, 2014, the Purchase Plan was replaced by the 2014 Employee Stock Purchase Plan (the “2014 ESPP Plan”).
The Company’s Third Amended and Restated International Employee Stock Purchase Plan (the “Foreign Purchase Plan”) authorized the issuance of up to an aggregate of 400,000 shares of common stock to participating employees. Offerings under the Foreign Purchase Plan commenced on June 1 and December 1 of each year and terminated the following November 30 and May 31, respectively. Under the Foreign Purchase Plan, eligible employees purchased shares of common stock through payroll deductions of up to 10% of their compensation or up to an annual maximum amount of $21,250. The price at which an employee’s purchase option was exercised was the lower of (1) 85% of the closing price of the common stock on the NASDAQ Global Select Market on the day that each offering commenced, or (2) 85% of the closing price on the day that each offering terminated. During 2014, the Company issued 20,053 shares of common stock to employees who participated in the Foreign Purchase Plan at an exercise price of $24.52 per share. As of June 1, 2014, the Foreign Purchase Plan was replaced by the 2014 ESPP Plan.
The 2014 ESPP Plan was adopted by the Board of Directors on February 10, 2014 and approved by the Company’s stockholders on May 5, 2014. The 2014 ESPP Plan authorizes the issuance of up to an aggregate of 2,500,000 shares of common stock to participating employees. Offerings under the 2014 ESPP Plan commence on June 1 and December 1 and terminate, respectively, on November 30 and May 31. Under the 2014 ESPP Plan, eligible employees may purchase shares of common stock through payroll deductions of up to 10% of their compensation or up to an annual maximum amount of $21,250. The price at which an employee’s purchase option is exercised is the lower of (1) 85% of the closing price of the common stock on the NASDAQ Global Select Market on the day that each offering commences, or (2) 85% of the closing price on the day that each offering terminates. During 2016, 2015, and 2014, the Company issued 139,079, 140,531, and 82,481 shares, respectively, of common stock to employees who participated in the 2014 ESPP Plan at exercise prices of $31.40 and $35.16 per share in 2016, $30.74 and $31.34 per share in 2015, and $24.33 per share in 2014. As of December 31, 2016, there were 2,137,909 shares reserved for future issuance under the 2014 ESPP Plan.
Equity Incentive Plans
The Company has granted options to employees under the 2004 Stock Incentive Plan (the “2004 Plan”) and the Second Restated 1995 Stock Incentive Plan (the “1995 Plan”), and to directors under the 1997 Director Stock Plan (the “1997 Director Plan”); the Company has also granted restricted stock units (“RSUs”) to employees and directors under the 2004 Plan and the 2014 Stock Incentive Plan (the “2014 Plan” and together with the 2004 Plan, the 1995 Plan, and the 1997 Director Plan, the “Plans”). The Plans are administered by the Compensation Committee of the Company’s Board of Directors.
The Plans are intended to attract and retain employees and to provide an incentive for them to assist the Company to achieve long-range performance goals and to enable them to participate in the long-term growth of the Company. Employees may be granted RSUs, options to purchase shares of the Company’s stock and other equity incentives under the Plans.
The Company’s 2014 Plan was adopted by the Board of Directors on February 10, 2014 and approved by the Company’s stockholders on May 5, 2014. Up to 18,000,000 shares of common stock (subject to adjustment in the event of stock splits and other similar events) may be issued pursuant to awards granted under the 2014 Plan. The Company may grant options, RSUs, restricted stock, stock appreciation rights and other stock-based awards
98
Table of Contents
MKS INSTRUMENTS, INC.
NOTES TO CONSOLIDATED FINANCIAL STATEMENTS — (continued)
(in thousands, except share and per share data)
to employees, officers, directors, consultants and advisors under the 2014 Plan. Any full-value awards granted under the 2014 Plan will be counted against the shares reserved for issuance under the 2014 Plan as 2.4 shares for each share of common stock subject to such award and any award granted under the 2014 Plan that is not a full-value award (including, without limitation, any option or SAR) will be counted against the shares reserved for issuance under the plan as one share for each one share of common stock subject to such award. “Full-value award” means any RSU, or other stock-based award with a per share price or per unit purchase price lower than 100% of fair market value on the date of grant. To the extent a share that was subject to an award that counted as one share is returned to the 2014 Plan, each applicable share reserve will be credited with one share. To the extent that a share that was subject to an award that counts as 2.4 shares is returned to the 2014 Plan, each applicable share reserve will be credited with 2.4 shares. As of December 31, 2016, there were 15,306,423 shares reserved for future issuance under the 2014 Plan.
The Company’s 2004 Plan expired in March 2014 and no further awards may be granted under the 2004 Plan, although there are still outstanding RSUs which may vest under the 2004 Plan. The Company’s 1995 Plan expired in November 2005 and no further awards may be granted under the 1995 Plan. The Company’s 1997 Director Plan expired in February 2007 and no further awards may be granted under the 1997 Director Plan.
Stock options were granted at an exercise price equal to 100% of the fair value of the Company’s common stock on the date of grant. Generally, stock options granted to employees under the 1995 Plan and the 2004 Plan from 2001 to 2006, vested 25% after one year and 6.25% per quarter thereafter, and expired 10 years after the grant date. Options granted to directors generally vested at the earliest of (1) one day prior to the next annual meeting, (2) 13 months from the date of grant, or (3) the effective date of an acquisition. There were no remaining outstanding stock options as of December 31, 2016 and 2015, respectively under any of the Plans. RSUs granted to employees in 2016, 2015 and 2014 generally vest 33.3% per year on the anniversary of the date of grant. RSUs granted to certain employees who are at least 60 years old and have a minimum of 10 Years of Service (as defined in the applicable RSU agreement) are expensed immediately. RSUs granted to directors generally vest at the earliest of (1) one day prior to the next annual meeting, (2) 13 months from date of grant, or (3) the effective date of a change in control of the Company. Certain RSUs are subject to performance conditions (“performance shares”) under the Company’s 2004 Plan and 2014 Plan. Such performance shares are available, subject to time-based vesting conditions, if, and to the extent that, financial or operational performance criteria for the applicable period are achieved. Accordingly, the number of performance shares earned will vary based on the level of achievement of financial or operational performance objectives for the applicable period.
In connection with the completion of the Newport Merger, the Company assumed:
| • | all RSUs granted under any Newport equity plan that were outstanding immediately prior to the effective time of the Newport Merger, and as to which shares of Newport common stock were not fully distributed in connection with the closing of the Newport Merger, and |
| • | all stock appreciation rights granted under any Newport equity plan, whether vested or unvested, that were outstanding immediately prior to the effective time of the Newport Merger. |
As of the effective time of the Newport Merger, based on a formula provided in the Merger Agreement, (a) the Newport RSUs were converted automatically into RSUs with respect to 360,674 shares of the Company’s common stock (the “Assumed RSUs”), and (b) the Newport stock appreciation rights were converted automatically into stock appreciation rights with respect to 899,851 shares of the Company’s common stock (the “Assumed SARs”).
99
Table of Contents
MKS INSTRUMENTS, INC.
NOTES TO CONSOLIDATED FINANCIAL STATEMENTS — (continued)
(in thousands, except share and per share data)
Included in the total number of Assumed RSUs were 36,599 RSUs for outside directors that were part of the Newport Deferred Compensation Plan (the “DC Plan”), from which 19,137 underlying shares were released in May 2016. As of December 31, 2016, 17,462 Company RSUs remained outstanding under the DC Plan, and an additional 187 shares of the Company’s common stock were added to the DC Plan due to reinvested dividends. These Assumed RSUs will not become issued shares until their respective release dates.
The shares of the Company’s common stock that are subject to the Assumed SARs and the Assumed RSUs are issuable pursuant to the Company’s 2014 Plan.
The 1,260,525 shares of the Company’s common stock that are issuable pursuant to the Assumed RSUs and the Assumed SARs under the 2014 Plan were registered under the Securities Act of 1933, as amended (“Securities Act”), on a registration statement on Form S-8. These shares are in addition to the 18,000,000 shares of the Company’s common stock reserved for issuance under the 2014 Plan and previously registered under the Securities Act on a registration statement on Form S-8.
The following table presents the activity for RSUs under the Plans:
| Year Ended December 31, | ||||||||
| 2016 | ||||||||
| Non-vested RSUs | Weighted Average Grant Date Fair Value |
|||||||
| Non-vested RSUs — beginning of period |
733,162 | $ | 30.94 | |||||
| Assumed RSUs from Newport acquisition |
360,674 | 35.01 | ||||||
| Accrued dividend shares |
187 | 47.84 | ||||||
| Granted |
746,721 | 35.62 | ||||||
| Vested |
(434,951 | ) | 31.20 | |||||
| Forfeited or expired |
(80,277 | ) | 34.51 | |||||
|
|
|
|
|
|||||
| Non-vested RSUs — end of period |
1,325,516 | $ | 34.38 | |||||
|
|
|
|
|
|||||
The following table presents the activity for SARs under the Plans:
| Year Ended December 31, | ||||||||
| 2016 | ||||||||
| Non-vested SARs | Weighted Average Base Value |
|||||||
| SARs — beginning of period |
— | $ | — | |||||
| Assumed SARs from Newport acquisition |
899,851 | 27.71 | ||||||
| Granted |
— | — | ||||||
| Exercised |
(280,106 | ) | 26.70 | |||||
| Forfeited or expired |
(20,411 | ) | 30.29 | |||||
|
|
|
|
|
|||||
| SARs Outstanding — end of period |
599,334 | $ | 28.10 | |||||
|
|
|
|
|
|||||
There were no options outstanding or exercisable under the Plans at December 31, 2016 and 2015, respectively.
100
Table of Contents
MKS INSTRUMENTS, INC.
NOTES TO CONSOLIDATED FINANCIAL STATEMENTS — (continued)
(in thousands, except share and per share data)
At December 31, 2016, the Company’s outstanding and exercisable stock appreciation rights, the weighted-average base value, the weighted average remaining contractual life and the aggregate intrinsic value thereof, were as follows:
| Number of Shares |
Weighted Average Base Value |
Weighted Average Remaining Contractual Life (years) |
Aggregate Intrinsic Value |
|||||||||||||
| Stock appreciation rights outstanding |
599,334 | $ | 28.10 | 3.9 | $ | 18,758 | ||||||||||
| Stock appreciation rights exercisable |
377,722 | $ | 26.62 | 3.3 | $ | 12,383 | ||||||||||
The total cash received from employees as a result of employee stock option exercises during 2015 was approximately $592. In connection with these exercises, the tax benefit realized by the Company in 2015 was approximately $21. There were no stock options outstanding during 2016.
The Company settles employee stock option exercises, restricted stock unit vesting and stock appreciation rights exercises with newly issued shares of the Company’s common stock.
Stock-Based Compensation Expense
The Company recognized the full impact of its share-based payment plans in the consolidated statements of operations and comprehensive income for the years 2016, 2015 and 2014. As of December 31, 2016 and 2015, the Company capitalized $471 of such cost on its consolidated balance sheet. The following table reflects the effect of recording stock-based compensation for the years 2016, 2015 and 2014:
| Years Ended December 31, | ||||||||||||
| 2016 | 2015 | 2014 | ||||||||||
| Stock-based compensation expense by type of award: |
||||||||||||
| Restricted stock units |
$ | 23,302 | $ | 11,885 | $ | 10,203 | ||||||
| Stock appreciation rights |
700 | — | — | |||||||||
| Employee stock purchase plan |
1,226 | 1,128 | 1,112 | |||||||||
|
|
|
|
|
|
|
|||||||
| Total stock-based compensation |
25,228 | 13,013 | 11,315 | |||||||||
| Tax effect on stock-based compensation |
(1,254 | ) | (836 | ) | (331 | ) | ||||||
|
|
|
|
|
|
|
|||||||
| Net effect on net income |
$ | 23,974 | $ | 12,177 | $ | 10,984 | ||||||
|
|
|
|
|
|
|
|||||||
| Effect on net earnings per share: |
||||||||||||
| Basic |
$ | 0.45 | $ | 0.23 | $ | 0.21 | ||||||
|
|
|
|
|
|
|
|||||||
| Diluted |
$ | 0.44 | $ | 0.23 | $ | 0.21 | ||||||
|
|
|
|
|
|
|
|||||||
101
Table of Contents
MKS INSTRUMENTS, INC.
NOTES TO CONSOLIDATED FINANCIAL STATEMENTS — (continued)
(in thousands, except share and per share data)
The pre-tax effect within the consolidated statements of operations and comprehensive income of recording stock-based compensation for the years 2016, 2015 and 2014 was as follows:
| Years Ended December 31, | ||||||||||||
| 2016 | 2015 | 2014 | ||||||||||
| Cost of revenues |
$ | 2,997 | $ | 1,814 | $ | 1,960 | ||||||
| Research and development expense |
2,529 | 1,590 | 1,659 | |||||||||
| Selling, general and administrative expense |
19,702 | 9,609 | 7,696 | |||||||||
|
|
|
|
|
|
|
|||||||
| Total pre-tax stock-based compensation expense |
$ | 25,228 | $ | 13,013 | $ | 11,315 | ||||||
|
|
|
|
|
|
|
|||||||
Valuation Assumptions
The Company determines the fair value of RSUs based on the closing market price of the Company’s common stock on the date of the award, and estimates the fair value of stock options and employee stock purchase plan rights using the Black-Scholes valuation model. Such values are recognized as expense on a straight-line basis over the requisite service periods, net of estimated forfeitures except for retirement eligible employees in which the Company expenses the fair value of the grant in the period the grant is issued. The estimation of stock-based awards that will ultimately vest requires significant judgment. The Company considers many factors when estimating expected forfeitures, including types of awards and historical experience. Actual results, and future changes in estimates, may differ substantially from the Company’s current estimates.
The Company did not grant options during 2016, 2015 and 2014. There were no options outstanding in 2016. The total intrinsic value of options exercised during 2015 and 2014 was approximately $494 and $958, respectively.
The weighted average fair value per share of employee stock purchase plan rights granted in 2016, 2015 and 2014 was $8.52, $8.16 and $6.37, respectively. The fair value of the employees’ purchase plan rights was estimated using the Black-Scholes option-pricing model with the following weighted average assumptions:
| Years Ended December 31, | ||||||||||||
| 2016 | 2015 | 2014 | ||||||||||
| Employee stock purchase plan rights: |
||||||||||||
| Expected life (years) |
0.5 | 0.5 | 0.5 | |||||||||
| Risk-free interest rate |
0.5 | % | 0.1 | % | 0.1 | % | ||||||
| Expected volatility |
25.4 | % | 26.4 | % | 26.4 | % | ||||||
| Expected annual dividends per share |
$ | 0.68 | $ | 0.675 | $ | 0.655 | ||||||
Expected volatilities for 2016, 2015 and 2014 are based on a combination of implied and historical volatilities of the Company’s common stock; the expected life represents the weighted average period of time that options granted are expected to be outstanding giving consideration to vesting schedules and the Company’s historical exercise patterns; and the risk-free interest rate is based on the U.S. Treasury yield curve in effect at the time of grant for periods corresponding with the expected life of the option.
The total intrinsic value of options exercised, stock appreciation rights exercised and the total fair value of RSUs vested during 2016, 2015 and 2014 was approximately $18,844, $12,868 and $12,106, respectively. As of December 31, 2016, the unrecognized compensation cost related to RSUs and stock appreciation rights was approximately $23,446 and will be recognized over an estimated weighted average amortization period of 0.93 years.
102
Table of Contents
MKS INSTRUMENTS, INC.
NOTES TO CONSOLIDATED FINANCIAL STATEMENTS — (continued)
(in thousands, except share and per share data)
| 19) | Employee Benefit Plans |
The Company has a 401(k) profit-sharing plan for U.S. employees meeting certain requirements in which eligible employees may contribute between 1% and 50% of their annual compensation to this plan, and, with respect to employees who are age 50 and older, certain specified additional amounts, limited by an annual maximum amount determined by the Internal Revenue Service. The Company, at its discretion, makes certain matching contributions to these plans based on participating employees’ contributions to the plans and their total compensation. The Company’s contributions were $6,524, $2,667 and $2,484 for 2016, 2015 and 2014, respectively.
The Company maintains a bonus plan which provides cash awards to key employees, at the discretion of the compensation committee of the board of directors, based upon operating results and employee performance. In addition, the Company’s foreign locations also have various bonus plans based upon local operating results and employee performance. The total bonus expense was $28,097, $14,599 and $14,434 for 2016, 2015 and 2014, respectively.
The Company provides supplemental retirement benefits for one of its current executive officers and a number of former retired executives. The total cost of these benefits was $1,805, $1,704 and $2,258 for 2016, 2015 and 2014, respectively. The accumulated benefit obligation was $12,450 and $10,645 at December 31, 2016 and 2015, respectively, which was included in other long-term liabilities.
The Company also has a deferred compensation plan for certain Light & Motion segment executives.
Defined Benefit Pension Plans
As a result of the Newport Merger, the Company has assumed all assets and liabilities of Newport’s defined benefit pension plans, which cover substantially all of its full-time employees in France, Germany, Israel and Japan. In addition, there are certain pension assets and liabilities relating to former employees in the United Kingdom. The German plan is unfunded, as permitted under the plan and applicable laws.
For financial reporting purposes, the calculation of net periodic pension costs was based upon a number of actuarial assumptions including a discount rate for plan obligations, an assumed rate of return on pension plan assets and an assumed rate of compensation increase for employees covered by the plan. All of these assumptions were based upon management’s judgment, considering all known trends and uncertainties. Actual results that differ from these assumptions would impact future expense recognition and the cash funding requirements of the Company’s pension plans.
The net periodic benefit costs for the plans included the following components:
| Year
Ended December 31, 2016 |
||||
| Service cost |
$ | 479 | ||
| Interest cost on projected benefit obligations |
377 | |||
| Expected return on plan assets |
(84 | ) | ||
| Amortization of actuarial net loss |
406 | |||
|
|
|
|||
| $ | 1,178 | |||
|
|
|
|||
103
Table of Contents
MKS INSTRUMENTS, INC.
NOTES TO CONSOLIDATED FINANCIAL STATEMENTS — (continued)
(in thousands, except share and per share data)
The changes in projected benefit obligations and plan assets, as well as the ending balance sheet amounts for the Company’s defined benefit plans, were as follows:
| December 31, 2016 | ||||
| Change in projected benefit obligations: |
||||
| Projected benefit obligations, beginning of year(1) |
$ | 2,134 | ||
| Liabilities assumed through acquisition |
22,437 | |||
| Service cost |
479 | |||
| Interest cost |
377 | |||
| Actuarial (gain) loss |
1,085 | |||
| Benefits paid |
(897 | ) | ||
| Currency translation adjustments |
(2,165 | ) | ||
|
|
|
|||
| Projected benefit obligations, end of year |
$ | 23,450 | ||
|
|
|
|||
| Change in plan assets: |
||||
| Fair value of plan assets, beginning of year(1) |
$ | 301 | ||
| Assets acquired through acquisition |
7,896 | |||
| Company contributions |
741 | |||
| Gain on plan assets |
66 | |||
| Benefits paid |
(437 | ) | ||
| Currency translation adjustments |
(895 | ) | ||
|
|
|
|||
| Fair value of plan assets, end of year |
7,672 | |||
|
|
|
|||
| Net underfunded status |
$ | (15,778 | ) | |
|
|
|
|||
| (1) | The beginning of the year balances relate to plans held in Taiwan and Germany in the Vacuum & Analysis segment. These were not disclosed in prior years as the net liability was not material. |
Changes in plan assets and benefit obligations recognized in other comprehensive income (loss) included the following components:
| Amounts recognized in accumulated comprehensive income: |
||||
| Accumulated net actuarial loss |
$ | 465 | ||
| Income tax benefit |
199 | |||
|
|
|
|||
| Accumulated other comprehensive loss |
$ | 266 | ||
|
|
|
The Company’s Israeli plans account for the deferred vested benefits using the shut-down method of accounting, which resulted in assets of $13,910 and $16,224 and vested benefit obligations, reported on a gross basis as of December 31, 2016. Under the shut-down method, the liability is calculated as if it were payable as of the balance sheet date, on an undiscounted basis.
104
Table of Contents
MKS INSTRUMENTS, INC.
NOTES TO CONSOLIDATED FINANCIAL STATEMENTS — (continued)
(in thousands, except share and per share data)
As of December 31, 2016, the estimated benefit payments for the next 10 years were as follows:
| Estimated benefit payments |
||||
| 2017 |
$ | 2,224 | ||
| 2018 |
2,266 | |||
| 2019 |
2,949 | |||
| 2020 |
2,842 | |||
| 2021 |
3,151 | |||
| 2022-2026 |
12,554 | |||
|
|
|
|||
| $ | 25,986 | |||
|
|
|
|||
The Company expects to contribute $1,716 to the plans during 2017.
The weighted-average rates used to determine the net periodic benefit costs were as follows:
| December 31, 2016 | ||||
| Discount rate |
1.9 | % | ||
| Rate of increase in salary levels |
2.4 | |||
| Expected long-term rate of return on assets |
1.8 | |||
In determining the expected long-term rate of return on plan assets, the Company considers the relative weighting of plan assets, the historical performance of total plan assets and individual asset classes, and economic and other indicators of future performance.
Plan assets were held in the following categories as a percentage of total plan assets:
| Year Ended December 31, | ||||||||
| 2016 | ||||||||
| Amount | Percentage | |||||||
| Cash |
$ | 948 | 12.0 | % | ||||
| Debt securities |
4,105 | 54.0 | ||||||
| Equity securities |
1,630 | 21.0 | ||||||
| Other |
989 | 13.0 | ||||||
|
|
|
|
|
|||||
| $ | 7,672 | 100.0 | % | |||||
|
|
|
|
|
|||||
In general, the Company’s asset management objectives include maintaining an adequate level of diversification to reduce interest rate and market risk while providing adequate liquidity to meet immediate and future benefit payment requirements. In Japan, assets are primarily invested in pooled funds of insurance companies. The expected long-term rate of return on these assets is approximately 2.0%, which is based on the general yield environment for high quality instruments in Japan. The United Kingdom pension plan invests in a combination of equity and bond funds. The allocation mix is designed to minimize risk while providing a rate of return that will provide asset growth which will be sufficient to cover expected liabilities. The expected long-term rate of return on these assets is approximately 3.0%, which is a combination of long dated government and corporate bond yields for the bond funds, and long dated government and corporate bond yields with an
105
Table of Contents
MKS INSTRUMENTS, INC.
NOTES TO CONSOLIDATED FINANCIAL STATEMENTS — (continued)
(in thousands, except share and per share data)
allowance for out-performance for equity funds. In France, assets are invested in group insurance contracts and the expected long-term rate of return on these assets is approximately 1.3%, which is based on the expected return on the underlying assets.
Other Pension-Related Assets
As of December 31, 2016, the Company had assets with an aggregate market value of $5,558, which it has set aside in connection with its German pension plans. These assets are invested in group insurance contracts through the insurance companies administering these plans, in accordance with applicable pension laws. The Germany contracts have a guaranteed minimum rate of return ranging from 2.25% to 4.25%, depending on the contract. Because the assets were not separate legal assets of the pension plan, they were not included in the Company’s plan assets shown above. However, the Company has designated such assets to pay pension benefits. Such assets are included in other assets in the accompanying consolidated balance sheet.
20) Net Income Per Share
Basic earnings per share (“EPS”), is computed by dividing income available to common stockholders by the weighted-average number of common shares outstanding during the period. The computation of diluted EPS is similar to the computation of basic EPS except that the denominator is increased to include the number of additional common shares that would have been outstanding (using the treasury stock method), if securities containing potentially dilutive common shares (stock options, restricted stock units, stock appreciation rights and employee stock purchase plan) had been converted to such common shares, and if such assumed conversion is dilutive.
The following is a reconciliation of basic to diluted net income per share:
| Years Ended December 31, | ||||||||||||
| 2016 | 2015 | 2014 | ||||||||||
| Numerator: |
||||||||||||
| Net income |
$ | 104,809 | $ | 122,297 | $ | 115,778 | ||||||
|
|
|
|
|
|
|
|||||||
| Denominator: |
||||||||||||
| Shares used in net income per common share — basic |
53,472,000 | 53,282,000 | 53,232,000 | |||||||||
| Effect of dilutive securities |
579,000 | 278,000 | 283,000 | |||||||||
|
|
|
|
|
|
|
|||||||
| Shares used in net income per common share — diluted |
54,051,000 | 53,560,000 | 53,515,000 | |||||||||
|
|
|
|
|
|
|
|||||||
| Net income per common share: |
||||||||||||
| Basic |
$ | 1.96 | $ | 2.30 | $ | 2.17 | ||||||
| Diluted |
$ | 1.94 | $ | 2.28 | $ | 2.16 | ||||||
As of December 31, 2016, RSUs relating to an aggregate of approximately 1,326,000 shares were outstanding. There were no stock options outstanding as of December 31, 2016. As of December 31, 2015 and 2014, stock options and RSUs relating to an aggregate of approximately 733,000 and 747,000 shares of the Company’s common stock, respectively, were outstanding. In 2016, 2015 and 2014, the potential dilutive effect of 453, 0 and 600 weighted average shares, respectively, of RSUs and stock options were excluded from the computation of diluted weighted-average shares outstanding as the shares would have an anti-dilutive effect on EPS.
106
Table of Contents
MKS INSTRUMENTS, INC.
NOTES TO CONSOLIDATED FINANCIAL STATEMENTS — (continued)
(in thousands, except share and per share data)
| 21) | Business Segment, Geographic Area, Product and Significant Customer Information |
The Company is a global provider of instruments, subsystems and process control solutions that measure, control, deliver, power, monitor and analyze critical parameters of advanced manufacturing processes to improve process performance and productivity. The Company also provides services relating to the maintenance and repair of products it sells, software maintenance, installation services and training.
The Company’s Chief Operating Decision Maker (“CODM”) utilizes financial information to make decisions about allocating resources and assessing performance for the entire Company, which is used in the decision making process to assess performance. Based upon the information provided to the CODM, the Company has determined it has two reportable segments.
Effective April 29, 2016, in conjunction with the Newport Merger, the Company changed its reportable segments based upon the organizational structure of the Company and how the CODM utilizes information provided to allocate resources and make decisions. The Company’s two reportable segments are: Vacuum & Analysis and Light & Motion. The Vacuum & Analysis segment represents the legacy MKS business and the Light & Motion segment represents the legacy Newport business.
The Vacuum & Analysis segment provides a broad range of instruments, components, subsystems and software which are derived from the Company’s core competencies in pressure measurement and control, flow measurement and control, gas and vapor delivery, gas composition analysis, residual gas analysis, leak detection, control and information technology, ozone generation and delivery, RF & DC power, reactive gas generation and vacuum technology.
The Light & Motion segment provides a broad range of instruments, components and subsystems which are derived from the Company’s core competencies in lasers, photonics and optics.
The Company derives its segment results directly from the manner in which results are reported in its management reporting system. The accounting policies that the Company uses to derive reportable segment results are substantially the same as those used for external reporting purposes. The Company does not disclose external or intersegment revenues separately by reportable segment as this information is not presented to the CODM for decision making purposes.
The following is net revenues by reportable segment:
| Years Ended December 31, | ||||||||||||
| 2016 | 2015 | 2014 | ||||||||||
| Vacuum & Analysis |
$ | 872,291 | $ | 813,524 | $ | 780,869 | ||||||
| Light & Motion |
423,051 | — | — | |||||||||
|
|
|
|
|
|
|
|||||||
| $ | 1,295,342 | $ | 813,524 | $ | 780,869 | |||||||
|
|
|
|
|
|
|
|||||||
107
Table of Contents
MKS INSTRUMENTS, INC.
NOTES TO CONSOLIDATED FINANCIAL STATEMENTS — (continued)
(in thousands, except share and per share data)
The following is a reconciliation of segment gross profit to consolidated net income:
| Years Ended December 31, | ||||||||||||
| 2016 | 2015 | 2014 | ||||||||||
| Gross profit by reportable segment: |
||||||||||||
| Vacuum & Analysis |
$ | 388,220 | $ | 362,872 | $ | 337,766 | ||||||
| Light & Motion |
177,399 | — | — | |||||||||
|
|
|
|
|
|
|
|||||||
| Total gross profit by reportable segment |
565,619 | 362,872 | 337,766 | |||||||||
| Operating expenses: |
||||||||||||
| Research and development |
110,579 | 68,305 | 62,888 | |||||||||
| Selling, general and administrative |
229,171 | 129,087 | 131,828 | |||||||||
| Acquisition and integration costs |
27,279 | 30 | 499 | |||||||||
| Restructuring |
642 | 2,074 | 2,464 | |||||||||
| Asset impairment |
5,000 | — | — | |||||||||
| Amortization of intangible assets |
35,681 | 6,764 | 4,945 | |||||||||
|
|
|
|
|
|
|
|||||||
| Income from operations |
157,267 | 156,612 | 135,142 | |||||||||
| Interest income |
2,560 | 2,999 | 1,323 | |||||||||
| Interest expense |
30,611 | 143 | 72 | |||||||||
| Other expense, net |
1,239 | — | — | |||||||||
|
|
|
|
|
|
|
|||||||
| Income before income taxes |
127,977 | 159,468 | 136,393 | |||||||||
| Provision for income taxes |
23,168 | 37,171 | 20,615 | |||||||||
|
|
|
|
|
|
|
|||||||
| Net income |
$ | 104,809 | $ | 122,297 | $ | 115,778 | ||||||
|
|
|
|
|
|
|
|||||||
The following is capital expenditures by reportable segment for the years ended December 31, 2016, 2015 and 2014:
| Vacuum & Analysis | Light & Motion | Total | ||||||||||
| December 31, 2016: |
||||||||||||
| Capital expenditures |
$ | 11,732 | $ | 7,391 | $ | 19,123 | ||||||
|
|
|
|
|
|
|
|||||||
| December 31, 2015: |
||||||||||||
| Capital expenditures |
$ | 12,414 | $ | — | $ | 12,414 | ||||||
|
|
|
|
|
|
|
|||||||
| December 31, 2014: |
||||||||||||
| Capital expenditures |
$ | 13,183 | $ | — | $ | 13,183 | ||||||
|
|
|
|
|
|
|
|||||||
The following is depreciation and amortization of intangible assets for the years ended December 31, 2016, 2015 and 2014:
| Vacuum & Analysis | Light & Motion | Total | ||||||||||
| December 31, 2016: |
||||||||||||
| Depreciation and amortization |
$ | 20,820 | $ | 45,106 | $ | 65,926 | ||||||
|
|
|
|
|
|
|
|||||||
| December 31, 2015: |
||||||||||||
| Depreciation and amortization |
$ | 22,103 | $ | — | $ | 22,103 | ||||||
|
|
|
|
|
|
|
|||||||
| December 31, 2014: |
||||||||||||
| Depreciation and amortization |
$ | 20,514 | $ | — | $ | 20,514 | ||||||
|
|
|
|
|
|
|
|||||||
108
Table of Contents
MKS INSTRUMENTS, INC.
NOTES TO CONSOLIDATED FINANCIAL STATEMENTS — (continued)
(in thousands, except share and per share data)
Total income tax expense is not presented by reportable segment because the necessary information is not available or used by the CODM.
The following is segment assets by reportable segment:
| Vacuum & Analysis | Light & Motion | Corporate, Eliminations and Other |
Total | |||||||||||||
| December 31, 2016: |
||||||||||||||||
| Segment assets: |
||||||||||||||||
| Accounts receivable |
$ | 148,516 | $ | 121,516 | $ | (21,275 | ) | $ | 248,757 | |||||||
| Inventory |
165,040 | 110,829 | — | 275,869 | ||||||||||||
|
|
|
|
|
|
|
|
|
|||||||||
| Total segment assets |
$ | 313,556 | $ | 232,345 | $ | (21,275 | ) | $ | 524,626 | |||||||
|
|
|
|
|
|
|
|
|
|||||||||
| Vacuum & Analysis | Light & Motion | Corporate, Eliminations and Other |
Total | |||||||||||||
| December 31, 2015: |
||||||||||||||||
| Segment assets: |
||||||||||||||||
| Accounts receivable |
$ | 101,883 | $ | — | $ | — | $ | 101,883 | ||||||||
| Inventory |
152,631 | — | — | 152,631 | ||||||||||||
|
|
|
|
|
|
|
|
|
|||||||||
| Total segment assets |
$ | 254,514 | $ | — | $ | — | $ | 254,514 | ||||||||
|
|
|
|
|
|
|
|
|
|||||||||
A reconciliation of segment assets to consolidated total assets is as follows:
| Years Ended December 31, | ||||||||
| 2016 | 2015 | |||||||
| Total segment assets |
$ | 524,626 | $ | 254,514 | ||||
| Cash and cash equivalents, restricted cash and investments |
433,231 | 658,237 | ||||||
| Income tax receivable and other current assets |
50,770 | 26,760 | ||||||
| Property, plant and equipment, net |
174,559 | 68,856 | ||||||
| Goodwill and intangible assets, net |
996,589 | 243,730 | ||||||
| Other assets |
32,467 | 21,250 | ||||||
|
|
|
|
|
|||||
| Consolidated total assets |
$ | 2,212,242 | $ | 1,273,347 | ||||
|
|
|
|
|
|||||
Information about the Company’s operations in different geographic regions is presented in the tables below. Net revenues to unaffiliated customers are based on the location in which the sale originated. Transfers between geographic areas are at negotiated transfer prices and have been eliminated from consolidated net revenues.
109
Table of Contents
MKS INSTRUMENTS, INC.
NOTES TO CONSOLIDATED FINANCIAL STATEMENTS — (continued)
(in thousands, except share and per share data)
| Years Ended December 31, | ||||||||||||
| Net revenues: |
2016 | 2015 | 2014 | |||||||||
| United States |
$ | 675,601 | $ | 458,313 | $ | 448,452 | ||||||
| Korea |
112,432 | 106,909 | 97,323 | |||||||||
| Japan |
96,954 | 62,879 | 61,092 | |||||||||
| Europe |
156,365 | 79,927 | 80,659 | |||||||||
| Asia (excluding Korea and Japan) |
253,990 | 105,496 | 93,343 | |||||||||
|
|
|
|
|
|
|
|||||||
| $ | 1,295,342 | $ | 813,524 | $ | 780,869 | |||||||
|
|
|
|
|
|
|
|||||||
| Years Ended December 31, | ||||||||
| Long-lived assets:(1) |
2016 | 2015 | ||||||
| United States |
$ | 122,547 | $ | 56,594 | ||||
| Europe |
28,717 | 5,783 | ||||||
| Asia |
49,406 | 8,952 | ||||||
|
|
|
|
|
|||||
| $ | 200,670 | $ | 71,329 | |||||
|
|
|
|
|
|||||
| (1) | Long-lived assets include property, plant and equipment, net and certain other assets, and exclude goodwill and intangibles and long-term tax-related accounts. |
Goodwill associated with each of our reportable segments is as follows:
| Years Ended December 31, | ||||||||
| 2016 | 2015 | |||||||
| Reportable segment: |
||||||||
| Vacuum & Analysis |
$ | 199,453 | $ | 199,703 | ||||
| Light & Motion |
389,132 | — | ||||||
|
|
|
|
|
|||||
| Total goodwill |
$ | 588,585 | $ | 199,703 | ||||
|
|
|
|
|
|||||
110
Table of Contents
MKS INSTRUMENTS, INC.
NOTES TO CONSOLIDATED FINANCIAL STATEMENTS — (continued)
(in thousands, except share and per share data)
Worldwide Product Information
Because the reportable segment information above does not reflect worldwide sales of the Company’s products, the Company groups its products into seven groups of similar products based upon the similarity of product function. Worldwide net revenue for each group of products is as follows:
| Years Ended December 31, | ||||||||||||
| 2016 | 2015 | 2014 | ||||||||||
| Analytical and Control Solutions Products |
$ | 115,758 | $ | 102,658 | $ | 104,189 | ||||||
| Materials Delivery Solutions Products |
135,989 | 131,996 | 126,267 | |||||||||
| Power, Plasma and Reactive Gas Solutions Products |
367,665 | 350,469 | 335,271 | |||||||||
| Pressure and Vacuum Measurement Products |
252,879 | 228,401 | 215,142 | |||||||||
| Lasers Products |
124,432 | — | — | |||||||||
| Optics Products |
124,218 | — | — | |||||||||
| Photonics Products |
174,401 | — | — | |||||||||
|
|
|
|
|
|
|
|||||||
| $ | 1,295,342 | $ | 813,524 | $ | 780,869 | |||||||
|
|
|
|
|
|
|
|||||||
Sales of Analytical and Control Solutions Products; Materials Delivery Solutions Products; Power, Plasma and Reactive Gas Solutions Products; and Pressure and Vacuum Measurement Products are included in the Company’s Vacuum & Analysis segment. Sales of Lasers Products; Optics Products; and Photonics Products are included in the Light & Motion segment.
Major Customers
The Company had two customers with net revenues greater than 10% of total net revenues in the periods shown as follows:
| Years Ended December 31, | ||||||||||||
| 2016 | 2015 | 2014 | ||||||||||
| Applied Materials, Inc. |
13.6 | % | 17.8 | % | 19.1 | % | ||||||
| Lam Research Corporation |
11.2 | % | 13.4 | % | 12.9 | % | ||||||
Net revenues for each of our reportable segments include revenues from each of the two customers, which represent net revenues greater than 10% of total net revenues.
| 22) | Restructurings |
During 2016, the Company recorded restructuring charges of $642. The restructuring charges were primarily severance costs related to the consolidation of one of our international facilities.
During 2015, the Company recorded restructuring charges of $2,074. The restructuring charges were primarily for severance associated with the reduction in workforce of approximately 266 people throughout the Company as a result of outsourcing an international manufacturing operation and the consolidation of certain other foreign manufacturing locations. This restructuring was substantially complete by December 31, 2015.
111
Table of Contents
MKS INSTRUMENTS, INC.
NOTES TO CONSOLIDATED FINANCIAL STATEMENTS — (continued)
(in thousands, except share and per share data)
The activity related to the Company’s restructuring accrual is shown below:
| 2016 | 2015 | |||||||
| Balance at January 1 |
$ | 807 | $ | 92 | ||||
| Restructuring liability from Newport Merger |
562 | — | ||||||
| Charged to expense |
642 | 2,074 | ||||||
| Payments and adjustment |
(1,471 | ) | (1,359 | ) | ||||
|
|
|
|
|
|||||
| Balance at December 31 |
$ | 540 | $ | 807 | ||||
|
|
|
|
|
|||||
| 23) | Commitments and Contingencies |
On March 9, 2016, a putative class action lawsuit captioned Dixon Chung v. Newport Corp., et al, Case No. A-16-733154-C, was filed in the District Court, Clark County, Nevada on behalf of a putative class of stockholders of Newport for claims related to the Merger Agreement between the Company, Newport, and Merger Sub. The complaint, filed on March 9, 2016, named as defendants the Company, Newport and Merger Sub, and certain then-current and former members of Newport’s former board of directors. The complaint alleges that the named directors breached their fiduciary duties to Newport’s stockholders by agreeing to sell Newport through an inadequate and unfair process, which led to inadequate and unfair consideration, and by agreeing to unfair deal protection devices. The complaint also alleges that the Company, Newport, and Merger Sub aided and abetted the named directors’ alleged breaches of their fiduciary duties. The complaint seeks injunctive relief, including to enjoin or rescind the Merger Agreement, monetary damages, and an award of attorneys’ and other fees and costs, among other relief. On March 25, 2016, the plaintiff in the Chung action filed an amended complaint, which adds certain allegations, including that the preliminary proxy statement filed by Newport on March 15, 2016 (the “Proxy”) omitted material information. The amended complaint also names as defendants the Company, Newport, Merger Sub, and then-current members of Newport’s board of directors.
Also on March 25, 2016, a second putative class action complaint captioned Hubert C. Pincon v. Newport Corp., et al., Case No. A-16-734039-B, was filed in the District Court, Clark County, Nevada, on behalf of a putative class of Newport’s stockholders for claims related to the Merger Agreement. The complaint names as defendants the Company, Newport, and Merger Sub and the then-current members of Newport’s former board of directors. It alleges that the named directors breached their fiduciary duties to Newport’s stockholders by agreeing to sell Newport through an inadequate and unfair process, which led to inadequate and unfair consideration, by agreeing to unfair deal protection devices, and by omitting material information from the Proxy. The complaint also alleges that the Company, Newport, and Merger Sub aided and abetted the named directors’ alleged breaches of their fiduciary duties. The complaint seeks injunctive relief, including to enjoin or rescind the Merger Agreement, and an award of attorneys’ and other fees and costs, among other relief.
On April 14, 2016, the Court granted plaintiffs’ motion to consolidate the Pincon and Chung actions and appointed counsel in the Pincon action as lead counsel. Also on April 14, 2016, the Court granted plaintiffs’ motion for expedited discovery and scheduled a hearing on plaintiffs’ anticipated motion for a preliminary injunction for April 25, 2016. On April 20, 2016, plaintiffs filed a motion to vacate the hearing on their anticipated motion for a preliminary injunction and notified the Court that they did not presently intend to file a motion for a preliminary injunction regarding the Merger Agreement. On April 22, 2016, the Court vacated the hearing on plaintiffs’ anticipated motion for a preliminary injunction. In August, plaintiffs completed the expedited discovery that the Court ordered.
112
Table of Contents
MKS INSTRUMENTS, INC.
NOTES TO CONSOLIDATED FINANCIAL STATEMENTS — (continued)
(in thousands, except share and per share data)
On October19, 2016, plaintiffs filed an amended complaint captioned In re Newport Corporation Shareholder Litigation, Case No. A-16-733154-B, in the District Court, Clark County, Nevada, on behalf of a class of Newport’s stockholders for claims related to the Merger Agreement. The complaint names as defendants the Company, Newport, and the then-current members of Newport’s former board of directors. It alleges that the named directors breached their fiduciary duties to Newport’s stockholders by agreeing to sell Newport through an inadequate and unfair process, which led to inadequate and unfair consideration, by agreeing to unfair deal protection devices, and by omitting material information from the Proxy. The complaint also alleges that the Company and Newport aided and abetted the named directors’ alleged breaches of their fiduciary duties. The complaint seeks monetary damages, including pre- and post-judgment interest. On December 9, 2016, both the Company and the Newport defendants filed motions to dismiss. Plaintiffs filed an opposition to the motions to dismiss on January 13, 2017. On February 3, 2017, the Company and the Newport defendants filed their reply briefs in support of their motions to dismiss. A hearing on the motions to dismiss was held on February 15, 2017.
The Company believes that the claims asserted in the amended complaint have no merit and the Company, Newport and the named directors intend to defend vigorously against these claims.
The Company is subject to various legal proceedings and claims, which have arisen in the ordinary course of business. In the opinion of management, the ultimate disposition of these matters will not have a material adverse effect on the Company’s results of operations, financial condition or cash flows.
The Company leases certain of its facilities and machinery and equipment under operating leases expiring in various years through 2022. Generally, the facility leases require the Company to pay maintenance, insurance and real estate taxes. Rental expense under operating leases totaled $16,253, $7,845 and $6,909 for 2016, 2015 and 2014, respectively.
Minimum lease payments under operating leases are as follows:
| Year Ending December 31, |
Operating Leases | |||
| 2017 |
$ | 16,586 | ||
| 2018 |
14,507 | |||
| 2019 |
12,649 | |||
| 2020 |
10,965 | |||
| 2021 |
7,166 | |||
| Thereafter |
5,430 | |||
|
|
|
|||
| Total minimum lease payments |
$ | 67,303 | ||
|
|
|
|||
As of December 31, 2016, the Company has entered into purchase commitments for certain inventory components and other equipment and services used in its normal operations. The majority of these purchase commitments covered by these arrangements are for periods of less than one year and aggregate to approximately $247,563.
To the extent permitted by Massachusetts law, the Company’s Restated Articles of Organization, as amended, require the Company to indemnify any of its current or former officers or directors or any person who has served or is serving in any capacity with respect to any of the Company’s employee benefit plans. The Company believes that the estimated exposure for these indemnification obligations is currently not material. Accordingly, the Company has no material liabilities recorded for these requirements as of December 31, 2016.
113
Table of Contents
MKS INSTRUMENTS, INC.
NOTES TO CONSOLIDATED FINANCIAL STATEMENTS — (continued)
(in thousands, except share and per share data)
The Company also enters into agreements in the ordinary course of business which include indemnification provisions. Pursuant to these agreements, the Company indemnifies, holds harmless and agrees to reimburse the indemnified party, generally its customers, for losses suffered or incurred by the indemnified party in connection with certain patent or other intellectual property infringement claims, and, in some instances, other claims, by any third party with respect to the Company’s products. The term of these indemnification obligations is generally perpetual after execution of the agreement. The maximum potential amount of future payments the Company could be required to make under these indemnification agreements is, in some instances, not contractually limited. The Company has never incurred costs to defend lawsuits or settle claims related to these indemnification obligations. As a result, the Company believes the estimated fair value of these obligations is minimal. Accordingly, the Company has no liabilities recorded for these obligations as of December 31, 2016.
As part of past acquisitions and divestitures of businesses or assets, the Company has provided a variety of indemnifications to the sellers and purchasers for certain events or occurrences that took place prior to the date of the acquisition or divestiture. Typically, certain of the indemnifications expire after a defined period of time following the transaction, but certain indemnifications may survive indefinitely. The maximum potential amount of future payments the Company could be required to make for such obligations is undeterminable at this time. Other than obligations recorded as liabilities at the time of the acquisitions, historically the Company has not made significant payments for these indemnifications. Accordingly, no material liabilities have been recorded for these obligations.
In conjunction with certain asset sales, the Company may provide routine indemnifications whose terms range in duration and often are not explicitly defined. Where appropriate, an obligation for such indemnification is recorded as a liability. Because the amounts of liability under these types of indemnifications are not explicitly stated, the overall maximum amount of the obligation under such indemnifications cannot be reasonably estimated. Other than obligations recorded as liabilities at the time of the asset sale, historically the Company has not made significant payments for these indemnifications.
114
Table of Contents
MKS Instruments, Inc.
Supplemental Financial Data
| Quarter Ended | ||||||||||||||||
| March 31 | June 30 | Sept. 30 | Dec. 31 | |||||||||||||
| (Table in thousands, except per share data) (Unaudited) |
||||||||||||||||
| 2016 |
||||||||||||||||
| Statement of Operations Data |
||||||||||||||||
| Net revenues(1) |
$ | 183,681 | $ | 325,861 | $ | 380,660 | $ | 405,140 | ||||||||
| Gross profit |
77,913 | 135,913 | 168,385 | 183,408 | ||||||||||||
| Income from operations |
22,559 | 19,186 | 53,008 | 62,514 | ||||||||||||
| Net income |
$ | 17,563 | $ | 9,210 | $ | 32,549 | $ | 45,487 | ||||||||
| Net income per share: |
||||||||||||||||
| Basic |
$ | 0.33 | $ | 0.17 | $ | 0.61 | $ | 0.85 | ||||||||
| Diluted |
$ | 0.33 | $ | 0.17 | $ | 0.60 | $ | 0.83 | ||||||||
| Cash dividends paid per common share |
$ | 0.17 | $ | 0.17 | $ | 0.17 | $ | 0.17 | ||||||||
| (1) | The increase in net revenues in the quarter ended June 30, 2016, compared to the quarter ended March 31, 2016, related to the Newport Merger which closed on April 29, 2016. |
| 2015 |
||||||||||||||||
| Statement of Operations Data |
||||||||||||||||
| Net revenues |
$ | 213,839 | $ | 217,966 | $ | 209,332 | $ | 172,387 | ||||||||
| Gross profit |
97,046 | 98,798 | 94,229 | 72,799 | ||||||||||||
| Income from operations |
47,010 | 46,034 | 41,363 | 22,205 | ||||||||||||
| Net income |
$ | 33,786 | $ | 33,220 | $ | 29,769 | $ | 25,522 | ||||||||
| Net income per share: |
||||||||||||||||
| Basic |
$ | 0.63 | $ | 0.62 | $ | 0.56 | $ | 0.48 | ||||||||
| Diluted |
$ | 0.63 | $ | 0.62 | $ | 0.56 | $ | 0.48 | ||||||||
| Cash dividends paid per common share |
$ | 0.165 | $ | 0.17 | $ | 0.17 | $ | 0.17 |
115
Table of Contents
| Item 9. | Changes in and Disagreements with Accountants on Accounting and Financial Disclosure |
None.
| Item 9A. | Controls and Procedures |
Evaluation of Disclosure Controls and Procedures
Our management, with the participation of our Chief Executive Officer and Chief Financial Officer, evaluated the effectiveness of our disclosure controls and procedures as of December 31, 2016. The term “disclosure controls and procedures,” as defined in Rules 13a-15(e) and 15d-15(e) under the Securities Exchange Act of 1934, as amended (the “Exchange Act”), means controls and other procedures of an issuer that are designed to ensure that information required to be disclosed by the issuer in the reports that it files or submits under the Exchange Act is recorded, processed, summarized and reported, within the time periods specified in the SEC’s rules and forms. Disclosure controls and procedures include, without limitation, controls and procedures designed to ensure that information required to be disclosed by an issuer in the reports that it files or submits under the Exchange Act is accumulated and communicated to the issuer’s management, including its principal executive and principal financial officers, or persons performing similar functions as appropriate to allow timely decisions regarding required disclosure. Management recognizes that any controls and procedures, no matter how well designed and operated, can provide only reasonable assurance of achieving their objectives and management necessarily applies its judgment in evaluating the cost-benefit relationship of possible controls and procedures. Based on the evaluation of our disclosure controls and procedures as of December 31, 2016, our Chief Executive Officer and Chief Financial Officer concluded that, as of such date, our disclosure controls and procedures were effective at the reasonable assurance level to ensure that information required to be disclosed by us in reports that we file or submit under the Exchange Act is recorded, processed, summarized and reported within the time periods specified in Securities and Exchange Commission rules and forms and is accumulated and communicated to our management, including our Chief Executive Officer and Chief Financial Officer as appropriate to allow timely decisions regarding required disclosure.
Management’s Report on Internal Control over Financial Reporting
Our management is responsible for establishing and maintaining adequate internal control over financial reporting. Internal control over financial reporting is defined in Rules 13a-15(f) and 15d-15(f) promulgated under the Exchange Act as a process designed by, or under the supervision of our Chief Executive Officer and Chief Financial Officer or persons performing similar functions and effected by our board of directors, management and other personnel, to provide reasonable assurance regarding the reliability of financial reporting and the preparation of financial statements for external purposes in accordance with generally accepted accounting principles and includes those policies and procedures that:
| • | Pertain to the maintenance of records that in reasonable detail accurately and fairly reflect the transactions and dispositions of the assets of the Company; |
| • | Provide reasonable assurance that transactions are recorded as necessary to permit preparation of financial statements in accordance with generally accepted accounting principles, and that our receipts and expenditures of the Company are being made only in accordance with authorization of our management and directors of the Company; and |
| • | Provide reasonable assurance regarding prevention or timely detection of unauthorized acquisition, use or disposition of our assets that could have a material effect on the financial statements. |
Because of its inherent limitations, internal control over financial reporting may not prevent or detect misstatements. Projections of any evaluation of effectiveness to future periods are subject to the risk that controls may become inadequate because of changes in conditions, or that the degree of compliance with the policies or procedures may deteriorate.
116
Table of Contents
Under the supervision and with the participation of our management including our Chief Executive Officer and Chief Financial Officer, we conducted an assessment of the effectiveness of our internal control over financial reporting as of December 31, 2016. In making this assessment, we used the criteria set forth in the Internal Control-Integrated Framework (2013) issued by the Committee of Sponsoring Organizations of the Treadway Commission. Based on our assessment, our management concluded that, as of December 31, 2016, our internal control over financial reporting was effective.
We excluded Newport from our assessment of internal control over financial reporting as of December 31, 2016 because it was acquired by the Company in an Agreement and Plan of Merger during 2016. The total assets and total revenues of Newport, a wholly-owned subsidiary, represent 22% and 33%, respectively, of the related consolidated financial statement amounts as of and for the year ended December 31, 2016.
Our internal controls over financial reporting as of December 31, 2016 have been audited by PricewaterhouseCoopers LLP, an independent registered public accounting firm, as stated in their attestation report which appears in Item 8 of this Annual Report on Form 10-K.
Changes in Internal Control over Financial Reporting
There was no change in our internal control over financial reporting (as defined in Rules 13a-15(f) and 15d-15(f) under the Exchange Act) during our fourth fiscal quarter that has materially affected, or is reasonably likely to materially affect, our internal control over financial reporting.
| Item 9B. | Other Information |
None.
117
Table of Contents
| Item 10. | Directors, Executive Officers and Corporate Governance |
The information required by this item will be set forth under the captions “Election of Directors,” “Directors,” “Corporate Governance,” “Executive Officers,” “Corporate Governance — Code of Ethics” and “Compensation Governance — Audit Committee Financial Expert” in our definitive proxy statement for the 2017 Annual Meeting of Stockholders to be filed with the Securities and Exchange Commission no later than 120 days after the end of our fiscal year, and is incorporated herein by reference.
We are also required under Item 405 of Regulation S-K to provide information concerning delinquent filers of reports under Section 16 of the Securities and Exchange Act of 1934, as amended. This information will be set forth under the caption “Section 16(a) Beneficial Ownership Reporting Compliance” in our definitive proxy statement for the 2017 Annual Meeting of Stockholders to be filed with the Securities and Exchange Commission no later than 120 days after the end of our fiscal year, and is incorporated herein by reference.
| Item 11. | Executive Compensation |
The information required by this item will be set forth under the captions “Executive Officers,” “Executive Compensation — Compensation Discussion and Analysis,” “Corporate Governance — Compensation Committee Interlocks and Insider Participation,” “Compensation Committee Report” and “Director Compensation” in our definitive proxy statement for the 2017 Annual Meeting of Stockholders to be filed with the Securities and Exchange Commission no later than 120 days after the end of our fiscal year, and is incorporated herein by reference.
| Item 12. | Security Ownership of Certain Beneficial Owners and Management and Related Stockholder Matters |
The information required by Item 403 of Regulation S-K will be set forth under the caption “Security Ownership of Certain Beneficial Owners and Management” in our definitive proxy statement for the 2017 Annual Meeting of Stockholders to be filed with the Securities and Exchange Commission no later than 120 days after the end of our fiscal year, and is incorporated herein by reference.
The information required by Item 201(d) of Regulation S-K will be set forth under the caption “Executive Compensation — Equity Compensation Plan Information” in our definitive proxy statement for the 2017 Annual Meeting of Stockholders to be filed with the Securities and Exchange Commission no later than 120 days after the end of our fiscal year, and is incorporated herein by reference.
| Item 13. | Certain Relationships and Related Transactions and Director Independence |
The information required by this item will be set forth under the captions “Corporate Governance — Board Independence” and “Director Compensation — Transactions with Related Persons” in our definitive proxy statement for the 2017 Annual Meeting of Stockholders to be filed with the Securities and Exchange Commission no later than 120 days after the end of our fiscal year, and is incorporated herein by reference.
| Item 14. | Principal Accountant Fees and Services |
The information required by this item will be set forth under the caption “Independent Registered Public Accounting Firm” in our definitive proxy statement for the 2017 Annual Meeting of Stockholders to be filed with the Securities and Exchange Commission no later than 120 days after the end of our fiscal year, and is incorporated herein by reference.
118
Table of Contents
| Item 15. | Exhibits and Financial Statement Schedules |
(a) The following documents are filed as a part of this Report:
1. Financial Statements. The following Consolidated Financial Statements are included under Item 8 of this Annual Report on Form 10-K.
INDEX TO CONSOLIDATED FINANCIAL STATEMENTS
2. Financial Statement Schedules. The following consolidated financial statement schedule is included in this Annual Report on Form 10-K:
Schedule II — Valuation and Qualifying Accounts
Schedules other than those listed above have been omitted since they are either not required or information is otherwise included.
3. Exhibits. The following exhibits are filed as part of this Annual Report on Form 10-K.
| Exhibit |
Title | |
| +2.1(1) | Agreement and Plan of Merger, by and among the Registrant, PSI Equipment, Inc. and Newport Corporation, dated February 22, 2016 | |
| +3.1(2) | Restated Articles of Organization of the Registrant | |
| +3.2(3) | Articles of Amendment to Articles of Organization, as filed with the Secretary of State of Massachusetts on May 18, 2001 | |
| +3.3(4) | Articles of Amendment to Articles of Organization, as filed with the Secretary of State of Massachusetts on May 16, 2002 | |
| +3.4(5) | Amended and Restated By-Laws of the Registrant | |
| +4.1(6) | Specimen certificate representing the Common Stock | |
| +10.1(7) | Term Loan Credit Agreement, dated April 29, 2016, by and among the Registrant, Barclays Bank PLC, as administrative agent and collateral agent, and the lenders from time to time party thereto | |
| +10.2(8) | Amendment No. 1 to Term Loan Credit Agreement, dated as of June 9, 2016, by and among the Company, the other loan parties party thereto, Barclays Bank PLC, as administrative agent and collateral agent, and each participating lender party thereto | |
| +10.3(9) | Amendment No. 2 to Term Loan Credit Agreement, dated as of December 14, 2016, by and among the Company, the other loan parties party thereto, Barclays Bank PLC, as administrative agent and collateral agent, and each participating lender party thereto. | |
| +10.4(7) | ABL Credit Agreement, dated April 29, 2016, by and among the Registrant, Deutsche Bank AG New York Branch, as administrative agent and collateral agent, the other borrowers from time to time party thereto, and the lenders and letters of credit issuers from time to time party thereto | |
119
Table of Contents
| Exhibit No. |
Title | |
| +10.5(5)* | 2014 Stock Incentive Plan | |
| +10.6(5)* | 2014 Employee Stock Purchase Plan | |
| +10.7(5)* | Form of Restricted Stock Unit Agreement for Non-Employee Directors under the 2014 Stock Incentive Plan | |
| 10.8* | Form of Restricted Stock Unit Agreement for employees under the 2014 Stock Incentive Plan | |
| +10.9(10)* | 162(m) Executive Cash Incentive Plan | |
| 10.10* | Form of Bonus Award Agreement under 162(m) Executive Cash Incentive Plan | |
| +10.11(11)* | Employment Agreement, dated as of July 1, 2005, between John Bertucci and the Registrant | |
| +10.12(12)* | Employment Agreement, dated October 22, 2013, between Gerald G. Colella and the Registrant | |
| +10.13(13)* | Letter Agreement between the Registrant and Robert J. Phillippy, dated May 2, 2016 | |
| +10.14(14)* | Newport Corporation’s 2006 Performance-Based Stock Incentive Plan | |
| +10.15(14)* | Form of Stock Appreciation Right Award Agreement under Newport Corporation’s 2006 Performance-Based Stock Incentive Plan | |
| +10.16(14)* | Newport Corporation’s 2011 Stock Incentive Plan | |
| +10.17(14)* | Newport Corporation’s Amended and Restated 2011 Stock Incentive Plan | |
| +10.18(14)* | Form of Restricted Stock Unit Award Agreement (with performance-based vesting) used under Newport Corporation’s 2011 Stock Incentive Plan and Amended and Restated 2011 Stock Incentive Plan | |
| +10.19(14)* | Form of Stock Appreciation Right Award Agreement used under Newport Corporation’s 2011 Stock Incentive Plan and the Amended and Restated 2011 Stock Incentive Plan | |
| +10.20(14)* | Form of Indemnification Agreement between Newport Corporation and Robert J. Phillippy | |
| +10.21(14)* | Form of the Registrant’s RSU Assumption Agreement for U.S. Employees Relating to Newport Corporation’s Amended and Restated 2011 Stock Incentive Plan and 2011 Stock Incentive Plan | |
| +10.22(14)* | Form of the Registrant’s RSU Assumption Agreement for Employees Outside of the United States Relating to Newport Corporation’s Amended and Restated 2011 Stock Incentive Plan and 2011 Stock Incentive Plan | |
| +10.23(14)* | Form of the Registrant’s SAR Assumption Agreement for U.S. Employees Relating to Newport Corporation’s Amended and Restated 2011 Stock Incentive Plan, 2011 Stock Incentive Plan and 2006 Performance-Based Stock Incentive Plan | |
| +10.24(14)* | Form of the Registrant’s SAR Assumption Agreement for Employees Outside of the United States Relating to Newport Corporation’s Amended and Restated 2011 Stock Incentive Plan, 2011 Stock Incentive Plan and 2006 Performance-Based Stock Incentive Plan | |
| +10.25(15)* | Employment Agreement, dated August 1, 2016, between Seth Bagshaw and the Registrant | |
| +10.26(15)* | Employment Agreement, dated August 1, 2016, between John Abrams and the Registrant | |
| +10.27(15)* | Employment Agreement, dated August 1, 2016, between John Lee and the Registrant | |
| +10.28(15)* | Employment Agreement, dated August 1, 2016, between Brian Quirk and the Registrant | |
120
Table of Contents
| +10.29(15)* | Employment Agreement, dated August 1, 2016, between Dennis Werth and Newport Corporation | |
| +10.30(15)* | Summary of 2016 Cash Incentive Bonus Arrangements with Dennis Werth | |
| +10.31(15)* | Form of Indemnification Agreement between Newport Corporation and Dennis Werth | |
| †+10.32(16) | Global Supply Agreement, dated April 21, 2005, by and between the Registrant and Applied Materials, Inc. | |
| †+10.33(17) | Amendments, dated October 25, 2012, October 4, 2013, April 16, 2014, July 31, 2014, August 29, 2014, September 15, 2014 and October 3, 2014, to Global Supply Agreement, dated April 21, 2005 by and between the Registrant and Applied Materials, Inc. | |
| +18.1 | PricewaterhouseCooopers LLP Preferability Letter | |
| 21.1 | Subsidiaries of the Registrant | |
| 23.1 | Consent of PricewaterhouseCoopers LLP | |
| 31.1 | Certification of Principal Executive Officer pursuant to Rule 13a-14(a)/Rule 15d-14(a) of the Securities Exchange Act of 1934 | |
| 31.2 | Certification of Principal Financial Officer pursuant to Rule 13a-14(a)/Rule 15d-14(a) of the Securities Exchange Act of 1934 | |
| 32.1 | Certification of Chief Executive Officer and Chief Financial Officer pursuant to 18 U.S.C. Section 1350, as adopted pursuant to Section 906 of the Sarbanes-Oxley Act of 2002 | |
| 101.INS | XBRL Instance Document | |
| 101.SCH | XBRL Taxonomy Extension Schema Document | |
| 101.CAL | XBRL Taxonomy Calculation Linkbase | |
| 101.LAB | XBRL Taxonomy Labels Linkbase Document | |
| 101.PRE | XBRL Taxonomy Presentation Linkbase Document | |
| 101.DEF | XBRL Taxonomy Extension Definition Linkbase Document | |
+ Previously filed
| * | Management contract or compensatory plan arrangement. |
| † | Confidential Treatment has been requested as to certain portions of this Exhibit. Such portions have been omitted and filed separately with the Securities and Exchange Commission. |
The following materials from MKS Instrument, Inc.’s Annual Report on Form 10-K for the year ended December 31, 2016, are formatted in XBRL (Extensible Business Reporting Language): (i) the Consolidated Balance Sheets, (ii) the Consolidated Statements of Operations and Comprehensive Income, (iii) the Consolidated Statements of Stockholders’ Equity, (iv) the Consolidated Statements of Cash Flows and (v) Notes to the Consolidated Financial Statements.
| (1) | Incorporated by reference to the Current Report on Form 8-K filed with the Securities and Exchange Commission on February 23, 2016. |
| (2) | Incorporated by reference to the Registration Statement on Form S-4 (File No. 333-49738) filed with the Securities and Exchange Commission on November 13, 2000. |
| (3) | Incorporated by reference to the Registrant’s Quarterly Report on Form 10-Q for the quarter ended June 30, 2001. |
| (4) | Incorporated by reference to the Registrant’s Quarterly Report on Form 10-Q for the quarter ended June 30, 2002. |
121
Table of Contents
| (5) | Incorporated by reference to the Registrant’s Current Report on Form 8-K filed with the Securities and Exchange Commission on May 6, 2014. |
| (6) | Incorporated by reference to the Registration Statement on Form S-1 filed with the Securities and Exchange Commission on March 2, 1999. |
| (7) | Incorporated by reference to the Registrant’s Current Report on Form 8-K filed with the Securities and Exchange Commission on April 29, 2016. |
| (8) | Incorporated by reference to the Registrant’s Current Report on Form 8-K filed with the Securities and Exchange Commission on June 9, 2016. |
| (9) | Incorporated by reference to the Registrant’s Current Report on Form 8-K filed with the Securities and Exchange Commission on December 14, 2016. |
| (10) | Incorporated by reference to the Current Report on Form 8-K filed with the Securities and Exchange Commission on May 4, 2015. |
| (11) | Incorporated by reference to the Registrant’s Current Report on Form 8-K filed with the Securities and Exchange Commission on July 5, 2005. |
| (12) | Incorporated by reference to the Registrant’s Current Report on Form 8-K filed with the Securities and Exchange Commission on October 24, 2013. |
| (13) | Incorporated by reference to the Registrant’s Current Report on Form 8-K filed with the Securities and Exchange Commission on May 2, 2016. |
| (14) | Incorporated by reference to the Registrant’s Quarterly Report on Form 10-Q for the quarter ended March 31, 2016. |
| (15) | Incorporated by reference to the Registrant’s Quarterly Report on Form 10-Q for the quarter ended June 30, 2016 |
| (16) | Incorporated by reference to the Registrant’s Current Report on Form 8-K filed with the Securities and Exchange Commission on April 27, 2005. |
| (17) | Incorporated by reference to the Registrant’s Annual Report on Form 10-K for the year ended December 31, 2014. |
| (b) | Exhibits |
MKS hereby files as exhibits to our Annual Report on Form 10-K those exhibits listed in Item 15(a) above.
| (c) | Financial Statement Schedules |
| Item 16. | Form 10-K Summary |
Not applicable.
122
Table of Contents
MKS INSTRUMENTS, INC.
SCHEDULE II—VALUATION AND QUALIFYING ACCOUNTS
| Additions | ||||||||||||||||||||||||
| Description |
Balance at |
Acquisition Balance |
Charged to |
Charged |
Deductions & |
Balance at End of Year |
||||||||||||||||||
| (in thousands) | ||||||||||||||||||||||||
| Allowance for doubtful accounts: |
||||||||||||||||||||||||
| Years ended December 31, |
||||||||||||||||||||||||
| 2016 |
$ | 1,760 | $ | 1,292 | $ | 1,109 | $ | (66 | ) | $ | (186 | ) | $ | 3,909 | ||||||||||
| 2015 |
$ | 2,250 | $ | — | $ | (255 | ) | $ | 21 | $ | (256 | ) | $ | 1,760 | ||||||||||
| 2014 |
$ | 1,924 | $ | — | $ | 668 | $ | 12 | $ | (354 | ) | $ | 2,250 | |||||||||||
| Additions | ||||||||||||||||||||||||
| Description |
Balance at |
Acquisition Balance |
Charged to |
Charged |
Deductions & Write-offs |
Balance at End of Year |
||||||||||||||||||
| (in thousands) | ||||||||||||||||||||||||
| Allowance for sales returns: |
||||||||||||||||||||||||
| Years ended December 31, |
||||||||||||||||||||||||
| 2016 |
$ | 601 | $ | 423 | $ | 2,262 | $ | — | $ | (2,148 | ) | $ | 1,138 | |||||||||||
| 2015 |
$ | 730 | $ | — | $ | 2,500 | $ | (3 | ) | $ | (2,626 | ) | $ | 601 | ||||||||||
| 2014 |
$ | 827 | $ | — | $ | 2,223 | $ | — | $ | (2,320 | ) | $ | 730 | |||||||||||
| Additions | ||||||||||||||||||||||||
| Description |
Balance at Beginning of Year |
Acquisition Beginning Balance |
Charged to Costs and Expenses |
Charged to Other Accounts |
Deductions | Balance at End of Year |
||||||||||||||||||
| (in thousands) | ||||||||||||||||||||||||
| Valuation allowance on deferred tax asset: |
||||||||||||||||||||||||
| Years ended December 31, |
||||||||||||||||||||||||
| 2016 |
$ | 6,127 | $ | 3,769 | $ | 2,719 | $ | — | $ | (88 | ) | $ | 12,527 | |||||||||||
| 2015 |
$ | 26,763 | $ | — | $ | — | $ | 113 | $ | (20,749 | ) | $ | 6,127 | |||||||||||
| 2014 |
$ | 27,102 | $ | — | $ | — | $ | — | $ | (339 | ) | $ | 26,763 | |||||||||||
123
Table of Contents
Pursuant to the requirements of Section 13 or 15(d) of the Securities Exchange Act of 1934, the registrant has duly caused this annual report on Form 10-K for the fiscal year ended December 31, 2016, to be signed on its behalf by the undersigned, thereunto duly authorized on the 1st day of March 2017.
| MKS INSTRUMENTS, INC. | ||
| By: | /s/ Gerald G. Colella | |
| Gerald G. Colella Chief Executive Officer, President and Director (Principal Executive Officer) | ||
Pursuant to the requirements of the Securities Exchange Act of 1934, this report has been signed below by the following persons on behalf of the registrant and in the capacities and on the date indicated.
| SIGNATURES |
TITLE |
DATE | ||
| /s/ John R. Bertucci John R. Bertucci |
Chairman of the Board of Directors |
February 24, 2017 | ||
| /s/ Gerald G. Colella Gerald G. Colella |
Chief Executive Officer, President and Director |
March 1, 2017 | ||
| /s/ Seth H. Bagshaw Seth H. Bagshaw |
Vice President, Chief Financial Officer and Treasurer (Principal Financial and Accounting Officer) |
March 1, 2017 | ||
| /s/ Robert R. Anderson Robert R. Anderson |
Director |
February 22, 2017 | ||
| /s/ Gregory R. Beecher Gregory R. Beecher |
Director |
February 22, 2017 | ||
| /s/ Richard S. Chute Richard S. Chute |
Director |
February 24, 2017 | ||
| /s/ Peter R. Hanley Peter R. Hanley |
Director |
February 24, 2017 | ||
| /s/ Jacqueline F. Moloney Jacqueline F. Moloney |
Director |
February 24, 2017 | ||
| /s/ Elizabeth A. Mora Elizabeth A. Mora |
Director |
February 22, 2017 | ||
| /s/ Robert J. Phillippy Robert J. Phillippy |
Director |
February 24, 2017 | ||
124