Attached files
| file | filename |
|---|---|
| EX-32.2 - EXHIBIT 32.2 - MAXWELL TECHNOLOGIES INC | mxwl12311610kex322.htm |
| EX-32.1 - EXHIBIT 32.1 - MAXWELL TECHNOLOGIES INC | mxwl12311610kex321.htm |
| EX-31.2 - EXHIBIT 31.2 - MAXWELL TECHNOLOGIES INC | mxwl12311610kex312.htm |
| EX-31.1 - EXHIBIT 31.1 - MAXWELL TECHNOLOGIES INC | mxwl12311610kex311.htm |
| EX-23.1 - EXHIBIT 23.1 - MAXWELL TECHNOLOGIES INC | mxwl12311610kex231.htm |
| EX-21.1 - EXHIBIT 21.1 - MAXWELL TECHNOLOGIES INC | mxwl12311610kex211.htm |
| EX-10.26 - EXHIBIT 10.26 - MAXWELL TECHNOLOGIES INC | mxwl12311610kex1026ewbamen.htm |
| EX-10.25 - EXHIBIT 10.25 - MAXWELL TECHNOLOGIES INC | mxwl12311610kex1025localiz.htm |
UNITED STATES
SECURITIES AND EXCHANGE COMMISSION
Washington, D.C. 20549
FORM 10-K
(Mark One)
x | ANNUAL REPORT PURSUANT TO SECTION 13 OR 15(d) OF THE SECURITIES EXCHANGE ACT OF 1934 |
For the fiscal year ended December 31, 2016
OR
¨ | TRANSITION REPORT PURSUANT TO SECTION 13 OR 15(d) OF THE SECURITIES EXCHANGE ACT OF 1934 |
For the transition period from to
Commission file number 001-15477
MAXWELL TECHNOLOGIES, INC.
(Exact name of registrant as specified in its charter)
Delaware | 95-2390133 | |
(State or other jurisdiction of incorporation or organization) | (I.R.S. Employer Identification No.) | |
3888 Calle Fortunada San Diego, California | 92123 | |
(Address of principal executive offices) | (Zip Code) | |
Registrant’s telephone number, including area code: (858) 503-3300
Securities registered pursuant to Section 12(b) of the Act:
Title of Each Class | Name of Each Exchange on Which Registered | |
Common Stock, par value $0.10 per share | Nasdaq Global Market | |
Securities registered pursuant to Section 12(g) of the Act: None
Indicate by check mark if the registrant is a well-known seasoned issuer, as defined in Rule 405 of the Securities Act. YES ¨ NO x
Indicate by check mark if the registrant is not required to file reports pursuant to Section 13 or Section 15(d) of the Act. YES ¨ NO x
Indicate by check mark whether the registrant: (1) has filed all reports required to be filed by Section 13 or 15(d) of the Securities Exchange Act of 1934 during the preceding 12 months (or for such shorter period that the registrant was required to file such reports), and (2) has been subject to such filing requirements for the past 90 days. YES x NO ¨
Indicate by check mark whether the registrant has submitted electronically and posted on its corporate Website, if any, every Interactive Data File required to be submitted and posted pursuant to Rule 405 of Regulation S-T (§ 232.405 of this chapter) during the preceding 12 months (or for such shorter period that the registrant was required to submit and post such files). YES x NO ¨
Indicate by check mark if disclosure of delinquent filers pursuant to Item 405 of Regulation S-K (§ 229.405 of this chapter) is not contained herein, and will not be contained, to the best of registrant’s knowledge, in definitive proxy or information statements incorporated by reference in Part III of this Annual Report on Form 10-K or any amendment to this Form 10-K. ¨
Indicate by check mark whether the registrant is a large accelerated filer, an accelerated filer, a non-accelerated filer or a smaller reporting company. See the definitions of “accelerated filer”, “large accelerated filer” and “smaller reporting company” in Rule 12b-2 of the Exchange Act.
Large accelerated filer ¨ | Accelerated filer x | Non-accelerated filer ¨ | Smaller reporting company ¨ | |||
Indicate by check mark whether the registrant is a shell company (as defined in Rule 12b-2 of the Act). YES ¨ NO x
The aggregate market value of Common Stock held by non-affiliates as of June 30, 2016 based on the closing price of the common stock on the NASDAQ Global Market was $165,814,752.
The number of shares of the registrant’s Common Stock outstanding as of February 22, 2017, was 32,270,725 shares.
DOCUMENTS INCORPORATED BY REFERENCE
Portions of the proxy statement for the registrant’s annual meeting of stockholders (the “Proxy Statement”) are incorporated by reference in Part III of this Form 10-K to the extent stated herein. The Proxy Statement will be filed within 120 days of the registrant’s fiscal year ended December 31, 2016.
MAXWELL TECHNOLOGIES, INC.
INDEX TO ANNUAL REPORT ON FORM 10-K
For the fiscal year ended December 31, 2016
Page | ||
i
SPECIAL NOTE REGARDING FORWARD-LOOKING STATEMENTS
Unless the context otherwise requires, all references to “Maxwell,” “the Company,” “we,” “us,” and “our” refer to Maxwell Technologies, Inc. and its subsidiaries. All references to “Maxwell SA” refer to our Swiss Subsidiary, Maxwell Technologies, SA.
Some of the statements contained in this Annual Report on Form 10-K and incorporated herein by reference discuss our plans and strategies for our business or make other forward-looking statements, within the meaning of Section 27A of the Securities Act of 1933, as amended, and Section 21E of the Securities Exchange Act of 1934, as amended. The words “anticipates,” “believes,” “estimates,” “expects,” “plans,” “intends,” “may,” “could,” “will,” “continue,” “seek,” “should,” “would” and similar expressions are intended to identify these forward-looking statements, but are not the exclusive means of identifying them. These forward-looking statements reflect the current views and beliefs of our management; however, various risks, uncertainties and contingencies could cause our actual results, performance or achievements to differ materially from those expressed in, or implied by, our statements. Such risks, uncertainties and contingencies include, but are not limited to, the following:
• | dependence upon the sale of products to a small number of customers and vertical markets, some of which are heavily dependent on government funding or government subsidies which may or may not continue in the future; |
• | uncertainties related to the global geopolitical landscape and the recent elections in the United States; |
• | risks related to acquisitions and potential for unsuccessful integration of acquisitions; |
• | risk that our restructuring efforts may not be successful and that we may not be able to realize the anticipated cost savings and other benefits; |
• | our ability to obtain sufficient capital to meet our operating or other needs; |
• | downward pressures on product pricing from increased competition and potential shift in sales mix with respect to low margin and high margin business; |
• | our ability to manage and minimize the impact of unfavorable legal proceedings; |
• | risk that activist stockholders attempt to effect changes to our company which could adversely affect our corporate governance; |
• | risks related to our international operations including, but not limited to, our ability to adequately comply with the changing rules and regulations in countries where our business is conducted, our ability to oversee and control our foreign subsidiaries and their operations, our ability to effectively manage foreign currency exchange rate fluctuations arising from our international operations, and our ability to continue to comply with the U.S. Foreign Corrupt Practices Act as well as the anti-bribery laws of foreign jurisdictions; |
• | dependence upon the sale of products into Asia and Europe, where macroeconomic factors outside our control may adversely affect our sales; |
• | our ability to remain competitive and stimulate customer demand through successful introduction of new products, and to educate our prospective customers on the products we offer; |
• | successful acquisition, development and retention of key personnel; |
• | our ability to effectively manage our reliance upon certain suppliers of key component parts, specialty equipment and logistical services; |
• | our ability to manage product quality problems; |
• | our ability to protect our intellectual property rights and to defend claims against us; |
• | our ability to effectively identify, enter into, manage and benefit from strategic alliances; |
• | occurrence of a catastrophic event at any of our facilities; |
• | occurrence of a technology systems failure, network disruption, or breach in data security, and |
• | our ability to match production volume to actual customer demand. |
Many of these factors are beyond our control. Additionally, there can be no assurance that we will not incur new or additional unforeseen costs or risks in connection with the ongoing conduct of our business. Accordingly, any forward-looking statements included herein do not purport to be predictions of future events or circumstances and may not be realized.
For a discussion of important risks associated with an investment in our securities, including factors that could cause actual results to differ materially from expectations referred to in the forward-looking statements, see Item 1A, Risk Factors, of this document. We do not have any obligation to update publicly any forward-looking statements, whether as a result of new information, future events or otherwise.
1
PART I
Item 1. | Business |
Introduction
Maxwell was incorporated under the name Maxwell Laboratories, Inc. in 1965. The Company made an initial public offering of common stock in 1983, and changed its name to Maxwell Technologies, Inc. in 1996. Today, we develop, manufacture and market energy storage and power delivery products for transportation, industrial, information technology and other applications. Our products are designed and manufactured to perform reliably with minimal maintenance for the life of the applications into which they are integrated. We believe that this “life-of-the-application” reliability gives our products a competitive advantage and enables them to command higher profit margins than commodity products. We focus on the following lines of high-reliability products and technologies:
• | Ultracapacitors: Ultracapacitors are energy storage devices that possess a unique combination of high power density, extremely long operational life and the ability to charge and discharge very rapidly. Our ultracapacitor cells, multi-cell packs and modules provide highly reliable energy storage and power delivery solutions for applications in multiple industries, including automotive, bus, rail and truck in transportation, grid energy storage and renewable wind energy solutions. Our recently developed lithium-ion capacitors are energy storage devices with the power characteristics of an ultracapacitor combined with enhanced energy storage capacity approaching that of a battery. They are uniquely designed to address a variety of applications in the rail, grid, and industrial markets where energy density and weight are differentiating factors. |
• | Dry Battery Electrode Technology: We believe our dry electrode technology has the potential to be a revolutionary technology within the battery industry with a substantial market opportunity, particularly for use in electric vehicles. By applying our proprietary and fundamental dry electrode manufacturing technology and trade secrets to batteries of varying chemistries, we believe we can create significant performance and cost benefits when compared with today’s state of the art wet electrode technology. |
• | High-Voltage Capacitors: Our CONDIS® high-voltage capacitors are designed and manufactured to perform reliably for decades in all climates. These products include grading and coupling capacitors and electric voltage transformers that are used to ensure the safety and reliability of electric utility infrastructure and other applications involving transport, distribution and measurement of high-voltage electrical energy. |
In April 2016, we sold substantially all assets and liabilities related to our radiation-hardened microelectronics product line. Our radiation-hardened microelectronic products for satellites and spacecraft included single board computers and components, such as high-density memory and data conversion modules.
General Product Line and Technology Overview
Ultracapacitors
Ultracapacitors enhance the efficiency and reliability of devices or systems that generate or consume electrical energy. They differ from other energy storage and power delivery products by combining rapid charge/discharge capabilities typically associated with film and electrolytic capacitors with energy storage capacity generally associated with batteries. Although batteries store significantly more electrochemical energy than ultracapacitors, they cannot charge and discharge as rapidly and efficiently as ultracapacitors. Conversely, although electrolytic capacitors can deliver bursts of high power very rapidly, they have limited energy storage capacity, and therefore cannot sustain power delivery as long as ultracapacitors. Also, unlike batteries, which store energy by means of a chemical reaction and experience gradual depletion of their energy storage and power delivery capability over hundreds to a few thousand charge/discharge cycles, ultracapacitors’ energy storage and power delivery mechanisms involve minimal chemical reactions, so they can be charged and discharged hundreds of thousands to millions of times in typical operating environments with negligible performance degradation. This ability to store energy, deliver bursts of power and perform reliably for many years, with little or no maintenance, makes ultracapacitors an attractive and efficient energy storage option for a wide range of energy-consuming and generating devices and applications.
Based on potential volumes, we believe that the transportation industry represents the largest current market opportunity for ultracapacitors. Transportation applications include braking energy recuperation and torque-augmentation systems for hybrid-electric buses, trucks, autos and electric rail vehicles, vehicle power network smoothing and stabilization, and engine starting systems for light and heavy duty trucks to support anti-idle laws for emissions reduction.
2
Our ultracapacitor products have become a standard and often preferred energy storage solution for transportation applications such as hybrid-electric transit buses and electric rail systems and industrial electronics applications such as wind energy, automated utility meters in smart grid systems and backup power for telecommunications and information technology installations.
The core of our technology is a proprietary, solvent-free, electrode manufacturing process. This high throughput roll-to-roll process produces high reliability electrode material with uniform thickness resulting in enhanced product performance and long term durability. The process enables a favorable cost position versus competitors. As part of our offerings, we market electrode material to other ultracapacitor manufacturers. We have licensed our proprietary cell architecture to manufacturers in China, Taiwan and Korea to expand and accelerate acceptance of ultracapacitor products in large and rapidly growing global markets.
Complementary to our ultracapacitor products, lithium-ion capacitors are energy storage devices, that due to their unique design, have more than three times the energy density, similar power density, and a similarly long cycle life compared with ultracapacitors, as well as very low self-discharge similar to lithium-ion batteries. Like ultracapacitors, lithium-ion capacitors have a variety of applications, such as short-range vehicles, rail, grid energy storage, and industrial, where higher energy density and/or fast charge are required. With their unique properties, we believe lithium-ion capacitor products can open up new market opportunities for us.
Dry Battery Electrode Technology
Our dry battery electrode technology leverages our core dry electrode process technology currently used to manufacture ultracapacitors. This unique electrode manufacturing process expands our core technology into batteries of varying chemistry with value-added performance features over wet-coated electrode technology at a reduced production cost. The performance differentiators afforded by dry coating technology are higher energy density, longer operating lifetime, high temperature operating robustness and higher charge/discharge rate capability. As a solvent-less process technology, dry electrode manufacturing is less costly and much more environmentally friendly. We believe that the investment in manufacturing equipment for dry processing is significantly less than wet coating technology, with much lower energy consumption as there is no need to use, remove and recapture solvent from electrode during fabrication. In addition to offering benefits over today’s battery chemistries, dry process technology enables electrode production using high energy density, liquid sensitive materials that are more encumbered by wet coating processes. We believe that these combined attributes of dry battery electrode manufacturing have the potential to meet the cost and performance requirements in the fast growing demand for vehicle electrification.
High-Voltage Capacitors
High-voltage grading and coupling capacitors and electronic voltage transformers are used mainly in the electric utility industry. Grading and coupling capacitors are key components of circuit breakers that prevent high-voltage arcing that can damage switches, step-down transformers and other equipment that transmits or distributes high-voltage electrical energy within electricity network infrastructure and also within high-voltage laboratories. Electronic voltage transformers measure voltage and power levels within electric utility infrastructure. The market for these products consists of expansion, upgrades and maintenance of existing infrastructure and new infrastructure installations in developing countries. Such initiatives are capital-intensive and frequently are subject to regulation, availability of government funding and prevailing economic conditions. North America has a large installed base of fragmented electric utility infrastructure, and has experienced power interruptions and supply problems. Utility deregulation, government budget deficits, and other factors have limited recent capital spending in what historically has been a very large market for utility infrastructure components. We believe that consolidation and changes in market dynamics will generate new opportunities. Projects to increase the availability of electrical energy in developing countries as well as infrastructure modernization and renovation in already developed countries may continue to increase demand for our high-voltage products and solutions in the years to come.
Radiation-Hardened Microelectronics
In April 2016, we sold substantially all assets and liabilities related to our radiation-hardened microelectronics product line. Our radiation-hardened microelectronic products for satellites and spacecraft included single board computers and components, such as high-density memory and data conversion modules.
3
Business Strategy
Our primary objective is to significantly increase our revenue and profit margins by leveraging our differentiating, proprietary “dry electrode technology” platform, and to diversify our business and ultimately position the Company for accelerated, profitable growth to create value for our shareholders. In order to accomplish this objective, we are focused on the following three strategic imperatives:
•First, to maintain or expand our leadership position and market share for our high-voltage product line, which provides foundational cash flow and the opportunity for steady long-term growth;
•Second, to narrow our ultracapacitor market focus and optimize our product portfolio investment. To date, ultracapacitors have required our most significant investment and we are focused on markets which will deliver the required diversification and scale to transition our business to higher, profitable growth opportunities in a large and growing market;
•Third, to leverage our differentiating, proprietary dry battery electrode technology to establish significant partnerships with industry leaders in automotive and energy storage. We believe this technology platform could accelerate the shift towards vehicle electrification and has the potential to unlock new applications with significant revenues opportunities in a potentially large market.
Starting with our high voltage product line, our strategy is to capitalize on a significant shift happening now in the global high voltage market. While these products address highly specialized applications, we are a technology leader in the market niches they serve, and thus are able to sell our products at attractive profit margins. To maintain and expand this competitive position, we are leveraging our technological expertise to develop new products that not only meet the demands of our current markets, but also address additional applications. Leveraging our market leadership, we intend to grow revenue over the next five years by capitalizing on these new products we have recently introduced and for which we are experiencing increasing demand. To meet this growing demand, we have recently embarked on a factory expansion which is expected to be completed in 2018. The continued foundational cash flow from this product line is critical for us to sustain and grow our investment engine and to sufficiently invest in our ultracapacitor product line and our differentiating dry battery electrode platform.
The second part of our strategy is to narrow our market focus and optimize our product portfolio investment for our ultracapacitor product line. Over the last year, we have made steady progress leveraging our core competencies and diversifying this product line as we transition to higher growth market opportunities in automotive, power grid, rail, and wind. We believe that our automotive business, which has contributed a modest, but historically consistent revenue stream, has the largest growth potential. Our power grid and rail markets are in nascent stages of growth and are expected to become more significant contributors to our revenue growth in the coming years. The wind market, while highly dependent on China government subsidy program changes, continues to be a major revenue contributor, but with a modest growth opportunity. For the China bus market, we have established a localized manufacturing partnership with CRRC-SRI to reduce our dependency on China government influences, thus positioning us for future revenue growth. Additionally, we have been focused on optimizing our ultracapacitor product portfolio, and expanding our addressable market and customer base. To that end, we are collaborating and partnering with key existing and prospective customers to develop ultracapacitor-based solutions for high-volume, high-value applications. We are constantly improving technical performance such as higher temperature capability, higher voltage levels and higher power density as well as increased reliability and ruggedness of our products for an extended application lifetime. We are focused on developing and acquiring system level know-how and application expertise to enable entire system solutions and support rapid product implementations in novel and emerging markets and applications. In order to develop new, innovative solutions and accelerate time-to-market for these solutions, we are establishing technical and commercial relationships with value added partners within our target market segments and applications, including value added distributors, solution level integrators and tier one suppliers.
4
The third part of our strategy is focused on our dry battery electrode technology, which has the potential to be a revolutionary technology with a large market opportunity, particularly in electric vehicles. As with ultracapacitors, our proprietary, high throughput manufacturing process for dry battery electrode produces highly reliable electrode material with uniform characteristics resulting in enhanced product performance and long term durability. We believe that lithium ion batteries are the key enabling technology for vehicle electrification, and as such, cost reduction and performance improvement have become critical targets for the world’s leading lithium ion battery manufacturers and automotive OEMs. By applying our proprietary, fundamental dry electrode manufacturing process and trade secrets to lithium ion batteries, we believe that we can create significant performance and cost benefits when compared to today’s state of the art technology. This innovation is only viable because of our leadership in ultracapacitor innovation, as well as our proprietary dry electrode manufacturing experience and evolution over many years. With the automotive industry shifting towards electrification, several large global players in the automotive and battery industries are independently evaluating our dry battery electrode technology as a potentially viable improvement to existing technology solutions. In 2016, we signed a joint development agreement with a leading global automotive OEM as well as a global tier one automotive supplier on a proof-of-concept to develop and validate pilot-volume dry battery electrode performance, which targets a specific electric vehicle platform expected to be released in approximately 2022. In experiments and testing to date, significant performance and cost advantages of our dry electrode manufacturing process compared with wet electrode technology have been identified and we are progressing on track with the remaining key milestones under this proof-of-concept, while the objective of the development effort still requires further validation of the viability and scalability in a fully commercialized electric vehicle system. We are also experiencing increased interest from additional large, brand name, global players in the energy storage and automotive industries regarding future joint development and commercialization efforts. Unlocking the value of this technology for our customers, our partners and our shareholders has become a key priority for Maxwell. Given recent successes in the proof-of-concept development activities and the increasing interest from global leaders in the automotive and energy storage markets, we have begun to shift more investment towards our dry battery electrode technology and anticipate broader development and commercialization collaborations as we complete the current proof-of-concept activities towards the end of 2017.
Products and Applications
Our products incorporate our know-how and proprietary energy storage and power delivery technologies at both the component and system levels for specialized, high-value applications that demand “life-of-the-application” reliability.
Ultracapacitors
Ultracapacitors, also known as electrochemical double-layer capacitors (“EDLC”) or supercapacitors, store energy electrostatically. Although ultracapacitors are electrochemical devices, minimal chemical reactions are involved in their energy storage mechanism. Their electrostatic energy storage mechanism is fully reversible, allowing ultracapacitors to be rapidly charged and discharged hundreds of thousands to millions of times with minimal performance degradation.
Compared with electrolytic capacitors, which have very low energy storage capacity and discharge power too rapidly for many power delivery applications, ultracapacitors have much greater energy storage capacity and can deliver energy over time periods ranging from fractions of a second to several minutes.
Compared with batteries, which require minutes or hours to fully charge or discharge, ultracapacitors discharge and recharge in as little as fractions of a second. Although ultracapacitors store only about five to ten percent as much electrical energy as a battery of comparable size, they can deliver or absorb electric energy up to 100 times more rapidly than batteries. Because they operate reliably through hundreds of thousands to millions of charge cycles, compared with only hundreds to a few thousand equivalent cycles for batteries, ultracapacitors have significantly higher lifetime energy throughput, which equates to significantly lower cost on a life cycle basis.
We link our ultracapacitor cells together in multi-cell modules to satisfy energy storage and power delivery requirements of varying voltages. Both individual cells and multi-cell products can be charged from any primary energy source, such as a battery, generator, fuel cell, solar panel, wind turbine or electrical outlet. Virtually any device or system whose intermittent peak power demands are greater than its average continuous power requirement is a candidate for an ultracapacitor-based energy storage and power delivery solution.
Our ultracapacitor products have significant advantages over batteries, including:
• | the ability to charge and discharge up to 100 times faster; |
• | significantly lower weight per unit of power delivery; |
• | higher charge/discharge turnaround efficiency, minimizing energy loss; |
• | the ability to operate reliably and continuously in extreme temperatures (-40º C to +65º C); |
5
• | minimal to no maintenance requirements; |
• | “life of the application” durability; and |
• | minimal environmental issues associated with disposal because they contain no heavy metals. |
With no moving parts and negligible chemical reactions involved in their energy storage mechanism, ultracapacitors provide a simple and highly reliable solution to buffer short-term mismatches between power available and power required. Additionally, ultracapacitors offer the advantage of storing energy in the same form in which it is used, as electricity.
Emerging applications, including electric power in vehicles, stabilization of renewable power including solar and wind, and highly reliable, maintenance-free, backup power for telecommunications, information technology and industrial installations, are creating significant opportunities for more efficient and reliable energy storage and power delivery products. In many applications, power demand varies widely from moment to moment, and peak power demand typically is much greater than the average power requirement. For example, automobiles require 10 times more power to accelerate than to maintain a constant speed, and forklifts require more power to lift a heavy pallet of material than to move from place to place within a warehouse.
Engineers historically have addressed transient peak power requirements by over-sizing the engine, battery or other primary energy source to satisfy all of a system’s power demands, including demands that occur infrequently and may last only fractions of a second. Sizing a primary power source to meet brief peak power requirements, rather than for average power requirements, is costly and inefficient. When a primary energy source is coupled with ultracapacitors, which can deliver or absorb brief bursts of high power on demand for periods of time ranging from fractions of a second to several minutes, the primary energy source can be smaller, lighter and less expensive.
The following diagram depicts the separation of a primary energy storage source from a peak power delivery component to satisfy the requirements of a particular application. Components that enable this separation allow designers to optimize the size, efficiency and cost of the entire electrical power system.
Peak Power Application Model
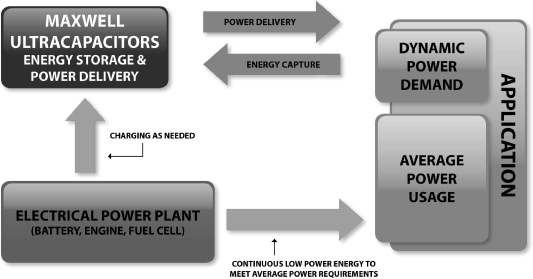
Although batteries remain the most widely used component for both energy storage and peak power delivery, flywheels, ultracapacitors and more advanced batteries now enable system designers to separate and optimize these functions. Based in part on our ultracapacitor products’ declining cost, high performance and “life-of-the-application” durability, they are becoming a preferred solution for many energy storage and power delivery applications.
6
We offer our ultracapacitor cells with capacitances ranging from 1 to 3,400 farads. Applications such as hybrid-electric bus, truck and auto drive trains, electric rail systems, renewables stabilization and uninterruptible power supply systems require integrated energy storage systems consisting of up to hundreds of ultracapacitor cells. To facilitate adoption of ultracapacitors for these larger systems, we have developed integration technologies, including proprietary electrical balancing and thermal management systems and interconnect technologies. We hold patents for certain of these technologies. We offer a broad range of standard multi-cell modules. Our current standard multi-cell products each incorporate from 6 to 60 of our cells to provide “plug and play” solutions for applications requiring from 16 to 160 volts, and these modules are designed to be linked together for higher voltage and higher power applications.
High-Voltage Capacitors
Electric utility infrastructure includes switches, circuit breakers, step-down transformers and measurement instruments that transmit, distribute and measure high-voltage electrical energy. High-voltage capacitors are used to protect these systems from high-voltage arcing. With operational lifetimes measured in decades, these applications require high reliability and durability.
Under our CONDIS® line of high-voltage capacitor products, Maxwell has more than 100 years of experience in this industry, and is the world’s largest producer of such products for use in utility infrastructure. Engineers with specific expertise in high-voltage systems develop, design and test our high-voltage capacitor products in our development and production facility in Rossens, Switzerland. Our high-voltage capacitors are produced through a proprietary assembly and automated winding and drying process to ensure consistent quality and reliability. We are continuously upgrading and expanding our high-voltage capacitor production facility and high end laboratory which has resulted in a doubling of our output capacity and significant shortening order-to-delivery intervals.
We sell our high-voltage capacitor products to large systems integrators, which install and service power plants and electrical utility infrastructure worldwide.
Manufacturing
Our internal manufacturing operations are conducted in production facilities located in Peoria, Arizona and Rossens, Switzerland. We have made substantial capital investments to outfit and expand our internal production facilities and incorporate mechanization and automation techniques and processes. We have trained our manufacturing personnel in advanced operational techniques, added information technology infrastructure and implemented new business processes and systems to increase our manufacturing capacity and improve efficiency, planning and product quality. Our ultracapacitor electrode material is currently produced exclusively at our Peoria facility. We outsource the assembly of our 60 mm diameter large cell ultracapacitors, and subsequently, assembly of large cell-based multi-cell modules to Belton Technology Group (“Belton”), a contract manufacturer with operations in Shenzhen, China. In 2010, we outsourced assembly of our mid-size D-cell ultracapacitor products and D-cell-based multi-cell modules to Tianjin Lishen Battery Joint-Stock Co. Ltd. (“Lishen”), one of China’s largest producers of lithium-ion batteries, based in Tianjin. We believe that we have sufficient capacity to meet near-term demand for all of our product lines.
Ultracapacitors
We produce electrode material for our own ultracapacitor products, and for sale to other ultracapacitor manufacturers such as Yeong-Long Technologies Co., Ltd. (“YEC”) at our Peoria facility. In 2013, we completed a major electrode capacity expansion in our Peoria facility. This facility gives us sufficient capacity to support both our current ultracapacitor production requirements and external electrode demand in the near term. As demand increases, additional increments of electrode production capacity can be added within a year through the utilization of established equipment vendors.
We also produce our engine start module on production lines in our Peoria facility. As noted above, we have outsourced assembly of all other cell types and multi-cell modules to contract manufacturers in Asia. To increase reliability, reduce cost, simplify assembly and facilitate automation, we have designed our ultracapacitor products to incorporate lower-cost materials and to reduce both the number of parts in a finished cell and the number of manufacturing process steps required to produce them. We intend to continue using outsourced cell and module assembly in countries with cost efficient value added services, but plan to continue to produce our proprietary electrode material only in internal production facilities to ensure the continued protection of our intellectual property.
7
High-Voltage Capacitors
We produce our high-voltage grading and coupling capacitors and electronic voltage transformers in our Rossens, Switzerland facility. We believe we are the only high-voltage capacitor producer that manufactures its products with stacking, assembly and automated winding processes. This enables us to produce consistent, high quality and highly reliable products, and gives us sufficient capacity to satisfy anticipated global customer demand. We operate the assembly portion of the manufacturing process using a “just-in-time” design, allowing us to increase production capacity without adding direct labor, and significantly shortening order-to-delivery intervals.
Suppliers
We generally purchase components and materials, such as carbon powder, certain electronic components, dielectric materials, and ceramic insulators from a variety of suppliers. For certain products, we rely on a limited number of suppliers or a single supplier for a number of reasons, including notably, the cost effectiveness of doing business with a single supplier. Although we believe there are alternative sources for some of the components and materials that we currently obtain from a single source, there can be no assurance that we will be able to identify and qualify alternative suppliers in a timely and cost effective manner. Therefore, for certain critical components, we utilize mitigation strategies such as, for example, maintaining an inventory of safety stock on site at our respective manufacturing locations in an effort to minimize the impact of an unforeseen disruption in supply from these outside parties.
Marketing and Sales
We market and sell our products worldwide through both direct and indirect sales channels for incorporation by integrators and OEM customers into a wide range of end products. Because the introduction of products based on emerging technologies requires customer acceptance of new and unfamiliar technical approaches, and because many OEM customers have rigorous vendor qualification processes, the design-in process and initial sale of our products often takes months or even years.
Our principal marketing strategy is to identify applications for which our products and technology offer a compelling value proposition, to become a preferred vendor on the basis of service and price, and to negotiate supply agreements that enable us to establish long-term relationships with key OEM and integrator customers. To optimize our go-to-market strategy and tailor our products to end user application, we organized our marketing team into two specialized ultracapacitor product line teams. One team supports Automotive and Transportation market segments which require highly rugged and robust products with very stringent automotive qualification requirements and solid change management. The other team supports all Green Infrastructure applications such as grid energy storage, wind power and other more stationary applications that require very cost sensitive products with very high service lifetimes and often very complex systems solutions. Our marketing efforts strive to develop application specific product portfolios and solutions for our Automotive & Transportation and Green Infrastructure market segments. As these design-in sales tend to be technical and engineering-intensive, we organize market-specific teams composed of sales, applications engineering and other technical and operational personnel to work closely with our customers across multiple disciplines to satisfy their requirements for form, fit, function and environmental needs. As time-to-market often is a primary motivation for our customers to use our products, the initial sale and design-in process typically evolves into ongoing account management to ensure on-time delivery, responsive technical support and value added problem-solving.
We design and conduct discrete marketing programs intended to position and promote each of our product lines. These include trade shows, seminars, advertising, product publicity, distribution of product literature, internet websites and social media. We utilize marketing communications specialists to develop and implement our marketing programs, design and develop marketing materials, negotiate advertising media purchases, write and place product press releases and manage our marketing websites.
We also have an alliance with YEC to assemble and market small cell ultracapacitor products. In addition, we sell electrode material to YEC, both for Maxwell-branded products and for incorporation into YEC’s own ultracapacitor products.
Competition
Each of our product lines has competitors, some of whom have longer operating histories, significantly greater financial, technical, marketing and other resources, greater name recognition and larger installed customer bases than we have. In some of the target markets for our emerging technologies, we face competition both from products utilizing well-established, existing technologies and other novel or emerging technologies.
8
Ultracapacitors
Our ultracapacitor products have two types of competitors: other ultracapacitor suppliers and purveyors of energy storage and power delivery solutions based on batteries or other technologies. Although a number of companies are developing ultracapacitor products and technology, our principal competitors in the supply of ultracapacitor or supercapacitor products are Panasonic, a division of Matsushita Electric Industrial Co., Ltd., NessCap Co., Ltd., LS Mtron, a unit of LS Cable, Supreme Power Solutions Co., Ltd., Vina Technology Company, Ltd., Samxon, a unit of Man Yue Technology Holdings, Ltd., Skeleton Technologies, Yunasko, Ltd., and Ioxus, Inc. The key competitive factors in the ultracapacitor industry are price, performance (energy stored and power delivered per unit volume), durability and reliability, operational lifetime and overall breadth of product offerings. We believe that our ultracapacitor products and electrode material compete favorably with respect to all of these competitive factors. However, the hybrid transit vehicle market for ultracapacitors in China, a region which has historically represented a significant portion of our sales, has recently become more competitive with respect to pricing which has caused us to lower our prices to remain competitive. In addition, the recent increase in the number of competitors in the hybrid transit vehicle market in China along with government subsidy program requirements regarding localization may drive down our market share.
Ultracapacitors also compete with products based on other technologies, including advanced batteries in power quality and peak power applications, as well as with flywheels, thermal storage and batteries in backup energy storage applications. We believe that the durability, long life, performance and value of ultracapacitors gives them a competitive advantage over these alternative choices in many applications. In addition, integration of ultracapacitors with some of these competing products may provide optimized solutions that neither product can provide by itself. For example, tier 1 auto parts supplier Continental AG designed a combined solution incorporating ultracapacitors with a battery for engine starting in a start-stop-idle elimination system for “micro hybrid” autos which was introduced in 2010 and installed in approximately two million cars by French automaker PSA Peugeot Citroen and was more recently introduced by General Motors for several models under the Cadillac brand.
High-Voltage Capacitors
Maxwell’s CONDIS® line of high-voltage capacitor products, is the world’s largest producer of high-voltage capacitors for use in electric utility infrastructure. Our principal competitors in the high-voltage capacitor markets are in-house production groups of certain of our customers and other independent manufacturers, such as the Coil Product Division of Trench Limited in Canada and Europe and Hochspannungsgeräte Porz GmbH in Germany. We believe that we compete favorably, both as a consistent supplier of highly reliable high-voltage capacitors, and in terms of our expertise in high-voltage systems design. Over the last ten years, our largest customer has transitioned from producing its grading and coupling capacitors internally to outsourcing substantially all of its requirements to us.
Research and Development
We maintain active research and development programs to improve existing products and to develop new products. For the year ended December 31, 2016, our research and development expenditures totaled approximately $20.9 million, compared with $24.7 million and $26.3 million in the years ended December 31, 2015 and December 31, 2014, respectively. In general, we focus our research and product development activities on:
• | designing and producing products that perform reliably for the life of the application or systems into which they are integrated; |
• | designing efficient manufacturing with low scrap rates to achieve improved profit margins and to enable us to reduce prices to allow our products to penetrate new and price-sensitive applications; |
• | designing our products to have superior technical performance; |
• | designing our products to be compact and light; and |
• | designing new products that provide novel solutions to expand our market opportunities. |
Most of our current research, development and engineering activities are focused on electrode fabrication and material science, including activated carbon, electrolyte, electrically conductive materials, dielectric materials and ceramics to reduce cost and improve performance, reliability and ease of manufacturing. Additional efforts are focused on product design and manufacturing processes for high-volume manufacturing.
In 2016, we also focused on lithium ion battery electrode development. The principal objective of our lithium ion battery electrode development activities is to demonstrate the ability of our dry electrode fabrication process to manufacture high volume lithium ion electrode at lower cost and improved performance relative to our competition.
9
Ultracapacitors
The principal focus of our ultracapacitor development activities is to increase power and energy density, reduce internal resistance, extend operational life and reduce manufacturing cost. Our ultracapacitor designs focus on low-cost, high-capacity cells in standard sizes ranging from 1 to 3,400 farads, and corresponding multi-cell modules based on various form factors.
High-Voltage Capacitors
The principal focus of our high-voltage capacitor development efforts is to enhance performance and reliability while reducing the size, weight and manufacturing cost of our products. We also are directing our design efforts to develop high-voltage capacitors for additional applications and solutions.
Intellectual Property
We place a strong emphasis on inventing, protecting and exploiting proprietary technologies, processes and designs which bring intrinsic value and uniqueness to our product portfolio. We place a high priority on obtaining patents to provide the broadest and strongest possible protection for our products, technologies and other strategic initiatives. Our continued success will depend in part on our ability to protect our existing patents and to secure patent protection on developing technologies. As of December 31, 2016, we held 71 issued U.S. patents and 22 published pending U.S. patent applications which relate to our core technologies, processes and designs. Of these issued patents, 65 relate to our ultracapacitor products and technology and 6 relate to our high-voltage capacitor products and technology.
Our pending and any future patent applications may not survive the challenges of patent prosecution in the jurisdictions in which we file throughout the world; however, our strategy is to focus on countries generating revenue as well as markets which we deem key to our business strategies and objectives. We routinely seek patent protection in the United States and the principal countries of Europe and Asia. At present, we do not rely on licenses from any third parties to produce our products.
Our existing patent portfolios and pending patent applications relate primarily to:
Ultracapacitors
• | compositions of the electrode, including its formulation, design and fabrication techniques; |
• | materials science associated with raw material components; |
• | physical cell package designs as well as the affiliated processes used in cell assembly; |
• | cell-to-cell and module-to-module interconnect technologies that minimize equivalent series resistance and enhance the functionality, performance and longevity of ultracapacitor products including system level electronics; and |
• | module and system designs that facilitate applications of ultracapacitor technology. |
High-Voltage Capacitors
• | physical cell package designs as well as the affiliated processes used in cell assembly; |
• | component selection to enable compliance with environmental regulations with minimal sacrifice to product performance; and |
• | manufacture of capacitors in a manner which significantly reduces exposure of internal components to impurities, moisture and other undesirable materials in an effort to avoid longer manufacturing times and reduced performance characteristics without these technical advancements. |
Historically, our high-voltage capacitor products have been based on our know-how and trade secrets rather than on patents. We filed our first patent application covering our high-voltage capacitor technology in 2003, and we continue to pursue patent protection in addition to trade secret protection of certain aspects of our products’ design and production.
While our primary strategy for protecting our proprietary technologies, processes and designs is related to obtaining patents, we also apply for trademark registrations which identify us as the source of the products. Additionally, we promote our technologies, processes and designs in association with these registered trademarks to further distinguish our products from those of our competitors. As of December 31, 2016, we had five formal trademark registrations within the U.S.
10
Establishing and protecting proprietary products and technologies is a key element of our corporate strategy. Although we attempt to protect our intellectual property rights through patents, trademarks, copyrights, trade secrets and other measures, there can be no assurance that these steps will be adequate to prevent infringement, misappropriation or other misuse by third parties, or will be adequate under the laws of some foreign countries, which may not protect our intellectual property rights to the same extent as do the laws of the U.S.
We use employee and third-party confidentiality and nondisclosure agreements to protect our trade secrets and unpatented know-how. We require each of our employees to enter into a proprietary rights and nondisclosure agreement in which the employee agrees to maintain the confidentiality of all our proprietary information and, subject to certain exceptions, to assign to us all rights in any proprietary information or technology made or contributed by the employee during his or her employment with us. In addition, we regularly enter into nondisclosure agreements with third parties, such as potential product development partners and customers, to protect any information disclosed in the pursuit of securing possible fruitful business endeavors.
Financial Information by Geographic Areas
Years ended December 31, | |||||||||||||||||||||
2016 | 2015 | 2014 | |||||||||||||||||||
Amount | Percent | Amount | Percent | Amount | Percent | ||||||||||||||||
Revenue from external customers located in(1): | (Dollars in thousands) | ||||||||||||||||||||
China | $ | 48,191 | 40 | % | $ | 87,856 | 53 | % | $ | 89,143 | 48 | % | |||||||||
United States | 12,041 | 10 | % | 20,836 | 12 | % | 23,758 | 13 | % | ||||||||||||
Germany | 12,854 | 10 | % | 13,972 | 8 | % | 16,384 | 9 | % | ||||||||||||
All other countries (1) | 48,158 | 40 | % | 44,708 | 27 | % | 57,301 | 30 | % | ||||||||||||
Total | $ | 121,244 | 100 | % | $ | 167,372 | 100 | % | $ | 186,586 | 100 | % | |||||||||
_________________________
(1) | Location is determined by shipment destination |
(2) | Revenue from external customers located in countries included in “All other countries” does not individually comprise more than 10% of total revenue for any of the years presented. |
Years ended December 31, | |||||||||||||||||||||
2016 | 2015 | 2014 | |||||||||||||||||||
Amount | Percent | Amount | Percent | Amount | Percent | ||||||||||||||||
Long-lived assets: | (Dollars in thousands) | ||||||||||||||||||||
United States | $ | 19,267 | 74 | % | $ | 22,267 | 69 | % | $ | 28,013 | 72 | % | |||||||||
China | 1,477 | 6 | % | 4,148 | 13 | % | 4,991 | 13 | % | ||||||||||||
Switzerland | 5,376 | 20 | % | 6,021 | 18 | % | 5,663 | 15 | % | ||||||||||||
Total | $ | 26,120 | 100 | % | $ | 32,436 | 100 | % | $ | 38,667 | 100 | % | |||||||||
Revenue by Product Line:
Years ended December 31, | |||||||||||||||||||||
2016 | 2015 | 2014 | |||||||||||||||||||
Amount | Percent | Amount | Percent | Amount | Percent | ||||||||||||||||
(Dollars in thousands) | |||||||||||||||||||||
Ultracapacitors | $ | 71,491 | 59 | % | $ | 114,525 | 68 | % | $ | 135,637 | 73 | % | |||||||||
High-voltage capacitors | 45,177 | 37 | % | 41,718 | 25 | % | 40,361 | 21 | % | ||||||||||||
Microelectronic products (1) | 4,576 | 4 | % | 11,129 | 7 | % | 10,588 | 6 | % | ||||||||||||
Total | $ | 121,244 | 100 | % | $ | 167,372 | 100 | % | $ | 186,586 | 100 | % | |||||||||
_________________________
(1) | The microelectronics product line was sold in April 2016. |
11
Risks Attendant to Foreign Operations and Dependence
We have substantial operations in Switzerland, and we derive a significant portion of our revenue from sales to customers located outside the U.S. We expect our international sales to continue to represent a significant amount of our future revenue. As a result, our business will continue to be subject to certain risks, such as those imposed by domestic laws and regulations related to topics such as export controls and interactions with foreign officials as well as foreign government regulations, including, notably, changes in tax laws, tax treaties, tariffs and freight rates. To the extent that we are unable to respond effectively to political, economic and other conditions in the countries where we operate and do business, our results of operations and financial condition could be materially adversely affected. Some of our business partners also have international operations and are subject to the risks described above. Even if we are able to successfully manage the risks of international operations, our business may be adversely affected if our business partners are not able to successfully manage these risks as well.
Having substantial international operations also increases the complexity of managing our financial reporting and internal controls and procedures. Additionally, as a result of our extensive international operations and significant revenue generated outside the U.S., the dollar amount of our current and future revenue, expenses and debt may be materially affected by fluctuations in foreign currency exchange rates. Similarly, assets and liabilities of our Swiss subsidiary that are not denominated in its functional currency are subject to effects of currency fluctuations, which may affect our reported earnings. Also, changes in the mix of income from our domestic and foreign operations, expiration of tax holidays and changes in tax laws and regulations could increase our tax expense. If we are unable to manage these risks effectively, it could impair our ability to achieve our targets for revenue and profitability.
As a result of our status as a publicly traded company within the U.S., we are subject to the U.S. Foreign Corrupt Practices Act (“FCPA”), which prohibits companies from making improper payments to foreign officials for the purpose of obtaining or retaining business. Additionally, as a result of our international operations, we could also be subject to the anti-bribery laws of other jurisdictions which vary slightly from jurisdiction to jurisdiction and may be different than the FCPA. If we fail to comply with anti-bribery laws and regulations, we could be subject to civil and/or criminal penalties as well as expenses related to any internal investigation.
Backlog
Product backlog as of December 31, 2016 was approximately $11.4 million, compared with $18.1 million as of December 31, 2015. Backlog consists of firm orders for products that will be delivered within 12 months. The actual amount of backlog at any particular time may not be a meaningful indicator of future business prospects as this amount is impacted by a number of factors including potential cancellations of orders by our customers.
Significant Customers
No customers accounted for 10% or more of total revenue in the year ended December 31, 2016. One customer, Shenzhen Xinlikang Supply China Management Co. Ltd., accounted for 19% and 20% of total revenue in the years ended December 31, 2015 and 2014, respectively.
Government Regulation
Due to the nature of our operations, including, notably, the use of hazardous substances in some of our manufacturing and research and development activities, we are subject to stringent federal, state and local laws, rules, regulations and policies governing workplace safety and environmental protection. These include the use, generation, manufacture, storage, air emission, effluent discharge, handling and disposal of certain materials and wastes. In the course of our historical operations, materials or wastes may have spilled or been released from properties owned or leased by us or on or under other locations where these materials and wastes have been taken for disposal. These properties and the materials and wastes spilled, released, or disposed thereon are subject to environmental laws which may impose strict liability, without regard to fault of the original conduct, for remediation of contamination resulting from such releases. Under such laws and regulations, we could be required to remediate previously spilled, released, or disposed substances or wastes, or to make capital improvements to prevent future contamination. Failure to comply with such laws and regulations also could result in the assessment of substantial administrative, civil and criminal penalties and even the issuance of injunctions restricting or prohibiting our activities. It is also possible that implementation of stricter environmental laws and regulations in the future could result in additional costs or liabilities to us as well as the industry in general. While we believe we are in substantial compliance with existing environmental laws and regulations, we cannot be certain that we will not incur substantial costs in the future related to unknown liabilities.
12
Employees
As of December 31, 2016, we had 418 employees in five countries, as follows: 224 full-time, 5 part-time and 31 temporary employees in the U.S.; 82 full-time, 9 part-time and 21 temporary employees in Switzerland; 32 full-time and 4 temporary employees in China; 9 full-time employees in Germany, and 1 full-time employee in South Korea. We are unable to estimate the percent of our Swiss employees that are members of a labor union, as Swiss law prohibits employers from inquiring into the union status of employees. We consider our relations with our employees to be amicable.
Available Information
We file annual, quarterly and current reports, proxy statements and other information with the Securities and Exchange Commission (“SEC”). Our SEC filings are available free of charge to the public over the Internet at the SEC’s website at http://www.sec.gov. Our SEC filings are also available free of charge on our website at http://www.maxwell.com as soon as reasonably practicable following the time that they are filed with the SEC. You may also read and copy any document we file with the SEC at the SEC’s Public Reference Room at 450 Fifth Street, NW, Washington, DC 20549. You may obtain information on the operation of the Public Reference Room by calling the SEC at 1-800-SEC-0330. The information found on our website is not part of this or any report that we file with the SEC.
13
Item 1A. Risk Factors
An investment in our common stock involves a high degree of risk. Our business, financial condition and results of operations could be seriously harmed if potentially adverse developments, some of which are described below, materialize and cannot be resolved successfully. In any such case, the market price of our common stock could decline and you may lose all or part of your investment in our common stock.
The risks and uncertainties described below are not the only ones we face. Additional risks and uncertainties, including those not presently known to us or that we currently deem immaterial, may also result in decreased revenue, increased expenses or other adverse impacts that could result in a decline in the price of our common stock. You should also refer to the other information set forth in this Annual Report on Form 10-K, including our consolidated financial statements and the related notes.
A substantial percentage of our total revenue depends on the sale of products within a small number of vertical markets and a small number of geographic regions, and the decline in the size of a vertical market or reduction of consumption within a geographic region, without offsetting growth in emerging markets, could impede our growth and profitability.
Sales within a relatively small number of vertical markets and a small number of geographic regions make up a large portion of our revenue. Our ability to grow our sales within this limited number of markets and regions depends on our ability to compete on price, delivery and quality. If a particular market into which we sell experiences a decline, then our customers will decrease their own consumption of our products thereby reducing our revenue. For example, if municipalities are no longer accepting of ultracapacitor systems for hybrid buses, then our direct customers will no longer consume products from us for incorporation into such applications. Additionally, a substantial portion of our revenue stems from sales to customers within a limited number of geographic regions including, notably, China and Germany. If certain factors were to arise including, for example, a catastrophic event or shift in economic health and stability within a particular region, then customers within these regions may reduce their consumption of our products resulting in reduced revenue for us. While we have focused efforts targeting growth of product acceptance in other smaller market segments, there can be no assurance that the revenue associated with these emerging markets will be able to fully or partially offset any down turn in the vertical markets where we currently maintain substantial business.
Many of our customers are currently the benefactors of government funding or government subsidies.
Our products are currently sold into a limited number of vertical markets, some of which are either directly funded by or partially subsidized with government funding. The use of our ultracapacitor technology in certain applications is still relatively immature, the costs associated with producing the products is perceived to be high as compared with more mature and readily understood solutions. However, many government entities have determined that they view certain prevailing interests, including, for example, reduction of pollution, to outweigh the economic costs associated with incorporating these clean technologies and therefore are willing to allocate government funding to encourage companies to produce goods which reduce pollution and energy consumption. For example, a large portion of our current ultracapacitor business is concentrated in the Chinese hybrid transit vehicle and wind energy markets, which are heavily dependent on government regulation and subsidy. These markets may experience volatility when there are changes or delays in government policies and subsidy programs that support our sales into these markets. For example, in 2016, the Chinese government proposed a new registration requirement for energy storage manufacturers who sell into the automotive and heavy transportation markets. Many subsidies offered by the Chinese government require a manufacturer to be registered under this regime in order to be eligible for the applicable subsidies, thereby injecting some uncertainty as to whether our customers will be able to capture the benefit of this new program while determining which manufacturers will be able to complete the proposed registration requirement. For 2017 and beyond, we may continue to see variability in revenue as a result of uncertainty regarding how these potential changes to the China government subsidy will impact our sales into these markets.
Similarly, our high-voltage capacitor products are primarily consumed by markets which are either directly funded by or controlled by the respective government bodies in the jurisdictions where our customers do business. For example, our high-voltage capacitor products are largely used for electric utility infrastructures which are largely controlled by the respective governments supplying power and electricity to its populations. If these government entities elect to change their policies on government subsidies or decide to cancel or reduce certain government funding programs, then our customers could cancel or reduce orders for our products.
14
Uncertainty in the global geopolitical landscape from recent events may impede the implementation of our strategy outside the United States.
There may be uncertainty as to the position the United States will take with respect to world affairs and events following the 2016 U.S. presidential election and related change in political agenda, coupled with the transition of administrations. This uncertainty may include such issues as U.S. support for existing treaty and trade relationships with other countries, including, notably, China. This uncertainty, together with other key global events during 2016 (such as recently enacted currency control regulations in China, the continuing uncertainty arising from the Brexit referendum in the United Kingdom as well as ongoing terrorist activity), may adversely impact (i) the ability or willingness of non-U.S. companies to transact business in the United States, including with the Company, (ii) our ability to transact business in other countries, (iii) regulation and trade agreements affecting U.S. companies, (iv) global stock markets (including The Nasdaq Global Market on which our common shares are traded), and (v) general global economic conditions. All of these factors are outside of our control, but may nonetheless cause us to adjust our strategy in order to compete effectively in global markets.
There may be changes in, and uncertainty with respect to, legislation, regulation and governmental policy due to recent elections in the United States.
The recent presidential and congressional elections in the United States could result in significant changes in, and uncertainty with respect to, legislation, regulation and government policy. While it is not possible to predict whether and when any such changes will occur, changes at the local, state or federal level could impact fuel cell market adoption in the USA and the alternative energy technologies sector in the USA, generally. Specific legislative and regulatory proposals discussed during and after the election that could have a material impact on us include, but are not limited to, reform of the federal tax code; infrastructure renewal programs; and modifications to international trade policy, public company reporting requirements, environmental regulation and antitrust enforcement.
We may not be successful in growing through acquisitions or integrating effectively any businesses and operations we may acquire.
Our success depends on our ability to continually enhance and broaden our product offerings in response to changing customer demands, technology, and competitive pressures as well as entry into new vertical markets. To remain competitive, we recently entered into an agreement providing for the acquisition of substantially all of the assets and business of Nesscap Energy, Inc., which includes complementary businesses to expand our portfolio of products and to add value to the projects undertaken for clients or enhance our capital strength. We do not know if we will be able to complete any future acquisitions or whether we will be able to successfully integrate any acquired businesses, operate them profitably, or retain their key employees.
If we cannot successfully close this planned acquisition, we may not be able to successfully expand our operations or achieve our revenue and other financial targets. Further, there can be no assurance that we will be able to generate sufficient cash flow from an acquisition or realize any other anticipated benefits. In addition, there can be no assurance that the due diligence undertaken in connection with an acquisition will uncover all liabilities relating to the acquired business. Nor can there be any assurance that our profitability will be improved as a result of this acquisition. Any acquisition may involve operating risks, such as:
• | the difficulty of assimilating the acquired operations and personnel and integrating them into our current business; |
• | the potential impairment of employee morale; |
• | the potential disruption of our ongoing business; |
• | preserving important strategic and customer relationships; |
• | the diversion of management’s attention and other resources; |
• | the risks of entering markets in which we have little or no experience; |
• | the possibility that acquisition-related liabilities that we incur or assume may prove to be more burdensome than anticipated; |
• | the risks associated with possible violations of the Foreign Corrupt Practices Act, the United Kingdom Bribery Act of 2010, and other anti-corruption laws as a result of any acquisition or otherwise applicable to our business; and |
• | the possibility that any acquired businesses do not perform as expected. |
15
Our acquisition integration and restructuring activities could result in management distractions, operational disruptions and other difficulties.
As disclosed on February 28, 2017, we have initiated a planned acquisition along with concurrent restructuring activities in an effort to improve operational efficiency, and such efforts are expected to continue in the future. These actions are intended to better align our cost structure with near-term revenue, and also to improve engineering and operational efficiencies throughout the organization. Additional reductions-in-force and senior level employee replacements may be required as we continue to realign our business organization, operations and product lines. Upon the close of the anticipated transaction, our efforts to integrate manufacturing and other operations with the acquired business may not be successful. For example, we may encounter issues with the transition of products delivered to our customers from the higher cost solutions, either from our current facilities or the facility of the acquired business, as the case may be, to the integrated cost efficient solutions. Such difficulties, even if managed correctly, could result in delays in the actual integration of our manufacturing operations and therefore a delay in realizing anticipated reductions in expenses. Any restructuring efforts could also disrupt our ability to supply products to customers, detriment relationships with customers and other business partners, divert the attention of management away from other priorities, harm our reputation, expose us to increased risk of legal claims by terminated employees, increase our expenses, increase the workload placed upon remaining employees and cause employees to lose confidence in our future performance and decide to leave. In addition, if we continue to reduce our workforce, it may adversely impact our ability to respond rapidly to new growth opportunities or to remain competitive. Further, employees whose positions were or will be eliminated in connection with these restructuring activities or who otherwise determine to leave may seek employment with our competitors, customers or suppliers. Although each of our employees is required to sign a confidentiality agreement with us at the time of employment, which agreement contains covenants prohibiting, among other things, the disclosure or use of our confidential information and the solicitation of our employees, we cannot guarantee that the confidential nature of our proprietary information will be maintained in the course of such future employment, or that our key continuing employees will not be solicited to terminate their employment with us. We cannot guarantee that any restructuring activities undertaken in the future will be successful, or that we will be able to realize the anticipated cost savings and other anticipated benefits from our restructuring plans.
We may not be able to obtain sufficient capital to meet our operating or other needs, which could require us to change our business strategy and result in decreased profitability and a loss of customers.
We believe that in the future we may need a substantial amount of additional capital for a number of potential purposes in furtherance of our strategic missions and growth objectives. For example, to meet potential growth in demand for our products, particularly for our ultracapacitor products, we will need significant resources for customized production equipment. Further, additional capital may be required to execute on our strategies related to continued expansion into commercial markets, development of new products and technologies, and acquisitions of new or complementary businesses, product lines or technologies. Cash generated by our operations may not be sufficient to cover these investments.
While we currently have access to a credit facility from East West Bank, we must still comply with certain conditions, including, notably, certain financial covenants, in order to have access to such funds. If adequate funds are not available when needed, we may be required to change or delay our planned growth, which could result in decreased revenue and profits and loss of customers. Also, if we are to raise additional funds by issuing equity, the issuance of additional shares will result in dilution to our current stockholders. If additional financing is accomplished by the issuance of debt, the service cost, or interest, will reduce net income or increase net loss, and we may also be required to issue warrants to purchase shares of common stock in connection with issuing such debt.
Downward pressures on product pricing or changes to our product mix could adversely impact our financial condition and operating results, and such pressures or changes could even result in loss of revenue in exchange for avoidance of gross margin pressures.
We strive to manage gross margin for the products we sell. There can be no assurance that targeted gross margin percentage levels will be achieved. In general, gross margins will remain under downward pressure due to increased competition as well as a potential shift in our sales mix to lower margin business. For example, if we increase sales of our products into markets which traditionally have lower margin rates than our current business, such as the automotive market, we may be forced to reduce our margins to remain competitive. Further, we are beginning to experience significant downward pricing pressure in the Chinese hybrid transit vehicle market, which has historically represented a significant portion of our sales, as a result of changes in the government subsidy program and other market factors. If our cost reduction efforts do not keep pace with these price pressures, or if we continue to pursue certain vertical markets and reduce our margins to maintain or increase sales, then we could experience degradation in our overall profit margins. In addition, gross margins could be negatively impacted by an increase in raw materials, components and labor costs, or by changes to our product mix.
16
Unfavorable results of legal proceedings could materially adversely affect us.
We are subject to various legal proceedings and claims that have arisen out of the ordinary conduct of our business and are not yet resolved, and additional claims may arise in the future. Results of legal proceedings cannot be predicted with certainty. Regardless of merit, litigation may be both time-consuming and disruptive to our operations and could cause significant expense and diversion of management attention. From time to time, we are involved in major lawsuits concerning intellectual property, torts, contracts, shareholder litigation, administrative and regulatory proceedings and other matters, as well as governmental inquiries and investigations, the outcomes of which may be significant to our results of operations and may limit our ability to engage in our business activities. In recognition of these considerations, we may enter into material settlements to avoid ongoing costs and efforts in defending or pursuing a matter. Should we fail to prevail in certain matters, or should several of these matters be resolved against us in the same reporting period, we may be faced with significant monetary damages or injunctive relief against us that could adversely affect our business, financial condition and operating results. While we have insurance related to our business operations, it may not apply to or fully cover any liabilities we incur as a result of these lawsuits. We record reserves for potential liabilities where we believe the liability to be probable and reasonably estimable. However, our actual costs may be materially different from these estimates.
For example, as articulated in Item 3 - Legal Proceedings, we have several pending legal matters in the form of both government and regulatory investigations. Notably, we received subpoenas from the SEC in June 2015 and again in June 2016 relating to an investigation into the underlying causes prompting the restatement of our 2011 and 2012 financial statements in 2013. The subpoenas requested a range of documents, including documents relating to our revenue recognition practices and associated transactions and business relationships. We are unable at this time to predict the outcome of the investigation. It is possible that the investigation could lead to claims or findings of violations of securities laws. We expect to incur substantial legal and administrative costs in connection with the investigation, and could incur other costs, damages or penalties, depending on the outcome. Additionally, we have certain indemnification obligations to some current and former employees who may request the advancement of legal fees related to this investigation. Further, the Swiss federal prosecutor is investigating the Company for actions, which we believe are related to the U.S. Foreign Corrupt Practices Act (“FCPA”) investigation previously settled with the SEC and Department of Justice (“DOJ”), and we are currently unable to determine the extent to which we may be subject to fines in accordance with Swiss bribery laws and what additional expenses will be incurred in order to defend this matter. We are unable at this time to estimate the amount of the possible loss or range of loss that we may incur as a result of these investigations. Further, these lawsuits, including, notably the investigation by the SEC, could be both time-consuming and disruptive to our business and our reputation could be harmed as a result of the allegations asserted in public statements and court documents throughout the course of the action. Consequently, our financial condition or operating results could be materially adversely affected.
Activist stockholders may attempt to effect changes to our company, which could adversely affect our corporate governance, results of operations and financial condition.
Campaigns by stockholders to effect changes at publicly traded companies are sometimes led by investors through various corporate actions, including Board nominations and proxy contests. We may become subject to one or more campaigns by stockholders who desire to increase stockholder value in the short term. If we become engaged in a proxy contest with an activist stockholder in the future, our business and operations could be adversely affected as responding to such contests or other activist stockholder actions would be costly and time-consuming, and we would expect that such actions would disrupt our operations and divert the attention of management and our employees from executing our strategic plans and product launch. In addition, if individuals are elected to our Board with a specific agenda or without relevant experience or expertise, it may adversely affect the ability of the Board to function effectively, as well as our ability to effectively and timely implement our strategic plans, which are focused on building shareholder value. Any perceived uncertainties as to our future direction as a result of stockholder activism or changes to the composition of our Board may lead to the perception of a change in the direction of our business and instability or lack of continuity with respect to our products which may cause concerns for our customers or be exploited by our competitors. As a result, we could experience significant volatility and a decline of our stock price, the loss of potential business opportunities and difficulties in attracting and retaining qualified personnel and customers. For example, we entered into a settlement agreement with an activist stockholder pursuant to which, among other things, we agreed to include certain proxy proposals on the ballot for our 2016 annual meeting of stockholders. There can be no assurance that we will not be subject to additional campaigns by the same or other stockholders now or in the future.
17
Our business is subject to risks related to its international operations including the risk that we will be unable to adequately comply with the changing rules and regulations in countries where our business is conducted.
We derive a significant portion of our revenue and earnings from international operations. Such operations outside the U.S. are subject to special risks and restrictions, including: fluctuations in currency values and foreign currency exchange rates, import and export requirements and trade policy, anti-corruption laws, tax laws (including U.S. taxes on foreign subsidiaries), foreign exchange controls and cash repatriation restrictions, data privacy requirements, labor laws, anti-competition regulations, and other potentially detrimental domestic and foreign governmental practices or policies affecting U.S. companies doing business abroad. Compliance with these U.S. and foreign laws and regulations increases the costs of doing business in foreign jurisdictions and these costs may continue to increase in the future as a result of changes in such laws and regulations or in their interpretation. Furthermore, we have implemented policies and procedures designed to ensure compliance with these laws and regulations, but there can be no assurance that our employees, contractors, or agents will not violate such laws and regulations or our policies. Any violations of rules and regulations could individually or in the aggregate materially adversely affect our financial condition or operating results. Some of our business partners also have international operations and are subject to the risks described above. Even if we are able to successfully manage the risks of international operations, our business may be adversely affected if our business partners are not able to successfully manage these risks.
Our success could be negatively impacted if we fail to control, oversee and direct foreign subsidiaries and their operations.
We currently own foreign subsidiaries located within Europe and Asia, including those involved in the recently announced target acquisition, where the employees and cultures represent certain vast differences from employees and cultures within the United States where our corporate headquarters is situated. While the cultural values and philosophies of the people located in Europe and portions of Asia are generally viewed to be in alignment with that of U.S. persons, there are still some significant differences. For example, the respective European data privacy laws take a harsher position regarding the protection of employee personal data and, consequently, there is less information shared with the U.S. parent corporation regarding employees working for our European subsidiaries. Additionally, the human resources and the systems our foreign entities use can be vastly different; notably, our Swiss, German, Korean, and Chinese subsidiaries utilize a primary language other than English for communications. Having substantial international operations also increases the complexity of managing our financial reporting and internal controls and procedures. If we are unable to manage these risks effectively, it could negatively impact our operating performance and our reputation.
Our exposure to fluctuations in foreign currency exchange rates arising from international operations could harm our financial condition and operating results.
As a result of our extensive international operations and significant revenue generated outside the U.S., the dollar amount of our current and future revenue, expenses and debt may be materially affected by fluctuations in foreign currency exchange rates. Our primary exposure to movements in foreign currency exchange rates relates to non-U.S. dollar denominated sales in Europe as well as non-U.S. dollar denominated operating expenses incurred throughout the world. Weakening of foreign currencies relative to the U.S. dollar will adversely affect the U.S. dollar value of our foreign currency-denominated sales and earnings, and generally could lead us to raise international pricing, potentially reducing demand for our products. In some circumstances, due to competition or other reasons, we may decide not to raise local prices to the full extent to offset unfavorable exchange rate fluctuations, or at all, which would adversely affect the U.S. dollar value of our foreign currency denominated sales and earnings. Conversely, a strengthening of foreign currencies, while generally beneficial to our foreign currency-denominated sales and earnings, could cause us to realize a reduction in our overall gross margin as the U.S. dollar value of our foreign currency-denominated expenses increases. As a result of the recent inflation in the value of the Swiss Franc against many other currencies, the prices for our high-voltage products, which are denominated primarily in Swiss Francs, became less affordable to customers that trade in these other currencies. This may result in a decrease in sales of our high-voltage products, or we could be required to reduce our prices, and thereby our profit margins, to maintain our market share.
Our business activities are subject to the FCPA and other anti-bribery laws. If we fail to comply with anti-bribery laws and regulations, we could be subject to civil and/or criminal penalties as well as further expenses related to an additional internal investigation.
Due to our status as a U.S. issuer, we are subject to the FCPA, which prohibits companies from making, promising or offering improper payments or other things of value to foreign officials for the purpose of obtaining or retaining business or a business advantage. In January 2011, we reached settlements with the SEC and DOJ with respect to charges asserted regarding certain payments made to an independent third-party sales agent in China for our high-voltage capacitor products produced by our Swiss subsidiary, Maxwell SA. As a result, we were required to pay monetary fines totaling $14.4 million, and to implement additional remedial measures to strengthen our compliance program concerning anti-bribery.
18
Due to our operations in Switzerland, we are subject to Swiss anti-bribery regulations. In August 2013, our Swiss subsidiary was served with a search warrant from the Swiss federal prosecutor’s office. Based upon our exposure to the case, we believe this action to be related to the same or similar facts and circumstances as the FCPA action previously settled with the SEC and the DOJ. Our failure to achieve a favorable result in these proceedings could have a material adverse impact on our financial condition and results of operations.
We depend upon component and product manufacturing and logistical services provided by third parties, many of whom are located outside of the U.S.
Substantially all of our components and products are manufactured in whole or in part by a few third-party manufacturers. Many of these manufacturers are located outside of the U.S. and are all located within a relatively small geographic location. If a catastrophic event occurs within this area, or the social or economic conditions shift within this geography, we could experience business interruptions, delayed delivery of products, or other adverse impacts to our ongoing business. We have also outsourced much of our transportation and logistics management. While these arrangements may lower operating costs, they also reduce our direct control over production and distribution. Such diminished control could have an adverse effect on the quality or quantity of our products as well as our flexibility to respond to changing conditions. In addition, we rely on third-party manufacturers to adhere to the terms and conditions of the agreements in place with each party. For example, although arrangements with such manufacturers may contain provisions for warranty expense reimbursement, we may remain responsible to the customer for warranty service in the event of product defects. Any unanticipated product defect or warranty liability, whether pursuant to arrangements with contract manufacturers or otherwise, could adversely affect our reputation, financial condition and operating results.
To remain competitive and stimulate customer demand, we must introduce and commercialize new products successfully as well as adequately educate our prospective customers on the products we offer.
Our ability to compete successfully depends heavily on our ability to ensure a continuing and timely introduction of innovative new products and technologies to the marketplace. We believe that we are unique in that we are a technology leader for the technologies we deliver and typically must first educate the customer regarding the implementation of our solution in their systems before the customer is capable of designing in our products. As a result, we must make significant investments in research and development efforts as well as sales and marketing efforts, including applications engineering resources. By contrast, many of our competitors, including some which are well capitalized with significant financial resources at their disposal, seek to compete primarily through aggressive pricing and very low cost structures. If we are unable to continue to develop and sell innovative new products or if we are unable to effectively educate the prospective customer on the value proposition offered by the implementation of our products, then our ability to maintain a competitive advantage could be negatively affected and our financial condition and operating results could be adversely affected.
Competition in the energy storage domain has significantly affected, and will continue to affect, our sales.
Many companies are engaged in or are starting to engage in designing, developing and producing energy storage solutions as a consequence of the movement towards clean energy solutions in both the commercial and public sectors. Consequently, more companies are pursuing opportunities in the energy storage domain and are beginning to compete in the markets in which we do business. The success of these new competitors could render our products less competitive, resulting in reduced sales compared with our expectations or past results. Certain companies which recently initiated efforts to enter the markets in which we do business, including, notably, in China, possess greater access to capital resources or utilize different product development strategies which vary in both time to market and innovation methodologies. Consequently, these companies could develop products that are superior to ours, more competitively priced than ours or faster to market than ours. Additionally, significant amounts of U.S. government funds are being invested in the development of batteries with better performance characteristics or lower manufacturing costs than battery technologies currently on the market and, consequently, these new, advanced batteries that include power delivery functionality could compete for market share with our ultracapacitor products. Moreover, as the market leader for certain markets for energy storage, competitors often follow our lead in the advancement of technologies for energy storage or customers attempt to facilitate second sources of comparable products, thereby requiring us to innovate rapidly in order to continue to serve as the market leader. The success of the products offered by our competitors could reduce our market share, thereby negatively impacting our financial results.
19
The successful management of new market applications and new product and technology introductions will be necessary for our growth.
Given our position as the technology leader for certain products, solutions and technologies we offer, we have a considerable number of new product and technology concepts in the pipeline. A critical component of our growth strategy is dependent upon our ability to effectively and accurately determine which new products, applications or technologies to pursue. Pursuing product or technology applications targeted at a specific customer base should enable our products to cross over from a more narrow range of acceptance by early technology adopters to acceptance by a majority of customers in the application space. Commercial success frequently depends on being the first provider to identify the applicable market opportunities. Consequently, if we are not able to fund our research and development activities appropriately and deliver new products or technologies which address the needs of the markets we serve on a timely basis, our growth prospects will be harmed. Additionally, we must balance the benefits of gaining market acceptance in new or existing markets with the goal of optimizing growth and profitability. That is, it is critical to ensure that the products, technologies and markets we select for development are aimed at large volume or high profile applications which can provide a significant return on our investment. If we fail to identify and pursue the appropriate markets for our products and technologies, our growth potential and operating results could be adversely affected.
Our success depends largely on the acquisition of, as well as the continued availability and service of, key personnel.
Much of our future success depends on the continued availability and service of key personnel, including our senior executive management team as well as highly-skilled employees in technical, marketing and staff positions. Due to the complexity and immaturity of the technologies involved in the products we produce and the markets we serve, we may be unable to find the right personnel with the background needed to serve our goals and objectives. As a market leader for the technologies we develop, there are limited opportunities to hire personnel from competitors or other technology companies with substantial background and experience in our technology fields. Consequently, we seek to hire individuals who are capable of performing well in an environment with limited resources and references to past experiences. We may struggle to find such talented personnel who also thrive in a high growth business atmosphere and who are capable of keeping pace with the rapidly changing environment encouraged by the technologies we create and the markets we serve. These uniquely talented personnel are in high demand in the technology industry and competition for acquiring such individuals is intense. Some of our scientists and engineers are the key developers of our products and technologies and are recognized as leaders in their area of expertise. Without attracting and retaining personnel with the appropriate skill sets, we could fail to maintain our technological and competitive advantage.
Our success as a reliable supplier to our customers is highly dependent upon our ability to effectively manage our reliance upon certain suppliers of key component parts, finished goods and specialty equipment.
Because we currently obtain certain key components including, but not limited to binder, separator, paper, aluminum piece parts, die, printed circuit boards and certain finished goods, including, notably, ultracapacitor finished goods, from single or limited sources, we are subject to significant supply and pricing risks. If the particular supplier is unable to provide the appropriate quantity and/or quality of the raw material or the finished goods at the prices required, then we will be unable to produce and deliver our goods to customers, thereby losing out on revenue generation and, potentially, incurring penalties for failing to timely perform. For example, a substantial portion of our revenue is generated from finished goods supplied to us from a single contract manufacturer. If this contract manufacturer is unable to supply the finished goods to us to meet our customer demand, then we could be forced to decline acceptance of customer orders, which could lead to, among other things, a reputation that we are an unreliable supplier and a decline in future demand for our products. Additionally, if we are not aware of potential constraints upon our contract manufacturer for these finished goods before we enter into binding supply commitments with our own customers, then we could be required to pay damages to the customers. While we have established mitigation strategies to attempt to minimize the likelihood and impact of an inability to supply finished goods due to supplier constraints, we cannot be certain that such mitigation strategies will eliminate an adverse effect to our financial condition.
Additionally, we use some custom components that are not common to the rest of the industries served by our suppliers and which are often available from only one source. Also, when a component or product uses new technologies, initial capacity constraints may exist until the particular supplier’s yield has matured or manufacturing capacity has increased. Continued availability of these components at acceptable prices, or at all, may be affected if those suppliers decide to concentrate on the production of common components instead of components customized to meet our unique requirements. If the supply of a key single-sourced component for a new or existing product were delayed or constrained, if such components were available only at significantly higher prices, or if a key manufacturing vendor delayed shipments of completed products to us, then our financial condition and operating results could be adversely affected.
20
Conversely, diversifying our supplier base to ensure that we have multiple suppliers for each key raw material typically involves additional costs including, but not limited to: higher prices for the raw materials as a direct consequence of purchasing lower volumes from each supplier; additional costs associated with qualifying additional suppliers; and increased resource expense in managing an additional supplier for factors including quality, timely delivery and other standards. If we fail to balance the interests between the reliance upon a single supplier and expense associated with diversifying the supply chain base, then our actual gross profit could fail to meet our targets.
Our products and services may experience quality or implementation problems from time to time that could result in decreased sales and operating margin, and could tarnish our reputation.
In the case of our ultracapacitor products, we sell relatively new technology, including advancements to our current technology, which could contain defects in design or manufacture, or could be implemented incorrectly in the end use application. As a direct consequence of the introduction of new features for our technology as well as new implementations by our customer base, we are still learning about the potential quality issues that could arise during operation in certain applications. Consequently, we are not always capable of anticipating the quality or implementation problems which the products may experience in the field. Products sold into high performance environments such as heavy transportation, automotive markets or grid infrastructure installations could experience additional operating characteristics that could unexpectedly interfere with the intended operation of our products. For example, if the end use application is in an environment which subjects the products to levels of vibration above our internal design and qualification levels, then the products could fail to achieve the customer’s performance requirements. With this sometimes limited understanding of the application and operation of our products in varying end user implementations, our customers may perceive our products as exhibiting quality problems, which could harm our reputation. We strive to respond quickly in addressing the concerns of our customers by modifying our products and assisting our customers in designing new implementation or installation strategies to achieve higher performance characteristics or to satisfy new or modified applications of our products. As such, the release time of next generation products or application solutions can be relatively quick and we may assume additional risks associated with expediting the release of new or modified products.
We are also building our infrastructure to adequately and efficiently handle any potential recall and the reverse logistics involved in returning our products to our facilities in the event that any defects are found. There can be no assurance that we will be able to detect and fix all defects in the products we sell or will be able to efficiently handle all issues related to product returns or implementation concerns. As we continue to pursue additional vertical markets, we are gaining a better understanding of certain business practices of these markets with respect to potential product recalls. For example, certain portions of the transportation industry are sensitive to product recall issues as they relate to both government regulations as well as customer satisfaction and safety. Failure to successfully prevent a defect in our products which prompts a recall or a failure to successfully manage expenses associated with any recalls could cause lost revenue, harm to our reputation, and significant warranty and other expenses, and result in an adverse impact on our financial condition and operating results.
Efforts to protect our intellectual property rights and to defend claims against us could increase our costs and will not always succeed; any failures could adversely affect sales and profitability and restrict our ability to do business.
Intellectual property (“IP”) rights are crucial to maintaining our competitive advantage and growing our business. We endeavor to obtain and protect our intellectual property rights which we feel will allow us to retain or advance our competitive advantage in the marketplace. However, there can be no assurance that we will be able to adequately identify and protect the portions of IP which are strategic to our business. Generally, when strategic IP rights are identified, we will seek formal protection in jurisdictions in which our products are produced or used, jurisdictions in which competitors are producing or importing their products, and jurisdictions into which our products are imported. Different nations may provide limited rights and inconsistent duration of protection for our products. Additionally, we may be unable to obtain protection for or defend our IP in key jurisdictions. For example, the patent prosecution and enforcement system within China is less mature than the systems in other jurisdictions and therefore we may be more limited in our ability to enforce our rights. This disadvantage would likely be compounded by the challenge of any enforcement attempts by us as a foreign entity seeking protection against a Chinese company infringing on our IP in China.
21
Even if protection is obtained, competitors or others in the chain of commerce may raise legal challenges to our rights or illegally infringe our rights, including through means that may be difficult to prevent or detect. For example, a certain portion of our IP portfolio is related to unique process steps performed during the manufacture of our products which are not readily recognizable in the physical embodiment of the final product. It may be difficult to identify and prove that a competitor is infringing on our rights to such process steps. Further, we are required to divulge certain of our IP to our business partners to enable them to provide quality products or raw materials to us or enable the exploitation and success of strategic partnerships. To the extent that such disclosure occurs in China or other jurisdictions in which the ability to protect IP is more limited, existing or new competitors in this region could begin to use our IP in the development of their own products, which could reduce our competitive edge. Even in jurisdictions in which IP is highly valued, and therefore protected, the financial burden of asserting or defending our IP rights could prove to be cost prohibitive for us thereby putting us in a position in which we must sacrifice our competitive edge.
In addition, because of the rapid pace of technology advancements, and the confidentiality of patent applications in some jurisdictions, competitors may be issued patents stemming from pending patent applications that were unknown to us prior to issuance of the patents. This could reduce the value of our commercial or pipeline products or, to the extent they cover key technologies on which we have unknowingly relied, require that we seek to obtain a license or cease using the technology, no matter how valuable to our business. We may not be able to obtain such a license on acceptable terms. The extent to which we succeed or fail in our efforts to protect our intellectual property will affect our financial condition and results of operations.
Our inability to effectively identify, enter into, manage and benefit from strategic alliances, may limit our ability to pursue certain growth objectives and/or strategies.
Our reputation is important to our growth and success. As a leader in an emerging technology industry, we recognize the value in identifying, selecting and managing key strategic alliances. We are mainly focusing our business on the specific products we deliver and pursuit of strategic alliances with other companies could allow us to provide customers with integrated or other new products, services, or technology advancements derived from the alliances. To be successful, we must first be able to define and identify opportunities which align with our growth plan. Additionally, we cannot be certain that our alliance partners will provide us with the support we anticipate, that such alliance or other relationships will be successful in advancing technology, or that any alliances or other relationships will be successful in manufacturing and marketing new or improved products. Our success is also highly dependent upon our ability to manage the respective parameters of all strategic alliances, promote the benefits to us, and to not prohibit or discourage other opportunities which may be beneficial to us in the future. Also, certain provisions of alliance agreements may include restrictions that limit our ability to independently pursue or exploit the developments under such strategic alliances. Currently, we have alliances with several partners both in the U.S. and throughout the world. We anticipate that future alliances may also be with foreign partners or entities. As a result, such alliances may be subject to the political climate and economies of the foreign countries where such partners reside and operate. If the strategic alliances we pursue are not successful, our business and prospects could be negatively affected.
Should a catastrophic event or other significant business interruption occur at any of our facilities, we could face significant reconstruction or remediation costs, penalties, third-party liability and loss of production capacity, which could adversely affect our business.
Weather conditions, natural disasters or other catastrophic events could cause significant disruptions in operations, including, specifically, disruptions at our manufacturing facilities or those of our major suppliers or customers. In turn, the quality, cost and volumes of the products we produce and sell could be unexpectedly, negatively affected, which will impact our sales and profitability. Natural disasters or industrial accidents could also damage our manufacturing facilities or infrastructure, or those of our major suppliers or major customers, which could affect our costs, production volumes and demand for our products. However, we have implemented certain mitigation strategies to ensure that certain components and processes involved in the manufacture of our component materials and finished goods are somehow temporarily available so as to reduce the impact of such a catastrophic event.
22
War, terrorism, geopolitical uncertainties, public health issues, and other business interruptions have caused and could cause damage or disruption to international commerce and the global economy, and thus could have a strong negative effect on us, our suppliers, logistics providers, manufacturing partners and customers. Our business operations could be subject to interruption by power shortages, terrorist attacks and other hostile acts, labor disputes, public health issues, and other events beyond our control. Such events could decrease demand for our products, make it difficult or impossible for us to produce and deliver products to our customers, or to receive components from our suppliers, thereby creating delays and inefficiencies in our supply chain. Should major public health issues, including pandemics, arise, we could be negatively affected by more stringent employee travel restrictions, additional limitations in freight services, governmental actions limiting the movement of products between regions, and disruptions in the operations of our manufacturing partners and component suppliers. The majority of our research and development activities, our corporate headquarters, information technology systems, and other critical business operations, including certain component suppliers and manufacturing partners, are in locations that could be affected by natural disasters. In the event of a natural disaster, losses could be incurred and significant recovery time could be required to resume operations and our financial condition and operating results could be materially adversely affected. While we may purchase insurance policies to cover the direct economic impact experienced following a natural disaster occurring at one of our own facilities, there can be no assurance that such insurance policies will cover the full extent of our financial loss nor will they cover losses which are not economic in nature such as, for example, our business and reputation as a reliable supplier.
We may be subject to information technology systems failures, network disruptions and breaches in data security.
Information technology system failures, network disruptions and breaches of data security could disrupt our operations by impeding the manufacture or shipment of products, the processing of transactions or reporting of financial results, or by causing an unintentional disclosure of confidential information. In the ordinary course of our business, we collect and store sensitive data in our data centers and on our networks, including intellectual property, proprietary business information, and personal information of our business partners and employees. Despite our security measures, our information technology and infrastructure may be vulnerable to attacks by hackers or breached due to employee error, malfeasance or other disruptions. Any such breach could compromise our networks and the information stored there could be accessed, publicly disclosed, lost or stolen. While management has taken steps to address these concerns by implementing certain data and system redundancy, hardening and fail-over along with other network security and internal control measures, there can be no assurance that the measures we have implemented to date would be sufficient in the event of a system failure, loss of data or security breach. As a result, in the event of such a failure, loss of data or security breach, our financial condition and operating results could be adversely affected.
Security breaches and other disruptions could compromise our information and expose us to liability, which would cause our business and reputation to suffer.
In the ordinary course of our business, we collect and store sensitive data, including intellectual property, our proprietary business information and that of our customers, suppliers and business partners, and personally identifiable information of our customers and employees, in our data centers and on our networks. The secure processing, maintenance and transmission of this information is critical to our operations and business strategy. Despite our security measures, our information technology and infrastructure may be vulnerable to attacks by hackers or breached due to employee error, malfeasance or other disruptions. Any such breach could compromise our networks and the information stored there could be accessed, publicly disclosed, lost or stolen. Any such access, disclosure or other loss of information could result in legal claims or proceedings, liability under laws that protect the privacy of personal information, regulatory penalties, disruption of our operations and the services we provide to customers, and damage to our reputation, which could adversely affect our financial results and competitive position.
Our ability to match our production plans for our ultracapacitor products to the level of product actually demanded by customers has a significant effect on our sales, costs and growth potential.
Customers’ decisions are affected by market, economic and government regulation conditions which can be difficult to accurately gauge in advance. In addition, many of the markets for our ultracapacitor products are within emerging industries as well as within project-oriented business models and, as such, it can be difficult to predict our future customer demand. Failure to provide customers and channel partners with demanded quantities of our products could reduce our sales. Conversely, increased capacity which exceeds actual customer demands for our products increases our costs and, consequently, reduces our profit margins on the products delivered. Although we have implemented policies and procedures for refining our forecasting methods, including a more sophisticated mechanism for gauging the sales pipeline to better project timing of new customer demand, there can be no assurance that these policies and procedures will provide accurate intelligence to align our production plans with customer demands. As a result of all of these factors, we could fail to meet revenue or profit margin targets.
23
Our reputation could be damaged as a result of negative publicity due to the restatement of prior periods financial statements contained within our Annual Report on Form 10-K for the fiscal year ended December 31, 2012, and the underlying business causes of such restatement.
We depend upon our reputation to compete for customers, suppliers, investors, strategic partners and personnel. Unfavorable publicity can damage our reputation and negatively impact our economic performance. Our restatement of our prior periods financial statements contained within our Annual Report on Form 10-K for the fiscal year ended December 31, 2012, and the underlying business causes of such restatement, could damage our reputation. For example, in June 2015 and June 2016, we received subpoenas from the SEC requesting certain documents related to, among other things, the facts and circumstances surrounding the restated financial statements. We have provided the required information to the SEC in response to these subpoenas and continue to cooperate with the SEC through the course of their ongoing investigation. At this stage, we cannot predict the ultimate outcome of this investigation and, consequently, there can be no assurance that unfavorable publicity arising from the forgoing will not have a material adverse effect on our business.
Our ability to use our net operating losses is dependent upon the generation of future taxable income, and the absence of significant ownership changes to our common stock.
As of December 31, 2016, we had U.S. federal tax and state tax net operating loss carryforwards of approximately $186.8 million and $48.4 million, respectively. Realization of any benefit from our tax net operating losses is dependent on both our ability to generate future taxable income before our net operating loss carryforwards expire, as well as the absence of certain “ownership changes” to our common stock. An “ownership change,” as defined in the applicable federal income tax rules, would place significant limitations, on an annual basis, on the use of such net operating losses to offset any future taxable income we may generate. The issuance of shares of our common stock, including the issuance of shares of common stock upon future conversion or exercise of outstanding stock options, could cause such an “ownership change.” Such limitations triggered by an “ownership change,” in conjunction with the net operating loss expiration provisions, could effectively eliminate our ability to use a substantial portion of our net operating loss carryforwards to offset any future taxable income.
Our stock price continues to be volatile.
Our stock has at times experienced substantial price volatility due to a number of factors, including but not limited to the various factors set forth in this “Risk Factors” section, as well as variations between our actual and anticipated financial results, announcements by us or our competitors, and uncertainty about future global economic conditions. The stock market as a whole also has experienced extreme price and volume fluctuations that have affected the market price of many technology companies in ways that may have been unrelated to these companies’ operating performance. Furthermore, we believe our stock price may reflect certain future growth and profitability expectations. If we fail to meet these expectations, our stock price may significantly decline which could have an adverse impact on investor confidence and employee retention.
Anti-takeover provisions in our certificate of incorporation and bylaws could prevent certain transactions and could make a takeover more difficult.
Some provisions in our certificate of incorporation and bylaws could make it more difficult for a third-party to acquire control of us, even if such change in control would be beneficial to our stockholders. We have a classified board of directors, which means that our directors are divided into three classes that are elected to three-year terms on a staggered basis. Since the three-year terms of each class overlap the terms of the other classes of directors, the entire board of directors cannot be replaced in any one year. Furthermore, our certificate of incorporation contains a “fair price provision” which may require a potential acquirer to obtain the consent of our board to any business combination involving us. Our certificate of incorporation and bylaws also contain provisions barring stockholder action by written consent unless first approved by a majority of the disinterested directors, and the calling by stockholders of a special meeting. Amendment of such provisions requires a super majority vote by the stockholders, except with the consent of the board of directors and a majority of the disinterested directors in certain circumstances. The provisions of our certificate of incorporation and bylaws could delay, deter or prevent a merger, tender offer, or other business combination or change in control involving us that stockholders might consider to be in their best interests. This includes offers or attempted takeovers that could result in our stockholders receiving a premium over the market price for their shares of our common stock.
Item 1B. | Unresolved Staff Comments |
None.
24
Item 2. | Properties |
Our primary operations are located in San Diego, California; Peoria, Arizona; and Rossens, Switzerland. We occupy a 36,400 square foot facility in San Diego, California for our principal research and development operations under a lease that expires in December 2018. We also occupy a 30,500 square foot corporate office located in San Diego, California under a lease that expires in December 2022 and we have one five-year renewal option thereafter. Our Peoria, Arizona manufacturing facility occupies 123,000 square feet under a lease that expires in June 2027 and we have one five-year renewal option thereafter. We also lease a research, manufacturing and marketing facility in Rossens, Switzerland occupying 60,800 square feet under a lease that expires in December 2019 and we have two five-year renewal options thereafter.
We have a 6,000 square foot sales office in Shanghai, China under a lease expiring in September 2019, and we have a two-year renewal option thereafter. We also have small sales offices in Munich, Germany and Seoul, South Korea.
We believe that we have sufficient space to support forecasted production volume and that our facilities are adequate to meet our needs for the foreseeable future. However, in 2017, we plan to expand capacity at our high-voltage capacitor facility in Rossens, Switzerland in order to improve production efficiency and support potential growth opportunities. For additional information regarding our expected capital expenditures in fiscal 2017, see Item 7, Management’s Discussion and Analysis of Financial Condition and Results of Operations-Liquidity and Capital Resources.
Over the past several years, we have made substantial capital investments to outfit and expand our internal production facilities and incorporate mechanization and automation techniques and processes. Additionally, we have trained our manufacturing personnel in the necessary operational techniques. We have completed certain upgrades and expansions in recent years and, even in the context of manufacturing consolidation efforts, we have capacity flexibility and are able to accommodate other upgrades. Including consideration of our contract manufacturing relationships with Belton Technology Group and Tianjin Lishen Battery Joint-Stock Co. Ltd. in China, we believe that we have sufficient capacity to meet near-term demand for all of our product lines. In 2017, we plan to expand capacity at our high-voltage capacitor facility in Rossens, Switzerland in order to better meet potential longer-term demand.
25
Item 3. | Legal Proceedings |
FCPA Matter
In January 2011, the Company reached settlements with the U.S. Securities and Exchange Commission (“SEC”) and the U.S. Department of Justice (“DOJ”) with respect to charges asserted by the SEC and DOJ relating to the anti-bribery, books and records, internal controls, and disclosure provisions of the U.S. Foreign Corrupt Practices Act (“FCPA”) and other securities laws violations. The Company paid the monetary penalties under these settlements in installments such that all monetary penalties were paid in full by January 2013. With respect to the DOJ charges, a judgment of dismissal was issued in the U.S. District Court for the Southern District of California on March 28, 2014.
On October 15, 2013, the Company received an informal notice from the DOJ that an indictment against the former Senior Vice President and General Manager of its Swiss subsidiary had been filed in the United States District Court for the Southern District of California. The indictment is against the individual, a former officer, and not against the Company and the Company does not foresee that further penalties or fines could be assessed against it as a corporate entity for this matter. However, the Company may be required throughout the term of the action to advance the legal fees and costs incurred by the individual defendant and to incur other financial obligations. While the Company maintains directors’ and officers’ insurance policies which are intended to cover legal expenses related to its indemnification obligations in situations such as these, the Company cannot determine if and to what extent the insurance policy will cover the ongoing legal fees for this matter. Accordingly, the legal fees that may be incurred by the Company in defending this former officer could have a material impact on its financial condition and results of operation.
Swiss Bribery Matter
In August 2013, the Company’s Swiss subsidiary was served with a search warrant from the Swiss federal prosecutor’s office. At the end of the search, the Swiss federal prosecutor presented the Company with a listing of the materials gathered by the representatives and then removed the materials from its premises for keeping at the prosecutor’s office. Based upon the Company’s exposure to the case, the Company believes this action to be related to the same or similar facts and circumstances as the FCPA action previously settled with the SEC and the DOJ. During initial discussions, the Swiss prosecutor has acknowledged both the existence of the Company’s deferred prosecution agreement with the DOJ and its cooperation efforts thereunder, both of which should have a positive impact on discussions going forward. Additionally, other than the activities previously reviewed in conjunction with the SEC and DOJ matters under the FCPA, the Company has no reason to believe that additional facts or circumstances are under review by the Swiss authorities. To date, the Swiss prosecutor has not issued its formal decision as to whether charges will be brought against individuals or the Company or whether the proceeding will be abandoned. At this stage in the investigation, the Company is currently unable to determine the extent to which it will be subject to fines in accordance with Swiss bribery laws and what additional expenses will be incurred in order to defend this matter. As such, the Company cannot determine whether there is a reasonable possibility that a loss will be incurred nor can it estimate the range of any such potential loss. Accordingly, the Company has not accrued an amount for any potential loss associated with this action, but an adverse result could have a material adverse impact on its financial condition and results of operation.
Government Investigations
In early 2013, the Company voluntarily provided information to the SEC and the United States Attorney’s Office for the Southern District of California related to its announcement that it intended to file restated financial statements for fiscal years 2011 and 2012. On June 11, 2015 and June 16, 2016, the Company received subpoenas from the SEC requesting certain documents related to, among other things, the facts and circumstances surrounding the restated financial statements. The Company has provided documents and information to the SEC in response to the subpoenas and continues to cooperate with the SEC. On September 6, 2016, the Company entered into a tolling agreement effective for the period beginning on September 12, 2016, and running through June 30, 2017, with the SEC related to these matters. At this stage, the Company cannot predict the ultimate outcome of this investigation or whether it will result in any loss. Accordingly, the Company has not accrued an amount for any potential loss associated with this action, but an adverse result could have a material adverse impact on its financial condition and results of operation.
Item 4. | Mine Safety Disclosures. |
Not applicable.
26
PART II
Item 5. | Market for the Registrant’s Common Equity, Related Stockholder Matters and Issuer Purchases of Equity Securities |
Our common stock has been quoted on the NASDAQ Global Market under the symbol “MXWL” since 1983. The following table sets forth the high and low sale prices per share of our common stock as reported on the NASDAQ Global Market for the periods indicated.
High | Low | |||||||
Year Ended December 31, 2016 | ||||||||
First Quarter | $ | 7.39 | $ | 4.81 | ||||
Second Quarter | 6.72 | 4.75 | ||||||
Third Quarter | 5.67 | 4.20 | ||||||
Fourth Quarter | 5.63 | 4.39 | ||||||
Year Ended December 31, 2015 | ||||||||
First Quarter | $ | 9.30 | $ | 6.29 | ||||
Second Quarter | 8.29 | 4.85 | ||||||
Third Quarter | 6.18 | 4.06 | ||||||
Fourth Quarter | 8.04 | 5.33 | ||||||
As of February 22, 2017, there were 275 registered holders of our common stock, and 171 registered holders of restricted common stock that was granted under our equity compensation plans. Because many of our shares of common stock are held by brokers or other institutions on behalf of stockholders, we are unable to estimate the total number of stockholders represented by the record holders.
Dividend Policy
We have never declared or paid cash dividends on our capital stock. We currently anticipate that any earnings will be retained for the development and expansion of our business and, therefore, we do not anticipate paying cash dividends on our capital stock in the foreseeable future.
Recent Sales of Unregistered Securities
None.
Equity Compensation Plans
The information required by this item is incorporated by reference to Part III, Item 12, Security Ownership of Certain Beneficial Owners and Management and Related Stockholders Matters, included in this Annual Report on Form 10-K.
Issuer Purchases of Equity Securities
None.
27
Stock Performance Graph
The following graph shows a five-year comparison of cumulative total return (equal to dividends plus stock appreciation) for our Common Stock, the NASDAQ Composite Index and the Russell 2000. Total stockholder returns for prior periods are not an indication of future investment returns. We chose the Russell 2000 index because it is comprised of issuers with similar market capitalizations. We do not believe that we can reasonably identify a comparable peer group of issuers or an industry or line-of-business index appropriate for comparison.
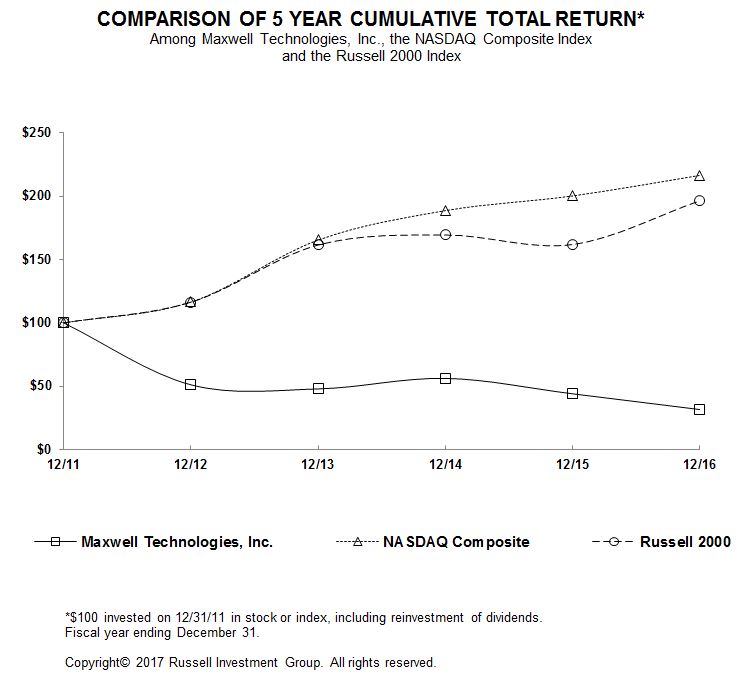
28
Item 6. | Selected Financial Data |
The selected consolidated financial data presented below is for each fiscal year in the five-year period ended December 31, 2016. The financial data for the years ended December 31, 2016, 2015, and 2014 is derived from, and is qualified by reference to, the audited consolidated financial statements that are included in this Annual Report on Form 10-K. The financial data for the years ended December 31, 2013 and 2012 is derived from audited, consolidated financial statements which are not included in this Annual Report on Form 10-K.
Years Ended December 31, | ||||||||||||||||||||
2016 | 2015 | 2014 | 2013 | 2012 | ||||||||||||||||
(In thousands, except per share data) | ||||||||||||||||||||
Consolidated Statement of Operations Data: | ||||||||||||||||||||
Total revenue | $ | 121,244 | $ | 167,372 | $ | 186,586 | $ | 193,534 | $ | 159,258 | ||||||||||
Net income (loss) | $ | (23,705 | ) | $ | (22,333 | ) | $ | (6,272 | ) | $ | 6,340 | $ | 7,174 | |||||||
Net income (loss) per share | ||||||||||||||||||||
Basic | $ | (0.74 | ) | $ | (0.73 | ) | $ | (0.21 | ) | $ | 0.22 | $ | 0.25 | |||||||
Diluted | $ | (0.74 | ) | $ | (0.73 | ) | $ | (0.21 | ) | $ | 0.22 | $ | 0.25 | |||||||
As of December 31, | ||||||||||||||||||||
2016 | 2015 | 2014 | 2013 | 2012 | ||||||||||||||||
(In thousands) | ||||||||||||||||||||
Consolidated Balance Sheet Data: | ||||||||||||||||||||
Total assets | $ | 140,874 | $ | 172,013 | $ | 186,600 | $ | 190,087 | $ | 176,472 | ||||||||||
Cash and cash equivalents | $ | 25,359 | $ | 24,382 | $ | 24,732 | $ | 30,647 | $ | 28,739 | ||||||||||
Short-term borrowings and current portion of long-term debt | $ | 40 | $ | 42 | $ | 15,549 | $ | 7,914 | $ | 9,452 | ||||||||||
Long-term debt, excluding current portion | $ | 43 | $ | 49 | $ | 20 | $ | 100 | $ | 83 | ||||||||||
Stockholders’ equity | $ | 100,822 | $ | 119,176 | $ | 126,953 | $ | 140,210 | $ | 124,933 | ||||||||||
Shares outstanding | 32,135 | 31,782 | 29,846 | 29,563 | 29,162 | |||||||||||||||
29
Item 7. | Management’s Discussion and Analysis of Financial Condition and Results of Operations |
The following discussion of our financial condition and results of operations for the years ended December 31, 2016, 2015 and 2014 should be read in conjunction with our consolidated financial statements and the related notes included in Item 8, Financial Statements and Supplementary Data, of this Annual Report on Form 10-K. In addition, the discussion contains forward-looking statements that are subject to risks and uncertainties, including estimates based on our judgment. These estimates include, but are not limited to, assessing the collectability of accounts receivable, applied and unapplied production costs, production capacities, the usage and recoverability of inventories and long-lived assets, deferred income taxes, pension assets and liabilities, the incurrence of warranty obligations, impairment of goodwill, estimation of the cost to complete certain projects, future revenue and other operating results, cash balances and access to liquidity, accruals for estimated losses from legal matters and estimation of the value of stock-based compensation awards, including the probability that the performance criteria of equity awards will be met. For further discussion regarding forward looking statements, see the section of this Annual Report on Form 10-K entitled Special Note Regarding Forward-Looking Statements.
Management’s Discussion and Analysis of Financial Condition and Results of Operations (“MD&A”) is designed to provide a reader of our financial statements with a narrative from the perspective of our management on our financial condition, results of operations, liquidity and certain other factors that may affect our future results. Our MD&A is presented in the following sections:
• | Executive Overview |
• | Recent Highlights |
• | Results of Operations |
• | Liquidity and Capital Resources |
• | Contractual Obligations |
• | Critical Accounting Estimates |
• | Impact of Inflation |
• | Recent Accounting Pronouncements |
• | Off Balance Sheet Arrangements |
Executive Overview
Maxwell is a global leader in developing, manufacturing and marketing energy storage and power delivery products for transportation, industrial, information technology and other applications. Our products are designed and manufactured to perform reliably with minimal maintenance for the life of the applications into which they are integrated. We believe that this “life-of-the-application” reliability gives our products a competitive advantage and enables them to command higher profit margins than commodity products. We have two product lines: ultracapacitors with applications in multiple industries, including transportation and renewable energy and high-voltage capacitors applied mainly in electrical utility infrastructure. In April 2016, we sold substantially all assets and liabilities of a third product line, radiation-hardened microelectronic products for space and satellite applications.
Our primary objective is to grow revenue and profit margins by creating and satisfying demand for ultracapacitor-based energy storage and power delivery solutions. We are focusing on establishing and expanding market opportunities for ultracapacitors and being the preferred supplier for ultracapacitor products worldwide. We believe that the transportation industry represents the largest market opportunity for ultracapacitors, primarily for applications related to electrical system augmentation, braking energy recuperation and hybrid electric drive systems for transit vehicles, as well as engine starting for trucks and electric rail vehicles. In addition, we see increasing demand for ultracapacitors for use in grid related applications such as backup power and power quality applications, including instantly available power for uninterruptible power supply systems, and stabilizing the output of renewable energy generation systems may also represent significant market opportunities.
In addition to expanding and growing our opportunities for ultracapacitor-based energy storage and power delivery solutions, we are also focused on demonstrating the ability of our core technology to satisfy the increasing performance demands for other energy storage products, such as lithium ion battery cells. To that end, in 2016, we entered into a “proof of concept” joint development agreement and are sharing the short-term costs of developing this technology with an automotive manufacturer and a tier 1 automotive supplier.
30
We also seek to expand market opportunities and revenue for our high-voltage capacitors. The market for high-voltage capacitors consists mainly of expansion, upgrading and maintenance of existing electrical utility infrastructure and new infrastructure installations in developing countries. Such installations are capital-intensive and frequently are subject to regulation, availability of government funding and general economic conditions. In 2017, we plan to expand capacity at our existing high-voltage capacitor production facility in Rossens, Switzerland in order to better meet demand and forecasted production volume.
On February 28, 2017, we announced that we entered into an agreement providing for the acquisition of substantially all of the assets and business of Nesscap Energy, Inc. (“Nesscap”), a developer and manufacturer of ultracapacitor products for use in transportation, renewable energy, industrial and consumer markets, for an aggregate purchase price of $23.2 million, which shall be paid in full through the issuance of 4.6 million shares of Maxwell common stock, subject to adjustment. The potential acquisition of Nesscap will add complementary businesses to our operations and expand our portfolio of products and add value for our customers. We expect the acquisition to be completed in the second quarter of 2017, subject to approval of the shareholders of Nesscap, regulatory approvals and other customary closing conditions.
In February 2017, we announced a restructuring plan to implement a wide range of organizational efficiencies and cost reduction opportunities to better align our costs with near term revenue. In connection with the restructuring plan, we expect to incur restructuring charges between $0.8 million and $1.0 million, primarily related to employee severance. We expect that most of these charges will be cash expenditures and we expect to recognize the majority of the charges in the first quarter of fiscal 2017. We anticipate annual cost savings between $2.5 million and $3.0 million as a result of this restructuring plan, including a benefit in the range of $2.0 million to $2.5 million realized over the remainder of fiscal 2017.
In 2015 and 2016, we executed our 2015 restructuring plan which consolidated U.S. manufacturing operations and reduced headcount and operating expenses in order to align our cost structure with the current business and improve operational efficiency. The plan also included the disposition of our microelectronics product line which was completed in April 2016. The cost savings resulting from the 2015 restructuring activities is approximately $5 million to $6 million per year.
In 2016, revenue was $121.2 million compared with $167.4 million in 2015, representing an overall decrease of 28%. The decrease is primarily attributable to lower revenue for our ultracapacitor products, for which revenue decreased by 38% to $71.5 million in 2016 from $114.5 million in 2015. The decrease in ultracapacitor product revenue was primarily due to government subsidy program changes in China, particularly a proposed requirement to localize product manufacturing, which significantly decreased sales of hybrid transit vehicle applications. This decrease was partially offset by increased sales for rail transit applications.
Revenue for our high-voltage capacitor products was $45.2 million in 2016 compared with $41.7 million for the prior year, representing an increase of 8%. Due to the sale of the product line in April 2016, microelectronics product revenue decreased to $4.6 million in 2016 compared with $11.1 million in 2015.
As of December 31, 2016, we had cash and cash equivalents of $25.4 million. Management believes that this available cash balance will be sufficient to fund our operations, obligations as they become due and capital investments for at least the next twelve months. In addition, we have a revolving line of credit available up to a maximum of $25.0 million, subject to a borrowing base limitation, and we have not borrowed any amounts under this facility to date. In the future, we may decide to supplement existing cash and planned cash flow from operations by borrowing funds or by issuing additional debt or equity.
Overall gross margin for fiscal year 2016 decreased to 27% compared with 30% in 2015, primarily associated with a change in product mix which includes lower sales of higher margin microelectronics products and an increase in product costs due to higher unabsorbed fixed costs associated with the lower sales volume. Operating expenses in 2016 increased to 48% of revenue, compared with 41% of revenue in the prior year, primarily attributable to significantly lower revenue in 2016, partially offset by lower operating expenses due to our restructuring and cost reduction efforts.
Going forward, we will continue to focus on growing our business and strengthening our market leadership and brand recognition through further penetration of existing markets, entry into new markets and development of new products. Our primary focus will be to grow our ultracapacitor business by increasing sales into primary applications, including transportation, renewable energy and backup power. In order to achieve our growth objectives, we will need to overcome risks and challenges facing our business.
31
A significant challenge we face is our ability to manage dependence on a small number of vertical markets, including some that are driven by government policies and subsidy programs. The markets may decline or experience slower rates of growth when there are changes or delays in government policies and subsidy programs. For example, a large portion of our current ultracapacitor business is concentrated in the Chinese hybrid transit bus and wind energy markets, which are heavily dependent on government regulation and subsidy programs. The Chinese government has provided subsidy programs, that vary year to year, targeting plug in hybrid diesel-electric buses. For 2016, the Chinese government renewed the subsidy program which provided subsidies for large plug in hybrid diesel-electric buses, but at a reduced reimbursement rate. and put into place a new subsidy program for medium plug in hybrid diesel-electric buses. However, it is unclear if bus OEM’s in China will adopt ultracapacitor based plug in hybrid diesel-electric designs for this class of bus. Also in 2016, the Chinese government proposed a new registration requirement for energy storage manufacturers who sell into the automotive and heavy transportation markets, requiring localization of manufacturing, and released an updated subsidy program for 2017. In 2017, the subsidies offered will require a manufacturer to be registered in order for its customers, who are ultimately building the buses, to qualify for the subsidy, thereby injecting some uncertainty as to whether our customers will be able to capture the benefit of this new program while determining which manufacturers will be able to comply with the proposed registration requirement. For 2017 and beyond, we may continue to see variability in revenue as a result of uncertainty regarding how these changes and potential changes to the China government subsidy will impact our sales into the hybrid transit vehicle market. In January 2017, to ensure Maxwell products are fully localized in support of the recent China government requirements, Maxwell licensed its module designs targeting the China bus market to CRRC-SRI, who will exclusively use Maxwell’s 2.7-volt and 3-volt ultracapacitor cells in local production lines to manufacture the modules. In addition, Maxwell will continue to leverage its long-standing expertise in the China bus market to jointly design additional, next-generation products, which CRRC-SRI will manufacture in the years to come.
We have also begun to experience significant pricing pressure for ultracapacitors in the Chinese hybrid transit vehicle market and wind energy market, which have historically represented a significant portion of our sales, as a result of other market factors in addition to the government subsidy programs referenced above. In order to remain competitive, we may be required to lower our prices, maintain a stronger local presence, or provide more favorable sales terms to our customers. We remain focused on reducing the cost of producing our ultracapacitors in order to offset in part the lower prices we are now offering in this particular market. However, in the short-term, our cost reduction efforts are not expected to fully offset the impact of these lower prices.
Although we believe the long-term prospects for the automotive, wind and hybrid transit markets remain positive, we are pursuing growth opportunities for our products in other vertical markets, including applications for backup power, power quality, rail, grid and heavy vehicle engine starting in order to further diversify our market presence and augment our long-term growth prospects.
Other significant risks and challenges we face include the ability to achieve profitability; the ability to develop our management team, product development infrastructure and manufacturing capacity to facilitate growth; competing technologies that may capture market share and interfere with our planned growth; difficulties in executing our restructuring plan; and hiring, developing and retaining key personnel critical to the execution of our strategy. We will be attentive to these risks and will focus on developing new products and promoting the value proposition of our products versus competing technologies and trying to grow our revenue and profit in the years to come.
32
Recent Highlights
We are continuing to focus on introducing new products, winning new customers, developing new product applications, adjusting production capacity, reducing costs to align with near-term revenue forecasts, and improving production and other operational processes. Some of these efforts are described below:
• | In January 2016, we announced that our ultracapacitors had been selected by Beijing Huadian Tianren Electric Power Control Technology Co., Ltd., a subsidiary of China Guodian Corporation, as the core component of a wind farm energy storage demonstration project. One of the five largest power producers in the country, China Guodian Corporation’s system is the first megawatt-scale, ultracapacitor-based wind farm energy storage system in the world. |
• | In February 2016, we announced the newest addition to our K2 family with a 3-volt, 3,000-farad ultracapacitor cell. With 31 percent higher power than our leading 2.7-volt, 3,000-farad cell in the industry-standard 60 mm cylindrical form factor, customers now have the flexibility to either increase available power and energy in the same volume or significantly cost-optimize their system designs with fewer cells or modules while maintaining the same power and energy. |
• | In March 2016, Duke Energy, the largest electric power holding company in the United States, announced the commissioning of a new hybrid-energy storage system utilizing our ultracapacitors to manage solar smoothing events. |
• | In April 2016, we announced that we entered into a definitive agreement to sell our microelectronics product line to Data Device Corporation, a subsidiary of ILC Industries, Inc. The transaction was completed on April 27, 2016. |
• | In July 2016, we announced that our ultracapacitors are being used for regenerative braking energy storage in the Beijing subway system. As part of the strategic partnership with China Railway Rolling Stock Corporation (“CRRC-SRI”) that we announced last year, we continue to collaborate to develop next-generation capacitive energy storage solutions for the China rail market. |
• | In July 2016, we entered into a 12-month joint development agreement with one of the world’s leading automotive OEMs to develop a “proof of concept” that, if successful, could lead to the world’s first electric drivetrain based on our technology, targeting a 2021 automotive platform launch. |
• | In October 2016, we announced our 51-volt (“51V”) module, the newest addition to our ultracapacitor product offerings for rugged applications. The 51V module uses our leading 2.85V, 3,400-farad ultracapacitor cell to deliver the highest energy and power density available in the market today. |
• | In November 2016, we announced the first commercial application of lithium-ion capacitors, developed in conjunction with CRRC-SRI, China’s largest rail manufacturer. The technology will be used for rapid energy regeneration in the trolley system in the capital city of the Hunan province in China. Following last year’s announcement of our strategic partnership with CRRC-SRI to collaborate on developing next-generation capacitive energy storage solutions, this project is the first to leverage our new lithium-ion technology and validates its unique value proposition for rail applications. |
• | In December 2016, we announced the Generator Starting Solutions (“GSS”) product line. As the newest addition to our ultracapacitor-based product offerings, the GSS modules help start commercial and industrial standby and backup generators (“gensets”). We are the first company to offer dedicated ultracapacitor-based products that provide strong successful genset starts within seconds of loss of power. |
• | In January 2017, we announced a definitive agreement with CRRC-SRI to localize manufacturing of our ultracapacitor-based modules for use in the China new energy bus market. Under the terms of the agreement, localized production of our ultracapacitor-based modules is expected to begin in China in the second half of 2017, coinciding with the peak buying season for China's new energy bus market. The production of bus modules extends our strategic partnership with CRRC-SRI and will enable us to compete more effectively in the China bus market moving forward. |
33
Results of Operations
Comparison of Years Ended December 31, 2016, 2015 and 2014
The following table presents certain statement of operations data expressed as a percentage of revenue for the periods indicated:
Years Ended December 31, | |||||||||
2016 | 2015 | 2014 | |||||||
Total revenue | 100 | % | 100 | % | 100 | % | |||
Cost of revenue | 73 | % | 70 | % | 63 | % | |||
Gross profit | 27 | % | 30 | % | 37 | % | |||
Operating expenses: | |||||||||
Selling, general and administrative | 30 | % | 24 | % | 24 | % | |||
Research and development | 17 | % | 15 | % | 14 | % | |||
Restructuring and exit costs | — | % | 2 | % | — | % | |||
Impairment of assets | 1 | % | — | % | — | % | |||
Total operating expenses | 48 | % | 41 | % | 38 | % | |||
Loss from operations | (21 | )% | (11 | )% | (1 | )% | |||
Gain on sale of product line | (5 | )% | — | % | — | % | |||
Loss before income taxes | (16 | )% | (11 | )% | (1 | )% | |||
Income tax provision | 3 | % | 2 | % | 2 | % | |||
Net loss | (19 | )% | (13 | )% | (3 | )% | |||
Net loss reported for 2016 was $23.7 million, or $0.74 per share, compared with a net loss in 2015 of $22.3 million, or $0.73 per share, and a net loss in 2014 of $6.3 million, or $0.21 per diluted share. The increase in net loss of $1.4 million in 2016 compared with 2015 was driven by a decline in revenue of 28% and a decline in gross profit of 35%, which were primarily related to changes in China’s government subsidy programs. The effect of these declines was largely offset by a $6.7 million gain from the sale of our microelectronics product line and fully realized savings in 2016 from our restructuring and cost reduction efforts. Despite lower operating expenses in absolute dollars resulting from our restructuring and cost reduction efforts, operating expenses in 2016 increased to 48% of revenue, compared with 41% of revenue in the prior year, primarily attributable to the significant decline in revenue in 2016.
The increase in net loss of $16.1 million in 2015 compared with 2014 was primarily driven by a decline in revenue of 10% and decline in gross profit of 26%. Total operating expenses increased to 41% of revenue in 2015 compared with 38% in 2014.
Revenue and Gross Profit
The following table presents revenue, cost of revenue and gross profit for the years ended December 31, 2016, 2015 and 2014 (in thousands, except percentages):
Years Ended December 31, | 2016 vs. 2015 | 2015 vs. 2014 | ||||||||||||||||||||||||
2016 | 2015 | 2014 | Decrease | % Change | Decrease | % Change | ||||||||||||||||||||
Revenue | $ | 121,244 | $ | 167,372 | $ | 186,586 | $ | (46,128 | ) | (28 | )% | $ | (19,214 | ) | (10 | )% | ||||||||||
Cost of revenue | 88,274 | 116,410 | 118,143 | (28,136 | ) | (24 | )% | (1,733 | ) | (1 | )% | |||||||||||||||
% of Revenue | 73 | % | 70 | % | 63 | % | ||||||||||||||||||||
Gross profit | $ | 32,970 | $ | 50,962 | $ | 68,443 | $ | (17,992 | ) | (35 | )% | $ | (17,481 | ) | (26 | )% | ||||||||||
% of Revenue | 27 | % | 30 | % | 37 | % | ||||||||||||||||||||
Revenue
During 2016, revenue decreased 28% to $121.2 million, compared with $167.4 million in the prior year. This decrease in revenue was primarily related to lower revenue for our ultracapacitor product line which decreased by $43.0 million, or 38%, to $71.5 million from $114.5 million.
34
The decrease in ultracapacitor product revenue was driven by lower sales volume of $44.9 million which was primarily due to government subsidy program changes in China, particularly a proposed requirement to localize product manufacturing, which significantly decreased sales of hybrid transit vehicle applications. The lower hybrid transit vehicle volume was partially offset by higher volume for rail transit applications. Ultracapacitor product revenue was also negatively affected by lower prices of $2.3 million and positively impacted by $4.2 million of other changes primarily related to product mix.
Revenue for our high-voltage products increased by $3.5 million to $45.2 million in 2016, compared with $41.7 million for the prior year. This increase was primarily driven by increased infrastructure renewal investment by the Canadian government. Revenue for our microelectronics products decreased by $6.6 million to $4.6 million for the 2016 compared with $11.1 million for the 2015, due to the sale of this product line in April 2016.
Revenue in 2015 decreased 10% to $167.4 million, compared with $186.6 million in 2014. This decrease was influenced primarily by lower revenue for our ultracapacitor product line, which decreased to $114.5 million in 2015 compared with $135.6 million in the prior year.
The decrease in ultracapacitor product revenue in 2015 primarily related to decreased sales for rail transit, wind energy, automotive and other markets. This decrease was composed of lower prices of $19.3 million and decreases due to product mix and other factors of $1.8 million, while volumes in 2015 and 2014 were comparable. Changes in the China government subsidy program and other market factors significantly contributed to lower pricing in 2015.
Revenue for our high-voltage capacitor products totaled $41.7 million for 2015, an increase of 3% from the $40.4 million recorded in 2014, primarily related to sales of newly developed products in 2015. Revenue from our microelectronic products totaled $11.1 million for 2015, up 5% from the $10.6 million recorded in 2014, as revenue for this product line varied based on the timing of governmental and commercial programs.
The following table presents revenue mix by product line for the years ended December 31, 2016, 2015 and 2014:
Years Ended December 31, | |||||||||
2016 | 2015 | 2014 | |||||||
Ultracapacitors | 59 | % | 68 | % | 73 | % | |||
High-voltage capacitors | 37 | % | 25 | % | 21 | % | |||
Microelectronics products | 4 | % | 7 | % | 6 | % | |||
Total | 100 | % | 100 | % | 100 | % | |||
A substantial amount of our revenue is generated through our Swiss subsidiary which has a functional currency of the Swiss Franc. As such, reported revenue can be materially impacted by changes in exchange rates between the Swiss Franc and the U.S. Dollar, our reporting currency. Due to the strengthening of the U.S. Dollar against the Swiss Franc during 2016 compared with 2015, revenue was negatively impacted by $1.1 million. Due to the strengthening of the U.S. Dollar against the Swiss Franc during 2015 compared with 2014, revenue was negatively impacted by $2.0 million.
Gross Profit and Gross Margin.
During 2016, gross profit decreased $18.0 million, or 35%, to $33.0 million compared with $51.0 million in the prior year. This decrease was associated with lower revenue, primarily due to lower sales volume, an increase in product costs due to higher unabsorbed fixed costs associated with the lower sales volume, as well as a less significant impact from a reduction in pricing for our ultracapacitor products. As a percentage of revenue, gross margin decreased to 27% in 2016 compared with 30% in the prior year. This decrease was primarily associated with a change in product mix which no longer includes sales of higher margin microelectronics products, an increase in product costs due to higher unabsorbed fixed costs associated with the lower sales volume, as well as a less significant impact from a reduction in pricing for our ultracapacitor products.
During 2015, gross profit decreased $17.5 million, or 26%, to $51.0 million compared with $68.4 million in 2014. This decrease was associated with lower revenue which primarily related to lower prices for our ultracapacitor products sold into the Chinese hybrid transit vehicle market. As a percentage of revenue, gross margin decreased to 30% in 2015 compared with 37% in 2014. This decrease was primarily associated with the reduction in pricing for our ultracapacitor products.
35
Selling, General and Administrative Expense
The following table presents selling, general and administrative expense for the years ended December 31, 2016, 2015 and 2014 (in thousands, except percentages):
Years Ended December 31, | 2016 vs. 2015 | 2015 vs. 2014 | ||||||||||||||||||||||||
2016 | 2015 | 2014 | Decrease | % Change | Decrease | % Change | ||||||||||||||||||||
Selling, general and administrative | $ | 36,281 | $ | 40,758 | $ | 43,022 | $ | (4,477 | ) | (11 | )% | $ | (2,264 | ) | (5 | )% | ||||||||||
% of Revenue | 30 | % | 24 | % | 24 | % | ||||||||||||||||||||
Selling, general and administrative expenses for 2016 decreased by $4.5 million, or 11%, compared with 2015. This decrease primarily related to a decrease of $1.7 million in labor costs related to headcount reductions in connection with our restructuring and sale of the microelectronics product line, a decrease of $1.7 million related to lower legal costs associated with the ongoing SEC and FCPA investigations, a decrease of $1.3 million related to the release of a foreign payroll tax liability due to the lapse of a statute of limitations, as well as various expense savings related to our restructuring and cost reduction efforts and sale of the microelectronics product line. These decreases were partially offset by an increase of $1.2 million in stock compensation expense related to our 2016 management bonus plan, whereas our bonus plan was suspended for 2015. Selling, general and administrative expenses increased to 30% of revenue, up from 24% in 2015, as revenue proportionately decreased more than expenses between the periods.
Selling, general and administrative expenses for 2015 decreased by $2.3 million, or 5%, compared with 2014. The decrease primarily related to a $1.0 million decrease in overall labor costs associated with reduced headcount as a result of our restructuring efforts and the elimination of our management bonus program for 2015. In addition, there was a $1.1 million reduction in recruiting costs, a $0.7 million decrease in travel costs, a $0.7 million decrease in consulting costs, a $0.5 million decrease in information technology and facilities costs, as well as other expense savings, primarily related to our restructuring and cost reduction efforts. Also, in the third quarter of 2015, we received a $0.5 million refund of value-added-taxes related to our operations in China. These decreases were partially offset by an increase in legal fees of $2.6 million incurred in 2015 due to the ongoing SEC and FCPA investigations. Selling, general and administrative expenses were 24% of revenue for 2015, consistent with 24% for 2014.
Research and Development Expense
The following table presents research and development expense for the years ended December 31, 2016, 2015 and 2014 (in thousands, except percentage):
Years Ended December 31, | 2016 vs. 2015 | 2015 vs. 2014 | ||||||||||||||||||||||||
2016 | 2015 | 2014 | Decrease | % Change | Decrease | % Change | ||||||||||||||||||||
Research and development | $ | 20,889 | $ | 24,697 | $ | 26,320 | $ | (3,808 | ) | (15 | )% | $ | (1,623 | ) | (6 | )% | ||||||||||
% of Revenue | 17 | % | 15 | % | 14 | % | ||||||||||||||||||||
Research and development expenses for 2016 decreased by $3.8 million, or 15%, compared with 2015. The decrease was primarily associated with a decrease of $1.1 million in labor and headcount-related costs primarily related to our restructuring and cost reduction efforts and sale of the microelectronics product line, an increase of $0.9 million in third-party funding under cost-sharing arrangements, as well as other decreases related to our restructuring and cost reduction efforts and sale of the microelectronics product line, such as a decrease of $0.7 million in outsourced research and development services, a decrease of $0.5 million in facilities costs and a decrease of $0.5 million in tool and supply expenses. Research and development expenses increased to 17% of revenue, up from 15% in 2015, as revenue proportionately decreased more than expenses between the periods.
Research and development expenses for 2015 decreased by $1.6 million, or 6%, compared with 2014. The decrease was associated with an increase in third-party funding under cost-sharing arrangements of $1.5 million and a decrease of $0.7 million in information technology and facilities costs due to cost control efforts in connection with our restructuring. These decreases were partially offset by an increase in expense of $0.4 million for product evaluation units used to support a grid energy storage demonstration project in 2015. Research and development expenses increased to 15% of revenue in 2015, up from 14% in 2014, as revenue proportionately decreased more than expenses between the periods.
36
Restructuring and Exit Costs
In 2015, we initiated a restructuring plan to consolidate U.S. manufacturing operations and to reduce headcount and operating expenses in order to align our cost structure with the current business forecast and to improve operational efficiency. The plan also included the disposition of our microelectronics product line which was completed in April 2016. The restructuring plan was otherwise substantially completed in the first quarter of 2016. Total restructuring and exit costs were $2.8 million, which included $1.3 million in facilities costs related to the consolidation of manufacturing operations, $1.2 million in employee severance costs and $0.3 million for equipment relocation and inventory scrap as a direct result of the deconstruction of machinery. Total cash expenditures related to restructuring activities were approximately $1.5 million.
For the years ended December 31, 2016 and 2015, we recorded charges related to the restructuring plan of $0.3 million and $2.5 million, respectively.
The following table summarizes our restructuring and exit costs for the years ended December 31, 2016 and 2015 (in thousands):
Employee Severance Costs | Lease Obligation Costs | Other Exit Costs | Total | |||||||||||||
Restructuring liability as of December 31, 2014 | $ | — | $ | — | $ | — | $ | — | ||||||||
Costs incurred | 1,439 | 1,208 | — | 2,647 | ||||||||||||
Amounts paid | (1,010 | ) | — | — | (1,010 | ) | ||||||||||
Accruals released | (135 | ) | — | — | (135 | ) | ||||||||||
Other non-cash adjustments | — | (165 | ) | — | (165 | ) | ||||||||||
Restructuring liability as of December 31, 2015 | 294 | 1,043 | — | 1,337 | ||||||||||||
Costs incurred | 67 | 86 | 298 | 451 | ||||||||||||
Amounts paid | (207 | ) | — | (246 | ) | (453 | ) | |||||||||
Accruals released | (154 | ) | — | — | (154 | ) | ||||||||||
Other non-cash adjustments | — | (327 | ) | (52 | ) | (379 | ) | |||||||||
Restructuring liability as of December 31, 2016 | $ | — | $ | 802 | $ | — | $ | 802 | ||||||||
Impairment of Assets
During the year ended December 31, 2016, we recorded total impairment charges of $1.4 million related to property and equipment. In the fourth quarter of 2016, we recorded $1.2 million of impairment charges related to machinery which was no longer forecasted to be utilized during its remaining useful life based on the current production forecast and for which the fair value approximated zero. Additionally, during the third quarter of 2016, we recorded $0.2 million of impairment charges related to the cancellation of a project. No impairments of property and equipment were recorded during the years ended December 31 2015 and 2014.
Provision for Income Taxes
The effective tax rate differs from the statutory U.S. federal income tax rate of 34% primarily due to foreign income taxes and the valuation allowance against our domestic deferred tax assets.
We recorded an income tax provision of $4.1 million, $4.6 million and $4.3 million for the years ended December 31, 2016, 2015 and 2014, respectively. This provision is primarily related to taxes on income generated by our Swiss subsidiary. As of December 31, 2016, we have recorded a $4.9 million deferred tax liability for Swiss withholding taxes associated with $97.6 million of undistributed earnings of our Swiss subsidiary that are no longer considered indefinitely reinvested. In the event that we repatriate these funds, this withholding tax would become payable to the Swiss government. During the years ended December 31, 2016, 2015 and 2014, income tax expense associated with undistributed earnings of our Swiss subsidiary that are no longer considered indefinitely reinvested was $1.2 million, $2.1 million and $1.6 million, respectively.
At December 31, 2016, we have a cumulative valuation allowance recorded offsetting our worldwide net deferred tax assets of $78.4 million, of which the significant majority represents the valuation allowance on our U.S. net deferred tax assets. We have established a valuation allowance against our U.S. federal and state deferred tax assets due to the uncertainty surrounding the realization of such assets. Management periodically evaluates the recoverability of the deferred tax assets and at such time as it is determined that it is more likely than not that U.S. deferred tax assets are realizable, the valuation allowance will be reduced accordingly.
37
Liquidity and Capital Resources
Changes in Cash Flow
The following table summarizes our cash flows from operating, investing and financing activities for each of the past three fiscal years (in thousands):
Year Ended December 31, 2016 | ||||||||||||
2016 | 2015 | 2014 | ||||||||||
Total cash provided by (used in): | ||||||||||||
Operating activities | $ | (14,357 | ) | $ | 9,380 | $ | (6,163 | ) | ||||
Investing activities | 14,663 | (4,143 | ) | (6,975 | ) | |||||||
Financing activities | 796 | (5,366 | ) | 9,563 | ||||||||
Effect of exchange rate changes on cash and cash equivalents | (525 | ) | 179 | (2,340 | ) | |||||||
Increase (decrease) in cash and cash equivalents | $ | 577 | $ | 50 | $ | (5,915 | ) | |||||
In 2016, cash used in operating activities of $14.4 million related primarily to a net loss of $23.7 million, which included non-cash charges of $9.8 million, a decrease in accounts payable and accrued liabilities of $14.9 million related to lower procurement activity in 2016, and an increase in inventory of $5.0 million, net of the sale of the microelectronics product line inventories, related to timing differences in matching production to demand. These decreases in cash were partially offset by a decrease in accounts receivable of $20.1 million primarily related to a lower volume of sales near the end of 2016 compared with the end of 2015.
In 2015, cash provided by operating activities of $9.4 million related primarily to an increase in accounts payable and accrued liabilities of $5.0 million primarily due to timing of payments, and a decrease in inventory of $5.3 million primarily associated with efforts to reduce our inventory levels. These increases in cash were partially offset by a net loss of $22.3 million, which included non-cash charges of $20.6 million.
Cash used in operating activities was $14.4 million for 2016 compared with cash provided by operating activities of $9.4 million for 2015. Cash flows from operating activities were negatively impacted by lower revenue and gross profit in 2016. Additionally, during 2016, working capital was relatively unchanged, net of the impact of the sale of the microelectronics product line, compared with positive cash flows of $11.2 million in 2015 mainly from changes in working capital.
Cash provided by operating activities was $9.4 million for 2015 compared with cash used in operating activities of $6.2 million for 2014. Cash flows from operating activities were positively impacted by working capital changes of $11.2 million in 2015 compared with a negative impact from working capital changes in 2014 of $15.1 million. This increase in cash flows was partially offset by lower revenue and gross profit in 2015 compared with 2014.
Cash provided by investing activities was $14.7 million for 2016 compared with cash used in investing activities of $4.1 million for 2015 and $7.0 million in 2014. Cash provided by investing activities for 2016 primarily related to proceeds from the sale of our microelectronics product line of $20.5 million, partially offset by capital expenditures of $6.0 million. Capital expenditures in 2016 were primarily focused on investments in our corporate research and development facility in San Diego, California. Cash used in investing activities in 2015 related to capital expenditures primarily focused on our manufacturing operations as well as investments in information technology infrastructure. Cash used in investing activities in 2014 related to capital expenditures primarily focused on investments to increase production capacity, including equipment for our manufacturing facilities in San Diego, California and Peoria, Arizona and our contract manufacturing operations in Shenzhen, China, as well as investments in our corporate research and development center in San Diego, California.
Cash provided by financing activities was $0.8 million for 2016, compared with $5.4 million used in financing activities in 2015 and $9.6 million provided by financing activities in 2014. Cash provided by financing activities for 2016 resulted from proceeds from purchases under our employee stock purchase plan of $0.8 million. Cash used in financing activities in 2015 primarily resulted from net payments on long term and short term borrowings of $15.8 million, offset by net proceeds from our at-the-market equity offering of $9.6 million and proceeds from exercises of employee stock options and purchases under our employee stock purchase plan of $0.9 million. In 2014, cash provided by financing activities primarily resulted from net borrowing on long term and short term debt of $8.1 million and proceeds from exercises of employee stock options and purchases under our employee stock purchase plan of $1.4 million.
38
Liquidity
As of December 31, 2016, we had approximately $25.4 million in cash and cash equivalents, and working capital of $53.1 million. In July 2015, we entered into a loan agreement with East West Bank (“EWB”), whereby EWB made available to us a secured credit facility in the form of a Revolving Line of Credit. The Revolving Line of Credit is available up to a maximum of the lesser of: (a) $25.0 million; or (b) a certain percentage of domestic and foreign trade receivables. As of December 31, 2016, the amount available under the Revolving Line of Credit was $11.4 million. No amounts have been borrowed under this Revolving Line of Credit as of December 31, 2016.
In addition, in June 2014, we filed a shelf registration statement on Form S-3 with the SEC to, from time to time, sell up to $125 million of our common stock, warrants, debt securities or units. On June 30, 2014, the registration statement was declared effective by the SEC, which allows us to access the capital markets for the three-year period following this effective date. On April 23, 2015, we entered into an At-the-Market Equity Offering Sales Agreement (“Sales Agreement”) with Cowen and Company, LLC (“Cowen”) pursuant to which we could sell, at our option, up to an aggregate of $10.0 million in shares of common stock through Cowen, as sales agent. Under the Sales Agreement, we agreed to pay Cowen a commission equal to 3.0% of the gross proceeds from the sale of shares of our common stock. On June 11, 2015, we completed the sale of approximately $10.0 million of our common stock and terminated the offering. Approximately 1.83 million shares were sold in the offering at an average share price of $5.46. We received net proceeds of $9.6 million after commissions and offering costs of $0.4 million.
In April 2016, we completed the sale of substantially all of the assets and liabilities of our microelectronics product line and received cash proceeds of $20.5 million, net of a one year $1.5 million holdback on the purchase price.
Capital expenditures are expected to be approximately $10.0 million in 2017. Approximately 45% of our planned capital spending is focused on product research and development and 35% is focused on improving manufacturing processes. The remaining planned capital spending will support information technology infrastructure and improvements to our facilities.
As of December 31, 2016, the amount of cash and short-term investments held by foreign subsidiaries was $18.8 million. If these funds are needed for our operations in the U.S. in the future, we may be required to pay taxes to repatriate these funds at a rate of approximately 5%. We have accrued the tax expense associated with the potential future repatriation of these funds.
Subsequent to the year ended December 31, 2016, our Board of approved a comprehensive restructuring plan for our businesses that includes a wide range of organizational efficiency initiatives and other cost reduction opportunities. We estimate that we will incur total aggregate charges of approximately $0.8 million to $1.0 million from this restructuring, primarily based upon estimated severance and related costs. We expect that most of these charges will be cash expenditures and we expect to recognize most of the charges related to this restructuring in the first quarter of fiscal 2017.
In connection with our potential acquisition of substantially all of the assets and business of Nesscap, we expect to incur approximately $3.5 million to $4.5 million in cash expenditures. We expect the acquisition to be completed in the second quarter of 2017, subject to approval of the shareholders of Nesscap, regulatory approvals and other customary closing conditions.
Revolving Line of Credit
In July 2015, we entered into a Loan and Security Agreement (the “Loan Agreement”) and related agreements with East West Bank (“EWB”), whereby EWB made available to us a secured credit facility in the form of a revolving line of credit (the “Revolving Line of Credit”). The Revolving Line of Credit is available up to a maximum of the lesser of: (a) $25.0 million; or (b) a certain percentage of domestic and foreign trade receivables. As of December 31, 2016, the amount available under the Revolving Line of Credit was $11.4 million. In general, amounts borrowed under the Revolving Line of Credit are secured by a lien on all of our assets, including our intellectual property, as well as a pledge of 100% of our equity interests in the Company’s Swiss subsidiary. The obligations under the Loan Agreement are guaranteed by the Swiss subsidiary. The Revolving Line of Credit will mature on July 3, 2018. In the event that we are in violation of the representations, warranties and covenants made in the Loan Agreement, including certain financial covenants set forth therein, we may not be able to utilize the Revolving Line of Credit or repayment of amounts owed pursuant to the Loan Agreement could be accelerated. We are currently in compliance with the financial covenants that we are required to meet during the term of the credit agreement including the minimum four-quarter rolling EBITDA, quarterly minimum quick ratio and minimum cash requirements. On March 1, 2017, we entered into an amendment to the Loan Agreement to approve the acquisition of substantially all of the assets and business of Nesscap Energy, Inc., and to modify certain financial covenants.
Amounts borrowed under the Revolving Line of Credit bear interest, payable monthly. Such interest shall accrue based upon, at our election, subject to certain limitations, either a Prime Rate plus a margin or the LIBOR Rate plus a margin, ranging from 0% to 0.50% or the LIBOR Rate plus a margin ranging from 2.75% to 3.25%, the specific rate for each as determined based upon our leverage ratio from time to time.
39
We are required to pay an annual commitment fee equal to $125,000, and an unused commitment fee of the average daily unused amount of the Revolving Line of Credit, payable monthly, equal to a per annum rate in a range of 0.30% to 0.50%, as determined by our leverage ratio on the last day of the previous fiscal quarter. No amounts have been borrowed under the Revolving Line of Credit as of December 31, 2016.
Former Credit Facility
In December 2011, we obtained a secured credit facility in the form of a revolving line of credit (the “Former Revolving Line of Credit”) and an equipment term loan (the “Equipment Term Loan”) (together, the “Former Credit Facility”). Borrowings under the Former Credit Facility bore interest, payable monthly, at either (i) the bank’s prime rate or (ii) LIBOR plus 2.25%, at our option, subject to certain limitations. The Equipment Term Loan was available to finance 80% of eligible equipment purchases made between April 1, 2011 and April 30, 2012. During this period, we borrowed $5.0 million under the Equipment Term Loan.
The balance of the Equipment Term Loan was paid in full by the maturity date of April 30, 2015. Concurrently with entering into the Loan Agreement described above, in July 2015, we repaid all outstanding loans under the Former Revolving Line of Credit and terminated the Former Credit Facility. We did not incur any early termination or prepayment penalties under the Former Credit Facility in connection with the above transactions.
Other long-term borrowings
Maxwell SA has various financing agreements for vehicles. These agreements are for up to an original three-year repayment period with interest rates ranging from 0.9% to 3.9%. At December 31, 2016 and 2015, $83,000 and $91,000, respectively, was outstanding under these agreements.
Contractual Obligations
Payment due by period (in thousands) | ||||||||||||||||||||
Total | Less than 1 Year | 1–3 Years | 3–5 Years | More than 5 Years | ||||||||||||||||
Operating lease obligations (1) | $ | 16,507 | $ | 3,167 | $ | 4,714 | $ | 3,481 | $ | 5,145 | ||||||||||
Purchase commitments (2) | 1,668 | 1,668 | — | — | — | |||||||||||||||
Debt obligations (3) | 83 | 40 | 43 | — | — | |||||||||||||||
Pension benefit payments (4) | 30,257 | 1,320 | 2,789 | 2,639 | 23,509 | |||||||||||||||
Total (5) (6) | $ | 48,515 | $ | 6,195 | $ | 7,546 | $ | 6,120 | $ | 28,654 | ||||||||||
_____________________
(1) | Operating lease obligations primarily represent building leases. |
(2) | Purchase commitments primarily represent the value of non-cancellable purchase orders and an estimate of purchase orders that if canceled would result in a significant penalty. |
(3) | Debt obligations represent long-term and short-term borrowings related to financing agreements for vehicles. |
(4) | Pension benefit payments represent the expected amounts to be paid for pension benefits. |
(5) | The table excludes $0.3 million of liabilities associated with uncertain tax positions because we are unable to reasonably estimate the timing of future payments, if required. |
(6) | The table excludes deferred tax liability of $4.9 million due to uncertainty of timing of future payments. This deferred tax liability on undistributed earnings of a foreign subsidiary represents deferred tax expense associated with a portion of the unremitted earnings of a foreign subsidiary that are not considered permanently reinvested. |
Critical Accounting Estimates
We consider an accounting estimate to be critical if: 1) the accounting estimate requires us to make assumptions about matters that were uncertain at the time the accounting estimate was made and 2) changes in the estimate are reasonably likely to occur from period to period, or use of different estimates that we reasonably could have used in the current period, would have a material impact on our financial condition or results of operations.
Also see Note 1, Summary of Significant Accounting Policies, in Part II, Item 8, Financial Statements and Supplementary Data, of this Annual Report on Form 10-K, which discusses the significant accounting policies.
40
We believe the following are either (i) critical accounting policies that require us to make significant estimates or assumptions in the preparation of our consolidated financial statements or (ii) other key accounting policies that may require us to make difficult or subjective judgments.
Revenue Recognition
Nature of Estimates Required. Sales revenue is primarily derived from the sale of products directly to customers. Product revenue is recognized when all of the criteria for revenue recognition are met. Customer agreements and other terms of the sale are evaluated to determine when the criteria for revenue recognition have been met, and therefore when revenue should be recognized. Revenue recognition is deferred until all the criteria for revenue recognition have been met.
Assumptions and Approach Used. Product revenue is recognized when all of the following criteria are met: (1) persuasive evidence of an arrangement exists according to customer contracts or sales documents; (2) title and risk of loss pass to the customer according to the order’s shipping terms; (3) price is deemed fixed or determinable and free of significant contingencies or uncertainties; and (4) collectability is reasonably assured. Customer contracts, or purchase orders and order confirmations, are generally used to determine the existence of an arrangement. Shipping terms determine when the passage of title and risk of loss have occurred. We assess whether a price is fixed or determinable based upon the payment terms associated with the transaction. We assess the collectability of accounts receivable based primarily upon creditworthiness of the customer as determined by credit checks and analysis, as well as the customer’s payment history. If we determine that a particular sale does not meet all of the above criteria for revenue recognition, revenue is not recognized until all of the criteria are determined to have been achieved.
A portion of our sales revenue is derived from sales to distributors. Distributor revenue is recognized when all of the criteria for revenue recognition are met, which is generally the time of shipment to the distributor; all returns and credits are estimable and not significant.
Total deferred revenue and customer deposits in our consolidated balance sheets as of December 31, 2016 and 2015 was $4.0 million and $3.1 million, respectively, and primarily relates to cash received from a customer in connection with a production-type contract, for which revenue is recognized using the percentage of completion method, and payments received under our joint development agreement, which are recognized as an offset to research and development expense as services are performed.
Excess and Obsolete Inventory
Nature of Estimates Required. Estimates are principally based on assumptions regarding the ability to sell the items in our inventory. Due to the uncertainty and potential volatility inherent in these estimates, changes in our assumptions could materially affect our results of operations.
Assumptions and Approach Used. Our estimate for excess and obsolete inventory is evaluated on a quarterly basis and is based on rolling historical inventory usage and assumptions regarding future product demand. As actual levels of inventory change or specific products become slow moving or obsolete, our estimated reserve may materially change.
Pension
Nature of Estimates Required. We use several significant assumptions within the actuarial models utilized in measuring our pension benefit obligations and assets held by the pension plan.
Assumptions and Approach Used. The discount rate and expected return on assets are estimates impacting plan expense and asset and liability measurement. We evaluate these critical assumptions at least annually. We periodically evaluate actuarial assumptions involving demographic factors, which are used to measure the pension obligation, such as retirement age, mortality and turnover, and update them to reflect our experience and expectations for the future. Actual results in any given year will often differ from actuarial assumptions because of economic and other factors. The projected benefit obligation as of December 31, 2016 was $30.3 million and the fair value of plan assets was $39.1 million. The Company does not have any rights to the assets of the plan other than the right to offset the liabilities of the plan.
41
Goodwill Impairment
Nature of Estimates Required. We review goodwill annually at the reporting unit level at the same time every year or when an event occurs or circumstances change such that it is reasonably possible that an impairment may exist. We have established December 31 as the annual impairment test date. We first make a qualitative assessment as to whether goodwill is impaired and if it is more likely than not that goodwill is impaired, we perform a two-step quantitative impairment analysis to determine if goodwill is impaired. We may also determine to skip the qualitative assessment in any year and move directly to the quantitative test. For the quantitative test, we determine the fair value of the reporting unit, then compare the fair value of the reporting unit to its carrying value. If carrying value exceeds fair value for the reporting unit, then we calculate and compare the implied fair value of goodwill to the carrying amount of goodwill and record an impairment charge for any excess of carrying value over implied fair value.
Assumptions and Approach Used. The determination of fair value requires a number of significant assumptions and judgments, including assumptions about future economic conditions, revenue growth, operating margins, and discount rates.
In 2016, we performed a qualitative analysis on our high voltage reporting unit and concluded that it was more likely than not that its fair value exceeded its carrying value and therefore did not perform quantitative testing for this reporting unit. For our ultracapacitor reporting unit, which was associated with $2.3 million of goodwill, we skipped the qualitative analysis and performed the first step of the quantitative analysis.
For the quantitative step one goodwill impairment analysis of our ultracapacitor reporting unit, we utilized a discounted cash flow model to calculate the fair value of the reporting unit which required us to make significant assumptions and estimates about the extent and timing of future cash flows, discount rates and growth rates. The basis of the goodwill impairment analysis is our annual budget and long-range cash flow projections. Because cash flows are estimated over a significant future period of time, the estimates and assumptions are subject to a high degree of uncertainty. Our revenue growth assumptions are internally developed based on detailed market and opportunity analysis and include the successful execution of our long-term growth strategies such as the localization of ultracapacitor modules for the China bus market. We believe the assumptions and estimates used in the analysis to estimate fair value are reasonable. The use of different estimates or assumptions within a discounted cash flow model, or the use of a methodology other than a discounted cash flow model, could result in a significantly different fair value for the reporting unit. The impairment testing we conducted in 2016 indicated that the fair value of the ultracapacitor reporting unit was in excess of its carrying value, as such, we concluded that the goodwill assigned to the ultracapacitor reporting unit was not impaired and no further quantitative testing was performed. No impairments of goodwill were reported during the years ended December 31, 2016, 2015 and 2014.
Stock-Based Compensation
Nature of Estimates Required. Our stock-based compensation awards include stock options, restricted stock, restricted stock units, and shares issued under our employee stock purchase plan (“ESPP”). We record compensation expense for our stock-based compensation awards in accordance with the criteria set forth in the Stock Compensation Subtopic of the Financial Accounting Standards Board (“FASB”) Accounting Standards Codification (“ASC”). Under the guidance, the fair value of each employee stock option is estimated on the date of grant using an option pricing model that meets certain requirements. We use the Black-Scholes option pricing model to estimate the fair value of stock option grants. The determination of the fair value of stock options utilizing the Black-Scholes model is affected by our stock price and a number of assumptions, including expected volatility, expected life, risk-free interest rate and expected dividends.
The fair value of restricted stock awards (“RSAs”) and restricted stock unit awards (“RSUs”) is based on the closing market price of our common stock on the date of grant. Compensation expense equal to the fair value of each RSA or RSU is recognized ratably over the requisite service period. For RSUs with vesting contingent on the achievement of Company performance conditions, we use the requisite service period that is most likely to occur. The requisite service period is estimated based on the performance period as well as any time-based employee service requirements. If it is unlikely that a performance condition will be achieved, no compensation expense is recognized unless it is later determined that achievement of the performance condition is likely. Expense may be adjusted for changes in the expected outcomes of the related performance conditions, with the impact of such changes recognized as a cumulative adjustment in the consolidated statement of operations in the period in which the expectation changes.
In 2016 and 2014, we issued market-condition RSUs to certain members of executive management. Since the vesting of the market-condition RSUs is dependent on stock price performance, the fair value of these awards was estimated using a Monte-Carlo valuation model. The determination of the fair value of market-condition RSUs utilizing a Monte-Carlo valuation model was affected by our stock price and a number of assumptions, including expected volatility, expected life, risk-free interest rate and expected dividends.
42
Stock-based compensation expense recognized in the consolidated statement of operations is based on equity awards ultimately expected to vest. We estimate forfeitures at the time of grant and revise, as necessary, in subsequent periods with a cumulative catch up adjustment if actual forfeitures differ from those estimates.
Assumptions and Approach Used. In determining the value of stock option and market-condition RSU grants, we estimate an expected dividend yield of zero because we have never paid cash dividends and have no present intention to pay cash dividends. The expected term calculation is based on the actual life of historical stock option grants. Expected volatility is based on our historical stock prices using a mathematical formula to measure the standard deviation of the change in the natural logarithm of our underlying stock price over a period of time commensurate with the expected term. The risk-free interest rate is derived from the zero coupon rate on U.S. Treasury instruments with a term commensurate with the awards expected term.
For RSUs with vesting contingent on the achievement of Company performance conditions, the amount of compensation expense is estimated based on the expected achievement of the performance condition. This requires us to make estimates of the likelihood of the achievement of Company performance conditions, which is highly judgmental. We base our judgments as to the expected achievement of Company performance conditions based on the financial projections of the Company that are used by management for business purposes, which represent our best estimate of expected Company performance. If it is unlikely that a performance condition will be achieved, no compensation expense is recognized unless it is later determined that achievement of the performance condition is likely. Further, the requisite service period is estimated based on the performance period as well as any time-based employee service requirements.
We evaluate the assumptions used to value stock-based awards on a quarterly basis. If factors change and we employ different assumptions, stock-based compensation expense may differ significantly from what we have recorded in the past. If there are any modifications or cancellations of stock-based awards, we may be required to accelerate, increase or decrease any remaining, unrecognized stock-based compensation expense. Compensation expense may be significantly impacted in the future to the extent our estimates differ from actual results.
Income Taxes
Nature of Estimates Required. We record an income tax valuation allowance when the realization of certain deferred tax assets, including net operating losses, is not likely. Not included in the net operating loss deferred tax asset is approximately $10.0 million of gross deferred tax asset attributable to stock option exercises, restricted stock grants, and disqualifying dispositions of both incentive stock options and stock issued under the Company’s ESPP as they did not reduce taxes payable.
We record U.S. income taxes on the undistributed earnings of foreign subsidiaries unless the subsidiaries’ earnings are considered indefinitely reinvested outside of the U.S. As of December 31, 2016, we have recorded a $4.9 million deferred tax liability for Swiss withholding taxes associated with $97.6 million of undistributed earnings of our Swiss subsidiary that are no longer considered indefinitely reinvested. In the event that we repatriate these funds, this withholding tax would become payable to the Swiss government. As of December 31, 2016, there were no undistributed earnings considered indefinitely reinvested.
Assumptions and Approach Used. Deferred income taxes arise from temporary differences between tax and financial statement recognition of revenue and expense. In evaluating our ability to recover our deferred tax assets within the jurisdiction from which they arise, we consider all available positive and negative evidence, including scheduled reversals of deferred tax liabilities, projected future taxable income, tax-planning strategies, and results of recent operations. Significant judgments and estimates are required in this evaluation. If we determine that we are able to realize a portion or all of these deferred tax assets in the future, we will record an adjustment to increase their recorded value and a corresponding adjustment to increase income or additional paid in capital, as appropriate, in that same period.
Commitments and Contingencies
Nature of Estimates Required. We are involved in litigation, regulatory and other proceedings and claims. We prosecute and defend these matters aggressively. However, there are many uncertainties associated with any litigation, and there can be no assurance that these actions or other third-party claims against us will be resolved without costly litigation and/or substantial settlement charges.
43
Assumptions and Approach Used. We disclose information concerning contingent liabilities with respect to these claims and proceedings for which an unfavorable outcome is more than remote. We recognize liabilities for these claims and proceedings as appropriate based upon the probability of loss and our ability to estimate losses and to fairly present, in conjunction with the disclosures of these matters in our consolidated financial statements, management’s view of our exposure. We review outstanding claims and proceedings with external counsel as appropriate to assess probability and estimates of loss. We will recognize a liability related to claims and proceedings at such time as an unfavorable outcome becomes probable and the amount can be reasonably estimated. When the reasonable estimate is a range, the recognized liability will be the best estimate within the range. If no amount in the range is a better estimate than any other amount, the minimum amount of the range will be recognized.
We re-evaluate these assessments each quarter or as new and significant information becomes available to determine whether a liability should be recognized or if any existing liability should be adjusted. The actual cost of ultimately resolving a claim or proceeding may be substantially different from the amount of the recognized liability. In addition, because it is not permissible to recognize a liability until the loss is both probable and estimable, in some cases there may be insufficient time to recognize a liability prior to the actual incurrence of the loss (upon verdict and judgment at trial, for example, or in the case of a quickly negotiated settlement).
Impact of Inflation
We believe that inflation has not had a material impact on our results of operations for any of our fiscal years in the three-year period ended December 31, 2016. However, there can be no assurance that future inflation would not have an adverse impact on our operating results and financial condition.
Recent Accounting Pronouncements
In May 2014, the Financial Accounting Standards Board (“FASB”) issued Accounting Standards Update (“ASU”) No. 2014-09, Revenue from Contracts with Customers. The standard provides companies with a single model for accounting for revenue arising from contracts with customers and supersedes current revenue recognition guidance, including industry-specific revenue guidance. The core principle of the model is to recognize revenue when control of the goods or services transfers to the customer, as opposed to recognizing revenue when the risks and rewards transfer to the customer under the existing revenue guidance. The guidance permits companies to either apply the requirements retrospectively to all prior periods presented, or apply the requirements in the year of adoption, through a cumulative adjustment. In August 2015, the FASB issued ASU 2015-14, Deferral of the Effective Date, which defers the required adoption date of ASU 2014-09 by one year. As a result of the deferred effective date, ASU 2014-09 will be effective for us in our first quarter of fiscal 2018. Early adoption is permitted but not before the original effective date of the new standard of the first quarter of fiscal 2017. The following ASUs were subsequently issued by the FASB to clarify the implementation guidance in some areas and add practical expedients: In March 2016, ASU 2016-08, Revenue from Contracts with Customers: Principal versus Agent Considerations; in April 2016, ASU 2016-10, Revenue from Contracts with Customers: Identifying Performance Obligations and Licensing; in May 2016, ASU 2016-12, Revenue from Contracts with Customers: Narrow Scope Improvements and Practical Expedients; and in December 2016, ASU 2016-20, Technical Corrections and Improvements to Revenue from Contracts with Customers. We have begun the process of evaluating our standard product sales arrangements and we have not yet identified any expected material impact on the timing and measurement of revenue for these arrangements from the adoption of this standard; however, we have not yet formalized our final conclusions from this review process. We are still evaluating the impact of adoption on non-product sale arrangements, which represent less than five percent of revenue. We have also developed a comprehensive project plan to guide implementation of the new standard. We have not yet determined our method of adoption for the new accounting standard.
In February 2016, the FASB issued ASU No. 2016-02, Leases. The standard requires that a lessee recognize the assets and liabilities that arise from operating leases. A lessee should recognize in its balance sheet a liability to make lease payments (the lease liability) and a right-of-use asset representing its right to use the underlying asset for the lease term. For leases with a term of 12 months or less, a lessee is permitted to make an accounting policy election by class of underlying asset not to recognize lease assets and lease liabilities. In transition, lessees and lessors are required to recognize and measure leases at the beginning of the earliest period presented using a modified retrospective approach. The guidance in ASU 2016-02 is effective for annual and interim reporting periods beginning after December 15, 2018. Our initial evaluation of our current leases does not indicate that the adoption of this standard will have a material impact on our consolidated statements of operations. We expect that the adoption of the standard will have a material impact on our consolidated balance sheets for the recognition of certain operating leases as right-of-use assets and lease liabilities.
44
In March 2016, the FASB issued ASU No. 2016-09, Improvements to Employee Share-Based Payment Accounting which changes the accounting for employee share-based payments, including the accounting for income taxes, forfeitures, and statutory tax withholding requirements, as well as classification in the Statements of Cash Flows. Under the new guidance, excess tax benefits associated with share-based payment awards will be recognized in the income statement when the awards vest or settle, rather than in stockholders’ equity. In addition, it will increase the number of shares an employer can withhold to cover income taxes on share-based payment awards and still qualify for the exemption to liability classification. The guidance will be effective for us in the first quarter of fiscal 2017. We expect that the adoption of this standard will result in the recognition of approximately $10.0 million of deferred tax assets related to stock-based compensation and a corresponding increase in our valuation allowance, which will be disclosed in our notes to consolidated financial statements. We do not expect that the adoption of this standard will have a material effect on our consolidated financial statements.
In August, 2016, the FASB issued ASU No. 2016-15, Classification of Certain Cash Receipts and Cash Payments, which provides guidance on the presentation and classification in the statement of cash flows for eight specific cash flow issues. The guidance will be effective for us in the first quarter of fiscal 2018. Early adoption is permitted in any annual or interim period. We have not identified any of the eight specific cash flow issues within our consolidated financial statements, therefore we do not expect the adoption of this standard to have a material effect on our consolidated statements of cash flows.
In November 2016, the FASB issued ASU 2016-18, Statement of Cash Flows - Restricted Cash, which requires entities to show the changes in the total of cash, cash equivalents, restricted cash and restricted cash equivalents in the statement of cash flow. The guidance will be effective for us in the first quarter of fiscal 2018. Early adoption is permitted, including adoption in an interim period, but any adjustments must be reflected as of the beginning of the fiscal year that includes that interim period. The new standard must be adopted retrospectively. We early adopted this standard in the fourth quarter of 2016 resulting in the reclassification of restricted cash in the presentation of our consolidated statements of cash flows.
In January 2017, the FASB issued ASU 2017 No. 2017-04, Intangibles - Goodwill and Other, which eliminates step two from the annual goodwill impairment test. The standard is effective for us in the first quarter of 2020, with early adoption permitted as of January 1, 2017, and is to be applied on a prospective basis. The adoption of the standard will not materially impact our consolidated financial statements unless step one of the annual goodwill impairment test fails. We are currently evaluating the timing of our planned adoption of this standard.
Off Balance Sheet Arrangements
None.
Item 7A. | Quantitative and Qualitative Disclosures about Market Risk |
We face exposure to financial market risks, including adverse movements in foreign currency exchange rates and changes in interest rates. These exposures may change over time and could have a material adverse impact on our financial results. We have not entered into or invested in any instruments that are subject to market risk, except as follows:
Foreign Currency Risk
Our primary foreign currency exposure is related to our subsidiary in Switzerland. Maxwell SA has Euro and local currency (Swiss Franc) revenue and operating expenses, as well as local currency loans. Changes in these currency exchange rates impact the reported amount (U.S. dollar) of revenue, expenses and debt.
As of December 31, 2016, the impact of a theoretical detrimental change in foreign currency exchange rates of 10% would result in a hypothetical loss of $0.1 million. For local currency debt carried by our Swiss subsidiary, the impact of a hypothetical 10% detrimental change in foreign currency exchange rates would result in a hypothetical loss of $8,000, which would be recorded in accumulated other comprehensive income on the consolidated balance sheet.
Interest Rate Risk
At December 31, 2016, we had approximately $83,000 in debt, $43,000 of which is classified as long-term debt. Debt outstanding is related to vehicle financing agreements and due to the minimal amounts outstanding any changes in interest rates would not significantly impact our financial results.
45
Fair Value Risk
We have a net pension asset of $8.9 million at December 31, 2016, including plan assets of $39.1 million, which are recorded at fair value. The plan assets consist of 52% debt and equity securities, 43% real estate investment funds and 5% cash and cash equivalents. The fair value measurement of real estate investment funds is subject to the real estate market forces in Switzerland. The fair value of debt and equity securities is determined based on quoted prices in active markets for identical assets and is subject to interest rate risk. We manage our risk by having a diversified portfolio. See Note 13 to the consolidated financial statements for further discussion on the pension assets.
46
Item 8. | Financial Statements and Supplementary Data |
Our consolidated financial statements and notes thereto appear on pages 49 to 80 of this Annual Report on Form 10-K.
MAXWELL TECHNOLOGIES, INC.
INDEX TO CONSOLIDATED FINANCIAL STATEMENTS
Page | |
Financial Statement Schedule: | |
47
REPORT OF INDEPENDENT REGISTERED PUBLIC ACCOUNTING FIRM
To the Board of Directors and Stockholders
Maxwell Technologies, Inc.
San Diego, California
We have audited the accompanying consolidated balance sheets of Maxwell Technologies, Inc. as of December 31, 2016 and 2015 and the related consolidated statements of operations, comprehensive loss, stockholders’ equity, and cash flows for each of the three years in the period ended December 31, 2016. In connection with our audits of the financial statements, we have also audited the financial statement schedule listed in the accompanying index. These financial statements and schedule are the responsibility of the Company’s management. Our responsibility is to express an opinion on these financial statements and schedule based on our audits.
We conducted our audits in accordance with the standards of the Public Company Accounting Oversight Board (United States). Those standards require that we plan and perform the audit to obtain reasonable assurance about whether the financial statements are free of material misstatement. An audit includes examining, on a test basis, evidence supporting the amounts and disclosures in the financial statements, assessing the accounting principles used and significant estimates made by management, as well as evaluating the overall presentation of the financial statements and schedule. We believe that our audits provide a reasonable basis for our opinion.
In our opinion, the consolidated financial statements referred to above present fairly, in all material respects, the financial position of Maxwell Technologies, Inc. as of December 31, 2016 and 2015, and the results of its operations and its cash flows for each of the three years in the period ended December 31, 2016, in conformity with accounting principles generally accepted in the United States of America.
Also, in our opinion, the related financial statement schedule, when considered in relation to the basic consolidated financial statements taken as a whole, presents fairly in all material respects the information set forth therein.
We also have audited, in accordance with the standards of the Public Company Accounting Oversight Board (United States), Maxwell Technologies, Inc.’s internal control over financial reporting as of December 31, 2016, based on criteria established in Internal Control—Integrated Framework (2013) issued by the Committee of Sponsoring Organizations of the Treadway Commission (COSO), and our report dated March 1, 2017 expressed an unqualified opinion thereon.
/s/ BDO USA, LLP
San Diego, California
March 1, 2017
48
MAXWELL TECHNOLOGIES, INC.
CONSOLIDATED BALANCE SHEETS
(in thousands, except per share data)
December 31, | ||||||||
2016 | 2015 | |||||||
ASSETS | ||||||||
Current assets: | ||||||||
Cash and cash equivalents | $ | 25,359 | $ | 24,382 | ||||
Restricted cash | — | 400 | ||||||
Trade and other accounts receivable, net of allowance for doubtful accounts of $26 and $252, at December 31, 2016 and December 31, 2015, respectively | 20,441 | 43,172 | ||||||
Inventories, net | 32,248 | 39,055 | ||||||
Prepaid expenses and other current assets | 4,407 | 2,593 | ||||||
Total current assets | 82,455 | 109,602 | ||||||
Property and equipment, net | 26,120 | 32,324 | ||||||
Goodwill | 22,799 | 23,635 | ||||||
Pension asset | 8,887 | 5,849 | ||||||
Other non-current assets | 613 | 603 | ||||||
Total assets | $ | 140,874 | $ | 172,013 | ||||
LIABILITIES AND STOCKHOLDERS’ EQUITY | ||||||||
Current liabilities: | ||||||||
Accounts payable and accrued liabilities | $ | 19,181 | $ | 33,985 | ||||
Accrued employee compensation | 6,152 | 6,672 | ||||||
Deferred revenue and customer deposits | 3,967 | 3,066 | ||||||
Short-term borrowings and current portion of long-term debt | 40 | 42 | ||||||
Total current liabilities | 29,340 | 43,765 | ||||||
Deferred tax liability, long-term | 8,580 | 6,076 | ||||||
Long-term debt, excluding current portion | 43 | 49 | ||||||
Other long-term liabilities | 2,089 | 2,947 | ||||||
Total liabilities | 40,052 | 52,837 | ||||||
Commitments and contingencies (Note 12 and Note 14) | ||||||||
Stockholders’ equity: | ||||||||
Common stock, $0.10 par value per share, 80,000 and 40,000 shares authorized at December 31, 2016 and December 31, 2015, respectively; 32,135 and 31,782 shares issued and outstanding at December 31, 2016 and December 31, 2015, respectively | 3,210 | 3,176 | ||||||
Additional paid-in capital | 296,316 | 291,505 | ||||||
Accumulated deficit | (204,104 | ) | (180,399 | ) | ||||
Accumulated other comprehensive income | 5,400 | 4,894 | ||||||
Total stockholders’ equity | 100,822 | 119,176 | ||||||
Total liabilities and stockholders’ equity | $ | 140,874 | $ | 172,013 | ||||
The accompanying notes are an integral part of these consolidated financial statements.
49
MAXWELL TECHNOLOGIES, INC.
CONSOLIDATED STATEMENTS OF OPERATIONS
(in thousands, except per share data)
Years Ended December 31, | ||||||||||||
2016 | 2015 | 2014 | ||||||||||
Revenue | $ | 121,244 | $ | 167,372 | $ | 186,586 | ||||||
Cost of revenue | 88,274 | 116,410 | 118,143 | |||||||||
Gross profit | 32,970 | 50,962 | 68,443 | |||||||||
Operating expenses: | ||||||||||||
Selling, general and administrative | 36,281 | 40,758 | 43,022 | |||||||||
Research and development | 20,889 | 24,697 | 26,320 | |||||||||
Restructuring and exit costs | 297 | 2,512 | — | |||||||||
Impairment of assets | 1,389 | — | — | |||||||||
Total operating expenses | 58,856 | 67,967 | 69,342 | |||||||||
Loss from operations | (25,886 | ) | (17,005 | ) | (899 | ) | ||||||
Gain on sale of product line | (6,657 | ) | — | — | ||||||||
Interest expense, net | 248 | 284 | 189 | |||||||||
Other income | (133 | ) | — | — | ||||||||
Foreign currency exchange loss, net | 216 | 441 | 838 | |||||||||
Loss before income taxes | (19,560 | ) | (17,730 | ) | (1,926 | ) | ||||||
Income tax provision | 4,145 | 4,603 | 4,346 | |||||||||
Net loss | $ | (23,705 | ) | $ | (22,333 | ) | $ | (6,272 | ) | |||
Net loss per share: | ||||||||||||
Basic and diluted | $ | (0.74 | ) | $ | (0.73 | ) | $ | (0.21 | ) | |||
Weighted average common shares outstanding: | ||||||||||||
Basic and diluted | 31,870 | 30,716 | 29,216 | |||||||||
The accompanying notes are an integral part of these consolidated financial statements.
50
MAXWELL TECHNOLOGIES, INC.
CONSOLIDATED STATEMENTS OF COMPREHENSIVE LOSS
(in thousands)
Years Ended December 31, | ||||||||||||
2016 | 2015 | 2014 | ||||||||||
Net loss | $ | (23,705 | ) | $ | (22,333 | ) | $ | (6,272 | ) | |||
Other comprehensive income (loss), net of tax: | ||||||||||||
Foreign currency translation adjustment | (2,107 | ) | 1,574 | (10,445 | ) | |||||||
Defined benefit pension plan, net of tax: | ||||||||||||
Actuarial gain (loss) on benefit obligation and plan assets, net of tax provision of $603 and tax benefit of $531 and $922 for the years ended December 31, 2016, 2015 and 2014, respectively | 2,298 | (1,862 | ) | (2,358 | ) | |||||||
Amortization of deferred loss, net of tax provision of $48 and $10 for the years ended December 31, 2016 and 2015, respectively | 195 | 35 | — | |||||||||
Amortization of prior service cost, net of tax provision of $30, $30 and $39 for the years ended December 31, 2016, 2015 and 2014, respectively | 120 | 106 | 101 | |||||||||
Settlements and plan changes, net of tax provision of $91 and $118 for the years ended December 31, 2015 and 2014, respectively. | — | 318 | 302 | |||||||||
Other comprehensive income (loss), net of tax | 506 | 171 | (12,400 | ) | ||||||||
Comprehensive loss | $ | (23,199 | ) | $ | (22,162 | ) | $ | (18,672 | ) | |||
The accompanying notes are an integral part of these consolidated financial statements.
51
MAXWELL TECHNOLOGIES, INC.
CONSOLIDATED STATEMENTS OF STOCKHOLDERS’ EQUITY
(in thousands)
Shares | Amount | Additional Paid-in Capital | Accumulated Deficit | Accumulated Other Comprehensive Income | Total Stockholders’ Equity | ||||||||||||||||||
Balance at December 31, 2013 | 29,563 | $ | 2,953 | $ | 271,928 | $ | (151,794 | ) | $ | 17,123 | $ | 140,210 | |||||||||||
Common stock issued under employee benefit plans | 175 | 18 | 1,432 | — | — | 1,450 | |||||||||||||||||
Share-based compensation | 312 | 31 | 3,933 | — | — | 3,964 | |||||||||||||||||
Repurchase and cancellation of restricted shares | (204 | ) | (20 | ) | 21 | — | — | 1 | |||||||||||||||
Net loss | — | — | — | (6,272 | ) | — | (6,272 | ) | |||||||||||||||
Foreign currency translation adjustments | — | — | — | — | (10,445 | ) | (10,445 | ) | |||||||||||||||
Pension adjustment, net of tax benefit of $765 | — | — | — | — | (1,955 | ) | (1,955 | ) | |||||||||||||||
Balance at December 31, 2014 | 29,846 | 2,982 | 277,314 | (158,066 | ) | 4,723 | 126,953 | ||||||||||||||||
Common stock issued under employee benefit plans | 142 | 14 | 861 | — | — | 875 | |||||||||||||||||
Share-based compensation | 80 | 8 | 3,938 | — | — | 3,946 | |||||||||||||||||
Proceeds from issuance of common stock, net | 1,831 | 183 | 9,381 | — | — | 9,564 | |||||||||||||||||
Cancellation of restricted shares | (117 | ) | (11 | ) | 11 | — | — | — | |||||||||||||||
Net loss | — | — | — | (22,333 | ) | — | (22,333 | ) | |||||||||||||||
Foreign currency translation adjustments | — | — | — | — | 1,574 | 1,574 | |||||||||||||||||
Pension adjustment, net of tax benefit of $400 | — | — | — | — | (1,403 | ) | (1,403 | ) | |||||||||||||||
Balance at December 31, 2015 | 31,782 | 3,176 | 291,505 | (180,399 | ) | 4,894 | 119,176 | ||||||||||||||||
Common stock issued under employee benefit plans | 180 | 18 | 823 | — | — | 841 | |||||||||||||||||
Share-based compensation | 225 | 21 | 3,983 | — | — | 4,004 | |||||||||||||||||
Cancellation of restricted shares | (52 | ) | (5 | ) | 5 | — | — | — | |||||||||||||||
Net loss | — | — | — | (23,705 | ) | — | (23,705 | ) | |||||||||||||||
Foreign currency translation adjustments | — | — | — | — | (2,107 | ) | (2,107 | ) | |||||||||||||||
Pension adjustment, net of tax provision of $681 | — | — | — | — | 2,613 | 2,613 | |||||||||||||||||
Balance at December 31, 2016 | 32,135 | $ | 3,210 | $ | 296,316 | $ | (204,104 | ) | $ | 5,400 | $ | 100,822 | |||||||||||
The accompanying notes are an integral part of these consolidated financial statements.
52
MAXWELL TECHNOLOGIES, INC.
CONSOLIDATED STATEMENTS OF CASH FLOWS (in thousands)
Years Ended December 31, | ||||||||||||
2016 | 2015 | 2014 | ||||||||||
Operating activities: | ||||||||||||
Net loss | $ | (23,705 | ) | $ | (22,333 | ) | $ | (6,272 | ) | |||
Adjustments to reconcile net loss to net cash from operating activities: | ||||||||||||
Depreciation | 9,871 | 11,385 | 11,159 | |||||||||
Amortization of intangible assets | — | 166 | 203 | |||||||||
Loss on lease due to restructuring | 87 | 1,043 | — | |||||||||
Pension cost | 635 | 412 | 319 | |||||||||
Stock-based compensation expense | 5,364 | 3,946 | 3,967 | |||||||||
Gain on sale of property and equipment | (131 | ) | — | — | ||||||||
Impairment of property and equipment | 1,389 | — | — | |||||||||
Gain on sale of product line | (6,657 | ) | — | — | ||||||||
Unrealized loss (gain) on foreign currency exchange rates | 63 | 1,631 | (2,126 | ) | ||||||||
Release of tax valuation allowance | — | (170 | ) | — | ||||||||
Release of tax liability | (1,518 | ) | — | — | ||||||||
Provision for (release of) allowance on accounts receivable | (106 | ) | 281 | 20 | ||||||||
Provision for losses on inventory | 397 | 541 | 910 | |||||||||
Provision for warranties | 383 | 1,327 | 717 | |||||||||
Changes in operating assets and liabilities: | ||||||||||||
Trade and other accounts receivable | 20,085 | 315 | (15,100 | ) | ||||||||
Inventories | (4,956 | ) | 5,251 | (1,520 | ) | |||||||
Prepaid expenses and other assets | (372 | ) | (35 | ) | (79 | ) | ||||||
Pension asset | (584 | ) | (650 | ) | (724 | ) | ||||||
Accounts payable and accrued liabilities | (14,884 | ) | 5,031 | 144 | ||||||||
Deferred revenue and customer deposits | 630 | 2,362 | 46 | |||||||||
Accrued employee compensation | (1,478 | ) | (2,670 | ) | 651 | |||||||
Deferred tax liability | 1,957 | 2,017 | 2,250 | |||||||||
Other long-term liabilities | (827 | ) | (470 | ) | (728 | ) | ||||||
Net cash provided by (used in) operating activities | (14,357 | ) | 9,380 | (6,163 | ) | |||||||
Investing activities: | ||||||||||||
Purchases of property and equipment | (5,956 | ) | (4,143 | ) | (6,975 | ) | ||||||
Proceeds from sale of property and equipment | 133 | — | — | |||||||||
Proceeds from sale of product line | 20,486 | — | — | |||||||||
Net cash provided by (used in) investing activities | 14,663 | (4,143 | ) | (6,975 | ) | |||||||
Financing activities: | ||||||||||||
Principal payments on long-term debt and short-term borrowings | (45 | ) | (18,845 | ) | (7,164 | ) | ||||||
Proceeds from long-term debt and short-term borrowings | — | 3,040 | 15,279 | |||||||||
Proceeds from sale of common stock, net of offering costs | — | 9,564 | — | |||||||||
Proceeds from issuance of common stock under equity compensation plans | 841 | 875 | 1,448 | |||||||||
Net cash provided by (used in) financing activities | 796 | (5,366 | ) | 9,563 | ||||||||
Effect of exchange rate changes on cash, cash equivalents and restricted cash | (525 | ) | 179 | (2,340 | ) | |||||||
Increase (decrease) in cash, cash equivalents and restricted cash | 577 | 50 | (5,915 | ) | ||||||||
Cash, cash equivalents and restricted cash, beginning of period | 24,782 | 24,732 | 30,647 | |||||||||
Cash, cash equivalents and restricted cash at end of year | $ | 25,359 | $ | 24,782 | $ | 24,732 | ||||||
Cash paid for: | ||||||||||||
Interest | $ | 75 | $ | 245 | $ | 223 | ||||||
Income taxes | $ | 2,551 | $ | 3,475 | $ | 3,304 | ||||||
Supplemental schedule of noncash investing and financing activities: | ||||||||||||
Purchases of property and equipment included in accounts payable and accrued liabilities | $ | 181 | $ | 345 | $ | 889 | ||||||
Amounts in escrow related to sale of product line | $ | 1,500 | $ | — | $ | — | ||||||
The accompanying notes are an integral part of these consolidated financial statements.
53
MAXWELL TECHNOLOGIES, INC.
NOTES TO CONSOLIDATED FINANCIAL STATEMENTS
Unless the context otherwise requires, all references to “Maxwell,” the “Company,” “we,” “us,” and “our” refer to Maxwell Technologies, Inc. and its subsidiaries, and all references to “Maxwell SA” refer to our Swiss subsidiary, Maxwell Technologies, SA.
Note 1—Description of Business and Summary of Significant Accounting Policies
Description of Business
Maxwell Technologies, Inc. is a Delaware corporation originally incorporated in 1965 under the name Maxwell Laboratories, Inc. In 1983, the Company completed an initial public offering, and in 1996, changed its name to Maxwell Technologies, Inc. The Company is headquartered in San Diego, California, and has two manufacturing facilities located in Rossens, Switzerland and Peoria, Arizona. In April 2016, the Company exited its manufacturing facility in San Diego, California. In addition, the Company has two contract manufacturers located in China. Maxwell operates as one operating segment, which is comprised of two product lines:
• | Ultracapacitors: Ultracapacitors are energy storage devices that possess a unique combination of high power density, extremely long operational life and the ability to charge and discharge very rapidly. The Company’s ultracapacitor cells, multi-cell packs and modules provide highly reliable energy storage and power delivery solutions for applications in multiple industries, including automotive, bus, rail and truck in transportation and grid energy storage, and wind in renewable energy. The Company has been focusing on developing complementary lithium-ion capacitors which are cost efficient energy storage devices with the power characteristics of an ultracapacitor combined with enhanced energy storage capacity. They are uniquely designed to address a variety of applications in the rail, grid, and industrial markets where energy density and weight are differentiating factors. |
• | High-Voltage Capacitors: The Company’s CONDIS® high-voltage capacitors are designed and manufactured to perform reliably for decades in all climates. These products include grading and coupling capacitors and capacitive voltage dividers that are used to ensure the safety and reliability of electric utility infrastructure and other applications involving transport, distribution and measurement of high-voltage electrical energy. |
In April 2016, the Company sold substantially all of the assets and liabilities of a third product line, radiation-hardened microelectronics. The Company’s radiation-hardened microelectronic products for satellites and spacecraft included single board computers and components, such as high-density memory and power modules.
The Company’s products are designed and manufactured to perform reliably for the life of the products and systems into which they are integrated. The Company achieves high reliability through the application of proprietary technologies and rigorously controlled design, development, manufacturing and test processes.
Financial Statement Presentation
The accompanying consolidated financial statements include the accounts of Maxwell Technologies, Inc. and its subsidiaries and have been prepared in accordance with accounting principles generally accepted in the United States (“U.S. GAAP”). All intercompany transactions and account balances have been eliminated in consolidation.
Liquidity
As of December 31, 2016, the Company had approximately $25.4 million in cash and cash equivalents, and working capital of $53.1 million. In July 2015, the Company entered into a loan agreement with East West Bank (“EWB”), whereby EWB made available to the Company a secured credit facility in the form of a revolving line of credit which is available up to a maximum of the lesser of: (a) $25.0 million; or (b) a certain percentage of domestic and foreign trade receivables. As of December 31, 2016, no amounts have been borrowed under this revolving line of credit and the amount available was $11.4 million. Management believes the available cash balance, along with the available borrowings under the revolving line of credit, will be sufficient to fund operations, obligations as they become due, and capital investments for at least the next twelve months.
54
Reclassifications
“Amortization of prepaid debt costs” for the years ended December 31, 2015 and 2014 has been reclassified to “interest expense, net” and “changes in operating assets and liabilities,” in the consolidated statements of operations and consolidated statements of cash flows, respectively, to conform to the current period presentation. In accordance with the Company’s early adoption of ASU No. 2016-18, changes in restricted cash for the years ended December 2016 and 2015 have been reclassified in the consolidated statements of cash flows and restricted cash balances have been included with beginning and ending cash and cash equivalent balances in the consolidated statements of cash flows. These reclassifications do not impact reported net loss and do not otherwise have a material impact on the presentation of the overall financial statements.
Use of Estimates
The preparation of financial statements in conformity with U.S. GAAP requires management to make estimates and assumptions that affect reported amounts and related disclosures. These estimates include, but are not limited to, assessing the collectability of accounts receivable, applied and unapplied production costs, production capacities, the usage and recoverability of inventories and long-lived assets, deferred income taxes, the incurrence of warranty obligations, impairment of goodwill, estimation of the cost to complete certain projects, estimation of pension assets and liabilities, accruals for estimated losses for legal matters, and estimation of the value of stock-based compensation awards, including the probability that the performance criteria of restricted stock units awards will be met.
Revenue Recognition
Revenue is derived primarily from the sale of manufactured products directly to customers. Product revenue is recognized, according to the guidelines of the Securities and Exchange Commission (“SEC”) Staff Accounting Bulletin (“SAB”) Numbers 101, Revenue Recognition in Financial Statements, and 104, Revenue Recognition, when all of the following criteria are met: (1) persuasive evidence of an arrangement exists (upon contract signing or receipt of an authorized purchase order from a customer); (2) title passes to the customer at either shipment from the Company’s facilities or receipt at the customer facility, depending on shipping terms; (3) customer payment is deemed fixed or determinable and free of contingencies or significant uncertainties; and (4) collectability is reasonably assured. This policy has been consistently applied from period to period.
A portion of our sales revenue is derived from sales to distributors. Distributor revenue is recognized when all of the criteria for revenue recognition are met, which is generally the time of shipment to the distributor; all returns and credits are estimable and not significant.
Revenue from production-type contracts, which represent less than five percent of total revenue, is recognized using the percentage of completion method. The degree of completion is determined based on costs incurred as a percentage of total costs anticipated, excluding costs that are not representative of progress to completion.
Total deferred revenue and customer deposits in the consolidated balance sheets as of December 31, 2016 and 2015 was $4.0 million and $3.1 million, respectively, and primarily relates to cash received from a customer in connection with a production-type contract, for which revenue is recognized using the percentage of completion method, and payments received under a joint development agreement, which are recognized as an offset to research and development expense as services are performed.
Cash and Cash Equivalents
Cash and cash equivalents consist primarily of cash in readily available checking accounts. Cash equivalents consist of highly liquid investments that are readily convertible to cash and that mature within three months or less from the date of purchase. The carrying amounts approximate fair value due to the short maturities of these instruments.
Accounts Receivable and Allowance for Doubtful Accounts
Trade receivables are stated at gross invoiced amount less an allowance for uncollectible accounts. The allowance for doubtful accounts reflects management’s best estimate of probable losses inherent in the accounts receivable balance. Management determines the allowance for doubtful accounts based on known troubled accounts, historical experience and other currently available evidence.
55
Inventories, net
Inventories are stated at the lower of cost (first-in first-out basis) or market. Finished goods and work-in-process inventory values include the cost of raw materials, labor and manufacturing overhead. Inventory when written down to market value establishes a new cost basis and its value is not subsequently increased based upon changes in underlying facts and circumstances. The Company also makes adjustments to reduce the carrying amount of inventories for estimated excess or obsolete inventories. Factors influencing these adjustments include inventories on-hand compared with historical and estimated future sales for existing and new products and assumptions about the likelihood of obsolescence. Unabsorbed manufacturing costs are treated as expense in the period incurred.
Property and Equipment
Property and equipment are carried at cost and are depreciated using the straight-line method. Depreciation is provided over the estimated useful lives of the related assets (three to ten years). Leasehold improvements are depreciated over the shorter of their estimated useful life or the term of the lease. Leasehold improvements funded by landlords are recorded as property and equipment, which is depreciated over the shorter of the estimated useful life of the asset or the lease term, and deferred rent, which is amortized over the lease term. As of December 31, 2016 and 2015, the net book value of leasehold improvements funded by landlords was $1.7 million and $2.2 million, respectively. As of December 31, 2016 and 2015, the unamortized balance of deferred rent related to landlord funding of leasehold improvements was $1.7 million and $2.2 million, respectively, which is included in “accounts payable and accrued liabilities” and “other long-term liabilities” in the consolidated balance sheets.
Goodwill
Goodwill, which represents the excess of the cost of an acquired business over the net fair value assigned to its assets and liabilities, is not amortized. Instead, goodwill is assessed annually at the reporting unit level for impairment under the Intangibles—Goodwill and Other Topic of the FASB ASC. The Company has established December 31 as the annual impairment test date. In addition, the Company assesses goodwill in between annual test dates if an event occurs or circumstances change that could more likely than not reduce the fair value of a reporting unit below its carrying value. The Company first makes a qualitative assessment as to whether goodwill is impaired. If it is more likely than not that goodwill is impaired, the Company performs a two-step quantitative impairment analysis to determine if goodwill is impaired. The Company may also determine to skip the qualitative assessment in any year and move directly to the quantitative test.
During the year ended December 31, 2016, the Company performed a quantitative step one goodwill impairment analysis for one reporting unit, which required the Company to make significant assumptions and estimates about the extent and timing of future cash flows, discount rates and growth rates. The step one analysis indicated that the goodwill assigned to the reporting unit was not impaired and no further quantitative testing was performed. No impairments of goodwill were reported during the years ended December 31, 2016, 2015 and 2014. Also see Note 3, Goodwill, for further discussion of the Company’s goodwill impairment analysis.
Impairment of Long-Lived Assets
Property and equipment are reviewed for impairment whenever events or changes in circumstances indicate the carrying value of the assets may not be recoverable. If the Company determines that the carrying value of the asset is not recoverable, a permanent impairment charge is recorded for the amount by which the carrying value of the long-lived asset exceeds its fair value. During the year ended December 31, 2016, the Company recorded impairment charges of $1.4 million related to property and equipment. In the fourth quarter of 2016, the Company recorded $1.2 million of impairment charges related to machinery which was no longer forecasted to be utilized during its remaining useful life based on the current production forecast and for which the fair value approximated zero. Additionally, during the third quarter of 2016, $0.2 million of impairment charges were recorded related to the cancellation of a project. No impairments of property and equipment were recorded during the years ended December 31 2015 and 2014.
Warranty Obligation
The Company provides warranties on all product sales. The majority of the Company’s warranties are for one to eight years in the normal course of business. The Company accrues for the estimated warranty costs at the time of sale based on historical warranty experience plus any known or expected changes in warranty exposure. As of December 31, 2016 and 2015, the accrued warranty liability included in “accounts payable and accrued liabilities” in the consolidated balance sheets was $1.2 million and $1.3 million, respectively.
56
Income Taxes
Deferred income taxes are provided on a liability method in accordance with the Income Taxes Topic of the FASB ASC, whereby deferred tax assets are recognized for deductible temporary differences and deferred tax liabilities are recognized for taxable temporary differences. Under this method, deferred income taxes are recorded to reflect the tax consequences on future years of temporary differences between the tax basis of assets and liabilities and their reported amounts at each period end. If it is more likely than not that some portion or all of a deferred tax asset will not be realized, a valuation allowance is recognized. The guidance also provides criteria for the recognition, measurement, presentation and disclosures of uncertain tax positions. A tax benefit from an uncertain tax position may be recognized if it is “more likely than not” that the position is sustainable based solely on its technical merits.
Concentration of Credit Risk
The Company maintains cash balances at various financial institutions primarily in California and in Switzerland. In California, cash balances commonly exceed the $250,000 Federal Deposit Insurance Corporation insurance limit. In Switzerland, the banks where the Company has cash deposits are either government-owned, or in the case of cash deposited with non-government banks, deposits are insured up to 100,000 Swiss Francs. The Company has not experienced any losses in such accounts and management believes that the Company is not exposed to any significant credit risk with respect to such cash and cash equivalents.
Financial instruments, which subject the Company to potential concentrations of credit risk, consist principally of the Company’s accounts receivable. The Company’s accounts receivable result from product sales to customers in various industries and in various geographical areas, both domestic and foreign. The Company performs credit evaluations of its customers and generally requires no collateral. No customers accounted for 10% or more of total revenue during the year ended December 31, 2016 or 10% or more of total accounts receivable at December 31, 2016. One customer, Shenzhen Xinlikang Supply China Management Co. LTD., accounted for 19% and 20% of total revenue in 2015 and 2014, respectively, and accounted for 33% of total accounts receivable as of December 31, and 2015.
Research and Development Expense
Research and development expenditures are expensed in the period incurred. Third-party funding of research and development expense under cost-sharing arrangements is recorded as an offset to research and development expense in the period the expenses are incurred. Research and development expense was $20.9 million, $24.7 million and $26.3 million, net of third-party funding under cost-sharing arrangements of $1.2 million, $1.3 million and $1.0 million, for the years ended December 31, 2016, 2015 and 2014, respectively.
During 2016, the Company entered into a joint development agreement under which it will receive cash consideration of up to $2.8 million to fund the short-term costs of developing technologies for the automotive market. During the year ended December 31, 2016, the Company received $2.0 million of cash related to the joint development agreement and recognized $0.6 million as an offset to research and development expense, which is included in total third party funding of $1.2 million. The remaining $1.4 million is recorded in “deferred revenue and customer deposits” in the Company’s consolidated balance sheets and is expected to be recognized in 2017 based on performance under the agreement. The potential additional funding of $0.8 million under the agreement is contingent on the achievement of a milestone, for which the probability of achievement is uncertain as of December 31, 2016.
Shipping and Handling Expense
The Company recognizes shipping and handling expenses as a component of cost of revenue.
Advertising Expense
Advertising costs are expensed in the period incurred. Advertising expense was $0.7 million, $1.1 million and $1.4 million for the years ended December 31, 2016, 2015 and 2014, respectively.
57
Foreign Currencies
The Company’s primary foreign currency exposure is related to its subsidiary in Switzerland, which has Euro and local currency (Swiss Franc) revenue and operating expenses, and local currency loans. Changes in these currency exchange rates impact the reported U.S. dollar amount of revenue, expenses and debt. The functional currency of the Swiss subsidiary is the Swiss Franc. Assets and liabilities of the Swiss subsidiary are translated at month-end exchange rates, and revenue, expenses, gains and losses are translated at rates of exchange that approximate the rate in effect at the time of the transaction. Any translation adjustments resulting from this process are presented separately as a component of accumulated other comprehensive income within stockholders’ equity in the consolidated balance sheets. Foreign currency transaction gains and losses on intercompany balances considered long term in nature are accounted for as translation adjustments within equity. All other foreign currency transaction gains and losses are reported in “foreign currency exchange loss, net” in the consolidated statements of operations.
Foreign Currency Derivative Instruments
The Company has historically used forward contracts to hedge certain monetary assets and liabilities, primarily receivables, payables, and cash balances, denominated in foreign currencies. The Company’s objective was to partially offset gains or losses resulting from these exposures with opposing gains or losses on the forward contracts, thereby reducing volatility of earnings created by these foreign currency exposures. During the year ended December 31, 2016, the Company ceased using foreign currency forward contracts to hedge foreign currency transaction exposure as management determined its foreign currency transaction exposure is no longer significant. In accordance with the Derivatives and Hedging Topic of the FASB ASC, the fair values of the forward contracts were estimated at each period end based on quoted market prices and were recorded as a net asset or liability on the consolidated balance sheets. These contracts were considered economic hedges but were not designated as hedges under the Derivatives and Hedging Topic of the FASB ASC, therefore, the change in the fair value of the instruments was recognized in the consolidated statements of operations and was recorded in “foreign currency exchange loss, net” in the consolidated statements of operations.
Net Income (Loss) per Share
In accordance with the Earnings Per Share Topic of the FASB ASC, basic net income (loss) per share is calculated using the weighted average number of common shares outstanding during the period. Diluted net income per share includes the impact of additional common shares that would have been outstanding if dilutive potential common shares were issued. Potentially dilutive securities are not considered in the calculation of diluted net loss per share, as their inclusion would be anti-dilutive. The following table sets forth the computation of basic and diluted net income (loss) per share (in thousands, except per share data):
Years Ended December 31, | ||||||||||||
2016 | 2015 | 2014 | ||||||||||
Numerator | ||||||||||||
Net loss | $ | (23,705 | ) | $ | (22,333 | ) | $ | (6,272 | ) | |||
Denominator | ||||||||||||
Weighted average common shares outstanding, basic and diluted | 31,870 | 30,716 | 29,216 | |||||||||
Net loss per share | ||||||||||||
Basic and diluted | $ | (0.74 | ) | $ | (0.73 | ) | $ | (0.21 | ) | |||
The following table summarizes instruments that may be convertible into common shares that are not included in the denominator used in the diluted net income (loss) per share calculation because to do so would be anti-dilutive (in thousands):
Common Stock | 2016 | 2015 | 2014 | ||||||
Outstanding options to purchase common stock | 414 | 931 | 672 | ||||||
Unvested restricted stock awards | 88 | 245 | 528 | ||||||
Unvested restricted stock unit awards | 1,748 | 885 | 224 | ||||||
Employee stock purchase plan awards | — | 10 | 9 | ||||||
Bonus to be paid in stock awards | 265 | — | — | ||||||
58
Stock-Based Compensation
The Company issues stock-based compensation awards to its employees and non-employee directors, including stock options, restricted stock, restricted stock units, and shares under an employee stock purchase plan. The Company records compensation expense for stock-based awards in accordance with the criteria set forth in the Stock Compensation Subtopic of the FASB ASC. The Company uses the Black-Scholes option pricing model to estimate the fair value of stock option grants. The determination of the fair value of stock options utilizing the Black-Scholes model is affected by the Company’s stock price and a number of assumptions, including expected volatility, expected term, risk-free interest rate and expected dividends.
The fair value of restricted stock awards (“RSAs”) and restricted stock unit awards (“RSUs”) with service-based or performance-based vesting is based on the closing market price of the Company’s common stock on the date of grant. Compensation expense equal to the fair value of each RSA or RSU is recognized ratably over the requisite service period. For RSUs with vesting contingent on Company performance conditions, the Company uses the requisite service period that is most likely to occur. The requisite service period is estimated based on the performance period as well as any time-based service requirements. If it is unlikely that a performance condition will be achieved, no compensation expense is recognized unless it is later determined that achievement of the performance condition is likely. Expense may be adjusted for changes in the expected outcomes of the related performance conditions, with the impact of such changes recognized as a cumulative adjustment in the consolidated statement of operations in the period in which the expectation changes.
In 2014 and 2016, the Company issued market-condition RSUs to certain members of executive management. Since the vesting of the market-condition RSUs is dependent on stock price performance, the fair values of these awards were estimated using a Monte-Carlo valuation model. The determination of the fair value of market-condition RSUs utilizing a Monte-Carlo valuation model was affected by the Company’s stock price and a number of assumptions, including expected volatility, expected life, risk-free interest rate and expected dividends.
In 2016, Company adopted a bonus plan that enabled participants to earn annual incentive bonuses based upon achievement of specified financial and strategic performance objectives. Under the terms of this plan, the Company has the ability to settle bonuses earned under the plan with fully vested RSUs. For the fiscal year 2016 performance period, the Company intends to settle the amounts earned under the bonus plan in fully vested RSUs in the first quarter of 2017. The stock-based compensation expense accrued under this bonus plan represents stock-settled debt per ASC 718 and ASC 480, as such, the Company has recorded a liability for bonuses expected to be paid in fully vested RSUs in “accrued employee compensation” in the Company’s consolidated balance sheets.
Stock-based compensation expense recognized in the consolidated statements of operations is based on equity awards ultimately expected to vest. The Company estimates forfeitures at the time of grant and revises forfeitures, if necessary, in subsequent periods with a cumulative catch up adjustment if actual forfeitures differ from those estimates. For market-condition awards, because the effect of the market-condition is reflected as an adjustment to the awards’ fair value at grant date, subsequent forfeitures due to the Company’s stock price performance do not result in a reversal of expense.
Recent Accounting Pronouncements
In May 2014, the Financial Accounting Standards Board (“FASB”) issued Accounting Standards Update (“ASU”) No. 2014-09, Revenue from Contracts with Customers. The standard provides companies with a single model for accounting for revenue arising from contracts with customers and supersedes current revenue recognition guidance, including industry-specific revenue guidance. The core principle of the model is to recognize revenue when control of the goods or services transfers to the customer, as opposed to recognizing revenue when the risks and rewards transfer to the customer under the existing revenue guidance. The guidance permits companies to either apply the requirements retrospectively to all prior periods presented, or apply the requirements in the year of adoption, through a cumulative adjustment. In August 2015, the FASB issued ASU 2015-14, Deferral of the Effective Date, which defers the required adoption date of ASU 2014-09 by one year. As a result of the deferred effective date, ASU 2014-09 will be effective for the Company in its first quarter of fiscal 2018. Early adoption is permitted but not before the original effective date of the new standard of the first quarter of fiscal 2017. The following ASUs were subsequently issued by the FASB to clarify the implementation guidance in some areas and add practical expedients: In March 2016, ASU 2016-08, Revenue from Contracts with Customers: Principal versus Agent Considerations; in April 2016, ASU 2016-10, Revenue from Contracts with Customers: Identifying Performance Obligations and Licensing; in May 2016, ASU 2016-12, Revenue from Contracts with Customers: Narrow Scope Improvements and Practical Expedients; and in December 2016, ASU 2016-20, Technical Corrections and Improvements to Revenue from Contracts with Customers. The Company’s has begun the process of evaluating its standard product sales arrangements and has not yet identified any expected material impact on the timing and measurement of revenue for these arrangements from the adoption of this standard; however, the Company has not yet formalized its final conclusions from this review process. The Company is still evaluating the impact of adoption on non-product sale arrangements, which represent less than five percent of revenue. The Company has also developed a comprehensive project plan to guide implementation of the new standard. The Company has not yet determined its method of adoption for the new accounting standard.
59
In February 2016, the FASB issued ASU No. 2016-02, Leases. The standard requires that a lessee recognize the assets and liabilities that arise from operating leases. A lessee should recognize in its balance sheet a liability to make lease payments (the lease liability) and a right-of-use asset representing its right to use the underlying asset for the lease term. For leases with a term of 12 months or less, a lessee is permitted to make an accounting policy election by class of underlying asset not to recognize lease assets and lease liabilities. In transition, lessees and lessors are required to recognize and measure leases at the beginning of the earliest period presented using a modified retrospective approach. The guidance in ASU 2016-02 is effective for annual and interim reporting periods beginning after December 15, 2018. The Company’s initial evaluation of its current leases does not indicate that the adoption of this standard will have a material impact on its consolidated statements of operations. The Company expects that the adoption of the standard will have a material impact on its consolidated balance sheets for the recognition of certain operating leases as right-of-use assets and lease liabilities.
In March 2016, the FASB issued ASU No. 2016-09, Improvements to Employee Share-Based Payment Accounting, which changes the accounting for employee share-based payments, including the accounting for income taxes, forfeitures, and statutory tax withholding requirements, as well as classification in the statement of cash flows. Under the new guidance, excess tax benefits associated with share-based payment awards will be recognized in the income statement when the awards vest or settle, rather than in stockholders’ equity. In addition, it will increase the number of shares an employer can withhold to cover income taxes on share-based payment awards and still qualify for the exemption to liability classification. The guidance will be effective for the Company in its first quarter of fiscal 2017. The Company expects that the adoption of this standard will result in the recognition of approximately $10.0 million of deferred tax assets related to stock-based compensation and a corresponding increase in the Company’s valuation allowance, which will be disclosed in the Company’s notes to consolidated financial statements. The Company does not expect that the adoption of this standard will have a material effect on its consolidated financial statements.
In August, 2016, the FASB issued ASU No. 2016-15, Classification of Certain Cash Receipts and Cash Payments, which provides guidance on the presentation and classification in the statement of cash flows for eight specific cash flow issues. The guidance will be effective for the Company in its first quarter of fiscal 2018. Early adoption is permitted in any annual or interim period. The Company has not identified any of the eight specific cash flow issues within its consolidated financial statements, therefore the Company does not expect that the adoption of this standard will have a material effect on its consolidated statements of cash flows.
In November 2016, the FASB issued ASU No. 2016-18, Statement of Cash Flows - Restricted Cash, which requires entities to show the changes in the total of cash, cash equivalents, restricted cash and restricted cash equivalents in the statement of cash flows. The guidance will be effective for the Company in its first quarter of fiscal 2018. Early adoption is permitted, including adoption in an interim period, but any adjustments must be reflected as of the beginning of the fiscal year that includes that interim period. The new standard must be adopted retrospectively. The Company early adopted this standard in the fourth quarter of 2016 resulting in the reclassification of restricted cash in the presentation of its consolidated statements of cash flows.
In January 2017, the FASB issued ASU 2017 No. 2017-04, Intangibles - Goodwill and Other, which eliminates step two from the annual goodwill impairment test. The standard is effective for the Company in the first quarter of 2020, with early adoption permitted as of January 1, 2017, and is to be applied on a prospective basis. The adoption of the standard will not materially impact the Company's consolidated financial statements unless step one of the annual goodwill impairment test fails. The Company is currently evaluating the timing of its planned adoption of this standard.
Business Enterprise Information
The Company operates as a single operating segment. According to the FASB ASC Topic Disclosures about Segments of an Enterprise and Related Information, operating segments are defined as components of an enterprise for which separate financial information is evaluated regularly by the chief operating decision maker (“CODM”) in deciding how to allocate resources and in assessing performance. The Company’s CODM is the Chief Executive Officer who evaluates the Company’s financial information and resources and assesses performance on a consolidated basis.
60
Revenue by product line and geographic area is presented below (in thousands):
Years ended December 31, | ||||||||||||
Revenue by product line: | 2016 | 2015 | 2014 | |||||||||
Ultracapacitors | $ | 71,491 | $ | 114,525 | $ | 135,637 | ||||||
High-voltage capacitors | 45,177 | 41,718 | 40,361 | |||||||||
Microelectronic products | 4,576 | 11,129 | 10,588 | |||||||||
Total | $ | 121,244 | $ | 167,372 | $ | 186,586 | ||||||
Years ended December 31, | ||||||||||||
Revenue from external customers located in(1): | 2016 | 2015 | 2014 | |||||||||
China | $ | 48,191 | $ | 87,856 | $ | 89,143 | ||||||
United States | 12,041 | 20,836 | 23,758 | |||||||||
Germany | 12,854 | 13,972 | 16,384 | |||||||||
All other countries (2) | 48,158 | 44,708 | 57,301 | |||||||||
Total | $ | 121,244 | $ | 167,372 | $ | 186,586 | ||||||
_____________ | ||||||||||||
(1) Location is determined by shipment destination.
(2) Revenue from external customers located in countries included in “All other countries” does not individually comprise more than 10% of total revenue for any of the years presented.
Long-lived assets by geographic location are as follows (in thousands):
As of December 31, | ||||||||||||
2016 | 2015 | 2014 | ||||||||||
United States | $ | 19,267 | $ | 22,267 | $ | 28,013 | ||||||
China | 1,477 | 4,148 | 4,991 | |||||||||
Switzerland | 5,376 | 6,021 | 5,663 | |||||||||
Total | $ | 26,120 | $ | 32,436 | $ | 38,667 | ||||||
Note 2—Balance Sheet Details (in thousands):
Inventories, net
December 31, 2016 | December 31, 2015 | |||||||
Raw materials and purchased parts | $ | 12,980 | $ | 21,126 | ||||
Work-in-process | 858 | 4,367 | ||||||
Finished goods | 19,492 | 16,941 | ||||||
Reserves | (1,082 | ) | (3,379 | ) | ||||
Total inventories, net | $ | 32,248 | $ | 39,055 | ||||
Warranty
Activity in the warranty reserve, which is included in “accounts payable and accrued liabilities” in the consolidated balance sheets, is as follows:
Years Ended December 31, | ||||||||
2016 | 2015 | |||||||
Beginning balance | $ | 1,288 | $ | 716 | ||||
Product warranties issued | 486 | 751 | ||||||
Settlement of warranties | (458 | ) | (755 | ) | ||||
Changes related to preexisting warranties | (103 | ) | 576 | |||||
Ending balance | $ | 1,213 | $ | 1,288 | ||||
61
December 31, | ||||||||
2016 | 2015 | |||||||
Property and equipment, net: | ||||||||
Machinery, furniture and office equipment | $ | 62,583 | $ | 76,077 | ||||
Computer hardware and software | 10,071 | 12,235 | ||||||
Leasehold improvements | 20,320 | 16,883 | ||||||
Construction in progress | 1,401 | 2,527 | ||||||
Property and equipment, gross | 94,375 | 107,722 | ||||||
Less accumulated depreciation and amortization | (68,255 | ) | (75,398 | ) | ||||
Total property and equipment, net | $ | 26,120 | $ | 32,324 | ||||
Accounts payable and accrued liabilities: | ||||||||
Accounts payable | $ | 13,109 | $ | 22,291 | ||||
Income tax payable | 1,066 | 1,376 | ||||||
Accrued warranty | 1,213 | 1,288 | ||||||
Other accrued liabilities | 3,793 | 9,030 | ||||||
Total accounts payable and accrued liabilities | $ | 19,181 | $ | 33,985 | ||||
Accumulated Other Comprehensive Income
Foreign Currency Translation Adjustment | Defined Benefit Pension Plan | Accumulated Other Comprehensive Income | Affected Line Items in the Statement of Operations | |||||||||||
Balance as of December 31, 2015 | $ | 9,933 | $ | (5,039 | ) | $ | 4,894 | |||||||
Other comprehensive income (loss) before reclassification | (2,107 | ) | — | (2,107 | ) | |||||||||
Amounts reclassified from accumulated other comprehensive income (loss) | — | 2,613 | 2,613 | Cost of Sales, Selling, General and Administrative and Research and Development Expense | ||||||||||
Net other comprehensive income (loss) for the year ended December 31, 2016 | (2,107 | ) | 2,613 | 506 | ||||||||||
Balance as of December 31, 2016 | $ | 7,826 | $ | (2,426 | ) | $ | 5,400 | |||||||
Note 3—Goodwill
The Company performs an impairment test for goodwill annually according to the Intangibles—Goodwill and Other Topic of the FASB ASC. The Company first makes a qualitative assessment of the likelihood of goodwill impairment and if it concludes that it is more likely than not that the carrying amount of a reporting unit is greater than its fair value, then it will be required to perform the first step of a two-step quantitative impairment test. Otherwise, performing the two-step impairment test is not required. Qualitative factors assessed at the reporting unit level include, but are not limited to, changes in industry and market structure, competitive environments, planned capacity and new product launches, cost factors such as raw material prices and financial performance of the reporting unit. The Company may also determine to skip the qualitative assessment in any year and move directly to the quantitative test.
The first step of the two-step quantitative impairment test consists of estimating the fair value and comparing the estimated fair value with the carrying value of the reporting unit. If the fair value is less than the carrying value, a second step is performed to compute the amount of the impairment by determining an implied fair value of goodwill. The implied fair value of goodwill is the residual fair value derived by deducting the fair value of a reporting unit’s assets and liabilities from its estimated total fair value, which was calculated in step one. An impairment charge would represent the excess of the carrying amount of the reporting unit’s goodwill over the implied fair value of the goodwill. The guidance requires goodwill to be reviewed annually at the same time every year or when an event occurs or circumstances change such that it is reasonably possible that an impairment may exist. The Company selected December 31 as its annual testing date.
62
In 2016, the Company assessed the qualitative factors for one of its two reporting units and concluded that it was more likely than not that its fair value exceeded its carrying value and therefore did not perform quantitative testing for the reporting unit. For its other reporting unit, the Company determined to skip the qualitative assessment and moved directly to the first quantitative test. The Company utilized a discounted cash flow methodology to calculate the fair value of the reporting unit. Based on the fair value analysis, management concluded that fair value exceeded carrying value of the reporting unit and no additional quantitative testing was required. As a result of the Company’s annual assessments, no impairment was indicated as of December 31, 2016, 2015 and 2014.
The change in the carrying amount of goodwill during 2015 and 2016 was as follows (in thousands):
Balance at December 31, 2014 | $ | 23,599 | |
Foreign currency translation adjustments | 36 | ||
Balance at December 31, 2015 | 23,635 | ||
Foreign currency translation adjustments | (545 | ) | |
Disposition of microelectronics product line | (291 | ) | |
Balance at December 31, 2016 | $ | 22,799 | |
Note 4 – Sale of Microelectronics Product Line
On April 27, 2016, the Company sold substantially all of the assets and liabilities comprising its microelectronics product line to Data Device Corporation, a privately-held Delaware corporation. The transaction purchase price was $21.0 million, subject to a working capital adjustment and a one year $1.5 million escrow holdback on the purchase price.
The assets sold were primarily comprised of inventory, accounts receivable and property and equipment. The liabilities sold were comprised mainly of deferred revenue, accounts payable and other current liabilities. During the first quarter of 2016, the Company met the held for sale criteria in accordance with ASC Topic 380, Impairment or Disposal of Long Lived Assets, and the Company ceased depreciation on the property and equipment and classified the assets to be sold as held for sale. During the second quarter of 2016, all assets and liabilities formerly classified as held for sale were disposed of pursuant to the sale. The sale of the microelectronics product line did not represent a strategic shift that had a major effect on the Company’s operations and financial results. As such, the Company did not account for the disposition as a discontinued operation. During the year ended December 31, 2016, the Company recorded a gain of $6.7 million related to the sale of the microelectronics product line.
In connection with the sale of the microelectronics product line, the Company guaranteed the future operating lease commitment related to the facility formerly occupied by the microelectronics product line, which was assumed by the buyer. The Company is obligated to perform under the guarantee if Data Device Corporation defaults on the lease at any time during the remainder of the lease agreement. The lease had a remaining lease term of fifteen months from the date of sale and expires on July 31, 2017. As of December 31, 2016, the undiscounted maximum amount of potential future payments under the lease guarantee is $0.6 million. The Company assessed the probability that it will be required to make payments under the terms of the guarantee based upon its actual and expected loss experience. Consistent with the requirements of FASB ASC 460, Guarantees, the Company has not recorded a liability on its consolidated balance sheet as of December 31, 2016 as a loss is not considered probable.
Note 5 – Restructuring and Exit Costs
In 2015, the Company initiated a restructuring plan to consolidate U.S. manufacturing operations and to reduce headcount and operating expenses in order to align the Company’s cost structure with the current business forecast and to improve operational efficiency. The plan also included the disposition of the Company’s microelectronics product line which was completed in April 2016. The restructuring plan was otherwise substantially completed in the first quarter of 2016. Total restructuring and exit costs were $2.8 million, which included $1.3 million in facilities costs related to the consolidation of manufacturing operations, $1.2 million in employee severance costs and $0.3 million in other exit costs. The Company also incurred $0.6 million in accelerated equipment depreciation expense related to the consolidation of manufacturing operations. Total cash expenditures related to restructuring activities were approximately $1.5 million.
The Company accounts for charges resulting from restructuring and exit activities in accordance with ASC Topic 420, Exit or Disposal Cost Obligations (“ASC 420”), and ASC Topic 712, Compensation-Nonretirement Postemployment Benefits, for employee termination benefits to be paid in accordance with its ongoing employee termination benefit arrangement.
63
In June 2015, the Company ceased use of approximately 60,000 square feet of its Peoria, AZ manufacturing facility, and determined this leased space would have no future economic benefit to the Company based on the current business forecast. As a result, in June 2015, the Company recorded a liability for the future rent obligation associated with this space, net of estimated sublease income, in accordance with ASC Topic 420. For the year ended December 31, 2015, the expense related to the exit of this leased space was $1.2 million, before tax, and was recorded as a component of total restructuring and exit costs. During the year ended December 31, 2016, the Company recorded additional restructuring and exit costs of $0.1 million related to revisions to the sublease income assumption.
For the years ended December 31, 2016 and 2015, the Company recorded total charges related to its restructuring plan of $0.3 million and $2.5 million, respectively, within “restructuring and exit costs” in the consolidated statements of operations. Additionally, for the years ended December 31, 2016 and 2015, the Company recorded $0.1 million and $0.4 million, respectively, of accelerated depreciation expense within “cost of revenue” in the consolidated statements of operations.
As of December 31, 2016, the Company’s consolidated balance sheet includes restructuring liability associated with lease obligation costs of $0.3 million in “accounts payable and accrued liabilities” and $0.5 million in “other long term liabilities.”
The following table summarizes restructuring and exit costs for the years ended December 31, 2016 and 2015 (in thousands):
Employee Severance Costs | Lease Obligation Costs | Other Exit Costs | Total | |||||||||||||
Restructuring liability as of December 31, 2014 | $ | — | $ | — | $ | — | $ | — | ||||||||
Costs incurred | 1,439 | 1,208 | — | 2,647 | ||||||||||||
Amounts paid | (1,010 | ) | — | — | (1,010 | ) | ||||||||||
Accruals released | (135 | ) | — | — | (135 | ) | ||||||||||
Other non-cash adjustments | — | (165 | ) | — | (165 | ) | ||||||||||
Restructuring liability as of December 31, 2015 | 294 | 1,043 | — | 1,337 | ||||||||||||
Costs incurred | 67 | 86 | 298 | 451 | ||||||||||||
Amounts paid | (207 | ) | — | (246 | ) | (453 | ) | |||||||||
Accruals released | (154 | ) | — | — | (154 | ) | ||||||||||
Other non-cash adjustments | — | (327 | ) | (52 | ) | (379 | ) | |||||||||
Restructuring liability as of December 31, 2016 | $ | — | $ | 802 | $ | — | $ | 802 | ||||||||
Note 6—Credit Facilities
Revolving Line of Credit
In July 2015, the Company entered into a Loan and Security Agreement (the “Loan Agreement”) with East West Bank (“EWB”), whereby EWB made available to the Company a secured credit facility in the form of a revolving line of credit (the “Revolving Line of Credit”). The Revolving Line of Credit is available up to a maximum of the lesser of: (a) $25.0 million; or (b) a certain percentage of domestic and foreign trade receivables. As of December 31, 2016 the amount available under the Revolving Line of Credit was $11.4 million. In general, amounts borrowed under the Revolving Line of Credit are secured by a lien on all of the Company’s assets, including its intellectual property, as well as a pledge of 100% of its equity interests in Maxwell SA. The obligations under the Loan Agreement are also guaranteed directly by Maxwell SA. The Revolving Line of Credit will mature on July 3, 2018. In the event that the Company is in violation of the representations, warranties and covenants made in the Loan Agreement, including certain financial covenants set forth therein, the Company may not be able to utilize the Revolving Line of Credit or repayment of amounts owed pursuant to the Loan Agreement could be accelerated. The Company is currently in compliance with the financial covenants that it is required to meet during the term of the credit agreement including the minimum four-quarter rolling EBITDA, quarterly minimum quick ratio and monthly minimum cash requirements. On March 1, 2017, the Company entered into an amendment to the Loan Agreement to approve the acquisition of substantially all of the assets and business of Nesscap Energy, Inc., and to modify certain financial covenants.
Amounts borrowed under the Revolving Line of Credit bear interest, payable monthly. Such interest shall accrue based upon, at the Company’s election, subject to certain limitations, either the Prime Rate plus a margin ranging from 0% to 0.50% or the LIBOR Rate plus a margin ranging from 2.75% to 3.25%, the specific rate for each as determined based upon the Company’s leverage ratio from time to time.
64
The Company is required to pay an annual commitment fee of $125,000, and an unused commitment fee of the average daily unused amount of the Revolving Line of Credit, payable monthly, equal to a per annum rate in a range of 0.30% to 0.50%, as determined by the Company’s leverage ratio on the last day of the previous fiscal quarter. No amounts have been borrowed under the Revolving Line of Credit as of December 31, 2016.
Former Credit Facility
In December 2011, the Company obtained a secured credit facility in the form of a revolving line of credit (the “Former Revolving Line of Credit”) and an equipment term loan (the “Equipment Term Loan”) (together, the “Former Credit Facility”). Borrowings under the Former Credit Facility bore interest, payable monthly, at either (i) the bank’s prime rate or (ii) LIBOR plus 2.25%, at the Company’s option subject to certain limitations. The Equipment Term Loan was available to finance 80% of eligible equipment purchases made between April 1, 2011 and April 30, 2012. During this period, the Company borrowed $5.0 million under the Equipment Term Loan. The balance of the Equipment Term Loan was paid in full by the maturity date of April 30, 2015. Concurrently with entering into the Loan Agreement described above, in July 2015, the Company repaid all outstanding loans under the Former Revolving Line of Credit and the Former Credit Facility was terminated. The Company did not incur any early termination or prepayment penalties under the Former Credit Facility in connection with the above transactions.
Other Long-term Borrowings
Maxwell SA has various financing agreements for vehicles. These agreements are for up to an original three-year repayment period with interest rates ranging from 0.9% to 3.9%. At December 31, 2016 and 2015, $83,000 and $91,000, respectively, was outstanding under these agreements.
Note 7—Fair Value Measurement
The Company records certain financial instruments at fair value in accordance with the Fair Value Measurements and Disclosures Topic of the FASB ASC. Historically, the financial instruments to which this topic applied were foreign currency forward contracts and pension assets. The fair value of foreign currency forward contracts was recorded as a liability or asset in the consolidated balance sheets. During the second quarter of 2016, the Company ceased using foreign currency forward contracts to hedge foreign currency exposure as management determined its foreign currency exposure is no longer significant. Therefore, no foreign currency forward contracts were outstanding as of December 31, 2016. As of December 31, 2015, the fair value of the Company’s foreign currency forward contracts was an asset of $16,000, which was recorded in “trade and other accounts receivable” in the consolidated balance sheet. The fair value of derivative instruments was measured using models following quoted market prices in active markets for identical instruments, which is a Level 2 input under the fair value hierarchy of the Fair Value Measurements and Disclosures Topic of the FASB ASC. Also see Note 8, Foreign Currency Derivative Instruments, and Note 13, Pension and Other Postretirement Benefit Plans, of this Annual Report on Form 10-K, for further discussion of fair value measurements.
The carrying value of short-term and long-term borrowings approximates fair value because of the relative short maturity of these instruments and the interest rates the Company could currently obtain.
Note 8—Foreign Currency Derivative Instruments
The Company has historically used forward contracts to hedge certain monetary assets and liabilities, primarily receivables, payables, and cash balances, denominated in foreign currencies. During the year ended December 31, 2016, the Company ceased using foreign currency forward contracts to hedge foreign currency exposure as management determined its foreign currency exposure is no longer significant. The change in fair value of these forward contracts represented a natural hedge as gains and losses on these instruments partially offset the changes in the fair value of the underlying monetary assets and liabilities due to movements in currency exchange rates. These forward contracts generally expired in one month. These contracts were considered economic hedges but were not designated as hedges under the Derivatives and Hedging Topic of the FASB ASC, therefore, the change in the fair value of the instruments was recognized each period in the consolidated statements of operations.
The net losses on foreign currency forward contracts included in “foreign currency exchange loss, net” in the consolidated statements of operations are as follows (in thousands):
Year Ended December 31, | ||||||||||||
2016 | 2015 | 2014 | ||||||||||
Total loss | $ | (88 | ) | $ | (720 | ) | $ | (5,265 | ) | |||
65
The net losses on foreign currency derivative contracts were partially offset by net gains and losses on the underlying monetary assets and liabilities. The net foreign currency gains or losses on those underlying monetary assets and liabilities included in “foreign currency exchange loss, net” in the consolidated statements of operations are as follows (in thousands):
Year Ended December 31, | ||||||||||||
2016 | 2015 | 2014 | ||||||||||
Total gain (loss) | $ | (37 | ) | $ | 179 | $ | 4,391 | |||||
The following table presents gross amounts, amounts offset and net amounts presented in the consolidated balance sheets for the Company’s derivative instruments measured at fair value (in thousands):
December 31, 2015 | ||||
Gross amounts of recognized asset | $ | 66 | ||
Gross amounts offset | (50 | ) | ||
Net amount of recognized asset | $ | 16 | ||
The Company had the legal right to offset these recognized assets and liabilities upon settlement of the derivative instruments. For additional information, refer to Note 7, Fair Value Measurements.
Note 9—Stock Plans
Equity Incentive Plans
The Company has two active share-based compensation plans as of December 31, 2016: the 2004 Employee Stock Purchase Plan (“ESPP”) and the 2013 Omnibus Equity Incentive Plan (the “Incentive Plan”), as approved by the stockholders. Under the Incentive Plan, incentive stock options, non-qualified stock options, restricted stock awards (“RSAs”) and restricted stock units (“RSUs”) have been granted to employees and non-employee directors. Generally, these awards vest over periods of one to four years. In addition, equity awards have been issued to senior management where vesting of the award is tied to Company performance or market conditions. The Company’s policy is to issue new shares of its common stock upon the exercise of stock options, vesting of restricted stock units, granting of restricted stock awards or ESPP purchases.
The Company’s Incentive Plan currently provides for an equity incentive pool of 4,900,000 shares. Shares reserved for issuance are replenished by forfeited shares from the Incentive Plan. Additionally, equity awards forfeited under the Company’s former 2005 equity incentive plan and shares that were available under other predecessor plans are included in the total shares available for issuance under the Incentive Plan.
For the year ended December 31, 2016, the tax benefit associated with stock option exercises, restricted stock unit vesting, restricted stock grants, and disqualifying dispositions of both incentive stock options and stock issued under the Company’s ESPP, was approximately $1.7 million. No tax benefits were recognized in the years ended December 31, 2016, 2015 and 2014 because excess tax benefits were not realized by the Company.
Stock Options
The Company grants stock options to its employees and executive management on a discretionary basis. The following table summarizes total aggregate stock option activity for the year ended December 31, 2016 (in thousands, except for per share data):
Number of Shares | Weighted Average Exercise Price | Weighted Average Remaining Contractual Term (in years) | Aggregate Intrinsic Value | ||||||||||
Balance at December 31, 2015 | 931 | $ | 10.19 | ||||||||||
Cancelled | (517 | ) | 11.17 | ||||||||||
Balance at December 31, 2016 | 414 | $ | 8.97 | 6.03 | $ | 23 | |||||||
Vested or expected to vest at December 31, 2016 | 398 | $ | 9.08 | 5.13 | $ | 21 | |||||||
Exercisable at December 31, 2016 | 246 | $ | 10.69 | 4.04 | $ | 6 | |||||||
66
The weighted-average grant date fair value of stock options granted during the year ended December 31, 2015 was $3.34. No stock options were granted during the years ended December 31, 2016 and 2014. The total intrinsic value of options exercised during the years ended December 31, 2016, 2015 and 2014 was $0, $16,000 and $0.6 million, respectively. There were no option exercises for the year ended December 31, 2016.
The fair value of the stock options granted during the years ended December 31, 2015 was estimated using the Black-Scholes valuation model using the following assumptions:
Year Ended December 31, | |||
2015 | |||
Expected dividends | — | % | |
Expected volatility range | 60% to 61% | ||
Expected volatility weighted average | 60 | % | |
Risk-free interest rate | 1.6 | % | |
Expected life/term weighted average (in years) | 4.9 | ||
The expected dividend yield is zero because the Company has never paid cash dividends and has no present intention to pay cash dividends. The expected term is based on the Company’s historical experience from previous stock option grants. Expected volatility is based on the historical volatility of the Company’s stock measured over a period commensurate with the expected option term. The Company does not consider implied volatility due to the low volume of publicly traded options in the Company’s stock. The risk-free interest rate is derived from the zero coupon rate on U.S. Treasury instruments with a term comparable to the option’s expected term.
As of December 31, 2016, there was $0.4 million of total unrecognized compensation cost related to stock options. The cost is expected to be recognized over a weighted average period of 2.3 years.
Restricted Stock Awards
During the year ended December 31, 2014, the Company ceased granting RSAs and began granting RSUs to employees and executive management as part of its annual equity incentive award program.
The following table summarizes RSA activity for the year ended December 31, 2016 (in thousands, except for per share data):
Shares | Weighted Average Grant Date Fair Value | ||||||
Nonvested at December 31, 2015 | 245 | $ | 13.87 | ||||
Vested | (105 | ) | 14.86 | ||||
Forfeited | (52 | ) | 12.73 | ||||
Nonvested at December 31, 2016 | 88 | $ | 13.37 | ||||
The weighted average grant date fair value of RSAs granted during the year ended December 31, 2014 was $14.21. No RSAs were granted during the years ended December 31, 2016 and 2015.
The vest date fair value of RSAs vested in 2016, 2015 and 2014 was $0.6 million, $1.2 million and $0.9 million, respectively. As of December 31, 2016, there was $0.6 million of unrecognized compensation cost related to nonvested RSAs expected to be recognized over a weighted average period of 0.9 years.
Restricted Stock Units
Non-employee directors receive annual RSU awards, normally in February of each year, as partial consideration for their annual retainer compensation. These awards vest in full one year from the date of grant provided the non-employee director provides continued service. Additionally, new directors normally receive RSUs upon their election to the board. The Company also grants RSUs to employees as part of its annual equity incentive award program, with vesting typically in equal annual installments over four years of continuous service. Additionally, the Company grants performance-based restricted stock units (“PSUs”) to executives with vesting contingent on continued service and achievement of specified performance objectives or stock price performance. Each RSU represents the right to receive one unrestricted share of the Company’s common stock upon vesting.
67
The following table summarizes RSU activity for the year ended December 31, 2016 (in thousands, except for per share data):
Shares | Weighted Average Grant Date Fair Value | ||||||
Nonvested at December 31, 2015 | 885 | $ | 7.36 | ||||
Granted | 1,353 | 6.00 | |||||
Released | (225 | ) | 7.20 | ||||
Forfeited | (265 | ) | 6.86 | ||||
Nonvested at December 31, 2016 | 1,748 | $ | 6.40 | ||||
The weighted average grant date fair value of RSUs granted in the years ended December 31, 2016, 2015 and 2014 was $6.00, $7.02 and $12.63, respectively. The release date fair value of RSUs in the years ended December 31, 2016, 2015 and 2014 was $1.3 million, $0.5 million and $0.6 million, respectively. As of December 31, 2016, there was $5.6 million of unrecognized compensation cost related to nonvested RSU awards. The cost is expected to be recognized over a weighted average period of 2.2 years.
RSU activity included 46,224, 214,831 and 50,000 PSUs granted in the years ended December 31, 2016, 2015 and 2014 with a weighted average grant date fair value of $5.08, $7.18 and $10.85 per share, respectively, with vesting contingent upon specified Company performance conditions or objectives.
Additionally, for the year ended December 31, 2016, RSUs granted included 313,460 market-condition PSUs with a weighted average grant date fair value of $7.76. The market-condition PSUs will be earned based on the level of the Company’s stock price performance against a determined market index over one, two and three-year performance periods. The market-condition PSUs have the potential to vest between 0% and 200% depending on the Company’s stock price performance and the recipients must remain employed through the end of each performance period in order to vest. No market-condition PSUs were granted during the year ended December 31, 2015. For the year ended December 31, 2014, RSUs granted included 70,000 market-condition PSUs with a weighted average grant date fair value of $7.71 per share. These PSUs have the potential to vest upon the achievement of certain stock price thresholds and the completion of three years of continuous employment from the date of grant. The fair value of market-condition PSUs granted was calculated using a Monte Carlo valuation model with the following assumptions:
Years Ended December 31, | ||||||
2016 | 2014 | |||||
Expected dividend yield | — | % | — | % | ||
Expected volatility | 62 | % | 65 | % | ||
Risk-free interest rate | 1.07 | % | 0.86 | % | ||
Expected term (in years) | 3.0 | 3.0 | ||||
The following table summarizes the amount of compensation expense recognized for RSUs for the years ended December 31, 2016, 2015 and 2014 (in thousands):
Years Ended December 31, | ||||||||||||
2016 | 2015 | 2014 | ||||||||||
Service-based restricted stock units | $ | 2,243 | $ | 1,362 | $ | 749 | ||||||
Performance-based restricted stock units | 103 | (28 | ) | 28 | ||||||||
Market-condition restricted stock units | 869 | 128 | 90 | |||||||||
Total compensation expense recognized for employee restricted stock units | $ | 3,215 | $ | 1,462 | $ | 867 | ||||||
Employee Stock Purchase Plan
In 2013, the Company amended and restated the 2004 Employee Stock Purchase Plan (“ESPP”). Pursuant to the ESPP, the aggregate number of shares of common stock which may be purchased shall not exceed 1,000,000 shares of common stock of the Company. For the years ended December 31, 2016 and 2015, 111,832 and 145,733 shares, respectively, were purchased under the ESPP.
The ESPP permits substantially all employees to purchase common stock through payroll deductions, at 85% of the lower of the trading price of the stock at the beginning or at the end of each six-month offering period. The number of shares purchased is based on participants’ contributions made during the offering period.
68
The fair value of the “look back” option for ESPP shares issued during the offering period is estimated using the Black-Scholes valuation model for a call and a put option. The share price used for the model is a 15% discount on the stock price on the last trading day before the offering period; the number of shares to be purchased is based on employee contributions. The fair value of ESPP awards was calculated using the following weighted-average assumptions:
Years Ended December 31, | ||||||||||||
2016 | 2015 | 2014 | ||||||||||
Expected dividends | — | % | — | % | — | % | ||||||
Expected volatility | 57 | % | 57 | % | 77 | % | ||||||
Risk-free interest rate | 0.43 | % | 0.29 | % | 0.08 | % | ||||||
Expected life (in years) | 0.5 | 0.5 | 0.5 | |||||||||
Fair value per share | $ | 1.93 | $ | 1.86 | $ | 4.56 | ||||||
The intrinsic value of shares of the Company’s stock purchased pursuant to the ESPP for offering periods within the years ended December 31, 2016, 2015 and 2014 was $0.1 million, $0.2 million and $0.4 million, respectively.
Bonuses to be Settled in Stock
On January 15, 2016, the Compensation Committee of the Board of Directors of the Company adopted the Maxwell Technologies, Inc. Incentive Bonus Plan to enable participants to earn annual incentive bonuses based upon achievement of specified financial and strategic performance objectives. The Company intends to settle bonuses earned under the plan for the fiscal year 2016 performance period with fully vested common stock of the Company in the first quarter of 2017. The Company recorded $1.4 million of stock-based compensation expense for these bonuses during the year ended December 31, 2016.
Stock-based Compensation Expense
Compensation cost for stock options, RSAs, RSUs, ESPP and bonus plan stock is as follows (in thousands):
Years Ended December 31, | ||||||||||||
2016 | 2015 | 2014 | ||||||||||
Stock options | $ | 171 | $ | 232 | $ | 52 | ||||||
Restricted stock awards | 388 | 1,974 | 2,536 | |||||||||
Restricted stock units | 3,215 | 1,462 | 867 | |||||||||
ESPP | 231 | 278 | 512 | |||||||||
Bonuses to be settled in stock | 1,359 | — | — | |||||||||
Total stock-based compensation expense | $ | 5,364 | $ | 3,946 | $ | 3,967 | ||||||
Stock-based compensation cost included in cost of revenue; selling, general and administrative expense; and research and development expense is as follows (in thousands):
Years Ended December 31, | ||||||||||||
2016 | 2015 | 2014 | ||||||||||
Cost of revenue | $ | 854 | $ | 644 | $ | 740 | ||||||
Selling, general and administrative | 3,674 | 2,502 | 2,362 | |||||||||
Research and development | 836 | 800 | 865 | |||||||||
Total stock-based compensation expense | $ | 5,364 | $ | 3,946 | $ | 3,967 | ||||||
Share Reservations
The following table summarizes the reservation of shares under the Company’s stock-based compensation plans as of December 31, 2016:
2013 Omnibus Equity Incentive Plan | 4,041,496 | |
2004 Employee Stock Purchase Plan | 195,294 | |
Total | 4,236,790 | |
69
Note 10—Shelf Registration Statement
On June 3, 2014, the Company filed a shelf registration statement on Form S-3 with the U.S. Securities and Exchange Commission (“SEC”) to, from time to time, sell up to an aggregate of $125 million of any combination of its common stock, warrants, debt securities or units. On June 30, 2014, the registration statement was declared effective by the SEC. On April 23, 2015, the Company entered into an At-the-Market Equity Offering Sales Agreement (“Sales Agreement”) with Cowen and Company, LLC (“Cowen”) pursuant to which they could sell, up to an aggregate of $10.0 million in shares of common stock through Cowen, as sales agent. Under the Sales Agreement, the Company agreed to pay Cowen a commission equal to 3.0% of the gross proceeds from the sale of shares of our common stock. On June 11, 2015, the Company completed the sale of approximately $10.0 million of common stock and terminated the offering. Approximately 1.83 million shares were sold in the offering at an average share price of $5.46. The Company received net proceeds of $9.6 million after commissions and offering costs of $0.4 million.
Note 11—Income Taxes
For financial reporting purposes, loss before income taxes includes the following components (in thousands):
Years Ended December 31, | ||||||||||||
2016 | 2015 | 2014 | ||||||||||
United States | $ | (38,319 | ) | $ | (35,074 | ) | $ | (19,301 | ) | |||
Foreign | 18,759 | 17,344 | 17,375 | |||||||||
Total | $ | (19,560 | ) | $ | (17,730 | ) | $ | (1,926 | ) | |||
The provision for income taxes based on loss before income taxes is as follows (in thousands):
Years Ended December 31, | ||||||||||||
2016 | 2015 | 2014 | ||||||||||
Federal: | ||||||||||||
Current | $ | — | $ | — | $ | — | ||||||
Deferred | (11,360 | ) | (4,297 | ) | (5,608 | ) | ||||||
(11,360 | ) | (4,297 | ) | (5,608 | ) | |||||||
State: | ||||||||||||
Current | 7 | 6 | 6 | |||||||||
Deferred | 923 | 62 | 853 | |||||||||
930 | 68 | 859 | ||||||||||
Foreign: | ||||||||||||
Current | 3,742 | 4,930 | 2,453 | |||||||||
Deferred | 561 | 8 | 1,944 | |||||||||
4,303 | 4,938 | 4,397 | ||||||||||
Increase in valuation allowance | 10,272 | 3,894 | 4,698 | |||||||||
Tax provision | $ | 4,145 | $ | 4,603 | $ | 4,346 | ||||||
70
The provision for income taxes in the accompanying consolidated statements of operations differs from the amount calculated by applying the statutory income tax rate to loss before income taxes. The primary components of such difference are as follows (in thousands):
Years Ended December 31, | ||||||||||||
2016 | 2015 | 2014 | ||||||||||
Taxes at federal statutory rate | $ | (6,650 | ) | $ | (6,028 | ) | $ | (655 | ) | |||
State taxes, net of federal benefit | (208 | ) | (236 | ) | (90 | ) | ||||||
Effect of tax rate differential for foreign subsidiary | (2,985 | ) | (2,641 | ) | (3,570 | ) | ||||||
Valuation allowance, including tax benefits of stock activity | 10,272 | 3,894 | 4,698 | |||||||||
Foreign taxes on unremitted earnings | 1,204 | 2,085 | 1,590 | |||||||||
Stock-based compensation | 441 | 134 | 621 | |||||||||
Foreign withholding taxes | 260 | 180 | — | |||||||||
Return to provision adjustments | 1,062 | 1,131 | 536 | |||||||||
Subpart F income inclusion | 906 | 5,914 | 1,167 | |||||||||
Other | (157 | ) | 170 | 49 | ||||||||
Tax provision | $ | 4,145 | $ | 4,603 | $ | 4,346 | ||||||
The Company has established a valuation allowance against its U.S. federal and state deferred tax assets due to the uncertainty surrounding the realization of such assets as evidenced by the cumulative losses from operations through December 31, 2016. Management periodically evaluates the recoverability of the deferred tax assets. At such time as it is determined that it is more likely than not that deferred assets are realizable, the valuation allowance will be reduced accordingly and recorded as a tax benefit, with the exception of $15.5 million which will impact additional paid in capital as discussed below. The Company has recorded a valuation allowance of $78.4 million as of December 31, 2016 to reflect the estimated amount of deferred tax assets that may not be realized. The Company increased its valuation allowance by $10.3 million for the year ended December 31, 2016.
At December 31, 2016, the Company has federal and state net operating loss carryforwards of approximately $186.8 million and $48.4 million, respectively. The federal tax loss carryforwards will begin to expire in 2020 and the state tax loss carryforwards will begin to expire in 2016. In addition, the Company has research and development and other tax credit carryforwards for federal and state income tax purposes as of December 31, 2016 of $6.9 million and $8.6 million, respectively. The federal credits will begin to expire in 2019 unless utilized and the state credits have an indefinite life. Pursuant to Internal Revenue Code Sections 382 and 383, use of the Company’s federal net operating loss and credit carryforwards may be limited upon a cumulative change in ownership of more than 50% within a three-year period.
Excess tax benefits associated with stock option exercises, restricted stock unit vesting, restricted stock grants, and disqualifying dispositions of both incentive stock options and stock issued from the Company’s Employee Stock Purchase Plan in the amount of $3.5 million for 2016 and 2015, did not reduce current income taxes payable and, accordingly, are not included in the deferred tax asset relating to net operating loss carryforwards, but are included with the federal and state net operating loss carryforwards disclosed in this footnote. The tax benefits associated with stock option deductions from 1998 to 2005 in the amount of $15.5 million were not recorded in additional paid-in capital because their realization was not more likely than not to occur and, consequently, a valuation allowance was recorded against the entire benefit.
The Company was granted a tax holiday in Switzerland, which was effective as of January 1, 2012 for up to 10 years. The tax holiday is conditioned upon the Company meeting certain employment and investment thresholds. As of January 1, 2017, the Company is no longer eligible for the tax holiday due to not meeting the employment threshold. The impact of the tax holiday decreased foreign taxes by $0.6 million and $0.7 million for 2016 and 2015, respectively. The benefit of the tax holiday on net loss per diluted share was $0.02 for 2016 and 2015.
The Company records U.S. income taxes on the undistributed earnings of foreign subsidiaries unless the subsidiaries’ earnings are considered indefinitely reinvested outside of the U.S. As of December 31, 2016, the Company has recorded a $4.9 million deferred tax liability for Swiss withholding taxes associated with $97.6 million of undistributed earnings of its Swiss subsidiary that are no longer considered indefinitely reinvested. In the event that the Company repatriates these funds, this withholding tax would become payable to the Swiss government. During the years ended December 31, 2016, 2015 and 2014, income tax expense associated with undistributed earnings of its Swiss subsidiary that are no longer considered indefinitely reinvested was $1.2 million, $2.1 million and $1.6 million, respectively. As of December 31, 2016, there were no undistributed earnings considered indefinitely reinvested. Determination of the amount of any unrecognized deferred income tax liability on the excess of the financial reporting basis over the tax basis of investments in foreign subsidiaries is not practicable because of the complexities of the hypothetical calculation.
71
Items that give rise to significant portions of the deferred tax accounts are as follows (in thousands):
December 31, | ||||||||
2016 | 2015 | |||||||
Deferred tax assets: | ||||||||
Tax loss carryforwards | $ | 62,994 | $ | 52,504 | ||||
Tax credit carryforwards | 19 | 19 | ||||||
Uniform capitalization, contract and inventory related reserves | 598 | 1,558 | ||||||
Accrued vacation | 514 | 592 | ||||||
Stock-based compensation | 2,130 | 1,466 | ||||||
Capitalized research and development | 5,532 | 6,212 | ||||||
Tax basis depreciation less book depreciation | 1,661 | 1,019 | ||||||
Intangible assets | 1,354 | 1,533 | ||||||
Deferred revenue | 33 | 254 | ||||||
Accrued foreign taxes | 1,263 | 1,271 | ||||||
Other | 2,523 | 2,527 | ||||||
Total | 78,621 | 68,955 | ||||||
Deferred tax liabilities: | ||||||||
Inventory deduction | (369 | ) | (235 | ) | ||||
Pension assets | (1,733 | ) | (1,173 | ) | ||||
Allowance for doubtful accounts | (677 | ) | (378 | ) | ||||
Withholding tax on undistributed earnings of foreign subsidiary | (4,879 | ) | (3,675 | ) | ||||
Unrealized gains and losses | (733 | ) | (984 | ) | ||||
Other | — | (1 | ) | |||||
Total | (8,391 | ) | (6,446 | ) | ||||
Net deferred tax assets before valuation allowance | 70,230 | 62,509 | ||||||
Valuation allowance | (78,366 | ) | (68,093 | ) | ||||
Net deferred tax liabilities | $ | (8,136 | ) | $ | (5,584 | ) | ||
As of December 31, 2016 and 2015, deferred tax assets of $0.4 million and $0.5 million, respectively were included in other non-current assets in the consolidated balance sheet.
The Company accounts for uncertain tax benefits in accordance with the provisions of section 740-10 of the Accounting for Uncertainty in Income Taxes Topic of the FASB ASC. Of the total unrecognized tax benefits at December 31, 2016, approximately $15.6 million was recorded as a reduction to deferred tax assets, which caused a corresponding reduction in the Company’s valuation allowance of $15.6 million. To the extent unrecognized tax benefits are recognized at a time when a valuation allowance does not exist, the recognition of the $15.6 million tax benefit would reduce the effective tax rate. The Company does not anticipate that the amount of unrecognized tax benefits as of December 31, 2016 will change materially within the 12-month period following December 31, 2016.
A reconciliation of the beginning and ending amount of unrecognized tax benefits is as follows (in thousands):
Balance at December 31, 2014 | $ | 11,939 | |
Increase in current period positions | 1,466 | ||
Increase in prior period positions | 609 | ||
Balance at December 31, 2015 | 14,014 | ||
Increase in current period positions | 1,596 | ||
Increase in prior period positions | 116 | ||
Decrease in prior period positions | (147 | ) | |
Balance at December 31, 2016 | $ | 15,579 | |
The Company recognizes interest and penalties as a component of income tax expense. Interest and penalties for the years ended December 31, 2016, 2015 and 2014 were $148,000, $119,000 and $34,000, respectively.
The Company’s U.S. federal income tax returns for tax years subsequent to 2009 are subject to examination by the Internal Revenue Service and its state income tax returns subsequent to 2008 are subject to examination by state tax authorities. The Company’s foreign tax returns subsequent to 2004 are subject to examination by the foreign tax authorities.
72
Net operating losses from years for which the statute of limitations has expired (2009 and prior for federal and 2008 and prior for state) could be adjusted in the event that the taxing jurisdictions challenge the amounts of net operating loss carryforwards from such years.
Note 12—Leases
Rental expense amounted to $4.1 million, $5.0 million and $5.6 million for the years ended December 31, 2016, 2015 and 2014, respectively, and was incurred primarily for facility leases. Future annual minimum rental commitments as of December 31, 2016 are as follows (in thousands):
Fiscal Years | |||
2017 | $ | 3,167 | |
2018 | 2,392 | ||
2019 | 2,322 | ||
2020 | 2,199 | ||
2021 | 1,282 | ||
Thereafter | 5,145 | ||
Total | $ | 16,507 | |
Note 13—Pension and Other Postretirement Benefit Plans
Foreign Plan
The Compensation—Retirement Benefits Subtopic of the FASB ASC requires balance sheet recognition of the total over funded or underfunded status of pension and postretirement benefit plans. Under the guidance, actuarial gains and losses, prior service costs or credits, and any remaining transition assets or obligations that have not been recognized under previous accounting standards must be recognized as a component of accumulated other comprehensive income (loss) within stockholders’ equity, net of tax effects, until they are amortized as a component of net periodic benefit cost (income).
The Company’s plan is regulated by the Swiss Government and is funded by the employees and the Company. The pension benefit is based on compensation, length of service and credited investment earnings. The plan guarantees both a minimum rate of return as well as minimum annuity purchase rates. The Company’s funding policy with respect to the pension plan is to contribute the amount required by Swiss law, using the required percentage applied to the employee’s compensation. In addition, participating employees are required to contribute to the pension plan. The Company made pension contributions of $0.6 million, $0.6 million and $0.7 million in 2016, 2015 and 2014, respectively; approximately 45% of the total contributions to the plan each year are made by the employees. This plan has a measurement date of December 31. The Company does not have any rights to the assets of the plan other than the right to offset the liabilities of the plan.
The net pension asset increased from $5.8 million to $8.9 million during the year ended December 31, 2016. The increase in plan assets was primarily due to a higher return on plan assets than expected, demographic and assumption changes made to reflect current market conditions, as well as higher than expected withdrawal and mortality experience during the year. The accumulated benefit obligation was $29.4 million and $31.3 million as of December 31, 2016 and 2015, respectively. The decrease in the benefit obligation was primarily due to higher than expected withdrawal and mortality experience and a higher amount of benefits paid during the year than new obligations incurred. The plan is fully funded and continues to be in a surplus condition.
73
The following table reflects changes in the pension benefit obligation and plan assets for the years ended December 31, 2016 and 2015 (in thousands):
Years ended December 31, | ||||||||
2016 | 2015 | |||||||
Change in benefit obligation: | ||||||||
Benefit obligation at beginning of year | $ | 33,153 | $ | 33,006 | ||||
Service cost | 1,171 | 958 | ||||||
Interest cost | 246 | 332 | ||||||
Plan participant contributions | 509 | 523 | ||||||
Benefits paid | (1,570 | ) | (3,064 | ) | ||||
Actuarial (gain) loss | (2,425 | ) | 1,262 | |||||
Plan change | — | 83 | ||||||
Effect of foreign currency translation | (827 | ) | 53 | |||||
Projected benefit obligation at end of year | 30,257 | 33,153 | ||||||
Changes in plan assets: | ||||||||
Fair value of plan assets at beginning of year | 39,002 | 40,368 | ||||||
Actual return on plan assets | 1,657 | 419 | ||||||
Company contributions | 596 | 640 | ||||||
Plan participant contributions | 509 | 523 | ||||||
Benefits paid | (1,570 | ) | (3,064 | ) | ||||
Effect of foreign currency translation | (1,050 | ) | 116 | |||||
Fair value of plan assets at end of year | 39,144 | 39,002 | ||||||
Funded status at end of year | $ | 8,887 | $ | 5,849 | ||||
Amounts recognized in the consolidated balance sheets consist of (in thousands):
As of December 31, | ||||||||
2016 | 2015 | |||||||
Net long-term pension asset | $ | 8,887 | $ | 5,849 | ||||
Accumulated other comprehensive loss consists of the following: | ||||||||
Net prior service cost | 779 | 837 | ||||||
Net loss | 3,113 | 5,668 | ||||||
Accumulated other comprehensive loss before taxes | $ | 3,892 | $ | 6,505 | ||||
74
The components of net periodic pension cost and other amounts recognized in other comprehensive income (loss) before taxes are as follows (in thousands):
Years ended December 31, | ||||||||||||
2016 | 2015 | 2014 | ||||||||||
Components of net periodic pension cost: | ||||||||||||
Service cost | $ | 1,171 | $ | 958 | $ | 846 | ||||||
Interest cost | 246 | 332 | 697 | |||||||||
Expected return on plan assets | (1,175 | ) | (1,551 | ) | (1,784 | ) | ||||||
Prior service cost amortization | 150 | 136 | 140 | |||||||||
Deferred loss amortization | 243 | 45 | — | |||||||||
Settlement cost | — | 492 | 420 | |||||||||
Net periodic pension cost | $ | 635 | $ | 412 | $ | 319 | ||||||
Other amounts recognized in other comprehensive income (loss) before income taxes are as follows: | ||||||||||||
Prior service cost amortization | $ | (150 | ) | $ | (136 | ) | $ | (140 | ) | |||
(Gain) loss on value of plan assets | (476 | ) | 1,131 | (1,695 | ) | |||||||
Actuarial (gain) loss on benefit obligation | (2,425 | ) | 1,262 | 4,975 | ||||||||
Plan change | — | 83 | — | |||||||||
Settlement | — | (492 | ) | (420 | ) | |||||||
Deferred loss amortization | (243 | ) | (45 | ) | — | |||||||
Total recognized in other comprehensive income (loss), before taxes | $ | (3,294 | ) | $ | 1,803 | $ | 2,720 | |||||
Total recognized in net periodic pension cost and other comprehensive income (loss), before taxes | $ | (2,659 | ) | $ | 2,215 | $ | 3,039 | |||||
Assumptions used to determine the benefit obligation and net periodic pension cost are as follows:
Years ended December 31, | ||||||
2016 | 2015 | |||||
Weighted-average assumptions used to determine benefit obligation: | ||||||
Discount rate | 0.75 | % | 0.75 | % | ||
Rate of compensation increase | 2.00 | % | 2.50 | % | ||
Measurement date | 11/30/2016 | 11/30/2015 | ||||
Weighted-average assumptions used to determine net periodic pension cost: | ||||||
Discount rate | 0.75 | % | 1.00 | % | ||
Expected long-term return on plan assets | 3.00 | % | 3.75 | % | ||
Rate of compensation increase | 2.50 | % | 2.50 | % | ||
Percentage of the fair value of total plan assets held in each major category of plan assets: | ||||||
Equity securities | 29 | % | 29 | % | ||
Debt securities | 23 | % | 23 | % | ||
Real estate investment funds | 43 | % | 43 | % | ||
Other | 5 | % | 5 | % | ||
Total | 100 | % | 100 | % | ||
The pension plan’s overall strategy and investment policy is managed by the board of the plan. The overall long-term rate is based on the target asset allocation of 14% Swiss bonds, 10% non-Swiss hedged bonds, 10% Swiss equities, 15% global equities, 5% emerging market equities, 4% alternative investments, 40% real estate and 2% cash and equivalents.
The 2017 expected future long-term rate of return is estimated to be 2.50%, which is based on historical asset rates of return for each asset allocation classification of (1.11)% for Swiss bonds, (1.20)% for non-Swiss hedged bonds, 3.00% for Swiss equities, 4.80% for global equities, 5.00% for emerging market equities, 1.80% for alternative investments, 2.10% for real estate and (0.20)% for cash and equivalents. The 2016 expected long-term rate of return was 3.00% and was based on the historical asset rates of return of 0.21% for Swiss bonds, 0% for non-Swiss hedged bonds, 3.52% for Swiss equities, 5.21% for global equities, 5.21% for emerging market equities, 1.23% for alternative investments, 2.54% for real estate and 0.23% for cash and equivalents.
75
Expected amortization during the year ending December 31, 2017 is as follows (in thousands): | |||
Amortization of net prior service costs | $ | 145 | |
The following benefit payments, which reflect expected future service, as appropriate, are expected to be paid (in thousands):
2017 | $ | 1,320 | |
2018 | 1,409 | ||
2019 | 1,380 | ||
2020 | 1,301 | ||
2021 | 1,338 | ||
Years 2022 through 2026 | 7,306 | ||
Total | $ | 14,054 | |
The Company expects to contribute approximately $0.5 million to the pension plan in 2017.
Investment objectives:
The primary investment goal of the pension plan is to achieve a total annualized return of 3.00% over the long-term. The investments are evaluated, compared and benchmarked to plans with similar investment strategies. The plan also attempts to minimize risk by not having any single security or class of securities with a disproportionate impact on the plan. As a guideline, assets are diversified by asset classes (equity, fixed income/bonds, and alternative investments).
The fair values of the plans assets at December 31, 2016 and 2015, by asset category, are as follows (in thousands):
Fair Value Measurements at | ||||||||||||||||
December 31, 2016 | ||||||||||||||||
Total | Active Market Prices (Level 1) | Significant Observable Inputs (Level 2) | Significant Unobservable Inputs (Level 3) | |||||||||||||
Cash held in Swiss Franc, Euro and USD | $ | 705 | $ | 705 | $ | — | $ | — | ||||||||
Equity securities: | ||||||||||||||||
Investment funds | 12,534 | 11,481 | 1,053 | — | ||||||||||||
Real estate investment funds | 17,034 | — | — | 17,034 | ||||||||||||
Fixed income / Bond securities: | 8,842 | 8,842 | — | — | ||||||||||||
Other assets (accounts receivable, assets at real estate management company) | 29 | — | 29 | — | ||||||||||||
Net assets of pension plan | $ | 39,144 | $ | 21,028 | $ | 1,082 | $ | 17,034 | ||||||||
Fair Value Measurements at | ||||||||||||||||
December 31, 2015 | ||||||||||||||||
Total | Active Market Prices (Level 1) | Significant Observable Inputs (Level 2) | Significant Unobservable Inputs (Level 3) | |||||||||||||
Cash held in Swiss Franc, Euro and USD | $ | 808 | $ | 808 | $ | — | $ | — | ||||||||
Equity securities: | ||||||||||||||||
Investment funds | 12,292 | 11,303 | 989 | — | ||||||||||||
Real estate investment funds | 16,917 | — | — | 16,917 | ||||||||||||
Fixed income / Bond securities: | 8,949 | 8,949 | — | — | ||||||||||||
Other assets (accounts receivable, assets at real estate management company) | 36 | — | 36 | — | ||||||||||||
Net assets of pension plan | $ | 39,002 | $ | 21,060 | $ | 1,025 | $ | 16,917 | ||||||||
76
Fair Value of Assets
Level 1: Observable inputs such as quoted prices in active markets for identical assets.
Level 2: Inputs other than quoted prices that are observable for the asset or liability, either directly or indirectly. These include quoted prices for similar assets or liabilities in active markets and quoted prices for identical or similar assets or liabilities in markets that are not active.
Level 3: Unobservable inputs that reflect the reporting entity’s own assumptions.
For those financial instruments with significant Level 3 inputs, the following table summarizes the activity for the year by investment type:
Description | Real estate investments | |||
Balance as of December 31, 2015 | $ | 16,917 | ||
Total unrealized gains included in net gain (1) | 575 | |||
Foreign currency translation adjustments | (458 | ) | ||
Balance as of December 31, 2016 | $ | 17,034 | ||
___________________
(1) | Total unrealized gains are reported as a component of the pension adjustment in accumulated other comprehensive income in the consolidated statement of stockholders’ equity. |
U.S. Plan
The Company has a postretirement benefit plan covering its employees in the United States. Substantially all U.S. employees are eligible to elect coverage under a contributory employee savings plan which provides for Company matching contributions based on one-half of employee contributions up to certain plan limits. The Company’s matching contributions under this plan totaled $0.5 million, $0.6 million and $0.5 million for the years ended December 31, 2016, 2015 and 2014, respectively.
Note 14—Legal Proceedings
Although the Company expects to incur legal fees in connection with the below legal proceedings, the Company is unable to estimate the amount of such legal fees and therefore, such fees will be expensed in the period the legal services are performed.
FCPA Matter
In January 2011, the Company reached settlements with the U.S. Securities and Exchange Commission (“SEC”) and the U.S. Department of Justice (“DOJ”) with respect to charges asserted by the SEC and DOJ relating to the anti-bribery, books and records, internal controls, and disclosure provisions of the U.S. Foreign Corrupt Practices Act (“FCPA”) and other securities laws violations. The Company paid the monetary penalties under these settlements in installments such that all monetary penalties were paid in full by January 2013. With respect to the DOJ charges, a judgment of dismissal was issued in the U.S. District Court for the Southern District of California on March 28, 2014.
On October 15, 2013, the Company received an informal notice from the DOJ that an indictment against the former Senior Vice President and General Manager of its Swiss subsidiary had been filed in the United States District Court for the Southern District of California. The indictment is against the individual, a former officer, and not against the Company and the Company does not foresee that further penalties or fines could be assessed against it as a corporate entity for this matter. However, the Company may be required throughout the term of the action to advance the legal fees and costs incurred by the individual defendant and to incur other financial obligations. While the Company maintains directors’ and officers’ insurance policies which are intended to cover legal expenses related to its indemnification obligations in situations such as these, the Company cannot determine if and to what extent the insurance policy will cover the ongoing legal fees for this matter. Accordingly, the legal fees that may be incurred by the Company in defending this former officer could have a material impact on its financial condition and results of operation.
77
Swiss Bribery Matter
In August 2013, the Company’s Swiss subsidiary was served with a search warrant from the Swiss federal prosecutor’s office. At the end of the search, the Swiss federal prosecutor presented the Company with a listing of the materials gathered by the representatives and then removed the materials from its premises for keeping at the prosecutor’s office. Based upon the Company’s exposure to the case, the Company believes this action to be related to the same or similar facts and circumstances as the FCPA action previously settled with the SEC and the DOJ. During initial discussions, the Swiss prosecutor has acknowledged both the existence of the Company’s deferred prosecution agreement with the DOJ and its cooperation efforts thereunder, both of which should have a positive impact on discussions going forward. Additionally, other than the activities previously reviewed in conjunction with the SEC and DOJ matters under the FCPA, the Company has no reason to believe that additional facts or circumstances are under review by the Swiss authorities. To date, the Swiss prosecutor has not issued its formal decision as to whether charges will be brought against individuals or the Company or whether the proceeding will be abandoned. At this stage in the investigation, the Company is currently unable to determine the extent to which it will be subject to fines in accordance with Swiss bribery laws and what additional expenses will be incurred in order to defend this matter. As such, the Company cannot determine whether there is a reasonable possibility that a loss will be incurred nor can it estimate the range of any such potential loss. Accordingly, the Company has not accrued an amount for any potential loss associated with this action, but an adverse result could have a material adverse impact on its financial condition and results of operation.
Government Investigations
In early 2013, the Company voluntarily provided information to the SEC and the United States Attorney’s Office for the Southern District of California related to its announcement that it intended to file restated financial statements for fiscal years 2011 and 2012. On June 11, 2015 and June 16, 2016, the Company received subpoenas from the SEC requesting certain documents related to, among other things, the facts and circumstances surrounding the restated financial statements. The Company has provided documents and information to the SEC in response to the subpoenas and continues to cooperate with the SEC. On September 6, 2016, the Company entered into a tolling agreement effective for the period beginning on September 12, 2016, and running through June 30, 2017, with the SEC related to these matters. At this stage, the Company cannot predict the ultimate outcome of this investigation or whether it will result in any loss. Accordingly, the Company has not accrued an amount for any potential loss associated with this action, but an adverse result could have a material adverse impact on its financial condition and results of operation.
78
Note 15—Unaudited Quarterly Financial Information
Quarter Ended | ||||||||||||||||||||||||
March 31 | June 30 | September 30 | December 31 | |||||||||||||||||||||
(in thousands except per share data) | ||||||||||||||||||||||||
Year Ended December 31, 2016 | ||||||||||||||||||||||||
Operating: | ||||||||||||||||||||||||
Total revenue | $ | 35,203 | $ | 34,135 | $ | 25,506 | $ | 26,400 | ||||||||||||||||
Gross profit | 9,653 | 9,981 | 7,628 | 5,708 | ||||||||||||||||||||
Net income (loss) | (6,848 | ) | (a) | 2,167 | (b) | (6,855 | ) | (c) | (12,169 | ) | (d) | |||||||||||||
Basic and diluted net loss per share | $ | (0.22 | ) | $ | 0.07 | $ | (0.21 | ) | $ | (0.38 | ) | |||||||||||||
Quarter Ended | ||||||||||||||||||||||||
March 31 | June 30 | September 30 | December 31 | |||||||||||||||||||||
(in thousands except per share data) | ||||||||||||||||||||||||
Year Ended December 31, 2015 | ||||||||||||||||||||||||
Operating: | ||||||||||||||||||||||||
Total revenue | $ | 34,670 | $ | 37,796 | $ | 45,076 | $ | 49,830 | ||||||||||||||||
Gross profit | 10,303 | 12,153 | 14,256 | 14,250 | ||||||||||||||||||||
Net income (loss) | (9,341 | ) | (e) | (9,376 | ) | (f) | (1,449 | ) | (g) | (2,167 | ) | (h) | ||||||||||||
Basic and diluted net income (loss) per share | $ | (0.32 | ) | $ | (0.31 | ) | $ | (0.05 | ) | $ | (0.07 | ) | ||||||||||||
_____________________
(a) | Includes non-cash expense for stock-based compensation of $1.2 million. |
(b) | Includes gain on sale of product line of $6.7 million, release of tax liability of $1.5 million and non-cash expense for stock-based compensation of $1.5 million. |
(c) | Includes non-cash expense for stock-based compensation of $1.1 million. |
(d) | Includes impairment of assets of $1.2 million, non-cash deferred tax expense of $1.2 million in connection with the probable repatriation of a portion of the unremitted earnings of a foreign subsidiary and non-cash expense for stock-based compensation of $1.6 million. |
(e) | Includes non-cash expense for stock-based compensation of $0.8 million. |
(f) | Includes restructuring and exit costs of $2.3 million, non-cash deferred tax expense of $2.1 million in connection with the probable repatriation of a portion of the unremitted earnings of a foreign subsidiary and non-cash expense for stock-based compensation of $1.0 million. |
(g) | Includes non-cash expense for stock-based compensation of $1.1 million. |
(h) | Includes non-cash expense for stock-based compensation of $1.0 million. |
79
Note 16—Subsequent Events
Localization Agreement
On January 25, 2017, the Company entered into a Localization Agreement (the “Agreement”) with CRRC Qingdao Sifang Rolling Stock Research Institute Co. Ltd. (“CRRC-SRI”) to localize manufacturing of its ultracapacitor-based modules for use in the China new energy bus market. Under the terms of the Agreement, localized production of its ultracapacitor-based modules is expected to begin in China in the second half of 2017.
The Agreement provides that the Company will transfer certain assets and grant an exclusive license to certain intellectual property and know-how, subject to appraisal of both the transferred assets and the grant of intellectual property rights and subject to certain regulatory approvals. Additionally, the Agreement requires CRRC-SRI to pay an up-front technology transfer fee of $3.0 million, with two additional contingent payments of $1.0 million that are payable if certain revenue metrics are achieved. Also, the Agreement provides for ongoing graduated royalties based upon net sales and which decrease over time.
Additionally, the Agreement contemplates additional sales and marketing services and design and engineering services to be performed by the Company over a period of two years. In exchange for these services and based in part upon achievement of milestones to be identified by the parties, the Agreement provides that the Localization Partner will pay the Company certain milestone payments.
Acquisition of Nesscap Energy, Inc.
On February 28, 2017, the Company entered into an Arrangement Agreement (the “Arrangement Agreement”) providing for the acquisition (the “Acquisition”) of substantially all of the assets and business of Nesscap Energy, Inc. (“Nesscap”), a developer and manufacturer of ultracapacitor products for use in transportation, renewable energy, industrial and consumer markets, for an aggregate purchase price of $23.2 million (the “Purchase Price”). The Company will pay the purchase price in full by issuing 4.6 million shares of its common stock, subject to adjustment as provided in the Arrangement Agreement (the “Share Consideration”). The Arrangement Agreement provides that Share Consideration may be subject to an adjustment upon the closing of the Acquisition based on the average closing price of the Company’s common stock for the ten (10) prevailing trading days on The Nasdaq Stock Market ending (and including) two (2) days prior to the closing in order to account for an increase or decrease to such per share price compared to the trading price used to calculate the Share Consideration at signing; provided, however, in any event, that any such increase or reduction in the Share Consideration is limited to a maximum adjustment of ten percent (10%). The Share Consideration represents approximately 14.28% of the Company’s outstanding shares, based on the number of shares of the Company’s outstanding common stock as of February 27, 2017 and assuming no adjustments. The Company expects the acquisition to be completed in the second quarter of 2017.
Consummation of the Acquisition also requires approval by a certain magnitude of Nesscap’s shareholders, the approval of the Canadian court, and is subject to various closing conditions, including that a material adverse effect will not have occurred to the Company or Nesscap. The Arrangement Agreement provides that Nesscap is subject to non-solicitation provisions and provides that the Nesscap Board may, under certain circumstances, terminate the Arrangement Agreement in favor of an unsolicited superior proposal, subject to the payment of a termination fee of USD $1 million to the Company, and subject to the Company’s right to match the superior proposal in question.
2017 Restructuring Plan
On February 28, 2017, the Board of Directors of the Company approved a comprehensive restructuring plan for the Company’s businesses that includes a wide range of organizational efficiency initiatives and other cost reduction opportunities. The Company estimates that it will incur total aggregate charges of approximately $0.8 million to $1.0 million from this restructuring, primarily based upon estimated severance and related costs. The Company expects that most of these charges will be cash expenditures and expects to recognize most of the charges related to this restructuring in the first quarter of fiscal 2017.
80
Schedule II
Valuation and Qualifying Accounts (in thousands)
Balance at the Beginning of the Year ($) | Charged to Expense ($) | Acquisitions/ Transfers and Other ($) | Write-offs Net of Recoveries ($) | Balance at the End of the Year ($) | |||||||||||
Allowance for Doubtful Accounts: | |||||||||||||||
December 31, 2014 | 134 | 61 | — | (52 | ) | 143 | |||||||||
December 31, 2015 | 143 | 304 | 1 | (196 | ) | 252 | |||||||||
December 31, 2016 | 252 | (106 | ) | — | (120 | ) | 26 | ||||||||
Allowance for Excess and Obsolete Inventories: | |||||||||||||||
December 31, 2014 | 3,570 | 892 | (24 | ) | (419 | ) | 4,019 | ||||||||
December 31, 2015 | 4,019 | 475 | (1 | ) | (1,114 | ) | 3,379 | ||||||||
December 31, 2016 | 3,379 | 397 | (2,323 | ) | (371 | ) | 1,082 | ||||||||
81
Item 9. | Changes in and Disagreements with Accountants on Accounting and Financial Disclosure |
None.
Item 9A. | Controls and Procedures |
Evaluation of Disclosure Controls and Procedures
We are committed to maintaining disclosure controls and procedures designed to ensure that information required to be disclosed in our periodic reports filed under the Securities and Exchange Act of 1934 (the “Exchange Act”) is recorded, processed, summarized and reported within the time periods specified in the SEC’s rules and forms, and that such information is accumulated and communicated to our management, including our Principal Executive Officer and Principal Financial Officer, as appropriate, to allow for timely decisions regarding required disclosure.
Under the supervision and with the participation of our management, including our Principal Executive Officer and Principal Financial Officer, we conducted an evaluation of the effectiveness of the design and operation of our disclosure controls and procedures as of December 31, 2016, as such term is defined under Rules 13a-15(e) and 15d-15(e) promulgated under the Exchange Act. Based on this evaluation, our Principal Executive Officer and Principal Financial Officer concluded that our disclosure controls and procedures were effective as of the end of the period covered by this Annual Report on Form 10-K.
Management’s Annual Report on Internal Control over Financial Reporting
Our management is responsible for establishing and maintaining adequate internal control over financial reporting, as such term is defined in Exchange Act Rules 13a-15(f) and 15d-15(f). Under the supervision and with the participation of our management, including our principal executive officer and principal financial officer, we conducted an evaluation of the effectiveness of our internal control over financial reporting based on the framework in Internal Control—Integrated Framework (2013) issued by the Committee of Sponsoring Organizations of the Treadway Commission.
Because of its inherent limitations, internal control over financial reporting is not intended to provide absolute assurance that a misstatement of our financial statements would be prevented or detected. Also, projections of any evaluation of effectiveness to future periods are subject to the risk that controls may become inadequate because of changes in conditions or because the degree of compliance with policies or procedures may deteriorate. Based on our evaluation under the framework in Internal Control—Integrated Framework (2013), management concluded that our internal control over financial reporting was effective as of December 31, 2016.
BDO USA, LLP, the independent registered public accounting firm that audited the consolidated financial statements of Maxwell in this Annual Report on Form 10-K, has issued an unqualified opinion on the effectiveness of our internal controls over financial reporting as of December 31, 2016 which is included in this Item under the heading “Report of Independent Registered Public Accounting Firm”.
Changes in Internal Control Over Financial Reporting
There have been no changes in our internal control over financial reporting that occurred during our last fiscal quarter that has materially affected, or is reasonably likely to materially affect, our internal control over financial reporting.
82
REPORT OF INDEPENDENT REGISTERED PUBLIC ACCOUNTING FIRM
Board of Directors and Stockholders
Maxwell Technologies, Inc.
San Diego, California
We have audited Maxwell Technologies, Inc.’s internal control over financial reporting as of December 31, 2016, based on criteria established in Internal Control - Integrated Framework (2013) issued by the Committee of Sponsoring Organizations of the Treadway Commission (the COSO criteria). Maxwell Technologies, Inc.’s management is responsible for maintaining effective internal control over financial reporting and for its assessment of the effectiveness of internal control over financial reporting, included in the accompanying “Item 9A, Management’s Annual Report on Internal Control over Financial Reporting”. Our responsibility is to express an opinion on the company’s internal control over financial reporting based on our audit.
We conducted our audit in accordance with the standards of the Public Company Accounting Oversight Board (United States). Those standards require that we plan and perform the audit to obtain reasonable assurance about whether effective internal control over financial reporting was maintained in all material respects. Our audit included obtaining an understanding of internal control over financial reporting, assessing the risk that a material weakness exists, and testing and evaluating the design and operating effectiveness of internal control based on the assessed risk. Our audit also included performing such other procedures as we considered necessary in the circumstances. We believe that our audit provides a reasonable basis for our opinion.
A company’s internal control over financial reporting is a process designed to provide reasonable assurance regarding the reliability of financial reporting and the preparation of financial statements for external purposes in accordance with generally accepted accounting principles. A company’s internal control over financial reporting includes those policies and procedures that (1) pertain to the maintenance of records that, in reasonable detail, accurately and fairly reflect the transactions and dispositions of the assets of the company; (2) provide reasonable assurance that transactions are recorded as necessary to permit preparation of financial statements in accordance with generally accepted accounting principles, and that receipts and expenditures of the company are being made only in accordance with authorizations of management and directors of the company; and (3) provide reasonable assurance regarding prevention or timely detection of unauthorized acquisition, use, or disposition of the company’s assets that could have a material effect on the financial statements.
Because of its inherent limitations, internal control over financial reporting may not prevent or detect misstatements. Also, projections of any evaluation of effectiveness to future periods are subject to the risk that controls may become inadequate because of changes in conditions, or that the degree of compliance with the policies or procedures may deteriorate.
In our opinion, Maxwell Technologies, Inc. maintained, in all material respects, effective internal control over financial reporting as of December 31, 2016, based on the COSO criteria.
We also have audited, in accordance with the standards of the Public Company Accounting Oversight Board (United States), the consolidated balance sheets of Maxwell Technologies, Inc. as of December 31, 2016 and 2015, and the related consolidated statements of operations, comprehensive loss, stockholders’ equity, and cash flows for each of the three years in the period ended December 31, 2016, and our report dated March 1, 2017 expressed an unqualified opinion thereon.
/s/ BDO USA, LLP
San Diego, California
March 1, 2017
83
Item 9B. | Other Information |
On March 1,2017 we entered into a fourth amendment (the “Fourth Amendment”) to our Loan and Security Agreement dated July 3, 2015, as amended from time to time, with East West Bank. The Fourth Amendment approves the acquisition of substantially all of the assets and business of Nesscap Energy, Inc., consents to the disposition of certain assets in connection with the Localization Agreement with CRRC Qingdao Sifang Rolling Stock Research Institute Co., Ltd., modifies the definition of EBITDA, and changes certain financial covenants, including the minimum EBITDA requirement beginning with the fiscal quarter ending December 31, 2016, and the quick ratio requirement beginning with the fiscal quarter ended December 31, 2017. The foregoing description of the Fourth Amendment does not purport to be complete and is qualified in its entirety by reference to a copy of the Fourth Amendment, which is filed as Exhibit 10.26 to this Annual Report on Form 10-K and is incorporated by reference herein.
84
PART III
DOCUMENTS INCORPORATED BY REFERENCE
The information required by Part III of this Annual Report on Form 10-K will be set forth in the registrant’s proxy statement for its 2017 annual meeting of stockholders (the “Proxy Statement”) and is incorporated herein by reference; provided that if the registrant does not file the Proxy Statement with the Securities and Exchange Commission (the “Commission”) within 120 days of its fiscal year ended December 31, 2016, the registrant will submit this information by filing an amendment to this Annual Report on Form 10-K prior to the end of such 120-day period.
Item 10. | Directors, Executive Officers and Corporate Governance |
The information required by this item will be set forth in the Proxy Statement and is incorporated in this Annual Report on Form 10-K by reference; provided that if the registrant does not file the Proxy Statement with the Commission within 120 days of its fiscal year ended December 31, 2016, the registrant will submit this information by filing an amendment to this Annual Report on Form 10-K prior to the end of such 120-day period.
Item 11. | Executive Compensation |
The information required by this item will be set forth in the Proxy Statement and is incorporated in this Annual Report on Form 10-K by reference; provided that if the registrant does not file the Proxy Statement with the Commission within 120 days of its fiscal year ended December 31, 2016, the registrant will submit this information by filing an amendment to this Annual Report on Form 10-K prior to the end of such 120-day period.
Item 12. | Security Ownership of Certain Beneficial Owners and Management and Related Stockholder Matters |
The information required by this item will be set forth in the Proxy Statement and is incorporated in this Annual Report on Form 10-K by reference; provided that if the registrant does not file the Proxy Statement with the Commission within 120 days of its fiscal year ended December 31, 2016, the registrant will submit this information by filing an amendment to this Annual Report on Form 10-K prior to the end of such 120-day period.
Item 13. | Certain Relationships and Related Transactions, and Director Independence |
The information required by this item will be set forth in the Proxy Statement and is incorporated in this Annual Report on Form 10-K by reference; provided that if the registrant does not file the Proxy Statement with the Commission within 120 days of its fiscal year ended December 31, 2016, the registrant will submit this information by filing an amendment to this Annual Report on Form 10-K prior to the end of such 120-day period.
Item 14. | Principal Accounting Fees and Services |
The information required by this item will be set forth in the Proxy Statement and is incorporated in this Annual Report on Form 10-K by reference; provided that if the registrant does not file the Proxy Statement with the Commission within 120 days of its fiscal year ended December 31, 2016, the registrant will submit this information by filing an amendment to this Annual Report on Form 10-K prior to the end of such 120-day period.
85
PART IV
Item 15. | Exhibits and Financial Statement Schedules |
(a) | Documents filed as part of this report. |
1. | Financial Statements. The consolidated financial statements required by this item are submitted in a separate section beginning on page 48 of this Annual Report on Form 10-K. |
2. | Financial Statement Schedules. The financial statement schedule entitled “Valuation and Qualifying Accounts” required by this item is submitted in a separate section beginning on page 81 of this Annual Report on Form 10-K. |
3. | Exhibits. |
Exhibit Number | Description of Document | ||
3.1 | Restated Certificate of Incorporation of Registrant. (5) | ||
3.2 | Certificate of Amendment of Restated Certificate of Incorporation of Registrant, dated November 22, 1996. (3) | ||
3.3 | Certificate of Amendment of Restated Certificate of Incorporation of Registrant, dated February 9, 1998. (1) | ||
3.4 | Certificate of Amendment of Restated Certificate of Incorporation of Registrant, dated June 15, 2016. (16) | ||
3.5 | Amended and Restated Bylaws of Registrant. (2) | ||
10.1 | Indemnity Agreement for Directors of Registrant dated December 2003. (6) | ||
10.2 | Registrant’s 2005 Omnibus Equity Incentive Plan, as amended through May 6, 2010. (7) ** | ||
10.3 | Form of Restricted Stock Unit Award Agreement under the 2005 Omnibus Equity Incentive Plan. (8) ** | ||
10.4 | Form of Restricted Stock Agreement for Service-based Awards under the 2005 Omnibus Equity Incentive Plan, as amended through May 6, 2010. (9) ** | ||
10.5 | Form of Restricted Stock Agreement for Performance-based Awards under the 2005 Omnibus Equity Incentive Plan, as amended through May 6, 2010. (9) ** | ||
10.6 | Amended and Restated 2004 Employee Stock Purchase Plan of Registrant. (4) ** | ||
10.7 | Registrant’s 2013 Omnibus Equity Incentive Plan. (4) ** | ||
10.8 | Form of Option Agreement under the 2013 Omnibus Incentive Plan. (10) ** | ||
10.9 | Form of Restricted Stock Unit Agreement under the 2013 Omnibus Equity Incentive Plan. (11) ** | ||
10.10 | Form of Performance Restricted Stock Unit Agreement under the 2013 Omnibus Equity Incentive Plan. (10) ** | ||
10.11 | Form of Market Stock Unit Award Agreement under the 2013 Omnibus Equity Incentive Plan. (14) ** | ||
10.12 | Maxwell Technologies, Inc. Incentive Bonus Plan. (14) ** | ||
10.13 | Maxwell Technologies, Inc. Severance and Change in Control Plan. (14) ** | ||
10.14 | Transition Agreement and Release of All Claims between the Registrant and Kevin S. Royal, dated May 8, 2015. (12) ** | ||
10.15 | Employment Agreement between the Registrant and David Lyle, dated May 8, 2015. (12) ** | ||
10.16 | Amendment to Employment Agreement between the Registrant and David Lyle, dated January 15, 2016. (14) ** | ||
10.17 | Employment Agreement between the Registrant and Franz Fink, dated April 25, 2014. (15) ** | ||
10.18 | Amendment to Employment Agreement between the Registrant and Franz Fink, dated January 15, 2016. (14) ** | ||
10.19 | Loan and Security Agreement between the Registrant and East West Bank, dated July 3, 2015. (13) | ||
10.20 | Agreement, dated as of March 11, 2016, by and among the Registrant and Viex Capital Advisors, LLC and its affiliates. (17) | ||
86
Exhibit Number | Description of Document | ||
10.21 | Asset Purchase Agreement by and between the Registrant and Data Device Corporation, dated April 12, 2016 (excluding schedules and exhibits, which the registrant agrees to furnish supplementally to the Securities and Exchange Commission upon request, pursuant to the provisions of Regulation S-K, Item 601(b)(2)). (18) | ||
10.22 | Amendment No. 1 to Loan and Security Agreement between the Registrant and East West Bank, dated April 12, 2016. (18) | ||
10.23 | Amendment No. 2 to Loan and Security Agreement between the Registrant and East West Bank, dated July 27, 2016. (19) | ||
10.24 | Amendment No. 3 to Loan and Security Agreement between the Registrant and East West Bank, dated October 31, 2016. (20) | ||
10.25 | Localization Agreement, dated January 25, 2017, by and between the Company and CRRC Qingdao Sifang Rolling Stock Research Institute Co., Ltd.*† | ||
10.26 | Amendment No. 4 to Loan and Security Agreement between the Registrant and East West Bank, dated March 1, 2017. * | ||
21.1 | List of Subsidiaries of Registrant. * | ||
23.1 | Consent of Independent Registered Public Accounting Firm. * | ||
31.1 | Certification of Chief Executive Officer pursuant to Rule 13a-14(a) (Section 302 Certification) as adopted pursuant to Section 302 of the Sarbanes-Oxley Act of 2002. * | ||
31.2 | Certification of Chief Financial Officer pursuant to Rule 13a-14(a) (Section 302 Certification) as adopted pursuant to Section 302 of the Sarbanes-Oxley Act of 2002. * | ||
32.1 | Certification of Chief Executive Officer pursuant to 18 U.S.C. Section 1350, as adopted pursuant to Section 906 of the Sarbanes-Oxley Act of 2002. * | ||
32.2 | Certification of Chief Financial Officer pursuant to 18 U.S.C. Section 1350, as adopted pursuant to Section 906 of the Sarbanes-Oxley Act of 2002. * | ||
101 | The following financial statements and footnotes from the Maxwell Technologies, Inc. Annual Report on Form 10-K for the year ended December 31, 2016 formatted in Extensible Business Reporting Language (XBRL): (i) Consolidated Balance Sheets; (ii) Consolidated Statements of Operations; (iii) Consolidated Statements of Comprehensive Income (Loss); (iv) Consolidated Statements of Stockholders’ Equity; (v) Consolidated Statements of Cash Flows; and (vi) the Notes to Consolidated Financial Statements. * | ||
_________
* | Filed herewith. |
** | Management contract or compensatory plan or arrangement of the company required to be filed as an exhibit. |
† | This Exhibit has been filed separately with the Secretary of the Securities and Exchange Commission without redaction pursuant to a Confidential Treatment Request under Rule 24b-2 of the Securities Exchange Act of 1934, as amended. |
(1) | Incorporated herein by reference to Registrant’s Annual Report on Form 10-K for the fiscal year ended July 31, 1999 (SEC file no. 000-10964). |
(2) | Incorporated herein by reference to Registrant’s Current Report on Form 8-K filed with the SEC on January 5, 2016(SEC file no. 001-15477). |
(3) | Incorporated herein by reference to Registrant’s Annual Report on Form 10-K for the fiscal year ended July 31, 1997 (SEC file no. 000-10964). |
(4) | Incorporated herein by reference to Registrant’s Schedule 14A for the 2013 Annual Meeting of Stockholders filed with the SEC on October 30, 2013 (SEC file no. 001-15477). |
(5) | Incorporated herein by reference to Registrant’s Annual Report on Form 10-K for the fiscal year ended July 31, 1987 (SEC file no. 000-10964). |
(6) | Incorporated herein by reference to Registrant’s Annual Report on Form 10-K for the fiscal year ended December 31, 2003 (SEC file no. 001-15477). |
87
(7) | Incorporated herein by reference to Registrant’s Current Report on Form 8-K filed with the SEC on May 10, 2010 (SEC file no. 001-15477). |
(8) | Incorporated herein by reference to Registrant’s Quarterly Report on Form 10-Q filed with the SEC on August 10, 2009 (SEC file no. 001-15477). |
(9) | Incorporated herein by reference to Registrant’s Annual Reports on Form 10-K for the fiscal year ended December 31, 2010 (SEC file no. 001-15477). |
(10) | Incorporated herein by reference to Registrant’s Current Report on Form 8-K filed with the SEC on March 17, 2015 (SEC file no. 001-15477). |
(11) | Incorporated herein by reference to Registrant’s Current Report on Form 8-K/A filed with the SEC on March 23, 2015 (SEC file no. 001-15477). |
(12) | Incorporated herein by reference to Registrant’s Current Report on Form 8-K filed with the SEC on May 11, 2015 (SEC file no. 001-15477). |
(13) | Incorporated herein by reference to Registrant’s Current Report on Form 8-K filed with the SEC on July 7, 2015 (SEC file no. 001-15477). |
(14) | Incorporated by reference to the Registrant’s Current Report on Form 8-K filed with the SEC on January 19, 2016 (SEC file no. 001-15477). |
(15) | Incorporated by reference to the Registrant’s Current Report on Form 8-K filed with the SEC on May 1, 2014 (SEC file no. 001-15477). |
(16) | Incorporated by reference to the Registrant’s Current Report on Form 8-K filed with the SEC on June 15, 2016 (SEC file no. 001-15477). |
(17) | Incorporated by reference to the Registrant’s Current Report on Form 8-K filed with the SEC on March 14, 2016 (SEC file no. 001-15477). |
(18) | Incorporated by reference to the Registrant’s Current Report on Form 8-K filed with the SEC on April 12, 2016 (SEC file no. 001-15477). |
(19) | Incorporated herein by reference to Registrant’s Current Report on Form 8-K filed with the SEC on August 3, 2016 (SEC file no. 001-15477). |
(20) | Incorporated herein by reference to Registrant’s Current Report on Form 8-K filed with the SEC on November 2, 2016 (SEC file no. 001-15477). |
(b) | See the exhibits required by this item under Item 15(a)(3) above. |
(c) | See the financial statement schedule required by this item under Item 15(a)(2) above. |
Item 16. Form 10-K Summary.
None.
88
SIGNATURES
Pursuant to the requirements of Section 13 or 15(d) of the Securities Exchange Act of 1934, the registrant has duly caused this report to be signed on its behalf by the undersigned, thereunto duly authorized, on this 1st day of March 2017.
MAXWELL TECHNOLOGIES, INC. | |||
By: | /S/ FRANZ FINK | ||
Franz Fink President and Chief Executive Officer | |||
POWER OF ATTORNEY
KNOW ALL PERSONS BY THESE PRESENTS, that each of the undersigned hereby constitutes and appoints Franz Fink and David Lyle, jointly and severally, as his or her true and lawful attorneys-in-fact and agents, each with full power of substitution and resubstitution, for him or her and on his or her behalf to sign, execute and file this Annual Report on Form 10-K and any or all amendments to this Annual Report on Form 10-K, and to file the same, with all exhibits thereto and any and all documents required to be filed with respect therewith, with the Securities and Exchange Commission or any regulatory authority, granting unto such attorneys-in-fact and agents full power and authority to do and perform each and every act and thing requisite and necessary to be done in connection therewith and about the premises in order to effectuate the same as fully to all intents and purposes as he or she might or could do if personally present, hereby ratifying and confirming all that such attorneys-in-fact and agents, or his or her substitute or substitutes, may lawfully do or cause to be done.
Pursuant to the requirements of the Securities Exchange Act of 1934, this report has been signed below by the following persons on behalf of the registrant and in the capacities and on the dates indicated.
Signature | Title | Date | ||
/s/ FRANZ FINK | President and Chief Executive Officer | March 1, 2017 | ||
Franz Fink | (Principal Executive Officer) | |||
/s/ DAVID LYLE | Senior Vice President, Chief Financial Officer, Treasurer and Secretary | March 1, 2017 | ||
David Lyle | ||||
(Principal Financial and Accounting Officer) | ||||
/s/ RICK BERGMAN | Director | March 1, 2017 | ||
Rick Bergman | ||||
/s/ STEVEN BILODEAU | Director | March 1, 2017 | ||
Steven Bilodeau | ||||
/s/ JÖRG BUCHHEIM | Director | March 1, 2017 | ||
Jörg Buchheim | ||||
/s/ BURKHARD GOESCHEL | Director | March 1, 2017 | ||
Burkhard Goeschel | ||||
/s/ ROBERT L. GUYETT | Director | March 1, 2017 | ||
Robert L. Guyett | ||||
/s/ ROGER HOWSMON | Director | March 1, 2017 | ||
Roger Howsmon | ||||
/s/ YON YOON JORDEN | Director | March 1, 2017 | ||
Yon Yoon Jorden | ||||
/s/ DAVID SCHLOTTERBECK | Director | March 1, 2017 | ||
David Schlotterbeck | ||||
89