Attached files
| file | filename |
|---|---|
| EX-32.2 - EXHIBIT 32.2 - MASONITE INTERNATIONAL CORP | a2016form10-kxex322.htm |
| EX-32.1 - EXHIBIT 32.1 - MASONITE INTERNATIONAL CORP | a2016form10-kxex321.htm |
| EX-31.2 - EXHIBIT 31.2 - MASONITE INTERNATIONAL CORP | a2016form10-kxex312.htm |
| EX-31.1 - EXHIBIT 31.1 - MASONITE INTERNATIONAL CORP | a2016form10-kxex311.htm |
| EX-23.1 - EXHIBIT 23.1 - MASONITE INTERNATIONAL CORP | a2016form10-kxex231.htm |
| EX-21.1 - EXHIBIT 21.1 - MASONITE INTERNATIONAL CORP | a2016form10-kxex211.htm |
| EX-10.5(F) - EXHIBIT 10.5(F) - MASONITE INTERNATIONAL CORP | a2016form10-kxex105f.htm |
| EX-10.4(M) - EXHIBIT 10.4(M) - MASONITE INTERNATIONAL CORP | a2016form10-kxex104m.htm |
| EX-10.3(V) - EXHIBIT 10.3(V) - MASONITE INTERNATIONAL CORP | a2016form10-kxex103v.htm |
| EX-10.3(U) - EXHIBIT 10.3(U) - MASONITE INTERNATIONAL CORP | a2016form10-kxex103u.htm |
| EX-10.3(T) - EXHIBIT 10.3(T) - MASONITE INTERNATIONAL CORP | a2016form10-kxex103t.htm |
| EX-10.3(S) - EXHIBIT 10.3(S) - MASONITE INTERNATIONAL CORP | a2016form10-kxex103s.htm |
UNITED STATES
SECURITIES AND EXCHANGE COMMISSION
Washington, D.C. 20549
FORM 10-K |
x ANNUAL REPORT PURSUANT TO SECTION 13 OR 15(d) OF THE SECURITIES EXCHANGE ACT OF 1934
For the fiscal year ended January 1, 2017
or
¨ TRANSITION REPORT PURSUANT TO SECTION 13 OR 15(d) OF THE SECURITIES EXCHANGE ACT OF 1934
For the transition period from _____ to _____
Commission File Number: 001-11796
____________________________
 |
Masonite International Corporation
(Exact name of registrant as specified in its charter)
____________________________
British Columbia, Canada (State or other jurisdiction of incorporation or organization) | 98-0377314 (I.R.S. Employer Identification No.) | |
2771 Rutherford Road
Concord, Ontario L4K 2N6 Canada
(Address of principal executive offices, zip code)
(800) 895-2723
(Registrant’s telephone number, including area code)
____________________________
Securities Registered Pursuant to Section 12(b) of the Act:
Common Stock (no par value) | New York Stock Exchange | |
(Title of class) | (Name of exchange on which registered) | |
Securities Registered Pursuant to Section 12(g) of the Act: None
Indicate by check mark if the registrant is a well-known seasoned issuer, as defined in Rule 405 of the Securities Act. Yes x No o
Indicate by check mark if the registrant is not required to file reports pursuant to Section 13 or Section 15(d) of the Act. Yes o No x
Indicate by check mark whether the registrant: (1) has filed all reports required to be filed by Section 13 or 15(d) of the Securities Exchange Act of 1934 during the preceding 12 months (or for such shorter period that the registrant was required to file such reports), and (2) has been subject to such filing requirements for the past 90 days. Yes x No o
Indicate by check mark whether the registrant has submitted electronically and posted on its corporate Website, if any, every Interactive Data File required to be submitted and posted pursuant to Rule 405 of Regulation S-T (§232.405 of this chapter) during the preceding 12 months (or for such shorter period that the registrant was required to submit and post such files). Yes x No ¨
Indicate by check mark if disclosure of delinquent filers pursuant to Item 405 of Regulation S-K (§229.405 of this chapter) is not contained herein, and will not be contained, to the best of registrant’s knowledge, in definitive proxy or information statements incorporated by reference in Part III of this Form 10-K or any amendment to this Form 10-K. o
Indicate by check mark whether the registrant is a large accelerated filer, an accelerated filer, a non-accelerated filer or a smaller reporting company. See the definitions of “large accelerated filer,” “accelerated filer” and “smaller reporting company” in Rule 12b-2 of the Exchange Act.
Large accelerated filer | x | Accelerated filer | o | |||
Non-accelerated filer | o (Do not check if a smaller reporting company) | Smaller reporting company | o | |||
Indicate by check mark whether the registrant is a shell company (as defined in Rule 12b-2 of the Exchange Act). Yes o No x
As of July 3, 2016, the last business day of the registrant’s most recently completed second fiscal quarter, the aggregate market value of the shares of voting common stock held by non-affiliates of the registrant, computed by reference to the closing sales price of such shares on the New York Stock Exchange on July 3, 2016, was $2.0 billion.
Indicate by check mark whether the registrant has filed all documents and reports required to be filed by Section 12, 13 or 15(d) of the Securities Exchange Act of 1934 subsequent to the distribution of the securities under a plan confirmed by a court. Yes x No o
The registrant had outstanding 29,769,978 shares of Common Stock, no par value, as of February 24, 2017.
DOCUMENTS INCORPORATED BY REFERENCE
Portions of the registrant’s definitive Proxy Statement for its 2017 Annual General Meeting of Shareholders scheduled to be held on May 11, 2017, to be filed with the Securities and Exchange Commission not later than 120 days after January 1, 2017, are incorporated by reference into Part III, Items 10-14 of this Annual Report on Form 10-K.
|
MASONITE INTERNATIONAL CORPORATION
INDEX TO ANNUAL REPORT ON FORM 10-K
January 1, 2017
Page No. | |||
PART I | |||
Item 1 | |||
Item 1A | |||
Item 1B | |||
Item 2 | |||
Item 3 | |||
Item 4 | |||
PART II | |||
Item 5 | |||
Item 6 | |||
Item 7 | |||
Item 7A | |||
Item 8 | |||
Item 9 | |||
Item 9A | |||
Item 9B | |||
PART III | |||
Item 10 | |||
Item 11 | |||
Item 12 | |||
Item 13 | |||
Item 14 | |||
PART IV | |||
Item 15 | |||
i
SPECIAL NOTE REGARDING FORWARD-LOOKING STATEMENTS
This Annual Report on Form 10-K contains "forward-looking statements" within the meaning of the federal securities laws, including, without limitation, statements concerning the conditions in our industry, our operations, our economic performance and financial condition, including, in particular, statements relating to our business and growth strategy and product development efforts under "Management’s Discussion and Analysis of Financial Condition and Results of Operations." Forward-looking statements include all statements that do not relate solely to historical or current facts and can be identified by the use of words such as "may," "might," "will," "should," "estimate," "project," "plan," "anticipate," "expect," "intend," "outlook," "believe" and other similar expressions. You are cautioned not to place undue reliance on these forward-looking statements, which speak only as of their dates. These forward-looking statements are based on estimates and assumptions by our management that, although we believe to be reasonable, are inherently uncertain and subject to a number of risks and uncertainties. These risks and uncertainties include, without limitation, those identified under "Risk Factors" and elsewhere in this Annual Report.
The following list represents some, but not necessarily all, of the factors that could cause actual results to differ from historical results or those anticipated or predicted by these forward-looking statements:
• | our ability to successfully implement our business strategy; |
• | general economic, market and business conditions; |
• | levels of residential new construction; residential repair, renovation and remodeling; and non-residential building construction activity; |
• | the United Kingdom's vote to leave, and its eventual exit from, the European Union; |
• | competition; |
• | our ability to manage our operations including integrating our recent acquisitions and companies or assets we acquire in the future; |
• | our ability to generate sufficient cash flows to fund our capital expenditure requirements, to meet our pension obligations, and to meet our debt service obligations, including our obligations under our senior notes and our ABL Facility; |
• | labor relations (i.e., disruptions, strikes or work stoppages), labor costs and availability of labor; |
• | increases in the costs of raw materials or any shortage in supplies; |
• | our ability to keep pace with technological developments; |
• | the actions taken by, and the continued success of, certain key customers; |
• | our ability to maintain relationships with certain customers; |
• | the ability to generate the benefits of our restructuring activities; |
• | retention of key management personnel; |
• | environmental and other government regulations; and |
• | limitations on operating our business as a result of covenant restrictions under our existing and future indebtedness, including our senior notes and our ABL Facility. |
We caution you that the foregoing list of important factors is not exclusive. In addition, in light of these risks and uncertainties, the matters referred to in the forward-looking statements contained in this Annual Report may not in fact occur. We undertake no obligation to publicly update or revise any forward-looking statement as a result of new information, future events or otherwise, except as otherwise required by law.
ii
PART I
Unless we state otherwise or the context otherwise requires, in this Annual Report all references to "Masonite", "we", "us", "our" and the "Company" refer to Masonite International Corporation and its subsidiaries.
Item 1. Business
Overview
We are a leading global designer, manufacturer and distributor of interior and exterior doors for the new construction and repair, renovation and remodeling sectors of the residential and non-residential building construction markets. Since 1925, we have provided our customers with innovative products and superior service at compelling values. In order to better serve our customers and create sustainable competitive advantages, we focus on developing innovative products, advanced manufacturing capabilities and technology-driven sales and service solutions. Today, we believe we hold either the number one or two market positions in the seven product categories we target in North America: interior molded residential doors; interior stile and rail residential doors; exterior fiberglass residential doors; exterior steel residential doors; interior architectural wood doors; wood veneers and molded door facings; and door core.
We market and sell our products to remodeling contractors, builders, homeowners, retailers, dealers, lumberyards, commercial and general contractors and architects through well-established wholesale and retail distribution channels. Our broad portfolio of brands, including Masonite®, Marshfield®, Premdor®, Mohawk®, Megantic®, Algoma®, Birchwood Best®, Lemieux®, Door-StopTM, Harring DoorsTM, Performance Doorset SolutionsTM and National HickmanTM are among the most recognized in the door industry and are associated with innovation, quality and value. In the year ended January 1, 2017, we sold approximately 35 million doors to more than 7,000 customers in 65 countries. Our fiscal year 2016 net sales by segment and global net sales of doors by end market are set forth below:
Net Sales by Segment - 2016 | Global Net Sales of Doors by End Market - 2016 | |
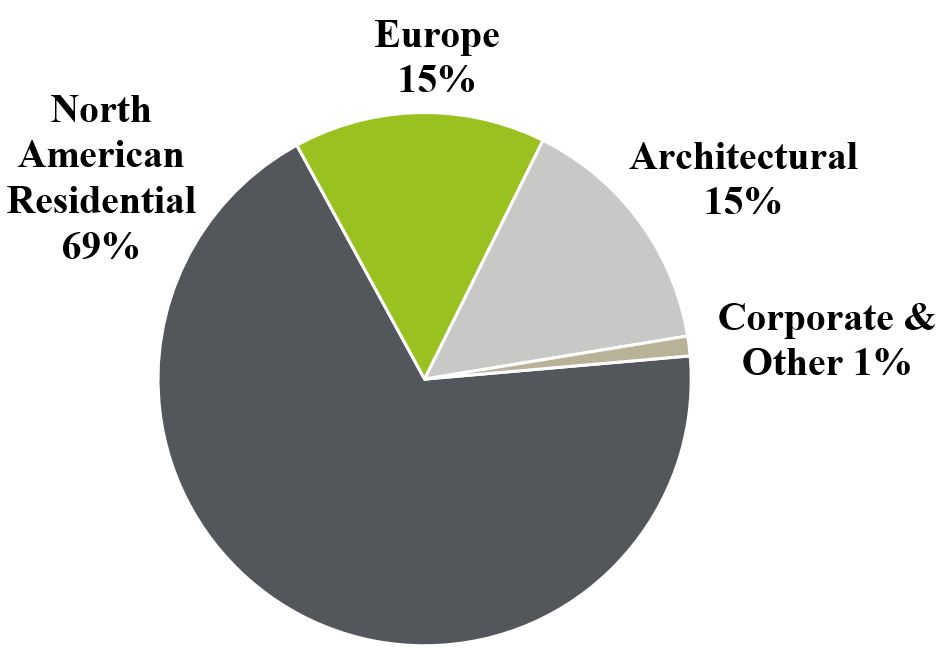 | 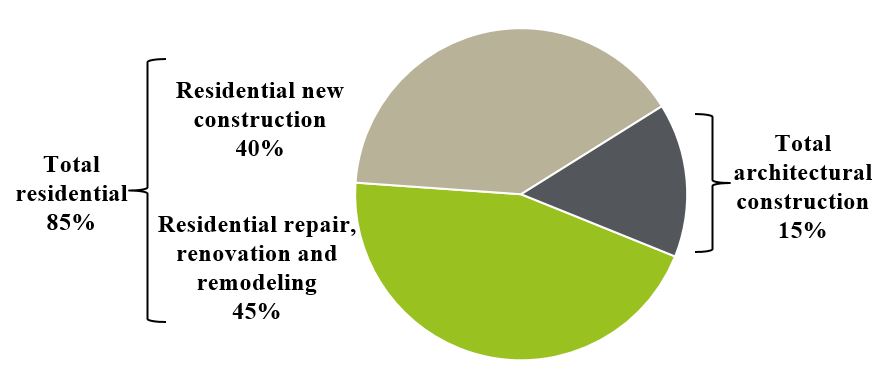 | |
See Note 15 to our consolidated financial statements for additional information about our segments.
Over the past several years, we have invested in advanced technologies to increase the automation of our manufacturing processes, increase quality and shorten lead times and introduced targeted e-commerce and other marketing initiatives to improve our sales and marketing efforts and customer experience. In addition, we implemented a disciplined acquisition strategy that solidified our presence in both the North American residential molded and stile and rail interior door markets and created leadership positions in the attractive North American commercial and architectural interior wood door, door core and wood veneer markets.
We operate 64 manufacturing and distribution facilities in 8 countries in North America, Europe, South America and Asia, which are strategically located to serve our customers. We are one of the few vertically integrated door manufacturers in the world and one of only two in the North American residential door industry as well as the only vertically integrated door manufacturer in the North American architectural interior wood door industry. Our vertical
1
integration extends to all steps of the production process from initial design, development and production of steel press plates to produce interior molded and exterior fiberglass door facings to the manufacturing of door components, such as door cores, wood veneers and molded facings, to door slab assembly. We also offer incremental value by pre-machining doors for hardware, hanging doors in frames with glass and hardware and pre-finishing doors with paint or stain. We believe that our vertical integration and automation enhance our ability to develop new and proprietary products, provide greater value and improved customer service and create high barriers to entry. We also believe vertical integration enhances our ability to cut costs, although our cost structure is subject to certain factors beyond our control, such as global commodity shocks.
Competitive Strengths
We believe the following competitive strengths differentiate us from other building product companies and position us for significant growth as part of a multi-year, multi stage recovery in our end markets.
Leading Market Positions in Targeted End Markets
Within the North American door market, we believe we hold either the number one or two market position in the seven product categories we target. We are one of the largest manufacturers of doors and door components in the world, selling approximately 35 million residential and architectural interior and exterior doors in 2016; approximately 23 million of which were sold in the United States, our largest market. We believe our scale and leadership positions support our commitment to invest in advanced manufacturing and e-commerce initiatives and develop innovative new products, to effectively service regional and national customers and to offer broad product lines across our markets, while reducing our materials and unit production costs.
Extensive Portfolio with Strong Brand Recognition
Our broad portfolio of brands is among the most recognized in the door industry and is associated with superior design, innovation, reliability and quality. Builder Magazine recognized the Masonite® brand as one of the leading interior door brands in the United States in 2016 in the following categories: Brand Familiarity, Brand Used in Past Two Years and Brand Used the Most.
Long-Term Customer Relationships and Well-Established Multi-Channel Distribution
As a result of our longstanding commitment to customer service and product innovation, we have well-established relationships within the wholesale and retail channels. All of our top 20 customers have purchased doors from us for at least 10 years, although we generally do not enter into long-term contracts with our customers and they generally do not have an obligation to purchase our products. In addition, our manufacturing and distribution facilities are strategically located to best serve our customers. We believe that our long-term relationships with leading retailers, wholesale distributors, major homebuilders, contractors and architects will enable us to continue to increase our market penetration in the residential and architectural construction markets.
Leading Technological Innovation Within the Door Industry
We believe we are a leader in technological innovation in the design of doors and door components and in the complex processes required to manufacture high quality products quickly and consistently. We intend to continue developing new and innovative products at our 145 thousand square foot innovation center in West Chicago, Illinois, while improving critical processes in the manufacturing and selling of our products. Our future success will depend on our ability to develop and introduce new or improved products, to continue to improve our manufacturing and product service processes, and to protect our rights to the technologies used in our products. We have also created proprietary web-based sales and marketing tools, including MAX Masonite Xpress Configurator® for our residential and DoorbuilderTM for our architectural customer networks, to improve selection and order processes, reduce order entry errors, create more accurate quotes, improve communication and facilitate a better customer experience. As of January 1, 2017, we had 223 design patents and design patent applications and 178 utility patents and patent applications in the United States, and 195 foreign design patents and patent applications and 271 foreign utility patents and patent applications.
2
Vertically Integrated Operations Across the Production Process
We are one of the few vertically integrated door manufacturers in the world. In North America, we are one of only two vertically integrated manufacturers of residential doors and the only vertically integrated manufacturer of non-residential interior wood doors. Our vertical integration extends across the production process, which we believe enhances our ability to develop products and respond quickly to changing consumer preferences, provides greater value and better service for our customers, and potentially lowers our costs. We leverage our assets through our vertically integrated operations in a manner that is difficult to replicate without significant capital investment.
Experienced Management Team with Extensive Experience and a Successful Track Record
We are managed by results-driven executives with a proven track record of successfully managing multiple brands, winning new business, reducing costs and identifying, executing and integrating strategic acquisitions. Several members of our management team previously worked at Fortune 500 companies, including Honeywell International Inc. (formerly AlliedSignal Inc.), General Motors Company, General Electric Company and Newell Rubbermaid Inc., where they utilized advanced technologies to improve cost structures and create competitive advantages.
Growth Strategy
Our vision is to be the premier provider of doors and door components for the global door industry. We are committed to executing the following balanced and complementary strategies to continue to further strengthen our leadership positions, create value for our customers, enhance our portfolio of leading brands and achieve our top and bottom line growth objectives.
Develop Innovative, Market-Leading Products
We intend to continue developing new and innovative products to grow our sales and enhance our returns. On average we have introduced more than 200 new products and designs in each of the last three years. We plan to capitalize on the anticipated growth in door demand by continuing to introduce new, value-added products to build upon our comprehensive portfolio of door styles, designs, textures, components, options, applications and materials. We have consistently demonstrated the ability to develop products that are differentiated by compelling design features and recognized for their reliability and quality. For example, we recently introduced the Heritage® Series of doors that feature recessed, flat panels and sharp, Shaker-style profiles which speak to a clean, modern aesthetic while retaining comfortable familiarity found in today’s interiors. We are extending our Heritage Series to exterior doors with the introduction of the Heritage Craftsman exterior fiberglass door line.
Expand our Presence in Attractive Markets to Accelerate Growth and Improve Margins
We plan to continue to focus our operations on attractive new market and channel opportunities. For example, we believe we can expand our leading position in the North American architectural wood door market by focusing on strategic sectors within this market, such as education, health care and hospitality. By expanding our market presence and achieving greater economies of scale, we intend to capitalize on the anticipated recovery in the U.S. non-residential construction market. Additionally, we believe we can expand our market growth in the architectural wood door market through the introduction of products with high design and performance attributes by focusing on certain markets within our Europe segment. We are also focused on expanding our business in the residential new construction market and with professional repair, renovation and remodeling contractors, both domestically and internationally.
We are also increasing our focus on multi-location in-home remodeling distributors and contractors. This channel is expected to grow with a shift in certain demographics from a "Do it Yourself" to a "Do it For You" offering. Using enhanced marketing, training and e-commerce tools, our teams plan to target specific multi-location remodeling distributors and contractors and attempt to increase our overall presence in the important repair, renovation and remodeling business.
3
Leverage Our Marketing, Sales and Customer Service Activities to Further Drive Sales
We intend to continue to pursue additional growth opportunities by leveraging our extensive sales, marketing and customer service efforts in innovative ways. For example, we have developed several proprietary web-based tools for our customers, including MAX Masonite Xpress Configurator®, MC2 and MConnectTM, to enhance communication and information flow with our customers in our wholesale dealer network by providing a more customized buying experience, customer leads and quoting capabilities and simplifying the procurement process. We also intend to capture additional share in the attractive professional repair, renovation and remodeling markets by helping professional contractors produce customized marketing materials to assist them in their sales efforts. In addition, we plan to continue developing effective marketing initiatives to expand our business with professional dealers and homebuilders.
Continue to Pursue Operational Excellence
As part of our commitment to continuous improvement we have launched initiatives to make our operations lean and efficient. We launched the Lean Six Sigma Continuous Improvement program in 2006. In 2015 we expanded our commitment by adopting a complete lean operating philosophy through the introduction of MVantage, Masonite’s Lean Advantage System. MVantage is a continuous improvement system centered around three key tenants: People, the Lean Management Operating System and Lean Tools. After a pilot program at two manufacturing sites, we introduced MVantage at 28 additional manufacturing sites in the United States, Canada, Mexico, Ireland and the United Kingdom in 2016. In 2017, we plan to implement MVantage in additional key operations in the United States and the United Kingdom. Our 2017 plans will focus on driving sustained rapid improvement through rigorous dedication to the key tenants of MVantage. We believe that our commitment to MVantage will not only assist Masonite in its efforts to set the industry benchmark for innovation, quality, delivery, service and support but also help improve safety, productivity, and financial performance.
Pursue Strategic Acquisitions to Create Leadership Positions
We intend to continue our disciplined approach to identifying, executing and integrating strategic acquisitions while maintaining a strong balance sheet, although we expect competition for the best candidates. We target companies who produce components for our existing operations, manufacture niche products and provide value-added services. Additionally, we target companies with strong brands, complementary technologies, attractive geographic footprints and opportunities for cost and distribution synergies. For example, from 2011 to 2016 we made twelve strategic acquisitions to create leadership positions in (i) the attractive North American architectural wood door and door core market through the acquisitions of Porta Industries, Inc. (“Marshfield”), Algoma Holding Company (“Algoma”), Les Portes Baillargeon, Inc. (“Baillargeon”), Harring Doors Corporation ("Harring"), USA Wood Door, Inc. ("USA Wood Door") and FyreWerks Inc. ("FyreWerks"), (ii) the North American interior stile and rail residential door market through the acquisitions of Portes Lemieux Inc. (“Lemieux”) and the assets of a door manufacturing operation located in Chile (the "Chile" acquisition) for servicing the North American market, (iii) the production and sale of wood veneers with the acquisition of Birchwood Lumber & Veneer Co., Inc. (“Birchwood”) and (iv) various markets in the United Kingdom with the acquisitions of Door-Stop International Limited ("Door-Stop"), Performance Doorset Solutions Limited ("PDS") and Hickman Industries Limited ("Hickman").
Product Lines
Residential Doors
We sell an extensive range of interior and exterior doors in a wide array of designs, materials, and sizes. While substantially all interior doors are made with wood and related materials such as hardboard (including wood composite molded and flat door facings), the use of wood in exterior doors in North America and Europe has declined over the last two decades as a result of the increased penetration of steel and fiberglass doors. Our exterior doors are made primarily of steel or fiberglass. Our residential doors are molded panel, flush, stile and rail, routed medium-density fiberboard (“MDF”), steel or fiberglass.
Molded panel doors are interior doors available either with a hollow or solid core and are made by assembling two molded door skin panels around a wood or MDF frame. Molded panel doors are routinely used for closets, bedrooms, bathrooms and hallways. Our molded panel product line is subdivided into five distinct product groups: our original Molded Panel series is a combination of classic styling, durable construction, and variety of design preferred by
4
our customers when price sensitivity is a critical component in the product selection; our Palazzo® series is comprised of three distinct patented designs that accentuate the beauty and flexibility of molding wood fiber to replicate high end, historically labor intensive door designs; the four doors within our Anniversary Collection® embody themed, period, and architectural style specific designs; the West EndTM Collection, strengthens our tradition of design innovation by introducing the clean and simple aesthetics found in modern linear designs to the molded panel interior door category; and our newest introduction to the molded panel line, the Heritage® Series, which features recessed, flat panels and sharp, Shaker-style profiles which speak to a clean, modern aesthetic while retaining comfortable familiarity found in today’s interiors. All of our molded panel doors except for the Palazzo® series can be upgraded with our proprietary, wheat straw based Safe ‘N Sound® door core or our environmentally friendly EmeraldTM door construction which enables home owners, builders, and architects to meet specific product requirements and “green” specifications to attain LEED certification for a building or dwelling.
Flush interior doors are available either with a hollow or solid core and are made by assembling two facings of plywood, MDF, composite wood, or hardboard over a wood or MDF frame. These doors can either have a wood veneer surface suitable for paint or staining or a composite wood surface suitable for paint. Our flush doors range from base residential flush doors consisting of unfinished composite wood, to the ultrahigh end exotic wood veneer doors.
Stile and rail doors are made from wood or MDF with individual vertical stiles, horizontal rails and panels, which have been cut, milled, veneered, and assembled from lumber such as clear pine, knotty pine, oak and cherry. Within our stile and rail line, glass panels can be inserted to create what is commonly referred to as a French door and we have over 50 glass designs for use in making French doors. Where horizontal slats are inserted between the stiles and rails, the resulting door is referred to as a louver door. For interior purposes stile and rail doors are primarily used for hallways, room dividers, closets and bathrooms. For exterior purposes these doors are used as entry doors with decorative glass inserts (known as lites) often inserted into these doors.
Routed MDF doors are produced by using a computer controlled router carver to machine a single piece of double refined MDF. Our routed MDF door category is comprised of two distinct product lines known as the Bolection® and CymaTM door. The offering of designs in this category is extensive, as the manufacturing of routed MDF doors is based on a routing program where the milling machine selectively removes material to reveal the final design.
Steel doors are exterior doors made by assembling two interlocking steel facings (paneled or flat) or attaching two steel facings to a wood or steel frame and injecting the core with polyurethane insulation. With our functional Utility Steel series, the design centric High Definition family, and the prefinished Sta-Tru® HD, we offer customers the freedom to select the right combination of design, protection, and compliance required for essentially any paint grade exterior door application. In addition, our product offering is significantly increased through our variety of compatible clear or decorative glass designs.
Fiberglass doors are considered premier exterior doors and are made by assembling two fiberglass door facings to a wood frame or composite material and injecting the core with polyurethane insulation. Led by the Barrington® door, our fiberglass door lines offer innovative designs, construction, and finishes. The Barrington® family of doors is specifically designed to replicate the construction, look, and feel of a real wood door. The Door-StopTM branded fiberglass doors are manufactured into prehung door sets and shipped to our customers with industry-leading lead times. We believe that our patented panel designs, sophisticated wood grain texturing and multiple application-specific construction processes will help our Barrington® and Belleville® fiberglass lines retain a distinct role in the exterior product category in the future.
Architectural Doors
Architectural doors are typically highly specified products designed, constructed, and tested to ensure regulatory compliance and that certification requirements such as FSC and LEED certifications are met. We offer an extensive line of architectural interior doors meeting custom market requirements and ranging from the entry level molded panel doors to the high end custom designed flush wood doors with exotic veneer inlay designs. Our architectural doors are molded panel, flush, stile and rail, or routed MDF and can be offered with varying levels of fire and sound rating as well as radiation shielding. Our architectural flush doors can also be produced with a laminate veneer facing. High pressure laminates are used when durability and aesthetics are the customer’s main concern, while low pressure laminates are utilized when consistency in surface color, texture, and value are equal requirements.
5
Components
In addition to residential and architectural doors, we also sell several door components to the building materials industry. Within the residential new construction market, we provide interior door facings, agri-fiber and particleboard door cores, MDF and wood cut-stock components to multiple manufacturers. Within the architectural building construction market, we are a leading component supplier of various critical door components and the largest wood veneer door skin supplier. Additionally, we are one of the leading providers of mineral and particleboard door cores to the North American architectural door market.
Molded door facings are thin sheets of molded hardboard produced by grinding or defibrating wood chips, adding resin and other ingredients, creating a thick fibrous mat composed of dry wood fibers and pressing the mat between two steel press plates to form a molded sheet, the surface of which may be smooth or may contain a wood grain pattern. Following pressing, molded door facings are trimmed, painted and shipped to door manufacturing plants where they are mounted on frames to produce molded doors.
Door framing materials, commonly referred to as cut stock, are wood or MDF components that constitute the frame on which interior and exterior door facings are attached. Door cores are pressed fiber mats of refined wood chips or agri-fiber used in the construction of solid core doors. For doors that must achieve a fire rating higher than 45 minutes, the door core consists of an inert mineral core or inorganic intumescent compounds.
New Products
We develop and engineer innovative products designed to influence the mix of products sold and provide the end user with doors and entry systems that enhance beauty and functionality while creating greater value to our customers. For example, on average we have introduced over 200 new products or product designs in each of the past three years, including three interior designs and a new exterior design in the Heritage Collection of doors that feature recessed, flat panels and sharp, Shaker-style profiles which speak to a clean, modern aesthetic while retaining comfortable familiarity found in today’s designs. We recently added new glass sizes and a fir textured offering to our Vista Grande line of exterior fiberglass doors that integrate glass into the door in a seamless assembly, giving a wider view through the door and clean, modern design lines. We also recently introduced our Barn Door Hardware kits to provide contemporary style to interior openings.
More consumers are requesting products that are factory finished. We continue to develop and invest in factory finished products tailored to the needs of our residential and architectural markets.
Sales and Marketing
Our sales and marketing efforts are focused around several key initiatives designed to drive organic growth, influence the mix sold and strengthen our customer relationships.
Multi-Level/Segment Distribution Strategy
We market our products through and to wholesale distributors, retail stores, independent and pro dealers, builders, remodelers, architects, door and hardware distributors and general contractors.
In the residential market, we deploy an "All Products" cross merchandising strategy, which provides certain of our retail and wholesale customers with access to our entire product range. Our "All Products" customers benefit from consolidating their purchases, leveraging our branding, marketing and selling strategies and improving their ability to influence the mix of products sold to generate greater value. We service our big box retail customers directly from our own door fabrication facilities which provide value added services and logistics, including store direct delivery of doors and entry systems and a full complement of in-store merchandising, displays and field service. Our wholesale residential channel customers are managed by our own sales professionals who focus on down channel initiatives designed to ensure our products are "pulled" through our North American wholesale distribution network.
6
Our architectural building construction customers are serviced by a separate and distinct sales team providing architects, door and hardware distributors, general contractors and project owners a wide variety of technical specifications, specific brand differentiation, compliance and regulatory approvals, product application advice and multisegment specialization work across North America. Additionally, our sales team is supported by marketing strategies aimed to drive product specification throughout our value chains via distributors, architects and end users.
Service Innovation
We leverage our marketing, sales and customer service activities to ensure our products are strategically pulled through our multiple distribution channels rather than deploying a more common, tactical "push" strategy like some of our competitors. Our marketing approach is designed to increase the value of each and every door opening we fill with our doors and entry systems, regardless of the channel being used to access our products.
Our proprietary web based tools accessible on our website also provide our customers with a direct link to our information systems to allow for accelerated and easier access to a wide variety of information and selling aids designed to increase customer satisfaction. Within our North American Residential business, our web-based tools include MConnect®, an online service allowing our customers access to several other E-Commerce tools designed to enhance the manufacturer-customer relationship. Once connected to our system, customers have access to MAX®,
Masonite’s Xpress Configurator®, a web based tool created to design customized door systems and influence the mix, improve selection and ordering processes, reduce order entry and quoting errors, and improve overall communication throughout the channel; MC2, our self-service, custom literature tool; the Product Corner, a section advising customers of the features and benefits of our newest products; Market Intelligence Section, which provides some of the latest economic statistics influencing our industry; the Treasure Chest, which is a collection of discontinued glass products providing customers with promotional based pricing on obsolete products; and Order Tracker, which allows customers to follow their purchase orders through the production process and confirm delivery dates. MConnect®, in conjunction with our website, improves transaction execution, enhances communication and information flow with our customers and their dealers providing a more customized buying experience. In Europe, our Door-Stop International website is a fully functional configuration and order platform that supports our entry door customers in the United Kingdom. The dynamic integration of Door-Stop's ERP and its website ensure that the products customers see, configure and order are in stock, which ensures that we are able to deliver on our promise of dependability. In our Architectural business, we have constructed a dedicated ordering platform for our distribution customers through our USA Wood Door website, which affords customers the ability to configure and purchase prefinished and machined wood doors through the streamlined Door Builder utility. Architectural distributors are able to make, retain and track quotes all within the USA Wood Door application.
Customers
During fiscal year 2016, we sold our products worldwide to more than 7,000 customers. We have developed strong relationships with these customers through our "All Products" cross merchandising strategy. Our vertical integration facilitates our "All Products" strategy with our door fabrication facilities in particular providing value-added fabrication and logistical services to our customers, including store delivery of pre-hung interior and exterior doors to our customers in North America. All of our top 20 customers have purchased doors from us for at least 10 years.
Although we have a large number of customers worldwide, our largest customer, The Home Depot, accounted for approximately 16% of our total net sales in fiscal year 2016. Due to the depth and breadth of the relationship with this customer, which operates in multiple North American geographic regions and which sells a variety of our products, our management believes that this relationship is likely to continue.
Distribution
Residential doors are primarily sold through wholesale and retail distribution channels.
• | Wholesale. In the wholesale channel, door manufacturers sell their products to homebuilders, contractors, lumber yards, dealers and building products retailers in two-steps or one step. Two-step distributors typically purchase doors from manufacturers in bulk and customize them by installing windows, or "lites", and pre-hanging them. One-step distributors sell doors directly to homebuilders and remodeling contractors who install the doors. |
7
• | Retail. The retail channel generally targets consumers and smaller remodeling contractors who purchase doors through retail home centers and smaller specialty retailers. Retail home centers offer large, warehouse size retail space with large selections, while specialty retailers are niche players that focus on certain styles and types of doors. |
Architectural doors are primarily sold through specialized one-step wholesale distribution channels where distributors sell to contractors and installers, or direct from manufacturers to contractors and installers.
Research and Development
We believe we are a leader in technological innovation and development of doors, door components and door entry systems and the manufacturing processes involved in making such products. We believe that research and development is a competitive advantage for us, and we intend to capitalize on our leadership in this area through the development of more new and innovative products. Our research and development and engineering capabilities enable us to develop and implement product and manufacturing process improvements that enhance the manufacturing efficiency of our products, improve quality and reduce costs.
As an integrated manufacturer, we believe that we are well positioned to take advantage of the growing global demand for a variety of molded door facing designs. We have an internal capability to create new molded door facing designs and manufacture our own molds for use in our own facilities. We believe this provides us with the ability to develop proprietary designs that enjoy a strong identity in the marketplace; more flexibility in meeting customer demand; quicker reaction time in the production of new designs or design changes; and greater responsiveness to customer needs. This capability also enables us to develop and implement product and process improvements with respect to the production of molded door facings and doors which enhance production efficiency and reduce costs.
In the past few years, our research and development activities have had a significant focus on process and material improvements in our products. These improvements have led to reductions in manufacturing costs and improvements in product quality. We have also directed our design innovation to address the growing need for safety and security, sound dampening and fire resistant products in the architectural wood door market.
Manufacturing Process
Our Manufacturing operations consist of three major manufacturing processes: (1) component manufacturing, (2) door slab assembly and (3) value-added ready to install door fabrication.
We have a leading position in the manufacturing of door components, including internal framing components (stile and rails), glass inserts (lites), door core, interior veneer and molded door facings, and exterior door facings. The manufacturing of interior molded door facings is the most complex of these processes requiring a significant investment in large scale wood fiber processing equipment. Interior molded door facings are produced by combining fine wood particles, synthetic resins and other additives under heat and pressure in large multi-opening automated presses utilizing Masonite proprietary steel plates. The facings are then painted, cut and inspected in a second highly automated continuous operation prior to being packed for shipping to our door assembly plants. We operate five interior molded door facing plants around the world, two in North America and one in each of South America, Europe and Asia. Our sole United States based plant in Laurel, Mississippi is one of the largest door facing plants in the world and we believe one of the most technologically advanced in the industry.
Interior residential hollow and solid core door manufacturing is an assembly operation that is primarily accomplished in the United States through the use of skilled manual labor and, at some plants, highly automated lines which are based on single flow principles and the use of advanced engineering processes and quality control features to assemble doors more quickly and reliably than before. Whether manual or automated, the construction process for a standard flush or molded interior door is based on assembly of door facings and various internal framing and support components, following which doors are trimmed to their final specifications.
The assembly process varies by type of door, from a relatively simple process for flush and molded doors, where the door facings are glued to a wood frame, to more complex processes where many pieces of solid and engineered wood are converted to louver or stile and rail door slabs. Architectural interior doors require another level of
8
customization and sophistication employing the use of solid cores with varying degrees of sound dampening and fire retarding attributes, furniture quality wood veneer facings, as well as secondary machining operations to incorporate more sophisticated commercial hardware, openers and locks. Additionally, architectural doors are typically pre-finished prior to sale.
The manufacturing of steel and fiberglass exterior door slabs is a semi-automated process that entails combining laminated wood or rot free composite framing components between two door facings and then injecting the resulting hollow core structure with insulating polyurethane expanding foam core materials. We invested in fiberglass manufacturing technology, including the vertical integration of our own fiberglass sheet molding compound plant at our Laurel, Mississippi, facility in 2006. In 2008 we consolidated fiberglass slab manufacturing from multiple locations throughout North America into a single highly automated facility in Dickson, Tennessee, significantly improving the reliability and quality of these products while simultaneously lowering cost and reducing lead times.
Short set-up times, proper production scheduling and coordinated material movement are essential to achieve a flexible process capable of producing a wide range of door types, sizes, materials and styles. We make use of our vertically integrated and flexible manufacturing operations together with scalable logistics primarily through the use of common carriers to fill customers’ orders and to minimize our investment in finished goods inventory.
Finally, interior flush and molded, stile and rail, louver and exterior door slabs manufactured at our door assembly plants are either sold directly to our customers or transferred to our door fabrication facilities where value added services are performed. These value added services include machining doors for hinges and locksets, installing the door slabs into ready to install frames, installing hardware, adding glass inserts and side lites, painting and staining, packaging and logistical services to our customers.
Raw Materials
While Masonite is vertically integrated, we require a regular supply of raw materials, such as wood chips and cut stock, various composites, steel, glass, paint, stain and primer as well as petroleum-based products such as binders, resins and plastic injection frames to manufacture and assemble our products. Our materials cost accounts for approximately 54% of the total cost of the finished product. In certain instances, we depend on a single or limited number of suppliers for these supplies. Wood chips, logs, resins, binders and other additives utilized in the manufacturing of interior molded facings, exterior fiberglass door facings and door cores are purchased from global, regional and local suppliers taking into consideration the relative freight cost of these materials. Internal framing components, MDF, cut stock and internal door cores are manufactured internally at our facilities and supplemented from suppliers located throughout the world. We utilize a network of suppliers based in North America, Europe, South America and Asia to purchase other components including steel coils for the stamping of steel door facings, MDF, plywood and hardboard facings, door jambs and frames and glass frames and inserts.
Safety
We believe that safety is as important to our success as productivity and quality. We also believe that incidents can be prevented through proper management, employee involvement, standardized operations and equipment and attention to detail. Safety programs and training are provided throughout the company to ensure employees and managers have effective tools to help identify and address both unsafe conditions and at-risk behaviors.
Through a sustained commitment to improve our safety performance, we have been successful in reducing the number of injuries sustained by our employees over the long term. However, in 2016 we experienced a total incident rate, or the annual number of injuries per 100 full time equivalent employees, of 1.7 compared to 1.4 in 2015. We believe that the increase was due to a combination of significant changes at many of our plants, including increasing production, converting temporary labor to full time employees and changes to our shift structures.
Environmental and Other Regulatory Matters
We strive to minimize any adverse environmental impact our operations might have to our employees, the general public and the communities of which we are a part. We are subject to extensive environmental laws and regulations. The geographic breadth of our facilities subjects us to environmental laws, regulations and guidelines in a number of jurisdictions, including, among others, the United States, Canada, Mexico, the United Kingdom, the
9
Republic of Ireland, the Czech Republic, Chile and Malaysia. Such laws, regulations and guidelines relate to, among other things, the discharge of contaminants into water and air and onto land, the storage and handling of certain regulated materials used in the manufacturing process, waste minimization, the disposal of wastes and the
remediation of contaminated sites. Many of our products are also subject to various regulations such as building and construction codes, product safety regulations, health and safety laws and regulations and mandates related to energy efficiency.
Our efforts to ensure environmental compliance include the review of our operations on an ongoing basis utilizing in-house staff and on a selective basis by specialized environmental consultants. The Environmental, Health and Safety team participates in industry groups to monitor developing regulatory actions and actively develop comments on specific issues. Furthermore, for our prospective acquisition targets, environmental assessments are conducted as part of our due diligence review process. Based on recent experience and current projections, environmental protection requirements and liabilities are not expected to have a material effect on our business, capital expenditures, operations or financial position.
In addition to the various environmental laws and regulations, our operations are subject to numerous foreign, federal, state and local laws and regulations, including those relating to the presence of hazardous materials and protection of worker health and safety, consumer protection, trade, labor and employment, tax, and others. We believe we are in compliance in all material respects with existing applicable laws and regulations affecting our operations.
Intellectual Property
In North America, our doors are marketed primarily under the Masonite® brand. Other North American brands include: Premdor®, Belleville®, Barrington®, Oakcraft®, Sta-Tru® HD, AvantGuard®, Flagstaff®, Hollister®, Sierra®, Specialty®, Fast-Frame®, Safe ’N Sound®, Palazzo Series®, Heritage®, Bellagio®, Capri®, Treviso®, Cheyenne®, Glenview®, Riverside®, Saddlebrook®, West EndTM, Mohawk®, Megantic®, Marshfield®, Birchwood Best®, Algoma®, NovodorTM, ArtisanTM, Artisan SFTM, RhinoDoor®, WeldrockTM, SuperstileTM, UnicolTM, Lemieux®, Harring DoorsTM and FyreWerks®. In Europe, doors are marketed under the Masonite®, Premdor®, CrosbyTM, Door-StopTM, Performance Doorset SolutionsTM and National HickmanTM brands. We consider the use of trademarks and trade names to be important in the development of product awareness, and for differentiating products from competitors and between customers.
We protect the intellectual property that we develop through, among other things, filing for patents in the United States and various foreign countries. In the United States, we currently have 223 design patents and design patent applications and 178 utility patents and patent applications. We currently have 195 foreign design patents and patent applications and 271 foreign utility patents and patent applications. Our U.S. utility patents are generally applicable for 20 years from the earliest filing date, our U.S. design patents for 15 years and our U.S. registered trademarks and trade names are generally applicable for 10 years and are renewable. Our foreign patents and trademarks have terms as set by the particular country, although trademarks generally are renewable.
Competition
The North American door industry is highly competitive and includes a number of global and local participants. In the North American residential interior door market, the primary participants are Masonite and JELD-WEN, which are the only vertically integrated manufacturers of door facings. There are also a number of smaller competitors in the residential interior door market that primarily source door facings from third party suppliers. In the North American residential exterior door market, the primary participants are Masonite, JELD-WEN, Plastpro, Therma-Tru, Feather River and Novatech. In the North American non-residential building construction door market, the primary participants are Masonite, VT Industries, Graham Wood Doors and Eggers Industries. Our primary market in Europe is the United Kingdom. The United Kingdom door industry is similarly competitive, including a number of global and local participants. The primary participants in the United Kingdom are our subsidiary Premdor, JELD-WEN, Vicaima and Distinction Doors. Competition in these markets is primarily based on product quality, design characteristics, brand awareness, service ability, distribution capabilities and value. We also face competition in the other countries in which we operate. In Europe, South America and Asia, we face significant competition from a number of regionally based competitors and importers.
10
A large portion of our products are sold through large home centers and other large retailers. The consolidation of our customers and our reliance on fewer larger customers has increased the competitive pressures as some of our largest customers, such as The Home Depot, perform periodic product line reviews to assess their product offerings and suppliers.
We are one of the largest manufacturers of molded door facings in the world. The rest of the industry consists of one other large, integrated door manufacturer and a number of smaller regional manufacturers. Competition in the molded door facing business is based on quality, price, product design, logistics and customer service. We produce molded door facings to meet our own requirements and outside of North America we serve as an important supplier to the door industry at large. We manufacture molded door facings at our facilities in Mississippi, Ireland, Chile, Canada and Malaysia.
Employees
As of January 1, 2017, we employed approximately 10,200 employees and contract personnel. This includes approximately 2,600 unionized employees, approximately 80% of whom are located in North America with the remainder in various foreign locations. Ten of our North American facilities have individual collective bargaining agreements, which are negotiated locally and the terms of which vary by location.
History and Reporting Status
Masonite was founded in 1925 in Laurel, Mississippi, by William H. Mason, to utilize vastly available quantities of sawmill waste to manufacture a usable end product. Masonite was acquired by Premdor from International Paper Company in August 2001.
Prior to 2005, Masonite was a public company with shares of our predecessor’s common stock listed on both the New York and Toronto Stock Exchanges. In March 2005, we were acquired by an affiliate of Kohlberg Kravis Roberts & Co. L.P.
On March 16, 2009, Masonite International Corporation and several affiliated companies, voluntarily filed to reorganize under the Company's Creditors Arrangement Act (the "CCAA") in Canada in the Ontario Superior Court of Justice. Additionally, Masonite International Corporation and Masonite Inc. (the former parent of the Company) and all of its U.S. subsidiaries filed voluntary petitions for reorganization under Chapter 11 of the U.S. Bankruptcy Code in the U.S. Bankruptcy Court in the District of Delaware. On June 9, 2009, we emerged from reorganization proceedings under the CCAA in Canada and under Chapter 11 of the U.S. Bankruptcy Code in the United States.
Effective July 4, 2011, pursuant to an amalgamation under the Business Corporations Act (British Columbia), Masonite Inc. amalgamated with Masonite International Corporation to form an amalgamated corporation named Masonite Inc., which then changed its name to Masonite International Corporation.
On September 9, 2013, our shares commenced listing on the New York Stock Exchange under the symbol "DOOR" and we became subject to periodic reporting requirements under the United States federal securities laws. We are currently not a reporting issuer, or the equivalent, in any province or territory of Canada and our shares are not listed on any recognized Canadian stock exchange.
Our United States executive offices are located at One Tampa City Center, 201 North Franklin Street, Suite 300, Tampa, Florida 33602 and our Canadian executive offices are located at 2771 Rutherford Road, Concord, Ontario L4K 2N6 Canada.
Available Information
We make our Annual Reports on Form 10-K, Quarterly Reports on Form 10-Q, Current Reports on Form 8-K and any amendments to those reports filed or furnished pursuant to Section 13(a) or 15(d) of the Securities Exchange Act of 1934 available through our website, free of charge, as soon as reasonably practicable after we electronically file such material with, or furnish it to, the Securities and Exchange Commission. Our website is www.masonite.com. Information on our website does not constitute part of this Annual Report on Form 10-K.
11
Item 1A. Risk Factors
You should carefully consider the following factors in addition to the other information set forth in this Annual Report before investing in our common shares. The risks and uncertainties described below are not the only ones facing us. If any of the following risks actually occur, our business, financial condition or results of operations would likely suffer. In such case, the trading price of our common shares could fall, and you may lose all or part of your investment.
Risks Related to Our Business
Downward trends in our end markets or in economic conditions could negatively impact our business and financial performance.
Our business may be adversely impacted by changes in United States, Canadian, European, Asian, South American or global economic conditions, including inflation, deflation, interest rates, availability and cost of capital, consumer spending rates, energy availability and costs, and the effects of governmental initiatives to manage economic conditions. Volatility in the financial markets in the regions in which we operate and the deterioration of national and global economic conditions have in the past and could in the future materially adversely impact our operations, financial results and liquidity.
Trends in our primary end markets (residential new construction, repair, renovation and remodeling and non-residential building construction) directly impact our financial performance because they are directly correlated to the demand for doors and door components. Accordingly, the following factors may have a direct impact on our business in the countries and regions in which our products are sold:
• | the strength of the economy; |
• | the amount and type of residential and non-residential construction; |
• | housing sales and home values; |
• | the age of existing home stock, home vacancy rates and foreclosures; |
• | non-residential building occupancy rates; |
• | increases in the cost of raw materials or any shortage in supplies or labor; |
• | the availability and cost of credit; |
• | employment rates and consumer confidence; and |
• | demographic factors such as immigration and migration of the population and trends in household formation. |
In the United States, the housing market crisis had a negative impact on residential housing construction and related product suppliers. In addition, the current housing recovery is characterized by new construction levels still well below historical levels, and at times including an increased number of multi-family new construction starts, which generally use fewer of our products and generate less net sales at a lower margin than typical single family homes.
In many of the non-North American markets in which we manufacture and sell our products, economic conditions deteriorated as various countries suffered from the after effects of the global financial downturn that began in the United States in 2006. Certain of our non-North American markets were acutely affected by the housing downturn and future downturns could cause excess capacity in housing and building products, including doors and door products, which may make it difficult for us to raise prices. Due in part to both market and operating conditions, we exited certain markets in the past several years, including the Ukraine, Turkey, Romania, Hungary, Poland, Israel, France and South Africa.
Our relatively narrow focus within the building products industry amplifies the risks inherent in a prolonged global market downturn. The impact of this weakness on our net sales, net income and margins will be determined by many factors, including industry capacity, industry pricing, and our ability to implement our business plan.
12
Increases in mortgage rates, changes in mortgage interest deductions and the reduced availability of financing for the purchase of new homes and home construction and improvements could have a material adverse impact on our sales and profitability.
In general, demand for new homes and home improvement products may be adversely affected by increases in mortgage rates and the reduced availability of consumer financing. Mortgage rates are near historic lows but have recently increased and will likely increase in the future. If mortgage rates increase and, consequently, the ability of prospective buyers to finance purchases of new homes or home improvement products is adversely affected, our business, financial condition and results of operations may be materially and adversely affected.
Members of Congress and government officials have from time to time suggested the elimination of the mortgage interest deduction for federal income tax purposes, either entirely or in part, based on borrower income, type of loan or principal amount. Future changes in policies set to encourage home ownership and improvement, such as changes to the tax rules allowing for deductions of mortgage interest, may adversely impact demand for our products and have a material adverse impact on us.
Our performance may also depend upon consumers having the ability to finance the purchase of new homes and other buildings and repair and remodeling projects with credit from third-parties. The ability of consumers to finance these purchases is affected by such factors as new and existing home prices, homeowners’ equity values, interest rates and home foreclosures. Adverse developments affecting any of these factors could result in a tightening of lending standards by financial institutions and reduce the ability of some consumers to finance home purchases or repair and remodeling expenditures. The most recent economic downturn, including declining home and other building values, increased home foreclosures and tightening of credit standards by lending institutions, have negatively impacted the home and other building new construction and repair and remodeling sectors. If these credit market trends continue or worsen, our net sales and net income may be adversely affected.
We operate in a competitive business environment. If we are unable to compete successfully, we could lose customers and our sales could decline.
The building products industry is highly competitive. Some of our principal competitors may have greater financial, marketing and distribution resources than we do and may be less leveraged than we are, providing them with more flexibility to respond to new technology or shifting consumer demand. Accordingly, these competitors may be better able to withstand changes in conditions within the industry in which we operate and may have significantly greater operating and financial flexibility than we do. Also, certain of our competitors may have excess production capacity, which may lead to pressure to decrease prices in order for us to remain competitive and may limit our ability to raise prices even in markets where economic and market conditions have improved. For these and other reasons, these competitors could take a greater share of sales and cause us to lose business from our customers or hurt our margins.
As a result of this competitive environment, we face pressure on the sales prices of our products. Because of these pricing pressures, we may in the future experience limited growth and reductions in our profit margins, sales or cash flows, and may be unable to pass on future raw material price, labor cost and other input cost increases to our customers which would also reduce profit margins.
Because we depend on a core group of significant customers, our sales, cash flows from operations and results of operations may be negatively affected if our key customers reduce the amount of products they purchase from us.
Our customers consist mainly of wholesalers, retail home centers and contractors. Our top ten customers together accounted for approximately 44% of our net sales in fiscal year 2016, while our largest customer, The Home Depot, accounted for approximately 16% of our net sales in fiscal year 2016. We expect that a small number of customers will continue to account for a substantial portion of our net sales for the foreseeable future. However, net sales from customers that have accounted for a significant portion of our net sales in past periods, individually or as a group, may not continue in future periods, or if continued, may not reach or exceed historical levels in any period. For example, our largest customer, The Home Depot, performs periodic line reviews to assess its product offerings, which have, on past occasions, led to loss of business and pricing pressures. In addition, as a result of competitive bidding processes, we may not be able to increase or maintain the margins at which we sell our products to our most significant customers. Moreover, if any of these customers fails to remain competitive in the respective markets or encounters
13
financial or operational problems, our net sales and profitability may decline. We generally do not enter into long-term contracts with our customers and they generally do not have an obligation to purchase products from us. Therefore, we could lose a significant customer with little or no notice. The loss of, or a significant adverse change in, our relationships with The Home Depot or any other major customer could cause a material decrease in our net sales.
Our competitors may adopt more aggressive sales policies and devote greater resources to the development, promotion and sale of their products than we do, which could result in a loss of customers. The loss of, or a reduction in orders from, any significant customers, losses arising from customer disputes regarding shipments, fees, merchandise condition or related matters, or our inability to collect accounts receivable from any major customer, could have a material adverse effect on us. Also, we have no operational or financial control over these customers and have limited influence over how they conduct their businesses.
Consolidation of our customers and their increasing size could adversely affect our results of operations.
In many of the countries in which we operate, an increasingly large number of building products are sold through large retail home centers and other large retailers. In addition, we have experienced consolidation of distributors in our wholesale distribution channel and among businesses operating in different geographic regions resulting in more customers operating nationally and internationally. If the consolidation of our customers and distributors were to continue, leading to the further increase of their size and purchasing power, we may be challenged to continue to provide consistently high customer service levels for increasing sales volumes, while still offering a broad portfolio of innovative products and on-time and complete deliveries. If we fail to provide high levels of service, broad product offerings, competitive prices and timely and complete deliveries, we could lose a substantial amount of our customer base and our profitability, margins and net sales could decrease. Consolidation of our customers could also result in the loss of a customer or a substantial portion of a customer's business.
If we are unable to accurately predict future demand preferences for our products, our business and results of operations could be materially affected.
A key element to our continued success is the ability to maintain accurate forecasting of future demand preferences for our products. Our business in general is subject to changing consumer and industry trends, demands and preferences. Changes to consumer shopping habits and potential trends towards "online" purchases could also impact our ability to compete as we currently sell our products mainly through our distribution channel. Our continued success depends largely on the introduction and acceptance by our customers of new product lines and improvements to existing product lines that respond to such trends, demands and preferences. Trends within the industry change often and our failure to anticipate, identify or quickly react to changes in these trends could lead to, among other things, rejection of a new product line and reduced demand and price reductions for our products, and could materially adversely affect us. In addition, we are subject to the risk that new products could be introduced that would replace or reduce demand for our products. Furthermore, new proprietary designs and/or changes in manufacturing technologies may render our products obsolete or we may not be able to manufacture products or designs at prices that would be competitive in the marketplace. We may not have sufficient resources to make necessary investments or we may be unable to make the investments or acquire the intellectual property rights necessary to develop new products or improve our existing products.
Our business is seasonal which may affect our net sales, cash flows from operations and results of operations.
Our business is moderately seasonal and our sales vary from quarter to quarter based upon the timing of the building season in our markets. Severe weather conditions in any quarter, such as unusually prolonged warm or cold conditions, rain, blizzards or hurricanes, could accelerate, delay or halt construction and renovation activity. The impact of these types of events on our business may adversely impact our sales, cash flows from operations and results of operations. Also, we cannot predict the effects on our business that may result from global climate change, including potential new related laws or regulations. If sales were to fall substantially below what we would normally expect during certain periods, our annual financial results would be adversely impacted. Moreover, our facilities are vulnerable to severe weather conditions.
14
A disruption in our operations could materially affect our operating results.
We operate facilities worldwide. Many of our facilities are located in areas that are vulnerable to hurricanes, earthquakes and other natural disasters. In the event that a hurricane, earthquake, natural disaster, fire or other catastrophic event were to interrupt our operations for any extended period of time, particularly at one or more of our door facing facilities or architectural door plants, such as when Marshfield experienced an autoclave explosion in July 2011, prior to our acquisition, it could delay shipment of merchandise to our customers, damage our reputation or otherwise have a material adverse effect on our financial condition and results of operations. Closure of one of our door facing facilities, which are our most capital intensive and least replaceable production facilities, could have a substantial negative effect on our earnings.
In addition, our operations may be interrupted by terrorist attacks or other acts of violence or war. These attacks may directly impact our suppliers’ or customers’ physical facilities. Furthermore, these attacks may make travel and the transportation of our supplies and products more difficult and more expensive and ultimately affect our operating results. The United States has entered into, and may enter into, additional armed conflicts which could have a further impact on our sales and our ability to deliver product to our customers in the United States and elsewhere. Political and economic instability in some regions of the world, including the current instabilities in the Middle East and North Africa, may also negatively impact our business. The consequences of any of these armed conflicts are unpredictable, and we may not be able to foresee events that could have an adverse effect on our business or your investment. More generally, any of these events could cause consumer confidence and spending to decrease or result in increased volatility in the United States and worldwide financial markets and economy. They could also result in economic recession in the United States or abroad. Any of these occurrences could have a significant impact on our operating results.
Manufacturing realignments may result in a decrease in our short-term earnings, until the expected cost reductions are achieved, as well as reduce our flexibility to respond quickly to improved market conditions.
We continually review our manufacturing operations and sourcing capabilities. Effects of periodic manufacturing realignments and cost savings programs have in the past and could in the future result in a decrease in our short-term earnings until the expected cost reductions are achieved. We also cannot assure you we will achieve all of our cost savings. Such programs may include the consolidation, integration and upgrading of facilities, functions, systems and procedures. The success of these efforts will depend in part on market conditions, and such actions may not be accomplished as quickly as anticipated and the expected cost reductions may not be achieved or sustained.
In connection with our manufacturing realignment and cost savings programs, we have closed or consolidated a substantial portion of our global operations and reduced our personnel, which may reduce our flexibility to respond quickly to improved market conditions. For example, in November 2016, we announced the closure of our Algoma, Wisconsin, facility in order to improve our cost structure, expand operational efficiencies and align our plant optimization portfolio. As a result, a failure to anticipate a sharp increase in levels of residential new construction, residential repair, renovation and remodeling and non-residential building construction activity could result in operational difficulties, adversely impacting our ability to provide our products to our customers. This may result in the loss of business to our competitors in the event they are better able to forecast or respond to market demand. There can be no assurance that we will be able to accurately forecast the level of market demand or react in a timely manner to such changes, which may have a material adverse effect on our business, financial condition and results of operations.
We are subject to the credit risk of our customers.
We provide credit to our customers in the normal course of business. We generally do not require collateral in extending such credit. An increase in the exposure, coupled with material instances of default, could have a material adverse effect on our business, financial condition, results of operations and cash flow.
Increased prices for raw materials or finished goods used in our products or interruptions in deliveries of raw materials or finished goods could adversely affect our profitability, margins and net sales.
Our profitability is affected by the prices of raw materials and finished goods used in the manufacture of our products. These prices have fluctuated and may continue to fluctuate based on a number of factors beyond our control, including world oil prices, changes in supply and demand, general economic or environmental conditions, labor costs,
15
competition, import duties, tariffs, currency exchange rates and, in some cases, government regulation. The commodities we use may undergo major price fluctuations and there is no certainty that we will be able to pass these costs through to our customers. Significant increases in the prices of raw materials or finished goods are more difficult to pass through to customers in a short period of time and may negatively impact our short-term profitability, margins and net sales. In the current competitive environment, opportunities to pass on these cost increases to our customers may be limited.
We require a regular supply of raw materials, such as wood, wood composites, cut stock, steel, glass, core material, paint, stain and primer as well as petroleum-based products such as binders, resins and frames. In certain instances, we depend on a single or limited number of suppliers for these supplies. We typically do not have long-term contracts with our suppliers. If we are not able to accurately forecast our supply needs, the limited number of suppliers may make it difficult to obtain additional raw materials to respond to shifting or increased demand. Our dependency upon regular deliveries from particular suppliers means that interruptions or stoppages in such deliveries could adversely affect our operations until arrangements with alternate suppliers could be made. Furthermore, because our products and the components of some of our products are subject to regulation, such alternative suppliers, even if available, may not be substituted until regulatory approvals for such substitution are received, thereby delaying our ability to respond to supply changes. Moreover, some of our raw materials, especially those that are petroleum or chemical based, interact with other raw materials used in the manufacture of our products and therefore significant lead time may be required to procure a compatible substitute. Substitute materials may also not be of the same quality as our original materials.
If any of our suppliers were unable to deliver materials to us for an extended period of time (including as a result of delays in land or sea shipping), or if we were unable to negotiate acceptable terms for the supply of materials with these or alternative suppliers, our business could suffer. In the future, we may not be able to find acceptable supply alternatives, and any such alternatives could result in increased costs for us. Even if acceptable alternatives are found, the process of locating and securing such alternatives might be disruptive to our business.
Furthermore, raw material prices could increase, and supply could decrease, if other industries compete with us for such materials. For example, we are highly dependent upon our supply of wood chips used for the production of our door facings and wood composite materials. Failure to obtain significant supply may disrupt our operations and even if we are able to obtain sufficient supply, we may not be able to pass increased supply costs on to our customers in the form of price increases, thereby resulting in reduced margins and profits.
A rapid and prolonged increase in fuel prices may significantly increase our costs and have an adverse impact on our results of operations.
Fuel prices remain volatile and are significantly influenced by international, political and economic circumstances. While fuel prices have fallen from historical highs over the last several years, this decline may not be permanent and if price increases were to arise for any reason, including fuel supply shortages or unusual price volatility, the resulting higher fuel prices could materially increase our shipping costs, adversely affecting our results of operations. In addition, competitive pressures in our industry may have the effect of inhibiting our ability to reflect these increased costs in the prices of our products.
We are highly dependent on information technology, the disruption of which could significantly impede our ability to do business.
Our operations depend on our network of information technology systems, which are vulnerable to damage from hardware failure, fire, power loss, telecommunications failure, impacts of terrorism, breaches in security (such as the actions of computer hackers), natural disasters, or other disasters. We have not experienced any material breaches in security in our recent history. Our information technology systems allow us to accurately maintain books and records, record transactions, provide information to management and prepare our consolidated financial statements. We may not have sufficient redundant operations to cover a loss or failure in a timely manner. Any damage to our information technology systems could cause interruptions to our operations that materially adversely affect our ability to meet customers’ requirements, resulting in an adverse impact to our business, financial condition and results of operations. Periodically, these systems need to be expanded, updated or upgraded as our business needs change. For example, we are in the process of implementing a new enterprise resource planning system in our architectural business. We may not be able to successfully implement changes in our information technology systems without experiencing difficulties,
16
which could require significant financial and human resources and impact our ability to efficiently service our customers. Moreover, our recent technological initiatives and increasing dependence on technology may exacerbate this risk.
Increases in labor costs, potential labor disputes and work stoppages at our facilities or the facilities of our suppliers could materially adversely affect our financial performance.
Our financial performance is affected by the availability of qualified personnel and the cost of labor. We have approximately 10,200 employees worldwide, including approximately 2,600 unionized workers. Employees represented by these unions are subject to collective bargaining agreements that are subject to periodic negotiation and renewal, including our agreements with employees and their respective work councils in Chile, Mexico and the United Kingdom, which are subject to annual negotiation. If we are unable to enter into new, satisfactory labor agreements with our unionized employees upon expiration of their agreements, we could experience a significant disruption of our operations, which could cause us to be unable to deliver products to customers on a timely basis. If our workers were to engage in strikes, a work stoppage or other slowdowns, we could also experience disruptions of our operations. Such disruptions could result in a loss of business and an increase in our operating expenses, which could reduce our net sales and profit margins. In addition, our non-unionized labor force may become subject to labor union organizing efforts, such as the attempt to organize our Northumberland facility in 2015, which could cause us to incur additional labor costs and increase the related risks that we now face.
We believe many of our direct and indirect suppliers and customers also have unionized workforces. Strikes, work stoppages or slowdowns experienced by these suppliers and customers could result in slowdowns or closures of facilities where components of our products are manufactured or delivered. Any interruption in the production or delivery of these components could reduce sales, increase costs and have a material adverse effect on us.
Our pension obligations are currently underfunded. We may have to make significant cash payments to our pension plans, which would reduce the cash available for our business.
As of January 1, 2017, our accumulated benefit obligations under our United States and United Kingdom defined benefit pension plans exceeded the fair value of plan assets by $17.3 million and $8.1 million, respectively. During the years ended January 1, 2017, January 3, 2016 and December 28, 2014, we contributed $5.0 million, $5.2 million and $5.4 million, respectively, to the United States pension plan and $0.8 million, $0.9 million and $0.8 million, respectively, to the United Kingdom pension plan. Additional contributions will be required in future years. We currently anticipate making $5.0 million and $0.8 million of contributions to our United States and United Kingdom pension plans, respectively, in 2017. If the performance of the assets in our pension plans does not meet our expectations or other actuarial assumptions are modified, our contributions to our pension plans could be materially higher than we expect, which would reduce the cash available for our businesses. In addition, our United States pension plans are subject to Title IV of the United States Employee Retirement Income Security Act of 1974, or ERISA. Under ERISA, the Pension Benefit Guaranty Corporation, or the PBGC, generally has the authority to terminate an underfunded pension plan if the possible long-run loss to the PBGC with respect to the plan may reasonably be expected to increase substantially if the plan is not terminated. In the event our pension plans are terminated for any reason while the plans are underfunded, we may incur a liability to the PBGC which could be equal to the entire amount of the underfunding.
Our recent acquisitions and any future acquisitions, if available, could be difficult to integrate and could adversely affect our operating results.
In the past several years we completed several strategic acquisitions of door and door component manufacturers in North America and the United Kingdom. Historically, we have made acquisitions to vertically integrate and expand our operations, such as our acquisitions of FyreWerks in 2016; USA Wood Door, Hickman and PDS in 2015; Harring and Door-Stop in 2014; the assets of a door manufacturing operation located in Chile in 2013; Lemieux, Algoma, and Baillargeon in 2012; and Birchwood and Marshfield in 2011. From time to time, we have evaluated and we continue to evaluate possible acquisition transactions on an on-going basis. Our acquisitions may not be accretive. At any time we may be engaged in discussions or negotiations with respect to possible acquisitions or may have entered into non-binding letters of intent. As part of our strategy, we expect to continue to pursue complementary acquisitions and investments and may expand into product lines or businesses with which we have little or no operating experience. For example, future acquisitions may involve building product categories other than doors. We may also
17
engage in further vertical integration. However, we may face competition for attractive targets and we may not be able to source appropriate acquisition targets at prices acceptable to us, or at all. In addition, in order to pursue our acquisition strategy, we will need significant liquidity, which, as a result of the other factors described herein, may not be available on terms favorable to us, or at all.
Our recent and any future acquisitions involve a number of risks, including:
• | our inability to integrate the acquired business; |
• | our inability to manage acquired businesses or control integration and other costs relating to acquisitions; |
• | our lack of experience with a particular business should we invest in a new product line; |
• | diversion of management attention; |
• | our failure to achieve projected synergies or cost savings; |
• | impairment of goodwill affecting our reported net income; |
• | our inability to retain the management or other key employees of the acquired business; |
• | our inability to establish uniform standards, controls, procedures and policies; |
• | our inability to retain customers of our acquired companies; |
• | risks associated with the internal controls of acquired companies; |
• | exposure to legal claims for activities of the acquired business prior to the acquisition; |
• | our due diligence procedures could fail to detect material issues related to the acquired business; |
• | unforeseen management and operational difficulties, particularly if we acquire assets or businesses in new foreign jurisdictions where we have little or no operational experience; |
• | damage to our reputation as a result of performance or customer satisfaction problems relating to an acquired businesses; |
• | the performance of any acquired business could be lower than we anticipated; and |
• | our inability to enforce indemnifications and non-compete agreements. |
The integration of any future acquisition into our business will likely require substantial time, effort, attention and dedication of management resources and may distract our management in unpredictable ways from our ordinary operations. The integration may also result in consolidation of certain existing operations. If we cannot successfully execute on our investments on a timely basis, we may be unable to generate sufficient net sales to offset acquisition, integration or expansion costs, we may incur costs in excess of what we anticipate, and our expectations of future results of operations, including cost savings and synergies, may not be achieved. If we are not able to effectively manage recent or future acquisitions or realize their anticipated benefits, it may harm our results of operations.
We are exposed to political, economic and other risks that arise from operating a multinational business.
We have operations in the United States, Canada, Europe and, to a lesser extent, other foreign jurisdictions. In the year ended January 1, 2017, approximately 65% of our net sales were in the United States, 16% in Canada and 13% in the United Kingdom. Further, certain of our businesses obtain raw materials and finished goods from foreign suppliers. Accordingly, our business is subject to political, economic and other risks that are inherent in operating in numerous countries.
These risks include:
• | the difficulty of enforcing agreements and collecting receivables through foreign legal systems; |
• | trade protection measures and import or export licensing requirements; |
• | tax rates in foreign countries and the imposition of withholding requirements on foreign earnings; |
• | the imposition of tariffs or other restrictions; |
• | difficulty in staffing and managing widespread operations and the application of foreign labor regulations; |
• | required compliance with a variety of foreign laws and regulations; and |
• | changes in general economic and political conditions in countries where we operate. |
Our business success depends in part on our ability to anticipate and effectively manage these and other risks. We cannot assure you that these and other factors will not have a material adverse effect on our international operations or on our business as a whole.
18
The United Kingdom's vote to leave, and its eventual exit from, the European Union could adversely affect our business.
In June 2016, voters in the United Kingdom voted for a non-binding referendum in favor of the United Kingdom exiting the European Union. The referendum was advisory, and the terms of any withdrawal are subject to a negotiation period that could last up to two years after the government of the United Kingdom formally initiates a withdrawal process. The United Kingdom has indicated its intent to provide this notice, subject to the receipt of the required approval by Parliament. The eventual exit of the United Kingdom from the European Union and negotiations leading up to that exit could adversely affect European and worldwide economic and market conditions. As a result, there has been, and may continue to be, instability in global financial and foreign exchange markets, including volatility in the value of the Pound Sterling and the Euro. Uncertainty about global or regional economic conditions poses a risk as consumers and businesses may postpone spending in response to tighter credit, negative financial news and declines in income or asset values, which could have a material negative effect on the European housing market, particularly in the United Kingdom, and demand for our products in the foreseeable future.
Fluctuating exchange and interest rates could adversely affect our financial results.
Our financial results may be adversely affected by fluctuating exchange rates. Net sales generated outside of the United States were approximately 35% for the year ended January 1, 2017. In addition, a significant percentage of our costs during the same period were not denominated in U.S. dollars. For example, for most of our manufacturing facilities, the prices for a significant portion of our raw materials are quoted in the domestic currency of the country where the facility is located or other currencies that are not U.S. dollars. We also have substantial assets outside the United States. As a result, the volatility in the price of the U.S. dollar has exposed, and in the future may continue to expose, us to currency exchange risks. For example, we are subject to currency exchange rate risk to the extent that some of our costs will be denominated in currencies other than those in which we earn revenues. Also, since our financial statements are denominated in U.S. dollars, changes in currency exchange rates between the U.S. dollar and other currencies have had, and will continue to have, an impact on many aspects of our financial results. Changes in currency exchange rates for any country in which we operate may require us to raise the prices of our products in that country and may result in the loss of business to our competitors that sell their products at lower prices in that country.
Moreover, as our current indebtedness is denominated in a currency that is different from the currencies in which we derive a significant portion of our net sales, we are also exposed to currency exchange rate risk with respect to those financial obligations. When the outstanding indebtedness is repaid, we may be subject to taxes on any corresponding foreign currency gain.
Borrowings under our current ABL Facility are incurred at variable rates of interest, which exposes us to interest rate fluctuation risk. If interest rates increase, the payments we are required to make on any variable rate indebtedness will increase.
We may fail to continue to innovate, face claims that we infringe third party intellectual property rights, or be unable to protect our intellectual property from infringement by others except by incurring substantial costs as a result of litigation or other proceedings relating to patent or trademark rights, any of which could cause our net sales or profitability to decline.
Our continued success depends on our ability to develop and introduce new or improved products, to improve our manufacturing and product service processes, and to protect our rights to the technologies used in our products. If we fail to do so, or if existing or future competitors achieve greater success than we do in these areas, our results of operations and our profitability may decline.
We rely on a combination of United States, Canadian and, to a lesser extent, European patent, trademark, copyright and trade secret laws as well as licenses, nondisclosure, confidentiality and other contractual restrictions to protect certain aspects of our business. We have registered trademarks, copyrights and our patent and trademark applications may not be allowed by the applicable governmental authorities to issue as patents or register as trademarks at all, or in a form that will be advantageous to us. In addition, we have selectively pursued patent and trademark protection, and in some instances we may not have registered important patent and trademark rights in these and other countries. Furthermore, the laws of foreign countries may not protect our intellectual property rights to the same extent as the laws of the United States. The failure to obtain worldwide patent and trademark protection may result in other companies copying and marketing products based upon our technologies or under our brand or trade names outside the
19
jurisdictions in which we are protected. This could impede our growth in existing regions and into new regions, create confusion among consumers and result in a greater supply of similar products that could erode prices for our protected products.
Our success depends in part on our ability to protect our patents, trademarks, copyrights, trade secrets and licensed intellectual property from unauthorized use by others. We cannot be sure that the patents we have obtained, or other protections such as confidentiality, trade secrets and copyrights, will be adequate to prevent imitation of our products by others. If we are unable to protect our products through the enforcement of intellectual property rights, our ability to compete based on our current advantages may be harmed. If we fail to prevent substantial unauthorized use of our trade secrets, we risk the loss of those intellectual property rights and whatever competitive advantage they embody.
Although we are not aware that any of our products or intellectual property rights materially infringe upon the proprietary rights of third parties, third parties may accuse us of infringing or misappropriating their patents, trademarks, copyrights or trade secrets. Third parties may also challenge our trademark rights and branding practices in the future. We may be required to institute or defend litigation to defend ourselves from such accusations or to enforce our patent, trademark and copyright rights from unauthorized use by others, which, regardless of the outcome, could result in substantial costs and diversion of resources and could negatively affect our competitive position, sales, profitability and reputation. If we lose a patent infringement suit, we may be liable for money damages and be enjoined from selling the infringing product unless we can obtain a license or are able to redesign our product to avoid infringement. A license may not be available at all or on terms acceptable to us, and we may not be able to redesign our products to avoid any infringement, which could negatively affect our profitability. In addition, our patents, trademarks and other proprietary rights may be subject to various attacks claiming they are invalid or unenforceable. These attacks might invalidate, render unenforceable or otherwise limit the scope of the protection that our patents and trademarks afford. If we lose the use of a product name, our efforts spent building that brand may be lost and we will have to rebuild a brand for that product, which we may or may not be able to do. Even if we prevail in a patent infringement suit, there is no assurance that third parties will not be able to design around our patents, which could harm our competitive position.
If we are unable to replace our expiring patents, our ability to compete both domestically and internationally will be harmed. In addition, our products face the risk of obsolescence, which, if realized, could have a material adverse effect on our business.
We depend on our door manufacturing intellectual property and products to generate revenue. Some of our patents will begin to expire in the next several years. While we will continue to work to add to our patent portfolio to protect the intellectual property of our products, we believe it is possible that new competitors will emerge in door manufacturing. We do not know whether we will be able to develop additional proprietary designs, processes or products. If any protection we obtain is reduced or eliminated, others could use our intellectual property without compensating us, resulting in harm to our business. Moreover, as our patents expire, competitors may utilize the information found in such patents to commercialize their own products. While we seek to offset the losses relating to important expiring patents by securing additional patents on commercially desirable improvements, and new products, designs and processes, there can be no assurance that we will be successful in securing such additional patents, or that such additional patents will adequately offset the effect of the expiring patents.
Further, we face the risk that third parties will succeed in developing or marketing products that would render our products obsolete or noncompetitive. New, less expensive methods could be developed that replace or reduce the demand for our products or may cause our customers to delay or defer purchasing our products. Accordingly, our success depends in part upon our ability to respond quickly to market changes through the development and introduction of new products. The relative speed with which we can develop products, complete regulatory clearance or approval processes and supply commercial quantities of the products to the market are expected to be important competitive factors. Any delays could result in a loss of market acceptance and market share. We cannot provide assurance that our new product development efforts will result in any commercially successful products.
20
We may be the subject of product liability claims or product recalls, we may not accurately estimate costs related to such claims or recalls, and we may not have sufficient insurance coverage available to cover potential liabilities.
Our products are used and have been used in a wide variety of residential and architectural applications. We face an inherent business risk of exposure to product liability or other claims, including class action lawsuits, in the event our products are alleged to be defective or that the use of our products is alleged to have resulted in harm to others or to property. Because we manufacture a significant portion of our products based on the specific requirements of our customers, failure to provide our customers the products and services they specify could result in product-related claims and reduced or cancelled orders and delays in the collection of accounts receivable. We may in the future incur liability if product liability lawsuits against us are successful. Moreover, any such lawsuits, whether or not successful, could result in adverse publicity to us, which could cause our sales to decline materially. In addition, it may be necessary for us to recall defective products, which would also result in adverse publicity, as well as resulting in costs connected to the recall and loss of net sales. We maintain insurance coverage to protect us against product liability claims, but that coverage may not be adequate to cover all claims that may arise or we may not be able to maintain adequate insurance coverage in the future at an acceptable cost. Any liability not covered by insurance or that exceeds our established reserves could materially and adversely impact our financial condition and results of operations.
In addition, consistent with industry practice, we provide warranties on many of our products and we may experience costs of warranty or breach of contract claims if our products have defects in manufacture or design or they do not meet contractual specifications. We estimate our future warranty costs based on historical trends and product sales, but we may fail to accurately estimate those costs and thereby fail to establish adequate warranty reserves for them.
The loss of certain members of our management may have an adverse effect on our operating results.
Our success will depend, in part, on the efforts of our senior management and other key employees. These individuals possess sales, marketing, engineering, manufacturing, financial and administrative skills and know-how that are critical to the operation of our business. If we lose or suffer an extended interruption in the services of one or more of our senior officers or other key employees, our financial condition and results of operations may be negatively affected. Moreover, the pool of qualified individuals may be highly competitive and we may not be able to attract and retain qualified personnel to replace or succeed members of our senior management or other key employees, should the need arise. The loss of the services of any key personnel, or our inability to hire new personnel with the requisite skills, could impair our ability to develop new products or enhance existing products, sell products to our customers or manage our business effectively.
Lack of transparency, threat of fraud, public sector corruption and other forms of criminal activity involving government officials increases risk for potential liability under anti-bribery or anti-fraud legislation, including the United States Foreign Corrupt Practices Act.
We operate facilities in 8 countries and sell our products in 65 countries around the world. As a result of these international operations, we may enter from time to time into negotiations and contractual arrangements with parties affiliated with foreign governments and their officials. In connection with these activities, we are subject to the United States Foreign Corrupt Practices Act ("FCPA"), the United Kingdom Bribery Act and other anti-bribery laws that prohibit improper payments or offers of payments to foreign governments and their officials and political parties by United States and other business entities for the purpose of obtaining or retaining business, or otherwise receiving discretionary favorable treatment of any kind and requires the maintenance of internal controls to prevent such payments. In particular, we may be held liable for actions taken by our local partners and agents in foreign countries where we operate, even though such parties are not always subject to our control. As part of our Masonite Values Operating Guide we have established FCPA and other anti-bribery policies and procedures and offer several channels for raising concerns in an effort to comply with applicable U.S. and international laws and regulations. However, there can be no assurance that our policies and procedures will effectively prevent us from violating these laws and regulations in every transaction in which we may engage. Any determination that we have violated the FCPA or other anti-bribery laws (whether directly or through acts of others, intentionally or through inadvertence) could result in sanctions that could have a material adverse effect on our results of operations and financial condition.
21
As we continue to expand our business globally, we may have difficulty anticipating and effectively managing these and other risks that our international operations may face, which may adversely impact our business outside of North America and our financial condition and results of operations. In addition, any acquisition of businesses with operations outside of North America may exacerbate this risk.
Environmental requirements and other government regulation may impose significant environmental and legal compliance costs and liabilities on us.
Our operations are subject to numerous Canadian (federal, provincial and local), United States (federal, state and local), European (European Union, national and local) and other laws and regulations relating to pollution and the protection of human health and the environment, including, without limitation, those governing emissions to air, discharges to water, storage, treatment and disposal of waste, releases of contaminants or hazardous or toxic substances, remediation of contaminated sites and protection of worker health and safety. From time to time, our facilities are subject to investigation by governmental regulators. Despite our efforts to comply with environmental requirements, we are at risk of being subject to civil, administrative or criminal enforcement actions, of being held liable, of being subject to an order or of incurring costs, fines or penalties for, among other things, releases of contaminants or hazardous or toxic substances occurring on or emanating from currently or formerly owned or operated properties or any associated offsite disposal location, or for contamination discovered at any of our properties from activities conducted by us or by previous occupants. Although, with the exception of costs incurred relating to compliance with Maximum Achievable Control Technology requirements (as described below), we have not incurred significant costs for environmental matters in prior years, future expenditures required to comply with any changes in environmental requirements are anticipated to be undertaken as part of our ongoing capital investment program, which is primarily designed to improve the efficiency of our various manufacturing processes. The amount of any resulting liabilities, costs, fines or penalties may be material.
In addition, the requirements of such laws and enforcement policies have generally become more stringent over time. Changes in environmental laws and regulations or in their enforcement or the discovery of previously unknown or unanticipated contamination or non-compliance with environmental laws or regulations relating to our properties or operations could result in significant environmental liabilities or costs which could adversely affect our business. In addition, we might incur increased operating and maintenance costs and capital expenditures and other costs to comply with increasingly stringent air emission control laws or other future requirements (such as, in the United States, those relating to compliance with Maximum Achievable Control Technology requirements under the Clean Air Act, for which we made capital expenditures totaling approximately $49 million from 2008 through 2010), which may decrease our cash flow. Also, discovery of currently unknown or unanticipated conditions could require responses that would result in significant liabilities and costs. Accordingly, we are unable to predict the ultimate costs of compliance with or liability under environmental laws, which may be larger than current projections.
Changes in government regulation may have a material effect on our results of operations.
Our manufacturing facilities are subject to numerous foreign, federal, state and local laws and regulations, including those relating to the presence of hazardous materials and protection of worker health and safety. Liability under these laws involves inherent uncertainties. Changes in such laws and regulations or in their enforcement could significantly increase our costs of operations which could adversely affect our business. Violations of health and safety laws are subject to civil, and, in some cases, criminal sanctions. As a result of these uncertainties, we may incur unexpected interruptions to operations, fines, penalties or other reductions in income which could adversely impact our business, financial condition and results of operations.
Further, in order for our products to obtain the energy efficient “ENERGYSTAR” label, they must meet certain requirements set by the Environmental Protection Agency, or the EPA. Changes in the energy efficiency requirements established by the EPA for the ENERGYSTAR label could increase our costs, and, if there is a lapse in our ability to label our products as such or we are not able to comply with the new standards at all, negatively affect our net sales and results of operations.
Moreover, many of our products are regulated by building codes and require specific fire, penetration or wind resistance characteristics. A change in the building codes could have a material impact on the manufacturing cost for these products, which we may not be able to pass on to our customers.
22
In addition, changing laws, regulations and standards relating to corporate governance and public disclosure, including the Sarbanes-Oxley Act, the Dodd-Frank Act and related regulations implemented by the Securities and Exchange Commission, or the SEC, and the stock exchanges are creating uncertainty for public companies, increasing legal and financial compliance costs and making some activities more time-consuming. We are currently evaluating and monitoring developments with respect to new and proposed rules and cannot predict or estimate the amount of additional costs we may incur or the timing of such costs. These laws, regulations and standards are subject to varying interpretations, in many cases due to their lack of specificity, and, as a result, their application in practice may evolve over time as new guidance is provided by regulatory and governing bodies. This could result in continuing uncertainty regarding compliance matters and higher costs necessitated by ongoing revisions to disclosure and governance practices.
We intend to invest resources to comply with evolving laws, regulations and standards, and this investment may result in increased general and administrative expenses and a diversion of management’s time and attention from revenue-generating activities to compliance activities. If our efforts to comply with new laws, regulations and standards differ from the activities intended by regulatory or governing bodies due to ambiguities related to practice, regulatory authorities may initiate legal proceedings against us and our business may be harmed. We also expect that being a public company and these new rules and regulations will make it more expensive for us to obtain director and officer liability insurance, and we may be required to accept reduced coverage or incur substantially higher costs to obtain coverage. These factors could also make it more difficult for us to attract and retain qualified members of our board of directors, particularly to serve on our audit committee and compensation committee, and attract and retain qualified executive officers.
To service our consolidated indebtedness, we will require a significant amount of cash. Our ability to generate cash depends on many factors beyond our control, and any failure to meet our debt service obligations could harm our business, financial condition and results of operations.
Our estimated annual payment obligation for 2017 with respect to our consolidated indebtedness is $26.7 million of interest payments. When we draw funds under the ABL Facility, we incur additional interest expense. Our ability to pay interest on and principal of the senior notes and our ability to satisfy our other debt obligations will principally depend upon our future operating performance. As a result, prevailing economic conditions and financial, business and other factors, many of which are beyond our control, will affect our ability to make these payments.
If we do not generate sufficient cash flow from operations to satisfy our consolidated debt service obligations, we may have to undertake alternative financing plans, such as refinancing or restructuring our indebtedness, selling assets, reducing or delaying capital investments or seeking to raise additional capital. Our ability to restructure or refinance our debt will depend on the capital markets and our financial condition at such time. Any refinancing of our debt could be at higher interest rates and may require us to comply with more onerous covenants, which could further restrict our business operations. In addition, the terms of existing or future debt instruments, including the ABL Facility and the indenture governing the senior notes, may restrict us from adopting some of these alternatives. If we are unable to generate sufficient cash flow to satisfy our debt service obligations, or to refinance our obligations on commercially reasonable terms, it would have an adverse effect, which could be material, on our business, financial condition and results of operations.
Under such circumstances, we may be unable to comply with the provisions of our debt instruments, including the financial covenants in the ABL Facility. If we are unable to satisfy such covenants or other provisions at any future time, we would need to seek an amendment or waiver of such financial covenants or other provisions. The lenders under the ABL Facility may not consent to any amendment or waiver requests that we may make in the future, and, if they do consent, they may not do so on terms which are favorable to us. The lenders will also have the right in these circumstances to terminate any commitments they have to provide further borrowings. If we are unable to obtain any such waiver or amendment, our inability to meet the financial covenants or other provisions of the ABL Facility would constitute an event of default thereunder, which would permit the lenders to accelerate repayment of borrowings under the ABL Facility, which in turn would constitute an event of the default under the indenture governing the senior notes, permitting the holders of the senior notes to accelerate payment thereon. Our assets and/or cash flow, and/or that of our subsidiaries, may not be sufficient to fully repay borrowings under our outstanding debt instruments if accelerated upon an event of default, and the secured lenders under the ABL Facility could proceed against the collateral securing that indebtedness. Such events would have a material adverse effect on our business, financial condition and results of operations, as well as on our ability to satisfy our obligations in respect of the senior notes.
23
The terms of the ABL Facility and the indenture governing the senior notes may restrict our current and future operations, particularly our ability to respond to changes in our business or to take certain actions.
The credit agreement governing the ABL Facility and the indenture governing the senior notes contain, and the terms of any future indebtedness of ours would likely contain, a number of restrictive covenants that impose significant operating and financial restrictions, including restrictions on our ability to engage in acts that may be in our best long-term interests. The indenture governing the senior notes and the credit agreements governing the ABL Facility include covenants that, among other things, restrict our and our subsidiaries’ ability to:
• | incur additional indebtedness and issue disqualified or preferred stock; |
• | make restricted payments; |
• | sell assets; |
• | create restrictions on the ability of their restricted subsidiaries to pay dividends or distributions; |
• | create or incur liens; |
• | enter into sale and lease-back transactions; |
• | merge or consolidate with other entities; and |
• | enter into transactions with affiliates. |
The operating and financial restrictions and covenants in the debt agreements we will enter into in connection with this offering and the ABL Facility and any future financing agreements may adversely affect our ability to finance future operations or capital needs or to engage in other business activities.
Risks Related to Ownership of Our Common Shares
Our share price may change significantly and you could lose all or part of your investment as a result.
The trading price of our common shares could fluctuate due to a number of factors such as those listed in “Risks Related to Our Business” and the following, some of which are beyond our control:
• | quarterly variations in our results of operations; |
• | results of operations that vary from the expectations of securities analysts and investors; |
• | results of operations that vary from those of our competitors; |
• | changes in expectations as to our future financial performance, including financial estimates by securities analysts and investors; |
• | announcements by us, our competitors or our vendors of significant contracts, acquisitions, joint marketing relationships, joint ventures or capital commitments; |
• | announcements by third parties of significant claims or proceedings against us; |
• | future sales of our common shares; and |
• | general domestic and international economic conditions. |
Furthermore, the stock market has experienced extreme volatility that, in some cases, has been unrelated or disproportionate to the operating performance of particular companies. These broad market and industry fluctuations may adversely affect the market price of our common shares, regardless of our actual operating performance.
In the past, following periods of market volatility, shareholders have instituted securities class action litigation. If we were involved in securities litigation, it could have a substantial cost and divert resources and the attention of executive management from our business regardless of the outcome of such litigation.
The availability of shares for sale in the future could reduce the market price of our common shares.
In the future, we may issue securities to raise cash for acquisitions or otherwise. We may also acquire interests in other companies by using a combination of cash and our common shares or just our common shares. We may also issue securities convertible into our common shares. Any of these events may dilute your ownership interest in our company and have an adverse impact on the price of our common shares.
24
In addition, sales of a substantial amount of our common shares in the public market, or the perception that these sales may occur, could reduce the market price of our common shares. This could also impair our ability to raise additional capital through the sale of our securities.
A small number of our shareholders could be able to significantly influence our business and affairs, limiting your ability to influence corporate matters.
As of January 1, 2017, shareholders owning 5% or more of our outstanding common shares reported their significant ownership positions in their Schedule 13G filings. As a result of their holdings, these shareholders may be able to significantly influence the outcome of any matters requiring approval by our shareholders, including the election of directors, mergers and takeover offers, regardless of whether others believe that approval of those matters is in our best interests.
United States civil liabilities may not be enforceable against us.
We exist under the laws of the Province of British Columbia, Canada. As a result, it may be difficult for investors to effect service of process within the United States upon us and those experts, or to enforce outside the United States judgments obtained in United States courts, in any action, including actions predicated upon the civil liability provisions of United States securities laws. Additionally, it may be difficult for investors to enforce, in original actions brought in courts in jurisdictions located outside the United States, rights predicated upon United States securities laws. In particular, there is uncertainty as to the enforceability in Canada by a court in original actions, or in actions to enforce judgments of United States courts, of the civil liabilities predicated upon the United States securities laws. Based on the foregoing, there can be no assurance that United States investors will be able to enforce against us or certain experts named herein who are residents of countries other than the United States any judgments obtained in United States courts in civil and commercial matters, including judgments under the United States federal securities laws. In addition, there is doubt as to whether a court in the Province of British Columbia would impose civil liability on us, our directors, officers or certain experts named herein in an original action predicated solely upon the federal securities laws of the United States brought in a court of competent jurisdiction in the Province of British Columbia against us or such directors, officers or experts, respectively.
Canadian laws differ from the laws in effect in the United States and may afford less protection to holders of our securities.
We are a company that exists under the laws of the Province of British Columbia, Canada and are subject to the Business Corporations Act (British Columbia) and certain other applicable securities laws as a Canadian issuer (nonreporting issuer), which laws may differ from those governing a company formed under the laws of a United States jurisdiction. The provisions under the Business Corporations Act (British Columbia) and other relevant laws may affect the rights of shareholders differently than those of a company governed by the laws of a United States jurisdiction, and may, together with our amended and restated articles of amalgamation, or the Articles, have the effect of delaying, deferring or discouraging another party from acquiring control of our company by means of a tender offer, a proxy contest or otherwise, or may affect the price an acquiring party would be willing to offer in such an instance.
If securities or industry research analysts do not publish or cease publishing research or reports about our business or if they issue unfavorable commentary or downgrade our common shares, our share price and trading volume could decline.
The trading market for our common shares relies in part on the research and reports that securities and industry research analysts publish about us, our industry, our competitors and our business. We do not have any control over these analysts. Our share price and trading volumes could decline if one or more securities or industry analysts downgrade our common shares, issue unfavorable commentary about us, our industry or business, cease to cover our Company or fail to regularly publish reports about us, our industry or our business.
Item 1B. Unresolved Staff Comments
None.
25
Item 2. Properties
Our United States executive headquarters are located in Tampa, Florida, and consist of approximately 80,000 square feet of leased office space at two sites. Our Canadian executive offices are located in a single leased site in Concord, Ontario. As of January 1, 2017, we owned and leased the following number of properties, by reportable segment:
Manufacturing | Warehouse | Support | Total | ||||||||
Owned properties: | |||||||||||
North American Residential | 23 | 8 | — | 31 | |||||||
Europe | 7 | — | 2 | 9 | |||||||
Architectural | 6 | 1 | — | 7 | |||||||
Corporate & Other | — | — | 1 | 1 | |||||||
Total owned properties | 36 | 9 | 3 | 48 | |||||||
Leased properties: | |||||||||||
North American Residential | 15 | 14 | 1 | 30 | |||||||
Europe | 6 | 7 | — | 13 | |||||||
Architectural | 6 | 4 | — | 10 | |||||||
Corporate & Other | 1 | — | 4 | 5 | |||||||
Total leased properties | 28 | 25 | 5 | 58 | |||||||
Total owned and leased properties | 64 | 34 | 8 | 106 | |||||||
Our properties in the North American Residential and Architectural segments are distributed across 23 states in the United States and four provinces in Canada, as well as one manufacturing facility and one support facility in Mexico and three manufacturing facilities in Chile. Our properties in the Europe segment are distributed across the United Kingdom, as well as one manufacturing facility in each of Ireland and the Czech Republic. Our properties in the Corporate and Other category include one manufacturing facility in Malaysia and four support facilities in the United States. As of January 1, 2017, total floor space at our manufacturing facilities was 12.3 million square feet, including 3.2 million square feet in our five molded door facings facilities. In addition to the properties outlined above, we own one idle manufacturing facility in Canada, we lease one idle manufacturing facility in the United Kingdom and we own two parcels of land: 17,000 acres of forestland in Costa Rica and 48 acres of undeveloped land in California.
We believe that our facilities are suitable to our respective businesses and have production capacity adequate to support our current level of production to meet our customers’ demand. Additional investments in manufacturing facilities are made as appropriate to balance our capacity with our customers’ demand.
Item 3. Legal Proceedings
The information required with respect to this item can be found under "Commitments and Contingencies" in Note 10 to the consolidated financial statements in this Annual Report and is incorporated by reference into this Item 3.
Item 4. Mine Safety Disclosures
Not applicable.
Executive Officers of the Registrant
Information about the Company's executive officers is incorporated herein by reference from Part III, Item 10 hereof.
26
PART II
Item 5. Market for Registrant's Common Equity, Related Stockholder Matters and Issuer Purchases of Equity Securities
Market Information
Our common shares have been listed on the New York Stock Exchange (“NYSE”) under the symbol “DOOR” since September 9, 2013. Prior to that time, there was no public market for our common shares, although our common shares were quoted on the OTC Grey Market under the symbol “MASWF” from June 2009 until our listing on the NYSE. The following table sets forth the high and low sales prices per share of our common stock as reported on the NYSE for the periods indicated:
2016 | 2015 | ||||||||||||||
High | Low | High | Low | ||||||||||||
First quarter | $ | 66.61 | $ | 45.14 | $ | 67.15 | $ | 57.70 | |||||||
Second quarter | 72.11 | 61.22 | 72.00 | 65.83 | |||||||||||
Third quarter | 72.75 | 61.56 | 73.26 | 63.06 | |||||||||||
Fourth quarter | 68.55 | 55.60 | 67.39 | 58.38 | |||||||||||
Holders
As of March 1, 2017, we had two record holders of our common shares, including Cede & Co., the nominee of the Depository Trust Corporation.
Dividends
We do not intend to pay any cash dividends on our common shares for the foreseeable future and instead may retain earnings, if any, for future operations and expansion, share repurchases or debt repayment, among other things. Any decision to declare and pay dividends in the future will be made at the discretion of our board of directors and will depend on, among other things, our results of operations, liquidity requirements, financial condition, contractual restrictions and other factors that our board of directors may deem relevant. In addition, our ability to pay dividends is limited by covenants in our ABL Facility and in the indenture governing our senior notes. Future agreements may also limit our ability to pay dividends. See Note 7 to our audited consolidated financial statements contained elsewhere in this Annual Report for restrictions on our ability to pay dividends.
27
Stock Performance Graph
The following graph depicts the total return to shareholders from September 9, 2013, the date our common shares became listed on the NYSE, through January 1, 2017, relative to the performance of the Standard & Poor's 500 Index and the Standard & Poor's 1500 Building Products Index. The graph assumes an investment of $100 in our common stock and each index on September 9, 2013, and the reinvestment of dividends paid since that date. The stock performance shown in the graph is not necessarily indicative of future price performance.
Comparison of Cumulative Total Stockholder Return
Masonite International Corporation, Standard & Poor's 500 Index and
Standard & Poor's 1500 Building Products Index
(Performance Results through January 1, 2017)
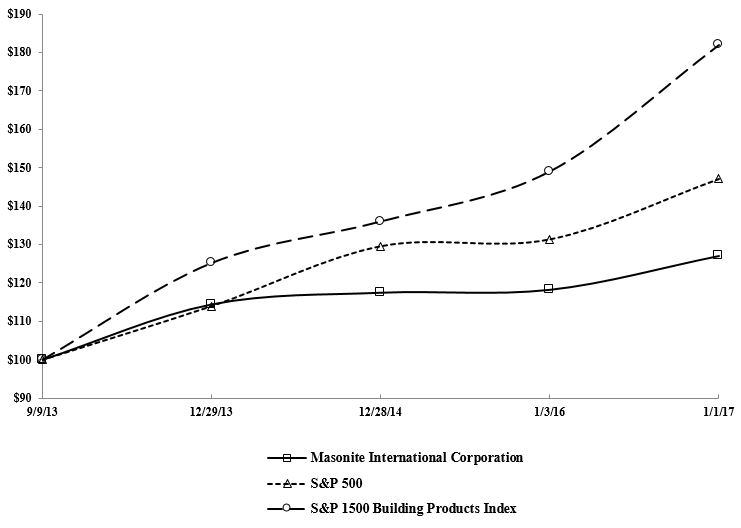 |
September 9, 2013 | December 29, 2013 | December 28, 2014 | January 3, 2016 | January 1, 2017 | |||||||||||||||
Masonite International Corporation | $ | 100.00 | $ | 114.49 | $ | 117.57 | $ | 118.32 | $ | 127.15 | |||||||||
Standard & Poor's 500 Index | 100.00 | 113.98 | 129.58 | 131.37 | 147.09 | ||||||||||||||
Standard & Poor's 1500 Building Products Index | 100.00 | 124.47 | 136.04 | 170.49 | 182.05 | ||||||||||||||
Recent Sales of Unregistered Securities; Use of Proceeds from Registered Securities
None.
28
Repurchases of Equity Securities by the Issuer and Affiliated Purchasers
During the three months ended January 1, 2017, we repurchased 296,426 of our common shares in the open market.
Total Number of Shares Purchased | Average Price Paid per Share | Total Number of Shares Purchased as Part of Publicly Announced Plans or Programs | Approximate Dollar Value of Shares that May Yet be Purchased Under the Plans or Programs | ||||||||||
October 3, 2016, through October 30, 2016 | 72,880 | $ | 61.63 | 72,880 | $ | 55,328,403 | |||||||
October 31, 2016, through November 27, 2016 | — | — | — | 55,328,403 | |||||||||
November 28, 2016, through January 1, 2017 | 223,546 | 65.00 | 223,546 | 40,797,473 | |||||||||
Total | 296,426 | $ | 64.17 | 296,426 | |||||||||
On February 23, 2016, our Board of Directors authorized a share repurchase program (the "2016 Program") with no specified expiration date whereby we may repurchase up to $150 million worth of our outstanding common shares. As of January 1, 2017, $40.8 million was available for repurchase in accordance with the 2016 Program.
Subsequently, on February 22, 2017, our Board of Directors authorized an additional share repurchase program (the “2017 Program” and, collectively with the 2016 Program, the "share repurchase programs") with no specified expiration date whereby we may repurchase up to an additional $200 million worth of our outstanding common shares. The table above does not give effect to the 2017 Program. While the share repurchase programs may take two years to complete, the timing and other amount of any share repurchases will be determined by management based on our evaluation of market conditions and other factors. Any repurchases under the share repurchase programs may be made in the open market, in privately negotiated transactions or otherwise, subject to market conditions, applicable legal requirements and other relevant factors. The share repurchase programs do not obligate us to acquire any particular amount of common stock, and they may be suspended or terminated at any time at our discretion. Repurchases under the share repurchase programs are permitted to be made under one or more Rule 10b5-1 plans, which would permit shares to be repurchased when we might otherwise be precluded from doing so under applicable insider trading laws.
29
Item 6. Selected Financial Data
The following table sets forth selected historical consolidated financial data as of the dates and for the periods indicated. The selected historical consolidated financial data as of January 1, 2017, and January 3, 2016, and for the years ended January 1, 2017, January 3, 2016, and December 28, 2014, have been derived from the audited consolidated financial statements included elsewhere in this Annual Report. The selected historical consolidated financial data as of December 28, 2014, December 29, 2013, and December 30, 2012, and for the years ended December 29, 2013, and December 30, 2012, have been derived from the audited consolidated financial statements not included in this Annual Report.
This historical data includes, in the opinion of management, all adjustments necessary for a fair presentation of the operating results and financial condition of the Company for such periods and as of such dates. The results of operations for any period are not necessarily indicative of the results of future operations. Since 2011, we have completed several acquisitions and dispositions. The results of these acquired entities are included in our consolidated statements of comprehensive income (loss) for the periods subsequent to their respective acquisition dates. The results of these disposed entities are included in our consolidated statements of comprehensive income (loss) for the periods up to their respective disposal dates. The selected historical consolidated financial data set forth below should be read in conjunction with, and are qualified by reference to, “Management’s Discussion and Analysis of Financial Condition and Results of Operations” and our consolidated financial statements and related notes thereto included elsewhere in this Annual Report.
Year Ended | |||||||||||||||||||
(In thousands of U.S. dollars, except for share and per share amounts) | January 1, 2017 | January 3, 2016 | December 28, 2014 | December 29, 2013 | December 30, 2012 | ||||||||||||||
Operating Results: | |||||||||||||||||||
Net sales | $ | 1,973,964 | $ | 1,871,965 | $ | 1,837,700 | $ | 1,731,143 | $ | 1,676,005 | |||||||||
Gross profit | 409,645 | 350,850 | 265,399 | 225,507 | 216,304 | ||||||||||||||
Income (loss) from continuing operations | 104,894 | (41,741 | ) | (33,488 | ) | (8,362 | ) | (21,802 | ) | ||||||||||
Net income (loss) | 104,142 | (42,649 | ) | (34,118 | ) | (8,960 | ) | (20,322 | ) | ||||||||||
Net income (loss) attributable to Masonite | 98,622 | (47,111 | ) | (37,340 | ) | (11,010 | ) | (23,245 | ) | ||||||||||
Income (loss) from continuing operations attributable to Masonite shareholders per common share (basic) | 3.27 | (1.53 | ) | (1.24 | ) | (0.37 | ) | (0.89 | ) | ||||||||||
Income (loss) from continuing operations attributable to Masonite shareholders per common share (diluted) | 3.19 | (1.53 | ) | (1.24 | ) | (0.37 | ) | (0.89 | ) | ||||||||||
Net income (loss) attributable to Masonite shareholders per common share (basic) | 3.25 | (1.56 | ) | (1.26 | ) | (0.39 | ) | (0.84 | ) | ||||||||||
Net income (loss) attributable to Masonite shareholders per common share (diluted) | 3.17 | (1.56 | ) | (1.26 | ) | (0.39 | ) | (0.84 | ) | ||||||||||
Cash Flow Data: | |||||||||||||||||||
Capital expenditures | 82,287 | 51,065 | 50,147 | 45,971 | 48,419 | ||||||||||||||
Balance Sheet Data: | |||||||||||||||||||
Working capital (1) | 347,559 | 326,428 | 455,335 | 377,312 | 398,903 | ||||||||||||||
Total assets | 1,475,861 | 1,499,149 | 1,616,146 | 1,566,345 | 1,619,105 | ||||||||||||||
Total debt | 470,745 | 468,856 | 503,785 | 370,383 | 370,343 | ||||||||||||||
Total equity | 659,776 | 655,566 | 735,499 | 825,562 | 837,815 | ||||||||||||||
____________
(1) Working capital is defined as current assets less current liabilities and includes cash restricted by letters of credit.
30
Item 7. Management's Discussion and Analysis of Financial Condition and Results of Operations
The following Management's Discussion and Analysis of Financial Condition and Results of Operations ("MD&A") is based upon accounting principles generally accepted in the United States of America and discusses the financial condition and results of operations for Masonite International Corporation for the years ended January 1, 2017, January 3, 2016, and December 28, 2014. In this MD&A, "Masonite," "we," "us," "our" and the "Company" refer to Masonite International Corporation and its subsidiaries.
This discussion should be read in conjunction with the consolidated financial statements and related notes included elsewhere in this Annual Report on Form 10-K. The following discussion should also be read in conjunction with the disclosure under "Special Note Regarding Forward Looking Statements" and Part I, Item 1A, "Risk Factors", elsewhere in this Annual Report on Form 10-K. Our actual results could differ materially from the forward-looking statements as a result of these risks and uncertainties. Certain prior year amounts have been reclassified to conform to the current basis of presentation.
Overview
We are a leading global designer, manufacturer and distributor of interior and exterior doors for the new construction and repair, renovation and remodeling sectors of the residential and non-residential building construction markets. Since 1925, we have provided our customers with innovative products and superior service at compelling values. In order to better serve our customers and create sustainable competitive advantages, we focus on developing innovative products, advanced manufacturing capabilities and technology-driven sales and service solutions.
We market and sell our products to remodeling contractors, builders, homeowners, retailers, dealers, lumberyards, commercial and general contractors and architects through well-established wholesale, retail and direct distribution channels as part of our cross-merchandising strategy. Customers are provided a broad product offering of interior and exterior doors and entry systems at various price points. We manufacture a broad line of interior doors, including residential molded, flush, stile and rail, louver and specially-ordered commercial and architectural doors; door components for internal use and sale to other door manufacturers; and exterior residential steel, fiberglass and wood doors and entry systems.
We operate 64 manufacturing and distribution facilities in 8 countries in North America, South America, Europe and Asia, which are strategically located to serve our customers through multiple distribution channels. These distribution channels include: (i) direct distribution to retail home center customers; (ii) one-step distribution that sells directly to homebuilders and contractors; and (iii) two-step distribution through wholesale distributors. For retail home center customers, numerous door fabrication facilities provide value-added fabrication and logistical services, including pre-finishing and store delivery of pre-hung interior and exterior doors. We believe our ability to provide: (i) a broad product range; (ii) frequent, rapid, on-time and complete delivery; (iii) consistency in products and merchandising; (iv) national service; and (v) special order programs enables retail customers to increase comparable store sales and helps to differentiate us from our competitors. We believe investments in innovative new product manufacturing and distribution capabilities, coupled with an ongoing commitment to operational excellence, provide a strong platform for future growth.
Our reportable segments are currently organized and managed principally by end market: North American Residential, Europe and Architectural. In the year ended January 1, 2017, we generated net sales of $1,351.3 million or 68.5%, $301.2 million or 15.3% and $297.9 million or 15.1% in our North American Residential, Europe and Architectural segments, respectively. See "Components of Results of Operations - Segment Information" below for a description of our reportable segment change that occurred in the first quarter of 2016.
31
Key Factors Affecting Our Results of Operations
Product Demand
There are numerous factors that influence overall market demand for our products. Demand for new homes, home improvement products and other building construction products have a direct impact on our financial condition and results of operations. Demand for our products may be impacted by changes in United States, Canadian, European, Asian or other global economic conditions, including inflation, deflation, interest rates, availability of capital, consumer spending rates, energy availability and costs, and the effects of governmental initiatives to manage economic conditions. Additionally, trends in residential new construction, repair, renovation and remodeling and architectural building construction may directly impact our financial performance. Accordingly, the following factors may have a direct impact on our business in the countries and regions in which our products are sold:
• | the strength of the economy; |
• | the amount and type of residential and commercial construction; |
• | housing sales and home values; |
• | the age of existing home stock, home vacancy rates and foreclosures; |
• | commercial building occupancy rates; |
• | increases in the cost of raw materials or any shortage in supplies; |
• | the availability and cost of credit; |
• | employment rates and consumer confidence; and |
• | demographic factors such as immigration and migration of the population and trends in household formation. |
Additionally, the United Kingdom's vote to leave, and its eventual exit from, the European Union has created uncertainty in European demand, particularly in the United Kingdom, which could have a material adverse effect on the demand for our products in the foreseeable future.
Product Pricing and Mix
The building products industry is highly competitive and we therefore face pressure on sales prices of our products. In addition, our competitors may adopt more aggressive sales policies and devote greater resources to the development, promotion and sale of their products than we do, which could result in a loss of customers. Our business in general is subject to changing consumer and industry trends, demands and preferences. Trends within the industry change often and our failure to anticipate, identify or quickly react to changes in these trends could lead to, among other things, rejection of a new product line and reduced demand and price reductions for our products, which could materially adversely affect us. Changes in consumer preferences may also lead to increased demand for our lower margin products relative to our higher margin products, which could reduce our future profitability.
Business Wins and Losses
Our customers consist mainly of wholesalers and retail home centers. In fiscal year 2016, our top ten customers together accounted for approximately 44% of our net sales and our top customer, The Home Depot, Inc. accounted for approximately 16% of our net sales in fiscal year 2016. Net sales from customers that have accounted for a significant portion of our net sales in past periods, individually or as a group, may not continue in future periods, or if continued, may not reach or exceed historical levels in any period. Certain customers perform periodic product line reviews to assess their product offerings, which have, on past occasions, led to business wins and losses. In addition, as a result of competitive bidding processes, we may not be able to increase or maintain the margins at which we sell our products to our customers.
Organizational Restructuring
Over the past several years we have initiated, and in the future we may initiate, restructuring plans designed to eliminate excess capacity in order to align our manufacturing capabilities with reductions in demand, as well as to streamline our organizational structure and reposition our business for improved long-term profitability.
32
During 2016, we began implementing a plan (the "2016 Plan") to close one manufacturing facility in the Architectural segment, which includes the reduction of approximately 140 positions. The 2016 Plan is expected to improve our cost structure and enhance operational efficiencies, and is expected to be completed by the end of the third quarter of 2017. Costs associated with the 2016 Plan include closure costs and severance. Additionally, the announcement of the plant closure was determined to be a triggering event requiring a test of the carrying value of the definite-lived assets of the plant, as further described in Note 12. Asset Impairment in the Notes to the Consolidated Financial Statements in this Annual Report. As of January 1, 2017, we expect to incur approximately $2.5 million of additional charges related to the 2016 Plan. Once completed, the 2016 Plan is expected to increase our annual earnings and cash flows by approximately $4 million.
During 2015, we began implementing a multi-year plan to reorganize and consolidate certain aspects of our global head office (the "2015 Plan"). The 2015 Plan includes the creation of a new shared services function and the rationalization of certain of our European facilities, including related headcount reductions. The 2015 Plan was implemented in response to the need for more effective business processes enabled by the planned implementation of our new enterprise resource planning system in our architectural business as well as ongoing weak market conditions in Africa and Europe outside of the United Kingdom. Costs associated with the 2015 Plan included severance and closure charges and are substantially completed. As of January 1, 2017, we do not expect to incur any material future charges for the 2015 Plan. Once fully implemented, the 2015 Plan is estimated to increase our annual earnings and cash flows by approximately $6 million.
On August 20, 2014, the Board of Directors of Masonite Israel Ltd. (“Israel”), one of our wholly-owned subsidiaries, decided to voluntarily seek a Stay of Proceedings from the Israeli courts in an attempt to restructure the business (the “2014 Plan”). The court filing was made on August 21, 2014, and the court appointed a trustee to oversee the operation of the business and to attempt to restructure it. The action to seek court protection followed a comprehensive evaluation of the alternatives for the business, including an organized sale process that was ultimately unsuccessful. We determined that the subsidiary should be deconsolidated at that time, as it had become subject to the control of a court. We have had and will continue to have no continuing involvement with Israel subsequent to August 21, 2014, and Israel will not be considered a related party. As of January 1, 2017, pending the ultimate resolution of the Stay of Proceedings, we do not anticipate any material future charges related to the 2014 Plan. The 2014 Plan has been estimated to have increased our annual earnings and cash flows by approximately $4 million.
Foreign Exchange Rate Fluctuation
Our financial results may be adversely affected by fluctuating exchange rates. In the years ended January 1, 2017, January 3, 2016, and December 28, 2014 approximately 35%, 36% and 42% of our net sales were generated outside of the United States, respectively. In addition, a significant percentage of our costs during the same period were not denominated in U.S. dollars. For example, for most of our manufacturing and distribution facilities, the prices for a significant portion of our raw materials are quoted in the domestic currency of the country where the facility is located or other currencies that are not U.S. dollars. We also have substantial assets outside the United States. As a result, the volatility in the price of the U.S. dollar has exposed, and in the future may continue to expose, us to currency exchange risks. Also, since our financial statements are denominated in U.S. dollars, changes in currency exchange rates between the U.S. dollar and other currencies have had, and will continue to have, an impact on many aspects of our financial results. Changes in currency exchange rates for any country in which we operate may require us to raise the prices of our products in that country or allow our competitors to sell their products at lower prices in that country. Unrealized exchange gains and losses arising from the translation of the financial statements of our non-U.S. functional currency operations are accumulated in the cumulative translation adjustments account in accumulated other comprehensive income (loss). Losses from currency translation adjustments as a result of translating our foreign assets and liabilities into U.S. dollars during the year ended January 1, 2017, were $37.1 million, which were primarily driven by the weakening of the Pound Sterling against the U.S. dollar.
Inflation
An increase in inflation could have a significant impact on the cost of our raw material inputs. Increased prices for raw materials or finished goods used in our products and/or interruptions in deliveries of raw materials or finished goods could adversely affect our profitability, margins and net sales, particularly if we are not able to pass these incurred costs on to our customers. In addition, interest rates normally increase during periods of rising inflation. Historically, as
33
interest rates increase, demand for new homes and home improvement products decreases. An environment of gradual interest rate increases may, however, signify an improving economy or increasing real estate values, which in turn may stimulate increased home buying activity.
Seasonality
Our business is moderately seasonal and our net sales vary from quarter to quarter based upon the timing of the building season in our markets. Severe weather conditions in any quarter, such as unusually prolonged warm or cold conditions, rain, blizzards or hurricanes, could accelerate, delay or halt construction and renovation activity.
Acquisitions and Dispositions
We are pursuing a strategic initiative of optimizing our global business portfolio. As part of this strategy, in the last several years we have pursued strategic acquisitions targeting companies who produce components for our existing operations, manufacture niche products and provide value-added services. Additionally, we target companies with strong brands, complementary technologies, attractive geographic footprints and opportunities for cost and distribution synergies. We also continuously analyze our operations to determine which businesses, market channels and products create the most value for our customers and acceptable returns for our shareholders.
Acquisitions
• | FyreWerks: On November 3, 2016 we completed the acquisition of FyreWerks, Inc. (“FyreWerks”), based in Westminster, Colorado. We acquired 100% of the equity interests in FyreWerks for consideration of $8.0 million, net of cash acquired. FyreWerks manufactures certified fire door core and frame components for use with architectural stile and rail wood panel doors and door frames. The FyreWerks acquisition complements our existing Architectural components business. |
• | USA Wood Door: On October 1, 2015, we completed the acquisition of USA Wood Door, Inc. (“USA Wood Door”), based in Thorofare, New Jersey. We acquired 100% of the equity interests in USA Wood Door for consideration of $13.7 million, net of cash acquired. USA Wood Door is a supplier of architectural and commercial wood doors in the Eastern United States providing door and hardware distributors with machined, re-sized and value-added additions to both unfinished and prefinished doors in short lead times. |
• | Hickman: On August 5, 2015, we completed the acquisition of Hickman Industries Limited (“Hickman”), a leading supplier of doorkits (similar to fully finished prehung door units) and other millwork in the United Kingdom. We acquired 100% of the equity interests in Hickman for consideration of $88.0 million, net of cash acquired. Hickman is headquartered in Wolverhampton, England, and their leadership in providing doorkit solutions to the homebuilder market in the United Kingdom is a natural extension of our existing business in the United Kingdom. Hickman’s deployment of automation and product line leadership complements the strategies we are pursuing with our business. |
• | PDS: On July 23, 2015, we completed the acquisition of Performance Doorset Solutions (“PDS”), a leading supplier of custom doors and millwork in the United Kingdom that specializes in non-standard product specifications, manufacturing both wood and composite solutions. We acquired 100% of the equity interests in PDS for consideration of $15.7 million, net of cash acquired. PDS is based in Lancashire, United Kingdom, and is a producer of high quality niche product lines that complement our existing United Kingdom business. |
• | Harring: On December 1, 2014, we completed the acquisition of Harring Doors Corporation ("Harring") for net consideration of $3.9 million. Harring manufactures interior and exterior stile and rail wood doors for architectural door applications at its facility in London, Ontario. The acquisition of Harring complements our architectural wood door business. |
34
• | Door-Stop: On February 24, 2014, we completed the acquisition of Door-Stop International Limited ("Door-Stop") for total consideration of $50.4 million, net of cash acquired. We acquired 100% of the equity interests in Door-Stop through the purchase of all outstanding shares of common stock on the acquisition date. Door-Stop is based in Nottinghamshire, United Kingdom, utilizes an internet-based ordering process and manufactures exterior door sets for the residential repair and renovation markets. The Door-Stop acquisition complements our existing exterior fiberglass business. |
Dispositions
• | South Africa: On December 22, 2015, following a comprehensive assessment of Masonite (Africa) Limited (“MAL”), our South African subsidiary, the MAL Board of Directors approved a plan to enter into Business Rescue proceedings, the South African equivalent of bankruptcy proceedings in the United States, similar to a Chapter 11 reorganization. As a result of this plan, a Business Rescue Practitioner was appointed to manage the affairs of the business and we no longer maintained operational control over MAL. For this reason, we deconsolidated MAL effective December 22, 2015. |
Subsequent to deconsolidation, we used the cost method to account for our equity investment in MAL, which was reflected as $10.0 million in our consolidated balance sheets as of January 3, 2016, based on the estimated fair value of our portion of MAL’s net assets on the date of deconsolidation. On May 5, 2016, the Business Rescue Practitioner proposed a business rescue plan that would result in the sale of the business. On August 10, 2016, MAL announced the closing of the transaction proposed as part of the business rescue plan by the Business Rescue Practitioner. During September 2016, we received $15.1 million as final pre-tax proceeds from the closing of the transaction. Upon receipt of these proceeds, our equity interest in MAL was eliminated and we accordingly reduced the value of our cost investment in MAL to zero and recorded a gain on disposal of subsidiaries of $5.1 million.
• | France: On July 31, 2015, we completed the sale of all of the capital stock of Premdor, S.A.S., Masonite’s door business in France, to a Paris-based independent investment firm (the "Buyer"). Pursuant to a stock purchase agreement dated July 16, 2015, the Buyer acquired all of Masonite's door manufacturing and distribution business in France for nominal consideration. |
• | Israel: Effective August 20, 2014, Masonite Israel Ltd., one of our wholly-owned subsidiaries, was deconsolidated due to our loss of operational control over the entity, as further described in Key Factors Affecting our Results of Operations - Organizational Restructuring above. |
Components of Results of Operations
Net Sales
Net sales are derived from the sale of products to our customers. We recognize sales of our products when an agreement with the customer in the form of a sales order is in place, the sales price is fixed or determinable, collection is reasonably assured and the customer has taken ownership and assumes risk of loss. Certain customers are eligible to participate in various incentive and rebate programs considered as a reduction of the sales price of our products. Accordingly, net sales are reported net of such incentives and rebates. Additionally, shipping and other transportation costs charged to customers are recorded in net sales in the consolidated statements of comprehensive income (loss).
Cost of Goods Sold
Our cost of goods sold is comprised of the cost to manufacture products for our customers and includes the cost of materials, direct labor, overhead, distribution and depreciation associated with assets used to manufacture products. Research and development costs are primarily included within cost of goods sold. We incur significant fixed and variable overhead at our global component locations that manufacture interior molded door facings. Our overall average production capacity utilization at these locations was approximately 77%, 68%, and 67% for the years ended January 1, 2017, January 3, 2016, and December 28, 2014.
35
Selling, General and Administration Expenses
Selling, general and administration expenses primarily include the costs for our sales organization and support staff at various plants and corporate offices. These costs include personnel costs for payroll, related benefits and stock based compensation expense; professional fees including legal, accounting and consulting fees; depreciation and amortization of our non-manufacturing equipment and assets; travel and entertainment expenses; director, officer and other insurance policies; environmental, health and safety costs; advertising expenses and rent and utilities related to administrative office facilities. Certain charges that are also incurred less frequently and are included in selling, general and administration costs include gain or loss on disposal of property, plant and equipment and bad debt expense.
Restructuring Costs
Restructuring costs include all salary-related severance benefits that are accrued and expensed when a restructuring plan has been put into place, the plan has received approval from the appropriate level of management and the benefit is probable and reasonably estimable. In addition to salary-related costs, we incur other restructuring costs when facilities are closed or capacity is realigned within the organization. Upon termination of a contract we record liabilities and expenses pursuant to the terms of the relevant agreement. For non-contractual restructuring activities, liabilities and expenses are measured and recorded at fair value in the period in which they are incurred.
Asset Impairment
Asset impairment includes charges that are taken when impairment testing indicates that the carrying values of our long-lived assets or asset groups exceed their respective fair values. Definite-lived assets are evaluated for impairment when events or changes in circumstances indicate that the carrying value of an asset or asset group may not be recoverable. Indefinite-lived intangible assets and goodwill are tested annually for impairment on the last day of fiscal November, or more frequently if events or changes in circumstances indicate the carrying value may not be recoverable. An impairment loss is recognized when the carrying value of the asset or asset group being tested exceeds its fair value, except in the case of goodwill, which is tested based on the fair value of the reporting unit where the goodwill is recorded.
Loss (Gain) on Disposal of Subsidiaries
Loss (gain) on disposal of subsidiaries represents the difference between proceeds received upon disposition and the book value of a subsidiary which has been divested and was excluded from treatment as a discontinued operation. Also included in loss (gain) on disposal of subsidiaries is recognition of the cumulative translation adjustment out of accumulated other comprehensive income (loss).
Interest Expense, Net
Interest expense, net relates primarily to our consolidated senior unsecured indebtedness. Subsequent to March 23, 2015, interest expense, net relates to our $475.0 million aggregate principal amount of 5.625% senior unsecured notes due March 15, 2023 (the "2023 Notes"). Prior to March 23, 2015, interest expense related to our $500.0 million aggregate principal amount of 8.25% senior unsecured notes due April 15, 2021. Debt issuance costs incurred in connection with the 2023 Notes were capitalized as a reduction to the carrying value of debt and are being accreted to interest expense over their respective terms. Certain issuances of our 8.25% senior unsecured notes due 2021 resulted in premiums that were amortized to interest expense over their respective terms. Unamortized premiums and unamortized debt issuance costs relating to the notes redeemed were written off upon redemption. Additionally, we pay interest on any outstanding principal under our ABL Facility and we are required to pay a commitment fee for unutilized commitments under the ABL Facility, both of which are recorded in interest expense as incurred.
Loss on Extinguishment of Debt
Loss on extinguishment of debt represents the difference between the reacquisition price of debt and the net carrying amount of the extinguished debt. The net carrying amount includes the principal, unamortized premium and unamortized debt issuance costs.
36
Other Expense (Income), Net
Other expense (income), net includes profits and losses related to our non-majority owned unconsolidated subsidiaries that we recognize under the equity method of accounting, unrealized gains and losses on foreign currency remeasurements, pension settlement charges and other miscellaneous non-operating expenses.
Income Tax Expense (Benefit)
Income taxes are recorded using the asset and liability method of accounting for income taxes. Under the asset and liability method, deferred tax assets and liabilities are recognized for the deferred tax consequences attributable to differences between the financial statement carrying amounts of existing assets and liabilities and their respective tax bases. Deferred tax assets and liabilities are measured using enacted tax rates expected to apply to taxable income in the years in which those temporary differences are expected to be recovered or settled. The effect on deferred tax assets and liabilities due to a change in tax rates is recognized in income in the period that includes the date of enactment. A valuation allowance is recorded to reduce deferred tax assets to an amount that is anticipated to be realized on a more likely than not basis. Our combined effective income tax rate is primarily the weighted average of federal, state and provincial rates in various countries where we have operations, including the United States, Canada, the United Kingdom and Ireland. Our income tax rate is also affected by estimates of our ability to realize tax assets and changes in tax laws.
Segment Information
During the first quarter of 2016, we changed our reportable segments to align with changes in how we manage our business, review operating performance and allocate resources as a result of the deconsolidation of Africa and other internal reporting changes. All prior period information was recast to reflect this change. Our reportable segments are organized and managed principally by end market: North American Residential, Europe and Architectural. The North American Residential reportable segment is the aggregation of the Wholesale and Retail operating segments. The Europe reportable segment is the aggregation of the United Kingdom, Central Eastern Europe and France (prior to disposal) operating segments. The Architectural reportable segment consists solely of the Architectural operating segment. The Corporate & Other category includes unallocated corporate costs and the results of immaterial operating segments which were not aggregated into any reportable segment, including the historical results of our Africa operating segment. Operating segments are aggregated into reportable segments only if they exhibit similar economic characteristics. In addition to similar economic characteristics we also consider the following factors in determining the reportable segments: the nature of business activities, the management structure directly accountable to our chief operating decision maker for operating and administrative activities, availability of discrete financial information and information presented to the Board of Directors and investors. The discussion of segment results herein is based on the new reportable segments.
37
Our management reviews net sales and Adjusted EBITDA (as defined below) to evaluate segment performance and allocate resources. Net assets are not allocated to the reportable segments. Adjusted EBITDA is a non-GAAP financial measure which does not have a standardized meaning under GAAP and is unlikely to be comparable to similar measures used by other companies. Adjusted EBITDA should not be considered as an alternative to either net income or operating cash flows determined in accordance with GAAP. Adjusted EBITDA is defined as net income (loss) attributable to Masonite adjusted to exclude the following items:
• | depreciation; |
• | amortization; |
• | share based compensation expense; |
• | loss (gain) on disposal of property, plant and equipment; |
• | registration and listing fees; |
• | restructuring costs; |
• | asset impairment; |
• | loss (gain) on disposal of subsidiaries; |
• | interest expense (income), net; |
• | loss on extinguishment of debt; |
• | other expense (income), net; |
• | income tax expense (benefit); |
• | loss (income) from discontinued operations, net of tax; and |
• | net income (loss) attributable to non-controlling interest. |
This definition of Adjusted EBITDA differs from the definitions of EBITDA contained in the indenture governing the 2023 Notes and the credit agreement governing the ABL Facility. Adjusted EBITDA is used to evaluate and compare the performance of the segments and it is one of the primary measures used to determine employee incentive compensation. Intersegment transfers are negotiated on an arm’s length basis, using market prices.
We believe that Adjusted EBITDA, from an operations standpoint, provides an appropriate way to measure and assess segment performance. Our management team has established the practice of reviewing the performance of each segment based on the measures of net sales and Adjusted EBITDA. We believe that Adjusted EBITDA is useful to users of the consolidated financial statements because it provides the same information that we use internally to evaluate and compare the performance of the segments and it is one of the primary measures used to determine employee incentive compensation.
38
Results of Operations
Year Ended | |||||||||||
(In thousands) | January 1, 2017 | January 3, 2016 | December 28, 2014 | ||||||||
Net sales | $ | 1,973,964 | $ | 1,871,965 | $ | 1,837,700 | |||||
Cost of goods sold | 1,564,319 | 1,521,115 | 1,572,301 | ||||||||
Gross profit | 409,645 | 350,850 | 265,399 | ||||||||
Gross profit as a % of net sales | 20.8 | % | 18.7 | % | 14.4 | % | |||||
Selling, general and administration expenses | 260,364 | 244,145 | 224,077 | ||||||||
Selling, general and administration expenses as a % of net sales | 13.2 | % | 13.0 | % | 12.2 | % | |||||
Restructuring costs | 1,445 | 5,678 | 11,137 | ||||||||
Asset impairment | 1,511 | 9,439 | 18,202 | ||||||||
Loss (gain) on disposal of subsidiaries | (6,575 | ) | 59,984 | — | |||||||
Operating income (loss) | 152,900 | 31,604 | 11,983 | ||||||||
Interest expense (income), net | 28,178 | 32,884 | 41,525 | ||||||||
Loss on extinguishment of debt | — | 28,046 | — | ||||||||
Other expense (income), net | (1,959 | ) | (1,757 | ) | (587 | ) | |||||
Income (loss) from continuing operations before income tax expense (benefit) | 126,681 | (27,569 | ) | (28,955 | ) | ||||||
Income tax expense (benefit) | 21,787 | 14,172 | 4,533 | ||||||||
Income (loss) from continuing operations | 104,894 | (41,741 | ) | (33,488 | ) | ||||||
Income (loss) from discontinued operations, net of tax | (752 | ) | (908 | ) | (630 | ) | |||||
Net income (loss) | 104,142 | (42,649 | ) | (34,118 | ) | ||||||
Less: net income (loss) attributable to non-controlling interest | 5,520 | 4,462 | 3,222 | ||||||||
Net income (loss) attributable to Masonite | $ | 98,622 | $ | (47,111 | ) | $ | (37,340 | ) | |||
Year Ended January 1, 2017, Compared with Year Ended January 3, 2016
Our fiscal year is the 52- or 53-week period ending on the Sunday closest to December 31. In a 52-week year, each fiscal quarter consists of 13 weeks. For ease of disclosure, the 13-week periods are referred to as three-month periods and the 52- or 53-week periods are referred to as years. Our 2015 fiscal year, which ended on January 3, 2016, contained 53 weeks of operating results, with the additional week occurring in the fourth quarter.
Net Sales
Net sales in the year ended January 1, 2017, were $1,974.0 million, an increase of $102.0 million or 5.4% from $1,872.0 million in the year ended January 3, 2016. Net sales in 2016 were negatively impacted by $47.4 million as a result of foreign exchange rate fluctuations. Excluding this exchange rate impact, net sales would have increased by $149.4 million or 8.0% due to changes in volume, average unit price and sales of components and other products. Higher volume in 2016 increased net sales by $99.2 million or 5.3% compared to 2015. Average unit price in 2016 increased net sales by $48.8 million or 2.6% compared to 2015. Also contributing to this increase were higher net sales of components and other products to external customers, which were $1.4 million higher in 2016 compared to 2015. The change in volume includes the incremental impacts of acquisitions and dispositions.
39
Net Sales and Percentage of Net Sales by Reportable Segment
Year Ended | |||||||
(In thousands) | January 1, 2017 | January 3, 2016 | |||||
North American Residential | $ | 1,357,228 | $ | 1,197,330 | |||
North American Residential intersegment | (5,926 | ) | (4,106 | ) | |||
North American Residential net sales to external customers | 1,351,302 | 1,193,224 | |||||
Percentage of consolidated net sales | 68.5 | % | 63.7 | % | |||
Europe | 305,710 | 312,560 | |||||
Europe intersegment | (4,543 | ) | (719 | ) | |||
Europe net sales to external customers | 301,167 | 311,841 | |||||
Percentage of consolidated net sales | 15.3 | % | 16.7 | % | |||
Architectural | 312,241 | 302,129 | |||||
Architectural intersegment | (14,353 | ) | (10,310 | ) | |||
Architectural net sales to external customers | 297,888 | 291,819 | |||||
Percentage of consolidated net sales | 15.1 | % | 15.6 | % | |||
Corporate & Other net sales to external customers | 23,607 | 75,081 | |||||
Net sales to external customers | $ | 1,973,964 | $ | 1,871,965 | |||
North American Residential
Net sales to external customers from facilities in the North American Residential segment in the year ended January 1, 2017, were $1,351.3 million, an increase of $158.1 million or 13.3% from $1,193.2 million in the year ended January 3, 2016. Net sales in 2016 were negatively impacted by $17.8 million as a result of foreign exchange rate fluctuations. Excluding this exchange rate impact, net sales would have increased by $175.9 million or 14.7% due to changes in volume, average unit price and sales of components and other products. Higher volume in 2016 increased net sales by $160.4 million or 13.4% compared to 2015. Average unit price increased net sales in 2016 by $14.2 million or 1.2% compared to 2015. Also contributing to this increase were higher net sales of components and other products to external customers, which were $1.3 million higher in 2016 compared to 2015.
Europe
Net sales to external customers from facilities in the Europe segment in the year ended January 1, 2017, were $301.2 million, a decrease of $10.6 million or 3.4% from $311.8 million in the year ended January 3, 2016. Net sales in 2016 were negatively impacted by $28.0 million as a result of foreign exchange fluctuations. Excluding this exchange rate impact, net sales would have increased by $17.4 million or 5.6% due to changes in volume, average unit price and sales of components and other products. Average unit price increased net sales in 2016 by $24.2 million or 7.8% compared to 2015. Partially offsetting this increase were lower volume in 2016, which decreased net sales by $4.8 million or 1.5%, and net sales of components and other products to external customers, which were $2.0 million lower in 2016 compared to 2015. The change in volume includes the incremental impacts of acquisitions and dispositions.
Architectural
Net sales to external customers from facilities in the Architectural segment in the year ended January 1, 2017, were $297.9 million, an increase of $6.1 million or 2.1% from $291.8 million in the year ended January 3, 2016. Net sales in 2016 were negatively impacted by $1.3 million as a result of foreign exchange fluctuations. Excluding this
40
exchange rate impact, net sales would have increased by $7.4 million or 2.5% due to changes in volume, average unit price and sales of components and other products. Average unit price increased net sales in 2016 by $10.4 million or 3.6% compared to 2015. Net sales of components and other products to external customers were $2.4 million higher in 2016 compared to 2015. Lower volume decreased net sales in 2016 by $5.4 million or 1.9%.
Cost of Goods Sold
Cost of goods sold as a percentage of net sales was 79.2% and 81.3% for the year ended January 1, 2017, and January 3, 2016, respectively. The primary reasons for the decrease in cost of goods sold as a percentage of net sales were the favorable impact of average unit price on our net sales, our increased operating leverage and our continued cost control efforts. Material cost of sales, overhead and depreciation as a percentage of net sales in 2016 decreased 1.5%, 0.7%, 0.3%, respectively, over the 2015 period. Direct labor and distribution as a percentage of sales increased by 0.3% and 0.1%, respectively, over the 2015 period.
Selling, General and Administration Expenses
In the year ended January 1, 2017, selling, general and administration expenses, as a percentage of net sales, were 13.2% compared to 13.0% in the year ended January 3, 2016, an increase of 20 basis points.
Selling, general and administration expenses in the year ended January 1, 2017, were $260.4 million, an increase of $16.3 million from $244.1 million in the year ended January 3, 2016. The increase included $6.7 million of non-cash items in SG&A expenses, including share based compensation, depreciation and amortization, deferred compensation and loss on sale of fixed assets. The increase was also driven by an $8.3 million increase in personnel costs due to a combination of wage inflation and investments in additional personnel, a $3.9 million increase in professional fees, primarily related to IT and digital initiatives, a $1.2 million increase in marketing costs, a $0.8 million increase in travel expenses and other increases of $0.8 million. These increases were partially offset by favorable foreign exchange impacts of $5.0 million and a net incremental decrease of $0.4 million due to acquisitions and dispositions.
Restructuring Costs
Restructuring costs in the year ended January 1, 2017, were $1.4 million, compared to $5.7 million in the year ended January 3, 2016. Restructuring costs in 2016 were related primarily to expenses incurred as part of the 2016 Plan. Costs incurred in 2015 were related primarily to the 2015 Plan.
Asset Impairment
Asset impairment charges were $1.5 million in the year ended January 1, 2017, compared to $9.4 million in the year ended January 3, 2016. Asset impairment charges in 2016 resulted from restructuring actions associated with the 2016 Plan. Asset impairment charges in 2015 resulted from the sale of Premdor S.A.S., Masonite's door business in France, which was determined to be a triggering event requiring a test of the indefinite-lived trade name assets of the Europe segment. This charge represents the excess of the carrying value over the fair value as determined using the relief of royalty discounted cash flows method.
Loss (Gain) on Disposal of Subsidiaries
Gain on disposal of subsidiaries was $6.6 million in the year ended January 1, 2017, compared to the loss on disposal of subsidiaries of $60.0 million in the year ended January 3, 2016. The gain in 2016 arose as a result of the sale of our equity interest in MAL and the liquidation of our legal entity in Romania. The gain relating to MAL represents the excess of pre-tax cash received upon closing of the sale over the book value of the investment, and the gain relating to Romania is comprised of the recognition of the cumulative translation adjustment out of accumulated other comprehensive income (loss). The charge in 2015 arose as a result of the deconsolidation of MAL and the disposition of Premdor S.A.S., our door business in France.
41
Interest Expense, Net
Interest expense, net, in the year ended January 1, 2017, was $28.2 million, compared to $32.9 million in the year ended January 3, 2016. This decrease primarily relates to the refinancing of $500.0 million of 8.25% senior unsecured notes for $475.0 million of 5.625% senior unsecured notes issued on March 23, 2015.
Loss on Extinguishment of Debt
Loss on extinguishment of debt was zero in the year ended January 1, 2017, compared to $28.0 million in the year ended January 3, 2016. The charge in 2015 represents the difference between the redemption price of our senior unsecured notes due 2021 of $531.7 million and the net carrying amount of such notes of $503.7 million. In addition to the $500.0 million of principal, the redemption price included a make-whole premium of $31.7 million and the net carrying amount included unamortized premiums of $11.5 million, partially offset by unamortized debt issuance costs of $7.8 million.
Other Expense (Income), Net
Other expense (income), net, in the year ended January 1, 2017, was $(2.0) million, compared to $(1.8) million in the year ended January 3, 2016. The change in other expense (income), net, is primarily due to unrealized gains and losses on foreign currency remeasurements. Also contributing to the change were our portion of dividends and the net gains and losses related to our non-majority owned unconsolidated subsidiary that are recognized under the equity method of accounting and other miscellaneous non-operating expenses.
Income Tax Expense (Benefit)
Our income tax expense in the year ended January 1, 2017, was $21.8 million, an increase of $7.6 million from $14.2 million of income tax expense in the year ended January 3, 2016. The increase in income tax expense (benefit) is primarily due to the mix of income or losses within the tax jurisdictions with various tax rates in which we operate and losses in tax jurisdictions with existing valuation allowances.
Segment Information
Year Ended January 1, 2017 | |||||||||||||||||||
(In thousands) | North American Residential | Europe | Architectural | Corporate & Other | Total | ||||||||||||||
Adjusted EBITDA | $ | 212,619 | $ | 38,795 | $ | 25,160 | $ | (24,061 | ) | $ | 252,513 | ||||||||
Adjusted EBITDA as a percentage of segment net sales | 15.7 | % | 12.9 | % | 8.4 | % | 12.8 | % | |||||||||||
Year Ended January 3, 2016 | |||||||||||||||||||
(In thousands) | North American Residential | Europe | Architectural | Corporate & Other | Total | ||||||||||||||
Adjusted EBITDA | $ | 165,560 | $ | 30,468 | $ | 23,281 | $ | (15,112 | ) | $ | 204,197 | ||||||||
Adjusted EBITDA as a percentage of segment net sales | 13.9 | % | 9.8 | % | 8.0 | % | 10.9 | % | |||||||||||
42
The following reconciles Adjusted EBITDA to net income (loss) attributable to Masonite:
Year Ended January 1, 2017 | |||||||||||||||||||
(In thousands) | North American Residential | Europe | Architectural | Corporate & Other | Total | ||||||||||||||
Adjusted EBITDA | $ | 212,619 | $ | 38,795 | $ | 25,160 | $ | (24,061 | ) | $ | 252,513 | ||||||||
Less (plus): | |||||||||||||||||||
Depreciation | 31,159 | 8,480 | 9,622 | 8,343 | 57,604 | ||||||||||||||
Amortization | 4,383 | 9,069 | 7,999 | 3,276 | 24,727 | ||||||||||||||
Share based compensation expense | — | — | — | 18,790 | 18,790 | ||||||||||||||
Loss (gain) on disposal of property, plant and equipment | 1,094 | 564 | 484 | (31 | ) | 2,111 | |||||||||||||
Restructuring costs | — | 19 | 1,313 | 113 | 1,445 | ||||||||||||||
Asset impairment | — | — | 1,511 | — | 1,511 | ||||||||||||||
Loss (gain) on disposal of subsidiaries | — | (1,431 | ) | — | (5,144 | ) | (6,575 | ) | |||||||||||
Interest expense (income), net | — | — | — | 28,178 | 28,178 | ||||||||||||||
Other expense (income), net | — | 557 | — | (2,516 | ) | (1,959 | ) | ||||||||||||
Income tax expense (benefit) | — | — | — | 21,787 | 21,787 | ||||||||||||||
Loss (income) from discontinued operations, net of tax | — | — | — | 752 | 752 | ||||||||||||||
Net income (loss) attributable to non-controlling interest | 3,389 | — | — | 2,131 | 5,520 | ||||||||||||||
Net income (loss) attributable to Masonite | $ | 172,594 | $ | 21,537 | $ | 4,231 | $ | (99,740 | ) | $ | 98,622 | ||||||||
Year Ended January 3, 2016 | |||||||||||||||||||
(In thousands) | North American Residential | Europe | Architectural | Corporate & Other | Total | ||||||||||||||
Adjusted EBITDA | $ | 165,560 | $ | 30,468 | $ | 23,281 | $ | (15,112 | ) | $ | 204,197 | ||||||||
Less (plus): | |||||||||||||||||||
Depreciation | 31,456 | 8,105 | 8,223 | 11,376 | 59,160 | ||||||||||||||
Amortization | 4,954 | 6,860 | 8,428 | 3,483 | 23,725 | ||||||||||||||
Share based compensation expense | — | — | — | 13,236 | 13,236 | ||||||||||||||
Loss (gain) on disposal of property, plant and equipment | 796 | 325 | 548 | (298 | ) | 1,371 | |||||||||||||
Restructuring costs | 10 | 2,501 | — | 3,167 | 5,678 | ||||||||||||||
Asset impairment | — | 9,439 | — | — | 9,439 | ||||||||||||||
Loss (gain) on disposal of subsidiaries | — | 29,721 | — | 30,263 | 59,984 | ||||||||||||||
Interest expense (income), net | — | — | — | 32,884 | 32,884 | ||||||||||||||
Loss on extinguishment of debt | — | — | — | 28,046 | 28,046 | ||||||||||||||
Other expense (income), net | (50 | ) | 1,087 | — | (2,794 | ) | (1,757 | ) | |||||||||||
Income tax expense (benefit) | — | — | — | 14,172 | 14,172 | ||||||||||||||
Loss (income) from discontinued operations, net of tax | — | — | — | 908 | 908 | ||||||||||||||
Net income (loss) attributable to non-controlling interest | 3,323 | — | — | 1,139 | 4,462 | ||||||||||||||
Net income (loss) attributable to Masonite | $ | 125,071 | $ | (27,570 | ) | $ | 6,082 | $ | (150,694 | ) | $ | (47,111 | ) | ||||||
43
Adjusted EBITDA in our North American Residential segment increased $47.0 million, or 28.4%, to $212.6 million in the year ended January 1, 2017, from $165.6 million in the year ended January 3, 2016. Adjusted EBITDA in the North American Residential segment included corporate allocations of shared costs of $50.7 million and $44.7 million in 2016 and 2015, respectively. The allocations generally consist of certain costs of human resources, legal, finance, information technology, research and development and share based compensation.
Adjusted EBITDA in our Europe segment increased $8.3 million, or 27.2%, to $38.8 million in the year ended January 1, 2017, from $30.5 million in the year ended January 3, 2016. Adjusted EBITDA in the Europe segment included an incremental comparative benefit of $0.1 million from the disposal of France in 2015.
Adjusted EBITDA in our Architectural segment increased $1.9 million to $25.2 million in the year ended January 1, 2017, from $23.3 million in the year ended January 3, 2016. Adjusted EBITDA in the Architectural segment also included corporate allocations of shared costs of $7.8 million and $6.5 million in 2016 and 2015, respectively. The allocations generally consist of certain costs of human resources, legal, finance and information technology.
Year Ended January 3, 2016, Compared with Year Ended December 28, 2014
Net Sales
Net sales in the year ended January 3, 2016, were $1,872.0 million, an increase of $34.3 million or 1.9% from $1,837.7 million in the year ended December 28, 2014. Net sales in 2015 were negatively impacted by $92.9 million as a result of foreign exchange rate fluctuations. Excluding this exchange rate impact, net sales would have increased by $127.2 million or 6.9% due to changes in volume, average unit price and sales of components and other products. Average unit price increased net sales in 2015 by $94.3 million or 5.1% compared to 2014. Also contributing to this increase were higher volume in 2015, which increased net sales by $30.5 million or 1.7% compared to 2014, and net sales of components and other products to external customers, which were $2.4 million higher in 2015 compared to 2014. The change in volume includes the incremental impacts of acquisitions and dispositions.
44
Net Sales and Percentage of Net Sales by Reportable Segment
Year Ended | |||||||
(In thousands) | January 3, 2016 | December 28, 2014 | |||||
North American Residential | $ | 1,197,330 | $ | 1,145,664 | |||
North American Residential intersegment | (4,106 | ) | (2,692 | ) | |||
North American Residential net sales to external customers | 1,193,224 | 1,142,972 | |||||
Percentage of consolidated net sales | 63.7 | % | 62.2 | % | |||
Europe | 312,560 | 326,649 | |||||
Europe intersegment | (719 | ) | (499 | ) | |||
Europe net sales to external customers | 311,841 | 326,150 | |||||
Percentage of consolidated net sales | 16.7 | % | 17.7 | % | |||
Architectural | 302,129 | 277,551 | |||||
Architectural intersegment | (10,310 | ) | (7,339 | ) | |||
Architectural net sales to external customers | 291,819 | 270,212 | |||||
Percentage of consolidated net sales | 15.6 | % | 14.7 | % | |||
Corporate & Other net sales to external customers | 75,081 | 98,366 | |||||
Net sales to external customers | $ | 1,871,965 | $ | 1,837,700 | |||
North American Residential
Net sales to external customers from facilities in the North American Residential segment in the year ended January 3, 2016, were $1,193.2 million, an increase of $50.2 million or 4.4% from $1,143.0 million in the year ended December 28, 2014. Net sales in 2015 were negatively impacted by $46.9 million as a result of foreign exchange rate fluctuations. Excluding this exchange rate impact, net sales would have increased by $97.1 million or 8.5% due to changes in volume, average unit price and sales of components and other products. Higher volume increased net sales in 2015 by $18.2 million or 1.6% and average unit price increased net sales in 2015 by $74.4 million or 6.5% compared to 2014. Net sales of components and other products to external customers were $4.5 million higher in 2015 compared to 2014.
Europe
Net sales to external customers from facilities in the Europe segment in the year ended January 3, 2016, were $311.8 million, a decrease of $14.4 million or 4.4% from $326.2 million in the year ended December 28, 2014. Net sales in 2015 were negatively impacted by $33.0 million as a result of foreign exchange fluctuations. Excluding this exchange rate impact, net sales would have increased by $18.6 million or 5.7% due to changes in volume, average unit price and sales of components and other products. Average unit price increased net sales in 2015 by $20.0 million or 6.1% and net sales of components and other products to external customers were $0.7 million higher in 2015 compared to 2014. Lower volume decreased net sales in 2015 by $2.1 million or 0.6% compared to 2014. The change in volume includes the incremental impacts of acquisitions and dispositions.
45
Architectural
Net sales to external customers from facilities in the Architectural segment in the year ended January 3, 2016, were $291.8 million, an increase of $21.6 million or 8.0% from $270.2 million in the year ended December 28, 2014. Net sales in 2015 were negatively impacted by $3.8 million as a result of foreign exchange fluctuations. Excluding this exchange rate impact, net sales would have increased by $25.4 million or 9.4% due to changes in volume, average unit price and sales of components and other products. Higher volume increased net sales in 2015 by $21.5 million or 8.0% and average unit price increased net sales in 2015 by $3.5 million or 1.3% compared to 2014. Net sales of components and other products to external customers were $0.4 million higher in 2015 compared to 2014.
Cost of Goods Sold
Cost of goods sold as a percentage of net sales was 81.3% and 85.6% for the year ended January 3, 2016, and December 28, 2014, respectively. The primary reasons for the decrease in cost of goods sold as a percentage of net sales were the favorable impact of average unit price on our net sales, our increased operating leverage and our continued cost control efforts. Material cost of sales, direct labor, overhead, distribution and depreciation as a percentage of net sales in 2015 decreased 2.0%, 0.7%, 0.7%, 0.3% and 0.6%, respectively, over the 2014 period.
Selling, General and Administration Expenses
In the year ended January 3, 2016, selling, general and administration expenses, as a percentage of net sales, were 13.0% compared to 12.2% in the year ended December 28, 2014, an increase of 80 basis points.
Selling, general and administration expenses in the year ended January 3, 2016, were $244.1 million, an increase of $20.0 million from $224.1 million in the year ended December 28, 2014. The increase was driven by a $21.8 million increase in personnel costs, $3.6 million of increased shared based compensation expense, $1.7 million of increased advertising costs, $1.6 million of increased depreciation and amortization, a $1.1 million reduction in business interruption insurance proceeds and other increases of $1.2 million. These increases were partially offset by favorable foreign exchange impacts of $7.9 million and a net $3.1 million incremental comparative benefit from our 2015 and 2014 acquisitions, the deconsolidation of Israel and the disposition of our door business in France. The increased personnel costs were driven by a combination of wage inflation, investments in personnel and an increase in the bonus accrual compared to the prior year.
Restructuring Costs
Restructuring costs in the year ended January 3, 2016, were $5.7 million, compared to $11.1 million in the year ended December 28, 2014. Restructuring costs in 2015 were related primarily to expenses incurred as part of the 2015 Plan. Costs incurred in 2014 were related primarily to the 2014 Plan.
Asset Impairment
Asset impairment charges in the year ended January 3, 2016, were $9.4 million compared to $18.2 million in the year ended December 28, 2014. Asset impairment charges in 2015 resulted from the sale of Premdor S.A.S., Masonite's door business in France.
Loss (Gain) on Disposal of Subsidiaries
Loss on disposal of subsidiaries was $60.0 million in the year ended January 3, 2016. This charge arose as a result of the deconsolidation of Masonite (Africa) Limited ("MAL"), our African subsidiary, and the disposition of Premdor S.A.S., our door business in France. The charge is comprised of the write-off of the consolidated carrying value of MAL of $26.2 million, the recognition of $24.6 million of cumulative translation adjustment out of accumulated other comprehensive income (loss) for MAL, the write-off of the consolidated carrying value of Premdor S.A.S. of $25.3 million and the recognition of the cumulative translation adjustment out of accumulated other comprehensive income (loss) of $4.4 million for Premdor S.A.S.. These charges were partially offset by the derecognition of $10.5 million of noncontrolling interest in MAL and the recording of our remaining investment in MAL at its fair value of $10.0 million. Cash proceeds received for Premdor S.A.S. were nominal.
46
Interest Expense, Net
Interest expense, net, in the year ended January 3, 2016, was $32.9 million, compared to $41.5 million in the year ended December 28, 2014. This decrease primarily relates to the refinancing of $500.0 million of 8.25% senior unsecured notes for $475.0 million of 5.625% senior unsecured notes issued on March 23, 2015.
Loss on Extinguishment of Debt
Loss on extinguishment of debt was $28.0 million in the year ended January 3, 2016. This charge represents the difference between the redemption price of our senior unsecured notes due 2021 of $531.7 million and the net carrying amount of such notes of $503.7 million. In addition to the $500.0 million of principal, the redemption price included a make-whole premium of $31.7 million and the net carrying amount included unamortized premiums of $11.5 million, partially offset by unamortized debt issuance costs of $7.8 million.
Other Expense (Income), Net
Other expense (income), net, in the year ended January 3, 2016, was $(1.8) million, compared to $(0.6) million in the year ended December 28, 2014. The change in other expense (income), net, is primarily due to unrealized gains and losses on foreign currency remeasurements. Also contributing to the change were our portion of dividends and the net gains and losses related to our non-majority owned unconsolidated subsidiaries that are recognized under the equity method of accounting and other miscellaneous non-operating expenses.
Income Tax Expense (Benefit)
Our income tax expense in the year ended January 3, 2016, was $14.2 million, an increase of $9.7 million from $4.5 million of income tax expense in the year ended December 28, 2014. Our income tax expense (benefit) is primarily due to the mix of income or losses within the tax jurisdictions with various tax rates in which we operate and losses in tax jurisdictions with existing valuation allowances. The increase in our income tax expense is primarily the result of mix of income or losses within the tax jurisdictions with various tax rates in which we operate and a $17.0 million increase in income tax expense attributable to deconsolidation and disposition of subsidiaries.
Segment Information
Year Ended January 3, 2016 | |||||||||||||||||||
(In thousands) | North American Residential | Europe | Architectural | Corporate & Other | Total | ||||||||||||||
Adjusted EBITDA | $ | 165,560 | $ | 30,468 | $ | 23,281 | $ | (15,112 | ) | $ | 204,197 | ||||||||
Adjusted EBITDA as a percentage of segment net sales | 13.9 | % | 9.8 | % | 8.0 | % | 10.9 | % | |||||||||||
Year Ended December 28, 2014 | |||||||||||||||||||
(In thousands) | North American Residential | Europe | Architectural | Corporate & Other | Total | ||||||||||||||
Adjusted EBITDA | $ | 120,944 | $ | 14,570 | $ | 19,799 | $ | (18,226 | ) | $ | 137,087 | ||||||||
Adjusted EBITDA as a percentage of segment net sales | 10.6 | % | 4.5 | % | 7.3 | % | 7.5 | % | |||||||||||
47
The following reconciles Adjusted EBITDA to net income (loss) attributable to Masonite:
Year Ended January 3, 2016 | |||||||||||||||||||
(In thousands) | North American Residential | Europe | Architectural | Corporate & Other | Total | ||||||||||||||
Adjusted EBITDA | $ | 165,560 | $ | 30,468 | $ | 23,281 | $ | (15,112 | ) | $ | 204,197 | ||||||||
Less (plus): | |||||||||||||||||||
Depreciation | 31,456 | 8,105 | 8,223 | 11,376 | 59,160 | ||||||||||||||
Amortization | 4,954 | 6,860 | 8,428 | 3,483 | 23,725 | ||||||||||||||
Share based compensation expense | — | — | — | 13,236 | 13,236 | ||||||||||||||
Loss (gain) on disposal of property, plant and equipment | 796 | 325 | 548 | (298 | ) | 1,371 | |||||||||||||
Restructuring costs | 10 | 2,501 | — | 3,167 | 5,678 | ||||||||||||||
Asset impairment | — | 9,439 | — | — | 9,439 | ||||||||||||||
Loss (gain) on disposal of subsidiaries | — | 29,721 | — | 30,263 | 59,984 | ||||||||||||||
Interest expense (income), net | — | — | — | 32,884 | 32,884 | ||||||||||||||
Loss on extinguishment of debt | — | — | — | 28,046 | 28,046 | ||||||||||||||
Other expense (income), net | (50 | ) | 1,087 | — | (2,794 | ) | (1,757 | ) | |||||||||||
Income tax expense (benefit) | — | — | — | 14,172 | 14,172 | ||||||||||||||
Loss (income) from discontinued operations, net of tax | — | — | — | 908 | 908 | ||||||||||||||
Net income (loss) attributable to non-controlling interest | 3,323 | — | — | 1,139 | 4,462 | ||||||||||||||
Net income (loss) attributable to Masonite | $ | 125,071 | $ | (27,570 | ) | $ | 6,082 | $ | (150,694 | ) | $ | (47,111 | ) | ||||||
Year Ended December 28, 2014 | |||||||||||||||||||
(In thousands) | North American Residential | Europe | Architectural | Corporate & Other | Total | ||||||||||||||
Adjusted EBITDA | $ | 120,944 | $ | 14,570 | $ | 19,799 | $ | (18,226 | ) | $ | 137,087 | ||||||||
Less (plus): | |||||||||||||||||||
Depreciation | 31,457 | 12,117 | 8,083 | 8,965 | 60,622 | ||||||||||||||
Amortization | 5,832 | 3,537 | 8,747 | 3,606 | 21,722 | ||||||||||||||
Share based compensation expense | — | — | — | 9,605 | 9,605 | ||||||||||||||
Loss (gain) on disposal of property, plant and equipment | 3,843 | (603 | ) | 487 | 89 | 3,816 | |||||||||||||
Restructuring costs | 647 | 917 | — | 9,573 | 11,137 | ||||||||||||||
Asset impairment | — | 14,020 | — | 4,182 | 18,202 | ||||||||||||||
Interest expense (income), net | — | — | — | 41,525 | 41,525 | ||||||||||||||
Other expense (income), net | — | 191 | — | (778 | ) | (587 | ) | ||||||||||||
Income tax expense (benefit) | — | — | — | 4,533 | 4,533 | ||||||||||||||
Loss (income) from discontinued operations, net of tax | — | — | — | 630 | 630 | ||||||||||||||
Net income (loss) attributable to non-controlling interest | 2,828 | — | — | 394 | 3,222 | ||||||||||||||
Net income (loss) attributable to Masonite | $ | 76,337 | $ | (15,609 | ) | $ | 2,482 | $ | (100,550 | ) | $ | (37,340 | ) | ||||||
48
Adjusted EBITDA in our North American Residential segment increased $44.7 million, or 37.0%, to $165.6 million in the year ended January 3, 2016, from $120.9 million in the year ended December 28, 2014. Adjusted EBITDA in the North American Residential segment included corporate allocations of shared costs of $44.7 million and $40.5 million in 2015 and 2014, respectively. The allocations generally consist of certain costs of human resources, legal, finance, information technology and research and development.
Adjusted EBITDA in our Europe segment increased $15.9 million, or 108.9%, to $30.5 million in the year ended January 3, 2016, from $14.6 million in the year ended December 28, 2014. Adjusted EBITDA in the Europe segment included an incremental comparative benefit of $2.2 million from the disposal of France in 2015.
Adjusted EBITDA in our Architectural segment increased $3.5 million, or 17.7%, to $23.3 million in the year ended January 3, 2016, from $19.8 million in the year ended December 28, 2014. Adjusted EBITDA in the Architectural segment included corporate allocations of shared costs of $6.5 million and $5.8 million in 2015 and 2014, respectively. The allocations generally consist of certain costs of human resources, legal, finance, information technology and research and development.
Liquidity and Capital Resources
Our liquidity needs for operations vary throughout the year. Our principal sources of liquidity are cash flows from operating activities, the borrowings under our ABL Facility and accounts receivable sales programs ("AR Sales Programs") and our existing cash balance. Our anticipated uses of cash in the near term include working capital needs, capital expenditures and share repurchases. As of January 1, 2017, we do not have any material commitments for capital expenditures. We anticipate capital expenditures in fiscal year 2017 to be approximately $80 million to $85 million. On a continual basis, we evaluate and consider strategic acquisitions, divestitures, and joint ventures to create shareholder value and enhance financial performance.
We believe that our cash balance on hand, future cash generated from operations, the use of our AR Sales Programs, our ABL Facility, and ability to access the capital markets will provide adequate liquidity for the foreseeable future. As of January 1, 2017, we had $71.7 million of cash and cash equivalents, availability under our ABL Facility of $130.1 million and availability under our AR Sales Programs of $21.0 million.
Cash Flows
Year Ended January 1, 2017, Compared with Year Ended January 3, 2016
Cash provided by operating activities was $174.0 million during the year ended January 1, 2017, compared to $161.0 million during the year ended January 3, 2016. This $13.0 million increase in cash provided by operating activities was primarily due to a $55.6 million increase in our net income (loss) attributable to Masonite, adjusted for non-cash and non-operating items, partially offset by an increase in net working capital in 2016 compared to 2015.
Cash used in investing activities was $76.5 million during the year ended January 1, 2017, compared to $180.2 million cash used during the year ended January 3, 2016. This $103.7 million decrease in cash used in investing activities was driven by a decrease of $108.8 million in cash used in acquisitions (net of cash acquired) and an increase of $27.0 million of cash proceeds from disposal of subsidiaries (net of cash disposed). These decreases to investing cash outflows were partially offset by $31.2 million of higher additions to property, plant and equipment, due to investments to support additional volume, and other increases in investing outflows of $0.9 million.
Cash used in financing activities was $109.6 million during the year ended January 1, 2017, compared to $72.0 million cash used during the year ended January 3, 2016. This $37.6 million increase in financing outflows was driven by $109.2 million of cash outflow for the repurchase of shares of our common stock in 2016, partially offset by $3.0 million of year over year other outflows. These current year cash outflows were offset by $10.5 million of proceeds from the exercise of warrants to purchase our common shares, as well as the prior year net cash use of $64.1 million related to the issuance of the 2023 Notes and repurchase of the 2021 Notes (as described below).
49
Year Ended January 3, 2016, Compared with Year Ended December 28, 2014
Cash provided by operating activities was $161.0 million during the year ended January 3, 2016, compared to $77.4 million during the year ended December 28, 2014. This $83.6 million increase in cash provided by operating activities was primarily due to a $79.1 million increase in our net income (loss) attributable to Masonite, adjusted for non-cash and non-operating items, in 2015 compared to 2014. Also contributing to this increase were changes in working capital.
Cash used in investing activities was $180.2 million during the year ended January 3, 2016, compared to $100.9 million during the year ended December 28, 2014. This $79.3 million increase in cash used in investing activities was primarily due to increased cash used in acquisitions of $63.1 million (net of cash acquired), increased cash losses on deconsolidation of $10.8 million and a decrease in proceeds from sales of property, plant and equipment of $5.7 million, partially offset by $0.3 million of other changes in investing cash flows.
Cash used in financing activities was $72.0 million during the year ended January 3, 2016, compared to $128.8 million provided during the year ended December 28, 2014. This $200.8 million net change in cash flows from financing activities was due to the $64.1 million net outflow from the issuance of the 2023 Notes and the repurchase of the 2021 Notes (as described below) during 2015. Cash inflows of $136.8 million were received from the issuance of the additional 2021 Notes during the year ended December 28, 2014, resulting in a net outflow of $200.9 million when comparing year over year. Partially offsetting this net outflow were other changes in financing cash flows of $0.1 million.
Share Repurchases
On February 23, 2016, our Board of Directors authorized a share repurchase program (the “2016 Program”) with no specified expiration date whereby we may repurchase up to $150 million worth of our outstanding common shares. During the year ended January 1, 2017, we repurchased and retired 1.7 million of our common shares in the open market at an aggregate cost of $109.2 million as part of the 2016 Program. As of January 1, 2017, $40.8 million was available for repurchase in accordance with the 2016 Program.
Subsequently, on February 22, 2017, our Board of Directors authorized an additional share repurchase program (collectively with the 2016 Program, the "share repurchase programs") with no specified expiration date whereby we may repurchase up to an additional $200 million worth of our outstanding common shares. While the share repurchase programs may take two years to complete, the timing and other amount of any share repurchases will be determined by management based on our evaluation of market conditions and other factors. Any repurchases under the share repurchase programs may be made in the open market, in privately negotiated transactions or otherwise, subject to market conditions, applicable legal requirements and other relevant factors. The share repurchase programs do not obligate us to acquire any particular amount of common stock, and they may be suspended or terminated at any time at our discretion. Repurchases under the share repurchase programs are permitted to be made under one or more Rule 10b5-1 plans, which would permit shares to be repurchased when we might otherwise be precluded from doing so under applicable insider trading laws.
Other Liquidity Matters
Our cash and cash equivalents balance includes cash held in foreign countries in which we operate. Cash held outside Canada, in which we are incorporated, is free from significant restrictions that would prevent the cash from being accessed to meet our liquidity needs including, if necessary, to fund operations and service debt obligations in Canada. However, earnings from certain jurisdictions are indefinitely reinvested in those jurisdictions. Upon the repatriation of any earnings to Canada, in the form of dividends or otherwise, we may be subject to Canadian income taxes and withholding taxes payable to the various foreign countries. As of January 1, 2017, we do not believe adverse tax consequences exist that restrict our use of cash or cash equivalents in a material manner.
We also routinely monitor the changes in the financial condition of our customers and the potential impact on our results of operations. There has not been a change in the financial condition of a customer that has had a material adverse effect on our results of operations. However, if economic conditions were to deteriorate, it is possible that there could be an impact on our results of operations in a future period and this impact could be material.
50
Accounts Receivable Sales Programs
We maintain accounts receivable sales programs with third parties (the "AR Sales Programs"). Under the AR Sales Programs, we can transfer ownership of eligible trade accounts receivable of certain customers. Receivables are sold outright to third parties who assume the full risk of collection, without recourse to us in the event of a loss. Transfers of receivables under these programs are accounted for as sales. Proceeds from the transfers reflect the face value of the accounts receivable less a discount. Receivables sold under the AR Sales Programs are excluded from trade accounts receivable in the consolidated balance sheets and are included in cash flows from operating activities in the consolidated statements of cash flows. The discounts on the sales of trade accounts receivable sold under the AR Sales Programs were not material for any of the periods presented and were recorded in selling, general and administration expense within the consolidated statements of comprehensive income (loss).
Senior Notes
On March 23, 2015, we issued $475.0 million aggregate principal senior unsecured notes (the “2023 Notes”). The 2023 Notes were issued in a private placement for resale to qualified institutional buyers pursuant to Rule 144A under the Securities Act of 1933, as amended (the “Securities Act”), and to buyers outside the United States pursuant to Regulation S under the Securities Act. The 2023 Notes were issued without registration rights and are not listed on any securities exchange. The 2023 Notes were issued at par and bear interest at 5.625% per annum, payable in cash semiannually in arrears on March 15 and September 15 of each year and are due March 15, 2023. We received net proceeds of $467.9 million after deducting $7.1 million of debt issuance costs. The debt issuance costs were capitalized as deferred financing costs and are being accreted to interest expense over the term of the 2023 Notes using the effective interest method. The net proceeds from the 2023 Notes, together with existing cash balances, were used to redeem the $500.0 million aggregate principal of 2021 Notes (as described in the footnotes to the consolidated financial statements) and to pay related premiums, fees and expenses.
Obligations under the 2023 Notes are fully and unconditionally guaranteed, jointly and severally, on a senior unsecured basis, by certain of our directly or indirectly wholly-owned subsidiaries. We may redeem the 2023 Notes under certain circumstances specified therein. The indenture governing the 2023 Notes contains restrictive covenants that, among other things, limit our ability and our subsidiaries’ ability to: (i) incur additional debt and issue disqualified or preferred stock, (ii) make restricted payments, (iii) sell assets, (iv) create or permit restrictions on the ability of our restricted subsidiaries to pay dividends or make other distributions to us, (v) create or incur certain liens, (vi) enter into sale and leaseback transactions, (vii) merge or consolidate with other entities and (viii) enter into transactions with affiliates. The foregoing limitations are subject to exceptions as set forth in the indenture governing the 2023 Notes. In addition, if in the future the 2023 Notes have an investment grade rating from at least two nationally recognized statistical rating organizations, certain of these covenants will be replaced with a less restrictive covenant. The indenture governing the 2023 Notes contains customary events of default (subject in certain cases to customary grace and cure periods). As of January 1, 2017, we were in compliance with all covenants under the indenture governing the 2023 Notes.
ABL Facility
On April 9, 2015, we and certain of our subsidiaries amended and restated our asset-based revolving credit facility (the "ABL Facility") in order to extend the maturity date of the ABL Facility and amend certain other provisions. The amended and restated ABL Facility increased the revolving commitments to $150.0 million from $125.0 million and extended the final maturity date to April 9, 2020, from May 17, 2016. The borrowing base is calculated based on a percentage of the value of selected U.S. and Canadian accounts receivable and inventory, less certain intangible amounts.
Obligations under the ABL Facility are secured by a first priority security interest in substantially all of the current assets of Masonite and our subsidiaries. In addition, obligations under the ABL Facility are fully and unconditionally guaranteed, jointly and severally, on a senior unsecured basis, by certain of our directly or indirectly wholly-owned subsidiaries.
51
Borrowings under the ABL Facility bear interest at a rate equal to, at our option, (i) the Base Rate, Canadian Prime Rate or Canadian Base Rate (each as defined in the Amended and Restated Credit Agreement) plus a margin ranging from 0.25%to 0.75% per annum, or (ii) the Eurodollar Base Rate or BA Rate (each as defined in the Amended and Restated Credit Agreement), plus a margin ranging from 1.25% to 1.75% per annum.
In addition to paying interest on any outstanding principal under the ABL Facility a commitment fee is payable on the undrawn portion of the ABL Facility in an amount equal to 0.25% per annum of the average daily balance of unused commitments during each calendar quarter.
The ABL Facility contains various customary representations, warranties and covenants by us that, among other things, and subject to certain exceptions, restrict Masonite's ability and the ability of our subsidiaries to: (i) pay dividends on our common shares and make other restricted payments, (ii) make investments and acquisitions, (iii) engage in transactions with our affiliates, (iv) sell assets, (v) merge and (vi) create liens.
The Amended and Restated Credit Agreement amended the ABL Facility to, among other things, (i) permit us to incur unlimited unsecured debt as long as such debt does not contain covenants or default provisions that are more restrictive than those contained in the ABL Facility, (ii) permit us to incur debt as long as the pro forma secured leverage ratio is less than 4.5 to 1.0, and (iii) add certain additional exceptions and exemptions under the restricted payment, investment and indebtedness covenants (including increasing the amount of certain debt permitted to be incurred under an existing exception). As of January 1, 2017, and January 3, 2016, we were in compliance with all covenants under the credit agreement governing the ABL Facility. As of January 1, 2017, and January 3, 2016, there were no amounts outstanding under the ABL Facility.
Supplemental Guarantor Financial Information
Our obligations under the 2023 Notes and the ABL Facility are fully and unconditionally guaranteed, jointly and severally, on a senior unsecured basis by certain of our directly or indirectly wholly-owned subsidiaries. The following unaudited supplemental financial information for our non-guarantor subsidiaries is presented:
Our non-guarantor subsidiaries generated external net sales of $1.6 billion the years ended January 1, 2017, and January 3, 2016, and $1.5 billion for the year ended December 28, 2014.
Our non-guarantor subsidiaries generated Adjusted EBITDA of $204.5 million, $166.6 million and $121.0 million for the years ended January 1, 2017, January 3, 2016, and December 28, 2014, respectively.
Our non-guarantor subsidiaries had total assets of $1.3 billion as of January 1, 2017, and January 3, 2016; and total liabilities of $771.2 million and $791.1 million as of January 1, 2017, and January 3, 2016, respectively.
Contractual Obligations
The following table presents our contractual obligations over the periods indicated as of January 1, 2017:
Fiscal Year Ended | |||||||||||||||||||||||||||
(In thousands) | 2017 | 2018 | 2019 | 2020 | 2021 | Thereafter | Total | ||||||||||||||||||||
Long-term debt maturities | $ | — | $ | — | $ | — | $ | — | $ | — | $ | 475,000 | $ | 475,000 | |||||||||||||
Scheduled interest payments | 26,719 | 26,719 | 26,719 | 26,719 | 26,719 | 40,079 | 173,674 | ||||||||||||||||||||
Operating leases | 20,249 | 19,003 | 17,774 | 15,499 | 11,927 | 71,487 | 155,939 | ||||||||||||||||||||
Pension contributions | 5,768 | 807 | 2,647 | 989 | 1,634 | 9,016 | 20,861 | ||||||||||||||||||||
Total (1) | $ | 52,736 | $ | 46,529 | $ | 47,140 | $ | 43,207 | $ | 40,280 | $ | 595,582 | $ | 825,474 | |||||||||||||
____________
(1) As of January 1, 2017, we have $8.2 million recorded as a long-term liability for uncertain tax positions. We are not able to reasonably estimate the timing of payments, or the amount by which our liability for these uncertain tax positions will increase or decrease over time, and accordingly, this liability has been excluded from the above table.
52
Off-Balance Sheet Arrangements
We do not have any material off-balance sheet arrangements.
Critical Accounting Policies and Estimates
Our significant accounting policies are fully disclosed in our annual consolidated financial statements included elsewhere in this Annual Report. We consider the following policies to be most critical in understanding the judgments that are involved in preparing our consolidated financial statements.
Business Acquisition Accounting
We use the acquisition method of accounting for all business acquisitions. We allocate the purchase price of our business acquisitions based on the fair value of identifiable tangible and intangible assets. The difference between the total cost of the acquisitions and the sum of the fair values of the acquired tangible and intangible assets less liabilities is recorded as goodwill.
Goodwill
We evaluate all business combinations for intangible assets that should be recognized and reported apart from goodwill. Goodwill is not amortized but instead is tested annually for impairment on the last day of fiscal November, or more frequently if events or changes in circumstances indicate the carrying amount may not be recoverable. The test for impairment is performed at the reporting unit level by comparing the reporting unit’s carrying amount to its fair value. Possible impairment in goodwill is first analyzed using qualitative factors such as macroeconomic and market conditions, changing costs and actual and projected performance, amongst others, to determine whether it is more likely than not that the book value of the reporting unit exceeds its fair value. If it is determined more likely than not that the book value exceeds fair value, a quantitative analysis is performed to test for impairment. When quantitative steps are determined necessary, the fair values of the reporting units are estimated through the use of discounted cash flow analyses and market multiples. If the carrying amount exceeds fair value, then goodwill is impaired. Any impairment in goodwill is measured by allocating the fair value of the reporting unit in a manner similar to a purchase price allocation and comparing the notional goodwill from the fair value allocation to the carrying value of the goodwill. We performed a quantitative impairment test during the fourth quarter of 2016 and determined that goodwill was not impaired. The estimated fair value of all other reporting units significantly exceeded the carrying values. The fair value of the Architectural reporting unit, which was previously disclosed as being "at-risk", is no longer considered "at-risk", due to the restructuring actions implemented as part of the 2016 Plan as well as improved performance compared to forecast.
Intangible Assets
Intangible assets with definite lives include customer relationships, non-compete agreements, patents, supply agreements, certain acquired trademarks and system software development. Definite-lived intangible assets are amortized on a straight-line basis over their estimated useful lives. Amortizable intangible assets are tested for impairment whenever events or changes in circumstances indicate that the carrying value may be greater than the fair value. An impairment loss is recognized when the estimate of undiscounted future cash flows generated by such assets is less than the carrying amount. Measurement of the impairment loss is based on the fair value of the asset, determined using discounted cash flows when quoted market prices are not readily available. Indefinite-lived intangible assets are tested for impairment annually on the last day of fiscal November, or more frequently if events or circumstances indicated that the carrying value may exceed the fair value. The inputs utilized to derive projected cash flows are subject to significant judgments and uncertainties. As such, the realized cash flows could differ significantly from those estimated. We performed a quantitative impairment test during the fourth quarter of 2016 and determined that indefinite-lived intangible assets were not impaired.
53
Long-lived Assets
Long-lived assets other than goodwill and indefinite-lived intangible assets, which are separately tested for impairment, are evaluated for impairment whenever events or changes in circumstances indicate that the carrying value may not be recoverable. When evaluating long-lived assets for potential impairment, we first compare the carrying value of the asset to the estimates of asset’s useful lives and undiscounted future cash flows based on market participant assumptions. If the undiscounted expected future cash flows are less than the carrying amount of the asset and the carrying amount of the asset exceeds its fair value, an impairment loss is recognized.
Income Taxes
As a multinational corporation, we are subject to taxation in many jurisdictions and the calculation of our tax liabilities involves dealing with inherent uncertainties in the application of complex tax laws and regulations in various taxing jurisdictions. We assess the income tax positions and record tax liabilities for all years subject to examination based upon our evaluation of the facts, circumstances and information available as of the reporting date.
We account for income taxes using the asset and liability method. Under this method, deferred tax assets and liabilities are recognized for the future tax consequences of temporary differences between the carrying amounts and the tax basis of assets and liabilities at enacted rates. We base our estimate of deferred tax assets and liabilities on current tax laws and rates and, in certain cases, business plans and other expectations about future outcomes. We record a valuation allowance to reduce our deferred tax assets to the amount that is more likely than not to be realized. While we have considered future taxable income and ongoing prudent and feasible tax planning strategies in assessing the need for the valuation allowance, in the event that we were to determine that we would be able to realize our deferred tax assets in the future in excess of our net recorded amount, an adjustment to the deferred tax assets would be a credit to income in the period such determination was made. The consolidated financial statements include increases in the valuation allowances as a result of uncertainty regarding our ability to realize certain deferred tax assets in the future.
Our accounting for deferred tax consequences represents our best estimate of future events that can be appropriately reflected in the accounting estimates. Changes in existing tax laws, regulations, rates and future operating results may affect the amount of deferred tax liabilities or the valuation of deferred tax assets over time. The application of tax laws and regulations is subject to legal and factual interpretation, judgment and uncertainty. Tax laws and regulations themselves are also subject to change as a result in changes in fiscal policy, changes in legislation, the evolution of regulations and court rulings.
Although we believe the measurement of liabilities for uncertain tax positions is reasonable, no assurance can be given that the final outcomes of these matters will not be different than what is reflected in the historical income tax provisions and accruals. If we ultimately determine that the payment of these liabilities will be unnecessary, the liability is reversed and a tax benefit is recognized in the period in which such determination is made. Conversely, additional tax charges are recorded in a period in which it is determined that a recorded tax liability is less than the ultimate assessment is expected to be. If additional taxes are assessed as a result of an audit or litigation, there could be a material effect on our income tax provision and net income in the period or periods for which that determination is made.
Inventory
We value inventories at the lower of cost or replacement cost for raw materials, and the lower of cost or net realizable value for finished goods, with expense estimates made for obsolescence or unsaleable inventory. In determining net realizable value, we consider such factors as yield, turnover and aging, expected future demand and market conditions, as well as past experience. A change in the underlying assumptions related to these factors could affect the valuation of inventory and have a corresponding effect on cost of goods sold. Historically, actual results have not significantly deviated from those determined using these estimates.
Employee Future Benefit Plans
Measurements of the obligations under our defined benefit pension plans are subject to several significant estimates. These estimates include the rate of return on plan assets and the rate at which the future obligations are discounted to value the liability. Additionally, the cost of providing benefits depends on demographic assumptions
54
including retirements, mortality, turnover and plan participation. We typically use actuaries to assist us in preparing these calculations and determining these assumptions. Our annual measurement date is the last day of the fiscal year for our defined benefit pension plans. Changes in these assumptions could impact future pension expense. The excess of the net actuarial gain (loss) over 10% of the greater of the benefit obligation and the fair value of plan assets at the beginning of the year is amortized over the average remaining service lives of its members. These estimates may differ from actual results that will occur over an extended period of time. Any significant differences may have an effect on the recorded pension expense and carrying value of the plans’ net assets or net liabilities.
Share Based Compensation Plan
We have a share based compensation plan, which governs the issuance of common shares to employees as compensation through various grants of share instruments. We apply the fair value method of accounting using the Black-Scholes-Merton option pricing model to determine the compensation expense for stock appreciation rights. The compensation expense for the Restricted Stock Units awarded is based on the fair value of the restricted stock units at the date of grant. Additionally, the compensation expense for certain performance based awards is determined using the Monte Carlo simulation method. Compensation expense is recorded in the consolidated statements of comprehensive income (loss) and is recognized over the requisite service period. The determination of obligations and compensation expense requires the use of several mathematical and judgmental factors, including stock price, expected volatility, the anticipated life of the award, estimated risk free rate and the number of shares or share options expected to vest. Any difference in the number of shares or share options that actually vest can affect future compensation expense. Other assumptions are not revised after the original estimate.
Variable Interest Entity
The accounting method used for our investments is dependent upon the influence we have over the investee. We consolidate subsidiaries when we are able to exert control over the financial and operating policies of the investee, which generally occurs if we own a 50% or greater voting interest.
Pursuant to ASC 810, “Consolidation”, for certain investments where the risks and rewards of ownership are not directly linked to voting interests (“variable interest entities” or “VIEs”), an investee may be consolidated if we are considered the primary beneficiary of the VIE. The primary beneficiary of a VIE is the party that has the power to direct the activities of the VIE which most significantly impact the VIE’s economic performance and that has the obligation to absorb losses of the VIE which could potentially be significant to the VIE.
Significant judgment is required in the determination of whether we are the primary beneficiary of a VIE. Estimates and assumptions made in such analyses include, but are not limited to, the market price of input costs, the market price for finished products, market demand conditions within various regions and the probability of certain other outcomes.
Changes in Accounting Standards and Policies
Changes in accounting standards and policies are discussed in Note 1. Business Overview and Significant Accounting Policies in the Notes to the Consolidated Financial Statements in this Annual Report.
Item 7A. Quantitative and Qualitative Disclosures about Market Risk
We are exposed to market risk from changes in foreign currency exchange rates, interest rates and commodity prices, which can affect our operating results and overall financial condition. We manage exposure to these risks through our operating and financing activities and, when deemed appropriate, through the use of derivative financial instruments. Derivative financial instruments are viewed as risk management tools and are not used for speculation or for trading purposes. Derivative financial instruments are generally contracted with a diversified group of investment grade counterparties to reduce exposure to nonperformance on such instruments. We held no such material derivative financial instruments as of January 1, 2017, or January 3, 2016.
55
We have in place an enterprise risk management process that involves systematic risk identification and mitigation covering the categories of enterprise, strategic, financial, operation and compliance and reporting risk. The enterprise risk management process receives Board of Directors and Management oversight, drives risk mitigation decision-making and is fully integrated into our internal audit planning and execution cycle.
Foreign Exchange Rate Risk
We have foreign currency exposures related to buying, selling, and financing in currencies other than the local currencies in which we operate. When deemed appropriate, we enter into various derivative financial instruments to preserve the carrying amount of foreign currency-denominated assets, liabilities, commitments, and certain anticipated foreign currency transactions. We held no such material derivative financial instruments as of January 1, 2017, or January 3, 2016.
Interest Rate Risk
We are subject to market risk from exposure to changes in interest rates with respect to borrowings under our ABL Facility to the extent it is drawn on and due to our other financing, investing and cash management activities. As of January 1, 2017, or January 3, 2016, there were no outstanding borrowings under our ABL Facility.
Impact of Inflation, Deflation and Changing Prices
We have experienced inflation and deflation related to our purchase of certain commodity products. We believe that volatile prices for commodities have impacted our net sales and results of operations. We maintain strategies to mitigate the impact of higher raw material, energy and commodity costs, which include cost reduction, sourcing and other actions, which typically offset only a portion of the adverse impact. Inflation and deflation related to our purchases of certain commodity products could have an adverse impact on our operating results in the future.
56
Item 8. Financial Statements and Supplementary Data
INDEX TO THE CONSOLIDATED FINANCIAL STATEMENTS AND SUPPLEMENTARY DATA | ||
57
Report of Independent Registered Public Accounting Firm
To the Board of Directors and Shareholders of
Masonite International Corporation
Tampa, Florida
We have audited the accompanying consolidated balance sheets of Masonite International Corporation and subsidiaries (the "Company") as of January 1, 2017 and January 3, 2016, and the related consolidated statements of comprehensive income (loss), changes in equity, and cash flows for each of the three years in the period ended January 1, 2017. We also have audited the Company’s internal control over financial reporting as of January 1, 2017, based on criteria established in Internal Control - Integrated Framework (2013) issued by the Committee of Sponsoring Organizations of the Treadway Commission. The Company’s management is responsible for these financial statements, for maintaining effective internal control over financial reporting, and for its assessment of the effectiveness of internal control over financial reporting, included in the accompanying Management Report on Internal Control over Financial Reporting. Our responsibility is to express an opinion on these financial statements and an opinion on the Company’s internal control over financial reporting based on our audits.
We conducted our audits in accordance with the standards of the Public Company Accounting Oversight Board (United States). Those standards require that we plan and perform the audit to obtain reasonable assurance about whether the financial statements are free of material misstatement and whether effective internal control over financial reporting was maintained in all material respects. Our audits of the financial statements included examining, on a test basis, evidence supporting the amounts and disclosures in the financial statements, assessing the accounting principles used and significant estimates made by management, and evaluating the overall financial statement presentation. Our audit of internal control over financial reporting included obtaining an understanding of internal control over financial reporting, assessing the risk that a material weakness exists, and testing and evaluating the design and operating effectiveness of internal control based on the assessed risk. Our audits also included performing such other procedures as we considered necessary in the circumstances. We believe that our audits provide a reasonable basis for our opinions.
A company's internal control over financial reporting is a process designed by, or under the supervision of, the company's principal executive and principal financial officers, or persons performing similar functions, and effected by the company's board of directors, management, and other personnel to provide reasonable assurance regarding the reliability of financial reporting and the preparation of financial statements for external purposes in accordance with generally accepted accounting principles. A company's internal control over financial reporting includes those policies and procedures that (1) pertain to the maintenance of records that, in reasonable detail, accurately and fairly reflect the transactions and dispositions of the assets of the company; (2) provide reasonable assurance that transactions are recorded as necessary to permit preparation of financial statements in accordance with generally accepted accounting principles, and that receipts and expenditures of the company are being made only in accordance with authorizations of management and directors of the company; and (3) provide reasonable assurance regarding prevention or timely detection of unauthorized acquisition, use, or disposition of the company's assets that could have a material effect on the financial statements.
Because of the inherent limitations of internal control over financial reporting, including the possibility of collusion or improper management override of controls, material misstatements due to error or fraud may not be prevented or detected on a timely basis. Also, projections of any evaluation of the effectiveness of the internal control over financial reporting to future periods are subject to the risk that the controls may become inadequate because of changes in conditions, or that the degree of compliance with the policies or procedures may deteriorate.
In our opinion, the consolidated financial statements referred to above present fairly, in all material respects, the financial position of Masonite International Corporation and subsidiaries as of January 1, 2017 and January 3, 2016, and the results of their operations and their cash flows for each of the three years in the period ended January 1, 2017, in conformity with accounting principles generally accepted in the United States of America. Also, in our opinion, the Company maintained, in all material respects, effective internal control over financial reporting as of January 1, 2017, based on the criteria established in Internal Control - Integrated Framework (2013) issued by the Committee of Sponsoring Organizations of the Treadway Commission.
/s/ DELOITTE & TOUCHE LLP
Certified Public Accountants
Tampa, Florida
March 1, 2017
58
MASONITE INTERNATIONAL CORPORATION
Consolidated Statements of Comprehensive Income (Loss)
(In thousands of U.S. dollars, except per share amounts)
Year Ended | |||||||||||
January 1, 2017 | January 3, 2016 | December 28, 2014 | |||||||||
Net sales | $ | 1,973,964 | $ | 1,871,965 | $ | 1,837,700 | |||||
Cost of goods sold | 1,564,319 | 1,521,115 | 1,572,301 | ||||||||
Gross profit | 409,645 | 350,850 | 265,399 | ||||||||
Selling, general and administration expenses | 260,364 | 244,145 | 224,077 | ||||||||
Restructuring costs | 1,445 | 5,678 | 11,137 | ||||||||
Asset impairment | 1,511 | 9,439 | 18,202 | ||||||||
Loss (gain) on disposal of subsidiaries | (6,575 | ) | 59,984 | — | |||||||
Operating income (loss) | 152,900 | 31,604 | 11,983 | ||||||||
Interest expense (income), net | 28,178 | 32,884 | 41,525 | ||||||||
Loss on extinguishment of debt | — | 28,046 | — | ||||||||
Other expense (income), net | (1,959 | ) | (1,757 | ) | (587 | ) | |||||
Income (loss) from continuing operations before income tax expense (benefit) | 126,681 | (27,569 | ) | (28,955 | ) | ||||||
Income tax expense (benefit) | 21,787 | 14,172 | 4,533 | ||||||||
Income (loss) from continuing operations | 104,894 | (41,741 | ) | (33,488 | ) | ||||||
Income (loss) from discontinued operations, net of tax | (752 | ) | (908 | ) | (630 | ) | |||||
Net income (loss) | 104,142 | (42,649 | ) | (34,118 | ) | ||||||
Less: net income (loss) attributable to non-controlling interest | 5,520 | 4,462 | 3,222 | ||||||||
Net income (loss) attributable to Masonite | $ | 98,622 | $ | (47,111 | ) | $ | (37,340 | ) | |||
Earnings (loss) per common share attributable to Masonite: | |||||||||||
Basic | $ | 3.25 | $ | (1.56 | ) | $ | (1.26 | ) | |||
Diluted | $ | 3.17 | $ | (1.56 | ) | $ | (1.26 | ) | |||
Earnings (loss) per common share from continuing operations attributable to Masonite: | |||||||||||
Basic | $ | 3.27 | $ | (1.53 | ) | $ | (1.24 | ) | |||
Diluted | $ | 3.19 | $ | (1.53 | ) | $ | (1.24 | ) | |||
Comprehensive income (loss): | |||||||||||
Net income (loss) | $ | 104,142 | $ | (42,649 | ) | $ | (34,118 | ) | |||
Other comprehensive income (loss): | |||||||||||
Foreign exchange gain (loss) | (37,097 | ) | (34,637 | ) | (48,667 | ) | |||||
Pension and other post-retirement adjustment | (5,941 | ) | (1,826 | ) | (12,045 | ) | |||||
Amortization of actuarial net losses | 1,070 | 889 | — | ||||||||
Pension settlement charges | — | 2,400 | — | ||||||||
Income tax benefit (expense) related to other comprehensive income (loss) | 1,155 | 385 | 3,076 | ||||||||
Other comprehensive income (loss), net of tax: | (40,813 | ) | (32,789 | ) | (57,636 | ) | |||||
Comprehensive income (loss) | 63,329 | (75,438 | ) | (91,754 | ) | ||||||
Less: comprehensive income (loss) attributable to non-controlling interest | 5,745 | 3,362 | 2,244 | ||||||||
Comprehensive income (loss) attributable to Masonite | $ | 57,584 | $ | (78,800 | ) | $ | (93,998 | ) | |||
See accompanying notes to the consolidated financial statements.
59
MASONITE INTERNATIONAL CORPORATION
Consolidated Balance Sheets
(In thousands of U.S. dollars, except share amounts)
ASSETS | January 1, 2017 | January 3, 2016 | |||||
Current assets: | |||||||
Cash and cash equivalents | $ | 71,714 | $ | 89,187 | |||
Restricted cash | 12,196 | 12,645 | |||||
Accounts receivable, net | 242,197 | 224,976 | |||||
Inventories, net | 225,940 | 208,393 | |||||
Prepaid expenses | 24,291 | 21,983 | |||||
Income taxes receivable | 2,399 | 1,762 | |||||
Total current assets | 578,737 | 558,946 | |||||
Property, plant and equipment, net | 542,088 | 534,234 | |||||
Investment in equity investees | 9,302 | 18,811 | |||||
Goodwill | 129,286 | 128,170 | |||||
Intangible assets, net | 190,154 | 225,932 | |||||
Long-term deferred income taxes | 9,478 | 16,899 | |||||
Other assets, net | 16,816 | 16,157 | |||||
Total assets | $ | 1,475,861 | $ | 1,499,149 | |||
LIABILITIES AND EQUITY | |||||||
Current liabilities: | |||||||
Accounts payable | $ | 96,178 | $ | 96,480 | |||
Accrued expenses | 133,799 | 136,029 | |||||
Income taxes payable | 1,201 | 9 | |||||
Total current liabilities | 231,178 | 232,518 | |||||
Long-term debt | 470,745 | 468,856 | |||||
Long-term deferred income taxes | 70,423 | 98,682 | |||||
Other liabilities | 43,739 | 43,527 | |||||
Total liabilities | 816,085 | 843,583 | |||||
Commitments and Contingencies (Note 10) | |||||||
Equity: | |||||||
Share capital: unlimited shares authorized, no par value, 29,774,784 and 30,427,865 shares issued and outstanding as of January 1, 2017, and January 3, 2016, respectively | 650,007 | 663,600 | |||||
Additional paid-in capital | 234,926 | 231,363 | |||||
Accumulated deficit | (89,063 | ) | (144,628 | ) | |||
Accumulated other comprehensive income (loss) | (148,986 | ) | (107,948 | ) | |||
Total equity attributable to Masonite | 646,884 | 642,387 | |||||
Equity attributable to non-controlling interests | 12,892 | 13,179 | |||||
Total equity | 659,776 | 655,566 | |||||
Total liabilities and equity | $ | 1,475,861 | $ | 1,499,149 | |||
See accompanying notes to the consolidated financial statements.
60
MASONITE INTERNATIONAL CORPORATION
Consolidated Statements of Changes in Equity
(In thousands of U.S. dollars, except share amounts)
Common Shares Outstanding | Share Capital | Additional Paid-In Capital | Accumulated Deficit | Accumulated Other Comprehensive Income (Loss) | Total Equity Attributable to Masonite | Equity Attributable to Non-controlling Interests | Total Equity | |||||||||||||||||||||||
Balances as of December 29, 2013 | 29,085,021 | $ | 646,196 | $ | 230,306 | $ | (60,177 | ) | $ | (19,601 | ) | $ | 796,724 | $ | 28,838 | $ | 825,562 | |||||||||||||
Net income (loss) | (37,340 | ) | (37,340 | ) | 3,222 | (34,118 | ) | |||||||||||||||||||||||
Other comprehensive income (loss), net of tax | (56,658 | ) | (56,658 | ) | (978 | ) | (57,636 | ) | ||||||||||||||||||||||
Dividends to non-controlling interests | — | (5,017 | ) | (5,017 | ) | |||||||||||||||||||||||||
Share based compensation expense | 9,605 | 9,605 | 9,605 | |||||||||||||||||||||||||||
Common shares issued for delivery of share based awards | 650,892 | 6,996 | (6,996 | ) | — | — | ||||||||||||||||||||||||
Common shares issued for exercise of warrants | 279,408 | 4,100 | (3,837 | ) | 263 | 263 | ||||||||||||||||||||||||
Common shares withheld to cover income taxes payable due to delivery of share based awards | (3,160 | ) | (3,160 | ) | (3,160 | ) | ||||||||||||||||||||||||
Balances as of December 28, 2014 | 30,015,321 | $ | 657,292 | $ | 225,918 | $ | (97,517 | ) | $ | (76,259 | ) | $ | 709,434 | $ | 26,065 | $ | 735,499 | |||||||||||||
Net income (loss) | (47,111 | ) | (47,111 | ) | 4,462 | (42,649 | ) | |||||||||||||||||||||||
Other comprehensive income (loss), net of tax | (31,689 | ) | (31,689 | ) | (1,100 | ) | (32,789 | ) | ||||||||||||||||||||||
Dividends to non-controlling interests | — | (5,797 | ) | (5,797 | ) | |||||||||||||||||||||||||
Deconsolidation of non-controlling interest | — | (10,451 | ) | (10,451 | ) | |||||||||||||||||||||||||
Share based compensation expense | 13,236 | 13,236 | 13,236 | |||||||||||||||||||||||||||
Common shares issued for delivery of share based awards | 399,198 | 5,460 | (5,460 | ) | — | — | ||||||||||||||||||||||||
Common shares withheld to cover income taxes payable due to delivery of share based awards | (2,114 | ) | (2,114 | ) | (2,114 | ) | ||||||||||||||||||||||||
Common shares issued under employee stock purchase plan | 12,913 | 846 | (215 | ) | 631 | 631 | ||||||||||||||||||||||||
Common shares issued for exercise of warrants | 433 | 2 | (2 | ) | — | — | ||||||||||||||||||||||||
Balances as of January 3, 2016 | 30,427,865 | $ | 663,600 | $ | 231,363 | $ | (144,628 | ) | $ | (107,948 | ) | $ | 642,387 | $ | 13,179 | $ | 655,566 | |||||||||||||
Cumulative effect of new accounting principle | 30,160 | 30,160 | 30,160 | |||||||||||||||||||||||||||
Balances as of January 3, 2016, as adjusted | 30,427,865 | $ | 663,600 | $ | 231,363 | $ | (114,468 | ) | $ | (107,948 | ) | $ | 672,547 | $ | 13,179 | $ | 685,726 | |||||||||||||
Net income (loss) | 98,622 | 98,622 | 5,520 | 104,142 | ||||||||||||||||||||||||||
Other comprehensive income (loss), net of tax | (41,038 | ) | (41,038 | ) | 225 | (40,813 | ) | |||||||||||||||||||||||
Dividends to non-controlling interests | — | (6,032 | ) | (6,032 | ) | |||||||||||||||||||||||||
Share based compensation expense | 18,790 | 18,790 | 18,790 | |||||||||||||||||||||||||||
Common shares issued for delivery of share based awards | 366,556 | 7,901 | (7,901 | ) | — | — | ||||||||||||||||||||||||
Common shares withheld to cover income taxes payable due to delivery of share based awards | (4,210 | ) | (4,210 | ) | (4,210 | ) | ||||||||||||||||||||||||
Common shares issued under employee stock purchase plan | 17,469 | 1,090 | (202 | ) | 888 | 888 | ||||||||||||||||||||||||
Common shares issued for exercise of warrants | 630,951 | 13,401 | (2,914 | ) | 10,487 | 10,487 | ||||||||||||||||||||||||
Common shares repurchased and retired | (1,668,057 | ) | (35,985 | ) | (73,217 | ) | (109,202 | ) | (109,202 | ) | ||||||||||||||||||||
Balances as of January 1, 2017 | 29,774,784 | $ | 650,007 | $ | 234,926 | $ | (89,063 | ) | $ | (148,986 | ) | $ | 646,884 | $ | 12,892 | $ | 659,776 | |||||||||||||
See accompanying notes to the consolidated financial statements.
61
MASONITE INTERNATIONAL CORPORATION
Consolidated Statements of Cash Flows
(In thousands of U.S. dollars)
Year Ended | |||||||||||
Cash flows from operating activities: | January 1, 2017 | January 3, 2016 | December 28, 2014 | ||||||||
Net income (loss) | $ | 104,142 | $ | (42,649 | ) | $ | (34,118 | ) | |||
Adjustments to reconcile net income (loss) to net cash flow provided by (used in) operating activities: | |||||||||||
Loss (income) from discontinued operations, net of tax | 752 | 908 | 630 | ||||||||
Non-cash loss (gain) on disposal of subsidiaries | (6,575 | ) | 59,984 | — | |||||||
Non-cash loss on deconsolidation | — | — | 7,577 | ||||||||
Loss on extinguishment of debt | — | 28,046 | — | ||||||||
Depreciation | 57,604 | 59,160 | 60,622 | ||||||||
Amortization | 24,727 | 23,725 | 21,722 | ||||||||
Share based compensation expense | 18,790 | 13,236 | 9,605 | ||||||||
Deferred income taxes | 12,918 | 9,097 | (1,970 | ) | |||||||
Unrealized foreign exchange loss (gain) | 829 | (3,238 | ) | 328 | |||||||
Share of loss (income) from equity investees, net of tax | (2,183 | ) | (1,473 | ) | (1,344 | ) | |||||
Dividend from equity investee | 1,733 | 1,440 | — | ||||||||
Pension and post-retirement expense (funding), net | (6,276 | ) | (3,727 | ) | (6,827 | ) | |||||
Non-cash accruals and interest | 2,612 | 1,587 | (365 | ) | |||||||
Loss (gain) on sale of property, plant and equipment | 2,111 | 1,371 | 3,816 | ||||||||
Asset impairment | 1,511 | 9,439 | 18,202 | ||||||||
Changes in assets and liabilities, net of acquisitions: | |||||||||||
Accounts receivable | (29,514 | ) | 27,150 | (14,047 | ) | ||||||
Inventories | (23,022 | ) | (2,071 | ) | (12,843 | ) | |||||
Prepaid expenses | (2,102 | ) | (5,424 | ) | 1,387 | ||||||
Accounts payable and accrued expenses | 16,560 | (8,246 | ) | 23,592 | |||||||
Other assets and liabilities | (587 | ) | (7,304 | ) | 1,419 | ||||||
Net cash flow provided by (used in) operating activities | 174,030 | 161,011 | 77,386 | ||||||||
Cash flows from investing activities: | |||||||||||
Proceeds from sale of property, plant and equipment | 1,268 | 1,316 | 6,976 | ||||||||
Additions to property, plant and equipment | (82,287 | ) | (51,065 | ) | (50,147 | ) | |||||
Cash used in acquisitions, net of cash acquired | (8,551 | ) | (117,398 | ) | (54,256 | ) | |||||
Cash proceeds from sale of subsidiaries, net of cash disposed | 15,103 | (11,851 | ) | (1,087 | ) | ||||||
Restricted cash | 449 | 539 | 644 | ||||||||
Other investing activities | (2,449 | ) | (1,765 | ) | (3,038 | ) | |||||
Net cash flow provided by (used in) investing activities | (76,467 | ) | (180,224 | ) | (100,908 | ) | |||||
Cash flows from financing activities: | |||||||||||
Proceeds from issuance of long-term debt | 390 | 475,000 | 138,688 | ||||||||
Repayments of long-term debt | (1,071 | ) | (500,038 | ) | — | ||||||
Payments of long-term debt extinguishment costs | — | (31,691 | ) | — | |||||||
Payment of debt issuance costs | — | (7,393 | ) | (1,925 | ) | ||||||
Proceeds from borrowings on revolving credit facilities | — | 17,000 | — | ||||||||
Repayments of borrowings on revolving credit facilities | — | (17,000 | ) | — | |||||||
Tax withholding on share based awards | (4,210 | ) | (2,114 | ) | (3,160 | ) | |||||
Distributions to non-controlling interests | (6,032 | ) | (5,797 | ) | (5,017 | ) | |||||
Proceeds from exercise of common stock warrants | 10,487 | — | 263 | ||||||||
Repurchases of common shares | (109,202 | ) | — | — | |||||||
Net cash flow provided by (used in) financing activities | (109,638 | ) | (72,033 | ) | 128,849 | ||||||
Net foreign currency translation adjustment on cash | (5,398 | ) | (11,604 | ) | (14,163 | ) | |||||
Increase (decrease) in cash and cash equivalents | (17,473 | ) | (102,850 | ) | 91,164 | ||||||
Cash and cash equivalents, beginning of period | 89,187 | 192,037 | 100,873 | ||||||||
Cash and cash equivalents, at end of period | $ | 71,714 | $ | 89,187 | $ | 192,037 | |||||
See accompanying notes to the consolidated financial statements.
62
1. Business Overview and Significant Accounting Policies
Unless we state otherwise or the context otherwise requires, references to “Masonite,” “we,” “our,” “us” and the “Company” in these notes to the consolidated financial statements refer to Masonite International Corporation and its subsidiaries.
Description of Business
Masonite International Corporation is one of the largest manufacturers of doors in the world, with significant market share in both interior and exterior door products. Masonite operates 64 manufacturing locations in 8 countries and sells doors to customers throughout the world, including the United States, Canada and the United Kingdom.
Basis of Presentation
We prepare these consolidated financial statements in accordance with accounting principles generally accepted in the United States of America (“GAAP”). These consolidated financial statements include the accounts of Masonite International Corporation, a company incorporated under the laws of British Columbia, and its subsidiaries, as of January 1, 2017, and January 3, 2016, and for the years ended January 1, 2017, January 3, 2016 and December 28, 2014.
Our fiscal year is the 52- or 53-week period ending on the Sunday closest to December 31. In a 52-week year, each fiscal quarter consists of 13 weeks. For ease of disclosure, the 13-week periods are referred to as three-month periods and the 52- or 53-week periods are referred to as years. Our 2015 fiscal year, which ended on January 3, 2016, contained 53 weeks of operating results, with the additional week occurring in the fourth quarter.
Changes in Accounting Standards and Policies
Adoption of Recent Accounting Pronouncements
In March 2016, the Financial Accounting Standards Board ("FASB") issued Accounting Standards Update ("ASU") 2016-09, "Improvements to Employee Share-Based Payment Accounting", which amends ASC 718 "Compensation - Stock Compensation". This ASU simplifies several aspects of the accounting for employee share-based award transactions, including the accounting for income taxes, forfeitures, and statutory tax withholding requirements, as well as classification in the statement of cash flows. Under the ASU, an entity recognizes all excess tax benefits and shortfalls resulting from the exercise or vesting of a share-based award to an employee. It also allows an entity to elect, as an accounting policy, either to continue to estimate forfeitures of share-based awards (as was previously required) or to account for forfeitures when they occur. Additionally, the ASU modifies the current exception to liability classification of an award when an employer uses a net-settlement feature to withhold shares to meet the employer’s minimum statutory tax withholding requirement. This ASU is effective for fiscal years beginning after December 15, 2016, and interim periods within those fiscal years; early adoption is permitted and varying types of application are required for the different aspects of the standard. We have adopted this guidance as of April 4, 2016. The aspect of the standard dealing with excess tax benefits and tax deficiencies was adopted using the modified-retrospective method, and resulted in an increase to previously-presented retained earnings of $30.2 million as of January 3, 2016. It also resulted in $6.7 million of income tax benefits recorded in the year ended January 1, 2017. As of January 1, 2017, a $4.2 million reduction to previously-presented opening retained earnings through October 2, 2016, was recorded to reflect a change in judgment in regards to realizability of related deferred tax assets. As a result of the adoption of this standard, we have elected to account for forfeitures when they occur. The forfeitures aspect of the standard and the tax withholding aspect of the standard have each been adopted using a modified retrospective approach and had no impact on any previously-presented amounts. All other aspects of the standard were adopted using a retrospective approach and had no impact on any previously-presented amounts.
63
In September 2015, the FASB issued ASU 2015-16, "Simplifying the Accounting for Measurement-Period Adjustments," which amends ASC 805, "Business Combinations." This ASU eliminates the requirement to retrospectively account for measurement-period adjustments and instead recognize such adjustments in the reporting period in which the adjustments are determined. This ASU is effective for fiscal years beginning after December 15, 2015, and interim periods within those fiscal years; early adoption is permitted and prospective application is required. The adoption of this standard did not have a material impact on the presentation of our financial statements.
In April 2015, the FASB issued ASU 2015-04, "Practical Expedient for the Measurement Date of an Employer’s Defined Benefit Obligation and Plan Assets." This ASU provides a practical expedient option to entities that have defined benefit plans and have a fiscal year end that does not coincide with a calendar month end. This ASU allows an entity to elect to measure defined benefit plan assets and obligations using the calendar month-end that is closest to its fiscal year end. This ASU is effective for fiscal years beginning after December 15, 2015, and interim periods within those fiscal years; early adoption is permitted and prospective application is required. The adoption of this standard did not have a material impact on the presentation of our financial statements.
In February 2015, the FASB issued ASU 2015-02, "Amendments to the Consolidation Analysis," which amended ASC 810, "Consolidation." This ASU modifies the evaluation of whether limited partnerships are variable interest entities ("VIEs") and affects the consolidation analysis of reporting entities that are involved with VIEs, particularly those that have fee arrangements and related party relationships. This ASU is effective for fiscal years beginning after December 15, 2015, and interim periods within those fiscal years; early adoption is permitted and either full retrospective or modified retrospective application is required at the entity's option. The adoption of this standard did not have a material impact on the presentation of our financial statements.
In August 2014, the FASB issued ASU 2014-15, "Disclosure of Uncertainties about an Entity's Ability to Continue as a Going Concern," which amended ASC 205-40, "Presentation of Financial Statements - Going Concern". This ASU requires management to perform interim and annual assessments of an entity's ability to continue as a going concern within one year of the date of issuance of the entity's financial statements and to provide related footnote disclosures. This ASU is effective for annual reporting periods ending after December 15, 2016, and interim periods thereafter; early adoption is permitted. We adopted this standard for the year ended January 1, 2017, and the adoption of this standard did not have a material impact on the presentation of our financial statements.
Other Recent Accounting Pronouncements not yet Adopted
In January 2017, the FASB issued ASU 2017-04, "Simplifying the Test for Goodwill Impairment", which amends ASC 350 "Intangibles - Goodwill and Other". This ASU simplifies the accounting for goodwill impairments and allows a goodwill impairment charge to be based upon the amount of a reporting unit's carrying value in excess of its fair value; thus, eliminating what is currently known as "Step 2" under the current guidance. This ASU is effective for annual periods beginning after December 15, 2019, and interim periods within those annual periods; early adoption is permitted and prospective application is required. We are in the process of evaluating this guidance to determine the impact it may have on our financial statements.
In November 2016, the FASB issued ASU 2016-18, "Restricted Cash Flows", which amends ASC 230 "Statement of Cash Flows". This ASU clarifies how entities should present restricted cash and restricted cash equivalents in the statement of cash flows. The new guidance requires entities to show the changes in the total of cash, cash equivalents, restricted cash and restricted cash equivalents in the statement of cash flows. As a result, entities will no longer present transfers between cash and cash equivalents and restricted cash and restricted cash equivalents in the statement of cash flows. This ASU is effective for annual periods beginning after December 15, 2017, and interim periods within those annual periods; early adoption is permitted and retrospective application is required. We are in the process of evaluating this guidance to determine the impact it will have on our financial statements.
In February 2016, the FASB issued ASU 2016-02, "Leases (Topic 842)", which will replace the existing guidance in ASC 840, "Leases." The updated standard aims to increase transparency and comparability among organizations by requiring lessees to recognize lease assets and lease liabilities on the balance sheet and requiring disclosure of key information about leasing arrangements. This ASU is effective for annual periods beginning after
64
December 15, 2018, and interim periods within those annual periods; early adoption is permitted and modified retrospective application is required. While we are currently assessing the impact that ASU 2016-02 will have on our consolidated financial statements, we anticipate that the primary impact upon adoption will be to our consolidated balance sheets from the recognition, on a discounted basis, of our minimum commitments under non-cancelable operating leases, resulting in the recognition of right to use assets and lease obligations. Our current minimum undiscounted lease commitments under non-cancelable operating leases are disclosed in Note 10.
In July 2015, the FASB issued ASU 2015-11, "Simplifying the Measurement of Inventory," which amends ASC 330, "Inventory." This ASU requires the measurement of inventory at the lower of cost or net realizable value. Net realizable value is the estimated selling prices in the ordinary course of business, less reasonably predictable costs of completion, disposal and transportation. This ASU is effective for fiscal years beginning after December 15, 2016, and interim periods within those fiscal years; early adoption is permitted. The adoption of this standard is not expected to have a material impact on the presentation of our financial statements.
In May 2014, the FASB issued ASU 2014-09, "Revenue from Contracts with Customers," which outlines a single comprehensive model for entities to use in accounting for revenue arising from contracts with customers and supersedes most current revenue recognition guidance, including industry-specific guidance. The core principle of the revenue model is that an entity recognizes revenue to depict the transfer of promised goods or services to customers in an amount that reflects the consideration to which the entity expects to be entitled in exchange for those goods or services. In August 2015, the FASB issued ASU 2015-14, "Revenue from Contracts with Customers - Deferral of the Effective Date," and the guidance will now be effective for annual and interim periods beginning on or after December 15, 2017; early application is permitted only as of annual and interim reporting periods beginning after December 15, 2016. While we are still in the process of evaluating the effect of adoption on our consolidated financial statements and are currently assessing our contracts with customers, we do not currently expect the adoption of the new standard to have a material impact on consolidated net income (loss) attributable to Masonite, cash flows or our consolidated balance sheets. We plan to adopt this standard using the retrospective method and adoption will be effective as of January 1, 2018.
Summary of Significant Accounting Policies
(a) Principles of consolidation:
These consolidated financial statements include the accounts of Masonite and our subsidiaries and the accounts of any variable interest entities for which we are the primary beneficiary. Intercompany accounts and transactions have been eliminated upon consolidation. The results of subsidiaries acquired during the periods presented are consolidated from their respective dates of acquisition using the acquisition method. Subsidiaries are prospectively deconsolidated as of the date when we no longer have effective control of the entity.
(b) Translation of consolidated financial statements into U.S. dollars:
These consolidated financial statements are expressed in U.S. dollars. The accounts of the majority of our self-sustaining foreign operations are maintained in functional currencies other than the U.S. dollar. Assets and liabilities for these subsidiaries have been translated into U.S. dollars at the exchange rates prevailing at the end of the period and results of operations at the average exchange rates for the period. Unrealized exchange gains and losses arising from the translation of the financial statements of our non-U.S. functional currency operations are accumulated in the cumulative translation adjustments account in accumulated other comprehensive income (loss). For our foreign subsidiaries where the U.S. dollar is the functional currency, all foreign currency-denominated accounts are remeasured into U.S. dollars. Unrealized exchange gains and losses arising from remeasurements of foreign currency-denominated assets and liabilities are included within other expense (income), net, in the consolidated statements of comprehensive income (loss). Gains and losses arising from international intercompany transactions that are of a long-term investment nature are reported in the same manner as translation gains and losses. Realized exchange gains and losses are included in net income (loss) for the periods presented.
65
(c) Cash and cash equivalents:
Cash includes cash equivalents which are short-term highly liquid investments with original maturities of three months or less.
(d) Restricted cash:
Restricted cash includes cash we have placed as collateral for letters of credit.
(e) Accounts receivable:
We record accounts receivable as our products are received by our customers. Our customers are primarily retailers, distributors and contractors. We record an allowance for doubtful accounts for known collectability issues, as such issues relate to specific transactions or customer balances. When it becomes apparent, based on age or customer circumstances, that such amounts will not be collected, they are expensed as bad debt and payments subsequently received are credited to the bad debt expense account, included within selling, general and administration expense in the consolidated statements of comprehensive income (loss). Generally, we do not require collateral for our accounts receivable.
(f) Inventories:
Raw materials are valued at the lower of cost or market value, where market value is determined using replacement cost. Finished goods are valued at the lower of cost or net realizable value. Cost is determined on a first in, first out basis. In determining the net realizable value, we consider factors such as yield, turnover, expected future demand and past experience.
The cost of inventories includes all costs of purchase, costs of conversion and other costs incurred in bringing the inventories to their present location and condition. The costs of conversion of inventories include costs directly related to the units of production, such as direct labor. They also include a systematic allocation of fixed and variable production overheads that are incurred in converting raw materials into finished goods. Fixed production overheads are those indirect costs of production that remain relatively constant regardless of the volume of production, such as depreciation and maintenance of factory buildings and equipment, and the cost of factory management and administration. Variable production overheads are those indirect costs of production that vary directly, or nearly directly, with the volume of production, such as indirect materials and indirect labor.
To determine the cost of inventory, we allocate fixed expenses to the cost of production based on the normal capacity, which refers to a range of production levels and is considered the production expected to be achieved over a number of periods or seasons under normal circumstances, taking into account the loss of capacity resulting from planned maintenance. Fixed overhead costs allocated to each unit of production are not increased due to abnormally low production. Those excess costs are recognized as a current period expense. When a production facility is completely shut down temporarily, it is considered idle, and all related expenses are charged to cost of goods sold.
66
(g) Property, plant and equipment
Property, plant and equipment are stated at cost. Depreciation is recorded based on the carrying values of buildings, machinery and equipment using the straight-line method over the estimated useful lives set forth as follows:
Useful Life (Years) | |
Buildings | 20 - 40 |
Machinery and equipment | |
Tooling | 10 - 25 |
Machinery and equipment | 5 - 25 |
Molds and dies | 12 - 25 |
Office equipment, fixtures and fittings | 3 - 12 |
Information technology systems | 5 - 15 |
Improvements and major maintenance that extend the life of an asset are capitalized; other repairs and maintenance are expensed as incurred. When assets are retired or otherwise disposed, their carrying values and accumulated depreciation are removed from the accounts.
Property, plant and equipment are tested for impairment when events or changes in circumstances indicate that the carrying value of an asset or asset group may not be recoverable. An impairment loss is recognized when the carrying amount of an asset or asset group being tested for recoverability exceeds the sum of the undiscounted cash flows expected from its use and disposal. Impairments are measured as the amount by which the carrying amount of the asset or asset group exceeds its fair value, as determined using a discounted cash flows approach when quoted market prices are not available.
(h) Goodwill:
We use the acquisition method of accounting for all business combinations. We evaluate all business combinations for intangible assets that should be recognized apart from goodwill. Goodwill adjustments are recorded for the effect on goodwill of changes to net assets acquired during the measurement period (up to one year from the date of acquisition) for new information obtained about facts and circumstances that existed as of the acquisition date that, if known, would have affected the measurement of the amounts recognized as of that date.
Goodwill is not amortized, but instead is tested annually for impairment on the last day of fiscal November, or more frequently if events or changes in circumstances indicate the carrying amount may not be recoverable. The test for impairment is performed at the reporting unit level by comparing the reporting unit’s carrying amount to its fair value. Possible impairment in goodwill is first analyzed using qualitative factors such as macroeconomic and market conditions, changing costs and actual and projected performance, amongst others, to determine whether it is more likely than not that the book value of the reporting unit exceeds its fair value. If it is determined more likely than not that the book value exceeds fair value, a quantitative analysis is performed to test for impairment. When quantitative steps are determined necessary, the fair values of the reporting units are estimated through the use of discounted cash flow analysis and market multiples. If the carrying amount exceeds fair value, then goodwill is impaired. Any impairment in goodwill is measured by allocating the fair value of the reporting unit in a manner similar to a purchase price allocation and comparing the notional goodwill from the fair value allocation to the carrying value of the goodwill. There were no impairment charges recorded against goodwill in any period presented.
67
(i) Intangible assets:
Intangible assets with definite lives include customer relationships, non-compete agreements, patents, system software development, supply agreements and acquired trademarks and tradenames. Definite lived intangible assets are amortized over their estimated useful lives. Information pertaining to the estimated useful lives of intangible assets is as follows:
Estimated Useful Life | |
Customer relationships | Over expected relationship period, not exceeding 10 years |
Non-compete agreements | Straight-line over life of the agreement |
Patents | Over expected useful life, not exceeding 17 years |
System software development | Over expected useful life, not exceeding 5 years |
Supply agreements | Straight-line over life of the agreement |
Acquired trademarks and tradenames | Straight-line over expected useful life |
Amortizable intangible assets are tested for impairment whenever events or changes in circumstances indicate that the carrying value may be greater than fair value. An impairment loss is recognized when the estimate of undiscounted future cash flows generated by such assets is less than the carrying amount. Measurement of the impairment loss is based on the fair value of the asset. Fair value is measured using discounted cash flows.
Indefinite lived intangible assets are not amortized, but instead are tested for impairment annually on the last day of fiscal November, or more frequently if events or circumstances indicate the carrying value may exceed the fair value.
(j) Income taxes:
We use the asset and liability method of accounting for income taxes. Under the asset and liability method, deferred tax assets and liabilities are recognized for the deferred tax consequences attributable to differences between the financial statement carrying amounts of existing assets and liabilities and their respective tax bases. Deferred tax assets and liabilities are measured using enacted tax rates expected to apply to taxable income in the years in which those temporary differences are expected to be recovered or settled. The effect on deferred tax assets and liabilities due to a change in tax rates is recognized in income in the period that includes the date of enactment. A valuation allowance is recorded to reduce deferred tax assets to an amount that is anticipated to be realized on a more likely than not basis.
We account for uncertain taxes in accordance with ASC 740, “Income Taxes”. The initial benefit recognition model follows a two-step approach. First we evaluate if the tax position is more likely than not of being sustained if audited based solely on the technical merits of the position. Second, we measure the appropriate amount of benefit to recognize. This is calculated as the largest amount of tax benefit that has a greater than 50% likelihood of ultimately being realized upon settlement. Subsequently at each reporting date, the largest amount that has a greater than 50% likelihood of ultimately being realized, based on information available at that date, will be measured and recognized.
We recognize interest and penalties related to unrecognized tax benefits within the income tax expense line in the consolidated statements of comprehensive income (loss). Accrued interest and penalties are included within the related tax liability line in the consolidated balance sheets.
(k) Employee future benefits:
We maintain defined benefit pension plans. Earnings are charged with the cost of benefits earned by employees as services are rendered. The cost reflects management’s best estimates of the pension plans’ expected investment yields, wage and salary escalation, mortality of members, terminations and the ages at which members will retire. Changes in these assumptions could impact future pension expense. The excess of the net actuarial gain (loss) over 10% of the greater of the benefit obligation or fair value of plan assets at the beginning of the year is amortized over the average remaining service lives of the members.
68
Assets are valued at fair value for the purpose of calculating the expected return on plan assets. Past service costs arising from plan amendments are amortized on a straight-line basis over the average remaining service period of employees active at the date of amendment.
When a restructuring of a benefit plan gives rise to both a curtailment and a settlement of obligations, the curtailment is accounted for prior to the settlement. Curtailment gains are offset against unrecognized losses and any excess gains and all curtailment losses are recorded in the period in which the curtailment occurs.
(l) Restructuring costs:
All salary-related severance benefits are accrued and expensed when a plan has been put into place, the plan has received approval from the appropriate level of management and the benefit is probable and reasonably estimable, which is generally when the decision to terminate the employee is made by management of sufficient authority. A liability and expense are recorded for termination benefits based on their fair value when it is probable that employees will be entitled to the benefits, and the amount can be reasonably estimated. This occurs when management approves and commits us to the obligation, management’s termination plan specifically identifies all significant actions to be taken, actions required to fulfill management’s plan are expected to begin as soon as possible and significant changes to the plan are not likely. All salary-related non-contractual benefits are accrued and expensed at fair value at the communication date.
In addition to salary-related costs, we incur other restructuring costs when facilities are closed or capacity is realigned within the organization. A liability and expense are recorded for contractual exit activities when we terminate the contract within the provisions of the agreement, generally by way of written notice to the counterparty. For non-contractual exit activities, a liability and expense are measured at fair value in the period in which the liability is incurred.
Restructuring-related costs are presented separately in the consolidated statements of comprehensive income (loss) whereas non-restructuring severance benefits are charged to cost of goods sold or selling, general and administration expense depending on the nature of the job responsibilities.
(m) Financial instruments:
We have applied a framework consistent with ASC 820, “Fair Value Measurement and Disclosure”, and have disclosed all financial assets and liabilities measured at fair value and non-financial assets and liabilities measured at fair value on a non-recurring basis (at least annually).
We classify and disclose assets and liabilities carried at fair value in one of the following three categories:
Level 1: Quoted market prices in active markets for identical assets or liabilities.
Level 2: Observable market based inputs or unobservable inputs that are corroborated by market data.
Level 3: Unobservable inputs that are not corroborated by market data.
The estimated fair value of a financial instrument is the amount at which the instrument could be exchanged in a current transaction between willing parties, other than a forced or liquidation sale. These estimates, although based on the relevant market information about the financial instrument, are subjective in nature and involve uncertainties and matters of significant judgment and, therefore, cannot be determined with precision. Changes in assumptions could significantly affect the estimates.
(n) Share based compensation expense:
We have a share based compensation plan, which is described in detail in Note 8. We apply the fair value method of accounting using comprehensive valuation models, including the Black-Scholes-Merton option pricing model, to determine the compensation expense.
69
(o) Revenue recognition:
Revenue from the sale of products is recognized when an agreement with the customer in the form of a sales order is in place, the sales price is fixed or determinable, collection is reasonably assured and the customer has taken ownership and assumes risk of loss. Volume rebates and incentives to customers are considered as a reduction of the sales price of our products. Accordingly, revenue is reported net of such rebates and incentives. Shipping and other transportation costs charged to buyers are recorded in both revenues and cost of goods sold in the consolidated statements of comprehensive income (loss).
(p) Product warranties:
We warrant certain qualitative attributes of our door products. We have recorded provisions for estimated warranty and related costs based on historical experience and periodically adjust these provisions to reflect actual experience. The rollforward of our warranty provision is as follows for the periods indicated:
Year Ended | |||||||||||
(In thousands) | January 1, 2017 | January 3, 2016 | December 28, 2014 | ||||||||
Balance at beginning of period | $ | 3,318 | $ | 3,555 | $ | 1,914 | |||||
Additions charged to expense | 3,219 | 3,113 | 4,674 | ||||||||
Deductions | (3,820 | ) | (3,350 | ) | (3,033 | ) | |||||
Balance at end of period | $ | 2,717 | $ | 3,318 | $ | 3,555 | |||||
(q) Vendor rebates:
We account for cash consideration received from a vendor as a reduction of cost of goods sold and inventory, in the consolidated statements of comprehensive income (loss) and consolidated balance sheets, respectively. The cash consideration received represents agreed-upon vendor rebates that are earned in the normal course of operations.
(r) Advertising costs:
We recognize advertising costs as they are incurred. Advertising costs incurred primarily relate to tradeshows and are included within selling, general and administration expense in the consolidated statements of comprehensive income (loss). Advertising costs were $9.3 million, $8.7 million and $7.7 million in the years ended January 1, 2017, January 3, 2016, and December 28, 2014, respectively.
(s) Research and development costs:
We recognize research and development costs as they are incurred. Research and development costs incurred primarily relate to the development of new products and the improvement of manufacturing processes, and are primarily included within cost of goods sold in the consolidated statements of comprehensive income (loss). These costs exclude the significant investments in other areas such as advanced automation and e-commerce. Research and development costs were $6.7 million, $6.4 million and $6.1 million in the years ended January 1, 2017, January 3, 2016, and December 28, 2014, respectively.
(t) Insurance losses and proceeds:
All involuntary conversions of property, plant and equipment are recorded as losses within loss (gain) on disposal of property, plant and equipment, which is included within selling, general and administration expense in the consolidated statements of comprehensive income (loss) and as reductions to property, plant and equipment in the consolidated balance sheets. Any subsequent proceeds received for insured losses of property, plant and equipment are also recorded as gains within loss (gain) in disposal of property, plant and equipment, and are classified as cash flows from investing activities in the consolidated statements of cash flows in the period in which the cash is received. Proceeds received for business interruption recoveries are recorded as a reduction to selling, general and administration
70
expense in the consolidated statements of comprehensive income (loss) and are classified as cash flows from operating activities in the consolidated statements of cash flows in the period in which an acknowledgment from the insurance carrier of settlement or partial settlement of a non-refundable nature has been presented to us.
(u) Discontinued operations:
We account for discontinued operations by segregating assets, liabilities and earnings (net of tax) in the consolidated balance sheets and consolidated statements of comprehensive income (loss), respectively. Operations are classified as discontinued when the operations and cash flows of the component has been or will be eliminated as a result of a disposal transaction and represents a strategic shift that has or will have a major impact on our operations and financial results.
(v) Equity investments:
We account for investments in affiliates of between 20% and 50% ownership, over which we have significant influence, using the equity method. We record our share of earnings of the affiliate within other expense (income) in the consolidated statements of comprehensive income (loss) and dividends as a reduction of the investment in the affiliate in the consolidated balance sheets when declared.
(w) Segment Reporting:
During the first quarter of 2016, we changed our reportable segments to align with changes in how we manage our business, review operating performance and allocate resources as a result of the deconsolidation of Africa and other internal reporting changes. All prior period information was recast to reflect this change. Our reportable segments are organized and managed principally by end market: North American Residential, Europe and Architectural. The North American Residential reportable segment is the aggregation of the Wholesale and Retail operating segments. The Europe reportable segment is the aggregation of the United Kingdom, Central Eastern Europe and France (prior to disposal) operating segments. The Architectural reportable segment consists solely of the Architectural operating segment. The Corporate & Other category includes unallocated corporate costs and the results of immaterial operating segments which were not aggregated into any reportable segment, including the historical results of our Africa operating segment. Operating segments are aggregated into reportable segments only if they exhibit similar economic characteristics. In addition to similar economic characteristics we also consider the following factors in determining the reportable segments: the nature of business activities, the management structure directly accountable to our chief operating decision maker for operating and administrative activities, availability of discrete financial information and information presented to the Board of Directors and investors.
(x) Use of estimates:
The preparation of consolidated financial statements in conformity with GAAP requires management to make estimates and assumptions which affect the reported amounts of assets and liabilities and disclosure of contingent assets and liabilities as of the date of the consolidated financial statements and the reported amounts of net sales and expenses during the reporting periods. During 2015, there were no material changes in the methods or policies used to establish estimates and assumptions. Matters subject to significant estimation and judgment include the valuation of the allowance for doubtful accounts; the realizable values of inventories; the valuation of acquired tangible assets and liabilities; the determination of the fair value of financial instruments; the determination of the fair value of goodwill and intangible assets and the useful lives of intangible assets and long-lived assets, as well as the determination of impairment thereon; the determination of obligations under employee future benefit plans; the determination of the valuation of share based awards; and the recoverability of deferred tax assets and uncertain tax positions. Actual results may differ significantly from our estimates.
71
2. Acquisitions and Dispositions
2016 Acquisition
On November 3, 2016 we completed the acquisition of FyreWerks, Inc. (“FyreWerks”), based in Westminster, Colorado. We acquired 100% of the equity interests in FyreWerks for consideration of $8.0 million, net of cash acquired. FyreWerks manufacturers certified fire door and frame cores for use with architectural stile and rail wood panel doors and door frames. The excess purchase price over the fair value of net assets acquired of $7.3 million was allocated to goodwill. The goodwill principally represents anticipated synergies from FyreWerks' integration into our existing Architectural door business. Under Section 338 of the Internal Revenue Code, the acquisition was treated as if it was an asset purchase. Generally, the tax basis of the assets will equal the fair market value at the time of the acquisition and the goodwill is deductible for tax purposes. The purchase price allocation, net sales, net income (loss) attributable to Masonite and pro forma information for FyreWerks are not presented as they were not material for any period presented.
2015 Acquisitions
On October 1, 2015, we completed the acquisition of USA Wood Door, Inc. (“USA Wood Door”), based in Thorofare, New Jersey. We acquired 100% of the equity interests in USA Wood Door for consideration of $13.7 million, net of cash acquired. USA Wood Door is a supplier of architectural and commercial wood doors in the Eastern United States providing door and hardware distributors with machining, resizing and value-added additions to both unfinished and prefinished doors in short lead times. The excess purchase price over the fair value of net assets acquired of $8.9 million was allocated to goodwill in our Architectural segment. The goodwill principally represents the anticipated synergies to be gained from the integration into our existing North America door business. Under Section 338 of the Internal Revenue Code, the acquisition was treated as if it was an asset purchase. Generally, the tax basis of the assets will equal the fair market value at the time of the acquisition and the goodwill is deductible for tax purposes. The USA Wood Door acquisition acts as an extension of our distribution network in North America.
On August 5, 2015, we completed the acquisition of Hickman Industries Limited (“Hickman”), headquartered in Wolverhampton, England, for total consideration of $88.0 million, net of cash acquired. We acquired 100% of the equity interests in Hickman through the purchase of all of the outstanding shares of common stock at the acquisition date. Hickman is a leading supplier of doorkits (similar to fully finished prehung door units) and other millwork in the United Kingdom and their business of providing doorkit solutions to the homebuilder market in the United Kingdom is a natural extension of our existing business in the United Kingdom. The excess purchase price over the fair value of net assets acquired of $18.2 million was allocated to goodwill. The goodwill principally represents anticipated synergies to be gained from the integration into our existing United Kingdom business. This goodwill is not deductible for tax purposes and relates to the Europe segment. The Hickman acquisition complements strategies we are pursuing with our existing United Kingdom business.
On July 23, 2015, we completed the acquisition of Performance Doorset Solutions Limited (“PDS”), headquartered in Lancashire, England, for total consideration of $15.7 million, net of cash acquired. We acquired 100% of the equity interests in PDS through the purchase of all of the outstanding shares of common stock at the acquisition date. PDS is a leading supplier of custom doors and millwork in the United Kingdom that specializes in non-standard product specifications, manufacturing both wood and composite solutions. The excess purchase price over the fair value of net assets acquired of $3.1 million was allocated to goodwill. The goodwill principally represents the future expected value of the operations of the business. This goodwill is not deductible for tax purposes and relates to the Europe segment. The PDS acquisition complements our existing United Kingdom business.
72
The aggregate consideration paid for acquisitions during 2015 was as follows:
(In thousands) | USA Wood Door | Hickman | PDS | Total 2015 Acquisitions | |||||||||||
Accounts Receivable | $ | 2,235 | $ | 20,870 | $ | 3,000 | $ | 26,105 | |||||||
Inventory | 1,677 | 11,090 | 1,438 | 14,205 | |||||||||||
Property, plant and equipment | 2,600 | 14,057 | 5,684 | 22,341 | |||||||||||
Goodwill | 8,921 | 18,215 | 3,145 | 30,281 | |||||||||||
Intangible assets | — | 55,634 | 6,437 | 62,071 | |||||||||||
Accounts payable and accrued expenses | (1,654 | ) | (23,972 | ) | (2,218 | ) | (27,844 | ) | |||||||
Other assets and liabilities, net | (81 | ) | (7,918 | ) | (1,762 | ) | (9,761 | ) | |||||||
Cash consideration, net of cash acquired | $ | 13,698 | $ | 87,976 | $ | 15,724 | $ | 117,398 | |||||||
The fair values of tangible assets acquired and liabilities assumed from the 2015 acquisitions were based upon preliminary calculations and valuations and the estimates and assumptions for the acquisition are subject to change as we obtain additional information during the measurement period (up to one year from the acquisition date). The primary areas of the preliminary estimates which are not yet finalized relate to certain tangible assets acquired and liabilities assumed, including goodwill. The fair values of intangible assets acquired are based on management’s estimates and assumptions including variations of the income approach, the cost approach and the market approach. Intangible assets acquired from the 2015 acquisitions consist of customer relationships and are being amortized over the weighted average amortization period of 9.6 years and 9.7 years for the Hickman and PDS acquisitions, respectively. The intangible assets are not expected to have any residual value. The gross contractual value of acquired trade receivables was $1.7 million, $21.0 million and $2.6 million for the USA Wood Door, Hickman and PDS acquisitions, respectively.
The following schedule represents the amounts of net sales and net income (loss) attributable to Masonite from the 2015 acquisitions which have been included in the consolidated statements of comprehensive income (loss) for the periods indicated subsequent to the acquisition date.
Year Ended January 1, 2017 | |||||||||||||||
(In thousands) | USA Wood Door | Hickman | PDS | Total 2015 Acquisitions | |||||||||||
Net sales | $ | 19,536 | $ | 99,372 | $ | 16,152 | $ | 135,060 | |||||||
Net income (loss) attributable to Masonite | 3,682 | 4,544 | (572 | ) | 7,654 | ||||||||||
Year Ended January 3, 2016 | |||||||||||||||
(In thousands) | USA Wood Door | Hickman | PDS | Total 2015 Acquisitions | |||||||||||
Net sales | $ | 4,790 | $ | 46,657 | $ | 7,059 | $ | 58,506 | |||||||
Net income (loss) attributable to Masonite | 367 | 813 | (251 | ) | 929 | ||||||||||
2014 Acquisitions
On December 1, 2014, we completed the acquisition of Harring Doors Corporation (“Harring”), located in London, Ontario, for total consideration of $3.9 million, net of cash acquired. We acquired 100% of the equity interests in Harring through the purchase of all of the outstanding shares of common stock at the acquisition date. Harring manufactures interior and exterior stile and rail wood doors for architectural door applications at its facility in London, Ontario. The excess purchase price over the fair value of net assets acquired of $2.0 million was allocated to goodwill. The goodwill principally represents anticipated synergies to be gained from the integration into our North American architectural wood door business. This goodwill is not deductible for tax purposes and relates to the Architectural segment. The acquisition of Harring complements our architectural wood door business.
73
On February 24, 2014, we completed the acquisition of Door-Stop International Limited ("Door-Stop") for total consideration of $50.4 million, net of cash acquired. We acquired 100% of the equity interests in Door-Stop through the purchase of all outstanding shares of common stock on the acquisition date. Door-Stop is based in Nottinghamshire, United Kingdom, utilizes an internet-based ordering process and manufactures exterior door sets for the residential repair and renovation markets. The excess purchase price over the fair value of net tangible and intangible assets acquired of $20.4 million was allocated to goodwill. The goodwill principally represents the future expected value of the operations of the business. This goodwill is not deductible for tax purposes and relates to the Europe segment. The Door-Stop acquisition complements our existing door business in the United Kingdom.
The aggregate consideration paid for acquisitions during 2014 was as follows:
(In thousands) | Harring | Door-Stop | Total 2014 Acquisitions | ||||||||
Accounts receivable | $ | 1,180 | $ | 2,648 | $ | 3,828 | |||||
Inventory | 443 | 2,665 | 3,108 | ||||||||
Property, plant and equipment | 1,167 | 4,303 | 5,470 | ||||||||
Goodwill | 1,951 | 20,359 | 22,310 | ||||||||
Intangible assets | — | 28,776 | 28,776 | ||||||||
Accounts payable and accrued expenses | (731 | ) | (3,492 | ) | (4,223 | ) | |||||
Other assets and liabilities, net | (109 | ) | (4,904 | ) | (5,013 | ) | |||||
Cash consideration, net of cash acquired | $ | 3,901 | $ | 50,355 | $ | 54,256 | |||||
The fair values of intangible assets acquired are based on management’s estimates and assumptions including variations of the income approach, the cost approach and the market approach. Intangible assets acquired from Door-Stop consist of customer relationships and are being amortized over the weighted average amortization period of 9.9 years. The intangible assets are not expected to have any residual value. The gross contractual value of acquired trade receivables was $1.2 million and $2.8 million for the Harring and Door-Stop acquisitions, respectively.
The following schedule represents the amounts of net sales and net income (loss) attributable to Masonite from the Door-Stop acquisition which have been included in the consolidated statements of comprehensive income (loss) for the periods indicated subsequent to the acquisition date. Amounts of revenue and earnings included in the consolidated statements of comprehensive income (loss) for Harring were not material for the year ended January 1, 2017.
Year Ended | |||||||||||
(In thousands) | January 1, 2017 | January 3, 2016 | December 28, 2014 | ||||||||
Net sales | $ | 58,029 | $ | 54,335 | $ | 42,498 | |||||
Net income (loss) attributable to Masonite | 11,726 | 9,119 | 4,819 | ||||||||
74
Pro Forma Information
The following unaudited pro forma financial information represents the consolidated financial information as if the acquisitions had been included in our consolidated results beginning on the first day of the fiscal year prior to their respective acquisition dates. Pro forma information relating to the FyreWerks and Harring acquisitions has been excluded as it is not materially different from amounts reported. The pro forma results have been calculated after adjusting the results of the acquired entities to remove intercompany transactions and transaction costs incurred and to reflect the additional depreciation and amortization that would have been charged assuming the fair value adjustments to property, plant and equipment and intangible assets had been applied on the first day of the fiscal year prior to the respective acquisitions, together with the consequential tax effects. The pro forma results do not reflect any cost savings, operating synergies or revenue enhancements that the combined company may achieve as a result of the acquisitions; the costs to combine the companies' operations; or the costs necessary to achieve these costs savings, operating synergies and revenue enhancements. The pro forma results do not necessarily reflect the actual results of operations of the combined companies' under our ownership and operation.
Year Ended January 3, 2016 | |||||||||||||||
(In thousands, except per share amounts) | Masonite | 2015 Acquisitions | Historical Sales to 2015 Acquisitions | Pro Forma | |||||||||||
Net sales | $ | 1,871,965 | $ | 89,013 | $ | (11,625 | ) | $ | 1,949,353 | ||||||
Net income (loss) attributable to Masonite | (47,111 | ) | 5,109 | (1,951 | ) | (43,953 | ) | ||||||||
Basic earnings (loss) per common share | $ | (1.56 | ) | $ | (1.45 | ) | |||||||||
Diluted earnings (loss) per common share | (1.56 | ) | (1.45 | ) | |||||||||||
Year Ended December 28, 2014 | |||||||||||||||||||
(In thousands, except per share amounts) | Masonite | 2015 Acquisitions | Historical Sales to 2015 Acquisitions | Door-Stop | Pro Forma | ||||||||||||||
Net sales | $ | 1,837,700 | $ | 145,240 | $ | (17,081 | ) | $ | 6,659 | $ | 1,972,518 | ||||||||
Net income (loss) attributable to Masonite | (37,340 | ) | 3,863 | (2,269 | ) | 624 | (35,122 | ) | |||||||||||
Basic earnings (loss) per common share | $ | (1.26 | ) | $ | (1.19 | ) | |||||||||||||
Diluted earnings (loss) per common share | (1.26 | ) | (1.19 | ) | |||||||||||||||
Dispositions
Africa
On December 22, 2015, following a comprehensive assessment of Masonite (Africa) Limited (“MAL”), our South African subsidiary, the MAL Board of Directors approved a plan to enter into Business Rescue proceedings, the South African equivalent of bankruptcy proceedings in the United States, similar to a Chapter 11 reorganization. As a result of this plan, a Business Rescue Practitioner was appointed to manage the affairs of the business and we no longer maintained operational control over MAL. For this reason, we deconsolidated MAL effective December 22, 2015.
Subsequent to deconsolidation, we used the cost method to account for our equity investment in MAL, which was reflected as $10.0 million in our consolidated balance sheets as of January 3, 2016, based on the estimated fair value of our portion of MAL’s net assets on the date of deconsolidation. The fair value of the investment in MAL was determined using a discounted future cash flows analysis based upon management's view of the most likely outcomes of the Business Rescue proceedings. The resulting valuation was net of future disposal costs and third party fees. This
75
valuation was performed on a non-recurring basis and categorized as having Level 3 valuation inputs as established by the FASB's Fair Value Framework. The Level 3 unobservable inputs included an estimate of future cash flows for the business.
On May 5, 2016, the Business Rescue Practitioner proposed a business rescue plan that would result in the sale of the business. On August 10, 2016, MAL announced the closing of the transaction proposed as part of the business rescue plan by the Business Rescue Practitioner. During September 2016, we received $15.1 million as final pre-tax proceeds from the closing of the transaction. Upon receipt of these proceeds, our equity interest in MAL was eliminated and we accordingly reduced the value of our cost investment in MAL to zero and recorded a gain on disposal of subsidiaries of $5.1 million. This transaction was subject to South African tax of $0.7 million, which is included in income tax expense (benefit) on the consolidated statements of comprehensive income (loss).
Romania
On April 22, 2016, we completed the liquidation of our legal entity in Romania. As a result, we recognized a $1.4 million cumulative translation adjustment in loss (gain) on disposal of subsidiaries from accumulated other comprehensive income during the year ended January 1, 2017.
France
On July 31, 2015, we completed the sale of all of the capital stock of Premdor S.A.S., Masonite’s door business in France, to a Paris-based independent investment firm (the “Buyer”). Pursuant to a stock purchase agreement dated July 16, 2015, the Buyer acquired all of Masonite’s door manufacturing and distribution business in France for nominal consideration. The disposition of this business resulted in a loss on disposal of $29.7 million, which was recognized during the third quarter of 2015 in the Europe segment and is included in loss (gain) on disposal of subsidiaries in the consolidated statements of comprehensive income (loss). The loss on disposal is comprised of the carrying value of the net assets disposed of $25.3 million and the recognition of $4.4 million of cumulative translation adjustment into net income. Additionally, the sale of Premdor S.A.S. was determined to be a triggering event requiring a test of the indefinite-lived intangible trade name assets of the Europe segment, resulting in an impairment charge of $9.4 million. This charge represents the excess of the carrying value over the fair value as determined using the relief of royalty discounted cash flows method. This valuation was performed on a non-recurring basis and is categorized as having Level 3 valuation inputs as established by the FASB's Fair Value Framework. The Level 3 unobservable inputs include an estimate of future revenues for the asset group. This impairment charge was partially offset by income tax benefits of $3.2 million.
Premdor S.A.S. generated $13.4 million and $22.0 million of losses from continuing operations before income tax expense (benefit) during years ended January 3, 2016 and December 28, 2014, respectively. All Premdor S.A.S. figures exclude amounts recognized for loss on deconsolidation.
Israel
Effective August 20, 2014, Masonite Israel Ltd., one of our wholly-owned subsidiaries, was deconsolidated due to our loss of operational control over the entity, as further described in Note 11. Restructuring Costs.
76
3. Goodwill and Intangible Assets
Changes in the carrying amount of goodwill were as follows as of the dates indicated:
(In thousands) | North American Residential | Europe | Architectural | Total | |||||||||||
December 28, 2014 | $ | 2,891 | $ | 19,008 | $ | 77,300 | $ | 99,199 | |||||||
Goodwill from 2015 acquisitions | — | 21,360 | 8,921 | 30,281 | |||||||||||
Foreign exchange fluctuations | (56 | ) | (1,062 | ) | (192 | ) | (1,310 | ) | |||||||
January 3, 2016 | 2,835 | 39,306 | 86,029 | 128,170 | |||||||||||
Goodwill from 2016 acquisitions | — | — | 7,331 | 7,331 | |||||||||||
Measurement period adjustment | — | — | 599 | 599 | |||||||||||
Foreign exchange fluctuations | 8 | (6,896 | ) | 74 | (6,814 | ) | |||||||||
January 1, 2017 | $ | 2,843 | $ | 32,410 | $ | 94,033 | $ | 129,286 | |||||||
During 2016 we recorded a $0.6 million increase in goodwill as a measurement period adjustment relating to the USA Wood Door acquisition, due to finalization of certain income tax-related items. We performed a quantitative impairment test during the fourth quarter of 2016 and determined that goodwill was not impaired.
Changes in the net book value of intangible assets were as follows for the periods indicated:
(In thousands) | Customer Relationships | Patents | Software | Other | Trademarks and Tradenames | Total | |||||||||||||||||
January 3, 2016 | $ | 102,254 | $ | 11,590 | $ | 6,435 | $ | 2,860 | $ | 102,793 | $ | 225,932 | |||||||||||
Additions (write-offs) | — | 1,055 | 1,392 | — | — | 2,447 | |||||||||||||||||
Amortization | (16,737 | ) | (2,283 | ) | (3,678 | ) | (1,294 | ) | — | (23,992 | ) | ||||||||||||
Translation adjustment | (9,613 | ) | (86 | ) | (26 | ) | (316 | ) | (4,192 | ) | (14,233 | ) | |||||||||||
January 1, 2017 | $ | 75,904 | $ | 10,276 | $ | 4,123 | $ | 1,250 | $ | 98,601 | $ | 190,154 | |||||||||||
(In thousands) | Customer Relationships | Patents | Software | Other | Trademarks and Tradenames | Total | |||||||||||||||||
December 28, 2014 | $ | 71,840 | $ | 13,626 | $ | 9,573 | $ | 1,221 | $ | 107,112 | $ | 203,372 | |||||||||||
Acquisitions | 48,546 | — | — | 2,823 | 10,702 | 62,071 | |||||||||||||||||
Additions (write-offs) | — | 1,013 | 998 | — | (10,217 | ) | (8,206 | ) | |||||||||||||||
Amortization | (14,844 | ) | (2,472 | ) | (3,865 | ) | (1,043 | ) | — | (22,224 | ) | ||||||||||||
Translation adjustment | (3,288 | ) | (577 | ) | (271 | ) | (141 | ) | (4,804 | ) | (9,081 | ) | |||||||||||
January 3, 2016 | $ | 102,254 | $ | 11,590 | $ | 6,435 | $ | 2,860 | $ | 102,793 | $ | 225,932 | |||||||||||
77
The cost and accumulated amortization values of our intangible assets were as follows for the periods indicated:
January 1, 2017 | |||||||||||||||
(In thousands) | Cost | Accumulated Amortization | Translation Adjustment | Net Book Value | |||||||||||
Definite life intangible assets: | |||||||||||||||
Customer relationships | $ | 155,927 | $ | (64,762 | ) | $ | (15,261 | ) | $ | 75,904 | |||||
Patents | 30,698 | (19,451 | ) | (971 | ) | 10,276 | |||||||||
Software | 31,222 | (26,865 | ) | (234 | ) | 4,123 | |||||||||
Other | 12,280 | (9,147 | ) | (1,883 | ) | 1,250 | |||||||||
230,127 | (120,225 | ) | (18,349 | ) | 91,553 | ||||||||||
Indefinite life intangible assets: | |||||||||||||||
Trademarks and tradenames | 111,538 | — | (12,937 | ) | 98,601 | ||||||||||
Total intangible assets | $ | 341,665 | $ | (120,225 | ) | $ | (31,286 | ) | $ | 190,154 | |||||
January 3, 2016 | |||||||||||||||
(In thousands) | Cost | Accumulated Amortization | Translation Adjustment | Net Book Value | |||||||||||
Definite life intangible assets: | |||||||||||||||
Customer relationships | $ | 155,927 | $ | (48,025 | ) | $ | (5,648 | ) | $ | 102,254 | |||||
Patents | 29,643 | (17,168 | ) | (885 | ) | 11,590 | |||||||||
Software | 29,830 | (23,187 | ) | (208 | ) | 6,435 | |||||||||
Other | 12,280 | (7,853 | ) | (1,567 | ) | 2,860 | |||||||||
227,680 | (96,233 | ) | (8,308 | ) | 123,139 | ||||||||||
Indefinite life intangible assets: | |||||||||||||||
Trademarks and tradenames | 111,538 | — | (8,745 | ) | 102,793 | ||||||||||
Total intangible assets | $ | 339,218 | $ | (96,233 | ) | $ | (17,053 | ) | $ | 225,932 | |||||
Amortization of intangible assets was $24.0 million, $22.2 million and $19.6 million for the years ended January 1, 2017, January 3, 2016, and December 28, 2014 respectively. Amortization expense is classified within selling, general and administration expenses in the consolidated statements of comprehensive income (loss).
The estimated future amortization of intangible assets with definite lives as of January 1, 2017, is as follows:
(In thousands) | |||
Fiscal year: | |||
2017 | $ | 21,065 | |
2018 | 15,306 | ||
2019 | 14,277 | ||
2020 | 11,936 | ||
2021 | 9,131 | ||
4. Accounts Receivable
Our customers consist mainly of wholesale distributors, dealers, and retail home centers. Our ten largest customers accounted for 57.3% and 54.1% of total accounts receivable as of January 1, 2017, and January 3, 2016, respectively. Our largest two customers, The Home Depot, Inc. and Lowe's Co. Inc., each accounted for more than 10%
78
of the consolidated gross accounts receivable balance as of January 1, 2017, and January 3, 2016. No other individual customer accounted for greater than 10% of the consolidated gross accounts receivable balance at either January 1, 2017, or January 3, 2016.
The changes in the allowance for doubtful accounts were as follows for the periods indicated:
Year Ended | |||||||||||
(In thousands) | January 1, 2017 | January 3, 2016 | December 28, 2014 | ||||||||
Balance at beginning of period | $ | 3,125 | $ | 2,616 | $ | 3,764 | |||||
Additions charged to expense | 103 | 2,083 | 2,522 | ||||||||
Deductions | (2,218 | ) | (1,574 | ) | (3,670 | ) | |||||
Balance at end of period | $ | 1,010 | $ | 3,125 | $ | 2,616 | |||||
We maintain accounts receivable sales programs with third parties (the "AR Sales Programs"). Under the AR Sales Programs, we can transfer ownership of eligible trade accounts receivable of certain customers. Receivables are sold outright to third parties who assume the full risk of collection, without recourse to us in the event of a loss. Transfers of receivables under these programs are accounted for as sales. Proceeds from the transfers reflect the face value of the accounts receivable less a discount. Receivables sold under the AR Sales Programs are excluded from trade accounts receivable in the consolidated balance sheets and are included in cash flows from operating activities in the consolidated statements of cash flows. The discounts on the sales of trade accounts receivable sold under the AR Sales Programs were not material for any of the periods presented and were recorded in selling, general and administration expense within the consolidated statements of comprehensive income (loss).
5. Inventories
The amounts of inventory on hand were as follows as of the dates indicated:
(In thousands) | January 1, 2017 | January 3, 2016 | |||||
Raw materials | $ | 165,896 | $ | 145,856 | |||
Finished goods | 65,791 | 69,045 | |||||
Provision for obsolete or aged inventory | (5,747 | ) | (6,508 | ) | |||
Inventories, net | $ | 225,940 | $ | 208,393 | |||
We carry an inventory provision which is the result of obsolete or aged inventory. The rollforward of our inventory provision is as follows for the periods indicated:
Year Ended | |||||||||||
(In thousands) | January 1, 2017 | January 3, 2016 | December 28, 2014 | ||||||||
Balance at beginning of period | $ | 6,508 | $ | 6,548 | $ | 8,351 | |||||
Additions charged to expense | 1,724 | 2,713 | 1,730 | ||||||||
Deductions | (2,485 | ) | (2,753 | ) | (3,533 | ) | |||||
Balance at end of period | $ | 5,747 | $ | 6,508 | $ | 6,548 | |||||
79
6. Property, Plant and Equipment
The carrying amounts of our property, plant and equipment and accumulated depreciation were as follows as of the dates indicated:
(In thousands) | January 1, 2017 | January 3, 2016 | |||||
Land | $ | 24,562 | $ | 25,316 | |||
Buildings | 163,802 | 155,709 | |||||
Machinery and equipment | 595,929 | 551,264 | |||||
Property, plant and equipment, gross | 784,293 | 732,289 | |||||
Accumulated depreciation | (242,205 | ) | (198,055 | ) | |||
Property, plant and equipment, net | $ | 542,088 | $ | 534,234 | |||
Total depreciation expense was $57.6 million, $59.2 million, and $60.6 million for the years ended January 1, 2017, January 3, 2016, and December 28, 2014, respectively. Depreciation expense is included primarily within cost of goods sold in the consolidated statements of comprehensive income (loss).
On June 6, 2014, an explosion occurred in the power plant of our Estcourt mill in South Africa which reduced the site’s ability to generate steam and heat the kilns which, in turn, required the production lines to cease operating for several weeks. We were insured against property loss and business interruption, and we recognized final payment of $2.4 million in business interruption insurance proceeds during the year ended January 3, 2016, and partial payment of $3.5 million during the year ended December 28, 2014. These proceeds were recorded as a reduction to selling, general and administration expense in the consolidated statements of comprehensive income (loss).
7. Long-Term Debt
(In thousands) | January 1, 2017 | January 3, 2016 | |||||
5.625% senior unsecured notes due 2023 | $ | 475,000 | $ | 475,000 | |||
Debt issuance costs for 2023 Notes | (5,393 | ) | (6,232 | ) | |||
Capital lease obligations | 768 | 88 | |||||
Other long-term debt | 370 | — | |||||
Total long-term debt | $ | 470,745 | $ | 468,856 | |||
Interest expense related to our consolidated indebtedness under senior unsecured notes was $27.8 million, $32.0 million, and $39.4 million for years ended January 1, 2017, January 3, 2016, and December 28, 2014, respectively.
5.625% Senior Notes due 2023
On March 23, 2015, we issued $475.0 million aggregate principal senior unsecured notes (the “2023 Notes”). The 2023 Notes were issued in a private placement for resale to qualified institutional buyers pursuant to Rule 144A under the Securities Act of 1933, as amended (the “Securities Act”), and to buyers outside the United States pursuant to Regulation S under the Securities Act. The 2023 Notes were issued without registration rights and are not listed on any securities exchange. The 2023 Notes were issued at par and bear interest at 5.625% per annum, payable in cash semiannually in arrears on March 15 and September 15 of each year and are due March 15, 2023. We received net proceeds of $467.9 million after deducting $7.1 million of debt issuance costs. The debt issuance costs were capitalized as a reduction to the carrying value of debt and are being accreted to interest expense over the term of the 2023 Notes using the effective interest method. The net proceeds from the 2023 Notes, together with available cash balances, were used to redeem the $500.0 million aggregate principal of 2021 Notes (the “2021 Notes”) and to pay related premiums, fees and expenses.
80
In conjunction with the closing of the 2023 Notes offering, the 2021 Notes were fully redeemed and considered extinguished as of March 23, 2015. Under the terms of the indenture governing the 2021 Notes, we paid the applicable premium, as described in the indenture, of $31.7 million. Additionally, the unamortized premium of $11.5 million and unamortized debt issuance costs of $7.8 million relating to the 2021 Notes were written off in conjunction with the extinguishment of the 2021 Notes. The resulting loss on extinguishment of debt was $28.0 million and is recorded as part of income (loss) from continuing operations before income tax expense (benefit) in the consolidated statements of comprehensive income (loss). Additionally, the cash payment of interest accrued to, but not including, the redemption date was accelerated to the redemption date.
We may redeem the 2023 Notes, in whole or in part, at any time prior to March 15, 2018, at a price equal to 100% of the principal amount plus the applicable premium, plus accrued and unpaid interest, if any, to the date of redemption. The applicable premium means, with respect to a note at any date of redemption, the greater of (i) 1.00% of the then-outstanding principal amount of such note and (ii) the excess of (a) the present value at such date of redemption of (1) the redemption price of such note at March 15, 2018, plus (2) all remaining required interest payments due on such note through such date (excluding accrued but unpaid interest to the date of redemption), computed using a discount rate equal to the Treasury Rate, as described in the indenture, plus 50 basis points, over (b) the principal amount of such note on such redemption date. We may also redeem the 2023 Notes, in whole or in part, at any time on or after March 15, 2018, at the applicable redemption prices specified under the indenture governing the 2023 Notes, plus accrued and unpaid interest, if any, to the date of redemption. If we experience certain changes of control or consummate certain asset sales and do not reinvest the net proceeds, we must offer to repurchase all of the 2023 Notes at a purchase price of 101.00% of their principal amount, plus accrued and unpaid interest, if any, to the repurchase date.
Obligations under the 2023 Notes are fully and unconditionally guaranteed, jointly and severally, on a senior unsecured basis, by certain of our directly or indirectly wholly-owned subsidiaries.
The indenture governing the 2023 Notes contains restrictive covenants that, among other things, limit our ability and the ability of our subsidiaries to: (i) incur additional debt and issue disqualified or preferred stock, (ii) make restricted payments, (iii) sell assets, (iv) create or permit restrictions on the ability of our restricted subsidiaries to pay dividends or make other distributions to the parent company, (v) create or incur certain liens, (vi) enter into sale and leaseback transactions, (vii) merge or consolidate with other entities and (viii) enter into transactions with affiliates. The foregoing limitations are subject to exceptions as set forth in the indenture governing the 2023 Notes. In addition, if in the future the 2023 Notes have an investment grade rating from at least two nationally recognized statistical rating organizations, certain of these covenants will be replaced with a less restrictive covenant.
The indenture governing the 2023 Notes contains customary events of default (subject in certain cases to customary grace and cure periods). As of January 1, 2017, we were in compliance with all covenants under the indenture governing the 2023 Notes.
ABL Facility
On April 9, 2015, we and certain of our subsidiaries amended and restated our asset-based revolving credit facility (the "ABL Facility") in order to extend the maturity date of the ABL Facility and amend certain other provisions. The amended and restated ABL Facility increased the revolving commitments to $150.0 million from $125.0 million and extended the final maturity date to April 9, 2020, from May 17, 2016. The borrowing base is calculated based on a percentage of the value of selected U.S. and Canadian accounts receivable and inventory, less certain intangible amounts.
Obligations under the ABL Facility are secured by a first priority security interest in substantially all of the current assets of Masonite and our subsidiaries. In addition, obligations under the ABL Facility are fully and unconditionally guaranteed, jointly and severally, on a senior unsecured basis, by certain of our directly or indirectly wholly-owned subsidiaries.
81
Borrowings under the ABL Facility bear interest at a rate equal to, at our option, (i) the Base Rate, Canadian Prime Rate or Canadian Base Rate (each as defined in the Amended and Restated Credit Agreement) plus a margin ranging from 0.25% to 0.75% per annum, or (ii) the Eurodollar Base Rate or BA Rate (each as defined in the Amended and Restated Credit Agreement), plus a margin ranging from 1.25% to 1.75% per annum.
In addition to paying interest on any outstanding principal under the ABL Facility a commitment fee is payable on the undrawn portion of the ABL Facility in an amount equal to 0.25% per annum of the average daily balance of unused commitments during each calendar quarter.
The ABL Facility contains various customary representations, warranties and covenants by us that, among other things, and subject to certain exceptions, restrict Masonite's ability and the ability of our subsidiaries to: (i) pay dividends on our common shares and make other restricted payments, (ii) make investments and acquisitions, (iii) engage in transactions with our affiliates, (iv) sell assets, (v) merge and (vi) create liens.
The Amended and Restated Credit Agreement amended the ABL Facility to, among other things, (i) permit us to incur unlimited unsecured debt as long as such debt does not contain covenants or default provisions that are more restrictive than those contained in the ABL Facility, (ii) permit us to incur debt as long as the pro forma secured leverage ratio is less than 4.5 to 1.0, and (iii) add certain additional exceptions and exemptions under the restricted payment, investment and indebtedness covenants (including increasing the amount of certain debt permitted to be incurred under an existing exception). As of January 1, 2017, and January 3, 2016, we were in compliance with all covenants under the credit agreement governing the ABL Facility. As of January 1, 2017, and January 3, 2016, there were no amounts outstanding under the ABL Facility.
8. Share Based Compensation Plans
Share-based compensation expense was $18.8 million, $13.2 million, and $9.6 million for the years ended January 1, 2017, January 3, 2016, and December 28, 2014, respectively. As of January 1, 2017, the total remaining unrecognized compensation expense related to share based compensation amounted to $15.1 million, which will be amortized over the weighted average remaining requisite service period of 1.5 years. Share based compensation expense is recognized using a graded-method approach, or to a lesser extent a cliff-vesting approach, depending on the terms of the individual award and is classified within selling, general and administration expenses in the consolidated statements of comprehensive income (loss). All share based awards are settled through issuance of new shares of our common stock. The share based award agreements contain restrictions on sale or transfer other than in limited circumstances. All other transfers would cause the share based awards to become null and void.
Equity Incentive Plan
Prior to July 9, 2012, we had a management equity incentive plan (the "2009 Plan"). The 2009 Plan required granting by June 9, 2012, equity instruments which upon exercise would result in management (excluding directors) owning 9.55% of our common equity (3,554,811 shares) on a fully diluted basis, after giving consideration to the potential exercise of warrants and the equity instruments granted to directors. Under the 2009 Plan, we were required to issue equity instruments to directors that represented 0.90% (335,004 shares) of the common equity on a fully diluted basis. The requirement for issuance to employees was satisfied in June 2012, and the requirement for issuance to directors was satisfied in July 2009. No awards have been granted under the 2009 Plan since May 30, 2012, and no future awards will be granted under the 2009 Plan; however, all outstanding awards under the 2009 Plan will continue to be governed by their existing terms. Aside from shares issuable for outstanding awards, there are no further shares of common stock available for future issuance under the 2009 Plan.
On July 12, 2012, the Board of Directors adopted the Masonite International Corporation 2012 Equity Incentive Plan, which was amended on June 21, 2013, by our Board of Directors, further amended and restated by our Board of Directors on February 23, 2015, and approved by our shareholders on May 12, 2015 (as amended and restated, the "2012 Plan"). The 2012 Plan was adopted because the Board believes awards granted will help to attract, motivate and retain employees and non-employee directors, align employee and stockholder interests and encourage a performance-based culture built on employee stock ownership. The 2012 Plan permits us to offer eligible directors, employees and
82
consultants cash and share-based incentives, including stock options, stock appreciation rights, restricted stock, other share-based awards (including restricted stock units) and cash-based awards. The 2012 Plan is effective for ten years from the date of its adoption. Awards granted under the 2012 Plan are at the discretion of the Human Resources and Compensation Committee of the Board of Directors. The Human Resources and Compensation Committee may grant any award under the 2012 Plan in the form of a performance award. The 2012 Plan may be amended, suspended or terminated by the Board at any time; provided, that any amendment, suspension or termination which impairs the rights of a participant is subject to such participant's consent and; provided further, that certain material amendments are subject to shareholder approval. The aggregate number of common shares that can be issued with respect to equity awards under the 2012 Plan cannot exceed 2,000,000 shares plus the number of shares subject to existing grants under the 2009 plan that may expire or be forfeited or cancelled. As of January 1, 2017, there were 1,584,589 shares of common stock available for future issuance under the 2012 Plan.
Deferred Compensation Plan
We offer to certain of our employees and directors a Deferred Compensation Plan ("DCP"). The DCP is an unfunded non-qualified deferred compensation plan that permits those certain employees and directors to defer a portion of their compensation to a future time. Eligible employees may elect to defer a portion of their base salary, bonus and/or restricted stock units and eligible directors may defer a portion of their director fees or restricted stock units. All contributions to the DCP on behalf of the participant are fully vested (other than restricted stock unit deferrals which remain subject to the vesting terms of the applicable equity incentive plan) and placed into a grantor trust, commonly referred to as a "rabbi trust." Although we are permitted to make matching contributions under the terms of the DCP, we have not elected to do so. The DCP invests the contributions in diversified securities from a selection of investments and the participants choose their investments and may periodically reallocate the assets in their respective accounts. Participants are entitled to receive the benefits in their accounts upon separation of service or upon a specified date, with benefits payable as a single lump sum or in annual installments. All plan investments are categorized as having Level 1 valuation inputs as established by the FASB’s Fair Value Framework.
Assets of the rabbi trust, other than Company stock, are recorded at fair value and included in other assets in the consolidated balance sheets. These assets in the rabbi trust are classified as trading securities and changes in their fair values are recorded in other income (loss) in the consolidated statements of comprehensive income (loss). The liability relating to deferred compensation represents our obligation to distribute funds to the participants in the future and is included in other liabilities in the consolidated balance sheets. As of January 1, 2017, the liability and asset relating to deferred compensation each had a fair value of $3.3 million. Any unfunded gain or loss relating to changes in the fair value of the deferred compensation liability is recognized in selling, general and administration expense in the consolidated statements of comprehensive income (loss).
As of January 1, 2017, participation in the deferred compensation plan is limited and no restricted stock awards have been deferred into the deferred compensation plan.
Stock Appreciation Rights
We have granted Stock Appreciation Rights ("SARs") to certain employees under both the 2009 Plan and the 2012 Plan, which entitle the recipient to the appreciation in value of a number of common shares over the exercise price over a period of time, each as specified in the applicable award agreement. The exercise price of any SAR granted may not be less than the fair market value of our common shares on the date of grant. The compensation expense for the SARs is measured based on the fair value of the SARs at the date of grant and is recognized over the requisite service period. The SARs vest over a maximum of four years, have a life of ten years and settle in common shares. It is assumed that all time-based SARs will vest.
83
The total fair value of SARs vested was $2.4 million, $0.6 million, and $0.7 million, in the years ended January 1, 2017, January 3, 2016, and December 28, 2014, respectively.
Twelve months ended January 1, 2017 | Stock Appreciation Rights | Aggregate Intrinsic Value (in thousands) | Weighted Average Exercise Price | Average Remaining Contractual Life (Years) | ||||||||
Outstanding, beginning of period | 891,147 | $ | 36,681 | $ | 20.07 | 4.9 | ||||||
Granted | 121,805 | 58.37 | ||||||||||
Exercised | (176,416 | ) | 8,954 | 17.09 | ||||||||
Forfeited | (46,246 | ) | 57.47 | |||||||||
Outstanding, end of period | 790,290 | $ | 32,659 | $ | 24.47 | 4.6 | ||||||
Exercisable, end of period | 712,331 | $ | 32,080 | $ | 20.77 | 4.1 | ||||||
Twelve months ended January 3, 2016 | Stock Appreciation Rights | Aggregate Intrinsic Value (in thousands) | Weighted Average Exercise Price | Average Remaining Contractual Life (Years) | ||||||||
Outstanding, beginning of period | 1,231,468 | $ | 48,516 | $ | 19.59 | 5.9 | ||||||
Exercised | (326,933 | ) | 15,943 | 17.15 | ||||||||
Forfeited | (13,388 | ) | 47.64 | |||||||||
Outstanding, end of period | 891,147 | $ | 36,681 | $ | 20.07 | 4.9 | ||||||
Exercisable, end of period | 703,827 | $ | 31,395 | $ | 16.62 | 4.2 | ||||||
Twelve months ended December 28, 2014 | Stock Appreciation Rights | Aggregate Intrinsic Value (in thousands) | Weighted Average Exercise Price | Average Remaining Contractual Life (Years) | ||||||||
Outstanding, beginning of period | 1,812,658 | $ | 59,525 | $ | 18.16 | 6.4 | ||||||
Exercised | (560,568 | ) | 23,400 | 14.15 | ||||||||
Forfeited | (20,622 | ) | 38.48 | |||||||||
Outstanding, end of period | 1,231,468 | $ | 48,516 | $ | 19.59 | 5.9 | ||||||
Exercisable, end of period | 907,716 | $ | 38,589 | $ | 16.48 | 5.1 | ||||||
84
The value of SARs granted in the year ended January 1, 2017, as determined using the Black-Scholes Merton valuation model, was $2.0 million and is expected to be recognized over the average requisite service period of 2.0 years. Expected volatility is based upon the historical volatility of our public industry peers’ common shares amongst other considerations. The expected term is calculated using the simplified method, due to insufficient exercise activity during recent years as a basis from which to estimate future exercise patterns. The weighted average grant date assumptions used for the SARs granted were as follows for the periods indicated:
2016 Grants | |||
SAR value (model conclusion) | $ | 16.78 | |
Risk-free rate | 1.6 | % | |
Expected dividend yield | 0.0 | % | |
Expected volatility | 26.2 | % | |
Expected term (years) | 6.0 | ||
Restricted Stock Units
We have granted Restricted Stock Units ("RSUs") to directors and certain employees under both the 2009 Plan and the 2012 Plan. The RSUs confer the right to receive shares of our common stock at a specified future date or when certain conditions are met. The compensation expense for the RSUs awarded is based on the fair value of the RSUs at the date of grant and is recognized over the requisite service period. The RSUs vest over a maximum of three years and call for the underlying shares to be delivered no later than 30 days following the vesting date unless the participant is subject to a blackout period. In such case, the shares are to be delivered once the blackout restriction has been lifted. It is assumed that all time-based RSUs will vest.
Year Ended | ||||||||||||||||||||
January 1, 2017 | January 3, 2016 | December 28, 2014 | ||||||||||||||||||
Total Restricted Stock Units Outstanding | Weighted Average Grant Date Fair Value | Total Restricted Stock Units Outstanding | Weighted Average Grant Date Fair Value | Total Restricted Stock Units Outstanding | Weighted Average Grant Date Fair Value | |||||||||||||||
Outstanding, beginning of period | 526,930 | $ | 49.31 | 543,373 | $ | 34.56 | 618,963 | $ | 22.09 | |||||||||||
Granted | 288,683 | 46.05 | 257,775 | 61.56 | 209,240 | |||||||||||||||
Delivered | (234,791 | ) | (157,356 | ) | (208,477 | ) | ||||||||||||||
Withheld to cover (1) | (61,894 | ) | (32,123 | ) | (59,066 | ) | ||||||||||||||
Forfeited | (17,002 | ) | (84,739 | ) | (17,287 | ) | ||||||||||||||
Outstanding, end of period | 501,926 | $ | 58.51 | 526,930 | $ | 49.31 | 543,373 | $ | 34.56 | |||||||||||
____________
(1) A portion of the vested RSUs delivered were net share settled to cover statutory requirements for income and other employment taxes. We remit the equivalent cash to the appropriate taxing authorities. These net share settlements had the effect of share repurchases by us as we reduced and retired the number of shares that would have otherwise been issued as a result of the vesting.
Approximately one-third of the RSUs granted during the year ended January 1, 2017, vest at specified future dates with only service requirements, while the remaining portion of the RSUs vest based on both performance and service requirements. The value of RSUs granted in the year ended January 1, 2017, was $13.3 million and is being recognized over the weighted average requisite service period of 2.5 years. During the year ended January 1, 2017, there were 296,685 RSUs vested at a fair value of $8.9 million.
85
Warrants
On June 9, 2009, we issued 5,833,335 warrants, representing the right to purchase our common shares for $55.31 per share, subsequently adjusted to $50.77 per share for the $4.54 per share return of capital in 2011. Of these, 3,333,334 had an expiration date of June 9, 2014 (the "2014 Warrants"), and 2,500,001 had an expiration date of June 9, 2016 (the "2016 Warrants"). During the six months prior to their respective expiration dates, the warrants provided the holders with a cashless exercise option. We have accounted for these warrants as equity instruments. As of January 1, 2017, all outstanding warrants to purchase our common shares have either been exercised or forfeited.
Activity relating to the warrants was as follows for the periods presented:
Year Ended | |||||||||||||||||||
January 1, 2017 | January 3, 2016 | December 28, 2014 | |||||||||||||||||
2016 Warrants | 2016 Warrants | 2014 Warrants | 2016 Warrants | Total Warrants | |||||||||||||||
Outstanding, beginning of period | 2,497,971 | 2,500,001 | 3,333,334 | 2,500,001 | 5,833,335 | ||||||||||||||
Exercised | (2,496,493 | ) | (2,030 | ) | (3,289,146 | ) | — | (3,289,146 | ) | ||||||||||
Forfeited | (1,478 | ) | — | (44,188 | ) | — | (44,188 | ) | |||||||||||
Outstanding, end of period | — | 2,497,971 | — | 2,500,001 | 2,500,001 | ||||||||||||||
Cash received for exercise (in thousands) | $ | 10,487 | $ | — | $ | 263 | $ | — | $ | 263 | |||||||||
Common shares issued | 630,951 | 433 | 279,408 | — | 279,408 | ||||||||||||||
9. Employee Future Benefits
United States Defined Benefit Pension Plan
We have a defined benefit pension plan covering certain active and former employees in the United States (“U.S.”). Benefits under the plan were frozen at various times in the past. The measurement date used for the accounting valuation of the defined benefit pension plan was January 1, 2017. Information about the U.S. defined benefit pension plan is as follows for the periods indicated:
Year Ended | |||||||||||
(In thousands) | January 1, 2017 | January 3, 2016 | December 28, 2014 | ||||||||
Components of net periodic benefit cost: | |||||||||||
Service cost | $ | 286 | $ | 288 | $ | 261 | |||||
Interest cost | 3,570 | 4,627 | 5,062 | ||||||||
Expected return on assets | (5,373 | ) | (6,350 | ) | (5,951 | ) | |||||
Amortization of actuarial net losses | 1,070 | 889 | — | ||||||||
Settlement loss (gain) | — | 2,400 | — | ||||||||
Net pension expense (benefit) | $ | (447 | ) | $ | 1,854 | $ | (628 | ) | |||
During 2015, we offered lump sum payments over a limited time to certain former employees in our U.S. pension plans. Payments of $12.6 million related to this offer were made from existing plan assets in the fourth quarter of 2015. As a result, total lump sum payments from these plans exceeded annual service and interest cost in 2015, and we recognized a pre-tax pension settlement charge of $2.4 million in the fourth quarter of 2015. This non-cash charge is recorded within other expense (income), net in the consolidated statements of comprehensive income (loss).
86
Information with respect to the assets, liabilities and net accrued benefit obligation of the U.S. defined benefit pension plan is set forth as follows for the periods indicated:
Year Ended | |||||||
(In thousands) | January 1, 2017 | January 3, 2016 | |||||
Pension assets: | |||||||
Fair value of plan assets, beginning of year | $ | 76,691 | $ | 90,724 | |||
Company contributions | 5,000 | 5,178 | |||||
Actual return on plan assets | 7,823 | (939 | ) | ||||
Plan settlements | — | (12,604 | ) | ||||
Benefits paid | (5,061 | ) | (5,262 | ) | |||
Administrative expenses paid | (903 | ) | (406 | ) | |||
Fair value of plan assets, end of year | 83,550 | 76,691 | |||||
Pension liability: | |||||||
Accrued benefit obligation, beginning of year | 97,686 | 116,303 | |||||
Current service cost | 286 | 288 | |||||
Interest cost | 3,570 | 4,627 | |||||
Plan settlements | — | (12,604 | ) | ||||
Actuarial loss (gain) | 5,309 | (5,260 | ) | ||||
Benefits paid | (5,061 | ) | (5,262 | ) | |||
Administrative expenses paid | (903 | ) | (406 | ) | |||
Accrued benefit obligation, end of year | 100,887 | 97,686 | |||||
Net accrued benefit obligation, end of year | $ | 17,337 | $ | 20,995 | |||
The net accrued benefit obligation is carried within other long-term liabilities in the consolidated balance sheets.
Pension fund assets are invested primarily in equity and debt securities. Asset allocation between equity and debt securities and cash is adjusted based on the expected life of the plan and the expected retirement age of the plan participants. No plan assets are expected to be returned to us in the next twelve months. Information with respect to the amounts and types of securities that are held in the U.S. defined benefit pension plan is set forth as follows for the periods indicated:
Year Ended | |||||||||||||
January 1, 2017 | January 3, 2016 | ||||||||||||
(In thousands) | Amount | % of Total Plan | Amount | % of Total Plan | |||||||||
Equity securities | $ | 48,793 | 58.4 | % | $ | 44,635 | 58.2 | % | |||||
Debt securities | 30,162 | 36.1 | % | 28,452 | 37.1 | % | |||||||
Other | 4,595 | 5.5 | % | 3,604 | 4.7 | % | |||||||
$ | 83,550 | 100.0 | % | $ | 76,691 | 100.0 | % | ||||||
Under our investment policy statement, plan assets are invested to achieve a fully-funded status based on actuarial calculations, maintain a level of liquidity that is sufficient to pay benefit and expense obligations when due, maintain flexibility in determining the future level of contributions and maximize returns within the limits of risk. The target asset allocation for plan assets in the U.S. defined benefit pension plan for 2016 is 60% equity securities, 38% debt securities and 2% of other securities. Our pension funds are not invested directly in the debt or equity of Masonite, but may have been invested indirectly as a result of inclusion of Masonite in certain market or investment funds.
87
The weighted average actuarial assumptions adopted in measuring our U.S. accrued benefit obligations and costs were as follows for the periods indicated:
Year Ended | ||||||||
January 1, 2017 | January 3, 2016 | December 28, 2014 | ||||||
Discount rate applied for: | ||||||||
Accrued benefit obligation | 4.2 | % | 4.5 | % | 4.1 | % | ||
Net periodic pension cost | 4.5 | % | 4.1 | % | 5.0 | % | ||
Expected long-term rate of return on plan assets | 7.0 | % | 7.0 | % | 7.0 | % | ||
The rate of compensation increase for the accrued benefit obligation and net periodic pension costs for the U.S. defined benefit pension plan is not applicable, as benefits under the plan are not affected by compensation increases.
The expected long-term rate of return on plan assets assumption is derived by taking into consideration the target plan asset allocation, historical rates of return on those assets, projected future asset class returns and net outperformance of the market by active investment managers. An asset return model is used to develop an expected range of returns on the plan investments over a 30-year period, with the expected rate of return selected from a best estimate range within the total range of projected results.
United Kingdom Defined Benefit Pension Plan
We also have a defined benefit pension plan in the United Kingdom (“U.K.”), which has been curtailed in prior years. The measurement date used for the accounting valuation of the U.K. defined benefit pension plan was January 1, 2017. Information about the U.K. defined benefit pension plan is as follows for the periods indicated:
Year Ended | |||||||||||
January 1, 2017 | January 3, 2016 | December 28, 2014 | |||||||||
Components of net periodic benefit cost: | |||||||||||
Interest cost | $ | 873 | $ | 1,098 | $ | 1,335 | |||||
Expected return on assets | (640 | ) | (756 | ) | (1,041 | ) | |||||
Net pension expense (benefit) | $ | 233 | $ | 342 | $ | 294 | |||||
88
Information with respect to the assets, liabilities and net accrued benefit obligation of the U.K. defined benefit pension plan is as follows for the periods indicated:
Year Ended | |||||||
(In thousands) | January 1, 2017 | January 3, 2016 | |||||
Pension assets: | |||||||
Fair value of plan assets, beginning of year | $ | 21,922 | $ | 23,089 | |||
Company contributions | 801 | 873 | |||||
Actual return on plan assets | 3,765 | 223 | |||||
Benefits paid | (1,595 | ) | (1,166 | ) | |||
Translation adjustment | (3,882 | ) | (1,097 | ) | |||
Fair value of plan assets, end of year | 21,011 | 21,922 | |||||
Pension liability | |||||||
Accrued benefit obligation ,beginning of year | 29,361 | 31,588 | |||||
Interest cost | 873 | 1,098 | |||||
Actuarial loss (gain) | 5,746 | (676 | ) | ||||
Benefits paid | (1,595 | ) | (1,166 | ) | |||
Translation adjustment | (5,290 | ) | (1,483 | ) | |||
Accrued benefit obligation, end of year | 29,095 | 29,361 | |||||
Net accrued benefit obligation, end of year | $ | 8,084 | $ | 7,439 | |||
The net accrued benefit obligation is carried within other long-term liabilities in the consolidated balance sheets.
Pension fund assets are invested primarily in equity and debt securities. Asset allocation between equity and debt securities and cash is adjusted based on the expected life of the plan and the expected retirement age of the plan participants. Information with respect to the amounts and types of securities that are held in the U.K. defined benefit pension plan is set forth as follows for the periods indicated:
Year Ended | |||||||||||||
January 1, 2017 | January 3, 2016 | ||||||||||||
(In thousands) | Amount | % of Total Plan | Amount | % of Total Plan | |||||||||
Equity securities | $ | 9,448 | 45.0 | % | $ | 9,752 | 44.5 | % | |||||
Debt securities | 11,462 | 54.5 | % | 11,576 | 52.8 | % | |||||||
Other | 101 | 0.5 | % | 594 | 2.7 | % | |||||||
$ | 21,011 | 100.0 | % | $ | 21,922 | 100.0 | % | ||||||
Under our investment policy and strategy, plan assets are invested to achieve a fully funded status based on actuarial calculations, maintain a level of liquidity that is sufficient to pay benefit and expense obligations when due, maintain flexibility in determining the future level of contributions and maximize returns within the limits of risk. The target asset allocation for plan assets in the U.K. defined benefit pension plan for 2016 is 50% equity securities and 50% debt securities.
89
The weighted average actuarial assumptions adopted in measuring our U.K. accrued benefit obligations and costs were as follows for the periods indicated:
Year Ended | ||||||||
January 1, 2017 | January 3, 2016 | December 28, 2014 | ||||||
Discount rate applied for: | ||||||||
Accrued benefit obligation | 2.6 | % | 3.7 | % | 3.6 | % | ||
Net periodic pension cost | 2.3 | % | 3.3 | % | 3.6 | % | ||
Expected long-term rate of return on plan assets | 3.9 | % | 4.0 | % | 4.2 | % | ||
The rate of compensation increase for the accrued benefit obligation and net pension cost for the U.K. defined benefit pension plan is not applicable, as the plan was curtailed in prior years and benefits under the plan are not affected by compensation increases.
The expected long-term rate of return on plan assets assumption is derived by taking into consideration the target plan asset allocation, historical rates of return on those assets, projected future asset class returns and net outperformance of the market by active investment managers. An asset return model is used to develop an expected range of returns on the plan investments over a 10-year period, with the expected rate of return selected from a best estimate range within the total range of projected results.
Overall Pension Obligation
For all periods presented, the U.S. and U.K. defined benefit pension plans were invested in equity securities, equity funds, bonds, bond funds and cash and cash equivalents. All investments are publicly traded and possess a high level of marketability or liquidity. All plan investments are categorized as having Level 1 valuation inputs as established by the FASB’s Fair Value Framework.
The change in the net difference between the pension plan assets and projected benefit obligation that is not attributed to our recognition of pension expense or funding of the plan is recognized in other comprehensive income (loss) within the consolidated statements of comprehensive income (loss) and the balance of such changes is included in accumulated other comprehensive income (loss) (“AOCI”) in the consolidated balance sheets. The estimated actuarial net losses that will be amortized from AOCI into net periodic benefit cost during 2017 are $1.6 million.
As of January 1, 2017, the estimated future benefit payments from the U.S. and U.K. defined benefit pension plans for the following future periods are set forth as follows:
(In thousands) | Expected Future Benefit Payments | ||
Fiscal year: | |||
2018 | $ | 6,578 | |
2019 | 6,793 | ||
2020 | 6,968 | ||
2021 | 7,187 | ||
2022 | 7,319 | ||
2023 through 2027 | 37,101 | ||
Total estimated future benefit payments | $ | 71,946 | |
Expected contributions to the U.S. and U.K. defined benefit pension plans during 2017 are $5.8 million.
90
10. Commitments and Contingencies
Leases
For lease agreements that provide for escalating rent payments or rent-free occupancy periods, we recognize rent expense on a straight line basis over the non-cancelable lease term and any option renewal period where failure to exercise such option would result in an economic penalty in such amount that renewal appears, at the inception of the lease, to be reasonably assured. The lease term commences on the date when all conditions precedent to our obligation to pay rent are satisfied. The leases contain provisions for renewal ranging from zero to three options of generally five years each. Minimum payments, for the following future periods, under non-cancelable operating leases and service agreements with initial or remaining terms of one year or more consist of the following:
(In thousands) | |||
Fiscal year: | |||
2017 | $ | 20,249 | |
2018 | 19,003 | ||
2019 | 17,774 | ||
2020 | 15,499 | ||
2021 | 11,927 | ||
Thereafter | 71,487 | ||
Total future minimum lease payments | $ | 155,939 | |
Total rent expense, including non-cancelable operating leases and month-to-month leases, was $26.3 million, $24.0 million, and $24.6 million for years ended January 1, 2017, January 3, 2016, and December 28, 2014, respectively.
We have provided customary indemnifications to our landlords under certain property lease agreements for claims by third parties in connection with their use of the premises. We also have provided routine indemnifications against adverse effects related to changes in tax laws and patent infringements by third parties. The maximum amount of these indemnifications cannot be reasonably estimated due to their nature. In some cases, we have recourse against other parties to mitigate the risk of loss from these indemnifications. Historically, we have not made any significant payments relating to such indemnifications.
Legal Proceedings
In November 2015, Derrick Byrd, a former hourly employee in California, filed a putative class action lawsuit against us in California Superior Court alleging violations of California wage and hour laws with respect to meal periods and rest breaks and other technical wage and hour issues. In January 2016, we removed the lawsuit to the United States District Court for the Central District of California and on February 25, 2016, the court dismissed the complaint in its entirety. On March 18, 2016, the plaintiff filed an amended complaint, which we moved to dismiss, and we moved to strike several of the plaintiff’s causes of action. On July 7, 2016, the court dismissed several of the plaintiff’s causes of action and gave the plaintiff leave to amend. On July 29, 2016, the plaintiff filed a second amended complaint containing a narrower version of nine of the eleven original claims. We answered this amended complaint on August 12, 2016, and amended our answer on September 14, 2016. On November 28, 2016, the plaintiff filed a third amended complaint to add an additional individual as a plaintiff. On December 19, 2016, we answered this amended complaint. The plaintiffs continue to allege violations with respect to overtime pay, meal periods, rest breaks, minimum wage, timely pay, wage statement detail and reimbursement of business expenses. The lawsuit seeks damages, penalties, attorney’s fees and an award under the California Private Attorney General Act. Discovery is underway. The court has set the deadline for the plaintiff to file his motion for class certification for August 21, 2017, and the trial date has been set for November 28, 2017, although those dates may be extended. While we intend to defend the lawsuit vigorously, there can be no assurance that the ultimate resolution of this lawsuit will not have a material, adverse effect on our consolidated financial condition or results of operations.
91
In addition, from time to time, we are involved in various claims and legal actions. In the opinion of management, the ultimate disposition of these matters, individually and in the aggregate, will not have a material adverse effect on our financial condition, results of operations or cash flows.
11. Restructuring Costs
The following table summarizes the restructuring charges recorded for the periods indicated:
Year Ended January 1, 2017 | |||||||||||||||
(In thousands) | Europe | Architectural | Corporate & Other | Total | |||||||||||
2016 Plan | $ | — | 1,313 | — | $ | 1,313 | |||||||||
2015 Plan | 19 | — | 113 | 132 | |||||||||||
Total Restructuring Costs | $ | 19 | $ | 1,313 | $ | 113 | $ | 1,445 | |||||||
Year Ended January 3, 2016 | |||||||||||||||
(In thousands) | North American Residential | Europe | Corporate & Other | Total | |||||||||||
2015 Plan | $ | — | $ | 2,316 | $ | 3,168 | $ | 5,484 | |||||||
2013 Plan | 9 | 144 | — | 153 | |||||||||||
2012 and Prior Plans | — | 41 | — | 41 | |||||||||||
Total Restructuring Costs | $ | 9 | $ | 2,501 | $ | 3,168 | $ | 5,678 | |||||||
Year Ended December 28, 2014 | |||||||||||||||
(In thousands) | North American Residential | Europe | Corporate & Other | Total | |||||||||||
2014 Plan | $ | — | $ | — | $ | 9,503 | $ | 9,503 | |||||||
2013 Plan | 608 | 580 | 16 | 1,204 | |||||||||||
2012 and Prior Plans | 39 | 338 | 53 | 430 | |||||||||||
Total Restructuring Costs | $ | 647 | $ | 918 | $ | 9,572 | $ | 11,137 | |||||||
Cumulative Amount Incurred Through | |||||||||||||||||||
January 1, 2017 | |||||||||||||||||||
(In thousands) | North American Residential | Europe | Architectural | Corporate & Other | Total | ||||||||||||||
2016 Plan | $ | — | $ | — | $ | 1,313 | $ | — | $ | 1,313 | |||||||||
2015 Plan | — | 2,335 | — | 3,281 | 5,616 | ||||||||||||||
2014 Plan | — | — | — | 9,503 | 9,503 | ||||||||||||||
2013 Plan | 3,025 | 2,733 | — | 2,157 | 7,915 | ||||||||||||||
2012 and Prior Plans | 2,378 | 12,695 | — | 3,609 | 18,682 | ||||||||||||||
Total Restructuring Costs | $ | 5,403 | $ | 17,763 | $ | 1,313 | $ | 18,550 | $ | 43,029 | |||||||||
92
During 2016, we began implementing a plan (the "2016 Plan") to close one manufacturing facility in the Architectural segment, which includes the reduction of approximately 140 positions. The 2016 Plan is expected to improve our cost structure and enhance operational efficiencies, and is expected to be completed by the end of the third quarter of 2017. Costs associated with the 2016 Plan include closure costs and severance. Additionally, the announcement of the plant closure was determined to be a triggering event requiring a test of the carrying value of the definite-lived assets of the plant, as further described in Note 12. As of January 1, 2017, we expect to incur approximately $2.5 million of additional charges related to the 2016 Plan.
During 2015, we began implementing a multi-year plan to reorganize and consolidate certain aspects of our global head office (the "2015 Plan"). The 2015 Plan includes the creation of a new shared services function and the rationalization of certain of our European facilities, including related headcount reductions. The 2015 Plan was implemented in response to the need for more effective business processes enabled by the planned implementation of our new enterprise resource planning system in our architectural business as well as ongoing weak market conditions in Africa and Europe outside of the United Kingdom. Costs associated with the 2015 Plan included severance and closure charges and are substantially completed. As of January 1, 2017, we do not expect to incur any material future charges for the 2015 Plan.
On August 20, 2014, the Board of Directors of Masonite Israel Ltd. (“Israel”), one of our wholly-owned subsidiaries, decided to voluntarily seek a Stay of Proceedings from the Israeli courts in an attempt to restructure the business (the “2014 Plan”). The court filing was made on August 21, 2014, and the court appointed a trustee to oversee the operation of the business and to attempt to restructure it. The action to seek court protection followed a comprehensive evaluation of the alternatives for the business, including an organized sale process that was ultimately unsuccessful. We determined that the subsidiary should be deconsolidated at that time, as it had become subject to the control of a court. We have had and will continue to have no continuing involvement with Israel subsequent to August 21, 2014, and Israel will not be considered a related party. As of January 1, 2017, pending the ultimate resolution of the Stay of Proceedings, we do not anticipate any material future charges related to the 2014 Plan.
During 2013, we began implementing plans to rationalize certain of our facilities, including related headcount reductions, in Canada due to synergy opportunities related to recent acquisitions in the residential interior wood door markets. We have also rationalized certain of our operations, including related headcount reductions, in Ireland, South Africa and Israel in order to respond to declines in demand in international markets. Additionally, the decision was made to discontinue sales into the Polish market subsequent to the decision to cease manufacturing operations in 2012 (collectively, the "2013 Plan"). Costs associated with the 2013 Plan include severance and closure charges, including impairment of certain property, plant and equipment, and are substantially completed. As of January 1, 2017, we do not expect to incur any material future charges for the 2013 Plan.
Prior years’ restructuring costs relate to the closure of certain of our U.S. manufacturing facilities due to the start-up of our highly automated interior door slab assembly plant in Denmark, South Carolina, synergy opportunities related to acquisitions in the architectural interior wood door market and footprint optimization efforts resulting from declines in demand in specific markets, primarily in Europe. In response to the decline in demand, we reviewed the required levels of production and reduced the workforce and plant capacity accordingly, resulting in severance and closure charges. These actions were taken in order to rationalize capacity with existing and forecasted market demand conditions. The restructuring plans initiated in 2012 and prior years (the "2012 and Prior Plans") are substantially completed, although cash payments are expected to continue through 2019, primarily related to lease payments at closed facilities. As of January 1, 2017, we do not expect to incur any future charges for the 2012 and Prior Plans.
93
The changes in the accrual for restructuring by activity were as follows for the periods indicated:
(In thousands) | January 3, 2016 | Severance | Closure Costs | Cash Payments | January 1, 2017 | ||||||||||||||
2016 Plan | $ | — | $ | 1,313 | $ | — | $ | 13 | $ | 1,300 | |||||||||
2015 Plan | 774 | 107 | 25 | 624 | 282 | ||||||||||||||
2014 Plan | 442 | — | — | 16 | 426 | ||||||||||||||
2013 Plan | 316 | — | — | 316 | — | ||||||||||||||
2012 and Prior Plans | 858 | — | — | 393 | 465 | ||||||||||||||
Total | $ | 2,390 | $ | 1,420 | $ | 25 | $ | 1,362 | $ | 2,473 | |||||||||
(In thousands) | December 28, 2014 | Severance | Closure Costs | Cash Payments | January 3, 2016 | ||||||||||||||
2015 Plan | $ | — | $ | 2,519 | $ | 2,965 | $ | 4,710 | $ | 774 | |||||||||
2014 Plan | 839 | — | — | 397 | 442 | ||||||||||||||
2013 Plan | 341 | — | 153 | 178 | 316 | ||||||||||||||
2012 and Prior Plans | 1,153 | — | 41 | 336 | 858 | ||||||||||||||
Total | $ | 2,333 | $ | 2,519 | $ | 3,159 | $ | 5,621 | $ | 2,390 | |||||||||
(In thousands) | December 29, 2013 | Severance | Closure Costs | Cash Payments | Non-Cash Items | December 28, 2014 | |||||||||||||||||
2014 Plan | $ | — | $ | — | $ | 9,503 | $ | 1,087 | $ | 7,577 | $ | 839 | |||||||||||
2013 Plan | 2,348 | (22 | ) | 1,226 | 3,211 | — | 341 | ||||||||||||||||
2012 and Prior Plans | 2,061 | 236 | 194 | 1,338 | — | 1,153 | |||||||||||||||||
Total | $ | 4,409 | $ | 214 | $ | 10,923 | $ | 5,636 | $ | 7,577 | $ | 2,333 | |||||||||||
12. Asset Impairment
During the year ended January 1, 2017, we recognized asset impairment charges of $1.5 million related to one asset group in the Architectural segment, as a result of the 2016 Plan. The resulting non-cash impairment charge for the asset group was determined based upon the excess of the asset group's carrying value of property, plant and equipment over the fair value of such assets, determined using a discounted cash flows approach. This valuation was performed on a non-recurring basis and is categorized as having Level 3 valuation inputs as established by the FASB's Fair Value Framework. The Level 3 unobservable inputs include an estimate of future cash flows for the asset group and a salvage value for the asset group. The fair value of the asset group was determined to be $0.6 million, compared to a book value of $2.1 million, with the difference representing the asset impairment charge recorded in the consolidated statements of comprehensive income (loss).
During the year ended January 3, 2016, we recognized asset impairment charges of $9.4 million, related to the disposition of Premdor S.A.S., as described in Note 2.
During the year ended December 24, 2014, we recognized asset impairment charges of $18.2 million, related to certain asset groups in the Europe segment and the Corporate & Other category. Of this amount, $15.0 million related to property, plant and equipment and $3.2 million was related to definite-lived intangible assets. During the fourth quarter of 2014, management reassessed future cash flow expectations in certain underperforming markets in Europe and Asia. After reviewing the businesses, and in consideration of deteriorated market conditions, management initiated strategic actions which have resulted in a significant reduction in expected future cash flows. The resulting non-cash impairment charges for three of our asset groups were determined based upon the excess of the asset groups' carrying values over their respective fair values, determined using a discounted cash flows approach. This valuation was performed on a non-
94
recurring basis and is categorized as having Level 3 valuation inputs as established by the FASB’s Fair Value Framework. The Level 3 unobservable inputs include an estimate of future cash flows for each asset group and a salvage value or market value for each asset group. For two of the asset groups, the estimated discounted future cash flows, including salvage values, were determined to be zero and the asset groups were fully impaired from their respective book values of $4.2 million and $2.1 million. The third asset group was determined to have a fair value of $0.7 million, based on a discounted future cash flow analysis including market value, compared to a book value of $12.4 million. The remaining $0.2 million of asset impairment charges are attributable to differences in foreign exchange rates used for balance sheet accounts versus statement of comprehensive income (loss) accounts.
13. Income Taxes
For financial reporting purposes, income before income taxes includes the following components:
Year Ended | |||||||||||
(In thousands) | January 1, 2017 | January 3, 2016 | December 28, 2014 | ||||||||
Income (loss) from continuing operations before income tax expense (benefit): | |||||||||||
Canada | $ | 25,982 | $ | (97,626 | ) | $ | (32,093 | ) | |||
Foreign | 100,699 | 70,057 | 3,138 | ||||||||
Total income (loss) from continuing operations before income tax expense (benefit): | $ | 126,681 | $ | (27,569 | ) | $ | (28,955 | ) | |||
Income tax expense (benefit) for income taxes consists of the following:
Year Ended | |||||||||||
(In thousands) | January 1, 2017 | January 3, 2016 | December 28, 2014 | ||||||||
Current income tax expense (benefit): | |||||||||||
Canada | $ | 6,740 | $ | 5,541 | $ | 4,458 | |||||
Foreign | 2,129 | (466 | ) | 2,045 | |||||||
Total current income tax expense (benefit): | 8,869 | 5,075 | 6,503 | ||||||||
Deferred income tax expense (benefit): | |||||||||||
Canada | 3,045 | 2,063 | 1,345 | ||||||||
Foreign | 9,873 | 7,034 | (3,315 | ) | |||||||
Total deferred income tax expense (benefit): | 12,918 | 9,097 | (1,970 | ) | |||||||
Income tax expense (benefit) | $ | 21,787 | $ | 14,172 | $ | 4,533 | |||||
95
The Canadian statutory rate is 26.6%, 26.6% and 26.5% for the years ended January 1, 2017, January 3, 2016, and December 28, 2014, respectively. A summary of the differences between expected income tax expense (benefit) calculated at the Canadian statutory rate and the reported consolidated income tax expense (benefit) follows:
Year Ended | |||||||||||
(In thousands) | January 1, 2017 | January 3, 2016 | December 28, 2014 | ||||||||
Income tax expense (benefit) computed at statutory income tax rate | $ | 33,710 | $ | (7,325 | ) | $ | (7,679 | ) | |||
Foreign rate differential | 6,125 | (637 | ) | 248 | |||||||
Permanent differences | 1,159 | 1,166 | (1,314 | ) | |||||||
Deconsolidation and disposition | (2,027 | ) | 15,354 | (1,679 | ) | ||||||
Income attributable to a permanent establishment | 637 | 1,436 | 1,623 | ||||||||
Change in valuation allowance | (586 | ) | 18,906 | 23,352 | |||||||
Tax exempt income | (9,411 | ) | (9,855 | ) | (9,643 | ) | |||||
Share based compensation | (6,080 | ) | (1,542 | ) | 270 | ||||||
Income tax credits | (2,389 | ) | (2,026 | ) | — | ||||||
Foreign exchange gains (losses) | (277 | ) | (2,020 | ) | (573 | ) | |||||
Unrecognized tax benefits | 2,232 | (142 | ) | 104 | |||||||
Functional currency adjustments | (157 | ) | 1,240 | 1,055 | |||||||
Change in tax rate | (1,130 | ) | 16 | (787 | ) | ||||||
Impact of Canadian tax legislation | — | (293 | ) | (900 | ) | ||||||
Other | (19 | ) | (106 | ) | 456 | ||||||
Income tax expense (benefit) | $ | 21,787 | $ | 14,172 | $ | 4,533 | |||||
96
Deferred tax assets arise from available net operating losses and deductions. Our ability to use those net operating losses is dependent upon our results of operations in the tax jurisdictions in which such losses or deductions arose. The tax effects of temporary differences that give rise to significant portions of the deferred tax assets and liabilities are presented below:
Year Ended | |||||||
(In thousands) | January 1, 2017 | January 3, 2016 | |||||
Deferred tax assets: | |||||||
Non-capital loss carryforwards | $ | 52,051 | $ | 46,050 | |||
Capital loss carryforwards | 13,748 | 13,406 | |||||
Deferred interest expense | 10,563 | 20,827 | |||||
Pension and post-retirement liability | 9,457 | 10,884 | |||||
Accruals and reserves currently not deductible for tax purposes | 20,909 | 19,132 | |||||
Share based compensation | 10,805 | 7,750 | |||||
Other | 7,525 | 5,180 | |||||
Total deferred tax assets | 125,058 | 123,229 | |||||
Valuation allowance | (36,800 | ) | (40,857 | ) | |||
Total deferred tax assets, net of valuation allowance | 88,258 | 82,372 | |||||
Deferred tax liabilities: | |||||||
Plant and equipment | (88,241 | ) | (90,806 | ) | |||
Intangibles | (41,222 | ) | (50,924 | ) | |||
Basis difference in subsidiaries | (8,824 | ) | (8,671 | ) | |||
Unrealized foreign exchange loss (gain) | (7,944 | ) | (8,250 | ) | |||
Other | (2,972 | ) | (5,504 | ) | |||
Total deferred tax liabilities | (149,203 | ) | (164,155 | ) | |||
Net deferred tax asset (liability) | $ | (60,945 | ) | $ | (81,783 | ) | |
Management assesses the available positive and negative evidence to estimate if sufficient future taxable income will be generated to use the existing deferred tax assets. On the basis of this evaluation, as of January 1, 2017 and January 3, 2016, a valuation allowance of $36.8 million and $40.9 million, respectively, has been established to reduce the deferred tax assets to an amount that is more likely than not to be realized. We have established valuation allowances on certain deferred tax assets resulting from net operating loss carryforwards and other assets in Canada, Chile, Luxembourg, and Mexico. The amount of the deferred tax assets considered realizable, however, could be adjusted if estimates of future taxable income during the carryforward period are reduced or increased or if objective negative evidence in the form of cumulative losses is no longer present and additional weight may be given to subjective evidence such as our projections for growth.
The following is a rollforward of the valuation allowance for deferred tax assets :
Year Ended | |||||||||||
(In thousands) | January 1, 2017 | January 3, 2016 | December 28, 2014 | ||||||||
Balance at beginning of period | $ | 40,857 | $ | 35,766 | $ | 16,949 | |||||
Additions charged to expense and other | 2,433 | 27,877 | 33,678 | ||||||||
Deductions | (6,490 | ) | (22,786 | ) | (14,861 | ) | |||||
Balance at end of period | $ | 36,800 | $ | 40,857 | $ | 35,766 | |||||
97
The losses carried forward for tax purposes are available to reduce future income taxes by $172.9 million. We can apply these losses against future taxable income as follows:
(In thousands) | Canada | United States | Other Foreign | Total | |||||||||||
2017-2024 | $ | — | $ | — | $ | 2,626 | $ | 2,626 | |||||||
2025-2044 | 65,439 | 57,873 | 4,106 | 127,418 | |||||||||||
Indefinitely | — | — | 42,820 | 42,820 | |||||||||||
Total tax losses carried forward | $ | 65,439 | $ | 57,873 | $ | 49,552 | $ | 172,864 | |||||||
We believe that it is more likely than not that the benefit from certain net operating loss carryforwards will not be realized. In recognition of this risk, we have provided valuation allowances of $15.9 million in Canada and $5.9 million outside Canada on these gross operating loss carryforwards. If or when recognized, the tax benefit related to any reversal of the valuation allowance on deferred tax assets as of January 1, 2017, will be accounted for as a reduction of income tax expense.
We have outside basis differences, including undistributed earnings in our foreign subsidiaries. For those subsidiaries in which we are considered to be indefinitely reinvested, no provision for Canadian income or local country withholding taxes has been recorded. Upon reversal of the outside basis difference and/or repatriation of those earnings, in the form of dividends or otherwise, we may be subject to both Canadian income taxes and withholding taxes payable to the various foreign countries. For those subsidiaries where the earnings are not considered indefinitely reinvested, taxes have been provided as required. The determination of the unrecorded deferred tax liability for temporary differences related to investments in foreign subsidiaries that are considered to be indefinitely reinvested is not considered practical.
As of January 1, 2017 and January 3, 2016, our unrecognized tax benefits were $9.0 million and $3.4 million, respectively, excluding interest and penalties. Included in the balance of unrecognized tax benefits as of January 1, 2017 and January 3, 2016, are $2.7 million and $2.5 million, respectively, of tax benefits that, if recognized, would favorably impact the effective tax rate. The unrecognized tax benefits are recorded in other long-term liabilities and as a reduction to related long-term deferred income taxes in the consolidated balance sheets. The changes to our unrecognized tax benefits were as follows:
Year Ended | |||||||||||
(In thousands) | January 1, 2017 | January 3, 2016 | December 28, 2014 | ||||||||
Unrecognized tax benefit at beginning of period | $ | 3,382 | $ | 3,693 | $ | 3,917 | |||||
Gross increases in tax positions in current period | 5,950 | — | — | ||||||||
Gross decreases in tax positions in prior period | (335 | ) | (172 | ) | (229 | ) | |||||
Gross increases in tax positions in prior period | 271 | — | 152 | ||||||||
Settlements | — | — | — | ||||||||
Lapse of statute of limitations | (264 | ) | (139 | ) | (147 | ) | |||||
Uncertainties arising from business combinations | — | — | — | ||||||||
Cumulative translation adjustment | — | — | — | ||||||||
Unrecognized tax benefit at end of period | $ | 9,004 | $ | 3,382 | $ | 3,693 | |||||
We recognize interest and penalties accrued related to unrecognized tax benefits as income tax expense. During the years ended January 1, 2017, January 3, 2016, and December 28, 2014, we recorded accrued interest of $0.5 million, $0.5 million and $0.9 million, respectively. Additionally, we have recognized a liability for penalties of $0.5 million, $0.6 million and $0.6 million, and interest of $5.5 million, $5.0 million and $4.9 million, respectively.
We estimate that the amount of unrecognized tax benefits will not significantly increase or decrease within the 12 months following the reporting date.
98
We are subject to taxation in Canada, the United States and other foreign jurisdictions. As of January 1, 2017, our tax years for 2013 and 2012 are subject to Canadian income tax examinations. We are no longer subject to Federal tax examinations in the United States for years prior to 2013 (except to the extent of loss carryforwards up to 2011). However, we are subject to United States state and local income tax examinations for years prior to 2012.
14. Supplemental Cash Flow Information
Certain cash and non-cash transactions were as follows for the periods indicated:
Year Ended | |||||||||||
(In thousands) | January 1, 2017 | January 3, 2016 | December 28, 2014 | ||||||||
Transactions involving cash: | |||||||||||
Interest paid | $ | 26,862 | $ | 33,340 | $ | 41,719 | |||||
Interest received | 279 | 614 | 683 | ||||||||
Income taxes paid | 9,475 | 6,984 | 5,485 | ||||||||
Income tax refunds | 1,469 | 303 | 1,504 | ||||||||
Non-cash transactions: | |||||||||||
Property, plant and equipment additions in accounts payable | 7,724 | 11,417 | 3,630 | ||||||||
15. Segment Information
During the first quarter of 2016, we changed our reportable segments to align with changes in how we manage our business, review operating performance and allocate resources as a result of the deconsolidation of Africa and other internal reporting changes. All prior period information was recast to reflect this change. Our reportable segments are organized and managed principally by end market: North American Residential, Europe and Architectural. The North American Residential reportable segment is the aggregation of the Wholesale and Retail operating segments. The Europe reportable segment is the aggregation of the United Kingdom, Central Eastern Europe and France (prior to disposal) operating segments. The Architectural reportable segment consists solely of the Architectural operating segment. The Corporate & Other category includes unallocated corporate costs and the results of immaterial operating segments which were not aggregated into any reportable segment, including the historical results of our Africa operating segment. Operating segments are aggregated into reportable segments only if they exhibit similar economic characteristics. In addition to similar economic characteristics we also consider the following factors in determining the reportable segments: the nature of business activities, the management structure directly accountable to our chief operating decision maker for operating and administrative activities, availability of discrete financial information and information presented to the Board of Directors and investors.
Our management reviews net sales and Adjusted EBITDA (as defined below) to evaluate segment performance and allocate resources. Net assets are not allocated to the reportable segments. Adjusted EBITDA is a non-GAAP financial measure which does not have a standardized meaning under GAAP and is unlikely to be comparable to similar measures used by other companies. Adjusted EBITDA should not be considered as an alternative to either net income or operating cash flows determined in accordance with GAAP. Adjusted EBITDA is defined as net income (loss) attributable to Masonite adjusted to exclude the following items:
• depreciation;
• amortization;
• share based compensation expense;
• loss (gain) on disposal of property, plant and equipment;
• registration and listing fees;
• restructuring costs;
• asset impairment;
99
• loss (gain) on disposal of subsidiaries;
• interest expense (income), net;
• loss on extinguishment of debt;
• other expense (income), net;
• income tax expense (benefit);
• loss (income) from discontinued operations, net of tax; and
• net income (loss) attributable to non-controlling interest.
This definition of Adjusted EBITDA differs from the definitions of EBITDA contained in the indenture governing the 2023 Notes and the credit agreement governing the ABL Facility. Although Adjusted EBITDA is not a measure of financial condition or performance determined in accordance with GAAP, it is used to evaluate and compare the operating performance of the segments and it is one of the primary measures used to determine employee incentive compensation. Intersegment transfers are negotiated on an arm’s length basis, using market prices.
Certain information with respect to reportable segments is as follows for the periods indicated:
(In thousands) | Year Ended January 1, 2017 | ||||||||||||||||||
(In thousands) | North American Residential | Europe | Architectural | Corporate & Other | Total | ||||||||||||||
Sales | $ | 1,357,228 | $ | 305,710 | $ | 312,241 | $ | 23,607 | $ | 1,998,786 | |||||||||
Intersegment sales | (5,926 | ) | (4,543 | ) | (14,353 | ) | — | (24,822 | ) | ||||||||||
Net sales to external customers | $ | 1,351,302 | $ | 301,167 | $ | 297,888 | $ | 23,607 | $ | 1,973,964 | |||||||||
Adjusted EBITDA | $ | 212,619 | $ | 38,795 | $ | 25,160 | $ | (24,061 | ) | $ | 252,513 | ||||||||
Depreciation and amortization | 35,542 | 17,549 | 17,621 | 11,619 | 82,331 | ||||||||||||||
Interest expense (income), net | — | — | — | 28,178 | 28,178 | ||||||||||||||
Income tax expense (benefit) | — | — | — | 21,787 | 21,787 | ||||||||||||||
(In thousands) | Year Ended January 3, 2016 | ||||||||||||||||||
(In thousands) | North American Residential | Europe | Architectural | Corporate & Other | Total | ||||||||||||||
Sales | $ | 1,197,330 | $ | 312,560 | $ | 302,129 | $ | 75,081 | $ | 1,887,100 | |||||||||
Intersegment sales | (4,106 | ) | (719 | ) | (10,310 | ) | — | (15,135 | ) | ||||||||||
Net sales to external customers | $ | 1,193,224 | $ | 311,841 | $ | 291,819 | $ | 75,081 | $ | 1,871,965 | |||||||||
Adjusted EBITDA | $ | 165,560 | $ | 30,468 | $ | 23,281 | $ | (15,112 | ) | $ | 204,197 | ||||||||
Depreciation and amortization | 36,410 | 14,965 | 16,651 | 14,859 | 82,885 | ||||||||||||||
Interest expense (income), net | — | — | — | 32,884 | 32,884 | ||||||||||||||
Income tax expense (benefit) | — | — | — | 14,172 | 14,172 | ||||||||||||||
100
(In thousands) | Year Ended December 28, 2014 | ||||||||||||||||||
(In thousands) | North American Residential | Europe | Architectural | Corporate & Other | Total | ||||||||||||||
Sales | $ | 1,145,664 | $ | 326,649 | $ | 277,551 | $ | 98,366 | $ | 1,848,230 | |||||||||
Intersegment sales | (2,692 | ) | (499 | ) | (7,339 | ) | — | (10,530 | ) | ||||||||||
Net sales to external customers | $ | 1,142,972 | $ | 326,150 | $ | 270,212 | $ | 98,366 | $ | 1,837,700 | |||||||||
Adjusted EBITDA | $ | 120,944 | $ | 14,570 | $ | 19,799 | $ | (18,226 | ) | $ | 137,087 | ||||||||
Depreciation and amortization | 37,289 | 15,654 | 16,830 | 12,571 | 82,344 | ||||||||||||||
Interest expense (income), net | — | — | — | 41,525 | 41,525 | ||||||||||||||
Income tax expense (benefit) | — | — | — | 4,533 | 4,533 | ||||||||||||||
A reconciliation of our consolidated Adjusted EBITDA to net income (loss) attributable to Masonite is set forth as follows for the periods indicated:
Year Ended | |||||||||||
(In thousands) | January 1, 2017 | January 3, 2016 | December 28, 2014 | ||||||||
Adjusted EBITDA | $ | 252,513 | $ | 204,197 | $ | 137,087 | |||||
Less (plus): | |||||||||||
Depreciation | 57,604 | 59,160 | 60,622 | ||||||||
Amortization | 24,727 | 23,725 | 21,722 | ||||||||
Share based compensation expense | 18,790 | 13,236 | 9,605 | ||||||||
Loss (gain) on disposal of property, plant and equipment | 2,111 | 1,371 | 3,816 | ||||||||
Restructuring costs | 1,445 | 5,678 | 11,137 | ||||||||
Asset impairment | 1,511 | 9,439 | 18,202 | ||||||||
Loss (gain) on disposal of subsidiaries | (6,575 | ) | 59,984 | — | |||||||
Interest expense (income), net | 28,178 | 32,884 | 41,525 | ||||||||
Loss on extinguishment of debt | — | 28,046 | — | ||||||||
Other expense (income), net | (1,959 | ) | (1,757 | ) | (587 | ) | |||||
Income tax expense (benefit) | 21,787 | 14,172 | 4,533 | ||||||||
Loss (income) from discontinued operations, net of tax | 752 | 908 | 630 | ||||||||
Net income (loss) attributable to non-controlling interest | 5,520 | 4,462 | 3,222 | ||||||||
Net income (loss) attributable to Masonite | $ | 98,622 | $ | (47,111 | ) | $ | (37,340 | ) | |||
101
We derive revenues from two major product lines: interior and exterior products. We do not review or analyze our two major product lines below net sales. Additionally, we sell door components to external customers which are not otherwise consumed in our vertical operations. Sales for the product lines are summarized as follows for the periods indicated:
Year Ended | |||||||||||
(In thousands) | January 1, 2017 | January 3, 2016 | December 28, 2014 | ||||||||
Net sales to external customers: | |||||||||||
Interior products | $ | 1,378,959 | $ | 1,254,056 | $ | 1,192,817 | |||||
Exterior products | 496,617 | 475,161 | 495,445 | ||||||||
Components | 98,388 | 142,748 | 149,438 | ||||||||
Total | $ | 1,973,964 | $ | 1,871,965 | $ | 1,837,700 | |||||
Net sales information with respect to geographic areas exceeding 10% of consolidated net sales is as follows for the periods indicated:
Year Ended | |||||||||||
(In thousands) | January 1, 2017 | January 3, 2016 | December 28, 2014 | ||||||||
Net sales to external customers from facilities in: | |||||||||||
United States | $ | 1,284,982 | $ | 1,150,889 | $ | 1,073,710 | |||||
Canada | 306,130 | 275,882 | 280,276 | ||||||||
United Kingdom(1) | 262,854 | — | — | ||||||||
Other | 119,998 | 445,194 | 483,714 | ||||||||
Total | $ | 1,973,964 | $ | 1,871,965 | $ | 1,837,700 | |||||
(1) Amount was less than 10% of consolidated net sales in the years ended January 3, 2016, and December 28, 2014, and was included as part of Other.
In the years ended January 1, 2017, January 3, 2016, and December 28, 2014, net sales to The Home Depot, Inc., were $316.2 million, $302.2 million and $308.6 million, respectively, which are included in the North American Residential segment. No other individual customer's net sales exceeded 10% of consolidated net sales for any of the periods presented.
Geographic information regarding property, plant and equipment which exceed 10% of consolidated property, plant and equipment used in continuing operations is as follows as of the dates indicated:
(In thousands) | January 1, 2017 | January 3, 2016 | December 28, 2014 | ||||||||
United States | $ | 350,899 | $ | 333,822 | $ | 329,689 | |||||
Canada | 60,086 | 55,440 | 65,491 | ||||||||
Other | 131,103 | 144,972 | 181,054 | ||||||||
Total | $ | 542,088 | $ | 534,234 | $ | 576,234 | |||||
102
16. Fair Value of Financial Instruments
The carrying amounts of our cash and cash equivalents, restricted cash, accounts receivable, income taxes receivable, accounts payable, accrued expenses and income taxes payable approximate fair value because of the short-term maturity of those instruments. The estimated fair value of the 2023 Notes as of January 1, 2017, was $485.4 million, compared to a carrying value of $469.6 million, and the estimated fair value of the 2023 Notes as of January 3, 2016, was $484.3 million, compared to a carrying value of $468.8 million. This estimate is based on market quotes and calculations based on current market rates available to us and is categorized as having Level 2 valuation inputs as established by the FASB’s Fair Value Framework. Market quotes used in these calculations are based on bid prices for our debt instruments and are obtained from and corroborated with multiple independent sources. The market quotes obtained from independent sources are within the range of management’s expectations.
103
17. Earnings Per Share
Basic earnings per share ("EPS") is calculated by dividing earnings attributable to Masonite by the weighted average number of our common shares outstanding during the period. Diluted EPS is calculated by dividing earnings attributable to Masonite by the weighted average number of common shares plus the incremental number of shares issuable from non-vested and vested RSUs, SARs and warrants outstanding during the period.
(In thousands, except share and per share information) | Year Ended | ||||||||||
January 1, 2017 | January 3, 2016 | December 28, 2014 | |||||||||
Net income (loss) attributable to Masonite | $ | 98,622 | $ | (47,111 | ) | $ | (37,340 | ) | |||
Less: income (loss) from discontinued operations, net of tax | (752 | ) | (908 | ) | (630 | ) | |||||
Income (loss) from continuing operations attributable to Masonite | $ | 99,374 | $ | (46,203 | ) | $ | (36,710 | ) | |||
Shares used in computing basic earnings per share | 30,359,193 | 30,266,747 | 29,588,001 | ||||||||
Effect of dilutive securities: | |||||||||||
Incremental shares issuable under share compensation plans and warrants | 741,883 | — | — | ||||||||
Shares used in computing diluted earnings per share | 31,101,076 | 30,266,747 | 29,588,001 | ||||||||
Basic earnings (loss) per common share attributable to Masonite: | |||||||||||
Continuing operations attributable to Masonite | $ | 3.27 | $ | (1.53 | ) | $ | (1.24 | ) | |||
Discontinued operations attributable to Masonite, net of tax | (0.02 | ) | (0.03 | ) | (0.02 | ) | |||||
Total Basic earnings per common share attributable to Masonite | $ | 3.25 | $ | (1.56 | ) | $ | (1.26 | ) | |||
Diluted earnings (loss) per common share attributable to Masonite: | |||||||||||
Continuing operations attributable to Masonite | $ | 3.19 | $ | (1.53 | ) | $ | (1.24 | ) | |||
Discontinued operations attributable to Masonite, net of tax | (0.02 | ) | (0.03 | ) | (0.02 | ) | |||||
Total Diluted earnings per common share attributable to Masonite | $ | 3.17 | $ | (1.56 | ) | $ | (1.26 | ) | |||
Incremental shares issuable from anti-dilutive instruments excluded from diluted earnings per common share: | |||||||||||
Warrants | — | 2,497,971 | 2,500,001 | ||||||||
Stock appreciation rights | — | 408,682 | 584,812 | ||||||||
Restricted stock units | — | 336,673 | 388,898 | ||||||||
The weighted average number of shares outstanding utilized for the diluted EPS calculation contemplates the exercise of all currently outstanding SARs and warrants and the conversion of all RSUs. The dilutive effect of such equity awards is calculated based on the weighted average share price for each fiscal period using the treasury stock method. For all periods presented, no potential common shares relating to our equity awards were included in the computation of diluted loss per share, as their effect would have been anti-dilutive given our net loss position for those periods.
104
18. Other Comprehensive Income and Accumulated Other Comprehensive Income
A rollforward of the components of accumulated other comprehensive income (loss) is as follows for the periods indicated:
Year Ended | |||||||||||
(In thousands) | January 1, 2017 | January 3, 2016 | December 28, 2014 | ||||||||
Accumulated foreign exchange gains (losses), beginning of period | $ | (90,111 | ) | $ | (57,473 | ) | $ | (8,797 | ) | ||
Foreign exchange gain (loss) | (35,666 | ) | (63,664 | ) | (48,082 | ) | |||||
Income tax benefit (expense) on foreign exchange gain (loss) | — | 899 | (987 | ) | |||||||
Cumulative translation adjustment recognized upon deconsolidation of subsidiaries | (1,431 | ) | 29,027 | (585 | ) | ||||||
Less: foreign exchange gain (loss) attributable to non-controlling interest | 225 | (1,100 | ) | (978 | ) | ||||||
Accumulated foreign exchange gains (losses), end of period | (127,433 | ) | (90,111 | ) | (57,473 | ) | |||||
Accumulated pension and other post-retirement adjustments, beginning of period | (17,837 | ) | (18,786 | ) | (10,804 | ) | |||||
Pension and other post-retirement adjustments | (5,941 | ) | (1,826 | ) | (12,045 | ) | |||||
Income tax benefit (expense) on pension and other post-retirement adjustments | 1,578 | 820 | 4,063 | ||||||||
Amortization of actuarial net losses | 1,070 | 889 | — | ||||||||
Income tax benefit (expense) on amortization of actuarial net losses | (423 | ) | (364 | ) | — | ||||||
Pension settlement charges | — | 2,400 | — | ||||||||
Income tax benefit (expense) on pension settlement charges | — | (970 | ) | — | |||||||
Accumulated pension and other post-retirement adjustments | (21,553 | ) | (17,837 | ) | (18,786 | ) | |||||
Accumulated other comprehensive income (loss) | $ | (148,986 | ) | $ | (107,948 | ) | $ | (76,259 | ) | ||
Other comprehensive income (loss), net of tax: | $ | (40,813 | ) | $ | (32,789 | ) | $ | (57,636 | ) | ||
Less: other comprehensive income (loss) attributable to non-controlling interest | 225 | (1,100 | ) | (978 | ) | ||||||
Other comprehensive income (loss) attributable to Masonite | $ | (41,038 | ) | $ | (31,689 | ) | $ | (56,658 | ) | ||
Cumulative translation adjustments are reclassified out of accumulated other comprehensive income (loss) into loss (gain) on disposal of subsidiaries in the year ended January 1, 2017, and restructuring costs in the year ended January 3, 2016, in the consolidated statements of comprehensive income (loss). Actuarial net losses are reclassified out of accumulated other comprehensive income (loss) into cost of goods sold in the consolidated statements of comprehensive income (loss). Pension settlement charges are reclassified out of accumulated other comprehensive income (loss) into other expense (income), net, in the consolidated statements of comprehensive income (loss).
105
19. Variable Interest Entity
As of January 1, 2017, and January 3, 2016, we held an interest in one variable interest entity ("VIE"), Magna Foremost Sdn Bhd, which is located in Bintulu, Malaysia. The VIE is integrated into our supply chain and manufactures door facings. We are the primary beneficiary of the VIE based on the terms of the existing supply agreement with the VIE. As primary beneficiary via the supply agreement, we receive a disproportionate amount of earnings on sales to third parties in relation to our voting interest, and as a result, receive a majority of the VIE’s residual returns. Sales to third parties did not have a material impact on our consolidated financial statements. We also have the power to direct activities of the VIE that most significantly impact the entity’s economic performance. As its primary beneficiary, we have consolidated the results of the VIE. Our net cumulative investment in the VIE was comprised of the following as of the dates indicated:
(In thousands) | January 1, 2017 | January 3, 2016 | |||||
Current assets | $ | 6,633 | $ | 9,987 | |||
Property, plant and equipment, net | 13,673 | 15,638 | |||||
Long-term deferred income taxes | 6,505 | 9,121 | |||||
Other assets, net | 1,789 | 2,270 | |||||
Current liabilities | (2,044 | ) | (5,133 | ) | |||
Other long-term liabilities | (2,115 | ) | (2,944 | ) | |||
Non-controlling interest | (4,664 | ) | (4,981 | ) | |||
Net assets of the VIE consolidated by Masonite | $ | 19,777 | $ | 23,958 | |||
Current assets include $2.6 million and $2.1 million of cash and cash equivalents as of January 1, 2017 and January 3, 2016, respectively. Assets recognized as a result of consolidating this VIE do not represent additional assets that could be used to satisfy claims against our general assets. Furthermore, liabilities recognized as a result of consolidating these entities do not represent additional claims on our general assets; rather, they represent claims against the specific assets of the consolidated VIE.
106
Supplemental Unaudited Quarterly Financial Information
The following table sets forth the historical unaudited quarterly financial data for the periods indicated. The information for each of these periods has been prepared on the same basis as the audited consolidated financial statements and, in our opinion, reflects all adjustments necessary to present fairly our financial results. Operating results for previous periods do not necessarily indicate results that may be achieved in any future period.
Quarter Ended | |||||||||||||||
(In thousands, except per share information) | January 1, 2017 | October 2, 2016 | July 3, 2016 | April 3, 2016 | |||||||||||
Net sales | $ | 481,027 | $ | 489,647 | $ | 513,985 | $ | 489,305 | |||||||
Cost of goods sold | 384,533 | 385,845 | 402,881 | 391,060 | |||||||||||
Gross profit | 96,494 | 103,802 | 111,104 | 98,245 | |||||||||||
Selling, general and administration expenses | 63,488 | 63,017 | 68,961 | 64,898 | |||||||||||
Restructuring costs | 1,314 | 215 | (103 | ) | 19 | ||||||||||
Asset impairment | 1,511 | — | — | — | |||||||||||
Loss (gain) on disposal of subsidiaries | — | (5,144 | ) | (1,431 | ) | — | |||||||||
Operating income (loss) | 30,181 | 45,714 | 43,677 | 33,328 | |||||||||||
Interest expense (income), net | 7,028 | 6,985 | 6,933 | 7,232 | |||||||||||
Other expense (income), net | (745 | ) | (1,199 | ) | (801 | ) | 786 | ||||||||
Income (loss) from continuing operations before income tax expense (benefit) | 23,898 | 39,928 | 37,545 | 25,310 | |||||||||||
Income tax expense (benefit) | 6,196 | 6,526 | 2,855 | 6,210 | |||||||||||
Income (loss) from continuing operations | 17,702 | 33,402 | 34,690 | 19,100 | |||||||||||
Income (loss) from discontinued operations, net of tax | (144 | ) | (236 | ) | (184 | ) | (188 | ) | |||||||
Net income (loss) | 17,558 | 33,166 | 34,506 | 18,912 | |||||||||||
Less: Net income (loss) attributable to non-controlling interest | 2,128 | 1,157 | 1,151 | 1,084 | |||||||||||
Net income (loss) attributable to Masonite | $ | 15,430 | $ | 32,009 | $ | 33,355 | $ | 17,828 | |||||||
Earnings (loss) per common share attributable to Masonite: | |||||||||||||||
Basic | $ | 0.51 | $ | 1.05 | $ | 1.09 | $ | 0.58 | |||||||
Diluted | $ | 0.50 | $ | 1.03 | $ | 1.06 | $ | 0.57 | |||||||
Quarter Ended | |||||||||||||||
January 3, 2016 | September 27, 2015 | June 28, 2015 | March 29, 2015 | ||||||||||||
Net sales | $ | 485,422 | $ | 475,650 | $ | 476,428 | $ | 434,465 | |||||||
Cost of goods sold | 390,424 | 388,141 | 381,394 | 361,156 | |||||||||||
Gross profit | 94,998 | 87,509 | 95,034 | 73,309 | |||||||||||
Selling, general and administration expenses | 67,576 | 59,590 | 58,818 | 58,161 | |||||||||||
Restructuring costs | 1,195 | 1,139 | 988 | 2,356 | |||||||||||
Asset impairment | — | 9,439 | — | — | |||||||||||
Loss (gain) on disposal of subsidiaries | 30,263 | 29,721 | — | — | |||||||||||
Operating income (loss) | (4,036 | ) | (12,380 | ) | 35,228 | 12,792 | |||||||||
Interest expense (income), net | 7,165 | 7,179 | 6,787 | 11,753 | |||||||||||
Loss on extinguishment of debt | — | — | — | 28,046 | |||||||||||
Other expense (income), net | 1,782 | (1,720 | ) | (635 | ) | (1,184 | ) | ||||||||
Income (loss) from continuing operations before income tax expense (benefit) | (12,983 | ) | (17,839 | ) | 29,076 | (25,823 | ) | ||||||||
Income tax expense (benefit) | (1,595 | ) | (2,510 | ) | 15,013 | 3,264 | |||||||||
Income (loss) from continuing operations | (11,388 | ) | (15,329 | ) | 14,063 | (29,087 | ) | ||||||||
Income (loss) from discontinued operations, net of tax | (247 | ) | (192 | ) | (240 | ) | (229 | ) | |||||||
Net income (loss) | (11,635 | ) | (15,521 | ) | 13,823 | (29,316 | ) | ||||||||
Less: Net income (loss) attributable to non-controlling interest | 1,583 | 762 | 381 | 1,736 | |||||||||||
Net income (loss) attributable to Masonite | $ | (13,218 | ) | $ | (16,283 | ) | $ | 13,442 | $ | (31,052 | ) | ||||
Earnings (loss) per common share attributable to Masonite: | |||||||||||||||
Basic | $ | (0.43 | ) | $ | (0.54 | ) | $ | 0.44 | $ | (1.03 | ) | ||||
Diluted | $ | (0.43 | ) | $ | (0.54 | ) | $ | 0.42 | $ | (1.03 | ) | ||||
107
Item 9. Changes in and Disagreements with Accountants on Accounting and Financial Disclosure
On October 7, 2016, our Audit Committee approved the selection of Ernst & Young LLP to serve as our independent registered public accounting firm for the fiscal year ending December 31, 2017. There have been no disagreements, as defined in SEC Regulation S-K Item 304, with Deloitte & Touche LLP on accounting and financial disclosure during the years ended January 1, 2017, and January 3, 2016, and for the interim period through March 1, 2017. For further information, please refer to our Current Report on Form 8-K filed with the SEC on October 13, 2016.
Item 9A. Controls and Procedures
Disclosure Controls and Procedures
We maintain disclosure controls and procedures as defined in Rule 13a-15(e) under the Exchange Act that are designed to ensure that information required to be disclosed in our Exchange Act reports is recorded, processed, summarized and reported within the time periods specified in the SEC’s rules and forms and that such information is accumulated and communicated to management, including our Chief Executive Officer and Chief Financial Officer, as appropriate, to allow timely decisions regarding required disclosure.
Management, with the participation of our Chief Executive Officer and Chief Financial Officer, has evaluated the effectiveness of our disclosure controls and procedures as of the end of the period covered by this report. Based on that evaluation, the Chief Executive Officer and the Chief Financial Officer have concluded that, as of the end of the period covered by this report, our disclosure controls and procedures were effective.
Management's Annual Report on Internal Control Over Financial Reporting
Management is responsible for establishing and maintaining adequate internal control over financial reporting (as defined in Rule 13a-15(f) under the Exchange Act). Because of its inherent limitations, internal control over financial reporting may not prevent or detect misstatements. Projections of any evaluation of effectiveness to future periods are subject to the risk that controls may become inadequate because of changes in conditions or that the degree of compliance with the policies or procedures may deteriorate.
Under the supervision and with the participation of management, including our Chief Executive Officer and Chief Financial Officer, we carried out an evaluation of the effectiveness of our internal control over financial reporting as of January 1, 2017, based on the Internal Control - Integrated Framework issued by the Committee of Sponsoring Organizations of the Treadway Commission in 2013. Based upon our evaluation, management concluded that our internal control over financial reporting was effective as of January 1, 2017.
The effectiveness of our internal control over financial reporting as of January 1, 2017, has been audited by Deloitte & Touche LLP, an independent registered certified public accounting firm, as stated in their report which is included herein, and which expresses an unqualified opinion on the effectiveness of our internal control over financial reporting as of January 1, 2017. See "Report of Independent Registered Public Accounting Firm" elsewhere in this Annual Report on Form 10-K.
Changes in Internal Control over Financial Reporting
There have been no changes in our internal control over financial reporting during the most recently completed quarter covered by this Annual Report that have materially affected, or that are reasonably likely to materially affect, our internal control over financial reporting.
Item 9B. Other Information
Annual Meeting and Record Date. The Board of Directors has set the date of the 2017 Annual General Meeting of Shareholders and the related record date. The Annual General Meeting will be held in Tampa, Florida, on May 11, 2017, and the shareholders entitled to receive notice of and vote at the meeting will be the shareholders of record at the close of business on March 13, 2017.
108
PART III
Item 10. Directors, Executive Officers and Corporate Governance
Some of the information required in response to this item with regard to directors is incorporated by reference into this Annual Report on Form 10-K from our definitive Proxy Statement for our 2017 Annual General Meeting of Shareholders (the "2017 Proxy Statement"). Such information will be included under the captions "Election of Directors," "Corporate Governance; Board and Committee Matters - Certain Legal Proceedings", "Section 16(a) Beneficial Ownership Reporting Compliance," "Corporate Governance; Board and Committee Matters - Corporate Governance Guidelines and Code of Ethics", "Corporate Governance; Board and Committee Matters - Board Structure and Director Independence" and "Corporate Governance; Board and Committee Matters - Board Committees; Membership - Audit Committee".
The following table sets forth information as of March 1, 2017, regarding each of our executive officers:
Name | Age | Positions | ||
Frederick J. Lynch | 52 | President and Chief Executive Officer and Director | ||
Russell T. Tiejema | 48 | Executive Vice President and Chief Financial Officer | ||
Lawrence P. Repar * | 55 | Executive Vice President and Chief Customer Experience Officer | ||
Robert E. Lewis | 56 | Senior Vice President, General Counsel and Secretary | ||
Gail N. Auerbach | 61 | Senior Vice President, Human Resources | ||
James A. "Tony" Hair | 50 | Senior Vice President and Business Leader, Residential Door Business | ||
Elias E. Barrios ^ | 52 | Senior Vice President, Global Operations and Supply Chain | ||
____________
* Mr. Repar has notified the Company that he intends to retire from the Company on or about August 1, 2017.
^ Mr. Barrios will be leaving the Company's employment effective March 10, 2017.
Biographies
The present principal occupations and recent employment history of each of the executive officers and directors listed above are as follows:
Frederick J. Lynch, (age 52) has served as President of Masonite since July 2006 and as President and Chief Executive Officer of Masonite since May 2007. Mr. Lynch has served as a Director of Masonite since June 2009. Mr. Lynch joined Masonite from Alpharma Inc., where he served as President of the human generics division and Senior Vice President of global supply chain from 2003 until 2006. Prior to joining Alpharma Inc. in 2003, Mr. Lynch spent nearly 18 years at Honeywell International Inc. (formerly AlliedSignal Inc.), most recently as vice president and general manager of the specialty chemical business. Mr. Lynch is a Director of Ingevity Corporation.
Russell T. Tiejema, (age 48) is Executive Vice President and Chief Financial Officer of Masonite. Mr. Tiejema joined Masonite in November 2015, from Lennox International, a global leader in the heating, ventilation, air conditioning and refrigeration industry, where he served as the Vice President of Finance and Chief Financial Officer of LII Residential, the largest reporting segment of Lennox International, since 2013. From 2011 to 2013, Mr. Tiejema served as the Vice President, Business Analysis & Planning, of Lennox International. Prior to joining Lennox in 2011, Mr. Tiejema spent 20 years with General Motors in a variety of financial leadership roles across a number of operating units and staffs, including Finance Director for GM Fleet & Commercial and Director of Financial Planning and Analysis.
Lawrence P. Repar, (age 55) joined Masonite (then known as Premdor) in 1995 and has served in a variety of executive roles, most recently as Executive Vice President and Chief Customer Experience Officer. Mr. Repar has more than 20 years of experience in the door business. Prior to joining Masonite, Mr. Repar worked for Sanwa McCarthy Securities Limited from 1992 to 1995, most recently as director of institutional sales and trading focusing on companies in the building products sector. Previously, Mr. Repar owned his own window and door company in Toronto, Canada. Mr. Repar is a member of the board of trustees for All Children's Hospital, Johns Hopkins Medicine in St. Petersburg, FL and Friends of the Hospital for Sick Children in Toronto.
109
Robert E. Lewis, (age 56) has served as the Senior Vice President, General Counsel and Secretary of Masonite since April 2012. Mr. Lewis joined Masonite from Gerdau Ameristeel Corporation, a mini-mill steel producer, where he served as Vice President, General Counsel and Corporate Secretary from January 2005 to May 2011. Prior to joining Gerdau, Mr. Lewis served as Senior Vice President, General Counsel and Secretary of Eckerd Corporation, a national retail drugstore chain from 1994 to January 2005. Prior to joining Eckerd, Mr. Lewis was an attorney and shareholder with the Tampa law firm of Shackleford, Farrior, Stallings & Evans, P.A.
Gail N. Auerbach, (age 61) has served as Senior Vice President of Human Resources for Masonite since September 2007 and is responsible for Masonite’s global human resources and employee communications. Ms. Auerbach launched her 30-year career in human resources with GE, spending 10 years in progressive human resources roles in several GE business divisions. Ms. Auerbach joined the Ray Ban division of Bausch & Lomb and was promoted to vice president of human resources for the Oral Care Division in 1992. For the next 10 years, Ms. Auerbach managed the human resources function for international based businesses including the Dutch based Randstad HR Solutions from 2002 to 2006.
James A. "Tony" Hair, (age 50) joined Masonite in November 2013 as Vice President and Business Leader for the Residential Door Business and he has served most recently as Masonite’s Senior Vice President and Business Leader for the Residential Door Business since December 2015. Prior to joining Masonite, Mr. Hair was with Newell Rubbermaid from 2005 to 2013, most recently serving as Senior Vice President and General Manager of the Décor Business Unit. Mr. Hair also held executive leadership positions in the Home Solutions and Tools business groups. Prior to joining Newell Rubbermaid, Mr. Hair held various engineering, supply chain and sales positions with Maytag Corporation.
Elias E. Barrios, (age 52) joined Masonite in June 2015 as Senior Vice President, Global Operations and Supply Chain. Mr. Barrios served, most recently, as Vice President Global Operations and Supply Chain, Energy Business Unit, TE Connectivity. Prior to joining TE Connectivity, Mr. Barrios spent 14 years with Honeywell (and the former AlliedSignal) in seven progressive roles from Project Manager to Acting Vice President – Aircraft Accessories & Landing Systems. Mr. Barrios earned his BS degree in Mechanical Engineering from Metropolitan University in Caracas, Venezuela, an MS in Operations Research from Venezuela Central University and an MS in Management, Concentration in Management of Technology, at Georgia Institute of Technology in Atlanta, Georgia.
Item 11. Executive Compensation
Information required in response to this item is incorporated by reference into this Annual Report on Form 10‑K from the 2017 Proxy Statement. Such information will be included in the 2017 Proxy Statement under the captions "Director Compensation", "Compensation Committee Report", "Executive Compensation" and "Corporate Governance; Board and Committee Matters - Compensation Interlocks and Insider Participation".
Item 12. Security Ownership of Certain Beneficial Owners and Management and Related Stockholder Matters
Information required in response to this item is incorporated by reference into this Annual Report on Form 10‑K from the 2017 Proxy Statement. Such information will be included in the 2017 Proxy Statement under the captions "Security Ownership of Certain Beneficial Owners and Management" and "Securities Authorized for Issuance Under Equity Compensation Plans".
Item 13. Certain Relationships and Related Transactions, and Director Independence
Information required in response to this item is incorporated by reference into this Annual Report on Form 10‑K from the 2017 Proxy Statement. Such information will be included under the captions "Corporate Governance; Board and Committee Matters - Board Structure and Director Independence", "Corporate Governance; Board and Committee Matters - Board Committees; Membership" and "Certain Relationships and Related Party Transactions".
110
Item 14. Principal Accountant Fees and Services
Information required in response to this item is incorporated by reference into this Annual Report on Form 10‑K from the 2017 Proxy Statement. Such information will be included under the caption "Appointment of Independent Registered Public Accounting Firm".
111
PART IV
Item 15. Exhibits and Financial Statement Schedules
(a) | The following documents are filed as part of this Form 10-K: | Page No. | ||
1. | Consolidated Financial Statements: | |||
2. | Financial Statement Schedules | |||
All schedules have been omitted because they are not required, not applicable, not present in amounts sufficient to require submission of the schedule or the required information is otherwise included. | ||||
3. | See “Index to Exhibits” on pages 114 through 118, which is incorporated by reference herein. | |||
(b) | The exhibits listed on the “Index to Exhibits” on pages 114 through 118 are filed with this Form 10‑K or incorporated by reference as set forth below. | |||
(c) | Additional Financial Statement Schedules | |||
None. | ||||
112
SIGNATURES
Pursuant to the requirements of Section 13 or 15(d) of the Securities Exchange Act of 1934, the Registrant has duly caused this report to be signed on its behalf by the undersigned, thereunto duly authorized.
MASONITE INTERNATIONAL CORPORATION | ||||
(Registrant) | ||||
Date: | March 1, 2017 | By | /s/ Russell T. Tiejema | |
Russell T. Tiejema | ||||
Executive Vice President and Chief Financial Officer | ||||
(Principal Financial Officer and Principal Accounting Officer) | ||||
Pursuant to the requirements of the Securities Exchange Act of 1934, this report has been signed by the following persons on behalf of the registrant in the capacities and on the dates indicated.
Signatures | Title | Date | |||
/s/ Frederick J. Lynch | President and Chief Executive Officer and Director | March 1, 2017 | |||
Frederick J. Lynch | (Principal Executive Officer) | ||||
/s/ Russell T. Tiejema | Executive Vice President and Chief Financial Officer | March 1, 2017 | |||
Russell T. Tiejema | (Principal Financial Officer and Principal Accounting Officer) | ||||
/s/ Robert J. Byrne | Director and Chairman of the Board | March 1, 2017 | |||
Robert J. Byrne | |||||
/s/ Jody L. Bilney | Director | March 1, 2017 | |||
Jody L. Bilney | |||||
/s/ Peter R. Dachowski | Director | March 1, 2017 | |||
Peter R. Dachowski | |||||
/s/ Jonathan F. Foster | Director | March 1, 2017 | |||
Jonathan F. Foster | |||||
/s/ George A. Lorch | Director | March 1, 2017 | |||
George A. Lorch | |||||
/s/ Rick J. Mills | Director | March 1, 2017 | |||
Rick J. Mills | |||||
/s/ Francis M. Scricco | Director | March 1, 2017 | |||
Francis M. Scricco | |||||
/s/ John C. Wills | Director | March 1, 2017 | |||
John C. Wills | |||||
113
INDEX TO EXHIBITS
The following is a list of all exhibits filed or furnished as part of this report:
Exhibit No. | Description | |
3.1 | Amended and Restated Articles of Masonite International Corporation (incorporated by reference to Exhibit 3.1 to the Company's Annual Report on Form 10-K (File No. 001-11796) filed with the Securities and Exchange Commission on February 26, 2015) | |
4.1 | Indenture, dated as of March 23, 2015, by and among the Company, the guarantors named therein and Wells Fargo Bank, National Association, as trustee, governing the 5.625% Senior Notes due 2023. (incorporated by reference to Exhibit 4.1 to the Company's Current Report on Form 8-K (File No. 001-11796) filed with the Securities and Exchange Commission on March 23, 2015) | |
4.2 | Transfer Agency and Registrar Services, dated July 1, 2013, between Masonite International Corporation and American Stock Transfer & Trust Company, LLC of New York (incorporated by reference to Exhibit 4.1(j) to the Company's Annual Report on Form 10-K (File No. 001-11796) filed with the Securities and Exchange Commission on February 27, 2014) | |
4.3 | Form of Second Amended and Restated Shareholders Agreement (Incorporated by reference to Exhibit 3.2 to the Company's Current Report on Form 8-K (File No. 001-11796) filed with the Securities and Exchange Commission on May 15, 2014) | |
10.1 ^ | Masonite International Corporation 2014 Employee Stock Purchase Plan (incorporated by reference to Exhibit 10.2 to the Company's Current Report on Form 8-K (File No. 001-11796) filed with the Securities and Exchange Commission on May 15, 2014) | |
10.2 ^ | Masonite International Corporation Deferred Compensation Plan, effective as of August 13, 2012 (incorporated by reference to Exhibit 10.2 to the Company's Registration Statement on Form 10 (File No. 001-11796) filed with the Securities and Exchange Commission on August 19, 2013) | |
10.3(a) ^ | Masonite International Corporation Amended and Restated 2012 Equity Incentive Plan (incorporated by reference to Exhibit 10.2 to the Company's Current Report on Form 8-K (File No. 011-11796) filed with the Securities and Exchange Commission on May 18, 2015) | |
10.3(b) ^ | Form of Restricted Stock Unit Agreement pursuant to the Masonite International Corporation 2012 Equity Incentive Plan for United States Directors (incorporated by reference to Exhibit 10.3(b) to the Company's Registration Statement on Form 10 (File No. 001-11796) filed with the Securities and Exchange Commission on August 19, 2013) | |
10.3(c) ^ | Form of Restricted Stock Unit Agreement pursuant to the Masonite International Corporation 2012 Equity Incentive Plan for United States Employees (incorporated by reference to Exhibit 10.3(c) to the Company's Registration Statement on Form 10 (File No. 001-11796) filed with the Securities and Exchange Commission on August 19, 2013) | |
10.3(d) ^ | Form of Stock Appreciation Rights Agreement pursuant to the Masonite International Corporation 2012 Equity Incentive Plan for United States Employees (incorporated by reference to Exhibit 10.3(d) to the Company's Registration Statement on Form 10 (File No. 001-11796) filed with the Securities and Exchange Commission on August 19, 2013) | |
10.3(e) ^ | Form of Amendment to Restricted Stock Unit Agreement pursuant to the Masonite International Corporation 2012 Equity Incentive Plan (incorporated by reference to Exhibit 10.3(e) to the Company's Registration Statement on Form 10 (File No. 001-11796) filed with the Securities and Exchange Commission on August 19, 2013) | |
10.3(f) ^ | Form of Restricted Stock Unit Agreement pursuant to the Masonite International Corporation 2012 Equity Incentive Plan for United States Directors (incorporated by reference to Exhibit 10.3(h) to the Company's Quarterly Report on Form 10-Q (File No. 001-11796) filed with the Securities and Exchange Commission on November 6, 2013) | |
10.3(g) ^ | Form of Restricted Stock Unit Agreement pursuant to the Masonite International Corporation 2012 Equity Incentive Plan for United States employees (incorporated by reference to Exhibit 10.3(b) to the Company's Quarterly Report on Form 10-Q (File No. 001-11796) filed with the Securities and Exchange Commission on May 8, 2014) | |
10.3(h) ^ | Form of Performance Restricted Stock Unit Agreement pursuant to the Masonite International Corporation 2012 Equity Incentive Plan (incorporated by reference to Exhibit 10.3(f) to the Company's Quarterly Report on Form 10-Q (File No. 001-11796) filed with the Securities and Exchange Commission on May 8, 2014) | |
114
Exhibit No. | Description | |
10.3(i) ^ | Form of Restricted Stock Unit Agreement Pursuant to the Masonite International Corporation 2012 Equity Incentive Plan for United States Employees (incorporated by reference to Exhibit 10.3(k) to the Company's Annual Report on Form 10-K (File No. 001-11796) filed with the Securities and Exchange Commission on February 26, 2015) | |
10.3(j) ^ | Form of Performance Restricted Stock Unit Agreement Pursuant to the Masonite International Corporation 2012 Equity Incentive Plan for United States employees (incorporated by reference to Exhibit 10.3(f) to the Company's Annual Report on Form 10-K (File No. 001-11796) filed with the Securities and Exchange Commission on February 26, 2015) | |
10.3(k) ^ | Performance Restricted Stock Unit Agreement Pursuant to the Masonite International Corporation Amended and Restated 2012 Equity Incentive Plan, dated as of November 5, 2015, by and between Masonite International Corporation and Frederick J. Lynch (incorporated by reference to Exhibit 10.3(k) to the Company's Annual Report on Form 10-K (File No. 001-11796) filed with the Securities and Exchange Commission on March 2, 2016) | |
10.3(l) ^ | Restricted Stock Unit Agreement Pursuant to the Amended and Restated Masonite International Corporation 2012 Equity Incentive Plant, dated as of December 22, 2015, by and between Masonite International Corporation and Lawrence P. Repar (incorporated by reference to Exhibit 10.3(l) to the Company's Annual Report on Form 10-K (File No. 001-11796) filed with the Securities and Exchange Commission on March 2, 2016) | |
10.3(m) ^ | Form of Restricted Stock Unit Agreement pursuant to the Masonite International Corporation Amended and Restated 2012 Equity Incentive Plan for United States Directors (2015) (incorporated by reference to Exhibit 10.3(m) to the Company's Annual Report on Form 10-K (File No. 001-11796) filed with the Securities and Exchange Commission on March 2, 2016) | |
10.3(n) ^ | Form of Restricted Stock Unit Agreement pursuant to the Masonite International Corporation Amended and Restated 2012 Equity Incentive Plan for United States Employees (November 2015) (incorporated by reference to Exhibit 10.3(n) to the Company's Annual Report on Form 10-K (File No. 001-11796) filed with the Securities and Exchange Commission on March 2, 2016) | |
10.3(o) ^ | Form of Restricted Stock Unit Agreement pursuant to the Masonite International Corporation Amended and Restated 2012 Equity Incentive Plan for United States Employees (December 2015) (incorporated by reference to Exhibit 10.3(o) to the Company's Annual Report on Form 10-K (File No. 001-11796) filed with the Securities and Exchange Commission on March 2, 2016) | |
10.3(p) ^ | Form of Performance Restricted Stock Unit Agreement pursuant to the Masonite International Corporation Amended and Restated 2012 Equity Incentive Plan for United States Employees (February 2016) (incorporated by reference to Exhibit 10.3(p) to the Company's Annual Report on Form 10-K (File No. 001-11796) filed with the Securities and Exchange Commission on March 2, 2016) | |
10.3(q) ^ | Form of Stock Appreciation Rights Agreement pursuant to the Masonite International Corporation Amended and Restated 2012 Equity Incentive Plan for United States Employees (February 2016) (incorporated by reference to Exhibit 10.3(q) to the Company's Annual Report on Form 10-K (File No. 001-11796) filed with the Securities and Exchange Commission on March 2, 2016) | |
10.3(r) ^ | Form of Restricted Stock Unit Agreement pursuant to the Masonite International Corporation Amended and Restated 2012 Equity Incentive Plan for United States Employees (February 2016) (incorporated by reference to Exhibit 10.3(r) to the Company's Annual Report on Form 10-K (File No. 001-11796) filed with the Securities and Exchange Commission on March 2, 2016) | |
10.3(s)* ^ | Amendment No. 1 to Masonite International Corporation Amended and Restated 2012 Equity Incentive Plan dated February 7, 2017 | |
10.3(t)* ^ | Form of Performance Restricted Stock Unit Agreement pursuant to the Masonite International Corporation Amended and Restated 2012 Equity Incentive Plan for United States Employees (February 2017) | |
10.3(u)* ^ | Form of Stock Appreciation Rights Agreement pursuant to the Masonite International Corporation Amended and Restated 2012 Equity Incentive Plan for United States Employees (February 2017) | |
10.3(v)* ^ | Form of Restricted Stock Unit Agreement pursuant to the Masonite International Corporation Amended and Restated 2012 Equity Incentive Plan for United States Employees (February 2017) | |
10.4(a) ^ | Masonite Worldwide Holdings Inc. 2009 Equity Incentive Plan (incorporated by reference to Exhibit 10.4(a) to the Company's Registration Statement on Form 10 (File No. 001-11796) filed with the Securities and Exchange Commission on August 19, 2013) | |
115
Exhibit No. | Description | |
10.4(b) ^ | Form of Restricted Stock Unit Agreement Pursuant to the Masonite Worldwide Holdings Inc. 2009 Equity Incentive Plan for Directors (incorporated by reference to Exhibit 10.4(b) to the Company's Registration Statement on Form 10 (File No. 001-11796) filed with the Securities and Exchange Commission on August 19, 2013) | |
10.4(c) ^ | Form of Restricted Stock Unit Agreement Pursuant to the Masonite Worldwide Holdings Inc. 2009 Equity Incentive Plan (incorporated by reference to Exhibit 10.4(c) to the Company's Registration Statement on Form 10 (File No. 001-11796) filed with the Securities and Exchange Commission on August 19, 2013) | |
10.4(d) ^ | Form of Stock Appreciation Rights Agreement Pursuant to the Masonite Worldwide Holdings Inc. 2009 Equity Incentive Plan (incorporated by reference to Exhibit 10.4(d) to the Company's Registration Statement on Form 10 (File No. 001-11796) filed with the Securities and Exchange Commission on August 19, 2013) | |
10.4(e) ^ | Form of Restricted Stock Unit Agreement Pursuant to the Masonite Worldwide Holdings Inc. 2009 Equity Incentive Plan for United States Executives (incorporated by reference to Exhibit 10.4(e) to the Company's Registration Statement on Form 10 (File No. 001-11796) filed with the Securities and Exchange Commission on August 19, 2013) | |
10.4(f) ^ | Form of Stock Appreciation Rights Agreement Pursuant to the Masonite Worldwide Holdings Inc. 2009 Equity Incentive Plan for United States Executives (incorporated by reference to Exhibit 10.4(f) to the Company's Registration Statement on Form 10 (File No. 001-11796) filed with the Securities and Exchange Commission on August 19, 2013) | |
10.4(g) ^ | Form of Restricted Stock Unit Agreement Pursuant to the Masonite Worldwide Holdings Inc. 2009 Equity Incentive Plan (2011 Grant) (incorporated by reference to Exhibit 10.4(g) to the Company's Registration Statement on Form 10 (File No. 001-11796) filed with the Securities and Exchange Commission on August 19, 2013) | |
10.4(h) ^ | Form of Stock Appreciation Rights Agreement Pursuant to the Masonite Worldwide Holdings Inc. 2009 Equity Incentive Plan (2011 Grant) (incorporated by reference to Exhibit 10.4(h) to the Company's Registration Statement on Form 10 (File No. 001-11796) filed with the Securities and Exchange Commission on August 19, 2013) | |
10.4(i) ^ | Form of Performance Restricted Stock Unit Agreement Pursuant to the Masonite Worldwide Holdings Inc. 2009 Equity Incentive Plan (2011 Grant) (incorporated by reference to Exhibit 10.4(i) to the Company's Registration Statement on Form 10 (File No. 001-11796) filed with the Securities and Exchange Commission on August 19, 2013) | |
10.4(j) ^ | Form of Restricted Stock Unit Agreement Pursuant to the Masonite Worldwide Holdings Inc. 2009 Equity Incentive Plan for United States Executives (Exchange Agreement) (incorporated by reference to Exhibit 10.4(j) to the Company's Registration Statement on Form 10 (File No. 001-11796) filed with the Securities and Exchange Commission on August 19, 2013) | |
10.4(k) ^ | Form of Stock Appreciation Rights Agreement Pursuant to the Masonite Worldwide Holdings Inc. 2009 Equity Incentive Plan for United States Executives (Exchange Agreement) (incorporated by reference to Exhibit 10.4(k) to the Company's Registration Statement on Form 10 (File No. 001-11796) filed with the Securities and Exchange Commission on August 19, 2013) | |
10.4(l) ^ | Form of Amendment to Restricted Stock Unit Agreement Pursuant to the Masonite Worldwide Holdings Inc. 2009 Equity Incentive Plan (incorporated by reference to Exhibit 10.4(l) to the Company's Registration Statement on Form 10 (File No. 001-11796) filed with the Securities and Exchange Commission on August 19, 2013) | |
10.4(m)* ^ | Amendment No. 1 to Masonite Worldwide Holdings Inc. 2009 Equity Incentive Plan dated February 7, 2017 | |
10.5(a) ^ | Amended and Restated Employment Agreement, dated as of December 31, 2015, by and between Masonite International Corporation and Frederick J. Lynch (incorporated by reference to Exhibit 10.1 to the Company's Current Report on Form 8-K (File No. 011-11796) filed with the Securities and Exchange Commission on December 23, 2015) | |
10.5(b) ^ | Employment Agreement, dated as of December 31, 2015, by and between Masonite International Corporation and Russell T. Tiejema (incorporated by reference to Exhibit 10.4 to the Company's Current Report on Form 8-K (File No. 011-11796) filed with the Securities and Exchange Commission on December 23, 2015) | |
10.5(c) ^ | Amended and Restated Employment Agreement, dated as of December 31, 2015, by and between Masonite International Corporation and Lawrence P. Repar (incorporated by reference to Exhibit 10.2 to the Company's Current Report on Form 8-K (File No. 011-11796) filed with the Securities and Exchange Commission on December 23, 2015) | |
116
Exhibit No. | Description | |
10.5(d) ^ | Employment Agreement, dated as of December 31, 2015, by and between Masonite International Corporation and Elias E. Barrios (incorporated by reference to Exhibit 10.5(d) to the Company's Annual Report on Form 10-K (File No. 001-11796) filed with the Securities and Exchange Commission on March 2, 2016) | |
10.5(e) ^ | Amended and Restated Employment Agreement, dated as of December 31, 2015, by and between Masonite International Corporation and Robert E. Lewis (incorporated by reference to Exhibit 10.3 to the Company's Current Report on Form 8-K (File No. 011-11796) filed with the Securities and Exchange Commission on December 23, 2015) | |
10.5(f)* ^ | Employment Agreement, dated as of December 31, 2015, by and between Masonite International Corporation and James A. Hair | |
10.5(g) ^ | Offer Letter to Russell Tiejema dated September 29, 2015 (incorporated by reference to Exhibit 10.1 to the Company's Current Report on Form 8-K (File No. 011-11796) filed with the Securities and Exchange Commission on October 13, 2015) | |
10.6 ^ | Form of Director and Officer Indemnification Agreement (incorporated by reference to Exhibit 10.6 to the Company's Registration Statement on Form 10 (File No. 001-11796) filed with the Securities and Exchange Commission on August 19, 2013) | |
10.7(a) | Amended and Restated Credit Agreement, dated as of April 9, 2015, by and among Masonite International Corporation, as Canadian borrower and parent borrower, Masonite Corporation and certain other subsidiaries of Masonite Corporation, as U.S. borrowers, Wells Fargo Bank, National Association, as administrative agent and letter of credit issuer, Bank of America, N.A., as a syndication agent, Royal Bank of Canada and Deutsche Bank Securities Inc., as co-documentation agents, Wells Fargo Capital Finance, LLC, Bank of America, N.A., Royal Bank of Canada, Deutsche Bank Securities Inc. and Barclays Bank PLC, as joint lead arrangers and book managers, and the lenders from time to time party thereto. (incorporated by reference to Exhibit 4.1 to the Company's Current Report on Form 8-K (File No. 001-11796) filed with the Securities and Exchange Commission on April 14, 2015) | |
10.7(b) | U.S. Security Agreement, dated as of May 17, 2011, among Masonite Corporation, as Lead U.S. Borrower, the other U.S. Borrowers from time to time party thereto and Wells Fargo Bank, National Association, as Collateral Agent (incorporated by reference to Exhibit 4.1 (b) to the Company's Registration Statement on Form 10 (File No. 001-11796) filed with the Securities and Exchange Commission on August 19, 2013) | |
10.7(c) | U.S. Guaranty, dated as of May 17, 2011, among Masonite Corporation, as Lead U.S. Borrower, the other U.S. Borrowers from time to time party thereto and Wells Fargo Bank, National Association, as Administrative Agent (incorporated by reference to Exhibit 4.1 (c) to the Company's Registration Statement on Form 10 (File No. 001-11796) filed with the Securities and Exchange Commission on August 19, 2013) | |
10.7(d) | Canadian Security Agreement, dated as of May 17, 2011, among Masonite International Corporation, as Canadian Borrower, Masonite Inc., as Holdings, the Canadian Subsidiary Guarantors from time to time party thereto and Wells Fargo Bank, National Association, as Collateral Agent (incorporated by reference to Exhibit 4.1(d) to the Company's Registration Statement on Form 10 (File No. 001-11796) filed with the Securities and Exchange Commission on August 19, 2013) | |
10.7(e) | Canadian Guarantee, dated as of May 17, 2011, among Masonite International Corporation, as Parent Borrower, Masonite Inc., as Holdings, the Canadian Subsidiary Guarantors from time to time party thereto and Wells Fargo Capital Finance, LLC, as Administrative Agent (incorporated by reference to Exhibit 4.1(e) to the Company's Registration Statement on Form 10 (File No. 001-11796) filed with the Securities and Exchange Commission on August 19, 2013) | |
21.1* | Subsidiaries of the Registrant | |
23.1* | Consent of Deloitte & Touche LLP, an Independent Registered Public Accounting Firm | |
31.1* | Certification of Periodic Report by Chief Executive Officer under Section 302 of the Sarbanes-Oxley Act of 2002 | |
31.2* | Certification of Periodic Report by Chief Financial Officer under Section 302 of the Sarbanes-Oxley Act of 2002 | |
32.1* | Certification of Chief Executive Officer Pursuant to 18 U.S.C. Section 1350 as Adopted Pursuant to Section 906 of the Sarbanes-Oxley Act of 2002 | |
32.2* | Certification of Chief Financial Officer Pursuant to 18 U.S.C. Section 1350 as Adopted Pursuant to Section 906 of the Sarbanes-Oxley Act of 2002 | |
101.INS* | XBRL Instance Document | |
117
Exhibit No. | Description | |
101.SCH* | XBRL Taxonomy Extension Schema Document | |
101.CAL* | XBRL Taxonomy Extension Calculation Linkbase Document | |
101.DEF* | XBRL Taxonomy Extension Definition Linkbase Document | |
101.LAB* | XBRL Taxonomy Extension Label Linkbase Document | |
101.PRE* | XBRL Taxonomy Extension Presentation Linkbase Document | |
* | Filed herewith. | |
^ | Denotes management contract or compensatory plan. | |
118