Attached files
| file | filename |
|---|---|
| EX-32.2 - EXHIBIT 32.2 - KNOLL INC | knl-ex322_20161231.htm |
| EX-32.1 - EXHIBIT 32.1 - KNOLL INC | knl-ex321_20161231.htm |
| EX-31.2 - EXHIBIT 31.2 - KNOLL INC | knl-ex312_20161231.htm |
| EX-31.1 - EXHIBIT 31.1 - KNOLL INC | knl-ex311_20161231.htm |
| EX-23.1 - EXHIBIT 23.1 - KNOLL INC | ex_231.htm |
| EX-21.0 - EXHIBIT 21.0 - KNOLL INC | knl-ex21_20161231.htm |
| EX-10.8 - EXHIBIT 10.8 - KNOLL INC | knl-ex108_20161231.htm |
| EX-10.7 - EXHIBIT 10.7 - KNOLL INC | knl-ex107_20161231.htm |
| EX-10.6 - EXHIBIT 10.6 - KNOLL INC | knl-ex106_20161231.htm |
| EX-10.5 - EXHIBIT 10.5 - KNOLL INC | knl-ex105_20161231.htm |
UNITED STATES
SECURITIES AND EXCHANGE COMMISSION
Washington, D.C. 20549
FORM 10-K
ý | ANNUAL REPORT PURSUANT TO SECTION 13 OR 15(d) OF THE SECURITIES EXCHANGE ACT OF 1934 | |
For the fiscal year ended December 31, 2016 | ||
OR | ||
o | TRANSITION REPORT PURSUANT TO SECTION 13 OR 15(d) OF THE SECURITIES EXCHANGE ACT OF 1934 | |
For the transition period from to | ||
Commission File No. 001-12907
KNOLL, INC.
(Exact name of registrant as specified in its charter)
Delaware (State or other jurisdiction of incorporation or organization) | 13-3873847 (I.R.S. Employer Identification Number) | |
1235 Water Street
East Greenville, PA 18041
(215) 679-7991
(Address, including zip code, and telephone number including area code of principal executive offices)
SECURITIES REGISTERED PURSUANT TO SECTION 12(b) OF THE ACT:
Title of each class | Name of exchange on which registered | |
Common Stock, par value $0.01 per share | New York Stock Exchange | |
SECURITIES REGISTERED PURSUANT TO SECTION 12(g) OF THE ACT: NONE
Indicate by check mark if the issuer is a well-known seasoned issuer (as defined in Rule 405 of the Securities Act.) Yes ý No o
Indicate by check mark if the registrant is not required to file reports pursuant to Section 13 or Section 15(d) of the Exchange Act. Yes o No ý
Indicate by check mark whether the Registrant (1) has filed all reports required to be filed by Section 13 or 15(d) of the Securities Exchange Act of 1934 during the preceding 12 months (or for such shorter period that the Registrant was required to file such reports), and (2) has been subject to such filing requirements for the past 90 days. Yes ý No o
Indicate by check mark whether the registrant has submitted electronically and posted on its corporate Website, if any, every Interactive Data File required to be submitted and posted pursuant to Rule 405 of Regulation S-T (§232.405 of this chapter) during the preceding 12 months (or for such shorter period that the registrant was required to submit and post such files). Yes ý No o
Indicate by check mark if disclosure of delinquent filers pursuant to Item 405 of Regulation S-K is not contained herein, and will not be contained, to the best of registrant's knowledge, in definitive proxy or information statements incorporated by reference in Part III of this Form 10-K or any amendment to this Form 10-K. ý
Indicate by check mark whether the registrant is a large accelerated filer, an accelerated filer, a non-accelerated filer or a smaller reporting company. See the definitions of “large accelerated filer,” “accelerated filer” and “smaller reporting company” in Rule 12b-2 of the Exchange Act.
Large accelerated filer ý | Accelerated filer o | Non-accelerated filer o (Do not check if a smaller reporting company) | Smaller reporting company o | |||
Indicate by check mark whether the registrant is a shell company (as defined in Rule 12b-2 of the Exchange Act.) Yes o No ý
As of June 30, 2016, the aggregate market value of the registrant's common stock held by non-affiliates of the registrant was approximately $1,150,700,000 based on the closing sale price as reported on the New York Stock Exchange.
As of February 27, 2017, there were 49,050,070 shares (including 948,902 shares of non-voting restricted shares) of the Registrant's common stock, par value $0.01 per share, outstanding.
DOCUMENTS INCORPORATED BY REFERENCE
Portions of the Registrant's definitive Proxy Statement for its 2016 Annual Meeting of Stockholders are incorporated by reference into Part III of this report on Form 10-K to the extent stated therein.
TABLE OF CONTENTS
Item | Page | ||
PART I | |||
PART II | |||
PART III | |||
PART IV | |||
2
PART I
ITEM 1. BUSINESS
General
Knoll, Inc. (“Knoll,” the “Company,” “we,” “us,” “our”) is a leading manufacturer of commercial and residential furniture, accessories and coverings. We are a constellation of design-driven brands and people working with clients to create inspired modern interiors. Simply stated, we provide the furnishings and materials to help people enjoy their workplaces and homes. Our businesses share a reputation for high-quality and sophistication forming a diversified portfolio that sustain throughout evolving trends and perform throughout business cycles. To the architects and designers we work with, to our clients in the commercial, education, healthcare and government sectors, and to the many consumers we reach, Knoll represents a commitment to innovative solutions and an unmatched heritage of modern design.
How people live and work is constantly being reshaped by changing technology and lifestyle trends. Our founders, Hans and Florence Knoll, believed in the power of design to enhance people’s lives. Since our start almost 80 years ago, Knoll has won a place in iconic settings and in museums worldwide, earning numerous design honors and awards. Today, we have an unsurpassed collection of classic products to introduce, and reintroduce, as well as groundbreaking new designs. We enjoy strong relationships with many of today’s celebrated furniture and industrial designers, and a reputation that attracts new designers. Together, we work with customers to create inspired settings for work, education, hospitality and living.
We focus on two distinct “to-the-trade” specifier markets, commercial and residential. Commercial, the largest portion of our business, is where we see strategic opportunities through the expansion of underpenetrated categories and ancillary markets. At the same time, we are expanding further into consumer and decorator channels worldwide. We reach customers primarily through a broad network of independent dealers and distribution partners, through our direct sales force, and through our showrooms, as well as our online presence.
We manage our business through our reporting segments: Office, Studio, and Coverings. All unallocated expenses are included within Corporate. When we refer to our “Specialty” products or businesses, we are referring collectively to our Studio and Coverings segments.
The Office segment includes a complete range of workplace products that address diverse workplace planning paradigms. These products include systems furniture, seating, storage, tables, desks and KnollExtra® accessories, as well as the international sales of our North American Office products.
The Studio segment includes:
KnollStudio® products, including iconic seating, lounge furniture, side, cafe and dining chairs as well as conference, training, dining and occasional tables. |
DatesWeiser, known for its sophisticated meeting and conference tables and credenzas, setting a standard for design, quality and technology integration. |
HOLLY HUNT®, known for high quality residential furniture, lighting, rugs, textiles and leathers. HOLLY HUNT® includes Vladimir Kagan Design Group (“Vladimir Kagan”), a renowned collection of modern luxury furnishings. |
Knoll Europe, which distributes both KnollStudio and Knoll Office products. |
The Coverings segment includes KnollTextiles®, Spinneybeck® (including Filzfelt®), and Edelman® Leather. These businesses provide a wide range of customers with high-quality fabrics, felt, leather and related architectural products.
The Corporate function represents the accumulation of unallocated costs relating to shared services and general corporate activities including, but not limited to, legal expenses, acquisition expenses, certain finance, human resources, administrative and executive expenses and other expenses that are not directly attributable to an operating segment. Dedicated, direct selling, general and administrative expenses of the segments continue to be included within segment operating profit. As we continue to grow both organically and through acquisitions, the central support of the Corporate function will evolve and grow as well.
For further information regarding our segments see the section below, and Note 20 in the accompanying financial statements.
3
Strategy
We draw on our constellation of businesses to provide products and designs that meet the needs of our customers. Our offerings range from classic signature pieces to the recently introduced Rockwell Unscripted collection by The Rockwell Group; from dramatic fabrics, to Filzfelt architectural products for acoustical control. We solve a variety of needs for each customer, and our goal for each engagement is to maximize the opportunity from the start. To that end, we have undertaken strategic programs to better synchronize our teams and resources to deliver a single compelling customer experience. We also are investing in systems and tools for our dealer partners to make it easier to do business with Knoll.
Our growth strategy also focuses on specific international markets where we can significantly build our share, such as Canada, Mexico, Europe, the Middle East, and selected underpenetrated areas across the globe where there is a concentration of discerning clients.
Office Segment
Maximizing the sales growth and profitability of Office, our largest segment, has been a continuing priority. With respect to growth in our Office segment, a variety of initiatives have contributed to making this growth possible: broadening our workplace products portfolio; enhancing strategic sales coverage, including a focus on global accounts; and strengthening our Knoll dealer distribution network. At the same time, we aim to increase profitability through operational improvements and investments in our infrastructure. Our lean manufacturing initiative, combined with continued modernization of our facilities, is allowing us to progressively deliver on this goal.
The commercial market has shifted dramatically in the last decade. As clients are readdressing the relationship between individual and collaborative workspaces, they are reducing the footprint of individual workstations and investing in more ancillary furniture. Knoll is committed to maintaining our leadership in open plan workspaces and private offices, while inventing and innovating new ways for people to work and contributing to a larger sense of well-being. Our constellation of businesses positions us well to deliver in the evolving work environment, where people choose how and where they work throughout the day, as the traditional boundaries between residential and commercial products blur, and the importance of a total environment outshines any one particular element.
We are looking beyond traditional office product categories-systems, task seating and storage-to furniture for activity spaces and the in-between spaces where people meet. We believe that our success in our traditional office products gives us an advantage throughout the workplace. As we design new products suited to flexible spaces, we are also responding to demands at different price points with different materials and finishes. Our new Rockwell Unscripted collection, received enthusiastically at the 2016 NeoCon® national industry tradeshow, addresses the idea of a hospitality work experience. Rockwell Unscripted brings a sense of theater and play to the workplace, putting people at the center of the work life experience and creating a warm and welcoming place where people want to be. The collection encompasses six product categories ranging from seating and lounge to architectural walls and storage. It addresses those needs holistically for organizations that seek alternatives to the traditional workspace.
With the evolution from individual workstations to collaborative spaces and ancillary products, Knoll is not only expanding the breadth of our offerings through our constellation of brands but also strengthening our presence in the marketplace. We are continuing to partner with our dealers to ensure our customers understand that Knoll provides not just systems or workstations and work chairs but rather a complete family of complementary ancillary products. Together, we are meeting the demands of our customers while capturing more of their total spend and elevating the profitability of our engagements.
This approach has served as a catalyst for dealers to invest in their spaces. Their showrooms are becoming extensions of our own not just product showcases but places to find new integrated solutions from all of Knoll, such as Filzfelt architectural solutions and coverings. Dealers help people to understand workplace needs and planning capabilities, and Knoll is providing more of the training and education that helps them add value and increase their profits when they sell Knoll.
Knoll is committed to using materials and technology efficiently to conserve natural resources, developing energy-efficient processes; diverting waste generated by our operations and products; and protecting the health and safety of our associates and communities. Products that contribute to sustainable development include our GREENGUARD Children & Schools(SM) certified Generation and Remix families of chairs; and our BIFMA Level 3 certified Dividends Horizon and Antenna Workspace products. Each year we issue an Environmental Health & Safety Annual Report which tracks our pursuit of sustainability across all Knoll businesses.
Our principal Knoll Office product lines, described below, include systems furniture, seating, storage, tables, desks and KnollExtra® ergonomic accessories.
4
Systems Furniture
Our office systems furniture encompasses a range of architect and designer-oriented products at different price levels, with a variety of planning models and product features. Systems furniture comprises integrated panels or table desks, work surfaces and storage units, power and data systems, and lighting. These components can be moved, re-configured and re-used to create flexible, space-efficient work environments, tailored to each organization's personality with wide range of laminates, paints, veneers and textiles. Knoll systems can adapt to virtually any office environment, from team spaces to private executive offices. Through product line enhancements for clients to add to their installations, and through integration with other Knoll lines, we maximize the long-term value of their investment in Knoll.
Knoll systems furniture product lines include these panel, technology wall and desk-based planning models:
•Antenna® Workspaces
•AutoStrada®
•Currents®
•Dividends Horizon®
•Morrison TM
•Reff® Profiles
Seating
We constantly research and assess the general office seating market, and develop work chairs that enhance Knoll’s reputation for ergonomics, aesthetics, comfort and value. The result is an increasingly innovative, versatile seating collection consistent with the Knoll brand.
Clients evaluate work chairs based on ergonomics, aesthetics, comfort, quality and affordability-all Knoll strengths. We offer market leading, high quality office chairs at a range of price points, performance levels and materials.
In 2014, we introduced RemixTM, a new collection of chairs by Formway Design, the New-Zealand-based designers of the successful Generation by Knoll® family of chairs (see below). RemixTM pairs upholstered comfort with innovative Flex Net MatrixTM technology for active, all-day support, delivering unexpected performance in a familiar upholstered form.
Our principal seating product lines include:
•Chadwick TM
•LIFE®
•Generation by Knoll®
•MultiGeneration by Knoll®
•ReGeneration by Knoll®
Files and Storage
Our files and storage products, featuring the Template®, Calibre® and Series 2TM product lines, are designed with unique features to maximize storage capabilities throughout the workplace. Our core files and storage products consist of lateral files, mobile pedestals and other storage units, bookcases and overhead cabinets. Knoll launched AnchorTM in 2013, a streamlined collection of user-friendly storage that addresses users’ organizational needs in the changing workplace.
The range of files and storage augments our product offering, allowing clients to address all of their office furniture needs with us, especially in competitive bid situations where Knoll systems, seating, tables and desks have been specified. The breadth of the product line also enables our dealers to offer stand-alone products to businesses that have smaller storage requirements. Files and storage are available in a wide range of sizes, configurations and colors, which can be integrated with other manufacturers' stand-alone furniture. In addition, some elements of the product line can be configured as freestanding furniture in private offices or open-plan environments.
Our principal storage product lines include:
•AnchorTM
•Calibre®
•Series 2TM
•Template®
5
Desks and Tables
We offer collections of adjustable tables as well as meeting, conference, training, dining, stand-alone and table desks.
Our Tone™, Upstart® and Antenna® Simple Tables product lines include adjustable, work, meeting, conference and training tables. In 2014, we introduced Tone™, a comprehensive collection of height-adjustable tables compatible with the Dividends Horizon, Antenna Workspaces, and Reff Profiles systems. Tone™ features a wide range of support and adjustment options that integrate seamlessly with Knoll open plan, private office and activity spaces furniture, or are used independently to create flexible work areas. We also expanded the Reff Profiles product line with a series of meeting tables.
KnollExtra®
KnollExtra offers accessories that complement Knoll office furniture products, including technology support accessories, desktop organizational tools, lighting and storage. KnollExtra integrates technology comfortably into the workplace, with flat panel monitor supports and central processing unit holders that deliver adjustability and save space. Sapper Monitor Arm Collection, designed by renowned industrial designer Richard Sapper, offers a clean, modern solution to technology challenges in the modern workplace; the collection is now in the permanent collection of New York's Museum of Modern Art. KnollExtra also includes marker boards, free-standing and mounted LED lighting and other technology support for the changing workplace.
The Office segment comprised approximately 62.8% of our sales in 2016, 62.2% of our sales in 2015, and 62.5% of our sales in 2014.
Studio Segment
Our Studio segment is comprised of KnollStudio, HOLLY HUNT®, KnollEurope and DatesWeiser. The Studio portfolio includes lounge seating; side, cafe and dining chairs; barstools; and training, conference, dining and occasional tables. KnollStudio includes many of our best-known furnishings, making Knoll a renowned source of classic modern and contemporary design. HOLLY HUNT® designs, produces and showcases high quality products such as residential furniture, lighting, rugs, textiles and leathers. Our Knoll Europe business offers products designed specifically for the European market, in addition to many of our popular KnollStudio and Office products. DatesWeiser, acquired in 2016, designs and produces sophisticated meeting and conference area tables known for high quality and technological integration.
KnollStudio
KnollStudio has a long history of working with celebrated architects and designers from around the world, including Ludwig Mies van der Rohe, Marcel Breuer, Harry Bertoia, Eero Saarinen, Isamu Noguchi, Warren Platner, Frank Gehry, Maya Lin, Jens Risom, Richard Schultz, and Kazuhide Takahama. In addition, KnollStudio manufactures a collection of original furniture designs by Florence Knoll. Their iconic designs often draw designers and customers into the larger Knoll constellation of brands.
The KnollStudio strategy is to both maintain and mine revered masterpieces-reintroducing those that were discontinued and are now mid-century classics, and keeping others refreshed and relevant for contemporary audiences. We enrich this heritage by collaborating with such leading contemporary designers as Mark Krusin, Marc Newson and David Adjaye, to create future classics for residential and commercial markets.
Our principal Knoll Studio product lines include seating, lounge furniture, side, café and dining chairs as well as conference, training and occasional tables. While KnollStudio designs represent different viewpoints and eras, they all embrace a modernist aesthetic. As a result, designers can integrate our ensemble of products into harmonious and inspiring settings furnished entirely with Knoll. With the trend towards residentially-inspired workplaces, KnollStudio products have gained cross-over appeal between residential and commercial settings. KnollStudio offers unparalleled quality for workplaces, homes, hotels and restaurants, as well as government and educational institutions.
To expand our audiences, our flagship Knoll Showroom in New York City and our knoll.com website reach retail consumers and designers alike. Our Knoll Space retail sales program brings consumers the best of Knoll furnishings for their home and home office, through more than 50 specialty retailers and e-tailers, with collectively more than 90 locations in the United States and Canada.
PixelTM is one our most recent Knoll Studio offerings. Introduced in 2015 as part of the KnollStudio line, Pixel is a comprehensive collection of flexible, architecturally-inspired meeting tables. Its intuitive Pixel Connect system and a patent-pending flip mechanism make it simple to attach, separate and nest tables for various meeting and training applications. Pixel received the 2015 Best of Neocon Gold award in its category.
Pixel allows access to power wherever needed, offering a range of electrical options and the innovative Pixel Link Power System which makes it easy to connect multiple power centers.
6
HOLLY HUNT®
In 2014, we acquired the luxury design brand HOLLY HUNT®. As both a premier provider and distributor of furnishings, lighting, textiles and leathers, HOLLY HUNT® significantly expands our reach into the high-end, to-the-trade residential marketplace. Our strategy has been to extend the brand into a broader set of primary markets, opening new showrooms in Dallas, Houston, London and Los Angeles and expanding our product offerings. In 2016, HOLLY HUNT® acquired Vladimir Kagan Design Group, ensuring the legacy of the renowned designer’s iconic products for high profile interiors.
KnollEurope
Our Studio segment includes our KnollEurope business, consisting primarily of KnollStudio products, but drawing on the Knoll portfolio to give our customers a complete office environment. We also offer products designed specifically for the European market, such as the WaTM desk and storage system. Our presence in the European market positions us not only with local clients, but also with international clients who want to maintain their Knoll facility standard across offices worldwide.
Studio accounted for approximately 27.8% of our sales in 2016, 27.5% of our sales in 2015, and 26.6% of our sales in 2014.
Coverings Segment
Our Coverings segment consists of KnollTextiles, Spinneybeck | FilzFelt, and Edelman Leather.
KnollTextiles continues to extend its distribution to reach new customers, notably through a KnollTextiles showroom in New York City's D&D building and through the knolltextiles.com website. Our KT Collection of upholstery marries classic modern design for every day use, in a range of high performance patterns and textures at an affordable price. The company continues to win awards for its design excellence including Best of NeoCon® awards for eleven years running.
Spinneybeck | FilzFelt is expanding from being just a supplier of raw material to being a provider of finished products. The same trends that have been transforming KnollOffice workspaces have created new opportunities for architectural products that offer flexible space divider panels and acoustic control. Spinneybeck has evolved from being an upholstery leather company to being a natural materials company that provides architects and interior designers with architectural and acoustic solutions. Filzfelt 100% wool felt, offered in 63 colors, meets the demand for new and renewable materials, and offers unique properties as an architectural and sound absorbing product. Now we provide not only felt panels, but also the track systems to hang them on, and are exploring innovative new uses of easy-to-install cork tiles for walls or ceilings. Finished architectural products such as these offer the opportunity for more large-scale orders than does upholstery alone.
Edelman Leather is pursuing growth in offering basic, beautiful, natural leathers, and leveraging its nine US showrooms and one in London. It is the only leather-focused company with such a large showroom network. Edelman successfully expanded beyond leather coverings in its Edelman showrooms with distribution partner Ruckstuhl rugs three years ago; this year it added Kyle Bunting, a unique Texas manufacturer of handcrafted, one-of-a-kind rugs. We are also developing new leather coverings for the hospitality business, offering quality within the financial constraints of today’s hotels and restaurants.
To offset the continued downturn in its traditional aviation market, Edelman is moving to recapture residential demand with more supple, luxurious and natural leathers. We are also striving to identify new opportunities for operational efficiencies.
The Coverings segment accounted for approximately 9.4% of our sales in 2016, 10.3% of our sales in 2015, and 10.9% of our sales in 2014.
Product Design and Development
Our design philosophy and modern perspective reflects a historical commitment to partnering with preeminent industrial designers and architects to commercialize products that meet evolving workplace and residential needs. By combining designers' creative vision with our commitment to innovative materials and technologically advanced processes, we continue to cultivate brand loyalty among target clients. Our enviable history of nurturing the design process fosters strong, lasting relationships that attract the world's leading designers. In addition, these collaborations are consistent with our commitment to a lean organization and incentive-based compensation, by utilizing a variable royalty-based fee as opposed to the fixed costs typically associated with a larger in-house design staff.
Our broad range of research, which explores the connection between workspace design and human behavior; health and performance; and the quality of the user experience, informs our product development initiatives. Our most recent research identified a new way to think about space, referred to as Immersive Planning, and contributed to the development of our newest product launch - Rockwell Unscripted.
7
In addition, our Office and Studio segments product development relies upon a New Product Commercialization Process to ensure quality and consistency of our methodology, reducing product development cycle time without sacrificing quality objectives. We use Pro/ENGINEER® solids modeling tools and rapid prototyping technology to compress development cycles and to improve responsiveness to special requests for customized solutions. Working closely with the designers during the early phases of development provides critical focus to yield the most viable products, balancing innovative modern design with practical function. Cross-functional teams are employed for all major development efforts with dedicated leaders who facilitate a seamless flow into manufacturing while aggressively managing cost and schedule opportunities. Increasingly, total environmental impact is factored into product material and manufacturing process decisions.
Research and development expenses, which are expensed as incurred, were $21.7 million for 2016, $20.7 million for 2015, and $19.2 million for 2014.
Sales and Distribution
We generate sales with our direct sales force and a network of independent dealers (primarily in the Office segment), who jointly market and sell our products. We generally rely on these independent dealers to also provide a variety of important specification, installation and after-market services to our clients. Our dealers generally operate under short-term (one to three year), non-exclusive agreements. Our Studio and Coverings segments market and sell products with their own internal sales force that often work closely with our Office sales force. We also sell our KnollStudio products through a network of independent retailers. HOLLY HUNT and Edelman both operate a network of showrooms to market and sell their products.
Our clients are typically Fortune 1000 companies, governmental agencies and other medium-to-large sized organizations in a variety of industries including financial, legal, accounting, education, healthcare and hospitality. Our Coverings segment also markets and sells products to private aviation, marine and luxury coach industries. Our direct sales force and independent dealers in North America work in close partnership with clients and design professionals to specify distinctive work environments. Our direct sales representatives, in conjunction with the independent dealers, sell to and call directly on key clients. Our independent dealers also call on many other medium and small sized clients to provide seamless sales support and client service. We have an over $11.1 billion installed base of office systems, which provides a strong platform for recurring and add-on sales. “Installed base” refers to the amount of office systems product we have sold in North America during the previous fifteen years.
Our products and knowledgeable sales force have generated strong brand recognition and loyalty among architects, designers and corporate facility managers, all of whom are key decision-makers in the furniture purchasing process. Our strong relationships with architects and design professionals help us stay abreast of key workplace trends and position us to better meet the changing needs of clients. For example, we have invested in training all of our architect and designer specialists as Leadership in Energy and Environmental Design (“LEED®”) accredited professionals to help clients better address environmental issues that arise in the design of the workplace.
We have aligned our sales force to target strategic areas of opportunity to include global accounts, health care, higher education and others. We have also placed sales representatives and technical specialists into certain dealerships to support programs such as Knoll Essentials, which is described below.
In addition to coordinating sales efforts with the sales representatives, our dealers generally handle project management, installation and maintenance for client accounts after the initial product selection and sale. Although many of these dealerships also carry products of other manufacturers, they have agreed not to act as dealers for our principal direct competitors. We have not experienced significant dealer turnover. Our dealers' substantial commitment to understanding our product lines, and their strong relationships with us, serve to discourage dealers from changing vendor affiliations. We are not significantly dependent on any one dealer, the largest of which accounted for approximately 4.4%, 3.5%, and 4.3%, of our North American sales in 2016, 2015, and 2014, respectively.
As part of our commitment to building relationships with our dealers, we introduced the Knoll Essentials program in January 2004. Knoll Essentials is a catalog program developed in response to dealer requests for a consolidated, user-friendly selling tool for day-to-day systems, seating, storage, and accessory products. The Knoll Essentials program includes dealer incentives to sell our products. We also employ a dedicated team of dealer sales representatives to work with our dealerships.
Sales to U.S. and state and local government agencies, respectively, aggregated approximately 5.5% and 6.9% of our consolidated sales in 2016. The U.S. government typically can terminate or modify any of its contracts with us either for its convenience or if we default by failing to perform under the terms of the applicable contract.
8
Manufacturing and Operations
Our global supply chain manufactures and assembles products to specific customer orders and operates all facilities under a philosophy of continuous improvement and lean manufacturing. Our Office Segment is supported by sites in Canada, Michigan and Pennsylvania. The Studio Segment is supported by sites in Illinois, Italy, New York, Pennsylvania and Texas. Sites in Connecticut, New York and Pennsylvania support our Coverings Segment. In addition, we utilize many third parties to produce a variety of our Office and Studio designs.
We continue to look for ways to ensure that our manufacturing capabilities match our supply chain strategy providing the most value for Knoll. The root of our continuous improvement efforts lies in the philosophy of lean manufacturing that drives operations. As part of this philosophy, we partner with suppliers who can facilitate efficient and often just-in-time deliveries, allowing us to manage our raw materials inventory. We also utilize “Kaizen” work groups in the plants to develop best practices to minimize scrap, time and material waste at all stages of the manufacturing process. The involvement of employees at all levels ensures an organizational commitment to lean and efficient manufacturing operations. These projects improved customer responsiveness, quality and significantly improve productivity.
Raw Materials and Suppliers
In addition to the continued focus on enhancing the efficiency of the manufacturing operations, we also seek to reduce costs through our global sourcing effort. We have capitalized on raw material and component cost savings available through lower cost global suppliers. This broader view of potential sources of supply has enhanced our leverage with domestic supply sources, and we have been able to reduce cycle times by extracting improvements from all levels throughout the supply chain.
The purchasing function in North America is centralized at the East Greenville facility for Office, Studio, and Textiles. This centralization, and the close relationships with our primary suppliers, has enhanced our ability to realize purchasing economies of scale and implement “just-in-time” inventory practices. Steel, lumber, paper, paint, plastics, laminates, particleboard, veneers, glass, fabrics, leathers, upholstery filling material, aluminum extrusions and castings are used in our manufacturing process. Both domestic and overseas suppliers of these materials are selected based upon a variety of factors, with the price and quality of the materials and the supplier's ability to meet delivery requirements being primary factors in such selection. We do not generally enter into long-term supply contracts and, as a result, we can be vulnerable to fluctuations in the prices for these materials. No supplier is the only available source for a particular component or raw material. However, because of the specialization involved with some of our components, it can take a significant amount of time, money and effort to move to an alternate source.
Competition
The markets in which we compete are highly competitive. We compete on the basis of (i) product design, including performance, ergonomic and aesthetic features; (ii) product quality and durability; (iii) relationships with clients, architects and designers; (iv) strength of dealer and distributor network; (v) on-time delivery and service performance; (vi) commitment to environmental standards by offering products that help clients achieve LEED® certified facilities and minimize environmental impact; and (vii) price. We estimate that our Office segment had an approximate 7.0% and 6.7% market share in the U.S. office furniture market in 2016 and 2015, respectively.
Some of our competitors, especially those in North America, are larger and have significantly greater financial, marketing, manufacturing and technical resources than us. Our most significant competitors in primary markets are Herman Miller, Inc., Steelcase, Inc., Haworth, Inc. and, to a lesser extent, Allsteel, Inc., an operating unit of HNI Corporation, and Teknion Corporation. These competitors have a substantial volume of furniture installed at businesses throughout North America, providing a continual source of demand for further products and enhancements. Moreover, the products of these competitors have strong acceptance in the marketplace. Although we believe that we have been able to compete successfully in the markets to date, there can be no assurance that we will be able to continue to do so in the future.
Competition in the Studio and Coverings segments are much more fragmented than in the Office segment. Our Studio and Coverings businesses serve the mid-to high-end of the market, but compete against many companies, none of which has a dominant market share.
9
Patents and Trademarks
We consider securing and protecting our intellectual property rights to be important to the business. We own approximately 53 active U.S. utility patents on various components used in our products and systems and approximately 88 active U.S. design patents. We also own approximately 420 patents in various foreign countries. The scope and duration of our patent protection varies throughout the world by jurisdiction and by individual product. In particular, patents for individual products extend for varying periods of time according to the date a patent application is filed, the date a patent is granted and the term of patent protection available in the jurisdiction granting the patent (generally 20 years from the date of filing in the U.S., for example). We believe that the duration of the applicable patents we are granted is adequate relative to the expected lives of our products. We own approximately 84 trademark registrations in the U.S., including registrations to the following trademarks, as well as related stylized depictions of the Knoll word mark: Knoll®, KnollExtra®, Knoll Luxe®, KnollStudio®, KnollTextiles®, Good Design Is Good Business®, Antenna®, Autostrada®, Calibre®, Currents®, Dividends®, Edelman® Leather, Modern Always®, Propeller®, Reff®, RPM®, Sapper XYZ®, Spinneybeck® Leather, Toboggan®, Generation by Knoll®, Regeneration by Knoll®, MultiGeneration by Knoll®, Remix®, HOLLY HUNT® and VLADIMIR KAGAN®. We also own approximately 300 trademarks registered in foreign countries. The scope and duration of our trademark protection varies throughout the world, with some countries protecting trademarks only as long as the mark is used, and others requiring registration of the mark and the payment of registration (generally ten years from the date of filing in the U.S., for example). In order to protect the indefinite duration, we make filings to continue registration of our trademarks.
In October 2004, we received registered trademark protection in the United States for five iconic furniture designs by Ludwig Mies van der Rohe-the Barcelona Chair, the Barcelona Stool, the Barcelona Couch, the Barcelona Table and the Flat Bar Brno Chair. This protection recognizes the renown of these designs and reflects our commitment to ensuring that when architects, furniture retailers, businesses and individuals purchase a Ludwig Mies van der Rohe design, they are acquiring the authentic product, manufactured in accordance with the designer's historic specifications. Barcelona® is a registered trademark in the U.S., Canada and European Community owned by Knoll, Inc.
Foreign and Domestic Operations
Our principal manufacturing operations and markets are in North America, and we also have manufacturing operations and markets in Europe. Our sales to clients and net property, plant and equipment are summarized by geographic areas below. Sales are attributed to the geographic areas based on the origin of sale.
United States | Canada | Europe | Mexico | Consolidated | |||||||||||||||
2016 | |||||||||||||||||||
Sales | $ | 1,031,920 | $ | 36,813 | $ | 93,420 | $ | 2,139 | $ | 1,164,292 | |||||||||
Property, plant, and equipment, net | 157,856 | 26,452 | 12,776 | — | 197,084 | ||||||||||||||
2015 | |||||||||||||||||||
Sales | $ | 979,221 | $ | 36,163 | $ | 89,058 | $ | — | $ | 1,104,442 | |||||||||
Property, plant, and equipment, net | 137,863 | 20,919 | 13,360 | — | 172,142 | ||||||||||||||
2014 | |||||||||||||||||||
Sales | $ | 928,733 | $ | 32,811 | $ | 88,750 | $ | — | $ | 1,050,294 | |||||||||
Property, plant, and equipment, net | 123,821 | 25,669 | 15,529 | — | 165,019 | ||||||||||||||
10
Environmental Matters
We believe that we are substantially in compliance with all applicable laws and regulations for the protection of the environment and the health and safety of our employees based upon existing facts presently known to us. Compliance with federal, state, local and foreign environmental laws and regulations relating to the discharge of substances into the environment, the disposal of hazardous wastes and other related activities has had and will continue to have an impact on our operations, but has, since 1990, been accomplished without having a material adverse effect on our operations. There can be no assurance that such laws and regulations will not change in the future or that we will not incur significant costs as a result of such laws and regulations. We have trained staff responsible for monitoring compliance with environmental, health and safety requirements. Our goal is to reduce and, wherever possible, eliminate the creation of hazardous waste in our manufacturing processes. While it is difficult to estimate the timing and ultimate costs to be incurred due to uncertainties about the status of laws, regulations and technology, based on information currently known to management, we do not expect environmental costs or contingencies to have a material adverse effect on our consolidated financial position, results of operations, competitive position, or cash flows. The operation of manufacturing plants entails risks in these areas, however, and we cannot be certain that we will not incur material costs or liabilities in the future which could adversely affect our operations.
We have been identified as a potentially responsible party pursuant to the Comprehensive Environmental Response Compensation and Liability Act, or “CERCLA,” for remediation costs associated with waste disposal sites previously used by us. CERCLA can impose liability for costs to investigate and remediate contamination without regard to fault or the legality of disposal and, under certain circumstances, liability may be joint and several resulting in one responsible party being held responsible for the entire obligation. Liability may also include damages for harm to natural resources. The remediation costs and our allocated share at some of these CERCLA sites are unknown. We may also be subject to claims for personal injury or contribution relating to CERCLA sites. We reserve amounts for such matters when expenditures are probable and reasonably estimable.
Employees
As of December 31, 2016, we employed a total of 3,471 people, consisting of 2,021 hourly and 1,450 salaried employees. The Grand Rapids, Michigan plant is the only unionized plant within North America and has an agreement with the Carpenters Union, Local 1615, of the United Brotherhood of Carpenters and Joiners of America, Affiliate of the Carpenters Industrial Council (the “Union”), covering approximately 200 hourly employees. The Collective Bargaining Agreement was entered into on May 1, 2015 and expires April 2018. From time to time, there have been unsuccessful efforts to unionize at our other North American locations. We believe that relations with our employees are good. Nonetheless, it is possible that our employees may continue attempts to unionize. Certain workers in the facilities in Italy are also represented by unions.
Available Information
Our annual report on Form 10-K, quarterly reports on Form 10-Q, current reports on Form 8-K and all amendments to those reports are made available free of charge through the “Investor Relations” section of our website at www.knoll.com, as soon as practicable after such material is electronically filed with or furnished to the U.S. Securities and Exchange Commission.
11
ITEM 1A. RISK FACTORS
RISK FACTORS
Risks Related to our Business
Our product sales are tied to corporate spending and service-sector employment, which are outside of our control. Our sales and/or growth in sales would be adversely affected by a recessionary economy characterized by decreased corporate spending and service-sector employment.
Our sales are significantly impacted by the level of corporate spending primarily in North America, which, in turn, is a function of the general economic environment. In a recessionary economy, business confidence, service-sector employment, corporate cash flows and non-residential commercial construction decrease, which typically leads to a decrease in demand for furniture and our other products. In addition, a recessionary economy may also result in saturation of the market by “just new” used office systems, leading to a decrease in demand for new office systems furniture. Sales of office systems, which have historically accounted for almost half of our revenues, represent longer term and higher cost investments for our clients. As a result, sales of office systems are more severely impacted by decreases in corporate spending than sales of coverings, studio products, seating, files and storage and casegoods, and demand for office systems typically takes longer to respond to an economic recovery.
Geopolitical uncertainties, terrorist attacks, acts of war, natural disasters, increases in energy and other costs or combinations of such and other factors that are outside of our control could at any time have a significant effect on the economy, and, therefore, our business. The occurrence of any of these or similar events in the future could result in downward pressure on the economy, which we would expect to cause demand for our products to decline and competitive pricing pressures to increase.
Weakness in the economy or uncertainty in the financial markets may adversely affect our results of operations and financial condition, as well as the financial soundness of our customers and suppliers.
In recent history, the global capital and credit markets have experienced a period of unprecedented turmoil and upheaval, characterized by the bankruptcy, failure, collapse or sale of various financial institutions. Our ability to access capital could be restricted at a time when we would like, or need, to access financial markets. In addition, interest rate fluctuations, financial market volatility or credit market disruptions may negatively affect our customers' and our suppliers' abilities to obtain credit to finance their businesses on acceptable terms. As a result, our customers' needs and abilities to purchase our products or services may decrease, and our suppliers may increase their prices, reduce their output or change their terms of sale. If our customers' or suppliers' operating and financial performance deteriorates, or if they are unable to make scheduled payments or obtain credit, our customers may not be able to pay, or may delay payment of, accounts receivable owed to us, and our suppliers may restrict credit or impose different payment terms on us. Any inability of customers to pay us for our products and services, or any demands by suppliers for different payment terms, may adversely affect our earnings and cash flow.
We may have difficulty increasing or maintaining our prices as a result of price competition, which could lower our profit margins. Our competitors may develop new product designs that give them an advantage over us in making future sales.
We compete with our competitors on the basis of, among other things, price and product design. Since our competitors offer products that are similar to ours, we face significant price competition from our competitors, particularly in the Office segment. This price competition impacts our ability to implement price increases or, in some cases, maintain prices, which could lower our profit margins.
Additionally, our competitors may develop new product designs that achieve a high level of customer acceptance, which could give them a competitive advantage over us in making future sales.
Our efforts to introduce new products that meet customer and workplace requirements may not be successful, which could limit our sales growth or cause our sales to decline.
To keep pace with workplace trends, such as changes in workplace design and increases in the use of technology, and with evolving regulatory and industry requirements, including environmental, health, safety and similar standards for the workplace and for product performance, we must periodically introduce new products. The introduction of new products requires the coordination of the design, manufacturing and marketing of such products, which may be affected by factors beyond our control. The design and engineering of certain of our new products can take up to a year or more and further time may be required to achieve client acceptance. In addition, we may face difficulties in introducing new products if we cannot successfully align ourselves with independent architects and designers who are able to design, in a timely manner, high-quality products consistent with our image. Accordingly, the launch of any particular product may be later or less successful than originally anticipated by us. Difficulties or delays in introducing new products or lack of customer acceptance of new products could limit our sales growth or cause our sales to decline.
12
We may not be able to manage our business effectively if we are unable to retain our experienced management team or recruit other key personnel.
The success of our business is highly dependent upon our ability to attract and retain qualified employees and upon the ability of our senior management and other key employees to implement our business strategy. We believe there are only a limited number of qualified executives in the industry in which we compete. We rely substantially upon the services of Andrew B. Cogan, our Chief Executive Officer. The loss of the services of Mr. Cogan or other key members of our management team could seriously harm our efforts to successfully implement our business strategy.
We are dependent on the pricing and availability of raw materials and components, and price increases and unavailability of raw materials and components could lower sales, increase our cost of goods sold and reduce our profits and margins.
We require substantial amounts of raw materials, which we purchase from outside sources. Steel, plastics, wood-related materials, and leather are the main raw materials used in our products. The prices and availability of raw materials are subject to change or curtailment due to, among other things, the supply of, and demand for, such raw materials, changes in laws or regulations, including duties and tariffs, suppliers' allocations to other purchasers, interruptions in production by raw materials or component parts suppliers, changes in currency exchange rates and worldwide price levels. We can be significantly impacted by price increases in these raw materials.
Although no supplier is the only available source for a particular component or raw material, some of our products and components are extremely specialized and, therefore, it can take a significant amount of time and money to move from one supply source to another. Any failure to obtain raw materials and components on a timely basis, or any significant delays or interruptions in the supply of raw materials or components, could prevent us from being able to produce products ordered by our clients in a timely fashion, which could have a negative impact on our reputation and our dealership network, and could cause our sales to decline.
We are affected by the cost of energy and increases in energy prices could reduce our margins and profits.
The profitability of our operations is sensitive to the cost of energy through our transportation costs, the cost of petroleum-based materials, like plastics, and the cost of operating our manufacturing facilities. Energy costs have been volatile in recent years due to changes in global supply and demand. Although we have been successful in countering energy price increases, primarily through our global sourcing initiatives and continuous improvement programs, we have not been able to offset these costs entirely.
We rely upon independent furniture dealers, and a loss of a significant number of dealers could affect our business, financial condition and results of operations.
We rely on a network of independent dealers for the joint marketing of our products to small and mid-sized accounts, and to assist us in the marketing of our products to large accounts, particularly in the Office segment. We also rely upon these dealers to provide a variety of important specification, installation and after-market services to our clients. Our dealers operate, generally, under short-term, non-exclusive agreements. There is nothing to prevent our dealers from terminating their relationships with us. In addition, individual dealers may not continue to be viable and profitable and may suffer from the lack of available credit. While we are not significantly dependent on any single dealer, our largest dealer accounted for 4.4% of our North American sales in 2016, and if dealers go out of business or are restructured, we may suffer losses because they may not be able to pay us for products previously delivered to them. The loss of a dealer relationship could also negatively affect our ability to maintain market share in the affected geographic market and to compete for and service clients in that market until a new dealer relationship is established. Establishing a viable dealer in a market can take a significant amount of time and resources. The loss or termination of a significant dealer or a significant number of dealer relationships could cause significant difficulties for us in marketing and distributing our products, resulting in a decline in our sales.
Currently, one of our largest clients is the U.S. government, a relationship that is subject to uncertain future funding levels and federal procurement laws and requires restrictive contract terms; any of these factors could curtail current or future business.
For the year ended December 31, 2016, we derived approximately 5.5% and 6.9% of our revenue from sales to U.S. and state and local government agencies, respectively. Our ability to compete successfully for and retain business with the U.S. government is highly dependent on cost-effective performance and compliance with complex procurement laws. Historically, federal procurement laws required government agencies to purchase furniture products from Federal Prison Industries, Incorporated. If these or similar laws would be re-instituted, it would make it more difficult for us to sell our furniture to agencies and departments of the U.S. government.
13
In addition, the U.S. government typically can terminate or modify its contracts with us either for its convenience or if we default by failing to perform under the terms of the applicable contract. A termination arising out of our default could expose us to liability and impede our ability to compete in the future for contracts and orders. Furthermore, if we were found to have committed fraud or certain criminal offenses, we could be suspended or debarred from all further government contracting.
Given the significance of our governmental business, we are sensitive to decreases in governmental spending. Federal, state and local government budgets have experienced deficits recently and are under significant pressure to reduce spending. These spending pressures have resulted in, and may continue to result in, decreased furniture spending, which has negatively impacted (and may continue to negatively impact) our governmental sales.
Our efforts to diversify our sources of revenue may not be effective and may expose us to new risks.
Historically, the majority of our revenues were derived from the sales of office systems in North America. We have pursued a strategy to diversify our sources of revenue and reduce our dependence on North American office system sales by, for example, growing our seating, international, and specialty businesses. While we believe that this strategy enables us to better maintain and grow our sales and profitability during cyclical ups and downs in the industry, there can be no assurance that this diversification strategy will be effective in achieving these goals. Our diversification strategy involves the continued expansion of our specialty businesses, and business growth internationally, which may expose us to business risks that we have not experienced. We also may incur significant costs in pursuing our diversification strategy, and those costs may not be fully offset by increased revenues associated with new business lines.
We operate with leverage, and a significant amount of cash will be required to service our indebtedness. Restrictions imposed by the terms of our indebtedness may limit our operating and financial flexibility.
As of December 31, 2016, we had total consolidated outstanding debt of approximately $222.0 million under our credit facility.
On May 20, 2014, we amended and restated our existing credit facility, dated February 3, 2012, with a new $500.0 million credit facility maturing on May 20, 2019, consisting of a revolving commitment in the amount of $300.0 million and a term loan commitment in the amount of $200.0 million. The Amended Credit Agreement also includes an option to increase the size of the credit facility or incur incremental term loans by up to an additional $200.0 million, subject to the satisfaction of certain terms and conditions.
At December 31, 2016, if we were to borrow the maximum available to us under our credit facility and those of our foreign subsidiaries, we would have total consolidated outstanding debt of approximately $494.2 million. The high level of our indebtedness could have important consequences to holders of our common stock, given that:
•a substantial portion of our cash flow from operations must be dedicated to fund scheduled payments of principal and debt service and will not be available for other purposes;
•our ability to obtain additional debt financing in the future for working capital, capital expenditures, research and development or acquisitions may be limited by the terms of our credit facility; and
•the terms of our credit facility also impose other operating and financial restrictions on us, which could limit our flexibility in reacting to changes in our industry or in economic conditions generally.
Our credit facility prevents us and our subsidiaries from incurring any additional indebtedness other than (i) borrowings under our existing credit facility; (ii) certain types of indebtedness that may be incurred subject to aggregate dollar limitations identified in the credit facility, including, without limitation, purchase money indebtedness and capital lease obligations, indebtedness incurred in connection with a permitted acquisition, and loans obtained through an expansion of the facility, all of which cannot exceed $250.0 million at any time, and (iii) other types of indebtedness that are not limited to specific dollar limitations, such as indebtedness incurred in the ordinary course of business and unsecured, subordinated indebtedness. The aggregate amount of indebtedness that we may incur pursuant to these exceptions is further limited by the financial covenants in our credit facility and, therefore, will depend on our future results of operations and cannot be determined at this time. Furthermore, although we may incur unlimited amounts of certain types of indebtedness, subject to compliance with these financial covenants, the amount of indebtedness that we may actually be able to incur will depend on the terms on which such types of debt financing are available to us, if available at all.
As a result of the foregoing, we may be prevented from engaging in transactions that might further our growth strategy or otherwise be considered beneficial to us. A breach of any of the covenants in our credit facility could result in a default thereunder. If payments to the lenders under our credit facility were to be accelerated, our assets could be insufficient to repay in full the indebtedness under our credit facility and our other liabilities. Any such acceleration could also result in a foreclosure on all or substantially all of our subsidiaries' assets, which would have a negative impact on the value of our common stock and jeopardize our ability to continue as a going concern.
14
We may require additional capital in the future, which may not be available or may be available only on unfavorable terms.
Our capital requirements depend on many factors, including capital improvements, tooling, information technology upgrades and new product development. To the extent that our existing capital is insufficient to meet these requirements and cover any losses, we may need to raise additional funds through financings or curtail our growth and reduce our assets. Any equity or debt financing, if available at all, may be on terms that are not favorable to us. Equity financings could result in dilution to our stockholders, and the securities may have rights, preferences and privileges that are senior to those of our common stock. If our need for capital arises because of significant losses, the occurrence of these losses may make it more difficult for us to raise the necessary capital.
An inability to protect our intellectual property could have a significant impact on our business.
We attempt to protect our intellectual property rights, both in the United States and in foreign countries, through a combination of patent, trademark, copyright and trade secret laws, as well as licensing agreements and third-party nondisclosure and assignment agreements. Because of the differences in foreign trademark, copyright, patent and other laws concerning proprietary rights, our intellectual property rights do not generally receive the same degree of protection in foreign countries as they do in the United States. In some parts of the world, we have limited protections, if any, for our intellectual property. Our ability to compete effectively with our competitors depends, to a significant extent, on our ability to maintain the proprietary nature of our intellectual property. The degree of protection offered by the claims of the various patents, copyrights, trademarks and service marks may not be broad enough to provide significant proprietary protection or competitive advantages to us, and patents, copyrights, trademarks or service marks may not be issued on our pending or contemplated applications. In addition, not all of our products are covered by patents or similar intellectual property protections. It is also possible that our patents, copyrights, trademarks and service marks may be challenged, invalidated, canceled, narrowed or circumvented.
In the past, certain of our products have been copied and sold by others. We try to enforce our intellectual property rights, but we have to make choices about where and how we pursue enforcement and where we seek and maintain intellectual property protection. In many cases, the cost of enforcing our rights is substantial, and we may determine that the costs of enforcement outweigh the potential benefits. If we are unable to maintain the proprietary nature of our intellectual property with respect to our significant current or proposed products, our competitors may be able to sell copies of our products, which could adversely affect our ability to sell our original products and could also result in competitive pricing pressures, which may negatively affect our profitability.
If third parties claim that we infringe upon their intellectual property rights, we may incur liabilities and costs and may have to redesign or discontinue an infringing product.
We face the risk of claims that we have infringed upon third parties' intellectual property rights. Companies operating in our industry routinely seek patent protection for their product designs, and many of our principal competitors have large patent portfolios. Prior to launching major new products in our key markets, we normally evaluate existing intellectual property rights. However, our competitors may have filed for patent protection which is not, at the time of our evaluation, a matter of public knowledge. Our efforts to identify and avoid infringing upon third parties' intellectual property rights may not be successful. Any claims of patent or other intellectual property infringement, even those without merit, could (i) be expensive and time consuming to defend; (ii) cause us to cease making, licensing or using products that incorporate the challenged intellectual property; (iii) require us to redesign, reengineer, or rebrand our products or packaging, if feasible; or (iv) require us to enter into royalty or licensing agreements in order to obtain the right to use a third party's intellectual property.
15
We could be required to incur substantial costs to comply with environmental requirements. Violations of, and liabilities under, environmental laws and regulations may increase our costs or require us to change our business practices.
Our past and present ownership and operation of manufacturing plants are subject to extensive and changing federal, state, local and foreign environmental laws and regulations, including those relating to discharges to air, water and land, the handling and disposal of solid and hazardous waste and the cleanup of properties affected by hazardous substances. As a result, we are involved from time to time in administrative and judicial proceedings and inquiries relating to environmental matters and could become subject to fines or penalties related thereto. We cannot predict what environmental legislation or regulations will be enacted in the future, how existing or future laws or regulations will be administered or interpreted or what environmental conditions may be found to exist. Compliance with more stringent laws or regulations, or stricter interpretation of existing laws, may require additional expenditures by us, some of which may be material. We have been identified as a potentially responsible party pursuant to the Comprehensive Environmental Response, Compensation and Liability Act of 1980, or CERCLA, for remediation costs associated with waste disposal sites previously used by us. In general, CERCLA can impose liability for costs to investigate and remediate contamination without regard to fault or the legality of disposal and, under certain circumstances, liability may be joint and several, resulting in one party being held responsible for the entire obligation. Liability may also include damages for harm to natural resources. The remediation costs and our allocated share at some of these CERCLA sites are unknown. We may also be subject to claims for personal injury or contribution relating to CERCLA sites. We reserve amounts for such matters when expenditures are probable and reasonably estimable.
We are subject to potential labor disruptions, which could have a significant impact on our business.
Certain of our employees located in Grand Rapids, Michigan and Italy are represented by unions. The collective bargaining agreement for our Grand Rapids location expires April 28, 2018. We have also had attempts to unionize our other North American manufacturing locations, which to date have been unsuccessful. We have experienced a number of brief work stoppages at our facilities in Italy as a result of national and local issues. While we believe that we have good relations with our workforce, we may experience work stoppages or other labor problems in the future, and further unionization efforts may be successful. Any prolonged work stoppage could have an adverse effect on our reputation, our vendor relations and our dealership network. Moreover, because substantially all of our products are manufactured to order, we do not carry finished goods inventory that could mitigate the effects of a prolonged work stoppage.
Product defects could adversely affect our results of operations.
Our customers may encounter product defects that could potentially arise in the course of our development of new products or due to manufacturing problems. If product defects do arise, we could incur product warranty costs, product liability costs and costs associated with recalling and repairing defective products. While we maintain a reserve for our product warranty costs based on estimates of the costs that may be incurred under the warranties on all of our products, our actual warranty costs may exceed this reserve, resulting in a need to increase the amounts accrued for warranty costs. We also maintain product liability and other insurance coverage that we believe to be generally in accordance with industry practices, but our insurance coverage does not extend to field visits to repair, retrofit or replace defective products, or to product recalls. As a result, our insurance coverage may not be adequate to protect us fully against substantial claims and costs that may arise from product defects, particularly if we have a large number of defective products that we must repair, retrofit, replace or recall. Sales of our products could be adversely affected by excessive warranty claims, product recalls and adverse perceptions of product quality. As a result of these factors, product defects could have a material adverse effect on our results of operations.
We may be vulnerable to the effects of currency exchange rate fluctuations, which could increase our expenses.
We primarily sell our products and report our financial results in U.S. dollars, but we generate some of our revenues and pay some of our expenses in other currencies. Paying our expenses in other currencies can result in a significant increase or decrease in the amount of those expenses in U.S. dollar terms, which affects our profits.
In the future, any foreign currency appreciation relative to the U.S. dollar would increase our expenses that are denominated in that currency. Additionally, as we report currency in the U.S. dollar, our financial position is affected by the strength of the currencies in countries where we have operations relative to the strength of the U.S. dollar. The principal foreign currencies in which we conduct business are the Canadian dollar and the Euro. Approximately 11.4% of our revenues in 2016 and 26.6% of our cost of goods sold in 2016 were denominated in currencies other than the U.S. dollar. From time to time, we review our foreign currency exposure and evaluate whether we should hedge our exposure.
16
Pension costs or funding requirements could increase at a higher-than-anticipated rate.
We administer two defined benefit pension plans, which hold significant amounts of equity securities. Changes in interest rates or other plan assumptions or in the market value of plan assets could affect the funded status of our pension plans. This could cause volatility in our benefits costs which could increase future funding requirements of our pension plans and have a negative impact on our results of operations, financial condition and cash flows. Our future funding obligations also are affected by the Pension Protection Act of 2006 (“PPA”), which established certain required funding targets. Volatility in the economic environment and/or a decline in the equity markets could cause the value of investment assets held by our pension plans to decline. As a result, we may be required to increase the amount of our cash contributions to our pension plans in order to meet the funding level requirements of the PPA.
If we fail to protect the integrity and security of our information technology systems and confidential information, it could adversely affect our business.
We rely upon information technology networks and systems to process, transmit and store electronic information, and to manage numerous aspects of our business and provide information to management. We also receive certain customer-specific data, including credit card information, in connection with orders placed through our various businesses, including our e-commerce websites and our retail store. The secure operation of these information technology systems, and the processing and maintenance of this information, is critical to our business operations and strategy. These systems are vulnerable to, among other things, damage and interruption from power loss or natural disasters, computer system and network failures, loss of telecommunications services, physical and electronic loss of data, security breaches, hackers and employee misuse. We may face unauthorized attempts by hackers seeking to harm us or, as a result of industrial espionage, to penetrate our network security and gain access to our systems, steal intellectual or other proprietary data, including design, sales or personally identifiable information, introduce malicious software or interrupt our internal systems, manufacturing or distribution. Though we attempt to prevent and detect these incidents, we may not be successful. Any disruption of our information technology systems, or access to or disclosure of information stored in or transmitted by our systems, could result in legal claims and damages, loss of intellectual property or other proprietary information (including customer data), disrupt operations, result in competitive disadvantage and damage our reputation, which could adversely affect our business and results of operations.
In addition, states and the federal government are increasingly enacting laws and regulations to protect consumers against identity theft. Also, as our business expands globally, we are subject to data privacy and other similar laws in various foreign jurisdictions. If we are the target of a cybersecurity attack resulting in unauthorized disclosure of our customer data, we may be required to undertake costly notification procedures. Compliance with these laws will likely increase the costs of doing business. Further, if we fail to implement appropriate safeguards or to detect and provide prompt notice of unauthorized access as required by some of these laws, we could be subject to potential claims for damages and other remedies, which could harm our business.
We are in the process of implementing a new enterprise resource planning system, and problems with the design or implementation of this system could interfere with our business and operations.
We are engaged in a multi-year implementation of a new global enterprise resource planning system (ERP). The ERP is designed to accurately maintain the company's books and records and provide information to the company's management team important to the operation of the business. The company's ERP has required, and will continue to require, the investment of significant human and financial resources. We may not be able to successfully implement the ERP without experiencing delays, increased costs and other difficulties. If we are unable to successfully design and implement the new ERP system as planned, our financial positions, results of operations and cash flows could be negatively impacted.
We may not be able to successfully integrate acquired businesses, which may result in an inability to realize the anticipated benefits of our acquisitions.
One of our key operating strategies is to selectively pursue acquisitions. We have made a number of acquisitions in the past and we expect that a portion of our future growth may come from such transactions. We evaluate potential acquisitions on an ongoing basis. However, we may not be able to identify suitable acquisition candidates at prices we consider attractive. Further, our ability to successfully integrate acquired businesses could be negatively impaired because of difficulties, costs and delays that may include:
•Negative impacts on employee morale and performance as a result of job changes and reassignments;
• | Unforeseen difficulties, costs or complications in integrating the companies' operations, which could lead to us not achieving the synergies we anticipate; |
•Unanticipated incompatibility of systems and operating methods;
• | Resolving possible inconsistencies in standards, controls, procedures and policies, business cultures and compensation structures; |
17
•The diversion of management's attention from ongoing business concerns and other strategic opportunities;
•Unforeseen difficulties in operating acquired business in parallel with similar businesses that we operated previously;
•Unforeseen difficulties in operating businesses we have not operated before;
•Unanticipated difficulty of integrating multiple acquired businesses simultaneously;
•The retention of key employees and management of acquired businesses;
•The coordination of geographically separate organizations;
•The coordination and consolidation of ongoing and future research and development efforts; and
•Possible tax costs or inefficiencies associated with integrating the operations of a combined company.
In connection with any acquisition that we make, there may be liabilities that we fail to discover or that we inadequately assess. Acquired entities may not operate profitably or result in improved operating performance. Additionally, we may not realize anticipated synergies. If our acquisitions perform poorly, our business and financial results could be adversely affected.
The new Administration may make substantial changes to fiscal and tax policies that may adversely affect our business.
The new Administration has called for substantial change to fiscal and tax policies, which may include comprehensive tax reform. We cannot predict the impact, if any, of these changes to our business. However, it is possible that these changes could adversely affect our business. It is likely that some policies adopted by the new administration will benefit us and others will negatively affect us. Until we know what changes are enacted, we will not know whether in total we benefit from, or are negatively affected by, the changes.
Any attempt by the new Administration to withdraw from or materially modify NAFTA and certain other international trade agreements could adversely affect our business, financial condition and results of operations.
A significant portion of our business activities are conducted in foreign countries, including Canada and Mexico. The new Administration has made comments suggesting that certain existing international trade agreements may change, including the North American Free Trade Agreement (“NAFTA”). At this time, it remains unclear what the new Administration will or will not do with respect to these international trade agreements. If the new Administration takes action to withdraw from or materially modify NAFTA or certain other international trade agreements, our business, financial condition and results of operations could be adversely affected.
Risks Related to Our Common Stock
Our corporate documents and Delaware law contain provisions that could discourage, delay or prevent a change in control of our company.
Provisions in our amended and restated certificate of incorporation and bylaws may discourage, delay or prevent a merger or acquisition involving us that our stockholders may consider favorable. For example, our amended and restated certificate of incorporation authorizes our board of directors to issue up to 10,000,000 shares of “blank check” preferred stock. Without stockholder approval, the board of directors has the authority to attach special rights, including voting and dividend rights, to this preferred stock. With these rights, preferred stockholders could make it more difficult for a third party to acquire us. In addition, our amended and restated certificate of incorporation provides for a staggered board of directors, whereby directors serve for three-year terms, with approximately one-third of the directors coming up for reelection each year. Having a staggered board will make it more difficult for a third party to obtain control of our board of directors through a proxy contest, which may be a necessary step in an acquisition of us that is not favored by our board of directors.
We are also subject to the anti-takeover provisions of Section 203 of the Delaware General Corporation Law. Under these provisions, if anyone becomes an “interested stockholder,” we may not enter into a “business combination” with that person for three years without special approval, which could discourage a third party from making a takeover offer and could delay or prevent a change of control. For purposes of Section 203, “interested stockholder” means, generally, someone owning 15% or more of our outstanding voting stock or an affiliate of ours that owned 15% or more of our outstanding voting stock during the past three years, subject to certain exceptions as described in Section 203. Upon any change in control, the lenders under our credit facility would have the right to require us to repay all of our outstanding obligations under the facility.
18
Our stock price may be volatile, and your investment in our common stock could suffer a decline in value.
There has been significant volatility in the market price and trading volume of equity securities, which may be unrelated to the financial performance of the companies issuing the securities. These broad market fluctuations may negatively affect the market price of our common stock. You may not be able to resell your shares at or above the price at which you purchased them due to fluctuations in the market price of our common stock caused by changes in our operating performance or prospects and other factors. Some specific factors that may have a significant effect on our common stock market price include:
• | actual or anticipated fluctuations in our operating results or future prospects, including actual or perceived fluctuations in the demand for our products; |
•our announcements or our competitors' announcements of new products;
•the public's reaction to our press releases, our other public announcements and our filings with the SEC;
•strategic actions by us or our competitors, such as acquisitions, joint ventures, strategic investments, or restructurings;
•new laws or regulations or new interpretations of existing laws or regulations applicable to our business;
•changes in accounting standards, policies, guidance, interpretations or principles;
•changes in our growth rates or our competitors' growth rates;
•our inability to raise additional capital;
• | conditions of our industry as a result of changes in financial markets or general economic conditions, including those resulting from war, incidents of terrorism and responses to such events; |
•sales of common stock by us or members of our management team; and
• | changes in stock market analyst recommendations or earnings estimates regarding our common stock, other comparable companies or our industry generally. |
19
ITEM 1B. UNRESOLVED STAFF COMMENTS
None
ITEM 2. PROPERTIES
We operate over 3,978 thousand square feet of facilities, including manufacturing plants, warehouses and sales offices. Of these facilities, we own approximately 2,396 thousand square feet and lease approximately 1,582 thousand square feet. Our manufacturing plants are located in East Greenville, Pennsylvania, Grand Rapids and Muskegon, Michigan, Chicago, Illinois, Dallas, Texas, Toronto, Canada, and Foligno and Graffignana, Italy. The location, square footage, and use of the facilities as of December 31, 2016 are shown below.
Owned Locations | Square Footage (in thousands) | Use | Reporting Segment | ||
East Greenville, Pennsylvania | 735 | (1) | Corporate Headquarters, Manufacturing, Warehouses, and Administration | Office, Studio and Coverings | |
Grand Rapids, Michigan | 534 | (1) | Manufacturing, Distribution, and Administration | Office | |
Toronto, Canada | 386 | Manufacturing, Distribution, Warehouses, and Administration | Office | ||
Muskegon, Michigan | 367 | (1) | Manufacturing and Administration | Office | |
Foligno, Italy | 259 | Manufacturing, Distribution, Warehouses, and Administration | Studio | ||
Graffignana, Italy | 108 | Manufacturing, Distribution, Warehouses, and Administration | Studio | ||
Paris, France | 7 | Sales Offices | Studio | ||
Leased Locations | Square Footage (in thousands) | Use | Reporting Segment | ||
Miscellaneous Showrooms | 499 | Sales Offices | Office, Studio, and Coverings | ||
Allentown, Pennsylvania | 290 | Warehouse, Distribution | Office and Studio | ||
Toronto, Canada | 180 | Manufacturing, Warehouses, Distribution and Administration | Office | ||
Bedford Park, Illinois | 135 | Warehouse, Distribution (Holly Hunt Enterprises) | Studio | ||
Muskegon, Michigan | 105 | Manufacturing | Office | ||
Buffalo, New York | 89 | Manufacturing and Administration (DatesWeiser) | Studio | ||
New Milford, Connecticut | 55 | Manufacturing and Administration (Edelman Leather) | Coverings | ||
Getzville, New York | 45 | Manufacturing and Administration (Spinneybeck) | Coverings | ||
Knoll, Europe—various locations | 41 | Sales Offices, Administration, and Warehouses | Studio | ||
East Greenville, Pennsylvania | 40 | Warehouses, Distribution | Office and Studio | ||
Chicago, Illinois | 34 | Warehouse, Distribution (Holly Hunt Enterprises) | Studio | ||
Dallas, Texas | 30 | Warehouse, Distribution (Holly Hunt Enterprises) | Studio | ||
Chicago, Illinois | 26 | Administration (Holly Hunt Enterprises) | Studio | ||
Clifton, New Jersey | 13 | Warehouse, Distribution (Holly Hunt Enterprises) | Studio | ||
(1) Facilities are encumbered by mortgages securing indebtedness under our credit facility.
We believe that our plants and other facilities are sufficient for our needs for the foreseeable future.
20
ITEM 3. LEGAL PROCEEDINGS
From time to time, we are subject to litigation or other legal proceedings arising in the ordinary course of business. Based upon information currently known to us, we believe the outcome of such proceedings will not have, individually or in the aggregate, a material adverse effect on our business, financial condition or results of operations.
ITEM 4. MINE SAFETY DISCLOSURES
Not applicable.
21
PART II
ITEM 5. MARKET FOR REGISTRANT'S COMMON EQUITY, RELATED STOCKHOLDER MATTERS AND ISSUER PURCHASES OF EQUITY SECURITIES
Market Information and Dividend Policy
Our common stock has been listed on the New York Stock Exchange (“NYSE”) since December 14, 2004, the date of our initial public offering, under the symbol “KNL.” As of December 31, 2016, there were approximately 121 stockholders of record of our common stock.
The following table sets forth, for the periods indicated, high and low sales prices for the common stock as reported by the NYSE.
High | Low | |||||||
Fiscal year ended December 31, 2016 | ||||||||
First quarter | $ | 21.93 | $ | 16.42 | ||||
Second quarter | $ | 25.46 | $ | 21.10 | ||||
Third quarter | $ | 26.76 | $ | 22.17 | ||||
Fourth quarter | $ | 28.40 | $ | 20.37 | ||||
High | Low | |||||||
Fiscal year ended December 31, 2015 | ||||||||
First quarter | $ | 23.53 | $ | 19.20 | ||||
Second quarter | $ | 26.06 | $ | 22.00 | ||||
Third quarter | $ | 25.49 | $ | 21.81 | ||||
Fourth quarter | $ | 24.87 | $ | 18.29 | ||||
We declared and paid cash dividends of $0.60 and $0.51 per share for the years ended December 31, 2016 and 2015, respectively. On February 7, 2017, our board of directors declared a cash dividend of $0.15 per share on our common stock payable on March 31, 2017 to shareholders of record on March 15, 2017. The declaration and payment of future dividends is subject to the discretion of our board of directors and depends on various factors, including our net income, financial condition, cash requirements and future prospects and other factors deemed relevant by our board of directors. Our credit facility imposes restrictions on our ability to pay dividends, and thus our ability to pay dividends on our common stock will depend upon, among other things, our level of indebtedness at the time of the proposed dividend and whether we are in default under any of our debt obligations. Our ability to pay dividends will also depend on the requirements of any future financing agreements to which we may be a party. Our board of directors intends to evaluate our dividend policy quarterly in reference to these factors.
Performance Graph
The following line graph compares the cumulative total stockholder return on our common stock with the cumulative total return of the Standard & Poor's 500 Stock Index and with the cumulative total return of a peer group of companies selected by us for the period commencing on December 31, 2011 and ending on December 31, 2016. Our share price at the beginning of the measurement period is $14.85 per share. The graph and table assume that $100 was invested on December 31, 2011 in each of our common stock, the stock of our peer group, and the S&P 500 Index, and that all dividends were reinvested. Cumulative total stockholder returns for our common stock, the S&P 500 Index, and the stock of our peer group are based on our fiscal year. Our peer group is made up of six publicly-held companies, Herman Miller, Inc., Steelcase, Inc., HNI Corp, Kimball International Inc., Interface Inc., and Movado Group Inc. The stock performance on the graph below does not necessarily indicate future price performance.
22
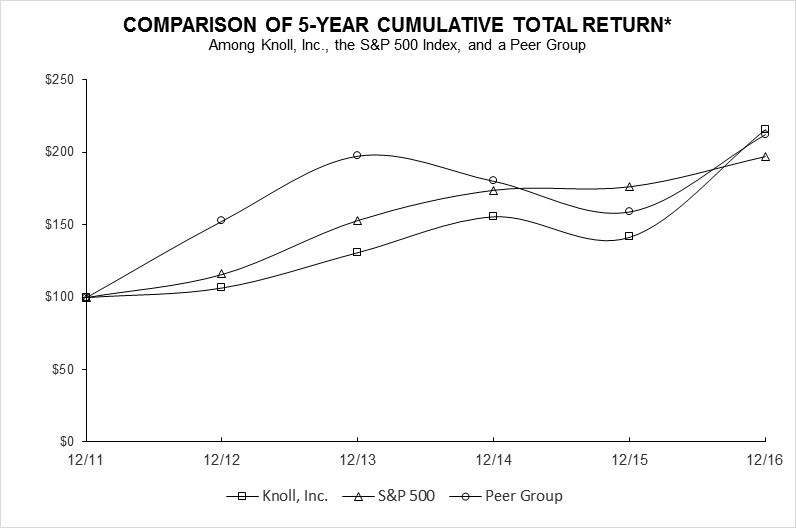
$100 invested on 12/31/11 in stock or index, including reinvestment of dividends. Fiscal year ending December 31.
12/11 | 12/12 | 12/13 | 12/14 | 12/15 | 12/16 | ||||||||||||
Knoll, Inc. | 100.00 | 106.64 | 130.97 | 155.54 | 141.44 | 215.52 | |||||||||||
S&P 500 | 100.00 | 115.88 | 153.01 | 173.69 | 176.07 | 196.78 | |||||||||||
Peer Group | 100.00 | 152.72 | 197.43 | 180.02 | 158.99 | 212.24 | |||||||||||
* The performance graph and the related chart should not be deemed filed for purposes of Section 18 of the Securities Exchange Act of 1934 or incorporated by reference into any of our filings under the Securities Act of 1933 or the Securities Exchange Act of 1934, unless we specifically incorporate the performance graph by reference therein.
23
Issuer Purchases of Equity Securities
The following is a summary of share repurchase activity during the three months ended December 31, 2016.
On August 17, 2005, our board of directors approved a stock repurchase program (the “Options Proceeds Program”), whereby they authorized us to purchase shares of our common stock in the open market using the cash proceeds received by us upon exercise of outstanding options.
On February 2, 2006, our board of directors approved an additional stock repurchase program, pursuant to which we are authorized to purchase up to $50.0 million of our common stock in the open market, through privately negotiated transactions, or otherwise. On February 4, 2008, our board of directors expanded this previously authorized $50.0 million stock repurchase program by an additional $50.0 million.
Period | Total Number of Shares Purchased | Average Price Paid Per Share | Total Number of Shares Purchased as Part of Publicly Announced Plans or Programs | Maximum Dollar Value of Shares that May Yet be Purchased Under the Plans or Programs(1) | |||||||||||
October 1, 2016 - October 31, 2016 | 33,517 | (2) | $ | 21.13 | 8,891 | (3) | $ | 32,352,413 | |||||||
November 1, 2016 - November 30, 2016 | — | $ | — | — | $ | 32,352,413 | |||||||||
December 1, 2016 - December 31, 2016 | 8,825 | (2) | $ | 27.84 | — | $ | 32,352,413 | ||||||||
Total | 42,342 | 8,891 | |||||||||||||
(1) There is no limit on the number or value of shares that may be purchased by us under the Options Proceeds Program. Under our $50.0 million stock repurchase program, which was expanded by an additional $50.0 million in February 2008, we are only authorized to spend an aggregate of $100.0 million on stock repurchases. Amounts in this column represent the amounts that remain available under the $100.0 million stock repurchase program as of the end of the period indicated. There is no scheduled expiration date for the Option Proceeds Program or the $100.0 million stock repurchase program, but our Board of Directors may terminate either program in the future.
(2) In October and December 2016, 51,667 and 18,742 shares of outstanding restricted stock vested, respectively. Concurrently with the vestings, 24,626 and 8,825 shares, respectively, were forfeited by the holders of the restricted shares to cover applicable taxes paid on the holders' behalf by the Company.
(3) These shares were purchased under the Options Proceeds Program.
ITEM 6. SELECTED FINANCIAL DATA
The following selected consolidated financial data should be read in conjunction with “Management's Discussion and Analysis of Financial Condition and Results of Operations” and our audited consolidated financial statements and the related notes included elsewhere in this Form 10-K. The selected consolidated financial data for the years ended December 31, 2014, 2015 and 2016 and as of December 31, 2015 and 2016 are derived from our audited financial statements included elsewhere in this Form 10-K. The selected consolidated financial data for the years ended December 31, 2012 and 2013 and as of December 31, 2012, 2013 and 2014 are derived from our audited financial statements not included in this Form 10-K.
24
Consolidated Statements of Operations and Comprehensive Income Data | |||||||||||||||||||
Years Ended December 31, | |||||||||||||||||||
(dollars in thousands, except per share data) | |||||||||||||||||||
2012 | 2013 | 2014 | 2015 | 2016 | |||||||||||||||
Sales | $ | 898,496 | $ | 862,252 | $ | 1,050,294 | $ | 1,104,442 | $ | 1,164,292 | |||||||||
Cost of sales | 600,602 | 581,920 | 678,609 | 692,310 | 718,316 | ||||||||||||||
Gross profit | 297,894 | 280,332 | 371,685 | 412,132 | 445,976 | ||||||||||||||
Selling, general and administrative expenses | 206,422 | 224,915 | 286,801 | 299,476 | 309,668 | ||||||||||||||
Restructuring and other charges | — | 5,104 | 1,532 | 896 | — | ||||||||||||||
Intangible asset impairment charges | — | 8,900 | — | 10,650 | — | ||||||||||||||
Pension settlement and OPEB curtailment | — | — | 6,509 | — | — | ||||||||||||||
Operating profit | 91,472 | 41,413 | 76,843 | 101,110 | 136,308 | ||||||||||||||
Interest expense | 6,350 | 5,941 | 7,378 | 6,865 | 5,405 | ||||||||||||||
Other (income) expense, net | 3,215 | (3,430 | ) | (6,285 | ) | (9,174 | ) | 3,365 | |||||||||||
Income before income tax expense | 81,907 | 38,902 | 75,750 | 103,419 | 127,538 | ||||||||||||||
Income tax expense | 30,384 | 15,718 | 29,165 | 37,471 | 45,424 | ||||||||||||||
Net earnings | $ | 51,523 | $ | 23,184 | $ | 46,585 | $ | 65,948 | $ | 82,114 | |||||||||
Net earnings attributable to Knoll, Inc. stockholders | $ | 51,523 | $ | 23,184 | $ | 46,596 | $ | 65,963 | $ | 82,084 | |||||||||
Per Share Data: | |||||||||||||||||||
Earnings per share: | |||||||||||||||||||
Basic | $ | 1.10 | $ | 0.49 | $ | 0.98 | $ | 1.38 | $ | 1.71 | |||||||||
Diluted | $ | 1.09 | $ | 0.49 | $ | 0.97 | $ | 1.36 | $ | 1.68 | |||||||||
Cash dividends declared per share: | $ | 0.44 | $ | 0.48 | $ | 0.48 | $ | 0.51 | $ | 0.60 | |||||||||
Weighted-average shares of common stock outstanding: | |||||||||||||||||||
Basic | 46,634,834 | 46,916,845 | 47,346,532 | 47,746,707 | 48,093,294 | ||||||||||||||
Diluted | 47,059,186 | 47,659,418 | 48,068,249 | 48,438,231 | 48,919,108 | ||||||||||||||
Consolidated Balance Sheet Data: | |||||||||||||||||||
As of December 31, | |||||||||||||||||||
2012 | 2013 | 2014 | 2015 | 2016 | |||||||||||||||
(in thousands) | |||||||||||||||||||
Working capital | $ | 83,129 | $ | 66,827 | $ | 80,045 | $ | 92,732 | $ | 54,435 | |||||||||
Total assets | 695,873 | 675,762 | 868,943 | 853,803 | 858,613 | ||||||||||||||
Total long-term debt, including current portion | 193,000 | 173,000 | 258,000 | 219,718 | 218,383 | ||||||||||||||
Total liabilities | 513,559 | 451,935 | 665,725 | 598,329 | 549,144 | ||||||||||||||
Total equity | 182,314 | 223,827 | 213,218 | 255,474 | 309,469 | ||||||||||||||
25
ITEM 7. MANAGEMENT'S DISCUSSION AND ANALYSIS OF FINANCIAL CONDITION AND RESULTS OF OPERATIONS
Management's discussion and analysis of financial condition and results of operations provides an account of our financial performance and financial condition that should be read in conjunction with the accompanying audited consolidated financial statements.
Forward-looking Statements
This annual report on Form 10-K contains forward-looking statements, principally in the sections entitled “Business,” “Risk Factors,” “Management's Discussion and Analysis of Financial Condition and Results of Operations,” and “Quantitative and Qualitative Disclosures About Market Risk.” Statements and financial discussion and analysis contained in this Form 10-K that are not historical facts are forward-looking statements. These statements discuss goals, intentions and expectations as to future trends, plans, events, results of operations or financial condition, or state other information relating to us, based on our current beliefs as well as assumptions made by us and information currently available to us. Forward-looking statements generally will be accompanied by words such as “anticipate,” “believe,” “could,” “estimate,” “expect,” “forecast,” “intend,” “may,” “possible,” “potential,” “predict,” “project,” or other similar words, phrases or expressions. This includes, without limitation, our statements and expectations regarding any current or future recovery in our industry and publicly announced plans for increased capital and investment spending to achieve our long-term revenue and profitability growth goals, and our expectations with respect to leverage. Although we believe these forward-looking statements are reasonable, they are based upon a number of assumptions concerning future conditions, any or all of which may ultimately prove to be inaccurate. Important factors that could cause actual results to differ materially from the forward-looking statements include, without limitation: the risks described in Item 1A and in Item 7A of this annual report on Form 10-K; changes in the financial stability of our clients or the overall economic environment, resulting in decreased corporate spending and service sector employment; changes in relationships with clients; the mix of products sold and of clients purchasing our products; the success of new technology initiatives; changes in business strategies and decisions; competition from our competitors; our ability to recruit and retain an experienced management team; changes in raw material prices and availability; restrictions on government spending resulting in fewer sales to the U.S. government, one of our largest customers; our debt restrictions on spending; our ability to protect our patents, copyrights and trademarks; our reliance on furniture dealers to produce sales; lawsuits arising from patents, copyrights and trademark infringements; violations of environmental laws and regulations; potential labor disruptions; adequacy of our insurance policies; the availability of future capital and the cost of borrowing; the overall strength and stability of our dealers, suppliers, and customers; access to necessary capital; our ability to successfully integrate acquired businesses; the success of our design and implementation of a new enterprise resource planning system; and currency rate fluctuations. The factors identified above are believed to be important factors (but not necessarily all of the important factors) that could cause actual results to differ materially from those expressed in any forward-looking statement. Unpredictable or unknown factors could also have material adverse effects on us. All forward-looking statements included in this Form 10-K are expressly qualified in their entirety by the foregoing cautionary statements. Except as required under the Federal securities laws and the rules and regulations of the SEC, we undertake no obligation to update, amend, or clarify forward-looking statements, whether as a result of new information, future events, or otherwise.
Overview
We design, manufacture, market and sell high-end commercial and residential furniture, accessories, textiles, fine leathers and designer felt for the workplace and home. We work with clients to create inspired modern interiors. Our design-driven businesses share a reputation for high-quality and sophistication offering a diversified product portfolio that endures throughout evolving trends and performs throughout business cycles. Our products are targeted at the middle to upper-end of the market where we reach customers primarily through a broad network of independent dealers and distribution partners, through our direct sales force, and through our showrooms, as well as our online presence.
Business Highlights
During the last decade we have diversified our sources of revenue among our varying operating segments. During 2016, over 37% of our sales and 45% of our profits came from outside our Office segment. We continue to build Knoll with an eye toward what works for our customers and shareholders: a constellation of high-design, high-margin businesses that leverage our historic relationships with architects, designers and decorators that combined with our disciplined approach to the management of our business has resulted in the creation of a singular entity.
26
We believe that over time our diversification efforts and strategy will continue to result in a more profitable and less cyclical enterprise. The 2016 acquisitions of DatesWeiser and Vladimir Kagan further advance our strategy of building global capability as a singular go-to resource for high-design workplaces and homes. DatesWeiser plays an integral role in the creation of high performance workplaces as its sophisticated meeting and conference tables and credenzas set a standard for design, quality and technology integration. DatesWeiser products will be offered as a compliment of our ‘ancillary’ offerings. Vladimir Kagan's elegant and contemporary designs will be leveraged within our HOLLY HUNT distribution channels to maximize probability and growth in the future years.
Our efforts to diversify our sources of revenue among our operating segments has not detracted from our continued focus on growing and improving the operating performance of our Office segment. We are looking beyond the traditional office product categories of systems, task seating and storage, to furniture that supports activity areas and the in-between spaces where people meet. We believe that our success in traditional office products gives us an advantage throughout the workplace. Our new Rockwell Unscripted collection encompasses every product category ranging from seating and lounge to architectural walls and storage. It addresses the needs of organizations that seek alternatives to the traditional workspace, and is substantially additive to our current product portfolio. In addition to these initiatives, we aim to increase profitability through operational improvements and investments in our physical and technological infrastructure. Our supply chain transformation initiative, combined with continued modernization of our facilities, is allowing us to progressively deliver on this goal.
We are committed to building a more efficient and responsive customer centric service culture and technology infrastructure across our organization. Our 2016 capital expenditures are reflective of this commitment as we continued to invest in the business through technology infrastructure upgrades, continued investments in our manufacturing facilities focusing on lean initiatives and showroom footprint.
Results of Operations
Comparison of Consolidated Results for the Years Ended December 31, 2016 and December 31, 2015
Year Ended December 31, | 2016 vs. 2015 | ||||||||||||||
2016 | 2015 | $ Change | % Change | ||||||||||||
(Dollar in thousands) | |||||||||||||||
Net Sales | $ | 1,164,292 | $ | 1,104,442 | $ | 59,850 | 5.4 | % | |||||||
Gross profit | 445,976 | 412,132 | 33,844 | 8.2 | % | ||||||||||
Operating profit | 136,308 | 101,110 | 35,198 | 34.8 | % | ||||||||||
Interest expense | 5,405 | 6,865 | (1,460 | ) | (21.3 | )% | |||||||||
Other expense (income), net | 3,365 | (9,174 | ) | 12,539 | (136.7 | )% | |||||||||
Income tax expense | 45,424 | 37,471 | 7,953 | 21.2 | % | ||||||||||
Net earnings | 82,114 | 65,948 | 16,166 | 24.5 | % | ||||||||||
Net earnings attributable to Knoll, Inc. stockholders | 82,084 | 65,963 | 16,121 | 24.4 | % | ||||||||||
Net earnings per common share attributable to Knoll, Inc. stockholders: | |||||||||||||||
Basic | $ | 1.71 | $ | 1.38 | $ | 0.33 | 23.9 | % | |||||||
Diluted | $ | 1.68 | $ | 1.36 | $ | 0.32 | 23.5 | % | |||||||
Statistical Data | |||||||||||||||
Gross profit % | 38.3 | % | 37.3 | % | |||||||||||
Operating profit % | 11.7 | % | 9.2 | % | |||||||||||
Net Sales
Net sales for the year ended December 31, 2016 were $1,164.3 million, an increase of $59.9 million, or 5.4%, from sales of $1,104.4 million for the year ended December 31, 2015. The increase in sales was largely due to a $44.4 million increase in Office sales driven by continued growth in our core systems portfolio as well as an increase in complimentary products. While Coverings segment sales were slightly down compared to the prior year, Studio segment sales increased $19.6 million, led by KnollStudio in North America and Europe.
27
Gross Profit
Gross profit for 2016 was $446.0 million, an increase of $33.8 million, or 8.2%, from gross profit of $412.1 million in 2015. Gross profit for 2015 includes a charge of $0.9 million due to the discontinuation of one of our seating products. As a percentage of sales, gross profit increased from 37.3% for 2015 to 38.3% for 2016. This improvement was driven mainly by the Office and Studio segments, where operating efficiencies and improved fixed-cost leverage from higher volumes were favorable.
Operating Profit
Operating profit for 2016 was $136.3 million, an increase of $35.2 million, or 34.8%, from operating profit of $101.1 million for 2015. Operating profit as a percentage of sales increased from 9.2% in 2015 to 11.7% in 2016. Operating profit for 2015 included $11.5 million of restructuring and impairment charges.
Selling, general, and administrative expenses for 2016 were $309.7 million, or 26.6% of sales, compared to $299.5 million, or 27.1% of sales, for 2015. Operating expenses for 2015 include an Edelman tradename impairment of $10.7 million, as well as restructuring charges of $0.9 million. The increase in operating expenses was primarily related to expanded sales, marketing and product development investments as well as additional headcount.
Interest Expense
Interest expense for 2016 was $5.4 million, a decrease of $1.5 million from interest expense of $6.9 million for 2015. The decrease in interest expense was due primarily to reductions in our outstanding debt. During 2016 and 2015, the Company's weighted average interest rates were approximately 2.0% and 2.1%, respectively.
Other Expense (Income), net
Other expense in 2016 was $3.4 million compared to other income of $9.2 million in 2015. Other expense in 2016 was related primarily to foreign exchange losses that resulted from the revaluation of intercompany balances between our Canadian and US entities. Other income in 2015 was due primarily to foreign exchange gains on intercompany balances.
Income Tax Expense
Our effective tax rate was 35.6% for 2016, compared to 36.2% for 2015. The mix of pretax income and the varying effective tax rates in the countries and states in which we operate directly affects our consolidated effective tax rate.
Comparison of Consolidated Results for the Years Ended December 31, 2015 and December 31, 2014
Year Ended December 31, | 2015 vs. 2014 | ||||||||||||||
2015 | 2014 | $ Change | % Change | ||||||||||||
(Dollar in thousands) | |||||||||||||||
Sales | $ | 1,104,442 | $ | 1,050,294 | $ | 54,148 | 5.2 | % | |||||||
Gross profit | 412,132 | 371,685 | 40,447 | 10.9 | % | ||||||||||
Operating profit | 101,110 | 76,843 | 24,267 | 31.6 | % | ||||||||||
Interest expense | 6,865 | 7,378 | (513 | ) | (7.0 | )% | |||||||||
Other income, net | (9,174 | ) | (6,285 | ) | (2,889 | ) | 46.0 | % | |||||||
Income tax expense | 37,471 | 29,165 | 8,306 | 28.5 | % | ||||||||||
Net earnings | 65,948 | 46,585 | 19,363 | 41.6 | % | ||||||||||
Net earnings attributable to Knoll, Inc. stockholders | 65,963 | 46,596 | 19,367 | 41.6 | % | ||||||||||
Net earnings per common share attributable to Knoll, Inc. stockholders: | |||||||||||||||
Basic | $ | 1.38 | $ | 0.98 | $ | 0.40 | 40.8 | % | |||||||
Diluted | $ | 1.36 | $ | 0.97 | $ | 0.39 | 40.2 | % | |||||||
Statistical Data | |||||||||||||||
Gross profit % | 37.3 | % | 35.4 | % | |||||||||||
Operating profit % | 9.2 | % | 7.3 | % | |||||||||||
28
Net Sales
Net sales for the year ended December 31, 2015 were $1,104.4 million, an increase of $54.1 million, or 5.2%, from sales of $1,050.3 million for the year ended December 31, 2014. The increase in sales was largely due to a $30.7 million increase in Office sales where we experienced growth in our complimentary products to which we have been aggressively investing. In 2015, our Studio segment sales also increased, due primarily to strong sales growth of $11.8 million and $7.8 million related to the full year effect of the HOLLY HUNT acquisition.
Gross Profit
Gross profit for 2015 was $412.1 million, an increase of $40.4 million, or 10.9%, from gross profit of $371.7 million in 2014. Gross profit for 2015 includes a charge of $0.9 million due to the discontinuation of one of our seating products. As a percentage of sales, gross profit increased from 35.4% for 2014 to 37.3% for 2015. The increase in gross profit as a percent of sales during the year was driven by foreign exchange benefits, operational improvements as well as the mix of business and net price realization.
Operating Profit
Operating profit for 2015 was $101.1 million, an increase of $24.3 million, or 31.6%, from operating profit of $76.8 million for 2014. Operating profit as a percentage of sales increased from 7.3% in 2014 to 9.2% in 2015. Operating profit for 2015 includes $11.5 million of charges related to a non-cash Edelman tradename impairment of $10.7 million as well as restructuring charges of $0.9 million that was intended to streamline our corporate structure and improve future profitability. Operating profit for 2014 includes the pension settlement and other post-employment benefit curtailment of $6.5 million, acquisition expenses of $0.7 million, restructuring charges of $1.5 million and a charge of $0.5 million associated with the remeasurement of the FilzFelt earn-out liability.
Selling, general, and administrative expenses for 2015 were $299.5 million, or 27.1% of sales, compared to $286.8 million, or 27.3% of sales, for 2014. The increase in operating expenses was related to higher commissions from increased sales volume as well as higher incentive compensation and profit sharing resulting from increased profitability.
Interest Expense
Interest expense for 2015 was $6.9 million, a decrease of $0.5 million from interest expense of $7.4 million for 2014. The decrease in interest expense was due primarily to a reduction in outstanding debt. During 2015 and 2014, the Company's weighted average interest rates were approximately 2.1% and 2.3%, respectively.
Other Income, net
Other income in 2015 and 2014 was $9.2 million and $6.3 million, respectively, which primarily consisted of foreign exchange gains.
Income Tax Expense
Our effective tax rate was 36.2% for 2015, compared to 38.5% for 2014. The decrease in the effective tax rate was due to the allowance of certain research and development tax credits recognized in 2015 as well as the mix of pretax income and the varying effective tax rates in the states and countries in which we operate, as that mix directly affects our consolidated effective tax rate.
29
Segment Reporting
We manage our business through our reporting segments: Office, Studio, and Coverings. All unallocated expenses are included within Corporate.
Our Office segment includes a complete range of workplace products that address diverse workplace planning paradigms. These products include: systems furniture, seating, storage, tables, desks and KnollExtra® accessories as well as the international sales of our North American Office products.
Our Studio segment includes KnollStudio®, HOLLY HUNT®, Knoll Europe and DatesWeiser. KnollStudio products, include iconic seating, lounge furniture, side, cafe and dining chairs as well as conference, training and dining and occasional tables. HOLLY HUNT® is known for high quality residential furniture, lighting, rugs, textiles and leathers. In 2016, HOLLY HUNT® acquired Vladimir Kagan Design Group, a renowned collection of modern luxury furnishings. Knoll Europe, which distributes both KnollStudio and Knoll Office products, manufactures and sells products to customers primarily in Europe. DatesWeiser, known for its sophisticated meeting and conference tables and credenzas, sets a standard for design, quality and technology integration.
Our Coverings segment includes KnollTextiles®, Spinneybeck® (including Filzfelt®), and Edelman® Leather. These businesses provide a wide range of customers with high-quality fabrics, felt, leather and related architectural products.
In 2016, we determined it appropriate to revise our segment presentation to segregate Corporate costs. We believe this facilitates improved communication as we report segment results and better aligns with how we view and operate the Company. Corporate costs represent the portion of unallocated expenses relating to shared services and general corporate functions including, but not limited to, legal expenses, acquisition expenses, certain finance, human resources, administrative and executive expenses and other expenses that are not directly attributable to an operating segment. Dedicated, direct selling, general and administrative expenses of the segments continue to be included within segment operating profit. We regularly review the costs included in the Corporate function, and believe disclosing such information provides more visibility and transparency of how our chief operating decision maker reviews the results for the Company.
See Note 20 of our consolidated financial statements contained in this annual report on Form 10-K for further information regarding the business segments.
The comparisons of segment results found below present our segment information with Corporate costs excluded from operating segment results. Prior year amounts have been recast to conform to the current presentation.
Comparison of Segment Results for the Years Ended December 31, 2016 and December 31, 2015
Year Ended December 31, | 2016 vs. 2015 | ||||||||||||||
2016 | 2015 | $ Change | % Change | ||||||||||||
(Dollar in thousands) | |||||||||||||||
SALES | |||||||||||||||
Office | $ | 731,327 | $ | 686,943 | $ | 44,384 | 6.5 | % | |||||||
Studio | 323,431 | 303,838 | 19,593 | 6.4 | % | ||||||||||
Coverings | 109,534 | 113,661 | (4,127 | ) | (3.6 | )% | |||||||||
Corporate | — | — | — | — | % | ||||||||||
Knoll, Inc. | $ | 1,164,292 | $ | 1,104,442 | $ | 59,850 | 5.4 | % | |||||||
OPERATING PROFIT | |||||||||||||||
Office | $ | 73,871 | $ | 55,823 | $ | 18,048 | 32.3 | % | |||||||
Studio | 53,413 | 47,952 | 5,461 | 11.4 | % | ||||||||||
Coverings | 25,953 | 17,273 | 8,680 | 50.3 | % | ||||||||||
Corporate | (16,929 | ) | (19,938 | ) | 3,009 | 15.1 | % | ||||||||
Knoll, Inc. (1) | $ | 136,308 | $ | 101,110 | $ | 32,189 | 31.8 | % | |||||||
(1) The Company does not allocate interest expense or other (income) expense, net to the reportable segments.
30
Office
Net sales for the Office segment in 2016 were $731.3 million, an increase of $44.4 million, or 6.5%, when compared with 2015. This increase in the Office segment for the year was led by continued growth in our core systems portfolio, as well as increases in complementary products. Operating profit for the Office segment in 2016 was $73.9 million, an increase of $18.0 million, or 32.3%, when compared with 2015. The increase in operating profit was driven by continuous improvement efficiencies and leveraging our fixed cost structure from higher volume. Operating profit for the Office segment in 2015 includes a $0.9 million seating product discontinuation charge and $0.5 million of restructuring charges.
Studio
Net sales for the Studio segment in 2016 were $323.4 million, an increase of $19.6 million, or 6.4%, when compared with 2015. The increase in the Studio segment was driven by higher sales at KnollStudio in North America and by our European business unit. Operating profit for the Studio segment in 2016 was $53.4 million, an increase of $5.5 million, or 11.4%, when compared with 2015. The increase in operating profit was driven by increased sales volume and net price realization. Operating profit for the Studio segment in 2015 included a $0.4 million restructuring charge.
Coverings
Net sales for the Coverings segment in 2016 were $109.5 million, a decrease of $4.1 million, or 3.6%, when compared with 2015. Continued year-over-year growth in Spinneybeck | FilzFelt sales was offset by lower volume at KnollTextiles and Edelman. Operating profit for the Coverings segment in 2016 was $26.0 million, an increase of $8.7 million, or 50.3%, when compared with 2015. Operating profit for the Coverings segment in 2015 included a $10.7 intangible asset impairment charge.
Corporate
Corporate costs in 2016 were $16.9 million, a decrease of $3.0 million, or 15.1%, when compared with 2015. The decrease was driven primarily by the full year pension benefits recognized in 2016 as a result of our 2015 pension curtailment actions, partially offset by higher salary expense related to additional headcount.
Comparison of Segment Results for the Years Ended December 31, 2015 and December 31, 2014
Year Ended December 31, | 2015 vs. 2014 | ||||||||||||||
2015 | 2014 | $ Change | % Change | ||||||||||||
(Dollar in thousands) | |||||||||||||||
SALES | |||||||||||||||
Office | $ | 686,943 | $ | 656,228 | $ | 30,715 | 4.7 | % | |||||||
Studio | 303,838 | 279,167 | 24,671 | 8.8 | % | ||||||||||
Coverings | 113,661 | 114,899 | (1,238 | ) | (1.1 | )% | |||||||||
Corporate | — | — | — | — | % | ||||||||||
Knoll, Inc. | $ | 1,104,442 | $ | 1,050,294 | $ | 54,148 | 5.2 | % | |||||||
OPERATING PROFIT | |||||||||||||||
Office | $ | 55,823 | $ | 38,116 | $ | 17,707 | 46.5 | % | |||||||
Studio | 47,952 | 37,834 | 10,118 | 26.7 | % | ||||||||||
Coverings | 17,273 | 23,816 | (6,543 | ) | (27.5 | )% | |||||||||
Corporate | (19,938 | ) | (22,923 | ) | 2,985 | 13.0 | % | ||||||||
Knoll, Inc. (1) | $ | 101,110 | $ | 76,843 | $ | 21,282 | 27.7 | % | |||||||
(1) The Company does not allocate interest expense or other (income) expense, net to the reportable segments.
31
Office
Net sales for the Office segment in 2015 were $686.9 million, an increase of $30.7 million, or 4.7%, when compared with 2014. This increase in the Office segment for the year was the result of growth experienced across all of our product categories. The most predominant growth was experienced in complimentary products where we have been aggressively investing. Operating profit for the Office segment in 2015 was $55.8 million, an increase of $17.7 million, or 46.5%, when compared with 2014. The increase in operating profit was driven by more efficiency and continued work in our plants and a more profitable mix of product revenue. Operating profit for the Office segment in 2015 includes a $0.9 million seating product discontinuation charge and the $0.5 million restructuring charges. Operating profit for the Office segment in 2014 includes a restructuring charges of $2.1 million.
Studio
Net sales for the Studio segment in 2015 were $303.8 million, an increase of $24.7 million, or 8.8%, when compared with 2014. This increase in net sales was driven by strong sales growth in HOLLY HUNT, one additional month of HOLLY HUNT sales included in 2015 as well as additional sales growth in our North American Studio business. Operating profit for the Studio segment in 2015 was $48.0 million, an increase of $10.1 million, or 26.7%, when compared with 2014. The increase in operating profit was driven by foreign exchange benefits, increased sales volume and net price realization. Operating profit for the Studio segment in 2015 includes a $0.4 million restructuring charge. Operating profit for the Studio segment in 2014 includes a restructuring benefit of $0.9 million.
Coverings
Net sales for the Coverings segment in 2015 were $113.7 million, a decrease of $1.2 million, or 1.1%, when compared with 2014. For the full year 2015, Spinneybeck | FilzFelt and KnollTextiles all grew, while Edelman was negatively impacted by weakness in the private aviation market. Operating profit for the Coverings segment in 2015 was $17.3 million, a decrease of $6.5 million, or 27.5%, when compared with 2014. Operating profit for the Coverings segment in 2015 includes a $10.7 intangible asset impairment charge. Operating profit for the Coverings segment in 2014 includes $0.3 million of restructuring charges.
Corporate
Corporate costs in 2015 were $19.9 million, a decrease of $3.0 million, or 13.0%, when compared with 2014. The decrease was driven primarily by a $6.1 million settlement charge recognized in 2014 related to pension and OBEP curtailments that did not reoccur in 2015, partially offset by increased stock compensation expense and higher incentive compensation expenses.
32
Reconciliation of Non-GAAP Financial Measures
This annual report on Form 10-K contains certain non-GAAP financial measures. A “non-GAAP financial measure” is a numerical measure of a company's financial performance that excludes or includes amounts so as to be different than the most directly comparable measure calculated and presented in accordance with U.S. generally accepted accounting principles (“GAAP”) in the statements of income, balance sheets, or statements of cash flow of the company. These non-GAAP financial measures are presented because management uses this information to monitor and evaluate financial results and trends. Therefore, management believes this information is also useful for investors. Pursuant to applicable reporting requirements, the company has provided reconciliations below of non-GAAP financial measures to the most directly comparable GAAP measure.
The non-GAAP financial measures presented within this item are Last Twelve Months (“LTM”) Adjusted EBITDA. These non-GAAP measures are not indicators of our financial performance under GAAP and should not be considered as an alternative to the applicable GAAP measure. These non-GAAP measures have limitations as analytical tools, and you should not consider them in isolation or as a substitute for analysis of our results as reported under GAAP. In addition, in evaluating these non-GAAP measures, you should be aware that in the future we may incur expenses similar to the adjustments in this presentation. Our presentation of these non-GAAP measures should not be construed as an inference that our future results will be unaffected by unusual or infrequent items. We compensate for these limitations by providing equal prominence of our GAAP results and using non-GAAP measures only as supplemental presentations.
The following table reconciles net earnings to adjusted EBITDA and computes our bank leverage calculations for the periods shown. The bank leverage calculation is in accordance with our Second Amended and Restated Credit Agreement dated May 20, 2014.
12/31/2015 | 3/31/2016 | 6/30/2016 | 9/30/2016 | 12/31/2016 | ||||||||||||||||
($ in millions) | ||||||||||||||||||||
Debt Levels (1) | $ | 238.7 | $ | 233.7 | $ | 221.7 | $ | 206.7 | $ | 231.8 | ||||||||||
LTM Net Earnings | 66.0 | 65.8 | 69.3 | 74.1 | 82.1 | |||||||||||||||
LTM Adjustments | ||||||||||||||||||||
Interest | 6.1 | 6.2 | 6.2 | 5.0 | 4.7 | |||||||||||||||
Taxes | 37.5 | 37.8 | 39.3 | 39.6 | 45.4 | |||||||||||||||
Depreciation and Amortization | 21.3 | 21.3 | 21.3 | 22.5 | 23.0 | |||||||||||||||
Non-cash items and Other (2) | 12.5 | 21.9 | 22.4 | 23.8 | 13.4 | |||||||||||||||
LTM Adjusted EBITDA | $ | 143.4 | $ | 153.0 | $ | 158.5 | $ | 165.0 | $ | 168.6 | ||||||||||
Bank Leverage Calculation (3) | 1.67 | 1.53 | 1.40 | 1.25 | 1.37 | |||||||||||||||
(1) Outstanding debt levels include outstanding letters of credit and guarantee obligations. Excess cash over $15.0 million reduces outstanding debt per the terms of our credit facility, a copy of which was filed with the Securities and Exchange Commission on May 21, 2014. | ||||||||||||||||||||
(2) Non-cash items and Other includes, but is not limited to, an intangible asset impairment charge, stock-based compensation expenses, unrealized gains and losses on foreign exchange,and restructuring charges. | ||||||||||||||||||||
(3) Debt divided by LTM Adjusted EBITDA, as calculated in accordance with our credit facility. | ||||||||||||||||||||
33
Liquidity and Capital Resources
The following table highlights certain key cash flows and capital information pertinent to the discussion that follows:
2016 | 2015 | 2014 | ||||||||||
(in thousands) | ||||||||||||
Cash provided by operating activities | $ | 104,295 | $ | 88,854 | $ | 88,227 | ||||||
Capital expenditures, net | (40,105 | ) | (29,610 | ) | (41,901 | ) | ||||||
Purchase of businesses, net of cash acquired | (18,456 | ) | — | (93,349 | ) | |||||||
Cash used in investing activities | (58,561 | ) | (29,610 | ) | (135,250 | ) | ||||||
Purchase of common stock for treasury | (5,464 | ) | (8,725 | ) | (8,974 | ) | ||||||
Proceeds from credit facilities | 377,500 | 309,000 | 789,000 | |||||||||
Repayment of credit facilities | (379,500 | ) | (345,000 | ) | (704,000 | ) | ||||||
Payment of dividends | (29,217 | ) | (24,364 | ) | (22,742 | ) | ||||||
Proceeds from issuance of common stock | 2,847 | 5,756 | 4,914 | |||||||||
Cash (used in) provided by financing activities | (38,834 | ) | (67,517 | ) | 57,265 | |||||||
We have historically funded our business through cash generated from operations, supplemented by debt borrowings. Available cash is primarily used for our working capital needs, ongoing operations, capital expenditures, the payment of quarterly dividends, and the repurchase of shares. Our investment in capital expenditures shows our commitment to improving our operating efficiency, innovation and modernization, showroom investment, new product tooling, manufacturing equipment and technology infrastructure. During 2016, we made annual dividend payments of $0.60 per share, returning $29.2 million of cash to our shareholders.
Cash provided by operating activities was $104.3 million, $88.9 million, and $88.2 million in 2016, 2015 and 2014, respectively. For the year ended December 31, 2016, cash provided by operating activities consisted primarily of $82.1 million of net income and $69.0 million of various non-cash charges, including $26.0 million of deferred taxes driven by discretionary pension funding, $23.0 million of depreciation and amortization, and $10.5 million of stock based compensation, offset by $46.8 million of unfavorable changes in assets and liabilities primarily driven by our discretionary pension plan contribution during the year of $53.2 million. For the year ended December 31, 2015, cash provided by operating activities consisted of net income of $65.9 million and $36.8 million of various non-cash charges, which included $21.3 million of depreciation and amortization and $8.2 million of stock based compensation expense, offset by $13.9 million of unfavorable changes in assets and liabilities. For the year ended December 31, 2014, cash provided by operating activities consisted of $46.6 million of net income and $26.4 million of various non-cash charges, which included $20.0 million of depreciation and amortization and $8.1 million of stock based compensation expense, offset by $15.3 million of unfavorable changes in assets and liabilities.
For the year ended December 31, 2016, we used $40.1 million and $18.5 million of cash for capital expenditures and the purchase of businesses, respectively. The capital expenditures are reflective of our continued commitment to enhance and modernize our sales, manufacturing and information technology infrastructure. The acquisitions are reflective of our strategy of building our global capabilities as a singular resource for high-design workplaces and homes. During 2015 and 2014, we invested $29.6 million and $41.9 million in capital expenditures, respectively. The capital expenditures are mainly attributed to our technology infrastructure upgrades, site capacity expansion and supply chain improvements, the opening of new showrooms, and new product development.
For the year ended December 31, 2016, we used cash of $29.2 million to fund dividend payments to shareholders, $5.5 million for share repurchases associated with the repurchase of shares used to offset the cost of employee tax withholdings, and $5.0 million of a contingent purchase price payment related to an earn-out for the HOLLY HUNT acquisition in 2014. For the year ended December 31, 2015 we used cash to make $36.0 million of net debt repayments and fund dividend payments $24.4 million. For the year ended December 31, 2014, cash was provided by $85.0 million of net borrowings related to the renegotiation of the Company’s credit facility, offset by $22.7 million of cash used for dividend payments.
34
We use our credit facility in the ordinary course of business to fund our working capital needs and, at times, make significant borrowings and repayments under the facility depending on our cash needs and availability at such time. Borrowings under the credit facility may be repaid at any time, but no later than May 2019. See Note 12 of the consolidated financial statements included in this Form 10-K for further information regarding this facility. Despite our recent acquisitions, pension plan contributions and continuing investment in the business, we were able to reduce our outstanding debt from $219.7 million in 2015 to $218.4 million in 2016. The combination of lowered debt levels and increased EBITDA drove leverage from 1.67 to 1.37. The calculation of our leverage ratio under our credit facility includes the use of adjusted EBITDA, a non-GAAP financial measure. For details on the leverage ratio calculations, see “Reconciliation of Non-GAAP Financial Measures” above.
Our credit facility requires that we comply with two financial covenants, consolidated leverage ratio, defined as the ratio of total indebtedness to consolidated EBITDA (as defined in our credit agreement) and consolidated interest coverage ratio, defined as the ratio of our consolidated EBITDA (as defined in our credit agreement) to our consolidated interest expense. Our consolidated leverage ratio cannot exceed 4.0 to 1, and our consolidated interest coverage ratio must be a minimum of 3.0 to 1. We are also required to comply with various other affirmative and negative covenants including, without limitation, covenants that prevent or restrict our ability to pay dividends, engage in certain mergers or acquisitions, make certain investments or loans, incur future indebtedness, engage in sale-leaseback transactions, alter our capital structure or line of business, prepay subordinated indebtedness, engage in certain transactions with affiliates and sell stock or assets.
We are currently in compliance with all of the covenants and conditions under our credit facility. We believe that existing cash balances and internally generated cash flows, together with borrowings available under our credit facility, will be sufficient to fund working capital needs, capital spending requirements, debt service requirements and dividend payments for at least the next twelve months. However, because of the financial covenants mentioned above, our capacity under our credit facility could be reduced if our trailing consolidated EBITDA (as defined by our credit agreement) declines due to deteriorating market conditions or poor performance. Future debt payments may be paid out of cash flows from operations, from future refinancing of our debt or from equity issuances. Our ability to make scheduled payments of principal, pay interest on or to refinance our indebtedness, satisfy our other debt obligations and to pay dividends to stockholders will depend upon our future operating performance, which is affected by general economic, financial, competitive, legislative, regulatory, business and other factors beyond our control.
Contractual Obligations
The following table summarizes our contractual cash obligations as of December 31, 2016 (in thousands):
Payments Due by Period | ||||||||||||||||||||
Less than 1 year | 1 to 3 years | 3 to 5 years | More than 5 years | Total | ||||||||||||||||
Long-term debt (a) | $ | 11,404 | $ | 211,523 | $ | — | $ | — | $ | 222,927 | ||||||||||
Operating leases | 24,797 | 38,837 | 22,729 | 23,683 | 110,046 | |||||||||||||||
Purchase commitments | 2,457 | — | — | — | 2,457 | |||||||||||||||
Pension and other post-employment benefit plan obligations (b) | 612 | — | — | — | 612 | |||||||||||||||
Other liabilities (c) | 7,100 | — | — | — | 7,100 | |||||||||||||||
Total * | $ | 46,370 | $ | 250,360 | $ | 22,729 | $ | 23,683 | $ | 343,142 | ||||||||||
(a) Contractual obligations for long-term debt and short-term borrowings include principal and interest payments. Interest payments have been computed based on an estimated variable interest as of December 31, 2016. The estimated variable interest rate is based on the company's expected consolidated leverage ratio and the forecasted LIBOR rate for each period presented. The computation of interest, as included in the above table, is based on our Amended and Restated Credit Agreement, dated May 20, 2014.
(b) Due to the uncertainty of future cash outflows, contributions to the pension and other post-employment benefit plans subsequent to 2017 have been excluded from the table above.
(c) Other liabilities consists of contingent payouts due to HOLLY HUNT and DatesWeiser, which is based on the future performance of the businesses.
* Due to the uncertainty of future cash outflows, uncertain tax positions have been excluded from the table above.
35
Environmental Matters
Our past and present business operations and the past and present ownership and operation of manufacturing plants on real property are subject to extensive and changing federal, state, local and foreign environmental laws and regulations, including those relating to discharges to air, water and land, the handling and disposal of solid and hazardous waste and the cleanup of properties affected by hazardous substances. As a result, we are involved from time-to-time in administrative and judicial proceedings and inquiries relating to environmental matters and could become subject to fines or penalties related thereto. We cannot predict what environmental legislation or regulations will be enacted in the future, how existing or future laws or regulations will be administered or interpreted or what environmental conditions may be found to exist. Compliance with more stringent laws or regulations, or stricter interpretation of existing laws, may require additional expenditures by us, some of which may be material. We have been identified as a potentially responsible party pursuant to the Comprehensive Environmental Response, Compensation and Liability Act of 1980 (“CERCLA”) for remediation costs associated with waste disposal sites that we previously used. The remediation costs and our allocated share at some of these CERCLA sites are unknown. We may also be subject to claims for personal injury or contribution relating to CERCLA sites. We reserve amounts for such matters when expenditures are probable and reasonably estimable.
Off-Balance Sheet Arrangements
We do not currently have any relationships with unconsolidated entities or financial partnerships, such as entities often referred to as structured finance or special-purpose entities, which would have been established for the purpose of facilitating off-balance sheet arrangements or other contractually narrow or limited purposes. In addition, we do not engage in trading activities involving non-exchange-traded contracts. As a result, we are not materially exposed to any financing, liquidity, market or credit risk that could arise if we had engaged in these relationships.
Critical Accounting Policies
The preparation of our consolidated financial statements in conformity with accounting principles generally accepted in the U.S. (“GAAP”) requires us to make estimates and assumptions that affect the reported amounts in the consolidated financial statements and accompanying notes. Actual results may differ from such estimates. We believe that the critical accounting policies that follow are those policies that require the most judgment, estimation and assumption in preparing our consolidated financial statements.
Allowance for Doubtful Accounts
We maintain allowances for doubtful accounts for estimated losses resulting from the inability of our clients and dealers to make required payments. The allowance is determined through an analysis of the aging of accounts receivable and assessments of risk that are based on historical trends. We evaluate the past-due status of our trade receivables based on contractual terms of sale. If the financial condition of our customers were to deteriorate, additional allowances may be required. Accounts receivable are charged against the allowance for doubtful accounts when we determine that the likelihood of recovery is remote, and we no longer intend to expend resources to attempt collection.
Inventory
Inventories are valued at the lower of cost or market. Cost is determined using the first-in, first-out method. We reserve inventory that, in our judgment, is impaired or obsolete. Obsolescence may be caused by the discontinuance of a product line, changes in product material specifications, replacement products in the marketplace and other competitive influences.
Goodwill and Intangible Assets
We record the excess of purchase price over the fair value of the tangible and identifiable intangible assets acquired as goodwill. Goodwill and intangible assets with indefinite lives are tested for impairment at least annually, as of October 1, and whenever events or circumstances occur indicating that a possible impairment may have been incurred. Intangible assets with finite lives are amortized over their useful lives.
We assess whether goodwill impairment exists using both the qualitative and quantitative assessments. The qualitative assessment involves determining whether events or circumstances exist that indicate it is more likely than not that the fair value of a reporting unit is less than its carrying amount, including goodwill. If based on this qualitative assessment we determine it is not more likely than not that the fair value of a reporting unit is less than its carrying amount or if we elect not to perform a qualitative assessment, a quantitative assessment is performed using a two-step approach to determine whether a goodwill impairment exists at the reporting unit.
36
In the first step, we compare the fair value of each reporting unit to its carrying value. If the fair value of the reporting unit exceeds its carrying value, goodwill is not impaired and no further testing is required. If the fair value of the reporting unit is less than the carrying value, we must perform the second step of the impairment test to measure the amount of impairment loss, if any. In the second step, the reporting unit's fair value is allocated to all of the assets and liabilities of the reporting unit, including any unrecognized intangible assets, in a hypothetical analysis that calculates the implied fair value of goodwill in the same manner as if the reporting unit was being acquired in a business combination. If the implied fair value of the reporting unit's goodwill is less than the carrying value, the difference is recorded as an impairment loss.
We estimate the fair value of its reporting units using a combination of the fair values derived from both the income approach and the market approach. Under the income approach, we calculate the fair value of a reporting unit based on the present value of estimated future cash flows. Cash flow projections are based on our estimates of revenue growth rates and operating margins, taking into consideration industry and market conditions. The discount rate used is based on the weighted-average cost of capital adjusted for the relevant risk associated with business-specific characteristics and the uncertainty related to the business's ability to execute on the projected cash flows. The market approach estimates fair value based on market multiples of revenue and earnings derived from comparable publicly-traded companies with similar operating and investment characteristics as the reporting unit.
We assess whether indefinite-lived intangible assets impairment exists using both the qualitative and quantitative assessments. The qualitative assessment involves determining whether events or circumstances exist that indicate it is more likely than not that the fair value of an indefinite-lived intangible asset is less than its carrying amount. If based on this qualitative assessment, we determine it is not more likely than not that the fair value of an indefinite-lived intangible asset is less than its carrying amount or if we elect not to perform a qualitative assessment, a quantitative assessment is performed to determine whether an indefinite-lived intangible asset impairment exists. We test the indefinite-lived intangible assets for impairment by comparing the carrying value to the fair value based on current revenue projections of the related operations, under the relief from royalty method. Any excess of the carrying value over the amount of fair value is recognized as an impairment. Any such impairment would be recognized in full in the reporting period in which it has been identified.
Based on the results of the annual impairment test as of October 1, 2016, we determined there were no indications of impairment for goodwill or indefinite-lived intangible assets. As a result of our annual impairment test during 2016, the fair values of each of our reporting units significantly exceeded the carrying values with the exception of our Edelman reporting unit. The goodwill balance at Edelman was $32.1 million at December 31, 2016. The estimated fair value of the Edelman reporting unit exceeded the carrying value as of October 1, 2016 by approximately 4%. Due to the impairment charge recorded in 2015, the fair value of the Edelman trade name approximates its carrying value.
Deferred Financing Fees
Financing fees that are incurred by the Company in connection with the issuance of debt are deferred and amortized to interest expense over the life of the underlying indebtedness. Deferred financing fees are presented in the Company's consolidated balance sheets as a direct reduction from long-term debt.
Business Combinations
The purchase price of an acquired company is allocated between tangible and intangible assets acquired and liabilities assumed from the acquired business based on their estimated fair values with the residual of the purchase price recorded as goodwill. The results of operations of the acquired businesses are included in our operating results from the dates of acquisition.
Warranty
We generally offer a warranty for our products. The specific terms and conditions of those warranties vary depending upon the product. We estimate the costs that may be incurred under our warranties and record a liability in the amount of such costs at the time product revenue is recognized. Factors that affect our warranty liability include historical product-failure experience and estimated repair costs for identified matters. We periodically assess the adequacy of our recorded warranty liabilities and adjust the amounts as necessary.
Employee Benefits
We are partially self-insured for our employee health benefits. We accrue for employee health benefit obligations based on an actuarial valuation. The actuarial valuation is based upon historical claims as well as a number of assumptions, including rates of inflation for medical costs, and benefit plan changes. Actual results could be materially different from the estimates used.
37
Pension and Other Post-Employment Benefits
We sponsor two defined benefit pension plans and two other post-employment benefit plans (“OPEB”). Several statistical and other factors, which attempt to anticipate future events, are used in calculating the expense and liability related to the plans. Key factors include assumptions about the expected rates of return on plan assets, discount rates, and health care cost trend rates. We consider market and regulatory conditions, including changes in investment returns and interest rates, in making these assumptions.
During 2015, we approved amendments, effective December 31, 2015, to both the union and nonunion U.S. defined benefit pension plans. We also amended our remaining post-employment medical plan, effective May 1, 2015. The amendments eliminated the accrual of future benefits for all participants in the defined benefit pension plans and closed entry to new retirees into the post-employment medical plan. These amendments resulted in a curtailment gain of approximately $7.1 million. As the plans had unrealized losses in excess of the reduction of the projected benefit obligation at the date of amendment, the gain was recorded as a reduction of the projected benefit obligation and a corresponding reduction of unrealized losses within accumulated other comprehensive loss.
We determine the expected long-term rate of return on plan assets based on aggregating the expected rates of return for each component of the plan's asset mix. We use historic plan asset returns combined with current market conditions to estimate the rate of return. The expected rate of return on plan assets is a long-term assumption and generally does not change annually. The discount rate reflects the market rate for high-quality fixed income debt instruments as of our annual measurement date and is subject to change each year. Holding all other assumptions constant, a one-percentage-point increase or decrease in the assumed rate of return on plan assets would decrease or increase 2016 net periodic pension expense by approximately $2.1 million. Likewise, a one-percentage-point increase or decrease in the discount rate would increase or decrease 2016 net periodic pension expense by approximately $0.7 million or $0.4 million, respectively.
Unrecognized actuarial gains and losses are recognized over the expected remaining lifetime of the plan participants. Unrecognized actuarial gains and losses arise from several factors, including experience and assumption changes with respect to the obligations and from the difference between expected returns and actual returns on plan assets. These unrecognized gains and losses are systematically recognized as a change in future net periodic pension expense in accordance with the appropriate accounting guidance relating to defined benefit pension and OPEB plans.
As of December 31, 2015, we changed the method used to estimate the interest cost component of net periodic benefit cost for pension and other post-employment benefits. This change resulted in a decrease in the interest cost component for 2016, compared to the previous method. Historically, we estimated the interest cost component utilizing a single weighted-average discount rate derived from the yield curve used to measure the benefit obligation at the beginning of the period. We have elected to utilize a full yield curve approach in the estimation of this component by applying the specific spot rates along the yield curve used in the determination of the benefit obligation to the relevant projected cash flows. We have made this change to provide a more precise measurement of interest cost by improving the correlation between projected benefit cash flows to the corresponding spot yield curve rates. This change did not affect the measurement of the total benefit obligation at the annual measurement date, as the change in interest cost is completely offset by deferred actuarial (gains)/losses that will arise at the next annual measurement date.
Key assumptions that we use in determining the amount of the obligation and expense recorded for OPEB, under the appropriate accounting guidance, include the assumed discount rate and the assumed rate of increases in future health care costs. In estimating the health care cost trend rate, we consider actual health care cost experience, future benefit structures, industry trends and advice from our actuaries. We assume that the relative increase in health care costs will generally trend downward over the next several years, reflecting assumed increases in efficiency and cost-containment initiatives in the health care system. For purposes of measuring the benefit obligation associated with the Company's OPEB plans as of December 31, 2016, as well as the assumed rate for 2017, a between 5.80% to 6.20% annual rate of increase in the per capita cost of covered health care benefits was assumed and a 11.10% annual rate of increase in the per capita cost of covered prescription drug benefits was assumed. The rate was then assumed to decrease to an ultimate rate of 4.5% for 2025 and thereafter for the medical plan and prescription drug plan and thereafter for the benefit obligation. Increasing the assumed health care cost trend by one-percentage-point in each year would increase the benefit obligation as of December 31, 2016 by $0.1 million and increase the aggregate of the service and interest cost components of net periodic benefit cost for 2016 by a minimal amount. Decreasing the assumed health care cost trend rate by one percentage point in each year would decrease the benefit obligation as of December 31, 2016 by approximately $0.1 million and decrease the aggregate of the service and interest cost components of net periodic benefit cost for 2016 by a minimal amount.
38
In accordance with the appropriate accounting guidance, we recognize in our consolidated balance sheet the funded status (i.e., the difference between the fair value of plan assets and the projected benefit obligation) of our defined benefit pension and OPEB plans. To record the unfunded status of our plans, we recorded an additional liability and an adjustment to accumulated other comprehensive income, net of tax.
The actuarial assumptions we use in determining our pension and OPEB retirement benefits may differ materially from actual results due to changing market and economic conditions, higher or lower withdrawal rates, or longer or shorter life spans of participants. While we believe that the assumptions used are appropriate, differences in actual experience or changes in assumptions may materially affect our financial position or results of operations.
Commitments and Contingencies
We establish reserves for the estimated cost of environmental and legal contingencies when such expenditures are probable and reasonably estimable. A significant amount of judgment is required to estimate and quantify our ultimate exposure in these matters. We engage outside experts as deemed necessary or appropriate to assist in the evaluation of exposure. From time to time, as information becomes available regarding changes in circumstances for ongoing issues as well as information regarding emerging issues, our potential liability is reassessed and reserve balances are adjusted as necessary. Revisions to our estimates of potential liability, and actual expenditures related to commitments and contingencies, could have a material impact on our results of operations or financial position.
Taxes
We account for income taxes in accordance with the appropriate accounting guidance relating to income taxes, which requires that deferred tax assets and liabilities be recognized using enacted tax rates for the effect of temporary differences between book and tax bases of recorded assets and liabilities. The appropriate accounting guidance also requires that deferred tax assets be reduced by a valuation allowance if it is more likely than not that some portion or all of the deferred tax assets will not be recognized.
At December 31, 2016, our deferred tax liabilities of $121.7 million exceeded deferred tax assets of $44.9 million by $77.0 million. At December 31, 2015, deferred tax liabilities of $114.5 million exceeded deferred tax assets of $59.1 million by $55.4 million. Our deferred tax assets at December 31, 2016 and 2015 of $44.9 million and $59.1 million, respectively, are net of valuation allowances of $6.2 million and $6.3 million, respectively. We have recorded the valuation allowance primarily for net operating loss carryforwards in foreign tax jurisdictions where we have incurred historical tax losses from operations or acquired tax losses through acquisition, and have determined that it is more likely than not that these deferred tax assets will not be realized.
We evaluate on an ongoing basis the realizability of our deferred tax assets and adjust the amount of the allowance, if necessary. The factors used to assess the likelihood of realization include our forecast of future taxable income and our assessment of available tax planning strategies that could be implemented to realize the net deferred tax assets.
We account for uncertain tax positions in accordance with the applicable accounting guidance relating to uncertainty in income taxes. Accordingly, we report a liability for unrecognized tax benefits resulting from uncertain tax positions taken, or expected to be taken, in an income tax return. We recognize interest and penalties, if any, related to unrecognized tax benefits in income tax expense.
Derivative Financial Instruments
From time to time, we enter into foreign currency forward exchange contracts and foreign currency option contracts to manage our exposure to foreign exchange rates associated with short-term operating receivables of a Canadian subsidiary that are payable by the U.S. operations. The terms of these contracts are less than a year.
We do not hold or issue derivative financial instruments for trading or speculative purposes. We recognize derivatives as either assets or liabilities in the accompanying consolidated balance sheet and measures those instruments at fair value. Changes in the fair value of such contracts are reported in earnings as a component of “Other (income) expense, net.”
Stock-Based Compensation
We measure the cost of employee services received in exchange for an award of equity instruments based on the grant-date fair value of the award. Forfeitures are recognized when they occur.
39
Stock Options
The fair value of stock options is estimated at the date of grant using the Black-Scholes option pricing model, which requires management to make certain assumptions of future expectations based on historical and current data. The assumptions include the expected term of the options, risk-free interest rate, expected volatility, and dividend yield. The expected term represents the expected amount of time that options granted are expected to be outstanding, based on historical and forecasted exercise behavior. The risk-free rate is based on the rate at grant date of zero-coupon U.S. Treasury Notes with a term equal to the expected term of the option. Expected volatility is estimated based on the historical volatility of our stock price. Our dividend yield is based on historical data. We recognize compensation expense using the straight-line method over the vesting period.
Restricted Stock and Restricted Stock Units
The fair value of restricted stock and restricted stock units, excluding market-based restricted stock units that are discussed below, is based upon the closing market price of our common stock on the date of grant. We recognize compensation expense using the straight-line method over the vesting period.
The fair value of the market-based restricted stock units is estimated at the date of grant using a lattice pricing model, which requires management to make certain assumptions based on both historical and current data. These awards vest based upon the performance of our stock price relative to a peer group. The assumptions included in the model include, but are not limited to, risk-free interest rate, expected volatility of our and the peer group's stock prices, and dividend yield. The risk-free rate is based upon the applicable U.S. Treasury Note rate. Expected volatility is estimated based on the historical volatility of our stock prices. The dividend yield is based on our historical data.
40
ITEM 7A. QUANTITATIVE AND QUALITATIVE DISCLOSURES ABOUT MARKET RISK
During the normal course of business, we are routinely subjected to market risk associated with interest rate movements and foreign currency exchange rate movements. Interest rate risk arises from our debt obligations. Foreign currency exchange rate risk arises from our non-U.S. operations and purchases of inventory from foreign suppliers.
We also have risk in our exposure to certain materials and transportation costs. Steel, leather, wood products and plastics are all used in our products. For the year ended December 31, 2016, we estimated that materials and transportation deflation were approximately $0.7 million and $0.1 million, respectively. During 2015, we estimated that materials and transportation inflation were approximately $2.0 million and $0.3 million, respectively. We continue to work to offset price increases in raw materials and transportation through our global sourcing initiatives, cost improvements and price increases to our products.
Interest Rate Risk
We have variable rate debt obligations that are denominated in U.S. dollars. A change in interest rates will impact the interest costs incurred and cash paid on the variable rate debt. During 2016 and 2015, our weighted average interest rates were approximately 2.0% and 2.1%, respectively.
The following table summarizes our market risks associated with our debt obligations as of December 31, 2016. For debt obligations, the table presents principal cash flows and related average interest rates by year of maturity. Variable interest rates presented for variable-rate debt represent the average interest rates on our credit facility borrowings as of December 31, 2016.
2017 | 2018 | 2019 | 2020 | Thereafter | Total | ||||||||||||||||||
(in thousands) | |||||||||||||||||||||||
Rate-Sensitive Liabilities | |||||||||||||||||||||||
Long-term Debt: | |||||||||||||||||||||||
Variable Rate Debt | $ | 10,000 | $ | 10,000 | $ | 200,000 | $ | — | $ | — | $ | 220,000 | |||||||||||
Variable Interest Rate | 2.20 | % | 2.40 | % | 2.69 | % | 2.66 | % | — | % | 2.49 | % | |||||||||||
The fair value of the Company's long-term debt approximates its carrying value, as the variable rate debt and the associated terms are comparable to market terms as of the balance sheet date.
For each period presented, the average interest rate is based on an estimated variable interest rate as of December 31, 2016. The estimated variable interest rate is based on the Company's expected consolidated leverage ratio, and the forecasted LIBOR rate and commitment fees for each period presented. The computation of interest, as included in the above table, is based on our Amended and Restated Credit Agreement, dated May 20, 2014.
An increase in our effective interest rate of 1% would increase annual interest expense by approximately $2.2 million. We will continue to review our exposure to interest rate fluctuations and evaluate whether we should manage such exposure through derivative transactions.
Foreign Currency Exchange Rate Risk
We manufacture our products in the United States, Canada and Italy, and sell our products primarily in those markets as well as in other European countries. Our foreign sales and certain expenses are transacted in foreign currencies. Our production costs, profit margins and competitive position are affected by the strength of the currencies in countries where we manufacture or purchase goods relative to the strength of the currencies in countries where our products are sold. Additionally, as our reporting currency is the U.S. dollar, our financial position is affected by the strength of the currencies in countries where we have operations relative to the strength of the U.S. dollar. The principal foreign currencies in which we conduct business are the Canadian dollar and the Euro. Approximately 11.4% and 11.6% of our revenues in 2016 and 2015, respectively, and 26.6% and 26.1% of our cost of goods sold in 2016 and 2015, respectively, were denominated in currencies other than the U.S. dollar. Foreign currency exchange rate fluctuations resulted in $3.7 million of translation losses and $9.1 million of translation gains for 2016 and 2015, respectively.
From time to time, we enter into foreign currency hedges to manage our exposure to foreign exchange rates associated with short-term operating receivables of a Canadian subsidiary that are payable by our U.S. operations. The terms of these contracts are typically less than a year. Changes in the fair value of such contracts are reported in earnings in the period the value of the contract changes. The net gain or loss upon settlement and the change in fair value of outstanding contracts is recorded as a component of other expense (income).
41
ITEM 8. FINANCIAL STATEMENTS AND SUPPLEMENTARY DATA
Report of Independent Registered Public Accounting Firm
The Board of Directors and Stockholders of Knoll, Inc.
We have audited the accompanying consolidated balance sheets of Knoll, Inc. as of December 31, 2016 and 2015, and the related consolidated statements of operations and comprehensive income, equity and cash flows for each of the three years in the period ended December 31, 2016. Our audits also included the financial statement schedule listed in the Index at Item 15(a). These financial statements and schedule are the responsibility of the Company's management. Our responsibility is to express an opinion on these financial statements and schedule based on our audits.
We conducted our audits in accordance with the standards of the Public Company Accounting Oversight Board (United States). Those standards require that we plan and perform the audit to obtain reasonable assurance about whether the financial statements are free of material misstatement. An audit includes examining, on a test basis, evidence supporting the amounts and disclosures in the financial statements. An audit also includes assessing the accounting principles used and significant estimates made by management, as well as evaluating the overall financial statement presentation. We believe that our audits provide a reasonable basis for our opinion.
In our opinion, the financial statements referred to above present fairly, in all material respects, the consolidated financial position of Knoll, Inc. at December 31, 2016 and 2015, and the consolidated results of its operations and its cash flows for each of the three years in the period ended December 31, 2016, in conformity with U.S. generally accepted accounting principles. Also, in our opinion, the related financial statement schedule, when considered in relation to the basic financial statements taken as a whole, presents fairly in all material respects the information set forth therein.
We also have audited, in accordance with the standards of the Public Company Accounting Oversight Board (United States), Knoll, Inc.’s internal control over financial reporting as of December 31, 2016, based on criteria established in Internal Control-Integrated Framework issued by the Committee of Sponsoring Organizations of the Treadway Commission (2013 framework) and our report dated March 1, 2017 expressed an unqualified opinion thereon.
/s/ Ernst & Young LLP
Philadelphia, Pennsylvania
March 1, 2017
42
KNOLL, INC.
CONSOLIDATED BALANCE SHEETS
(dollars in thousands, except share and per share data)
December 31, 2016 | December 31, 2015 | ||||||
ASSETS | |||||||
Current assets: | |||||||
Cash and cash equivalents | $ | 9,854 | $ | 4,192 | |||
Customer receivables, net of allowance for doubtful accounts of $8,059 and $7,919, respectively | 84,425 | 116,532 | |||||
Inventories, net | 142,072 | 140,798 | |||||
Deferred income taxes | — | 20,485 | |||||
Prepaid expenses | 27,461 | 14,798 | |||||
Other current assets | 12,996 | 11,967 | |||||
Total current assets | 276,808 | 308,772 | |||||
Property, plant, and equipment, net | 197,084 | 172,142 | |||||
Goodwill | 141,391 | 127,671 | |||||
Intangible assets, net | 241,870 | 240,169 | |||||
Other non-trade receivables | 26 | 2,254 | |||||
Other noncurrent assets | 1,434 | 2,795 | |||||
Total Assets | $ | 858,613 | $ | 853,803 | |||
LIABILITIES AND EQUITY | |||||||
Current liabilities: | |||||||
Current maturities of long-term debt | $ | 10,000 | $ | 10,000 | |||
Accounts payable | 97,518 | 89,552 | |||||
Income taxes payable | 81 | 1,580 | |||||
Other current liabilities | 114,774 | 114,908 | |||||
Total current liabilities | 222,373 | 216,040 | |||||
Long-term debt | 208,383 | 209,718 | |||||
Deferred income taxes | 76,854 | 75,959 | |||||
Post-employment benefits other than pensions | 5,124 | 6,294 | |||||
Pension liability | 17,428 | 63,441 | |||||
Other noncurrent liabilities | 18,982 | 26,877 | |||||
Total liabilities | 549,144 | 598,329 | |||||
Commitments and contingent liabilities | |||||||
Equity: | |||||||
Common stock, $0.01 par value; 200,000,000 shares authorized; 64,741,648 shares issued and 49,096,290 shares outstanding (including 993,962 non-voting restricted shares and net of 15,645,358 treasury shares) at December 31, 2016 and 64,603,344 shares issued and 48,822,013 shares outstanding (including 993,934 non-voting restricted shares and net of 15,781,331 treasury shares) at December 31, 2015 | 491 | 488 | |||||
Additional paid-in capital | 55,148 | 47,165 | |||||
Retained earnings | 297,011 | 244,947 | |||||
Accumulated other comprehensive loss | (43,403 | ) | (37,318 | ) | |||
Total Knoll, Inc. stockholders' equity | 309,247 | 255,282 | |||||
Noncontrolling interests | 222 | 192 | |||||
Total equity | 309,469 | 255,474 | |||||
Total Liabilities and Equity | $ | 858,613 | $ | 853,803 | |||
See accompanying notes to the consolidated financial statements.
43
KNOLL, INC.
CONSOLIDATED STATEMENTS OF OPERATIONS AND COMPREHENSIVE INCOME
(dollars in thousands, except share and per share data)
Years ended December 31, | |||||||||||
2016 | 2015 | 2014 | |||||||||
Sales | $ | 1,164,292 | $ | 1,104,442 | $ | 1,050,294 | |||||
Cost of sales | 718,316 | 692,310 | 678,609 | ||||||||
Gross profit | 445,976 | 412,132 | 371,685 | ||||||||
Selling, general, and administrative expenses | 309,668 | 299,476 | 286,801 | ||||||||
Restructuring and other charges | — | 896 | 1,532 | ||||||||
Intangible asset impairment charges | — | 10,650 | — | ||||||||
Pension settlement and OPEB curtailment | — | — | 6,509 | ||||||||
Operating profit | 136,308 | 101,110 | 76,843 | ||||||||
Interest expense | 5,405 | 6,865 | 7,378 | ||||||||
Other expense (income), net | 3,365 | (9,174 | ) | (6,285 | ) | ||||||
Income before income tax expense | 127,538 | 103,419 | 75,750 | ||||||||
Income tax expense | 45,424 | 37,471 | 29,165 | ||||||||
Net earnings | 82,114 | 65,948 | 46,585 | ||||||||
Net earnings (loss) attributable to noncontrolling interests | 30 | (15 | ) | (11 | ) | ||||||
Net earnings attributable to Knoll, Inc. stockholders | $ | 82,084 | $ | 65,963 | $ | 46,596 | |||||
Net earnings per common share attributable to Knoll, Inc. stockholders: | |||||||||||
Basic | $ | 1.71 | $ | 1.38 | $ | 0.98 | |||||
Diluted | $ | 1.68 | $ | 1.36 | $ | 0.97 | |||||
Weighted-average number of common shares outstanding: | |||||||||||
Basic | 48,093,294 | 47,746,707 | 47,346,532 | ||||||||
Diluted | 48,919,108 | 48,438,231 | 48,068,249 | ||||||||
Net earnings | $ | 82,114 | $ | 65,948 | $ | 46,585 | |||||
Other comprehensive income (loss): | |||||||||||
Pension and other post-employment liability adjustment, net of tax | (6,573 | ) | 11,945 | (25,548 | ) | ||||||
Foreign currency translation adjustment | 488 | (16,581 | ) | (12,271 | ) | ||||||
Total other comprehensive (loss), net of tax | (6,085 | ) | (4,636 | ) | (37,819 | ) | |||||
Total comprehensive income | 76,029 | 61,312 | 8,766 | ||||||||
Comprehensive income (loss) attributable to noncontrolling interests | 30 | (15 | ) | (11 | ) | ||||||
Comprehensive income attributable to Knoll, Inc. stockholders | $ | 75,999 | $ | 61,327 | $ | 8,777 | |||||
See accompanying notes to the consolidated financial statements.
44
KNOLL, INC.
CONSOLIDATED STATEMENTS OF EQUITY
(dollars in thousands, except per share data)
Common Stock | Additional Paid-In Capital | Retained Earnings | Accumulated Other Comprehensive Income (Loss) | Total Knoll, Inc. Stockholders' Equity | Noncontrolling Interests | Total Equity | ||||||||||||||||||||||
Balance at December 31, 2013 | $ | 483 | $ | 37,258 | $ | 180,949 | $ | 5,137 | $ | 223,827 | $ | — | $ | 223,827 | ||||||||||||||
Noncontrolling interests acquired in acquisition | — | — | — | — | — | 218 | 218 | |||||||||||||||||||||
Net earnings | — | — | 46,596 | — | 46,596 | (11 | ) | 46,585 | ||||||||||||||||||||
Other comprehensive loss | — | — | — | (37,819 | ) | (37,819 | ) | — | (37,819 | ) | ||||||||||||||||||
Shares issued for consideration: | ||||||||||||||||||||||||||||
Exercise of stock options | 4 | 4,854 | — | — | 4,858 | — | 4,858 | |||||||||||||||||||||
Income tax effect from the exercise of stock options and vesting of equity awards | — | (119 | ) | — | — | (119 | ) | — | (119 | ) | ||||||||||||||||||
Shares issued under stock incentive plan | 6 | — | — | — | 6 | — | 6 | |||||||||||||||||||||
Shares issued to Board of Directors in lieu of cash | — | 56 | — | — | 56 | — | 56 | |||||||||||||||||||||
Stock-based compensation | — | 8,062 | — | — | 8,062 | — | 8,062 | |||||||||||||||||||||
Cash dividend ($0.48 per share) | — | — | (23,482 | ) | — | (23,482 | ) | — | (23,482 | ) | ||||||||||||||||||
Purchase of common stock | (6 | ) | (8,968 | ) | — | — | (8,974 | ) | — | (8,974 | ) | |||||||||||||||||
Balance at December 31, 2014 | $ | 487 | $ | 41,143 | $ | 204,063 | $ | (32,682 | ) | $ | 213,011 | $ | 207 | $ | 213,218 | |||||||||||||
Net earnings | — | — | 65,963 | — | 65,963 | (15 | ) | 65,948 | ||||||||||||||||||||
Other comprehensive income | — | — | — | (4,636 | ) | (4,636 | ) | — | (4,636 | ) | ||||||||||||||||||
Shares issued for consideration: | ||||||||||||||||||||||||||||
Exercise of stock options | 4 | 5,652 | — | — | 5,656 | — | 5,656 | |||||||||||||||||||||
Income tax effect from the exercise of stock options and vesting of equity awards | — | 826 | — | — | 826 | — | 826 | |||||||||||||||||||||
Shares issued under stock incentive plan | 1 | (1 | ) | — | — | — | — | — | ||||||||||||||||||||
Shares issued to Board of Directors in lieu of cash | — | 100 | — | — | 100 | — | 100 | |||||||||||||||||||||
Stock-based compensation | — | 8,166 | — | — | 8,166 | — | 8,166 | |||||||||||||||||||||
Cash dividend ($0.51 per share) | — | — | (25,079 | ) | — | (25,079 | ) | — | (25,079 | ) | ||||||||||||||||||
Purchase of common stock | (4 | ) | (8,721 | ) | — | — | (8,725 | ) | — | (8,725 | ) | |||||||||||||||||
Balance at December 31, 2015 | $ | 488 | $ | 47,165 | $ | 244,947 | $ | (37,318 | ) | $ | 255,282 | $ | 192 | $ | 255,474 | |||||||||||||
Net earnings | — | — | 82,084 | — | 82,084 | 30 | 82,114 | |||||||||||||||||||||
Other comprehensive income | — | — | — | (6,085 | ) | (6,085 | ) | — | (6,085 | ) | ||||||||||||||||||
Shares issued for consideration: | ||||||||||||||||||||||||||||
Exercise of stock options | 2 | 2,770 | — | — | 2,772 | — | 2,772 | |||||||||||||||||||||
Shares issued under stock incentive plan | 3 | (3 | ) | — | — | — | — | — | ||||||||||||||||||||
Shares issued to Board of Directors in lieu of cash | — | 75 | — | — | 75 | — | 75 | |||||||||||||||||||||
Stock-based compensation (1) | — | 10,603 | (134 | ) | — | 10,469 | — | 10,469 | ||||||||||||||||||||
Cash dividend ($0.60 per share) | — | — | (29,886 | ) | — | (29,886 | ) | — | (29,886 | ) | ||||||||||||||||||
Purchase of common stock | (2 | ) | (5,462 | ) | — | — | (5,464 | ) | — | (5,464 | ) | |||||||||||||||||
Balance at December 31, 2016 | $ | 491 | $ | 55,148 | $ | 297,011 | $ | (43,403 | ) | $ | 309,247 | $ | 222 | $ | 309,469 | |||||||||||||
(1) The $0.1 million adjustment in retained earnings represents the ASU 2016-09 adjustment for cumulative estimated forfeiture expense. See Note 2 for additional information.
See accompanying notes to the consolidated financial statements.
45
KNOLL, INC.
CONSOLIDATED STATEMENTS OF CASH FLOWS
(dollars in thousands)
Years Ended December 31, | |||||||||||
2016 | 2015 | 2014 | |||||||||
CASH FLOWS FROM OPERATING ACTIVITIES | |||||||||||
Net earnings | $ | 82,114 | $ | 65,948 | $ | 46,585 | |||||
Adjustments to reconcile net earnings to cash provided by operating activities: | |||||||||||
Depreciation | 19,071 | 17,364 | 16,327 | ||||||||
Amortization expense (including deferred financing fees) | 3,954 | 3,915 | 3,715 | ||||||||
Provision for deferred taxes | 26,016 | 158 | (269 | ) | |||||||
Write-off of deferred financing fees | — | — | 347 | ||||||||
Inventory obsolescence | 2,376 | 2,656 | 1,761 | ||||||||
Loss on disposal of property, plant and equipment | 5 | 1,229 | 464 | ||||||||
Unrealized foreign currency losses (gains) | 827 | (8,789 | ) | (6,640 | ) | ||||||
Stock-based compensation | 10,469 | 8,166 | 8,062 | ||||||||
Intangible asset impairment charge | — | 10,650 | — | ||||||||
Bad debt and customer credits | 6,303 | 1,477 | 2,590 | ||||||||
Changes in assets and liabilities, net of effects of acquisitions: | |||||||||||
Customer receivables | 26,591 | (4,292 | ) | (13,814 | ) | ||||||
Inventories | (2,157 | ) | (4,481 | ) | (23,063 | ) | |||||
Accounts payable | 4,591 | (26,253 | ) | 23,002 | |||||||
Current income taxes | (6,871 | ) | 675 | (5,528 | ) | ||||||
Prepaid and other current assets | (13,815 | ) | (5,425 | ) | (3,601 | ) | |||||
Other current liabilities | (3,430 | ) | 22,937 | (6,969 | ) | ||||||
Other noncurrent assets and liabilities | (51,749 | ) | 2,919 | 45,258 | |||||||
Cash provided by operating activities | 104,295 | 88,854 | 88,227 | ||||||||
CASH FLOWS FROM INVESTING ACTIVITIES | |||||||||||
Capital expenditures, net | (40,105 | ) | (29,610 | ) | (41,901 | ) | |||||
Purchase of businesses, net of cash acquired | (18,456 | ) | — | (93,349 | ) | ||||||
Cash used in investing activities | (58,561 | ) | (29,610 | ) | (135,250 | ) | |||||
CASH FLOWS FROM FINANCING ACTIVITIES | |||||||||||
Proceeds from credit facility | 377,500 | 309,000 | 789,000 | ||||||||
Repayment of credit facility | (379,500 | ) | (345,000 | ) | (704,000 | ) | |||||
Payment of financing fees | — | (10 | ) | (1,938 | ) | ||||||
Payment of dividends | (29,217 | ) | (24,364 | ) | (22,742 | ) | |||||
Proceeds from the issuance of common stock | 2,847 | 5,756 | 4,914 | ||||||||
Purchase of common stock for treasury | (5,464 | ) | (8,725 | ) | (8,974 | ) | |||||
Contingent purchase price payment | (5,000 | ) | (5,000 | ) | — | ||||||
Tax benefit from the exercise of stock options and vesting of equity awards | — | 826 | 1,005 | ||||||||
Cash (used in) provided by financing activities | (38,834 | ) | (67,517 | ) | 57,265 | ||||||
Effect of exchange rate changes on cash and cash equivalents | (1,238 | ) | (6,556 | ) | (3,247 | ) | |||||
Net increase (decrease) in cash and cash equivalents | 5,662 | (14,829 | ) | 6,995 | |||||||
Cash and cash equivalents at beginning of year | 4,192 | 19,021 | 12,026 | ||||||||
Cash and cash equivalents at end of year | $ | 9,854 | $ | 4,192 | $ | 19,021 | |||||
Supplemental disclosure of cash flow information: | |||||||||||
Cash paid for interest | $ | 5,228 | $ | 6,168 | $ | 6,879 | |||||
Cash paid for income taxes | $ | 23,699 | $ | 40,781 | $ | 18,646 | |||||
See accompanying notes to the consolidated financial statements.
46
KNOLL, INC.
NOTES TO THE CONSOLIDATED FINANCIAL STATEMENTS
DECEMBER 31, 2016
1. DESCRIPTION OF THE BUSINESS AND BASIS OF PRESENTATION
Description of the Business
Knoll, Inc. and its subsidiaries (the “Company” or “Knoll”) are engaged in the design, manufacture, market and sale of high-end furniture products and accessories, and modern outdoor furniture. The Company is also engaged in the sale of fine leather, textiles, and felt, focusing on the middle to high-end segments of the market. The Company primarily operates in the United States (“U.S.”), Canada and Europe, and sells its products primarily through a broad network of independent dealers and distribution partners, through a direct sales force, and through its showrooms, as well as online.
Basis of Presentation
The Company follows accounting standards set by the Financial Accounting Standards Board (“FASB”). The FASB establishes accounting principles generally accepted in the United States (“GAAP”). Rules and interpretive releases of the Securities and Exchange Commission (“SEC”) under authority of federal securities laws are also sources of authoritative GAAP for SEC registrants, which the Company is required to follow. References to GAAP issued by the FASB in these footnotes are to the FASB Accounting Standards Codification (“ASC”), which serves as a single source of authoritative non-SEC accounting and reporting standards to be applied by non-governmental entities. All amounts are presented in U.S. dollars, unless otherwise noted.
2. SUMMARY OF SIGNIFICANT ACCOUNTING POLICIES
Principles of Consolidation
The consolidated financial statements of the Company include the accounts of the Company and its wholly owned subsidiaries and any partially owned subsidiaries that the Company has the ability to control. Significant intercompany transactions and balances have been eliminated in consolidation.
The results of the Company's European subsidiaries are included in the consolidated financial statements, and are presented on a one-month lag to allow for the timely preparation of consolidated financial information. The effect of this lag in presentation is not material to the consolidated financial statements.
Use of Estimates
The preparation of the consolidated financial statements in conformity with United States GAAP requires management to make estimates and assumptions that affect the reported amounts in the consolidated financial statements and accompanying notes. Examples include, but are not limited to, revenue recognition; income tax exposures; the carrying value of goodwill and property, plant, and equipment; bad debts; customer receivable allowances; inventory obsolescence and product warranties. Actual results may differ from such estimates.
Cash and Cash Equivalents
Cash and cash equivalents include cash on hand and highly liquid investments with maturities of three months or less at the date of purchase.
Revenue Recognition
The Company recognizes revenue when the earnings process is complete. This occurs when risk and title transfers, collectability is reasonably assured, and pricing is fixed and determinable. Accordingly, revenue is recognized when risk and title are transferred to the client, which primarily occurs at the time of shipment. Taxes on revenue producing transactions are not included in sales. Based on historical experience, accruals are made at the time of sale to estimate for sales returns and other allowances.
Allowance for Doubtful Accounts
The Company maintains allowances for doubtful accounts for estimated losses resulting from the inability of its customers to make required payments. The allowance is determined through an analysis of the aging of accounts receivable and assessments of risk that are based on historical trends. The Company evaluates the past-due status of its customer receivables based on the contractual terms of sale. If the financial condition of the Company's customers were to deteriorate, additional allowances may be required. Accounts receivable are charged against the allowance for doubtful accounts when the Company determines that the likelihood of recovery is remote, and the Company no longer intends to expend resources to attempt collection.
47
KNOLL, INC.
NOTES TO THE CONSOLIDATED FINANCIAL STATEMENTS
DECEMBER 31, 2016
Inventories
Inventories are stated at the lower of cost or market. Cost is determined using the first-in, first-out method. The Company reserves for inventory that, in its judgment, is impaired or obsolete. Obsolescence may be caused by the discontinuance of a product line, changes in product material specifications, replacement products in the marketplace and other competitive influences.
Property, Plant, and Equipment
Property, plant, and equipment are stated at cost, less accumulated depreciation. Depreciation is computed using the straight-line method over the estimated useful lives of the assets. The useful lives are as follows:
Category | Useful Life (in years) | |
Leasehold improvements (1) | Various | |
Buildings | 45-60 | |
Office equipment | 3-10 | |
Machinery and equipment | 4-12 | |
(1) Useful lives for leasehold improvements are amortized over the shorter of the economic lives or the term of the lease.
The Company reviews the carrying values of its property and equipment for possible impairment whenever events or changes in circumstances indicate that the carrying value of an asset may not be recoverable based on undiscounted estimated cash flows expected to result from its use and eventual disposition. The factors considered by the Company in performing this assessment include current operating results, business trends affecting the use of certain assets and other economic factors. In assessing the recoverability of the carrying value of property and equipment, the Company must make assumptions regarding future cash flows and other factors. If these estimates or the related assumptions change in the future, the Company may be required to record an impairment loss for these assets.
Goodwill and Intangible Assets
The Company records the excess of purchase price over the fair value of the tangible and identifiable intangible assets acquired as goodwill. Goodwill and intangible assets with indefinite lives are tested for impairment at least annually, as of October 1, and whenever events or circumstances occur indicating that a possible impairment may have been incurred. Intangible assets with finite lives are amortized over their useful lives.
The Company assesses whether goodwill impairment exists using both the qualitative and quantitative assessments. The qualitative assessment involves determining whether events or circumstances exist that indicate it is more likely than not that the fair value of a reporting unit is less than its carrying amount, including goodwill. If based on this qualitative assessment the Company determines it is more likely than not that the fair value of a reporting unit is less than its carrying amount, or if the Company elects not to perform a qualitative assessment, a quantitative assessment is performed using a two-step approach to determine whether a goodwill impairment exists at the reporting unit.
In the first step, the Company compares the estimated fair value of each reporting unit to its carrying value. If the estimated fair value of the reporting unit exceeds its carrying value, goodwill is not impaired and no further testing is required. If the estimated fair value of the reporting unit is less than the carrying value, the Company must perform the second step of the impairment test to measure the amount of impairment loss, if any. In the second step, the reporting unit's estimated fair value is allocated to all of the assets and liabilities of the reporting unit, including any unrecognized intangible assets, in a hypothetical analysis that calculates the implied fair value of goodwill in the same manner as if the reporting unit was being acquired in a business combination. If the implied fair value of the reporting unit's goodwill is less than the carrying value, the difference is recorded as an impairment loss.
The Company estimates the fair value of its reporting units using a combination of the fair values derived from both the income approach and the market approach. Under the income approach, the Company calculates the fair value of a reporting unit based on the present value of estimated future cash flows. Cash flow projections are based on management's estimates of revenue growth rates and operating margins, taking into consideration industry and market conditions. The discount rate used is based on the weighted-average cost of capital adjusted for the relevant risk associated with business-specific characteristics and the uncertainty related to the business's ability to execute on the projected cash flows. The market approach estimates fair value based on market multiples of revenue and earnings derived from comparable publicly-traded companies with similar operating and investment characteristics as the reporting unit.
48
KNOLL, INC.
NOTES TO THE CONSOLIDATED FINANCIAL STATEMENTS
DECEMBER 31, 2016
The Company assesses whether indefinite-lived intangible assets impairment exists using both the qualitative and quantitative assessments. The qualitative assessment involves determining whether events or circumstances exist that indicate it is more likely than not that the fair value of an indefinite-lived intangible asset is less than its carrying amount. If based on this qualitative assessment, the Company determines it is more likely than not that the fair value of an indefinite-lived intangible asset is less than its carrying amount or if the Company elects not to perform a qualitative assessment, a quantitative assessment is performed to determine whether an indefinite-lived intangible asset impairment exists. The Company tests the indefinite-lived intangible assets for impairment by comparing the carrying value to the fair value based on current revenue projections of the related operations, under the relief from royalty method. Any excess of the carrying value over the amount of fair value is recognized as an impairment. Any such impairment would be recognized in the reporting period in which it has been identified.
Finite-lived assets such as customer relationships, non-compete agreements, and licenses are amortized over their estimated useful lives. The Company reviews the carrying values of these assets for possible impairment whenever events or changes in circumstances indicate that the carrying value of an asset may not be recoverable based on undiscounted estimated cash flows expected to result from its use and eventual disposition. The Company continually evaluates the reasonableness of the useful lives of these assets.
Business Combinations
The purchase price of an acquired company is allocated between tangible and intangible assets acquired and liabilities assumed from the acquired business based on their estimated fair values, with the residual of the purchase price recorded as goodwill. The results of operations of the acquired business are included in the Company's operating results from the date of acquisition.
Deferred Financing Fees
Financing fees that are incurred by the Company in connection with the issuance of debt are deferred and amortized to interest expense over the life of the underlying indebtedness. Deferred financing fees are presented in the Company's consolidated balance sheets as a direct reduction from long-term debt.
Shipping and Handling
Amounts billed to clients for shipping and handling of products are classified as sales. Costs incurred by the Company for shipping and handling are classified as cost of sales.
Research and Development Costs
Research and development expenses are expensed as incurred, and are included as a component of selling, general, and administrative expenses. Research and development expenses, were $21.7 million for 2016, $20.7 million for 2015, and $19.2 million for 2014.
Income Taxes
The Company accounts for income taxes using the asset and liability approach, which requires deferred tax assets and liabilities be recognized using enacted tax rates to measure the effect of temporary differences between book and tax bases on recorded assets and liabilities. Valuation allowances are recorded to reduce deferred tax assets, if it is more likely than not some portion or all of the deferred tax assets will not be recognized. The need to establish valuation allowances against deferred tax assets is assessed quarterly. The Company maintained a valuation allowance primarily for net operating loss carryforwards in foreign tax jurisdictions where the Company has incurred historical tax losses from operations or acquired tax losses through acquisitions, and has determined that it is more likely than not these deferred tax assets will not be recognized. The primary factors used to assess the likelihood of realization are forecasts of future taxable income and available tax planning strategies that could be implemented to realize the net deferred tax assets.
The Company evaluates tax positions to determine whether the benefits of tax positions are more likely than not to be sustained upon audit based on the technical merits of the tax position. For tax positions that are more likely than not to be sustained upon audit, the Company recognizes the largest amount of the benefit that is greater than 50% likely of being realized upon ultimate settlement. For tax positions that are not more likely than not to be sustained upon audit, the Company does not recognize any portion of the benefit. If the more likely than not threshold is not met in the period for which a tax position is taken, the Company may subsequently recognize the benefit of that tax position if the tax matter is effectively settled, the statute of limitations expires, or if the more likely than not threshold is met in a subsequent period.
The Company recognizes tax-related interest and penalties in income tax expense and accrues for interest and penalties in other noncurrent liabilities.
49
KNOLL, INC.
NOTES TO THE CONSOLIDATED FINANCIAL STATEMENTS
DECEMBER 31, 2016
Fair Value of Financial Instruments
The Company uses the following valuation techniques to measure fair value for its financial assets and financial liabilities:
Level 1 | Inputs are unadjusted quoted prices in active markets for identical assets or liabilities. | |
Level 2 | Inputs are quoted prices for similar assets or liabilities in an active market, quoted prices for identical or similar assets or liabilities in markets that are not active, inputs other than quoted prices that are observable and market-corroborated inputs which are derived principally from or corroborated by observable market data. | |
Level 3 | Inputs are derived from valuation techniques in which one or more significant inputs or value drivers are unobservable. | |
Fair value is the price that would be received to sell an asset or paid to transfer a liability in an orderly transaction between market participants at the measurement date. The Company and its subsidiaries use, as appropriate, a market approach (generally, data from market transactions), an income approach (generally, present value techniques and option-pricing models), and/or a cost approach (generally, replacement cost) to measure the fair value of an asset or liability. These valuation approaches incorporate inputs such as observable, independent market data and/or unobservable data that management believes are predicated on the assumptions market participants would use to price an asset or liability. These inputs may incorporate, as applicable, certain risks such as nonperformance risk, which includes credit risk.
Derivative Financial Instruments
From time to time, the Company enters into foreign currency hedges to manage its exposure to foreign exchange rates associated with short-term operating receivables of a Canadian subsidiary that are payable by the U.S. operations. The terms of these contracts are typically less than one year.
The Company does not hold or issue derivative financial instruments for trading or speculative purposes. The Company recognizes derivatives as either assets or liabilities in the accompanying consolidated balance sheet and measures those instruments at fair value. Changes in the fair value of such contracts are reported in earnings as a component of “Other income, net.”
Commitments and Contingencies
The Company establishes reserves for the estimated cost of environmental, legal and other contingencies when such expenditures are probable and reasonably estimable. A significant amount of judgment is required to estimate and quantify the ultimate exposure in these matters. The Company engages outside experts as deemed necessary or appropriate to assist in the evaluation of exposure. From time to time, as information becomes available regarding changes in circumstances for ongoing issues as well as information regarding emerging issues, the potential liability is reassessed and reserve balances are adjusted as necessary. Revisions to the estimates of potential liability, and actual expenditures related to commitments and contingencies, could have a material impact on the results of operations or financial position.
Warranty
The Company generally offers a warranty for its products. The specific terms and conditions of those warranties vary depending upon the product sold. The Company estimates the costs that may be incurred under its warranties and records a liability in the amount of such costs at the time product revenue is recognized. Factors that affect the Company's warranty liability include historical product-failure experience and estimated repair costs for identified matters. The Company regularly assesses the adequacy of its recorded warranty liabilities and adjusts the amounts as necessary.
Concentration of Credit Risk
The Company's accounts receivables are comprised primarily of independent dealers and direct customers. The Company monitors and manages the credit risk associated with the individual dealers and direct customers. The independent dealers are responsible for assessing and assuming the credit risk of their customers, and may require their customers to provide deposits or other credit enhancement measures. Historically the Company has had a concentration of federal and local government receivables; however, they carry minimal credit risk.
Foreign Currency Translation
Results of foreign operations are translated into U.S. dollars using average exchange rates during the year, while assets and liabilities are translated into U.S. dollars using the exchange rates as of the balance sheet dates. The resulting translation adjustments are recorded in accumulated other comprehensive income (loss).
50
KNOLL, INC.
NOTES TO THE CONSOLIDATED FINANCIAL STATEMENTS
DECEMBER 31, 2016
Transaction gains and losses resulting from exchange rate changes on transactions denominated in currencies other than the functional currency of the applicable subsidiary are included in the consolidated statements of operations, within other (income) expense, net, in the year in which the change occurs.
Stock-Based Compensation
The Company measures the cost of employee services received in exchange for an award of equity instruments based on the grant-date fair value of the award. Forfeitures are recognized when they occur.
Stock Options
The fair value of stock options is estimated at the date of grant using the Black-Scholes option pricing model, which requires management to make certain assumptions of future expectations based on historical and current data. The assumptions include the expected term of the options, risk-free interest rate, expected volatility, and dividend yield. The expected term represents the expected amount of time that options granted are expected to be outstanding, based on historical and forecasted exercise behavior. The risk-free rate is based on the rate at grant date of zero-coupon U.S. Treasury Notes with a term equal to the expected term of the option. Expected volatility is estimated based on the historical volatility of the Company's stock price. The Company's dividend yield is based on historical data. The Company recognizes compensation expense using the straight-line method over the vesting period.
Restricted Stock and Restricted Stock Units
The fair value of restricted stock and restricted stock units, excluding market-based restricted stock units, is based upon the closing market price of the Company's common stock on the date of grant. The Company recognizes compensation expense using the straight-line method over the vesting period.
The fair value of the market-based restricted stock units is estimated at the date of grant using a lattice pricing model, which requires management to make certain assumptions based on both historical and current data. These awards vest based upon the performance of the Company's stock price relative to a peer group. The assumptions included in the model include, but are not limited to, risk-free interest rate, expected volatility of the Company's and the peer group's stock prices, and dividend yield. The risk-free rate is based upon the applicable U.S. Treasury Note rate. Expected volatility is estimated based on the historical volatility of the companies' stock prices. The dividend yield is based on the Company's historical data.
Pension and Other Post-Employment Benefits
The Company sponsors two defined benefit pension plans and two other post-employment benefit plans ("OPEB"). Several statistical and other factors, which attempt to anticipate future events, are used in calculating the expense and liability related to the plans. Key factors include assumptions about the expected rates of return on plan assets, discount rates, and health care cost trend rates. The Company considers market and regulatory conditions, including changes in investment returns and interest rates, in making these assumptions.
The Company determines the expected long-term rate of return on plan assets based on aggregating the expected rates of return for each component of the plan's asset mix. The Company uses historic plan asset returns combined with current market conditions to estimate the rate of return. The expected rate of return on plan assets is a long-term assumption and generally does not change annually. The discount rate reflects the market rate for high-quality fixed income debt instruments as of the Company's annual measurement date and is subject to change each year.
Unrecognized actuarial gains and losses are recognized over the expected remaining lifetime of the plan participants. Unrecognized actuarial gains and losses arise from several factors, including experience and assumption changes with respect to the obligations of the pension and OPEB plans, and from the difference between expected returns and actual returns on plan assets. These unrecognized gains and losses are systematically recognized as a change in future net periodic pension expense in accordance with the appropriate accounting guidance relating to defined benefit pension and OPEB plans.
Key assumptions used in determining the amount of the obligation and expense recorded for the OPEB plans include the assumed discount rate and the assumed rate of increases in future health care costs. In estimating the health care cost trend rate, the Company considers actual health care cost experience, future benefit structures, industry trends and advice from its actuaries. The Company assumes that the relative increase in health care costs will generally trend downward over the next several years, reflecting assumed increases in efficiency and cost-containment initiatives in the health care system.
51
KNOLL, INC.
NOTES TO THE CONSOLIDATED FINANCIAL STATEMENTS
DECEMBER 31, 2016
In accordance with the appropriate accounting guidance, the Company has recognized the funded status (i.e., the difference between the fair value of plan assets and the projected benefit obligation) of the defined benefit pension and OPEB plans in the consolidated balance sheets. To record the unfunded status of the plans, the Company recorded an additional liability and an adjustment to accumulated other comprehensive loss, net of tax. Other changes in the benefit obligation including net actuarial loss (gain), prior service cost (credit) or curtailment (gain) loss are recognized in other comprehensive income.
The actuarial assumptions the Company used in determining the pension and OPEB retirement benefits may differ materially from actual results due to changing market and economic conditions, higher or lower withdrawal rates, or longer or shorter life spans of participants. While the Company believes that the assumptions used are appropriate, differences in actual experience or changes in assumptions may materially affect the financial position or results of operations.
As of December 31, 2015, the Company changed the method it uses to estimate the interest cost component of net periodic benefit cost for pension and other post-employment benefits. This change resulted in a decrease in the interest cost component for 2016, compared to the previous method. Historically, the Company estimated the interest cost component utilizing a single weighted-average discount rate derived from the yield curve used to measure the benefit obligation at the beginning of the period. The Company has elected to utilize a full yield curve approach in the estimation of this component by applying the specific spot rates along the yield curve used in the determination of the benefit obligation to the relevant projected cash flows. The Company has made this change to provide a more precise measurement of interest cost by improving the correlation between projected benefit cash flows to the corresponding spot yield curve rates. This change did not affect the measurement of the total benefit obligation at the annual measurement date, as the change in interest cost is completely offset by deferred actuarial (gains)/losses that will arise at the next annual measurement date. As this change is treated as a change in estimate inseparable from a change in accounting principle, historical measurements of interest cost are not affected. This change in estimate reduced the Company's annual net periodic benefit expense in 2016 by approximately $2.7 million.
Segment Information
Accounting Standards Codification 280, Segment Reporting, defines that a segment for reporting purposes is based on the financial performance measures that are regularly reviewed by the “Chief Operating Decision Maker” to assess segment performance and to make decisions about a public entity's allocation of resources. Based on this guidance, the Company reports its segment results based on its reporting segments: Office, Studio, and Coverings. All unallocated expenses are included within Corporate.
The Office segment includes a complete range of workplace products that address diverse workplace planning paradigms. These products include: systems furniture, seating, storage, tables, desks and KnollExtra® accessories as well as the international sales of our North American Office products.
The Studio segment includes KnollStudio®, HOLLY HUNT®, Knoll Europe and DatesWeiser. KnollStudio products, include iconic seating, lounge furniture, side, cafe and dining chairs as well as conference, training and dining and occasional tables. HOLLY HUNT® is known for high quality residential furniture, lighting, rugs, textiles and leathers. In 2016, HOLLY HUNT® acquired Vladimir Kagan Design Group, a renowned collection of modern luxury furnishings. Knoll Europe, which distributes both KnollStudio and Knoll Office products, manufactures and sells products to customers primarily in Europe. DatesWeiser, known for its sophisticated meeting and conference tables and credenzas, sets a standard for design, quality and technology integration.
The Coverings segment includes KnollTextiles®, Spinneybeck® (including Filzfelt®), and Edelman® Leather. These businesses provide a wide range of customers with high-quality fabrics, felt, leather and related architectural products.
In 2016, the Company determined it appropriate to revise its segment presentation to segregate Corporate costs. The Company believes this facilitates improved communication as it reports segment results and better aligns with how it views and operates the Company. Corporate costs represent the accumulation of unallocated costs relating to shared services and general corporate activities including, but not limited to, legal expenses, acquisition expenses, certain finance, human resources, administrative and executive expenses and other expenses that are not directly attributable to an operating segment. Dedicated, direct selling, general and administrative expenses of the segments continue to be included within segment operating profit. Management regularly reviews the costs included in the Corporate function, and believes disclosing such information provides more visibility and transparency of how the chief operating decision maker reviews the results for the Company.
Reclassifications
Certain amounts in the prior years' consolidated financial statements have been reclassified to conform to the current-year presentation.
52
KNOLL, INC.
NOTES TO THE CONSOLIDATED FINANCIAL STATEMENTS
DECEMBER 31, 2016
New Accounting Pronouncements
In May 2014, the FASB issued ASU No. 2014-09, “Revenue from Contracts with Customers”, which outlines a single comprehensive model for entities to use in accounting for revenue arising from contracts with customers. This ASU supersedes the revenue recognition requirements in FASB ASC Topic 605, “Revenue Recognition,” and most industry-specific guidance. This ASU sets forth a five-step model for determining when and how revenue is recognized. Under the model, an entity will be required to recognize revenue to depict the transfer of goods or services to a customer at an amount reflecting the consideration it expects to receive in exchange for those goods or services. ASU 2014-09 is effective for interim and annual periods beginning after December 15, 2016. The FASB subsequently deferred the effective date of this standard to December 15, 2017 with early adoption permitted as of December 15, 2016. The Company will adopt the new standard in the annual period beginning January 1, 2018. The standard permits the use of either the full retrospective or modified retrospective (cumulative effect) transition method. Transition practical expedients are available for both methods. The Company plans to apply the modified retrospective transition method. The Company assembled an implementation work team to assess and document the accounting conclusions for the adoption of ASU 2014-09 and will continue to evaluate and assess the impact on the Company's consolidated financial statements. At this time the Company believes the impact to the financial statements will be immaterial.
In April 2015, the FASB issued ASU No. 2015-03 - Interest—Imputation of Interest (Subtopic 835-30). This ASU simplifies the presentation of debt issuance costs by requiring that debt issuance costs related to a recognized debt liability be presented in the balance sheet as a direct reduction from the carrying amount of the debt liability, which is consistent with the treatment of debt discounts. The new guidance should be applied on a retrospective basis, and upon transition, an entity is required to comply with the applicable disclosures necessary for a change in accounting principle. This ASU is effective for fiscal years beginning after December 15, 2015, and for interim periods within those fiscal years. The Company reclassified deferred financing fees of $1.6 million and $2.3 million from other noncurrent assets to long-term debt as of December 31, 2016 and 2015, respectively.
In July 2015, the FASB issued ASU 2015-11 - Inventory (Topic 330), which amends existing guidance for measuring inventories. This amendment will require the Company to measure inventories recorded using the first-in, first-out method at the lower of cost and net realizable value. This amendment does not change the methodology for measuring inventories recorded using the last-in, first-out method. This amendment will be effective for fiscal years beginning after December 15, 2016. Early adoption is permitted. The Company does not expect the impact of the adoption of this ASU to have a material impact on its consolidated financial position, results of operations and cash flows.
In November 2015, the FASB issued ASU No. 2015-17, Income Taxes (Topic 740): Balance Sheet Classification of Deferred Taxes. The amendments in this ASU require that deferred tax liabilities and assets be classified as one net noncurrent deferred tax asset or liability by jurisdiction in a classified statement of financial position. The amendments in this ASU are effective for financial statements issued for annual periods beginning after December 15, 2016, and interim periods within those annual periods. Earlier application is permitted for all entities as of the beginning of an interim or annual reporting period. The amendments in this ASU may be applied either prospectively or retrospectively. The Company elected to early adopt this standard on a prospective basis as of December 31, 2016. As a result, at December 31, 2016, the Company reclassified $18.5 million of current deferred tax assets to long term deferred tax liabilities.
In February 2016, the FASB issued guidance codified in ASC 842, Leases, which supersedes the guidance in ASC 840, Leases. ASC 842 will be effective for the Company on January 1, 2019, and the Company will adopt the standard using the modified retrospective approach. Footnote 9 provides details on the Company’s current lease arrangements. While the Company continues to evaluate the provisions of ASC 842 to determine how it will be affected, the primary effect of adopting the new standard will be to record assets and obligations for current operating leases. The Company is currently in the process of evaluating the impact of adoption of the ASU on its consolidated financial statements.
In March 2016, the FASB issued ASU 2016-09, Improvements to Employee Share-Based Payment Accounting, which amends Accounting Standards Codification Topic 718, Compensation – Stock Compensation. ASU 2016-09 simplifies several aspects of the accounting for share-based payment transactions, including the income tax consequences, classification of awards as either equity or liabilities, and classification on the statement of cash flows. ASU 2016-09 is effective for fiscal years beginning after December 15, 2016, and interim periods within those fiscal years and early adoption is permitted. The Company early adopted this standard during the year ended December 31, 2016. As a result of the adoption of this standard,
•excess tax benefits of $0.5 million were recorded through income tax expense for the year ended December 31, 2016;
•excess tax benefits were combined with current income taxes within operating cash flows adopted on a prospective basis;
53
KNOLL, INC.
NOTES TO THE CONSOLIDATED FINANCIAL STATEMENTS
DECEMBER 31, 2016
•the Company elected to change its policy from estimating forfeitures to recognizing forfeitures when they occur and as a result approximately$0.1 million of cumulative estimated forfeiture expense was recorded to retained earnings as of January 1, 2016;
•cash paid by the Company when directly withholding shares to satisfy an employee's statutory tax obligations continued to be classified as a financing activity and are included within the purchase of common stock for treasury line item; and
•there was no impact on prior periods due to adopting the guidance on a prospective basis.
In January 2017, the FASB issued ASU 2017-04, Intangibles - Goodwill and Other (Topic 350): Simplifying the Test for Goodwill Impairment. ASU 2017-04 simplifying the accounting for goodwill impairment that removes the second step of the goodwill impairment test that requires a hypothetical purchase price allocation. Under the new guidance, goodwill impairment will be measured and recognized as the amount by which a reporting unit’s carrying value exceeds its fair value, not to exceed the carrying amount of goodwill allocated to the reporting unit. The revised guidance does not affect the reporting entity’s ability to first assess qualitative factors by reporting unit to determine whether it is necessary to perform the quantitative goodwill impairment test. The guidance is effective for goodwill impairment tests in fiscal years beginning after December 15, 2019, with early adoption.
3. ACQUISITIONS
On September 9, 2016, Holly Hunt Enterprises, Inc. (“HOLLY HUNT®”) completed the acquisition of Vladimir Kagan Design Group (“Vladimir Kagan”), known for its elegant, mid-century and contemporary designs. The aggregate purchase price for the acquisition was $8.5 million, subject to working capital adjustments. The purchase price was funded from borrowings under the Company's revolving credit facility. The Company recorded the acquisition of Vladimir Kagan using the acquisition method of accounting and recognized the assets acquired and liabilities assumed at their fair values as of the date of the acquisition. The results of operations of Vladimir Kagan have been included in the Company's Studio segment beginning September 9, 2016.
On December 1, 2016, the Company completed the acquisition of DatesWeiser Furniture Corporation (“DatesWeiser”), a designer and manufacturer of contemporary wood conference and meeting room furniture. The aggregate purchase price for the acquisition was $11.0 million, subject to working capital adjustments, plus certain contingent payouts of up to $4.0 million in the aggregate based on the future performance of the business. The purchase price was funded from borrowings under the Company's revolving credit facility. The Company recorded the acquisition of DatesWeiser using the acquisition method of accounting and recognized the assets acquired and liabilities assumed at their fair values as of the date of the acquisition. The results of operations of DatesWeiser have been included in the Company's Studio segment beginning December 1, 2016.
The results of Vladimir Kagan and DatesWeiser in 2016, as well as pro forma financial information, have not been presented separately as the financial impact of these acquisitions are not considered material for the year ended December 31, 2016.
On February 3, 2014, the Company acquired HOLLY HUNT®. The acquisition advances the Company's strategy of building its global capability as a resource for high-design workplaces and homes, including the commercial contract, decorator to-the-trade and consumer markets. The aggregate purchase price for the acquisition was $95.0 million, plus certain contingent payouts of up to $16.0 million in the aggregate based on the future performance of the business. The purchase price was funded from borrowings under the Company's revolving credit facility. The Company recorded the acquisition of HOLLY HUNT using the acquisition method of accounting and recognized the assets acquired and liabilities assumed at their fair values as of the date of the acquisition. The Company finalized the purchase accounting for the acquisition of HOLLY HUNT during the first quarter of 2015 as no additional adjustments were made from the fair values assigned since December 31, 2014. The results of operations of HOLLY HUNT have been included in the Company's Studio segment beginning February 3, 2014.
The amount of sales and net earnings that resulted from the acquisition of HOLLY HUNT and attributable to Knoll, Inc. stockholders included in the consolidated statements of operations and comprehensive income during the twelve months ended December 31, 2014 were as follows (in thousands):
Year Ended December 31, 2014 | |||
Sales | $ | 102,572 | |
Net earnings attributable to Knoll, Inc. stockholders | $ | 6,291 | |
54
KNOLL, INC.
NOTES TO THE CONSOLIDATED FINANCIAL STATEMENTS
DECEMBER 31, 2016
The Company recorded acquisition costs in its consolidated statements of operations and comprehensive income, within selling, general, and administrative expenses during the year ended December 31, 2014 as follows (in thousands):
Year Ended December 31, 2014 | |||
Accounting and legal fees | $ | 435 | |
Other | 275 | ||
Total | $ | 710 | |
The following unaudited pro forma summary financial information presents the operating results of the combined company, assuming the acquisition had occurred as of January 1, 2013 (in thousands):
Year Ended December 31, 2014 | |||
Pro forma sales | $ | 1,058,115 | |
Pro forma net earnings attributable to Knoll, Inc. stockholders | $ | 47,079 | |
The unaudited pro forma financial information is presented for illustrative purposes only and is not necessarily indicative of the results that would have been attained had the acquisition occurred on January 1, 2013, nor is it indicative of results of operations for future periods. The pro forma information presented includes adjustments for acquisition costs, interest expense that would have been incurred to finance the acquisition, amortization and depreciation.
The results of this acquisition have been included in the Company's results of operations as of the acquisition date. This acquisition strengthened the Company's portfolio of products that can be offered.
4. RESTRICTED CASH
Included in the Company's consolidated balance sheets in cash and cash equivalents is restricted cash of $0.1 million as of December 31, 2016 and 2015, respectively. This restricted cash primarily represents a bond held in the United Kingdom in order to defer the payment of duties on imports into the United Kingdom.
5. INVENTORIES
Information regarding the Company's inventories is as follows (in thousands):
December 31, | |||||||
2016 | 2015 | ||||||
Raw materials | $ | 60,217 | $ | 58,412 | |||
Work-in-process | 7,186 | 7,470 | |||||
Finished goods | 74,669 | 74,916 | |||||
$ | 142,072 | $ | 140,798 | ||||
Inventory reserves for obsolescence and other estimated losses were $9.5 million and $8.3 million at December 31, 2016 and 2015, respectively, and have been included in the amounts above.
55
KNOLL, INC.
NOTES TO THE CONSOLIDATED FINANCIAL STATEMENTS
DECEMBER 31, 2016
6. PROPERTY, PLANT, AND EQUIPMENT, NET
Information regarding the Company's property, plant and equipment is as follows (in thousands):
December 31, | |||||||
2016 | 2015 | ||||||
Land | $ | 11,930 | $ | 11,826 | |||
Leasehold improvements | 46,125 | 41,897 | |||||
Buildings | 63,749 | 63,122 | |||||
Office equipment | 35,350 | 28,596 | |||||
Machinery and equipment | 232,777 | 226,198 | |||||
Construction-in-progress | 55,890 | 32,967 | |||||
Property, plant and equipment | 445,821 | 404,606 | |||||
Accumulated depreciation | (248,737 | ) | (232,464 | ) | |||
Property, plant, and equipment, net | $ | 197,084 | $ | 172,142 | |||
During 2016, 2015 and 2014, the Company capitalized interest of approximately $0.7 million, $0.3 million and $0.4 million, respectively.
7. GOODWILL AND OTHER INTANGIBLE ASSETS, NET
Information regarding the Company's other intangible assets are as follows (in thousands):
December 31, 2016 | December 31, 2015 | ||||||||||||||||||||||
Gross Amount | Accumulated Amortization | Net Amount | Gross Amount | Accumulated Amortization | Net Amount | ||||||||||||||||||
Indefinite-lived intangible assets: | |||||||||||||||||||||||
Tradenames | $ | 225,600 | $ | — | $ | 225,600 | $ | 220,650 | $ | — | $ | 220,650 | |||||||||||
Finite-lived intangible assets: | |||||||||||||||||||||||
Various | 34,585 | (18,315 | ) | 16,270 | 34,545 | (15,026 | ) | 19,519 | |||||||||||||||
Total | $ | 260,185 | $ | (18,315 | ) | $ | 241,870 | $ | 255,195 | $ | (15,026 | ) | $ | 240,169 | |||||||||
The Company completed the annual test of impairment for goodwill and tradenames (indefinite-lived intangible assets) as of October 1, 2016. The Company estimated the fair value of its reporting units using a combination of the fair values derived from both the income approach and the market approach.The Company estimated the fair value of the tradenames using a relief from royalty method under the income approach. Based on the results of the annual impairment test as of October 1, 2016, the Company determined there were no indications of impairment for goodwill or indefinite-lived intangible assets.
The Company also completed the annual test of impairment for tradenames (indefinite-lived intangible assets) as of October 1, 2015. The Company estimated the fair value of the tradenames using a relief from royalty method under the income approach. The key assumptions for this method are revenue projections, royalty rates based on a consideration of market rates, and a discount rate (based on the weighted-average cost of capital). Based on the results of the annual impairment test as of October 1, 2015, the Company determined that the Edelman Leather tradename was impaired as the estimated fair value of the Edelman Leather tradename was less than its respective carrying amount. The decline in the fair value of the Edelman Leather tradename was primarily the result of weaker than expected revenue performance in 2015 and a corresponding reduction of future revenue expectations. These revenue reductions were primarily a result of lower sales to private aviation customers. The fair value of the Edelman Leather tradename is estimated to be $6.5 million, resulting in a non-cash pre-tax impairment charge of $10.7 million during the fourth quarter of 2015. The impairment charge was separately disclosed in the consolidated statements of operations. These fair value measurements fell within Level 3 of the fair value hierarchy as described in Note 2. A significant decline in expected revenue or a change in the discount rate may result in future impairment charges. Edelman Leather is included within the Company’s Coverings Segment.
56
KNOLL, INC.
NOTES TO THE CONSOLIDATED FINANCIAL STATEMENTS
DECEMBER 31, 2016
The Company's amortization expense related to finite-lived intangible assets was $3.3 million, $3.2 million, and $3.1 million for the years ended December 31, 2016, 2015, and 2014, respectively. The expected amortization expense based on the finite-lived intangible assets as of December 31, 2016 is as follows (in thousands):
Estimated Amortization | |||
2017 | $ | 3,523 | |
2018 | 2,697 | ||
2019 | 2,465 | ||
2020 | 2,368 | ||
2021 | 2,235 | ||
The changes in the carrying amount of goodwill by reportable segment are as follows (in thousands):
Office Segment | Studio Segment | Coverings Segment | Total | ||||||||||||
Balance as of December 31, 2015 | $ | 35,499 | $ | 55,213 | $ | 36,959 | $ | 127,671 | |||||||
Foreign currency translation adjustment | 202 | 103 | — | 305 | |||||||||||
Goodwill acquired in acquisitions | — | 13,415 | — | 13,415 | |||||||||||
Balance as of December 31, 2016 | $ | 35,701 | $ | 68,731 | $ | 36,959 | $ | 141,391 | |||||||
8. OTHER CURRENT LIABILITIES
Information regarding the Company's other current liabilities is as follows (in thousands):
December 31, | |||||||
2016 | 2015 | ||||||
Accrued employee compensation | $ | 46,508 | $ | 44,011 | |||
Customer deposits | 31,216 | 36,906 | |||||
Warranty | 8,906 | 8,513 | |||||
Contingent payout | 7,100 | 5,000 | |||||
Other | 21,044 | 20,478 | |||||
Other current liabilities | $ | 114,774 | $ | 114,908 | |||
57
KNOLL, INC.
NOTES TO THE CONSOLIDATED FINANCIAL STATEMENTS
DECEMBER 31, 2016
9. LEASES
The Company has commitments under operating leases for certain machinery and equipment as well as manufacturing, warehousing, showroom and other facilities used in its operations. Some of the leases contain renewal provisions and generally require the Company to pay certain operating expenses, including utilities, insurance and taxes, which are subject to escalation. At times the Company enters into lease agreements which contain a provision for cash abatements related to certain leasehold improvements. These abatements are recognized on a straight-line basis as a reduction to rent expense over the lease term. The unamortized portions as of December 31, 2016 and 2015 were $5.2 million and $15.8 million, respectively. Total rent expense for 2016, 2015, and 2014 was $29.8 million, $28.6 million, and $28.8 million, respectively. Future minimum rental payments required, excluding maintenance and other miscellaneous charges, under those operating leases are as follows (in thousands):
Future Minimum Rental Payments | |||
2017 | $ | 24,797 | |
2018 | 22,267 | ||
2019 | 16,570 | ||
2020 | 13,472 | ||
2021 | 9,257 | ||
Subsequent years | 23,683 | ||
Total minimum lease payments | $ | 110,046 | |
10. PENSION AND OTHER POST-EMPLOYMENT BENEFITS
The Company has two domestic defined benefit pension plans and two plans providing for other post-employment benefits, including medical and life insurance coverage. One of the pension plans and one of the OPEB plans cover eligible U.S. nonunion employees while the other pension plan and OPEB plan cover eligible U.S. union employees. The Company uses a December 31 measurement date for all of these plans.
During 2014, the Company offered a one-time lump sum payment option to terminated vested participants in exchange for the right to receive future pension payments. As a result, the Company settled $30.2 million of benefit obligations and recorded a $6.1 million settlement charge during the year ended December 31, 2014.
During 2015, the Company approved amendments, effective December 31, 2015, to both the union and nonunion U.S. defined benefit pension plans. The Company also amended its remaining post-employment medical plan, effective May 1, 2015. The amendments eliminated the accrual of future benefits for all participants in the defined benefit pension plans and closed entry to new retirees into the post-employment medical plan. These amendments resulted in a curtailment gain of approximately $7.1 million. As the plans had unrealized losses in excess of the reduction of the projected benefit obligation at the date of amendment, the gain was recorded as a reduction of the projected benefit obligation and a corresponding reduction of unrealized losses within accumulated other comprehensive loss.
During 2016, the Company contributed $9.0 million and $43.0 million in discretionary contributions to the union and nonunion pension plans, respectively.
58
KNOLL, INC.
NOTES TO THE CONSOLIDATED FINANCIAL STATEMENTS
DECEMBER 31, 2016
The following table sets forth a reconciliation of the related benefit obligation and plan assets related to the benefits provided by the Company (in thousands):
Pension Benefits | Other Benefits | ||||||||||||||
2016 | 2015 | 2016 | 2015 | ||||||||||||
Change in projected benefit obligation: | |||||||||||||||
Projected benefit obligation at beginning of the period | $ | 273,809 | $ | 296,416 | $ | 6,294 | $ | 9,804 | |||||||
Service cost | 1,870 | 7,457 | — | 5 | |||||||||||
Interest cost | 9,662 | 12,350 | 196 | 289 | |||||||||||
Plan amendments | — | — | (998 | ) | (1,684 | ) | |||||||||
Participant contributions | — | — | 206 | 281 | |||||||||||
Actuarial (gain) loss | 7,207 | (21,134 | ) | 1,076 | (1,182 | ) | |||||||||
Benefits paid | (11,943 | ) | (15,867 | ) | (1,038 | ) | (1,219 | ) | |||||||
Liability (gain) related to curtailment | — | (5,413 | ) | — | — | ||||||||||
Administrative expenses paid | (412 | ) | — | — | — | ||||||||||
Projected benefit obligation at end of the period | $ | 280,193 | $ | 273,809 | $ | 5,736 | $ | 6,294 | |||||||
Accumulated benefit obligation at end of the period | $ | 280,193 | $ | 273,388 | $ | — | $ | — | |||||||
Change in plan assets: | |||||||||||||||
Fair value of plan assets at beginning of the period | $ | 210,556 | $ | 225,862 | $ | — | $ | — | |||||||
Actual return on plan assets | 11,662 | (50 | ) | — | — | ||||||||||
Employer contributions | 53,164 | 611 | 832 | 938 | |||||||||||
Participant contributions | — | — | 206 | 281 | |||||||||||
Actual expenses paid | (412 | ) | |||||||||||||
Benefits paid | (11,943 | ) | (15,867 | ) | (1,038 | ) | (1,219 | ) | |||||||
Benefits paid related to settlement | — | — | — | — | |||||||||||
Fair value of plan assets at the end of period | $ | 263,027 | $ | 210,556 | $ | — | $ | — | |||||||
Funded status | $ | (17,166 | ) | $ | (63,253 | ) | $ | (5,736 | ) | $ | (6,294 | ) | |||
Assumptions used in computing the benefit obligation as of December 31, 2016 and 2015 were as follows:
Pension Benefits | Other Benefits | ||||||||
2016 | 2015 | 2016 | 2015 | ||||||
Discount rate | 4.16 - 4.25% | 4.55 - 4.65% | 2.35 - 4.20% | 2.30 - 4.51% | |||||
Expected return on plan assets | 7.10 | % | 7.10 | % | N/A | N/A | |||
Rate of compensation increase | N/A | 2.50 | % | N/A | N/A | ||||
59
KNOLL, INC.
NOTES TO THE CONSOLIDATED FINANCIAL STATEMENTS
DECEMBER 31, 2016
The following table presents the fair value of the Company's pension plan investments as of December 31, 2016 and 2015 (in thousands):
Level 1 | Level 2 | Level 3 | Total | ||||||||||||
Equity Securities | |||||||||||||||
U.S. equity securities | $ | 103,649 | $ | — | $ | — | $ | 103,649 | |||||||
Non-U.S. equity securities | 36,936 | — | — | 36,936 | |||||||||||
Debt Securities | |||||||||||||||
Fixed income funds and cash investment funds | 122,442 | — | — | 122,442 | |||||||||||
December 31, 2016 | $ | 263,027 | $ | — | $ | — | $ | 263,027 | |||||||
Equity Securities | |||||||||||||||
U.S. equity securities | $ | 110,705 | $ | — | $ | — | $ | 110,705 | |||||||
Non-U.S. equity securities | 20,866 | — | — | 20,866 | |||||||||||
Debt Securities | |||||||||||||||
Fixed income funds and cash investment funds | 78,985 | — | — | 78,985 | |||||||||||
December 31, 2015 | $ | 210,556 | $ | — | $ | — | $ | 210,556 | |||||||
See Note 2 of the consolidated financial statements for the description of the levels of the fair value hierarchy.
The following table sets forth the consolidated balance sheets presentation for components relating to the Company's pension and OPEB plans (in thousands):
Pension Benefits | Other Benefits | ||||||||||||||
2016 | 2015 | 2016 | 2015 | ||||||||||||
(in thousands) | |||||||||||||||
Amounts recognized in the consolidated balance sheets consist of: | |||||||||||||||
Current liabilities | $ | — | $ | — | $ | (612 | ) | $ | (818 | ) | |||||
Noncurrent liabilities | (17,166 | ) | (63,253 | ) | (5,124 | ) | (5,476 | ) | |||||||
Net amount recognized | $ | (17,166 | ) | $ | (63,253 | ) | $ | (5,736 | ) | $ | (6,294 | ) | |||
Amounts recognized in accumulated other comprehensive income (loss) before taxes: | |||||||||||||||
Net actuarial loss (gain) | $ | 50,327 | $ | 40,493 | $ | 1,302 | $ | 474 | |||||||
Prior service cost (credit) | — | — | (3,477 | ) | (3,600 | ) | |||||||||
Net amount recognized | $ | 50,327 | $ | 40,493 | $ | (2,175 | ) | $ | (3,126 | ) | |||||
The following table sets forth other changes in the benefit obligation recognized in other comprehensive income for the Company's pension and OPEB plans (in thousands):
Pension Benefits | Other Benefits | ||||||||||||||
2016 | 2015 | 2016 | 2015 | ||||||||||||
Net actuarial loss (gain) | $ | 10,326 | $ | (6,629 | ) | $ | 581 | $ | (687 | ) | |||||
Prior service cost/(credit) | — | — | (998 | ) | (1,684 | ) | |||||||||
Curtailment (gain)/loss | — | (5,413 | ) | — | — | ||||||||||
Amortization of: | |||||||||||||||
Prior service credit | — | — | 1,120 | 852 | |||||||||||
Actuarial (loss) gain | (492 | ) | (6,311 | ) | 248 | 144 | |||||||||
Total recognized in OCI | $ | 9,834 | $ | (18,353 | ) | $ | 951 | $ | (1,375 | ) | |||||
60
KNOLL, INC.
NOTES TO THE CONSOLIDATED FINANCIAL STATEMENTS
DECEMBER 31, 2016
The net actuarial loss of $10.3 million for the pension plans in 2016 was mainly due to decreases in discount rates over the course of 2016. The net actuarial gain of $6.6 million in 2015 was mainly due to improved discount rates over the course of 2015 and the mortality improvement scale was updated to MP-2015, still using the RP- 2014 base table.
The estimated net actuarial loss for the defined benefit pension plans included in accumulated other comprehensive income and expected to be recognized in net periodic pension cost during the fiscal year ended December 31, 2017 is $0.6 million.
The following table sets forth the components of the net periodic benefit cost for the Company's pension and OPEB plans (in thousands):
Pension Benefits | Other Benefits | ||||||||||||||||||||||
2016 | 2015 | 2014 | 2016 | 2015 | 2014 | ||||||||||||||||||
Service cost | $ | 1,870 | $ | 7,457 | $ | 6,937 | $ | — | $ | 5 | $ | 23 | |||||||||||
Interest cost | 9,662 | 12,350 | 13,341 | 196 | 289 | 385 | |||||||||||||||||
Expected return on plan assets | (14,782 | ) | (14,455 | ) | (15,743 | ) | — | — | — | ||||||||||||||
Amortization of prior service cost (credit) | — | — | 10 | (1,120 | ) | (852 | ) | (2,029 | ) | ||||||||||||||
Recognized actuarial loss (gain) | 492 | 6,311 | 2,006 | (248 | ) | (144 | ) | 534 | |||||||||||||||
Settlement and curtailment related expense | — | — | 6,060 | — | — | 449 | |||||||||||||||||
Net periodic benefit (income) cost | $ | (2,758 | ) | $ | 11,663 | $ | 12,611 | $ | (1,172 | ) | $ | (702 | ) | $ | (638 | ) | |||||||
For the year ended December 31, 2016, $1.5 million and $1.3 million of pension income was recorded in cost of sales and selling, general, and administrative expenses, respectively. For the years ended December 31, 2015 and 2014, $6.5 million and $7.3 million of pension expense was recorded in cost of sales and $5.2 million and $5.3 million was recorded in selling, general, and administrative expenses, respectively.
Assumptions used to determine net periodic benefit cost for the years ended December 31, 2016, 2015, and 2014 were as follows:
Pension Benefits | Other Benefits | |||||||||||||
2016 | 2015 | 2014 | 2016 | 2015 | 2014 | |||||||||
Discount rate | 4.55 - 4.65% | 4.18 - 4.54% | 5.10 - 5.18% | 2.30 - 4.51% | 1.69 - 4.20% | 2.69 - 5.05% | ||||||||
Expected return on plan assets | 7.10 | % | 7.10 | % | 7.10 | % | N/A | N/A | N/A | |||||
Rate of compensation increase | N/A | 2.50 | % | 2.50 | % | N/A | N/A | N/A | ||||||
The expected long-term rate of return on assets is based on management's expectations of long-term average rates of return to be earned on the investment portfolio. In establishing this assumption, management considers historical and expected returns for the asset classes in which the plan assets are invested.
For purposes of measuring the benefit obligation associated with the Company's OPEB plans as of December 31, 2016, as well as the assumed rate for 2017, an annual rate increase of 5.80% to 6.20% in the per capita cost of covered health care benefits was assumed and a 11.1% annual rate of increase in the per capita cost of covered prescription drug benefits was assumed. The rates were then assumed to decrease to an ultimate rate of 4.5% for 2025 and thereafter. For purposes of measuring the net periodic benefit cost for 2016 associated with the Company's OPEB plans, a 6.0% to 6.5% annual rate of increase in the per capita cost of covered medical benefits was assumed and a 12.00% annual rate of increase in the per capita cost of covered prescription drug benefits was assumed. The rate was then assumed to decrease to an ultimate rate of 4.5% for 2023 and 2024 for both the medical plan and prescription drug plan and thereafter. Increasing the assumed health care cost trend rate by 1.0% would increase the benefit obligation as of December 31, 2016 by $75,000 and increase the aggregate of the service and interest cost components of net periodic benefit cost for 2016 by $2,400. Decreasing the assumed health care cost trend rate by 1.0% would decrease the benefit obligation as of December 31, 2016 by $70,000 and decrease the aggregate of the service and interest cost components of net periodic benefit cost for 2016 by $2,000.
61
KNOLL, INC.
NOTES TO THE CONSOLIDATED FINANCIAL STATEMENTS
DECEMBER 31, 2016
The Company's pension plans' weighted-average asset allocations as of December 31, 2016 and 2015, by asset category were as follows:
Plan Assets at December 31, | |||||
2016 | 2015 | ||||
Asset Category: | |||||
Temporary investment funds | 1 | % | 1 | % | |
Equity investment funds | 53 | % | 63 | % | |
Fixed income funds | 46 | % | 36 | % | |
Total | 100 | % | 100 | % | |
The Company's pension plans' investment policy includes an asset mix based on the Company's risk posture. The investment policy states a target allocation based on the plans’ funded status of 54% equity funds and 46% fixed income funds. Inclusion of the fixed income assets is to hedge risk associated with the plans’ liabilities along with providing potential growth through income. These assets should primarily invest in fixed income instruments of the U.S. Treasury and government agencies and investment-grade corporate bonds. The equity fund investments can consist of broadly diversified domestic equity, international equity, fixed income (return seeking), alternative investments, commodities, and real estate assets. The purpose of these assets is to provide the opportunity for capital appreciation, income, and the ability to diversify investments. A mix of mutual funds, ETF’s, and separate accounts are used as the plans' investment vehicles with clearly stated investment objectives and guidelines, as well as offer competitive long-term results.
The Company expects to contribute $0.6 million to its OPEB plans in 2017. Currently, No contributions are expected in 2017 for the Company's pension plans. Estimated future benefit payments under the pension and OPEB plans are as follows (in thousands):
Pension Benefits | Other Benefits | ||||||
2017 | $ | 17,593 | $ | 612 | |||
2018 | 17,381 | 569 | |||||
2019 | 17,022 | 519 | |||||
2020 | 18,003 | 469 | |||||
2021 | 18,025 | 438 | |||||
2022 - 2026 | 89,404 | 1,812 | |||||
The Company also sponsors 401K retirement savings plans for all U.S. associates. Under the 401K retirement savings plans, participants may defer a portion of their earnings up to the annual contribution limits established by the Internal Revenue Service. The Company's total expense under the 401K plans for U.S. employees was $9.8 million for 2016, $5.6 million for 2015 and $2.5 million for 2014. Employees of the Canadian, Belgium and United Kingdom operations also participate in defined contribution pension plans sponsored by the Company. The Company's expense related to these plans for 2016, 2015, and 2014 was $1.0 million, $1.0 million, and $1.2 million, respectively.
11. FAIR VALUE OF FINANCIAL INSTRUMENTS
Financial Instruments
The fair values of the Company’s cash and cash equivalents, customer receivables, and accounts payable approximate carrying value due to their short maturities.
The fair value of the Company’s long-term debt approximates its carrying value, as it is variable rate debt and the terms are comparable to market terms as of the balance sheet dates, and are classified as Level 2.
62
KNOLL, INC.
NOTES TO THE CONSOLIDATED FINANCIAL STATEMENTS
DECEMBER 31, 2016
Assets and Liabilities Recorded at Fair Value on a Recurring Basis
The following table represents the assets and liabilities, measured at fair value on a recurring basis and the basis for that measurement (in thousands):
Fair Value as of December 31, 2016 | Fair Value as of December 31, 2015 | ||||||||||||||||||||||||||||||
Liabilities: | Level 1 | Level 2 | Level 3 | Total | Level 1 | Level 2 | Level 3 | Total | |||||||||||||||||||||||
Contingent purchase price payment - Holly Hunt | $ | — | $ | — | $ | 6,000 | $ | 6,000 | $ | — | $ | — | $ | 11,000 | $ | 11,000 | |||||||||||||||
Contingent purchase price payment - DatesWeiser | — | — | 1,100 | 1,100 | — | — | — | — | |||||||||||||||||||||||
Total | $ | — | $ | — | $ | 7,100 | $ | 7,100 | $ | — | $ | — | $ | 11,000 | $ | 11,000 | |||||||||||||||
Pursuant to the agreement governing the acquisition of HOLLY HUNT®, the Company may be required to make annual contingent purchase price payments. The payouts are based upon HOLLY HUNT® reaching an annual net sales target, for each year through 2016, and are paid out on or around February 20 of the following calendar year. The Company classifies this as a Level 3 measurement and is required to remeasure this liability at fair value on a recurring basis. The fair value of such contingent purchase price payments was determined at the time of acquisition based upon net sales projections for HOLLY HUNT® for 2014, 2015, and 2016. The Company paid $5.0 million of the contingent purchase price in 2016, as a result of HOLLY HUNT® achieving the 2015 net sales projections. Excluding the initial recognition of the liability for the contingent purchase price payments and payments made to reduce the liability, any changes in the fair value would be included within selling, general and administrative expenses.
Pursuant to the agreement governing the acquisition of DatesWeiser, the Company may be required to make annual contingent purchase price payments. The payouts are based upon DatesWeiser reaching an annual net sales target, for each year through 2020. The Company classifies this as a Level 3 measurement and is required to remeasure this liability at fair value on a recurring basis. The fair value of such contingent purchase price payments was determined at the time of acquisition based upon net sales projections for DatesWeiser for 2017, 2018, 2019 and 2020. Excluding the initial recognition of the liability for the contingent purchase price payments and payments made to reduce the liability, any changes in the fair value would be included within selling, general and administrative expenses.
There were no additional assets and/or liabilities recorded at fair value on a recurring basis as of December 31, 2016 or 2015.
Assets and Liabilities Recorded at Fair Value on a Nonrecurring Basis
The following table represents non-recurring fair value amounts (as measured at the time of adjustment) for those assets remeasured to fair value on a nonrecurring basis during 2015 (in thousands):
Fair Value as of October 1, 2015 | |||||||||||||
Description | Level 1 | Level 2 | Level 3 | Total | |||||||||
Edelman Leather tradename | — | — | $ | 6,500 | $ | 6,500 | |||||||
Based on the results of the 2015 annual impairment test, the Company determined that the Edelman tradename was impaired that year. The Company estimated the fair value of the indefinite-life intangible asset using the relief-from-royalty method under the income approach as of October 1, 2015. The Company used a royalty rate of 2.5% based on comparable market rates and a discount rate of 12.0%. Refer to Note 7 for more details regarding the impairment testing.
There were no additional assets and/or liabilities remeasured to fair value on a nonrecurring basis as of December 31, 2016 or 2015 and for the years then ended.
63
KNOLL, INC.
NOTES TO THE CONSOLIDATED FINANCIAL STATEMENTS
DECEMBER 31, 2016
12. INDEBTEDNESS
The Company's long-term debt is summarized as follows (in thousands):
December 31, | |||||||
2016 | 2015 | ||||||
Balance of revolving credit facility | $ | 45,000 | $ | 37,000 | |||
Balance of term loan | 175,000 | 185,000 | |||||
Total long-term debt | 220,000 | 222,000 | |||||
Less: Current maturities of long-term debt | 10,000 | 10,000 | |||||
Less: Deferred financing fees, net | 1,617 | 2,282 | |||||
Long-term debt | $ | 208,383 | $ | 209,718 | |||
At December 31, 2016 and 2015, the Company's interest rates were approximately 2.0% and 1.9%, respectively.
Credit Facilities
On May 20, 2014, the Company amended and restated its existing credit facility, dated February 3, 2012, with a new $500.0 million credit facility maturing on May 20, 2019, consisting of a revolving commitment in the amount of $300.0 million and a term loan commitment in the amount of $200.0 million (“Amended Credit Agreement”). The Amended Credit Agreement also includes an option to increase the size of the revolving credit facility or incur incremental term loans by up to an additional $200.0 million, subject to the satisfaction of certain terms and conditions.
Borrowings under the revolving credit facility may be repaid at any time, but no later than the maturity date on May 20, 2019. Obligations under the credit facility are secured by a first priority security interest in (i) the capital stock of certain present and future subsidiaries (with limitations on foreign subsidiaries) and (ii) all present and future property and assets of the Company (with various limitations and exceptions). The Company retains the right to terminate or reduce the size of the revolving credit facility at any time. Borrowings under the term loan facility are due in equal quarterly installments of $2.5 million, with the remaining borrowings due on the maturity date.
Interest on revolving credit and term loans will accrue, at the Company’s election, at (i) the Eurocurrency Rate (as defined in the Amended Credit Agreement), plus additional percentage points based on the Company’s leverage ratio or (ii) the Base Rate (a rate based on the higher of (a) the prime rate announced from time-to-time by Bank of America, N.A., (b) the Federal Reserve System’s federal funds rate, plus .50% or (c) the Eurocurrency Rate plus 1.00%; Base Rate is defined in detail in the Amended Credit Agreement), plus additional percentage points based on the Company’s leverage ratio.
The Company is required to pay an annual commitment fee equal to a rate per annum calculated as the product of the applicable rate based upon the Company's leverage ratio as set forth in the credit agreement, times the unused portion of the revolving credit facility. In addition, the Company is required to pay a letter of credit fee equal to the applicable rate based upon the Company's leverage ratio as set forth in the credit agreement times the daily maximum amount available to be drawn under such letter of credit. The commitment and letter of credit fees are payable in arrears on the last business day of each quarter.
The Amended Credit Agreement requires the Company to comply with various affirmative and negative covenants, including without limitation (i) covenants to maintain a minimum specified interest coverage ratio and maximum specified net leverage ratio, and (ii) covenants that prevent or restrict the Company’s ability to pay dividends, engage in certain mergers or acquisitions, make certain investments or loans, incur future indebtedness, engage in sale-leaseback transactions, alter its capital structure or line of business, prepay subordinated indebtedness, engage in certain transactions with affiliates and sell stock or assets. The Company was in compliance with the Amended Credit Agreement covenants at December 31, 2016.
Repayments under the Amended Credit Agreement can be accelerated by the lenders upon the occurrence of certain events of default, including, without limitation, a failure to pay any principal, interest or other amounts in respect of loans when due, breach by the Company (or its subsidiaries) of any of the covenants or representations contained in the Amended Credit Agreement or related loan documents, failure of the Company (or its material subsidiaries) to pay any amounts owed with respect to other significant indebtedness of the Company or such subsidiary, or a bankruptcy event with respect to the Company or any of its material subsidiaries.
64
KNOLL, INC.
NOTES TO THE CONSOLIDATED FINANCIAL STATEMENTS
DECEMBER 31, 2016
Deferred Financing Fees
In connection with the refinancing of the Company's previous credit facility during 2014, the Company wrote off $0.3 million of unamortized deferred financing fees associated with the previous credit facility and incurred $1.9 million in new financing fees that will be amortized as a component of interest expense over the life of the new facility through May 2019. Deferred financing fees, net of accumulated amortization, totaled $1.6 million and $2.3 million as of December 31, 2016 and 2015, respectively. Amortization expense related to the deferred financing fees, included in interest expense, was $0.7 million for each of the years ended December 31, 2016, 2015 and 2014, respectively.
Other Borrowings
The Company also has several revolving credit agreements with various European financial institutions. These credit agreements provide credit primarily for overdraft and working capital purposes. As of December 31, 2016, total credit available under such agreements was approximately $10.2 million, and the Company had no outstanding borrowings under the European credit facilities as of December 31, 2016 or 2015. There is currently no expiration date on these agreements. The interest rates on borrowings are variable and are based on the monetary market rate that is linked to each country's prime rate.
13. COMMITMENTS AND CONTINGENCIES
Litigation
The Company is currently involved in matters of litigation, including environmental contingencies, arising in the ordinary course of business. The Company accrues for such matters when expenditures are probable and reasonably estimable. Based upon information presently known, management is of the opinion that such litigation, either individually or in the aggregate, will not have a material adverse effect on the Company’s financial position, results of operations, or cash flows.
Collective Bargaining
At December 31, 2016, the Company employed a total of 3,471 people. Approximately 11.0% of the total number of employees are represented by unions globally. The Grand Rapids, Michigan Plant is the only unionized plant within the U.S. and has an agreement with the Carpenters Union, Local 1615, of the United Brotherhood of Carpenters and Joiners of America, Affiliate of the Carpenters Industrial Council, covering approximately 200 hourly employees. The Collective Bargaining Agreement expires April 2018. Approximately 82 workers in Italy are also represented by state-sponsored unions. The union contracts under which these Italian workers are represented expire in 2018.
Warranty
The Company provides for estimated product warranty expenses when related products are sold and are included within other current liabilities. Because warranty estimates are forecasts that are based on the best available information, primarily historical claims experience, future warranty claims may differ from the amounts provided.
Changes in the warranty reserve are as follows (in thousands):
2016 | 2015 | 2014 | |||||||||
Balance, beginning of the year | $ | 8,513 | $ | 8,180 | $ | 8,214 | |||||
Provision for warranty claims | 6,792 | 7,249 | 6,664 | ||||||||
Warranty claims paid | (6,272 | ) | (6,801 | ) | (6,631 | ) | |||||
Foreign currency translation adjustment | (127 | ) | (115 | ) | (67 | ) | |||||
Balance, end of the year | $ | 8,906 | $ | 8,513 | $ | 8,180 | |||||
65
KNOLL, INC.
NOTES TO THE CONSOLIDATED FINANCIAL STATEMENTS
DECEMBER 31, 2016
14. STOCK PLANS
As of December 31, 2016, the Company sponsors three stock incentive plans under which awards denominated or payable in shares, units or options to purchase shares of Knoll common stock may be granted to officers, certain other employees, directors and consultants of the Company. In May 2007, the Company approved the 2007 Stock Incentive Plan which authorized the issuance of 2,000,000 shares of common stock; as of December 31, 2016, 7,306 shares remained available for issuance under this plan. In May 2010, the Company approved the 2010 Stock Incentive Plan which authorized the issuance of 2,000,000 shares of common stock; as of December 31, 2016, 26,496 shares remained available for issuance under this plan. In May 2013, the Company approved the 2013 Stock Incentive Plan which authorized the issuance of 2,000,000 shares of common stock; as of December 31, 2016, 1,460,089 shares remained available for issuance under this plan. As of December 31, 2016, an aggregate of 1,493,891 total shares remained available for issuance under these plans.
A Committee of the Board of Directors currently consisting of the Compensation Committee of the Company's Board of Directors, has sole discretion concerning administration of the plans including selection of individuals to receive awards, types of awards, the terms and conditions of the awards and the time at which awards will be granted.
Restricted Shares and Restricted Stock Units
During 2014, the Company granted 1,106,919 of restricted shares and restricted stock units to certain key employees and the Company's Board of Directors. 462,773 of these awards were granted at the weighted-average fair value of $15.43 per restricted share at the date of grant. The majority of these awards cliff vest on the third anniversary of the grant date. 200,000 of these awards were granted at the weighted-average fair value of $18.72 per restricted share and cliff vest on the fourth anniversary of the grant date. 331,896 of these awards were granted at the weighted-average fair value of $17.34 per restricted stock unit. These awards vest based upon the Company achieving certain cumulative operating performance target goals over the next three years. 112,250 of these awards were granted at the weighted-average fair value of $8.24 per restricted stock unit. These awards vest based upon the performance of the Company's stock price relative to a peer group over the next three years.
During 2015, the Company granted 314,360 of restricted shares and restricted stock units to certain key employees and the Company's Board of Directors. 168,360 of these awards were granted at the weighted-average fair value of $21.59 per restricted share at the date of grant. The majority of these awards cliff vest on the third anniversary of the grant date. 73,000 of these awards were granted at the weighted-average fair value of $21.64 per restricted stock unit. These awards vest based upon the Company achieving certain cumulative operating performance target goals over the next three years. 73,000 of these awards were granted at the weighted-average fair value of $12.14 per restricted stock unit. These awards vest based upon the performance of the Company's stock price relative to a peer group over the next three years.
During 2016, the Company granted 586,141 of restricted shares and restricted stock units to certain key employees and the Company's Board of Directors. 313,632 of these awards were granted at the weighted-average fair value of $18.65 per restricted share at the date of grant. The majority of these awards cliff vest on the third anniversary of the grant date. 163,509 of these awards were granted at the weighted-average fair value of $18.81 per restricted stock unit. These awards vest based upon the Company achieving certain cumulative operating performance target goals over the next three years. 109,000 of these awards were granted at the weighted-average fair value of $13.02 per restricted stock unit. These awards vest based upon the performance of the Company's stock price relative to a peer group over the next three years.
The following table summarizes the Company's restricted stock activity during the year:
Restricted Stock | Weighted-Average Fair Value | |||||
Outstanding at December 31, 2015 | 993,934 | $ | 17.34 | |||
Granted | 313,632 | 18.65 | ||||
Forfeited | (15,103 | ) | 17.73 | |||
Vested | (298,501 | ) | 16.51 | |||
Outstanding at December 31, 2016 | 993,962 | $ | 18.00 | |||
66
KNOLL, INC.
NOTES TO THE CONSOLIDATED FINANCIAL STATEMENTS
DECEMBER 31, 2016
The following table summarizes the Company's restricted stock units activity during the year:
Restricted Stock Units | Weighted-Average Fair Value | Restricted Stock Units Performance Based | Weighted-Average Fair Value | Restricted Stock Units Market Based | Weighted-Average Fair Value | |||||||||||||||
Outstanding at December 31, 2013 | 95,000 | $ | 14.04 | — | $ | — | — | $ | — | |||||||||||
Granted | — | — | 331,896 | 17.34 | 112,250 | 8.24 | ||||||||||||||
Forfeited | — | — | (8,813 | ) | 15.19 | (8,813 | ) | 8.14 | ||||||||||||
Vested | (15,000 | ) | 14.04 | — | — | — | — | |||||||||||||
Outstanding at December 31, 2014 | 80,000 | $ | 14.04 | 323,083 | $ | 17.36 | 103,437 | $ | 8.18 | |||||||||||
Granted | — | — | 73,000 | 21.64 | 73,000 | 12.14 | ||||||||||||||
Forfeited | — | — | (15,625 | ) | 15.92 | (15,625 | ) | 8.93 | ||||||||||||
Vested | (35,000 | ) | 14.04 | — | — | — | — | |||||||||||||
Outstanding at December 31, 2015 | 45,000 | $ | 14.04 | 380,458 | $ | 18.28 | 160,812 | $ | 10.12 | |||||||||||
Granted | — | — | 163,509 | 18.81 | 109,000 | 13.02 | ||||||||||||||
Forfeited | — | — | (8,862 | ) | 17.93 | (7,203 | ) | 11.42 | ||||||||||||
Vested | (15,000 | ) | 14.04 | — | — | — | — | |||||||||||||
Outstanding at December 31, 2016 | 30,000 | $ | 14.04 | 535,105 | $ | 18.45 | 262,609 | $ | 11.96 | |||||||||||
Stock Options
The following table summarizes the Company's stock option activity for the preceding three years.
Number of Options | Weighted-Average Exercise Price | Weighted- Average Remaining Contractual Life (years) | Aggregate Intrinsic Value | |||||||||
Outstanding at December 31, 2013 | 1,023,389 | $ | 14.48 | 2.71 | $ | 4,625,520 | ||||||
Exercised | (375,718 | ) | $ | 12.93 | $ | 2,237,704 | ||||||
Outstanding at December 31, 2014 | 647,671 | $ | 15.37 | 2.16 | $ | 4,016,809 | ||||||
Exercised | (377,671 | ) | $ | 14.98 | $ | 2,496,218 | ||||||
Outstanding at December 31, 2015 | 270,000 | $ | 15.93 | 1.44 | $ | 1,203,600 | ||||||
Exercised | (202,500 | ) | $ | 13.69 | $ | 1,597,398 | ||||||
Outstanding at December 31, 2016 | 67,500 | $ | 22.64 | 0.68 | $ | 357,225 | ||||||
Exercisable at December 31, 2016 | 63,500 | $ | 23.06 | 0.40 | $ | 309,425 | ||||||
The following table summarizes information regarding stock options outstanding and exercisable at December 31, 2016:
Options Outstanding | Options Exercisable | ||||||||||||||
Ranges of Exercise Prices | Number of Options | Weighted- Average Remaining Contractual Life (years) | Weighted- Average Exercise Price | Number of Options | Weighted- Average Exercise Price | ||||||||||
$15.98 | 7,500 | 5.19 | $ | 15.98 | 3,500 | $ | 15.98 | ||||||||
$23.47 | 60,000 | 0.12 | $ | 23.47 | 60,000 | $ | 23.47 | ||||||||
$15.98 - $23.47 | 67,500 | 0.68 | $ | 22.64 | 63,500 | $ | 23.06 | ||||||||
67
KNOLL, INC.
NOTES TO THE CONSOLIDATED FINANCIAL STATEMENTS
DECEMBER 31, 2016
A summary of the status of the Company's non-vested options as of December 31, 2016 and 2015, and changes during the year ended December 31, 2016, is presented below.
Number of Options | Weighted- Average Grant-Date Fair Value | |||||
Non-vested at December 31, 2015 | 8,000 | $ | 6.26 | |||
Vested | (4,000 | ) | $ | 6.26 | ||
Non-vested at December 31, 2016 | 4,000 | $ | 6.26 | |||
The total fair value of options vested during 2016, 2015 and 2014 were less than $0.1 million, respectively.
Total Awards
Compensation costs related to stock-based compensation for the years ended December 31, 2016, 2015, and 2014 totaled $10.5 million pre-tax ($6.8 million after-tax), $8.3 million pre-tax ($5.3 million after-tax), and $7.8 million pre-tax ($4.8 million after-tax), respectively, and are included within selling, general, and administrative expenses.
At December 31, 2016, the total compensation cost related to non-vested awards not yet recognized equaled $13.0 million for restricted stock awards and restricted stock units, with minimal costs related to non-vested stock options. The weighted-average remaining period over which the cost is to be recognized is 1.4 years.
15. STOCKHOLDERS' EQUITY
Preferred Stock
The Company's Certificate of Incorporation authorizes the issuance of 10,000,000 shares of preferred stock with a par value of $1.00 per share. Subject to applicable laws, the Board of Directors is authorized to provide for the issuance of preferred shares in one or more series, for such consideration and with designations, powers, preferences and relative, participating, optional or other special rights and the qualifications, limitations or restrictions thereof, as shall be determined by the Board of Directors. There was no preferred stock outstanding as of December 31, 2016, 2015 or 2014.
Common Stock
The following table demonstrates the change in the number of shares of common stock outstanding during the years ended December 2016, 2015, and 2014 (excludes non-voting restricted shares).
Shares outstanding as of December 31, 2013 | 47,059,458 | |
Purchase of common stock | (270,467 | ) |
Shares issued under stock incentive plan, net of awards surrender to pay applicable taxes | 319,773 | |
Exercise of stock options | 375,718 | |
Shares issued to Board of Directors in lieu of cash | 3,028 | |
Shares outstanding as of December 31, 2014 | 47,487,510 | |
Purchase of common stock | (260,088 | ) |
Shares issued under stock incentive plan, net of awards surrender to pay applicable taxes | 218,458 | |
Exercise of stock options | 377,671 | |
Shares issued to Board of Directors in lieu of cash | 4,528 | |
Shares outstanding as of December 31, 2015 | 47,828,079 | |
Purchase of common stock | (123,577 | ) |
Shares issued under stock incentive plan, net of awards surrender to pay applicable taxes | 192,050 | |
Exercise of stock options | 202,500 | |
Shares issued to Board of Directors in lieu of cash | 3,276 | |
Shares outstanding as of December 31, 2016 | 48,102,328 | |
68
KNOLL, INC.
NOTES TO THE CONSOLIDATED FINANCIAL STATEMENTS
DECEMBER 31, 2016
Treasury Stock
As of December 31, 2016 and 2015, the Company held 15,645,358 and 15,781,331 treasury shares, respectively. The Company records repurchases of its common stock for treasury at cost.
Accumulated Other Comprehensive Income (Loss)
The components of accumulated other comprehensive income (loss) are as follows (in thousands):
Beginning Balance | Before-Tax Amount | Tax Benefit (Expense) | Net-of-Tax Amount | Ending Balance | |||||||||||||||
December 31, 2014 | |||||||||||||||||||
Pension and other post-employment liability adjustment | $ | (9,229 | ) | $ | (41,906 | ) | $ | 16,358 | $ | (25,548 | ) | $ | (34,777 | ) | |||||
Foreign currency translation adjustment | 14,366 | (12,271 | ) | — | (12,271 | ) | 2,095 | ||||||||||||
Accumulated other comprehensive income (loss) | $ | 5,137 | $ | (54,177 | ) | $ | 16,358 | $ | (37,819 | ) | $ | (32,682 | ) | ||||||
December 31, 2015 | |||||||||||||||||||
Pension and other post-employment liability adjustment | $ | (34,777 | ) | $ | 19,728 | $ | (7,783 | ) | $ | 11,945 | $ | (22,832 | ) | ||||||
Foreign currency translation adjustment | 2,095 | (16,581 | ) | — | (16,581 | ) | (14,486 | ) | |||||||||||
Accumulated other comprehensive income (loss) | $ | (32,682 | ) | $ | 3,147 | $ | (7,783 | ) | $ | (4,636 | ) | $ | (37,318 | ) | |||||
December 31, 2016 | |||||||||||||||||||
Pension and other post-employment liability adjustment | $ | (22,832 | ) | $ | (10,785 | ) | $ | 4,212 | $ | (6,573 | ) | $ | (29,405 | ) | |||||
Foreign currency translation adjustment | (14,486 | ) | 488 | — | 488 | (13,998 | ) | ||||||||||||
Accumulated other comprehensive income (loss) | $ | (37,318 | ) | $ | (10,297 | ) | $ | 4,212 | $ | (6,085 | ) | $ | (43,403 | ) | |||||
The following reclassifications were made from accumulated other comprehensive income (loss) to the statements of operations are as follows (in thousands):
December 31, | |||||||||||
2016 | 2015 | 2014 | |||||||||
Amortization of pension and other post-employment liability adjustments | |||||||||||
Prior service credits (1) | $ | 1,120 | $ | 852 | $ | 2,019 | |||||
Actuarial losses (1) | (244 | ) | (6,167 | ) | (2,540 | ) | |||||
Loss recognized during settlement | — | — | (6,509 | ) | |||||||
Total before tax | 876 | (5,315 | ) | (7,030 | ) | ||||||
Tax expense (benefit) | 312 | (1,929 | ) | (2,714 | ) | ||||||
Net of tax | $ | 564 | $ | (3,386 | ) | $ | (4,316 | ) | |||
(1) These accumulated other comprehensive income (loss) components are included in the computation of net periodic pension costs. See Note 10 for additional information.
69
KNOLL, INC.
NOTES TO THE CONSOLIDATED FINANCIAL STATEMENTS
DECEMBER 31, 2016
16. EARNINGS PER SHARE
Basic earnings per share excludes the dilutive effect of common shares that could potentially be issued due to the exercise of stock options and unvested restricted stock and restricted stock units, and is computed by dividing net income available to common shareholders by the weighted-average number of common shares outstanding for the period. Diluted earnings per share includes the effect of shares and potential shares and units issued under the stock incentive plans. The following table sets forth the reconciliation from basic to dilutive average common shares (in thousands):
Years ended December 31, | |||||||||||
2016 | 2015 | 2014 | |||||||||
Numerator: | |||||||||||
Net earnings attributable to Knoll, Inc. stockholders | $ | 82,084 | $ | 65,963 | $ | 46,596 | |||||
Denominator: | |||||||||||
Denominator for basic earnings per shares - weighted-average shares | 48,093 | 47,747 | 47,347 | ||||||||
Effect of dilutive securities: | |||||||||||
Potentially dilutive shares resulting from stock plans | 826 | 691 | 721 | ||||||||
Denominator for diluted earnings per share - weighted-average shares | 48,919 | 48,438 | 48,068 | ||||||||
Antidilutive equity awards not included in weighted-average common shares—diluted | — | 4 | 144 | ||||||||
Net earnings per common share attributable to Knoll, Inc. stockholders: | |||||||||||
Basic | $ | 1.71 | $ | 1.38 | $ | 0.98 | |||||
Diluted | $ | 1.68 | $ | 1.36 | $ | 0.97 | |||||
17. INCOME TAXES
Income before income tax expense consists of the following (in thousands):
2016 | 2015 | 2014 | |||||||||
U.S. operations | $ | 107,803 | $ | 77,996 | $ | 61,353 | |||||
Foreign operations | 19,735 | 25,423 | 14,397 | ||||||||
Total | $ | 127,538 | $ | 103,419 | $ | 75,750 | |||||
Income tax expense is comprised of the following (in thousands):
2016 | 2015 | 2014 | |||||||||
Current: | |||||||||||
Federal | $ | 11,980 | $ | 24,988 | $ | 20,154 | |||||
State | 2,840 | 6,101 | 4,472 | ||||||||
Foreign | 4,588 | 6,224 | 4,808 | ||||||||
Total current | 19,408 | 37,313 | 29,434 | ||||||||
Deferred: | |||||||||||
Federal | 23,814 | (1,098 | ) | (1,315 | ) | ||||||
State | 2,347 | 505 | 753 | ||||||||
Foreign | (145 | ) | 751 | 293 | |||||||
Total deferred | 26,016 | 158 | (269 | ) | |||||||
Income tax expense | $ | 45,424 | $ | 37,471 | $ | 29,165 | |||||
70
KNOLL, INC.
NOTES TO THE CONSOLIDATED FINANCIAL STATEMENTS
DECEMBER 31, 2016
The following table sets forth the tax effects of temporary differences that give rise to the deferred tax assets and liabilities (in thousands):
December 31, 2016 | December 31, 2015 | ||||||
Deferred tax assets | |||||||
Accounts receivable, principally due to allowance for doubtful accounts | $ | 2,985 | $ | 2,949 | |||
Inventories | 8,294 | 4,707 | |||||
Net operating loss carryforwards | 6,664 | 7,260 | |||||
Accrued pension | 7,637 | 25,939 | |||||
Stock-based compensation | 6,493 | 5,813 | |||||
Compensation-related accruals | 4,928 | 5,131 | |||||
Warranty | 3,222 | 3,245 | |||||
Obligation for post-employment benefits other than pension | 2,267 | 2,131 | |||||
Accrued liabilities and other items | 8,537 | 8,195 | |||||
Gross deferred tax assets | 51,027 | 65,370 | |||||
Valuation allowance | (6,161 | ) | (6,317 | ) | |||
Net deferred tax assets | 44,866 | 59,053 | |||||
Deferred tax liabilities: | |||||||
Intangibles | 86,961 | 84,931 | |||||
Plant and equipment | 34,759 | 29,596 | |||||
Gross deferred tax liabilities | 121,720 | 114,527 | |||||
Net deferred tax liabilities | $ | (76,854 | ) | $ | (55,474 | ) | |
Income taxes paid, net of refunds received, by the Company during 2016, 2015, and 2014, totaled $27.4 million, $40.8 million, and $18.6 million, respectively.
As of December 31, 2016, the Company had net operating loss carryforwards totaling approximately $26.7 million in Brazil, the United Kingdom, and Germany. The net operating loss carryforwards may be carried forward indefinitely. The Company provides a valuation allowance against certain net foreign deferred tax assets (principally the net operating loss carryforwards) due to the uncertainty that they can be realized.
The following table sets forth a reconciliation of the statutory federal income tax rate to the effective income tax rate:
2016 | 2015 | 2014 | ||||||
Federal statutory tax rate | 35.0 | % | 35.0 | % | 35.0 | % | ||
Increase (decrease) in the tax rate resulting from: | ||||||||
State taxes, net of federal effect | 3.3 | % | 4.4 | % | 3.5 | % | ||
Effect of tax rates of other countries | (1.4 | )% | (2.4 | )% | (0.4 | )% | ||
Section 199 deduction | (0.8 | )% | (0.9 | )% | (1.2 | )% | ||
Change in contingency reserve | (0.2 | )% | (0.2 | )% | 0.7 | % | ||
Limitation on deduction of officer’s compensation | 0.6 | % | 0.5 | % | 1.5 | % | ||
Other | (0.9 | )% | (0.2 | )% | (0.6 | )% | ||
Effective tax rate | 35.6 | % | 36.2 | % | 38.5 | % | ||
As of December 31, 2016, there is $129.0 million of cumulative earnings overseas. Approximately $12.4 million has been subject to tax under the U.S. Subpart F of Section 954 provisions. Accordingly, $116.6 million of earnings have not been subject to U.S. tax and are reinvested indefinitely. It is not practical to estimate the amount of U.S. tax that would result upon the eventual repatriation of such earnings.
As of December 31, 2016 and 2015, the Company had unrecognized tax benefits of approximately $0.9 million and $4.4 million, respectively. The entire amount of the unrecognized tax benefits would reduce the effective tax rate if recognized.
71
KNOLL, INC.
NOTES TO THE CONSOLIDATED FINANCIAL STATEMENTS
DECEMBER 31, 2016
The following table summarizes the activity related to the Company's unrecognized tax benefits during 2016, 2015, and 2014 (in thousands):
2016 | 2015 | 2014 | |||||||||
Balance, beginning of the year | $ | 4,407 | $ | 4,922 | $ | 4,611 | |||||
Additions for tax position related to the current year | 125 | 125 | 125 | ||||||||
Additions for tax position related to the prior year | 56 | 134 | 350 | ||||||||
Decreases for tax position related to the prior year | (250 | ) | (774 | ) | — | ||||||
Prior year reductions: | |||||||||||
Lapse of statute of limitations | (125 | ) | — | (164 | ) | ||||||
Settlements | (3,338 | ) | — | — | |||||||
Balance, end of the year | $ | 875 | $ | 4,407 | $ | 4,922 | |||||
During 2016, 2015, and 2014, respectively, the Company recognized approximately $0.1 million, $0.1 million and $0.2 million of interest and penalties. The Company has paid all accrued interest and penalties recognized prior to December 31, 2016, therefore the Company has no accruals for the payment of interest and penalties as of December 31, 2016. The Company accrued approximately $0.5 million for the payment of interest and penalties as of December 31, 2015.
As of December 31, 2016, the Company is subject to U.S. Federal Income Tax examination for the tax years 2007 through 2016, and to non-U.S. income tax examination for the tax years 2010 to 2016. In addition, the Company is subject to state and local income tax examinations for the tax years 2007 through 2016.
18. OTHER EXPENSE (INCOME), NET
The components of other expense (income), net are as follows (in thousands):
Years Ended December 31, | |||||||||||
2016 | 2015 | 2014 | |||||||||
Foreign exchange losses (gains) | $ | 3,725 | $ | (9,130 | ) | $ | (5,801 | ) | |||
Other, net | (360 | ) | (44 | ) | (484 | ) | |||||
Other expense (income), net | $ | 3,365 | $ | (9,174 | ) | $ | (6,285 | ) | |||
72
KNOLL, INC.
NOTES TO THE CONSOLIDATED FINANCIAL STATEMENTS
DECEMBER 31, 2016
19. QUARTERLY RESULTS (UNAUDITED)
The following tables contain selected unaudited Consolidated Statements of Operations and Comprehensive Income data for each quarter for the years ended December 31, 2016 and 2015. The operating results for any quarter are not necessarily indicative of results for any future period. The quarterly results are as follows (in thousands):
First Quarter | Second Quarter | Third Quarter | Fourth Quarter | Fiscal Year | |||||||||||||||||
2016 | |||||||||||||||||||||
Sales | $ | 284,629 | $ | 294,700 | $ | 292,097 | $ | 292,866 | $ | 1,164,292 | |||||||||||
Gross profit | 107,764 | 114,064 | 112,801 | 111,347 | 445,976 | ||||||||||||||||
Net earnings | 17,411 | 21,641 | 21,618 | 21,444 | 82,114 | (1) | |||||||||||||||
Net earnings attributable to Knoll, Inc. stockholders | 17,400 | 21,635 | 21,607 | 21,442 | 82,084 | (1) | |||||||||||||||
Earnings per share—Basic | $ | 0.36 | $ | 0.45 | $ | 0.45 | $ | 0.45 | $ | 1.71 | (1) | ||||||||||
Earnings per share—Diluted | $ | 0.36 | $ | 0.44 | $ | 0.44 | $ | 0.44 | $ | 1.68 | |||||||||||
2015 | |||||||||||||||||||||
Sales | $ | 266,498 | $ | 268,622 | $ | 263,588 | $ | 305,734 | $ | 1,104,442 | |||||||||||
Gross profit | 95,309 | 101,191 | 101,207 | 114,425 | 412,132 | ||||||||||||||||
Net earnings | 17,435 | 17,222 | 17,861 | 13,430 | 65,948 | (2) | |||||||||||||||
Net earnings attributable to Knoll, Inc. stockholders | 17,443 | 17,239 | 17,833 | 13,448 | 65,963 | (2) | |||||||||||||||
Earnings per share—Basic | $ | 0.37 | $ | 0.36 | $ | 0.37 | $ | 0.28 | $ | 1.38 | |||||||||||
Earnings per share—Diluted | $ | 0.36 | $ | 0.36 | $ | 0.37 | $ | 0.28 | $ | 1.36 | |||||||||||
(1) During 2016, the Company adopted ASU 2016-09. As a result of this adoption, $0.1 million and $0.4 million of income tax benefits were recognized in the three months ended March 31, 2016 and June 30, 2016, respectively. These retroactive income tax adjustments are reflected as a reduction of income tax expense which increased basic earnings per share by $0.01 in the three months ended June 30, 2016. No other basic or diluted earnings per share amounts were affected. See Note 2 for additional information.
(2) During 2015, the Company recorded $0.9 million of pre-tax restructuring charges. These charges of $0.4 million and $0.5 million were incurred in the third and fourth quarters of 2015, respectively. Additionally, during the fourth quarter of 2015, the Company recorded an intangible asset impairment charge of $10.7 million.
20. SEGMENT AND GEOGRAPHIC REGION INFORMATION
The Company manages business through its reporting segments: Office, Studio, and Coverings. All unallocated expenses are included within Corporate.
The Office segment includes a complete range of workplace products that address diverse workplace planning paradigms. These products include: systems furniture, seating, storage, tables, desks and KnollExtra® accessories as well as the international sales of North American Office products.
The Studio segment includes KnollStudio®, HOLLY HUNT®, Knoll Europe and DatesWeiser. KnollStudio products, include iconic seating, lounge furniture, side, cafe and dining chairs as well as conference, training and dining and occasional tables. HOLLY HUNT® is known for high quality residential furniture, lighting, rugs, textiles and leathers. In 2016, HOLLY HUNT® acquired Vladimir Kagan Design Group, a renowned collection of modern luxury furnishings. Knoll Europe, which markets and sells both KnollStudio and Knoll Office products, manufactures and sells products to customers primarily in Europe. DatesWeiser, known for its sophisticated meeting and conference tables and credenzas, sets a standard for design, quality and technology integration.
The Coverings segment includes KnollTextiles®, Spinneybeck® (including Filzfelt®), and Edelman® Leather. These businesses provide a wide range of customers with high-quality fabrics, felt, leather and related architectural products.
In 2016, the Company determined it appropriate to revise its segment presentation to segregate Corporate costs. The Company believes this facilitates improved communication as it reports segment results and better aligns with how it views and operates the Company. Corporate costs represent the accumulation of unallocated costs relating to shared services and general corporate activities including, but not limited to, legal expenses, acquisition expenses, certain finance, human resources, administrative and executive expenses and other expenses that are not directly attributable to an operating segment. Dedicated, direct selling, general and administrative expenses of the segments continue to be included within segment operating profit.
73
KNOLL, INC.
NOTES TO THE CONSOLIDATED FINANCIAL STATEMENTS
DECEMBER 31, 2016
Management regularly reviews the costs included in the Corporate function, and believes disclosing such information provides more visibility and transparency of how the chief operating decision maker reviews the results for the Company.
The tables below present the Company’s segment information with Corporate costs excluded from operating segment results. Prior year amounts have been recast to conform to the current presentation (in thousands):
2016 | 2015 | 2014 | |||||||||
SALES | |||||||||||
Office | $ | 731,327 | $ | 686,943 | $ | 656,228 | |||||
Studio | 323,431 | 303,838 | 279,167 | ||||||||
Coverings | 109,534 | 113,661 | 114,899 | ||||||||
Corporate | — | — | — | ||||||||
Knoll, Inc. | $ | 1,164,292 | $ | 1,104,442 | $ | 1,050,294 | |||||
INTERSEGMENT SALES (1) | |||||||||||
Office | $ | 1,877 | $ | 1,640 | $ | 2,776 | |||||
Studio | 5,788 | 6,184 | 5,918 | ||||||||
Coverings | 8,350 | 8,358 | 10,576 | ||||||||
Corporate | — | — | — | ||||||||
Knoll, Inc. | $ | 16,015 | $ | 16,182 | $ | 19,270 | |||||
DEPRECIATION AND AMORTIZATION | |||||||||||
Office | $ | 16,284 | $ | 14,945 | $ | 13,747 | |||||
Studio | 5,936 | 5,565 | 5,313 | ||||||||
Coverings | 805 | 769 | 982 | ||||||||
Corporate | — | — | — | ||||||||
Knoll, Inc. | $ | 23,025 | $ | 21,279 | $ | 20,042 | |||||
OPERATING PROFIT | |||||||||||
Office | $ | 73,871 | $ | 55,823 | $ | 38,116 | |||||
Studio | 53,413 | 47,952 | 37,834 | ||||||||
Coverings | 25,953 | 17,273 | 23,816 | ||||||||
Corporate | (16,929 | ) | (19,938 | ) | (22,923 | ) | |||||
Knoll, Inc.(2) | $ | 136,308 | $ | 101,110 | $ | 76,843 | |||||
CAPITAL EXPENDITURES | |||||||||||
Office | $ | 35,072 | $ | 27,058 | $ | 33,541 | |||||
Studio | 6,819 | 4,241 | 8,075 | ||||||||
Coverings | 804 | 648 | 285 | ||||||||
Corporate | — | — | — | ||||||||
Knoll, Inc. | $ | 42,695 | $ | 31,947 | $ | 41,901 | |||||
_______________________________________________________________________________
(1) Intersegment sales are presented on a cost-plus basis which takes into consideration the effect of transfer prices between legal entities.
(2) The Company does not allocate interest expense or other (income) expense, net to the reportable segments.
Many of the Company's facilities manufacture products for all three reporting segments. Therefore, it is impractical to disclose asset information on a segment basis.
74
KNOLL, INC.
NOTES TO THE CONSOLIDATED FINANCIAL STATEMENTS
DECEMBER 31, 2016
The Company's net sales by product category were as follows (in thousands):
Year Ended December 31, | |||||||||||
2016 | 2015 | 2014 | |||||||||
Office Systems | $ | 461,743 | $ | 432,655 | $ | 429,503 | |||||
Seating | 114,135 | 117,799 | 108,635 | ||||||||
Files and Storage | 85,696 | 86,099 | 84,297 | ||||||||
Studio | 323,431 | 303,838 | 279,167 | ||||||||
Coverings | 109,534 | 113,661 | 114,899 | ||||||||
Other | 69,753 | 50,390 | 33,793 | ||||||||
Total | $ | 1,164,292 | $ | 1,104,442 | $ | 1,050,294 | |||||
The Company markets its products in the United States and internationally, with its principal international markets being Canada and Europe. The table below contains information about the geographical areas in which the Company operates. Sales are attributed to the geographic areas based on the origin of sale, and property, plant, and equipment, net is based on the geographic area in which the asset resides (in thousands):
United States | Canada | Europe | Mexico | Consolidated | |||||||||||||||
2016 | |||||||||||||||||||
Sales | $ | 1,031,920 | $ | 36,813 | $ | 93,420 | $ | 2,139 | $ | 1,164,292 | |||||||||
Property, plant, and equipment, net | 157,856 | 26,452 | 12,776 | — | 197,084 | ||||||||||||||
2015 | |||||||||||||||||||
Sales | $ | 979,221 | $ | 36,163 | $ | 89,058 | $ | — | $ | 1,104,442 | |||||||||
Property, plant, and equipment, net | 137,863 | 20,919 | 13,360 | — | 172,142 | ||||||||||||||
2014 | |||||||||||||||||||
Sales | $ | 928,733 | $ | 32,811 | $ | 88,750 | $ | — | $ | 1,050,294 | |||||||||
Property, plant, and equipment, net | 123,821 | 25,669 | 15,529 | — | 165,019 | ||||||||||||||
ITEM 9. CHANGES IN AND DISAGREEMENTS WITH ACCOUNTANTS ON ACCOUNTING AND FINANCIAL DISCLOSURES
None
ITEM 9A. CONTROLS AND PROCEDURES
Evaluation of disclosure controls and procedures. We, under the supervision and with the participation of our management, including our principal executive officer and principal financial officer, evaluated the effectiveness of the design and operation of our disclosure controls and procedures, as defined in Rule 13a-15(e) of the Securities Exchange Act of 1934 as of the end of the period covered by this report (December 31, 2016) ("Disclosure Controls"). Based upon the Disclosure Controls evaluation, our principal executive officer and principal financial officer have concluded that the Disclosure Controls are effective in reaching a reasonable level of assurance that (i) information required to be disclosed by us in the reports that we file or submit under the Securities Exchange Act of 1934 is recorded, processed, summarized and reported within the time periods specified in the Securities and Exchange Commission's rules and forms and (ii) information required to be disclosed by us in the reports that we file or submit under the Securities Exchange Act of 1934 is accumulated and communicated to our management, including our principal executive and principal financial officers, or persons performing similar functions, as appropriate to allow timely decisions regarding required disclosure.
75
INTERNAL CONTROL OVER FINANCIAL REPORTING
Management's annual report on internal control over financial reporting. Our management is responsible for establishing and maintaining adequate internal control over financial reporting as defined in Rule 13a-15(f) under the Securities Exchange Act of 1934, as amended, for the Company. Internal control over financial reporting is a process to provide reasonable assurance regarding the reliability of our financial reporting and the preparation of financial statements for external purposes in accordance with accounting principles generally accepted in the United States of America. Internal control over financial reporting includes without limitation, maintaining records that in reasonable detail accurately and fairly reflect our transactions, providing reasonable assurance that transactions are recorded as necessary for preparation of our financial statements, providing reasonable assurance that receipts and expenditures of company assets are made in accordance with management authorization, and providing reasonable assurance that unauthorized acquisition, use or disposition of company assets that could have a material effect on our financial statements would be prevented or detected on a timely basis. Because of its inherent limitations, internal control over financial reporting is not intended to provide absolute assurance that a misstatement of our financial statements would be prevented or detected.
Our management assessed the effectiveness of our internal control over financial reporting based on the framework in Internal Control—Integrated Framework issued by the Committee of Sponsoring Organizations of the Treadway Commission (2013 framework). Based on this assessment, management concluded that the Company's internal control over financial reporting was effective as of December 31, 2016.
The effectiveness of the Company’s internal control over financial reporting as of December 31, 2016 has been audited by Ernst & Young LLP, the Company’s independent registered public accounting firm, as stated in their report included in Item 8, “Financial Statements and Supplementary Data.”
Changes in Internal Control Over Financial Reporting. During the period covered by this report, there has been no change in the Company’s internal control over financial reporting (as such term is defined in Rules 13a-15(f) and 15d-15(f) under the Exchange Act) that has materially affected, or is reasonably likely to materially affect, the Company’s internal control over financial reporting.
76
Report of Independent Registered Public Accounting Firm
The Board of Directors and Stockholders of Knoll, Inc.
We have audited Knoll, Inc.’s internal control over financial reporting as of December 31, 2016, based on criteria established in Internal Control-Integrated Framework issued by the Committee of Sponsoring Organizations of the Treadway Commission (2013 framework) (the COSO criteria). Knoll, Inc.’s management is responsible for maintaining effective internal control over financial reporting, and for its assessment of the effectiveness of internal control over financial reporting included in the accompanying Management’s annual report on internal control over financial reporting. Our responsibility is to express an opinion on the company’s internal control over financial reporting based on our audit.
We conducted our audit in accordance with the standards of the Public Company Accounting Oversight Board (United States). Those standards require that we plan and perform the audit to obtain reasonable assurance about whether effective internal control over financial reporting was maintained in all material respects. Our audit included obtaining an understanding of internal control over financial reporting, assessing the risk that a material weakness exists, testing and evaluating the design and operating effectiveness of internal control based on the assessed risk, and performing such other procedures as we considered necessary in the circumstances. We believe that our audit provides a reasonable basis for our opinion.
A company’s internal control over financial reporting is a process designed to provide reasonable assurance regarding the reliability of financial reporting and the preparation of financial statements for external purposes in accordance with generally accepted accounting principles. A company’s internal control over financial reporting includes those policies and procedures that (1) pertain to the maintenance of records that, in reasonable detail, accurately and fairly reflect the transactions and dispositions of the assets of the company; (2) provide reasonable assurance that transactions are recorded as necessary to permit preparation of financial statements in accordance with generally accepted accounting principles, and that receipts and expenditures of the company are being made only in accordance with authorizations of management and directors of the company; and (3) provide reasonable assurance regarding prevention or timely detection of unauthorized acquisition, use, or disposition of the company’s assets that could have a material effect on the financial statements.
Because of its inherent limitations, internal control over financial reporting may not prevent or detect misstatements. Also, projections of any evaluation of effectiveness to future periods are subject to the risk that controls may become inadequate because of changes in conditions, or that the degree of compliance with the policies or procedures may deteriorate.
In our opinion, Knoll, Inc. maintained, in all material respects, effective internal control over financial reporting as of December 31, 2016, based on the COSO criteria.
We also have audited, in accordance with the standards of the Public Company Accounting Oversight Board (United States), the consolidated balance sheets of Knoll, Inc. as of December 31, 2016 and 2015, and the related consolidated statements of operations and comprehensive income, equity and cash flows for each of the three years in the period ended December 31, 2016 of Knoll, Inc. and our report dated March 1, 2017 expressed an unqualified opinion thereon.
/s/ Ernst & Young LLP
Philadelphia, Pennsylvania
March 1, 2017
77
ITEM 9B. OTHER INFORMATION
None.
PART III
ITEM 10. DIRECTORS, EXECUTIVE OFFICERS AND CORPORATE GOVERNANCE
The information required by Item 10 relating to directors, director nominees and executive officers of the registrant is incorporated by reference from the information under the captions “Board of Directors,” “Election of Directors,” “Executive Officers,” “Board Meetings and Committees,” “Code of Ethics,” and “Section 16(a) Beneficial Ownership Reporting Compliance” contained in our Proxy Statement for our 2017 Annual Meeting of Stockholders (the “Proxy Statement”).
The information relating to the identification of the audit committee, audit committee financial expert and director nomination procedures of the registrant is incorporated by reference from the information under the caption “Board Meetings and Committees” contained in our Proxy Statement.
Our Board of Directors has adopted a code of ethics for all employees. This code is made available free of charge on our website at www.knoll.com. For further information see subsection “Code of Ethics” in our Proxy Statement.
ITEM 11. EXECUTIVE COMPENSATION
The information required by Item 11 is hereby incorporated by reference from the information under the caption “Executive Compensation” contained in our Proxy Statement.
ITEM 12. SECURITY OWNERSHIP OF CERTAIN BENEFICIAL OWNERS AND MANAGEMENT AND RELATED STOCKHOLDER MATTERS
Securities Authorized for Issuance Under Equity Compensation Plans
Equity Compensation Plan Information As of December 31, 2016 | ||||||||||
Plan Category | Number of Securities to be Issued upon Exercise of Outstanding Options (a) | Weighted-Average Exercise Price of Outstanding Options (b) | Number of Shares Remaining for Future Issuance Under Equity Compensation Plans (Excluding Securities Reflected in Column (a)) (c) | |||||||
Equity compensation plans approved by security holders | 67,500 | $ | 22.64 | 1,493,891 | ||||||
Equity compensation plans not approved by security holders | — | — | — | |||||||
Total | 67,500 | 1,493,891 | ||||||||
If there is an expiration, termination, or cancellation of any benefit granted under the plans without the issuance of shares, the shares subject to or reserved for that benefit may again be used for new stock options, rights, or awards of any type authorized under the plans.
All other information required by Item 12 is hereby incorporated by reference from the information under the caption “Security Ownership of Certain Beneficial Owners and Management” contained in our Proxy Statement.
ITEM 13. CERTAIN RELATIONSHIPS AND RELATED TRANSACTIONS, AND DIRECTOR INDEPENDENCE
The information required by Item 13 is hereby incorporated by reference from the information under the captions “Transactions with Related Persons” and “Director Independence” contained in our Proxy Statement.
ITEM 14. PRINCIPAL ACCOUNTING FEES AND SERVICES
The information required by Item 14 is hereby incorporated by reference from the information under the caption “Independent Registered Public Accounting Firm” contained in our Proxy Statement.
78
PART IV
ITEM 15. EXHIBITS AND FINANCIAL STATEMENT SCHEDULES
(a)Documents filed as part of this Form 10-K:
(1) CONSOLIDATED FINANCIAL STATEMENTS (ITEM 8)
•Consolidated Balance Sheets as of December 31, 2016 and 2015
• | Consolidated Statements of Operations and Comprehensive Income for the Years Ended December 31, 2016, 2015, and 2014 |
•Consolidated Statements of Equity for the Years Ended December 31, 2016, 2015, and 2014
•Consolidated Statements of Cash Flows for the Years Ended December 31, 2016, 2015, and 2014
•Notes to the Consolidated Financial Statements
•Report of Independent Registered Public Accounting Firm
(2) FINANCIAL STATEMENT SCHEDULES
• | Financial Statement Schedule II—Valuation and Qualifying Accounts is filed with this Form 10-K on page S-1 of this Form 10-K. All other schedules for which provision is made in the applicable regulation of the Commission have either been presented in the Company's financial statements or are not required under the related instructions or are inapplicable and therefore have been omitted. |
(3) EXHIBITS
Exhibit Number | Description | ||
2.1 | (i) | Securities Purchase Agreement, dated February 3, 2014, among Knoll, Inc., Holly Hunt Enterprises, Inc., HHMI LLC, the Shareholders of Holly Hunt Enterprises, Inc. and the Members of HHMI LLC. | |
3.1 | (a) | Amended and Restated Certificate of Incorporation of Knoll, Inc. | |
3.2 | (k) | Amended and Restated By-Laws of Knoll, Inc. | |
4.1 | (o) | Form of Stock Certificate. | |
10.1 | (b) | Second Amended and Restated Credit Agreement, dated as of May 20, 2014, by and among Knoll, Inc., certain of the domestic subsidiaries of Knoll, Inc., Bank of America, N.A., Merrill Lynch, Pierce, Fenner and Smith Incorporated, and the other lenders party thereto. | |
10.2 | (f)* | Amended and Restated Employment Agreement, executed March 14, 2006, effective as of January 1, 2006, between Knoll, Inc. and Burton B. Staniar. | |
10.3 | (m)* | Amendment to Amended and Restated Employment Agreement, dated as of May 4, 2009, between Knoll, Inc. and Burton B. Staniar. | |
10.4 | (d)* | Amended and Restated Employment Agreement, dated as of July 1, 2016, between Knoll, Inc. and Andrew B. Cogan. | |
10.5 | * | Summary of Craig B. Spray 2017 Compensation. | |
79
Exhibit Number | Description | ||
10.6 | * | Summary of Joseph T. Coppola 2017 Compensation. | |
10.7 | * | Summary of Benjamin A. Pardo 2017 Compensation. | |
10.8 | * | Summary of David L. Schutte 2017 Compensation. | |
10.9 | (c)* | Amended and Restated Knoll, Inc. 1997 Stock Incentive Plan. | |
10.10 | (a)* | Amended and Restated Knoll, Inc. 1999 Stock Incentive Plan. | |
10.11 | (h)* | Amended and Restated Knoll, Inc. 2007 Stock Incentive Plan. | |
10.12 | (n)* | Amended and Restated Knoll, Inc. 2010 Stock Incentive Plan. | |
10.13 | (q)* | Amended and Restated Knoll, Inc. 2013 Stock Incentive Plan | |
10.14 | (p)* | Amended and Restated Knoll, Inc. Non-Employee Director Compensation Plan. | |
10.15 | (e)* | Form of Non-Qualified Stock Option Agreement under the Amended and Restated Knoll, Inc. 1997 Stock Incentive Plan, entered into by Knoll, Inc. and certain executive officers. | |
10.16 | (c)* | Form of Non-Qualified Stock Option Agreement under the Amended and Restated Knoll, Inc. 1999 Stock Incentive Plan, entered into by Knoll, Inc. and certain executive officers. | |
10.17 | (j)* | Form of Non-Qualified Stock Option Agreement under the 2007 Stock Incentive Plan, entered into by Knoll, Inc. and certain executive officers. | |
10.18 | (j)* | Form of Restricted Share Agreement under the 2007 Stock Incentive Plan (time vesting with accelerated performance vesting). | |
10.19 | (j)* | Form of Restricted Share Agreement under the 2007 Stock Incentive Plan (time vesting). | |
10.20 | (j)* | Form of Restricted Share Agreement under the Non-Employee Director Compensation Plan (time vesting). | |
10.21 | (g)* | Form of Restricted Share Agreement under the 2010 Stock Incentive Plan (time vesting). | |
10.22 | (g)* | Form of Restricted Share Agreement under the 2010 Stock Incentive Plan (time vesting with accelerated performance vesting). | |
10.23 | (g)* | Form of Non-Qualified Stock Option Agreement under the 2010 Stock Incentive Plan. | |
10.24 | (r)* | Form of Performance-Based Stock Unit Agreement under the 2013 Stock Incentive Plan. | |
10.25 | (p)* | Form of Performance-Based Stock Unit Agreement under the 2013 Stock Incentive Plan (enhanced vesting). | |
10.26 | (a)* | Form of Director and Officer Indemnification Agreement. | |
10.27 | (l)* | Andrew B. Cogan 2017 Incentive Compensation Letter, dated December 6, 2016. | |
10.28 | (l)* | Craig B. Spray 2017 Incentive Compensation Letter, dated December 6, 2016. | |
10.29 | (l)* | Benjamin A. Pardo 2017 Incentive Compensation Letter, dated December 6, 2016. | |
10.30 | (l)* | David L. Schutte 2017 Incentive Compensation Letter, dated December 6, 2016. | |
21.00 | Subsidiaries of Knoll, Inc. | ||
23.10 | Consent of Independent Registered Public Accounting Firm. | ||
24.10 | Power of Attorney [(included on signature page)]. | ||
31.10 | Certification for Chief Executive Officer pursuant to Rule 13a-14(a) of the Securities Exchange Act of 1934, as amended. | ||
80
Exhibit Number | Description | ||
31.20 | Certification for Chief Financial Officer pursuant to Rule 13a-14(a) of the Securities Exchange Act of 1934, as amended. | ||
32.10 | Certification for Chief Executive Officer pursuant to Rule 13a-14(b) of the Securities Exchange Act of 1934, as amended, and 18 U.S.C. Section 1350, as adopted pursuant to Section 906 of the Sarbanes-Oxley Act of 2002. | ||
32.20 | Certification for Chief Financial Officer pursuant to Rule 13a-14(b) of the Securities Exchange Act of 1934, as amended, and 18 U.S.C. Section 1350, as adopted pursuant to Section 906 of the Sarbanes-Oxley Act of 2002. | ||
101.00 | The following materials from the Company's Annual Report on Form 10-K for the period ended December 31, 2016, formatted in XBRL (eXtensible Business Reporting Language): (i) Consolidated Balance Sheets as of December 31, 2016, and December 31, 2015, (ii) Consolidated Statements of Operations and Comprehensive Income for the years ended December 31, 2016, December 31, 2015 and December 31, 2014, (iii) Consolidated Statements of Stockholders' Equity for the years ended December 31, 2016, December 31, 2015, and December 31, 2014, (iv) Consolidated Statements of Cash Flows for the years ended December 31, 2016, December 31, 2015, and December 31, 2014 and (v) Notes to Consolidated Financial Statements.** | ||
_______________________________________________________________________________
* Management Contract or Compensatory Plan or Arrangement required to be identified by Item 15(a) (3) of Form 10-K.
** Pursuant to Rule 406T of Regulation S-T, the Interactive Data Files on Exhibit 101 hereto are deemed not filed or part of a registration statement or prospectus for purposes of Sections 11 or 12 of the Securities Act of 1933, as amended, are deemed not filed for purposes of Section 18 of the Securities and Exchange Act of 1934, as amended, and otherwise are not subject to liability under those sections
(a) | Incorporated by reference to Knoll, Inc.'s Registration Statement on Form S-1 (File No. 333-118901), which was declared effective by the Commission on December 13, 2004. | |
(b) | Incorporated by reference to Knoll, Inc.'s Current Report on Form 8-K filed with the Commission on May 21, 2014. | |
(c) | Incorporated by reference to Knoll, Inc.'s Annual Report on Form 10-K for the year ended December 31, 1999. | |
(d) | Incorporated by reference to Knoll, Inc.'s Quarterly Report on Form 10-Q filed with the Commission on August 9, 2016. | |
(e) | See Exhibit 10.16. Exhibit is substantially identical to Exhibit 10.16. | |
(f) | Incorporated by reference to Knoll, Inc.'s Annual Report on Form 10-K for the year ended December 31, 2005. | |
(g) | Incorporated by reference to Knoll, Inc.'s Annual Report on Form 10-K for the year ended December 31, 2010. | |
(h) | Incorporated by reference to Knoll, Inc.'s Quarterly Report on Form 10-Q filed with the Commission on August 9, 2007. | |
(i) | Incorporated by reference to Knoll, Inc.'s Current Report on Form 8-K filed with the Commission on February 3, 2014. | |
(j) | Incorporated by reference to Knoll, Inc.'s Annual Report on Form 10-K for the year ended December 31, 2007. | |
(k) | Incorporated by reference to Knoll, Inc.'s Current Report on Form 8-K filed with the Commission on May 11, 2015. | |
(l) | Incorporated by reference to Knoll, Inc.'s Current Report on Form 8-K filed with the Commission on December 12, 2016. | |
(m) | Incorporated by reference to Knoll, Inc.'s Quarterly Report on Form 10-Q filed with the Commission on May 11, 2009. | |
(n) | Incorporated by reference to Knoll, Inc.'s Current Report on Form 8-K filed with the Commission on May 11, 2010. | |
(o) | Incorporated by reference to Knoll, Inc's Annual Report on Form 10-K for the year ended December 31, 2012. | |
(p) | Incorporated by reference to Knoll, Inc.'s Annual Report on Form 10-K for the year ended December 31, 2015. | |
(q) | Incorporated by reference to Knoll, Inc's Current Report on Form 8-K filed with the Commission on April 26, 2013. | |
(r) | Incorporated by reference to Knoll, Inc.'s Annual Report on Form 10-K for the year ended December 31, 2013. | |
81
ITEM 16. FORM 10-K SUMMARY
None.
82
SIGNATURES
Pursuant to the requirements of Section 13 or 15(d) of the Securities Exchange Act of 1934, the Registrant has duly caused this report on Form 10-K to be signed on its behalf by the undersigned, thereunto duly authorized, on this 1st day of March 2017.
KNOLL, INC. | |||
By: | /s/ ANDREW B. COGAN Andrew B. Cogan President and Chief Executive Officer | ||
KNOW ALL PERSONS BY THESE PRESENTS, that each individual whose signature appears below constitutes and appoints Andrew B. Cogan and Craig B. Spray, and each of them, his true and lawful attorneys-in-fact and agents with full power of substitution, for him and in his name, place and stead, in any and all capacities, to sign any and all amendments to this Form 10-K, and to file the same, with all exhibits thereto and all documents in connection therewith, with the Securities and Exchange Commission, granting unto said attorneys-in-fact and agents, and each of them, full power and authority to do and perform each and every act and thing requisite and necessary to be done in and about the premises, as fully to all intents and purposes as he might or could do in person, hereby ratifying and confirming all that said attorneys-in-fact and agents or any of them, or his or their substitute or substitutes, may lawfully do or cause to be done by virtue hereof.
Pursuant to the requirements of the Securities Exchange Act of 1934, this report on Form 10-K has been signed by the following persons on behalf of the Registrant and in the capacities and on the date indicated.
/s/ BURTON B. STANIAR Burton B. Staniar | Chairman of the Board | March 1, 2017 | ||
/s/ ANDREW B. COGAN Andrew B. Cogan | President and Chief Executive Officer, Knoll, Inc. and Director | March 1, 2017 | ||
/s/ CRAIG B. SPRAY Craig B. Spray | Chief Financial Officer (Chief Accounting Officer and Controller) | March 1, 2017 | ||
/s/ JEFFREY A. HARRIS Jeffrey A. Harris | Director | March 1, 2017 | ||
/s/ SIDNEY LAPIDUS Sidney Lapidus | Director | March 1, 2017 | ||
/s/ KATHLEEN G. BRADLEY Kathleen G. Bradley | Director | March 1, 2017 | ||
/s/ JOHN F. MAYPOLE John F. Maypole | Director | March 1, 2017 | ||
/s/ SARAH E. NASH Sarah E. Nash | Director | March 1, 2017 | ||
/s/ STEPHEN F. FISHER Stephen F. Fisher | Director | March 1, 2017 | ||
/s/ STEPHANIE STAHL Stephanie Stahl | Director | March 1, 2017 | ||
/s/ CHRISTOPHER G. KENNEDY Christopher G. Kennedy | Director | March 1, 2017 | ||
83
SCHEDULE II
KNOLL, INC.
VALUATION AND QUALIFYING ACCOUNTS
(In Thousands)
Description | Balance at Beginning of Year | Additions Charged to Expenses (Income) | Charge-Offs | Other(1) | Balance at End of Year | ||||||||||
Allowance for doubtful accounts: | |||||||||||||||
Year ended December 31, 2014 | 5,677 | 2,494 | (972 | ) | (2 | ) | 7,197 | ||||||||
Year ended December 31, 2015 | 7,197 | 1,401 | (600 | ) | (79 | ) | 7,919 | ||||||||
Year ended December 31, 2016 | 7,919 | 6,653 | (6,514 | ) | 1 | 8,059 | |||||||||
Reserve for inventory valuation: | |||||||||||||||
Year ended December 31, 2014 | 7,202 | 1,761 | (508 | ) | (51 | ) | 8,404 | ||||||||
Year ended December 31, 2015 | 8,404 | 2,656 | (2,286 | ) | (503 | ) | 8,271 | ||||||||
Year ended December 31, 2016 | 8,271 | 2,376 | (1,109 | ) | (15 | ) | 9,523 | ||||||||
Valuation allowance for deferred income tax assets: | |||||||||||||||
Year ended December 31, 2014 | 8,991 | 254 | — | (1,344 | ) | 7,901 | |||||||||
Year ended December 31, 2015 | 7,901 | (841 | ) | — | (743 | ) | 6,317 | ||||||||
Year ended December 31, 2016 | 6,317 | 451 | — | (607 | ) | 6,161 | |||||||||
(1) Primarily the impact of currency changes
S-1