Attached files
| file | filename |
|---|---|
| EX-32.1 - EXHIBIT 32.1 - Criteo S.A. | exhibit321ceocfocertificat.htm |
| EX-31.2 - EXHIBIT 31.2 - Criteo S.A. | exhibit312cfocertification.htm |
| EX-31.1 - EXHIBIT 31.1 - Criteo S.A. | exhibit311ceocertification.htm |
| EX-23.1 - EXHIBIT 23.1 - Criteo S.A. | exhibit231consent.htm |
| EX-21.1 - EXHIBIT 21.1 - Criteo S.A. | exhibit211subsidiaries.htm |
| EX-10.9 - EXHIBIT 10.9 - Criteo S.A. | exhibit109bsagrantdocument.htm |
| EX-4.3 - EXHIBIT 4.3 - Criteo S.A. | exhibit43debtinstruments.htm |
UNITED STATES SECURITIES AND EXCHANGE COMMISSION
Washington, D.C. 20549
Washington, D.C. 20549
FORM 10-K
(Mark One)
x | ANNUAL REPORT PURSUANT TO SECTION 13 OR 15(D) OF THE SECURITIES EXCHANGE ACT OF 1934 |
for the Fiscal Year Ended December 31, 2016
or
¨ | TRANSITION REPORT PURSUANT TO SECTION 13 OR 15(D) OF THE SECURITIES EXCHANGE ACT OF 1934 |
for the transition period from to
Commission file number: 001-36153
Criteo S.A.
(Exact name of registrant as specified in its charter)
(Exact name of registrant as specified in its charter)
France (State or other jurisdiction of incorporation or organization) | Not Applicable (I.R.S. Employer Identification Number) | |
32, rue Blanche, 75009 Paris—France
(Address of principal executive offices including zip code)
(Address of principal executive offices including zip code)
Registrant's telephone number, including area code: +33 1 40 40 22 90
Securities registered pursuant to Section 12(b) of the Act:
American Depositary Shares, each representing one ordinary share, nominal value €0.025 per share | Nasdaq Global Select Market | |
Ordinary shares, nominal value €0.025 per share* | Nasdaq Global Select Market * | |
(Title of class) | (Name of exchange on which registered) | |
* Not for trading, but only in connection with the registration of the American Depositary Shares.
Securities registered pursuant to Section 12(g) of the Act: None
Indicate by check mark if the registrant is a well-known seasoned issuer, as defined in Rule 405 of the Securities Act. Yes x No ¨
Indicate by check mark if the registrant is not required to file reports pursuant to Section 13 or Section 15(d) of the Act. Yes ¨ No x
Indicate by check mark whether the registrant (1) has filed all reports required to be filed by Section 13 or 15(d) of the Securities Exchange Act of 1934 during the preceding 12 months (or for such shorter period that the registrant was required to file such reports), and (2) has been subject to such filing requirements for the past 90 days. Yes x No ¨
Indicate by check mark whether the registrant has submitted electronically and posted on its corporate website, if any, every Interactive Data File required to be submitted and posted pursuant to Rule 405 of Regulation S-T during the preceding 12 months (or for such shorter period that the registrant was required to submit and post such files). Yes x No ¨
Indicate by check mark if disclosure of delinquent filers pursuant to Item 405 of Regulation S-K is not contained herein and will not be contained, to the best of the registrant's knowledge, in definitive proxy or information statements incorporated by reference in Part III of this Form 10-K or any amendment to this Form 10-K. ¨
Indicate by check mark whether the registrant is a large accelerated filer, an accelerated filer, a non-accelerated filer or a smaller reporting company. See the definitions of "large accelerated filer," "accelerated filer," and "smaller reporting company" in Rule 12b-2 of the Exchange Act.
Large Accelerated Filer x | Accelerated Filer ¨ | Non-accelerated Filer ¨ (Do not check if a smaller reporting company) | Smaller reporting company ¨ | |||
Indicate by check mark whether the registrant is a shell company (as defined in Rule 12b-2 of the Act). Yes ¨ No x
The aggregate market value of voting stock held by non-affiliates of the registrant as of the last business day of the registrant's most recently completed second fiscal quarter was $2.7 billion, based on the closing sale price of the American Depositary Shares as reported by the Nasdaq Global Select Market on June 30, 2016. Ordinary shares, nominal value €0.025 per share, held by each officer and director and by each person who owns or may be deemed to own 10% or more of the outstanding ordinary shares have been excluded since such persons may be deemed to be affiliates. This determination of affiliate status is not necessarily a conclusive determination for other purposes.
As of January 31, 2017, the registrant had 63,990,003 ordinary shares, nominal value €0.025 per share, outstanding.
DOCUMENTS INCORPORATED BY REFERENCE
Part III incorporates certain information by reference from the registrant’s proxy statement for the 2017 Annual Meeting of Shareholders. Such proxy statement will be filed no later than 120 days after the close of the registrant’s fiscal year ended December 31, 2016.
CRITEO S.A.
ANNUAL REPORT ON FORM 10-K
For The Fiscal Year Ended December 31, 2016
ANNUAL REPORT ON FORM 10-K
For The Fiscal Year Ended December 31, 2016
TABLE OF CONTENTS
Item 1 | |||
Item 1A | |||
Item 1B | |||
Item 2 | |||
Item 3 | |||
Item 4 | |||
Item 5 | |||
Item 6 | |||
Item 7 | |||
Item 7A | |||
Item 8 | |||
Item 9 | |||
Item 9A | |||
Item 9B | |||
Item 10 | |||
Item 11 | |||
Item 12 | |||
Item 13 | |||
Item 14 | |||
Item 15 | |||
Item 16 | |||
General
Except where the context otherwise requires, all references in this Annual Report on Form 10-K ("Form 10-K") to the "Company," "Criteo," "we," "us," "our" or similar words or phrases are to Criteo S.A. and its subsidiaries, taken together. In this Form 10-K, references to "$" and "US$" are to United States dollars. Our audited consolidated financial statements have been prepared in accordance with accounting principles generally accepted in the United States of America, or U.S. GAAP. Unless otherwise indicated, the statistical and financial data contained in this Form 10-K are presented as of December 31, 2016.
Trademarks
"Criteo," the Criteo logo and other trademarks or service marks of Criteo S.A. appearing in this Annual Report on Form 10-K are the property of Criteo S.A. Trade names, trademarks and service marks of other companies appearing in this Form 10-K are the property of their respective holders.
Special Note Regarding Forward-Looking Statements
This Form 10-K contains forward-looking statements within the meaning of Section 27A of the Securities Act of 1933, as amended (the "Securities Act"), and Section 21E of the Securities Exchange Act of 1934, as amended (the "Exchange Act"), that are based on our management’s beliefs and assumptions and on information currently available to our management. All statements other than present and historical facts and conditions contained in this Form 10-K, including statements regarding our future results of operations and financial position, business strategy, plans and our objectives for future operations, are forward-looking statements. When used in this Form 10-K, the words "anticipate," "believe," "can," "could," "estimate," "expect," "intend," "is designed to," "may," "might," "plan," "potential," "predict," "objective," "should," or the negative of these and similar expressions identify forward-looking statements. Forward-looking statements include, but are not limited to, statements about:
• | the ability of the Criteo Engine to accurately predict engagement by a user; |
• | our ability to predict and adapt to changes in widely adopted industry platforms and other new technologies; |
• | our ability to continue to collect and utilize data about user behavior and interaction with advertisers; |
• | our ability to acquire an adequate supply of advertising inventory from publishers on terms that are favorable to us; |
• | our ability to meet the challenges of a growing and international company in a rapidly developing and changing industry, including our ability to forecast accurately; |
• | our ability to maintain an adequate rate of revenue growth and sustain profitability; |
• | our ability to manage our international operations and expansion and the integration of our acquisitions; |
• | the effects of increased competition in our market; |
• | our ability to adapt to regulatory, legislative or self-regulatory developments regarding internet privacy matters; |
• | our ability to protect users’ information and adequately address privacy concerns; |
• | our ability to enhance our brand; |
• | our ability to enter new marketing channels and new geographies and to effectively scale our technology platform in new industry verticals; |
• | our ability to attract and retain qualified employees and key personnel; |
• | our ability to maintain, protect and enhance our brand and intellectual property; and |
• | failures in our systems or infrastructure. |
You should refer to Item 1A "Risk Factors" of this Form 10-K for a discussion of important factors that may cause our actual results to differ materially from those expressed or implied by our forward-looking statements. As a result of these factors, we cannot assure you that the forward-looking statements in this Form 10-K will prove to be accurate. Furthermore, if our forward-looking statements prove to be inaccurate, the inaccuracy may be material. In light of the significant uncertainties in these forward-looking statements, you should not regard these statements as a representation or warranty by us or any other person that we will achieve our objectives and plans in any specified time frame or at all. We undertake no obligation to publicly update any forward-looking statements, whether as a result of new information, future events or otherwise, except as required by law.
You should read this Form 10-K and the documents that we reference in this Form 10-K and have filed as exhibits to this Form 10-K completely and with the understanding that our actual future results may be materially different from what we expect. We qualify all of our forward-looking statements by these cautionary statements.
This Form 10-K contains market data and industry forecasts that were obtained from industry publications. These data and forecasts involve a number of assumptions and limitations, and you are cautioned not to give undue weight to such information. We have not independently verified any third-party information. While we believe the market position, market opportunity and market size information included in this Form 10-K is generally reliable, such information is inherently imprecise.
PART I
Item 1. Business
History and Development of the Company
Criteo S.A. was initially incorporated as a société par actions simplifiée, or S.A.S., under the laws of the French Republic on November 3, 2005, for a period of 99 years and subsequently converted to a société anonyme, or S.A. We are registered at the Paris Commerce and Companies Register under the number 484 786 249. Our agent for service of process in the United States is National Registered Agents, Inc. We began selling our solution in France in 2007 and expanded our business into other countries in Western Europe. In 2009, we expanded our business into North America and entered the Asia-Pacific region in late 2010. In November 2016, we acquired HookLogic, Inc. ("HookLogic"), a New York-based company that has developed a performance marketing exchange connecting consumer brand manufacturers with retail ecommerce sites via sponsored product ads sold by ecommerce retailers. We now offer HookLogic's products under the "Criteo Sponsored Products" name. Please refer to Note 2 to our audited consolidated financial statements included elsewhere in this Form 10-K for further details.
Business Overview
We are a global technology company specializing in digital performance marketing. We strive to deliver post-click sales at scale to advertisers across multiple digital marketing channels and according to the client's targeted return on investment. We use our proprietary machine-learning algorithms, coupled with large volumes of granular shopping intent data and deep insights into consumer intent and purchasing habits, to price and deliver in real time highly relevant and personalized digital performance advertisements to consumers. By measuring the value we deliver on a post-click sales basis, we make the return on investment transparent and easy to measure for our advertiser clients.
We partner with our clients to capture activity on their digital properties, which we define as websites and/or mobile applications, and optimize the performance of their advertisements based on that activity and other data. Demonstrating the depth and scale of our data, we collected data on over $550 billion in sales transactions1 on our clients' digital properties in the year ended December 31, 2016, whether or not a consumer saw or clicked on an advertisement displayed by Criteo. Based on this data and our other assets, we delivered targeted advertisements that generated approximately 7.4 billion clicks1 in the year ended December 31, 2016. Based on these clicks, our clients generated approximately $25 billion in post-click sales1 during this period. A post-click sale is defined as a purchase made by a user from one of our clients' digital properties within a certain period of time following the user clicking on an advertisement we delivered for that client. This period of time varies by client, but is a maximum of 30 days. We believe post-click sales is a key performance indicator that our clients use to measure the effectiveness of our solution in driving sales and the return on their marketing spend with us. As of December 31, 2016, we had over 14,000 clients and in each of the last three years our average client retention rate, as measured on a quarterly basis, was approximately 90%.
Every day we are presented with billions of opportunities to connect individuals with relevant marketing messages from our clients. For each of these opportunities, our algorithms analyze massive volumes of data to observe and predict user intent and deliver specific messaging for products or services that are likely to engage that particular user and result in a sale for our client. The accuracy of our algorithms improves with every advertisement we deliver, as they incorporate new data, while continuing to learn from previous data.
___________________________________________________
1 Based on Criteo Dynamic Retargeting.
1
Our performance marketing product portfolio is currently comprised of three products: Criteo Dynamic Retargeting, Criteo Predictive Search and Criteo Sponsored Products. Our core technology in the Criteo Engine is comprised of four key components: Universal Match, Product Recommendations, Predictive Bidding and Kinetic Design.
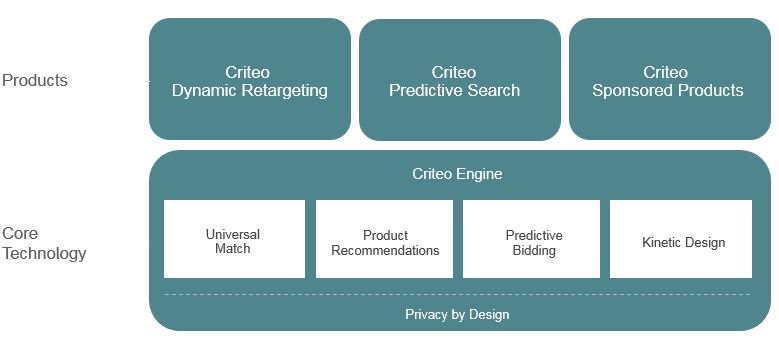
• | Criteo Dynamic Retargeting provides performance marketing to advertisers by pricing and delivering personalized advertisements in real time to consumers on display inventory, including on social and native inventory. |
• | Criteo Predictive Search provides performance marketing to retailer advertisers by pricing personalized product advertisements on the shopping pages of the Google search engine in real time, for which users or consumers have expressed explicit intent by entering a search query. |
• | Criteo Sponsored Products provides performance marketing to brand manufacturers by pricing and delivering in real time sponsored product advertisements to consumers on ecommerce retailers' websites. |
Our technology enables real-time digital performance marketing in four key steps:4
___________________________________________________
4 Some of these steps (specifically product recommendation, dynamic creative and delivery of the personalized advertisement) do not apply to our Criteo Predictive Search product. In addition, prediction bidding does not apply to Criteo Sponsored Products.
2
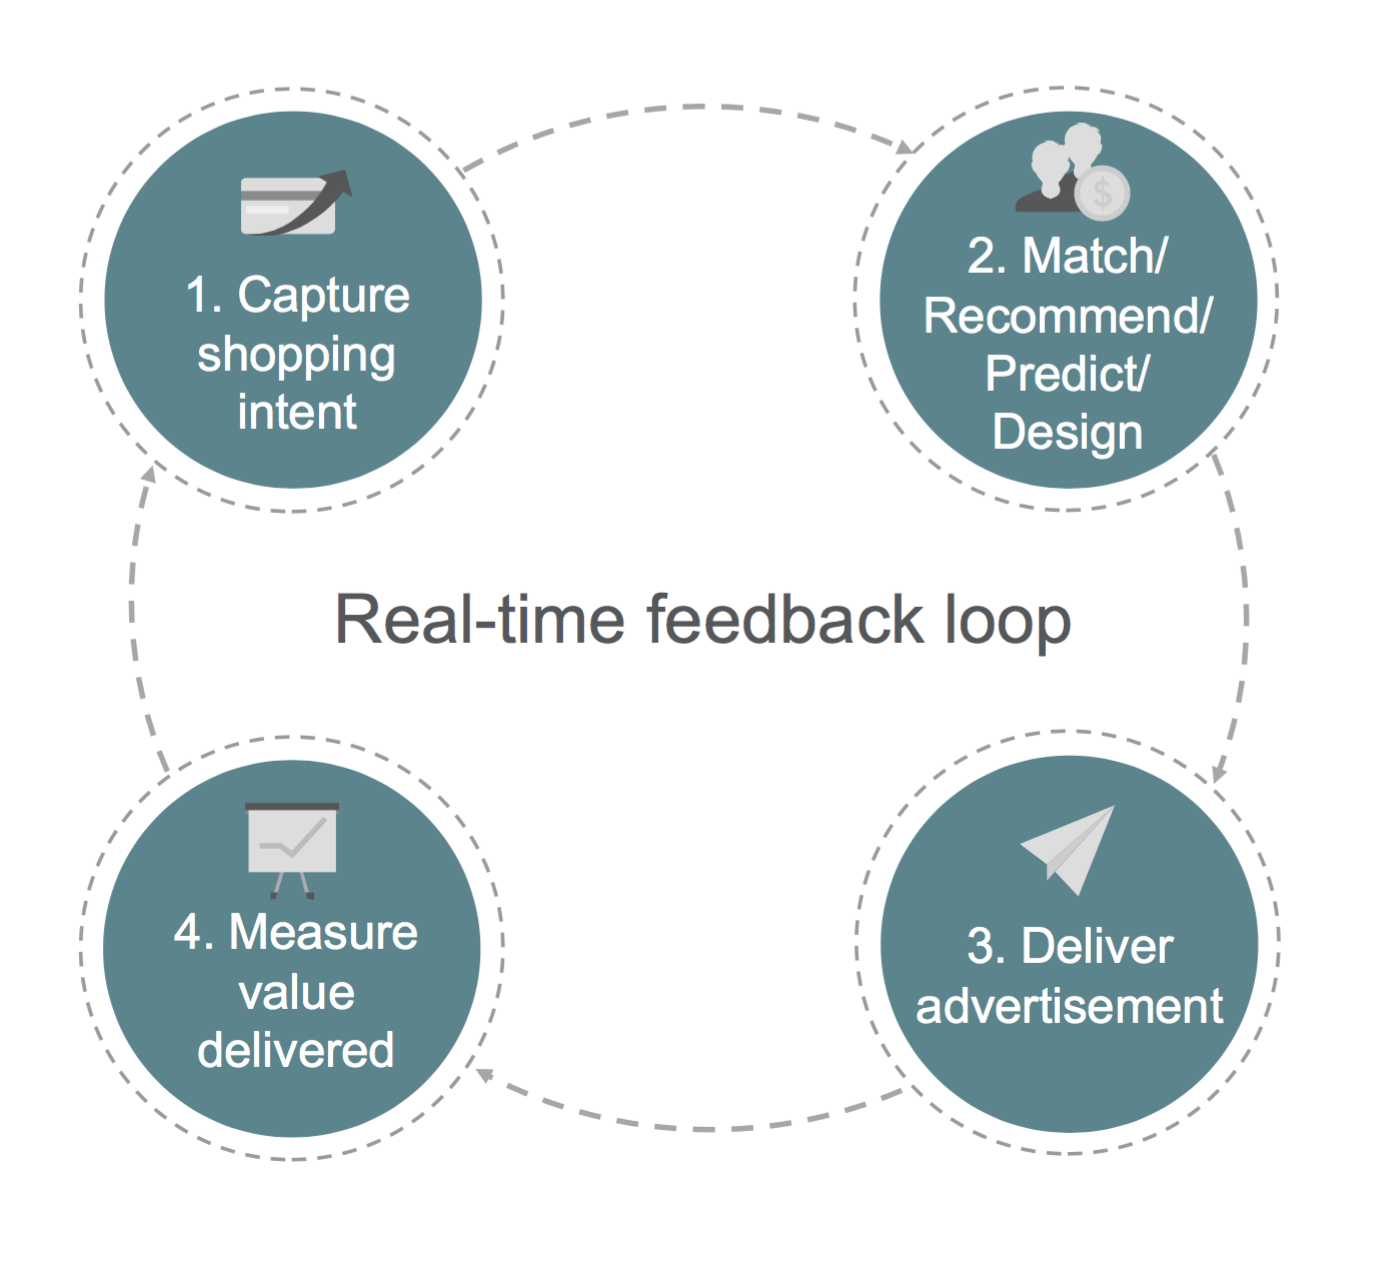
• | First, we capture the shopping intent of individuals, whom we refer to as consumers or users, directly from the online stores and product catalogs of our clients' digital properties, to feed our technology platform. |
• | Second, our proprietary technology sequentially performs the following critical steps: |
▪ | Matches the device identifier of that user across several devices potentially used by that user; |
▪ | Recommends the right product or service to offer to that user, based on the shopping intent data collected for that user and other statistically relevant data points; |
▪ | Predicts the individual value of that user for the advertiser client, whose product or service is on offer in the advertisement, in order to bid the appropriate price for the advertising inventory on which our advertisement will be displayed; and |
▪ | Creates a customized advertisement using optimized creative elements in line with the advertiser's branding guidelines. |
• | Third, we deliver the personalized advertisement to the user across a wide range of inventory available to us through customized technical integrations and ad serving capabilities with publisher partners. |
• | Fourth, we measure in real time the success of the advertisement and provide this performance information to our advertiser clients. |
The entire process leading up to user engagement can be executed in under 100 milliseconds and, throughout the process, our technology monitors and adjusts each of these steps through a real-time feedback loop in order to optimize performance at all times.
Our solution is comprised of the Criteo Engine, our data assets, access to publisher inventory, and our advertiser and publisher platforms. The Criteo Engine has been developed over the past 11 years and consists of multiple machine learning algorithms – in particular our product recommendation, user prediction/predictive bidding and creative algorithms – and the proprietary global hardware and software infrastructure that enables our solution to operate in real time and at significant scale.
3
Our solution covers the entire consumer journey and works seamlessly across digital devices (desktops, laptops, smartphones and tablets), digital environments (web and mobile applications), platforms (Google's Android, Apple's iOS and other operating systems), marketing channels (display, including social and native, search, and sponsored products advertisements on ecommerce retailers' sites) and publisher ecosystems (Google, Facebook and thousands of publishers in the open web).
Access to high quality data assets fuels the accuracy of our algorithms. We obtain large volumes of expressed consumer purchase intent, browsing behavior and transaction data through integration with substantially all of our clients, which enables us to track users' interactions with our clients' digital properties at the individual product level. These data assets include: our clients' sensitive and proprietary data, such as transaction activity on their digital properties; publisher-specific data, such as the performance of advertisements we previously delivered; as well as internally developed data that includes the vast knowledge we have extracted from having delivered and measured responses to over 3.4 trillion advertising impressions since inception.
We believe this deep access to highly granular information demonstrates the trust that our clients place in us. For example, for most of our clients, we typically have real-time access to the products or services a customer has viewed, researched or bought from them and we continuously receive updated information on more than 4 billion products or services, including pricing, images and descriptions. The combination of these data sets gives us powerful insights into consumer purchasing habits that we use to price inventory and create the most relevant advertisements to drive user engagement and ultimately drive sales for our clients.
We also benefit from broad access to inventory through our direct relationships with thousands of publisher partners, including a leading presence on real-time-bidding display advertising exchanges. We define inventory as the combination of display advertising impressions, including social and native display inventory, shopping campaigns inventory on Google and inventory for sponsored products advertisements on major ecommerce retailers' sites. We believe that many of our direct publisher partners have granted us preferred access to portions of their inventory as a result of our ability to effectively monetize that inventory. This access enables us to select, buy and price inventory on an impression-by-impression basis that a publisher might otherwise only sell subject to minimum volume commitments. In addition, in some instances, we get exclusive or priority access to inventory before a publisher makes that inventory available to others. In the specific case of Criteo Predictive Search, we do not purchase search inventory ourselves; our advertiser clients have direct access to Google Shopping inventory, and we optimize the bidding strategy for such inventory on behalf of these clients to maximize the sales generated by their shopping campaigns.
The accuracy and efficiency of the Criteo Engine enables us to charge our clients only when users engage with an advertisement we deliver, usually by clicking on it. In contrast, traditional display solutions typically charge clients when an advertisement is displayed, whether or not the advertisement is seen or clicked on. In the specific case of Criteo Predictive Search, we get paid a percentage of sales generated by a client's Google Shopping campaigns, which means we only get paid for the completed sales. We believe our pay-for-performance pricing model clearly links the cost of a marketing campaign to its effectiveness, and is valued as such by our clients. Our revenue retention rate was 147%, 138% and 120% for the years ended December 31, 2014, 2015 and 2016.5 We define our revenue retention rate as (i) revenue recognized during a period from clients that contributed to revenue recognized in the prior corresponding period divided by (ii) total revenue recognized in such prior corresponding period. We believe that consistently having over 77% of our Revenue ex-TAC generated from clients that have uncapped budgets demonstrates our ability to maintain a high level of revenue retention. As a result, we believe our ability to retain and grow revenue from our existing clients is a useful indicator of the stability of our revenue base and the long-term value of our client relationships.
___________________________________________________
5 Based on Criteo Dynamic Retargeting.
4
Our clients have 24/7 access to a unified dashboard to manage their campaigns, product by product. As a result, we reduce unnecessary complexity and cost associated with manual processes and multiple vendors for our clients, delivering efficiencies even as clients' campaigns grow. Our solution, as we define it, is available as a unique and comprehensive offering and cannot be broken down and purchased as separate services.
As clients have embraced our solution, we have achieved significant growth since our inception and have established a global presence. As of December 31, 2016, we had more than 14,000 clients that used our solution, including some of the largest and most sophisticated ecommerce companies in the world, as well as world-class consumer brands.
Our financial results include:
• | revenue of $988.2 million, $1,323.2 million and $1,799.1 million for the years ended December 31, 2014, 2015 and 2016, respectively; |
• | revenue excluding traffic acquisition costs, which we refer to as Revenue ex-TAC, which is a non-U.S. GAAP financial measure, of $402.8 million, $534.0 million and $730.2 million for the years ended December 31, 2014, 2015 and 2016, respectively; |
• | net income of $46.9 million, $62.3 million and $87.3 million for the years ended December 31, 2014, 2015 and 2016, respectively; and |
• | Adjusted EBITDA, which is a non-U.S. GAAP financial measure, of $105.4 million, $143.4 million and $224.6 million for the years ended December 31, 2014, 2015 and 2016, respectively. |
Please see footnotes 3 and 5 to the "Other Financial and Operating Data" table in "Item 6. Selected Financial Data" in this Form 10-K for a reconciliation of Revenue ex-TAC to revenue and Adjusted EBITDA to net income, in each case the most directly comparable financial measures calculated and presented in accordance with accounting principles generally accepted in the United States or "U.S. GAAP".
Industry Background
The ability to engage and convert customers is a critical success factor for most companies, especially for businesses in the ecommerce sector, who often dedicate a significant portion of their cost base to developing such an ability. Business to consumer ecommerce sales in retail and travel were approximately $2.6 trillion globally in 2016, and are expected to grow at an 18% compound annual growth rate, or CAGR, to $4.3 trillion in 2019, according to eMarketer. The internet and mobile devices continue to be critical to generating customer engagement and leads that ultimately result in sales, both online and offline. However, these advertising mediums are also complex and fragmented, making it difficult and costly to engage and convert customers. For example, the global cart abandonment rate, or the percentage of online customers leaving their order behind instead of purchasing, was 74.4% in the third quarter 2016 according to SaleCycle, including 73.9% in the Retail vertical and 80.4% in the Travel vertical. It is therefore important for businesses to develop and execute marketing campaigns across all digital devices, effectively capitalizing on large amounts of consumer intent data, machine-learning technology, and the ability to target and measure at scale.
There are two primary channels for customer engagement and conversion in the digital space - search and display. According to eMarketer, marketers spent $179 billion on digital search and display advertising combined in 2016, with this spend expected to grow at a 15.3% CAGR to over $316 billion in 2020. Search marketing, which mainly consists of placing text-based and/or product listing advertisements alongside user query results, represented 50.0% of the combined digital search and display advertising spend in 2016, according to eMarketer. It is expected to grow from $89.5 billion in 2016 at a 13.9% CAGR to $150.6 billion in 2020, according to eMarketer.
5
Historically, search has been effective at capturing consumer intent and quickly delivering highly targeted advertisements based on query keywords, showing measurable results through simple, pay-for-performance pricing, and creating an automated and efficient marketplace for advertising inventory. Shopping ads are making up a larger part of overall retailer budgets for search, with shopping ad spend growing from 18% of global search ad spend in January 2014 to 28% in March 2016, according to Marin Software.
Internet display advertising involves placing images, video or advertisements that incorporate animation, sound and/or interactivity, which we refer to as rich media content, alongside website and mobile application content. According to eMarketer, display advertising accounted for 50.0% of the $179 billion combined market in 2016, and is projected to grow at a 16.7% CAGR to $166 billion in 2020. The display advertising market is more fragmented and is growing at a faster rate than search, due in part to the rapid rise of mobile internet usage, as well as the continued proliferation of content across the internet, including on social media platforms. Through internet display advertising, businesses can deliver effective advertisements integrating rich media. These attributes have led display advertising to be well suited to broad marketing objectives, including generating awareness and favorability for brands as opposed to the intent-driven performance objectives of search.
Internet display advertising faces a number of important challenges as an effective intent-driven medium for customer engagement and conversion, including:
Difficult to Deliver Targeted, Relevant Ads. Businesses strive for targeted, relevant advertisements to minimize wasted spend and maximize their chances of generating engagement, and ultimately a sale. Relevant advertisements are ones that target a specific audience, or a specific user, with a message that matches that audience's, or that specific user's, purchase intent or interest and that are delivered at the right moment. Achieving relevance, however, is particularly difficult because users are scattered across online destinations and devices, and consumer purchase intent and interest can be hard to determine or can change rapidly. Against this backdrop, traditional internet display advertising solutions have incorporated limited personalization capabilities. In addition, these solutions have generally not been effective in utilizing consumer intent as a signal for the delivery of advertisements. As a result, targeting and messaging have mainly been done by buying advertising impressions for generic audiences and placing generic advertisements alongside certain types of content (e.g., non-personalized automotive advertisements on sites related to cars), without incorporating purchase intent or interests. These traditional campaigns often lack relevance, and as a consequence result in limited user engagement and conversion.
Difficult to Deliver Performance at Scale. Many internet display advertising solutions are unable to sustain performance for larger campaigns or longer trials due in part to the highly fragmented nature of the internet display landscape, increasing amounts of data and lack of robust technology. Therefore, the challenges described above are amplified for larger and more complex campaigns.
Pricing Disconnected from Performance. Internet display advertising inventory has historically been sold on a cost per impression, or CPM, basis, meaning that an advertiser is charged each time an advertisement is displayed, whether or not a user interacted with the advertisement. This makes it difficult for advertisers to determine the true cost of an advertising campaign and evaluate the relationship of that cost to the effectiveness of the campaign in driving engagement and sales. Today, there are a few different pricing models generally available in the internet advertising market, including the traditional CPM pricing model, as well as cost per click, or CPC, pricing model, where an advertiser is charged when a user clicks on the advertisement, cost per action, or CPA, pricing model, where an advertiser is charged when a user takes a specific action, and hybrid pricing models, which reflect a combination of one or more of these models. While the search segment of the internet advertising market is generally priced on a CPC model, we believe the internet display advertisement segment of the internet advertising market has generally been and continues to be priced on a CPM basis.
6
Inefficient Campaign Execution. Deployment of internet display advertising campaigns can be inefficient and costly. Traditional solutions are often a combination of many point solutions, requiring businesses to connect and manage multiple intermediaries and complex elements of the advertising campaign execution process, including media planning, data analysis, targeting, creative assembly, media buying, optimization, advertisement serving and reporting. In addition, meaningful portions of campaign planning, execution and management remain highly manual.
Lack of Performance Display Advertising Options for Brand Manufacturers. Brand manufacturers, who usually do not directly sell their products online via their own ecommerce store but instead rely on multi-brand ecommerce stores for that purpose, face a number of significant challenges when they attempt to invest in performance-based digital advertising outside of search, to engage their customers and drive online sales. As a result, brand manufacturers have a very limited number of options to advertise their products on a performance basis via display campaigns and to get a clear and measurable view of how such advertising campaigns drive their sales.
We believe internet display advertising has reached a critical inflection point where its potential to be both a brand building medium and a more effective engagement and conversion medium has finally materialized. This transformation is being driven by powerful technology trends including:
Machine Learning. According to IDC Research, from now until 2020, the digital universe is expected to double every two years. The large and diverse data sets that make up this digital information are often referred to as big data and are generally categorized into business application data, human-generated content and machine data. New computational approaches and the falling costs of computing power enable technology companies to process and draw insights from this data using machine-learning approaches. These insights can be used to optimize display advertising campaigns in ways that were not previously possible. The ability to collect, collate and analyze shopping intent data points using machine-learning technology, is becoming a key differentiator for advertisers, including for brand manufacturers.
Programmatic Buying. Technologies for more automated and efficient buying and selling of display advertising have been gaining traction for several years with both advertisers and publishers. Programmatic buying from real-time, automated buying platforms and bidding exchanges, as well as through relationships with publishers, provide advertisers with dynamic, targeted and efficient ways to access the proper inventory, and help publishers to maximize the value of their advertising inventory. Worldwide spending in programmatic display advertising is expected to grow from $19 billion in 2016 to $42 billion in 2020 according to MAGNA, representing a CAGR of 22%.
Mobile and Cross-Device Commerce. Penetration of smartphones and tablets is driving rapid growth of global mobile commerce. Mobile commerce represented $429 billion globally in 2016, and is expected to grow at a 25% CAGR between 2016 and 2018 according to Statista. In addition, consumers increasingly use multiple devices to interact with ecommerce websites and mobile applications. Accordingly, transactions involving the usage of multiple devices, referred to as "cross-device" transactions, represent a fast-growing share of ecommerce, and mobile commerce in particular.
In addition, we believe the search marketing landscape for ecommerce retailers is now ready for disruption.
Although search has been an effective marketing channel to deliver measurable results through simple, pay-for-performance pricing, advertisers still face a number of complexities and challenges when buying search advertising. While several changes introduced in the search marketing ecosystem over the past few years, including Product Listing Ads ("PLA") formats, the provision of Remarketing Lists for Search Advertising ("RLSA"), and the opportunity to make bid modifications in real time, have brought new opportunities to search buyers, they also came with increased complexity with respect to implementation and execution.
7
In particular, for large ecommerce retailers with vast product catalogs, such complexities and challenges may include: the automated structuring of their product catalog and linkage of product attributes with relevant query keywords; the building and structuring of user lists; grouping users according to multiple variables (including but not limited to users' digital devices, shopping intent types, intensity by product category or users' past and recent shopping behavior); and real-time bid modification per query keyword or query product according to a specific user list.
While traditional agencies and software providers in the fragmented Search Engine Marketing ("SEM") landscape have approached this evolving market through the provision of bidding or workflow automation tools, we believe significant opportunities have now emerged for the provision of a comprehensive and scalable machine-learning technology approach to search, in particular for ecommerce retailer advertisers. We believe our Criteo Predictive Search product brings better performance from search marketing to retailers through sophisticated, automated and end-to-end technology.
Competitive Strengths of our Solution
We believe our solution transforms the way our clients use digital performance marketing to drive sales by making digital performance marketing, and in particular digital display advertising, a more efficient and effective medium for engaging consumers and converting them into buyers. We believe the following competitive strengths will enable us to capture increasingly greater digital performance marketing spend:
Powerful, Scalable Technology & Network Effects. Our solution is the result of 11 years of research and development and investment in our technology platform. The Criteo Engine is supported by a flexible and scalable high-performance computing infrastructure, made of two Hadoop clusters hosting 76,000 processing cores with total storage capacity of 127,000 terabytes and 363 terabytes of random-access memory. Every day, our platform can process 100 terabytes of additional compressed data. We own approximately 20,000 servers through a global network of eight data centers. We believe our core technology assets are increasingly hard to replicate by other market participants. Our technology platform, which is developed and maintained by a team of over 600 engineers, operates at significant scale and is powered by machine-learning algorithms whose accuracy and performance improve with each new piece of information about a user and the billions of advertising impressions we analyze daily, creating a cycle of increasing network effects. As clients spend more with us and we attract more publisher inventory and deliver more advertisements, our data assets grow, enabling us to deliver even more precisely targeted and personalized advertisements and generate additional sales for our clients. As a result, we believe more advertisers will use our solution and increase their spend with us. This, in turn, will enable us to increase advertising revenue for our publishers, further expanding our publisher network and enhancing our ability to drive increasing volumes of sales for advertisers. We expect this cycle of self-reinforcing network effects will continue to contribute to fueling our growth.
Highly Relevant, Targeted Ads. Through our deep data-driven understanding of consumer intent and behavior, we are able to deliver highly relevant, targeted and personalized advertisements across multiple digital devices. Substantially all of our clients grant us access to their detailed consumer purchase intent and behavior data through integration with their websites and mobile applications. More broadly, our own operating data includes insights from user responses to each advertisement that we provide, which we use to continually improve our performance. The scale and breadth of our data is constantly growing as users interact with our clients and as we deliver advertising impressions. For example, in 2016, we delivered over 974 billion targeted advertisements. By dynamically matching what we believe to be a user's intent or interest with a personalized advertisement, we are able to deliver more relevant and engaging advertisements to users, which are more likely to lead to sales. Our average click-through rate, or the ratio of clicks generated by our advertisements over the number of advertising impressions we purchased ("CTR"), was over 0.76% in 2016, which represents a factor of over four times the average click-through rate of 0.19%, as measured by the DoubleClick display benchmark tool for 2016. We believe our superior click-through rate illustrates the superior performance of our solution.
8
Performance-Driven Business Model and Transparency of Return-On-Investment. We only get paid when a user engages with one of our advertisements, usually by clicking on it. This model is well proven in search marketing, and our clients value pay-for-performance pricing for providing a clear link between the cost of their marketing campaign and its effectiveness in driving sales for them. In the specific case of Criteo Predictive Search, we get paid a percentage of the sales generated by a client's Google Shopping campaigns, which means we only get paid for completed sales. As the Criteo Engine becomes more sophisticated, we are increasingly optimizing our solution not just to maximize clicks at a target CPC, but to maximize post-click sales at a target cost of sales. As a result, most of our clients now set their budgets with us whereby their total spend with us is effectively constrained mainly by our ability to find enough relevant opportunities for them that achieve their specific return objectives. For example, for the year ended December 31, 2016, over 77% of our Revenue ex-TAC was derived from clients whose budgets were either uncapped or so large that the budget constraint did not restrict purchases of advertisements by us. In addition, existing advertiser clients continue to increase their advertising spend with us as illustrated by our 120% revenue retention rate for Criteo Dynamic Retargeting for the year ended December 31, 2016, demonstrating our ability to drive revenue expansion within our existing client base.
We use the industry-standard last-click attribution model to measure the effectiveness of our solution for our advertiser clients. We believe that our return-on-investment calculation methodology, based on post-click sales, is a relevant proxy for the sales we generate for our clients. For the year ended December 31, 2016, we estimate that our solution helped generate approximately 8% of the total online sales of our retail clients with uncapped budgets.6 As a result, we believe that marketers view their spend with Criteo as a transparent and elastic cost of sales, as opposed to a traditional discretionary marketing spend.
Complete Performance Solution Including our Large-Scale User Graph. Our solution covers the entire consumer journey, working seamlessly across digital devices (desktops, laptops, smartphones and tablets), digital environments (web and mobile applications), platforms (Google's Android, Apple's iOS and other operating systems), marketing channels (display, including social and native, search, and sponsored products advertisements on ecommerce retailers' sites), and publisher ecosystems (Google, Facebook and thousands of publishers in the open web). With the dramatic increase in smartphone and tablet usage in an increasingly fragmented digital landscape, it has become critical for marketers to engage and convert their customers across multiple digital devices. We believe that, for advertisers looking to engage with their prospects or customers irrespective of the digital device, digital environment, platform, marketing channel or publisher ecosystem where the user may be, our complete performance solution provides a clear advantage over other solutions available on the market.
In the fourth quarter of 2016, virtually all of our clients used our multi-screen solution, including on desktop and mobile devices, and 63% of our Revenue ex-TAC was generated by clicks on advertisements delivered on mobile devices. At the end of 2014, we launched our "Universal Match" cross-device matching solution that allows us to match users across several devices. Through Universal Match, we are able, for a single user, to capture shopping intent data from one device, show an ad on another device and track sale conversion on a third device. At December 31, 2016, over 73% of our clients contributed non-identifying Customer Relationship Management ("CRM") data points that enable the exact match of users across multiple devices and the building of a large-scale user graph. We believe our complete performance solution, including our powerful, large-scale user graph, will increasingly become a competitive strength.
___________________________________________________
6 Based on Criteo Dynamic Retargeting only.
9
Deep Liquidity of Demand and Supply. Over multiple years, we have built an extensive network of relationships with our advertiser clients and publishers, creating a highly liquid marketplace for internet display advertising inventory. As of December 31, 2016, we had over 14,000 advertiser clients, including some of the largest ecommerce companies in the world and approximately 82% of our advertiser relationships were directly with the advertiser in the fourth quarter of 2016. For the year ended December 31, 2016, our top 10 clients represented 11.8% of our revenue. As we continue to grow our client base, we will continue to grow the number of users who interact with our advertisements, which will allow us to benefit from greater scale when we purchase inventory from publisher partners. On the supply side, we have direct relationships with thousands of publisher partners and are also integrated with the leading advertising exchanges and networks. A dedicated team of approximately 130 professionals is focused on building and maintaining our direct relationships with publishers, many of whom have granted us preferred access to portions of their internet display advertising inventory. For the month of January 2016, comScore data indicated that over 1.2 billion unique users saw Criteo advertisements on the desktop alone, representing the second largest reach worldwide. Our deep and liquid marketplace has enabled us to increase our reach and access to quality advertising inventory, allowing us to quickly match an advertisement to a user before purchase intent has diminished.
Simple End-To-End Solution and Highly Efficient Campaign Execution at Scale. Our solution is end-to-end: it encompasses the integration of our advertiser clients' digital properties, the tracking of users, the real-time buying of impressions on publishers' digital properties, the real-time creation of customized advertisements for each specific client and its prospective end customer, the serving and delivery of the advertisements and the provision of real-time analytics on the performance of marketing campaigns. In addition, our clients have 24/7 access to a unified dashboard to manage their performance marketing, product by product. Our platform automates most of the processes associated with executing a performance marketing campaign, such as creative assembly, real-time buying of inventory and campaign optimization, and billing. Using our platform, our clients are able to drive sales based on their specific cost of sales or return on investment objectives in large volumes with real-time control over the price they pay. As a result, we reduce unnecessary complexity and cost associated with manual processes and multiple providers involved in performance marketing campaign management. Further, we are able to continue to deliver these efficiencies even as marketing campaigns scale and become more complex.
Extensive Reach and Global Presence. We do business in over 90 countries and have a direct operating presence in 19 countries. For 2016, close to 42% of our revenue was derived from clients who conducted marketing campaigns with us in more than one national market. We have achieved this global presence by replicating and scaling our business model across geographic markets. Large businesses are increasingly seeking global marketing partners with comprehensive performance solutions that are effective across multiple geographies. We believe we are able to meet this demand by leveraging our scalable technology and global network of relationships and are well positioned to serve our clients in nearly every market in which they seek to drive sales.
Commitment to Privacy. We are committed to consumer privacy. The user information we collect relates primarily to purchase intent and is therefore not considered to be information that can directly identify a user. In 2009, we became one of the first companies to include a link in all the advertisements we deliver, which gives users access to clear, transparent, detailed and user-friendly information about personalized advertisements and the data practices associated with the advertisements they receive. In addition, we provide consumers with an easy-to-use and easy-to-access mechanism to control their advertising experience and opt out of receiving targeted advertisements we deliver or send, either for all campaigns or for a specific client or specific period of time. We believe that this transparent consumer-centric approach to privacy empowers consumers to make better-informed decisions about our use of their data. We also actively encourage our advertiser clients and publishers to provide information to consumers about our collection and use of data relating to advertisements we deliver and track.
10
Our Growth Opportunities
Our vision is to build the world's performance marketing platform for commerce and brands. Our goal is to drive post-click sales at scale for our clients at their target return on investment, through customer engagement and conversion, across multiple marketing channels. We are currently expanding our business and strengthening our performance marketing platform through multiple growth opportunities, both within our core business and in new areas focused on performance marketing. The core elements of our growth strategy include:
Continuing to Innovate and Invest in Technology and Data. We intend to continue to make substantial investments in research and development to further increase the efficiency and effectiveness of our solution by improving our machine-learning algorithms and underlying technology platform. In addition, as the rich data sets that drive performance on a real-time basis are central to our technology and product investments, we also intend to continue to develop ways of extracting greater value from the data we collect for the benefit of our clients. We believe our technology, product and data investments will continue to enhance our value proposition for both existing and prospective clients and publisher partners.
Selectively Broadening our Spectrum of Marketing Channels. We started delivering our solution through internet display advertisements in desktop browsers. Since then, we have expanded into mobile in-browser and in-app, native display, including on social media platforms, search engine marketing and sponsored products advertisements on ecommerce retailers' sites. We intend to continue to invest in our existing marketing channels. For example, we are currently exploring potential ways to expand into performance-based video advertising. We also intend to expand selectively into additional marketing channels, in order to help our clients generate more sales across a broader range of marketing channels while always using a single solution priced on a transparent performance-based model. In addition, we are exploring the possibility of measuring the impact of our digital campaigns on our clients' in-store sales. We believe a broader platform of complementary marketing channels, all based on measurable performance, will enhance our value proposition for existing and prospective clients.
Broadening our Supply of Quality Advertising Inventory. We already partner with thousands of publishers globally for display advertising with Criteo Dynamic Retargeting. While we work with both real-time bidding internet display exchanges and direct publishers, including premium publishers, 44% of our Revenue ex-TAC in the second quarter of 2016 was generated from inventory sourced from publishers with whom we have a preferred relationship. We intend to maintain a high level of preferred relationships, with both premium and mid-sized publishers. In addition, we continue to broaden our supply of quality advertising inventory, with a particular focus on mobile, native and social inventory. With Criteo Sponsored Products for brand manufacturers, we intend to increase our publisher reach by providing a broader share of our existing retailer client base the opportunity to monetize their website inventory. We believe a broader supply of quality advertising inventory will continue to enhance our value proposition for existing and prospective clients, including both commerce and brand advertisers.
Expanding our Client Base of Brand Manufacturers. Our solution primarily addresses performance marketing for companies in the digital retail, travel and classifieds verticals. As a result, our client base includes some of the largest and most sophisticated ecommerce companies in the world. Through Criteo Sponsored Products, we now also address the needs for measurable performance marketing of brand manufacturers, who can advertise their products on major ecommerce retailers sites. We believe the marketing spend of brand manufacturers on a performance basis represents a significant opportunity for us. We intend to continue to broaden our client base to brand manufacturers through the expansion of Criteo Sponsored Products on a larger number of ecommerce retailers' sites. We believe our powerful and measurable performance solution, along with our large base of ecommerce retailer partners, will enhance our value proposition for existing and prospective clients in the large brand manufacturers vertical.
11
Leveraging our User Graph Pooled Asset to Convert our Clients' Customers Across All Devices. We deliver performance marketing across multiple digital devices and environments. With the dramatic increase in smartphone and tablet usage in an increasingly fragmented digital landscape, it has become critical for marketers to engage and convert their customers across multiple digital devices. At December 31, 2016, over 73% of our clients contributed non-identifying CRM data points that enable the exact match of users across multiple devices and the building of a large-scale user graph. In the fourth quarter of 2016, approximately 60% of our Revenue ex-TAC was generated by clicks from users matched on at least two devices through our "Universal Match" technology. Given the significant scale that building a relevant and powerful user graph requires, we believe our pooled asset will increasingly become a competitive strength. As a result, we believe our large-scale user graph will continue to enhance our value proposition for existing and prospective clients, in particular in the competitive retail sector.
Expanding our Presence in Core Markets and Penetrating New Geographic Markets. We believe significant opportunities remain for us to grow our business in geographic markets where we already operate, such as Western Europe, the United States and Japan. Additionally, we plan to leverage and grow our existing sales teams as we expand operations in markets entered more recently. We have a strong track record of entering new markets successfully and rapidly achieving commercial traction. We believe our broad global presence will continue to enhance our value proposition for existing and prospective global ecommerce and brand advertisers.
Continuing to Grow our Client Base Across Advertiser Categories. We intend to continue growing our client base, both in the large client and the midmarket categories. During 2015 and 2016, we invested significantly to capture the midmarket opportunity and intend to continue investing in this promising market segment. In particular, we plan to expand our midmarket presence in the Americas, Europe, the Middle East and Africa, or EMEA, and Asia-Pacific.
Addressing Additional Marketing Objectives Along the Customer Lifecycle. We started delivering our solution by addressing the direct-response marketing objectives of ecommerce advertisers looking to generate sales at a targeted return on investment through our Criteo Dynamic Retargeting product. With our existing product portfolio, we have demonstrated the strength and measurability of our performance-based solution in customer retargeting. In order to accompany our clients along a larger part of the customer lifecycle, and in particular help them acquire prospective customers, we intend to invest in developing products that address acquisition marketing objectives, while always using a single solution priced on a transparent performance-based model. For example, we are exploring potential ways to expand into customer prospecting and installation of mobile applications by new customers. We believe expanding into a broader set of marketing objectives, while always measuring performance in a clear and accountable way, will enhance our value proposition for existing and prospective clients.
Pursuing Strategic Acquisitions. We selectively evaluate technologies and businesses that we believe have potential to enhance, complement or expand our technology platform and product portfolio or strengthen our research and development team. We target acquisitions that can be efficiently integrated into our technology infrastructure and global operations, while preserving the quality and performance of our offering. We believe we are an acquirer of choice among prospective acquisition targets due to our entrepreneurial culture, growth, global scale, strong brand and market position.
12
Our Solution
Our technology delivers digital performance marketing. We generate post-click sales for our clients by efficiently and effectively engaging and converting customers across multiple marketing channels. Our solution is comprised of the Criteo Engine, our data assets, access to publisher inventory, and our advertiser and publisher platforms.
Criteo Engine
The Criteo Engine leverages the vast and high-quality data assets developed through our extensive relationships with thousands of advertisers and publishers, as well as our significant operational history, with the goal of delivering, in real time, highly relevant and personalized digital performance advertisements that engage and convert consumers.
The Criteo Engine consists of:
• | Recommendation algorithms. These algorithms dynamically create and tailor advertisements to specific user interest by determining the specific products and services to include in the advertisement. These products and services may be ones that a user has already been exposed to, or to a large extent, that the algorithms predict the user could be interested in. Alternatively, these products and services may be ones that other users, who have been exposed to some of the same products and services as such user, have been interested in. |
• | User value prediction and predictive bidding algorithms. These algorithms predict the probability and nature of a user's engagement with a given advertisement, in the form, for example, of clicks, conversions, basket value, or even specific product categories purchased. This prediction of engagement incorporates data from our advertiser clients, publishers and third-party sources, including user intent, who the advertiser is, the products offered by the advertiser client, as well as data on the creative content of the advertisement and the publisher context in which the advertisement is viewed. Together with our recommendation algorithms, the prediction algorithms allow us to determine the most appropriate price to pay for an advertising impression based on an individual user's predicted engagement, conversion and conversion value, as well as what the advertiser client is willing to pay for that engagement. |
• | Bidding engine. Our bidding engine executes campaigns based on certain objectives set by our clients (for example, cost-per-click limits and number of sales). After a bid is placed and won, the Criteo Engine assembles and delivers individualized advertisements and provides campaign reporting, all in near-real time. |
• | Dynamic creative optimization. Based on the results of our algorithms, the Criteo Engine automatically assembles customized advertising content on an impression-by-impression basis in real time, by optimizing each individual creative component in the advertisement, from the font, color, size of product pictures to the "call to action" or price discount. Our "Kinetic Design" creative technology offers virtually unlimited personalization, with up to 17 trillion visual ad variations, while maintaining advertisers' brand consistency. |
• | Software systems and processes. Our algorithms are supported by robust software infrastructure that allows our solution to operate seamlessly at scale. The architecture and processing capabilities of this technology have been designed to match the massive computational demands and complexity of the algorithms. This technology enables data synchronization, storage and analysis across a large-scale distributed computing infrastructure in multiple geographies, as well as fast data collection and retrieval using multi-layered caching infrastructure. |
• | Experimentation platform. This offline/online platform is used to improve the prediction abilities of our models by measuring the correlation of specific parameters with user engagement, usually measured by clicks and conversions (typically in the form of sales). A dedicated team is constantly testing new types and sources of data to determine whether they help to diminish the gap between predicted engagement and conversion and actual observed engagement and conversion over the course of a live campaign. |
13
Data Assets
The accuracy of our algorithms improves with both the increasing quantity and quality of data we obtain from our clients and publishers, as well as insights gained through our extensive operational history. Using cookies and similar tracking technologies, we collect information about the interaction of users with our advertisers' and publishers' digital properties (including, for example, information about the placement of advertisements and users' shopping or other interactions with our clients' digital properties or advertisements). We have access to large volumes of granular data from our clients, which carry consumer intent and are directly relevant to those clients' campaigns. The information we collect does not enable us to identify the particular user. Our clients grant us access to their valuable data through direct integration with us, which requires our clients to place Criteo software code throughout their digital properties. This integration gives us privileged insight into users' behavioral history at the product level for each client, representing a very high-quality data asset. We use the shopping intent data from each specific client solely for the benefit of that specific client's marketing campaigns.
In addition to client data, we seek to use as much information as possible about the context or intent of a given user to further refine our prediction accuracy. We collect this data directly from our advertiser clients or publishers.
In addition to consumer shopping intent data, some of our advertiser clients give us access to non-identifying CRM data, creating a pooled asset to enable us to match users across multiple digital devices, through deterministic technology, in order to build a large-scale user graph benefiting all clients who contribute such CRM data.
Access to Inventory
Through our relationships with the leading real-time bidding, or "RTB," internet display exchanges, and thousands of publisher partners, including through our Publisher Marketplace, we provide extensive access to advertising inventory. In some cases, we have negotiated direct and privileged access with publishers, giving us the opportunity to purchase on an impression-per-impression basis and in real time: (1) inventory that a publisher might otherwise only sell subject to minimum volume commitments; and/or (2) particular advertising impressions before such impressions are made available to other potential buyers. For example, in Japan, we have entered into a strategic relationship with Yahoo! Japan, giving us privileged access to its advertising inventory for delivering personalized display advertisements. With Criteo Sponsored Products, we access inventory from ecommerce retailers’ sites that is generally not available to traditional advertising demand. This sponsored product inventory from ecommerce retailers is a valuable source of inventory for brand manufacturers to advertise their products on a performance basis.
Across both our direct publisher relationships and inventory purchasing done on advertising exchanges, we leverage the Criteo Engine's ability to quickly and accurately value available advertising inventory, and utilize that information to bid for inventory on a programmatic, automated basis. Our ability to efficiently access and value inventory results in deep liquidity, allowing us to deliver effective advertisements at the right price for our clients, even as the size and complexity of campaigns increases.
For Criteo Dynamic Retargeting, we purchase inventory from our direct publishers generally through insertion orders consistent with industry standard terms and conditions for the purchase of internet advertising inventory. Pursuant to such arrangements, we purchase impressions on a CPM basis for users that Criteo recognizes on the publishers' network. Such arrangements are cancellable upon short notice and without penalty. For Criteo Sponsored Products, we pay for the inventory of our ecommerce retailer partners on a revenue sharing basis, effectively paying the retailers a portion of the click-based revenue generated by user clicks on the sponsored products advertisements displaying the products of our brand manufacturer clients. For Criteo Predictive Search, we do not source the search inventory ourselves. Our advertiser clients have direct access to Google Shopping inventory, and we optimize the bidding price for such inventory on behalf of these clients to maximize the sales generated by their shopping campaigns.
14
Through the direct relationships we have with publishers, we take measures to determine that the publisher's inventory meets our content requirements and the content requirements of our clients to ensure that their display advertisements are not shown in inappropriate content categories, such as adult or political content. With respect to our inventory purchased through RTB exchanges, we utilize third-party software to verify that the inventory where the advertisement placement is shown conforms to our advertising guidelines and the content expectations and branding guidelines of our advertiser clients.
Advertiser and Publisher Platforms
We offer our clients an integrated technology platform that enables comprehensive visibility and includes a unified and easy-to-use dashboard and a suite of software and services that automates key campaign processes. As a result, we reduce unnecessary complexity and cost associated with manual processes and multiple vendors, delivering efficiencies even as campaigns grow.
Our integrated solution includes a comprehensive suite of services and software tools, including:
• | A unified dashboard to manage campaigns, product by product. This dashboard automates a number of campaign execution and management tasks. Key attributes of the dashboard include: |
▪ | easy-to-use interface; |
▪ | 24/7 availability; |
▪ | granular control, with the ability to specify product categories and bid at the category level; and |
▪ | transparent and detailed reporting of key campaign metrics, such as CPCs, impressions served, effective cost per thousand impressions, or eCPM, and post-click sales. |
• | Business intelligence and analytics. We provide high value-added consulting services to our larger clients through a team of advisers that aid them in setting goals for, extracting insights from, and evaluating trends and performance of their marketing campaigns across our different sources of inventory supply, marketing channels, and the multiple digital devices that consumers may use. |
• | Publisher Marketplace. We also offer small and mid-sized publishers direct access to advertisers by providing a comprehensive inventory management platform that we call the Criteo Publisher Marketplace ("PuMP"), which allows us to access the inventory of these publishers, without directly managing that inventory. Through this platform, our small- and mid-sized publisher partners have access to: |
▪ | an easy-to-use interface; |
▪ | 24/7 availability; |
▪ | control to specify minimum prices for each publisher’s inventory; and |
▪ | reporting that allows each publisher to monitor the amount of money they have made selling their inventory to us. |
15
Strategic Relationship with Yahoo! Japan
In August 2012, we entered into a strategic relationship with Yahoo! Japan, a leading provider of advertising inventory in Japan, which provides us with privileged access to their performance-based display inventory. In connection with this strategic relationship, Yahoo! Japan invested in our subsidiary, Criteo K.K. We retain 66% ownership of Criteo K.K. and Yahoo! Japan holds 34% ownership. Yahoo! Japan has the right to require us to buy back its interest upon the occurrence of certain events (such as bankruptcy or breach of obligations), and we have the right to require them to sell their interest in Criteo K.K. under specified circumstances, such as a termination of the commercial relationship.
This strategic relationship may be terminated by either party for material breach and other customary events. The term of this strategic relationship was renewed to August 2017 and will renew automatically thereafter for one-year terms if neither party provides advance written notice of its intent not to renew within a specified period of time.
Infrastructure
Our ability to deliver our solution depends on our highly sophisticated global technology software and hardware infrastructure. Our global infrastructure includes approximately 20,000 servers, including two Hadoop clusters comprising 2,130 servers providing a storage capacity exceeding 127,000 terabytes and 363 terabytes of random-access memory. Our global infrastructure is divided into four independent geographic zones in the Americas, Asia-Pacific, EMEA and mainland China. In each of the zones, our services are delivered through data centers that support these zones. We generally rely on more than one data center in any given zone. The data centers are strategically placed within large zones to be close to our advertiser clients, publishers and users. This has the benefit of minimizing the impact of network latency within a particular zone, especially for time-constrained services such as RTB. In addition, we replicate data across multiple data centers to maximize availability and performance. We also generally seek to distribute workload across multiple locations in order to avoid overloads in our systems and increase reliability through redundancy.
Within each data center, computing power is provided by horizontal build-outs of commodity servers arranged in multiple, highly redundant pools. Some of these pools are dedicated to handling incoming traffic and delivering advertisements and others are devoted to the data analytics involved in creating these advertisements. In particular, we use clusters using software specifically designed for processing large data sets, such as Hadoop, to run offline data analyses. The results are then fed back to refresh and improve our prediction and recommendation algorithms.
We use multiple-layered security controls to protect the Criteo Engine and data assets, including hardware- and software-based access controls for our source code and production systems, segregated networks for different components of our production systems and centralized production systems management.
Our Clients
Our client base consists primarily of companies in the digital retail, travel and classifieds verticals and includes some of the largest and most sophisticated ecommerce companies in the world. These companies range from large, global, diversified ecommerce companies to mid-sized regional companies. With Criteo Sponsored Products, we also serve brand manufacturers as advertiser clients. As of December 31, 2016, we had over 14,000 clients, representing advertisers who had a marketing campaign live with us on any given day over a 12 trailing-month period. In 2016, approximately 82% of our client relationships were held directly with the advertiser.
We believe our business is not substantially dependent on any particular client or group of clients. In 2014, 2015 and 2016, our largest client represented 2.9%, 1.9% and 2.0% of our revenue, respectively, and in 2016 our largest 10 clients represented 11.8% of our revenue in the aggregate.
16
There is no group of customers under common control or customers that are affiliates of each other constituting an aggregate amount equal to 10% or more of our consolidated revenues, the loss of which would have a material adverse effect on the Company.
We define a client to be a unique party from whom we have received an insertion order and delivered an advertisement during the previous 12 months. We count specific brands or divisions within the same business as distinct clients so long as those entities have separately signed insertion orders with us. On the other hand, we count a client who runs campaigns in multiple geographies as a single client, even though multiple insertion orders may be involved. When the insertion order is with an advertising agency, we generally consider the client on whose behalf the marketing campaign is conducted as the "client" for purposes of this calculation. In the event a client has its marketing spend with us managed by multiple agencies, that client is counted as a single client.
Our client base is composed of two client categories: the large client category and the midmarket category. We define large clients typically as the top-100 or the top-200 advertiser websites per vertical in a given geographic market, depending on the depth of that market, based on the number of monthly unique visitors as measured by comScore or other third-party providers of such information. We define a midmarket client as any client outside of the top-100 or top-200 advertisers per vertical in a given geographic market, depending on the depth of that market, and with a certain minimum threshold number of unique monthly visitors to their digital property, as measured by comScore or other third-party providers of such information. This minimum threshold varies by market, but is generally around 40,000 unique monthly visitors for our more developed markets.
Research and Development
We invest substantial resources in research and development to enhance our solution and technology infrastructure, develop new features, conduct quality assurance testing and improve our core technology. Our engineering group is primarily located in research and development centers in Paris, France, Grenoble, France, Palo Alto, California and Ann Arbor, Michigan. We expect to continue to expand capabilities of our technology in the future and to invest significantly in continued research and development efforts. We had over 600 employees primarily engaged in research and development at December 31, 2016. Research and development expense totaled $60.1 million, $86.8 million and $123.6 million for 2014, 2015 and 2016, respectively.
Intellectual Property
Our intellectual property rights are a key component of our success. We rely on a combination of patent, trademark, copyright and trade secret laws, as well as confidentiality procedures and contractual restrictions, to establish, maintain and protect our proprietary rights. We generally require employees, consultants, advertiser clients, publishers, suppliers and partners to execute confidentiality agreements with us that restrict the disclosure of our intellectual property. We also generally require our employees and consultants to execute invention assignment agreements with us that protect our intellectual property rights.
Intellectual property laws, together with our efforts to protect our proprietary rights, provide only limited protection, and any of our intellectual property rights may be challenged, invalidated, circumvented, infringed or misappropriated. The laws of certain countries do not protect proprietary rights to the same extent as the laws of France and the United States and, therefore, in certain jurisdictions, we may be unable to protect our proprietary technology.
Agreements with our employees and consultants may also be breached, and we may not have adequate remedies to redress any breach. Further, to the extent that our employees or consultants use intellectual property owned by others in their work for us, disputes may arise as to the rights to know-how and inventions relating thereto or resulting therefrom. Finally, our trade secrets may otherwise become known or be independently discovered by competitors and unauthorized parties may attempt to copy aspects of our solution or obtain and use information that we regard as proprietary.
17
As of December 31, 2016, we held four patents issued by the U.S. Patent and Trademark Office and one patent issued by the French Patent Office, and had filed 23 non-provisional U.S. patent applications, one European patent application, one Japanese patent application and one international patent application under the Patent Cooperation Treaty. We also own and use registered and unregistered trademarks on or in connection with our products and services in numerous jurisdictions. In addition, we have also registered numerous internet domain names.
Our industry is characterized by the existence of a large number of patents and frequent claims and related litigation regarding patent and other intellectual property rights. In particular, leading companies in the technology industry have extensive patent portfolios. From time to time, third parties, including certain of these leading companies, have asserted and may assert patent, copyright, trademark and other intellectual property rights against us, our advertiser clients or our publishers. Litigation and associated expenses may be necessary to enforce our proprietary rights.
Privacy, Data Protection and Content Control
Legal and Regulatory
Privacy and data protection laws play a significant role in our business. The regulatory environment for the collection and use of consumer data by advertising networks, advertisers and publishers is very unsettled in the United States, Europe and elsewhere. The United States and foreign governments have enacted, considered or are considering legislation or regulations that could significantly restrict industry participants’ ability to collect, augment, analyze, use and share non-identifying data, such as by regulating the level of consumer notice and consent required before a company can utilize cookies or other tracking technologies.
In the United States, at both the federal and state level, there are laws that govern activities such as the collection and use of data by companies like us. At the federal level, online advertising activities in the United States have primarily been subject to regulation by the Federal Trade Commission, or the FTC, which has regularly relied upon Section 5 of the Federal Trade Commission Act, or Section 5, to enforce against unfair and deceptive trade practices, including alleged violations of consumer privacy interests. Various states have also enacted legislation that governs these practices. For example, on September 27, 2013, the governor of California signed into law AB 370, an amendment to the California Online Privacy Protection Act of 2003, or CalOPPA. This amendment requires that we disclose in our privacy policy how we respond to web browser “do not track” signals. Our privacy policy discloses that we do not respond to web browser “do not track” signals but that we do respond to opt-out requests made through our proprietary opt-out button or through industry opt-out platforms (namely Network Advertising Initiative and Digital Advertising Alliance).
In addition, our solution reaches users throughout the world, including in Europe, Australia, Canada, South America and Asia-Pacific. As a result, some of our activities may also be subject to the laws of foreign jurisdictions. In particular, data protection laws in Europe can be more restrictive regarding the collection and use of data than those in U.S. jurisdictions.
In the European Union, the two main pillars of the data protection legal framework are the E-Privacy Directive (Directive on Privacy and Electronic Communications), which is currently under review, and the new General Data Protection Regulation, adopted in April 2016.
Directive 2002/581-EC of the European Parliament and of the Council, or the E-Privacy Directive, was amended by Directive 2009/136/EC of the European Parliament and of the Council of November 25, 2009, or the E-Privacy Directive Amendment, to require countries in the European Union to enact specific legislation requiring companies like ours, along with advertisers and publishers, to present users with an information notice and to obtain their consent prior to placing cookies or other tracking technologies for purposes of targeted advertising. The E-Privacy Directive Amendment was intended to be implemented in all 28 countries of the European Union, but it has been implemented differently across the European Union member states. Some member states, like the United Kingdom, permit companies to imply consent from the user’s proceeding onto the website and continuing his/her navigation after s/he has been clearly informed about how cookies are used without disabling them.
18
Other member states currently require, through law and/or guidance, that the user’s consent must be obtained prior to the placement of cookies for targeted advertising purposes. The position regarding prior consent versus consent at the time of cookie dropping is not fully settled within the European Union.
The position regarding explicit versus implied consent also is still not fully settled within the European Union. On October 2, 2013, the Article 29 Data Protection Working Party, a group with an advisory status composed of representatives of the European Union data protection authorities and the European Commission, issued new guidance on the obtaining of consent for cookies under the E-Privacy Directive and recommended that consent be expressed by the user’s positive action or other active behavior, such as clicking on a link, image or other content, based on clear information that cookies will be set due to this action. While the European Commission is still in the process of adopting a legislative proposal to review the E-Privacy Directive, there is no assurance that tracking for advertising purposes will not be affected, as "cookie" consent is being re-discussed.
In December 2016, E.U. institutions reached an agreement on a draft regulation that was formally adopted in April 2016, referred to as the General Data Protection Regulation ("GDPR"). The GDPR updates and modernizes the principles of the 1995 Data Protection Directive. The GDPR significantly increases the level of sanctions for non-compliance. The European Union data protection authorities will have the power to impose administrative fines of up to a maximum of €20 million or 4% of the data controller’s or data processor’s total worldwide global turnover for the preceding financial year, whichever is higher. The regulation should not have a material impact on our business or the way our technologies operate, however, interpretations of the GDPR may vary, especially with respect to the conditions for collection of a valid "non-ambiguous" consent, and thus there can be no assurance that this will be the case. The regulation will be enforced after a two-year transition period beginning in spring 2018.
As we continue to expand into other foreign jurisdictions, we may be subject to additional laws and regulations that may affect how we conduct business.
Self-Regulation
In addition to complying with extensive government regulations, we voluntarily participate in several trade associations and industry self-regulatory groups that promulgate best practices or codes of conduct relating to targeted advertising. For example, the Internet Advertising Bureau EU & US, the Network Advertising Initiative, the European Digital Advertising Alliance and the Digital Advertising Alliance have developed and implemented guidance for companies to provide notice and choice to users regarding targeted advertising.
In addition to complying with such guidance, we provide consumers with notice about our use of cookies and our collection and use of data in connection with the delivery of targeted advertising, and allow them to opt out from the use of such data for the delivery of targeted advertising. In an effort to harmonize the industry’s approach to internet-based advertising, these programs facilitate a user’s ability to disable services of integrated providers, but also educate users on the potential benefits of online advertising, including access to free content and display of more relevant advertisements to them. The rules and policies of the self-regulatory programs that we participate in are updated from time to time and may impose additional restrictions upon us in the future.
In 2009, we became one of the first companies to broadly include a link in the advertisements we deliver, which gives access to clear, transparent, detailed and user-friendly information describing why a user is seeing an advertisement, as well as prominently describing our service and data management practices. In addition, we provide users with an easy-to-use and easy-to-access control mechanism to opt out of receiving advertisements we deliver or being tracked by us either for all campaigns or for a specific client or time period. We believe that this user-centric approach in addressing privacy matters empowers users to make informed decisions on the use of their data. We also actively encourage our clients to provide greater transparency and information about the collection and use of data.
19
Content Control
To protect against unlawful advertiser and publisher content, we include restrictions on content in our terms and conditions. We also manually review the websites of new publisher partners and use third-party software to screen impressions we acquire through advertising exchanges.
Government Regulation
In addition to the laws and regulations governing privacy and data protection described above, we are subject to numerous domestic and foreign laws and regulations covering a wide variety of subject matters. New laws and regulations (or new interpretations of existing laws and regulations) may also impact our business. The costs of compliance with these laws and regulations are high and are likely to increase in the future and any failure on our part to comply with these laws may subject us to significant liabilities and other penalties.
Competition
We compete primarily in the market for digital performance marketing across multiple channels. Our market is rapidly evolving, highly competitive, complex and fragmented. We face significant competition in this market, which we expect to intensify in the future, partially as a result of potential new entrants in our market, including but not limited to large well-established internet publishers and players. We currently compete with large, well-established companies, such as Adobe Systems, Inc. ("Adobe"), Alliance Data Systems, Corp. ("Alliance Data"), Amazon.com, Inc. ("Amazon"), eBay Inc. ("eBay"), Facebook, Inc. ("Facebook"), Alphabet Inc. ("Google") and Sociomantic Labs ("Sociomantic"), which is owned by Tesco plc, as well as smaller, privately held companies. We believe the principal competitive factors in our industry include:
• | technology-based ability to deliver return on marketing spend at scale; |
• | measurability of the marketing spend performance, based on accountable metrics; |
• | comprehensiveness and efficiency of solution; |
• | relevance and breadth of products; |
• | seamlessness of solution across devices, environments, platforms, marketing channels and ecosystems; |
• | client trust; |
• | breadth and depth of publisher relationships; |
• | global reach; |
• | client service; and |
• | ease of use. |
We believe that we are well positioned with respect to all of these factors and expect to continue to grow and capture an increasing share of digital performance marketing budgets worldwide.
20
Seasonality
Our client base consists primarily of businesses in the digital retail, travel and classifieds industries. In the digital retail industry in particular, many businesses devote the largest portion of their advertising spend to the fourth quarter of the calendar year, to coincide with increased holiday spending by consumers. With respect to Criteo Sponsored Products, the concentration of advertising spend in the fourth quarter of the calendar year is particularly pronounced. Our ecommerce retail clients typically conduct fewer advertising campaigns in the first and second quarters than they do in other quarters, while our travel clients typically increase their travel campaigns in the first and third quarters and conduct fewer advertising campaigns in the second quarter. As a result, our revenue tends to be seasonal in nature, but the impact of this seasonality has, to date, been partly offset by our significant growth and geographic expansion. If the seasonal fluctuations become more pronounced, our operating cash flows could fluctuate materially from period to period.
Employees
As of December 31, 2016, we had over 2,500 employees. Our employees employed by French entities (approximately 800 employees) are represented by a labor union, employee representative bodies (works' council, employee delegates and a health and safety committee) and covered by collective bargaining agreements. We consider labor relations to be good and have not experienced any work stoppages, slowdowns or other serious labor problems that have materially impeded our business operations.
Financial Information about Segments and Regions
We manage our operations as a single reportable segment. For information about revenues, net income and total assets of our reporting segment, please see our audited consolidated financial statements included elsewhere in this Form 10-K. For a breakdown of our revenue and non-current assets by region, please see note 25 to our audited consolidated financial statements included elsewhere in this Form 10-K. For information regarding risks associated with our international operations, please refer to the section entitled "Risk Factors" in Item 1A of Part I in this Form 10-K.
Available Information
Our Annual Reports on Form 10-K, Quarterly Reports on Form 10-Q, Current Reports on Form 8-K and amendments to these reports filed or furnished pursuant to Section 13(a) or 15(d) of the Exchange Act are made available, free of charge on our website, as soon as reasonably practicable after we electronically file such material with, or furnish it to, the U.S. Securities and Exchange Commission (the "SEC"). These documents may be accessed through our website at www.criteo.com under "Investors." Information contained on, or that can be accessed through, our website does not constitute a part of this Form 10-K. We have included our website address in this Form 10-K solely as an inactive textual reference.
You may also review a copy of this Form 10-K, including exhibits and any schedule filed with this Form 10-K, and obtain copies of such materials at prescribed rates, at the SEC's Public Reference Room at 100 F Street, NE, Washington, D.C. 20549-0102. You may obtain information on the operation of the Public Reference Room by calling the SEC at 1-800-SEC-0330. The SEC maintains a website (www.sec.gov) that contains reports, proxy and information statements and other information regarding registrants, such as Criteo, that file electronically with the SEC.
With respect to references made in this Form 10-K to any contract or other document of Criteo, such references are not necessarily complete and you should refer to the exhibits attached or incorporated by reference to this Form 10-K for copies of the actual contract or document.
21
Item 1A Risk Factors
Investing in our ADSs involves a high degree of risk. You should carefully consider the following risks and all other information contained in this Form 10-K, including our consolidated financial statements and the related notes thereto, before investing in our ADSs. The risks and uncertainties described below are not the only ones we face. Additional risks and uncertainties that we are unaware of, or that we currently believe are not material, also may become important factors that affect us. If any of the following risks materialize, our business, financial condition and results of operations could be materially harmed. In that case, the trading price of our ADSs could decline, and you may lose some or all of your investment.
Risks Related to Our Business and Industry
The failure by the Criteo Engine to accurately predict engagement by a user could result in significant costs to us, lost revenue and diminished internet display advertising inventory.
The effective delivery of our solution depends on the ability of the Criteo Engine to predict the likelihood that a consumer will engage with any given internet display advertisement with a sufficient degree of accuracy that our clients can achieve desirable returns on their marketing spend. We primarily charge our clients based on a cost-per-click, or CPC, pricing model, and our clients only pay us when a user engages with the advertisement, usually by clicking on it. However, for Criteo Dynamic Retargeting, we purchase advertising inventory from publishers on a cost-per-thousand-impressions, or CPM, basis.
Our agreements with clients are open-ended and often do not include a spending minimum. Similarly, our contracts with publishers generally do not include long-term obligations requiring them to make their inventory available to us. Therefore, we need to continuously deliver satisfactory results for our advertiser clients and publishers in order to maintain and increase revenue, which in turn depends in part on the optimal functioning of the Criteo Engine.
In addition, as we have increased the number of advertiser clients and publishers that use our solution on a global basis, we have experienced significant growth in the amount of data processed by the Criteo Engine and the number of advertising impressions we deliver. As the amount of data and number of variables processed by the Criteo Engine increase, the risk of errors in the type of data collected, stored or accessed increases. In addition, the calculations that the algorithms must compute become increasingly complex and the likelihood of any defects or errors increases.
The proper functioning of the Criteo Engine may also be impaired by fraudulent or malicious activity, including non-human traffic. For example, the use of bots or other automated or manual mechanisms to generate fraudulent clicks on advertisements we deliver could overstate the performance of our advertising. It may be difficult to detect fraudulent or malicious activity, particularly because the perpetrators of such activity frequently change their tactics and may become more sophisticated, requiring us to improve our processes for detecting and controlling such activity. If we fail to detect or prevent fraudulent or malicious activity, our clients may experience or perceive a reduced return on their investment or heightened risk associated with use of our solution, resulting in refusals to pay, demands for refunds, loss of confidence, withdrawal of future business and potential legal claims.
If we were to experience significant errors or defects in the Criteo Engine, our solution could be impaired or stop working altogether, which could prevent us from purchasing any advertising inventory and generating any revenue until the errors or defects were detected and corrected. Other negative consequences from significant errors or defects in the Criteo Engine could include:
• | a loss of advertiser clients and publishers; |
• | lower click-through rates; |
22
• | lower conversion rates; |
• | lower profitability per impression, up to and including negative margins; |
• | faulty inventory purchase decisions for which we may need to bear the cost; |
• | lower return on marketing spend for our clients; |
• | lower price for the advertising inventory we are able to offer to publishers; |
• | delivery of advertisements that are less relevant or irrelevant to users; |
• | liability for damages or regulatory inquiries or lawsuits; and |
• | harm to our reputation. |
Furthermore, the ability of the Criteo Engine to accurately predict engagement by a user depends in part on our ability to continuously innovate and improve the algorithms underlying the Criteo Engine in order to deliver positive results for our advertiser clients and publishers that can be clearly attributed to the services we provide. The failure to do so could result in delivering poor performance for our advertiser clients and a reduced ability to secure advertising inventory from publishers.
If failures in the Criteo Engine or our inability to innovate and improve the algorithms underlying the Criteo Engine result in our advertiser clients and publishers ceasing to use our solution, we cannot assure you that we will be able to replace, in a timely or effective manner, departing clients with new clients that generate comparable revenue or departing publishers with new publishers that offer similar internet advertising inventory. As a result, the failure by the Criteo Engine to accurately predict engagement of users and to continue to do so over time could result in significant costs to us, lost revenue and diminished internet display advertising inventory.
Increased availability of “ad-blocking” software, including on mobile devices, could impair our ability to collect the significant amounts of data we use to optimize display advertisements for our clients.
Internet users are able to download free or paid “ad-blocking” software that prevents third-party cookies from being stored on a user’s computer and blocks advertisements from being displayed to such user. If the availability of ad-blocking software increases and its use becomes more prevalent on computers and mobile devices, fewer of our cookies or our clients’ cookies may be set in browsers. As a result, the number of users to whom we could serve our clients’ advertisements could be materially restricted, and the Criteo Engine would be denied the benefits of the data and impressions we could have otherwise collected from such users, which would adversely affect our business. In particular, Apple’s operating system now allows third-party developers to build content-blocking extensions for Safari’s mobile browser. Safari is the default browser on iPhone and iPad mobile devices and a significant number of mobile customers use this application to access the Internet. As a result, iPhone and iPad users are able to download “ad-blocking” apps which block third-party cookies from reaching them while they browse the internet on Safari. If a significant number of Safari users download such “ad-blocking” apps, our business could be materially impacted.
If we fail to innovate, adapt and respond effectively to rapidly changing technology, our solution may become less competitive or obsolete.
Our future success will depend on our ability to continuously enhance and improve our solution to meet advertiser client needs, add functionality to our advertiser and publisher platforms, and address technological and industry advancements. If we are unable to enhance our solution to meet market demand in a timely manner, we may not be able to maintain our existing clients or attract new clients.
23
For example, as ecommerce and consumption of content continues to migrate from the desktop web to mobile and tablet devices and advertisements more frequently include video or incorporate animation, sound and/or interactivity, which we refer to as rich media content, businesses are increasingly demanding that internet display advertising solutions extend to all three screens and support video and rich media content.
In addition, as consumers spend more time watching video and playing social network games online, including within mobile applications, as opposed to browsing static web pages, businesses may increasingly shift their advertising budgets to video and game publishers and to mobile applications or, if consumers fail to engage with advertisements displayed on smaller screens, reduce their internet display advertising budgets. In order to maintain and continue to grow our revenue, we may need to continue to adapt and improve our solution to offer video and rich media content advertisements and to enhance user engagement with advertisements on mobile applications. In addition, there may be developments in the way we purchase inventory that require us to adapt our technology. For example, we are currently working on our own version of a header bidder to connect directly to publishers' ad servers, however there can be no assurance that we will be able to develop a solution that adequately addresses the increased use of header bidding in the publisher inventory sector of the industry.
Our complete solution for personalized mobile advertising involves delivery of display advertising to the web browsers of mobile devices, which we refer to as in-browser, as well as within mobile applications, which we refer to as in-app. To date, the majority of our revenue derived from the delivery of display advertising on mobile devices is still from in-browser advertisements. We may not be successful in generating comparable revenue from our mobile in-app solution or sustain revenue from our in-browser solution. At the end of 2014, we also launched our “Universal Match” cross-device matching solution that allows us to match users across devices. However, as the number of sales involving multiple devices increases, there can be no assurance that our device graph will be strong enough to track sales across devices, thereby impairing our ability to properly attribute sales of our clients’ products being generated by our services. If we are unable to successfully develop, enhance or acquire new solutions to continuously meet advertiser needs or are unable to adapt our organization to market these new solutions, our solution may become less competitive or obsolete.
Our ability to generate revenue depends on our collection of significant amounts of data from various sources, which may be restricted by consumer choice, restrictions imposed by advertisers and publishers, changes in technology, and new developments in laws, regulations and industry standards.
Our ability to optimize the delivery of internet advertisements for our clients depends on our ability to successfully leverage data, including data that we collect from our clients, data we receive from our publisher partners and third parties, and data from our own operating history. Using cookies, device identifiers, and similar tracking technologies, we collect information about the interactions of users with our advertisers’ and publishers’ websites and mobile applications (including, for example, information about the placement of advertisements and users’ shopping or other interactions with our clients’ websites or advertisements). Our ability to successfully leverage such data depends on our continued ability to access and use such data, which could be restricted by a number of factors, including consumer choice, restrictions imposed by advertisers and publishers, changes in technology, and new developments in laws, regulations and industry standards.
Consumer resistance to the collection and sharing of the data used to deliver targeted advertising, increased visibility of consent or “do not track” mechanisms as a result of industry regulatory and/or legal developments, the adoption by consumers of browsers settings or "ad-blocking" software and the development and deployment of new technologies could materially impact our ability to collect data or reduce our ability to deliver relevant advertisements, which could materially impair the results of our operations.
Further, certain web browsers, such as Safari, currently block or are planning to block some or all third-party cookies by default. As a result, we have adapted our solution to enable us to continue to access data and deliver internet display advertising by using first-party cookies, rather than third-party cookies. However, there can be no assurance regulators will not challenge the transparency of our solution, or that web browser developers will not technically block our solution. If we are blocked from serving advertisements to a significant portion of internet users, our business could suffer and our results of operations could be harmed.
24
In addition, our ability to collect and use data may be restricted or prevented by a number of other factors, including:
• | the failure of our network, hardware, or software systems, or the network, hardware, or software systems of our clients; |
• | variability in user traffic on advertiser websites or mobile applications; |
• | decisions by some of our advertiser clients or publishers to restrict our ability to collect data from them, third parties and users or to refuse to implement mechanisms we request to ensure compliance with our legal obligations; |
• | changes in browser or device functionality and settings, and other new technologies, which make it easier for users to prevent the placement of cookies or other tracking technology and impact our publishers’ or our advertisers’ ability to collect and use data; |
• | changes by large internet and technology companies to the nature of the internet display advertising (for example, any changes in Apple Inc.’s Identifier for Advertising, or IDFA, that could prevent us from identifying users and associating particular browsing behaviors to those users as they use mobile applications that run on Apple’s operating system); |
• | changes in traffic filtering performed by various internet service providers, causing some of the information we use for tracking to be removed before requests are sent to our servers; |
• | our inability to develop a device graph that is strong enough to properly match users and track sales across an increasing number of devices and environments; |
• | our inability to grow our advertiser and publisher base in new industry verticals and geographic markets in order to obtain the critical mass of data necessary for the Criteo Engine to perform optimally in such new industry verticals or geographic markets; |
• | malicious traffic (such as non-human traffic) that introduces "noise" in the information that we collect from advertiser clients and publishers; |
• | interruptions, failures or defects in our data collection, mining, analysis and storage systems; and |
• | changes in laws, rules, regulations and industry standards or increased enforcement of laws, rules, regulations and industry standards in or across any of the geographies in which we operate or may want to operate in the future. |
Any of the above described limitations on our ability to successfully collect, utilize and leverage data could also materially impair the optimal performance of the Criteo Engine and severely limit our ability to target users for our advertisements, which would harm our business and adversely impact our future results of operations.
If we fail to access a consistent supply of internet display advertising inventory and expand our access to such inventory, our business and results of operations could be harmed.
Essentially all of our revenue is derived from placing advertisements on publisher digital properties that we do not own. As a result, we do not own or control the advertising inventory upon which our business depends. We currently access advertising inventory through various channels, including through direct relationships with publishers, advertising exchange platforms (such as Google's DoubleClick Ad Exchange and Microsoft Corp.’s (“Microsoft”) Ad Exchange) and other platforms that aggregate the supply of advertising inventory, such as Appnexus Inc., The Rubicon Project, Inc., PubMatic, Inc., Taboola, Inc., Baidu, Inc. and Yandex N.V.
25
Since our contracts with publishers with whom we have direct relationships generally do not include long-term obligations requiring them to make their inventory available to us, our ability to continue to purchase inventory from these publishers depends in part on our ability to consistently pay sufficiently competitive CPMs for their internet display advertising inventory, or in the case of Criteo Sponsored Products to generate sufficient revenue, as well as our ability to offer advertisements from high quality companies. Similarly, as more companies compete for advertising impressions on advertising exchange platforms and other platforms that aggregate supply of advertising inventory, advertising inventory may become more expensive, which may adversely affect our ability to acquire it and to deliver internet display advertisements on a profitable basis.
Our access to advertising inventory may also be affected by the increased use of header bidding, by which impressions that would traditionally have been exposed to different potential sources of demand in a sequence, of which we were a part, are instead made available simultaneously to competitive bidding by multiple demand sources that use header bidding tags. This may provide us with access to more advertising inventory, but there is no guarantee that selling publishers will allocate to us a header bidding slot or accept our header bidding tags or that advertising inventory will not be more expensive as a result of the increased competition in the process of header bidding. We may receive multiple bid requests for the same impression, which may result in us bidding against ourselves and create false liquidity in an auction, if we are not able to accurately determine the source of the inventory.
Many widely used aggregators of advertising inventory are owned by companies that may compete with us for clients. Competitive pressure may incentivize these companies to limit our access to advertising inventory available through their platforms. Any interference with our ability to access advertising inventory could materially impair the ability of our solution to deliver advertisements for our clients. In addition, since we rely on a limited number of companies for access to significant portions of the advertising inventory that our business depends on, the loss of access to advertising inventory from one of those companies could negatively impact our ability to deliver internet display advertisements for our advertiser clients. Any of these consequences could therefore adversely affect our results of operations and financial condition.
In order to grow our publisher base, we will need to expand the breadth and quality of businesses that utilize our solution. In addition, in order to grow our advertiser base, we must expand our access to new sources of quality internet display advertising inventory, and maintain a consistent supply of such quality inventory. While we have historically relied on direct relationships with publishers, as well as advertising exchange platforms and other platforms that aggregate supply of advertising inventory, we may increasingly rely on direct relationships with strong publisher partners in order to maintain the necessary access to, and establish a greater amount of preferred access to, quality advertising inventory. In order to enter into or maintain such direct relationships, we may need to agree to terms that are unfavorable to us, including, for example, contractual minimums, bonuses and/or long-term commitments for advertising inventory. In addition, as we attempt to improve our solution to enable businesses to place advertisements with publishers other than on the web, including mobile applications, video and social games, we will need to develop and improve our access to publishers in those environments. Our ability to attract new publishers on the web, mobile applications, video and social games will depend on various factors, some of which are beyond our control.
Therefore, we cannot assure you that we will successfully grow our direct relationships with new publishers or maintain or expand our access to quality advertising inventory through other channels and, if we are not successful, our business and results of operations could be harmed. In addition, even if we do grow our direct relationships, we cannot assure you that those direct relationships with publishers will be on terms favorable to us.
26
We may not be able to effectively integrate the businesses we acquire, which may adversely affect our ability to achieve our growth and business objectives.
Over the past three years, we have acquired HookLogic, DataPop, Inc. and various other businesses. We may seek to acquire additional businesses, products or technologies in the future. If we identify an appropriate acquisition candidate, we may not be successful in negotiating the terms and/or financing of the acquisition, and our due diligence may fail to identify all of the problems, liabilities or other shortcomings or challenges of an acquired business, product or technology, including issues related to intellectual property, product quality or architecture, employees or clients, regulatory compliance practices or revenue recognition or other accounting practices.
Any acquisition or investment may require us to use significant amounts of cash, issue potentially dilutive equity securities or incur debt. In addition, acquisitions, including our recent acquisitions, involve numerous risks, any of which could harm our business, including:
• | difficulties in integrating the operations, technologies, services and personnel of acquired businesses, especially if those businesses operate outside of our core competency; |
• | the need to integrate operations across different geographies, cultures and languages and to address the particular economic, currency, political and regulatory risks associated with specific countries; |
• | cultural challenges associated with integrating employees from the acquired company into our organization; |
• | ineffectiveness or incompatibility of acquired technologies or services; |
• | potential loss of key employees of acquired businesses; |
• | inability to maintain the key business relationships and the reputations of acquired businesses; |
• | failure to successfully further develop the acquired technology in order to recoup our investment; |
• | unfavorable reputation and perception of the acquired product or technology by the general public; |
• | diversion of management’s attention from other business concerns; |
• | liability or litigation for activities of the acquired business, including claims from terminated employees, clients, former shareholders or other third parties; |
• | implementation or remediation of controls, practices, procedures and policies at acquired businesses, including the costs necessary to establish and maintain effective internal controls; and |
• | increased fixed costs. |
In November 2016, we acquired HookLogic, a New York-based company that has developed a performance marketing exchange connecting consumer brand manufacturers with retail ecommerce sites via sponsored product ads sold by ecommerce retailers. In May 2016, we acquired Monsieur Drive SAS ("Monsieur Drive"), a Paris-based company building advertising products for the consumer packaged goods vertical. We began integrating both these acquisitions in 2016; however, there can be no assurance that the integrations will be successful or that we will be able to leverage the acquired commercial relationships or technologies in the manner we anticipate.
In February 2015, we acquired DataPop, a Los Angeles-based company specializing in the optimization of shopping campaigns on large search engines. In 2015, we began integrating DataPop’s technology into our core platform, and in October 2016 we launched Criteo Predictive Search in the United States. However, there can be no assurance that this offering will be successful in the United States or that we will be able to successfully expand the offering to other geographic markets in the future.
27
If we are unable to successfully integrate the businesses we have acquired or any business, product or technology we acquire in the future, our business and results of operations could suffer, and we may not be able to achieve our business and growth objectives.
The market in which we participate is intensely competitive, and we may not be able to compete successfully with our current or future competitors.
The market for internet advertising solutions is highly competitive and rapidly changing. New technologies and methods of buying advertising present a dynamic competitive challenge as market participants offer multiple new products and services, such as analytics, programmatic buying and exchanges, aimed at facilitating and/or capturing advertising spend. With the introduction of new technologies and the influx of new entrants to the market, we expect competition to persist and intensify in the future, which could harm our ability to increase sales and maintain our profitability.
We compete primarily in the market for digital performance marketing across multiple channels. This market is rapidly evolving, highly competitive, complex and fragmented. We face significant competition in this market, and we expect that competition will intensify in the future.
In addition to competing for marketing spend, we compete with many companies for internet display advertising inventory, some of whom also operate their own advertising networks or exchanges from which we buy advertising inventory. Some of these companies that we compete with, either for marketing spend or for advertising inventory, may also be our clients or affiliated with our clients. Competitive pressure may incentivize such companies to cease to be our clients or cease to provide us with access to their advertising inventory. If this were to occur, our ability to place advertisements would be significantly impaired and our results of operations would be adversely affected.
In addition to existing competitors and intermediaries, we may also face competition from companies newly entering the market, which may include large established companies, such as Adobe (which acquired both Omniture, Inc. and Efficient Frontier, Inc.), Verizon, Inc. (which acquired AOL, Inc., which in turn had previously acquired Platform-A, Inc. (advertising.com) and Millennial Media), Alliance Data (which acquired Conversant, Inc., which in turn had previously acquired Dotomi), Ve Interactive (which acquired eBay's display retargeting business, which in turn had previously acquired both Fetchback, Inc. and GSI Commerce Inc.), Tesco plc (which acquired Sociomantic) and AdRoll, all of which currently offer, or may in the future offer, solutions that result in additional competition for marketing spend or advertising inventory. Large and established internet and technology companies, such as those mentioned above and Amazon, Apple, Facebook, Google and Microsoft, may have the power to significantly change the very nature of the search marketing and internet display advertising marketplaces in ways that could materially disadvantage us. For example, Amazon, Apple, Facebook, Google and Microsoft have a significant share of widely adopted industry platforms such as web browsers, mobile operating systems and advertising exchanges and networks. These companies could leverage their positions to make changes to their web browsers, mobile operating systems, platforms, exchanges, networks or other products or services that could be significantly harmful to our business and results of operations. In addition, changes to the method of serving advertisements with publishers, such as header bidding, present challenges to our business that could result in increased competition for advertising inventory.
Our current and potential competitors may have significantly more financial, technical, marketing and other resources than we have, be able to devote greater resources to the development, promotion, sale and support of their products and services, have more extensive advertiser client bases and broader publisher relationships than we have, and have longer operating histories and greater name recognition than we have. As a result, these competitors may be able to respond more quickly to new technologies, develop deeper advertiser client relationships or offer services at lower prices. We may also face competition from companies we do not yet know about. If existing or new companies develop, market or resell competitive high-value marketing products or services, acquire one of our existing competitors or form a strategic alliance with one of our competitors, our ability to compete effectively could be significantly compromised and our results of operations could be harmed.
28
Any of these developments would make it more difficult for us to sell our solution and could result in increased pricing pressure, reduced gross margins, increased sales and marketing expense and/or the loss of market share.
Our international operations and expansion expose us to several risks.
As of December 31, 2016, we had a direct operating presence in 19 countries and did business in 91 countries and a client operating presence in 19 countries. Our primary research and development operations are located in France and the United States. In addition, we currently have international offices outside of France and the United States, which focus primarily on selling and implementing our solution in those regions. In the future, we may expand to other international locations. Our current global operations and future initiatives involve a variety of risks, including:
• | localization of our solution and systems, including translation into foreign languages and adaptation for local practices; |
• | compliance with (and liability for failure to comply with) applicable local laws and regulations, including, among other things, laws and regulations with respect to privacy, data and consumer protection, spam and content, which laws and regulations may be inconsistent across jurisdictions; |
• | more stringent regulations relating to data security and the unauthorized use of, or access to, commercial and personal information, particularly in the European Union; |
• | taxation in a variety of jurisdictions with increasingly complex tax laws, the application of which can be uncertain; |
• | intensity of local competition for digital advertising budgets and internet display inventory; |
• | unexpected changes in laws and regulatory requirements, trade laws, tariffs, export quotas, customs duties or other trade restrictions; |
• | labor regulations and labor laws that can be interpreted as more advantageous to employees than those in the United States, including with respect to deemed hourly wage and overtime regulations; |
• | changes in a specific country’s or region’s political or economic conditions; |
• | challenges inherent to hiring and efficiently managing an increased number of employees over large geographic distances, including the need to implement appropriate systems, policies, benefits and compliance programs; |
• | risks resulting from changes in currency exchange rates and the implementation of exchange controls, including restrictions promulgated by the Office of Foreign Assets Control of the U.S. Department of the Treasury, and other similar trade protection regulations and measures in the United States or in other jurisdictions; |
• | reduced ability to timely collect amounts owed to us by our clients in countries where our recourse may be more limited; |
• | limitations on our ability to reinvest earnings from operations derived from one country to fund the capital needs of our operations in other countries |
• | restrictions on foreign ownership and investments; |
• | limited or unfavorable intellectual property protection; |
29
• | exposure to liabilities under anti-corruption and anti-money laundering laws, including the U.S. Foreign Corrupt Practices Act and similar laws and regulations in other jurisdictions; and |
• | restrictions on repatriation of earnings. |
We have recently established operations in geographies such as China, India and Russia, and may establish operations in additional geographies in the near future, where we may face more complex regulatory environments and market conditions than the ones we have experienced in the past in our existing geographies. If we invest substantial time and resources to expand our international operations and are unable to do so successfully or in a timely manner, our business and results of operations could suffer, and we may not be able to achieve our business and growth objectives.
Additionally, operating in international markets also requires significant management attention and financial resources. We cannot be certain that the investment and additional resources required in establishing operations in other countries will produce desired levels of revenue or profitability.
Regulatory, legislative or self-regulatory developments regarding internet privacy matters could adversely affect our ability to conduct our business.
The United States and foreign governments have enacted, considered or are considering legislation or regulations that could significantly restrict our ability to collect, process, use, transfer and share data collected from and about consumers and devices. Trade associations and industry self-regulatory groups have also promulgated best practices and other industry standards relating to targeted advertising. Various U.S. and foreign governments, self-regulatory bodies and public advocacy groups have called for new regulation specifically directed at the digital advertising industry, and we expect to see an increase in legislation, regulation and self-regulation in this area.
In particular, legislative and regulatory developments in Europe, including the E-Privacy Directive Amendment and country-specific laws pursuant thereto (see the section entitled “Business – Privacy, Data Protection and Content Control – Legal and Regulatory” in Item 1 of Part I in this Form 10-K), may reduce the amount of data we can collect or process. Because the E-Privacy Directive Amendment has been interpreted differently by different member states, it is unclear whether a user’s consent must be obtained prior to the placement of cookies for targeted advertising purposes. If the trend in the European Union toward requiring “prior” consent is confirmed and mandated, our clients would have to implement solutions that deactivate our tags on the first user visit, which would result in Criteo losing all first browsing events on advertiser websites and first impressions on publisher websites.
In addition to the uncertain interpretation of the E-Privacy Directive, there is an ongoing debate about whether the current guidance and approaches promulgated by industry groups in which we participate comply with E.U. law. For example, on December 28, 2011, the Article 29 Data Protection Working Party published an opinion stating that the self-regulatory code, released by the Internet Advertising Bureau EU on April 14, 2011 and implemented by the European Digital Advertising Alliance, to provide notice and choice to users regarding targeted advertising was not adequate to comply with Article 5.3 of the E-Privacy Directive, which addresses the placement and reading of cookies for targeted advertising. We could be adversely affected by changes to these guidelines and codes in ways that are inconsistent with our practices or the practices of our publishers and advertisers or in conflict with the laws and regulations of the European Union or other international regulatory authorities.
Last December, E.U. institutions reached an agreement on the GDPR. The GDPR updates and modernizes the principles of the 1995 Data Protection Directive. The GDPR significantly increases the level of sanctions for non-compliance. Data Protection Authorities will have the power to impose administrative fines of up to a maximum of €20 million or 4% of the data controller’s or data processor’s total worldwide global turnover of the preceding financial year, whichever is higher. The regulation should not have a material impact on our business or the way our technologies operate, however, interpretations on the GDPR may vary and there can be no assurance that this will be the case. The regulation will be enforced after a two year transition period, in spring 2018.
30
In addition to restricting our collection of data, governments may also restrict the storage of information about their own citizens beyond their national borders. For example, on October 6, 2015, the European Court of Justice invalidated the E.U.-U.S. Safe Harbor framework, which we relied on to operate our data transfers both internally (for HR, CRM and other back-office data processing) and with several U.S. based partners (notably, RTB platforms). Following the Safe Harbor invalidation, in July 2016, the European Commission announced the formal adoption of the "EU-US Privacy Shield." We elected to rely on the Standard Contractual Clauses of the European Commission to secure our data transfers.
We cannot anticipate if this legal scheme will be compromised in the future. Restrictions on our ability to export data across borders could limit our ability to utilize technology infrastructure consolidation, redundancy and load-balancing techniques, resulting in increased infrastructure costs, decreased operational efficiencies and performance, and a greater risk of failure.
In addition, although the user information we retain relates primarily to purchase intent and does not permit us to identify visitors, we currently do business in over 90 countries and the interpretation of "personally identifiable information" ("PII"), and our obligations relating thereto, may vary from one country to the other. In some countries, operating a local data center is compulsory for the processing of PII. Moreover, in certain countries, the legal requirements surrounding PII are so new that their impact on doing business is not yet clear. Recently, the FTC staff clarified or expanded its definition of PII to include data that can be reasonably linked to a particular person, computer, or device. The FTC staff indicated that persistent identifiers, such as device identifiers, media access control addresses, static IP addresses or retail loyalty card numbers meet this test. While the definition of PII appears expanded, the notice and choice requirement has not yet been adapted to the different buckets of data depending on their identifiability. If all types of PII (whether they allow direct identification of a person or whether they only permit the singling out of a person without identifying them) are treated the same way, thus requiring an opt-in for the processing of browsing data, Criteo’s business could be materially impacted. Evolving definitions of PII may cause us to change our business practices, diminish the quality of our data and the value of our solution, or hamper our ability to expand our offerings to new geographic markets.
Clarifications of and changes to these existing and proposed laws, regulations and industry standards can be costly to comply with, and we may be unable to pass along those costs to our clients in the form of increased fees, which may negatively affect our operating results. Such changes can also delay or impede the development of new products, result in negative publicity and reputational harm, require significant management time and attention, increase our risk of non-compliance and subject us to claims or other remedies, including fines or demands that we modify or cease existing business practices. Additionally, any perception of our practices or products as an invasion of privacy, whether or not such practices or products are consistent with current or future regulations and industry practices, may subject us to public criticism, private class actions, reputational harm or claims by regulators, which could disrupt our business and expose us to increased liability.
We strive to comply with all applicable laws and regulations relating to privacy and data collection, processing, use and disclosure, but these laws and regulations are continually evolving and often unclear and inconsistent across the jurisdictions in which we do business. The measures we take to ensure our compliance with applicable privacy laws, regulations and industry standards may not be successful. For example, our compliance depends in part on our clients’ adherence to privacy laws and regulations and their use of our services in ways consistent with visitors’ expectations. We contractually require our clients to notify visitors to their websites or mobile applications about our services (i.e., that we place cookies and other tracking technologies and collect and share certain non-identifying data for purposes of targeting advertisements), and, when legally required, to obtain user consent to cookie or other tracking technology dropping, and further require that they link to pages where visitors can opt out of the collection or targeting. We rely on representations made to us by clients that they will comply with all applicable laws, including all relevant privacy and data protection regulations, and we make reasonable efforts to enforce such representations and contractual requirements, but we do not fully audit our clients’ compliance with our recommended disclosures or their adherence to privacy laws and regulations.
31
If our clients fail to adhere to our contracts in this regard, or a court or governmental agency determines that we have not adequately, accurately or completely described our own products, services and data collection, use and sharing practices in our own disclosures to consumers, then we and our clients may be subject to potentially adverse publicity, damages and related possible investigation or other regulatory activity in connection with our privacy practices or those of our clients. For example, liability for non-compliance with the guidelines issued in April 2012 by the Commission Nationale de l'Informatique et des Libertés ("CNIL") is shared between advertisers, publishers and networks, including us. If advertisers, publishers or networks on whom we rely fail to obtain the legally required consent, we could potentially be liable under these guidelines and could suffer damages, fines, penalties and reputational harm. In 2012, CNIL commenced an inquiry into our compliance with such guidelines, which was closed in July 2014 with no compliance actions for us to take.
In 2016, CNIL commenced an new inquiry into our compliance with French data privacy laws. The inquiry is still pending and focusing on the new features or products that we have deployed since the last investigation. In addition, in 2016, the Korea data protection authority commenced an inquiry into our compliance with Korean legislation. While the Korean investigation was closed with no compliance actions for us to take, there can be no assurance that action will not be required by CNIL as a result of its open investigation or that there will not be further inquiries with respect to our compliance with privacy laws from CNIL or regulatory bodies in other jurisdictions.
If we fail to successfully enhance our brand, our ability to protect and expand our client base will be impaired and our financial condition may suffer.
We believe that developing and maintaining awareness of the Criteo brand is critical to achieving widespread acceptance of our existing solution and any future products, such as mobile solutions and solutions directed toward capturing broader advertising budgets, and is an important element in attracting new advertiser clients and publishers. Furthermore, we believe that the importance of brand recognition will increase as competition in our market increases. Successful promotion of our brand will depend largely on the effectiveness of our marketing efforts and on our ability to deliver valuable solutions for our advertiser clients and publishers. In the past, our efforts to build our brand have involved significant expenses and they may continue to do so in the future. As a result, we may not be able to develop our brand in a cost-effective manner. Furthermore, brand promotion activities may not yield any increased revenue, and even if they do, any increased revenue may not offset the expenses we incurred in building our brand.
If we fail to successfully promote and maintain our brand we may fail to attract enough new advertiser clients or publishers or retain enough of our existing advertiser clients or publishers, and our business could suffer.
Our future success will depend in part on our ability to expand into new marketing channels.
We started delivering our solution through internet display advertisements in desktop browsers. Since then, we have expanded into mobile in-browser and in-app, native display, including on social media platforms and search engine marketing. We define a marketing channel as a specific advertisement medium to engage with a user or a consumer for which we currently purchase inventory through a specific source, or for which we compute the pricing and implement the bidding of such inventory.
We launched our Criteo Predictive Search offering in the fourth quarter of 2016 and there can be no assurance that it will be successful. In particular, the search marketing channel is less fragmented than the internet display market, with a few large, well-established players, and uplift is harder to measure in search marketing than in internet display marketing. As a result, we may have difficulty attracting advertiser clients for our Criteo Predictive Search offering and it may never become a meaningful part of our business.
In the future, we may decide to broaden the spectrum of our marketing channels further if we believe that doing so would significantly increase the value we can offer to clients. We believe a broader platform delivering our digital performance marketing solution through complementary marketing channels can enhance our value proposition for existing and prospective clients.
32
However, any future attempts to enter new marketing channels may not be successful. Our success in expanding into any additional marketing channels will depend on various factors, including our ability to:
• | identify additional marketing channels where our solution could perform; |
• | adapt our solution to additional marketing channels and effectively market it for such additional marketing channels to our existing and prospective clients; |
• | integrate newly developed or acquired marketing channels into our pay-for-performance model, with a clear and measurable performance attribution mechanism that works across all channels, and in a manner that is consistent with our privacy standards; |
• | accumulate sufficient data sets relevant for those marketing channels to ensure that the Criteo Engine has a sufficient quantity and quality of information to deliver relevant personalized advertisements through those additional marketing channels; |
• | achieve client performance levels through the new marketing channels that are similar to those delivered through existing marketing channels, and in any case that are not dilutive to the overall client performance; |
• | identify and establish acceptable business arrangements with publishers to access inventories in sufficient quality and quantity for these new marketing channels; |
• | maintain our gross margin at a consistent level upon entering one or more additional marketing channels; |
• | compete with new market participants active in these additional marketing channels; and |
• | hire and retain key personnel with relevant technology and product expertise to lead the integration of additional marketing channels onto our platform, and sales and operations teams to sell and integrate additional marketing channels. |
If we are unable to successfully adapt our solution to additional marketing channels and effectively market such solutions to our existing and prospective clients, or if we are unable to maintain our pay-for-performance model in these additional marketing channels, we may not be able to achieve our growth or business objectives.
Our future success will depend in part on our ability to expand into new industry verticals.
As we market our solution to a wider group of potential clients outside of our three key industry verticals of retail, travel and classifieds, including businesses in the automotive, telecommunications, consumer goods and finance industries, we will need to adapt our solution and effectively market our solution to businesses in these new industry verticals. Our success in expanding our solution to businesses in new industry verticals will depend on various factors, including our ability to:
• | design products and solutions that are attractive to businesses in such industries; |
• | provide high returns on marketing spend in such industries and maintain such high returns on marketing spend at scale; |
• | transparently measure the performance of such marketing spend based on accountable metrics; |
• | hire personnel with relevant industry vertical experience to lead sales and product teams; |
• | work with clients in new industry verticals through the advertising agencies that manage their advertising budgets; and |
33
• | accumulate sufficient data sets relevant for those industry verticals to ensure that the Criteo Engine has sufficient quantity and quality of information to deliver efficient and effective internet display advertising within the relevant industry. |
For example, with the introduction of Criteo Sponsored Products, we recently expanded our solution to brand manufacturers. However, historically, we have very limited experience working with brand manufacturers and there can be no assurance that we will be able to maintain the client base built by HookLogic or that we will be able to expand the Criteo Sponsored Products business successfully.
If we are unable to successfully adapt our solution to appeal to businesses in industries other than our core verticals, or are unable to effectively market such solutions to businesses in such industries, we may not be able to achieve our growth or business objectives. Further, as we expand our client base and solution into new industry verticals, we may be unable to maintain our current client retention rates.
Our revenue would decline if we fail to effectively coordinate the demand for and supply of advertising inventory in a specific geographic market.
The performance of the Criteo Engine in a specific geographic market depends on having sufficient advertiser clients utilizing our solutions, and our ability to coordinate the demand for and supply of advertising inventory with the publishers in that market. Since we cannot consistently predict the demand for advertising inventory by our clients or the advertising inventory available to us, including on a priority basis, the demand for and supply of advertising inventory in that market may not be sufficient or sufficiently coordinated for the Criteo Engine to function optimally. As such, as we target new geographic markets, we will need to adequately coordinate the timing to onboard local advertiser clients and publishers. A failure to effectively manage demand for, and the supply of, advertising inventory processed through the Criteo Engine could impair its ability to accurately predict user engagement in that market, which could result in:
• | a reduction in the amount of inventory our publishers make available to us in the future; |
• | a loss of existing advertiser clients or publishers; |
• | changes in the priority given to our advertisements by publishers; |
• | an adverse effect on our ability to attract new publishers willing to give us preferred access; |
• | harm to our reputation; |
• | increased cost; and |
• | lost revenue. |
Our sales efforts with both potential advertiser clients and publishers require significant time and expense, and our success will depend on effectively expanding and integrating our sales and marketing operations and activities to grow our base of advertiser clients and publishers.
Attempting to increase our base of advertiser clients and publishers is a key component of our growth strategy. However, attracting advertiser clients and publishers requires substantial time and expense, and it may be difficult to identify, engage and market to potential clients that are unfamiliar with our solution, particularly as we seek to enter new marketing channels or industry verticals. Furthermore, many potential clients require input from multiple internal constituencies to make advertising decisions, or delegate advertising decisions to advertising agencies. As a result, we must identify those involved in the purchasing decision and devote a sufficient amount of time to presenting our solution to those individuals (including providing demonstrations and comparisons of our solution to other available solutions), which can be a costly and time-consuming process.
34
Our ability to grow our advertiser and publisher base will depend to a significant extent on our ability to effectively expand our sales, marketing and publisher support operations. In particular, as we target new industry verticals, we will need to attract sales and publisher support personnel that are familiar with the relevant industries and geographic markets. We believe that there is significant competition for direct sales and support personnel with the sales skills and technical knowledge that we require.
Therefore, our ability to grow our advertiser and publisher base will depend, in large part, on our success in recruiting, training and retaining the sales and publisher support personnel we require. In the last year, we hired a number of new sales personnel and expanded our marketing department, including new leadership. However, we cannot be sure that newly hired personnel will be integrated effectively, and such personnel may require significant training and may not become productive as quickly as we would like, or at all. If we are not successful in recruiting and training our advertiser sales and publisher support personnel and streamlining our sales and business development processes to cost-effectively grow our advertiser and publisher base, our ability to grow our business and our results of operations could be adversely affected.
If we do not retain our senior management team and key employees, or attract additional highly skilled talent, we may not be able to sustain our growth or achieve our business objectives.
Our future success is substantially dependent on the continued service of our senior management team. Our management team is currently spread across multiple physical locations and geographies, which can strain the organization and make coordinated management more challenging. Our future success also depends on our ability to continue to attract, retain and motivate highly skilled employees, particularly employees with the technical skills that enable us to deliver effective advertising solutions, sales and advertiser and publisher support representatives with experience in digital advertising, and more broadly employees that are highly qualified in their areas of expertise to support and grow our operations. Competition for highly skilled employees in our industry is intense. As a result, we may be unable to attract or retain the management and highly skilled personnel who are critical to our success, which could result in harm to our key advertiser and publisher relationships, loss of key information, expertise or proprietary knowledge and unanticipated recruitment and training costs. The loss of the services of our senior management or other key employees could make it more difficult to successfully operate our business and pursue our business goals.
If we are unable to protect our proprietary information or other intellectual property, our business could be adversely affected.
We rely largely on trade secret law to protect our proprietary information and technology. We generally seek to protect our proprietary information by confidentiality, non-disclosure and assignment of invention agreements with our employees, contractors and parties with which we do business. However, we may not execute these agreements with every party who has access to our confidential information or contributes to the development of our intellectual property. In addition, those agreements may be breached, and we may not have adequate remedies for any such breach.
Breaches of the security of our data center systems and infrastructure or other IT resources could expose us to a risk of loss of proprietary information. We cannot be certain that the steps we have taken will prevent unauthorized use or reverse engineering of our technology or information. Moreover, our trade secrets may be disclosed to or otherwise become known or be independently developed by competitors, and in these situations, we may have no or limited rights to stop their use of our information. To the extent that our employees, contractors or other third parties with whom we do business use intellectual property owned by others in their work for us, disputes may arise as to the rights to such intellectual property. If, for any of the above reasons, our intellectual property is disclosed or misappropriated, it would harm our ability to protect our rights and may have an adverse effect on our business.
35
Although we also rely on copyright laws to protect works of authorship created by us, including software, we do not register the copyrights in any of our copyrightable works. U.S. copyrights must be registered before the copyright owner may bring an infringement suit in the United States, and must be registered within three months of the publication of the underlying work if the copyright owner wants to seek statutory damages or attorney’s fees in any U.S. enforcement action. Accordingly, if one of our unregistered U.S. copyrights is infringed by a third party, we will need to register the copyright before we can file an infringement suit in the United States, and our remedies in any such infringement suit may be limited.
As of December 31, 2016, we held four patents issued by the U.S. Patent and Trademark Office and one patent issued by the French Patent Office, and had filed 23 non-provisional U.S. patent applications, one European patent application, one Japanese patent application and one international patent application under the Patent Cooperation Treaty. We have also registered numerous domain names and are also pursuing the registration of trademarks and service marks in the United States and in certain locations outside the United States. Effective trademark, domain name and patent protection are expensive to develop and maintain, both in terms of initial and ongoing registration requirements and the costs of defending our rights, and there may be certain areas of our business that we cannot protect through the use of trademarks, domain names or patents. Any of our existing or future patents, trademarks or other intellectual property rights may not provide sufficient protection for our business as currently conducted or may be challenged by others or invalidated through administrative process or litigation. In addition, in the event that our trademarks are successfully challenged, we could be forced to rebrand our solution, which could result in loss of brand recognition and could require us to devote resources to advertising and marketing our new brand. Further, we cannot assure you that competitors will not infringe our trademarks, or that we will have adequate resources to enforce our trademarks.
Our existing patents and any patents issued in the future may be successfully challenged, invalidated or circumvented by third parties, may give rise to ownership claims or to claims for the payment of additional remuneration of fair price by the persons having participated in the creation of the inventions and may not be of sufficient scope or strength to provide us with any meaningful protection or competitive advantage. Further, as we continue to expand our business geographically, it may become desirable for us to protect our intellectual property in an increasing number of jurisdictions, which is expensive and may not be successful, and which we may not pursue.
Once we file a patent application in one country, we have a limited period of time to file it in all other countries in which we want to have patent protection over a certain invention. If we fail to file in those other countries, we will be precluded from having patent protection for that invention in those countries. Without patent protection, others will be free to utilize that invention in those countries. Even if we obtain patent protection, we cannot assure you that competitors will not infringe our patents, or that we will have adequate resources to enforce our patents.
Additionally, in the United States, the Leahy-Smith America Invents Act, or AIA, switched U.S. patent rights from the former “first-to-invent” system to a “first inventor-to-file” system. This may result in inventors and companies having to file patent applications more frequently to preserve rights in their inventions, which may favor larger competitors that have the resources to file more patent applications.
Further, the laws of certain countries do not protect proprietary rights to the same extent as the laws of the United States and, therefore, in certain jurisdictions, we may be unable to protect our proprietary technology adequately against unauthorized third-party copying, infringement or use, which could adversely affect our competitive position.
To protect or enforce our intellectual property rights, we may initiate litigation against third parties. Any lawsuits that we initiate could be expensive, take significant time and divert management’s attention from other business concerns. Additionally, we may unintentionally provoke third parties to assert claims against us. These claims could invalidate or narrow the scope of our own intellectual property. We may not prevail in any lawsuits that we initiate and the damages or other remedies awarded, if any, may not be commercially valuable. Accordingly, despite our efforts, we may be unable to prevent third parties from infringing upon or misappropriating our intellectual property. The occurrence of any of these events may adversely affect our business, financial condition and results of operations.
36
Our business may suffer if it is alleged or determined that our technology or another aspect of our business infringes the intellectual property rights of others.
The online and mobile advertising industries are characterized by the existence of large numbers of patents, copyrights, trademarks, trade secrets and other intellectual property and proprietary rights. Companies in these industries are often required to defend against litigation claims that are based on allegations of infringement or other violations of intellectual property rights. Our technologies may not be able to withstand any third-party claims or rights against their use.
Our success depends, in part, upon non-infringement of intellectual property rights owned by others and being able to resolve claims of intellectual property infringement or misappropriation without major financial expenditures or adverse consequences. From time to time, we may be the subject of claims that our solution and underlying technology infringe or violate the intellectual property rights of others, particularly as we expand the scope and complexity of our business.
Regardless of whether claims that we are infringing patents or other intellectual property rights have any merit, these claims are time-consuming and costly to evaluate and defend, and the outcome of any litigation is inherently uncertain. Some of our competitors have substantially greater resources than we do and are able to sustain the costs of complex intellectual property litigation to a greater degree and for longer periods of time than we could. Claims that we are infringing patents or other intellectual property rights could:
• | subject us to significant liabilities for monetary damages, which may be tripled in certain instances; |
• | prohibit us from developing, commercializing or continuing to provide some or all of our solution unless we obtain licenses from, and pay royalties to, the holders of the patents or other intellectual property rights, who may not be willing to offer them on terms that are acceptable to us, or at all; |
• | subject us to indemnification obligations or obligations to refund fees to, and adversely affect our relationships with, our current or future clients, advertising agencies, media networks and exchanges or publishers; |
• | cause delays or stoppages in providing our solution; |
• | cause clients, potential clients, advertising agencies, media networks and exchanges or publishers to avoid working with us; |
• | divert the attention and resources of management and technical personnel; |
• | harm our reputation; and |
• | require technology or branding changes to our solution that would cause us to incur substantial cost and that we may be unable to execute effectively or at all. |
In addition, we may be exposed to claims that the content contained in advertising campaigns violates the intellectual property or other rights of third parties. Such claims could be made directly against us or against the advertising agencies, media networks and exchanges and publishers from whom we purchase advertising inventory. Generally, under our agreements with advertising agencies, media networks and exchanges and publishers, we are required to indemnify the advertising agencies, media networks and exchanges and publishers against any such claim with respect to an advertisement we served. We generally require our clients to indemnify us for any damages from any such claims. There can be no assurance, however, that our clients will have the ability to satisfy their indemnification obligations to us, and pursuing any claims for indemnification may be costly or unsuccessful.
37
As a result, we may be required to satisfy our indemnification obligations to advertising agencies, media networks and exchanges and publishers or claims against us with our assets. This result could harm our reputation, business, financial condition and results of operations.
Our business involves the use, transmission and storage of confidential information, and the failure to properly safeguard such information could result in significant reputational harm and monetary damages.
Our business involves the storage and transmission of confidential consumer, advertiser client and publisher information, including certain purchaser data, as well as financial, employee and operational information. Security breaches could expose us to unauthorized disclosure of this information, litigation and possible liability, as well as damage to our relationships with our clients and publishers. If our security measures are breached as a result of third-party action, employee or contractor error, malfeasance or otherwise and, as a result, someone obtains unauthorized access to our data or the data of consumers, our advertiser clients, publishers, employees or other third parties, our reputation could be damaged, our business may suffer and we could incur significant liability.
Techniques used to obtain unauthorized access or to sabotage systems change frequently and generally are not recognized until launched against a target. As a result, we may be unable to anticipate some of these techniques or to implement adequate preventative measures. If an actual or perceived security breach occurs, the market perception of our security measures could be harmed and we could lose sales and clients. Any significant violations of data privacy or other security breaches could result in the loss of business, litigation and regulatory investigations and penalties that could damage our reputation and adversely impact our results of operations and financial condition. Moreover, if a high profile security breach occurs with respect to another provider of performance display advertising solutions, our clients and potential clients may lose trust in the security of providers of performance display advertising solutions generally, which could adversely impact our ability to retain existing clients or attract new ones.
Additionally, third parties may attempt to fraudulently induce employees, consumers, our advertiser clients, our publishers or third-party providers into disclosing sensitive information such as user names, passwords or other information in order to gain access to our data, our advertiser clients’ data or our publishers’ data, which could result in significant legal and financial exposure and a loss of confidence in the security of our solution and, ultimately, harm to our future business prospects. A party who is able to compromise the security of our facilities, including our data centers or office facilities, or any device, such as a smartphone or laptop, connected to our systems could misappropriate our proprietary information or the proprietary information of consumers, our advertiser clients and/or our publishers, or cause interruptions or malfunctions in our operations or those of our advertiser clients and/or publishers. We may be required to expend significant resources to protect against such threats or to alleviate problems caused by breaches in security. Finally, computer viruses or malware may harm our systems or cause the loss or alteration of data, and the transmission of computer viruses or malware via our solution could expose us to litigation and a loss of confidence in the security of our solution. Our errors and omissions insurance may be inadequate or may not be available in the future on acceptable terms, or at all. In addition, our policy may not cover any claim against us for loss of data or other indirect or consequential damages and defending a suit, regardless of its merit, could be costly and divert management’s attention.
Our business depends on our ability to maintain the quality of content for our advertiser clients and publishers.
We must be able to ensure that our clients’ advertisements are not placed in publisher content that is unlawful or inappropriate. If we fail to ensure that our clients’ advertisements are not placed in unlawful or inappropriate content, our reputation and business may suffer. In particular, we could be treated as a spammer and blocked by internet service providers or regulators. In addition, if we place advertisements on websites containing content that is not permitted under the terms of the applicable agreements with a client, we may be unable to charge the client for clicks generated on those sites, the client may terminate their campaign or the client may require us to indemnify them for any resulting third party claims. Our relationships with our advertiser clients may also be impaired by fraudulent or malicious activity, including non-human traffic. For example, the use of bots or other automated or manual mechanisms to generate fraudulent clicks on advertisements we deliver could overstate the performance of our advertising.
38
It may be difficult to detect fraudulent or malicious activity, particularly because the perpetrators of such activity frequently change their tactics and may become more sophisticated, requiring us to improve our processes for detecting and controlling such activity.
If we fail to detect or prevent fraudulent or malicious activity, our clients may experience or perceive a reduced return on their investment or a heightened risk associated with use of our solution, resulting in refusals to pay, demands for refunds, loss of confidence, withdrawal of future business and potential legal claims.
Further, our publishers rely upon us not to place advertisements on their websites that are unlawful or inappropriate. If we are unable to maintain the quality of our advertiser and publisher content as the number of advertiser clients and publishers we work with continues to grow, our reputation and business may suffer and we may not be able to retain or secure additional clients or publisher relationships.
Failures in our systems and infrastructure supporting our solution and operations could significantly disrupt our operations and cause us to lose clients.
In addition to the optimal performance of the Criteo Engine, our business relies on the continued and uninterrupted performance of our software and hardware infrastructures. We currently place close to four billion advertisements per day and each of those advertisements can be placed in under 100 milliseconds. Sustained or repeated system failures of our software or hardware infrastructures (such as massive and sustained data center outages) or of the software or hardware infrastructures our third-party providers, which interrupt our ability to deliver advertisements quickly and accurately, our ability to serve and track advertisements, our ability to process consumers’ responses to those advertisements or otherwise disrupt our internal operations, could significantly reduce the attractiveness of our solution to advertiser clients and publishers, reduce our revenue or otherwise negatively impact our financial situation, impair our reputation and subject us to significant liability.
In addition, while we seek to maintain excess capacity to facilitate the rapid provision of new client deployments and the expansion of existing client deployments, we may need to increase data center hosting capacity, bandwidth, storage, power or other elements of our system architecture and our infrastructure as our client base and/or our traffic continues to grow. Our existing systems may not be able to scale up in a manner satisfactory to our existing or prospective clients, and may not be adequately designed with the necessary reliability and redundancy of certain critical portions of our infrastructure to avoid performance delays or outages that could be harmful to our business.
Our failure to continuously upgrade or increase the reliability and redundancy of our infrastructure to meet the demands of a growing base of global advertiser clients and publishers could adversely affect the functioning and performance of our solution and could in turn affect our results of operations.
Finally, our systems are vulnerable to damage from a variety of sources, some of which are outside of our control, including telecommunications failures, natural disasters, terrorism, power outages, a variety of other possible outages affecting data centers, and malicious human acts, including hacking, computer viruses, malware and other security breaches. Techniques used to obtain unauthorized access or to sabotage systems change frequently and generally are not recognized until launched against a target. As a result, we may be unable to anticipate some of these techniques or to implement adequate preventative measures.
Any steps we take to increase the security, reliability and redundancy of our systems supporting our solution or operations may be expensive and may not be successful in preventing system failures. If we are unable to prevent system failures, the functioning and performance of our solution could suffer, which in turn could interrupt our business and harm our results of operations.
39
As we expand the market for our solution, we may become more dependent on advertising agencies as intermediaries, which may adversely affect our ability to attract and retain business.
As we market our solution, we may increasingly need advertising agencies to work with us in assisting businesses in planning and purchasing for broader advertising objectives. In particular, many of our Criteo Sponsored Products clients, whom we have started working with since our acquisition of HookLogic, work with us through advertising agencies. Historically, however, direct relationships with our clients accounted for 69%, 71% and 76% of our revenue for 2014, 2015 and 2016, respectively, for Criteo Dynamic Retargeting.
If we have an unsuccessful engagement with an advertising agency on a particular advertising campaign, we risk losing the ability to work not only for the advertiser for whom the campaign was run, but also for other brands represented by that agency. Further, if our business evolves such that we are increasingly working through advertising agency intermediaries, we would have less of a direct relationship with our clients. This may drive our clients to attribute the value we provide to the advertising agency rather than to us, further limiting our ability to develop long-term relationships directly with our clients. Additionally, our advertiser clients may move from one advertising agency to another, and, accordingly, even if we have a positive relationship with an advertising agency, we may lose the underlying advertiser client’s business when the advertiser switches to a new agency. The presence of advertising agencies as intermediaries between us and our clients thus creates a challenge to building our own brand awareness and maintaining an affinity with our clients, who are the ultimate sources of our revenue. In the event we were to become more dependent on advertising agencies as intermediaries, this may adversely affect our ability to attract and retain business. In addition, an increased dependency on advertising agencies may harm our results of operations, as a result of the increased agency fees we may be required to pay and/or as result of longer payment terms from agencies.
We are a growing company in a rapidly evolving industry, which makes it difficult to evaluate our future prospects and may increase the risk that we will not be successful. Our recent growth rates may not be indicative of our future growth, and we expect our operating expenses to continue to increase in the foreseeable future. Accordingly, we may have difficulty sustaining profitability.
We are a growing company in a rapidly evolving industry. Our ability to forecast our future operating results is subject to a number of uncertainties, including our ability to plan for and model future growth in both our business and the performance advertising market generally. We have encountered and will continue to encounter risks and uncertainties frequently experienced by growing companies in rapidly evolving industries, including challenges in forecasting accuracy, determining appropriate investments, achieving market acceptance of our existing and future solutions, managing client implementations and developing new solutions. If our assumptions regarding these uncertainties, which we use to plan our business, are incorrect or change in reaction to changes in our markets, or if we do not address these risks successfully, our operating and financial results could differ materially from our expectations and our business could suffer.
While our revenue has increased substantially since our inception, we may not be able to sustain revenue growth consistent with our recent history, or at all. You should not consider our revenue growth in recent periods to be indicative of our future performance. In future periods, our revenue could decline or grow more slowly than we expect. We believe the growth of our revenue depends on a number of factors, including our ability to:
• | attract new clients, and retain and expand our relationships with existing clients; |
• | maintain the breadth of our publisher network and attract new publishers, including publishers of web content, mobile applications and video and social games, in order to grow the volume and breadth of advertising inventory available to us; |
40
• | adapt our solution to meet evolving needs of businesses, including to address market trends such as (i) the migration of consumers from desktop to mobile and from web to mobile applications, (ii) the increasing percentage of sales that involve multiple devices, (iii) the growing adoption by consumers of “ad-blocking” software on web browsers on desktop and/or on mobile devices, and (iv) changes in the marketplace for and supply of advertising inventory, including the shift toward header bidding; |
• | maintain and increase our access to data necessary for the performance of the Criteo Engine; |
• | maintain the proper functioning of the Criteo Engine as we continue to collect increasing amounts of data from new geographic markets, new marketing channels, new industry verticals and a growing base of clients; |
• | continuously improve the algorithms underlying the Criteo Engine; and |
• | continue to adapt to a changing regulatory landscape governing privacy matters. |
We also anticipate that our operating expenses will continue to increase as we scale our business, expand our headcount and expand our operations. In particular, we plan to continue to focus on maximizing our revenue after traffic acquisition costs on an absolute basis, or the revenue we derive after deducting the costs we incur to purchase advertising inventory, which we call Revenue ex-TAC, as we believe this focus fortifies a number of our competitive strengths, including access to advertising inventory, breadth and depth of data and continuous improvement of the Criteo Engine’s performance. As part of this focus, we are continuing to invest in (i) building relationships with direct publishers on both web and mobile application properties, (ii) increasing access to leading advertising exchanges on both web and mobile application properties, and (iii) enhancing the liquidity of our advertising inventory supply, which may include purchasing advertising inventory that may result in lower margin on an individual impression basis and may be less effective in generating clicks and driving sales for our clients. In addition, we are experiencing, and expect to continue to experience, increased competition for advertising inventory purchased on a programmatic basis. Our focus on maximizing the growth of Revenue ex-TAC on an absolute basis may have an adverse impact on our gross margin and we cannot be certain that this strategy will be successful or result in increased liquidity or long-term value for our shareholders.
In addition, as our business expands, we may not be able to maintain our current profitability margin or to achieve our long-term profitability margin target. For example, our midmarket business is currently less profitable than our large client business, and, as a result, if the size of our midmarket business continues to grow as a proportion of our overall business, our profitability may be negatively affected. Similarly, as we transition to a multi-product company, with products available to advertisers across several marketing channels, such new products may require additional investments in sales, business development and marketing, for example in product sales specialist resources or similar resources to enable sales. As a result of such additional investments, our new products may be less profitable than our existing business and therefore drive down our overall profitability.
In periods of economic uncertainty, businesses may delay or reduce their spending on advertising, which could materially harm our business.
General worldwide economic conditions have been significantly unstable in recent years, especially in the European Union where we generated 32% of our revenue for 2016. Unstable conditions make it difficult for our clients and us to accurately forecast and plan future business activities, and could cause our clients to reduce or delay their advertising spending with us. Historically, economic downturns have resulted in overall reductions in advertising spending, and businesses may curtail spending both on advertising in general and on a solution such as ours. We cannot predict the timing, strength or duration of any economic slowdown or recovery. Any macroeconomic deterioration in the future, especially further deterioration in the European Union and some emerging markets, such as Brazil and Russia, could impair our revenue and results of operations.
In addition, even if the overall economy improves, we cannot assure you that the market for performance internet display advertising will experience growth or that we will experience growth. Furthermore, we generally sell
41
through insertion orders with our clients. These insertion orders generally do not include long-term obligations and are cancellable upon short notice and without penalty. Any reduction in advertising spending could limit our ability to grow our business and negatively affect our results of operations.
We derive a significant portion of our revenue from ecommerce businesses, especially in the retail, travel and classified industries, and downturn in these industries or any changes in regulations affecting these industries could harm our business.
A significant portion of our revenue is derived from ecommerce businesses in the retail, travel and classifieds industries. For example, in 2014, 2015 and 2016, 66.3%, 67.0% and 66.8%, respectively, of our revenue was derived from advertisements placed for retail ecommerce businesses. While we expect to grow our advertiser base in additional industries, any downturn or increased competitive pressure in any of our core industries, or other industries we may target in the future, may cause our clients to reduce their spending with us, or delay or cancel their advertising campaigns with us.
Furthermore, our business could be negatively impacted by the application of existing laws and regulations or the enactment of new laws by federal, state and foreign governmental or regulatory agencies which would impose taxes on goods and services provided over the internet. To the extent such taxes discourage the use of the internet as a means of commercial marketing or reduce the amount of products and services offered through ecommerce websites, online advertising spending may decline and the use or attractiveness of our solution by our clients or potential clients may be adversely affected.
Our inability to use software licensed from third parties, or our use of open source software under license terms that interfere with our proprietary rights, could disrupt our business.
Our technology platform and internal systems incorporate software licensed from third parties, including some software, known as open source software, which we use without charge. Although we monitor our use of open source software, the terms of many open source licenses to which we are subject have not been interpreted by U.S. or foreign courts, and there is a risk that such licenses could be construed in a manner that imposes unanticipated conditions or restrictions on our ability to provide our solution to our clients. In the future, we could be required to seek licenses from third parties in order to continue offering our solution, which licenses may not be available on terms that are acceptable to us, or at all. Alternatively, we may need to re-engineer our solution or discontinue using portions of the functionality provided by our solution. In addition, the terms of open source software licenses may require us to provide software that we develop using such software to others on unfavorable terms, such as by precluding us from charging license fees or by requiring us to disclose our source code. Any such restriction on the use of our own software, or our inability to use open source or third-party software, could result in disruptions to our business or operations, or delays in our development of future offerings or enhancements of our existing platform, which could impair our business.
If we fail to manage our growth and the shift in our client profile effectively, we may be unable to execute our business plan or maintain high levels of advertiser and publisher satisfaction.
We have experienced, and may in the future experience, rapid growth and organizational change, which have created, and may continue to create, challenges to the quality of our service to our advertiser clients and publishers, and which have placed, and may continue to place, significant demands on our management and our operational and financial resources.
For example, the number of clients from which we collect revenue has increased from under 350 located in eight countries as of January 1, 2010 to over 14,000 located in over 90 countries as of December 31, 2016. While our client count has increased over time, this metric can also fluctuate from quarter to quarter due to the seasonal trends in advertising spending by our clients and the timing and amounts of revenue contributions from new clients.
Therefore, there is not necessarily a direct correlation between a change in the number of clients in a particular period and an increase or decrease in our revenue.
42
For example, the size of our midmarket business has grown significantly as a proportion of our overall business, and we expect it to continue to do so in the future. As our business shifts toward the midmarket segment, there are several additional risks to our business, including risks relating to the financial stability of our clients in the midmarket segment and our ability to collect from such clients. In addition, since our midmarket business is comprised of thousands of smaller clients which require significant resources to support, it is currently less profitable than our large client business. We will need to continue automating certain of our processes to service the midmarket segment as it continues to grow globally. However, there can be no assurance that we will be able to successfully adjust to these shifting dynamics and remain profitable.
Another part of the challenge that we expect to face in the course of our continued expansion is maintaining a high level of service to ensure advertiser client and publisher satisfaction. To the extent our advertiser client and publisher base grows, we will need to expand our account management, publisher support and other personnel in order to continue to provide personalized account management and services. We will therefore require significant expenses and capital expenditures and will need to allocate valuable management resources to maintain the quality of our client service that has been central to our growth to date, especially as we continue to seek to attract larger advertiser clients and publishers. If we fail to manage our anticipated growth in a manner that preserves our attention to our clients, our brand and reputation may suffer, which would in turn impair our ability to attract and retain advertiser clients and publishers.
Over the past few years, we have significantly expanded and we expect to continue to expand our international operations in the future. As such, our organizational structure is becoming more complex as we expand our managerial, research and development, marketing and sales, operational and administrative, legal, financial and other functions in order to support our expanding business. Furthermore, our rapid international expansion and the expanding geographic diversity of our workforce has placed, and is expected to continue to place, a significant strain on the corporate culture of rapid innovation and teamwork that has been central to our growth.
If we are unable to successfully manage our geographic expansion, and the associated growth in employee headcount and changes to our organizational structure, our results of operations could suffer.
We experience quarterly fluctuations in our results of operations due to a number of factors which make our future results difficult to predict and could cause our operating results to fall below expectations or our guidance.
Our quarterly results of operations fluctuate due to a variety of factors, many of which are outside of our control. As a result, comparing our results of operations on a period-to-period basis may not be meaningful. You should not rely on our past results as indicative of our future performance. If our revenue or results of operations fall below the expectations of investors or securities analysts, or below any guidance we may provide to the market, the price of our ADSs could decline substantially.
Our operating results and cash flows from operations may vary from quarter to quarter due to the seasonal nature of our clients’ spending. For example, many businesses in the online retail industry devote the largest portion of their advertising spend to the fourth quarter of the calendar year, and many of our ecommerce retail and travel clients typically conduct fewer advertising campaigns in the second quarter than they do in other quarters. With respect to Criteo Sponsored Products, the concentration of advertising spend in the fourth quarter of the year is particularly pronounced. If and to the extent that seasonal fluctuations are significant, our operating cash flows could fluctuate materially from period to period as a result.
Additionally, implementing our solution for a client can be a long process, which generally requires clients to integrate software code on their website. This process can be complex and time-consuming, and can delay the deployment and use of our solution by an advertiser even after the advertiser has signed up to utilize it.
Depending upon the time and resources that an advertiser is willing to devote to the integration of our solution with their website, and the nature and complexity of an advertiser’s network and systems, the actual implementation of our solution may occur long after an advertiser has signed up to use our solution.
43
As a result, we may incur substantial expenses in one period without any guarantee of revenue generation in the near term, or at all. This possibly lengthy implementation cycle may result in difficulty in predicting our future results of operations.
We also plan to continue to substantially increase our investment in research and development, product development and sales and marketing, as we seek to continue to expand geographically, into new marketing channels and into new industry verticals to capitalize on what we see as a growing global opportunity for our solution. Our general and administrative expenses may also increase to support our growing operations and due to the increased costs of operating as a public company. For the foregoing reasons or other reasons we may not anticipate, historical patterns should not be considered indicative of our future quarterly results of operations.
Other factors that may affect our quarterly results of operations include:
• | the nature of our advertising clients’ products or services; |
• | demand for our solution and the size, scope and timing of advertising campaigns; |
• | the lack of long-term agreements with our advertiser clients and publishers; |
• | advertiser and publisher retention rates; |
• | market acceptance of our solution and future products and services (i) in current industry verticals and new industry verticals, (ii) in new geographic markets, (iii) in new marketing channels, or (iv) for broader marketing objectives; |
• | the timing of large expenditures related to expansion into new geographic markets, new industry verticals, acquisitions and/or capital projects; |
• | the timing of adding support for new devices, platforms and operating systems; |
• | the amount of inventory purchased through direct relationships with publishers versus internet advertising exchanges or networks; |
• | our clients’ budgeting cycles; |
• | changes in the competitive dynamics of our industry, including consolidation among competitors; |
• | the response of consumers to our clients’ advertisements and to online marketing in general; |
• | our ability to control costs, including our operating expenses; |
• | network outages, errors in our solution or security breaches and any associated expense and collateral effects; |
• | foreign currency exchange rate fluctuations, as some of our foreign sales and costs are denominated in their local currencies; |
• | failure to successfully manage any acquisitions; and |
• | general economic and political conditions in our domestic and international markets. |
As a result, we may have a limited ability to forecast the amount of future revenue and expense, and our results of operations may from time to time fall below our estimates or the expectations of public market analysts and investors.
44
Interruptions or delays in services provided by third-party providers that we rely upon could impair the performance of our solution or operations and harm our business.
We currently lease space from third-party data center hosting facilities for our servers and/or networking equipment located in California, New York, Virginia, France, The Netherlands, Hong Kong, mainland China and Japan. All of our data gathering and analytics are conducted on, and the advertisements we deliver are processed through, our servers and network equipment located in these facilities.
We also rely on bandwidth providers and internet service providers to deliver advertisements. Any damage to, or failure of, the systems or facilities of our third-party providers could adversely impact our ability to deliver our solution to our clients. If, for any reason, our arrangement with one or more data centers is terminated, we could experience additional expense in arranging for new facilities and support.
The occurrence of a natural disaster, an act of terrorism, vandalism or sabotage, a decision to close any data center or the facilities of any other third-party provider without adequate notice, or other unanticipated problems at these facilities could result in lengthy interruptions in the availability of our solution or operations. Our testing of our services in actual disasters or similar events has been limited. If any such event were to occur, our business, results of operations and financial condition could be adversely affected.
We are exposed to foreign currency exchange rate fluctuations.
The functional currency of the Company is the euro, while our reporting currency is the U.S. dollar. Since we incur portions of our expenses and derive revenues in currencies other than the euro, we are exposed to foreign currency exchange risk to the extent that our results of operations and cash flows are subject to fluctuations in foreign currency exchange rates. Foreign currency exchange risk exposure also arises from intra-company transactions and financing with subsidiaries that have a functional currency different than the euro.
The statements of financial position of consolidated entities having a functional currency different from the U.S. dollar are translated into U.S. dollars at the closing exchange rate (spot exchange rate at the statement of financial position date) and the statement of income, statement of comprehensive income and statement of cash flow of such consolidated entities are translated at the average period to date exchange rate. The resulting translation adjustments are included in equity under the caption “Accumulated Other Comprehensive Income” in the consolidated statement of changes in equity.
While we are engaging in hedging transactions to minimize the impact of uncertainty in future exchange rates on intra-company transactions and financing, we may not hedge all of our foreign currency exchange rate risk. In addition, hedging transactions carry their own risks and costs, including the possibility of a default by the counterparty to the hedge transaction. There can be no assurance that we will be successful in managing our foreign currency exchange rate risk. We cannot predict the impact of foreign currency fluctuations, and foreign currency fluctuations in the future may adversely affect our financial condition, results of operations and cash flows.
Our failure to maintain certain tax benefits applicable to French technology companies may adversely affect our results of operations.
As a French technology company, we have benefited from certain tax advantages, including, for example, a reduced tax rate in France on technology royalty income received from subsidiaries and the French research tax credit (crédit d’impôt recherche), or CIR. The CIR is a French tax credit aimed at stimulating research and development. The CIR can be offset against French corporate income tax due and the portion in excess (if any) may be refunded at the end of a three fiscal-year period.
The CIR is calculated based on our claimed amount of eligible research and development expenditures in France and represented $5.1 million, $3.4 million and $4.9 million for 2014, 2015 and 2016, respectively and is classified as a reduction of our research and development expenses.
45
The French tax authority, with the assistance of the Research and Technology Ministry, may audit each research and development program in respect of which a CIR benefit has been claimed and assess whether such program qualifies, in their view, for the CIR benefit. If the French tax authority determines that our research and development programs do not meet the requirements for the CIR benefit, or challenges our calculations with respect to the CIR benefit, we could be liable for additional corporate tax, and penalties and interest related thereto, which could have a significant impact on our results of operations and future cash flows.
Furthermore, if the French Parliament decides to eliminate the reduced tax rate on technology royalty income or to reduce the scope or the rate of the CIR benefit, which it could decide to do at any time, our results of operations could be adversely affected.
We are a multinational organization faced with increasingly complex tax issues in many jurisdictions, and we could be obligated to pay additional taxes in various jurisdictions as a result of new taxes or laws, or revised interpretations thereof, which may negatively affect our business.
As a multinational organization operating in multiple jurisdictions we are subject to taxation in several jurisdictions around the world with increasingly complex tax laws, the application of which can be uncertain. The amount of taxes we pay in these jurisdictions could increase substantially as a result of changes in the applicable tax principles, including increased tax rates, new tax laws or revised interpretations of existing tax laws and precedents, which could have a material adverse effect on our liquidity and results of operations.
For example, many of the jurisdictions in which we conduct business have detailed transfer pricing rules which require that all transactions with non-resident related parties be priced using arm’s length pricing principles. Contemporaneous documentation must exist to support this pricing. The tax authorities in these jurisdictions could challenge whether our related party transfer pricing policies are at arm’s length and, as a consequence, challenge our tax treatment of corresponding expenses and income. International transfer pricing is an area of taxation that depends heavily on the underlying facts and circumstances and generally involves a significant degree of judgment. If any of these tax authorities were successful in challenging our transfer pricing policies, we may be liable for additional corporate income tax, and penalties, fines and interest related thereto, which may have a significant impact on our effective tax rate, results of operations and future cash flows.
Risks Related to Ownership of Our Shares and the ADSs and the Trading of the ADSs
The market price for the ADSs may be volatile or may decline regardless of our operating performance.
The trading price of the ADSs has fluctuated, and is likely to continue to fluctuate, substantially. The trading price of the ADSs depends on a number of factors, including those described in this “Risk Factors” section, many of which are beyond our control and may not be related to our operating performance. Since the ADSs were sold at our initial public offering in October 2013 at a price of $31.00 per share, the price per ADS has ranged as low as $24.23 and as high as $60.95 through January 31, 2017. The market price of the ADSs may fluctuate significantly in response to numerous factors, many of which are beyond our control, including:
• | actual or anticipated fluctuations in our revenue and other results of operations; |
• | the guidance we may provide to the public, any changes in this guidance or our failure to meet this guidance; |
• | failure of securities analysts to initiate or maintain coverage of us and our securities, changes in financial estimates by any securities analysts who follow our company, or our failure to meet these estimates or the expectations of investors; |
• | announcements by us or our competitors of significant technical innovations, acquisitions, strategic partnerships, joint ventures or capital commitments; |
46
• | changes in operating performance and stock market valuations of online marketing or other technology companies, or those in our industry in particular; |
• | investor sentiment with respect to our competitors, our business partners or our industry in general; |
• | price and volume fluctuations in the overall stock market, including as a result of trends in the economy as a whole; |
• | additional ADSs being sold into the market by us; |
• | media coverage of our business and financial performance; |
• | developments in anticipated or new legislation or new or pending lawsuits or regulatory actions; and |
• | other events or factors, including those resulting from war, incidents of terrorism or responses to these events. |
In addition, the stock markets have experienced extreme price and volume fluctuations that have affected and continue to affect the market prices of equity securities of many technology companies. Stock prices of many technology companies have fluctuated in a manner unrelated or disproportionate to the operating performance of those companies. In the past, shareholders have instituted securities class action litigation following periods of market volatility. If we were to become involved in securities litigation, it could subject us to substantial costs, divert resources and the attention of management from our business and adversely affect our business.
If securities or industry analysts cease publishing research or publish inaccurate or unfavorable research about our business or our industry, the price and trading volume of the ADSs could decline.
The trading market for the ADSs depends in part on the research and reports that securities or industry analysts publish about us or our business. If one or more of the analysts who covers us downgrades the ADSs or publishes incorrect or unfavorable research about our business, the price of the ADSs would likely decline. If one or more of these analysts ceases coverage of our company or fails to publish reports on us regularly, demand for the ADSs could decrease, which could cause the price of the ADSs or trading volume to decline.
We do not currently intend to pay dividends on our securities and, consequently, your ability to achieve a return on your investment will depend on appreciation in the price of the ADSs. In addition, French law may limit the amount of dividends we are able to distribute.
We have never declared or paid any cash dividends on our ordinary shares and do not currently intend to do so for the foreseeable future. We currently intend to invest our future earnings, if any, to fund our growth. Therefore, you are not likely to receive any dividends on your ADSs for the foreseeable future and the success of an investment in ADSs will depend upon any future appreciation in their value. Consequently, investors may need to sell all or part of their holdings of ADSs after price appreciation, which may never occur, as the only way to realize any future gains on their investment. There is no guarantee that the ADSs will appreciate in value or even maintain the price at which our shareholders have purchased the ADSs. Investors seeking cash dividends should not purchase the ADSs.
Further, the credit agreement for the General RCF (as defined herein) contains restrictions on our ability to pay dividends. In addition, under French law, the determination of whether we have been sufficiently profitable to pay dividends is made on the basis of our statutory financial statements prepared and presented in accordance with accounting principles generally accepted in France. In addition, payment of dividends may subject us to additional taxes under French law. Therefore, we may be more restricted in our ability to declare dividends than companies not based in France.
47
Please see the section entitled “Market for Registrant’s Common Equity, Related Stockholder Matters and Issuer Purchases of Equity Securities-Taxation-French Tax Consequences” in Item 5 of Part II in this Form 10-K for further details on the limitations on our ability to declare and pay dividends and the taxes that may become payable by us if we elect to pay a dividend.
In addition, exchange rate fluctuations may affect the amount of euros that we are able to distribute, and the amount in U.S. dollars that our shareholders receive upon the payment of cash dividends or other distributions we declare and pay in euros, if any. These factors could harm the value of the ADSs, and, in turn, the U.S. dollar proceeds that holders receive from the sale of the ADSs.
Our credit agreement contains, and future debt agreements may contain, restrictions that may limit our flexibility in operating our business.
The credit agreement for the General RCF contains, and documents governing our future indebtedness may contain, numerous covenants that limit the discretion of management with respect to certain business matters. These covenants place restrictions on, among other things, our ability and the ability of our subsidiaries to incur or guarantee additional indebtedness, pay dividends and make other distributions and restricted payments, make certain acquisitions and other investments, sell certain assets or engage in mergers, acquisitions and other business combinations, and create liens. Our credit agreement also requires, and documents governing our future indebtedness may require, us or our subsidiaries to meet certain financial ratios and tests in order to incur certain additional debt, make certain loans, acquisitions or other investments, or pay dividends or make other distributions or restricted payments. Our ability and the ability of our subsidiaries to comply with these and other provisions of our debt agreements are dependent on our future performance, which will be subject to many factors, some of which are beyond our control. The breach of any of these covenants or noncompliance with any of these financial ratios and tests could result in an event of default under the applicable debt agreement, which, if not cured or waived, could result in acceleration of the related debt and the acceleration of debt under other instruments evidencing indebtedness that may contain cross-acceleration or cross-default provisions.
We may need additional capital in the future to meet our financial obligations and to pursue our business objectives. Additional capital may not be available on favorable terms, or at all, which could compromise our ability to meet our financial obligations and grow our business.
While we anticipate that our existing cash and cash equivalents and short-term investments will be sufficient to fund our operations for at least the next 12 months,we may need to raise additional capital to fund operations in the future or to finance acquisitions. If adequate funds are not available on acceptable terms, we may be unable to fund the expansion of our marketing and sales and research and development efforts, increase working capital, take advantage of acquisition or other opportunities, or adequately respond to competitive pressures which could seriously harm our business and results of operations.
In September 2015, we entered into a five-year senior unsecured revolving credit facility under which we may borrow up to €250 million (or its equivalent in U.S. dollars or, subject to the satisfaction of certain conditions, other optional currencies) to fund general corporate purposes, including the funding of business combinations (the "General RCF"). As of December 31, 2016, $75 million had been drawn on this facility. To the extent we have drawn on the General FCF or incur new debt, the debt holders have rights senior to shareholders to make claims on our assets, and the terms of such debt could restrict our operations, including our ability to pay dividends on our ordinary shares. In addition, pursuant to the terms of our credit facilities, we may be restricted in the use of such facilities to fund capital expenditures and information technology-related expenses may be restricted. If adequate additional funds are not available, we may be required to delay, reduce the scope of, or eliminate material parts of our business strategy, including potential additional acquisitions or development of new technologies.
Furthermore, if we issue additional equity securities, shareholders will experience dilution, and the new equity securities could have rights senior to those of our ordinary shares.
48
Because our decision to issue securities in any future offering will depend on market conditions and other factors beyond our control, we cannot predict or estimate the amount, timing or nature of our future offerings. As a result, our shareholders bear the risk of our future securities offerings reducing the market price of the ADSs and diluting their interest.
Our by-laws and French corporate law contain provisions that may delay or discourage a takeover attempt.
Provisions contained in our by-laws and the corporate laws of France, the country in which we are incorporated, could make it more difficult for a third party to acquire us, even if doing so might be beneficial to our shareholders. In addition, provisions of our by-laws impose various procedural and other requirements, which could make it more difficult for shareholders to effect certain corporate actions. These provisions include the following:
• | our ordinary shares are in registered form only and we must be notified of any transfer of our shares in order for such transfer to be validly registered; |
• | under French law, a non-resident of France as well as any French entity controlled by non-French residents may have to file an administrative notice with French authorities in connection with a direct or indirect investment in us, as defined by administrative rulings (see the section entitled "Exchange Controls & Ownership by Non-French Residents" in Item 5 to Part II in this Form 10-K); |
• | provisions of French law allowing the owner of 95% of the share capital or voting rights of a public company to force out the minority shareholders following a tender offer made to all shareholders are only applicable to companies listed on a stock exchange of the European Union and will therefore not be applicable to us; |
• | a merger of our company into a company incorporated outside of the European Union would require the unanimous approval of our shareholders; |
• | a merger (i.e., in a French law context, a stock-for-stock exchange following which our company would be dissolved into the acquiring entity and our shareholders would become shareholders of the acquiring entity) of our company into a company incorporated in the European Union would require the approval of our board of directors as well as a two-thirds majority of the votes held by the shareholders present, represented by proxy or voting by mail at the relevant shareholders' meeting; |
• | under French law, a cash merger is treated as a share purchase and would require the consent of each participating shareholder; |
• | our shareholders have granted and may grant in the future our board of directors broad authorizations to increase our share capital or to issue additional ordinary shares or other securities (for example, warrants) to our shareholders, the public or qualified investors, including as a possible defense following the launching of a tender offer for our shares; |
• | our shareholders have preferential subscription rights proportionally to their shareholding in our company on the issuance by us of any additional securities for cash or a set-off of cash debts, which rights may only be waived by the extraordinary general meeting (by a two-thirds majority vote) of our shareholders or on an individual basis by each shareholder; |
• | our board of directors has the right to appoint directors to fill a vacancy created by the resignation or death of a director, subject to the approval by the shareholders of such appointment at the next shareholders’ meeting, which prevents shareholders from having the sole right to fill vacancies on our board of directors; |
• | our board of directors can only be convened by its chairman or, when no board meeting has been held for more than two consecutive months, by directors representing at least one third of the total number of directors; |
49
• | our board of directors meetings can only be regularly held if at least half of the directors attend either physically or by way of videoconference or teleconference enabling the directors’ identification and ensuring their effective participation in the board’s decisions; |
• | approval of at least a majority of the votes held by shareholders present, represented by a proxy, or voting by mail at the relevant ordinary shareholders’ general meeting, is required to remove directors with or without cause; |
• | advance notice is required for nominations to the board of directors or for proposing matters to be acted upon at a shareholders’ meeting, except that a vote to remove and replace a director can be proposed at any shareholders’ meeting without notice; and |
• | pursuant to French law, the sections of the by-laws relating to the number of directors and election and removal of a director from office may only be modified by a resolution adopted by a two-thirds majority of the votes of our shareholders present, represented by a proxy or voting by mail at the shareholders' meeting. |
You may not be able to exercise your right to vote the ordinary shares underlying your ADSs.
Holders of ADSs may exercise voting rights with respect to the ordinary shares represented by the ADSs only in accordance with the provisions of the deposit agreement. The deposit agreement provides that, upon receipt of notice of any meeting of holders of our ordinary shares, the depositary will fix a record date for the determination of ADS holders who shall be entitled to give instructions for the exercise of voting rights. Upon timely receipt of notice from us, if we so request, the depositary shall distribute to the holders as of the record date (1) the notice of the meeting or solicitation of consent or proxy sent by us and (2) a statement as to the manner in which instructions may be given by the holders.
You may instruct the depositary of your ADSs to vote the ordinary shares underlying your ADSs. Otherwise, you will not be able to exercise your right to vote, unless you withdraw the ordinary shares underlying the ADSs you hold. However, you may not know about the meeting far enough in advance to withdraw those ordinary shares. If we ask for your instructions, the depositary, upon timely notice from us, will notify you of the upcoming vote and arrange to deliver our voting materials to you. We cannot guarantee you that you will receive the voting materials in time to ensure that you can instruct the depositary to vote your ordinary shares or to withdraw your ordinary shares so that you can vote them yourself. If the depositary does not receive timely voting instructions from you, it may give a proxy to a person designated by us to vote the ordinary shares underlying your ADSs. In addition, the depositary and its agents are not responsible for failing to carry out voting instructions or for the manner of carrying out voting instructions. This means that you may not be able to exercise your right to vote, and there may be nothing you can do if the ordinary shares underlying your ADSs are not voted as you requested.
Your right as a holder of ADSs to participate in any future preferential subscription rights or to elect to receive dividends in shares may be limited, which may cause dilution to your holdings.
According to French law, if we issue additional securities for cash, current shareholders will have preferential subscription rights for these securities proportionally to their shareholding in our company unless they waive those rights at an extraordinary meeting of our shareholders (by a two-thirds majority vote) or individually by each shareholder.
However, our ADS holders in the United States will not be entitled to exercise or sell such rights unless we register the rights and the securities to which the rights relate under the Securities Act or an exemption from the registration requirements is available.
In addition, the deposit agreement provides that the depositary will not make rights available to you unless the distribution to ADS holders of both the rights and any related securities are either registered under the Securities Act or exempted from registration under the Securities Act.
50
Further, if we offer holders of our ordinary shares the option to receive dividends in either cash or shares, under the deposit agreement the depositary may require satisfactory assurances from us that extending the offer to holders of ADSs does not require registration of any securities under the Securities Act before making the option available to holders of ADSs. We are under no obligation to file a registration statement with respect to any such rights or securities or to endeavor to cause such a registration statement to be declared effective. Moreover, we may not be able to establish an exemption from registration under the Securities Act. Accordingly, ADS holders may be unable to participate in our rights offerings or to elect to receive dividends in shares and may experience dilution in their holdings. In addition, if the depositary is unable to sell rights that are not exercised or not distributed or if the sale is not lawful or reasonably practicable, it will allow the rights to lapse, in which case you will receive no value for these rights.
You may be subject to limitations on the transfer of your ADSs and the withdrawal of the underlying ordinary shares.
Your ADSs, which may be evidenced by ADRs, are transferable on the books of the depositary. However, the depositary may close its books at any time or from time to time when it deems expedient in connection with the performance of its duties. The depositary may refuse to deliver, transfer or register transfers of your ADSs generally when our books or the books of the depositary are closed, or at any time if we or the depositary think it is advisable to do so because of any requirement of law, government or governmental body, or under any provision of the deposit agreement, or for any other reason subject to your right to cancel your ADSs and withdraw the underlying ordinary shares.
Temporary delays in the cancellation of your ADSs and your withdrawal of the underlying ordinary shares may arise because the depositary has closed its transfer books or we have closed our transfer books, the transfer of ordinary shares is blocked to permit voting at a shareholders’ meeting or we are paying a dividend on our ordinary shares.
In addition, you may not be able to cancel your ADSs and withdraw the underlying ordinary shares when you owe money for fees, taxes and similar charges and when it is necessary to prohibit withdrawals in order to comply with any laws or governmental regulations that apply to ADSs or to the withdrawal of ordinary shares or other deposited securities.
If we fail to maintain an effective system of internal controls, we may be unable to accurately report our financial results or prevent fraud, and investor confidence and the market price of the ADSs may, therefore, be adversely impacted.
As a public company, we are required to maintain internal control over financial reporting and to report any material weaknesses in such internal control. In addition, we are required to submit a report by management to the Audit Committee and external auditors on the effectiveness of our internal control over financial reporting pursuant to Section 404 of the Sarbanes-Oxley Act and our independent registered public accounting firm is required to attest to the effectiveness of our internal controls over financial reporting. If we identify material weaknesses in our internal controls over financial reporting, if we are unable to comply with the requirements of Section 404 of the Sarbanes-Oxley Act in a timely manner or assert that our internal controls over financial reporting are effective, or if our independent registered public accounting firm is unable to express an opinion as to the effectiveness of our internal controls over financial reporting when required, investors may lose confidence in the accuracy and completeness of our financial reports and the market price of the ADSs may be adversely impacted, and we could become subject to investigations by the stock exchange on which our securities are listed, the SEC, or other regulatory authorities, which could require additional financial and management resources.
U.S. investors may have difficulty enforcing civil liabilities against our company and directors and senior management.
Certain of our directors and members of senior management, and those of certain of our subsidiaries, are non-residents of the United States, and all or a substantial portion of our assets and the assets of such persons are located outside the United States.
51
As a result, it may not be possible to serve process on such persons or us in the United States or to enforce judgments obtained in U.S. courts against them or us based on civil liability provisions of the securities laws of the United States. Additionally, it may be difficult to assert U.S. securities law claims in actions originally instituted outside of the United States.
Foreign courts may refuse to hear a U.S. securities law claim because foreign courts may not be the most appropriate forums in which to bring such a claim. Even if a foreign court agrees to hear a claim, it may determine that the law of the jurisdiction in which the foreign court resides, and not U.S. law, is applicable to the claim. Further, if U.S. law is found to be applicable, the content of applicable U.S. law must be proved as a fact, which can be a time-consuming and costly process, and certain matters of procedure would still be governed by the law of the jurisdiction in which the foreign court resides. In particular, there is some doubt as to whether French courts would recognize and enforce certain civil liabilities under U.S. securities laws in original actions or judgments of U.S. courts based upon these civil liability provisions. In addition, awards of punitive damages in actions brought in the United States or elsewhere may be unenforceable in France.
An award for monetary damages under the U.S. securities laws would be considered punitive if it does not seek to compensate the claimant for loss or damage suffered but is intended to punish the defendant. The enforceability of any judgment in France will depend on the particular facts of the case as well as the laws and treaties in effect at the time. The United States and France do not currently have a treaty providing for recognition and enforcement of judgments (other than arbitration awards) in civil and commercial matters.
The rights of shareholders in companies subject to French corporate law differ in material respects from the rights of shareholders of corporations incorporated in the United States.
We are a French company with limited liability. Our corporate affairs are governed by our by-laws and by the laws governing companies incorporated in France. The rights of shareholders and the responsibilities of members of our board of directors are in many ways different from the rights and obligations of shareholders in companies governed by the laws of U.S. jurisdictions. For example, in the performance of its duties, our board of directors is required by French law to consider the interests of our company, its shareholders, its employees and other stakeholders, rather than solely our shareholders and/or creditors. It is possible that some of these parties will have interests that are different from, or in addition to, your interests as a shareholder.
Item 1B. Unresolved Staff Comments
We do not have any unresolved comments from the SEC staff.
Item 2. Properties
Our headquarters are located in Paris, France, in an approximately 16,000 square meter facility, under a lease agreement expiring on June 14, 2023. In addition, we had 33 regional offices as of December 31, 2016. We currently lease space into data centers to third-party hosting providers for our hosting services for our servers located in California, New York, Virginia, France, Hong Kong,China, Japan and The Netherlands. We believe that our facilities are adequate for our current needs.
Item 3. Legal Proceedings
On June 13, 2016, we filed a complaint in the Central District of California for damages and injunctive relief against SteelHouse, Inc. (“SteelHouse”), alleging Federal False and/or Misleading Advertising, Fraud, Intentional Interference with Prospective Economic Advantage, Libel, Trade Libel, Unfair Competition under California Business & Professions Code § 17200, and False Advertising under California Business & Professions Code § 17500. In the complaint, we alleged that SteelHouse perpetrated a counterfeit click fraud scheme in its business operations, and engaged in false and misleading advertising related to such conduct. On July 1, 2016, we filed a motion for preliminary injunction to enjoin such conduct. On July 25, 2016, SteelHouse filed its Answer and Counterclaims, alleging Federal False and/or Misleading Advertising, False Advertising under California Business
52
& Professions Code § 17500, Unfair Competition under California Business & Professions Code § 17200, Intentional Interference with Contract, and Intentional Interference with Prospective Economic Relations against us. In its counterclaims, SteelHouse alleged that we manufactured click count numbers and interfered with SteelHouse's actual and prospective business relationships. On October 31, 2016, we reached a settlement with SteelHouse to resolve all outstanding claims and counterclaims between us. This proceeding did not have a material adverse effect on our business, financial condition, results of operations or cash flows.
From time to time we may become involved in legal proceedings or be subject to claims arising in the ordinary course of our business. We are not presently a party to any legal proceedings that, if determined adversely to us, would individually or taken together have a material adverse effect on our business, results of operations, financial condition or cash flows. Regardless of the outcome, litigation can have an adverse impact on us because of defense and settlement costs, diversion of management resources and other factors.
Item 4. Mine Safety Disclosures
Not applicable.
53
PART II
Item 5. Market for Registrant's Common Equity, Related Stockholder Matters and Issuer Purchases of Equity Securities
Market Information
The ADSs have been listed on the Nasdaq Global Select Market under the symbol “CRTO” since October 30, 2013. Prior to that date, there was no public trading market for ADSs or our ordinary shares. Our initial public offering was priced at $31.00 per ADS on October 29, 2013. The following table sets forth for the periods indicated the high and low sales prices per ADS as reported on the Nasdaq Global Select Market:
Per ADS | ||||||
High | Low | |||||
2015 | ||||||
First quarter | $ | 46.50 | $ | 37.70 | ||
Second quarter | $ | 51.43 | $ | 39.12 | ||
Third quarter | $ | 57.30 | $ | 28.09 | ||
Fourth quarter | $ | 44.43 | $ | 33.71 | ||
2016 | ||||||
First quarter | $ | 41.50 | $ | 24.23 | ||
Second quarter | $ | 47.81 | $ | 37.75 | ||
Third quarter | $ | 47.09 | $ | 34.29 | ||
Fourth quarter | $ | 44.14 | $ | 32.83 | ||
Holders
As of January 31, 2017, there were 45 holders of record of our ordinary shares and 145 participants in DTC that held our ADSs. The actual number of holders is greater, and includes beneficial owners whose ADSs are held in street name by brokers and other nominees. This number of holders of record and DTC participants also does not include holders whose shares may be held in trust by other entities.
ADS Performance Graph
The following graph shows a comparison from October 30, 2013 (the date our ADSs commenced trading on the Nasdaq Global Select Market) through December 31, 2016 of the cumulative total return for our ADSs, the Russell 2000 Index and the Nasdaq Internet Index. The graph assumes that $100 was invested at the market close on October 30, 2013 in our ADSs, the Russell 2000 Index and the Nasdaq Internet Index and data for the Russell 2000 Index and the Nasdaq Internet Index assumes reinvestments of dividends. The stock price performance of the following graph is not necessarily indicative of future stock price performance.
54
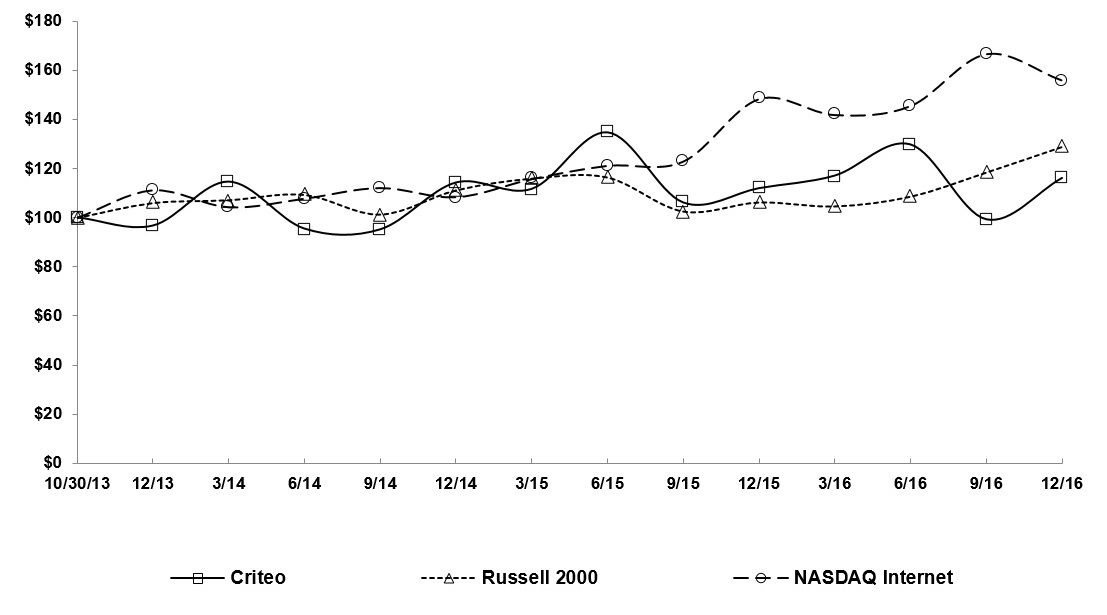
The foregoing performance graph and related information shall not be deemed “soliciting material” or to be “filed” with the SEC, nor shall such information be incorporated by reference into any future filings under the Securities Act or the Exchange Act, except to the extent we specifically incorporate it by reference into such filing.
Dividends
We have never declared or paid any cash dividends on our ordinary shares. We do not anticipate paying cash dividends on our equity securities in the foreseeable future and intend to retain all available funds and any future earnings to fund our growth.
Subject to the requirements of French law and our by-laws, dividends may only be distributed from our statutory retained earnings. Dividend distributions, if any, will be made in euros and converted into U.S. dollars with respect to the ADSs, as provided in the deposit agreement. In addition, under the General RCF, we may not declare, make or pay dividends if our net debt to Adjusted EBITDA leverage ratio exceeds 2.0x.
Securities Authorized for Issuance Under Equity Compensation Plans
The following table provides information as of December 31, 2016 regarding compensation plans under which our equity securities are authorized for issuance.
(a) | (b) | (c) | ||||
Plan Category | Number of securities to be issued upon exercise of outstanding options, warrants and rights | Weighted-average exercise price of outstanding options, warrants and rights(1) | Number of securities remaining available for future issuance under equity compensation plans (excluding securities reflected in column (a)) | |||
Equity compensation plans approved by security holders | 8,391,496 | $26.05(2) | 2,624,795 | |||
Equity compensation plans not approved by security holders | — | — | — | |||
Total | 8,391,496 | $26.05(2) | 2,624,795 | |||
(1) The weighted-average exercise price does not reflect the ordinary shares that will be issued in connection with the vesting of free shares, since free shares have no exercise price.
(2) The weighted-average exercise price was €23.54 and has been converted to U.S. dollars based on the average exchange rate for the year ended December 31, 2016 of €1.00=$1.10683.
55
Exchange Controls & Ownership by Non-French Residents
Under current French foreign exchange control regulations there are no limitations on the amount of cash payments that we may remit to residents of foreign countries. Laws and regulations concerning foreign exchange controls do, however, require that all payments or transfers of funds made by a French resident to a non-resident, such as dividend payments, be handled by an accredited intermediary. All registered banks and substantially all credit institutions in France are accredited intermediaries.
Neither the French Commercial Code nor our by-laws presently impose any restrictions on the right of non-French residents or non-French shareholders to own and vote shares. However, residents outside of France, as well as any French entity controlled by non-French residents, must file an administrative notice with French authorities in connection with their direct and indirect foreign investments in us, including through ownership of ADSs, on the date a binding purchase agreement is executed or a tender offer is made public. Under existing administrative rulings, the following transactions qualify as foreign investments in us:
• | any transaction carried out on our capital by a non-French resident provided that after the transaction the cumulative amount of the capital or the voting rights held by non-French residents exceeds 33.33% of our capital or voting rights; |
• | any transaction mentioned above carried out by a corporation incorporated under French law whose capital or voting rights are held for more than 33.33% by non-French residents; |
• | any transaction carried out abroad resulting in a change of the controlling shareholder of a corporation incorporated under a foreign law that holds a shareholding or voting rights in us if our capital or voting rights are held for more than 33.33% by non-French residents; |
• | loans and guarantees granted by a corporation incorporated under foreign laws to us in amounts evidencing control over our financing; and |
• | patent licenses granted by a corporation incorporated under foreign laws or management or technical assistance agreements with such corporation that place us in a dependent position vis-à-vis such party or its group. |
Violation of this administrative notice requirement is sanctioned by a fine of €750. This amount may be multiplied by five if the violation is made by a legal entity.
Additionally, residents outside of France must file a declaration for statistical purposes with French authorities within twenty working days after the settlement date of certain direct foreign investments in us, including purchases of our ADSs. In particular, such filings are required in connection with investments that exceed €15 million and lead to the acquisition of more than 10% of our outstanding ordinary shares or cross the 10% shareholder ownership threshold. Violation of this filing requirement may be sanctioned by five years of imprisonment and a fine of up to twice the amount of the relevant investment. This amount may be multiplied by five if the violation is made by a legal entity.
56
Taxation
French Tax Consequences
The following describes the material French income tax consequences to U.S. Holders (as defined below) of purchasing, owning and disposing of the ADSs and ordinary shares, or the Securities.
This discussion does not purport to be a complete analysis or listing of all potential tax effects of the acquisition, ownership or disposition of our securities to any particular investor, and does not discuss tax considerations that arise from rules of general application or that are generally assumed to be known by investors. All of the following is subject to change. Such changes could apply retroactively and could affect the consequences described below.
In 2011, France introduced a comprehensive set of new tax rules applicable to French assets that are held by or in foreign trusts. These rules, among other things, provide for the inclusion of trust assets in the settlor’s net assets for purpose of applying the French wealth tax, for the application of French gift and death duties to French assets held in trust, for a specific tax on capital on the French assets of foreign trusts not already subject to the French wealth tax and for a number of French tax reporting and disclosure obligations. The following discussion does not address the French tax consequences applicable to securities held in trusts. If securities are held in trust, the grantor, trustee and beneficiary are urged to consult their own tax adviser regarding the specific tax consequences of acquiring, owning and disposing of securities.
The description of the French income tax and wealth tax consequences set forth below is based on the Convention Between the Government of the United States of America and the Government of the French Republic for the Avoidance of Double Taxation and the Prevention of Fiscal Evasion with Respect to Taxes on Income and Capital of August 31, 1994, or the Treaty, which came into force on December 30, 1995 (as amended by any subsequent protocols, including the protocol of January 13, 2009), and the tax guidelines issued by the French tax authorities in force as of the date of this Form 10-K.
For the purposes of this discussion, the term “U.S. Holder” means a beneficial owner of securities that is (1) an individual who is a U.S. citizen or resident for U.S. federal income tax purposes, (2) a U.S. domestic corporation or certain other entities created or organized in or under the laws of the United States or any state thereof, including the District of Colombia, or (3) otherwise subject to U.S. federal income taxation on a net income basis in respect of securities.
If a partnership holds securities, the tax treatment of a partner generally will depend upon the status of the partner and the activities of the partnership. If a U.S. Holder is a partner in a partnership that holds securities, such holder is urged to consult its own tax adviser regarding the specific tax consequences of acquiring, owning and disposing of securities.
This discussion applies only to investors that hold our securities as capital assets that have the U.S. dollar as their functional currency, that are entitled to Treaty benefits under the “Limitation on Benefits” provision contained in the Treaty, and whose ownership of the securities is not effectively connected to a permanent establishment or a fixed base in France.
Certain U.S. Holders (including, but not limited to, U.S. expatriates, partnerships or other entities classified as partnerships for U.S. federal income tax purposes, banks, insurance companies, regulated investment companies, tax-exempt organizations, financial institutions, persons subject to the alternative minimum tax, persons who acquired the securities pursuant to the exercise of employee share options or otherwise as compensation, persons that own (directly, indirectly or by attribution) 5% or more of our voting stock or 5% or more of our outstanding share capital, dealers in securities or currencies, persons that elect to mark their securities to market for U.S. federal income tax purposes and persons holding securities as a position in a synthetic security, straddle or conversion transaction) may be subject to special rules not discussed below.
57
U.S. Holders are urged to consult their own tax advisers regarding the tax consequences of the purchase, ownership and disposition of securities in light of their particular circumstances, especially with regard to the “Limitations on Benefits” provision.
Estate and Gift Taxes and Transfer Taxes
In general, a transfer of securities by gift or by reason of death of a U.S. Holder that would otherwise be subject to French gift or inheritance tax, respectively, will not be subject to such French tax by reason of the Convention between the Government of the United States and the Government of the French Republic for the Avoidance of Double Taxation and the Prevention of Fiscal Evasion with Respect to Taxes on Estates, Inheritances and Gifts, dated November 24, 1978, unless the donor or the transferor is domiciled in France at the time of making the gift or at the time of his or her death, or the securities were used in, or held for use in, the conduct of a business through a permanent establishment or a fixed base in France.
Pursuant to Article 235 ter ZD of the Code général des impôts (French Tax Code, or FTC), purchases of shares or ADSs of a French company listed on a regulated market of the European Union or an exchange formally acknowledged by the French Financial Market Authority (AMF) are subject to a 0.3% French tax on financial transactions provided that the issuer’s market capitalization exceeds €1 billion as of December 1 of the year preceding the taxation year.
A list of companies whose market capitalization exceeds €1 billion as of December 1 of the year preceding the taxation year within the meaning of Article 235 ter ZD of the French Tax Code used to be published annually by the French Ministry of Economy. It is now published by the French tax authorities, and could be amended at any time. Pursuant to Regulations BOI‑ANNX‑000467‑20161220 issued on December 20, 2016, Criteo is currently not included in such list. Please note that such list may be updated from time to time, or may not be published anymore in the future.
Furthermore, Nasdaq is not currently acknowledged by the French AMF but this may change in the future.
Consequently, Criteo’s securities should not fall within the scope of the tax on financial transactions described above. In the future, purchases of Criteo’s securities may become subject to such tax if Nasdaq is acknowledged by the French AMF.
In the case where Article 235 ter ZD of the FTC is not applicable, (i) transfers of shares issued by a listed French company are subject to uncapped registration duties at the rate of 0.1% if the transfer is evidenced by a written statement (“acte”) executed either in France or outside France, whereas (ii) transfers of shares which are not listed are subject to uncapped registration duties at the rate of 0.1% notwithstanding the existence of a written statement (“acte”). As ordinary shares of Criteo are not listed, their transfer is subject to uncapped registration duties at the rate of 0.1% notwithstanding the existence of a written agreement (“acte”).
Although the official guidelines published by the French tax authorities are silent on this point, ADSs should remain outside of the scope of the aforementioned 0.1% registration duties.
Wealth Tax
The French wealth tax (impôt de solidarité sur la fortune) applies only to individuals and does not generally apply to securities held by a U.S. resident, as defined pursuant to the provisions of the Treaty, provided that such U.S. Holder does not own directly or indirectly more than 25% of the issuer’s financial rights.
58
Taxation of Dividends
Dividends paid by a French corporation to non-residents of France are generally subject to French withholding tax at a rate of 30%. Dividends paid by a French corporation in a non-cooperative State or territory, as defined in Article 238-0 A of the FTC, will generally be subject to French withholding tax at a rate of 75%. However, eligible U.S. Holders entitled to Treaty benefits under the “Limitation on Benefits” provision contained in the Treaty who are U.S. residents, as defined pursuant to the provisions of the Treaty, will not be subject to this 30% or 75% withholding tax rate, but may be subject to the withholding tax at a reduced rate (as described below).
Under the Treaty, the rate of French withholding tax on dividends paid to an eligible U.S. Holder who is a U.S. resident as defined pursuant to the provisions of the Treaty and whose ownership of the ordinary shares or ADSs is not effectively connected with a permanent establishment or fixed base that such U.S. Holder has in France, is generally reduced to 15%, or to 5% if such U.S. Holder is a corporation and owns directly or indirectly at least 10% of the share capital of the issuer; such U.S. Holder may claim a refund from the French tax authorities of the amount withheld in excess of the Treaty rates of 15% or 5%, if any.
For U.S. Holders that are not individuals but are U.S. residents, as defined pursuant to the provisions of the Treaty, the requirements for eligibility for Treaty benefits, including the reduced 5% or 15% withholding tax rates contained in the “Limitation on Benefits” provision of the Treaty, are complicated, and certain technical changes were made to these requirements by the protocol of January 13, 2009. U.S. Holders are advised to consult their own tax advisers regarding their eligibility for Treaty benefits in light of their own particular circumstances.
Dividends paid to an eligible U.S. Holder may immediately be subject to the reduced rates of 5% or 15% provided that such holder establishes before the date of payment that it is a U.S. resident under the Treaty by completing and providing the depositary with a treaty form (Form 5000).
Dividends paid to a U.S. Holder that has not filed the Form 5000 before the dividend payment date will be subject to French withholding tax at the rate of 30%, or 75% if paid in a non-cooperative State or territory (as defined in Article 238-0 A of the FTC), and then reduced at a later date to 5% or 15%, provided that such holder duly completes and provides the French tax authorities with the treaty forms Form 5000 and Form 5001 before December 31 of the second calendar year following the year during which the dividend is paid. Certain qualifying pension funds and certain other tax-exempt entities are subject to the same general filing requirements as other U.S. Holders except that they may have to supply additional documentation evidencing their entitlement to these benefits.
Form 5000 and Form 5001, together with instructions, will be provided by the depositary to all U.S. Holders registered with the depositary. The depositary will arrange for the filing with the French Tax authorities of all such forms properly completed and executed by U.S. Holders of ordinary shares or ADSs and returned to the depositary in sufficient time so that they may be filed with the French tax authorities before the distribution in order to obtain immediately a reduced withholding tax rate.
The withholding tax refund, if any, ordinarily occurs within 12 months from filing the applicable French Treasury Form, but not before January 15 of the year following the calendar year in which the related dividend was paid.
Tax on Sale or Other Disposition
In general, under the Treaty, a U.S. Holder who is a U.S. resident for purposes of the Treaty will not be subject to French tax on any capital gain from the redemption (other than redemption proceeds characterized as dividends under French domestic tax law or administrative guidelines), sale or exchange of ordinary shares or ADSs unless the ordinary shares or the ADSs form part of the business property of a permanent establishment or fixed base that the U.S. Holder has in France. Special rules apply to U.S. Holders who are residents of more than one country.
59
Recent Sales of Unregistered Securities; Use of Proceeds From Registered Securities
There were no unregistered sales of equity securities during 2016.
Issuer Purchases of Equity Securities
None.
60
Item 6. Selected Financial Data
Our audited consolidated financial statements have been prepared in accordance with U.S. GAAP. We derived the selected consolidated statements of income data for the years ended December 31, 2014, 2015 and 2016 and selected consolidated statements of financial position data as of December 31, 2015 and 2016 from our audited consolidated financial statements included in Part IV, Item 15 “Exhibits and Financial Statements” of this Form 10-K. The selected consolidated statements of income data for the years ended December 31, 2012 and 2013 and the selected consolidated financial position data as of December 31, 2012, 2013 and 2014 have been derived from our audited consolidated financial statements and notes thereto which are not included in this Form 10-K. This data should be read together with Part II, Item 7, “Management’s Discussion and Analysis of Financial Condition and Results of Operations” as well as our audited consolidated financial statements and notes thereto appearing elsewhere in this Form 10-K. Our historical results are not necessarily indicative of the results to be expected in the future.
Consolidated Statements of Income Data:
Year Ended December 31, | |||||||||||||||||||
2012 | 2013 | 2014 | 2015 | 2016 | |||||||||||||||
(in thousands, except share and per share data) | |||||||||||||||||||
Revenue | $ | 349,209 | $ | 589,418 | $ | 988,249 | $ | 1,323,169 | $ | 1,799,146 | |||||||||
Cost of revenue (1): | |||||||||||||||||||
Traffic acquisition costs | (202,581 | ) | (351,759 | ) | (585,492 | ) | (789,152 | ) | (1,068,911 | ) | |||||||||
Other cost of revenue | (16,265 | ) | (29,150 | ) | (47,948 | ) | (62,201 | ) | (85,260 | ) | |||||||||
Gross profit | 130,363 | 208,509 | 354,809 | 471,816 | 644,975 | ||||||||||||||
Operating expenses | |||||||||||||||||||
Research and development expenses (1) | (18,351 | ) | (42,716 | ) | (60,075 | ) | (86,807 | ) | (123,649 | ) | |||||||||
Sales and operations expenses (1) | (74,563 | ) | (109,953 | ) | (176,927 | ) | (229,530 | ) | (282,853 | ) | |||||||||
General and administrative expenses (1) | (25,959 | ) | (41,681 | ) | (64,723 | ) | (79,145 | ) | (117,469 | ) | |||||||||
Total operating expenses | (118,873 | ) | (194,350 | ) | (301,725 | ) | (395,482 | ) | (523,971 | ) | |||||||||
Income from operations | 11,490 | 14,159 | 53,084 | 76,334 | 121,004 | ||||||||||||||
Financial income (expense) | (2,002 | ) | (9,117 | ) | 11,390 | (4,541 | ) | (546 | ) | ||||||||||
Income before taxes | 9,488 | 5,042 | 64,474 | 71,793 | 120,458 | ||||||||||||||
Provision for income taxes | (8,422 | ) | (3,203 | ) | (17,578 | ) | (9,517 | ) | (33,129 | ) | |||||||||
Net income | $ | 1,066 | $ | 1,839 | $ | 46,896 | $ | 62,276 | $ | 87,329 | |||||||||
Net income available to shareholders of Criteo S.A. (2) | $ | 1,260 | $ | 1,404 | $ | 45,556 | $ | 59,553 | $ | 82,272 | |||||||||
Net income available to shareholders per share: | |||||||||||||||||||
Basic | $ | 0.03 | $ | 0.03 | $ | 0.77 | $ | 0.96 | $ | 1.30 | |||||||||
Diluted | $ | 0.03 | $ | 0.03 | $ | 0.72 | $ | 0.91 | $ | 1.25 | |||||||||
Weighted average shares outstanding used in computing per share amounts: | |||||||||||||||||||
Basic | 45,143,188 | 48,692,148 | 58,928,563 | 61,835,499 | 63,337,792 | ||||||||||||||
Diluted | 48,586,666 | 53,748,108 | 63,493,260 | 65,096,486 | 65,633,470 | ||||||||||||||
(1) Cost of revenue and operating expenses include equity awards compensation expense, pension service costs, depreciation and amortization expense, acquisition-related costs and deferred price consideration as follows:
61
Year Ended December 31, | |||||||||||||||||||
2012 | 2013 | 2014 | 2015 | 2016 | |||||||||||||||
(in thousands) | |||||||||||||||||||
Equity awards compensation expense | |||||||||||||||||||
Research and development expenses | $ | 551 | $ | 2,721 | $ | 3,682 | $ | 6,520 | $ | 12,108 | |||||||||
Sales and operations expenses | 2,313 | 3,719 | 12,291 | 11,678 | 16,838 | ||||||||||||||
General and administrative expenses | 1,705 | 2,690 | 3,628 | 5,791 | 14,313 | ||||||||||||||
Total equity awards compensation expense | 4,569 | 9,130 | 19,601 | 23,989 | 43,259 | ||||||||||||||
Pension service costs | |||||||||||||||||||
Research and development expenses | — | 145 | 167 | 163 | 211 | ||||||||||||||
Sales and operations expenses | — | 139 | 187 | 153 | 144 | ||||||||||||||
General and administrative expenses | 141 | 100 | 150 | 125 | 169 | ||||||||||||||
Total pension service costs (a) | 141 | 384 | 504 | 441 | 524 | ||||||||||||||
Depreciation and amortization expense | |||||||||||||||||||
Cost of revenue | 4,686 | 10,417 | 21,455 | 29,866 | 38,469 | ||||||||||||||
Research and development expenses (b) | 213 | 1,215 | 4,949 | 7,995 | 7,211 | ||||||||||||||
Sales and operations expenses | 1,088 | 2,379 | 3,664 | 5,178 | 7,757 | ||||||||||||||
General and administrative expenses | 138 | 752 | 1,145 | 1,526 | 3,342 | ||||||||||||||
Total depreciation and amortization expense | 6,125 | 14,763 | 31,213 | 44,565 | 56,779 | ||||||||||||||
Acquisition-related costs | |||||||||||||||||||
General and administrative expenses | — | — | — | — | 2,921 | ||||||||||||||
Total acquisition-related costs | — | — | — | — | 2,921 | ||||||||||||||
Acquisition-related deferred price consideration | |||||||||||||||||||
Research and development expense | — | 3,137 | 950 | 324 | 85 | ||||||||||||||
Sales and operations expenses | — | — | — | — | — | ||||||||||||||
General and administrative expenses | — | — | — | (2,218 | ) | — | |||||||||||||
Total acquisition-related deferred price considerations | $ | — | $ | 3,137 | $ | 950 | $ | (1,894 | ) | $ | 85 | ||||||||
(a) Effective January 1, 2012, actuarial gains and losses are recognized in other comprehensive income.
(b) Includes acquisition-related amortization of intangible assets of $3.9 million, $6.3 million and $4.1 million as of December 31, 2014, 2015 and 2016 respectively.
(2) For the years ended December 31, 2013, 2014, 2015 and 2016, this excludes $0.4 million, $1.3 million, $2.7 million and $5.1 million, respectively, of net income available to non-controlling interests in our Japanese subsidiary held by Yahoo! Japan.
62
Reconciliation from Non-GAAP Operating Expenses to Operating Expenses under GAAP:
Year Ended December 31, | |||||||||||||||||||
2012 | 2013 | 2014 | 2015 | 2016 | |||||||||||||||
(in thousands) | |||||||||||||||||||
Research and development expenses | $ | (18,351 | ) | $ | (42,716 | ) | $ | (60,075 | ) | $ | (86,807 | ) | $ | (123,649 | ) | ||||
Equity awards compensation expense | 551 | 2,721 | 3,682 | 6,520 | 12,108 | ||||||||||||||
Depreciation and amortization expense | 213 | 1,215 | 4,949 | 7,995 | 7,211 | ||||||||||||||
Pension service costs | — | 145 | 167 | 163 | 211 | ||||||||||||||
Acquisition-related deferred price consideration | — | 3,137 | 950 | 324 | 85 | ||||||||||||||
Non-GAAP - Research and development expenses | $ | (17,587 | ) | $ | (35,498 | ) | $ | (50,327 | ) | $ | (71,805 | ) | $ | (104,034 | ) | ||||
Sales and operations expenses | (74,563 | ) | (109,953 | ) | (176,927 | ) | (229,530 | ) | (282,853 | ) | |||||||||
Equity awards compensation expense | 2,313 | 3,719 | 12,291 | 11,678 | 16,838 | ||||||||||||||
Depreciation and amortization expense | 1,088 | 2,379 | 3,664 | 5,178 | 7,757 | ||||||||||||||
Pension service costs | — | 139 | 187 | 153 | 144 | ||||||||||||||
Non-GAAP - Sales and operations expenses | (71,162 | ) | (103,716 | ) | (160,785 | ) | (212,521 | ) | (258,114 | ) | |||||||||
General and administrative expenses | (25,959 | ) | (41,681 | ) | (64,723 | ) | (79,145 | ) | (117,469 | ) | |||||||||
Equity awards compensation expense | 1,705 | 2,690 | 3,628 | 5,791 | 14,313 | ||||||||||||||
Depreciation and amortization expense | 138 | 752 | 1,145 | 1,526 | 3,342 | ||||||||||||||
Pension service costs | 141 | 100 | 150 | 125 | 169 | ||||||||||||||
Acquisition-related costs | — | — | — | — | 2,921 | ||||||||||||||
Acquisition-related deferred price consideration | — | — | — | (2,218 | ) | — | |||||||||||||
Non-GAAP - General and administrative expenses | (23,975 | ) | (38,139 | ) | (59,800 | ) | (73,921 | ) | (96,724 | ) | |||||||||
Total Operating expenses | (118,873 | ) | (194,350 | ) | (301,725 | ) | (395,482 | ) | (523,971 | ) | |||||||||
Equity awards compensation expense | 4,569 | 9,130 | 19,601 | 23,989 | 43,259 | ||||||||||||||
Depreciation and Amortization expense | 1,439 | 4,346 | 9,758 | 14,699 | 18,310 | ||||||||||||||
Pension service costs | 141 | 384 | 504 | 441 | 524 | ||||||||||||||
Acquisition-related costs | — | — | — | — | 2,921 | ||||||||||||||
Acquisition-related deferred price consideration | — | 3,137 | 950 | (1,894 | ) | 85 | |||||||||||||
Total Non-GAAP Operating expenses | $ | (112,724 | ) | $ | (177,353 | ) | $ | (270,912 | ) | $ | (358,247 | ) | $ | (458,872 | ) | ||||
Non-GAAP Operating Expenses are our consolidated operating expenses adjusted to eliminate the impact of depreciation and amortization, equity awards compensation expense, pension service costs, acquisition-related costs and deferred price consideration. We believe Non-GAAP Operating Expenses reflects our ongoing operating expenses in a manner that allows for meaningful period-to-period comparisons and analysis of trends in our business. As a result, we believe that Non-GAAP Operating Expenses provides useful information to investors in understanding and evaluating our core operating performance and trends in the same manner as our management and in comparing financial results across periods. In addition, Non-GAAP Operating Expenses is a key component in calculating Adjusted EBITDA, which is one of the key measures we use to provide its quarterly and annual business outlook to the investment community.
63
Consolidated Statements of Financial Position Data:
Year Ended December 31, | |||||||||||||||||||
2012 | 2013 | 2014 | 2015 | 2016 | |||||||||||||||
(in thousands) | |||||||||||||||||||
Cash and cash equivalents | $ | 57,078 | $ | 323,182 | $ | 351,827 | $ | 353,537 | $ | 270,317 | |||||||||
Total assets | $ | 180,926 | $ | 539,380 | $ | 686,510 | $ | 841,719 | $ | 1,211,186 | |||||||||
Trade receivables, net of allowances for doubtful accounts | $ | 80,067 | $ | 120,868 | $ | 192,595 | $ | 261,581 | $ | 397,244 | |||||||||
Total financial liabilities | $ | 8,250 | $ | 15,605 | $ | 14,780 | $ | 10,428 | $ | 85,580 | |||||||||
Total liabilities | $ | 101,183 | $ | 173,819 | $ | 270,155 | $ | 362,696 | $ | 601,309 | |||||||||
Total equity | $ | 79,741 | $ | 365,561 | $ | 416,355 | $ | 479,023 | $ | 609,877 | |||||||||
Other Financial and Operating Data:
Year Ended December 31, | |||||||||||||||||||
2012 | 2013 | 2014 | 2015 | 2016 | |||||||||||||||
(in thousands, except number of clients) | |||||||||||||||||||
Number of clients | 3,297 | 5,072 | 7,190 | 10,198 | 14,468 | ||||||||||||||
Revenue ex-TAC (3) | $ | 146,628 | $ | 237,659 | $ | 402,757 | $ | 534,017 | $ | 730,235 | |||||||||
Adjusted net income (4) | $ | 5,635 | $ | 14,472 | $ | 70,846 | $ | 89,835 | $ | 136,777 | |||||||||
Adjusted EBITDA (5) | $ | 22,325 | $ | 41,573 | $ | 105,352 | $ | 143,435 | $ | 224,572 | |||||||||
(3) We define Revenue ex-TAC (Traffic Acquisition Costs) as our revenue excluding traffic acquisition costs, or TAC, generated over the applicable measurement period. Revenue ex-TAC is not a measure calculated in accordance with U.S. GAAP. We have included Revenue ex-TAC in this Form 10-K because it is a key measure used by our management and board of directors to evaluate operating performance and generate future operating plans. In particular, we believe that the elimination of TAC from revenue can provide a useful measure for period-to-period comparisons of our core business. Accordingly, we believe that Revenue ex-TAC provides useful information to investors and others in understanding and evaluating our results of operations in the same manner as our management and board of directors. Our use of Revenue ex-TAC has limitations as an analytical tool, and you should not consider it in isolation or as a substitute for analysis of our financial results as reported under U.S. GAAP. Some of these limitations are: (a) other companies, including companies in our industry which have similar business arrangements, may address the impact of TAC differently; and (b) other companies may report Revenue ex-TAC or similarly titled measures but calculate them differently, which reduces their usefulness as a comparative measure. Because of these and other limitations, you should consider Revenue ex-TAC alongside our other U.S. GAAP financial results, including revenue . The following table presents a reconciliation of Revenue ex-TAC to revenue, the most directly comparable U.S. GAAP measure, for each of the periods indicated:
Year Ended December 31, | |||||||||||||||||||
2012 | 2013 | 2014 | 2015 | 2016 | |||||||||||||||
(in thousands) | |||||||||||||||||||
Revenue | $ | 349,209 | $ | 589,418 | $ | 988,249 | $ | 1,323,169 | $ | 1,799,146 | |||||||||
Adjustment: | |||||||||||||||||||
Traffic acquisition costs | (202,581 | ) | (351,759 | ) | (585,492 | ) | (789,152 | ) | (1,068,911 | ) | |||||||||
Revenue ex-TAC | $ | 146,628 | $ | 237,659 | $ | 402,757 | $ | 534,017 | $ | 730,235 | |||||||||
64
(4) We define Adjusted Net Income as our net income adjusted to eliminate the impact of equity awards compensation expense, amortization of acquisition-related intangible assets, acquisition-related costs and deferred price consideration and the tax impact of the foregoing adjustments. Adjusted Net Income is not a measure calculated in accordance with U.S. GAAP. We have included Adjusted Net Income in this Form 10-K because it is a key measure used by our management and board of directors to evaluate operating performance, generate future operating plans and make strategic decisions regarding the allocation of capital. In particular, we believe that the elimination of equity awards compensation expense, amortization of acquisition-related intangible assets, acquisition-related costs and deferred price consideration and the tax impact of the foregoing adjustments in calculating Adjusted Net Income can provide a useful measure for period-to-period comparisons of our core business. Accordingly, we believe that Adjusted Net Income provides useful information to investors and others in understanding and evaluating our results of operations in the same manner as our management and board of directors. Our use of Adjusted Net Income has limitations as an analytical tool, and you should not consider it in isolation or as a substitute for analysis of our financial results as reported under U.S. GAAP. Some of these limitations are: (a) Adjusted Net Income does not reflect the potentially dilutive impact of equity-based compensation or the impact of certain acquisition related costs; and (b) other companies, including companies in our industry, may calculate Adjusted Net Income or similarly titled measures differently, which reduces their usefulness as a comparative measure. Because of these and other limitations, you should consider Adjusted Net Income alongside our other U.S. GAAP financial results, including net income. The following table presents a reconciliation of Adjusted Net Income to net income, the most directly comparable U.S. GAAP measure, for each of the periods indicated:
Year Ended December 31, | |||||||||||||||||||
2012 | 2013 | 2014 | 2015 | 2016 | |||||||||||||||
(in thousands) | |||||||||||||||||||
Net income | $ | 1,066 | $ | 1,839 | $ | 46,896 | $ | 62,276 | $ | 87,329 | |||||||||
Adjustments: | |||||||||||||||||||
Equity awards compensation expense | 4,569 | 9,130 | 19,601 | 23,989 | 43,259 | ||||||||||||||
Amortization of acquisition-related intangible assets | — | 464 | 3,902 | 6,342 | 4,131 | ||||||||||||||
Acquisition-related costs | — | — | — | — | 2,921 | ||||||||||||||
Acquisition-related deferred price consideration | — | 3,137 | 950 | (1,894 | ) | 85 | |||||||||||||
Tax impact of the above adjustments | — | (98 | ) | (503 | ) | (878 | ) | (948 | ) | ||||||||||
Adjusted net income | $ | 5,635 | $ | 14,472 | $ | 70,846 | $ | 89,835 | $ | 136,777 | |||||||||
(5) We define Adjusted EBITDA as our consolidated earnings before financial income (expense), income taxes, depreciation and amortization, adjusted to eliminate the impact of equity awards compensation expense, pension service costs, acquisition-related costs and deferred price consideration. Adjusted EBITDA is not a measure calculated in accordance with U.S. GAAP. We have included Adjusted EBITDA in this Form 10-K because it is a key measure used by our management and board of directors to evaluate operating performance, generate future operating plans and make strategic decisions regarding the allocation of capital. In particular, we believe that the elimination of equity awards compensation expense, pension service costs, acquisition-related costs and deferred price consideration in calculating Adjusted EBITDA can provide a useful measure for period-to-period comparisons of our core business. Accordingly, we believe that Adjusted EBITDA provides useful information to investors and others in understanding and evaluating our results of operations in the same manner as our management and board of directors. Our use of Adjusted EBITDA has limitations as an analytical tool, and you should not consider it in isolation or as a substitute for analysis of our financial results as reported under U.S. GAAP. Some of these limitations are: (a) although depreciation and amortization are non-cash charges, the assets being depreciated and amortized may have to be replaced in the future, and Adjusted EBITDA does not reflect cash capital expenditure requirements for such replacements or for new capital expenditure requirements; (b) Adjusted EBITDA does not reflect changes in, or cash requirements for, our working capital needs; (c) Adjusted EBITDA does not reflect the potentially dilutive impact of equity-based compensation; (d) Adjusted EBITDA does not reflect tax payments that may represent a reduction in cash available to us; and (e) other companies, including companies in our industry, may calculate Adjusted EBITDA or similarly titled measures differently, which reduces their usefulness as a comparative measure. Because of these and other limitations, you should consider Adjusted EBITDA alongside our other U.S. GAAP financial results, including net income. The following table presents a reconciliation of Adjusted EBITDA to net income, the most directly comparable U.S. GAAP measure, for each of the periods indicated:
Year Ended December 31, | |||||||||||||||||||
2012 | 2013 | 2014 | 2015 | 2016 | |||||||||||||||
(in thousands) | |||||||||||||||||||
Net income | $ | 1,066 | $ | 1,839 | $ | 46,896 | $ | 62,276 | $ | 87,329 | |||||||||
Adjustments: | |||||||||||||||||||
Financial expense (income) | 2,002 | 9,117 | (11,390 | ) | 4,541 | 546 | |||||||||||||
Provision for income taxes | 8,422 | 3,203 | 17,578 | 9,517 | 33,129 | ||||||||||||||
Equity awards compensation expense | 4,569 | 9,130 | 19,601 | 23,989 | 43,259 | ||||||||||||||
Pension service costs (a) | 141 | 384 | 504 | 441 | 524 | ||||||||||||||
Depreciation and amortization expense | 6,125 | 14,763 | 31,213 | 44,565 | 56,779 | ||||||||||||||
Acquisition-related costs | — | — | — | — | 2,921 | ||||||||||||||
Acquisition-related deferred price consideration | — | 3,137 | 950 | (1,894 | ) | 85 | |||||||||||||
Total net adjustments | 21,259 | 39,734 | 58,456 | 81,159 | 137,243 | ||||||||||||||
Adjusted EBITDA | $ | 22,325 | $ | 41,573 | $ | 105,352 | $ | 143,435 | $ | 224,572 | |||||||||
(a) | Effective January 1, 2012, actuarial gains and losses are recognized in other comprehensive income. |
65
Item 7. Management's Discussion and Analysis of Financial Condition and Results of Operations
The following discussion and analysis of our financial condition and results of operations should be read in conjunction with our consolidated financial statements and related notes appearing elsewhere in this Form 10-K.
Overview
We are a global technology company specializing in digital performance marketing. We strive to deliver post-click sales at scale to advertisers across multiple digital marketing channels and according to the client's targeted return on investment. We use our proprietary machine-learning algorithms, coupled with large volumes of granular shopping intent data and deep insights into consumer intent and purchasing habits, to price and deliver in real time highly relevant and personalized digital performance advertisements to consumers. By measuring the value we deliver on a post-click sales basis, we make the return on investment transparent and easy to measure for our advertiser clients.
We partner with our clients to capture activity on their digital properties and optimize the performance of their advertisements based on that activity and other data. Demonstrating the depth and scale of our data, we collected data on over $550 billion in sales transactions1 on our clients' digital properties in the year ended December 31, 2016, whether or not a consumer saw or clicked on an advertisement displayed by Criteo. Based on this data and our other assets, we delivered targeted advertisements that generated approximately 7.4 billion clicks1 in the year ended December 31, 2016. Based on these clicks, our clients generated approximately $25 billion in post-click sales1 during this period. We believe post-click sales is a key performance indicator that our clients use to measure the effectiveness of our solution in driving sales and the return on their marketing spend with us.
As of December 31, 2016, we had over 14,000 clients and in each of the last three years our average client retention rate, as measured on a quarterly basis, was approximately 90%. We serve a wide range of clients and our revenue is not concentrated within any single client or group of clients. In 2014, 2015 and 2016, our largest client represented 2.9%, 1.9% and 2.0% of our revenue, respectively, and in 2016, our largest 10 clients represented 11.8% of our revenue in the aggregate. There is no group of customers under common control or customers that are affiliates of each other constituting an aggregate amount equal to 10% or more of our consolidated revenues, the loss of which would have a material adverse effect on the Company.
Our performance marketing product portfolio is currently comprised of three products: Criteo Dynamic Retargeting, Criteo Predictive Search and Criteo Sponsored Products. In early 2017, we ceased offering Criteo Dynamic Email to clients. All products leverage the same core technology in the Criteo Engine, which is comprised of four key components: Universal Match, Product Recommendations, Predictive Bidding and Kinetic Design.
We operate in 91 countries through a network of more than 30 international offices located in Europe, the Americas and Asia-Pacific. As a result of our significant international operations, our revenue from outside of France, our home country, accounted for 92.7% of our revenue for year ended December 31, 2016.
___________________________________________________
1 Based on Criteo Dynamic Retargeting.
66
The Company's foreign currency risk exposure to the Sterling pound, the Japanese yen, the Brazilian real and the U.S dollar against the euro (the euro still remains the Group's functional currency) is described in Note 3 to our audited consolidated financial statements included elsewhere in this Form 10-K.
Our financial results include:
• | revenue increased from $988.2 million for 2014 to $1,323.2 million for 2015 and $1,799.1 million for 2016; |
• | revenue excluding traffic acquisition costs, which we refer to as Revenue ex-TAC, which is a non-U.S. GAAP financial measure, increased from $402.8 million for 2014 to $534.0 million for 2015 and $730.2 million for 2016; |
• | net income was $46.9 million for 2014, $62.3 million for 2015 and $87.3 million for 2016; and |
• | Adjusted EBITDA, which is a non-U.S. GAAP financial measure, increased from $105.4 million for 2014 to $143.4 million for 2015 and $224.6 million for 2016. |
Please see footnotes 3 and 5 to the Other Financial and Operating Data table in “Item 6. Selected Financial Data” in this Form 10-K for a reconciliation of Revenue ex-TAC to revenue and Adjusted EBITDA to net income, the most directly comparable financial measures calculated and presented in accordance with U.S. GAAP.
We are focused on maximizing Revenue ex-TAC. We believe this focus builds sustainable long-term value for our business and fortifies a number of our competitive strengths, including a highly liquid marketplace for display advertising. As part of this focus, we seek to maximize our percentage of overall marketing spend in the internet display advertising market over the long-term. In addition, this focus enriches liquidity for both advertisers and publishers resulting in more effective advertising for the advertiser, better monetization for the publisher and more relevant advertisements for the user. We believe our results of operations reflect this focus.
Acquisitions
On November 9, 2016, we completed the acquisition of all of the outstanding shares of Hooklogic, a New York-based company connecting many of the world's largest e-commerce retailers with consumer brand manufacturers. We now offer HookLogic's products under the "Criteo Sponsored Products" name. Please refer to Note 2 to our audited consolidated financial statements included elsewhere in this Form 10-K for further details.
On May 31, 2016, we acquired all of the outstanding shares of Monsieur Drive, a Paris-based company building advertising products for the consumer packaged goods vertical. Please refer to Note 2 to our audited consolidated financial statements included elsewhere in this Form 10-K for further details.
In February 2015, we acquired DataPop, a Los Angeles-based company specializing in the optimization of shopping campaigns on large search engines. We launched Criteo Predictive Search in October 2016.
In April 2014, we completed the acquisition of AdQuantic, a bidding technology company headquartered in Paris. Through the acquisition of AdQuantic, we added a team of seven experts in bidding technology, reinforcing our focus on research and development.
In February 2014, we acquired Tedemis, a provider of real-time personalized e-mail marketing solutions that help advertisers turn web visitors into customers. With the addition of Tedemis, we extended our digital performance marketing solution to a new marketing channel.
67
Transition to U.S. GAAP and Change in Reporting Currency
As of June 30, 2015, we no longer met the requirements to qualify as a foreign private issuer under the Exchange Act. As a result, we began reporting as a domestic registrant as of January 1, 2016 and we are required under current SEC rules to prepare our financial statements in accordance with U.S. GAAP, rather than IFRS, and to present our financial information in U.S. dollars instead of euros. The transition from consolidated financial statements under IFRS to U.S. GAAP only impacted the presentation of our consolidated statement of financial position (order of liquidity) and of our consolidated statement of cash flows (effect of exchange rate changes on cash and cash equivalents). The functional currency of the Company remains the euro, while our reporting currency changed from the euro to the U.S. dollar. Consequently, since we incur portions of our expenses and derive revenues in currencies other than the euro, we are exposed to foreign currency exchange risk as our results of operations and cash flows are subject to fluctuations in foreign currency exchange rates. Foreign exchange risk exposure also arises from intra-company transactions and financing with subsidiaries that have a functional currency different than the euro.
The statements of financial position of consolidated entities having a functional currency different from the U.S. dollar are translated into U.S. dollars at the closing exchange rate (spot exchange rate at the statement of financial position date) and the statements of income, statements of comprehensive income and statements of cash flow of such consolidated entities are translated at the average period to date exchange rate. The resulting translation adjustments are included in equity under the caption “accumulated other comprehensive income” in the consolidated statements of changes in equity.
A. | Operating Results. |
Basis of Presentation
The key elements of our results of operations include:
Revenue
We sell internet display advertisements featuring product-level recommendations either directly to clients or to advertising agencies, which we collectively refer to as our clients. We generate revenue generally when a user clicks on a banner advertisement of one of our advertiser clients. While accessing publishers’ supply of inventory in sufficient quantity and quality is a critical requirement for us to successfully conduct our business, we do not generate any revenue directly from our relationships with publishers. In the specific case of Criteo Predictive Search, we do not not price our service on a CPC basis and get paid a percentage of sales generated by a client's Google Shopping campaigns, which means we only get paid for completed sales.
We recognize revenue from the delivery of display advertisements in the period in which the display advertisements are delivered. Specifically, we recognize revenue for display ad delivery through our solution once the consumer clicks on the personalized banner displayed by us on the client’s website for CPC ad campaigns. For CPC ad campaigns, sales are valued at the fair value of the amount received. Rebates and discounts granted to clients, along with free or extended advertising campaigns, are recorded as a deduction from revenue. Essentially all of our revenue in each of 2014, 2015 and 2016 was derived from advertising campaigns sold on a CPC basis. In the specific case of Criteo Predictive Search, we recognize revenue when users exposed to the Google Shopping campaigns of our clients generate a sale on the digital property of our clients after clicking on the shopping advertisements displayed on Google. Our revenue for Criteo Predictive Search is a percentage of the sales generated by a client's Google Shopping campaigns, which means we only get paid for completed sales. In the specific case of Criteo Sponsored Products, we generally act as principal and as a result, we report revenue earned and costs incurred related to these transactions on a gross basis. When we do not (i) set the price, (ii) select the publisher site the advertisement is placed on, (iii) take responsibility for the acceptability of the service and (iv) bear the credit risk, we report revenue earned and costs incurred related to these transactions on a net basis.
68
We sell performance-based campaigns to clients generally through insertion orders that are cancellable upon short notice and without penalty. We generally bill our clients on a monthly basis for each campaign run during the prior month. The monthly fee is based on the campaign’s various real-time CPCs for that month multiplied by the number of clicks generated by users for that month for such CPCs.
As we further expand our geographic footprint, acquire new clients and grow our business with existing clients in all markets, develop new products, and expand our business into new marketing channels and industry verticals, we expect our revenue to continue to increase.
Cost of Revenue
Our cost of revenue primarily includes traffic acquisition costs and other cost of revenue.
Traffic Acquisition Costs. Traffic acquisition costs consist primarily of purchases of impressions from publishers on a CPM basis. We purchase impressions directly from publishers or third-party intermediaries, such as advertising exchanges. We recognize cost of revenue on a publisher by publisher basis as incurred. Costs owed to publishers but not yet paid are recorded in our consolidated statements of financial position as accounts payable and accrued expenses.
We purchase inventory from our direct publishers generally through insertion orders consistent with industry standard terms and conditions for the purchase of internet advertising inventory. Pursuant to such arrangements, we purchase impressions on a CPM-basis for users that Criteo recognizes on the publishers’ network. Such arrangements are cancellable upon short notice and without penalty. As a general rule, our agreements with publishers do not contain spend commitments. We may only enter in commitments to purchase a defined volume of impressions if such commitments are specifically subject to corresponding performance commitments from the publisher.We may require our publishers to deliver higher volumes of impressions, with our commitment to buy being linked to specified performance commitments from the publisher. We may also require our publishers to call us first for the advertising serving, thereby granting us privileged access to qualified digital display advertising inventory, and we may sign more exclusive deals with publishers.
Over the past few years, real-time automated buying platforms and bidding exchanges have gained significant traction in the internet display advertising market, resulting in a significant increase in the supply of inventory available through such platforms. As part of this expansion, we have integrated our solution with the leading advertising exchanges and developed our own comprehensive inventory management platform, which we refer to as PuMP. We believe the combination of our extensive direct publisher relationships and access to leading advertising exchanges enhances the breadth and depth of our accessible advertising inventory resulting in deep liquidity for us. We believe that this contributes to increasing the strength of our solution with our clients.
For Criteo Sponsored Products, we pay for the inventory of our ecommerce retailer partners on a revenue sharing basis, effectively paying the retailers a portion of the click-based revenue generated by user clicks on the sponsored products advertisements displaying the products of our brand manufacturer clients.
For Criteo Predictive Search, we do not purchase search inventory ourselves; our advertiser clients have direct access to Google Shopping inventory, and we optimize the bidding price for such inventory on behalf of these clients to maximize the sales generated by their shopping campaigns.
For a discussion of the trends we expect to see in traffic acquisition costs, see the section entitled "—Highlights and Trends—Revenue ex-TAC" in Item 7.D—Trend Information below.
Other Cost of Revenue. Other cost of revenue includes expenses related to third-party hosting fees, depreciation of data center equipment and data purchased from third parties that we leverage in our solution. We intend to continue to invest additional resources in increasing the capacity of our hosting services infrastructure, and as we enter new markets, we may make additional investments in the acquisition of relevant third-party data. The Company does not build or operate its own data centers and none of its research and development personnel is dedicated to revenue generating activities. As a result, we do not include the costs of such personnel in other cost of revenue.
69
Operating Expenses
Operating expenses consist of research and development, sales and operations, and general and administrative expenses. Salaries, bonuses, equity awards compensation, pension benefits and other personnel-related costs are the most significant components of each of these expense categories. We grew from 810 employees at January 1, 2014 to 2,503 employees at December 31, 2016, and we expect to continue to hire a significant number of new employees in order to support our anticipated revenue growth.
We include equity awards compensation expense in connection with grants of share options, warrants, and restricted share units ("RSUs") in the applicable operating expense category based on the respective equity award recipient’s function (Research and development, Sales and operations, General and administrative).
Research and Development Expense. Research and development expense consists primarily of personnel-related costs for our employees working in the engine, platform, product and infrastructure teams, including salaries, bonuses, equity awards compensation and other personnel related costs. Our research and development function was supplemented in January 2013 to include a dedicated product organization following the appointment of our Chief Product Officer. Also included are non-personnel costs such as subcontracting, consulting and professional fees to third-party development resources, allocated overhead and depreciation and amortization costs. These expenses are partially offset by the French research tax credit that is conditional upon the level of our expenditures in research and development. For additional discussion of the French research tax credit, see the discussion below titled “—Provision for Income Taxes.”
Our research and development efforts are focused on enhancing the performance of our solution and improving the efficiency of the services we deliver to our clients and publisher partners. All development costs, principally headcount-related costs, are expensed as management determines that technological feasibility is reached, shortly before the release of the developed products or features. As a result, the development costs incurred after the establishment of technological feasibility and before the release of those products or features are not material and, accordingly, are expensed as incurred.
The number of employees in research and development functions grew from 192 at January 1, 2014 to 603 at December 31, 2016. We expect research and development expenses to continue to increase in absolute dollars but remain fairly constant as a percentage of our revenue. We believe our continued investment in research and development to be critical to maintaining and improving our technology solution, our quality of service and our competitive position.
Sales and Operations Expense. Sales and operations expense consists primarily of personnel-related costs for our employees working in our sales, marketing, account strategy, business intelligence analytics, technical solutions and creative teams, including salaries, bonuses, equity awards compensation, and other personnel-related costs. Additional expenses in this category include travel and entertainment, marketing and promotional events, marketing activities, provisions for doubtful accounts, subcontracting, consulting and professional fees paid to third parties, allocated overhead and depreciation and amortization costs.
The number of employees in sales and operations functions grew from 491 at January 1, 2014 to 1,489 at December 31, 2016. In order to continue to grow our business, geographic footprint and brand awareness, we expect to continue to invest in our resources in sales and operations, in particular by increasing the number of sales and account strategy teams in new geographic markets and in our midmarket hubs. As a result, we expect sales and operations expenses to increase in absolute dollars as we invest to acquire new clients and retain existing ones, and grow revenue from existing clients , but to decrease as a percentage of revenue over time as we scale and increase the productivity of our sales and operations teams.
General and Administrative Expense. General and administrative expense consists primarily of personnel costs, including salaries, bonuses, equity awards compensation, pension benefits and other personnel-related costs for our administrative, legal, information technology, human resources, facilities and finance teams. Additional expenses included in this category are non-personnel costs, such as travel-related expenses, subcontracting and professional fees, audit fees, tax services and legal fees, as well as insurance and other corporate expenses, along with allocated overhead and depreciation and amortization costs.
The number of employees in general and administrative functions grew from 127 at January 1, 2014 to 411 at December 31, 2016. We expect our general and administrative expense to increase in absolute dollars as we continue to support our growth, but to decrease as a percentage of revenue over time as we scale and increase the productivity of our general and administrative teams.
70
Financial Income (Expense)
Financial income (expense) primarily consists of:
• | exchange differences arising on the balance of proceeds of our initial public offering completed in October 2013, received in U.S. dollars that have been hedged through put and collar instruments since 2013 and which we used and sold in 2015. The translation of the U.S. dollar proceeds into euros (the Company's functional currency) according to the closing foreign exchange rate generated an exchange difference partially offset by the cost of the related hedging instruments. This net exchange difference in euro was then translated into U.S. dollars (the Company's reporting currency) according to the average euro / U.S. dollar exchange rate for the periods ended December 31, 2013 and 2014. |
• | exchange differences arising on the settlement or translation into local currency of monetary balance sheet items labeled in euros (the Company's functional currency). We are exposed to changes in exchange rates primarily in the United States, the United Kingdom, Japan and Brazil. The U.S. dollar, the British pound, the Japanese yen and the Brazilian real are our most significant foreign currency exchange risks. At December 31, 2016, our exposure to foreign currency risk was centralized at parent company level and hedged. These exchange differences in euro are then translated into U.S. dollars (the Company's reporting currency) according to the average euro/U.S. dollar exchange rate. |
• | interest received on our cash and cash equivalents and interest incurred on outstanding borrowings under our debt loan agreements and revolving credit facilities. |
We monitor foreign currency exposure and look to mitigate exposures through normal business operations and hedging strategies.
Provision for Income Taxes
We are subject to potential income taxes in France, the United States and numerous other jurisdictions. We recognize tax liabilities based on estimates of whether additional taxes will be due. These tax liabilities are recognized when we believe that certain positions may not be fully sustained upon review by tax authorities, notwithstanding our belief that our tax return positions are supportable.
Our effective tax rates differ from the statutory rate applicable to us primarily due to valuation allowance on deferred tax assets, differences between domestic and foreign jurisdiction tax rates, RTC (Research Tax Credit) offsets, which are non-taxable items, potential tax audit provision settlements, share-based compensation expenses that are non-deductible in some jurisdictions under certain circumstances, and transfer pricing adjustments. We license access to our technology to our subsidiaries and charge a royalty fee to these subsidiaries for such access. In France, we benefit from a reduced tax rate of 15% on a large portion of this technology royalty income.
In 2011, we underwent a tax inspection by the French tax authorities covering fiscal years 2008 and 2009. At the end of 2011, we received a tax assessment notice for which a provision has been recognized for $0.5 million. Pursuant to another tax inspection in 2013, no significant reassessment was received. The provision was released upon reception of the tax notification as of December 31, 2015.
Critical Accounting Policies and Significant Judgments and Estimates
Our consolidated financial statements are prepared in accordance with U.S. GAAP. The preparation of our consolidated financial statements requires us to make estimates, assumptions and judgments that affect the reported amounts of revenue, assets, liabilities, costs and expenses. We base our estimates and assumptions on historical experience and other factors that we believe to be reasonable under the circumstances. We evaluate our estimates and assumptions on an ongoing basis. Our actual results may differ from these estimates. Our most critical accounting policies are summarized below. See note 1 to our audited consolidated financial statements beginning on page F-1 for a description of our other significant accounting policies.
71
Revenue Recognition
We sell personalized display advertisements featuring product-level recommendations either directly to clients or to advertising agencies, which we collectively refer to as our clients. We generate revenue generally when a user clicks on the banner advertisement we deliver for our clients. We generally price our advertising campaigns on a CPC model based on the number of clicks generated by users on the advertisement we deliver in each advertising campaign. In the specific case of Criteo Predictive Search, we do not price our service on a CPC basis and get paid a percentage of sales generated by a client's Google Shopping campaigns, which means we only get paid for completed sales.
Revenue is recognized when the related services are delivered based on the specific terms of the contract, which are primarily based on specified CPCs and related campaign budgets. We recognize revenue when four basic criteria are met: (1) persuasive evidence exists of an arrangement with the client reflecting the terms and conditions under which the services will be provided; (2) services have been provided or delivery has occurred; (3) the fee is fixed or determinable; and (4) collection is reasonably assured. Collectability is assessed based on a number of factors, including the creditworthiness of a client, the size and nature of a client’s digital property and transaction history. Amounts billed or collected in excess of revenue recognized are included as deferred revenue. An example of this deferred revenue would be arrangements where clients request or are required by us to pay in advance of delivery.
We recognize revenue from the delivery of display advertisements in the period in which the display advertisements are delivered. Specifically, we recognize revenue for display advertising delivery through our solution once the consumer clicks on the personalized banner displayed by us on a publisher's website for CPC advertising campaigns. For CPC advertising campaigns, revenue is valued at the fair value of the amount received. Rebates and discounts granted to clients, along with free or extended advertising campaigns, are recorded as a deduction from revenue. Essentially all of our revenue in each of 2014, 2015 and 2016 was derived from advertising campaigns sold on a CPC basis. In the specific case of Criteo Predictive Search, we recognize revenue when users exposed to the Google Shopping campaigns of our clients generate a sale on the digital property of our clients after clicking on the shopping advertisements displayed on Google. Our revenue for Criteo Predictive Search is a percentage of the sales generated by a client's Google Shopping campaigns, which means we only get paid for completed sales.
In the normal course of business, we act as an intermediary in executing transactions with third parties. The determination of whether revenue should be reported on a gross or net basis is based on an assessment of whether we are acting as the principal or an agent in our transactions. In determining whether we act as the principal or an agent, we follow the accounting guidance for principal-agent considerations. The determination of whether we are acting as a principal or an agent in a transaction involves judgment and is based on an evaluation of the terms of each arrangement. While none of the factors individually are considered presumptive or determinative, because we are the primary obligor and are responsible for (1) identifying and contracting with third-party clients, (2) establishing the selling prices of the display advertisements sold, (3) performing all billing and collection activities, including retaining credit risk, and (4) bearing sole responsibility for fulfillment of the advertising and the inventory risk, we act as the principal in these arrangements and therefore report revenue earned and costs incurred related to these transactions on a gross basis. With Criteo Predictive Search, we do not purchase search inventory ourselves; our advertiser clients have direct access to Google Shopping inventory and buy such inventory themselves. As a result of not incurring inventory costs related to these transactions, we act as an agent for our clients with respect to these transactions. Consequently, revenue for Criteo Predictive Search is reported on a net basis. In the specific case of Criteo Sponsored Products, we may act as the principal or as the agent depending on the type of service sold to the advertiser. As a result, depending on the service sold through Criteo Sponsored Products, we report revenue earned and costs incurred related to these transactions on a gross basis or on a net basis.
Trade Receivables, Net of Allowances for Doubtful Accounts
We carry our accounts receivable at net realizable value. On a periodic basis, our management evaluates our accounts receivable and determines whether to provide an allowance or if any accounts should be written down and charged to expense as a bad debt. The evaluation is based on a past history of collections, current credit conditions, the length of time the trade receivable is past due and a past history of write downs. A trade receivable is considered past due if we have not received payments based on agreed-upon terms. A higher default rate than estimated or a deterioration in our major clients’ creditworthiness could have an adverse impact on our future results. Allowances for doubtful accounts on trade receivables are recorded in “Sales and Operations” in our consolidated statements of income. We generally do not require any security or collateral to support our trade receivables. The amount of allowance for doubtful accounts charged to our consolidated statements of income for the years ended December 31, 2014, 2015 and 2016 was $1.3 million, $2.7 million and $5.4 million, respectively and represented 0.7%, 1.1% and 1.5% of our trade receivables, net of allowances, as of December 31, 2014, 2015, and 2016, respectively.
72
Deferred Tax Assets
Deferred taxes are recorded on all temporary differences between the financial reporting and tax bases of assets and liabilities, and on tax losses, using the liability method. Differences are defined as temporary when they are expected to reverse within a foreseeable future. We may only recognize deferred tax assets if, based on the projected taxable incomes within the next three years, we determine that it is probable that future taxable profit will be available against which the unused tax losses and tax credits can be utilized. As a result, the measurement of deferred income tax assets is reduced, if necessary, by a valuation allowance for any tax benefits which are not expected to be realized. If future taxable profits are considerably different from those forecasted that support recording deferred tax assets, we will have to revise downwards or upwards the amount of the deferred tax assets, which would have a significant impact on our financial results. This determination requires many estimates and judgments by our management for which the ultimate tax determination may be uncertain.
Amounts recognized in our consolidated financial statements are calculated at the level of each subsidiary within our consolidated financial statements. As at December 31, 2014, 2015 and 2016, the valuation allowance against net deferred taxes amounted to $26.1 million, $24.0 million and $19.9 million, respectively. It mainly related to Criteo Corp. ($13.9 million, $12.4 million and $0.9 million, respectively), Criteo do Brasil ($2.6 million, $3.9 million and $3.6 million, respectively), Criteo Ltd (United Kingdom) ($7.7 million, $4.7 million and $4.7 million, respectively), Criteo China ($0.8 million, $1.4 million and $3.7 million, respectively) and Criteo France ($0.7 million, $0.6 million and $3.0 million, respectively).
Business Combinations
We apply the provisions of ASC Topic 805 Business Combinations (Topic 805) for our acquisitions. It requires us to recognize separately from goodwill, the assets acquired and the liabilities assumed at their acquisition date fair values. Goodwill as of the acquisition date is measured as the excess of consideration transferred over the net of the acquisition date fair values of the assets acquired and the liabilities assumed. While we use our best estimates and assumptions to accurately value assets acquired and liabilities assumed at the acquisition date as well as contingent consideration, where applicable, our estimates are inherently uncertain and subject to refinement. As a result, during the measurement period, which may be up to one year from the acquisition date, we may record adjustments to the assets acquired and liabilities assumed with the corresponding offset to goodwill. Upon the conclusion of the measurement period or final determination of the values of assets acquired or liabilities assumed, whichever comes first, any subsequent adjustments would be recorded to our Consolidated Statements of Income.
Goodwill and Intangible Assets
Acquired intangible assets are accounted for at acquisition cost less accumulated amortization and any impairment loss. Acquired intangible assets are amortized over their estimated useful lives of one to five years on a straight-line method. Intangible assets are reviewed for impairment whenever events or changes in circumstances such as, but not limited to, significant declines in revenue, earnings or cash flows or material adverse changes in the financial and economic environment indicate that the carrying amount of an asset may be impaired.
Goodwill is not amortized and is tested for impairment at least annually or whenever events or changes in circumstances indicate that the carrying value may not be recoverable. The Company has determined that it operates as a single reporting unit and has selected December 31 as the date to perform its annual impairment test. In the impairment assessment of its goodwill, the Company performs a two-step impairment test, which involves assumptions regarding estimated future cash flows to be derived from the Company. If these estimates or their related assumptions change in the future, the Company may be required to record impairment for these assets.
The first step of the impairment test involves comparing the fair value of the reporting unit to its net book value, including goodwill. If the net book value exceeds its fair value, then the Company would perform the second step of the goodwill impairment test to determine the amount of the impairment loss. The impairment loss to be recognized would be calculated by comparing the implied fair value of the Company to its net book value.
In calculating the implied fair value of the Company’s goodwill, the fair value of the Company would be allocated to all of the other assets and liabilities based on their fair values. The excess of the fair value of the Company over the amount assigned to its other assets and liabilities is the implied fair value of goodwill. An impairment loss would be recognized in the Consolidated Statement of Income when the carrying amount of goodwill exceeds its implied fair value.
73
There has been no impairment of goodwill during the years ended December 31, 2014, 2015 and 2016, as the Company's reporting unit's fair value was substantially in excess of the carrying value based on the annual goodwill impairment test.
Internal-Use Software
Costs related to customized internal-use software that have reached the application development stage are capitalized. Capitalization of such costs begins when the preliminary project stage is complete and stops when the project is substantially complete and is ready for its intended purpose. In making this determination, several analyses for each phase are performed, including analysis of the feasibility, availability of resources, intention to use and future economic benefits. Amortization of these costs begins when capitalization stops and is calculated on a straight-line basis over the assets’ useful lives estimated at three to five years. Our research and development efforts are focused on enhancing the performance of our solution and improving the efficiency of the services we deliver to our clients. Such capitalized costs include costs directly associated with the development of the applications. Internal-use software is amortized on a straight-line basis over the estimated useful life. Costs incurred during the preliminary development stage, as well as maintenance and training costs, are expensed as incurred.
Equity Awards Compensation
We account for share-based compensation in accordance with ASC 718 - Compensation - Stock Compensation. Under the fair value recognition provisions of this guidance, share-based compensation is measured at the grant date based on the fair value of the award and is recognized as expense, over the requisite service period, which is generally the vesting period of the respective award.
Determining the fair value of share-based awards at the grant date requires judgment. The determination of the grant date fair value of RSUs is based on the share price on the grant date. We use the Black-Scholes option-pricing model to determine the fair value of share options. The determination of the grant date fair value of options using an option-pricing model is affected by our estimated ordinary share fair value as well as assumptions regarding a number of other complex and subjective variables.
These variables include the fair value of our ordinary shares, the expected term of the options, our expected share price volatility, risk-free interest rates, and expected dividends, which are estimated as follows:
• | Fair value of our ordinary shares. Following our initial public offering, we established a policy of using the closing sales price per ADS as quoted on the Nasdaq on the date of grant for purposes of determining the fair value of ordinary shares with a floor value of 95% of the average of the closing sales price per ADS for the 20 trading days preceding the grant. |
• | Expected term. The expected term represents the period that our share-based awards are expected to be outstanding. As we do not have sufficient historical experience for determining the expected term of the ordinary share option awards granted, we have based our expected term on the simplified method, which represents the average period from vesting to the expiration of the award. |
• | Expected volatility. Prior to our initial public offering, as we did not have a trading history for our ordinary shares, the expected share price volatility for our ordinary shares was estimated by taking the average historic price volatility for industry peers based on daily price observations over a period equivalent to the expected term of the ordinary share option grants. From the initial public offering, the expected share price volatility takes into account the Criteo closing share price from the initial public offering date to the grant date and closing share price of industry peers for the remaining expected term of the ordinary share option grant. |
• | Risk-free rate. The risk-free interest rate is based on the yields of France Treasury securities with maturities similar to the expected term of the options for each option group. |
• | Dividend yield. We have never declared or paid any cash dividends and do not presently plan to pay cash dividends in the foreseeable future. Consequently, we use an expected dividend yield of zero. |
If any of the assumptions used in the Black-Scholes model changes significantly, share-based compensation for future awards may differ materially compared with the awards granted previously.
74
The following table presents the weighted-average assumptions used to estimate the fair value of options granted during the periods presented:
Year Ended December 31, | ||||||||
2014 | 2015 | 2016 | ||||||
Volatility | 41.5% - 44.5% | 39.4% - 40.6% | 40.4%-40.6% | |||||
Risk-free interest rate | 0.43% - 1.90% | 0% - 0.52% | 0.00% | |||||
Expected life (in years) | 6 years | 6 years | 6 years | |||||
Dividend yield | — | % | — | % | — | % | ||
Recent Accounting Pronouncements
For a discussion of recent accounting pronouncements applicable to us, see note 1 to our audited consolidated financial statements beginning on page F-1.
75
Results of Operations for the Years Ended December 31, 2014, 2015 and 2016
Revenue
Year Ended December 31, | % change | ||||||||||||||||
2014 | 2015 | 2016 | 2014 vs 2015 | 2015 vs 2016 | |||||||||||||
(in thousands) | |||||||||||||||||
Revenue as reported | $ | 988,249 | $ | 1,323,169 | $ | 1,799,146 | 34 | % | 36 | % | |||||||
Conversion impact U.S dollar/other currencies | $ | (5,022 | ) | ||||||||||||||
Revenue at constant currency (*) | 988,249 | 1,323,169 | 1,794,124 | 49 | % | 36 | % | ||||||||||
Americas | |||||||||||||||||
Revenue as reported | $ | 303,436 | $ | 505,653 | $ | 730,873 | 67 | % | 45 | % | |||||||
Conversion impact U.S dollar/other currencies | $ | 3,952 | |||||||||||||||
Revenue at constant currency (*) | 303,436 | 505,653 | 734,825 | 74 | % | 45 | % | ||||||||||
EMEA | |||||||||||||||||
Revenue as reported | $ | 485,986 | $ | 541,105 | $ | 660,523 | 11 | % | 22 | % | |||||||
Conversion impact U.S dollar/other currencies | $ | 18,976 | |||||||||||||||
Revenue at constant currency (*) | 485,986 | 541,105 | 679,499 | 31 | % | 26 | % | ||||||||||
Asia-Pacific | |||||||||||||||||
Revenue as reported | $ | 198,827 | $ | 276,411 | $ | 407,750 | 39 | % | 48 | % | |||||||
Conversion impact U.S dollar/other currencies | $ | (27,950 | ) | ||||||||||||||
Revenue at constant currency (*) | 198,827 | 276,411 | 379,800 | 56 | % | 37 | % | ||||||||||
(*) Growth at constant currency excludes the impact of foreign currency fluctuations and is computed by applying the average exchange rates for the prior year to the following year figures.
2016 Compared to 2015
Revenue for 2016 increased $476.0 million, or 36% (or 36% on a constant currency basis), compared to 2015. Excluding the contribution of Criteo Sponsored Products (formerly HookLogic) for the period from November 9, 2016 until December 31, 2016, revenue increased $430.8 million, or 33% (or 32% on a constant currency basis). Excluding Criteo Sponsored Products, revenue from new clients contributed 35.7% to the global year-over-year revenue growth while revenue from existing clients contributed 64.3% to the global year-over-year revenue growth. This increase in revenue was primarily due to technology improvements, broader access to quality display impressions including new sources of native inventory, and our ability to engage seamlessly with end-customers across desktop and mobile devices, which helped generate more revenue per client, in particular from existing clients. Our continuing ability to convert a large portion of our clients to uncapped budgets continued to be a key driver of the increase in revenue per client.
The year-over-year increase was the result of our rapid growth across all geographies. Our revenue in the Americas region increased 45% (or 45% on a constant currency basis) to $730.9 million for 2016 compared to 2015, as we engaged with new large clients, continued to increase revenue from existing large clients, saw continued strong traction from midmarket clients across the region, and benefited from the contribution of Criteo Sponsored Products in the fourth quarter of 2016.
Our revenue in the EMEA region increased 22% (or 26% on a constant currency basis) to $660.5 million for 2016 compared 2015, as we signed several new large and midmarket clients across markets in the region and continued to grow our revenue from existing clients across large and midmarket clients and geographic markets. Our revenue in the Asia-Pacific region increased 48% (or 37% on a constant currency basis) to $407.8 million for 2016 compared to 2015, as we continued to expand our business with new and existing clients across the region, in particular in Japan and Korea, and saw continued solid growth across South-East Asian markets.
76
Additionally, our $1,799.1 million of revenue for 2016 was positively impacted by $5.0 million of currency fluctuations, particularly as a result of the strengthening of the Japanese yen compared to the U.S. dollar partially offset by the depreciation of the Brazilian real and the pound sterling.
Over 100% of the year-over-year growth in revenue on a constant currency basis excluding Criteo Sponsored Products was attributable to an increased volume of clicks delivered on the advertising banners displayed by us.
2015 Compared to 2014
Revenue for 2015 increased $334.9 million, or 34% (or 49% on a constant currency basis), compared to 2014. Revenue from new clients contributed 40.2% to the global year-over-year revenue growth while revenue from existing clients contributed 59.8% to the global year-over-year revenue growth. This increase in revenue was primarily due to our technology improvements and our ability to engage seamlessly with end-customers across desktop and mobile devices, which helped generate more revenue per client, in particular from our existing clients. Our continuing ability to convert a large portion of our clients to uncapped budgets was also a key driver of the increase in revenue per client.
The year-over-year increase was the result of our growth across all geographies. Our revenue in the Americas region increased 67% (or 74% on a constant currency basis) to $505.7 million for 2015 compared to 2014, as large clients continued to increase their spend with us and our midmarket segment continued its triple-digit growth across the Americas. Our revenue in the EMEA region increased 11% (or 31% on a constant currency basis) to $541.1 million for 2015 compared 2014, as we signed several large and midmarket clients in the region and continued to grow our revenue from existing clients across client segments and markets. Our revenue in the Asia-Pacific region increased 39% (or 56.0% on a constant currency basis) to $276.4 million for 2015 compared to 2014, as we continued to expand our business with existing clients, in particular in Japan, and saw very fast growth in South-East Asia throughout the year.
Additionally, our $1,323.2 million of revenue for 2015 was negatively impacted by $152.1 million of currency fluctuations, particularly as a result of the strengthening of the U.S. dollar compared to the Japanese Yen, the Brazilian Real, and the Euro.
Over 100% of this year-over-year growth in revenue on a constant currency basis was attributable to an increased volume of clicks delivered on the advertising banners displayed by us.
Cost of Revenue
Year Ended December 31, | % change | ||||||||||||||
2014 | 2015 | 2016 | 2014 vs 2015 | 2015 vs 2016 | |||||||||||
(in thousands, except percentages) | |||||||||||||||
Traffic acquisition costs | $ | (585,492 | ) | $ | (789,152 | ) | $ | (1,068,911 | ) | 35% | 35% | ||||
Other cost of revenue | $ | (47,948 | ) | $ | (62,201 | ) | $ | (85,260 | ) | 30% | 37% | ||||
% of revenue | (64 | )% | (64 | )% | (64 | )% | |||||||||
Gross profit % | 36 | % | 36 | % | 36 | % | |||||||||
2016 Compared to 2015
Cost of revenue for 2016 increased $302.8 million, or 36%, compared to 2015. This increase was primarily the result of a $279.8 million, or 35% (or 35% on a constant currency basis), increase in traffic acquisition costs and a $23.1 million, or 37% (or 37% on a constant currency basis), increase in other cost of revenue.
The increase in traffic acquisition costs related primarily to an increase of 24.8% in the number of impressions we purchased, as well as a 4.8% increase in the average CPM for inventory purchased. The increase in impressions purchased was driven by impressions bought through real-time bidding exchanges, as more quality inventory became available on these platforms, and to a lesser extent by the publishers with whom we have a direct relationship, including PuMP. The year-over-year increase in average CPM remained largely driven by the improving quality and evolving formats of ad units available to us on an individual basis, more than the price dynamics prevalent in the marketplace. The increase in other cost of revenue includes a $11.5 million increase in hosting costs, a $8.6 million increase in allocated depreciation and amortization expense and a $3.0 million increase in other cost of sales.
77
We consider Revenue ex-TAC as a key measure of our business activity. Our strategy focuses on maximizing the growth of our Revenue ex-TAC on an absolute basis over maximizing our near-term gross margin, as we believe this focus builds sustainable long-term value for our business by fortifying a number of our competitive strengths, including access to advertising inventory, breadth and depth of data and continuous improvement of the Criteo Engine’s performance, allowing it to deliver more relevant advertisements at scale. As a part of this focus, we continue to invest in building relationships with direct publishers and pursue access to leading advertising exchanges. Our performance-based business model provides us with significant control over our level of Revenue ex-TAC margin, which we seek to optimize in order to maximize Revenue ex-TAC growth on an absolute basis in accordance with our strategic focus.
2015 Compared to 2014
Cost of revenue for 2015 increased $217.9 million, or 34%, compared to 2014. This increase was primarily the result of a $203.7 million, or 35% (or 50% on a constant currency basis), increase in traffic acquisition costs and a $14.3 million, or 30% (or 39% on a constant currency basis), increase in other cost of revenue.
The increase in traffic acquisition costs related primarily to an increase of 28% in CPM as well as a 5.2% increase in the number of impressions we purchased, in particular from publishers with whom we have direct relationships, including PuMP, and to a lesser extent from the main real-time bidding exchanges. The year-over-year increase in average CPM was not only driven by price dynamics but was largely a function of the improving quality of the inventory as well as the evolving formats of ad units available to us on an individual basis. The increase in other cost of revenue includes a $5.7 million increase in hosting costs, a $8.4 million increase in allocated depreciation and amortization expense and a $0.5 million increase in other cost of sales, partially offset by a $0.3 million decrease in data acquisition costs.
Research and Development Expenses
Year Ended December 31, | % change | ||||||||||||||
2014 | 2015 | 2016 | 2014 vs 2015 | 2015 vs 2016 | |||||||||||
(in thousands, except percent of revenue) | |||||||||||||||
Research and development expenses | $ | (60,075 | ) | $ | (86,807 | ) | $ | (123,649 | ) | 44% | 42% | ||||
% of revenue | (6 | )% | (7 | )% | (7 | )% | |||||||||
2016 Compared to 2015
Research and development expenses for 2016 increased $36.8 million, or 42%, compared to 2015. This increase was primarily the result of a $29.9 million increase in salaries, bonuses, share-based compensation, and other personnel costs primarily due to a 51% increase in headcount, due in part to Criteo Sponsored Products, a $2.1 million increase in subcontracting and other headcount-related costs, a $3.8 million increase in allocated rent and facilities costs, a $2.0 million increase in consulting and professional fees and a $1.3 million increase in other costs partially offset by a $1.5 million increase in the French Research Tax Credit and a $0.8 million decrease in amortization and depreciation of assets.
2015 Compared to 2014
Research and development expenses for 2015 increased $26.7 million, or 44%, compared to 2014. This increase was primarily the result of a $18.2 million increase in salaries, bonuses, share-based compensation, and other personnel costs primarily due to increased headcount in this function, a $2.5 million increase in subcontracting and other headcount-related costs, a $1.3 million increase in allocated rent and facilities costs, a $3.0 million increase in amortization and depreciation of assets, a $0.4 million increase in consulting and professional fees and a $1.7 million decrease in the French Research Tax Credit partially offset by a $0.4 million decrease in other costs.
78
Sales and Operations Expenses
Year Ended December 31, | % change | |||||||||||||||
2014 | 2015 | 2016 | 2014 vs 2015 | 2015 vs 2016 | ||||||||||||
(in thousands, except percent of revenue) | ||||||||||||||||
Sales and operations expenses | $ | (176,927 | ) | $ | (229,530 | ) | $ | (282,853 | ) | 30% | 23% | |||||
% of revenue | (18 | )% | (17 | )% | (16 | )% | ||||||||||
2016 Compared to 2015
Sales and operations expenses for 2016 increased $53.3 million, or 23%, compared to 2015. This increase was primarily a result of a $34.6 million increase in salaries, bonuses, share-based compensation, and other personnel-related costs primarily due to the 32% increase in headcount, due in part to Criteo Sponsored Products, a $1.3 million increase in subcontracting and other headcount-related costs, a $2.9 million increase in events, a $2.6 million increase in allocated depreciation and amortization expense, a $4.5 million increase in allocated rent and facilities costs, a $2.8 million increase in provisions for doubtful accounts, and a $4.6 million increase in other expenses mainly related to other operating taxes.
2015 Compared to 2014
Sales and operations expenses for 2015 increased $52.6 million, or 30%, compared to 2014. This increase was primarily a result of a $32.8 million increase in salaries, bonuses, share-based compensation, and other personnel-related costs primarily due to increased headcount in this function, a $1.2 million increase in subcontracting and other headcount-related costs, a $3.0 million increase in events, a $1.5 million increase in allocated depreciation and amortization expense, a $10.3 million increase in allocated rent and facilities costs,a $0.2 million increase in consulting and professional fees, a $1.3 million increase in provisions for doubtful accounts, and a $2.3 million increase in other expenses mainly related to other taxes.
General and Administrative Expenses
Year Ended December 31, | % change | ||||||||||||||
2014 | 2015 | 2016 | 2014 vs 2015 | 2015 vs 2016 | |||||||||||
(in thousands, except percent of revenue) | |||||||||||||||
General and administrative expenses | $ | (64,723 | ) | $ | (79,145 | ) | $ | (117,469 | ) | 22% | 48% | ||||
% of revenue | (7 | )% | (6 | )% | (7 | )% | |||||||||
2016 Compared to 2015
General and administrative expenses for 2016 increased $38.3 million, or 48%, compared to 2015. This increase was primarily a result of a $23.2 million increase in salaries, bonuses, share-based compensation, pension benefits and other personnel-related costs primarily in connection with the 29% increase in headcount, due in part to Criteo Sponsored Products, a $2.8 million increase in subcontracting and other headcount-related costs, a $3.0 million increase in allocated rent and facilities costs, a $1.8 million increase in allocated depreciation and amortization expense, a $5.6 million increase in consulting and professional fees, primarily as a result of exceptional expenses related to litigation and business combinations, and a $1.9 million increase in other operating expenses explained primarily by a prior release of accrued deferred price consideration in relation with the Tedemis acquisition.
2015 Compared to 2014
General and administrative expenses for 2015 increased $14.4 million, or 22%, compared to 2014. This increase was primarily a result of a $10.4 million increase in salaries, bonuses, share-based compensation, pension benefits and other personnel-related costs primarily due to increased headcount in this function, a $0.3 million increase in subcontracting and other headcount-related costs, a $1.3 million increase in allocated rent and facilities costs, a $0.4 million increase in allocated depreciation and amortization expense, a $3.2 million increase in consulting and professional fees, a $0.3 million increase in operating taxes and a $0.9 million increase in operating expenses including amortization of
79
implementation fees & non-utilization fees on the General RCF, partially offset by a $2.4 million decrease mainly related to the release of the accrual for the Tedemis earn-out payment.
Financial Income (Expense)
Year Ended December 31, | % change | ||||||||||||||
2014 | 2015 | 2016 | 2014 vs 2015 | 2015 vs 2016 | |||||||||||
(in thousands, except percent of revenue) | |||||||||||||||
Financial income (expense) | $ | 11,390 | $ | (4,541 | ) | $ | (546 | ) | (140)% | (88)% | |||||
% of revenue | 1 | % | (3 | )% | — | % | |||||||||
2016 Compared to 2015
Financial income (expense) for 2016 increased by $4.0 million, or (88)% compared to 2015. The $0.5 million financial expense for the period ended December 31, 2016 resulted from the interest incurred from drawing $75.0 million on the General RCF to partially fund the HookLogic acquisition in November 2016, the negative impact of foreign exchange reevaluations and related hedging mainly recorded during the first quarter, partially offset by the foreign exchange gain realized on the hedging of the USD denominated consideration paid for the HookLogic acquisition. At December 31, 2016, our exposure to foreign currency risk was centralized at Criteo S.A. and hedged using foreign currency swaps or forward purchases or sales of foreign currencies.
2015 Compared to 2014
Financial income (expense) for 2015 decreased by $15.9 million, or (140)% compared to 2014. The significant foreign exchange loss for the period ended December 31, 2015 was mainly a result of the weakening of the Brazilian Real which resulted in losses on intra-group positions denominated in this currency, associated with a higher related cost of hedging and partially offset by the gain realized on the sale of the $70 million remaining from our initial public offering proceeds. At December 31, 2015, our exposure to foreign currency risk was centralized at Criteo S.A. and hedged using foreign currency swaps or forward purchases or sales of foreign currencies.
Provision for Income Taxes
Year Ended December 31, | % change | ||||||||||||||
2014 | 2015 | 2016 | 2014 vs 2015 | 2015 vs 2016 | |||||||||||
(in thousands, except percent information) | |||||||||||||||
Provision for income taxes | $ | (17,578 | ) | $ | (9,517 | ) | $ | (33,129 | ) | (46)% | 248% | ||||
% of revenue | (2 | )% | (1 | )% | (2 | )% | |||||||||
Effective tax rate | 27.3 | % | 13.3 | % | 27.5 | % | |||||||||
2016 Compared to 2015
The provision for income taxes for 2016 increased by $23.6 million, or (248)%, compared to 2015. The annual effective tax rate for 2016 was 27.5%, compared to an annual effective tax rate of 13.3% for 2015. Generally, the annual effective tax rates differ from statutory rates primarily due to the impact of the domestic tax deduction applicable to technology royalty income we received from our subsidiaries, differences in tax rates in foreign jurisdictions, tax loss carryforwards in certain of our foreign subsidiaries and equity awards compensation expense.
In 2016, our income before taxes increased by $48.7 million to $120.5 million, compared to 2015, generating a $41.5 million theoretical income tax expense at a nominal standard French tax rate of 34.43%. This theoretical tax expense is impacted primarily by the following items contributing to a $33.1 million effective tax expense and a 27.5% effective tax rate: $7.8 million of deferred tax assets on which we recognized a valuation allowance mainly related to Criteo Ltd, Criteo Singapore Pte. Ltd (United Kingdom), Criteo Pty (Australia) and Criteo Advertising (Beijing) Co. Ltd tax losses, $13.8 million in taxes related to our equity awards compensation expense, for which no deferred taxes are recognized, $3.2 million related to the French business tax Cotisation sur la Valeur Ajoutée des Entreprises, or “CVAE”, offset by a $4.8 million tax deduction on share options exercised during the period by U.K. and U.S. residents, a $20.0 million tax deduction resulting from technology royalty income we received from our subsidiaries and the recognition or reversal of valuation allowance on deferred tax
80
assets for $13.4 million (mainly for Criteo Corp.). Please see note 21 to our audited consolidated financial statements for more detailed information on the provision for income taxes.
Amounts recognized in our consolidated financial statements are calculated at the level of each subsidiary within our consolidated financial statements. As at December 31, 2016, the valuation allowance against deferred tax assets amounted to $19.9 million. It mainly related to Criteo do Brasil ($3.6 million), Criteo Ltd ($4.7 million), Criteo China ($3.7 million) and Criteo France ($3.0 million).
2015 Compared to 2014
The provision for income taxes for 2015 decreased by $8.1 million, or 46%, compared to 2014. The annual effective tax rate for 2015 was 13.3%, compared to an annual effective tax rate of 27.3% for 2014. Generally, the annual effective tax rates differ from statutory rates primarily due to the impact of the domestic tax deduction applicable to technology royalty income we received from our subsidiaries, differences in tax rates in foreign jurisdictions, tax loss carryforwards in certain of our foreign subsidiaries and equity awards compensation expense.
In 2015, our income before taxes increased by $7.3 million to $71.8 million, compared to 2015, generating a $24.7 million theoretical income tax expense at a nominal standard French tax rate of 34.43%. This theoretical tax expense is impacted primarily by the following items contributing to a $9.5 million effective tax expense and a 13.3% effective tax rate: $7.7 million of deferred tax assets on which we recognized a valuation allowance mainly related to Criteo Ltd, Criteo Singapore Pte. Ltd, Criteo do Brasil and Criteo Advertising (Beijing) Co. Ltd tax losses, $8.3 million in taxes related to our equity awards compensation expense, for which no deferred taxes are recognized, $3.1 million related to the French business tax Cotisation sur la Valeur Ajoutée des Entreprises, or “CVAE”, offset by a $10.3 million tax deduction on share options exercised during the period by U.K. and U.S. residents, a $12.5 million tax deduction resulting from technology royalty income we received from our subsidiaries and the recognition or reversal of valuation allowance on deferred tax assets for $12.3 million (including $10.8 million for Criteo Corp.). Please see note 21 to our audited consolidated financial statements for more detailed information on the provision for income taxes.
Amounts recognized in our consolidated financial statements are calculated at the level of each subsidiary within our consolidated financial statements. As at December 31, 2015, the valuation allowance against deferred tax assets amounted to $24.0 million. It mainly related to Criteo Corp. ($12.4 million), Criteo do Brasil ($3.9 million) and Criteo Ltd ($4.7 million).
Net Income
Year Ended December 31, | % change | ||||||||||||||
2014 | 2015 | 2016 | 2014 vs 2015 | 2015 vs 2016 | |||||||||||
(in thousands, except percent of revenue) | |||||||||||||||
Net income | $ | 46,896 | $ | 62,276 | $ | 87,329 | 33% | 40% | |||||||
% of revenue | 5 | % | 5 | % | 5 | % | |||||||||
2016 Compared to 2015
Net income for 2016 increased $25.1 million, or 40% compared to 2015. This increase was the result of the factors discussed above, in particular a $44.7 million increase in income from operations and a $4.0 million increase in financial income (expense) offset by a $23.6 million increase in provision for income taxes compared to 2015.
2015 Compared to 2014
Net income for 2015 increased $15.4 million, or 33% compared to 2014. This increase was the result of the factors discussed above, in particular, a $23.3 million increase in income from operations and a $8.1 million decrease in provision for income taxes, partially offset by a $15.9 million decrease in financial income (expense) compared to 2014.
81
Revenue, Traffic Acquisition Costs and Revenue ex-TAC by Region
The following table sets forth our revenue, traffic acquisition costs and Revenue ex-TAC by region, including the Americas (North and South America), Europe, Middle East and Africa, or EMEA, and Asia-Pacific:
Year Ended December 31, | |||||||||||||
Region | 2014 | 2015 | 2016 | ||||||||||
(in thousands) | |||||||||||||
Revenue | Americas | $ | 303,436 | $ | 505,653 | $ | 730,873 | ||||||
EMEA | 485,986 | 541,105 | 660,523 | ||||||||||
Asia-Pacific | 198,827 | 276,411 | 407,750 | ||||||||||
Total | $ | 988,249 | $ | 1,323,169 | $ | 1,799,146 | |||||||
Traffic acquisition costs | Americas | $ | (184,245 | ) | $ | (308,427 | ) | $ | (451,774 | ) | |||
EMEA | (280,242 | ) | (313,928 | ) | (373,664 | ) | |||||||
Asia-Pacific | (121,005 | ) | (166,797 | ) | (243,473 | ) | |||||||
Total | $ | (585,492 | ) | $ | (789,152 | ) | $ | (1,068,911 | ) | ||||
Revenue ex-TAC (1) | Americas | $ | 119,191 | $ | 197,226 | $ | 279,099 | ||||||
EMEA | 205,744 | 227,177 | 286,859 | ||||||||||
Asia-Pacific | 77,822 | 109,614 | 164,277 | ||||||||||
Total | $ | 402,757 | $ | 534,017 | $ | 730,235 | |||||||
(1) We define Revenue ex-TAC as our revenue excluding traffic acquisition costs generated over the applicable measurement period. Revenue ex-TAC and Revenue ex-TAC by Region are not measures calculated in accordance with U.S. GAAP. We have included Revenue ex-TAC and Revenue ex-TAC by Region in this Form 10-K because they are key measures used by our management and board of directors to evaluate operating performance and generate future operating plans. In particular, we believe that the elimination of TAC from revenue and review of these measures by region can provide useful measures for period-to-period comparisons of our core business. Accordingly, we believe that Revenue ex-TAC and Revenue ex-TAC by Region provide useful information to investors and others in understanding and evaluating our results of operations in the same manner as our management and board of directors. Our use of Revenue ex-TAC and Revenue ex-TAC by Region has limitations as an analytical tool, and you should not consider them in isolation or as a substitute for analysis of our financial results as reported under U.S. GAAP. Some of these limitations are: (a) other companies, including companies in our industry which have similar business arrangements, may address the impact of TAC differently; (b) other companies may report Revenue ex-TAC and Revenue ex-TAC by Region or similarly titled measures but define the regions differently, which reduces their effectiveness as a comparative measure; and (c) other companies may report Revenue ex-TAC or similarly titled measures but calculate them differently, which reduces their usefulness as a comparative measure. Because of these and other limitations, you should consider Revenue ex-TAC and Revenue ex-TAC by Region alongside our other U.S. GAAP financial results, including revenue. The above table provides a reconciliation of Revenue ex-TAC by region to revenue by region. Please also refer to footnote 3 to the "Other Financial and Operating Data" table in “Item 6. Selected Financial Data” in this Form 10-K for a reconciliation of Revenue ex-TAC to revenue, the most directly comparable financial measure calculated and presented in accordance with U.S. GAAP.
82
Constant Currency Reconciliation
Information in this Form 10-K with respect to results presented on a constant currency basis was calculated by applying prior period average exchange rates to current period results. Management reviews and analyzes business results excluding the effect of foreign currency translation because they believe this better represents our underlying business trends. Below is a table which reconciles the actual results presented in this section with the results presented on a constant currency basis:
Year Ended December 31, | % change | ||||||||||||||
2014 | 2015 | 2016 | 2014 vs 2015 | 2015 vs 2016 | |||||||||||
(in thousands) | |||||||||||||||
Revenue as reported | $ | 988,249 | $ | 1,323,169 | 1,799,146 | 34% | 36% | ||||||||
Conversion impact U.S. Dollar/other currencies | 15,666 | 152,061 | (5,022 | ) | |||||||||||
Revenue at constant currency | $ | 1,003,915 | $ | 1,475,230 | $ | 1,794,124 | 49% | 36% | |||||||
Traffic acquisition costs as reported | $ | (585,492 | ) | $ | (789,152 | ) | (1,068,911 | ) | 35% | 35% | |||||
Conversion impact U.S. Dollar/other currencies | (10,064 | ) | (90,002 | ) | 3,852 | ||||||||||
Traffic acquisition cost at constant currency | $ | (595,556 | ) | $ | (879,154 | ) | $ | (1,065,059 | ) | 50% | 35% | ||||
Revenue ex-TAC as reported | $ | 402,757 | $ | 534,017 | $ | 730,235 | 33% | 37% | |||||||
Conversion impact U.S. Dollar/other currencies | 5,602 | 62,059 | (1,170 | ) | |||||||||||
Revenue ex-TAC at constant currency | $ | 408,359 | $ | 596,076 | $ | 729,065 | 48% | 37% | |||||||
Other cost of revenue as reported | $ | (47,948 | ) | $ | (62,201 | ) | (85,260 | ) | 30% | 37% | |||||
Conversion impact U.S. Dollar/other currencies | (511 | ) | (4,589 | ) | (40 | ) | |||||||||
Other cost of revenue at constant currency | $ | (48,459 | ) | $ | (66,790 | ) | $ | (85,300 | ) | 39% | 37% | ||||
83
Unaudited Quarterly Results of Operations
The following tables set forth our unaudited consolidated statement of income data for the last eight quarters, as well as the percentage of revenue for each line item shown. We derived this information from our unaudited interim consolidated financial information, which, in the opinion of management, includes all adjustments, consisting only of normal recurring adjustments, necessary for the fair presentation of the information for the quarters presented. The quarterly results of operations have been prepared by, and are the responsibility of, our management and have not been audited or reviewed by our independent registered public accounting firm. You should read this information together with our audited consolidated financial statements and related notes beginning on page F-1.
Three Months Ended | |||||||||||||||||||||||||||||||||
March 31, 2015 | June 30, 2015 | September 30, 2015 | December 31, 2015 | March 31, 2016 | June 30, 2016 | September 30, 2016 | December 31, 2016 | ||||||||||||||||||||||||||
(in thousands) (unaudited) | |||||||||||||||||||||||||||||||||
Consolidated Statements of Income Data: | |||||||||||||||||||||||||||||||||
Revenue | $ | 294,172 | $ | 299,306 | $ | 332,674 | $ | 397,018 | $ | 401,253 | $ | 407,201 | $ | 423,867 | $ | 566,825 | |||||||||||||||||
Cost of revenue (1) | |||||||||||||||||||||||||||||||||
Traffic acquisition costs | (175,888 | ) | (177,239 | ) | (198,970 | ) | (237,056 | ) | (238,755 | ) | (240,969 | ) | (247,310 | ) | (341,877 | ) | |||||||||||||||||
Other cost of revenue | (12,969 | ) | (14,243 | ) | (17,206 | ) | (17,782 | ) | (18,338 | ) | (20,279 | ) | (22,332 | ) | (24,309 | ) | |||||||||||||||||
Gross profit | 105,315 | 107,824 | 116,498 | 142,180 | 144,160 | 145,953 | 154,225 | 200,639 | |||||||||||||||||||||||||
Operating expenses (1): | |||||||||||||||||||||||||||||||||
Research and development expenses | (17,846 | ) | (19,853 | ) | (22,442 | ) | (26,665 | ) | (27,162 | ) | (30,235 | ) | (30,701 | ) | (35,552 | ) | |||||||||||||||||
Sales and operations expenses | (53,083 | ) | (59,727 | ) | (56,310 | ) | (60,410 | ) | (64,473 | ) | (69,225 | ) | (68,164 | ) | (80,991 | ) | |||||||||||||||||
General and administrative expenses | (17,546 | ) | (20,404 | ) | (19,915 | ) | (21,280 | ) | (24,737 | ) | (28,610 | ) | (32,492 | ) | (31,630 | ) | |||||||||||||||||
Total operating expenses | (88,475 | ) | (99,984 | ) | (98,667 | ) | (108,355 | ) | (116,372 | ) | (128,070 | ) | (131,357 | ) | (148,173 | ) | |||||||||||||||||
Income from operations | 16,840 | 7,840 | 17,831 | 33,825 | 27,788 | 17,883 | 22,868 | 52,466 | |||||||||||||||||||||||||
Financial income (expense) | 3,920 | (2,546 | ) | (6,650 | ) | 735 | (1,317 | ) | (94 | ) | (570 | ) | 1,435 | ||||||||||||||||||||
Income before taxes | 20,760 | 5,294 | 11,181 | 34,560 | 26,471 | 17,789 | 22,298 | 53,901 | |||||||||||||||||||||||||
Provision for income taxes | (7,143 | ) | (1,365 | ) | (5,388 | ) | 4,378 | (7,944 | ) | (4,450 | ) | (7,574 | ) | (13,161 | ) | ||||||||||||||||||
Net income | $ | 13,617 | $ | 3,929 | $ | 5,793 | $ | 38,938 | $ | 18,527 | $ | 13,339 | $ | 14,724 | $ | 40,740 | |||||||||||||||||
Net income available to shareholders of Criteo S.A | 12,982 | 3,540 | 5,096 | 37,936 | 17,131 | 12,200 | 13,539 | 39,403 | |||||||||||||||||||||||||
Other Financial Data: | |||||||||||||||||||||||||||||||||
Revenue ex-TAC (2) | $ | 118,284 | $ | 122,067 | $ | 133,704 | $ | 159,962 | $ | 162,498 | $ | 166,232 | $ | 176,557 | $ | 224,948 | |||||||||||||||||
Adjusted EBITDA (3) | $ | 31,806 | $ | 23,668 | $ | 34,487 | $ | 53,477 | $ | 48,843 | $ | 39,201 | $ | 53,532 | $ | 82,995 | |||||||||||||||||
84
(1) Cost of revenue and operating expenses include equity awards compensation expense, pension service costs, depreciation and amortization expense and acquisition-related costs and deferred price consideration as follows:
Three Months Ended | |||||||||||||||||||||||||||||||
March 31, 2015 | June 30, 2015 | September 30, 2015 | December 31, 2015 | March 31, 2016 | June 30, 2016 | September 30, 2016 | December 31, 2016 | ||||||||||||||||||||||||
(in thousands) (unaudited) | |||||||||||||||||||||||||||||||
Equity awards compensation expense | |||||||||||||||||||||||||||||||
Research and development expenses | $ | 1,478 | $ | 1,162 | $ | 1,714 | $ | 2,167 | $ | 2,402 | $ | 2,179 | $ | 4,667 | $ | 2,860 | |||||||||||||||
Sales and operations expenses | 3,454 | 2,903 | 1,715 | 3,606 | 3,390 | 2,488 | 5,143 | 5,816 | |||||||||||||||||||||||
General and administrative expenses | 1,385 | 1,260 | 1,171 | 1,975 | 2,578 | 3,028 | 4,155 | 4,553 | |||||||||||||||||||||||
Total equity awards compensation expense | $ | 6,317 | $ | 5,325 | $ | 4,600 | $ | 7,748 | $ | 8,370 | $ | 7,695 | $ | 13,965 | $ | 13,229 | |||||||||||||||
Pension service costs | |||||||||||||||||||||||||||||||
Research and development expenses | $ | 42 | $ | 40 | $ | 41 | $ | 40 | $ | 52 | $ | 53 | $ | 55 | $ | 52 | |||||||||||||||
Sales and operations expenses | 39 | 39 | 37 | 38 | 34 | 35 | 38 | 37 | |||||||||||||||||||||||
General and administrative expenses | 31 | 31 | 32 | 31 | 43 | 43 | 39 | 44 | |||||||||||||||||||||||
Total pension service costs | $ | 112 | $ | 110 | $ | 110 | $ | 109 | $ | 129 | $ | 131 | $ | 132 | $ | 133 | |||||||||||||||
Depreciation and amortization expense | |||||||||||||||||||||||||||||||
Cost of revenue | $ | 5,971 | $ | 6,813 | $ | 8,503 | $ | 8,579 | $ | 8,220 | $ | 9,220 | $ | 10,407 | $ | 10,623 | |||||||||||||||
Research and development expenses | 1,144 | 1,977 | 1,690 | 3,183 | 2,007 | 1,457 | 1,640 | 2,106 | |||||||||||||||||||||||
Sales and operations expenses | 992 | 1,112 | 1,330 | 1,744 | 1,771 | 2,019 | 1,813 | 2,153 | |||||||||||||||||||||||
General and administrative expenses | 321 | 376 | 369 | 461 | 518 | 604 | 911 | 1,308 | |||||||||||||||||||||||
Total depreciation and amortization expense | $ | 8,428 | $ | 10,278 | $ | 11,892 | $ | 13,967 | $ | 12,516 | $ | 13,300 | $ | 14,771 | $ | 16,190 | |||||||||||||||
Acquisition-related costs | |||||||||||||||||||||||||||||||
General and administrative expenses | — | — | — | — | — | 148 | 1,793 | 980 | |||||||||||||||||||||||
Total depreciation and amortization expense | $ | — | $ | — | $ | — | $ | — | $ | — | $ | 148 | $ | 1,793 | $ | 980 | |||||||||||||||
Acquisition-related deferred price consideration | |||||||||||||||||||||||||||||||
Research and development expenses | $ | 109 | $ | 115 | $ | 54 | $ | 46 | $ | 40 | $ | 44 | $ | 3 | $ | (3 | ) | ||||||||||||||
Sales and operations expenses | — | — | — | — | — | — | — | — | |||||||||||||||||||||||
General and administrative expenses | — | — | — | (2,218 | ) | — | — | — | — | ||||||||||||||||||||||
Total acquisition-related deferred price consideration | $ | 109 | $ | 115 | $ | 54 | $ | (2,172 | ) | $ | 40 | $ | 44 | $ | 3 | $ | (3 | ) | |||||||||||||
85
(2) We define Revenue ex-TAC as our revenue excluding traffic acquisition costs generated over the applicable measurement period. Revenue ex-TAC is not a measure calculated in accordance with U.S. GAAP. Please see footnote 3 to the "Other Financial and Operating Data" table in “Item 6. Selected Financial Data” in this Form 10-K for more information. Below is a reconciliation of Revenue ex-TAC to revenue, the most directly comparable financial measure calculated and presented in accordance with U.S. GAAP.
Three Months Ended | |||||||||||||||||||||||||||||||||
March 31, 2015 | June 30, 2015 | September 30, 2015 | December 31, 2015 | March 31, 2016 | June 30, 2016 | September 30, 2016 | December 31, 2016 | ||||||||||||||||||||||||||
(in thousands) (unaudited) | |||||||||||||||||||||||||||||||||
Reconciliation of Revenue ex-TAC to Revenue: | |||||||||||||||||||||||||||||||||
Revenue | $ | 294,172 | $ | 299,306 | $ | 332,674 | $ | 397,018 | $ | 401,253 | $ | 407,201 | $ | 423,867 | $ | 566,825 | |||||||||||||||||
Adjustment: | |||||||||||||||||||||||||||||||||
Traffic acquisition costs | (175,888 | ) | (177,239 | ) | (198,970 | ) | (237,056 | ) | (238,755 | ) | (240,969 | ) | (247,310 | ) | (341,877 | ) | |||||||||||||||||
Revenue ex-TAC | $ | 118,284 | $ | 122,067 | $ | 133,704 | $ | 159,962 | $ | 162,498 | $ | 166,232 | $ | 176,557 | $ | 224,948 | |||||||||||||||||
(3) | We define Adjusted EBITDA as our consolidated earnings before financial income (expense), income taxes, depreciation and amortization, adjusted to eliminate the impact of equity awards compensation expense, pension service costs, acquisition-related costs and deferred price consideration. Adjusted EBITDA is not a measure calculated in accordance with U.S. GAAP. Please see footnote 5 to the "Other Financial and Operating Data" table in “Item 6. Selected Financial Data” in this Form 10-K for more information. Below is a reconciliation of Adjusted EBITDA to net income, the most directly comparable financial measure calculated and presented in accordance with U.S. GAAP. |
Three Months Ended | |||||||||||||||||||||||||||||||||
March 31, 2015 | June 30, 2015 | September 30, 2015 | December 31, 2015 | March 31, 2016 | June 30, 2016 | September 30, 2016 | December 31, 2016 | ||||||||||||||||||||||||||
(in thousands) (unaudited) | |||||||||||||||||||||||||||||||||
Reconciliation of Adjusted EBITDA to Net Income: | |||||||||||||||||||||||||||||||||
Net Income | $ | 13,617 | $ | 3,929 | $ | 5,793 | $ | 38,938 | $ | 18,527 | $ | 13,339 | $ | 14,724 | $ | 40,740 | |||||||||||||||||
Adjustments: | |||||||||||||||||||||||||||||||||
Financial (income) expense | (3,920 | ) | 2,546 | 6,650 | (735 | ) | 1,317 | 94 | 570 | (1,435 | ) | ||||||||||||||||||||||
Provision for income taxes | 7,143 | 1,365 | 5,388 | (4,378 | ) | 7,944 | 4,450 | 7,574 | 13,161 | ||||||||||||||||||||||||
Equity awards compensation expense | 6,317 | 5,325 | 4,600 | 7,748 | 8,370 | 7,695 | 13,965 | 13,229 | |||||||||||||||||||||||||
Pension service costs | 112 | 110 | 110 | 109 | 129 | 131 | 132 | 133 | |||||||||||||||||||||||||
Depreciation and amortization expense | 8,428 | 10,278 | 11,892 | 13,967 | 12,516 | 13,300 | 14,771 | 16,190 | |||||||||||||||||||||||||
Acquisition-related costs | — | — | — | — | — | 148 | 1,793 | 980 | |||||||||||||||||||||||||
Acquisition-related deferred price consideration | 109 | 115 | 54 | (2,172 | ) | 40 | 44 | 3 | (3 | ) | |||||||||||||||||||||||
Total net adjustments | 18,189 | 19,739 | 28,694 | 14,539 | 30,316 | 25,862 | 38,808 | 42,255 | |||||||||||||||||||||||||
Adjusted EBITDA | $ | 31,806 | $ | 23,668 | $ | 34,487 | $ | 53,477 | $ | 48,843 | $ | 39,201 | $ | 53,532 | $ | 82,995 | |||||||||||||||||
86
Three Months Ended | |||||||||||||||||||||||||
March 31, 2015 | June 30, 2015 | September 30, 2015 | December 31, 2015 | March 31, 2016 | June 30, 2016 | September 30, 2016 | December 31, 2016 | ||||||||||||||||||
(as a percentage of revenue) (unaudited) | |||||||||||||||||||||||||
Statements of Operations Data: | |||||||||||||||||||||||||
Revenue | 100.0 | % | 100.0 | % | 100.0 | % | 100.0 | % | 100.0 | % | 100.0 | % | 100.0 | % | 100.0 | % | |||||||||
Cost of revenue | |||||||||||||||||||||||||
Traffic acquisition costs | (59.8 | ) | (59.2 | ) | (59.8 | ) | (59.7 | ) | (59.5 | ) | (59.2 | ) | (58.3 | ) | (60.3 | ) | |||||||||
Other cost of revenue | (4.4 | ) | (4.8 | ) | (5.2 | ) | (4.5 | ) | (4.6 | ) | (5.0 | ) | (5.3 | ) | (4.3 | ) | |||||||||
Gross profit | 35.8 | 36.0 | 35.0 | 35.8 | 35.9 | 35.8 | 36.4 | 35.4 | |||||||||||||||||
Operating expenses: | |||||||||||||||||||||||||
Research and development expenses | (6.1 | ) | (6.6 | ) | (6.7 | ) | (6.7 | ) | (6.8 | ) | (7.4 | ) | (7.2 | ) | (6.3 | ) | |||||||||
Sales and operations expenses | (18.0 | ) | (20.0 | ) | (16.9 | ) | (15.2 | ) | (16.1 | ) | (17.0 | ) | (16.1 | ) | (14.3 | ) | |||||||||
General and administrative expenses | (6.0 | ) | (6.8 | ) | (6.0 | ) | (5.4 | ) | (6.2 | ) | (7.0 | ) | (7.7 | ) | (5.6 | ) | |||||||||
Total operating expenses | (30.1 | ) | (33.4 | ) | (29.7 | ) | (27.3 | ) | (29.0 | ) | (31.5 | ) | (31.0 | ) | (26.1 | ) | |||||||||
Income from operations | 5.7 | 2.6 | 5.4 | 8.5 | 6.9 | 4.4 | 5.4 | 9.3 | |||||||||||||||||
Financial income (expense) | 1.3 | (0.9 | ) | (2.0 | ) | 0.2 | (0.3 | ) | — | (0.1 | ) | 0.3 | |||||||||||||
Income before taxes | 7.1 | 1.8 | 3.4 | 8.7 | 6.6 | 4.4 | 5.3 | 9.5 | |||||||||||||||||
Provision for income taxes | (2.4 | ) | (0.5 | ) | (1.6 | ) | 1.1 | (2.0 | ) | (1.1 | ) | (1.8 | ) | (2.3 | ) | ||||||||||
Net income | 4.6 | % | 1.3 | % | 1.7 | % | 9.8 | % | 4.6 | % | 3.3 | % | 3.5 | % | 7.2 | % | |||||||||
Net income available to shareholders of Criteo S.A | 4.4 | % | 1.2 | % | 1.5 | % | 9.6 | % | 4.3 | % | 3.0 | % | 3.2 | % | 7.0 | % | |||||||||
Other Financial Data: | |||||||||||||||||||||||||
Revenue ex-TAC | 40.2 | % | 40.8 | % | 40.2 | % | 40.3 | % | 40.5 | % | 40.8 | % | 41.7 | % | 39.7 | % | |||||||||
Adjusted EBITDA | 10.8 | % | 7.9 | % | 10.4 | % | 13.5 | % | 12.2 | % | 9.6 | % | 12.6 | % | 14.6 | % | |||||||||
87
B. | Liquidity and Capital Resources. |
Market Risk
We are mainly exposed to changes of foreign currency exchange rate fluctuations.
The functional currency of the Company is the euro, while our reporting currency is the U.S. dollars. Consequently, as a first step, since we incur portions of our expenses and derive revenues in currencies other than the euro, we are exposed to foreign currency exchange risk as our results of operations and cash flows are subject to fluctuations in foreign currency exchange rates. Foreign exchange risk exposure also arises from intra-company transactions and financing with subsidiaries that have a functional currency different than the euro. The statements of financial position of consolidated entities having a functional currency different from the U.S. dollar are translated into U.S. dollars at the closing exchange rate (spot exchange rate at the statement of financial position date) and the statement of income, statement of comprehensive income and statement of cash flow of such consolidated entities are translated at the average period to date exchange rate. The resulting translation adjustments are included in equity under the caption “Accumulated Other Comprehensive Income” in the Consolidated Statement of Changes in Equity.
The significant foreign exchange income of $10.1 million for the period ended December 31, 2014 was primarily a result of the translation of $90 million of our initial public offering proceeds into euros at the foreign exchange closing rate, then translated into the U.S. dollar according to the average exchange rate euro / U.S. dollar generating a $11.8 million gain, partially offset by the cost of premiums on related hedging instruments ($2.9 million).
The material foreign exchange loss for the period ended December 31, 2015 was mainly a result of the weakening of the Brazilian Real which resulted in losses on intra-group positions denominated in this currency, associated with a higher related cost of hedging and partially offset by the gain realized on the sale of the $70 million remaining from our initial public offering proceeds.
The $0.5 million financial expense for the period ended December 31, 2016 resulted from the interest incurred as a result of drawing on the General RCF to partially fund the acquisition of HookLogic in November 2016, the negative impact of foreign exchange reevaluations and related hedging mainly recorded during the first quarter, partially offset by the foreign exchange gain realized on the hedging of the HookLogic acquisition.
Since 2013, the Company has had a foreign currency risk management policy in place. At December 31, 2016, our exposure to foreign currency risk was centralized at Criteo S.A. and hedged using foreign currency swaps or forward purchases or sales of foreign currencies.
88
Foreign Currency Risk
A 10% increase or decrease of the Sterling Pound, the Euro, the Japanese Yen or the Brazilian Real against the U.S. dollar would have impacted the Consolidated Statements of Income in Equity including non-controlling interests as follows:
Year Ended December 31, | |||||||||||||||||||||||
2014 | 2015 | 2016 | |||||||||||||||||||||
(in thousands) | |||||||||||||||||||||||
GBP/USD | +10% | -10% | +10% | -10% | +10% | -10% | |||||||||||||||||
Net income impact | $ | 207 | $ | (207 | ) | $ | 14 | $ | (14 | ) | $ | (8 | ) | $ | 8 | ||||||||
Year Ended December 31, | |||||||||||||||||||||||
2014 | 2015 | 2016 | |||||||||||||||||||||
(in thousands) | |||||||||||||||||||||||
BRL/USD | +10% | -10% | +10% | -10% | +10% | -10% | |||||||||||||||||
Net income impact | $ | (111 | ) | $ | 111 | $ | (788 | ) | $ | 788 | $ | 412 | $ | (412 | ) | ||||||||
Year Ended December 31, | |||||||||||||||||||||||
2014 | 2015 | 2016 | |||||||||||||||||||||
(in thousands) | |||||||||||||||||||||||
JPY/USD | +10% | -10% | +10% | -10% | +10% | -10% | |||||||||||||||||
Net income impact | $ | 260 | $ | (260 | ) | $ | 529 | $ | (529 | ) | $ | 982 | $ | (982 | ) | ||||||||
Year Ended December 31, | |||||||||||||||||||||||
2014 | 2015 | 2016 | |||||||||||||||||||||
(in thousands) | |||||||||||||||||||||||
EUR/USD | +10% | -10% | +10% | -10% | +10% | -10% | |||||||||||||||||
Net income impact | $ | 4,916 | $ | (4,916 | ) | $ | 5,794 | $ | (5,794 | ) | $ | 7,785 | $ | (7,785 | ) | ||||||||
Counterparty Risk
As of December 31, 2016, we show a positive net cash position. Since 2012, we have utilized a cash pooling arrangement, reinforcing cash management centralization. Investment and financing decisions are carried out by our internal central treasury function. We only deal with counterparties with high credit ratings. In addition, under our Investment and Risk Management Policy, our central treasury function ensures a balanced distribution between counterparties of the investments, no matter the rating of such counterparty.
89
Liquidity Risk
Year Ended December 31, 2015 | |||||||||||||||||||
Carrying value | Contractual cash flows | Less than 1 year | 1 to 5 years | 5 years + | |||||||||||||||
(in thousands) | |||||||||||||||||||
Trade payables | $ | 246,382 | $ | 246,382 | $ | 246,382 | $ | — | $ | — | |||||||||
Other taxes | 30,463 | 30,463 | 30,463 | — | — | ||||||||||||||
Employee - related payables | 42,275 | 42,275 | 42,275 | — | — | ||||||||||||||
Other current liabilities | 15,531 | 15,531 | 15,531 | — | — | ||||||||||||||
Financial liabilities | 10,428 | 10,779 | 7,254 | 3,183 | 342 | ||||||||||||||
Operating lease arrangements | — | 252,429 | 60,697 | 144,604 | 47,128 | ||||||||||||||
Total | $ | 345,079 | $ | 597,859 | $ | 402,602 | $ | 147,787 | $ | 47,470 | |||||||||
Year Ended December 31, 2016 | |||||||||||||||||||
Carrying value | Contractual cash flows | Less than 1 year | 1 to 5 years | 5 years + | |||||||||||||||
(in thousands) | |||||||||||||||||||
Trade payables | $ | 365,788 | $ | 365,788 | $ | 365,788 | $ | — | $ | — | |||||||||
Other taxes | 44,831 | 44,831 | 44,831 | — | — | ||||||||||||||
Employee - related payables | 55,874 | 55,874 | 55,874 | — | — | ||||||||||||||
Other current liabilities | 30,221 | 30,221 | 30,221 | — | — | ||||||||||||||
Financial liabilities | 85,580 | 93,422 | 10,208 | 83,214 | — | ||||||||||||||
Operating lease arrangements | — | 291,139 | 88,811 | 152,777 | 49,551 | ||||||||||||||
Total | $ | 582,294 | $ | 881,275 | $ | 595,733 | $ | 235,991 | $ | 49,551 | |||||||||
Working Capital
The following table summarizes our cash, cash equivalents and short-term investments, accounts receivable and working capital for the periods indicated:
Year Ended December 31, | |||
2015 | 2016 | ||
Cash flows provided by operating activities | $137,150 | $153,469 | |
Trade receivables, net of allowances | $261,581 | $397,244 | |
Working capital (current assets less current liabilities) | $305,574 | $222,793 | |
Our cash and cash equivalents at December 31, 2016 were held for working capital and general corporate purposes, which could include acquisitions. The decrease in cash and cash equivalents compared with December 31, 2015, primarily resulted from $153.5 million in cash flows from operating activities and $90.6 million in cash flows from financing activities over the period, partially offset by the $312.8 million used for investing activities, including the cash consideration paid for the acquisitions of HookLogic ($265.8 million) and Monsieur Drive ($5.1 million) and $77.4 million in capital expenditures.
In addition, the cash flows were also negatively impacted by a $14.5 million change in foreign exchange rates on our cash position over the period. We do not enter into investments for trading or speculative purposes.
90
Our policy is to invest any cash in excess of our immediate requirements in investments designed to preserve the principal balance and provide liquidity. Accordingly, our cash and cash equivalents are invested primarily in demand deposit accounts and money market funds that are currently providing only a minimal return.
Sources of Liquidity
Our principal sources of liquidity are our cash and cash equivalents and cash generated from operations. Since our inception, we raised a total of $51.1 million aggregate net proceeds from the sale of preferred shares through four private placements. In November 2013, we received aggregate net proceeds before expenses of $269.0 million from our initial public offering. In March 2014, we received aggregate net proceeds before expenses of $22.6 million from our secondary equity offering. We also benefited to a much lesser extent from the proceeds of the exercise of share options and warrants and expect to continue to do so in the future, as such securities are exercised by holders.
We are party to a loan agreement and several revolving credit facilities, or RCFs, with third-party financial institutions. Our loan and RCF agreements as of December 31, 2016 are presented in the table below:
Nominal/ Authorized amounts | Amount drawn (RCF only) | ||||||||||
Nature | (in thousands) | (in thousands) | Interest rate | Settlement date | |||||||
Central loan agreements | |||||||||||
BPI Loan | |||||||||||
February 20, 2014 | € | 3,000 | N/A | Fixed: 2.09% | May 31, 2021 | ||||||
Central RCF | |||||||||||
Bpifrance Financement | |||||||||||
February 20, 2014 | € | 2,000 | € | 50 | Floating rate: EURIBOR 3M + 0.7% 0.39% as of December 31, 2016 | February 28, 2017 | |||||
Bank Syndicate | |||||||||||
September 24, 2015 | € | 250,000 | $ | 75,000 | Floating rate: EURIBOR / LIBOR + margin depending on leverage ratio 1.73% as of December 31, 2016 | September 23, 2020 | |||||
China RCF | |||||||||||
HSBC RCF | |||||||||||
October 3, 2014 | RMB 40,000 | RMB 30,000 | Floating rate: + 10% 4.79% as of December 31, 2016 | N/A | |||||||
In September 2015, Criteo entered into the General RCF for general corporate purposes, including acquisitions, for a maximum amount of €250 million ($263.5 million), with a bank syndicate composed of Natixis (coordinator and documentation agent), Le Credit Lyonnais ("LCL") (facility agent), HSBC France, Société Générale Corporate & Investment Banking and BNP Paribas (each acting individually as book runners and mandated lead arrangers). This multi-currency RCF bears interest at the relevant EURIBOR or LIBOR plus a variable margin (adjusted on the basis of the leverage ratio). As of December 31, 2016, $75.0 million had been drawn, which was used to partially fund the consideration paid to acquire all of the outstanding shares of HookLogic.
We were party to a loan agreement with LCL to finance certain capital expenditures. The loan matured in June 2016. As a result, at December 31, 2016, there was no amount outstanding under the loan agreement.
In February 2014, we entered into a loan agreement with Bpifrance Financement (French Public Investment Bank) to support our development. This is a fixed rate seven-year term loan for €3 million ($3.2 million) which is to be amortized quarterly after a two-year grace period.
91
In February 2014 we also entered into a three-year RCF with Bpifrance Financement (French Public Investment Bank). Upon origination, this agreement allowed for a maximum amount of €3 million ($3.2 million) in the first year, decreasing by €1.0 million ($1.1 million) in each subsequent year. As of December 31, 2016, we are authorized to draw €1.0 million ($1.1 million). The interest rate is the three month EURIBOR rate plus a 0.70% margin. A 0.30% commitment fee may be due on a quarterly basis, depending on the amount used. At December 31, 2016, €0.1 million ($0.1 million) had been drawn.
In October 2014, we entered into a RCF with HSBC (the "China RCF") to support the development of our Chinese subsidiary for a total amount, as amended in May 2015, of RMB 40.0 million ($5.8 million). Interest is determined at a rate equal to the benchmark lending rate effective on the loan drawdown date promulgated by the People’s Bank of China with a 10% mark up and payable when the loan matures. At December 31, 2016, RMB 30.0 million ($4.3 million) were drawn.
All of these loans are unsecured and contain customary events of default but do not contain any affirmative,
financial or negative covenants, with the exception of the General RCF, which contains covenants, including covenants requiring maintenance of a minimum total net debt to Adjusted EBITDA ratio, restricting our ability to pay dividends, and restricting the incurrence of additional indebtedness. At December 31, 2016, the level of leverage required was met.
We are also party to short-term credit lines and overdraft facilities with HSBC plc and LCL. We are authorized to draw up to a maximum of €9.4 million ($9.9 million) in the aggregate under the short-term credit lines and overdraft facilities. As of December 31, 2016, we had not drawn on either of these facilities. Any loans or overdrafts under these short-term facilities bear interest based on the one month EURIBOR rate or three month EURIBOR rate. As these facilities are exclusively short-term credit and overdraft facilities, our banks have the ability to terminate such facilities on short notice.
Operating and Capital Expenditure Requirements
In 2015 and 2016, our actual capital expenditures were $74.5 million and $77.4 million, respectively, primarily related to the acquisition of data center and server equipment, fit out of new offices and internal IT systems. We expect our capital expenditures to remain at the level of approximately 5% of revenue for 2017, as we plan to continue to build and maintain additional data center equipment capacity in all regions and significantly increase our redundancy capacity to strengthen our infrastructure.
As part of our strategy to build upon our market and technology leadership, in November 2016, we acquired all of the outstanding shares of HookLogic. The total consideration paid was $ 250.1 million for the acquisition of the shares. The acquisition was financed by (i) a $75.0 million amount drawn on the General RCF and (ii) a $175.1 million amount financed by the available cash resources.
We believe our existing cash balances will be sufficient to meet our anticipated cash requirements through at least the next 12 months.
Our future working capital requirements will depend on many factors, including the rate of our revenue growth, the amount and timing of our investments in personnel and capital equipment, and the timing and extent of our introduction of new products and product enhancements. If our cash and cash equivalents balances and cash flows from operating activities are insufficient to satisfy our liquidity requirements, we may need to raise additional funds through equity, equity-linked or debt financings to support our operations, and such financings may not be available to us on acceptable terms, or at all. We may also need to raise additional funds in the event we determine in the future to effect one or more acquisitions of businesses, technologies, assets or products.
If we are unable to raise additional funds when needed, our operations and ability to execute our business strategy could be adversely affected. If we raise additional funds through the incurrence of indebtedness, such indebtedness
92
would have rights that are senior to holders of our equity securities and could contain covenants that restrict our operations. Any additional equity financing will be dilutive to our shareholders.
Historical Cash Flows
The following table sets forth our cash flows for 2014, 2015 and 2016:
Year Ended December 31, | |||||||||||
2014 | 2015 | 2016 | |||||||||
(in thousands) | |||||||||||
Cash flows provided by operating activities | $ | 116,281 | $ | 137,150 | $ | 153,469 | |||||
Cash used in investing activities | (75,281 | ) | (101,633 | ) | (312,763 | ) | |||||
Cash from financing activities | $ | 31,013 | $ | 7,811 | $ | 90,570 | |||||
Operating Activities
Cash flows provided by operating activities are primarily driven by the increase in the number of clients using our solution, the increase in spending from our existing clients and investment in personnel and infrastructure to support the anticipated growth of our business. Cash flows provided by operating activities have typically been generated from net income and by changes in our operating assets and liabilities, particularly in the areas of accounts receivable and accounts payable and accrued expenses, adjusted for non-cash and non-operating expense items such as depreciation, amortization, equity awards compensation, deferred tax assets and income taxes.
In 2016, net cash flows provided by operating activities were $153.5 million and consisted of net income of $87.3 million and $139.1 million in adjustments for non-cash and non-operating items partially offset by $29.5 million of cash flows used by working capital and $43.5 million of income taxes paid during 2016. Adjustments for non-cash and non-operating items primarily consisted of depreciation and amortization expense of $62.7 million, equity awards compensation expense of $43.3 million and $43.2 million of accrued income taxes, partially offset by $10.0 million of changes in deferred tax assets and $0.1 million of change in non-current assets. The $29.5 million decrease in cash resulting from changes in working capital primarily consisted of $118.0 million increase in accounts receivable and $28.4 million increase in other current assets (including prepaid expenses and VAT receivables) driven by increased revenue during the year and, to a lesser extent, an increase in office rental advance payments. This was partially offset by an $81.9 million increase in accounts payable and $35.1 million increase in accrued expenses such as payroll and payroll related expenses and VAT payables, explained primarily by an increase in traffic acquisition costs, and an increase in accrued payroll and payroll-related expenses resulting from an increase in the number of our employees.
In 2015, net cash flows provided by operating activities were $137.2 million and consisted of net income of $62.3 million, $78.4 million in adjustments for non-cash and non-operating items and $15.2 million of cash provided by working capital, partially offset by $18.8 million of income taxes paid during 2015. Adjustments for non-cash and non-operating items primarily consisted of depreciation and amortization expense of $47.1 million, equity awards compensation expense of $24.0 million and $25.2 million of accrued income taxes, partially offset by $15.7 million of changes in deferred tax assets and $2.1 million of changes in non-current assets. The $15.2 million increase in cash resulting from changes in working capital primarily consisted of a $100.0 million increase in accounts payable and a $22.7 million increase in accrued expenses such as payroll and payroll-related expenses and VAT payables, driven primarily by an increase in traffic acquisition costs, and an increase in accrued payroll and payroll related expenses resulting from an increase in the number of our employees. This was partially offset by an increase in accounts receivable resulting in a decrease in cash flow of $83.4 million primarily driven by increased revenue during the year as we continue to expand our operations.
Prepaid expenses, VAT receivables, and other current assets also increased by $24.1 million, primarily as the result of an increase in our revenue and to a lesser extent, an increase in office rental advance payments.
93
In 2014, net cash flows provided by operating activities were $116.3 million and consisted of net income of $46.9 million, $71.5 million in adjustments for non-cash and non-operating items and $4.7 million million of cash provided by working capital, partially offset by $6.8 million of income taxes paid during 2014. Adjustments for non-cash and non-operating items primarily consisted of depreciation and amortization expense of $33.4 million, equity awards compensation expense of $19.6 million and $22.9 million of accrued income taxes, partially offset by $5.3 million of changes in deferred tax assets. The $4.7 million increase in cash resulting from changes in working capital primarily consisted of an increase in operating cash flow due to a $70.6 million increase in accounts payable and a $25.7 million increase in accrued expenses such as payroll and payroll related expenses and VAT payables, driven primarily by an increase in traffic acquisition costs and an increase in the number of our employees. This was partially offset by an increase in accounts receivable of $83.6 million, primarily driven by increased revenue during the year as we continue to expand our operations and an increase in the average days outstanding of our accounts receivable. Prepaid expenses, VAT receivables, and other current assets also increased by $8.0 million, primarily the result of an increase in our revenue and to a lesser extent, an increase in office rental advance payments.
Investing Activities
Our investing activities to date have consisted primarily of purchases of property and equipment and acquisitions.
In 2016, net cash flows used in investing activities were $(312.8) million and consisted of $77.4 million for purchases of property and equipment, $235.5 million related to the Hooklogic and Monsieur Drive acquisitions and $0.2 million of bank deposits or lease deposits related to new premises.
In 2015, net cash flows used in investing activities were $101.6 million and consisted of $74.5 million for purchases of property and equipment, $20.5 million related to the DataPop acquisition and Tedemis earn-out and $6.6 million of bank deposits or lease deposits related to new premises.
In 2014, net cash flows used in investing activities were $75.3 million and consisted of $46.9 million for purchases of property and equipment, $26.1 million related to the Tedemis and Adquantic acquisitions and $2.3 million composed of bank deposits or lease deposits related to new premises.
Financing Activities
In 2016, net cash provided by financing activities was $90.6 million resulting from $84.0 million of new loans (drawings on the General RCF to partially fund the consideration paid to acquire all of the outstanding shares of HookLogic and the China RCF) and $20.1 million from proceeds of share option exercises, partially offset by $13.3 million for repayment of indebtedness and $0.2 million of changes in other financial liabilities.
In 2015, net cash provided by financing activities was $7.8 million resulting from $13.8 million from proceeds of share option exercises and $4.0 million of new loans under the China RCF, partially offset by $9.0 million for repayment of indebtedness and $1.0 million of changes in other financial liabilities.
In 2014, net cash provided by financing activities was $31.0 million resulting from $20.2 million in net proceeds from our secondary equity offering in March 2014, $11.4 million from proceeds of share option exercises, $5.6 million of new loans and $0.3 million of lease deposits, partially offset by $6.5 million for repayment of indebtedness.
94
C. | Research and Development, Patents and Licenses, etc. |
We invest substantial resources in research and development to enhance our solution and technology infrastructure, develop new features, conduct quality assurance testing and improve our core technology. Our engineering group is primarily located in research and development centers in Paris, France,Palo Alto, California and Ann Arbor, Michigan. We expect to continue to expand the capabilities of our technology in the future and to invest significantly in continued research and development efforts. We had 603 employees primarily engaged in research and development at December 31, 2016. Research and development expense totaled $60.1 million, $86.8 million and $123.6 million for 2014, 2015 and 2016, respectively.
D. | Trend Information. |
Key Metrics
We review three key metrics to help us monitor the performance of our business and to identify trends affecting our business. These key metrics include number of clients, Revenue ex-TAC, and Adjusted EBITDA. We believe these metrics are useful to understanding the underlying trends in our business. The following table summarizes our key metrics for 2014, 2015 and 2016.
Year Ended December 31, | |||||||||||
2014 | 2015 | 2016 | |||||||||
(in thousands, except number of clients) | |||||||||||
Number of clients | 7,190 | 10,198 | 14,468 | ||||||||
Revenue ex-TAC | $ | 402,757 | $ | 534,017 | $ | 730,235 | |||||
Adjusted EBITDA | $ | 105,352 | $ | 143,435 | $ | 224,572 | |||||
Number of Clients
We define a client to be a unique party from whom we have received an insertion order and delivered an advertisement during the previous 12 months. We believe this criteria best identifies clients who are actively using our solution. We count specific brands or divisions within the same business as distinct clients so long as those entities have separately signed insertion orders with us. In the case of Criteo Sponsored Products, we count the parent company of the brands as an individual client, even if several distinct brands pertaining to the same parent company have signed separate insertion orders with us. On the other hand, we count a client who runs campaigns in multiple geographies as a single client, even though multiple insertion orders may be involved. When the insertion order is with an advertising agency, we generally consider the client on whose behalf the advertising campaign is conducted as the “client” for purposes of this calculation. In the event a client has its advertising spend with us managed by multiple agencies, that client is counted as a single client.
We believe that our ability to increase the number of clients using our solution is an important indicator of our ability to grow revenue over time. While our client count has increased over time, this metric can also fluctuate from quarter to quarter due to the seasonal trends in advertising spend of advertisers and timing and amount of revenue contribution from new clients. In addition, over time we have added an increasing number of midmarket clients that generate a lower revenue per client than large clients on average, and may continue to add a significant number of midmarket clients in the future. Therefore, there is not necessarily a direct correlation between a change in clients in a particular period and an increase or decrease in our revenue.
95
Revenue ex-TAC
We consider Revenue ex-TAC as a key measure of our business activity. Our traffic acquisition costs primarily consist of purchases of impressions from publishers on a CPM basis.
Our management views our Revenue ex-TAC as a key measure to evaluate, plan and make decisions on our business activities and sales performance. In particular, we believe that the elimination of TAC from revenue can provide a useful measure for period-to-period comparisons of our core business. Accordingly, we believe that Revenue ex-TAC provides useful information to investors and others in understanding and evaluating our results of operations in the same manner as our management and board of directors. Revenue ex-TAC is not a measure calculated in accordance with U.S. GAAP. Please see footnote 3 to the "Other Financial and Operating Data" table in "Item 6. Selected Financial Data" in this Form 10-K for a discussion of the limitations of Revenue ex-TAC and a reconciliation of Revenue ex-TAC to revenue, the most comparable U.S. GAAP measure, for 2012, 2013, 2014, 2015 and 2016.
Adjusted EBITDA
Adjusted EBITDA represents our consolidated earnings before financial income (expense), income taxes, depreciation and amortization, adjusted to eliminate the impact of equity awards compensation expense, pension service costs and acquisition-related costs and deferred price consideration. Adjusted EBITDA is a key measure used by management to evaluate operating performance, generate future operating plans and make strategic decisions regarding the allocation of capital. In particular, we believe that the elimination of equity awards compensation expense, pension service costs and acquisition-related costs and deferred price consideration in calculating Adjusted EBITDA can provide a useful measure for period-to-period comparisons of our core business.
Accordingly, we believe that Adjusted EBITDA provides useful information to investors and others in understanding and evaluating our results of operations in the same manner as our management and board of directors. Adjusted EBITDA is not a measure calculated in accordance with U.S. GAAP. Please see footnote 5 to the "Other Financial and Operating Data" table in "Item 6. Selected Financial Data" in this Form 10-K for a discussion of the limitations of Adjusted EBITDA and a reconciliation of Adjusted EBITDA to net income, the most comparable U.S. GAAP measure, for 2012, 2013, 2014, 2015 and 2016.
Highlights and Trends
Revenue
Our revenue for 2016 was $1,799.1 million, a 36% increase over 2015 (or 36% on a constant currency basis). The increase in revenue in 2016 was primarily driven by the expansion of our business with existing clients across all regions, as well as the addition of new clients across all our markets, including a mix of large and midmarket clients. Our revenue growth was balanced from a geographic standpoint, with the Americas, Asia-Pacific and EMEA growing revenue 45% (or 45% on a constant currency basis), 48% (or 37% on a constant currency basis) and 22% (or 26% on a constant currency basis), respectively, for 2016 over 2015.
We believe the expansion of our business with existing clients as well as the addition of new clients have both been significant contributors to our historical growth. As a result, we believe significant opportunities exist for us to continue to grow our business. Specifically, we believe that continued investment in technology innovation and data, expansion into new marketing channels, including search and sponsored product advertisements on retailers' sites, the development of a larger user graph across devices, the expansion of our client base across commerce and brands verticals, the addition of new clients across categories, in particular in the midmarket, and a higher penetration of existing and new geographic markets, will fuel our future growth. However, we may not be able to maintain our current growth rates.
96
Revenue ex-TAC
We are focused on maximizing our Revenue ex-TAC on an absolute basis. We believe this focus builds sustainable long-term value for our business by fortifying a number of our competitive strengths, including access to advertising inventory, breadth and depth of data and continuous improvement of the Criteo Engine’s performance, allowing us to deliver more relevant advertisements at scale. As part of this focus we are continuing to invest in building relationships with direct publishers, including with ecommerce retailers, and increasing access to leading advertising exchanges, which includes purchasing advertising inventory that may have lower margins on an individual impression basis, but generates incremental Revenue ex-TAC. We believe this strategy maximizes the growth of our Revenue ex-TAC on an absolute basis and strengthens our market position. As a result, we expect our traffic acquisition costs to continue to increase on an absolute basis as we continue to grow our revenue. However, our traffic acquisition costs might also increase as a percentage of revenue as we continue to invest in building liquidity and long-term value for advertisers and publishers over optimizing near-term gross margins.
Our Revenue ex-TAC for 2016 was $730.2 million, a 37% increase over 2015 (or 37% on a constant currency basis). This increase reflects solid momentum across all regions, as we continued to expand our business with existing clients and added new clients across large and midmarket advertisers, in both existing and new geographic markets. In particular, Revenue ex-TAC increased by 42% (or 42% on a constant currency basis) in the Americas for 2016 compared to 2015 as we engaged with new large clients, continued to increase revenue from existing large clients, saw continued strong traction from midmarket clients across the region, and benefited from the contribution of Criteo Sponsored Products in the fourth quarter. In the Asia-Pacific region, Revenue ex-TAC increased by 50% (or 40% on a constant currency basis) for 2016 compared to 2015 as we continued to expand our business with new and existing clients across the region, in particular in Japan and Korea, and saw continued solid growth across South-East Asian markets. In addition, Revenue ex-TAC increased by 26% (or 30% on a constant currency basis) in EMEA for 2016 compared to 2015, as we signed several large and midmarket clients across all markets in the region and continued to grow our revenue from existing clients in all categories and markets. Revenue ex-TAC is not a measure calculated in accordance with U.S. GAAP. Please see footnote 3 to the "Other Financial and Operating Data" table in "Item 6. Selected Financial Data" in this Form 10-K for a discussion of the limitations of Revenue ex-TAC and a reconciliation of Revenue ex-TAC to revenue, the most comparable U.S. GAAP measure.
Adjusted EBITDA
Our Adjusted EBITDA for 2016 was $224.6 million, a 57% increase over 2015. Our increase in Adjusted EBITDA for 2016 compared to 2015 was primarily the result of the 37% growth in Revenue ex-TAC over the period. This increase in Adjusted EBITDA was achieved despite the significant increase in investments in 2016, especially in hosting costs, research and development expenses and general and administrative expenses, as we continued to scale our infrastructure and organization to support future growth. In the short-term, we expect to continue to invest in our resources, in particular in launching and scaling Criteo Predictive Search in key markets and integrating Criteo Sponsored Products into our technology platform. As a result of these increased investments, we anticipate moderate growth in Adjusted EBITDA. Over time, we expect Adjusted EBITDA to increase as a percentage of our Revenue ex-TAC, as we benefit from a larger scale and operating leverage. Adjusted EBITDA is not a measure calculated in accordance with U.S. GAAP. Please see footnote 5 to the to the "Other Financial and Operating Data" table in "Item 6. Selected Financial Data" in this Form 10-K for a discussion of the limitations of Adjusted EBITDA and a reconciliation of Adjusted EBITDA to net income, the most comparable U.S. GAAP measure.
Number of Clients
Since our inception, we have significantly grown the number of clients with which we do business. Our base of clients increased to more than 14,000 at December 31, 2016, a 42% increase over December 31, 2015. This growth in the number of clients using our solution has been driven by a number of factors, including our global footprint expansion, our continued development of large clients in the retail, travel and classifieds industry verticals, our strong commercial success with midmarket clients and our penetration into the consumer brand vertical through Criteo Sponsored Products further to the HookLogic acquisition. We believe that our ability to increase the number of clients using our solution is a leading indicator of our ability to grow revenue over time. We expect to continue to focus our attention and investment on further growing our client base across all regions, client categories and verticals. While we intend to grow our client base across all categories, we expect midmarket customers to continue to increase their contribution in the mix of our total client base.
97
Client Retention
We believe our ability to retain and grow revenue from our live clients is a useful indicator of the stability of our revenue base and the long-term value of our client relationships. Our technology solution is designed to enable clients to efficiently and effectively engage and convert consumers through highly targeted and personalized digital advertisements across marketing channels. We measure our client satisfaction through our ability to retain them and the revenue they generate quarter after quarter. We define client retention rate as the percentage of live clients during the previous quarter that continued to be live clients during the current quarter. This metric is calculated on a quarterly basis, and for annual periods, we use an average of the quarterly metrics. We define a live client as a client whose advertising campaign has or had been generating Revenue ex-TAC for us on any day over the relevant measurement period. In each of 2014, 2015 and 2016, our client retention rate was approximately 90%. We define our revenue retention rate with respect to a given 12-month period as (1) revenue recognized during such period from clients that contributed to revenue recognized in the prior 12-month period divided by (2) total revenue recognized in such prior 12-month period. Our revenue retention rate was 147%, 138% and 120% for the years ended December 31, 2014, 2015 and 2016, respectively.
Seasonality
Our client base consists primarily of businesses in the online retail, classifieds and travel industries. In the digital retail industry in particular, many businesses devote the largest portion of their advertising spend to the fourth quarter of the calendar year, to coincide with increased holiday spending by consumers. With respect to Criteo Sponsored Products, the concentration of advertising spend in the fourth quarter of the calendar year is particularly pronounced, compared to our other products. Our ecommerce retail clients typically conduct fewer advertising campaigns in the first and second quarters than they do in other quarters, while our travel clients typically increase their travel campaigns in the first and third quarters and conduct fewer advertising campaigns in the second quarter than they do in other quarters. As a result, our revenue tends to be seasonal in nature but the impact of this seasonality has been partly offset by our significant growth and geographic expansion. If the seasonal fluctuations become more pronounced, our operating cash flows could fluctuate materially from period to period.
E. | Off-balance Sheet Arrangements. |
We do not have any relationships with unconsolidated entities or financial partnerships, including entities sometimes referred to as structured finance or special purpose entities that were established for the purpose of facilitating off-balance sheet arrangements or other contractually narrow or limited purposes. In addition, we do not engage in trading activities involving non-exchange traded contracts. We therefore believe that we are not materially exposed to any financing, liquidity, market or credit risk that could arise if we had engaged in these relationships.
F. | Tabular Disclosure of Contractual Obligations. |
The following table discloses aggregate information about material contractual obligations and periods in which payments were due as of December 31, 2016. Future events could cause actual payments to differ from these estimates.
Less than 1 year | 1 to 5 years | More than 5 years | Total | ||||||||||||
(in thousands of U.S. Dollars) | |||||||||||||||
Long-term debt | $ | 7,763 | $ | 83,000 | $ | — | $ | 90,763 | |||||||
Operating Leases | 88,811 | 152,777 | 49,551 | 291,139 | |||||||||||
- Property leases | 33,655 | 98,938 | 49,551 | 182,144 | |||||||||||
- Hosting leases | 50,959 | 48,927 | — | 99,886 | |||||||||||
- Other leases | 4,197 | 4,912 | — | 9,109 | |||||||||||
Other financial liabilities | 478 | 214 | — | 692 | |||||||||||
Financial derivatives | 1,967 | — | — | 1,967 | |||||||||||
Total | $ | 99,019 | $ | 235,991 | $ | 49,551 | $ | 384,561 | |||||||
98
The commitment amounts in the table above are associated with contracts that are enforceable and legally binding and that specify all significant terms, including interest on long-term debt, fixed or minimum services to be used, fixed, minimum or variable price provisions, and the approximate timing of the actions under the contracts. The table does not include obligations under agreements that we can cancel without a significant penalty. The current portion of long-term debt (due in less than one year) includes accrued interest of $2.2 million. Pension contributions and cash outflows have not been included in the above table as they have been deemed immaterial.
G. | Safe Harbor. |
This Form 10-K contains forward-looking statements within the meaning of Section 27A of the Securities Act and Section 21E of the Exchange Act and as defined in the Private Securities Litigation Reform Act of 1995. See "Special Note Regarding Forward-Looking Statements."
Item 7A. Quantitative and Qualitative Disclosures About Market Risk
We are mainly exposed to changes of foreign currency exchange rate fluctuations.
For a description of our foreign exchange risk and a sensitivity analysis of the impact of foreign currency exchange rates on our net income, please see "Item 7. Management's Discussion and Analysis of Financial Condition and Results of Operations – B. Liquidity and Capital Resources" in this Form 10-K.
Item 8. Financial Statements and Supplementary Data
The information required by Item 8 is set forth on pages F-1 through F-56 of this Form 10-K.
99
Item 9. Changes in and Disagreements with Accountants on Accounting and Financial Disclosure
There have been no changes in our independent registered public accounting firm, Deloitte & Associés, or disagreements with our accountants on matters of accounting and financial disclosure.
Item 9A. Controls and Procedures
Evaluation of Disclosure Controls and Procedures
Criteo carried out an evaluation as of December 31, 2016, under the supervision and with the participation of our management, including our Chief Executive Officer and our Chief Financial Officer, of the effectiveness of our disclosure controls and procedures, as such term is defined in Rules 13a-15(e) and 15d-15(e) under the Exchange Act. Disclosure controls and procedures are controls and other procedures designed to reasonably assure that information required to be disclosed in our reports filed or furnished under the Exchange Act, such as this Annual Report on Form 10-K, is recorded, processed, summarized and reported within the time periods specified in the SEC's rules and forms.
Disclosure controls and procedures are also designed to reasonably assure that this information is accumulated and communicated to our management, including our Chief Executive Officer and our Chief Financial Officer, to allow timely decisions regarding required disclosure.
Based on that evaluation, our Chief Executive Officer and Chief Financial Officer have concluded that, as of December 31, 2016, our disclosure controls and procedures were effective to provide reasonable assurance.
Management’s Annual Report on Internal Control Over Financial Reporting
Our management is responsible for establishing and maintaining adequate internal control over financial reporting, as such term is defined in Rule 13a-15(f) under the Exchange Act. Our management assessed, with the oversight of our board of directors, the effectiveness of our internal control over financial reporting as of December 31, 2016. In making this assessment, our management used the criteria established in the Internal Control—Integrated Framework (2013) issued by the Committee of Sponsoring Organizations of the Treadway Commission. Based on this assessment, our management has concluded that the Company's internal control over financial reporting was effective as of December 31, 2016. The effectiveness of the Company's internal control over financial reporting as of December 31, 2016 has been audited by Deloitte & Associés, an independent registered public accounting firm, as stated in its attestation report, which appears on page F-3 of this Annual Report on Form 10-K.
Changes in Internal Control Over Financial Reporting
There were no changes in our internal control over financial reporting, as such term is defined in Rules 13a-15(f) and 15d-15(f) under the Exchange Act, that occurred during the quarter ended December 31, 2016, that have materially affected, or that are reasonably likely to materially affect, our internal control over financial reporting.
Our management, including our Chief Executive Officer and Chief Financial Officer, does not expect that our disclosure controls and procedures or our internal controls will prevent all error and all fraud. A control system, no matter how well conceived and operated, can provide only reasonable, not absolute, assurance that the objectives of the control system are met. Further, the design of a control system must reflect the fact that there are resource constraints, and the benefits of controls must be considered relative to their costs. Because of the inherent limitations in all control systems, no evaluation of controls can provide absolute assurance that all control issues and instances of fraud, if any, within Criteo have been detected. These inherent limitations include the realities that judgments in decisions making can be faulty and that breakdowns can occur because of simple error or mistake. Controls can also be circumvented by the individual acts of some persons, by collusion of two or more people, or by management override of the controls. The design of any system of controls is based in part on certain assumptions about the likelihood of future events, and there can be no assurance that any design will succeed in achieving its stated goals under all potential future conditions. Over time, controls may become inadequate because of changes in conditions or deterioration in the degree of compliance with policies and procedures. Because of the inherent limitations in a cost-effective control system, misstatements due to error or fraud may occur and not be detected.
100
Item 9B. Other Information
None.
101
PART III
Item 10. Directors, Executive Officers and Corporate Governance
The information required by this item (other than the information set forth in the next paragraph in this Item 10) will be included in our definitive proxy statement with respect to our 2017 Annual Shareholders’ Meeting to be filed with the SEC, and is incorporated herein by reference.
We have adopted a Code of Business Conduct and Ethics (the "Code of Conduct") that is applicable to all of our employees, officers and directors, including our chief executive and senior financial officers. The Code of Conduct is available on our website at criteo.investorroom.com under "Corporate Governance." The Audit Committee of our board of directors is responsible for overseeing the Code of Conduct and our board of directors is required to approve any waivers of the Code of Conduct for employees, executive officers and directors. We expect that any amendments to the Code of Conduct, or any waivers of its requirements required to be disclosed under the rules of the SEC or Nasdaq will be disclosed on our website.
Item 11. Executive Compensation
The information called for by this item will be included in our definitive proxy statement with respect to our 2017 Annual Shareholders’ Meeting to be filed with the SEC, and is incorporated herein by reference.
Item 12. Security Ownership of Certain Beneficial Owners and Management and Related Stockholder Matters
The information called for by this item will be included in our definitive proxy statement with respect to our 2017 Annual Meeting of Shareholders to be filed with the SEC, and is incorporated herein by reference.
Item 13. Certain Relationships and Related Transactions, and Director Independence
The information called for by this item will be included in our definitive proxy statement with respect to our 2017 Annual Meeting of Shareholders to be filed with the SEC, and is incorporated herein by reference.
Item 14. Principal Accounting Fees and Services
The information called for by this item will be included in our definitive proxy statement with respect to our 2017 Annual Meeting of Shareholders to be filed with the SEC, and is incorporated herein by reference.
PART IV
Item 15. Exhibits and Financial Statement Schedules
(a) Financial Statements
The financial statements listed in the accompanying Index to Consolidated Financial Statements on page F-1 are filed as part of this Form 10-K. All schedules are omitted because they are not applicable or the required information is shown in the financial statements or notes thereto.
(b) Exhibits
102
Incorporated by Reference | |||||||||
Exhibit | Description | Schedule/ Form | File Number | Exhibit | File Date | ||||
2.1 | Merger Agreement, dated as of October 3, 2016, by and among Criteo Corp., TBL Holdings, Inc., Hooklogic, Inc. and Fortis Advisors LLC | 8-K | 001-36153 | 2.1 | October 4, 2016 | ||||
3.1 | By-laws (statuts) (English translation) | 10-Q | 001-36153 | 3.1 | November 7, 2016 | ||||
4.1 | Form of Deposit Agreement, including the Form of American Depositary Receipt | F-1 | 333-191223 | 4.1 | October 2, 2013 | ||||
4.2 | Multicurrency Revolving Facility Agreement, dated September 24, 2015, among the registrant and BNP Paribas, Crédit Lyonnais (LCL), HSBC France, Natixis and Société Générale Corporate & Investment Banking | 10-K | 001-36153 | 4.2 | February 29, 2016 | ||||
4.3# | Agreement to Furnish Debt Instruments | ||||||||
10.1 | Commercial Lease between Orosdi and the registrant dated January 20, 2012 (English translation) | F-1 | 333-191223 | 10.1 | October 2, 2013 | ||||
10.2 | Form of Registration Rights Agreement by and among the registrant and certain investors signatory thereto, dated as of August 30, 2013 | F-1 | 333-191223 | 10.3 | October 23, 2013 | ||||
10.3† | Form of Indemnification Agreement between the registrant and each of its executive officers and directors | F-1 | 333-191223 | 10.4 | October 23, 2013 | ||||
10.4† | Non-Compete Agreement between the registrant and each of Messrs. Rudelle, Le Ouay and Niccoli | F-1 | 333-191223 | 10.5 | October 2, 2013 | ||||
10.5† | Stock Option Plans—2009, 2010, 2011, 2012, 2013 (including forms of Stock Option Grant Agreement and Exercise Notice) | F-1 | 333-191223 | 10.6 | October 2, 2013 | ||||
10.6† | 2014 Stock Option Plan (including forms of Stock Option Grant Agreement and Exercise Notice) | S-8 | 333-197373 | 99.1 | July 11, 2014 | ||||
10.7† | 2016 Stock Option Plan (including form of Stock Option Grant Agreement and Exercise Notice) (English Translation) | 8-K | 001-36153 | 10.1 | June 30, 2016 | ||||
10.8† | Summary of BSA Terms and Conditions | 10-K | 001-36153 | 10.7 | February 29, 2016 | ||||
10.9#† | Form of BSA Grant Document (English translation) | ||||||||
10.10† | Summary of BSPCE Plan | F-1 | 333-191223 | 10.8 | September 18, 2013 | ||||
10.11† | Form of BSPCE Grant Document (English translation) | F-1 | 333-191223 | 10.11 | September 18, 2013 | ||||
10.12† | Amended and Restated 2015 Performance-Based Free Share Plan (including form of Allocation Letter) (English Translation) | 8-K | 001-36153 | 10.3 | June 30, 2016 | ||||
103
Incorporated by Reference | |||||||||
Exhibit | Description | Schedule/ Form | File Number | Exhibit | File Date | ||||
10.13† | Amended and Restated 2015 Time-Based Free Share Plan (including form of Allocation Letter) (English Translation) | S-8 | 333-212722 | 99.3 | July 28, 2016 | ||||
10.14† | Criteo Executive Bonus Plan | 10-K | 001-36153 | 10.15 | February 29, 2016 | ||||
10.15† | Employment Agreement between the registrant and Benoit Fouilland, dated November 18, 2011 (English translation) | F-1 | 333-191223 | 10.12 | October 2, 2013 | ||||
10.16† | Management Agreement between the registrant and Eric Eichmann, dated as of October 27, 2016 | 8-K | 001-36153 | 10.1 | November 2, 2016 | ||||
10.17† | Employment Offer Letter between the registrant and Jean-Baptiste Rudelle, effective as of August 1, 2014 | 20-F | 001-36153 | 4.14 | March 27, 2015 | ||||
10.18† | Employment Agreement between the registrant and Romain Niccoli, effective as of March 2006, and amendments thereto | 20-F | 001-36153 | 4.15 | March 27, 2015 | ||||
21.1# | List of Subsidiaries | ||||||||
23.1# | Consent of Deloitte & Associés | ||||||||
31.1# | Certificate of Chief Executive Officer pursuant to Section 302 of the Sarbanes-Oxley Act of 2002 | ||||||||
31.2# | Certificate of Chief Financial Officer pursuant to Section 302 of the Sarbanes-Oxley Act of 2002 | ||||||||
32.1* | Certificate of Chief Executive Officer and Chief Financial Officer pursuant to 18 U.S.C. §1350, as adopted pursuant to Section 906 of the Sarbanes-Oxley Act of 2002 | ||||||||
† | Indicates management contract or compensatory plan. |
# | Filed herewith. |
* | Furnished herewith. |
Item 16. Form 10-K Summary
Not applicable.
104
SIGNATURES
Pursuant to the requirements of the Securities Exchange Act of 1934, the registrant has duly caused this report to be signed on its behalf by the undersigned thereunto duly authorized.
CRITEO S.A. | ||
March 1, 2017 | By: | /s/ Eric Eichmann |
Eric Eichmann | ||
Chief Executive Officer | ||
Pursuant to the requirements of the Securities Exchange Act of 1934, this report has been signed below by the following persons in the capacities and on the dates indicated below.
Signature | Title | Date | ||
/s/ Eric Eichmann | Chief Executive Officer & Director (Principal Executive Officer) | March 1, 2017 | ||
Eric Eichmann | ||||
/s/ Benoit Fouilland | Chief Financial Officer (Principal Financial Officer and Principal Accounting Officer) | |||
Benoit Fouilland | March 1, 2017 | |||
/s/ Jean-Baptiste Rudelle | Executive Chairman | |||
Jean-Baptiste Rudelle | March 1, 2017 | |||
/s/ Dana Evan | Director | |||
Dana Evan | March 1, 2017 | |||
/s/ Sharon Fox Spielman | Director | |||
Sharon Fox Spielman | March 1, 2017 | |||
/s/ Edmond Mesrobian | Director | |||
Edmond Mesrobian | March 1, 2017 | |||
/s/ Hubert de Pesquidoux | Director | |||
Hubert de Pesquidoux | March 1, 2017 | |||
/s/ James Warner | Director | |||
James Warner | March 1, 2017 | |||
105
Index to Consolidated Financial Statements
Page | |
Reports of Deloitte & Associés, Independent Registered Public Accounting Firm | F-2 |
Consolidated Statements of Financial Position as of December 31, 2015 and 2016 | F-4 |
Consolidated Statements of Income for the Years Ended December 31, 2014, 2015 and 2016 | F-5 |
Consolidated Statements of Comprehensive Income for the Years Ended December 31, 2014, 2015 and 2016 | F-6 |
Consolidated Statements of Changes in Shareholders' Equity for the Years Ended December 31, 2014, 2015 and 2016 | F-7 |
Consolidated Statements of Cash Flows for the Years Ended December 31, 2014, 2015 and 2016 | F-8 |
Notes to the Consolidated Financial Statements | F-9 |
106
REPORT OF INDEPENDENT REGISTERED PUBLIC ACCOUNTING FIRM
To the Board of Directors and Shareholders of Criteo S.A.
Paris, France
We have audited the accompanying consolidated statements of financial position of Criteo S.A. and subsidiaries (the "Company") as of December 31, 2016 and 2015, and the related consolidated statements of income, comprehensive income, shareholders' equity, and cash flows for each of the three years in the period ended December 31, 2016. These financial statements are the responsibility of the Company's management. Our responsibility is to express an opinion on these financial statements based on our audits.
We conducted our audits in accordance with the standards of the Public Company Accounting Oversight Board (United States). Those standards require that we plan and perform the audit to obtain reasonable assurance about whether the financial statements are free of material misstatement. An audit includes examining, on a test basis, evidence supporting the amounts and disclosures in the financial statements. An audit also includes assessing the accounting principles used and significant estimates made by management, as well as evaluating the overall financial statement presentation. We believe that our audits provide a reasonable basis for our opinion.
In our opinion, such consolidated financial statements present fairly, in all material respects, the financial position of Criteo S.A. and subsidiaries as of December 31, 2016 and 2015, and the results of their operations and their cash flows for each of the three years in the period ended December 31, 2016, in conformity with accounting principles generally accepted in the United States of America.
We have also audited, in accordance with the standards of the Public Company Accounting Oversight Board (United States), the Company's internal control over financial reporting as of December 31, 2016, based on the criteria established in Internal Control - Integrated Framework (2013) issued by the Committee of Sponsoring Organizations of the Treadway Commission and our report dated March 1, 2017 expressed an unqualified opinion on the Company’s internal control over financial reporting.
/s/ Deloitte & Associés
Neuilly-sur-Seine, France
March 1, 2017
Represented by Anthony Maarek
F-2
REPORT OF INDEPENDENT REGISTERED PUBLIC ACCOUNTING FIRM
To the Board of Directors and Shareholders of Criteo S.A.
Paris, France
We have audited the internal control over financial reporting of Criteo S.A. and subsidiaries (the "Company") as of December 31, 2016, based on criteria established in Internal Control - Integrated Framework (2013) issued by the Committee of Sponsoring Organizations of the Treadway Commission. The Company's management is responsible for maintaining effective internal control over financial reporting and for its assessment of the effectiveness of internal control over financial reporting, included in the accompanying Management’s Annual Report on Internal Control over Financial Reporting. Our responsibility is to express an opinion on the Company's internal control over financial reporting based on our audit.
We conducted our audit in accordance with the standards of the Public Company Accounting Oversight Board (United States). Those standards require that we plan and perform the audit to obtain reasonable assurance about whether effective internal control over financial reporting was maintained in all material respects. Our audit included obtaining an understanding of internal control over financial reporting, assessing the risk that a material weakness exists, testing and evaluating the design and operating effectiveness of internal control based on the assessed risk, and performing such other procedures as we considered necessary in the circumstances. We believe that our audit provides a reasonable basis for our opinion.
A company's internal control over financial reporting is a process designed by, or under the supervision of, the company's principal executive and principal financial officers, or persons performing similar functions, and effected by the company's board of directors, management, and other personnel to provide reasonable assurance regarding the reliability of financial reporting and the preparation of financial statements for external purposes in accordance with generally accepted accounting principles. A company's internal control over financial reporting includes those policies and procedures that (1) pertain to the maintenance of records that, in reasonable detail, accurately and fairly reflect the transactions and dispositions of the assets of the company; (2) provide reasonable assurance that transactions are recorded as necessary to permit preparation of financial statements in accordance with generally accepted accounting principles, and that receipts and expenditures of the company are being made only in accordance with authorizations of management and directors of the company; and (3) provide reasonable assurance regarding prevention or timely detection of unauthorized acquisition, use, or disposition of the company's assets that could have a material effect on the financial statements.
Because of the inherent limitations of internal control over financial reporting, including the possibility of collusion or improper management override of controls, material misstatements due to error or fraud may not be prevented or detected on a timely basis. Also, projections of any evaluation of the effectiveness of the internal control over financial reporting to future periods are subject to the risk that the controls may become inadequate because of changes in conditions, or that the degree of compliance with the policies or procedures may deteriorate.
In our opinion, the Company maintained, in all material respects, effective internal control over financial reporting as of December 31, 2016, based on the criteria established in Internal Control - Integrated Framework (2013) issued by the Committee of Sponsoring Organizations of the Treadway Commission.
We have also audited, in accordance with the standards of the Public Company Accounting Oversight Board (United States), the consolidated financial statements as of and for the year ended December 31, 2016 of the Company and our report dated March 1, 2017 expressed an unqualified opinion on those financial statements.
/s/ Deloitte & Associés
Neuilly-sur-Seine, France
March 1, 2017
Represented by Anthony Maarek
F-3
Criteo S.A. and subsidiaries
Consolidated Statements of Financial Position
Year Ended December 31, | |||||||||
Notes | 2015 | 2016 | |||||||
(in thousands) | |||||||||
Assets | |||||||||
Current assets: | |||||||||
Cash and cash equivalents | 5 | $ | 353,537 | $ | 270,317 | ||||
Trade receivables, net of allowances | 6 | 261,581 | 397,244 | ||||||
Income taxes | 2,714 | 2,741 | |||||||
Other taxes | 7 | 29,552 | 52,942 | ||||||
Other current assets | 7 | 16,030 | 19,340 | ||||||
Total current assets | 663,414 | 742,584 | |||||||
Property, plant and equipment, net | 8 | 82,482 | 108,581 | ||||||
Intangible assets, net | 9 | 16,470 | 102,944 | ||||||
Goodwill | 11 | 41,973 | 209,418 | ||||||
Non-current financial assets | 10 | 17,184 | 17,029 | ||||||
Deferred tax assets | 21 | 20,196 | 30,630 | ||||||
Total non current assets | 178,305 | 468,602 | |||||||
Total assets | $ | 841,719 | $ | 1,211,186 | |||||
Liabilities and shareholders' equity | |||||||||
Current liabilities: | |||||||||
Trade payables | $ | 246,382 | $ | 365,788 | |||||
Contingencies | 12 | 668 | 654 | ||||||
Income taxes | 15,365 | 14,454 | |||||||
Financial liabilities - current portion | 14 | 7,156 | 7,969 | ||||||
Other taxes | 30,463 | 44,831 | |||||||
Employee-related payables | 42,275 | 55,874 | |||||||
Other current liabilities | 13 | 15,531 | 30,221 | ||||||
Total current liabilities | 357,840 | 519,791 | |||||||
Deferred tax liabilities | 21 | 139 | 686 | ||||||
Retirement benefit obligation | 15 | 1,445 | 3,221 | ||||||
Financial liabilities - non current portion | 14 | 3,272 | 77,611 | ||||||
Total non-current liabilities | 4,856 | 81,518 | |||||||
Total liabilities | 362,696 | 601,309 | |||||||
Commitments and contingencies | |||||||||
Shareholders' equity: | |||||||||
Common shares, €0.025 per value, 62,470,881 and 63,978,204 shares authorized, issued and outstanding at December 31, 2015 and 2016, respectively. | 2,052 | 2,093 | |||||||
Additional paid-in capital | 425,220 | 488,277 | |||||||
Accumulated other comprehensive income (loss) | (69,023 | ) | (88,593 | ) | |||||
Retained earnings | 116,076 | 198,355 | |||||||
Equity - attributable to shareholders of Criteo S.A. | 474,325 | 600,132 | |||||||
Non-controlling interests | 4,698 | 9,745 | |||||||
Total equity | 479,023 | 609,877 | |||||||
Total equity and liabilities | $ | 841,719 | $ | 1,211,186 | |||||
The accompanying notes form an integral part of these consolidated financial statements.
F-4
Criteo S.A. and subsidiaries
Consolidated Statements of Income
Year Ended December 31, | |||||||||||||
Notes | 2014 | 2015 | 2016 | ||||||||||
(in thousands, except share and per share data) | |||||||||||||
Revenue | $ | 988,249 | $ | 1,323,169 | $ | 1,799,146 | |||||||
Cost of revenue | |||||||||||||
Traffic acquisition costs | 17 | (585,492 | ) | (789,152 | ) | (1,068,911 | ) | ||||||
Other cost of revenue | 17 | (47,948 | ) | (62,201 | ) | (85,260 | ) | ||||||
Gross profit | 354,809 | 471,816 | 644,975 | ||||||||||
Operating expenses: | |||||||||||||
Research and development expenses | 17,18 | (60,075 | ) | (86,807 | ) | (123,649 | ) | ||||||
Sales and operations expenses | 17,18 | (176,927 | ) | (229,530 | ) | (282,853 | ) | ||||||
General and administrative expenses | 17,18 | (64,723 | ) | (79,145 | ) | (117,469 | ) | ||||||
Total operating expenses | (301,725 | ) | (395,482 | ) | (523,971 | ) | |||||||
Income from operations | 53,084 | 76,334 | 121,004 | ||||||||||
Financial income (expense) | 20 | 11,390 | (4,541 | ) | (546 | ) | |||||||
Income before taxes | 64,474 | 71,793 | 120,458 | ||||||||||
Provision for income taxes | 21 | (17,578 | ) | (9,517 | ) | (33,129 | ) | ||||||
Net income | $ | 46,896 | $ | 62,276 | $ | 87,329 | |||||||
Net income available to shareholders of Criteo S.A. | $ | 45,556 | $ | 59,553 | $ | 82,272 | |||||||
Net income available to non-controlling interests | $ | 1,340 | $ | 2,723 | $ | 5,057 | |||||||
Net income allocated to shareholders per share: | |||||||||||||
Basic | 22 | $ | 0.77 | $ | 0.96 | $ | 1.30 | ||||||
Diluted | 22 | $ | 0.72 | $ | 0.91 | $ | 1.25 | ||||||
Weighted average shares outstanding used in computing per share amounts: | |||||||||||||
Basic | 22 | 58,928,563 | 61,835,499 | 63,337,792 | |||||||||
Diluted | 22 | 63,493,260 | 65,096,486 | 65,633,470 | |||||||||
The accompanying notes form an integral part of these consolidated financial statements.
F-5
Criteo S.A. and subsidiaries
Consolidated Statements of Comprehensive Income
Year Ended December 31, | |||||||||||
2014 | 2015 | 2016 | |||||||||
(in thousands) | |||||||||||
Net income | $ | 46,896 | $ | 62,276 | $ | 87,329 | |||||
Foreign currency translation differences, net of taxes | (48,190 | ) | (37,234 | ) | (18,571 | ) | |||||
Foreign currency translation differences | (48,190 | ) | (37,234 | ) | (18,571 | ) | |||||
Income tax effect | — | — | — | ||||||||
Actuarial (losses) gains on employee benefits, net of taxes | 435 | 105 | (1,129 | ) | |||||||
Actuarial (losses) gains on employee benefits | 512 | 127 | (1,335 | ) | |||||||
Income tax effect | (77 | ) | (22 | ) | 206 | ||||||
Financial instruments, net of taxes | — | — | — | ||||||||
Fair value change on financial instruments | — | — | — | ||||||||
Income tax effect | — | — | — | ||||||||
Comprehensive income (loss) | (859 | ) | 25,147 | 67,629 | |||||||
Attributable to shareholders of Criteo S.A. | (1,968 | ) | 22,418 | 62,820 | |||||||
Attributable to non-controlling interests | $ | 1,109 | $ | 2,729 | $ | 4,809 | |||||
The accompanying notes form an integral part of these consolidated financial statements.
F-6
Criteo S.A. and subsidiaries
Consolidated Statements of Changes in Shareholders’ Equity
Share capital | Additional paid-in capital | Accumulated other comprehensive (loss) income | Retained earnings | Equity - attributable to shareholders of Criteo S.A. | Non controlling interests | Total equity | ||||||||||||||||||||||||
(Common shares) | (in thousands) | |||||||||||||||||||||||||||||
Balance at January 1, 2014 | 56,856,070 | $ | 1,873 | $ | 336,804 | $ | 15,624 | $ | 10,967 | $ | 365,268 | $ | 293 | $ | 365,561 | |||||||||||||||
Net income | — | — | — | 45,556 | 45,556 | 1,340 | 46,896 | |||||||||||||||||||||||
Other comprehensive income (loss) | — | — | (47,524 | ) | — | (47,524 | ) | (231 | ) | (47,755 | ) | |||||||||||||||||||
Issuance of ordinary shares | 135 | 31,905 | — | — | 32,040 | — | 32,040 | |||||||||||||||||||||||
Shared-based compensation | — | 19,263 | — | — | 19,263 | 338 | 19,601 | |||||||||||||||||||||||
Other changes in equity | — | — | 12 | — | 12 | — | 12 | |||||||||||||||||||||||
Balance at December 31, 2014 | 60,902,695 | 2,008 | 387,972 | (31,888 | ) | 56,523 | 414,615 | 1,740 | 416,355 | |||||||||||||||||||||
Net income | — | — | — | 59,553 | 59,553 | 2,723 | 62,276 | |||||||||||||||||||||||
Other comprehensive income (loss) | — | — | (37,135 | ) | — | (37,135 | ) | 6 | (37,129 | ) | ||||||||||||||||||||
Issuance of ordinary shares | 44 | 13,726 | — | — | 13,770 | — | 13,770 | |||||||||||||||||||||||
Shared-based compensation | — | 23,760 | — | — | 23,760 | 229 | 23,989 | |||||||||||||||||||||||
Other changes in equity | — | (238 | ) | — | — | (238 | ) | — | (238 | ) | ||||||||||||||||||||
Balance at December 31, 2015 | 62,470,881 | 2,052 | 425,220 | (69,023 | ) | 116,076 | 474,325 | 4,698 | 479,023 | |||||||||||||||||||||
Net income | — | — | — | 82,272 | 82,272 | 5,057 | 87,329 | |||||||||||||||||||||||
Other comprehensive income (loss) | — | — | (19,452 | ) | — | (19,452 | ) | (248 | ) | (19,700 | ) | |||||||||||||||||||
Issuance of ordinary shares | 41 | 21,706 | — | — | 21,747 | — | 21,747 | |||||||||||||||||||||||
Shared-based compensation | — | 41,351 | — | — | 41,351 | 238 | 41,589 | |||||||||||||||||||||||
Other changes in equity | — | — | (118 | ) | 7 | (111 | ) | — | (111 | ) | ||||||||||||||||||||
Balance at December 31, 2016 | 63,978,204 | $ | 2,093 | $ | 488,277 | $ | (88,593 | ) | $ | 198,355 | $ | 600,132 | $ | 9,745 | $ | 609,877 | ||||||||||||||
The accompanying notes form an integral part of these consolidated financial statements.
F-7
Criteo S.A. and subsidiaries
Consolidated Statements of Cash Flows
Year Ended December 31, | |||||||||||
2014 | 2015 | 2016 | |||||||||
(in thousands) | |||||||||||
Net income | $ | 46,896 | $ | 62,276 | $ | 87,329 | |||||
Non-cash and non-operating items | 71,544 | 78,448 | 139,122 | ||||||||
Amortization and provisions | 33,365 | 47,085 | 62,733 | ||||||||
Equity awards compensation expense (1) | 19,600 | 23,989 | 43,259 | ||||||||
Net gain (or loss) on disposal of non-current assets | 141 | (2,127 | ) | (81 | ) | ||||||
Interest accrued and non-cash financial income and expenses | 861 | 28 | 39 | ||||||||
Change in deferred taxes | (5,315 | ) | (15,748 | ) | (10,024 | ) | |||||
Income tax for the period | 22,892 | 25,221 | 43,196 | ||||||||
Change in working capital | 4,661 | 15,231 | (29,460 | ) | |||||||
(Increase) in trade receivables | (83,646 | ) | (83,420 | ) | (117,970 | ) | |||||
Increase in trade payables | 70,557 | 100,047 | 81,862 | ||||||||
(Increase) in other current assets | (7,986 | ) | (24,101 | ) | (28,432 | ) | |||||
Increase in other current liabilities | 25,736 | 22,705 | 35,080 | ||||||||
Income taxes paid | (6,820 | ) | (18,805 | ) | (43,522 | ) | |||||
Cash from operating activities | 116,281 | 137,150 | 153,469 | ||||||||
Acquisition of intangibles assets, property, plant and equipment | (48,591 | ) | (75,607 | ) | (85,133 | ) | |||||
Change in accounts payable related to intangible assets, property, plant and equipment | 1,705 | 1,128 | 7,752 | ||||||||
Payments for acquired businesses, net of cash acquired | (26,103 | ) | (20,542 | ) | (235,541 | ) | |||||
Change in other financial non-current assets | (2,292 | ) | (6,612 | ) | 159 | ||||||
Cash used to investing activities | (75,281 | ) | (101,633 | ) | (312,763 | ) | |||||
Issuance of long term borrowings | 5,628 | 4,023 | 84,022 | ||||||||
Repayment of borrowings (2) | (6,525 | ) | (8,980 | ) | (13,305 | ) | |||||
Proceeds from capital increase | 31,638 | 13,768 | 20,075 | ||||||||
Change in other financial liabilities | 272 | (1,000 | ) | (222 | ) | ||||||
Cash from financing activities | 31,013 | 7,811 | 90,570 | ||||||||
Change in net cash and cash equivalents | 72,013 | 43,328 | (68,724 | ) | |||||||
Net cash and cash equivalents - beginning of period | 323,181 | 351,827 | 353,537 | ||||||||
Effect of exchange rate changes on cash and cash equivalents | (43,367 | ) | (41,618 | ) | (14,496 | ) | |||||
Net cash and cash equivalents - end of period | $ | 351,827 | $ | 353,537 | $ | 270,317 | |||||
(1) $41.6 million of equity awards compensation expense consisted of share-based compensation expense according to ASC 718 - Compensation - stock compensation for the year ended December 31, 2016.
(2) Interest paid for the year ended December 31, 2016 amounted to $1.3 million, and was immaterial for the year ended December 31, 2015 and 2014.
The accompanying notes form an integral part of these consolidated financial statements.
F-8
Notes to the Consolidated Financial Statements
Criteo S.A. was initially incorporated as a société par actions simplifiée, or S.A.S., under the laws of the French Republic on November 3, 2005, for a period of 99 years and subsequently converted to a société anonyme, or S.A.
Criteo S.A. is a global technology company specialized in digital performance marketing. We strive to deliver post-click sales to our advertiser clients at scale across multiple digital marketing channels, and according to the client's targeted return on investment. In these notes, Criteo S.A. is referred to as the Parent company and together with its subsidiaries, collectively, as "Criteo," the "Company," the "Group," or "we". The Company uses its proprietary machine-learning algorithms, coupled with large volumes of granular shopping intent data and deep insights into consumer intent and purchasing habits, to price and deliver in real time highly relevant and personalized digital performance advertisements to consumers.
Note 1. Principles and Accounting Methods
Basis of Preparation
The Consolidated Financial Statements have been prepared assuming a going concern and using the historical cost principle with the exception of certain assets and liabilities that are measured at fair value in accordance with generally accepted accounting principles in the United States of America (“U.S. GAAP”). The categories concerned are detailed in the following notes.
Consolidation Methods
We have control over all our subsidiaries, and consequently they are all fully consolidated. Intercompany transactions and balances have been eliminated. The table below presents at each period’s end and for all entities included in the consolidation scope the following information: the country of incorporation and the percentage of voting rights and ownership interests.
2015 | 2016 | ||||||||||||||
Country | Voting rights | Ownership Interest | Voting rights | Ownership Interest | Consolidation Method | ||||||||||
Parent company | |||||||||||||||
Criteo S.A | France | 100 | % | 100 | % | 100 | % | 100 | % | Parent company | |||||
French subsidiaries | |||||||||||||||
Criteo France SAS | France | 100 | % | 100 | % | 100 | % | 100 | % | Fully consolidated | |||||
Criteo Finance SAS | France | - | - | 100 | % | 100 | % | Fully consolidated | |||||||
Foreign subsidiaries | |||||||||||||||
Criteo Ltd | United Kingdom | 100 | % | 100 | % | 100 | % | 100 | % | Fully consolidated | |||||
Criteo Corp | United States | 100 | % | 100 | % | 100 | % | 100 | % | Fully consolidated | |||||
Criteo Gmbh | Germany | 100 | % | 100 | % | 100 | % | 100 | % | Fully consolidated | |||||
Criteo KK | Japan | 66 | % | 66 | % | 66 | % | 66 | % | Fully consolidated | |||||
Criteo Do Brasil LTDA | Brazil | 100 | % | 100 | % | 100 | % | 100 | % | Fully consolidated | |||||
Criteo BV | The Netherlands | 100 | % | 100 | % | 100 | % | 100 | % | Fully consolidated | |||||
Criteo Pty | Australia | 100 | % | 100 | % | 100 | % | 100 | % | Fully consolidated | |||||
Criteo Srl | Italy | 100 | % | 100 | % | 100 | % | 100 | % | Fully consolidated | |||||
Criteo Advertising (Beijng) Co. Ltd | China | 100 | % | 100 | % | 100 | % | 100 | % | Fully consolidated | |||||
Criteo Singapore Pte. Ltd. | Singapore | 100 | % | 100 | % | 100 | % | 100 | % | Fully consolidated | |||||
Criteo LLC | Russia | 100 | % | 100 | % | 100 | % | 100 | % | Fully consolidated | |||||
Criteo Europa S.L. | Spain | 100 | % | 100 | % | 100 | % | 100 | % | Fully consolidated | |||||
Criteo Espana S.L. | Spain | 100 | % | 100 | % | 100 | % | 100 | % | Fully consolidated | |||||
Criteo Canada Corp. | Canada | 100 | % | 100 | % | 100 | % | 100 | % | Fully consolidated | |||||
Criteo Reklamcılık Hizmetleri ve Ticaret Anonim Şirketi | Turkey | 100 | % | 100 | % | 100 | % | 100 | % | Fully consolidated | |||||
Criteo MEA FZ-LLC | United Arab Emirates | 100 | % | 100 | % | 100 | % | 100 | % | Fully consolidated | |||||
Criteo India Private Ltd. | India | - | - | 100 | % | 100 | % | Fully consolidated | |||||||
HookLogic, Inc. | United States | - | - | 100 | % | 100 | % | Fully consolidated | |||||||
HookLogic Ltd | United Kingdom | - | - | 100 | % | 100 | % | Fully consolidated | |||||||
Hooklogic Brasil Solucoes EM Tecnología Ltda | Brazil | - | - | 100 | % | 100 | % | Fully consolidated | |||||||
F-9
Functional Currency and Translation of Financial Statements in Foreign Currency
The Consolidated Financial Statements are presented in U.S. dollars, which differs from the functional currency of the Parent, being the Euro. The statements of financial position of consolidated entities having a functional currency different from the U.S. dollar are translated into U.S. dollars at the closing exchange rate (spot exchange rate at the statement of financial position date) and the statements of income, statements of comprehensive income and statements of cash flow of such consolidated entities are translated at the average period to date exchange rate. The resulting translation adjustments are included in equity under the caption “Accumulated other comprehensive income (loss)” in the Consolidated Statements of Changes in Shareholders' Equity.
Conversion of Foreign Currency Transactions
Foreign currency transactions are converted to U.S. dollars at the rate of exchange applicable on the transaction date. At period-end, foreign currency monetary assets and liabilities are converted at the rate of exchange prevailing on that date. The resulting exchange gains or losses are recorded in the Consolidated Statements of Income in “Other financial income (expense)” with the exception of exchange differences arising from monetary items that form part of the reporting entity’s net investment in a foreign operation which are recognized in other comprehensive income (loss); they will be recognized in profit or loss on disposal of the net investment.
Use of Estimates
Our Consolidated Financial Statements are prepared in accordance with U.S. GAAP. The preparation of our Consolidated Financial Statements requires us to make estimates, assumptions and judgments that affect the reported amounts of assets, liabilities, revenue and expenses. We base our estimates and assumptions on historical experience and other factors that we believe to be reasonable under the circumstances. We evaluate our estimates and assumptions on an ongoing basis. Our actual results may differ from these estimates.
The most significant areas that require management judgment and estimates relate to (1) the recognition of revenue and particularly, the determination as to whether revenue should be reported on a gross or a net basis; (2) the evaluation of our trade receivables and the recognition of a valuation allowance for doubtful accounts; (3) the recognition of our deferred tax assets considering the subsidiaries projected taxable profit within the next three years and the potential tax deduction upon future exercises of share-options in certain jurisdictions; (4) the recognition and measurement of goodwill and intangible assets and particularly costs capitalized in relation to our customized internal-use software; and (5) the measurement of share-based compensation.
Business combinations
We include the results of operations of the businesses that we acquire as of the acquisition date. We allocate the purchase price of our acquisitions to the assets acquired and liabilities assumed based on their estimated fair values. The excess of the purchase price over the fair values of these identifiable assets and liabilities is recorded as goodwill. Acquisition-related expenses are recognized separately from the business combination and are expensed as incurred.
F-10
Intangible Assets
Acquired intangible assets are accounted for at acquisition cost, less accumulated amortization. Acquired intangible assets are primarily composed of software amortized on a straight-line basis over their estimated useful lives comprised between one and three years. Intangible assets are reviewed for impairment whenever events or changes in circumstances such as, but not limited to, significant declines in revenue, earnings or cash flows or material adverse changes in the business climate indicate that the carrying amount of an asset may be impaired.
Costs related to customized internal-use software that have reached the development stage are capitalized. Capitalization of such costs begins when the preliminary project stage is complete and stops when the project is substantially complete and is ready for its intended purpose. In making this determination, several analyses for each phase were performed, including analysis of the feasibility, availability of resources, intention to use and future economic benefits. Amortization of these costs begins when assets are placed in service and is calculated on a straight-line basis over the assets’ useful lives estimated at three to five years.
Our research and development efforts are focused on enhancing the performance of our solution and improving the efficiency of the services we deliver to our clients. All development costs, principally headcount-related costs, are expensed as incurred as management has determined that technological feasibility is reached shortly before our product is available for release to customers.
Property, Plant and Equipment
Property, plant and equipment are accounted for at acquisition cost less cumulative depreciation and any impairment loss.
Depreciation is calculated on a straight-line basis over the assets’ estimated useful lives as follows:
Fixtures and fittings (mainly composed of leasehold improvements).................................. 5 to 10 years
Furniture and equipment (servers and IT equipment in data centers and office equipment)............ 1 to 5 years
Leasehold improvements are depreciated over their useful life or over the lease term, whichever is shorter.
The gains and losses on disposal of assets are determined by comparing selling price with the net book value of the disposed asset.
Impairment of Assets
Goodwill and Intangible Assets
Goodwill represents the excess of the aggregate purchase price paid over the fair value of the net tangible and intangible assets acquired. Intangible assets that are not considered to have an indefinite useful life are amortized over their useful lives. The Company evaluates the estimated remaining useful lives of purchased intangible assets and whether events or changes in circumstances warrant a revision to the remaining periods of amortization.
Goodwill is not amortized and is tested for impairment at least annually or whenever events or changes in circumstances indicate that the carrying value may not be recoverable. The Company has determined that it operates as a single reporting unit and has selected December 31 as the date to perform its annual impairment test.
In the impairment assessment of its goodwill, the Company performs a two-step impairment test, which involves assumptions regarding estimated future cash flows to be derived from the Company. If these estimates or their related assumptions change in the future, the Company may be required to record impairment for these assets. The first step of the impairment test involves comparing the fair value of the reporting unit to its net book value, including goodwill.
F-11
If the net book value exceeds its fair value, then the Company would perform the second step of the goodwill impairment test to determine the amount of the impairment loss. The impairment loss to be recognized would be calculated by comparing the implied fair value of the Company to its net book value. In calculating the implied fair value of the Company’s goodwill, the fair value of the Company would be allocated to all of the other assets and liabilities based on their fair values. The excess of the fair value of the Company over the amount assigned to its other assets and liabilities is the implied fair value of goodwill. An impairment loss would be recognized in the Consolidated Statement of Income when the carrying amount of goodwill exceeds its implied fair value.
With respect to intangible assets, acquired intangible assets are accounted for at acquisition cost less cumulative amortization and any impairment loss. Acquired intangible assets are amortized over their estimated useful lives of one to five years on a straight-line method. Intangible assets are reviewed for impairment whenever events or changes in circumstances such as, but not limited to, significant declines in revenue, earnings or cash flows or material adverse changes in the financial and economic environment indicate that the carrying amount of an asset may be impaired.
Property, Plant and Equipment and Impairment of Long-lived Assets
The Company periodically reviews long-lived assets for impairment whenever events or changes in circumstances indicate that the carrying amount of an asset is impaired or the estimated useful life is no longer appropriate. If indicators of impairment exist and the undiscounted projected cash flows associated with an asset are less than the carrying amount of the asset, an impairment loss is recorded to write the asset down to its estimated fair value. Fair value is estimated based on discounted future cash flows.
Leases
The Company leases various facilities under agreements accounted for as operating leases. For leases that contain escalation or rent concessions provisions, management recognizes rent expense during the lease term on a straight-line basis over the term of the lease. The difference between rent paid and straight-line rent expense is recorded as a deferred rent liability in the accompanying Consolidated Statement of Financial Position.
Assets held under capital leases are recorded at the lower of the net present value of the minimum lease payments or at the fair value of the leased asset at the inception of the lease. Amortization expense is computed using the straight-line method over the shorter of the estimated useful life of the asset or the period of the related lease. Principal payments on capital lease obligations are recorded as reduction of capital lease liability in the accompanying consolidated balance sheets, and interest payments are recorded as interest expense which is included in financial income (expense), in the accompanying Consolidated Statements of Operations.
Financial Assets and Liabilities, Excluding Derivative Financial Instruments
Financial assets, excluding cash and cash equivalents, consist exclusively of loans and receivables. Loans and receivables are non-derivative financial assets with a payment, which is fixed or can be determined, not listed on an active market. They are included in current assets, except those that mature more than twelve months after the reporting date.
Loans are measured at amortized cost using the effective interest method. The recoverable amount of loans and advances is estimated whenever there is an indication that the asset may be impaired and at least on each reporting date. If the recoverable amount is lower than the carrying amount, an impairment loss is recognized in the Consolidated Statements of Income.
Financial liabilities are initially recorded at their fair value at the transaction date. Subsequently they are measured at amortized cost using the effective interest method.
F-12
We carry our accounts receivable at net realizable value. On a periodic basis, our management evaluates our accounts receivable and determines whether to provide an allowance or if any accounts should be written down and charged to expense as a bad debt. The evaluation is based on, among other factors, a past history of collections, current credit conditions, the ageing of the receivable and a past history of write downs. A receivable is considered past due if we have not received payments based on agreed-upon terms. A higher default rate than estimated or a deterioration in our clients’ creditworthiness could have an adverse impact on our future results. Allowances for doubtful accounts on trade receivables are recorded in “sales and operations expenses” in our Consolidated Statements of Income. We generally do not require any security or collateral to support our receivables.
Derivative financial instruments
We buy and sell derivative financial instruments (mainly put, forward buying and selling) in order to manage and reduce our exposure to the risk of exchange rate fluctuations. We deal only with major financial institutions. Under the ASC 815 – Derivatives and hedging, financial instruments may only be classified as hedges when we can demonstrate and document the effectiveness of the hedging relationship at inception and throughout the life of the hedge.
The effectiveness of the hedge is determined by reference to changes in the value of the derivative instrument and the hedged item. The ratio must remain within 80% to 125%.
Derivative financial instruments are recognized in the balance sheet at their market value on the reporting date in financial current assets or liabilities.
Changes in fair value are recorded as follows:
• | cash flow hedges: the portion of the gain or loss on the financial instrument that is determined to be an effective hedge is recorded directly to equity. The ineffective portion is recorded to the income statement; |
• | fair value hedges and financial instruments not designated as hedges : changes in fair value are recorded to the income statement. |
Fair value measurements
In accordance with ASC 820 – Fair value measurement, financial instruments are presented in three categories based on a hierarchical method used to determine their fair value : (i) level 1: fair value calculated using quoted prices in an active market for identical assets and liabilities; (ii) level 2: fair value calculated using valuation techniques based on observable market data such as prices of similar assets and liabilities or parameters quoted in an active market; (iii) level 3: fair value calculated using valuation techniques based wholly or partially on unobservable inputs such as prices in an active market or a valuation based on multiples for unlisted companies.
The Company's valuation techniques used to measure the fair value of money market funds and certain short term investments were derived from quoted prices in active markets. The valuation techniques used to measure the fair value of the Company's financial liabilities and all other financial instruments, all of which have counterparties with high credit ratings, were valued based on quoted market prices or model-driven valuations using inputs derived from or corroborated by observable market data.
F-13
Cash and Cash Equivalents
Cash includes cash on hand and demand deposits with banks. Cash equivalents include short-term, highly liquid investments, with a remaining maturity at the date of purchase of three months or less for which the risk of changes in value is considered to be insignificant. Demand deposits therefore meet the definition of cash equivalents. Cash equivalents are measured at fair value using level 1 for cash at hand and money market funds using quoted prices, and any changes are recognized in the Consolidated Statements of Income.
Concentration of Credit Risk
Financial instruments that potentially subject the Company to significant concentrations of credit risk consist primarily of cash, cash equivalents and accounts receivable. The Company’s cash and cash equivalents are held at major financial institutions that the Company's management has assessed to be of high credit quality. The Company has not experienced any losses in such accounts.
The Company mitigates its credit risk with respect to accounts receivable by performing credit evaluations and monitoring agencies' and advertisers' accounts receivable balances. As of December 31, 2016 and 2015 no customer accounted for 10% or more of accounts receivable. During the years ended December 31, 2016, 2015 and 2014, no single customer represented 10% or more of revenue.
Employee Benefits
Depending on the laws and practices of the countries in which we operate, employees may be entitled to compensation when they retire or to a pension following their retirement. For state-managed plans and other defined contribution plans, we recognize them as expenses when they become payable, our commitment being limited to our contributions.
The liability with respect to defined benefit plans is estimated using the following main assumptions:
• | discount rate; |
• | future salary increases; and |
• | employee turnover. |
Service costs are recognized in profit or loss and are allocated by function.
Actuarial gains and losses are recognized in other comprehensive income and subsequently amortized into the income statement over a specified period, which is generally the expected average remaining service period of the employees participating in the plan. Actuarial gains and losses arise as a result of changes in actuarial assumptions or experience adjustments (differences between the previous actuarial assumptions and what has actually occurred).
Contingencies
We recognize contingencies in accordance with ASC 450 - Contingencies, if the following two conditions are met:
• | information available before the financial statements are issued indicates that it is probable that an asset had been impaired or a liability had been incurred at the date of the financial statements; |
• | the amount of loss can be reasonably estimated |
With respect to litigation and claims that may result in a provision to be recognized, we exercise significant judgment in measuring and recognizing provisions or determining exposure to contingent liabilities that are related to pending litigation or other outstanding claims. These judgment and estimates are subject to change as new information becomes available.
F-14
Revenue Recognition
We sell personalized display advertisements featuring product-level recommendations either directly to clients or to advertising agencies, which we collectively refer to as our clients, and generate revenue when a user clicks on the banner ad. We generally price our advertising campaigns on a cost per click (“CPC”) model based on the number of clicks generated by users on each advertisement we deliver in our advertising campaigns.
Revenue is recognized when the related services are delivered based on the specific terms of the contract, which are commonly based on specified CPCs and related campaign budgets. We recognize revenue when four basic criteria are met: (1) persuasive evidence exists of an arrangement with the client reflecting the terms and conditions under which the services will be provided; (2) services have been provided or delivery has occurred; (3) the fee is fixed or determinable; and (4) collection is reasonably assured. Collectability is assessed based on a number of factors, including the creditworthiness of a client, the size and nature of a client’s website and transaction history. Amounts billed or collected in excess of revenue recognized are included as deferred revenue. An example of this deferred revenue would be arrangements where clients request or are required by us to pay in advance of delivery.
We recognize revenue from the delivery of display advertisements in the period in which the display advertisements are delivered. Specifically, we recognize revenue for display ad delivery through our solution once the consumer clicks on the personalized banner displayed by us on the client’s website for CPC ad campaigns. For CPC ad campaigns, sales are valued at the fair value of the amount received. Rebates and discounts granted to clients, along with free or extended advertising campaigns, are recorded as a deduction from revenue. Essentially all of our revenue in each of 2014, 2015 and 2016 was derived from advertising campaigns sold on a CPC basis. In the specific case of Criteo Predictive Search, we recognize revenue when users exposed to the Google Shopping campaigns of our clients generate a sale on the digital property of our clients after clicking on the shopping advertisements displayed on Google. Our revenue for Criteo Predictive Search is a percentage of the sales generated by a client's Google Shopping campaigns, which means we only get paid for completed sales.
The determination of whether revenue should be reported on a gross or net basis is based on an assessment of whether we are acting as the principal or an agent in our transactions. In determining whether we act as the principal or an agent, we follow the accounting guidance for principal-agent considerations. The determination of whether we are acting as a principal or an agent in a transaction involves judgment and is based on an evaluation of the terms of each arrangement. While none of the factors individually are considered presumptive or determinative, because we are the primary obligor and are responsible for (1) identifying and contracting with third-party clients; (2) establishing the selling prices of the display advertisements sold; (3) performing all billing and collection activities, including retaining credit risk; and (4) bearing sole responsibility for fulfillment of the advertising and the inventory risk, we act as the principal in these arrangements and therefore report revenue earned and costs incurred related to these transactions on a gross basis. With Criteo Predictive Search, we do not purchase search inventory ourselves; our advertiser clients have direct access to Google Shopping inventory and buy such inventory themselves. As a result of not incurring inventory costs related to these transactions, we act as an agent for our clients with respect to these transactions. Consequently, revenue for Criteo Predictive Search is reported on a net basis. In the specific case of Criteo Sponsored Products, we generally act as principal and as a result, we report revenue earned and costs incurred related to these transactions on a gross basis. When we do not (i) set the price, (ii) select the publisher site the advertisement is placed on, (iii) take responsibility for the acceptability of the service and (iv) bear the credit risk, we report revenue earned and costs incurred related to these transactions on a net basis.
F-15
Cost of Revenue
Our cost of revenue primarily includes traffic acquisition costs and other cost of revenue.
Traffic Acquisition Costs. Traffic acquisition costs consist primarily of purchases of impressions from publishers on a CPM basis. We purchase impressions directly from publishers or third-party intermediaries, such as advertisement exchanges. We recognize cost of revenue on a publisher by publisher basis as incurred. Costs owed to publishers but not yet paid are recorded in our Consolidated Statements of Financial Position as trade payables and other current liabilities. Under our current agreements with our publishers, we only commit to purchase a defined volume of impressions from any given publisher to the extent that a pre-determined click through rate, or CTR, is reached. If the publisher fails to reach the targeted volume of impressions, we can either terminate the agreement or reduce our commitment to buy impressions accordingly.
For Criteo Sponsored Products, we pay for the inventory of our ecommerce retailer partners on a revenue sharing basis, effectively paying the retailers a portion of the click-based revenue generated by user clicks on the sponsored products advertisements displaying the products of our brand manufacturer clients.
For Criteo Predictive Search, we do not purchase search inventory ourselves; our advertiser clients have direct access to Google Shopping inventory, and we optimize the bidding price for such inventory on behalf of the clients to maximize the sales generated by shopping campaigns.
Other Cost of Revenue. Other cost of revenue includes expenses related to third-party hosting fees, depreciation of data center equipment and data purchased from third parties. The Company does not build or operate its own data centers and none of its Research and Development employments are dedicated to revenue generating activities. As a result, we do not include the costs of such personnel in other cost of revenue.
Share-Based Compensation
Shares, employee share options and employee and non-employee warrants are primarily awarded to our employees or directors. As required by ASC 718 – Compensation – Stock Compensation, these awards are measured at their fair value on the date of grant. The fair value is calculated with the most relevant formula regarding the settlement and the conditions of each plan. The fair value is recorded in personnel expenses (allocated by function in the Consolidated Statements of Income) on a straight-line basis over each milestone composing the vesting period with a corresponding increase in shareholders’ equity.
At each closing date, we re-examine the number of options likely to become exercisable. If applicable, the impact of the review of the estimate is recognized in the Consolidated Statements of Income with a corresponding adjustment in equity.
Income Taxes
We elected to classify the French business tax, Cotisation sur la Valeur Ajoutée des Entreprises (“CVAE”), as an income tax in compliance with ASC 740—Income Taxes (“ASC 740”).
The French Research Tax Credit, Crédit d’Impôt Recherche (“CIR”), is a French tax incentive to stimulate research and development (“R&D”). Generally, the CIR offsets the income tax to be paid and the remaining portion (if any) can be refunded at the end of a three-fiscal year period. The CIR is calculated based on the claimed volume of eligible R&D expenditures by us. As a result, the CIR is presented as a deduction to “research and development expenses” in the Consolidated Statements of Income, as the CIR is not within the scope of ASC 740. We have exclusively claimed R&D performed in France for purposes of the CIR.
F-16
Income taxes are accounted for under the asset and liability method of accounting. Deferred taxes are recorded on all temporary differences between the financial reporting and tax bases of assets and liabilities, and on tax losses, using the liability method. Differences are defined as temporary when they are expected to reverse within a foreseeable future. We may only recognize deferred tax assets if, based on the projected taxable incomes within the next three years, we determine that it is probable that future taxable profit will be available against which the unused tax losses and tax credits can be utilized. As a result, the measurement of deferred income tax assets is reduced, if necessary, by a valuation allowance for any tax benefits which are not expected to be realized. If future taxable profits are considerably different from those forecasted that support recording deferred tax assets, we will have to revise downwards or upwards the amount of deferred tax assets, which would have a significant impact on our financial results. This determination requires many estimates and judgments by our management for which the ultimate tax determination may be uncertain. In accordance with ASC 740, tax assets and liabilities are not discounted. Amounts recognized in the Consolidated Financial Statements are calculated at the level of each tax entity included in the consolidation scope. The effect on deferred income tax assets and liabilities of a change in tax rates is recognized in the period that such tax rate changes are enacted.
Uncertain Tax Positions
The Company follows the guidance of ASC 740, which prescribes a more likely than not threshold for financial statement recognition and measurement of a tax position taken or expected to be taken in a tax return. This Interpretation also provides guidance on recognition of income tax assets and liabilities, classification of current and deferred income tax assets and liabilities, accounting for interest and penalties associated with tax positions, accounting for income taxes in interim periods, and income tax disclosures.
Operating Segments
In accordance with ASC 280 – Segment reporting, segment information reported is built on the basis of internal management data used for performance analysis of businesses and for the allocation of resources (management approach). An operating segment is a component of the Company for which separate financial information is available that is evaluated regularly by our Chief Decision Maker in deciding how to allocate resources and assessing performance.
Our chief operating decision-maker is our CEO. The CEO reviews consolidated data for revenue, revenue excluding traffic acquisition costs (revenue ex-TAC) and Adjusted EBITDA (earnings before financial income (expense), income taxes, depreciation and amortization, adjusted to eliminate the impact of equity awards compensation expense, pension service costs, acquisition-related costs and deferred price consideration) for the purposes of allocating resources and evaluating financial performance.
We have concluded that our operations constitute one operating and reportable segment.
Earnings Per Share
In accordance with ASC 260—Earnings Per Share, basic earnings per share (“EPS”) are calculated by dividing the net income attributable to shareholders of the Parent by the weighted average number of shares outstanding. The weighted average number of shares outstanding is calculated according to movements in share capital.
In addition, we calculate diluted earnings per share by dividing the net income attributable to shareholders of the Parent company, Criteo S.A. by the weighted average number of shares outstanding plus any potentially dilutive shares not yet issued.
F-17
Recent Accounting Pronouncements
In May 2014, the FASB issued Accounting Standards Update No. 2014-09, Revenue from Contracts with Customers (Topic 606) (ASU 2014-09), which amends the existing accounting standards for revenue recognition. In August 2015, the FASB issued ASU No. 2015-14, Revenue from Contracts with Customers (Topic 606): Deferral of the Effective Date, which delays the effective date of ASU 2014-09 by one year. The FASB also agreed to allow entities to choose to adopt the standard as of the original effective date. In March 2016, the FASB issued Accounting Standards Update No. 2016-08, Revenue from Contracts with Customers (Topic 606): Principal versus Agent Considerations (Reporting Revenue Gross versus Net) (ASU 2016-08) which clarifies the implementation guidance on principal versus agent considerations. The guidance includes indicators to assist an entity in determining whether it controls a specified good or service before it is transferred to the customers. The new revenue recognition standard will be effective for the Company in the first quarter of 2018, with the option to adopt it in the first quarter of 2017. We currently anticipate adopting the new standard effective January 1, 2018. The new standard also permits two methods of adoption: retrospectively to each prior reporting period presented (full retrospective method), or retrospectively with the cumulative effect of initially applying the guidance recognized at the date of initial application (the modified retrospective method). We currently anticipate adopting the standard using the modified retrospective method. While we are still in the process of completing our analysis on the impact this guidance will have on our Consolidated Financial Statements and related disclosures, the more significant changes that we have identified to date relate to the gross versus net presentation of our consolidated revenue. Upon adoption of ASU 2014-09, we may be required to report, on a net basis, a portion of the revenue derived from Criteo Sponsored Products.
In February 2016, the FASB issued Accounting Standards Update No. 2016-02, Leases (Topic 842) (ASU 2016-02), which generally requires companies to recognize operating and financing lease liabilities and corresponding right-of-use assets on the balance sheet for operating leases with terms of more than 12 months, in addition to those currently recorded. This guidance will be effective for us in the first quarter of 2019 on a modified retrospective basis and early adoption is permitted. We are still evaluating the effect that this guidance will have on our Consolidated Financial Statements and related disclosures.
In October 2016, the FASB issued Accounting Standards Update No. 2016-16, Income Taxes (Topic 740): Intra-Entity Transfers Other than Inventory (ASU 2016-16), which requires companies to recognize the income-tax consequences of an intra-entity transfer of an asset other than inventory. This guidance will be effective for us in the first quarter of 2018, with the option to adopt it in the first quarter of 2017. We currently anticipate adopting the new standard effective January 1, 2018, and do not expect the standard to have a material impact on our Consolidated Financial Statements.
In November 2016, the FASB issued Accounting Standards Update No. 2016-18, Statement of Cash Flows (Topic 230): Restricted Cash (ASU 2016-18), which requires companies to include amounts generally described as restricted cash and restricted cash equivalents in cash and cash equivalents when reconciling beginning-of-period and end-of-period total amounts shown on the statement of cash flows. This guidance will be effective for us in the first quarter of 2018 and early adoption is permitted. We are still evaluating the effect that this guidance will have on our Consolidated Financial Statements and related disclosures.
Other accounting standards that have been issued or proposed by the FASB or other standards-setting bodies that do not require adoption until a future date are not expected to have a material impact on the Company’s Consolidated Financial Statements upon adoption.
F-18
Note 2. Significant Events and Transactions of the Period
Changes in the scope of consolidation
Business combinations
HookLogic Inc.
On November 9, 2016, we completed the acquisition of all of the outstanding shares of Hooklogic, Inc. ("HookLogic"). Please refer to Note 3 for further details.
Monsieur Drive Acquisition
On May 31, 2016, we acquired all of the outstanding shares of Monsieur Drive SAS. ("Monsieur Drive"), a Paris-based company building advertising products for the consumer packaged goods vertical. Please refer to Note 3 for further details.
Consolidation scope
Creation of Criteo India Pvt Ltd (India)
This new subsidiary is 100% held and controlled by the Parent Company. It is included in the Company’s consolidation scope as of December 31, 2016, but its contribution to the Consolidated Financial Statements is not material.
Creation of Criteo Finance SAS (France)
This new subsidiary is 100% held and controlled by the Parent company. It is included in the Company’s consolidation scope as of December 31, 2016, but its contribution to the Consolidated Financial Statements is not material. The business objective of this subsidiary is to enhance the service level to strategic global customers by providing them with one single billing relationship and to consolidate the management of the foreign exchange risk.
Changes in Group funding
Drawing on Group Revolving Credit Facility
In September 2015, Criteo S.A. entered into a Multicurrency Revolving Facility Agreement for general purposes of the Group including the funding of business combinations. In the context of the acquisition of HookLogic Inc., $75.0 million was drawn in November 2016.
Drawing on Chinese revolving loan facility
In October 2014, we entered into a revolving loan facility with HSBC to support the development of our Chinese subsidiary for a total amount of RMB15.0 million. This facility was increased to RMB 40.0 million in May 2015. At December 31, 2015 and 2016, RMB 25 million ($3.9 million) and RMB 30.0 million ($4.3 million) was drawn.
Note 3. Business combination
Acquisition of HookLogic Inc.
On November 9, 2016, we completed the acquisition of all of the outstanding shares of Hooklogic, a New York-based company connecting many of the world's largest ecommerce retailers with consumer brand manufacturers. The total consideration paid was $250.1 million for the acquisition of shares. The acquisition was financed by (i) a $75.0 million amount drawn on the Revolving Credit Facility entered into in September 2015 and (ii) $175.1 million financed by available cash resources.
F-19
The purchase price allocation is in progress. A preliminary valuation of the fair value of HookLogic's assets acquired and liabilities assumed has been performed as of December 31, 2016. Provisional goodwill amounted to $165.3 million, subject to post-closing working capital adjustments. Once this valuation analysis is finalized, the estimate of the fair value of the assets acquired and liabilities assumed may be adjusted. Several factors gave rise to the provisional goodwill recorded in the acquisition, such as the expected benefits of the addition of HookLogic to the existing performance marketing platform of the Company. Goodwill is not expected to be deductible for tax purposes.
In addition, acquisition costs amounting to $2.2 million were fully expensed as incurred.
The transaction has been accounted for as a business combination under the acquisition method of accounting. The following table summarizes the estimated fair values of the assets acquired and liabilities assumed as of the acquisition date. Due to the timing of the acquisition, these amounts are provisional and subject to change. The Company will finalize these amounts as it obtains the information necessary to complete the measurement process. Any changes resulting from facts and circumstances that existed as of the acquisition date may result in adjustments to the provisional amounts recognized at the acquisition date. These changes could be significant. The Company will finalize these amounts no later than one year from the acquisition date. In allocating the purchase price for the transaction, the Company recorded the following (in millions):
Amounts recognized as of Acquisition Date (in millions) | |||
Cash and cash equivalents | $ | 19.7 | |
Trade receivables, net of allowances | 29.2 | ||
Other current assets | 1.0 | ||
Property, plant and equipment, net | 1.3 | ||
Identifiable intangible assets | 84.4 | ||
Non-current financial assets | 0.3 | ||
Trade payables | (38.7 | ) | |
Financial liabilities - current portion | (7.4 | ) | |
Other taxes | (0.5 | ) | |
Employee-related payables | (1.4 | ) | |
Other current liabilities | (3.1 | ) | |
Total identifiable net assets | 84.8 | ||
Goodwill | 165.3 | ||
Total fair value of consideration transferred | $ | 250.1 | |
F-20
The following table summarizes the amounts and useful lives assigned to identified intangible assets :
Weighted-Average Useful Lives (Years) | Amounts recognized as of Acquisition Date (in millions) | ||||
Technology | 3-5 years | 24.4 | |||
Customer relationships | 5-9 years | $ | 60.0 | ||
Total identifiable intangible assets acquired | $ | 84.4 | |||
Assuming a weighted-average useful life of 4 years and 7 years for technology and customer relationships, respectively, annual expected amortization expense would amount to $6.0 million and $8.6 million, respectively.
The contribution of HookLogic to revenue, revenue ex-TAC and net income included in the Consolidated Financial Statements from the acquisition date to December 31, 2016 were $45.2 million, $12.3 million and $2.7 million, respectively.
The following unaudited consolidated revenue, revenue ex-TAC and net income from the standalone financial statements of HookLogic prepared under U.S. GAAP for the year ended December 31, 2016 amounts to $116.7 million, $34.1 million and $(4.8) million, respectively.
Acquisition of Monsieur Drive
On May 31, 2016, we acquired all of the outstanding shares of Monsieur Drive. The total consideration paid was $5.1 million (€4.6 million) for the acquisition of the shares, financed by available cash resources at the acquisition date. A preliminary valuation of the fair value of Monsieur Drive's assets acquired, liabilities assumed and the related allocation of purchase price has been performed as of December 31, 2016, resulting in the identification of a technology asset of $1.2 million (€1.2 million) and related deferred tax liability of $0.2 million (€0.2 million). Provisional goodwill amounted to $3.7 million (€3.5 million). Once this valuation analysis is finalized, the estimate of the fair value of the assets acquired and liabilities assumed may be adjusted. In addition, acquisition costs amounting to $0.2 million (€0.2 million) were fully expensed as incurred.
F-21
Note 4. Categories of Financial Assets and Financial Liabilities
Financial Assets
The following schedules disclose our financial assets categories for the presented periods:
Year Ended December 31, 2015 | |||||||||||
Carrying Value | Loans and receivables | Fair value | |||||||||
(in thousands) | |||||||||||
Cash and cash equivalents | $ | 353,537 | $ | — | $ | 353,537 | |||||
Trade receivables, net of allowances | 261,581 | 261,581 | $ | 261,581 | |||||||
Other taxes | 29,552 | 29,552 | $ | 29,552 | |||||||
Other current assets | 16,030 | 16,030 | $ | 16,030 | |||||||
Financial assets | 17,184 | 17,184 | $ | 17,184 | |||||||
Total | $ | 677,884 | $ | 324,347 | $ | 677,884 | |||||
Year Ended December 31, 2016 | |||||||||||
Carrying Value | Loans and receivables | Fair value | |||||||||
(in thousands) | |||||||||||
Cash and cash equivalents | $ | 270,317 | $ | — | $ | 270,317 | |||||
Trade receivables, net of allowances | 397,244 | 397,244 | $ | 397,244 | |||||||
Other taxes | 52,942 | 52,942 | $ | 52,942 | |||||||
Other current assets | 19,340 | 19,340 | $ | 19,340 | |||||||
Financial assets | 17,029 | 17,029 | $ | 17,029 | |||||||
Total | $ | 756,872 | $ | 486,555 | $ | 756,872 | |||||
F-22
Credit Risk
The maximum exposure to credit risk at the end of each reported period is represented by the carrying amount of financial assets, and summarized in the following table:
Year Ended December 31, | |||||||
2015 | 2016 | ||||||
(in thousands) | |||||||
Cash and cash equivalents | $ | 353,537 | $ | 270,317 | |||
Trade receivables, net of allowances | 261,581 | 397,244 | |||||
Other taxes | 29,552 | 52,942 | |||||
Other current assets | 16,030 | 19,340 | |||||
Non-current financial assets | 17,184 | 17,029 | |||||
Total | $ | 677,884 | $ | 756,872 | |||
As of December 31, 2016 and 2015, no customer accounted for 10% or more of trade receivables.
We perform ongoing credit evaluations of our customers and do not require collateral. We maintain an allowance for estimated credit losses. During the years ended December 31, 2016 and 2015, our net change in allowance for doubtful accounts was $5.4 million and $2.3 million, respectively.
Trade Receivables
Credit risk is defined as an unexpected loss in cash and earnings if the client is unable to pay its obligations in due time. We perform internal ongoing credit risk evaluations of our clients. When a possible risk exposure is identified, we require prepayments.
For each period presented, the aging of trade receivables and allowances for doubtful accounts is as follows:
Year Ended December 31, | |||||||||||||||||||||||||||
2015 | 2016 | ||||||||||||||||||||||||||
Gross value | % | Allowance | % | Gross value | % | Allowance | % | ||||||||||||||||||||
(in thousands) | (in thousands) | (in thousands) | (in thousands) | ||||||||||||||||||||||||
Not yet due | $ | 193,603 | 72.2 | % | $ | — | — | % | $ | 265,600 | 65.0 | % | $ | — | — | % | |||||||||||
0 - 30 days | $ | 53,803 | 20.1 | % | $ | — | — | % | $ | 92,163 | 22.5 | % | $ | (49 | ) | 0.4 | % | ||||||||||
31 - 60 days | $ | 8,287 | 3.1 | % | $ | — | — | % | $ | 19,747 | 4.8 | % | $ | (182 | ) | 1.6 | % | ||||||||||
61 - 90 days | $ | 2,574 | 1.0 | % | $ | (2 | ) | — | % | $ | 6,055 | 1.5 | % | $ | (191 | ) | 1.6 | % | |||||||||
> 90 days | $ | 9,578 | 3.6 | % | $ | (6,262 | ) | 100.0 | % | $ | 25,277 | 6.2 | % | $ | (11,176 | ) | 96.4 | % | |||||||||
Total | $ | 267,845 | 100.0 | % | $ | (6,264 | ) | 100.0 | % | $ | 408,842 | 100.0 | % | $ | (11,598 | ) | 100.0 | % | |||||||||
Cash and Cash Equivalents
Cash and cash equivalents are exclusively invested in secure investments such as interest-bearing term deposits.
F-23
Financial Liabilities
Year Ended December 31, 2015 | |||||||
Carrying Value | Fair value | ||||||
(in thousands) | |||||||
Trade payables | $ | 246,382 | $ | 246,382 | |||
Other taxes | 30,463 | 30,463 | |||||
Employee - related payables | 42,275 | 42,275 | |||||
Other current liabilities | 15,531 | 15,531 | |||||
Financial liabilities | 10,428 | 10,428 | |||||
of which derivative financial instruments | 553 | 553 | |||||
Total | $ | 345,079 | $ | 345,079 | |||
Year Ended December 31, 2016 | |||||||
Carrying Value | Fair value | ||||||
(in thousands) | |||||||
Trade payables | $ | 365,788 | $ | 365,788 | |||
Other taxes | 44,831 | 44,831 | |||||
Employee - related payables | 55,874 | 55,874 | |||||
Other current liabilities | 30,221 | 30,221 | |||||
Financial liabilities | 85,580 | 85,580 | |||||
of which derivative financial instruments | 1,968 | $ | 1,968 | ||||
Total | $ | 582,294 | $ | 582,294 | |||
Fair Value Measurements
We measure the fair value of our cash equivalents, which include money market funds and interest bearing deposits, as level 1 and level 2 measurements because they are valued using quoted market prices and observable market data, respectively.
Financial liabilities include derivative financial instruments used to manage our exposure to the risk of exchange rate fluctuations. These instruments are considered level 2 financial instruments as they are measured using valuation techniques based on observable market data.
F-24
Note 5. Cash and Cash Equivalents
The following table presents for each reported period, the breakdown of cash and cash equivalents:
Year Ended December 31, | |||||||
2015 | 2016 | ||||||
(in thousands) | |||||||
Money market funds | $ | 54,188 | $ | 31,688 | |||
Interest-bearing bank deposits | 114,127 | 88,091 | |||||
Cash and cash equivalents | 185,222 | 150,538 | |||||
Total Cash and cash equivalents | $ | 353,537 | $ | 270,317 | |||
The short-term investments included investments in money market funds and interest–bearing bank deposits which met ASC 230—Statement of Cash flows criteria: short-term, highly liquid investments, for which the risks of changes in value are considered to be insignificant.
The following table shows the allocation by currency of our financial liabilities and cash and cash equivalents:
Currency | |||||||||||||||||||||||||||||||
Carrying value | EUR | GBP | USD | CNY | JPY | KRW | Other | ||||||||||||||||||||||||
(in thousands) | |||||||||||||||||||||||||||||||
Borrowings | $ | 82,921 | $ | 3,289 | $ | — | $ | 75,253 | $ | 4,379 | $ | — | $ | — | $ | — | |||||||||||||||
Other financial liabilities | 691 | 450 | — | 241 | — | — | — | — | |||||||||||||||||||||||
Financial derivatives | 1,968 | 1,968 | — | — | — | — | — | — | |||||||||||||||||||||||
Financial liabilities | 85,580 | 5,707 | — | 75,494 | 4,379 | — | — | — | |||||||||||||||||||||||
Cash and cash equivalents | $ | 270,317 | $ | 197,997 | $ | 2,887 | $ | 29,636 | $ | 3,074 | $ | 17,316 | $ | 2,531 | $ | 16,876 | |||||||||||||||
F-25
Note 6. Trade Receivables
The following table shows the breakdown in trade receivables net book value for the presented periods:
Year Ended December 31, | |||||||
2015 | 2016 | ||||||
(in thousands) | |||||||
Trade accounts receivables | $ | 267,845 | $ | 408,842 | |||
(Less) Allowance for doubtful accounts | (6,264 | ) | (11,598 | ) | |||
Net book value at end of period | $ | 261,581 | $ | 397,244 | |||
Changes in allowance for doubtful accounts are summarized below:
Year Ended December 31, | |||||||||||
2014 | 2015 | 2016 | |||||||||
(in thousands) | |||||||||||
Balance at beginning of period | $ | (2,529 | ) | $ | (3,930 | ) | $ | (6,264 | ) | ||
Provision for doubtful accounts | (2,248 | ) | (2,660 | ) | (9,898 | ) | |||||
Reversal of provision | 910 | — | 4,464 | ||||||||
Change in consolidation scope | (450 | ) | (99 | ) | (221 | ) | |||||
Currency translation adjustment | 387 | 425 | 321 | ||||||||
Balance at end of period | $ | (3,930 | ) | $ | (6,264 | ) | $ | (11,598 | ) | ||
Note 7. Other Current Assets
The following table shows the breakdown in other current assets net book value for the presented periods:
Year Ended December 31, | |||||||
2015 | 2016 | ||||||
(in thousands) | |||||||
Prepayments to suppliers | $ | 2,774 | $ | 2,439 | |||
Employee-related receivables | 94 | 97 | |||||
Taxes receivables | 29,552 | 52,942 | |||||
Other debtors | 3,687 | 3,166 | |||||
Prepaid expenses | 9,475 | 13,638 | |||||
Gross book value at end of period | 45,582 | 72,282 | |||||
Net book value at end of period | $ | 45,582 | $ | 72,282 | |||
Taxes receivables are primarily composed of VAT receivables and research tax credit receivables. Prepaid expenses mainly consist of office rental advance payments.
F-26
Note 8. Property, Plant and Equipment
Changes in net book value during the presented periods are summarized below:
Fixtures and fittings | Furniture and equipment | Construction in Progress | Total | ||||||||||||
(in thousands) | |||||||||||||||
Net book value at January 1, 2015 | $ | 2,501 | $ | 47,391 | $ | 2,347 | $ | 52,239 | |||||||
Additions to tangible assets | 13,408 | 50,849 | 3,990 | 68,247 | |||||||||||
Disposal of tangible assets | (53 | ) | (48 | ) | — | (101 | ) | ||||||||
Depreciation expense | (1,840 | ) | (32,487 | ) | — | (34,327 | ) | ||||||||
Change in consolidation scope | 31 | 87 | — | 118 | |||||||||||
Currency translation adjustment | (488 | ) | (2,936 | ) | (270 | ) | (3,694 | ) | |||||||
Transfer into service | 784 | 677 | (1,461 | ) | — | ||||||||||
Net book value at December 31, 2015 | 14,343 | 63,533 | 4,606 | 82,482 | |||||||||||
Gross book value at end of period | 15,948 | 125,968 | 4,606 | 146,522 | |||||||||||
Accumulated depreciation and impairment at end of period | (1,605 | ) | (62,435 | ) | — | (64,040 | ) | ||||||||
Net book value at January 1, 2016 | 14,343 | 63,533 | 4,606 | 82,482 | |||||||||||
Additions to tangible assets | 6,188 | 57,866 | 11,976 | 76,030 | |||||||||||
Disposal of tangible assets net of accumulated depreciation | — | (8 | ) | — | (8 | ) | |||||||||
Depreciation expense | (4,496 | ) | (43,665 | ) | — | (48,161 | ) | ||||||||
Change in consolidation scope | 85 | 405 | — | 490 | |||||||||||
Currency translation adjustment | (499 | ) | (1,665 | ) | (88 | ) | (2,252 | ) | |||||||
Transfer into service | 2,544 | 1,283 | (3,827 | ) | — | ||||||||||
Net book value at December 31, 2016 | $ | 18,165 | $ | 77,749 | $ | 12,667 | $ | 108,581 | |||||||
Gross book value at end of period | 24,200 | 179,025 | 12,667 | 215,892 | |||||||||||
Accumulated depreciation and impairment at end of period | (6,035 | ) | (101,276 | ) | — | (107,311 | ) | ||||||||
The increase in property plant and equipment (gross book value and accumulated depreciation) mainly includes server equipment in the French, American and Japanese subsidiaries where the Company’s data center equipments are located as well as fit out of new office locations in the United States and Singapore.
F-27
Note 9. Intangible assets
Changes in net book value during the presented periods are summarized below:
Software | Technology and customer relationships | Construction in Progress | Total | ||||||||||||
(in thousands) | |||||||||||||||
Net book value at January 1, 2015 | $ | 5,122 | $ | 7,356 | $ | 343 | $ | 12,821 | |||||||
Additions to intangible assets | 5,645 | 554 | 1,172 | 7,371 | |||||||||||
Amortization expense | (3,631 | ) | (6,604 | ) | — | (10,235 | ) | ||||||||
Change in consolidation scope | 1 | 7,800 | — | 7,801 | |||||||||||
Currency translation adjustment | (570 | ) | (666 | ) | (52 | ) | (1,288 | ) | |||||||
Transfer into service | 314 | — | (314 | ) | — | ||||||||||
Net book value at December 31, 2015 | 6,881 | 8,440 | 1,149 | 16,470 | |||||||||||
Gross book value at end of period | 15,863 | 18,538 | 1,149 | 35,550 | |||||||||||
Accumulated depreciation and impairment at end of period | (8,982 | ) | (10,098 | ) | — | (19,080 | ) | ||||||||
Net book value at January 1, 2016 | 6,881 | 8,440 | 1,149 | 16,470 | |||||||||||
Additions to intangible assets | 7,972 | 553 | — | 8,525 | |||||||||||
Amortization expense | (3,449 | ) | (4,969 | ) | — | (8,418 | ) | ||||||||
Change in consolidation scope | 3 | 86,230 | 788 | 87,021 | |||||||||||
Currency translation adjustment | (455 | ) | (185 | ) | (14 | ) | (654 | ) | |||||||
Transfer into service | 435 | 594 | (1,029 | ) | — | ||||||||||
Net book value at December 31, 2016 | $ | 11,387 | $ | 90,663 | $ | 894 | $ | 102,944 | |||||||
Gross book value at end of period | 22,770 | 106,328 | 894 | 129,992 | |||||||||||
Accumulated depreciation and impairment at end of period | (11,383 | ) | (15,665 | ) | — | (27,048 | ) | ||||||||
Additions to software consist mainly of internal-use software and IT licenses. Additions to technology and customer relationships relate to a preliminary valuation of Monsieur Drive and HookLogic identified intangibles, as the purchase price allocation is in progress as of December 31, 2016 (classified under “Change in consolidation scope”). Amortization on technology and customer relationships relates to Monsieur Drive, Datapop, Tedemis and Ad-X Limited) intangibles resulting from business combinations.
F-28
As of December 31, 2016, expected amortization expense for intangible assets other than intangible assets recognized in conjunction with the HookLogic acquisition (refer to Note 3) for the next five years is as follows (in thousands):
Software | Technology and customer relationships | Total | |||||||||
2017 | $ | 5,116 | $ | 2,709 | $ | 7,825 | |||||
2018 | 4,321 | 2,411 | 6,732 | ||||||||
2019 | 2,218 | 436 | 2,654 | ||||||||
2020 | 586 | — | 586 | ||||||||
2021 | 11 | — | 11 | ||||||||
Total | $ | 12,252 | $ | 5,556 | $ | 17,808 | |||||
The average life of the software, the technology and customer relationships is 3 years.
Note 10. Non-Current Financial Assets
Non-current financial assets are mainly composed of (i) an interest-bearing bank deposit amounting to $6.6 million, which is pledged to the benefit of a bank in order to secure the first-demand bank guarantee in connection with our headquarters premises, and (ii) guarantee deposits for office rentals in France, Spain, the United Kingdom, the United States, Japan, China and Singapore.
F-29
Note 11. Goodwill
Goodwill | |||
(in thousands) | |||
Balance at January 1, 2015 | $ | 27,856 | |
Additions to goodwill | 16,695 | ||
Currency translation adjustment | (2,578 | ) | |
Balance at December 31, 2015 | 41,973 | ||
Additions to goodwill | 169,197 | ||
Currency translation adjustment | (1,752 | ) | |
Balance at December 31, 2016 | $ | 209,418 | |
For a discussion of additions to goodwill in 2016 (acquisitions of HookLogic and Monsieur Drive), please refer to Note 2.
On February 17, 2015, we acquired all of the outstanding shares of DataPop, Inc., a Los Angeles-based company specializing in the optimization of shopping campaigns on large search engines. The total consideration paid was $22.0 million ($3.7 million as cash advances and $18.3 million for the acquisition of shares). As a result of the purchase price allocation, a technology asset of $7.8 million was identified. Residual goodwill has been valued at $16.7 million. Acquisition costs amounting to $0.6 million were fully expensed as incurred.
On April 7, 2014, we acquired all the outstanding shares of AdQuantic, a bidding technology company headquartered in Paris. The total consideration paid for the acquisition was $4.1 million (€3.0 million) paid in cash at the acquisition date. Consequently, as of December 31, 2014, further to the purchase price allocation, goodwill was recognized for $3.9 million (€2.8 million) corresponding to the workforce and know-how acquired. Acquisition costs amounting to $0.1 million (€0.1 million) were fully expensed as incurred.
On February 19, 2014, we acquired all the outstanding shares of Tedemis, a leading provider of realtime personalized email marketing solutions that help advertisers turn web visitors into customers. The total consideration paid for the acquisition was $29 million (€21.0 million) composed as follows: $23.4 million (€17.0 million) paid in cash at the acquisition date and $5.5 million (€4.0 million) as deferred consideration, contingent upon certain milestones over a 2 year period. As of December 31, 2014, further to the purchase price allocation the following assets have been identified: technology for $3.9 million (€2.8 million), cookie pool for $6.3 million (€4.6 million) and related deferred taxes for $3.2 million (€2.3 million). Residual goodwill has been valued at $21.6 million (€15.6 million). Acquisition costs were fully expensed as incurred for a total amount of $0.5 million (€0.4 million) (of which $0.1 million (€0.1 million) was incurred during the period ended December 31, 2013).
Identified intangibles assets are amortized and an impairment test is performed on the goodwill annually.
F-30
Note 12. Contingencies
Changes in provisions during the presented periods are summarized below:
Provision for employee- related litigation | Provision for tax- related litigation | Other provisions | Total | |||||||||
(in thousands) | ||||||||||||
Balance at January 1, 2015 | $ | 781 | $ | 592 | $ | — | $ | 1,373 | ||||
Charges | 200 | 44 | 388 | 632 | ||||||||
Provision used | (487 | ) | — | — | (487 | ) | ||||||
Provision released not used | (186 | ) | (541 | ) | — | (727 | ) | |||||
Currency translation adjustments | (72 | ) | (51 | ) | — | (123 | ) | |||||
Balance at January 1, 2016 | $ | 236 | $ | 44 | $ | 388 | $ | 668 | ||||
Charges | 671 | — | 166 | 837 | ||||||||
Provision used | (402 | ) | — | (48 | ) | (450 | ) | |||||
Provision released not used | — | (44 | ) | (347 | ) | (391 | ) | |||||
Currency translation adjustments | (20 | ) | — | 10 | (10 | ) | ||||||
Balance at December 31, 2016 | $ | 485 | $ | — | $ | 169 | $ | 654 | ||||
- of which current | $ | 485 | $ | — | $ | 169 | $ | 654 | ||||
The amount of the provisions represent management’s best estimate of the future outflow. Provisions are mainly in relation to employee-related litigation and other provisions which consist of estimated restoration costs following the end of leases in 2015 and 2016. The remaining provision was for tax contingencies relating to a tax inspection covering the fiscal years 2008 and 2009, which released upon receipt of the tax notification as of December 31, 2015.
Note 13. Other Current Liabilities
Other current liabilities are presented in the following table:
Year Ended December 31, | |||||||
2015 | 2016 | ||||||
(in thousands) | |||||||
Clients' prepayments | $ | 6,244 | $ | 9,176 | |||
Employee-related payables | 42,275 | 55,874 | |||||
Taxes payable | 30,463 | 44,831 | |||||
Accounts payable relating to capital expenditures | 8,037 | 15,484 | |||||
Other creditors | 1,091 | 2,440 | |||||
Deferred revenue | 159 | 3,121 | |||||
Total | $ | 88,269 | $ | 130,926 | |||
F-31
Note 14. Financial Liabilities
The changes in current and non-current financial liabilities during the periods ended December 31, 2015 and December 31, 2016 are illustrated in the following schedules:
As of December 31, 2014 | New borrowings | Repayments | Liabilities assumed in connection with business combinations | Other(1) | Currency translation adjustment | As of December 31, 2015 | ||||||||||||||||||||||
(in thousands) | ||||||||||||||||||||||||||||
Borrowings | $ | 8,007 | $ | 4,023 | $ | (8,716 | ) | $ | 1,796 | $ | 1,599 | $ | (736 | ) | $ | 5,973 | ||||||||||||
Financial liabilities relating to finance leases | 282 | — | (258 | ) | — | 24 | (25 | ) | 23 | |||||||||||||||||||
Other financial liabilities | 488 | — | (1,000 | ) | 1,000 | 174 | (54 | ) | 608 | |||||||||||||||||||
Financial derivatives | 743 | — | — | — | (116 | ) | (75 | ) | 552 | |||||||||||||||||||
Financial liabilities - current portion | 9,520 | 4,023 | (9,974 | ) | 2,796 | 1,681 | (890 | ) | 7,156 | |||||||||||||||||||
Borrowings | 5,044 | — | — | — | (1,275 | ) | (497 | ) | 3,272 | |||||||||||||||||||
Financial liabilities relating to finance leases | 25 | — | — | — | (24 | ) | (1 | ) | — | |||||||||||||||||||
Other financial liabilities | 191 | — | — | — | (174 | ) | (17 | ) | — | |||||||||||||||||||
Financial liabilities - non current portion | 5,260 | — | — | — | (1,473 | ) | (515 | ) | 3,272 | |||||||||||||||||||
Borrowings | 13,051 | 4,023 | (8,716 | ) | 1,796 | 324 | (1,233 | ) | 9,245 | |||||||||||||||||||
Financial liabilities relating to finance leases | 307 | — | (258 | ) | — | — | (26 | ) | 23 | |||||||||||||||||||
Other financial liabilities | 679 | — | (1,000 | ) | 1,000 | — | (71 | ) | 608 | |||||||||||||||||||
Financial derivatives | 743 | — | — | — | (116 | ) | (75 | ) | 552 | |||||||||||||||||||
Total | $ | 14,780 | $ | 4,023 | $ | (9,974 | ) | $ | 2,796 | $ | 208 | $ | (1,405 | ) | $ | 10,428 | ||||||||||||
(1) Includes reclassification from non-current to current portion based on maturity of the financial liabilities.
F-32
As of December 31, 2015 | New borrowings | Repayments | Liabilities assumed in connection with business combinations | Other (1) | Currency translation adjustment | As of December 31, 2016 | |||||||||||||||||||||
(in thousands) | |||||||||||||||||||||||||||
Borrowings | $ | 5,973 | $ | 5,846 | $ | (13,854 | ) | $ | 7,067 | $ | 808 | $ | (316 | ) | $ | 5,524 | |||||||||||
Financial liabilities relating to finance leases | 23 | — | (27 | ) | — | — | 4 | — | |||||||||||||||||||
Other financial liabilities | 608 | 64 | (286 | ) | 318 | (225 | ) | (2 | ) | 477 | |||||||||||||||||
Financial derivatives | 552 | — | — | — | 1,505 | (89 | ) | 1,968 | |||||||||||||||||||
Current portion | 7,156 | 5,910 | (14,167 | ) | 7,385 | 2,088 | (403 | ) | 7,969 | ||||||||||||||||||
Borrowings | 3,272 | 78,752 | — | — | (808 | ) | (3,819 | ) | 77,397 | ||||||||||||||||||
Other financial liabilities | — | — | — | — | 225 | (11 | ) | 214 | |||||||||||||||||||
Non current portion | 3,272 | 78,752 | — | — | (583 | ) | (3,830 | ) | 77,611 | ||||||||||||||||||
Borrowings | 9,245 | 84,598 | (13,854 | ) | 7,067 | — | (4,135 | ) | 82,921 | ||||||||||||||||||
Financial liabilities relating to finance leases | 23 | — | (27 | ) | — | — | 4 | — | |||||||||||||||||||
Other financial liabilities | 608 | 64 | (286 | ) | 318 | — | (13 | ) | 691 | ||||||||||||||||||
Financial derivatives | 552 | — | — | — | 1,505 | (89 | ) | 1,968 | |||||||||||||||||||
Total | $ | 10,428 | $ | 84,662 | $ | (14,167 | ) | $ | 7,385 | $ | 1,505 | $ | (4,233 | ) | $ | 85,580 | |||||||||||
(1) Includes reclassification from non-current to current portion based on maturity of the financial liabilities.
We are party to several loan agreements and revolving credit facilities, or RCF, with third-party financial institutions. Our loans and RCF agreements are presented in the table below:
Nominal/ Authorized amounts | Amount drawn as of December 31, 2016 (RCF only) | ||||||||||
Nature | (in thousands) | Interest rate | Settlement date | ||||||||
Central loan agreements | |||||||||||
BPI Loan | |||||||||||
February 20, 2014 | € | 3,000 | N/A | Fixed: 2.09% | May 31, 2021 | ||||||
Central RCF | |||||||||||
BPI RCF | |||||||||||
February 20, 2014 | € | 2,000 | € | 50 | Floating rate: EURIBOR 3M + 0.7% 0.39% as of December 31, 2016 | February 28, 2017 | |||||
Bank Syndicate RCF | |||||||||||
September 24, 2015 | € | 250,000 | $ | 75,000 | Floating rate: EURIBOR / LIBOR + margin depending on leverage ratio 1.73% as of December 31, 2016 | September 23, 2020 | |||||
China RCF | |||||||||||
HSBC RCF | |||||||||||
May 12, 2015 | RMB 40,000 | RMB 30,000 | Floating rate: + 10% 4.79% as of December 31, 2016 | N/A | |||||||
F-33
In September 2015, Criteo entered into a five year revolving credit facility for general corporate purposes, including acquisitions, for a maximum amount of €250 million ($263.5 million), with a bank syndicate composed of Natixis (coordinator and documentation agent), Le Credit Lyonnais (LCL) (facility agent), HSBC France, Société Générale Corporate & Investment Banking and BNP Paribas (each acting individually as bookrunners and mandated lead arrangers). This multi-currency revolving credit facility bears interest rate at Euribor or the relevant Libor plus a variable margin (adjusted on the basis of the leverage ratio). As of December 31, 2016, $75.0 million had been drawn.
We were party to a loan agreement with Le Credit Lyonnais, or LCL, to finance certain capital expenditures. The outstanding principal and interest were payable in equal monthly installments and matured in June 2016. As a result, at December 31, 2016, the loan agreement was fully repaid.
In February 2014, we entered into an agreement with Bpifrance Financement (French Public Investment Bank) to support our development. This is a fixed rate seven-year term loan for €3 million ($3.2 million) which will be amortized quarterly after a two-year grace period.
In February 2014, we also entered into a three-year RCF with Bpifrance Financement (French Public Investment Bank). Upon origination, this agreement allowed for a maximum amount of €3.0 million ($3.2 million) in the first year, decreasing by €1.0 million ($1.0 million) in each subsequent year. As of December 31, 2016, we are authorized to draw €1.0 million ($1.0 million). The interest rate is Euribor 3 months plus a 0.70% margin. A 0.30% commitment fee is due on a quarterly basis depending on the amount used. At December 31, 2016, €0.1 million ($0.1 million) had been drawn.
In October 2014, and as amended in May 2015, we entered into a revolving loan facility with HSBC to support the development of our Chinese subsidiary for a total amount RMB 40.0 million ($5.8 million). Interest is determined at a rate equal to the benchmark lending rate effective on the loan drawdown date promulgated by the People’s Bank of China with a 10% mark up and payable when the loan matures. At December 31, 2016, RMB 30 million ($4.3 million) had been drawn.
All of these loans and revolving credit facilities are unsecured and contain customary events of default but do not contain any affirmative, financial or negative covenants, with the exception of the September 2015 revolving credit facility which contains covenants, including compliance with a total net debt to adjusted EBITDA ratio and restrictions on the incurrence of additional indebtedness. At December 31, 2016, we were in compliance with the required leverage ratio.
The following table shows the maturity of our financial liabilities:
Maturity | ||||||||||||||||||||||||||||
Carrying value | 2017 | 2018 | 2019 | 2020 | 2021 | 2022 | ||||||||||||||||||||||
(in thousands) | ||||||||||||||||||||||||||||
Borrowings | $ | 82,921 | $ | 5,522 | $ | 817 | $ | 632 | $ | 75,634 | $ | 316 | $ | — | ||||||||||||||
Financial liabilities relating to finance leases | — | — | — | — | — | — | — | |||||||||||||||||||||
Other financial liabilities | 691 | 477 | — | 214 | — | — | — | |||||||||||||||||||||
Bank overdraft | — | — | — | — | — | — | — | |||||||||||||||||||||
Financial derivatives | 1,968 | 1,968 | — | — | — | — | — | |||||||||||||||||||||
Financial liabilities | 85,580 | 7,967 | 817 | 846 | 75,634 | 316 | — | |||||||||||||||||||||
F-34
Note 15. Employee Benefits
Defined Benefit Plans
According to the French law and the Syntec Collective Agreement, French employees are entitled to compensation paid on retirement.
The following table summarizes the changes in the projected benefit obligation:
Year Ended December 31, | |||||||||||
2014 | 2015 | 2016 | |||||||||
(in thousands) | |||||||||||
Projected benefit obligation present value—beginning of period | $ | 1,276 | $ | 1,245 | $ | 1,445 | |||||
Service cost | 492 | 441 | 524 | ||||||||
Interest cost | 33 | 22 | 37 | ||||||||
Actuarial losses (gains) | (512 | ) | (128 | ) | 1,335 | ||||||
Change in consolidation scope | 119 | — | 19 | ||||||||
Currency translation adjustment | (163 | ) | (135 | ) | (139 | ) | |||||
Projected benefit obligation present value—end of period | $ | 1,245 | $ | 1,445 | $ | 3,221 | |||||
The Company does not hold any plan assets for any of the periods presented. The reconciliation of the changes in the present value of projected benefit obligation with the Consolidated Statements of Income for the presented periods is illustrated in the following table:
Year Ended December 31, | |||||||||||
2014 | 2015 | 2016 | |||||||||
(in thousands) | |||||||||||
Service cost | $ | (492 | ) | $ | (441 | ) | $ | (524 | ) | ||
Research and development expenses | (167 | ) | (163 | ) | (211 | ) | |||||
Sales and operations expenses | (188 | ) | (153 | ) | (144 | ) | |||||
General and administrative expenses | (137 | ) | (125 | ) | (169 | ) | |||||
Interest cost | (33 | ) | (22 | ) | (37 | ) | |||||
Financial income (expense) | (33 | ) | (22 | ) | (37 | ) | |||||
Actuarial gains (losses) | 512 | 128 | (1,335 | ) | |||||||
Accumulated other comprehensive income | 512 | 128 | (1,335 | ) | |||||||
Amortization of net loss (gain) | 12 | — | — | ||||||||
F-35
The main assumptions used for the purposes of the actuarial valuations are listed below:
Year Ended December 31, | |||||
2014 | 2015 | 2016 | |||
Discount rate (Corp AA) | 1.5% | 2.5% | 1.9% | ||
Expected rate of salary increase | 5.0% | 5.0% | 5.0% | ||
Expected rate of social charges | 44.0% - 47.6% | 48.0% - 51.0% | 49.0% - 51.0% | ||
Expected staff turnover | 0 - 15% | 0 - 15% | 0 - 10.5% | ||
Estimated retirement age | 65 years old | 65 years old | Progressive table | ||
Life table | INSEE - 2007 - 2009 | TGHF 2005 | TH-TF 2000-2002 shifted | ||
Defined Contribution Plans
The total expense represents contributions payable to these plans by us at specified rates.
The Group makes earnings-related payments, in accordance with local customs, to the national organizations responsible for paying pensions and similar financial benefits. The main contributions concern France, the United States, for 401k plans, and the United Kingdom.
Year Ended December 31, | |||||||||||
2014 | 2015 | 2016 | |||||||||
(in thousands) | |||||||||||
Defined contributions plans included in personnel expenses | $ | (6,522 | ) | $ | (8,320 | ) | $ | (11,061 | ) | ||
F-36
Note 16. Common shares
We manage our capital to ensure that entities in the Company will be able to continue as a going concern while maximizing the return to stakeholders through the optimization of the debt and equity balance.
Our capital structure consists of financial liabilities (as detailed in Note 14 offset by cash and bank balances) and equity (comprising issued capital, reserves, retained earnings and non-controlling interests).
We are not subject to any externally imposed capital requirements.
Issued Capital
As of December 31, 2016, the Parent’s share capital was composed of 63,978,204 ordinary shares, each with a nominal value of €0.025, i.e. a total amount of €1.6 million, or $2.1 million.
Change in Number of Shares
Number of ordinary shares | ||
Balance at January 1, 2015 | 60,902,695 | |
Issuance of shares under share option and free share plans (1) | 1,568,186 | |
Balance at December 31, 2015 | 62,470,881 | |
Issuance of shares under share option and free share plans (2) | 1,507,323 | |
Balance at December 31, 2016 | 63,978,204 | |
(1) Adopted by the Board of Directors on January 29, 2015, March 19, 2015, April 30, 2015, July 30, 2015, October 29, 2015 and December 17, 2015.
(2) Adopted by the Board of Directors on January 29, 2016, February 25, 2016, April 20, 2016, June 28, 2016, July 28, 2016, October 27, 2016 and November 9, 2016.
F-37
Note 17. Nature of Expenses Allocated by Function
Nature of Expenses Allocated to Cost of Revenue
Year Ended December 31, | |||||||||||
2014 | 2015 | 2016 | |||||||||
(in thousands) | |||||||||||
Traffic acquisition costs | $ | (585,492 | ) | $ | (789,152 | ) | $ | (1,068,911 | ) | ||
Other cost of revenue | (47,948 | ) | (62,201 | ) | (85,260 | ) | |||||
Hosting costs | (24,780 | ) | (30,428 | ) | (41,978 | ) | |||||
Depreciation and amortization | (21,455 | ) | (29,866 | ) | (38,469 | ) | |||||
Data acquisition | (600 | ) | (257 | ) | (122 | ) | |||||
Other cost of sales | (1,113 | ) | (1,650 | ) | (4,691 | ) | |||||
Total cost of revenue | $ | (633,440 | ) | $ | (851,353 | ) | $ | (1,154,171 | ) | ||
Nature of Expenses Allocated to Research and Development
Year Ended December 31, | |||||||||||
2014 | 2015 | 2016 | |||||||||
(in thousands) | |||||||||||
Personnel expenses | $ | (40,075 | ) | $ | (58,075 | ) | $ | (86,389 | ) | ||
Personnel expense excluding equity awards compensation expense and research tax credit | (41,456 | ) | (54,941 | ) | (79,222 | ) | |||||
Equity awards compensation expense | (3,682 | ) | (6,520 | ) | (12,108 | ) | |||||
Research tax credit | 5,063 | 3,386 | 4,941 | ||||||||
Other cash operating expenses | (14,888 | ) | (21,081 | ) | (29,867 | ) | |||||
Subcontracting and other headcount related costs | (8,218 | ) | (12,592 | ) | (14,713 | ) | |||||
Rent and facilities costs | (5,765 | ) | (7,107 | ) | (10,939 | ) | |||||
Consulting and professional fees | (765 | ) | (1,201 | ) | (2,423 | ) | |||||
Marketing costs | (97 | ) | (161 | ) | (953 | ) | |||||
Other | (43 | ) | (20 | ) | (839 | ) | |||||
Other non-cash operating expenses | (5,112 | ) | (7,651 | ) | (7,393 | ) | |||||
Depreciation and amortization | (4,949 | ) | (7,995 | ) | (7,211 | ) | |||||
Net change in other provisions | (163 | ) | 344 | (182 | ) | ||||||
Total research and development expenses | $ | (60,075 | ) | $ | (86,807 | ) | $ | (123,649 | ) | ||
F-38
Nature of Expenses Allocated to Sales and Operations
Year Ended December 31, | |||||||||||
2014 | 2015 | 2016 | |||||||||
(in thousands) | |||||||||||
Personnel expenses | $ | (119,609 | ) | $ | (150,426 | ) | $ | (185,065 | ) | ||
Personnel expense excluding equity awards compensation expense | (107,319 | ) | (138,748 | ) | (168,227 | ) | |||||
Equity awards compensation expense | (12,290 | ) | (11,678 | ) | (16,838 | ) | |||||
Other cash operating expenses | (52,077 | ) | (71,034 | ) | (84,127 | ) | |||||
Subcontracting and other headcount related costs | (17,363 | ) | (20,856 | ) | (22,460 | ) | |||||
Rent and facilities costs | (15,684 | ) | (25,542 | ) | (29,968 | ) | |||||
Marketing costs | (9,443 | ) | (12,478 | ) | (15,225 | ) | |||||
Other | (9,587 | ) | (12,158 | ) | (16,474 | ) | |||||
Other non-cash operating expenses | (5,241 | ) | (8,070 | ) | (13,661 | ) | |||||
Depreciation and amortization | (3,664 | ) | (5,178 | ) | (7,757 | ) | |||||
Net change in provisions for doubtful receivables | (1,342 | ) | (2,660 | ) | (5,433 | ) | |||||
Net change in other provisions | (235 | ) | (232 | ) | (471 | ) | |||||
Total sales and operations expenses | $ | (176,927 | ) | $ | (229,530 | ) | $ | (282,853 | ) | ||
Nature of Expenses Allocated to General and Administrative
Year Ended December 31, | |||||||||||
2014 | 2015 | 2016 | |||||||||
(in thousands) | |||||||||||
Personnel expenses | $ | (29,734 | ) | $ | (37,670 | ) | $ | (60,899 | ) | ||
Personnel expense excluding equity awards compensation expense | (26,106 | ) | (31,879 | ) | (46,586 | ) | |||||
Equity awards compensation expense | (3,628 | ) | (5,791 | ) | (14,313 | ) | |||||
Other cash operating expenses | (33,430 | ) | (41,814 | ) | (52,867 | ) | |||||
Subcontracting and other headcount related costs | (17,452 | ) | (19,963 | ) | (22,990 | ) | |||||
Rent and facilities costs | (4,731 | ) | (6,475 | ) | (9,516 | ) | |||||
Consulting and professional fees | (10,094 | ) | (12,921 | ) | (18,298 | ) | |||||
Other | (1,153 | ) | (2,455 | ) | (2,063 | ) | |||||
Other non-cash operating expenses | (1,559 | ) | 339 | (3,703 | ) | ||||||
Depreciation and amortization | (1,145 | ) | (1,526 | ) | (3,342 | ) | |||||
Net change in other provisions | (414 | ) | (353 | ) | (361 | ) | |||||
Other | — | 2,218 | — | ||||||||
Total general and administrative expenses | $ | (64,723 | ) | $ | (79,145 | ) | $ | (117,469 | ) | ||
F-39
Note 18. Allocation of Personnel Expenses
Allocation of Personnel Expenses By Function
Year Ended December 31, | |||||||||||
2014 | 2015 | 2016 | |||||||||
(in thousands) | |||||||||||
Research and development expenses | $ | (40,075 | ) | $ | (58,075 | ) | $ | (86,389 | ) | ||
Sales and operations expenses | (119,609 | ) | (150,426 | ) | (185,065 | ) | |||||
General and administrative expenses | (29,734 | ) | (37,670 | ) | (60,899 | ) | |||||
Total personnel expenses | $ | (189,418 | ) | $ | (246,171 | ) | $ | (332,353 | ) | ||
Allocation of Personnel Expenses by Nature
Year Ended December 31, | |||||||||||
2014 | 2015 | 2016 | |||||||||
(in thousands) | |||||||||||
Wages and salaries | $ | (128,737 | ) | $ | (170,079 | ) | $ | (220,317 | ) | ||
Severance pay | (2,469 | ) | (1,343 | ) | (2,726 | ) | |||||
Social charges | (38,814 | ) | (47,176 | ) | (59,668 | ) | |||||
Other social expenses | (3,178 | ) | (6,033 | ) | (9,913 | ) | |||||
Acquisition-related deferred price consideration | (950 | ) | (324 | ) | (85 | ) | |||||
Share based compensation | (19,600 | ) | (23,989 | ) | (43,259 | ) | |||||
Profit sharing | (733 | ) | (613 | ) | (1,326 | ) | |||||
Research tax credit (classified as a reduction of R&D expenses) | 5,063 | 3,386 | 4,941 | ||||||||
Total personnel expenses | $ | (189,418 | ) | $ | (246,171 | ) | $ | (332,353 | ) | ||
F-40
Note 19. Share-Based Compensation
Share Options Plans and Employee Warrants Grants (BSPCE)
The Board of Directors has been authorized by the general meeting of the shareholders to grant employee warrants (Bons de Souscription de Parts de Créateur d’Entreprise or “BSPCE”) and to implement share options plans as follows:
• | Issuance of 2,112,000 BSPCE, authorized at the General Meeting of Shareholders on October 24, 2008, making available up to 2,112,000 BSPCE until April 24, 2010 (“Plan 1”); |
• | Issuance of 1,472,800 BSPCE, authorized at the General Meeting of Shareholders on April 16, 2009, making available up to 1,472,800 BSPCE until October 16, 2010 (“Plan 2”); |
• | 1,584,000 Share Options, authorized at the General Meeting of Shareholders on September 9, 2009, making available up to 1,584,000 share options until November 8, 2012. This Plan has been amended at the General Meeting of Shareholders on November 16, 2010, making available up to 2,700,000 share options or BSPCE (“Plan 3”); |
• | Issuance of 361,118 BSPCE, granted to Criteo co-founders at the General Meeting of Shareholders on April 23, 2010 (“Plan 4”); |
• | 2,800,000 BSPCE or Share Options (Options de Souscription d'Actions or “OSA”), authorized at the General Meeting of Shareholders on November 18, 2011, making available up to 2,800,000 share options or BSPCE (“Plan 5”); |
• | 1,654,290 BSPCE or Share Options, authorized at the General Meeting of Shareholders on September 14, 2012, making available up to 1,654,290 share options or BSPCE (“Plan 6”). |
• | 6,627,237 BSPCE or Share Options, authorized at the General Meeting of Shareholders on August 2, 2013, making available up to 6,627,237 share options or BSPCE (“Plan 7”). |
• | 9,935,710 Share Options, authorized at the General Meeting of Shareholders on June 18, 2014, making available up to 9,935,710 share options (“Plan 8”). The Board of Directors has also authorized free shares/restricted stock units ("RSUs") to Criteo employees under presence condition and to certain senior managers, employees and members of the Management, subject to the achievement of internal performance objectives and presence condition. |
• | 4,600,000 Share Options or RSUs, authorized at the General Meeting of Shareholders on June 29, 2016 and 100,000 BSAs (any BSA granted will also be deducted from the 4,600,000 limit), such authorizations collectively referred to as “Plan 9”. The Board of Directors has authorized RSUs to Criteo employees subject to a presence condition and to certain senior managers, employees and members of management, subject to the achievement of internal performance objectives and a presence condition. |
Upon exercise of the BSPCE or OSA, or the vesting of an RSU we offer beneficiaries newly issued ordinary shares of the Parent.
The BSPCEs and OSAs may be exercised by the beneficiary on the basis of the following vesting schedule for the Plans 1, 2 and 3:
• | up to one third (1/3) of the BSPCE on the first anniversary of the date of grant; |
• | up to one twelfth (1/12) at the expiration of each quarter following the first anniversary of the date of grant, and this during twenty-four (24) months thereafter; and |
• | at the latest within ten (10) years from the date of grant. |
For the Plan 3 amended to Plan 9, the vesting schedule is as follows:
• | up to one fourth (1/4) of the BSPCE/share options on the first anniversary of the date of grant; |
• | up to one-sixteenth (1/16) at the expiration of each quarter following the first anniversary of the date of grant, and this during thirty-six (36) months thereafter; and |
• | at the latest within ten (10) years from the date of grant. |
F-41
The vesting schedule for the RSUs is as follows:
• | 50% at the expiration of a two year period |
• | 6.25% at the expiration of each quarter following the first two years-period during twenty four (24) months. |
When the Company was not listed, exercise prices were determined by reference to the latest capital increase as of the date of grant, unless the Board of Directors decided otherwise. Since our initial public offering, exercise prices are determined by reference to the closing share price the day before the date of the grant if higher than a floor value of 95% of the average of the closing share price for the last 20 trading days.
In the following tables, exercise prices, grant date share fair values and fair value per equity instruments are provided in euros, as the Company is incorporated in France and the euro is the currency used for the grants.
Details of BSPCE / OSA / RSU plans
Plans 1 & 2 | Plan 3 | Plan 4 | Plan 5 | Plan 6 | Plan 6 | Plan 7 | Plan 8 | Plan 9 | ||||||||||||||
Dates of grant (Boards of Directors) | Oct 24, 2008 - Sept 14, 2010 | Sept 9, 2009 - Sept 21, 2011 | April 23, 2010 | Nov 18, 2011 - May 22, 2012 | Oct 25, 2012 | Oct 25, 2012 - April 18, 2013 | Sept 3, 2013 - April 23, 2014 | July 30, 2014 - June 28, 2016 | July 28, 2016 - Nov 9, 2016 | |||||||||||||
Vesting period | 3 years | 3 - 4 years | None | 4 years | 1 year | 4-5 years | 4 years | 4 years | 4 years | 4 years | 4 years | |||||||||||
Contractual life | 10 years | 10 years | 10 years | 10 years | 10 years | 10 years | 10 years | 10 years | — | 10 years | — | |||||||||||
Expected option life | 8 years | 8 years | 8 years | 8 years | 8 years | 8 years | 6 - 8 years | 6 years | — | 6 years | — | |||||||||||
Number of instruments granted | 1,819,120 | 4,289,940 | 361,118 | 1,184,747 | 257,688 | 1,065,520 | 2,317,374 | 4,318,551 | 2,534,262 | 147,400 | 1,153,383 | |||||||||||
Type : Share Option (S.O.) / BSPCE / RSU | BSPCE | BSCPCE & OSA | BSPCE | BSCPCE & OSA | BSPCE | BSCPCE & OSA | BSCPCE & OSA | OSA | RSU | OSA | RSU | |||||||||||
Share entitlement per option | 1 | 1 | 1 | 1 | 1 | 1 | 1 | 1 | 1 | 1 | 1 | |||||||||||
Exercise price | € 0.45 - € 2.10 | € 0.20 - € 5.95 | € 2.10 | € 5.95 | € 8.28 | € 8.28 - € 10.43 | € 12.08 - € 38.81 | € 22.95 - € 47.47 | — | € 38.20 | — | |||||||||||
Valuation method | Black & Scholes | |||||||||||||||||||||
Grant date share fair value | € 0.20 - € 0.70 | € 0.20 - € 4.98 | € 2.10 | € 4.98 | € 6.43 | € 5.45 - € 6.43 | € 12.08 - € 38.81 | € 22.50 - € 47.47 | € 35.18 - € 35.58 | € 38.20 | € 33.98 - € 39.03 | |||||||||||
Expected volatility (1) | 53.0% - 55.7% | 55.2% - 57.8% | 55.2% | 52.1% - 52.9% | 50.2% | 49.6% - 50.2% | 44.2% - 50.1% | 39.4% - 44.5% | — | — | — | |||||||||||
Discount rate (2) | 2.74% - 4.10% | 2.62% - 3.76% | 3.4% | 2.79% - 3.53% | 2.2% | 1.80% - 2.27% | 1.20% - 2.40% | 0.00% - 0.71% | — | — | — | |||||||||||
Performance conditions | No | Yes (A) | No | No | Yes (B) | No | No | No | Yes (C) | No | Yes (D) | |||||||||||
Fair value per option / RSU | € 0.08 - € 0.45 | € 0.08 - € 2.88 | € 1.33 | € 2.75 - € 2.85 | € 3.28 | € 3.28 - € 5.83 | € 6.85 - € 16.90 | € 9.47 - € 17.97 | € 26.16 - € 37.10 | € 14.49 | € 33.98 - € 39.03 | |||||||||||
(1) | Based on similar listed entities. |
(2) | Based on Obligation Assimilables du Trésor, i.e. French government bonds with a ten-year maturity (“TEC 10 OAT floating-rate bonds”). |
(A) Options subject to performance condition: Among the 960,000 share options granted in April 7, 2011, 180,000 are subjected to performance conditions based on revenue excluding traffic acquisition costs targets that were met in 2012.
(B) On October 25, 2012, the Board of Directors of the Parent also granted a total of 257,688 BSPCE to our co-founders. The conditions of exercise of these BSPCE are linked to a future liquidity event or a transfer of control of the Company, and the number of BSPCE that can be exercised are determined by the event’s date which cannot occur after March 31, 2014. Based on the assumptions known as at December 31, 2012, we determined that the share-based compensation expense would be recognized over a one-year period. This assumption was confirmed in 2013.
(C) On October 29, 2015, the Board of Directors of the Parent also granted a total of 337,960 RSU to Criteo employees under condition of presence and to certain senior managers, employees and members of the management, subject to the achievement of internal performance objectives and condition of presence. Based on the assumptions known at December 31, 2015, we determined the share-based compensation expense by applying a probability ratio on performance objectives completion. This assumption was confirmed in 2016. On January 29, 2016, the Board of Directors of the Parent granted a total of 33,010 RSUs to members of the management, subject to the achievement of internal performance objectives and condition of presence. Based on the assumptions known at December 31, 2016, we determined the share-based compensation expense by applying a probability ratio on performance objectives completion.
(D) On July 28, 2016, the Board of Directors of the Parent granted a total of 195,250 RSUs to certain senior managers and members of the management, subject to the achievement of internal performance objectives and condition of presence. Based on the assumptions known at December 31, 2016, we determined the share-based compensation expense by applying a probability ratio on performance objectives completion.
F-42
Change in Number of BSPCE / OSA / RSU
Plans 1 & 2 | Plan 3 | Plan 4 | Plan 5 | Plan 6 | Plan 7 | Plan 8 | Plan 9 | RSUs | Total | |||||||||||||||||||||
Balance at January 1, 2014 | 1,134,737 | 2,333,763 | 361,118 | 1,929,299 | 1,204,248 | 1,555,144 | — | — | — | 8,518,309 | ||||||||||||||||||||
Granted | — | — | — | — | — | 749,330 | 2,267,774 | — | — | 3,017,104 | ||||||||||||||||||||
Exercised | (930,660 | ) | (1,315,733 | ) | (273,559 | ) | (337,352 | ) | (271,520 | ) | (47,019 | ) | — | — | — | (3,175,843 | ) | |||||||||||||
Forfeited | — | (82,439 | ) | — | (407,222 | ) | (42,928 | ) | (440,320 | ) | (30,820 | ) | — | — | (1,003,729 | ) | ||||||||||||||
Balance at December 31, 2014 | 204,077 | 935,591 | 87,559 | 1,184,725 | 889,800 | 1,817,135 | 2,236,954 | — | — | 7,355,841 | ||||||||||||||||||||
Granted | — | — | — | — | — | — | 1,621,734 | — | 1,103,405 | 2,725,139 | ||||||||||||||||||||
Exercised | (116,520 | ) | (449,069 | ) | (87,559 | ) | (343,021 | ) | (156,801 | ) | (310,827 | ) | (69,819 | ) | — | — | (1,533,616 | ) | ||||||||||||
Forfeited | — | (148,864 | ) | — | (22,357 | ) | (40,068 | ) | (218,730 | ) | (466,086 | ) | — | (7,820 | ) | (903,925 | ) | |||||||||||||
Balance at December 31, 2015 | 87,557 | 337,658 | — | 819,347 | 692,931 | 1,287,578 | 3,322,783 | — | 1,095,585 | 7,643,439 | ||||||||||||||||||||
Granted | — | — | — | — | — | — | 429,043 | 147,400 | 2,584,240 | 3,160,683 | ||||||||||||||||||||
Exercised | (33,403 | ) | (162,265 | ) | — | (310,236 | ) | (281,166 | ) | (383,127 | ) | (300,126 | ) | — | — | (1,470,323 | ) | |||||||||||||
Forfeited | — | 300 | — | 3,956 | (12,324 | ) | (153,923 | ) | (508,866 | ) | (23,025 | ) | (436,546 | ) | (1,130,428 | ) | ||||||||||||||
Balance at December 31, 2016 | 54,154 | 175,693 | — | 513,067 | 399,441 | 750,528 | 2,942,834 | 124,375 | 3,243,279 | 8,203,371 | ||||||||||||||||||||
F-43
Breakdown of the Closing Balance
Plans 1 & 2 | Plan 3 | Plan 4 | Plan 5 | Plan 6 | Plan 7 | Plan 8 | Plan 9 | RSUs | Total | |||||||||||||||||||||||||||||||
Balance at December 31, 2014 | ||||||||||||||||||||||||||||||||||||||||
Number outstanding | 204,077 | 935,591 | 87,559 | 1,184,725 | 889,800 | 1,817,135 | 2,236,954 | — | — | 7,355,841 | ||||||||||||||||||||||||||||||
Weighted-average exercise price | € | 1.08 | € | 2.08 | € | 2.10 | € | 5.95 | € | 9.81 | € | 18.29 | € | 23.40 | € | — | € | — | € | 14.10 | ||||||||||||||||||||
Number exercisable | 204,077 | 883,399 | 87,559 | 730,371 | 362,778 | 394,785 | — | — | — | 2,662,969 | ||||||||||||||||||||||||||||||
Weighted-average exercise price | € | 1.08 | € | 1.94 | € | 2.10 | € | 5.95 | € | 9.58 | € | 14.02 | € | — | € | — | € | — | € | 5.81 | ||||||||||||||||||||
Weighted-average remaining contractual life | 4.6 years | 5.8 years | 5.3 years | 7.3 years | 8.1 years | 8.9 years | 9.6 years | — | — | 8.2 years | ||||||||||||||||||||||||||||||
Balance at December 31, 2015 | ||||||||||||||||||||||||||||||||||||||||
Number outstanding | 87,557 | 337,658 | — | 819,347 | 692,931 | 1,287,578 | 3,322,783 | — | 1,095,585 | 7,643,439 | ||||||||||||||||||||||||||||||
Weighted-average exercise price | € | 1.41 | € | 3.14 | € | — | € | 5.95 | € | 9.75 | € | 17.97 | € | 30.50 | € | — | € | — | € | 20.97 | ||||||||||||||||||||
Number exercisable | 87,557 | 337,658 | — | 713,165 | 420,228 | 564,034 | 521,578 | — | — | 2,644,220 | ||||||||||||||||||||||||||||||
Weighted-average exercise price | € | 1.41 | € | 3.14 | € | — | € | 5.95 | € | 9.58 | € | 17.24 | € | 23.32 | € | — | € | — | € | 11.85 | ||||||||||||||||||||
Weighted-average remaining contractual life | 3.6 years | 4.8 years | — | 6.3 years | 7.1 years | 7.9 years | 8.9 years | — | — | 7.9 years | ||||||||||||||||||||||||||||||
Balance at December 31, 2016 | ||||||||||||||||||||||||||||||||||||||||
Number outstanding | 54,154 | 175,693 | — | 513,067 | 399,441 | 750,528 | 2,942,834 | 124,375 | 3,243,279 | 8,203,371 | ||||||||||||||||||||||||||||||
Weighted-average exercise price | € | 1.24 | € | 3.29 | € | — | € | 5.95 | € | 9.77 | € | 18.13 | € | 31.32 | € | 38.20 | € | — | € | 23.92 | ||||||||||||||||||||
Number exercisable | 54,154 | 175,693 | — | 513,067 | 325,596 | 504,262 | 1,135,634 | — | — | 2,708,406 | ||||||||||||||||||||||||||||||
Weighted-average exercise price | € | 1.24 | € | 3.29 | € | — | € | 5.95 | € | 9.66 | € | 17.94 | € | 28.96 | € | — | € | — | € | 17.73 | ||||||||||||||||||||
Weighted-average remaining contractual life | 2.9 years | 4.3 years | — | 5.2 years | 6.1 years | 6.8 years | 8.2 years | 9.6 years | — | 6.9 years | ||||||||||||||||||||||||||||||
F-44
Non-Employee Warrants (Bons de Souscription d’Actions or BSA)
In addition to the RSUs, share options and BSPCE grants, the shareholders of the Parent also authorized the grant of non-employee warrants or Bons de Souscription d’Actions (“BSA”), as indicated below:
• | Plan A : up to one-eight (1/8) at the expiration of each quarter following the date of grant, and this during twenty-four (24) months; and at the latest within ten (10) years as from the date of grant. |
• | Plan B : up to one third (1/3) of the non-employee warrants on the first anniversary of the date of grant; then up to one twelfth (1/12) at the expiration of each quarter following the first anniversary of the beginning of the vesting period, and this during twenty-four (24) months thereafter; and at the latest within ten (10) years as from the date of grant. |
• | Plan C : up to one-twenty fourth (1/24) at the expiration of each month following the date of grant, and this during twenty-four (24) months, and at the latest within ten (10) years as from the date of grant. |
• | Plan D (member of the advisory board) : up to one-twenty fourth (1/24) at the expiration of each month following the date of grant, and this during twenty-four (24) months; and at the latest within ten (10) years as from the date of grant. |
• | Plan D (not member of the advisory board) : one-third (1/3) at the date of grant; one third (1/3) at the first anniversary of the date of grant; one third (1/3) at the second anniversary of the date of grant; and at the latest within ten (10) years as from the date of grant. |
• | Plans E and F : up to one fourth (1/4) of the non-employee warrants on the first anniversary of the date of grant; up to one-sixteenth (1/16) at the expiration of each quarter following the first anniversary of the date of grant, and this during thirty-six (36) months thereafter; and at the latest within ten (10) years from the date of grant. |
Upon exercise of the non-employee warrants, we offer settlement of the warrants in newly issued ordinary shares of the Parent.
Details of Non-Employee Warrants
Plan A | Plan B | Plan C | Plan D | Plan E | Plan F | |||||||||||||
Dates of grant (Boards of Directors) | Nov 17, 2009 | March 11, 2010 | Nov 16, 2010 - Sept 21, 2011 | Oct 25, 2012 - March 6, 2013 | March 19, 2015 - Oct 29, 2015 | April 20, 2016 - Oct 27, 2016 | ||||||||||||
Vesting period | 2 years | 3 years | 2 years | 2 years | 1 - 4 years | 1 - 4 years | ||||||||||||
Contractual life | 10 years | 10 years | 10 years | 10 years | 10 years | 10 years | ||||||||||||
Number of warrants granted | 231,792 | 277,200 | 192,000 | 125,784 | 38,070 | 48,655 | ||||||||||||
Share entitlement per warrant | 1 | 1 | 1 | 1 | 1 | 1 | ||||||||||||
Share warrant price | €0.02 | €0.07 - €0.11 | €0.04 - €0.30 | €0.43 - €0.48 | €9.98 - €16.82 | €13.89 - €14.55 | ||||||||||||
Exercise price | €0.70 | €0.70 | €0.70 - €5.95 | €8.28 - €9.65 | €35.18 - €41.02 | €33.98 - €35.41 | ||||||||||||
Valuation method used | Black & Scholes | |||||||||||||||||
Grant date share fair value | €0.20 | €0.70 | €0.70 - €4.98 | €6.43 - €9.65 | €35.18 - €41.02 | €33.98 - €35.41 | ||||||||||||
Expected volatility (1) | 55.7 | % | 55.2 | % | 53.5% - 55.0% | 50.0% - 50.2% | 39.9 | % | 40.6 | % | ||||||||
Discount rate (2) | 3.58 | % | 3.44 | % | 2.62% - 3.38% | 2.13% - 2.27% | 0.% - 0.52% | 0.10% - 0.25% | ||||||||||
Performance conditions | No | Yes (A) | No | No | No | No | ||||||||||||
Fair value per warrant | €0.05 | €0.33 - €0.38 | €0.40 - €2.58 | €2.85 - €4.98 | €9.98 - €16.82 | €13.89 - €14.55 | ||||||||||||
(1) Based on similar listed entities.
(2) Based on Obligations Assimilables du Trésor, i.e. French government bonds with a ten-year maturity (“TEC 10 OAT floating-rate bonds”).
(A) All the performance conditions were achieved during the period ended December 31, 2010.
F-45
Changes in Number of Non-Employee Warrants
Balance at January 1, 2014 | 542,148 | ||
Granted | 5,040 | ||
Exercised | (345,780 | ) | |
Forfeited | (2,000 | ) | |
Balance at December 31, 2014 | 199,408 | ||
Granted | 38,070 | ||
Exercised | (34,568 | ) | |
Forfeited | (48,000 | ) | |
Balance at December 31, 2015 | 154,910 | ||
Granted | 48,655 | ||
Exercised | (37,000 | ) | |
Forfeited | 21,560 | ||
Balance at December 31, 2016 | 188,125 | ||
Breakdown of the Closing Balance
Non-employee warrants | ||||
Balance at December 31, 2014 | ||||
Number outstanding | 199,408 | |||
Weighted-average exercise price | € | 7.54 | ||
Number exercisable | 155,609 | |||
Weighted-average exercise price | € | 6.88 | ||
Weighted-average remaining contractual life | 7.5 years | |||
Balance at December 31, 2015 | ||||
Number outstanding | 154,910 | |||
Weighted-average exercise price | € | 15.72 | ||
Number exercisable | 117,783 | |||
Weighted-average exercise price | € | 8.49 | ||
Weighted-average remaining contractual life | 7.4 years | |||
Balance at December 31, 2016 | ||||
Number outstanding | 188,125 | |||
Weighted-average exercise price | € | 19.04 | ||
Number exercisable | 117,096 | |||
Weighted-average exercise price | € | 11.73 | ||
Weighted-average remaining contractual life | 7.3 years | |||
F-46
Reconciliation with the Consolidated Statements of Income
Balance for the year ended December 31, 2014 | Balance for the year ended December 31, 2015 | Balance for the year ended December 31, 2016 | ||||||||||||||||||||||||||||||||||||||||||||
(in thousands) | ||||||||||||||||||||||||||||||||||||||||||||||
R&D | S&O | G&A | Total | R&D | S&O | G&A | Total | R&D | S&O | G&A | Total | |||||||||||||||||||||||||||||||||||
RSUs | — | — | — | — | (706 | ) | (1,046 | ) | (544 | ) | (2,296 | ) | (9,178 | ) | (12,705 | ) | (7,287 | ) | (29,170 | ) | ||||||||||||||||||||||||||
Share options / BSPCE | (3,682 | ) | (12,290 | ) | (3,497 | ) | (19,469 | ) | (5,814 | ) | (10,632 | ) | (5,001 | ) | (21,447 | ) | (2,930 | ) | (4,133 | ) | (5,356 | ) | (12,419 | ) | ||||||||||||||||||||||
Plan 3 | 34 | 15 | (36 | ) | 13 | 1 | (6 | ) | — | (5 | ) | — | — | — | — | |||||||||||||||||||||||||||||||
Plan 5 | (215 | ) | (134 | ) | (257 | ) | (606 | ) | (71 | ) | 27 | (108 | ) | (152 | ) | (8 | ) | (27 | ) | (7 | ) | (42 | ) | |||||||||||||||||||||||
Plan 6 | (505 | ) | (1,358 | ) | (44 | ) | (1,907 | ) | (188 | ) | (384 | ) | (13 | ) | (585 | ) | (35 | ) | (20 | ) | (162 | ) | (217 | ) | ||||||||||||||||||||||
Plan 7 | (1,598 | ) | (8,494 | ) | (1,134 | ) | (11,226 | ) | (884 | ) | (1,758 | ) | (379 | ) | (3,021 | ) | (234 | ) | 239 | (194 | ) | (189 | ) | |||||||||||||||||||||||
Plan 8 | (1,398 | ) | (2,319 | ) | (2,026 | ) | (5,743 | ) | (4,672 | ) | (8,511 | ) | (4,501 | ) | (17,684 | ) | (2,587 | ) | (4,258 | ) | (4,638 | ) | (11,483 | ) | ||||||||||||||||||||||
Plan 9 | — | — | — | — | — | — | — | — | (66 | ) | (67 | ) | (355 | ) | (488 | ) | ||||||||||||||||||||||||||||||
Total share-based compensation | (3,682 | ) | (12,290 | ) | (3,497 | ) | (19,469 | ) | (6,520 | ) | (11,678 | ) | (5,545 | ) | (23,743 | ) | (12,108 | ) | (16,838 | ) | (12,643 | ) | (41,589 | ) | ||||||||||||||||||||||
BSAs | — | — | (131 | ) | (131 | ) | — | — | (246 | ) | (246 | ) | — | — | (1,670 | ) | (1,670 | ) | ||||||||||||||||||||||||||||
Total equity awards compensation expense | $ | (3,682 | ) | $ | (12,290 | ) | $ | (3,628 | ) | $ | (19,600 | ) | $ | (6,520 | ) | $ | (11,678 | ) | $ | (5,791 | ) | $ | (23,989 | ) | $ | (12,108 | ) | $ | (16,838 | ) | $ | (14,313 | ) | $ | (43,259 | ) | ||||||||||
F-47
Note 20. Financial Income and Expenses
The Consolidated Statements of Income line item “Financial income (expense)” can be broken down as follows:
Year Ended December 31, | |||||||||||
2014 | 2015 | 2016 | |||||||||
(in thousands) | |||||||||||
Financial income from cash equivalents | $ | 1,910 | $ | 2,105 | $ | 1,352 | |||||
Interest and fees | (583 | ) | (653 | ) | (2,367 | ) | |||||
Interest on debt | (583 | ) | (553 | ) | (1,134 | ) | |||||
Fees | — | (100 | ) | (1,233 | ) | ||||||
Foreign exchange (loss) gain | 10,096 | (5,971 | ) | 506 | |||||||
Other financial expense | (33 | ) | (22 | ) | (37 | ) | |||||
Total financial income (expense) | $ | 11,390 | $ | (4,541 | ) | $ | (546 | ) | |||
The $0.5 million financial expense for the period ended December 31, 2016 resulted from the interest incurred as a result of drawing on the revolving credit facility entered into in September 2015 to partially fund the acquisition of HookLogic in November 2016, the negative impact of foreign exchange reevaluations and related hedging mainly recorded during the first quarter, partially offset by the foreign exchange gain realized on the hedging of HookLogic Inc acquisition. At the end of December 2016, the main positions bearing a risk of foreign currency are centralized at the Parent company level and hedged using foreign currency swaps or forward purchases or sales of foreign currencies.
The $6.0 million foreign exchange loss for the period ended December 31, 2015 mainly results from the revaluation of the intra-group positions between Criteo S.A. and its Brazilian subsidiary, associated with a higher related cost of hedging, partially offset by a $2.1 million gain realized on the sale of the $70 million remaining from our initial public offering proceeds. At the end of December 2015, the main positions bearing a risk of foreign currency are centralized at the Parent company level and hedged using foreign currency swaps or forward purchases or sales of foreign currencies.
Note 21. Income Taxes
Breakdown of Income Taxes
The Consolidated Statements of Income line item “Provision for income taxes” can be broken down as follows:
Year Ended December 31, | ||||||||||||
2014 | 2015 | 2016 | ||||||||||
(in thousands) | ||||||||||||
Current income tax | $ | (22,893 | ) | $ | (25,265 | ) | $ | (43,153 | ) | |||
France | (11,087 | ) | (15,458 | ) | (20,204 | ) | ||||||
International | (11,806 | ) | (9,807 | ) | (22,949 | ) | ||||||
Net change in deferred taxes | 5,315 | 15,748 | 10,024 | |||||||||
France | 671 | 2,009 | 2,654 | |||||||||
International | 4,644 | 13,739 | 7,370 | |||||||||
Provision for income tax | $ | (17,578 | ) | $ | (9,517 | ) | $ | (33,129 | ) | |||
F-48
As mentioned in Note 1 (Principles and Accounting Methods), the French Research Tax Credit is not included in the line item “Provision for income taxes” but is deducted from “Research and development expenses” (see Note 18 - Allocation of Personnel Expenses). French business tax, CVAE, is included in the current tax balance for an amount of $2.5 million, $3.0 million and $4.1 million, for the years ended December 31, 2014, 2015 and 2016 respectively.
Reconciliation between the Effective and Nominal Tax Expense
The following table shows the reconciliation between the effective and nominal tax expense at the nominal standard French rate of 34.43% (excluding additional contributions):
Year Ended December 31, | ||||||||||||
2014 | 2015 | 2016 | ||||||||||
(in thousands) | ||||||||||||
Income before taxes | $ | 64,474 | $ | 71,793 | $ | 120,458 | ||||||
Theoretical group tax-rates | 34.43 | % | 34.43 | % | 34.43 | % | ||||||
Nominal tax expense | (22,198 | ) | (24,718 | ) | (41,474 | ) | ||||||
Increase / decrease in tax expense arising from: | ||||||||||||
Research tax credit | 1,743 | 1,352 | 1,701 | |||||||||
Net effect of shared based compensation (1) | 3,419 | 2,048 | (8,957 | ) | ||||||||
Other permanent differences | (2,245 | ) | (804 | ) | (3,518 | ) | ||||||
Non recognition of deferred tax assets related to tax losses and temporary differences (2) | (3,546 | ) | (7,662 | ) | (7,738 | ) | ||||||
Utilization or recognition of previously unrecognized tax losses (3) | 276 | 12,264 | 13,366 | |||||||||
French CVAE included in income taxes | (2,467 | ) | (3,052 | ) | (3,165 | ) | ||||||
Special tax deductions (4) | 8,984 | 12,545 | 20,022 | |||||||||
Effect of different tax rates | (1,019 | ) | (1,046 | ) | (1,108 | ) | ||||||
Other differences | (525 | ) | (444 | ) | (2,258 | ) | ||||||
Effective tax expense | $ | (17,578 | ) | $ | (9,517 | ) | $ | (33,129 | ) | |||
Effective tax rate | 27.3 | % | 13.3 | % | 27.5 | % | ||||||
Increases and decreases in tax expense are presented applying the theoretical Group tax rate to the concerned tax bases. The impact resulting from the differences between local tax rates and the Group theoretical rate is shown in the “effect of different tax rates.”
(1) | While in most countries share-based compensation does not give rise to any tax effect either when granted or when exercised, the United States and the United Kingdom generally permit tax deductions in respect of share-based compensation. The tax deduction generated in the United States and United Kingdom is in connection with the significant number of options exercised during the period was offset by the share-based compensation accounting expense exclusion. |
(2) | Deferred tax assets on which a valuation allowance has been recognized mainly relate to Criteo Ltd, Criteo do Brasil, Criteo Singapore Pte. Ltd and Criteo Advertising (Beijing) Co. Ltd tax losses. |
(3) | The 2014 balance relates exclusively to Criteo Pty. The 2015 and 2016 balances mainly relate to the recognition of Criteo Corp. tax losses considering the projected taxable income within the next 3 years and the Section IRC 382 annual limitation. |
(4) | Special tax deductions refer to the application of a reduced income tax rate on the majority of the technology royalties income invoiced by the Parent to its subsidiaries. |
F-49
Deferred Tax Assets and Liabilities
The following table shows the changes in the major sources of deferred tax assets and liabilities:
(in thousands) | Year ended December 31, 2014 | Change recognized in profit or loss | Change recognized in OCI | Change in consolidation scope | Other | Currency translation adjustments | Year ended December 31, 2015 | |||||||||||||||||||||
Deferred tax assets: | ||||||||||||||||||||||||||||
Net operating loss carryforwards | $ | 23,468 | $ | (385 | ) | $ | — | $ | 5,889 | $ | — | $ | (549 | ) | $ | 28,423 | ||||||||||||
Personnel-related accruals | 2,538 | 5,414 | — | 9 | — | (659 | ) | 7,302 | ||||||||||||||||||||
Other accruals | 2,285 | 1,353 | — | — | — | (545 | ) | 3,093 | ||||||||||||||||||||
Projected benefit obligation | 472 | 202 | (44 | ) | — | — | (52 | ) | 578 | |||||||||||||||||||
Other | 1,458 | 4,372 | — | 1,091 | — | (79 | ) | 6,842 | ||||||||||||||||||||
Deferred tax assets (gross) | 30,221 | 10,956 | (44 | ) | 6,989 | — | (1,884 | ) | 46,238 | |||||||||||||||||||
Valuation allowance | (19,863 | ) | 1,429 | 21 | (7,177 | ) | — | 1,610 | (23,980 | ) | ||||||||||||||||||
Deferred tax asset (net) | 10,358 | 12,385 | (23 | ) | (188 | ) | — | (274 | ) | 22,258 | ||||||||||||||||||
Deferred tax liabilities: | ||||||||||||||||||||||||||||
Intangible assets | (2,861 | ) | 5,445 | — | (2,979 | ) | — | 245 | (150 | ) | ||||||||||||||||||
Other | (4 | ) | (2,082 | ) | — | 47 | — | (12 | ) | (2,051 | ) | |||||||||||||||||
Deferred tax liabilities | (2,865 | ) | 3,363 | — | (2,932 | ) | — | 233 | (2,201 | ) | ||||||||||||||||||
Net deferred income tax balance | $ | 7,493 | $ | 15,748 | $ | (23 | ) | $ | (3,120 | ) | $ | — | $ | (41 | ) | $ | 20,057 | |||||||||||
F-50
(in thousands) | Year ended December 31, 2015 | Change recognized in profit or loss | Change recognized in OCI | Change in consolidation scope | Other | Currency translation adjustments | Year ended December 31, 2016 | |||||||||||||||||||||
Deferred tax assets: | ||||||||||||||||||||||||||||
Net operating loss carryforwards | $ | 28,423 | $ | (1,048 | ) | $ | — | $ | — | $ | — | $ | (912 | ) | $ | 26,463 | ||||||||||||
Personnel-related accruals | 7,302 | 257 | — | (30 | ) | 241 | 7,770 | |||||||||||||||||||||
Other accruals | 3,093 | 975 | — | 30 | 276 | 4,374 | ||||||||||||||||||||||
Projected benefit obligation | 578 | 213 | 466 | — | — | (50 | ) | 1,207 | ||||||||||||||||||||
Other | 6,842 | 7,331 | — | — | (482 | ) | (265 | ) | 13,426 | |||||||||||||||||||
Deferred tax assets (gross) | 46,238 | 7,728 | 466 | — | (482 | ) | (710 | ) | 53,240 | |||||||||||||||||||
Valuation allowance | (23,980 | ) | 3,630 | (16 | ) | — | — | 545 | (19,821 | ) | ||||||||||||||||||
Deferred tax asset (net) | 22,258 | 11,358 | 450 | — | (482 | ) | (165 | ) | 33,419 | |||||||||||||||||||
Deferred tax liabilities: | ||||||||||||||||||||||||||||
Intangible assets | (150 | ) | (6 | ) | (477 | ) | — | (33 | ) | 35 | (631 | ) | ||||||||||||||||
Other | (2,051 | ) | (1,328 | ) | — | — | 515 | 20 | (2,844 | ) | ||||||||||||||||||
Total deferred tax liabilities | (2,201 | ) | (1,334 | ) | (477 | ) | — | 482 | 55 | (3,475 | ) | |||||||||||||||||
Net deferred income tax balance | $ | 20,057 | $ | 10,024 | $ | (27 | ) | $ | — | $ | — | $ | (110 | ) | $ | 29,944 | ||||||||||||
Amounts recognized in our Consolidated Financial Statements are calculated at the level of each subsidiary within our Consolidated Financial Statements. As at December 31, 2014, 2015 and 2016, the valuation allowance against net deferred income taxes amounted to $26.1 million, $24.0 million and $19.9 million, which related mainly to Criteo Corp. ($13.9 million, $12.4 million and $0.9 million, respectively), Criteo do Brasil ($2.6 million, $3.9 million and $3.6 million, respectively), Criteo Ltd ($7.7 million, $4.7 million and $4.7 million, respectively), Criteo China ($0.7 million, $1.4 million and $3.7 million, respectively) and Criteo France ($0.7 million, $0.6 million and $3.0 million, respectively).
The main changes that occurred in 2016 relate to the recognition of deferred tax assets for Criteo Corp. tax losses and temporary differences in connection with the 3-year tax plan ($8.5 million).
In accordance with ASC 740 - Income taxes, no uncertain tax positions were identified as of December 31, 2016.
The Company has various net operating loss carryforwards in the U.S. and China for $14.9 million and $3.6 million, respectively, which begin to expire in 2030 and 2019, respectively. The Company has net operating loss carryforwards in the United Kingdom of $4.8 million which have no expiration date.
Current tax assets
The total amount corresponds to prepayments of income taxes by Criteo do Brasil Ltda.
F-51
Note 22. Earnings Per Share
Basic Earnings Per Share
We calculate basic earnings per share by dividing the net income for the period attributable to shareholders of the Parent by the weighted average number of shares outstanding.
Year Ended December 31, | |||||||||||
2014 | 2015 | 2016 | |||||||||
(in thousands, except share data) | |||||||||||
Net income attributable to shareholders of Criteo S.A. | $ | 45,556 | $ | 59,553 | $ | 82,272 | |||||
Weighted average number of shares outstanding | 58,928,563 | 61,835,499 | 63,337,792 | ||||||||
Basic earnings per share | $ | 0.77 | $ | 0.96 | $ | 1.30 | |||||
Diluted Earnings Per Share
We calculate diluted earnings per share by dividing the net income attributable to shareholders of the Parent by the weighted average number of shares outstanding plus any potentially dilutive shares not yet issued from share-based compensation plans (see note 19). There were no other potentially dilutive instruments outstanding as of December 31, 2014, 2015 and 2016. Consequently all potential dilutive effects from shares are considered.
For each period presented, a contract to issue a certain number of shares (i.e. share option, share warrant, restricted share award or BSPCE contracts) is assessed as potentially dilutive, if it is “in the money” (i.e., the exercise or settlement price is inferior to the average market price).
Year Ended December 31, | |||||||||||
2014 | 2015 | 2016 | |||||||||
(in thousands, except share data) | |||||||||||
Net income attributable to shareholders of Criteo S.A. | $ | 45,556 | $ | 59,553 | $ | 82,272 | |||||
Weighted average number of shares outstanding of Criteo S.A. | 58,928,563 | 61,835,499 | 63,337,792 | ||||||||
Dilutive effect of : | |||||||||||
Restricted share awards | — | — | 253,728 | ||||||||
Share options and BSPCE | 4,347,236 | 3,133,549 | 1,958,728 | ||||||||
Share warrants | 217,461 | 127,438 | 83,222 | ||||||||
Weighted average number of shares outstanding used to determine diluted earnings per share | 63,493,260 | 65,096,486 | 65,633,470 | ||||||||
Diluted earnings per share | $ | 0.72 | $ | 0.91 | $ | 1.25 | |||||
F-52
The weighted average number of securities that were anti-dilutive for diluted EPS for the periods presented but which could potentially dilute EPS in the future are as follows:
Year Ended December 31, | |||||||||
2014 | 2015 | 2016 | |||||||
Restricted share awards | — | 273,896 | 396,086 | ||||||
Share options and BSPCE | 1,288,977 | 968,734 | 509,442 | ||||||
Share warrants | — | 15,925 | — | ||||||
Weighted average number of anti-dilutive securities excluded from diluted earnings per share | 1,288,977 | 1,258,555 | 905,528 | ||||||
Note 23. Commitments and contingencies
Operating Lease Arrangements
Future payment obligations under non-cancellable operating leases as of December 31, 2016 are listed below:
Less than 1 year | 1 to 5 years | 5 years + | Total | ||||||||||||
(in thousands) | |||||||||||||||
Minimum payments for property leases | $ | 33,655 | $ | 98,938 | $ | 49,551 | $ | 182,144 | |||||||
Minimum payments for hosting services | 50,959 | 48,927 | — | 99,886 | |||||||||||
Minimum payments for other leases | $ | 4,197 | $ | 4,912 | $ | — | $ | 9,109 | |||||||
Operating Lease Expenses
Operating lease expenses relating to our offices totaled $32.1 million, $23.6 million and $18.8 million for the years ended December 31, 2016, 2015, and 2014, respectively.
Operating lease expenses relating to hosting services totaled $42.0 million, $30.4 million, and $24.8 million for the years ended December 31, 2016, 2015, and 2014, respectively.
Revolving Credit Facilities, Credit Lines Facilities and Bank Overdrafts
As mentioned in Note 14, we are party to three RCFs including one with BPI France, for which we can draw up to €1.0 million ($1.1 million), one with HSBC for which we can draw up to RMB 40.0 million ($5.8 million), and one with a syndicate of banks which allow us to draw up to €250.0 million ($263.5 million). As of December 31, 2016, €0.1 million ($0.1 million), RMB 30.0 million ($4.3 million), and $75.0 million had been drawn, respectively.
All of these credit facilities are unsecured and contain customary events of default but do not contain any affirmative, financial or negative covenants, with the exception of the €250.0 million ($263.5 million) RCF which contains covenants, including compliance with a total net debt to adjusted EBITDA ratio and restrictions on incurring additional indebtedness. At December 31, 2016, we were in compliance with the required leverage ratio.
We are also party to short-term credit lines and overdraft facilities with HSBC plc, and LCL. We are authorized to draw up to a maximum of €9.4 million ($9.9 million) in the aggregate under the short-term credit lines and overdraft facilities. As of December 31, 2016, we had not drawn on any of these facilities. Any loans or overdraft under these short-term facilities bear interest based on the one month EURIBOR rate or three month EURIBOR rate. As these facilities are exclusively short-term credit and overdraft facilities, our banks have the ability to terminate such facilities on short notice.
F-53
Contingencies
From time to time we may become involved in legal proceedings or be subject to claims arising in the ordinary course of our business. We are not presently a party to any legal proceedings that, if determined adversely to us, would individually or taken together have a material adverse effect on our business, results of operations, financial condition or cash flows. Regardless of the outcome, litigation can have an adverse impact on us because of defense and settlement costs, diversion of management resources and other factors.
Note 24. Related Parties
During its meeting on December 17, 2015, the Board of Directors decided to separate the functions of Chairman of the Board and Chief Executive Officer. Effective January 1, 2016, Jean-Baptiste Rudelle became Executive Chairman and Eric Eichmann was appointed Chief Executive Officer. In the exercise of his responsibilities, Mr. Eichmann was assisted by Benoit Fouilland, Chief Financial Officer, and Romain Niccoli, Chief Product Officer.
On October 26, 2016, Romain Niccoli resigned as Chief Product Officer, with effect from December 31, 2016.
The Executive Officers as of December 31, 2016 were:
• | Jean-Baptiste Rudelle—Executive Chairman |
• | Romain Niccoli—Chief Product Officer |
• | Benoit Fouilland—Chief Financial Officer |
• | Eric Eichmann—Chief Executive Officer |
Total compensation for the Executive Officers, including social contributions, is summarized in the following table:
Year Ended December 31, | |||||||||||
2014 | 2015 | 2016 | |||||||||
(in thousands) | |||||||||||
Short-term benefits (1) | $ | (4,145 | ) | $ | (3,067 | ) | $ | (2,755 | ) | ||
Long-term benefits (2) | (241 | ) | (245 | ) | (194 | ) | |||||
Shared-based compensation | (3,291 | ) | (4,594 | ) | (7,159 | ) | |||||
Total | $ | (7,677 | ) | $ | (7,906 | ) | $ | (10,108 | ) | ||
(1) wages, bonuses and other compensations
(2) pension defined benefit plan
For the year ended December 31, 2016, 2015 and 2014, there were no material related party transactions.
F-54
Note 25. Breakdown of Revenue and Non-Current Assets by Geographical Areas
The Company operates in the following three geographical markets:
• | Americas: North and South America; |
• | EMEA: Europe, Middle-East and Africa; and |
• | Asia-Pacific. |
The following tables disclose our consolidated revenue for each geographical area for each of the reported periods. Revenue by geographical area is based on the location of advertisers’ campaigns.
Americas | EMEA | Asia-Pacific | Total | ||||||||||||
(in thousands) | |||||||||||||||
December 31, 2014 | $ | 303,436 | $ | 485,986 | $ | 198,827 | $ | 988,249 | |||||||
December 31, 2015 | 505,653 | 541,105 | 276,411 | 1,323,169 | |||||||||||
December 31, 2016 | $ | 730,873 | $ | 660,523 | $ | 407,750 | $ | 1,799,146 | |||||||
Revenue generated in France amounted to $115.4 million, $116.8 million and $132.2 million for the periods ended December 31, 2014, 2015 and 2016, respectively.
Revenue generated in other significant countries where we operate is presented in the following table:
Year Ended December 31, | |||||||||||
2014 | 2015 | 2016 | |||||||||
(in thousands) | |||||||||||
Americas | |||||||||||
United States | $ | 237,385 | $ | 419,742 | $ | 630,047 | |||||
EMEA | |||||||||||
Germany | 105,544 | 111,792 | 137,116 | ||||||||
United Kingdom | 90,315 | 107,071 | 115,053 | ||||||||
Asia-Pacific | |||||||||||
Japan | $ | 154,798 | $ | 190,066 | $ | 285,959 | |||||
F-55
Other Information
For each reported period, non-current assets (corresponding to the net book value of tangible and intangible assets) are presented in the table below. The geographical information results from the locations of legal entities.
Of which | Of which | ||||||||||||||||||||||||||
Holding | Americas | United States | EMEA | Asia-Pacific | Japan | Total | |||||||||||||||||||||
(in thousands) | |||||||||||||||||||||||||||
December 31, 2015 | $ | 48,160 | $ | 24,437 | $ | 23,332 | $ | 8,847 | $ | 17,508 | $ | 7,807 | $ | 98,952 | |||||||||||||
December 31, 2016 | $ | 55,052 | $ | 43,308 | $ | 42,474 | $ | 7,132 | $ | 26,033 | $ | 8,965 | $ | 131,525 | |||||||||||||
Note 26. Subsequent Events
The Company evaluated subsequent events that occurred after December 31, 2016 through the date of issuance of the Consolidated Financial Statements and determined that there are no significant events that require adjustments or disclosure in such Consolidated Financial Statements.
F-56