Attached files
| file | filename |
|---|---|
| EX-95 - EXHIBIT 95 - COMPASS MINERALS INTERNATIONAL INC | cmp-20161231x10kxex95.htm |
| EX-32 - EXHIBIT 32 - COMPASS MINERALS INTERNATIONAL INC | cmp-20161231x10kxex32.htm |
| EX-31.2 - EXHIBIT 31.2 - COMPASS MINERALS INTERNATIONAL INC | cmp-20161231x10kxex312.htm |
| EX-31.1 - EXHIBIT 31.1 - COMPASS MINERALS INTERNATIONAL INC | cmp-20161231x10kxex311.htm |
| EX-24.1 - EXHIBIT 24.1 - COMPASS MINERALS INTERNATIONAL INC | cmp-20161231x10kxex241.htm |
| EX-23.1 - EXHIBIT 23.1 - COMPASS MINERALS INTERNATIONAL INC | cmp-20161231x10kxex231.htm |
| EX-21.1 - EXHIBIT 21.1 - COMPASS MINERALS INTERNATIONAL INC | cmp-20161231x10kxex211.htm |
| EX-12.1 - EXHIBIT 12.1 - COMPASS MINERALS INTERNATIONAL INC | cmp-20161231x10kxex121.htm |
| EX-10.48 - EXHIBIT 10.48 - COMPASS MINERALS INTERNATIONAL INC | cmp-20161231x10kxex1048.htm |
| EX-10.45 - EXHIBIT 10.45 - COMPASS MINERALS INTERNATIONAL INC | cmp-20161231x10kxex1045.htm |
| EX-10.44 - EXHIBIT 10.44 - COMPASS MINERALS INTERNATIONAL INC | cmp-20161231x10kxex1044.htm |
COMPASS MINERALS INTERNATIONAL, INC. | 2016 FORM 10-K | |
United States
Securities and Exchange Commission
Washington, D.C. 20549
FORM 10-K
(MARK ONE)
x ANNUAL REPORT PURSUANT TO SECTION 13 OR 15(d) OF THE SECURITIES EXCHANGE ACT OF 1934
For the fiscal year ended December 31, 2016
OR
☐TRANSITION REPORT PURSUANT TO SECTION 13 OR 15(d) OF THE SECURITIES EXCHANGE ACT OF 1934
For the transition period from _______ to _______
Commission File Number 001-31921
Compass Minerals International, Inc.
(Exact name of registrant as specified in its charter)
Delaware | 36-3972986 | |
(State or other jurisdiction of incorporation or organization) | (I.R.S. Employer Identification No.) | |
9900 West 109th Street, Suite 100 | 66210 | |
Overland Park, Kansas | (Zip Code) | |
(Address of principal executive offices) | ||
Registrant’s telephone number, including area code:
(913) 344-9200
Securities registered pursuant to Section 12(b) of the Act:
Title of each class | Name of each exchange on which registered | |
Common stock, par value $0.01 per share | New York Stock Exchange | |
Securities registered pursuant to Section 12(g) of the Act: None
Indicate by check mark if the registrant is a well-known seasoned issuer, as defined in Rule 405 of the Securities Act.
Yes þ No ☐
Indicate by check mark if the registrant is not required to file reports pursuant to Section 13 or Section 15(d) of the Act.
Yes ☐ No þ
Indicate by check mark whether the registrant (1) has filed all reports required to be filed by Section 13 or 15(d) of the Securities Exchange Act of 1934 during the preceding 12 months (or for such shorter period that the registrant was required to file such reports), and (2) has been subject to such filing requirements for the past 90 days.
Yes þ No ☐
Indicate by check mark whether the registrant has submitted electronically and posted on its corporate Website, if any, every Interactive Data File required to be submitted and posted pursuant to Rule 405 of Regulation S-T during the preceding 12 months (or for such shorter period that the registrant was required to submit and post such files).
Yes þ No ☐
Indicate by check mark if disclosure of delinquent filers pursuant to Item 405 of Regulation S-K is not contained herein, and will not be contained, to the best of registrant’s knowledge, in definitive proxy or information statements incorporated by reference in Part III of this Form 10-K or any amendment to this Form 10-K. þ
Indicate by check mark whether the registrant is a large accelerated filer, an accelerated filer, a non-accelerated filer, or a smaller reporting company. See definitions of “large accelerated filer,” “accelerated filer” and “smaller reporting company” in Rule 12b-2 of the Exchange Act.
Large accelerated filer þ | Accelerated filer ☐ | |||
Non-accelerated filer ☐ | Smaller reporting company ☐ | |||
Indicate by check mark whether the registrant is a shell company (as defined in Rule 12b-2 of the Exchange Act). Yes ☐ No þ
As of June 30, 2016, the aggregate market value of the registrant’s common stock held by non-affiliates of the registrant was $2,506,545,942, based on the closing sale price of $74.19 per share, as reported on the New York Stock Exchange.
The number of shares outstanding of the registrant’s $0.01 par value common stock at February 24, 2017 was 33,796,278 shares.
DOCUMENTS INCORPORATED BY REFERENCE
Document | Parts into which Incorporated | |
Portions of the Proxy Statement for the Annual Meeting of Stockholders to be held May 3, 2017 | Part III, Items 10, 11, 12, 13 and 14 | |
COMPASS MINERALS INTERNATIONAL, INC. | 2016 FORM 10-K | |
TABLE OF CONTENTS
PART I | Page No. | ||
4 | |||
19 | |||
29 | |||
29 | |||
29 | |||
29 | |||
PART II | |||
31 | |||
33 | |||
34 | |||
48 | |||
50 | |||
87 | |||
87 | |||
88 | |||
PART III | |||
88 | |||
89 | |||
89 | |||
89 | |||
89 | |||
PART IV | |||
90 | |||
SIGNATURES | 94 | ||
1 | ||
COMPASS MINERALS INTERNATIONAL, INC. | 2016 FORM 10-K | |
PART I
CAUTIONARY NOTE REGARDING FORWARD-LOOKING STATEMENTS
Certain statements in this annual report on Form 10-K (this “report”), including without limitation our or management’s beliefs, expectations or opinions; statements regarding future events or future financial performance; our plans and objectives; our outlook; existing or potential capital expenditures; understanding of the industry and our competition; projected sources of cash flow; potential legal liability; and proposed legislation and regulatory action, are forward-looking statements within the meaning of the Private Securities Litigation Reform Act of 1995. Forward-looking statements are those that predict or describe future events or trends and that do not relate solely to historical matters. We use words such as “may,” “would,” “could,” “should,” “will,” “likely,” “expect,” “anticipate,” “believe,” “intend,” “plan,” “forecast,” “outlook,” “project,” “estimate” and similar expressions suggesting future outcomes or events to identify forward-looking statements or forward-looking information. These statements are based on our current expectations and involve risks and uncertainties that could cause our actual results to differ materially. In evaluating these statements, you should carefully consider various risks, uncertainties and factors including, but not limited to, those listed under Item 1A., “Risk Factors” and elsewhere in this report. Forward-looking statements are only predictions and are subject to certain risks and uncertainties that may cause our actual results to differ materially from the forward-looking statements expressed or implied in this report as a result of factors, risks, and uncertainties, over many of which we do not have control.
Although we believe that the expectations reflected in the forward-looking statements are reasonable as of the date of this report, we cannot guarantee future results, levels of activity, performance or achievements. We do not undertake, and hereby disclaim, any obligation or duty, unless otherwise required to do so by applicable securities laws, to update any forward-looking statement after the date of this report regardless of any new information, future events or other factors. The inclusion of any statement in this report does not constitute our admission that the events or circumstances described in such statement are material to us.
Factors that could cause actual results, levels of activity, performance, or achievements to differ materially from those expressed or implied by the forward-looking statements include, but are not limited to, the following:
• | risks related to our mining and industrial operations; |
• | geological conditions; |
• | dependency on a limited number of key production and distribution facilities and critical equipment; |
• | the inability to fund necessary capital expenditures or successfully complete capital projects; |
• | supply constraints or price increases for energy and raw materials used in our production processes; |
• | weather conditions; |
• | climate change; |
• | our indebtedness and ability to pay our indebtedness; |
• | restrictions in our debt agreements that may limit our ability to operate our business or require accelerated debt payments; |
• | tax liabilities; |
• | financial assurance requirements imposed on us; |
• | the inability of our customers to access credit or a default by our customers of trade credit extended by us or financing we have guaranteed; |
• | restrictions on or ability to pay dividends; |
• | the impact of competition on the sales of our products; |
• | risks associated with our international operations and sales; |
• | the impact of anticipated changes in plant nutrition prices and customer application rates; |
2 | ||
COMPASS MINERALS INTERNATIONAL, INC. | 2016 FORM 10-K | |
• | the seasonal demand for our products; |
• | conditions in the agricultural sector and supply and demand imbalances for competing plant nutrition products; |
• | increasing costs or a lack of availability of transportation services; |
• | strikes, other forms of work stoppage or slowdown or other union activities; |
• | the loss of key personnel; |
• | our rights and governmental authorizations to mine and operate our properties; |
• | our ability to expand our business through acquisitions, integrate acquired businesses and realize anticipated benefits from acquisitions; |
• | compliance with foreign and U.S. laws and regulations applicable to our international operations; |
• | compliance with environmental, health and safety laws and regulations; |
• | environmental liabilities; |
• | the ability to access our computer systems and information technology or the inability to protect confidential data; |
• | misappropriation or infringement claims relating to intellectual property; |
• | changes in industry standards and regulatory requirements; |
• | product liability claims and product recalls; |
• | inability to obtain required product registrations or increased regulatory requirements; |
• | domestic and international general business and economic conditions; and |
• | other risk factors included in this report or reported from time to time in our filings with the Securities and Exchange Commission (the “SEC”). See “Where You Can Find More Information.” |
MARKET AND INDUSTRY DATA AND FORECASTS
This report includes market share and industry data and forecasts that we obtained from publicly available information and industry publications, surveys, market research, internal company surveys and consultant surveys. Industry publications and surveys, consultant surveys and forecasts generally state that the information contained therein has been obtained from sources believed to be reliable, but there can be no assurance as to the accuracy and completeness of such information. We have not independently verified any of the data from third-party sources nor have we ascertained the underlying economic assumptions relied upon therein. Similarly, internal company surveys, industry forecasts and market research, which we believe to be reliable based upon management’s knowledge of the industry, have not been verified by any independent sources. Except where otherwise noted, references to North America include only the continental United States (“U.S.”) and Canada, references to the United Kingdom (“U.K.”) include only England, Scotland and Wales, and statements as to our position relative to our competitors or as to market share refer to the most recent available data. Statements concerning (a) North American consumer and industrial salt and highway deicing salt are generally based on historical sales volumes, (b) U.K. highway deicing salt sales are generally based on historical production capacity, and (c) sulfate of potash are generally based on historical sales volumes. Except where otherwise noted, all references to tons refer to “short tons” and all amounts are in U.S. dollars. One short ton equals 2,000 pounds.
WHERE YOU CAN FIND MORE INFORMATION
We file annual, quarterly and current reports and other information with the SEC. Our SEC filings are available to the public over the Internet at the SEC’s website at www.sec.gov. Alternatively, copies of these documents are also available free of charge on our website, www.compassminerals.com. The information on these websites is not part of this report and is not incorporated by reference into this report. Further, our references to website URLs are intended to be inactive textual references only.
3 | ||
COMPASS MINERALS INTERNATIONAL, INC. | 2016 FORM 10-K | |
You may also request a copy of any of our filings, at no cost, by writing or telephoning:
Investor Relations
Compass Minerals International, Inc.
9900 West 109th Street, Suite 100
Overland Park, Kansas 66210
For general inquiries concerning us, please call (913) 344-9200.
Unless the context requires otherwise, references in this annual report to the “Company,” “Compass Minerals,” “CMP,” “we,” “us” and “our” refer to Compass Minerals International, Inc. (“CMI,” the parent holding company) and its consolidated subsidiaries collectively.
ITEM 1. | BUSINESS |
COMPANY OVERVIEW
Compass Minerals is a leading provider of essential minerals that solve nature’s challenges, including salt for winter roadway safety and other consumer, industrial and agricultural uses; specialty plant nutrition minerals that improve the quality and yield of crops; and specialty chemicals for water treatment and other industrial processes. As of December 31, 2016, we operated 22 production and packaging facilities, including:
• | The largest rock salt mine in the world in Goderich, Ontario, Canada; |
• | The largest dedicated rock salt mine in the U.K. in Winsford, Cheshire; |
• | A solar evaporation facility located in Ogden, Utah, which is both the largest sulfate of potash specialty fertilizer (“SOP”) production site and the largest solar salt production site in the Western Hemisphere; and |
• | Several facilities producing essential agricultural nutrients and specialty chemicals in Brazil. |
Our salt business provides highway deicing salt to customers in North America and the U.K. as well as consumer deicing and water conditioning products, ingredients used in consumer and commercial food preparation and other salt-based products for consumer, agricultural and industrial applications in North America. In the U.K., we operate a records management business utilizing excavated areas of our Winsford salt mine with one other location in London, England.
Our plant nutrition business produces and markets specialty plant nutrition products to distributors and retailers of crop inputs, as well as growers worldwide. Our principal plant nutrition product in North America is SOP which we market under the trade name Protassium+. We also sell various premium micronutrient products under our Wolf Trax brand.
We sell our salt and plant nutrition products primarily in the United States, Canada, Brazil and the United Kingdom. See Note 15 to our Consolidated Financial Statements for financial information relating to our operations by geographic areas.
In October 2016, we significantly expanded our plant nutrition business with the acquisition of Produquímica Indústria e Comércio S.A. (“Produquímica”), which now constitutes our Plant Nutrition South America segment. This segment operates two primary businesses in Brazil - agricultural productivity, which manufactures and distributes a broad offering of specialty plant nutrition solution-based products, and chemical solutions, which manufactures and markets specialty chemicals, primarily for the water treatment industry and for use in other industrial processes. See Note 3 to our Consolidated Financial Statements for further discussion of this acquisition.
SALT SEGMENT
Overview
Salt is indispensable and enormously versatile with thousands of reported uses. In addition, there are no known cost-effective alternatives for most high-volume uses. We are among the lowest-cost salt producers in our markets due to our high-grade quality salt deposits, which are among the most extensive in the world, and we leverage this advantage through the use of effective mining techniques and efficient production processes. Further, many of our salt assets are in locations that are logistically favorable to our core markets. Our strategy for this business is to focus on driving profitability from every ton we produce through both cost efficiency and commercial execution.
Through our Salt segment, we produce and market sodium chloride and magnesium chloride in North America and sodium chloride in the U.K. Our Salt products include rock salt, mechanically evaporated salt, solar evaporated salt, brine magnesium chloride and flake magnesium chloride. While we also purchase potassium chloride (“KCl”) and calcium chloride to sell as finished products or to blend with salt (sodium chloride) to produce specialty products, sodium chloride represents the vast majority of the products we produce and sell. In 2016, the salt segment accounted for approximately 71% of our gross sales (see Note 15 to our Consolidated Financial Statements for segment financial information).
4 | ||
COMPASS MINERALS INTERNATIONAL, INC. | 2016 FORM 10-K | |
Our Salt products are used in a wide variety of applications, including as a deicer for highway, consumer and professional use, as an ingredient in chemical production, for water treatment, human and animal nutrition and for a variety of other consumer and industrial uses.
The demand for salt has historically remained relatively stable during periods of rising prices and through a variety of economic cycles due to its relatively low cost and a diverse number of end uses. As a result, our cash flows from our Salt segment are not materially impacted by economic cycles. However, demand for deicing salt products is primarily affected by the number and intensity of snow events and temperatures in our service territories.
Salt Industry Overview
We estimate that the consumption of highway deicing rock salt in North America, including rock salt used in chemical manufacturing processes, is approximately 36 million tons per year based on average winter weather conditions, while the consumer and industrial market is approximately 9 million tons per year. In the U.K., we estimate that the consumption of highway deicing salt is approximately 2 million tons per year based on average winter weather conditions. According to the latest available data from the U.S. Geological Survey (“USGS”), during the 30-year period ending in 2014, the production of salt used in highway deicing and for consumer and industrial products in the U.S. has increased at a historical average rate of approximately 1% per year, although there have been recent fluctuations above and below this average driven by winter weather variability.
Salt prices vary according to purity, end use and variations in refining and packaging processes. According to the latest USGS data, during the 30-year period ending in 2014, prices for salt used in highway deicing and consumer and industrial products in the U.S. have increased at a historical average rate of approximately 3% per year, although there have been recent fluctuations above and below this average. Due to salt’s relatively low production cost, transportation and handling costs tend to be a significant component of the total delivered cost, which makes logistics management and customer service key competitive factors in the industry. The high relative cost associated with transportation tends to favor producers located nearest to customers.
Processing Methods
As of December 31, 2016, salt mining, other production activities and packaging are conducted at 12 of our facilities. The three processing methods we use to produce salt are described below.
Underground Rock Salt Mining - We produce most of the salt we sell through underground mining. In North America, we use a combination of drill and blast and continuous mining techniques. At our Winsford, U.K., facility, we primarily use continuous mining techniques. We introduced continuous mining at our Goderich mine in 2012 and are in the process of shifting all of our production at that mine to this technology. Mining machinery moves salt from the salt face to conveyor belts, which transport the salt to the mill center where it is crushed and screened. It is then hoisted to the surface where the processed salt is loaded onto shipping vessels, railcars or trucks. The primary power sources for each of our rock salt mines are electricity and diesel fuel. Rock salt is sold in our highway deicing product line and for numerous applications in our consumer and industrial product lines.
Mechanical Evaporation - Mechanical evaporation involves obtaining salt brine from underground salt deposits through brine wells and subjecting that salt-saturated brine to vacuum pressure and heat to precipitate and crystallize salt. The primary power sources used for this process are natural gas and electricity. The resulting product is high purity and has a uniform physical shape. Mechanically evaporated salt is primarily sold through our consumer and industrial salt product lines.
Solar Evaporation - Solar evaporation is used in areas of the world where high-salinity brine is available and weather conditions provide for a high natural evaporation rate. Salt brine is pumped into a series of large open ponds where sun and wind evaporate the water and crystallize the salt, which is then mechanically harvested and processed through washing, drying and screening. We produce solar salt at the Great Salt Lake in Ogden, Utah, and sell it through both our consumer and industrial and our highway deicing product lines.
We also produce magnesium chloride using solar evaporation. After sodium chloride and potassium-rich salts evaporate from brine, a concentrated magnesium chloride brine solution remains which becomes the raw material we use to produce several magnesium chloride products. We sell these products in our Salt segment through our consumer and industrial and highway deicing product lines, as well as in our Plant Nutrition North America segment.
Operations and Facilities
Canada - We produce finished Salt products at four locations in Canada. Rock salt mined at our Goderich, Ontario, mine serves the highway deicing markets and the consumer and industrial markets in Canada and the Great Lakes region of the U.S., principally through a series of depots located around the Great Lakes and through packaging facilities. Mechanically evaporated salt used for our consumer and industrial product lines is produced at three facilities strategically located throughout Canada: Amherst, Nova Scotia, in Eastern Canada; Goderich, Ontario, in Central Canada; and Unity, Saskatchewan, in Western Canada.
United States - We produce finished Salt products at three locations in the United States. Our Cote Blanche, Louisiana, rock salt mine serves highway deicing customers through a series of depots located along the Mississippi and Ohio rivers (and their
5 | ||
COMPASS MINERALS INTERNATIONAL, INC. | 2016 FORM 10-K | |
major tributaries) and chemical and agricultural customers in the Southern and Midwestern U.S. Our solar evaporation facility located in Ogden, Utah, principally serves the Midwestern and Western U.S. consumer and industrial markets, provides salt for highway deicing and chemical applications and produces magnesium chloride, which is used in deicing, dust control and unpaved road surface stabilization applications. The production capacity for solar-evaporated salt at our Ogden, Utah, facility is currently only limited by demand. Mechanically evaporated salt for our U.S. consumer and industrial customers is produced at our Lyons, Kansas, plant. We also operate four salt packaging facilities in Illinois, Minnesota, New York and Wisconsin.
United Kingdom - Our Winsford rock salt mine in Northwest, England, near Manchester, serves the U.K. highway deicing market, primarily in England and Wales.
Our current production capacity is approximately 15.6 million tons of salt per year. The following table shows the annual production capacity and type of salt produced at each of our owned or leased production locations as of December 31, 2016:
Location | Annual Production Capacity(a) (tons) | Product Type |
North America | ||
Goderich, Ontario, Mine(b) | 8,000,000 | Rock Salt |
Cote Blanche, Louisiana, Mine | 3,000,000 | Rock Salt |
Ogden, Utah: | ||
Salt(c) | 1,500,000 | Solar Salt |
Magnesium Chloride(d) | 750,000 | Magnesium Chloride |
Lyons, Kansas, Plant | 450,000 | Evaporated Salt |
Unity, Saskatchewan, Plant | 160,000 | Evaporated Salt |
Goderich, Ontario, Plant | 130,000 | Evaporated Salt |
Amherst, Nova Scotia, Plant | 130,000 | Evaporated Salt |
United Kingdom | ||
Winsford, Cheshire, Mine | 1,500,000 | Rock Salt |
(a) Annual production capacity is our estimate of the tons that can be produced assuming a normal amount of scheduled down time and operation of our facilities under normal working conditions, including staffing levels.
(b) We continue to invest in the mine to achieve production capacity of approximately nine million tons annually.
(c) Solar salts deposited annually substantially exceed the amount converted into finished products. The amount presented here represents an approximate average amount produced based on recent market demand.
(d) The magnesium chloride amount includes both brine and flake.
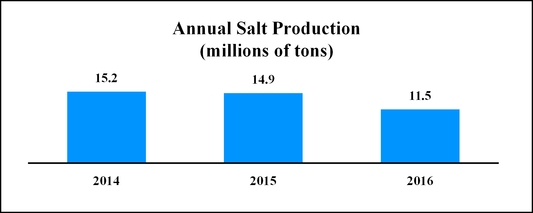
Actual salt production volume levels vary from the annual production capacity shown in the table above and vary from year to year due to a number of factors, including variations in the winter season weather, which impacts the demand during the winter for highway and consumer deicing products, the quality of the reserves and the nature of the geologic formation that we are mining at a particular time, unplanned downtime due to accidents and mechanical failures and other operating conditions. The chart below shows total annual Salt production volumes, including magnesium chloride, at our owned or leased production locations:
Our production facilities have access to vast mineral deposits. At all of our production locations, we estimate the recoverable salt reserves to last at least several more decades at current production rates and capacities. Our rights to extract those minerals
6 | ||
COMPASS MINERALS INTERNATIONAL, INC. | 2016 FORM 10-K | |
may be contractually limited by either geographic boundaries or time. We believe that we will be able to continue to extend these agreements, as we have in the past, at commercially reasonable terms without incurring substantial costs or material modifications to the existing lease terms and conditions, thereby allowing us to extract the additional salt necessary to fully develop our existing mineral rights.
Our underground mines in Canada (Goderich, Ontario), the U.S. (Cote Blanche, Louisiana) and the U.K. (Winsford, Cheshire) make up 84% of our Salt production capacity as of December 31, 2016. Each of these mines is operated with modern mining equipment and utilizes subsurface improvements such as vertical shaft lift systems, milling and crushing facilities, maintenance and repair shops and extensive raw materials handling systems.
We own the mine site at Goderich, Ontario, and maintain a mineral lease for mineral reserves with the provincial government, which grants us the right to mine salt. This mineral lease expires in 2022, and we have an option to renew the lease until 2043 after demonstrating to the lessor that the mine’s useful life is greater than the term of the lease. The Cote Blanche mine is operated under land and mineral leases with third-party landowners who grant us the right to mine salt. The mine site and salt reserves at the Winsford mine are owned. We regularly perform mineral reserve studies at our mines to confirm the remaining mineral reserves. The table below reflects current information about our mines:
Mine | Years in operation | Remaining reserve* | Remaining mine life |
Goderich | 57 years | 562.2 million tons | 86 years |
Cote Blanche | 51 years | 312.4 million tons | 104 years |
Winsford | 171 years | 31.5 million tons | 31 years |
*Assumes current average rates of production. In January 2017, we received a third-party reserve study for the Goderich mine, which reduced the amount of remaining reserves compared to prior estimates due to a determination that certain reserves no longer qualified as probable reserves and revised assumptions regarding our extraction rates and process loss factors.
Our mineral interests are amortized on an individual mine basis over estimated useful lives not to exceed 99 years using primarily the units-of-production method. Our mineral reserve estimates of the remaining tons are derived from periodic reserve studies completed by third-party geological engineering firms. Our mineral reserve estimates and the third-party reserve studies are based on many factors, including the area and volume covered by our mining rights, assumptions regarding our extraction rates based upon an expectation of operating the mines on a long-term basis and the quality of in-place reserves. Established criteria for proven and probable reserves are primarily applicable to mining deposits of discontinuous metal, where both the presence of ore and its variable grade need to be precisely identified. However, the massive continuous nature of evaporative deposits, such as salt, requires proportionately less data for the same degree of confidence in mineral reserves, both in terms of quantity and quality. Reserve studies performed by third-party engineering firms suggest that most of our mineral reserves are characterized as probable mineral reserves, with smaller quantities as proven mineral reserves. We have classified our mineral reserves as probable reserves.
In 2012 we acquired mining rights to approximately 100 million tons of salt reserves in the Chilean Atacama Desert. This reserve estimate is based upon an initial report. We will need to complete a feasibility study before we proceed with the development of this project to ensure our salt reserves are probable. The development of this project will require significant infrastructure to establish extraction and logistics capabilities.
We package our Salt products at four additional Company-owned and operated facilities. We estimate that our annual combined packaging capacity at these four facilities is 485,000 tons. Our packaging capacity is based on our estimate of the tons than can be packaged at these facilities assuming a normal amount of scheduled down-time and operation of our facilities under normal working conditions, including staffing levels. We believe that we have the capability to approximately double our annual packaging capacity by increasing our staffing levels in response to demand.
We also purchase salt and other minerals under contracts with third-parties to supplement our production when needed. As of December 31, 2016, we also have a contract to purchase salt from one supplier in North America, which has a minimum purchasing commitment.
Products and Sales
We sell our Salt products through our highway deicing product line (which includes brine magnesium chloride as well as rock salt treated with this mineral) and our consumer and industrial product line (which includes salt as well as products containing magnesium chloride and calcium chloride in both pure form and blended with salt).
Highway deicing, including salt sold to chemical customers, constituted 43% of our gross sales in 2016. Our principal customers are states, provinces, counties, municipalities and road maintenance contractors that purchase bulk deicing salt, both treated and untreated, for ice control on public roadways. Highway deicing salt in North America is sold primarily through an annual tendered bid contract process with governmental entities, as well as through longer-term contracts, with price, product quality and delivery capabilities as the primary competitive market factors. Some sales also occur through negotiated sales contracts with third-party customers, particularly in the U.K. Since transportation costs are a relatively large portion of the cost to deliver products to customers, the locations of the salt sources and distribution networks also play a significant role in the ability of suppliers to cost-effectively serve customers. We have an extensive network of approximately 90 depots for storage and distribution of highway
7 | ||
COMPASS MINERALS INTERNATIONAL, INC. | 2016 FORM 10-K | |
deicing salt in North America. The majority of these depots are located on the Great Lakes and the Mississippi River and Ohio River systems (and their major tributaries). Deicing salt product from our Ogden, Utah, facility supplies customers in the Western and upper Midwest regions of the U.S. Treated rock salt, which is typically rock salt treated with brine magnesium chloride and organic materials that enhance the salt’s performance, is sold throughout our markets.
We believe our production capability at our Winsford, Cheshire, U.K. mine and favorable logistics position enhance our ability to meet the U.K.’s winter demands. Due to our strong position, we are viewed as a key supplier by the U.K.’s Highways Agency. In the U.K., approximately 75% of our highway deicing customers have multi-year contracts.
Winter weather variability is the most significant factor affecting Salt sales for deicing applications, because mild winters reduce the need for salt used in ice and snow control. On average, over the last three years, approximately two-thirds of our deicing product sales occurred during the North American and European winter months of November through March each year. The vast majority of our North American deicing sales are made in Canada and the Midwestern U.S. where inclement weather during the winter months causes dangerous road conditions. In keeping with industry practice, we stockpile salt to meet estimated requirements for the next winter season. See “Management’s Discussion and Analysis of Financial Condition and Results of Operations—Seasonality” for more information on the seasonality of our Salt segment results.
Our principal chemical customers are producers of intermediate chemical products used in the production of vinyls and other chemicals, pulp and paper, as well as water treatment and a variety of other industrial uses. We typically have multi-year supply agreements with our chemical customers. Price, service, product quality and security of supply are the major competitive market factors.
Sales of our consumer and industrial products accounted for 28% of our 2016 gross sales. We are the third largest producer of consumer and industrial salt products in North America. This product line includes commercial and consumer applications, such as water conditioning, consumer and professional ice control, food processing, agricultural applications, table salt and a variety of industrial applications. We believe that we are among the largest private-label producers of water conditioning and table salt products in Canada. Our Sifto brand encompasses a full line of salt products, which are well recognized in Canada.
Our consumer and industrial sales are driven by broad product lines, strong customer relationships and products using both private-label and Company brands. Our consumer and industrial product line is distributed through many channels including retail, agricultural, industrial, janitorial and sanitation, and resellers. The consumer and industrial product line is channeled from our plants and third-party warehouses to our customers using a combination of direct sales personnel, contract personnel and a network of brokers or manufacturers’ representatives.
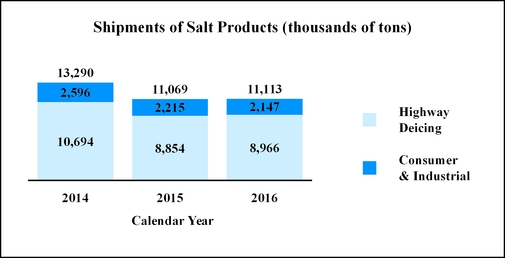
The chart below shows our shipments of Salt products:
Competition
We face strong competition in each of the markets in which we operate. In North America, other large, nationally and internationally recognized companies compete with our Salt products. In addition, there are also several smaller regional producers of salt. There are several importers of salt into North America, which mostly impact the East Coast and West Coast of the U.S. where we have minimal market presence. Two competitors serve the highway deicing salt market in the U.K., one in Northern England and one in Northern Ireland. There are typically not significant imports of highway deicing salt into the U.K.
Salt is a commodity, which limits the potential for product differentiation and increases competition. Additionally, low barriers to entry in the consumer and industrial segment of the industry increase competition. Our advantageous geographical locations, superior assets and distribution network strengthen our competitive position.
8 | ||
COMPASS MINERALS INTERNATIONAL, INC. | 2016 FORM 10-K | |
PLANT NUTRITION
Overview
Fertilizers are critical for efficient crop production using the limited arable land resources available around the world. The nutrients needed to ensure plant health can be divided into three categories:
• | macro nutrients - the traditional NPK fertilizers (nitrogen (N), phosphorus (P) and potassium (K)), |
• | secondary nutrients - calcium, magnesium and sulfur, and |
• | micronutrients - trace elements of iron, manganese, copper, boron, zinc, molybdenum, chlorine and nickel. |
In addition, a wide range of nutritional and functional enhancers, biostimulants and adjuvants are critical for a plant’s metabolic processes and overall stress and disease resistance. The application and necessity of essential nutritional supplements is based on Liebig’s Law of the Minimum, which is the principle that only by increasing the amount of the scarcest nutrient can the growth of a plant or crop be enhanced, despite the plentiful presence of other nutrients.
Our plant nutrition business focuses on higher value plant nutrients including SOP, specialty formulations of macro fertilizers and a wide range of high-value specialty products incorporating secondary nutrients, micronutrients and nutritional and functional enhancers. Our products contribute to improved overall plant-metabolism, nutrient uptake and fixing, stress resistance, plant defense mechanisms, energy conversion, cell division, root enhancement and leaf, flower and fruit formation, among other benefits. The yield-enhancing properties of these supplements have been shown to provide significant farm productivity gains. Our plant nutrition strategy is based upon maximizing the profitability of our current product portfolio, innovating new technology-driven products and robust commercialization of these technologies globally.
Factors influencing the plant nutrition market include world grain and food supply, currency fluctuations, grower incomes, changes in consumer diets, general levels of economic activity, government food programs, governmental agriculture and energy policies in the U.S. and around the world, and the amount or type of crop grown in certain locations, or the type or amount of fertilizer product used. In addition, our plant nutrition results can be impacted by seasonality (see “Management’s Discussion and Analysis of Financial Condition and Results of Operations—Seasonality” for more information).
Historically, our plant nutrition business primarily consisted of the production and sale of SOP, a specialty form of potassium which also provides plant-ready sulfur. There are two major forms of potassium-based fertilizer, SOP and muriate of potash (“MOP”). Many high-value or chloride-sensitive crops experience improved yields and quality when SOP rather than MOP is used. SOP is also a more cost-effective alternative to other forms of specialty potash. We are the leading SOP producer and marketer in North America and also market SOP products internationally depending on market conditions. In 2014, we branded our SOP products under the name Protassium+. Our plant in Ogden, Utah, is the largest in North America and one of only four large-scale solar brine evaporation operations for SOP in the world. Our SOP plant in Wynyard, Saskatchewan, is Canada’s only SOP producer.
In April 2014, we acquired Wolf Trax, Inc., a privately held Canadian corporation, which develops and distributes micronutrient products under the Wolf Trax brand. The innovative products we develop under the Wolf Trax brand are based upon proprietary and patented technologies. The acquisition has provided us an opportunity to enter both new product and geographic markets and build a stronger retail presence in North America.
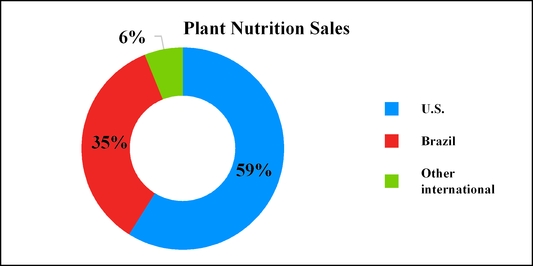
In October 2016, we completed the acquisition of Produquímica, which expanded our ability to serve growers in Brazil and significantly expanded the number of our specialty plant nutrition products. See Note 3 to our Consolidated Financial Statements for further discussion of this acquisition. As a result of this acquisition, we have added a new reporting segment, Plant Nutrition South America, which is the acquired Produquímica business, and renamed our former Plant Nutrition segment as Plant Nutrition North America. During the fourth quarter of 2016, 76% of sales generated by Plant Nutrition South America were derived from the manufacturing and marketing of a wide range of specialty crop nutrients and supplements to enhance agriculture productivity. We believe we are one of the market leaders in Brazil and offer a more comprehensive range of products and brands compared to our competitors. Plant Nutrition South America also operates a chemical solutions business which accounted for the remaining 24% of segment sales during the fourth quarter of 2016. We believe we are one of the largest manufacturers of water treatment chemicals in Brazil. We have a strong presence in the Northeast and Southeast of Brazil, which allows us to take advantage of efficient logistics due to proximity to raw materials and customers.
9 | ||
COMPASS MINERALS INTERNATIONAL, INC. | 2016 FORM 10-K | |
In 2016, our plant nutrition business, on a combined basis, accounted for 28% of our gross sales (see Note15 to our Consolidated Financial Statements for segment financial information).
PLANT NUTRITION NORTH AMERICA (FORMERLY PLANT NUTRITION) SEGMENT
Industry Overview
Our Plant Nutrition North America segment includes sales of SOP and micronutrients. The average annual worldwide consumption of all potash fertilizers is approximately 77 million tons, with MOP accounting for approximately 85% of all potash consumed in fertilizer production, based upon 2015 industry data. SOP represents approximately 10% of all potash consumption. The remainder is supplied in forms containing varying concentrations of potassium (expressed as potassium oxide) along with different combinations of co-nutrients. SOP (which contains the equivalent of approximately 50% potassium oxide) maintains a price premium over MOP.
Historically, our domestic sales of Protassium+ have been concentrated in the Western and Southeastern U.S. where the crops and soil conditions favor the use of low-chloride potassium nutrients, such as SOP. Consequently, weather patterns and field conditions in these locations can impact Plant Nutrition North America sales volumes.
While long-term global consumption of potash has increased in response to growing populations and the need for additional food supplies, the market has faced challenges over the last three years due to a downturn in the broader commodities market which has pressured grower incomes. We expect the long-term demand for potassium nutrients to continue to grow as arable land per capita decreases, thereby encouraging improved crop yields. Additionally, as the broader agricultural market rebounds, increases in grower incomes are expected to also improve the near-term demand for our products.
While used in small amounts, micronutrients play important roles in plant development, and nutrient deficient soils must be replenished to obtain higher crop yields. Growth rates in North America for this specialty plant nutrient market have slowed recently in response to the drop in commodity prices. We expect our future growth to stem from the innovation and commercialization of our products, which provide more technology-driven solutions that growers demand in this market.
Approximately 92% of our Plant Nutrition North America sales volumes in 2016 were made to U.S. customers, who include retail fertilizer dealers and distributors of agricultural products as well as professional turf care customers. In some cases, these dealers and distributors combine or blend our Plant Nutrition North America products with other fertilizers and minerals to produce fertilizer blends tailored to individual requirements.
Operations and Facilities
We produce Protassium+ at two facilities, both located in North America, namely at our Ogden, Utah, facility, on the Great Salt Lake, and our Wynyard, Saskatchewan, Canada facility on Big Quill Lake. Our Ogden facility is the largest SOP production site in North America. The facility operates approximately 55,000 acres of solar evaporation ponds to produce SOP and salt, including magnesium chloride, from the Great Salt Lake’s naturally occurring brine. The facility is located on land that is both owned and leased under renewable leases from the State of Utah. We believe that our property and operating equipment are maintained in good working condition. This facility has the capability to produce up to 320,000 tons of solar pond-based SOP, approximately 750,000 tons of magnesium chloride and 1.5 million tons of salt annually when weather conditions are typical.
These recoverable minerals exist in vast quantities in the Great Salt Lake. We believe the recoverable minerals exceed 100 years of reserves at current production rates and capacities and the lake quantities are so vast that they will not be significantly impacted by our production. While our rights to extract these minerals are contractually limited, we believe we will be able to
10 | ||
COMPASS MINERALS INTERNATIONAL, INC. | 2016 FORM 10-K | |
extend our lease agreements, as we have in the past, at commercially reasonable terms, without incurring substantial costs or incurring material modifications to the existing lease terms and conditions.
Initially, we draw mineral-rich lake water, or brine, from the Great Salt Lake into our solar evaporation ponds. The brine moves through a series of solar evaporation ponds over a two- to three-year production cycle. As the water evaporates and the mineral concentration increases, some of those minerals naturally precipitate out of the brine and are deposited on the pond floors. These deposits provide the salts necessary to process into SOP, salt and magnesium chloride. The evaporation process is dependent upon sufficient lake brine levels and hot, arid summer weather conditions. The potassium-bearing salts are mechanically harvested out of the solar evaporation ponds and refined to high-purity SOP in our production facility.
We also have a unique ability to use KCl and other potassium-rich minerals as a raw material feedstock to supplement our solar harvest to help meet demand when it is economically feasible. Given our current production capability, we can produce approximately 400,000 tons of SOP annually when using both solar-pond based feedstock and KCl at our Ogden facility. In the last three years, we have purchased and consumed KCl and raw material feedstock to supplement production.
We have invested to increase the efficiency and expand the capacity of Ogden facility through upgrades to our processing plant and our solar evaporation ponds. These investments have included modifications to our existing solar evaporation ponds to increase the annual solar harvest and the extraction yield from the harvest and processing capacity of our SOP plant. We are nearing completion of a project to further expand our SOP production capacity by augmenting our ability to convert KCl into SOP. Once complete, we expect our annual SOP production capacity to be approximately 550,000 tons, including amounts produced with supplemental KCl feedstock.
We also own our Wynyard, Saskatchewan, facility, which contributes 40,000 tons to our annual SOP capacity. At this facility, we combine sulfate-rich brine with sourced potassium chloride to create SOP through ion exchange and glaserite processes. This product is high purity and is used in addition to crop nutrient applications as well as specialty, non-agricultural applications.
We hold numerous environmental and mineral extraction permits, water rights and other permits, licenses and approvals from governmental authorities authorizing operations at each of our facilities.
Products and Sales
Our SOP is sold in various grades under our Protassium+ brand. Our agricultural product line consists of different grades sized for use in broadcast spreaders, direct application and liquid fertilizer solutions. Our turf product line consists of grades sized for use by the turf and ornamental markets and for blends used on golf greens. We also provide an organic product line with grades sized for a wide range of applications.
Our Wolf Trax micronutrient products are essential to a wide range of crops, including commodity row crops, as different plants and soil conditions require different micronutrients. Both Protassium+ and Wolf Trax product lines are generally sold to crop input distributors and dealers who then sell our product to farmers and growers. Our commercial efforts focus on educating and selling the agronomic benefits of SOP as a source of potassium nutrients and various micronutrients to plant health.
Competition
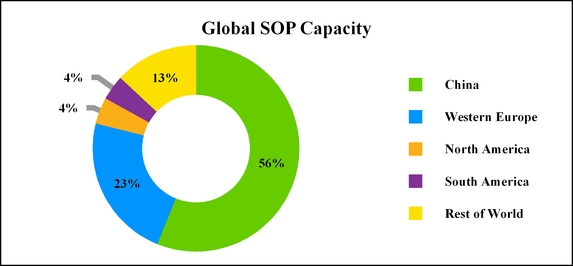
SOP is a global market with approximately 56% of the world’s 11 million tons of capacity located in China.
Our major competition for SOP sales in North America includes imports from Germany, Chile and Belgium. Fluctuations in the values of foreign currencies in relation to the U.S. dollar impact the level of international competition we face. As the only SOP producer with production facilities in North America and as a result of our logistically favorable production site in Ogden, Utah, we estimate that our share of the North American market is sizable. In addition to imported SOP, there is functional competition between SOP and other forms of potassium crop nutrients, such as MOP. The micronutrient market is highly
11 | ||
COMPASS MINERALS INTERNATIONAL, INC. | 2016 FORM 10-K | |
fragmented. Commodity and specialty crops require micronutrients in varying degrees depending on the crop and soil conditions. While sales of Wolf Trax products have historically been concentrated in North America, we also sell our micronutrient products globally, primarily in Europe, Central America, South America and the Caribbean.
PLANT NUTRITION SOUTH AMERICA SEGMENT
Industry Overview
Plant Nutrition South America manufactures, distributes and markets a wide array of specialty plant nutrients and supplements developed and formulated from essential primary and secondary nutrients, micronutrients and biostimulants. These products consist of different chemical molecules, chemical compositions and production processes from conventional NPK fertilizers, and this specific category of plant nutrients offers a diversity of delivery mechanisms, low environmental impact, low dosages per acre, a high degree of innovation and product development and also requires more product marketing than conventional NPK fertilizers, among other differences. Brazilian soils are naturally deficient in nutrients such as zinc, manganese and boron, among others. In parallel, the increased adoption of technologically advanced seeds (both conventional and genetically modified) has driven farmers around the globe to address the higher nutritional demands of such crops and to apply essential nutritional supplements to unlock the yield potential embedded in these seeds. We estimate that Brazilian farmers, on average, only use approximately 25% of the optimal prescription of essential nutritional supplements.
In addition to agriculture products, this segment produces water and wastewater treatment chemicals in Brazil for cleaning, decontaminating and purifying water as well as process chemicals for industrial use. This business benefits from the rapidly expanding focus on, and increased investment in, improving standards for drinking water purification and wastewater treatment. Our water treatment customers include state and municipal entities, wastewater treatment companies and manufacturing companies that treat their own wastewater. Our chemical solutions business also benefits from growth in Brazilian industrial sectors that use our products, including the oil and gas exploration, mining, pulp and paper production and ethanol production industries. Our involvement in both businesses allows us to benefit from greater purchasing power with suppliers, given that approximately 75% of the mineral inputs for both businesses are identical.
Our strategy for Plant Nutrition South America is to leverage the product portfolio and expand sales opportunities in North America where possible. We expect to continue to drive market growth by increasing the adoption rate and acre penetration of nutritional supplements. Our plan is to reinforce the use of these supplements as a profitable tool to enhance crop productivity. We use a three-pronged approach to deliver under our strategy, consisting of (1) our specialized agronomic research teams, (2) our technical in-the-field agronomic sales force, and (3) continuous innovation.
We expect to increase sales through new product introductions and growth in direct distribution channels. We continually invest in the development of new products and new generations of existing products that meet the specific needs of our customers. As a result of these efforts, our direct-to-end-customer sales to large farmers have increased as a proportion of total agriculture productivity revenues. Additionally, our Plant Nutrition South America segment provides geographic diversification for our combined plant nutrition business.
Operations and Facilities
We operate nine production facilities throughout Brazil, including a property we jointly operate with a third-party. Our production facilities are located in the Southeast and Northeast parts of Brazil. Our Plant Nutrition South America production facility network has a significant level of integration. While some production facilities are focused on producing chemical and physical transformation of ingredients, such as Jacareí I production facility with sulfur derivatives, others are specialized in transforming these ingredients into final products for our customers by mixing them with other ingredients produced in different or the same production facilities. We also use by-products from one production facility as a raw material for another production facility, where possible.
The table below shows our Plant Nutrition South America production facility utilization by product line:
Production Facility | |||||||||
Suzano I | Suzano II | Igarassu | Mauá | Uberlândia | Fermavi(a) | Reluz Nordeste | Jacareí I | Jacareí II | |
Agriculture Productivity | X | X | X | X | X | X | X | ||
Chemical Solutions | X | X | X | X | |||||
(a) We hold a 50% ownership interest through a joint venture with Fermavi Eletroquímica Ltda.
Our products are produced through a series of chemical and physical transformations in automated reactors, granulators, grinders and mixers. Our equipment is capable of processing both primary and secondary sources of raw materials, thus enabling us to rapidly remodel our production process to deal with variations in element concentration in raw material feeds. This also allows us flexibility with regard to raw material purchasing opportunities, allowing us to purchase products that are less expensive on a percentage-contained-metal-basis.
12 | ||
COMPASS MINERALS INTERNATIONAL, INC. | 2016 FORM 10-K | |
Products and Sales
As of December 31, 2016, our total Plant Nutrition South America portfolio consisted of more than 1,100 products, including approximately 900 in agriculture productivity and more than 200 in chemical solutions. The agriculture productivity products may be applied for different stages of a plant’s life cycle, different soil and other growing conditions, different crop types and using different delivery mechanisms. We also provide value-added services to our customers, such as soil analysis programs, technical trainings and conferences, crop field test and research, pre- and post-sales support and specialized technical support, which allow us to tailor our Plant Nutrition South America products and sales to a wide variety of customers, diverse types of crops and multiple regions. Through our chemical solutions business, we manufacture, market and supply water treatment and chemicals for industrial processes. Our water treatment products have many different uses including algae control, alkalinity control, disinfection control, odor and corrosion control, water filtration and water clarification.
Competition
Agricultural Productivity - The Brazilian market for nutritional supplements is highly fragmented with hundreds of market participants. Competitors typically focus their product offerings on specific product categories and delivery mechanisms, geographic regions and selected crops. As a result, we have different competitors for different market situations. The international competitive landscape is also fragmented. We estimate there are approximately 15 international competitors present in Brazil, mainly from Europe.
Market consolidation is likely to continue in the future, as players are challenged to keep up with demands for product innovation, increasingly specialized agronomic and technical skills, the effect of specific legislation, licensing and product registration procedures, cost pressures from economies of scale and other industry trends. Many competitors have limited production capabilities and can better be characterized as resellers, mixers and marketing companies, rather than producers. We differentiate ourselves by a broad market presence using a large technical sales force, an extensive network of point-of-sales distributors, resellers and cooperatives and direct sales to large farmers and industrial customers. This presence enhances our new product placement capabilities, thereby driving market growth.
Chemical Solutions - We estimate that there are approximately six companies which control approximately two-thirds of the Brazilian water treatment market. However, as the water treatment market is highly regional by nature, average market shares do not reflect the actual competitive strength for each company by geography, product and customer type. Our strategy is to focus on the regions where our production facilities are located where we have strong market positions for the product categories in which we operate.
In the case of public customers, suppliers of water treatment chemicals compete through a pre-qualification and public bidding process. Barriers to market entry are therefore related to low cost of production (strongly influenced by access to low raw material costs, reduced logistics and large production scale), consistency of product quality and specification, existing customer relationships and previous supply experience.
We believe we are among the eight primary producers of caustic soda, chlorine and sodium hypochlorite (bleach) in Brazil. Our market position is substantially stronger in the North and Northeast regions of Brazil where we choose to operate.
OTHER
DeepStore is our records management business in the U.K. that utilizes portions of previously excavated space in our salt mine in Winsford, Cheshire, for secure underground document storage and one warehouse location in London, England. Currently, DeepStore does not have a significant share of the document storage market in the U.K., and it is not material in comparison to our Salt, Plant Nutrition North America and Plant Nutrition South America segments.
INTELLECTUAL PROPERTY
We rely on a combination of patents, trademarks, copyright and trade secret protection, employee and third-party non-disclosure agreements, license arrangements and domain name registrations to protect our intellectual property. Although we believe these patents, trademarks, copyright and trade secret protection, non-disclosure agreements, license arrangements and domain name registrations are an important factor in our business and that our success does depend in part on these rights, we rely primarily on the innovative skills, technical competence, operational knowledge and marketing abilities required by our business. In addition, we believe that the duration of our intellectual property rights is adequate relative to the expected lives of our products.
We sell many of our products under a number of registered trademarks that we believe are widely recognized in the industry. The following items are some of our registered trademarks pursuant to applicable intellectual property laws and are the property of our subsidiaries: Acquanutri; Aluclor; American Stockman; Amigu; Boromag; Borosol; Canamicros; Chlori-Mag; Citromangan; Cobresol; Coopergran; DDP; DeepStore; DustGuard; Ecentya; FreezGard; Grancote; H2Pro; IceAWay; Improver; Kellus; K-Life; Magnesol; Mapsol; MIB; MIB Colore; Molibsol; Nature’s Own; Nitrak; Nitrosol; Nu-Trax P+; Odorcap; Policote; Potassol; Proacqua; Produbor 10; Produzinco; Profol; Profol Produtividade and design; Prokalium; ProSoft; Protassium and design; Protinus;
13 | ||
COMPASS MINERALS INTERNATIONAL, INC. | 2016 FORM 10-K | |
Rapfloc; Safe Step; Sifto; Somipal; Sulfurgran; Sulfur-Sal; Sure Soft; Sure Paws; Thawrox; Triunfo Flex; Wolf Trax; and Zincodur. No single patent, trademark or trade name is material to our business as a whole.
Any issued patents that cover our proprietary technology and our other intellectual property rights may not provide us with substantial protection or be commercially beneficial to us. The issuance of a patent is not conclusive as to its validity or its enforceability. Competitors may also be able to design around our patents. If we are unable to protect our patented technologies, our competitors could commercialize our technologies.
With respect to proprietary know-how, we rely on trade secret protection and confidentiality agreements. Monitoring the unauthorized use of our technology is difficult, and we may not be able to prevent unauthorized use of our technology. The disclosure or misappropriation of our intellectual property could harm our ability to protect our rights and our competitive position. See Item 1A., “Risk Factors – Our intellectual property may be misappropriated or subject to claims of infringement.” for more information.
EMPLOYEES
As of December 31, 2016, we had 3,103 employees, of which 1,155 are located in Brazil, 995 are located in the U.S., 784 are located in Canada and 169 are located in the U.K. Approximately 40% of our workforce in the U.S., Canada and the U.K. and approximately 25% of our global workforce is represented by collective bargaining agreements. Of our 13 collective bargaining agreements, four will expire in 2017, four will expire in 2018 and five will expire in 2019. Trade union membership is common in Europe and required in Brazil where approximately 5% and 35% of our workforce is located, respectively. We consider our overall labor relations to be good.
14 | ||
COMPASS MINERALS INTERNATIONAL, INC. | 2016 FORM 10-K | |
PROPERTIES
We have leases for packaging facilities and other facilities, which are not individually material to our business. The table below sets forth our principal properties as of December 31, 2016:
Land and Related Surface Rights | Mineral Reserves | |||||||||
Name, Location | Use | Owned/ Leased | Expiration of Lease | Owned/ Leased | Expiration of Lease | |||||
Cote Blanche, Louisiana | Rock salt production facility | Leased | 2060(1) | Leased | 2060(1) | |||||
Lyons, Kansas | Evaporated salt production facility | Owned | N/A | Owned | N/A | |||||
Ogden, Utah | SOP, solar salt and magnesium chloride production facility | Owned | N/A | Leased | (2) | |||||
Wynyard, Saskatchewan, Canada | SOP production facility | Owned(3) | N/A | Leased | 2020(4) | |||||
Amherst, Nova Scotia, Canada | Evaporated salt production facility | Owned | N/A | Leased | 2023(5) | |||||
Goderich, Ontario, Canada | Rock salt production facility | Owned | N/A | Leased | 2022(5) | |||||
Goderich, Ontario, Canada | Evaporated salt production facility | Owned | N/A | Owned | N/A | |||||
Unity, Saskatchewan, Canada | Evaporated salt production facility | Owned | N/A | Leased | 2037/2030(6) | |||||
Winsford, Cheshire, United Kingdom | Rock salt production facility; records management | Owned | N/A | Owned | N/A | |||||
London, United Kingdom | Records management | Leased | 2028 | N/A | N/A | |||||
Suzano I, São Paulo, Brazil | Nutritional supplements and other chemicals production facility | Owned | N/A | N/A | N/A | |||||
Suzano II, São Paulo, Brazil | Nutritional supplements packaging facility | Owned | N/A | N/A | N/A | |||||
Igarassu, Pernambuco, Brazil | Various chemicals production facility | Owned | N/A | N/A | N/A | |||||
Mauá, São Paulo, Brazil | Nutritional supplements production facility | Owned | N/A | N/A | N/A | |||||
Uberlândia, Minas Gerais, Brazil | Mineral supplements for beef cattle and milk | Owned | N/A | N/A | N/A | |||||
Fermavi, Minas Gerais, Brazil(7) | Nutritional supplements, water treatment, and other chemicals production facility | Owned | N/A | N/A | N/A | |||||
Reluz Nordeste, Alagoas, Brazil | Water treatment and other chemicals production facility | Owned | N/A | N/A | N/A | |||||
Jacareí I, São Paulo, Brazil | Nutritional supplements production facility | Owned | N/A | N/A | N/A | |||||
Jacareí II, São Paulo, Brazil | Nutritional supplements production and warehouse | Leased | 2030 | N/A | N/A | |||||
Overland Park, Kansas | Corporate headquarters | Leased | 2020 | N/A | N/A | |||||
(1) | The Cote Blanche lease was amended in 2014 to include two 25-year renewal options. |
(2) | The Ogden lease renews on an annual basis. |
(3) | The Wynyard location also has leases expiring in 2026 for two parcels of land. |
(4) | The Wynyard mineral lease may be renewed for additional 20-year periods. |
(5) | Subject to our right of renewal through 2043. |
(6) | Consists of a lease expiring in 2037 and a lease expiring in 2030 subject to our right of renewal through 2051. |
(7) | Hold a 50% ownership interest through a joint venture with Fermavi Eletroquímica Ltda. |
15 | ||
COMPASS MINERALS INTERNATIONAL, INC. | 2016 FORM 10-K | |
With respect to each facility at which we extract salt, brine or SOP, permits, licenses and approvals are obtained as needed in the normal course of business based on our mine plans and federal, state, provincial and local regulatory provisions regarding mine permitting and licensing. Based on our historical permitting experience, we expect to be able to continue to obtain necessary mining permits and approvals to support historical rates of production.
Our mineral leases have varying terms. Some will expire after a set term of years, while others continue indefinitely. Many of these leases provide for a royalty payment to the lessor based on a specific amount per ton of minerals extracted or as a percentage of revenue. In addition, we own a number of properties and are party to non-mining leases that permit us to perform activities that are ancillary to our mining operations, such as surface use leases for storage at depots and warehouse leases. We believe that all of our leases were entered into at market terms.
16 | ||
COMPASS MINERALS INTERNATIONAL, INC. | 2016 FORM 10-K | |
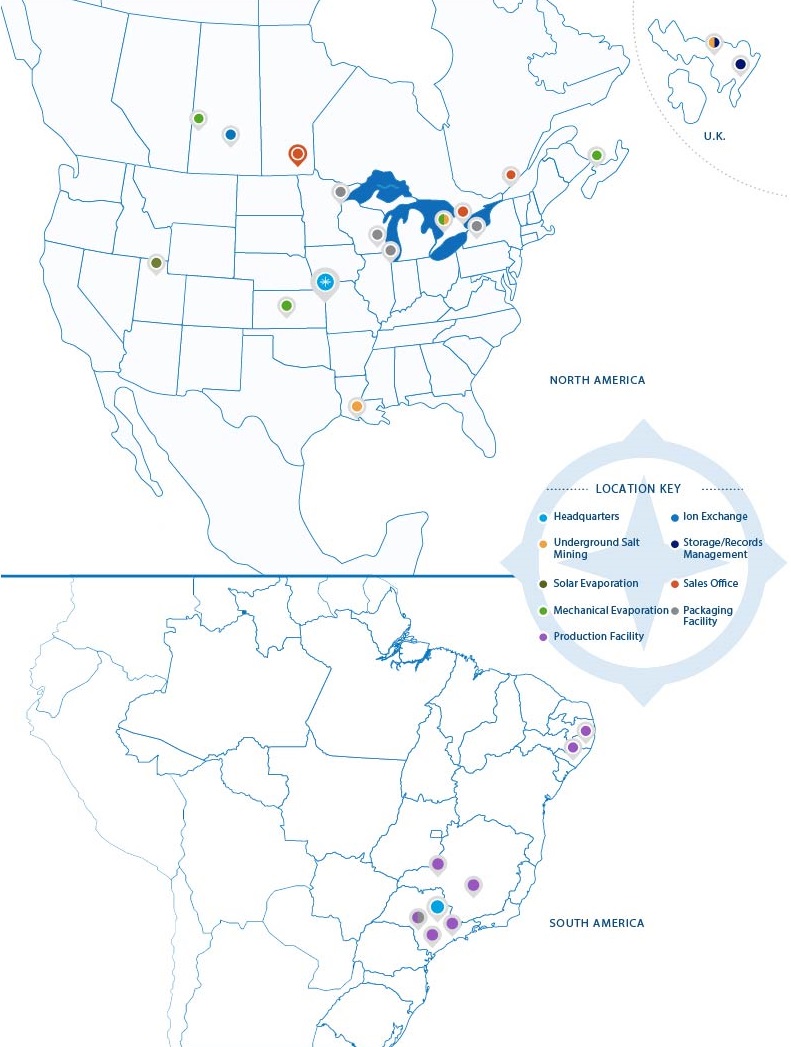
The following map shows the locations of our principal operating facilities as of December 31, 2016:
17 | ||
COMPASS MINERALS INTERNATIONAL, INC. | 2016 FORM 10-K | |
ENVIRONMENTAL, HEALTH AND SAFETY MATTERS
Our operations subject us to an evolving set of international, federal, national, foreign, state, provincial and local environmental, health and safety (“EHS”) laws and regulations. These EHS laws and regulations regulate, or propose to regulate, the conduct of our mining and production operations, including safety procedures and process safety management; management and handling of raw and in-process materials and finished products; air and water quality impacts from our facilities; management of hazardous and solid wastes; remediation of contamination at our facilities and third-party sites; and post-mining land reclamation.
The Environment, Health and Safety Committee of our Board of Directors works closely with our management to ensure that appropriate strategies and processes are in place to ensure safe and compliant operations and to promote a culture that prioritizes safety and environmental stewardship. The committee monitors our EHS performance against our targets. We have adopted a five-year environmental management plan focused on (i) verifying compliance through a combination of internal and third party audits, (ii) ensuring operational excellence and associated efficiencies, and (iii) enhancing our focus on sustainable operations. We also employ and consult with environmental specialists to assess and ensure our compliance with EHS laws and regulations.
Costs of compliance with EHS laws and regulations, including management effort, time and resources, have been and are expected to continue to be significant. New or proposed EHS regulatory programs, as well as future interpretations and enforcement of existing EHS laws and regulations, may require modification to our facilities, substantial increases in equipment and operating costs or interruptions, modifications or a termination of operations, the extent to which we cannot predict and which may involve significant capital costs or increases in operating costs. Anticipating future compliance obligations, implementing compliance plans and estimating future costs can be particularly challenging while EHS laws and regulations are under development and have not been adopted.
We estimate that our 2016 EHS capital expenditures were approximately $5.1 million. Our EHS capital expenditures in 2016 did not differ materially from amounts expended in the past two years. For 2017, our EHS capital expenditures are expected to be approximately $2.2 million.
As of December 31, 2016, we had recorded $1.7 million of accruals for contingent environmental liabilities. We record accruals for contingent environmental liabilities when we believe it is probable that we will be responsible, in whole or in part, for environmental investigation or remediation activities and the expenditures for these activities are reasonably estimable. However, the extent and costs of any environmental investigation or remediation activities are inherently uncertain and difficult to estimate and could exceed our expectations, which could materially affect our financial condition and operating results.
Operating Requirements and Impacts
Our operations require permits for extraction of salt and brine, air emissions, surface water discharges of process material and wastes, waste generation, injection of brine and wastewater into subsurface wells and other activities. As a result, we hold numerous environmental and mineral extraction permits, water rights and other permits, licenses and approvals from governmental authorities authorizing operations at each of our facilities. These permits, licenses and approvals are typically subject to renewals and reissuances. Expansion of our operations or production capacity, or preservation of existing rights in some cases, is also predicated upon securing any necessary permits, licenses and approvals. The terms and conditions of future EHS laws and regulations, permits, licenses and approvals may be more stringent and may require increased expenditures on our part. In addition, although we do not engage in hydraulic fracturing (commonly known as “fracking”), laws and regulations targeting fracking could lead to increased permit requirements and compliance costs for non-fracking operations, including our salt operations, which require permitted wastewater disposal wells.
Our Cote Blanche mine, an underground salt mine located in St. Mary Parish, Louisiana, is subject to regulation by the Mine Safety and Health Administration (“MSHA”) under the Federal Mine Safety and Health Act of 1977, as amended (the “Mine Act”). MSHA is required to regularly inspect the Cote Blanche mine and issue a citation, or take other enforcement action, if an inspector or authorized representative believes that a violation of the Mine Act or MSHA’s standards or regulations has occurred. As required by MSHA, these operations are regularly inspected by MSHA personnel. Item 4 and Exhibit 95 to this Annual Report on Form 10-K provide information concerning mine safety violations and other regulatory matters required by Section 1503(a) of the Dodd-Frank Wall Street Reform and Consumer Protection Act and Item 104 of Regulation S-K. The costs of compliance and penalties for violations of the Mine Act have been and are expected to continue to be substantial.
We have post-closure mine reclamation obligations, primarily arising under our mining permits or by agreement. Many of these obligations include requirements to maintain financial surety bonds to fund mine reclamation and site cleanup following the ultimate closure of the mines. As a result, we maintain financial surety bonds to satisfy these obligations.
We are also impacted by the U.S. Clean Air Act (the “Clean Air Act”) and other EHS laws and regulations that regulate air emissions. These regulatory programs may require us to install expensive emissions abatement equipment, modify our operational practices, obtain additional permits or make other expenditures. In December 2013, the Utah Air Quality Board adopted a state implementation plan (the “SIP”) pursuant to the Clean Air Act related to certain air pollutants in an area where our Ogden, Utah facility is located. Under the SIP, we were required to abate NOx (nitric oxide and nitrogen dioxide) emissions from our dryers at our Ogden, Utah, facilities by January 1, 2017. In response to the SIP, we retrofitted and improved our equipment in advance of the compliance deadline; however, we were unable to retire, retrofit or improve certain equipment as a result of construction related to our other capital projects. The Utah Air Quality Board extended our SIP compliance deadline to October 2017.
18 | ||
COMPASS MINERALS INTERNATIONAL, INC. | 2016 FORM 10-K | |
From time to time, we have received notices from governmental agencies that we are not in compliance with certain EHS laws, regulations, permits or approvals. Upon receipt of these notices, we evaluate the matter and take all appropriate corrective actions.
Remedial Activities
Many of our past and present facilities have been in operation for decades. Operations at these facilities have historically involved the use and handling of regulated chemical substances, salt, salt byproducts and process tailings by us and our predecessors.
At many of these facilities, releases and disposal of regulated substances have occurred and could occur in the future, which could require us to investigate, undertake or pay for remediation activities under the U.S. Comprehensive Environmental Response, Compensation and Liability Act (“CERCLA”) and other similar EHS laws and regulations. These laws and regulations may impose “no fault” liability on past and present owners and operators of facilities associated with the release or disposal of hazardous substances, regardless of fault or the legality of the original actions. Additionally, one past or present owner or operator may be required to bear more than its proportional share of liability if payments cannot be obtained from other responsible parties.
In addition, third parties have alleged in the past and could allege in the future that our operations have resulted in contamination to neighboring off-site areas or third-party facilities, including third-party disposal facilities for regulated substances generated by our operations, which could result in liability for us under CERCLA or other EHS laws and regulations.
We have incurred and expect to continue to incur costs and liabilities as a result of our current and former operations and our predecessor’s operations. In the past, we have agreed to undertake or pay for investigations to determine whether remediation will be required under CERCLA or otherwise to address any contamination. In other instances, we have agreed to perform remediation activities or have undertaken voluntary remediation to address identified contamination. Ongoing investigation and remediation activities at our Kenosha, Wisconsin, plant are described in Note 12 of our Consolidated Financial Statements.
ITEM 1A. | RISK FACTORS |
We are subject to a number of risks, which could have a material adverse effect on our business, financial condition, results of operations and the value of our securities. You should carefully consider the following risks and all of the information set forth in this report. The risks described below are not the only ones facing our company. Additional risks and uncertainties not currently known to us or that we currently deem to be immaterial may also materially and adversely affect our business, financial condition or results of operations.
Our mining and industrial operations involve inherently risky activities.
Our operations involve significant risks and hazards, including environmental hazards and industrial accidents. Our underground salt mining operations and related processing activities may be subject to industrial and mining accidents, fire, explosions, unusual or unexpected geological formations, water intrusion and flooding. For example, MSHA considers our Cote Blanche, Louisiana, salt mine to be a “gaseous mine” and, as a result, is subject to a heightened risk of explosion and fire. The types and volumes of certain chemicals manufactured by our Plant Nutrition South America segment’s chemical solutions business pose process safety management risks, including hazards related to chemical process manufacturing and the related storage, handling and transportation of raw materials, products and wastes. These potential risks include pipeline and storage tank leaks and ruptures, explosions and fires, mechanical failure and chemical spills and other discharges or releases of toxic or hazardous substances or gases at our sites or during transportation.
These hazardous activities pose significant management challenges and could result in loss of life, a mine shutdown, damage to or destruction of our properties and surrounding properties, production facilities or equipment, production delays or business interruption. Our insurance coverage may be insufficient to cover all losses or claims associated with our operations, including these operational risks.
Geological conditions could lead to a mine shutdown, increased costs and production delays, which could adversely affect results of our operations.
Our salt mining operations involve a complex process, which is affected by the mineralogy of the mineral deposits and structural geologic conditions and is subject to related risks. For example, unexpected geological conditions could lead to significant water inflows and flooding at any of our underground mines, which could result in a mine shutdown, serious injuries, increased operational costs, production delays, damage to our mineral deposits and equipment damage. We have minor water inflows at our Cote Blanche and Goderich salt mines that we actively monitor and manage. Underground mining also poses the potential risk of mine subsidence (i.e., collapse of the mine) because of the mine geology and rate and volume of minerals extracted.
Our mineral reserve estimates of the remaining tons minerals in our mines are based on many factors, including the area and volume covered by our mining rights, assumptions regarding our extraction rates based upon an expectation of operating the mines on a long-term basis and the quality of in-place reserves. Our actual mineral deposits encountered in our mining operations and the economic viability of mining a mineral deposit may differ materially from our estimates. In addition, we may not be able to access certain mineral deposits as a result of the nature of the geologic formations of our salt mines, which could impact the accuracy of our salt deposit reserve projections.
19 | ||
COMPASS MINERALS INTERNATIONAL, INC. | 2016 FORM 10-K | |
Variations in the mineralogy of our mineral deposits could limit our ability to extract our mineral deposits, increase our extraction costs, impact the purity of extracted minerals and the suitability of the extracted minerals to create products for sale and to meet customer specifications. This could adversely impact our ability to fulfill our contracts, resulting in significant contractual penalties and loss of customers.
Our operations are conducted primarily through a limited number of key production and distribution facilities, and we are also dependent on critical equipment.
We conduct our operations through a limited number of key production and distribution facilities. These facilities include our underground salt mines, our evaporation plants, our SOP solar evaporation ponds and facilities, certain facilities in Brazil used by our Plant Nutrition South America businesses and the distribution facilities, depots and ports owned by us and third parties. Many of our products are produced at one or two of these facilities. Any disruption of operations at one of these facilities could significantly affect production or distribution of our products, which could damage our customer relationships.
For example, our two North American salt mines together constituted approximately 74% of our salt production capacity as of December 31, 2016 and supply most of the salt sold by our North American highway deicing business and significant portions of the salt sold by our consumer and industrial business. A production interruption at one of our salt mines could adversely affect our ability to fulfill our salt contracts and our ability to secure future contracts in affected markets or other markets. In addition, we only have a limited number of distribution facilities in the markets in which we sell our salt products. Failure to have our salt products at a specific distribution facility when needed (for example during a snow event) could adversely impact our ability to fulfill our highway deicing sales contracts, resulting in significant contractual penalties and loss of customers.
Similarly, many of our plant nutrition products are only produced at one or two facilities. We produce SOP at our solar evaporation ponds located at the Great Salt Lake and Big Quill Lake. SOP production at these solar ponds could be disrupted or negatively impacted by structural damage, as a result of dike failure or other factors, which could result in lowered sales and revenue. In addition, in our Plant Nutrition South America businesses, we use products manufactured at certain of our production facilities as inputs to products manufactured at our other production facilities in Brazil. An interruption at one of our production facilities could result in production disruptions at other facilities in Brazil, as alternative sources for raw materials or other materials might not be found at reasonable prices, on a timely basis, or at all. A production interruption or disruption at one or more of our facilities could result in a loss of customers and revenue.
Our operations depend upon critical equipment, such as our continuous miners, hoists and conveyor belts. This equipment could be damaged or destroyed, suffer breakdowns or failures or deteriorate due to wear and tear sooner than we estimate, and we may be unable to replace or repair the equipment in a timely manner or at a reasonable cost. If these events occur, we may incur additional maintenance and capital expenditures, our operations could be materially disrupted and we may not be able to produce and ship our products.
Our business is capital intensive, and the inability to fund necessary capital expenditures or successfully complete our capital projects could have an adverse effect on our growth and profitability.
We are in the process of a shaft relining project, implementing continuous mining at our Goderich, Canada, mine and expanding our SOP processing plant at our Great Salt Lake facility in Ogden, Utah, which will require us to make significant capital expenditures in 2017. Significant capital expenditures are required to maintain our existing facilities and the capital required to maintain these facilities can fluctuate significantly. These activities or other capital projects may require the temporary suspension of production at our facilities, which could have a material adverse effect on the results of our operations.
Our capital projects involve risks, including cost overruns, delays and performance uncertainties, and could interrupt our ongoing operations. The expected benefits from these capital projects may not be realized in accordance with our projections, despite the significant capital expenditures. Our capital projects may also result in other unanticipated adverse consequences, such as the diversion of management’s attention from other operational matters or significant disruptions to our ongoing operations.
Although we currently finance most of our capital expenditures through cash provided by operations, we also may depend on increased borrowing or other financing arrangements to fund future capital expenditures. If we are unable to obtain suitable financing, we may not be able to complete our capital projects and our ability to maintain or expand our facilities in the future may be limited. The occurrence of these events could have a material adverse effect on our business, financial condition and results of operations.
Our production processes rely on the consumption of natural gas, electricity and certain other raw materials. A significant interruption in the supply or an increase in the price of any of these could adversely affect our business.
Energy costs, primarily natural gas and electricity, represented a substantial part of our total production costs in 2016. Our profitability is impacted by the price and availability of natural gas and electricity we purchase from third parties. Natural gas is a primary energy source used in the evaporated salt production process. Our contractual arrangements for the supply of natural gas have terms of up to three years, do not specify quantities and are automatically renewed unless either party elects not to do so. In addition, electricity is a primary fuel source used by our Plant Nutrition South America businesses and we have electricity contracts with terms of up to three years. We do not have arrangements in place with back-up suppliers. We use natural gas derivatives to hedge our financial exposure to the price volatility of natural gas. A significant increase in the price of energy that
20 | ||
COMPASS MINERALS INTERNATIONAL, INC. | 2016 FORM 10-K | |
is not recovered through an increase in the price of our products or covered through our hedging arrangements, or an extended interruption in the supply of natural gas or electricity to our production facilities, could have a material adverse effect on our business, financial condition and results of operations.
We use KCl in our salt and plant nutrition operations. Large negative price fluctuations in KCl can occur without a corresponding change in sales price to our customers. This could change the profitability of our products that require KCl, which could materially affect the results of our operations.
The results of our operations are dependent on and vary due to weather conditions. Additionally, adverse weather conditions or significant changes in weather patterns could adversely affect us.
Weather conditions, including amounts, timing and duration of wintry precipitation and snow events, excessive hot or cold temperatures, rainfall and drought, can significantly impact our sales, production, costs and operational results and impact our customers. From year to year, sales of our highway deicing products and profitability of the salt segment may be affected by weather conditions in our markets. Any prolonged change in weather patterns in our markets, as a result of climate change or otherwise, could have a material impact the results of our operations.
In addition, our ability to produce SOP, salt and magnesium chloride from our solar evaporation ponds in Ogden, Utah, is dependent upon sufficient lake brine levels and hot, arid summer weather conditions. Prolonged periods of precipitation, lack of sunshine, cooler weather during the evaporation season or increased mountain snowfall fresh water run-off could reduce the evaporation rate and our production levels. Similarly, drought or decreased mountain snowfall fresh water run-off could accelerate the evaporation rate or change brine levels, impacting our mineral harvesting process, amount and timing. In recent years, the Great Salt Lake area has experienced a severe drought. As a result, lake brine levels have been altered and we may experience a disruption in our typical two- to three-year evaporation production cycle. Similar factors could negatively impact the lake level and concentration of sulfates at the Big Quill Lake, impacting the production at our Wynyard facility. The occurrence of these events at the Great Salt Lake or Big Quill Lake could lead to decreased production levels, increased operating costs and significant additional capital expenditures.
Weather conditions have historically caused volatility in the agricultural industry (and indirectly in our results of operations) by causing crop failures or significantly reduced harvests, which can adversely affect crop yields, application rates, demand for our plant nutrition products and our customers’ creditworthiness. Drought can also adversely impact growers’ crop yields and the uptake of plant nutrients, reducing the need for application of plant nutrition products for the next planting season which could result in lower demand for our plant nutrition products and impact sale prices.
Future climate change could adversely affect us.
The potential impact of climate change on our operations, product demand and the needs of our customers remains uncertain. Scientists have proposed that the impacts of climate change could include changes in rainfall patterns, water shortages, changing sea levels, changing storm patterns and intensities and changing temperature levels and that these changes could be severe. These impacts could vary by geographic location as well as negatively impact customer demand for our products and our costs and ability to produce our products. In addition, potential climate change regulations or other carbon or emissions taxes could result in higher costs.
Our indebtedness and ability to pay our indebtedness could adversely affect our business and financial condition.
We have a significant amount of indebtedness and may incur additional debt in the future. As of December 31, 2016, we had $1.33 billion of outstanding indebtedness, including $951.3 million of borrowings under our senior secured credit facilities, which is further described in Note 10 of our Consolidated Financial Statements. We pay significant interest on our indebtedness, with variable interest on our borrowing under our senior secured credit facilities based on prevailing interest rates. Significant increases in interest rates will increase the interest we pay on our debt. Our significant indebtedness could:
• | limit our ability to borrow additional money or sell our stock to fund our working capital, capital expenditures and debt service requirements; |
• | impact our ability to implement our business strategy and limit our flexibility in planning for, or reacting to, changes in our business as well as changes to economic, regulatory or other competitive conditions; |
• | place us at a competitive disadvantage compared to our competitors with greater financial resources; |
• | make us more vulnerable to a downturn in our business or the economy; |
• | require us to dedicate a substantial portion of our cash flow from operations to the repayment of our indebtedness, thereby reducing the availability of our cash flow for other purposes; and |
• | materially and adversely affect our business and financial condition if we are unable to meet our debt service requirements or obtain additional financing. |
In the future, we may incur additional indebtedness or refinance our existing indebtedness. If we incur additional indebtedness or refinance, the risks that we face as a result of our leverage could increase. Financing may not be available when needed or, if available, may not be available on commercially reasonable or satisfactory terms.
Our ability to make payments on our indebtedness, refinance our indebtedness and fund planned capital expenditures will depend on our ability to generate future cash flows from operations. This, to a certain extent, is subject to general economic,
21 | ||
COMPASS MINERALS INTERNATIONAL, INC. | 2016 FORM 10-K | |
financial, competitive, legislative, regulatory and other factors that are beyond our control. There can be no assurance that our business will generate sufficient cash flows from operations or that future borrowings will be available to us under our revolving credit facility in an amount sufficient to enable us to make payments with respect to our indebtedness or to fund our other liquidity needs. If this were the case, we might need to refinance all or a portion of our indebtedness on or before maturity, sell assets, reduce or delay capital expenditures or seek additional equity financing. Our inability to obtain needed financing or generate sufficient cash flows from operations may require us to abandon or curtail capital projects, strategic initiatives or other investments or impair our ability to make acquisitions, enter into joint ventures or engage in other activities, which could materially impact our business.
The agreements governing our indebtedness impose restrictions that may limit our ability to operate our business or require accelerated debt payments.
Our agreements governing our indebtedness contain covenants that limit our ability to:
• | incur additional indebtedness or contingent obligations or grant liens; |
• | pay dividends or make distributions to our stockholders; |
• | repurchase or redeem our stock; |
• | make investments or dispose of assets; |
• | prepay, or amend the terms of, certain junior indebtedness; |
• | engage in sale and leaseback transactions; |
• | make changes to our organizational documents or fiscal periods; |
• | enter into third-party agreements that limit our ability to grant liens on our assets or make certain intercompany dividends, investments or asset transfers; |
• | enter into new lines of business; |
• | enter into transactions with our stockholders and affiliates; and |
• | acquire the assets of, or merge or consolidate with, other companies. |
The credit agreement governing our senior secured credit facilities also requires us to maintain financial ratios, including an interest coverage ratio and a total leverage ratio, which we may be unable to maintain. As of December 31, 2016, our total leverage ratio is 3.9, and if our leverage ratio exceeds 4.5 we would be in default under our credit agreement.
Various risks, uncertainties and events beyond our control could affect our ability to comply with the covenants, financial tests and ratios required by the agreements governing our indebtedness. If we default under our agreements governing our indebtedness, our lenders could cease to make further extensions of credit, accelerate payments under our other debt instruments that contain cross-acceleration or cross-default provisions and foreclose upon any collateral securing that debt as well as restrict our ability to make certain investments and payments, pay dividends, purchase our stock, enter into transactions with affiliates, make acquisitions, merge and consolidate, or transfer or dispose of assets.
If our lenders were to require immediate repayment, we may need to obtain new financing to be able to repay them immediately, which may not be available or, if available, may not be available on commercially reasonable or satisfactory terms. Under these circumstances, we might not have sufficient funds or other resources to satisfy all of our obligations.
We are subject to tax liabilities which could adversely impact our profitability, cash flow and liquidity.
We are subject to income tax in the U.S., Canada, Brazil and U.K. Our effective tax rate could be adversely affected by changes in the mix of earnings in countries with differing statutory tax rates, changes in the valuation of deferred tax assets and liabilities and the discovery of new information in the course of our tax return preparation process. Our effective tax rate could also be adversely affected by changes in tax laws. For example, certain versions of recent U.S. tax reform proposals as well as future tax reform proposals could, if enacted, have a material impact on our tax expense and cash flows. We are also subject to audits in various jurisdictions and may be assessed additional taxes during an audit.
Canadian federal and provincial tax authorities have challenged our tax positions and assessed additional taxes on us, including for years which had been previously settled by agreement among us, the Canadian federal taxing authority and the U.S. federal taxing authority (described in Note 8 of our Consolidated Financial Statements). These tax assessments and future tax assessments could be material if the disputes are not resolved in our favor.
In the ordinary course of our business, there are many transactions and calculations that could be challenged by taxing authorities. This includes the values charged on the transfer of products between our subsidiaries. Although we believe our tax estimates and calculations are reasonable, they have been challenged by taxing authorities in the past. The final determination of any tax audits and litigation may take several years and be materially different from our historical income tax provisions and accruals in our financial statements. If additional taxes are assessed as a result of an audit, assessment or litigation, there could be a material adverse effect on our financial condition, income tax provision and net income in the affected periods as well as future profitability, cash flows and our ability to pay dividends and service our debt.
22 | ||
COMPASS MINERALS INTERNATIONAL, INC. | 2016 FORM 10-K | |
We are subject to financial assurance requirements and failure to satisfy these requirements could materially affect our business, results of our operations and our financial condition.
In connection with our dispute of tax assessments made by Canadian federal and provincial tax authorities (described in Note 8 of our Consolidated Financial Statements), we are required to post and maintain financial performance bonds. In addition, as part of our business operations, we are required to maintain financial surety or performance bonds with certain of our North American highway deicing customers and to fund mine reclamation and site cleanup following the ultimate closure of our mines. We incur costs to maintain these financial assurance bonds and failure to satisfy these financial assurance requirements could materially affect our business, the results of our operations and our financial condition.
If our customers are unable to access credit, they may be not be able to purchase our products. In addition, we extend trade credit to certain customers and guarantee financing that certain customers use to purchase our products and the results of our operations may be adversely affected if customers default on these obligations.
Some of our customers require access to credit to purchase our products. A lack of available credit to customers, due to global or local economic conditions or for other reasons, could adversely affect demand for our products and the sales of our products.
We extend trade credit to our customers in the United States and throughout the world, in some cases for extended periods of time. In Brazil, where there are fewer third-party financing sources available to farmers, we also have several programs under which we guarantee customers’ financing from financial institutions that they use to purchase our products. If these customers are unable to repay the trade credit from us or financing from their banks, the results of our operations could be adversely affected. In addition, increases in prices for other inputs may increase the working capital requirements, indebtedness and other liabilities of our customers, and increase the risk that they will default on the trade credit from us or their financing that we guarantee, and decrease the likelihood that we will be able to collect from our customers in the event of their default.
We may be restricted from paying cash dividends on our common stock in the future.
We have declared and paid regular quarterly cash dividends on our common stock. Any future payment of cash dividends will depend upon our financial condition, earnings, legal requirements, restrictions in our debt agreements and other factors deemed relevant by our board of directors. Although our operations are conducted through our subsidiaries, none of our subsidiaries is obligated to make funds available to pay dividends on our common stock. Accordingly, our ability to pay dividends to our stockholders is dependent on the earnings and the distribution of funds from our subsidiaries.
Certain agreements governing our indebtedness contain limitations on our ability to pay dividends (including regular annual dividends). Among other things, dividends to shareholders are limited in the aggregate to $100 million plus 50% of the preceding year net income (as defined in our credit facility). In addition, we may be restricted from paying dividends to our stockholders if our total leverage ratio exceeds 4.5x (actual ratio of 3.9x as of December 31, 2016) or if a default or event of default has occurred and is continuing under the credit agreement. We cannot provide assurances that the agreements governing our current and future indebtedness will permit us to pay dividends on our common stock.
Our products face strong competition and if we fail to successfully attract and retain customers and invest in product development, capital improvements and productivity improvements, sales of our products could be adversely affected.
We encounter strong competition in many areas of our business and our competitors may have significantly more financial resources than we do. Competition in our product lines is based on a number of factors, including product quality and performance, logistics (especially in salt distribution and Brazil chlor-alkali products), brand reputation, price and quality of customer service and support. Many of our customers attempt to reduce the number of vendors from which they purchase in order to increase their efficiency. Our customers demand a broad product range and we must continue to develop our expertise in order to manufacture and market these products successfully. To remain competitive, we need to invest in manufacturing, marketing, customer service and support and our distribution networks. We may not have sufficient resources to continue to make such investments or maintain our competitive position. We may have to adjust our prices, strategy, distribution efforts or marketing to stay competitive.
The demand for our products may be adversely affected by technological advances or the development of new or less costly competing products. For example, the development of substitutes for our products that can more efficiently mix with other agricultural inputs or have more efficient application methods may impact the demand for our products. Many of our products, including sodium chloride, magnesium chloride and SOP, have historically been characterized by a slow pace of technological advances. However, new production methods or sources for our products or the development of substitute or competing products could materially adversely affect the demand and sales of our products.
Changes in competitors’ production, geographic or marketing focus could have a material impact on our business. We face global competition from new and existing competitors who have entered or may enter the markets in which we sell. Some of our competitors may have greater financial and other resources than we do or are more diversified, making them less vulnerable to industry downturns and better positioned to pursue new expansion and development opportunities. Our competitive position could suffer if we are unable to expand our operations through investments in new or existing operations or through acquisitions, joint ventures or partnerships.
23 | ||
COMPASS MINERALS INTERNATIONAL, INC. | 2016 FORM 10-K | |
Risks associated with our international operations and sales could adversely affect our business and earnings.
We have significant operations in Canada, Brazil and the U.K. and our 2016 sales outside the U.S. were approximately 33% of our total 2016 sales. Our overall success as a global business depends on our ability to operate successfully in differing economic, political and cultural conditions. Our international operations and sales are subject to numerous risks and uncertainties, including:
• | economic developments including changes in currency exchange rates, inflation risks, exchange controls, tariffs, other trade protection measures and import or export licensing requirements; |
• | difficulties and costs associated with complying with laws, treaties and regulations, including tax laws and labor regulations, and changes to laws, treaties and regulations; |
• | restrictions on our ability to own or operate subsidiaries, make investments or acquire new businesses; |
• | restrictions on our ability to repatriate earnings from our subsidiaries and withholding taxes on remittances and other payments by subsidiaries; and |
• | political developments, government deadlock, political instability, political activism, terrorist activities, civil unrest and international conflicts. |
A significant portion of our cash flow is generated in Canadian dollars, Brazilian Reais and British pounds sterling and our consolidated financial results are reported in U.S. dollars. Our reported results can significantly increase or decrease based on exchange rate volatility after translation of our results into U.S. dollars. Exchange rate fluctuations could also impact our ability to meet interest and principal payments on our U.S. dollar-denominated debt. In addition, we incur currency transaction risk when we enter into a purchase or a sales transaction using a currency other than the local currency of the transacting entity. We may not be able to effectively manage our currency risks. For more information, see “Management’s Discussion and Analysis of Financial Condition and Results of Operations—Effects of Currency Fluctuations and Inflation,” and “Quantitative and Qualitative Disclosures About Market Risk.”
In addition, we may face more competition in periods when foreign currency exchange rates are favorable to our competitors. A relatively strong U.S. dollar increases the attractiveness of the U.S. market for some of our international competitors while decreasing the attractiveness of other markets to us. Similarly, a relatively strong Brazilian Reais increases the attractiveness of the Brazil market for our international competitors.
The decision by U.K. voters to leave the European Union could cause volatility in global stock markets, currency exchange rate fluctuations and increased regulatory complexities. These changes may adversely affect the results of our operations.
Anticipated changes in plant nutrition prices and customer application rates can have a significant effect on the demand and price for our plant nutrition products.
When customers anticipate increasing plant nutrition selling prices, they tend to accumulate inventories in advance of the expected price increase. Similarly, customers tend to delay their purchases when they anticipate future selling prices for plant nutrition products will stabilize or decrease. These customer expectations can lead to a lag in our ability to realize price increases for our products and adversely impact our sales volumes and selling prices.
Customer expectations about agricultural economics may impact the demand for our products. Growers’ decision to purchase plant nutrition products and the application rate for plant nutrition products depend on many factors, including expected grower income, crop prices, plant nutrition prices and nutrient levels in the soil. Customers are more likely to decrease purchases and application rates when they expect declining agricultural economics or relatively high plant nutrition costs, other input costs prices and soil nutrient levels. This variability can materially impact our prices and volumes.
The demand for our products is seasonal.
The demand for both our salt and plant nutrition products is seasonal, and the degree of seasonality can change significantly from year to year due to weather conditions, including the number of snow events, rainfall and other factors.
Our salt deicing business is seasonal. On average, over the last three years, approximately two-thirds of our deicing product sales occurred during the North American and European winter months of November through March each year. Winter weather events are not predictable, yet we must stand ready to deliver deicing products to local communities with little advance notice under the requirements of our highway deicing contracts. As a result, we attempt to stockpile our highway deicing salt throughout the year to meet estimated demand for the winter season. Failure to deliver under our highway deicing contracts may result in significant financial penalties under those contracts and could lead to future loss of customers in geographies we serve.
Our plant nutrition business is also seasonal. For example, the strongest demand for our plant nutrition products in Brazil typically occurs during the spring planting season. As a result, we and our customers generally build inventories during the low demand periods of the year to ensure timely product availability during the peak sales season. The seasonality of this demand results in our sales volumes and net sales for our Plant Nutrition South America segment usually being the highest during the third and fourth quarters of each year (as the spring planting season begins in September in Brazil).
If seasonal demand is greater than we expect, we may experience product shortages, and our customers may turn to our competitors for products that they would otherwise have purchased from us. If seasonal demand is less than we expect, we may have excess inventory that will have to be stored (in which case we may incur increased storage costs) or liquidated (in which case the selling price may be below our costs). If prices for our products rapidly decrease, we may be subject to inventory write-
24 | ||
COMPASS MINERALS INTERNATIONAL, INC. | 2016 FORM 10-K | |
downs. Our inventories may also become impaired through obsolescence or the quality may be impaired if our inventories are not stored properly.
Conditions in the agricultural sector and supply and demand imbalances for competing plant nutrition products can also impact the price and demand for our products.
Conditions in the North American and Brazilian agricultural sectors can significantly impact our plant nutrition business. The North America and Brazil agricultural sector can be affected by a number of factors, including weather conditions, field conditions (particularly during periods of traditionally high plant nutrition application), government policies and import and export markets.
Demand for our products in the agricultural sector is affected by crop prices, type of crops planted, planted acreage and application rates, crop yields, product acceptance, driven by population growth and changes in dietary habits, among other things. Supply is affected by available capacity, operating rates, raw material costs and availability, feasible transportation, government policies and global trade. In addition, the demand and price of plant nutrition products can be affected by factors such as plant disease. For example, Asian soybean rust has in certain years affected soybean crops in Brazil and the United States, reducing demand for plant nutrition products.
MOP is the least expensive form of potash fertilizer and, consequently, it is the most widely used potassium source for most crops. SOP is utilized by growers for many high-value crops, especially crops for which low-chloride content fertilizers or the presence of sulfur improves quality and yield, such as almonds and other tree nuts, avocado, citrus, lettuce tobacco, grapes, strawberries and other berries. Lower prices or demand for these crops could adversely affect demand for our products and the results of our operations.
When the demand and price of potash are high, our competitors are more likely to increase their production and invest in increased production capacity. An over-supply of MOP or SOP domestically or worldwide could unfavorably impact the prices we can charge for our SOP, as a large price disparity between potash products could cause growers to choose MOP or other less-expensive alternatives, which could adversely impact our sales volume and the results of our operations.
Increasing costs or a lack of availability of transportation services could have an adverse effect on our ability to deliver products at competitive prices.
Transportation and handling costs are a significant component of our total product cost, particularly for our salt products. The high relative cost of transportation favors producers whose mines or facilities are located near the customers it serves. We contract bulk shipping vessels, barges, trucking and rail services to move our products from our production facilities to distribution outlets and customers. A reduction in the dependability or availability of transportation services or a significant increase in transportation service rates, including the impact of weather and water levels on the waterways we use, could impair our ability to deliver our products economically to our customers or expand our markets. For example, if the Mississippi river floods significantly, barges may be unable to traverse the river system and we may be prevented from timely delivering our salt products to our customers, which could increase costs to deliver our products and adversely impact our ability to fulfill our contracts, resulting in significant contractual penalties and loss of customers.
In addition, diesel fuel is a significant component of our transportation costs. Some of our customer contracts allow for full or partial recovery of changes in diesel fuel costs through an adjustment to the selling price. However, a significant increase in the price of diesel fuel that is not recovered through transportation costs we are able to pass through to our customers could materially increase our costs and adversely affect our financial results.
Significant transportation costs associated with certain of our products, including our salt products and certain products sold by our Plant Nutrition South America segment, limit our ability to increase our market share or serve new markets.
Strikes, other forms of work stoppage or slowdown and other union activities could disrupt our business and negatively impact our financial results.
Approximately 40% of our workforce in the U.S., Canada and the U.K. and approximately 25% of our global workforce is represented by collective bargaining agreements. Of our 13 collective bargaining agreements, four will expire in 2017, four will expire in 2018 and five will expire in 2019. Trade union membership is common in Europe and required in Brazil, where our workforce is also located. Unsuccessful contract negotiations or adverse labor relations could result in strikes, work stoppages and work slowdowns, which could disrupt our business and operations. These disruptions could negatively impact our operations, our ability to produce or sell our products and our ability to recruit and retain personnel and could result in additional costs to resolve disputes. For example, we are involved in proceedings alleging unfair labor practices at our Cote Blanche, Louisiana, mine, arising out of a labor dispute between us and the United Steelworkers Union over the terms of a contract for certain employees at the mine (described in Note 12 of our Consolidated Financial Statements). We have recorded a reserve in our consolidated financial statements related to expected payments required to resolve the dispute; however, the reserved amounts may not be sufficient and we may incur significant additional costs.
25 | ||
COMPASS MINERALS INTERNATIONAL, INC. | 2016 FORM 10-K | |
Our business is dependent upon highly skilled personnel, and the loss of key personnel may have a material adverse effect on our performance.
Our business is dependent on our ability to attract, develop and retain highly skilled personnel. We may not be able to attract, develop and retain the personnel necessary for the efficient operation of our business, and our inability to do so could result in decreased productivity and efficiency, higher costs, the use of less-qualified personnel and reputational harm, which may have a material adverse effect on our performance. The loss of certain key employees could damage critical customer relationships, result in the loss of vital institutional knowledge, experience and expertise, and impact our ability to successfully operate our business and execute our business strategy. We may not be able to find qualified replacements for these key positions and the integration of replacements may be disruptive to our business. In addition, the loss of our key employees who have intimate knowledge of our research and development, mining or manufacturing processes could lead to increased competition to the extent that those employees are hired by a competitor and are able to recreate our processes or share our confidential information.
Our operations depend on our rights and governmental authorizations to mine and operate our properties.
We hold numerous environmental and mineral extraction permits, water rights and other permits, licenses and approvals from governmental authorities authorizing operations at each of our facilities. A decision by a governmental agency to revoke, substantially modify, deny or delay renewal of or apply conditions to an existing permit, license or approval could have a material adverse effect on our ability to continue operations at the affected facility and result in significant costs. For example, certain indigenous groups have challenged the Canadian government’s ownership of the land under which our Goderich, Ontario, facility is operated. There can be no assurances that the Canadian government’s ownership will be upheld or that our existing mining and operating permits will not be revoked or otherwise affected. In addition, although we do not engage in fracking, laws and regulations targeting fracking could lead to increased permit requirements and compliance costs for non-fracking operations, including our salt operations, which require permitted wastewater disposal wells.
Furthermore, many of our facilities are located on land leased from governmental authorities or third parties. Our leases generally require us to continue mining in order to retain the lease, the loss of which could have a material adverse effect on our ability to continue operations at the affected facility and result in significant costs. In some instances, we have received access rights or easements from third parties which allow for a more efficient operation than would exist without the access or easement. Loss of these access rights or easements could have a material adverse effect on us. In addition, many of our facilities are located near existing and proposed third-party industrial operations that could affect our ability to fully extract, or the manner in which we extract, the mineral deposits to which we have mining rights. For example, certain neighboring operations or land uses may require setbacks that could prevent us from mining portions of our mineral reserves or using certain mining methods.
Expansion of our operations or production capacity, or preservation of existing rights in some cases, is also predicated upon securing any necessary permits, licenses and approvals. For example, we may require additional permits, licenses and approvals to continue diverting water from the Great Salt Lake based on lake conditions. We may not be granted the necessary permits, licenses and approvals. A decision by a governmental agency to deny, delay issuing or apply conditions to any new permits, licenses and approvals could adversely affect our ability to operate and the results of our operations.
We may not be able to expand our business through acquisitions, and acquisitions may not perform as expected, we may not successfully integrate acquired businesses and anticipated benefits may not be realized.
Our business strategy includes supplementing organic growth with acquisitions of complementary businesses. We may not have acquisition opportunities because we may not identify suitable businesses to acquire, we compete with other potential buyers, we may not have or be able to obtain suitable financing for an acquisition and we may be hindered by competition and regulatory laws. If we cannot make acquisitions, our business growth may be limited.
Acquisitions of new businesses, including our recently completed Produquímica acquisition, may not perform as expected, may not positively impact our financial performance and could increase our debt obligations. Acquisitions involve significant risks and uncertainties, including diversion of management attention, greater than expected liabilities and expenses, inadequate return of capital and unidentified issues not discovered in our due diligence.
Our ability to realize benefits from our recent Produquímica acquisition depends on several factors, including the growth and health of the Brazilian and international agribusiness industry, our ability to innovate and develop new products, the continued demand for innovative specialty essential nutritional supplement products and successful geographical expansion inside and outside Brazil. We may not successfully implement our proposed business strategies, which could cause a material adverse effect on our business, financial condition and results of operations.
The success of any acquisition, including our Produquímica acquisition, will also depend on our ability to successfully combine and integrate the acquired business. We may fail to integrate acquired businesses in a timely and efficient manner. The integration process could result in the loss of key employees, higher than expected costs, ongoing diversion of management attention from other strategic opportunities or operational matters, the disruption of our ongoing businesses or increased risk that our internal controls are found to be ineffective.
26 | ||
COMPASS MINERALS INTERNATIONAL, INC. | 2016 FORM 10-K | |
Compliance with foreign and U.S. laws and regulations applicable to our international operations, including the Foreign Corrupt Practices Act (the “FCPA”) and other applicable anti-corruption and anti-competition laws, may increase the cost of doing business in international jurisdictions.
Various laws and regulations associated with our international operations are complex and increase our cost of doing business. These laws and regulations include but are not limited to import and export requirements, anti-competition regulations, and anti-corruption laws such as the FCPA, the Brazilian Clean Companies Act and the U.K. Bribery Act. We cannot predict how these laws or their interpretation, administration and enforcement will change over time. There can be no assurance that our employees, contractors and agents will not take actions in violation of these laws. Any such violations could subject us to civil or criminal penalties, including fines or prohibitions on our ability to offer our products in one or more countries, debarment from government contracts (and termination of existing contracts) and could also materially damage our reputation, brand, international expansion efforts, business and operating results. In addition, changes to the trade or anti-competition laws that could affect our operating practices or impose liability on us in a manner that could materially adversely affect our business, financial condition and results of operations.
We are subject to EHS laws and regulations which could become more stringent and adversely affect our business.
Our operations are subject to an evolving set of international, national, federal, foreign state, provincial and local EHS laws and regulations. New or proposed EHS regulatory programs, as well as future interpretations and enforcement of existing EHS laws and regulations, may require modification to our facilities, substantial increases in equipment and operating costs or interruptions, modifications or a termination of operations, which may involve significant capital costs or increases in operating costs.
For example, governmental initiatives to limit greenhouse gas emissions under consideration and future initiatives could, if adopted, restrict our operations and require us to make capital expenditures to improve our facilities. We are also impacted by the Clean Air Act and other EHS laws and regulations that regulate air emissions. These regulatory programs may require us to install expensive emissions abatement equipment, modify our operational practices, obtain additional permits or make other expenditures. Our Ogden, Utah, facility is located in an area expected to be of continued focus by the Utah Air Quality Board with respect certain air emissions under the Clean Air Act.
In addition, if new Clean Water Act regulations are adopted or increased compliance obligations are imposed on existing regulations, we could be adversely affected. For example, a significant portion of our salt products are distributed through salt depots owned and operated by third parties. If these depots are required to adopt more stringent stormwater management practices or are subject to increased compliance requirements under existing Clean Water Act regulations, these depots may pass on any increased costs to us, exit the depot business (requiring us to find new depot partners or establish Company-owned depots) or otherwise cause an adverse impact to our ability to deliver salt to our customers. See “Environmental, Health and Safety Matters” in Item 1 of this Annual Report for more information about EHS laws and regulations affecting us and their potential impact on us.
We could incur significant environmental liabilities with respect to our current, future or former facilities, adjacent or nearby third-party facilities or off-site disposal locations.
Risks of environmental liabilities is inherent in our current and former operations. At many of our past and present facilities, releases and disposal of regulated substances has occurred and could occur in the future, which could require us to investigate, undertake or pay for remediation activities under the CERCLA and other similar EHS laws and regulations. The use, handling, disposal and remediation of hazardous substances currently or formerly used by us, or the liabilities arising from past releases of, or exposure to, hazardous substances, may result in future expenditures that could materially and adversely affect our financial results, cash flows or financial condition. Our facilities are also subject to laws and regulations which require us to monitor and detect potential environmental hazards and damages. Our procedures and controls may not be sufficient to timely identify and protect against potential environmental damages and related costs.
We record accruals for contingent environmental liabilities when we believe it is probable that we will be responsible, in whole or in part, for environmental investigation or remediation activities and the expenditures for these activities are reasonably estimable. For example, we have ongoing investigation and remediation activities at our Kenosha, Wisconsin, plant, which are described in Note 12 of our Consolidated Financial Statements. However, the extent and costs of any environmental investigation or remediation activities are inherently uncertain and difficult to estimate and could exceed our expectations, which could materially affect our financial condition and operating results.
Additionally, we previously sold a portion of our U.K. salt mine to a subsidiary of Veolia, which operates a waste management business. The Veolia business, under governmental permits, is allowed to securely dispose certain hazardous waste at the property they own and pays us fees for engaging in this activity. We could incur future expenditures to address risks related to this hazardous waste disposal or to remediate any contamination. See “Environmental, Health and Safety Matters” in Item 1 of this Annual Report for more information about CERCLA and other EHS laws and regulations affecting us and their potential impact on us.
27 | ||
COMPASS MINERALS INTERNATIONAL, INC. | 2016 FORM 10-K | |
If our computer systems and information technology are compromised, our ability to conduct our business will be adversely impacted.
We rely on computer systems and information technology to conduct our business, including cash management, order entry, vendor payments, employee salaries and recordkeeping, inventory and asset management, shipping of products, and communication with employees and customers. We also use our systems to analyze and communicate our operating results and other data to internal and external recipients. In 2017, we expect to implement a comprehensive update to our enterprise resource planning system that impacts substantially all of our key processes. Any implementation issues could have adverse effects on our ability to properly capture, process and report financial transactions, distribute our products and invoice and collect from our customers and lead to increased expenditures. While we have taken steps to ensure the security of our information technology systems, we may be susceptible to cyber-attacks, computer viruses and other technological disruptions. A material failure or interruption of access to our computer systems for an extended period of time or the loss of confidential or proprietary data could adversely affect our operations and regulatory compliance. While we have mitigation and data recovery plans in place, it is possible that significant capital investment and time may be required to correct any of these issues. The additional capital investment needed to prevent or correct any of these issues may negatively impact our business, financial condition and results of operations.
Our intellectual property may be misappropriated or subject to claims of infringement.
We consider our intellectual property rights, including patents, trademarks and trade secrets, to be a valuable aspect of our business. We attempt to protect our intellectual property rights primarily through a combination of patent, trademark and trade secret protection. Our patents, which vary in duration, may not preclude others from selling competitive products or using similar production processes. We cannot provide assurances that pending applications for protection of our intellectual property rights will be approved. Our trademark registrations may not prevent our competitors from using similar brand names. We also rely on trade secret protection to guard confidential unpatented technology, and when appropriate, we require that employees and third-party consultants or advisors enter into confidentiality agreements. These agreements may not provide meaningful protection for our trade secrets, know-how or other proprietary information in the event of any unauthorized use, misappropriation or disclosure. It is possible that our competitors could independently develop the same or similar technology or otherwise obtain access to our unpatented technology.
Many of our brand names are registered as trademarks in the U.S. and foreign countries. The laws in certain foreign countries in which we do business do not protect intellectual property rights to the same extent as U.S. law. As a result, these factors could weaken our competitive advantage with respect to our products, services and brands in foreign jurisdictions, which could adversely affect our financial performance.
Our intellectual property rights may not be upheld if challenged. Such claims, if proven, could materially and adversely affect our business and may lead to the impairment of the amounts recorded for goodwill and other intangible assets. If we are unable to maintain the proprietary nature of our technologies, we may lose any competitive advantage provided by our intellectual property. In addition, although any such claims may ultimately prove to be without merit, the necessary management attention to and legal costs associated with defending our intellectual property rights could be significant.
We may be adversely affected by changes in industry standards and regulatory requirements.
Our global business is subject to the requirements of federal, state, local and foreign law, regulations and regulatory authorities as well as industry standard-setting authorities. Changes in the standards and requirements imposed by these laws, regulations and authorities could negatively affect our ability to serve our customers and our business. In the event that we are unable to meet any new or modified standards when adopted, our business could be adversely affected.
For example, if significant import duties were imposed on the salt we import into the U.S. from our Goderich mine or if we were unable to include the transfer price of such salt in the cost of goods sold, our financial condition and operating results would be materially adversely affected. In addition, failure to comply with applicable laws and regulations could preclude us from conducting business with governmental entities and lead to penalties, injunctions, civil remedies or fines.
We may face significant product liability claims and product recalls, which could harm our business and reputation.
We face exposure to product liability and other claims if our products cause harm, are alleged to have caused harm or have the potential to cause harm to consumers. In addition, our products or products manufactured by our customers using our products could be subject to a product recall as a result of product contamination, our failure to meet product specifications or other causes. For example, our customers use our food-grade salt products in food items they produce, such as cheese and bread, which could be subject to a product recall if our products are contaminated or adulterated. Similarly, the use and application of our animal feed and plant nutrition products could result in a product recall if it were alleged that they were contaminated. Additionally, our water treatment chemicals are sold to state and municipal entities and other customers, and could result in contaminants entering waterways and the public water system.
A product recall could result in significant losses due to the costs of a recall, the destruction of product inventory and production delays to identify the underlying cause of the recall. We could be held liable for costs related to our customers’ product recall if our products cause the recall or other product liability claims if our products cause harm to our customers. Additionally, a significant
28 | ||
COMPASS MINERALS INTERNATIONAL, INC. | 2016 FORM 10-K | |
product liability case, product recall or failure to meet products specifications could result in adverse publicity, harm to our brand and reputation and significant costs, which could have a material adverse effect on our business and financial performance.
We may be negatively impacted if we are unable to obtain required product registrations or if we face increased regulatory requirements.
Globally, there are directives, laws and regulations that require registration of our products before they can be sold, impose labeling requirements and require our products to be manufactured to certain specifications. Each country, state and province appoints regulatory agencies responsible for these requirements, and many of our products must be registered with these regulatory agencies. A decision to deny the registration of a new product or to delay, revoke or modify an existing product registration may have a material adverse effect on us and could impede our ability to implement our business strategies. In addition, regulatory and labeling requirements could increase, which could require increased expenditures. For example, many regulatory agencies continue to evaluate potential health and environmental impacts that could arise from the handling and use of new and existing plant nutrition products. These evaluations or other developments could result in additional regulatory requirements for plant nutrition producers, including us, or for our customers, and could negatively impact the demand for our products.
ITEM 1B. | UNRESOLVED STAFF COMMENTS |
None.
ITEM 2. | PROPERTIES |
Information regarding our plants and properties is included in Item 1, “Business,” of this report.
ITEM 3. | LEGAL PROCEEDINGS |
We are involved in the legal proceedings described in Note 12 to our Consolidated Financial Statements and, from time to time, various routine legal proceedings and claims arising from the ordinary course of our business. These primarily involve tax assessments, disputes with former employees and contract labor, commercial claims, product liability claims, personal injury claims and workers’ compensation claims. Management cannot predict the outcome of legal proceedings and claims with certainty. Nevertheless, management believes that the outcome of legal proceedings and claims, which are pending or known to be threatened, even if determined adversely, will not, either individually or in the aggregate, have a material adverse effect on our results of operations, cash flows or financial condition.
ITEM 4. | MINE SAFETY DISCLOSURES |
Information concerning mine safety violations or other regulatory matters required by Section 1503(a) of the Dodd-Frank Wall Street Reform and Consumer Protection Act and Item 104 of Regulation S-K is included in Exhibit 95 to this report.
Executive Officers of the Registrant
The following table sets forth the name and position of each person who is an executive officer as of December 31, 2016, and as of the date of the filing of this report. The table set forth each person’s age as of the date of the filing of this report.
Name | Age | Position | ||
Francis J. Malecha | 52 | President, Chief Executive Officer and Director | ||
John D. Craft | 54 | Interim Chief Financial Officer | ||
Steven N. Berger | 51 | Senior Vice President, Corporate Services | ||
S. Bradley Griffith | 49 | Senior Vice President, Plant Nutrition | ||
Jack C. Leunig | 63 | Senior Vice President, Operations | ||
Anthony J. Sepich | 46 | Senior Vice President, Salt | ||
Diana C. Toman | 38 | Senior Vice President, General Counsel and Corporate Secretary | ||
Francis J. Malecha, President and Chief Executive Officer, joined Compass Minerals and assumed his current position in January 2013. Mr. Malecha has also served as a member of the Company’s board of directors since January 2013. He came to Compass Minerals with more than 25 years of experience in agribusiness. From 2000 to 2013, Mr. Malecha worked at Viterra Inc., a global agribusiness company. Viterra was acquired by Glencore International plc in December 2012, at which time Mr. Malecha was named Head of Agricultural Products, North America. He served as Chief Operating Officer-Grain from 2007 to 2012 and
29 | ||
COMPASS MINERALS INTERNATIONAL, INC. | 2016 FORM 10-K | |
served as Senior Vice President-Grain and Vice President-Grain Merchandising & Transportation from 2000 to 2007. Prior to Viterra, Mr. Malecha spent 15 years working in the grain division of General Mills, Inc.
John D. Craft, Interim Chief Financial Officer, joined Compass Minerals in March 2015 and assumed his current position in November 2016. Prior to assuming his current position, Mr. Craft served as the Company’s Vice President and Corporate Controller from May 2015 to November 2016 and Vice President of Internal Audit and Compliance from March 2015 to May 2015. Prior to joining the Company, from August 2011, he worked as Chief Financial Officer for Delphi Connection Systems, Americas at Delphi Automotive plc, an automotive parts manufacturer, and as Vice President, Business Group Controller at FCI Corporation, a global connector manufacturing company, in a division acquired by Delphi Automotive in 2012. He previously served as Senior Vice President, Global Financial Controller at D&M Holdings, Inc. and was with Ford Motor Company for 20 years, where he held numerous finance and accounting positions with increasing responsibility.
Steven N. Berger, Senior Vice President, Corporate Services, joined Compass Minerals in March 2013 and assumed his current position in June 2013. Prior to his current position, Mr. Berger served as the Company’s Vice President, Human Resources. From 2008 to March 2013, Mr. Berger was at Viterra Inc., a global agribusiness company based in Canada, where he was responsible for human resources and other corporate functions. In prior roles, he served as a Senior Executive at Accenture and a Principal at A.T. Kearney.
S. Bradley Griffith, Senior Vice President, Plant Nutrition, joined Compass Minerals and assumed his current position in August 2016. Before joining Compass Minerals, Mr. Griffith spent eight years at Monsanto Company, a global provider of agricultural products. While at Monsanto, he held various positions, including Vice President, Global Strategic Accounts, Vice President, Global Microbials and Vice President, Western Business Unit (USA Row Crops). Prior to Monsanto, Mr. Griffith held a number of pharmaceutical and medical sales roles, most recently at Sanofi.
Jack C. Leunig, Senior Vice President, Operations, joined Compass Minerals in 2008 and assumed his current role in June 2013. Mr. Leunig joined the Company as Vice President, Manufacturing and Engineering. From 2004 to 2008, he was with Johns Manville, where his last role was Vice President of Operations for its building products division. Previously, Mr. Leunig held manufacturing and supply chain leadership roles with Great Lakes Chemical, Allied-Signal/Honeywell International and General Electric.
Anthony J. Sepich, Senior Vice President, Salt, joined Compass Minerals and assumed his current role in November 2016. Mr. Sepich joined Compass Minerals from Archer Daniels Midland Company (“ADM”), one of the world’s largest agricultural processors, where he most recently served as President of ADM Corn Europe. He joined ADM in 1997 and served in a number of capacities, primarily in ADM’s cocoa division, where he held positions in risk management and sales, including Vice President of Sales.
Diana C. Toman, Senior Vice President, General Counsel and Corporate Secretary, joined Compass Minerals and assumed her current role in November 2015. From 2010 to 2015, Ms. Toman worked at General Cable Corporation, a global wire and cable manufacturing company, most recently as Vice President, Strategy and General Counsel, Asia Pacific and Africa based in Thailand. Ms. Toman served as legal counsel with increasing levels of responsibility at Gardner Denver, Inc. from 2006 to 2010 and Waddell & Reed Financial, Inc. from 2003 to 2006. She began her career as an attorney with the law firm of Levy & Craig, P.C.
30 | ||
COMPASS MINERALS INTERNATIONAL, INC. | 2016 FORM 10-K | |
PART II
ITEM 5. | MARKET FOR THE REGISTRANT’S COMMON EQUITY, RELATED STOCKHOLDER MATTERS AND ISSUER PURCHASES OF EQUITY SECURITIES |
PRICE RANGE OF COMMON STOCK
Our common stock, $0.01 par value, trades on the New York Stock Exchange under the symbol CMP. The following chart sets forth the high and low closing prices per share for the four quarters ended December 31, 2016, and 2015.
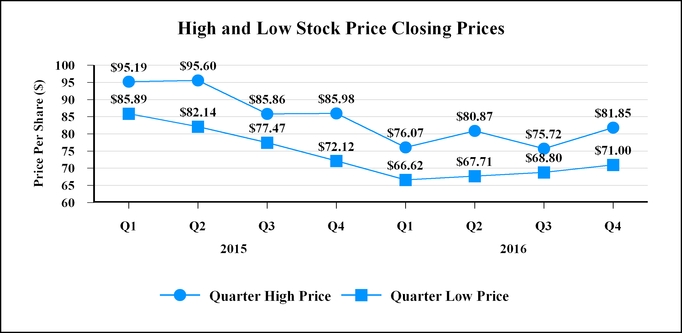
HOLDERS
On February 24, 2017, the number of holders of record of our common stock was 101.
DIVIDEND POLICY
We intend to pay quarterly cash dividends on our common stock. The declaration and payment of future dividends to holders of our common stock will be at the discretion of our board of directors and will depend upon many factors, including our financial condition, earnings, legal requirements, restrictions in our debt agreements and other factors our board of directors deems relevant. See Item 1A., “Risk Factors – We may be restricted from paying cash dividends on our common stock in the future.”
The Company paid quarterly dividends totaling $2.78 and $2.64 per share in 2016 and 2015, respectively. On February 2, 2017, our board of directors declared a quarterly cash dividend of $0.72 per share on our outstanding common stock, an increase of 3.6% from the quarterly cash dividends paid in 2016 of $0.695 per share. The dividend will be paid on March 15, 2017, to stockholders of record as of the close of business on March 1, 2017.
31 | ||
COMPASS MINERALS INTERNATIONAL, INC. | 2016 FORM 10-K | |
EQUITY COMPENSATION PLAN INFORMATION
The following table sets forth information at December 31, 2016, concerning our common stock authorized for issuance under our equity compensation plans:
Plan category | Number of shares to be issued upon exercise of outstanding securities | Weighted-average exercise price of outstanding securities | Number of securities available for issuance under plan | |||||
Equity compensation plans approved by shareholders | ||||||||
Stock options | 442,755 | $ | 80.07 | |||||
Restricted stock units | 63,780 | N/A | ||||||
Performance stock units | 89,011 | N/A | ||||||
Deferred stock units | 69,172 | N/A | ||||||
Total securities under approved plans(a) | 664,718 | 2,642,543 | ||||||
Equity compensation plans not approved by shareholders(b): | ||||||||
Deferred stock units | 17,775 | N/A | ||||||
Total | 682,493 | 2,642,543 | ||||||
(a) In 2015, shareholders approved the 2015 Incentive Award Plan. No new awards will be made under the 2005 Incentive Award Plan subsequent to the approval of the 2015 Incentive Award Plan.
(b) Prior to 2008, non-employee directors were issued common stock and deferred stock units in connection with their service as a director under the 2004 Directors Deferred Share Plan. In 2008, we began issuing non-employees director shares of common stock and deferred stock units under equity plans approved by shareholders. No new awards will be granted under the 2004 Directors Deferred Share Plan.
32 | ||
COMPASS MINERALS INTERNATIONAL, INC. | 2016 FORM 10-K | |
ITEM 6. | SELECTED FINANCIAL DATA |
The information included in the following table should be read in conjunction with “Item 7 – Management’s Discussion and Analysis of Financial Condition and Results of Operations” and the Consolidated Financial Statements and accompanying Notes thereto included elsewhere in this report.
For the Year Ended December 31, | ||||||||||||||||||||
(Dollars in millions, except share data) | 2016 | 2015 | 2014 | 2013 | 2012 | |||||||||||||||
Statement of Operations Data: | ||||||||||||||||||||
Sales | $ | 1,138.0 | $ | 1,098.7 | $ | 1,282.5 | $ | 1,129.6 | $ | 941.9 | ||||||||||
Shipping and handling cost | 244.9 | 261.5 | 337.7 | 301.7 | 238.1 | |||||||||||||||
Product cost(a),(c) | 509.4 | 433.1 | 449.1 | 471.5 | 414.7 | |||||||||||||||
Depreciation, depletion and amortization(b) | 90.3 | 78.3 | 78.0 | 73.0 | 64.5 | |||||||||||||||
Selling, general and administrative expenses | 124.9 | 108.7 | 110.4 | 100.4 | 93.9 | |||||||||||||||
Operating earnings(c) | 174.6 | 221.4 | 311.0 | 185.6 | 133.2 | |||||||||||||||
Interest expense | 34.1 | 21.5 | 20.1 | 17.9 | 18.2 | |||||||||||||||
Net earnings from continuing operations(c) | 162.7 | 159.2 | 217.9 | 130.8 | 88.9 | |||||||||||||||
Net earnings available for common stock(c) | 161.9 | 158.2 | 216.4 | 129.8 | 87.8 | |||||||||||||||
Share Data: | ||||||||||||||||||||
Weighted-average common shares outstanding (in thousands): | ||||||||||||||||||||
Basic | 33,776 | 33,677 | 33,557 | 33,403 | 33,109 | |||||||||||||||
Diluted | 33,780 | 33,692 | 33,581 | 33,420 | 33,135 | |||||||||||||||
Net earnings from continuing operations per share: | ||||||||||||||||||||
Basic | $ | 4.79 | $ | 4.70 | $ | 6.45 | $ | 3.89 | $ | 2.65 | ||||||||||
Diluted | 4.79 | 4.69 | 6.44 | 3.88 | 2.65 | |||||||||||||||
Cash dividends declared per share | 2.78 | 2.64 | 2.40 | 2.18 | 1.98 | |||||||||||||||
Balance Sheet Data (at year end): | ||||||||||||||||||||
Total cash and cash equivalents | $ | 77.4 | $ | 58.4 | $ | 266.8 | $ | 159.6 | $ | 100.1 | ||||||||||
Total assets(d) | 2,466.5 | 1,624.8 | 1,632.2 | 1,401.7 | 1,296.9 | |||||||||||||||
Total debt(d) | 1,325.0 | 722.9 | 621.4 | 475.5 | 478.6 | |||||||||||||||
Other Financial Data: | ||||||||||||||||||||
Ratio of earnings to fixed charges(e) | 5.73x | 9.04x | 13.51x | 9.22x | 5.95x | |||||||||||||||
(a) | “Product cost” is presented exclusive of depreciation, depletion and amortization. |
(b) | Depreciation, depletion and amortization include amounts also included in selling, general and administrative expenses. |
(c) | In the fourth quarter of 2016, we recognized a gain of $59.3 million related to the remeasurement of our previously held equity investment in Produquímica (see Note 3 to our Consolidated Financial Statements). In the third quarter of 2014, we recognized a gain of $83.3 million ($60.6 million, net of taxes) from an insurance settlement relating to damage sustained as a result of a tornado that struck our rock salt mine and evaporation plant in Goderich, Ontario, in 2011. We recognized $82.3 million of the gain in product cost and $1.0 million of the gain in selling, general and administrative expenses in the Consolidated Statements of Operations. In the fourth quarter of 2013, we recognized a gain of $9 million ($5.7 million, net of taxes) from the settlement of an insurance claim resulting from a loss of mineral-concentrated brine due to an asset failure at our solar evaporation ponds in 2010 and a charge of $4.7 million ($2.8 million, net of taxes) from a ruling against us related to a labor matter. In 2012, our product cost, operating earnings and net earnings were impacted by the effects of a tornado in Goderich, Ontario, that occurred in August 2011. |
(d) | In 2016, we adopted guidance which requires the presentation of debt issuance costs as a reduction to debt rather than in assets. Prior years have been adjusted to reflect this change. |
(e) | For the purposes of computing the ratio of earnings to fixed charges, earnings consist of earnings from continuing operations before income taxes and fixed charges. Fixed charges consist of interest expense, including the amortization of deferred debt issuance costs and the interest component of our operating rents. |
33 | ||
COMPASS MINERALS INTERNATIONAL, INC. | 2016 FORM 10-K | |
ITEM 7. | MANAGEMENT’S DISCUSSION AND ANALYSIS OF FINANCIAL CONDITION AND RESULTS OF OPERATIONS |
The statements in this discussion regarding the industry outlook, our expectations for the future performance of our business, and the other non-historical statements in this discussion are forward-looking statements. These forward-looking statements are subject to numerous risks and uncertainties, including, but not limited to, the risks and uncertainties described in Item 1A., “Risk Factors.” You should read the following discussion together with Item 1A., “Risk Factors” and the Consolidated Financial Statements and Notes thereto included elsewhere in this report.
COMPANY OVERVIEW
Compass Minerals is a leading provider of essential minerals that solve nature’s challenges, including salt for winter roadway safety and other consumer, industrial and agricultural uses; specialty plant nutrition minerals that improve the quality and yield of crops; and specialty chemicals for water treatment and other industrial processes. As of December 31, 2016, we operated 22 production and packaging facilities, including:
• | The largest rock salt mine in the world in Goderich, Ontario, Canada; |
• | The largest dedicated rock salt mine in the U.K. in Winsford, Cheshire; |
• | A solar evaporation facility located in Ogden, Utah, which is both the largest SOP specialty fertilizer production site and the largest solar salt production site in the Western Hemisphere; |
• | Several mechanical evaporation facilities producing consumer and industrial salt; and |
• | Multiple facilities producing essential agricultural nutrients and specialty chemicals in Brazil. |
Our salt business provides highway deicing salt to customers in North America and the U.K. as well as consumer deicing and water conditioning products, ingredients used in consumer and commercial food preparation, and other salt-based products for consumer, agricultural and industrial applications in North America. In the U.K., we operate a records management business utilizing excavated areas of our Winsford salt mine with one other surface location in London, England.
Our plant nutrition business produces and markets specialty plant nutrition products to distributors and retailers of crop inputs, as well as growers worldwide. Our principal plant nutrition product in North America is SOP which we market under the trade name Protassium+. We also sell various premium micronutrient products under our Wolf Trax brand. We have renamed this segment Plant Nutrition North America (formerly Plant Nutrition).
In October 2016, we significantly expanded our plant nutrition business with the acquisition of Produquímica, which now constitutes our new Plant Nutrition South America segment. This segment operates two primary businesses in Brazil - agricultural productivity, which manufactures and distributes a broad offering of specialty plant nutrition solution-based products, and chemical solutions, which manufactures and markets specialty chemicals, primarily for the chemical and industrial markets and for use in water treatment industry. See Note 3 to our Consolidated Financial Statements for a further discussion of this acquisition. Our new Plant Nutrition South America segment represents the results of the acquired business.
We focus on building intrinsic value by growing our earnings before interest, taxes, depreciation and amortization (“EBITDA”) and by improving our asset quality. We can employ our operating cash flow and other sources of liquidity to pay dividends, re-invest in our business, pay down debt and make acquisitions.
Consolidated Results of Operations
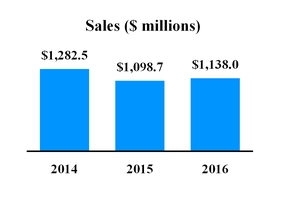
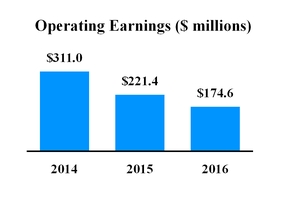
34 | ||
COMPASS MINERALS INTERNATIONAL, INC. | 2016 FORM 10-K | |
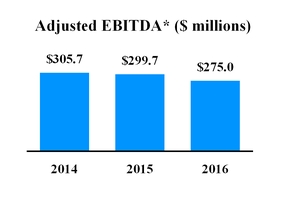
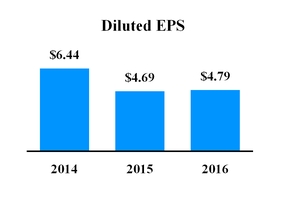
* Refer to “—Sensitivity Analysis Related to EBITDA and Adjusted EBITDA” for a reconciliation to the most directly comparable GAAP financial measure and the reasons we use this non-GAAP measure.
CONSOLIDATED RESULTS COMMENTARY: 2015 – 2016
• | Completed the acquisition of Produquímica, a leading Brazilian specialty plant nutrition company, in October 2016. |
• | Total sales for 2016 were $1,138.0 million, an increase of 4% from 2015, due to the contribution from the recent acquisition of Produquímica, which was partially offset by continued weakness in the North American agriculture market and lower salt segment selling prices. |
• | Operating earnings of $174.6 million decreased 21% from 2015 results due to lower operating earnings in Salt and Plant Nutrition North America segments. |
• | Net earnings were $162.7 million in 2016, a 2% increase from 2015. Net earnings in 2016 were positively impacted by a $59.3 million gain on the remeasurement of our previously held equity investment in Produquímica, which was mostly offset by lower earnings in our Salt and Plant Nutrition North America segments. |
• | EBITDA adjusted for items management believes are not indicative of our ongoing operating performance (“Adjusted EBITDA”) was $275.0 million, an 8% decrease from 2015 Adjusted EBITDA of $299.7 million. |
• | Diluted earnings per share of $4.79 increased by 2% from 2015 diluted earnings per share. Diluted earnings per share in 2016 was positively impacted by the $59.3 million remeasurement gain. |
CONSOLIDATED RESULTS COMMENTARY: 2014 – 2015
• | Total sales for 2015 were $1,098.7 million, a decrease of 14% from 2014, largely due to mild winter weather in the fourth quarter of 2015 and the weak agriculture market. |
• | Operating earnings of $221.4 million decreased 29% from 2014 primarily due to the $82.3 million gain included in 2014 results related to the tornado that hit our facilities in Goderich, Ontario, in 2011. |
• | Net earnings were $159.2 million in 2015, a 27% decrease from 2014. Net earnings in 2014 of $217.9 million were positively impacted by an insurance settlement of $60.6 million (net of tax) related to the tornado. |
• | Adjusted EBITDA was $299.7 million, a 2% decrease from 2014 Adjusted EBITDA of $305.7 million. |
• | Product cost of 46% of sales in 2015 increased from the product cost of 41% in 2014. The 2014 product cost was favorably impacted due to a gain of approximately $82.3 million from the aforementioned settlement. |
• | Diluted earnings per share of $4.69 decreased by 27% from 2014 diluted earnings per share. |
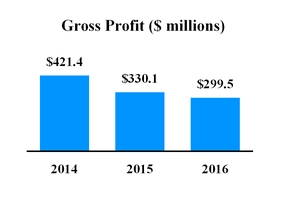
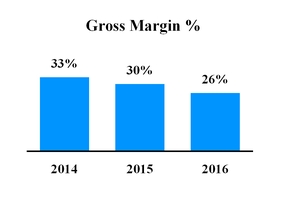
35 | ||
COMPASS MINERALS INTERNATIONAL, INC. | 2016 FORM 10-K | |
GROSS PROFIT & GROSS MARGIN COMMENTARY: 2015 – 2016
Gross Profit: Decreased $30.6 million or 9%; Gross Margin decreased 4 percentage points from 30% to 26%
• | Salt gross profit decreased by $17 million due primarily to reduced salt average selling prices and higher per-unit production costs resulting from lower operating rates at our mines and unplanned downtime at our Goderich mine. |
• | The decrease in salt gross profit was primarily due to a $37 million decrease in salt sales partially offset by approximately $25 million of lower logistics costs due to lower fuel rates and improved geographic mix. |
• | The plant nutrition business, on a combined basis, contributed approximately $11 million to the decrease in gross profit primarily due to lower average sales prices realized in our Plant Nutrition North America segment and a partial write-down of $3.1 million of a Wolf Trax trade name acquired in 2014 partially offset by the positive impact of the results from Produquímica due to the acquisition in October 2016. |
• | In addition, Plant Nutrition North America experienced an 11% increase in per-unit shipping and handling costs due to higher warehousing costs and unfavorable geographic sales mix. |
GROSS PROFIT & GROSS MARGIN COMMENTARY: 2014 – 2015
Gross Profit: Decreased $91.3 million or 22%; Gross Margin decreased 3 percentage points from 33% to 30%
• | Approximately $83 million of the decrease in gross profit was due to the gain recognized in the Salt segment in 2014 from the settlement of the insurance claim related to the tornado in Goderich, Ontario, in 2011. |
• | Unfavorable exchange rate contributed approximately $7 million to the decrease in Salt gross profit. |
• | Salt gross profit was unfavorably impacted by lower sales volume for highway and consumer and industrial deicing products which were offset partially by higher realized average salt sales prices. |
• | Lower gross profit for Plant Nutrition North America contributed approximately $15 million to the decrease in gross profit primarily due to lower sales volumes. |
• | Gross profit for Plant Nutrition North America was unfavorably impacted by lower Plant Nutrition North America sales volumes and an increase in per-unit production costs. Per-unit production costs increased as we purchased and consumed KCl and other potassium mineral feedstock to supplement production due to the poor 2014 evaporation season. |
• | The decrease in Plant Nutrition North America gross profit was partially offset by higher realized average sales prices. |
OTHER EXPENSES AND INCOME COMMENTARY: 2015 – 2016
SG&A: Increased $16.2 million or 15%; Increased to 11.0% from 9.9% as a percentage of sales
• | The increase in expense was due to the inclusion of Produquímica’s results since the October 2016 acquisition date and higher expenses in our Plant Nutrition North America segment due to the partial impairment of our Wolf Trax trade name and corporate severance costs related to the restructuring of our business. |
• | This increase was partially offset by a decrease of $2.0 million in corporate professional services and a decrease of $1.8 million in marketing expenses in our Plant Nutrition North America and Salt segments. |
Interest Expense: Increased $12.6 million to $34.1 million
• | The increase was primarily due to our higher aggregate debt level driven by the acquisition of Produquímica, which was partially offset by lower interest rates due to the refinancing of our term loans and revolving credit facility in April 2016. |
Gain from Remeasurement of Equity Method Investment: $59.3 million
• | We recognized a gain of $59.3 million related to our previously held equity investment in Produquímica, which was remeasured to fair value upon our full acquisition of the business in October 2016. |
Other (Income) Expense, Net: Decreased from income of $14.6 million in 2015 to expense of $1.1 million
• | The decrease was primarily due to foreign exchange gains of $13.9 million in 2015 compared to losses of $0.1 million in 2016 and $3.0 million of expenses related to our debt financing. |
Income Tax Expense: Decreased $20.7 million to $34.6 million
• | Income tax expense decreased in 2016 due to lower pre-tax income after excluding the non-taxable gain recognized in 2016 from the remeasurement of our previously held equity investment in Produquímica. |
• | Our income tax provision in both periods differs from the U.S. statutory rate primarily due to U.S. statutory depletion, domestic manufacturing deductions, state income taxes, foreign income, mining and withholding taxes and interest expense recognition differences for tax and financial reporting purposes. |
• | Our effective tax rate was 18% in 2016 and 26% in 2015. Our effective tax rate decreased in 2016 as a result of a nontaxable gain of $59.3 million from the remeasurement of our previously held equity investment in Produquímica. |
36 | ||
COMPASS MINERALS INTERNATIONAL, INC. | 2016 FORM 10-K | |
OTHER EXPENSES AND INCOME COMMENTARY: 2014 – 2015
SG&A: Decreased $1.7 million or 2%; Increased to 9.9% from 8.6% as a percentage of sales
• | The decrease in expense was due to lower professional services expenses in both segments, which totaled approximately $2.8 million in comparison to the prior year. |
• | SG&A in 2015 was also impacted by lower incentive compensation in both segments and corporate and other, which totaled approximately $2.2 million. |
• | The decrease was partially offset by an increase in in corporate and other costs related to information technology and ongoing costs related to our Wolf Trax business in our Plant Nutrition North America segment. |
Interest Expense: Increased $1.4 million to $21.5 million
• | The increase was primarily due to the refinancing in June 2014 of our $100.0 million 8% Senior Notes due 2019 (our “8% Notes”) with $250.0 million of our 4.875% Senior Notes due 2024 (our “4.875% Notes”). |
Other Income, Net: Increased $13.7 million to $14.6 million
• | Net foreign exchange gains increased from $6.6 million in 2014 to $13.9 million in 2015 and contributed to the year over year improvement. |
• | The increase was due in part to a $6.9 million charge relating to the refinancing in June 2014 of our 8% Notes. |
Income Tax Expense: Decreased $18.6 million to $55.3 million
• | Decrease was primarily due to lower pre-tax income. |
• | Our income tax provision in both periods differs from the U.S. statutory rate primarily due to U.S. statutory depletion, domestic manufacturing deductions, state income taxes, foreign income, mining and withholding taxes and interest expense recognition differences for tax and financial reporting purposes. |
• | Our effective tax rate was 26% in 2015 and 25% in 2014. |
Operating Segment Performance
The following financial results represent consolidated financial information with respect to sales from our Salt, Plant Nutrition North America and Plant Nutrition South America segments for the years ended December 31, 2016, 2015 and 2014. Additionally, we have presented our combined plant nutrition business results, which include both our Plant Nutrition North America and Plant Nutrition South America operating segments. Sales primarily include revenues from the sales of our products, or “product sales,” and the impact of shipping and handling costs incurred to deliver our salt and plant nutrition products to our customers.
The results of operations of the consolidated records management business and other incidental revenues include sales of $9.6 million, $11.3 million and $9.7 million for 2016, 2015 and 2014, respectively. These revenues are not material to our consolidated financial results and are not included in the following operating segment financial data.
SALT SEGMENT RESULTS
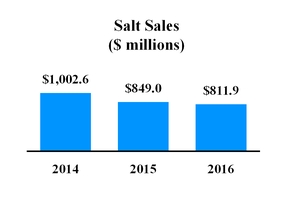
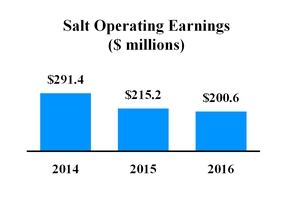
37 | ||
COMPASS MINERALS INTERNATIONAL, INC. | 2016 FORM 10-K | |
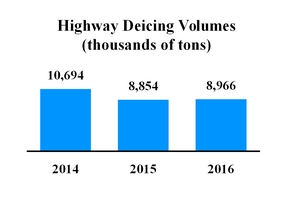
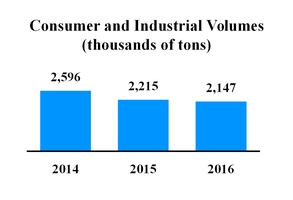
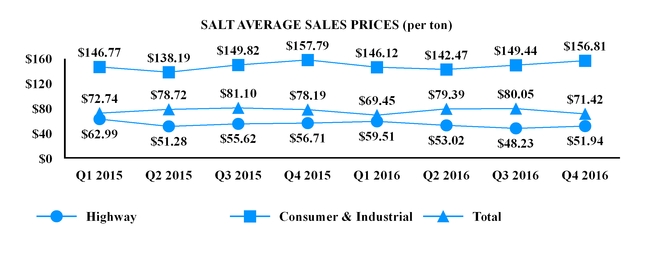
Salt Sales (in millions) | 2016 | 2015 | 2014 | |||||||||
Salt sales | $ | 811.9 | $ | 849.0 | $ | 1,002.6 | ||||||
Less: salt shipping and handling | 214.5 | 239.1 | 309.3 | |||||||||
Salt product sales | $ | 597.4 | $ | 609.9 | $ | 693.3 | ||||||
Salt Operating Earnings | $ | 200.6 | $ | 215.2 | $ | 291.4 | ||||||
Salt Sales Volumes (thousands of tons) | ||||||||||||
Highway deicing | 8,966 | 8,854 | 10,694 | |||||||||
Consumer and industrial | 2,147 | 2,215 | 2,596 | |||||||||
Total tons sold | 11,113 | 11,069 | 13,290 | |||||||||
Average Salt Sales Price (per ton) | ||||||||||||
Highway deicing | $ | 54.73 | $ | 58.62 | $ | 57.37 | ||||||
Consumer and industrial | 149.63 | 148.98 | 149.89 | |||||||||
Combined | 73.06 | 76.70 | 75.44 | |||||||||
SALT SEGMENT RESULTS COMMENTARY: 2015 – 2016
• | Salt segment sales were $811.9 million, a decrease of 4% from 2015, primarily due to lower average Salt sales prices in 2016. |
• | Salt segment volumes were essentially flat with 2015 due to higher North American highway and consumer deicing sales volumes which were partially offset by lower U.K. sales volumes. |
38 | ||
COMPASS MINERALS INTERNATIONAL, INC. | 2016 FORM 10-K | |
• | Our Salt operating results are impacted by the winter weather in the markets we serve. We assess the severity of winter weather compared to recent averages, using official government snow data and comparisons of our sales volumes to historical trends and other relevant data. Our assessment of the frequency of winter snow events in the three past winter weather seasons in the markets we serve are summarized below:(a) |
2014 | Above average in first quarter |
Below average in the fourth quarter | |
2015 | Slightly above average in the first quarter |
Significantly below average in the fourth quarter | |
2016 | Below average in the first quarter |
Above average in the fourth quarter | |
(a) The number of snow events reported may not directly correlate to our deicing results due to a variety of factors, including the relative significance to each city we serve within our market regions. The weather data should be used only as an indicator of year-to-year variations in winter weather conditions in our markets.
• | A decrease of 5% in Salt average sales prices contributed approximately $40 million to the decline in Salt sales and included unfavorable foreign currency exchange rates. |
• | Salt segment operating earnings were $200.6 million, a decrease of 7% from 2015, primarily due to lower average selling prices and higher per unit production costs. |
SALT SEGMENT RESULTS COMMENTARY: 2014 – 2015
• | Salt segment sales were $849.0 million, a decrease of 15% from 2014 primarily due to mild winter weather in the fourth quarter of 2015. |
• | Salt segment average selling price increased 2% from 2014. |
• | Salt sales volumes declined 2.2 million tons or 17% due to lower highway and consumer deicing sales volumes as a result of milder winter weather experienced in the fourth quarter of 2015 when compared to the same period in the prior year. |
• | Lower sales volumes for North American highway and consumer deicing customers contributed approximately $123 million to the decrease in Salt product sales. |
• | The decrease in North American Salt sales volumes was partially offset by higher U.K. Salt sales volumes. |
• | Unfavorable foreign currency exchange rates contributed approximately $24 million to the decrease in Salt product sales. |
• | An increase of 2% in highway salt deicing average selling prices and lower per-unit shipping and handling costs compared to the prior year partially offset the decline in product sales. |
• | Salt segment operating earnings were $215.2 million, a decrease of 26% from 2014, primarily due to a gain of approximately $83 million recognized in 2014 related to the tornado. |
COMBINED PLANT NUTRITION RESULTS
(North America and South America)
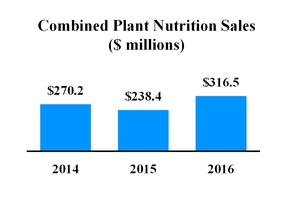
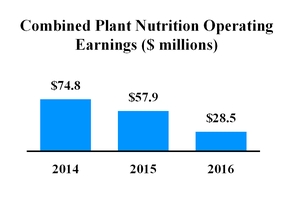
39 | ||
COMPASS MINERALS INTERNATIONAL, INC. | 2016 FORM 10-K | |
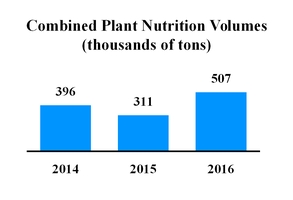
Combined Plant Nutrition Sales (in millions) | 2016 | 2015 | 2014 | |||||||||
Combined plant nutrition sales | $ | 316.5 | $ | 238.4 | $ | 270.2 | ||||||
Less: combined plant nutrition shipping and handling | 30.4 | 22.4 | 28.4 | |||||||||
Combined plant nutrition product sales | $ | 286.1 | $ | 216.0 | $ | 241.8 | ||||||
Combined Plant Nutrition Operating Earnings | $ | 28.5 | $ | 57.9 | $ | 74.8 | ||||||
Combined Plant Nutrition Sales Volumes (thousands of tons) | 507 | 311 | 396 | |||||||||
COMBINED PLANT NUTRITION RESULTS COMMENTARY: 2015 – 2016
• | Combined plant nutrition sales were $316.5 million, an increase of 33% from 2015, primarily due to the inclusion of Produquímica’s results since the October 2016 acquisition date. |
• | Combined plant nutrition operating earnings were $28.5 million, a decrease of 51% from 2015, primarily due to lower average selling prices in North America partially offset by the inclusion of Produquímica results since the acquisition in October 2016. |
• | Combined plant nutrition volumes increased 63% from 2015 driven by Produquímica sales volumes. |
COMBINED PLANT NUTRITION RESULTS COMMENTARY: 2014 – 2015
• | Plant nutrition results in 2014 and 2015 only include Plant Nutrition North America. See below for further discussion. |
PLANT NUTRITION NORTH AMERICA RESULTS
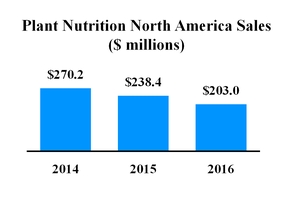
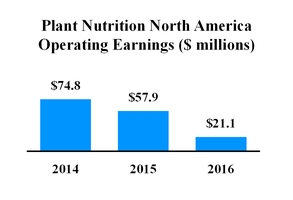
40 | ||
COMPASS MINERALS INTERNATIONAL, INC. | 2016 FORM 10-K | |
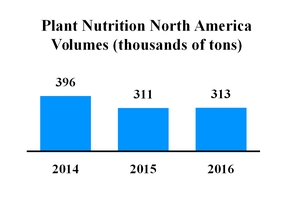
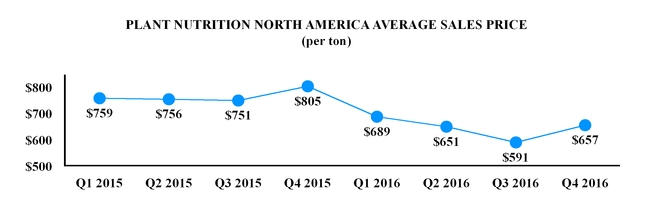
Plant Nutrition North America Sales (in millions) | 2016 | 2015 | 2014 | |||||||||
Plant Nutrition North America sales | $ | 203.0 | $ | 238.4 | $ | 270.2 | ||||||
Less: Plant Nutrition North America shipping and handling | 25.0 | 22.4 | 28.4 | |||||||||
Plant Nutrition North America product sales | $ | 178.0 | $ | 216.0 | $ | 241.8 | ||||||
Plant Nutrition North America Operating Earnings | $ | 21.1 | $ | 57.9 | $ | 74.8 | ||||||
Plant Nutrition North America Sales Volumes (thousands of tons) | 313 | 311 | 396 | |||||||||
Plant Nutrition North America Average Sales Price (per ton) | $ | 648 | $ | 765 | $ | 682 | ||||||
PLANT NUTRITION NORTH AMERICA RESULTS COMMENTARY: 2015 – 2016
• | Plant Nutrition North America sales were $203.0 million, a decrease of 15% from 2015, primarily due to lower average sales prices. |
• | Plant Nutrition North America average sales price decreased by 15% from 2015 and contributed approximately $37 million to the decrease in Plant Nutrition North America sales. Average sales prices were lower than 2015 due to the depressed agriculture market. |
• | Plant Nutrition North America volumes increased 1% from 2015 which partially offset the decrease in sales by approximately $1 million. |
• | Plant Nutrition North America operating earnings were $21.1 million, a decrease of 64% from 2015, primarily due to a 15% reduction in average selling prices and an 11% increase in per-unit shipping and handling costs related to higher warehousing costs and an unfavorable geographic sales mix. |
PLANT NUTRITION NORTH AMERICA RESULTS COMMENTARY: 2014 – 2015
• | Plant Nutrition North America sales were $238.4 million, a decrease of 12% from 2014, primarily due to weakness in the agriculture market. |
• | Plant Nutrition North America average selling price increased by 12% from 2014. |
• | Plant Nutrition North America volumes decreased 21% from 2014 driven by weakness in the agriculture market. |
• | Per-unit costs were unfavorably impacted in 2015 by purchased KCl used to supplement the raw mineral feedstock produced through solar-evaporation at our Ogden, Utah, facility. |
41 | ||
COMPASS MINERALS INTERNATIONAL, INC. | 2016 FORM 10-K | |
• | Plant Nutrition North America sales volumes declined 85,000 tons or 21% and contributed approximately $49 million to the decrease in plant nutrition product sales. |
• | The 12% increase in Plant Nutrition North America average selling price partially offset the decrease in Plant Nutrition North America product sales by approximately $23 million. |
• | Plant Nutrition North America operating earnings were $57.9 million, a decrease of 23% from 2014, primarily due to lower sales volumes and higher per unit costs. |
PLANT NUTRITION SOUTH AMERICA RESULTS
The following financial results represent consolidated financial information with respect to our new Plant Nutrition South America segment from October 3, 2016, the Produquímica acquisition date, through December 31, 2016.
Plant Nutrition South America Sales (in millions) | 2016 | 2015 | 2014 | |||||||
Plant Nutrition South America sales | $ | 113.5 | — | — | ||||||
Less: Plant Nutrition South America shipping and handling | 5.4 | — | — | |||||||
Plant Nutrition South America product sales | $ | 108.1 | — | — | ||||||
Plant Nutrition South America Operating Earnings | $ | 7.4 | — | — | ||||||
Plant Nutrition South America Sales Volumes (thousands of tons) | ||||||||||
Agricultural productivity | 122 | — | — | |||||||
Chemical solutions | 72 | — | — | |||||||
Total tons sold | 194 | — | — | |||||||
Average Plant Nutrition South America Sales Price (per ton) | ||||||||||
Agricultural productivity | $ | 713 | — | — | ||||||
Chemical solutions | 372 | — | — | |||||||
Combined | 587 | — | — | |||||||
PLANT NUTRITION SOUTH AMERICA RESULTS COMMENTARY
• | Plant Nutrition South America sales were $113.5 million for the fourth quarter. Plant Nutrition South America’s operating results are impacted by seasonality. Sales volumes are usually higher in the third and fourth quarter and lower in the first and second quarters. See “—Seasonality” for more information. |
• | Plant Nutrition South America average sales price was $587 per ton. |
OUTLOOK
• | Improving market dynamics for the deicing market is expected to result in increased Salt sales volumes in 2017 from the prior year, assuming average winter weather for the year. We expect Salt sales volumes to range from 11.8 million to 12.6 million tons in 2017. |
• | Despite the expected increase in Salt sales volumes, we expect Salt operating margins to be pressured by lower average sales prices and higher per-unit costs in the first half of 2017. |
• | We believe the North American specialty plant nutrient market has stabilized at current pricing levels. We anticipate limited volume and average selling price growth for SOP products in North America in 2017. We expect Plant Nutrition North America sales volumes to range from 300,000 to 330,000 tons in 2017. |
• | The Brazilian plant nutrient market is expected to remain strong in 2017, which continues to benefit from robust farm incomes due to the strong U.S. dollar and demand for Brazilian commodities. We expect Plant Nutrition South America sales volumes to range from 800,000 to 1.1 million tons. |
• | Due to the seasonality of the Plant Nutrition South America segment, we expect operating earnings for this segment to be minimal in the first half of 2017. |
Investments, Liquidity and Capital Resources
Overview
Over the last several years, we have made significant investments in order to strengthen our operational capabilities.
• | We continue to invest in our Goderich mine to increase our annual available salt production capability to nine million tons as demand warrants. |
42 | ||
COMPASS MINERALS INTERNATIONAL, INC. | 2016 FORM 10-K | |
• | We continue to invest in our continuous mining project at Goderich. This project is expected to be completed in the fourth quarter of 2017 and should generate annual cost savings of approximately $30 million once the project is fully implemented beginning in 2018. |
• | We invested in our Ogden facility to strengthen our solar-pond-based SOP production through upgrades to our processing plant and our solar evaporation ponds. This included modifying our existing solar evaporation ponds to increase the annual solar harvest and increasing the extraction yield and processing capacity of our SOP plant. These improvements have increased our current annual solar-pond-based SOP production capacity to approximately 320,000 tons. |
• | We are nearing completion of a project to further expand our SOP production capacity at our Ogden facility. After the completion of this additional expansion, we expect our SOP production capacity to be approximately 550,000 tons produced with supplemental KCl feedstock. In addition, we are expanding our ability to compact product into various product grades. |
• | In 2012, we acquired the mining rights to approximately 100 million tons of salt reserves in the Chilean Atacama Desert. This reserve estimate is based upon an initial report. We will need to complete a feasibility study before we proceed with the development of this project to ensure our salt reserves are probable. The development of this project will require significant infrastructure to establish extraction and logistics capabilities. In the event that production begins, we will be required to pay the seller royalties on any tons produced. |
• | In 2014, we completed the acquisition of Wolf Trax, Inc., a privately held Canadian corporation. The acquisition enhanced our position as a key resource for premium plant nutrition products by adding innovative plant nutrient products based upon proprietary and patented technologies. |
• | In October 2016, we acquired the remaining 65% of the issued and outstanding capital stock of Produquímica (see Note 3 to our Consolidated Financial Statements for more information). |
As a holding company, CMI’s investments in its operating subsidiaries constitute substantially all of its assets. Consequently, our subsidiaries conduct all of our consolidated operations and own substantially all of our operating assets. The principal source of cash needed to pay our obligations is the cash generated from our subsidiaries’ operations and their borrowings. Our subsidiaries are not obligated to make funds available to CMI. Furthermore, we must remain in compliance with the terms of the credit agreement governing our credit facilities, including the total leverage ratio and interest coverage ratio, in order to pay dividends to our stockholders. We must also comply with the terms of our indenture governing our 4.875% Notes, which limits the amount of dividends we can pay to our stockholders. We are in compliance with our debt covenants as of December 31, 2016. See Note 10 to our Consolidated Financial Statements for a discussion of our outstanding debt.
Historically, our cash flows from operating activities have generally been adequate to fund our basic operating requirements, ongoing debt service and sustaining investment in property, plant and equipment. We have also used cash generated from operations to fund capital expenditures which strengthen our operational position, pay dividends, fund smaller acquisitions and repay our debt. We have been able to manage our cash flows generated and used across Compass Minerals to permanently reinvest earnings in our foreign jurisdictions or efficiently repatriate those funds to the U.S. As of December 31, 2016, we had $70.8 million of cash and cash equivalents (in the Consolidated Balance Sheets) that was either held directly or indirectly by foreign subsidiaries. Due in large part to the seasonality of our deicing salt business, we have experienced large changes in our working capital requirements from quarter to quarter. Historically, our working capital requirements have been the highest in the fourth quarter and lowest in the second quarter. With the addition of our Plant Nutrition South America segment, we expect a less seasonal distribution of working capital requirements. When needed, we fund short-term working capital requirements by accessing our $300 million revolving credit facility. Due to our ability to generate adequate levels of domestic cash flow on an annual basis, it is our current intention to permanently reinvest our foreign earnings outside of the U.S. However, if we were to repatriate our foreign earnings to the U.S., we may be required to accrue and pay U.S. taxes in accordance with the applicable U.S. tax rules and regulations as a result of the repatriation. We review our tax circumstances on a regular basis with the intent of optimizing cash accessibility and minimizing tax expense.
In addition, the amount of permanently reinvested earnings is influenced by, among other things, the profits generated by our foreign subsidiaries and the amount of investment in those same subsidiaries. The profits generated by our domestic and foreign subsidiaries are impacted by the transfer price charged on the transfer of our products between them. As discussed in Note 8 to our Consolidated Financial Statements, our calculated transfer price on certain products between one of our foreign subsidiaries and a domestic subsidiary has been challenged by Canadian federal and provincial governments. The final resolution of these challenges may not occur for several years. We currently expect the outcome of these matters will not have a material impact on our results of operations. However, it is possible the resolution could materially impact the amount of earnings attributable to our domestic and foreign subsidiaries, which could impact the amount of permanently reinvested foreign earnings as well as future cash flows from our domestic operations. See Note 8 to our Consolidated Financial Statements for a discussion regarding our Canadian tax reassessments. See Note 4 to our Consolidated Financial Statements for a discussion regarding a tornado that struck our salt mine and our salt mechanical evaporation plant in Goderich, Ontario, in August 2011.
Principally due to the nature of our deicing business, our cash flows from operations have historically been seasonal, with the majority of our cash flows from operations generated during the first half of the calendar year (see “Seasonality” section below for more information). When we have not been able to meet our short-term liquidity or capital needs with cash from operations,
43 | ||
COMPASS MINERALS INTERNATIONAL, INC. | 2016 FORM 10-K | |
whether as a result of the seasonality of our business or other causes, we have met those needs with borrowings under our revolving credit facility. We expect to meet the ongoing requirements for debt service, any declared dividends and capital expenditures from these sources. This, to a certain extent, is subject to general economic, financial, competitive, legislative, regulatory and other factors that are beyond our control.
The table below provides a summary our cash flows by category and year.
2016 | 2015 | 2014 |
Operating Activities: | ||
Net cash flows provided by operating activities were $167.3 million. » Net earnings were $162.7 million which included a non-cash remeasurement gain of $59.3 million related to the acquisition of Produquímica. » Non-cash depreciation and amortization expense was $90.3 million. » Working capital items were a use of operating cash flows of $31.7 million. | Net cash flows provided by operating activities were $137.9 million. » Net earnings were $159.2 million. » Non-cash depreciation and amortization expense was $78.3 million. » Working capital items were a use of operating cash flows of $111.0 million. | Net cash flows provided by operating activities were $242.9 million. » Net earnings were $217.9 million. » This included a non-cash gain of $60.6 million (net of tax) related to the tornado insurance settlement which reduced our cash flows from operations. » Working capital items were a source of operating cash flows of $1.0 million. |
Investing Activities: | ||
Net cash flows used by investing activities were $467.8 million. » Included $182.2 million of capital expenditures and cash payments of $4.7 million relating to our previously held equity investment and $277.7 million for the full acquisition of Produquímica. | Net cash flows used by investing activities were $335.4 million. » Included $217.6 million of capital expenditures and an equity investment of $116.4 million. | Net cash flows used by investing activities were $189.2 million. » Included $125.2 million of capital expenditures, partially offset by tornado insurance proceeds. » We also acquired Wolf Trax, Inc. for $86.5 million in 2014. |
Financing Activities: | ||
Net cash flows provided by financing activities were $314.6 million. » Included net proceeds from issuance of debt of $416.7 million, payments of dividends of $94.1 million, payments of $8.5 million related to the refinancing of debt. | Net cash flows provided by financing activities were $14.2 million. » Primarily related to new debt obtained to finance the Produquímica investment of $100 million, partially offset by the payment of dividends of $89.4 million. | Net cash flows provided by financing activities were $64.6 million. » Included the refinancing of our 8% Notes and proceeds received from stock option exercises of $7.5 million, partially offset by the payment of dividends of $80.7 million and debt payments of $102.4 million. |
Capital Resources
We believe our primary sources of liquidity will continue to be cash flow from operations and borrowings under our revolving credit facility. We believe that our current banking syndicate is secure and believe we will have access to our entire revolving credit facility. We expect that ongoing requirements for debt service and committed or sustaining capital expenditures will primarily be funded from these sources. See Note 4 to our Consolidated Financial Statements for a discussion of cash received related to a tornado that struck our mine and evaporation plant in Goderich, Ontario, in August 2011.
Our debt service obligations could, under certain circumstances, materially affect our financial condition and prevent us from fulfilling our debt obligations. See Item 1A., “Risk Factors – Our indebtedness and ability to pay our indebtedness could adversely affect our business and financial condition.” Furthermore, CMI is a holding company with no operations of its own and is dependent on its subsidiaries for cash flow. As discussed in Note 10 to our Consolidated Financial Statements, at December 31, 2016, we had $1.33 billion of outstanding indebtedness consisting of $250.0 million under our 4.875% Notes, $951.3 million of borrowings outstanding under our senior secured credit facilities (consisting of term loans and a revolving credit facility), including $105.4 million borrowed against our revolving credit facility, and $131.5 million of debt assumed in the Produquímica acquisition. Letters of credit totaling $6.2 million as of December 31, 2016, reduced available borrowing capacity under the revolving credit facility to $188.4 million. In the future, including in 2017, we may borrow amounts under the revolving credit facility or enter into additional financing to fund our working capital requirements, potential acquisitions and capital expenditures and for other general corporate purposes.
Our ability to make scheduled interest and principal payments on our indebtedness, to refinance our indebtedness, to fund planned capital expenditures and to fund acquisitions will depend on our ability to generate cash in the future. This, to a certain extent, is subject to general economic, financial, competitive, legislative, regulatory and other factors that are beyond our control. Based on our current level of operations, we believe that cash flow from operations and available cash, together with available borrowings under our revolving credit facility, will be adequate to meet our liquidity needs over the next 12 months.
44 | ||
COMPASS MINERALS INTERNATIONAL, INC. | 2016 FORM 10-K | |
We have various foreign and state net operating loss (“NOL”) carryforwards that may be used to offset a portion of future taxable income to reduce our cash income taxes that would otherwise be payable. However, we may not be able to use any or all of our NOL carryforwards to offset future taxable income and our NOL carryforwards may become subject to additional limitations due to future ownership changes or otherwise. At December 31, 2016, we had $61.1 million of gross NOL carryforwards ($53.6 million of gross foreign federal NOL carryforwards that have no expiration date and $7.5 million of gross foreign federal NOL carryforwards that expire in 2033) and $0.9 million of net operating tax-effected state NOL carryforwards that expire in 2033.
We have a defined benefit pension plan for certain of our current and former U.K. employees. Beginning December 1, 2008, future benefits ceased to accrue for the remaining active employee participants in the plan concurrent with the establishment of a defined contribution plan for these employees. Generally, our cash funding policy is to make the minimum annual contributions required by applicable regulations. Although the fair value of the plan’s assets are slightly in excess of the accumulated benefit obligations, we expect to be required to use cash from operations above our historical levels to fund the plan in the future.
Off-Balance Sheet Arrangements
At December 31, 2016, we had no off-balance sheet arrangements that have or are likely to have a material current or future effect on our consolidated financial statements.
Contractual Obligations
Our contractual cash obligations and commitments as of December 31, 2016, are as follows (in millions):
Payments Due by Period
Contractual Cash Obligations | Total | 2017 | 2018 | 2019 | 2020 | 2021 | Thereafter | |||||||||||||||||||||
Long-term Debt | $ | 1,332.8 | $ | 130.2 | $ | 10.9 | $ | 10.7 | $ | 9.9 | $ | 918.7 | $ | 252.4 | ||||||||||||||
Interest(a) | 211.2 | 58.8 | 34.7 | 33.3 | 31.9 | 21.5 | 31.0 | |||||||||||||||||||||
Capital Lease Obligations(b) | 10.7 | 1.0 | 0.9 | 0.9 | 0.9 | 0.9 | 6.1 | |||||||||||||||||||||
Operating Leases(b) | 37.8 | 14.4 | 7.7 | 5.1 | 3.0 | 1.8 | 5.8 | |||||||||||||||||||||
Unconditional Purchase Obligations(c) | 11.7 | 10.0 | 1.7 | — | — | — | — | |||||||||||||||||||||
Estimated Future Pension Benefit Obligations(d) | 61.7 | 2.4 | 2.4 | 2.5 | 2.6 | 2.7 | 49.1 | |||||||||||||||||||||
Total Contractual Cash Obligations | $ | 1,665.9 | $ | 216.8 | $ | 58.3 | $ | 52.5 | $ | 48.3 | $ | 945.6 | $ | 344.4 | ||||||||||||||
Other Commitments | Total | 2017 | 2018 | 2019 | 2020 | 2021 | Thereafter | |||||||||||||||||||||
Letters of Credit | $ | 6.2 | $ | 6.2 | $ | — | $ | — | $ | — | $ | — | $ | — | ||||||||||||||
Bank Letter Guarantees(e) | 45.8 | 45.8 | — | — | — | — | — | |||||||||||||||||||||
Performance Bonds(e) | 137.1 | 124.8 | 12.3 | — | — | — | — | |||||||||||||||||||||
Total Other Commitments | $ | 189.1 | $ | 176.8 | $ | 12.3 | $ | — | $ | — | $ | — | $ | — | ||||||||||||||
(a) | Based on maintaining existing debt balances to maturity. Interest on our credit facilities varies with the Eurodollar rate and the base rate. The December 31, 2016, blended rate of 3.0%, including the applicable spread, was used for this calculation for CMI debt. The interest amounts also include estimates for the debt assumed in the Produquímica acquisition. The amounts in the table do not include interest payments of approximately $4 million each year which may be required to be deposited with the taxing authorities if other collateral arrangements cannot be made as long as the dispute remains outstanding. Note 8 to Consolidated Financial Statements provides additional information related to our Canadian tax reassessments. |
(b) | We lease property and equipment under non-cancelable operating and capital leases for varying periods. |
(c) | We have contracts to purchase certain amounts of electricity, equipment and a minimum tonnage of salt under purchase contracts. The price of the salt is dependent on the product purchased and has been estimated based on an average of the prices in effect for the various products at December 31, 2016, and adjusted based upon estimated price increases for 2017. In addition, we have minimum throughput commitments in certain depots. |
(d) | Note 9 to our Consolidated Financial Statements provides additional information. |
(e) | Note 12 to our Consolidated Financial Statements provides additional information. |
Sensitivity Analysis Related to EBITDA and Adjusted EBITDA
Management uses a variety of measures to evaluate our performance. While our consolidated financial statements, taken as a whole, provide an understanding of our overall results of operations, financial condition and cash flows, we analyze components of the consolidated financial statements to identify certain trends and evaluate specific performance areas. In addition to using U.S. generally accepted accounting principles (“GAAP”) financial measures, such as gross profit, net earnings and cash flows generated by operating activities, management uses EBITDA and Adjusted EBITDA. Both EBITDA and Adjusted EBITDA are non-GAAP financial measures used to evaluate the operating performance of our core business operations due to our resource allocation, financing methods and cost of capital, and income tax positions, which are managed at a corporate level apart from the activities of the operating segments, and the operating facilities are located in different taxing jurisdictions, which can cause
45 | ||
COMPASS MINERALS INTERNATIONAL, INC. | 2016 FORM 10-K | |
considerable variation in net earnings. We also use EBITDA and Adjusted EBITDA to assess our operating performance and return on capital, and to evaluate potential acquisitions or other capital projects. EBITDA and Adjusted EBITDA are not calculated under U.S. GAAP and should not be considered in isolation or as a substitute for net earnings, cash flows or other financial data prepared in accordance with U.S. GAAP or as a measure of our overall profitability or liquidity. EBITDA and Adjusted EBITDA exclude interest expense, income taxes and depreciation and amortization, each of which are an essential element of our cost structure and cannot be eliminated. Furthermore, Adjusted EBITDA excludes other cash and non-cash items including refinancing costs and other (income) expense. Our borrowings are a significant component of our capital structure and interest expense is a continuing cost of debt. We are also required to pay income taxes, a required and ongoing consequence of our operations. We have a significant investment in capital assets and depreciation and amortization reflect the utilization of those assets in order to generate revenues. Consequently, any measure that excludes these elements has material limitations. While EBITDA and Adjusted EBITDA are frequently used as measures of operating performance, these terms are not necessarily comparable to similarly titled measures of other companies due to the potential inconsistencies in the method of calculation. The calculation of EBITDA and Adjusted EBITDA as used by management is set forth in the table below (in millions).
For the Year Ended December 31, | ||||||||||||
2016 | 2015 | 2014 | ||||||||||
Net earnings | $ | 162.7 | $ | 159.2 | $ | 217.9 | ||||||
Interest expense | 34.1 | 21.5 | 20.1 | |||||||||
Income tax expense | 34.6 | 55.3 | 73.9 | |||||||||
Depreciation, depletion and amortization | 90.3 | 78.3 | 78.0 | |||||||||
EBITDA | $ | 321.7 | $ | 314.3 | $ | 389.9 | ||||||
Adjustments to EBITDA: | ||||||||||||
Gain from insurance settlement | $ | — | $ | — | $ | (83.3 | ) | |||||
Gain from remeasurement of equity method investment | (59.3 | ) | — | — | ||||||||
Business acquisition related items(1) | 8.4 | — | — | |||||||||
Indefinite-lived intangible asset impairment | 3.1 | — | — | |||||||||
Fees and premiums paid to redeem debt | 3.0 | — | 4.0 | |||||||||
Write-off of unamortized deferred financing fees and original issue discount | — | — | 2.9 | |||||||||
Other income, net | (1.9 | ) | (14.6 | ) | (7.8 | ) | ||||||
Adjusted EBITDA | $ | 275.0 | $ | 299.7 | $ | 305.7 | ||||||
(1) | Primarily includes additional expense recognized from the sale of finished goods inventory, which had its cost basis increased to fair value as a result of the acquisition of Produquímica. |
Key adjustments in 2016 included $8.4 million of costs in connection with the acquisition of Produquímica, primarily related to the step-up of finished goods inventory to fair value. As this finished goods inventory is sold, the additional costs are recorded in product cost. In the fourth quarter of 2016, we partially wrote-down a trade name acquired in our Wolf Trax acquisition. In 2016, we paid $3.0 million in fees related to debt financing. In connection with the refinancing of our 8% Notes in 2014, we paid $4.0 million for call premiums and wrote-off $1.4 million of our unamortized deferred financing costs and approximately $1.5 million of original issue discount, each related to our 8% Notes. In the third quarter of 2014, we settled our 2011 insurance claim relating to the damage sustained as a result of a tornado and recognized a gain of $83.3 million in our Consolidated Statements of Operations. EBITDA also includes other non-operating income, primarily foreign exchange gains (losses) resulting from the translation of intercompany obligations, interest income and investment income (loss) relating to our nonqualified retirement plan.
Our net earnings, EBITDA and Adjusted EBITDA are impacted by other events or transactions that we believe to be important in understanding our earnings trends such as the variability of weather. The impact of weather has not been adjusted in the amounts presented above. Our 2016 and 2015 results were unfavorably impacted by mild winter weather in the markets we serve. Conversely, our 2014 operating results were favorably impacted by the winter weather in the markets we serve.
Management’s Discussion of Critical Accounting Policies and Estimates
The preparation of the consolidated financial statements in conformity with U.S. GAAP requires management to make estimates and assumptions that affect the reported amounts of assets and liabilities as of the reporting date and the reported amounts of revenue and expenses during the reporting period. Actual results could vary from these estimates. We have identified the critical accounting policies and estimates that are most important to the portrayal of our financial condition and results of operations. The policies set forth below require significant subjective or complex judgments by management, often as a result of the need to make estimates about the effect of matters that are inherently uncertain.
46 | ||
COMPASS MINERALS INTERNATIONAL, INC. | 2016 FORM 10-K | |
Mineral Interests – As of December 31, 2016, we maintained $126.7 million of net mineral properties as a part of property, plant and equipment. Mineral interests include probable mineral reserves. We lease mineral reserves at several of our extraction facilities. These leases have varying terms, and many provide for a royalty payment to the lessor based on a specific amount per ton of mineral extracted or as a percentage of revenue.
Mineral interests are primarily depleted on a units-of-production method based on third-party estimates of recoverable reserves. Our rights to extract minerals are generally contractually limited by time or lease boundaries. If we are not able to continue to extend lease agreements, as we have in the past, at commercially reasonable terms, without incurring substantial costs or incurring material modifications to the existing lease terms and conditions, if the assigned lives realized are less than those projected by management, or if the actual size, quality or recoverability of the minerals is less than the estimated probable reserves, then the rate of amortization could be increased or the value of the reserves could be reduced by a material amount.
Income Taxes – Developing our provision for income taxes and analyzing our potential tax exposure items requires significant judgment and assumptions as well as a thorough knowledge of the tax laws in various jurisdictions. These estimates and judgments occur in the calculation of certain tax liabilities and in the assessment of the likelihood that we will be able to realize our deferred tax assets, which arise from temporary differences between the tax and financial statement recognition of revenue and expense, carryforwards and other items. Based on all available evidence, both positive and negative, the reliability of that evidence and the extent such evidence can be objectively verified, we determine whether it is more likely than not that all, or a portion of, the deferred tax assets will be realized.
In evaluating our ability to realize our deferred tax assets, we consider the sources and timing of taxable income, our ability to carry back tax attributes to prior periods, qualifying tax planning and estimates of future taxable income exclusive of reversing temporary differences. In determining future taxable income, our assumptions include the amount of pre-tax operating income according to multiple federal, international and state taxing jurisdictions, the origination of future temporary differences and the implementation of feasible and prudent tax planning. These assumptions require significant judgment about material estimates, assumptions and uncertainties in connection with the forecasts of future taxable income, the merits in tax law and assessments regarding previous taxing authorities’ proceedings or written rulings. While these assumptions are consistent with the plans and estimates we use to manage the underlying businesses, differences in our actual operating results or changes in our tax planning, tax credits, tax laws or our assessment of the tax merits of our positions could affect our future assessments.
In addition, the calculation of our tax liabilities involves uncertainties in the application of complex tax regulations in multiple jurisdictions. We recognize potential liabilities in accordance with applicable U.S. GAAP for anticipated tax issues in the U.S. and other tax jurisdictions based on our estimate of whether, and the extent to which, additional taxes will be due. If payment of these amounts ultimately proves to be unnecessary, the reversal of the liabilities would result in tax benefits being recognized in the period when we determine the liabilities are no longer necessary. If our estimate of tax liabilities proves to be less than the ultimate assessment, a further charge to expense would result. See Note 8 to our Consolidated Financial Statements for further discussion of our income taxes.
Taxes on Foreign Earnings – Our effective tax rate reflects the impact of undistributed foreign earnings for which no U.S. taxes have been provided because such earnings are planned to be reinvested indefinitely outside the U.S. Most of the amounts held outside the U.S. could be repatriated to the U.S., but would be subject to U.S. federal income taxes and foreign withholding taxes, less applicable foreign tax credits or deductions.
U.K. Pension Plan – We have a defined benefit pension plan covering some of our current and former employees in the U.K. The U.K. pension plan was closed to new participants in 1992. As we elected to freeze our pension plan, we ceased to accrue future benefits under the plan beginning December 1, 2008. We select the actuarial assumptions for our pension plan after consultation with our actuaries and consideration of market conditions. These assumptions include the discount rate and the expected long-term rates of return on plan assets, which are used in the calculation of the actuarial valuation of our defined benefit pension plans. If actual conditions or results vary from those projected by management, adjustments may be required in future periods to meet minimum pension funding or to increase pension expense or our pension liability. An adverse change of 25 basis points in our discount rate would have increased our projected benefit obligation as of December 31, 2015, by approximately $2.3 million and would decrease our net periodic pension benefit for 2016 by approximately $0.3 million. An adverse change of 25 basis points in our expected return on assets assumption as of December 31, 2016, would decrease our net periodic benefit for 2017 by approximately $0.2 million.
We set our discount rate for our U.K. pension plan based on a forward yield curve for a portfolio of high credit quality bonds with expected cash flows and an average duration closely matching the expected benefit payments under the plan. The assumption for the return on plan assets is determined based on expected returns applicable to each type of investment within the portfolio expected to be maintained over the next 15 to 20 years. Our funding policy has been to make the minimum annual contributions required by applicable regulations. However, we have made special payments during some years when changes in the business could reasonably impact the pension plan’s available assets and when special early retirement payments or other inducements are made to pensioners. Contributions totaled $1.4 million, $1.5 million and $1.6 million during the years ended December 31, 2016, 2015 and 2014, respectively. If supplemental benefits were approved and granted under the provisions of the plan, or if periodic
47 | ||
COMPASS MINERALS INTERNATIONAL, INC. | 2016 FORM 10-K | |
statutory valuations cause a change in funding requirements, our contributions could increase to fund all or a portion of those benefits. See Note 9 to the Consolidated Financial Statements for additional discussion of our pension plan.
Other Significant Accounting Policies – Other significant accounting policies not involving the same level of measurement uncertainties as those discussed above are nevertheless important to an understanding of our consolidated financial statements. Policies related to revenue recognition, allowance for doubtful accounts, valuation of inventory reserves, valuation of equity compensation instruments, derivative instruments and environmental accruals require judgments on complex matters.
Effects of Currency Fluctuations and Inflation
Our operations outside of the U.S. are conducted primarily in Canada, Brazil and the U.K. Therefore, our results of operations are subject to both currency transaction risk and currency translation risk. We incur currency transaction risk whenever we or one of our subsidiaries enter into either a purchase or sales transaction using a currency other than the local currency of the transacting entity. With respect to currency translation risk, our financial condition and results of operations are measured and recorded in the relevant local currency and then translated into U.S. dollars for inclusion in our historical consolidated financial statements. Exchange rates between these currencies and the U.S. dollar have fluctuated significantly from time to time and may do so in the future. The majority of revenues and costs are denominated in U.S. dollars, with Canadian dollars, Brazilian Reais and British pounds sterling also being significant. We generated 34% of our 2016 sales in foreign currencies, and we incurred 38% of our 2016 total operating expenses in foreign currencies. Additionally, we have approximately $1,115 million of net assets denominated in foreign currencies. In 2014 and 2015, the average rate for the U.S. dollar strengthened against the Canadian dollar and the British pound sterling, which had a negative impact on sales, operating earnings and reported assets. In 2016, the average rate for the U.S. dollar strengthened against the British pound sterling and, since the October 2016 Produquímica acquisition date, against the Brazilian real. The average rate for the U.S. dollar weakened against the Canadian dollar in 2016. Significant changes in the value of the Canadian dollar, Brazilian real or the British pound sterling relative to the U.S. dollar could have a material adverse effect on our financial condition and our ability to meet interest and principal payments on U.S. dollar-denominated debt, including borrowings under our senior secured credit facilities.
Although inflation has not had a significant impact on our operations, our efforts to recover cost increases due to inflation may be hampered as a result of the competitive industries and countries in which we operate.
Seasonality
We experience a substantial amount of seasonality in our sales. Our sales of our salt deicing products are seasonal. Consequently, our Salt sales and operating income are generally higher in the first and fourth quarters and lower during the second and third quarters of each year. In particular, sales of highway and consumer deicing salt and magnesium chloride products vary based on the severity of the winter conditions in areas where the product is used. Following industry practice in North America, we seek to stockpile sufficient quantities of deicing salt in the second, third and fourth quarters to meet the estimated requirements for the winter season.
Our plant nutrition business is also seasonal. The strongest demand for our Plant Nutrition South America products in Brazil typically occurs during the spring planting season. As a result, we and our customers generally build inventories during the low demand periods of the year to ensure timely product availability during the peak sales season. The seasonality of this demand results in our sales volumes and net sales for our Plant Nutrition South America segment usually being the highest during the third and fourth quarters of each year (as the spring planting season begins in September in Brazil).
Recent Accounting Pronouncements
See Note 2 to our Consolidated Financial Statements for a discussion of recent accounting pronouncements.
ITEM 7A. | QUANTITATIVE AND QUALITATIVE DISCLOSURES ABOUT MARKET RISK |
Our business is subject to various types of market risks that include, but are not limited to, interest rate risk, foreign currency translation risk and commodity pricing risk. Management may take actions to mitigate our exposure to these types of risks including entering into forward purchase contracts and other financial instruments. However, there can be no assurance that our hedging activities will eliminate or substantially reduce these risks. We do not enter into any financial instrument arrangements for speculative purposes.
Interest Rate Risk
As of December 31, 2016, we had $951.3 million of debt outstanding under our credit agreement (consisting of term loans and revolving credit facility) and $131.5 million of debt assumed as part of the Produquímica acquisition, bearing interest at variable rates. Accordingly, our earnings and cash flows will be affected by changes in interest rates to the extent the principal balance is unhedged. Assuming no change in the amount of debt outstanding, a 100 basis point increase in the average interest rate under these borrowings would have increased the interest expense related to our variable rate debt by approximately $10.8 million based
48 | ||
COMPASS MINERALS INTERNATIONAL, INC. | 2016 FORM 10-K | |
upon our debt outstanding as of December 31, 2016. Actual results may vary due to changes in the amount of variable rate debt outstanding.
As of December 31, 2016, a significant portion of the investments in the U.K. pension plan are in bond funds. Changes in interest rates could impact the value of the investments in the pension plan.
Foreign Currency Risk
In addition to the U.S., we primarily conduct our business in Canada, Brazil and the U.K. Our operations are, therefore, subject to volatility because of currency fluctuations, inflation changes and changes in political and economic conditions in these countries. Sales and expenses are frequently denominated in local currencies, and results of operations may be affected adversely as currency fluctuations affect our product prices and operating costs or those of our competitors. We may engage in hedging operations, including forward foreign currency exchange contracts, to reduce the exposure of our cash flows to fluctuations in foreign currency exchange rates. We do not engage in hedging for speculative investment purposes. Any hedging operations may not eliminate or substantially reduce risks associated with fluctuating currencies. See Item 1A., “Risk Factors – Risks associated with international operations and sales could adversely affect our business and earnings.”
Considering our foreign earnings, a hypothetical 10% unfavorable change in the exchange rates compared to the U.S. dollar would have an estimated $0.5 million impact on our operating earnings for the year ended December 31, 2016. Actual changes in market prices or rates will differ from hypothetical changes.
In conjunction with the acquisition of Produquímica, we assumed U.S. dollar denominated debt which was previously held by Produquímica. Prior to the acquisition, Produquímica entered into foreign currency swap agreements whereby Produquímica agreed to swap interest and principal payments on the loans denominated in U.S. dollars for principal and interest payments denominated in Brazilian Reais, Produquímica’s functional currency. The objective of the swap agreements is to mitigate the foreign currency fluctuation risk related to holding debt denominated in a currency other than Produquímica’s functional currency. We may either continue to hedge this exposure or borrow in Brazilian Reais to meet the capital needs of our Brazilian operations.
Commodity Pricing Risk
We have a hedging policy to mitigate the impact of fluctuations in the price of natural gas. The notional amounts of volumes hedged are determined based on a combination of factors, including estimated natural gas usage, current market prices and historical market prices. We enter into contractual natural gas price arrangements, which effectively fix the purchase price of our natural gas requirements up to 36 months in advance of the physical purchase of the natural gas. We may hedge up to approximately 90% of our expected natural gas usage. Because of the varying locations of our production facilities, we also enter into basis swap agreements to eliminate any further price variation due to local market differences. We have determined that these financial instruments qualify as cash flow hedges under U.S. GAAP. As of December 31, 2016, the amount of natural gas hedged with derivative contracts totaled 2.3 million MMBtus, of which 1.8 million expire within one year and 0.5 million expire in the following year.
Excluding natural gas hedged with derivative instruments, a hypothetical 10% adverse change in our natural gas prices during the year ended December 31, 2016, would have increased our cost of sales by approximately $0.2 million. Actual results will vary due to actual changes in market prices and consumption.
We are subject to increases and decreases in the cost of transporting our products due to variations in our contracted carriers’ cost of fuel, which is typically diesel fuel. We may engage in hedging operations, including forward contracts, to reduce our exposure to changes in our transportation cost due to changes in the cost of fuel in the future. Due to the difficulty in meeting all of the requirements for hedge accounting under current U.S. GAAP, any such cash flow hedges of transportation costs would likely be accounted for by marking the hedges to market at each reporting period. Our historical results do not reflect any direct fuel hedging activity. However, hedging operations may not eliminate or substantially reduce the risks associated with changes in our transportation costs. We do not engage in hedging for speculative investment purposes.
49 | ||
COMPASS MINERALS INTERNATIONAL, INC. | 2016 FORM 10-K | |
ITEM 8. | FINANCIAL STATEMENTS AND SUPPLEMENTARY DATA |
Description | Page |
Reports of Independent Registered Public Accounting Firm | 51 |
Consolidated Balance Sheets as of December 31, 2016 and 2015 | 53 |
Consolidated Statements of Operations for each of the three years in the period ended December 31, 2016 | 54 |
Consolidated Statements of Comprehensive Income for each of the three years in the period ended December 31, 2016 | 55 |
Consolidated Statements of Stockholders’ Equity for each of the three years in the period ended December 31, 2016 | 56 |
Consolidated Statements of Cash Flows for each of the three years in the period ended December 31, 2016 | 57 |
Notes to Consolidated Financial Statements | 58 |
50 | ||
COMPASS MINERALS INTERNATIONAL, INC. | 2016 FORM 10-K | |
Report of Independent Registered Public Accounting Firm
The Board of Directors and Stockholders of Compass Minerals International, Inc.
We have audited the accompanying consolidated balance sheets of Compass Minerals International, Inc. as of December 31, 2016 and 2015 and the related consolidated statements of operations, comprehensive income, stockholders’ equity and cash flows for each of the three years in the period ended December 31, 2016. Our audits also included the financial statement schedule listed at Item 15(a)(2). These financial statements and schedule are the responsibility of the Company’s management. Our responsibility is to express an opinion on these financial statements and schedule based on our audits.
We conducted our audits in accordance with the standards of the Public Company Accounting Oversight Board (United States). Those standards require that we plan and perform the audit to obtain reasonable assurance about whether the financial statements are free of material misstatement. An audit includes examining, on a test basis, evidence supporting the amounts and disclosures in the financial statements. An audit also includes assessing the accounting principles used and significant estimates made by management, as well as evaluating the overall financial statement presentation. We believe that our audits provide a reasonable basis for our opinion.
In our opinion, the financial statements referred to above present fairly, in all material respects, the consolidated financial position of Compass Minerals International, Inc. at December 31, 2016 and 2015, and the consolidated results of its operations and its cash flows for each of the three years in the period ended December 31, 2016, in conformity with U.S. generally accepted accounting principles. Also, in our opinion, the related financial statement schedule, when considered in relation to the basic financial statements taken as a whole, presents fairly in all material respects the information set forth therein.
We also have audited, in accordance with the standards of the Public Company Accounting Oversight Board (United States), Compass Minerals International, Inc.’s internal control over financial reporting as of December 31, 2016, based on criteria established in Internal Control-Integrated Framework issued by the Committee of Sponsoring Organizations of the Treadway Commission (2013 framework) and our report dated March 1, 2017 expressed an unqualified opinion thereon.
Kansas City, Missouri | /s/ Ernst & Young LLP |
March 1, 2017 | |
51 | ||
COMPASS MINERALS INTERNATIONAL, INC. | 2016 FORM 10-K | |
Report of Independent Registered Public Accounting Firm
The Board of Directors and Stockholders of Compass Minerals International, Inc.
We have audited Compass Minerals International, Inc.’s internal control over financial reporting as of December 31, 2016, based on criteria established in Internal Control - Integrated Framework issued by the Committee of Sponsoring Organizations of the Treadway Commission (2013 framework), (the COSO criteria). Compass Minerals International, Inc.’s management is responsible for maintaining effective internal control over financial reporting, and for its assessment of the effectiveness of internal control over financial reporting included in the accompanying Management’s Report on Internal Control over Financial Reporting. Our responsibility is to express an opinion on the company’s internal control over financial reporting based on our audit.
We conducted our audit in accordance with the standards of the Public Company Accounting Oversight Board (United States). Those standards require that we plan and perform the audit to obtain reasonable assurance about whether effective internal control over financial reporting was maintained in all material respects. Our audit included obtaining an understanding of internal control over financial reporting, assessing the risk that a material weakness exists, testing and evaluating the design and operating effectiveness of internal control based on the assessed risk, and performing such other procedures as we considered necessary in the circumstances. We believe that our audit provides a reasonable basis for our opinion.
A company’s internal control over financial reporting is a process designed to provide reasonable assurance regarding the reliability of financial reporting and the preparation of financial statements for external purposes in accordance with generally accepted accounting principles. A company’s internal control over financial reporting includes those policies and procedures that (1) pertain to the maintenance of records that, in reasonable detail, accurately and fairly reflect the transactions and dispositions of the assets of the company; (2) provide reasonable assurance that transactions are recorded as necessary to permit preparation of financial statements in accordance with generally accepted accounting principles, and that receipts and expenditures of the company are being made only in accordance with authorizations of management and directors of the company; and (3) provide reasonable assurance regarding prevention or timely detection of unauthorized acquisition, use, or disposition of the company’s assets that could have a material effect on the financial statements.
Because of its inherent limitations, internal control over financial reporting may not prevent or detect misstatements. Also, projections of any evaluation of effectiveness to future periods are subject to the risk that controls may become inadequate because of changes in conditions, or that the degree of compliance with the policies or procedures may deteriorate.
As indicated in the accompanying Management’s Report on Internal Control over Financial Reporting, management’s assessment of and conclusion on the effectiveness of internal control over financial reporting did not include the internal controls of Produquímica Indústria e Comércio S.A. (Produquímica), which is included in the 2016 consolidated financial statements of Compass Minerals International, Inc. and constituted 34% of total assets as of December 31, 2016 and 10% and 2% of revenues and net income, respectively, for the year then ended. Our audit of internal control over financial reporting of Compass Minerals International, Inc. also did not include an evaluation of the internal control over financial reporting of Produquímica.
In our opinion, Compass Minerals International, Inc. maintained, in all material respects, effective internal control over financial reporting as of December 31, 2016, based on the COSO criteria.
We also have audited, in accordance with the standards of the Public Company Accounting Oversight Board (United States), the consolidated balance sheets of Compass Minerals International, Inc. as of December 31, 2016 and 2015, and the related consolidated statements of operations, comprehensive income, stockholders’ equity, and cash flows for each of the three years in the period ended December 31, 2016 of Compass Minerals International, Inc. and our report dated March 1, 2017 expressed an unqualified opinion thereon.
Kansas City, Missouri | /s/ Ernst & Young LLP |
March 1, 2017 | |
52 | ||
COMPASS MINERALS INTERNATIONAL, INC. | 2016 FORM 10-K | |
Consolidated Balance Sheets
December 31, | ||||||||
(In millions, except share data) | 2016 | 2015 | ||||||
ASSETS | ||||||||
Current assets: | ||||||||
Cash and cash equivalents | $ | 77.4 | $ | 58.4 | ||||
Receivables, less allowance for doubtful accounts of $9.0 in 2016 and $1.3 in 2015 | 320.9 | 147.8 | ||||||
Inventories | 280.6 | 275.3 | ||||||
Other | 36.1 | 30.8 | ||||||
Total current assets | 715.0 | 512.3 | ||||||
Property, plant and equipment, net | 1,092.3 | 800.7 | ||||||
Intangible assets, net | 157.6 | 85.3 | ||||||
Goodwill | 412.2 | 58.1 | ||||||
Investment in equity investee | 24.9 | 116.4 | ||||||
Other | 64.5 | 52.0 | ||||||
Total assets | $ | 2,466.5 | $ | 1,624.8 | ||||
LIABILITIES AND STOCKHOLDERS’ EQUITY | ||||||||
Current liabilities: | ||||||||
Current portion of long-term debt | $ | 130.2 | $ | 4.9 | ||||
Accounts payable | 100.8 | 80.7 | ||||||
Accrued expenses | 105.3 | 48.9 | ||||||
Accrued salaries and wages | 22.6 | 15.2 | ||||||
Income taxes payable | 4.4 | 14.8 | ||||||
Accrued interest | 8.7 | 6.3 | ||||||
Total current liabilities | 372.0 | 170.8 | ||||||
Long-term debt, net of current portion | 1,194.8 | 718.0 | ||||||
Deferred income taxes, net | 130.8 | 71.3 | ||||||
Other noncurrent liabilities | 51.8 | 25.0 | ||||||
Commitments and contingencies (Note 12) | ||||||||
Stockholders’ equity: | ||||||||
Common Stock: | ||||||||
$0.01 par value, authorized shares – 200,000,000; issued shares – 35,367,264 | 0.4 | 0.4 | ||||||
Additional paid-in capital | 97.1 | 91.7 | ||||||
Treasury stock, at cost – 1,577,960 shares at December 31, 2016 and 1,665,731 shares at December 31, 2015 | (3.0 | ) | (3.2 | ) | ||||
Retained earnings | 727.5 | 659.1 | ||||||
Accumulated other comprehensive loss | (104.9 | ) | (108.3 | ) | ||||
Total stockholders’ equity | 717.1 | 639.7 | ||||||
Total liabilities and stockholders’ equity | $ | 2,466.5 | $ | 1,624.8 | ||||
The accompanying notes are an integral part of the consolidated financial statements.
53 | ||
COMPASS MINERALS INTERNATIONAL, INC. | 2016 FORM 10-K | |
Consolidated Statements of Operations
For the Year Ended December 31, | ||||||||||||
(In millions, except share data) | 2016 | 2015 | 2014 | |||||||||
Sales | $ | 1,138.0 | $ | 1,098.7 | $ | 1,282.5 | ||||||
Shipping and handling cost | 244.9 | 261.5 | 337.7 | |||||||||
Product cost (Note 4) | 593.6 | 507.1 | 523.4 | |||||||||
Gross profit | 299.5 | 330.1 | 421.4 | |||||||||
Selling, general and administrative expenses | 124.9 | 108.7 | 110.4 | |||||||||
Operating earnings | 174.6 | 221.4 | 311.0 | |||||||||
Other (income) expense: | ||||||||||||
Interest expense | 34.1 | 21.5 | 20.1 | |||||||||
Net loss from equity investee | 1.4 | — | — | |||||||||
Gain from remeasurement of equity method investment | (59.3 | ) | — | — | ||||||||
Other, net | 1.1 | (14.6 | ) | (0.9 | ) | |||||||
Earnings before income taxes | 197.3 | 214.5 | 291.8 | |||||||||
Income tax expense | 34.6 | 55.3 | 73.9 | |||||||||
Net earnings | $ | 162.7 | $ | 159.2 | $ | 217.9 | ||||||
Basic net earnings per common share | $ | 4.79 | $ | 4.70 | $ | 6.45 | ||||||
Diluted net earnings per common share | $ | 4.79 | $ | 4.69 | $ | 6.44 | ||||||
Weighted-average common shares outstanding (in thousands): | ||||||||||||
Basic | 33,776 | 33,677 | 33,557 | |||||||||
Diluted | 33,780 | 33,692 | 33,581 | |||||||||
Cash dividends per share | $ | 2.78 | $ | 2.64 | $ | 2.40 | ||||||
The accompanying notes are an integral part of the consolidated financial statements.
54 | ||
COMPASS MINERALS INTERNATIONAL, INC. | 2016 FORM 10-K | |
Consolidated Statements of Comprehensive Income
For the Year Ended December 31, | ||||||||||||
(In millions) | 2016 | 2015 | 2014 | |||||||||
Net earnings | $ | 162.7 | $ | 159.2 | $ | 217.9 | ||||||
Other comprehensive income (loss): | ||||||||||||
Unrealized gain from change in pension costs, net of tax of $(0.1), $(1.2) and $(0.1) in 2016, 2015 and 2014 | 0.1 | 5.2 | 0.3 | |||||||||
Unrealized gain (loss) on cash flow hedges, net of tax of $(1.3), $(0.3) and $1.4 in 2016, 2015 and 2014 | 2.2 | 0.4 | (2.3 | ) | ||||||||
Cumulative translation adjustment | 1.1 | (98.4 | ) | (48.0 | ) | |||||||
Comprehensive income | $ | 166.1 | $ | 66.4 | $ | 167.9 | ||||||
The accompanying notes are an integral part of the consolidated financial statements.
55 | ||
COMPASS MINERALS INTERNATIONAL, INC. | 2016 FORM 10-K | |
Consolidated Statements of Stockholders’ Equity
(In millions) | Common Stock | Additional Paid-In Capital | Treasury Stock | Retained Earnings | Accumulated Other Comprehensive Income (Loss) | Total | ||||||||||||||||||
Balance, December 31, 2013 | $ | 0.4 | $ | 70.4 | $ | (3.6 | ) | $ | 452.5 | $ | 34.5 | $ | 554.2 | |||||||||||
Comprehensive income | 217.9 | (50.0 | ) | 167.9 | ||||||||||||||||||||
Dividends on common stock/equity awards | 0.2 | (80.9 | ) | (80.7 | ) | |||||||||||||||||||
Shares issued for stock units | (0.1 | ) | 0.1 | — | ||||||||||||||||||||
Income tax deficiencies from equity awards | (0.2 | ) | (0.2 | ) | ||||||||||||||||||||
Stock options exercised | 7.3 | 0.2 | 7.5 | |||||||||||||||||||||
Stock-based compensation | 4.9 | 4.9 | ||||||||||||||||||||||
Balance, December 31, 2014 | $ | 0.4 | $ | 82.5 | $ | (3.3 | ) | $ | 589.5 | $ | (15.5 | ) | $ | 653.6 | ||||||||||
Comprehensive income | 159.2 | (92.8 | ) | 66.4 | ||||||||||||||||||||
Dividends on common stock/equity awards | 0.2 | (89.6 | ) | (89.4 | ) | |||||||||||||||||||
Income tax benefits from equity awards | 0.5 | 0.5 | ||||||||||||||||||||||
Stock options exercised | 2.4 | 0.1 | 2.5 | |||||||||||||||||||||
Stock-based compensation | 6.1 | 6.1 | ||||||||||||||||||||||
Balance, December 31, 2015 | $ | 0.4 | $ | 91.7 | $ | (3.2 | ) | $ | 659.1 | $ | (108.3 | ) | $ | 639.7 | ||||||||||
Comprehensive income | 162.7 | 3.4 | 166.1 | |||||||||||||||||||||
Dividends on common stock/equity awards | 0.2 | (94.3 | ) | (94.1 | ) | |||||||||||||||||||
Shares issued for stock units | (0.2 | ) | 0.2 | — | ||||||||||||||||||||
Income tax deficiencies from equity awards | (0.2 | ) | (0.2 | ) | ||||||||||||||||||||
Stock options exercised | 0.7 | 0.7 | ||||||||||||||||||||||
Stock-based compensation | 4.9 | 4.9 | ||||||||||||||||||||||
Balance, December 31, 2016 | $ | 0.4 | $ | 97.1 | $ | (3.0 | ) | $ | 727.5 | $ | (104.9 | ) | $ | 717.1 | ||||||||||
The accompanying notes are an integral part of the consolidated financial statements.
56 | ||
COMPASS MINERALS INTERNATIONAL, INC. | 2016 FORM 10-K | |
Consolidated Statements of Cash Flows
For the Year Ended December 31, | ||||||||||||
(In millions) | 2016 | 2015 | 2014 | |||||||||
Cash flows from operating activities: | ||||||||||||
Net earnings | $ | 162.7 | $ | 159.2 | $ | 217.9 | ||||||
Adjustments to reconcile net earnings to net cash flows provided by operating activities: | ||||||||||||
Depreciation, depletion and amortization | 90.3 | 78.3 | 78.0 | |||||||||
Finance fee amortization | 2.0 | 1.2 | 1.2 | |||||||||
Early extinguishment and refinancing of long-term debt | 0.7 | — | 6.9 | |||||||||
Impairment of intangible asset | 3.1 | — | — | |||||||||
Stock-based compensation | 4.9 | 6.1 | 4.9 | |||||||||
Deferred income taxes | (11.3 | ) | (0.1 | ) | 3.6 | |||||||
Net loss in equity investee | 1.4 | — | — | |||||||||
Gain from remeasurement of equity method investment | (59.3 | ) | — | — | ||||||||
Gain from insurance settlement | — | — | (83.3 | ) | ||||||||
Other, net | 4.5 | 4.2 | 0.8 | |||||||||
Insurance receipts for operating purposes, Goderich tornado | — | — | 11.9 | |||||||||
Changes in operating assets and liabilities, net of acquisitions: | ||||||||||||
Receivables | (76.9 | ) | 59.0 | (4.4 | ) | |||||||
Inventories | 65.1 | (90.5 | ) | (21.9 | ) | |||||||
Other assets | 35.4 | (11.3 | ) | (4.7 | ) | |||||||
Accounts payable, income taxes payable and accrued expenses | (56.0 | ) | (65.7 | ) | 35.5 | |||||||
Other liabilities | 0.7 | (2.5 | ) | (3.5 | ) | |||||||
Net cash provided by operating activities | 167.3 | 137.9 | 242.9 | |||||||||
Cash flows from investing activities: | ||||||||||||
Capital expenditures | (182.2 | ) | (217.6 | ) | (125.2 | ) | ||||||
Insurance receipts for investment purposes, Goderich tornado | — | — | 19.4 | |||||||||
Investment in equity method investee | (4.7 | ) | (116.4 | ) | — | |||||||
Acquisition of a business, net of cash and cash equivalents acquired | (277.7 | ) | — | (86.5 | ) | |||||||
Other, net | (3.2 | ) | (1.4 | ) | 3.1 | |||||||
Net cash used in investing activities | (467.8 | ) | (335.4 | ) | (189.2 | ) | ||||||
Cash flows from financing activities: | ||||||||||||
Proceeds from the issuance of long-term debt | 850.9 | 100.0 | 250.0 | |||||||||
Proceeds from revolving credit facility borrowings | 384.3 | 50.0 | — | |||||||||
Principal payments on long-term debt | (535.1 | ) | (3.9 | ) | (102.4 | ) | ||||||
Principal payments on revolving credit facility borrowings | (283.4 | ) | (45.5 | ) | — | |||||||
Premium and other payments to refinance debt | (2.8 | ) | — | (5.5 | ) | |||||||
Deferred financing costs | (5.7 | ) | — | (4.1 | ) | |||||||
Dividends paid | (94.1 | ) | (89.4 | ) | (80.7 | ) | ||||||
Proceeds received from stock option exercises | 0.7 | 2.5 | 7.5 | |||||||||
Excess tax benefits (deficiencies) from equity compensation awards | (0.2 | ) | 0.5 | (0.2 | ) | |||||||
Net cash provided by financing activities | 314.6 | 14.2 | 64.6 | |||||||||
Effect of exchange rate changes on cash and cash equivalents | 4.9 | (25.1 | ) | (11.1 | ) | |||||||
Net change in cash and cash equivalents | 19.0 | (208.4 | ) | 107.2 | ||||||||
Cash and cash equivalents, beginning of the year | 58.4 | 266.8 | 159.6 | |||||||||
Cash and cash equivalents, end of year | $ | 77.4 | $ | 58.4 | $ | 266.8 | ||||||
Supplemental cash flow information: | ||||||||||||
Interest paid, net of amounts capitalized | $ | 26.7 | $ | 20.5 | $ | 13.1 | ||||||
Income taxes paid, net of refunds | $ | 59.4 | $ | 89.4 | $ | 36.2 | ||||||
See Note 3 to the Consolidated Financial Statements for detail regarding the non-cash effects of the current year business acquisition. | ||||||||||||
In connection with the acquisition of Wolf Trax, Inc., the Company assumed liabilities as follows (in millions): | ||||||||||||
Fair value of assets acquired | $ | 99.2 | ||||||||||
Cash paid during the year ended December 31, 2014 | (86.5 | ) | ||||||||||
Liabilities assumed | $ | 12.7 | ||||||||||
The accompanying notes are an integral part of the consolidated financial statements.
57 | ||
COMPASS MINERALS INTERNATIONAL, INC. | 2016 FORM 10-K | |
Notes to Consolidated Financial Statements
1. ORGANIZATION AND FORMATION
Compass Minerals International, Inc. (“CMI”), through its subsidiaries (collectively, “CMP,” “Compass Minerals” or the “Company”), is a leading producer of essential minerals that solve nature’s challenges, including salt for winter roadway safety and other consumer, industrial and agricultural uses, and specialty plant nutrition minerals that improve the quality and yield of crops, and specialty chemicals for water treatment and other industrial processes. The Company’s principal products are salt, consisting of sodium chloride and magnesium chloride, sulfate of potash (“SOP”) and various other micronutrient products. The Company’s production sites are located in the United States (“U.S.”), Canada, Brazil and the United Kingdom (the “U.K.”). The Company also provides records management services to businesses located in the U.K.
CMI is a holding company with no operations other than those of its subsidiaries.
2. SUMMARY OF SIGNIFICANT ACCOUNTING POLICIES
a. Management Estimates:
The preparation of financial statements in conformity with U.S. generally accepted accounting principles (“GAAP”) as included in the Accounting Standards Codification requires management to make estimates and assumptions that affect the amounts reported in the consolidated financial statements and accompanying notes. Actual results could differ from those estimates.
b. Basis of Consolidation:
The Company’s consolidated financial statements include the accounts of CMI and its wholly owned domestic and foreign subsidiaries. All significant intercompany balances and transactions have been eliminated in consolidation.
c. Foreign Currency:
Assets and liabilities are translated into U.S. dollars at end of period exchange rates. Revenues and expenses are translated using the monthly average rates of exchange during the year. Adjustments resulting from the translation of foreign-currency financial statements into the reporting currency, U.S. dollars, are included in accumulated other comprehensive income (loss). The Company recorded foreign exchange gains (losses) of $15.8 million, $(33.7) million and $(18.4) million in 2016, 2015 and 2014, respectively, in accumulated other comprehensive income (loss) related to intercompany notes which were deemed to be of long-term investment nature. Aggregate exchange gains (losses) from transactions denominated in a currency other than the functional currency, which are included in other income (expense), for the years ended December 31, 2016, 2015 and 2014, were $(0.1) million, $13.9 million and $6.6 million, respectively.
d. Revenue Recognition:
The Company typically recognizes revenue at the time of shipment to the customer, which coincides with the transfer of title and risk of ownership to the customer. Sales represent billings to customers net of sales taxes charged for the sale of the product. Sales include amounts charged to customers for shipping and handling costs, which are expensed when the related product is sold.
e. Cash and Cash Equivalents:
The Company considers all investments with original maturities of three months or less to be cash equivalents. The Company maintains the majority of its cash in bank deposit accounts with several commercial banks with high credit ratings in the U.S., Canada, Brazil and Europe. Typically, the Company has bank deposits in excess of federally insured limits. Currently, the Company does not believe it is exposed to significant credit risk on its cash and cash equivalents.
f. Accounts Receivable and Allowance for Doubtful Accounts:
Receivables consist almost entirely of trade accounts receivable. Trade accounts receivable are recorded at the invoiced amount and do not bear interest. The allowance for doubtful accounts is the Company’s best estimate of the amount of probable credit losses in its existing accounts receivable. The Company determines the allowance based on historical write-off experience by business line and a current assessment of its portfolio, including information regarding individual customers. The Company reviews its past due account balances for collectability and adjusts its allowance for doubtful accounts accordingly. Account balances are charged off against the allowance when the Company believes it is probable that the receivable will not be recovered.
g. Inventories:
Inventories are stated at the lower of cost or market. Finished goods and raw material and supply costs are valued using the average cost method. Raw materials and supplies primarily consist of raw materials purchased to aid in the production of mineral products, maintenance materials and packaging materials. Finished goods are primarily comprised of salt, magnesium chloride and plant nutrition products readily available for sale. Substantially all costs associated with the production of finished goods at
58 | ||
COMPASS MINERALS INTERNATIONAL, INC. | 2016 FORM 10-K | |
the Company’s production locations are captured as inventory costs. As required by U.S. GAAP, a portion of the fixed costs at a location are not included in inventory and are expensed as a product cost if production at that location is determined to be abnormally low in any period. Additionally, since the Company’s products are often stored at third-party warehousing locations, the Company includes in the cost of inventory the freight and handling costs necessary to move the product to storage until the product is sold to a customer.
h. Other Current Assets:
In the fourth quarter of 2015, the Company began marketing assets it held which were used for farming. Management remains committed to sell these assets, and the assets continue to be marketed at a reasonable price. The Company has performed an impairment analysis and concluded that the fair market value of these assets exceeds their carrying value. These assets have been recorded in other current assets in the Consolidated Balance Sheets as of December 31, 2016, and December 31, 2015. During the fourth quarter of 2016, a $2.2 million loss was recognized to record inventory at the lower of cost or market. The loss is included in the product cost in the Consolidated Statement of Operations. The amounts classified as held for sale include inventory of approximately $0.5 million, property, plant and equipment of approximately $2.8 million and water rights of approximately $5.2 million. The remaining other amounts included in other current assets as of December 31, 2016, and the amounts recorded as of December 31, 2015, consist principally of prepaid expenses.
i. Property, Plant and Equipment:
Property, plant and equipment is stated at cost and includes capitalized interest. The costs of replacements or renewals, which improve or extend the life of existing property, are capitalized. Maintenance and repairs are expensed as incurred. Upon retirement or disposition of an asset, any resulting gain or loss is included in the Company’s operating results.
Property, plant and equipment also includes mineral interests. The mineral interests for the Company’s Winsford U.K. mine are owned. The Company leases probable mineral reserves at its Cote Blanche and Goderich mines, its Ogden facility and several of its other North American facilities. These leases have varying terms, and many provide for a royalty payment to the lessor based on a specific amount per ton of mineral extracted or as a percentage of revenue. The Company’s rights to extract minerals are contractually limited by time. The Cote Blanche mine is operated under land and mineral leases, and the mineral lease expires in 2060 with two additional 25-year renewal periods. The Goderich mine mineral reserve lease expires in 2022 with the Company’s option to renew until 2043 after demonstrating to the lessor that the mine’s useful life is greater than the lease’s term. The Ogden facility mineral reserve lease renews annually. The Company believes it will be able to continue to extend lease agreements as it has in the past, at commercially reasonable terms, without incurring substantial costs or material modifications to the existing lease terms and conditions, and therefore, management believes that assigned lives are appropriate. The Company’s mineral interests are depleted on a units-of-production basis based upon the latest available mineral study. The weighted average amortization period for these probable mineral reserves is 93 years as of December 31, 2016. The Company also owns other mineral properties. The weighted average life for these probable owned mineral reserves is 40 years as of December 31, 2016 based upon current annual capacities.
Buildings and structures are depreciated on a straight line basis over lives generally ranging from 10 to 30 years. Portable buildings generally have shorter lives than permanent structures. Leasehold and building improvements typically have shorter estimated lives of 5 to 20 years or lower based on the life of the lease to which the improvement relates.
Property, plant and equipment recognized as a result of the full acquisition of Produquímica Indústria e Comércio S.A. (“Produquímica”) (see Note 3) were recorded at fair value as of the acquisition date and are being depreciated based on estimated weighted-average remaining useful lives. The Company’s other fixed assets are amortized on a straight-line basis over their respective lives. The following table summarizes the estimated useful lives of the Company’s different classes of property, plant and equipment:
Years | |
Land improvements | 10 to 25 |
Buildings and structures | 10 to 30 |
Leasehold and building improvements | 5 to 40 |
Machinery and equipment – vehicles | 3 to 10 |
Machinery and equipment – other mining and production | 3 to 50 |
Office furniture and equipment | 3 to 10 |
Mineral interests | 20 to 99 |
The Company has capital leases which are recorded in property, plant and equipment at the beginning of the lease at the lower of the fair value of the leased property or the present value of the minimum lease payments. Lease payments are recorded as interest expense and a reduction of the lease liability. A capital lease asset is depreciated over the lower of its useful life or the lease term.
59 | ||
COMPASS MINERALS INTERNATIONAL, INC. | 2016 FORM 10-K | |
The Company has capitalized computer software costs of $33.9 million and $28.0 million as of December 31, 2016 and 2015, respectively, recorded in property, plant and equipment. The capitalized costs are being amortized over five years. The Company recorded $3.1 million, $2.2 million and $1.6 million of amortization expense for 2016, 2015 and 2014, respectively.
The Company recognizes and measures obligations related to the retirement of tangible long-lived assets in accordance with applicable U.S. GAAP. Asset retirement obligations are not material to the Company’s financial position, results of operations or cash flows.
The Company reviews its long-lived assets and the related mineral reserves for impairment whenever events or changes in circumstances indicate the carrying amounts of such assets may not be recoverable. If an indication of a potential impairment exists, recoverability of the respective assets is determined by comparing the forecasted undiscounted net cash flows of the operation to which the assets relate, to the carrying amount, including associated intangible assets, of such operation. If the operation is determined to be unable to recover the carrying amount of its assets, then intangible assets are written down first, followed by the other long-lived assets of the operation, to fair value. Fair value is determined based on discounted cash flows or appraised values, depending upon the nature of the assets.
j. Goodwill and Intangible Assets:
The Company amortizes its intangible assets deemed to have finite lives on a straight-line basis over their estimated useful lives which, for the Company, range from 4 to 50 years. The Company reviews goodwill and other indefinite-lived intangible assets annually for impairment. In addition, goodwill and other intangible assets are reviewed when an event or change in circumstances indicates the carrying amounts of such assets may not be recoverable.
k. Investments:
The Company uses the equity method of accounting for equity securities when it has significant influence or when it has more than a minor ownership interest or more than minor influence over an investee’s operations but does not have a controlling financial interest. Initial investments are recorded at cost (including certain transaction costs) and are adjusted by the Company’s share of the investees’ undistributed earnings and losses. The Company may recognize its share of an investee’s earnings on a lag, if an investee’s financial results are not available in a timely manner.
Prior to the full acquisition of Produquímica, which was completed on October 3, 2016, the Company’s initial 35% equity interest in Produquímica was accounted for under the equity method of accounting (See Note 3 for more information). As a result of the full acquisition of Produquímica, the Company now also holds a 50% interest in Fermavi Eletroquímica Ltda. (“Fermavi”), which was previously held by Produquímica. Fermavi, which was founded in 1987, is a Brazilian corporation with headquarters in Varginha, Minas Gerais, Brazil, and its operations focus on the production and sale of manganese-based products. The Company’s investment in Fermavi was recorded at its estimated fair value in conjunction with the preliminary purchase price allocation as of the date the Company completed the full acquisition of Produquímica, which was in excess of the book value of net assets acquired. This basis difference was approximately $18 million as of December 31, 2016. The portion of the basis differences related to tangible and intangible assets will be amortized over their remaining useful lives, as appropriate. The Company accounts for its investment in Fermavi under the equity method of accounting.
l. Other Noncurrent Assets:
Other noncurrent assets include certain inventories of spare parts and related inventory, net of reserve, of approximately $11.4 million and $11.0 million at December 31, 2016 and 2015, respectively, which will be utilized with respect to long-lived assets, have been classified in the Consolidated Balance Sheets as other noncurrent assets.
The Company sponsors a non-qualified defined contribution plan for certain of its executive officers and key employees as described in Note 9. As of December 31, 2016 and 2015, investments in marketable securities representing amounts deferred by employees, Company contributions and unrealized gains or losses totaling $1.8 million and $1.6 million, respectively, were included in other noncurrent assets in the Consolidated Balance Sheets. The marketable securities are classified as trading securities and accordingly, gains and losses are recorded as a component of other (income) expense, net in the Consolidated Statements of Operations.
m. Income Taxes:
The Company accounts for income taxes using the liability method in accordance with the provisions of U.S. GAAP. Under the liability method, deferred taxes are determined based on the differences between the financial statement and the tax basis of assets and liabilities using enacted tax rates in effect in the years in which the differences are expected to reverse. The Company’s foreign subsidiaries file separate company returns in their respective jurisdictions.
The Company recognizes potential liabilities in accordance with applicable U.S. GAAP for anticipated tax issues in the U.S. and other tax jurisdictions based on its estimate of whether, and the extent to which, additional taxes will be due. If payment of these amounts ultimately proves to be unnecessary, the reversal of the liabilities would result in tax benefits being recognized in the period when the Company determines the liabilities are no longer necessary. If the Company’s estimate of tax liabilities proves
60 | ||
COMPASS MINERALS INTERNATIONAL, INC. | 2016 FORM 10-K | |
to be less than the ultimate assessment, a further charge to expense would result. Any penalties and interest that are accrued on the Company’s uncertain tax positions are included as a component of income tax expense.
In evaluating the Company’s ability to realize deferred tax assets, the Company considers the sources and timing of taxable income, including the reversal of existing temporary differences, the ability to carryback tax attributes to prior periods, qualifying tax-planning strategies, and estimates of future taxable income exclusive of reversing temporary differences. In determining future taxable income, the Company’s assumptions include the amount of pre-tax operating income according to different state, federal and international taxing jurisdictions, the origination of future temporary differences, and the implementation of feasible and prudent tax-planning strategies.
If the Company determines that a portion of its deferred tax assets will not be realized, a valuation allowance is recorded in the period that such determination is made. In the future, if the Company determines, based on the existence of sufficient evidence, that more or less of the deferred tax assets are more likely than not to be realized, an adjustment to the valuation allowance will be made in the period such a determination is made.
n. Environmental Costs:
Environmental costs, other than those of a capital nature, are accrued at the time the exposure becomes known and costs can be reasonably estimated. Costs are accrued based upon management’s estimates of all direct costs. The Company’s environmental accrual was $1.7 million and $1.4 million at December 31, 2016 and 2015, respectively.
o. Equity Compensation Plans:
The Company has equity compensation plans under the oversight of the Company’s board of directors, whereby stock options, restricted stock units, performance stock units, deferred stock units and shares of common stock are granted to the Company’s employees and directors. See Note 13 for additional discussion.
p. Earnings per Share:
The Company’s participating securities are accounted for in accordance with guidance related to the computation of earnings per share under the two-class method. The two-class method requires allocating the Company’s net earnings to both common shares and participating securities based upon their rights to receive dividends. Basic earnings per share is computed by dividing net earnings available to common shareholders by the weighted-average number of outstanding common shares during the period. Diluted earnings per share reflects the potential dilution that could occur under the more dilutive of either the treasury stock method or the two-class method for calculating the weighted-average number of outstanding common shares. The treasury stock method is calculated assuming unrecognized compensation expense, income tax benefits and proceeds from the potential exercise of employee stock options are used to repurchase common stock.
q. Derivatives:
The Company is exposed to the impact of fluctuations in exchange and interest rates on its borrowings and fluctuations in the purchase price of natural gas consumed in operations. The Company hedges portions of these risks through the use of derivative agreements.
The Company accounts for derivative financial instruments in accordance with applicable U.S. GAAP, which requires companies to record derivative financial instruments as assets or liabilities measured at fair value. Accounting for the changes in the fair value of a derivative depends on its designation and effectiveness. Derivatives qualify for treatment as hedges when there is a high correlation between the change in fair value of the derivative instrument and the related change in value of the underlying hedged item. For qualifying hedges, the effective portion of the change in fair value is recognized through earnings when the underlying transaction being hedged affects earnings, allowing a derivative’s gains and losses to offset related results from the hedged item in the statements of operations. For derivative instruments that are not accounted for as hedges, or for the ineffective portions of qualifying hedges, the change in fair value is recorded through earnings in the period of change. The Company formally documents, designates and assesses the effectiveness of transactions that receive hedge accounting treatment initially and on an ongoing basis.
r. Concentration of Credit Risk:
The Company sells its salt and magnesium chloride products to various governmental agencies, manufacturers, distributors and retailers primarily in the Midwestern U.S. and throughout Canada and the U.K. The Company’s plant nutrition products are sold across the Western Hemisphere and globally. No single customer or group of affiliated customers accounted for more than 10% of the Company’s sales in any year during the three year period ended December 31, 2016, or more than 10% of accounts receivable at December 31, 2016 or 2015.
s. Recent Accounting Pronouncements:
In August 2016, the Financial Accounting Standards Board (the “FASB”) issued guidance to clarify how certain cash receipts and payments should be presented and classified in the statement of cash flows. The guidance is effective for fiscal years beginning after December 15, 2017, including interim periods within those fiscal years, and early adoption is permitted. The Company is
61 | ||
COMPASS MINERALS INTERNATIONAL, INC. | 2016 FORM 10-K | |
currently evaluating the timing of adoption of this guidance and the impact of the adoption of this guidance on its consolidated financial statements.
In June 2016, the FASB issued guidance for estimating credit losses on certain types of financial instruments, including trade receivables, by introducing an approach based on expected losses. The expected loss approach will require entities to incorporate considerations of historical information, current information and reasonable and supportable forecasts. The guidance is effective for fiscal years beginning after December 15, 2019, including interim periods within those fiscal years, requires a modified retrospective transition method and early adoption is permitted. The Company is currently evaluating the impact of the adoption of this guidance on its consolidated financial statements.
In March 2016, the FASB issued guidance to simplify several aspects of the accounting for share-based payment transactions, including the income tax consequences, classification of awards as either equity or liabilities and classification on the statement of cash flows. The guidance is effective for fiscal years beginning after December 15, 2016, including interim periods within those fiscal years, and early adoption is permitted. The Company is currently evaluating the impact of the adoption of this guidance on its consolidated financial statements.
In February 2016, the FASB issued guidance which requires lessees to recognize on their balance sheet a right-of-use asset which represents a lessee’s right to use the underlying asset. Under this guidance, an entity must also recognize a lease liability which represents a lessee’s obligation to make lease payments for the right to use the asset. In addition, the standard requires expanded qualitative and quantitative disclosures. The guidance is effective for fiscal years beginning after December 15, 2018, including interim periods within those fiscal years, and requires a modified retrospective transition method. The Company is currently evaluating the impact of the adoption of this guidance on its consolidated financial statements.
In July 2015, the FASB issued guidance that requires entities to measure inventory within the scope of the standard at the lower of cost or net realizable value. “Net realizable value” is defined as the estimated selling prices in the ordinary course of business, less reasonably predictable costs of completion, disposal and transportation. The guidance is effective for fiscal years beginning after December 15, 2016, and interim periods within those years, and early adoption is permitted. The Company does not plan to early adopt, and the Company does not expect that this guidance will have a material impact on its consolidated financial statements.
In August 2014, the FASB issued guidance which requires management to evaluate whether there is substantial doubt about an entity’s ability to continue as a going concern and to provide disclosure in the footnotes under certain circumstances. The Company adopted this guidance in the fourth quarter of 2016. There was no impact on the Company’s consolidated financial statements.
In May 2014, the FASB issued guidance to provide a single, comprehensive revenue recognition model for all contracts with customers. The new revenue recognition model supersedes existing revenue recognition guidance and requires revenue recognition to depict the transfer of promised goods or services to customers in an amount that reflects the consideration an entity expects to receive in exchange for those goods or services. This guidance is effective for fiscal years beginning after December 15, 2017, and interim periods with those years, and early adoption is permitted. The guidance permits the use of either a full or modified retrospective or cumulative effect transition method. The Company expects to use the modified retrospective transition method. While the Company has not identified any material differences in the amount and timing of revenue recognition for the revenue streams management has reviewed thus far, the Company is still evaluating the impact of this guidance and it has not concluded on the overall impacts of adopting the standard.
3. ACQUISITION
Background and Financing
On December 16, 2015, Compass Minerals do Brasil Ltda., a wholly owned subsidiary of the Company (“Compass Minerals Brazil”), entered into (i) a subscription agreement and other covenants (as amended, the “Subscription Agreement”) with certain shareholders of Produquímica and Produquímica and (ii) a share purchase and sale agreement and other covenants (the “Purchase Agreement”) with certain shareholders of Produquímica and Produquímica. Pursuant to the Subscription Agreement and the Purchase Agreement, Compass Minerals Brazil acquired 35% of the issued and outstanding capital stock of Produquímica on December 23, 2015, for R$452.4 million Brazilian Reais (“R” or “BRL”), or $114.1 million U.S. dollars at closing, and paid additional consideration of $4.7 million in the second quarter of 2016 related to Produquímica’s 2015 financial performance.
The Subscription Agreement also contained a put right (the “Put”), allowing the Produquímica shareholders to sell the remainder of their interests in Produquímica to Compass Minerals Brazil. On August 12, 2016, Produquímica shareholders notified Compass Minerals Brazil of their exercise of the Put. On October 3, 2016, the Company acquired the remaining 65% of the issued and outstanding capital stock of Produquímica.
The Company entered into a new $100.0 million term loan tranche in the fourth quarter of 2015 to fund the acquisition of the 35% of Produquímica’s equity. In September 2016, the Company entered into a new $450.0 million term loan tranche to fund the acquisition of the remaining 65% of Produquímica’s equity. See Note 10 to for more information regarding these financings.
Based in São Paulo, Brazil, Produquímica operates two primary businesses – agricultural productivity and chemical solutions. The agricultural productivity division manufactures and distributes a broad offering of specialty plant nutrition solution-based products. These include micronutrients, controlled release fertilizers and other specialty supplements that are used in direct soil
62 | ||
COMPASS MINERALS INTERNATIONAL, INC. | 2016 FORM 10-K | |
and foliar applications, as well as through irrigation systems and for seed treatment. Many of these products are developed through Produquímica’s research and development capabilities. Produquímica also manufactures and markets specialty chemicals, primarily used in the industrial chemical and water treatment industries in Brazil. The acquisition broadens the Company’s geographic scope of operations and expands its specialty plant nutrition portfolio while reducing the Company’s dependence on winter weather conditions.
Purchase Price Allocation
The Company accounted for the acquisition as a business combination in accordance with U.S. GAAP. The guidance for business combinations requires estimates and judgments regarding expectations for future cash flows of the acquired entity as well as other valuation assumptions and an allocation to the net assets acquired. The fair values assigned to tangible and intangible assets acquired and liabilities assumed, including contingent consideration, are based on management’s best estimates. The preliminary purchase price allocation is not finalized as of December 31, 2016. The preliminary purchase price allocation may be adjusted during the measurement period, which is up to one year after the acquisition date. The Company is currently awaiting additional information to finalize the fair values of intangible assets, intangible and tangible asset useful lives, the final purchase price, additional assumed liabilities and labor and tax contingencies. The Company is not aware of any information that would indicate that the final purchase price will differ significantly from the preliminary estimate.
A summary of the acquisition-date fair value of the consideration transferred is presented in the table below:
Fair Value of Consideration Transferred (in millions) | October 3, 2016 | ||
Cash paid at closing | $ | 317.1 | |
Additional cash due at closing | 20.6 | ||
Fair value of contingent consideration | 31.4 | ||
Fair value of 35% equity investment | 178.7 | ||
Total | $ | 547.8 | |
The calculation of the purchase price at closing was based in part on an estimate of full-year 2016 operating results of Produquímica. As of the acquisition date, some of the periods included in the 2016 operating results of Produquímica had ended and actual results were known. Subsequent to the acquisition date, the purchase price will be adjusted based on the final full-year 2016 operating results of Produquímica. This adjustment will include amounts relating to periods occurring after the closing date, which is considered contingent consideration. As of the closing date, the Company estimated the fair value of contingent consideration to be $31.4 million. There are no thresholds or tiers in the payment structure, and management used an income approach to estimate the fair value of the contingent consideration. The adjustment to the purchase price is expected to be resolved in the first quarter of 2017, and any changes in the fair value of the contingent consideration will be recognized in income or expense.
Prior to the acquisition date, the Company accounted for its 35% interest in Produquímica as an equity method investment. The acquisition-date fair value of the previously held equity investment was $178.7 million and is included in the consideration transferred. To measure the acquisition-date fair value of the equity interest the Company utilized a market-based approach which relied on Level 3 inputs (see Note 14 for a discussion of the levels in the fair value hierarchy). The Company recognized a $59.3 million non-cash gain as a result of remeasuring its prior equity interest in Produquímica held before the business combination. The gain is reported in the “Gain from remeasurement of equity method investment” line item in the Consolidated Statement of Operations.
63 | ||
COMPASS MINERALS INTERNATIONAL, INC. | 2016 FORM 10-K | |
Under the acquisition method of accounting, the total purchase price is allocated on a preliminary basis to Produquímica’s assets and liabilities based upon their estimated fair value as of the date of completion of the acquisition. Based upon the estimated purchase price and the preliminary valuation, the purchase price allocation, which is subject to change based on the Company’s final analysis, is presented in the table below:
Recognized amounts of identifiable assets acquired and liabilities assumed: | Purchase Price Allocation | ||
Cash and cash equivalents | $ | 73.8 | |
Accounts receivable | 89.4 | ||
Inventory | 77.1 | ||
Other current assets | 13.7 | ||
Property, plant and equipment | 189.4 | ||
Identified intangible assets | 81.2 | ||
Investment in equity method investee | 24.5 | ||
Other noncurrent assets | 6.9 | ||
Accounts payable | (27.1 | ) | |
Accrued expenses | (40.3 | ) | |
Current portion of long-term debt | (129.6 | ) | |
Other current liabilities | (14.0 | ) | |
Long-term debt, net of current portion | (62.0 | ) | |
Deferred income taxes, net | (65.2 | ) | |
Other noncurrent liabilities | (26.3 | ) | |
Total identifiable net assets | $ | 191.5 | |
Goodwill | 356.3 | ||
Total fair value of business combination | $ | 547.8 | |
The total purchase price in excess of the net identifiable assets was recognized as goodwill in the amount of $356.3 million at the acquisition date and has been assigned to the Company’s new Plant Nutrition South America segment. The goodwill recognized is attributable primarily to expected synergies with the Company’s existing plant nutrition business and the assembled workforce of Produquímica. The future deductibility of the goodwill for income tax purposes is uncertain at this time.
The Company determined that the book value of the accounts receivables included in the purchase price allocation approximates their fair value due to their short-term nature. The gross contractual amounts of the receivables exceeds their fair value, because the receivables balance has been reduced by an allowance for doubtful accounts.
In connection with the acquisition the Company acquired identifiable intangible assets which consisted principally of trade names, developed technologies and customer relationships. The fair values were determined using Level 3 inputs (see Note 14 for a discussion of the levels in the fair value hierarchy). The fair values of the identifiable intangible assets were estimated using an income approach method. The estimated fair values and weighted average amortization period of the identifiable intangible assets are presented in the table below:
Estimated Fair Value (in millions) | Weighted-Average Amortization Period (in years) | |||
Trade names | $ | 36.9 | 11.0 | |
Developed technology | 37.5 | 5.3 | ||
Customer relationships | 6.8 | 13.5 | ||
Total identifiable intangible assets | $ | 81.2 | 8.6 | |
Impact on Operating Results
During the year ended December 31, 2016, Produquímica contributed revenues of $113.5 million and net income of $3.6 million since the acquisition date of October 3, 2016.
The following table presents the unaudited pro forma results for the full years ended December 31, 2016, and December 31, 2015. The pro forma financial information combines the historical results of operations for Produquímica and Compass Minerals as though the acquisition occurred on January 1, 2015. The pro forma information does not purport to represent the actual results of operations that the Company and Produquímica would have achieved had the companies been combined during the periods
64 | ||
COMPASS MINERALS INTERNATIONAL, INC. | 2016 FORM 10-K | |
presented nor is the information intended to project the future results of operations. Certain adjustments to Produquímica’s historical results have been made to conform to U.S. GAAP, and amounts have been translated to U.S. dollars.
Twelve Months Ended, | ||||||
Unaudited Combined Pro Forma Results of Operations (in millions) | December 31, 2016 | December 31, 2015 | ||||
Revenues | $ | 1,381.3 | $ | 1,421.3 | ||
Net income | 108.1 | 128.0 | ||||
Significant adjustments to the pro forma information above include:
• | Adjustments to exclude non-recurring direct incremental costs of the acquisition |
• | Adjustments to expenses relating to the financing transactions described above |
• | Adjustments to reflect incremental amortization and depreciation from the preliminary allocation of the purchase price |
• | Adjustments to reflect certain income tax effects of the acquisition |
• | Adjustments to remove net loss related to the previously held 35% equity interest in Produquímica |
• | Adjustment to remove the gain from the remeasurement of the previously held 35% equity interest in Produquímica |
The Company incurred acquisition costs of $1.8 million that were expensed during the year ended December 31, 2016. These costs are included in the “Selling, general and administrative expenses” line item in the Consolidated Statement of Operations.
4. GODERICH TORNADO
In August 2011, a tornado struck the Company’s salt mine and its salt mechanical evaporation plant, both located in Goderich, Ontario. There was no damage to the underground operations at the mine. However, some of the mine’s surface structures and the evaporation plant incurred significant damage, which temporarily ceased production at both facilities. Both facilities resumed normal production and shipping activities in 2012.
The Company recorded impairment of its property, plant and equipment and clean-up and restoration costs during 2011 through 2013 related to the impacted areas at both of the Goderich facilities. There were no material expenses or charges related to the tornado in 2014. In the third quarter of 2014, the Company settled its insurance claim related to the tornado. The settlement included a substantial amount related to business interruption losses. Cumulatively, the Company received $114.9 million in cash from 2011 to 2014. In connection with the settlement, the Company released its deferred revenue balance of $83.3 million and recorded a gain of $82.3 million as a reduction to product cost and approximately $1.0 million as a reduction to selling, general and administrative expenses in its Consolidated Statements of Operations for the third quarter of 2014.
5. INVENTORIES
Inventories consist of the following at December 31 (in millions):
2016 | 2015 | |||||||
Finished goods | $ | 206.1 | $ | 223.1 | ||||
Raw materials and supplies | 74.5 | 52.2 | ||||||
Total inventories | $ | 280.6 | $ | 275.3 | ||||
6. PROPERTY, PLANT AND EQUIPMENT
Property, plant and equipment consists of the following at December 31 (in millions):
2016 | 2015 | |||||||
Land, buildings and structures and leasehold improvements | $ | 480.1 | $ | 347.3 | ||||
Machinery and equipment | 848.2 | 701.5 | ||||||
Office furniture and equipment | 28.3 | 25.4 | ||||||
Mineral interests | 168.5 | 169.6 | ||||||
Construction in progress | 243.6 | 191.5 | ||||||
1,768.7 | 1,435.3 | |||||||
Less accumulated depreciation and depletion | (676.4 | ) | (634.6 | ) | ||||
Property, plant and equipment, net | $ | 1,092.3 | $ | 800.7 | ||||
65 | ||
COMPASS MINERALS INTERNATIONAL, INC. | 2016 FORM 10-K | |
The cost of leased property, plant and equipment under capital leases included above was $7.3 million and accumulated depreciation was $2.2 million as of December 31, 2016. There was one capital lease recorded as of December 31, 2015.
7. GOODWILL AND OTHER INTANGIBLE ASSETS
The asset value and accumulated amortization as of December 31, 2016 and December 31, 2015 for the finite-lived intangibles assets are as follows (in millions):
Supply Agreement | SOP Production Rights | Customer/ Distributor Relationships | Lease Rights | Trade names | Developed Technologies | Patents | Other | Total | |||||||||||||||||||
December 31, 2016 | |||||||||||||||||||||||||||
Gross intangible asset | $ | 27.0 | $ | 24.3 | $ | 13.8 | $ | 1.7 | $ | 43.6 | $ | 38.9 | $ | 15.4 | $ | 2.2 | $ | 166.9 | |||||||||
Accumulated amortization | (3.2 | ) | (12.7 | ) | (3.0 | ) | (0.3 | ) | (0.8 | ) | (3.2 | ) | (3.7 | ) | (0.7 | ) | (27.6 | ) | |||||||||
Net intangible assets | $ | 23.8 | $ | 11.6 | $ | 10.8 | $ | 1.4 | $ | 42.8 | $ | 35.7 | $ | 11.7 | $ | 1.5 | $ | 139.3 | |||||||||
Supply Agreement | SOP Production Rights | Customer/Distributor Relationships | Lease Rights | Patents | Other | Total | ||||||||||||||||||||||
December 31, 2015 | ||||||||||||||||||||||||||||
Gross intangible asset | $ | 26.1 | $ | 24.3 | $ | 7.0 | $ | 1.6 | $ | 14.9 | $ | 3.9 | $ | 77.8 | ||||||||||||||
Accumulated amortization | (2.6 | ) | (11.7 | ) | (2.5 | ) | (0.2 | ) | (2.3 | ) | (1.2 | ) | (20.5 | ) | ||||||||||||||
Net intangible assets | $ | 23.5 | $ | 12.6 | $ | 4.5 | $ | 1.4 | $ | 12.6 | $ | 2.7 | $ | 57.3 | ||||||||||||||
The estimated lives of the Company’s definite-lived intangible assets are as follows:
Intangible asset | Estimated Lives |
Supply agreement | 50 years |
SOP production rights | 25 years |
Patents | 10-20 years |
Developed technology | 4-7 years |
Lease rights | 25 years |
Customer and distributor relationships | 10-14 years |
Trademarks | 10 years |
Noncompete agreements | 5 years |
Trade names | 10-11 years |
None of the finite-lived intangible assets have a residual value. Aggregate amortization expense was $7.0 million in 2016, $4.4 million in 2015 and $4.3 million in 2014 and is projected to be between $12 million and $17 million per year over the next five years. The weighted average life for the Company’s finite-lived intangibles is 18 years.
In addition, the Company had water rights of $17.7 million as of December 31, 2016, and December 31, 2015, and trade names of $0.6 million and $10.3 million as of December 31, 2016, and December 31, 2015, respectively, which have indefinite lives. In the fourth quarter of 2015, the Company reclassified water rights of $5.2 million as assets held for sale (see Note 2 for more information). In the fourth quarter of 2016, the Company recorded a $3.1 million impairment of its Wolf Trax trade name acquired in 2014 as part of its annual impairment assessment. The estimated fair value as of October 1, 2016, of the trade name was calculated using Level 3 inputs and an income-based valuation approach. The impairment loss was recorded in its Plant Nutrition North America segment in selling, general and administrative expenses in the Consolidated Statements of Operations. In addition, the Company has determined that the Wolf Trax trade name no longer has an indefinite life and it will begin amortizing the trade name over 10 years.
The Company has goodwill of $412.2 million and $58.1 million as of December 31, 2016, and December 31, 2015, in its Consolidated Balance Sheets. Approximately $53.6 million and $51.7 million of the amounts recorded for goodwill as of December 31, 2016, and December 31, 2015, respectively, were recorded in the Company’s Plant Nutrition North America segment. Additionally, as of December 31, 2016, $352.8 million of goodwill was recorded in the Company’s new Plant Nutrition South
66 | ||
COMPASS MINERALS INTERNATIONAL, INC. | 2016 FORM 10-K | |
America segment. The remaining amounts in both periods were immaterial and recorded in its corporate and other and salt segment. The increase in the balance of goodwill from December 31, 2015, was primarily due to the completion of the acquisition of Produquímica which comprises the Company’s new Plant Nutrition South America segment (see Note 3 for more information). $1.8 million of the increase was due to changes in foreign currency exchange rates.
8. INCOME TAXES
The Company files tax returns in the U.S., Canada, Brazil and the U.K. at the federal and local taxing jurisdictional levels. The Company’s U.S. federal tax returns for tax years 2012 forward remain open and subject to examination. Generally, the Company’s state, local and foreign tax returns for years as early as 2003 forward remain open and subject to examination, depending on the jurisdiction.
The following table summarizes the Company’s income tax provision (benefit) related to earnings for the years ended December 31 (in millions):
2016 | 2015 | 2014 | ||||||||||
Current: | ||||||||||||
Federal | $ | 27.6 | $ | 31.7 | $ | 37.4 | ||||||
State | 6.7 | 7.3 | 9.5 | |||||||||
Foreign | 11.6 | 16.4 | 23.4 | |||||||||
Total current | 45.9 | 55.4 | 70.3 | |||||||||
Deferred: | ||||||||||||
Federal | (2.8 | ) | (0.2 | ) | (3.6 | ) | ||||||
State | (0.7 | ) | — | (0.9 | ) | |||||||
Foreign | (7.8 | ) | 0.1 | 8.1 | ||||||||
Total deferred | (11.3 | ) | (0.1 | ) | 3.6 | |||||||
Total provision for income taxes | $ | 34.6 | $ | 55.3 | $ | 73.9 | ||||||
The following table summarizes components of earnings before taxes and shows the tax effects of significant adjustments from the expected tax expense computed at the federal statutory rate for the years ended December 31 (in millions):
2016 | 2015 | 2014 | ||||||||||
Domestic income | $ | 123.6 | $ | 170.6 | $ | 184.3 | ||||||
Foreign income | 73.7 | 43.9 | 107.5 | |||||||||
Earnings before income taxes | 197.3 | 214.5 | 291.8 | |||||||||
Computed tax at the U.S. federal statutory rate of 35% | 69.1 | 75.1 | 102.1 | |||||||||
Foreign income rate differential, mining, and withholding taxes, net of U.S. federal deduction | (1.7 | ) | (1.2 | ) | (9.3 | ) | ||||||
Percentage depletion in excess of basis | (8.6 | ) | (11.2 | ) | (11.8 | ) | ||||||
Other domestic tax reserves, net of reversals | — | (4.5 | ) | (3.9 | ) | |||||||
Domestic manufacturers deduction | (1.4 | ) | (2.4 | ) | (2.5 | ) | ||||||
State income taxes, net of federal income tax benefit | 3.9 | 5.1 | 5.5 | |||||||||
Interest expense recognition differences | (5.9 | ) | (6.1 | ) | (7.1 | ) | ||||||
Nontaxable remeasurement gain | (20.2 | ) | — | — | ||||||||
Other, net | (0.6 | ) | 0.5 | 0.9 | ||||||||
Provision for income taxes | $ | 34.6 | $ | 55.3 | $ | 73.9 | ||||||
Effective tax rate | 18 | % | 26 | % | 25 | % | ||||||
67 | ||
COMPASS MINERALS INTERNATIONAL, INC. | 2016 FORM 10-K | |
Under U.S. GAAP, deferred tax assets and liabilities are recognized for the estimated future tax effects, based on enacted tax law, of temporary differences between the values of assets and liabilities recorded for financial reporting and tax purposes, and of net operating losses and other carryforwards. The significant components of the Company’s deferred tax assets and liabilities were as follows at December 31 (in millions):
2016 | 2015 | |||||||
Deferred tax assets: | ||||||||
Reluz Nordeste Indústria e Comércio Ltda net operating loss carryforwards | $ | 1.2 | $ | — | ||||
Other, net | 0.3 | — | ||||||
Total deferred tax assets: | $ | 1.5 | $ | — | ||||
Deferred tax assets to be netted with deferred tax liabilities: | ||||||||
Net operating loss carryforwards | $ | 17.8 | $ | 2.6 | ||||
Stock-based compensation | 4.0 | 4.7 | ||||||
Derivatives | 8.7 | — | ||||||
Other, net | 23.9 | 12.5 | ||||||
Total deferred tax assets before valuation allowance | 54.4 | 19.8 | ||||||
Valuation allowance | (33.6 | ) | (0.9 | ) | ||||
Total deferred tax assets to be netted with deferred tax liabilities | 20.8 | 18.9 | ||||||
Deferred tax liabilities: | ||||||||
Property, plant and equipment | 101.4 | 73.0 | ||||||
Intangible asset | 49.0 | 13.9 | ||||||
Other, net | 1.2 | 3.3 | ||||||
Total deferred tax liabilities | 151.6 | 90.2 | ||||||
Net deferred tax liabilities | $ | 130.8 | $ | 71.3 | ||||
At December 31, 2016, the Company had $53.6 million of gross foreign federal net operating loss (“NOL”) carryforwards that have no expiration date, $7.5 million of gross foreign federal NOL carryforwards which expire in 2033 and $0.9 million of net operating tax-effected state NOL carryforwards which expire in 2033.
The Company has recorded a valuation allowance for a portion of its deferred tax asset relating to various tax attributes that it does not believe are, more likely than not to be realized. As of December 31, 2016 and 2015, the Company’s valuation allowance was $33.6 million and $0.9 million, respectively. In the future, if the Company determines, based on existence of sufficient evidence, that it should realize more or less of its deferred tax assets, an adjustment to the valuation allowance will be made in the period such a determination is made.
The calculation of the Company’s tax liabilities involves dealing with uncertainties in the application of complex tax regulations in multiple jurisdictions. The Company recognizes potential liabilities for unrecognized tax benefits in the U.S. and other tax jurisdictions in accordance with applicable U.S. GAAP, which requires uncertain tax positions to be recognized only if they are more likely than not to be upheld based on their technical merits. The measurement of the uncertain tax position is based on the largest benefit amount that is more likely than not (determined on a cumulative probability basis) to be realized upon settlement of the matter. If payment of these amounts ultimately proves to be unnecessary, the reversal of the liabilities would result in tax benefits being recognized in the period when the Company determines the liabilities are no longer necessary. If the Company’s estimate of tax liabilities proves to be less than the ultimate assessment, a further charge to expense may result.
The Company’s uncertain tax positions primarily relate to transactions and deductions involving U.S., Canadian and Brazilian operations. If favorably resolved, $8.4 million of unrecognized tax benefits would decrease the Company’s effective tax rate. Management believes that it is reasonably possible that unrecognized tax benefits will decrease by approximately $0.3 million in the next twelve months largely as a result of tax returns being closed to future audits. In the fourth quarter of 2016, the Company’s income tax expense included a benefit of approximately $0.6 million related to the release of uncertain tax positions due to the expiration of statutes of limitations.
68 | ||
COMPASS MINERALS INTERNATIONAL, INC. | 2016 FORM 10-K | |
The following table shows a reconciliation of the beginning and ending amount of unrecognized tax benefits (in millions):
2016 | 2015 | 2014 | ||||||||||
Unrecognized tax benefits: | ||||||||||||
Balance at January 1 | $ | 18.3 | $ | 21.8 | $ | 24.6 | ||||||
Additions resulting from current year tax positions | 0.1 | 1.6 | 1.0 | |||||||||
Additions relating to tax positions taken in prior years | 0.5 | 0.8 | 1.1 | |||||||||
Additions relating to current year acquisitions | 2.4 | — | — | |||||||||
Reductions due to cash payments | — | (0.8 | ) | (0.3 | ) | |||||||
Reductions relating to tax positions taken in prior years | — | (2.4 | ) | (1.2 | ) | |||||||
Reductions due to expiration of tax years | (0.6 | ) | (2.7 | ) | (3.4 | ) | ||||||
Balance at December 31 | $ | 20.7 | $ | 18.3 | $ | 21.8 | ||||||
The Company accrues interest and penalties related to its uncertain tax positions within its tax provision. During the years ended December 31, 2016, 2015 and 2014, the Company accrued interest and penalties, net of reversals, of $0.9 million, $0.2 million and $0.6 million, respectively. As of December 31, 2016 and 2015, accrued interest and penalties included in the Consolidated Balance Sheets totaled $6.3 million (including $1.0 million from current year acquisitions) and $4.2 million, respectively.
The Company does not provide U.S. federal income taxes on undistributed earnings of foreign companies that are not currently taxable in the U.S. No undistributed earnings of foreign companies were subject to U.S. income tax in the years ended December 31, 2016, 2015 and 2014. Total undistributed earnings on which no U.S. federal income tax has been provided were $468.7 million at December 31, 2016. It is not practicable to estimate the amount of tax that might be payable if some or all of such earnings were to be repatriated, and the amount of foreign tax credits would be available to reduce the resulting U.S. income tax liability. As of December 31, 2016, the Company had $70.8 million of cash and cash equivalents in its Consolidated Balance Sheets that were either held directly or indirectly by foreign subsidiaries.
Canadian provincial tax authorities have challenged tax positions claimed by one of the Company’s Canadian subsidiaries and have issued tax reassessments for years 2002-2011. The reassessments are a result of ongoing audits and total $91.8 million, including interest through December 31, 2016. The Company disputes these reassessments and plans to continue to work with the appropriate authorities in Canada to resolve the dispute. There is a reasonable possibility that the ultimate resolution of this dispute, and any related disputes for other open tax years, may be materially higher or lower than the amounts the Company has reserved for such disputes. In connection with this dispute, local regulations require the Company to post security with the tax authority until the dispute is resolved. The Company has posted collateral in the form of a $59.3 million performance bond and has paid $32.8 million (most of which is recorded in other assets in the Consolidated Balance Sheets), which is necessary to proceed with future appeals or litigation.
In addition, Canadian federal and provincial taxing authorities have reassessed the Company for years 2004-2006, which have been previously settled by agreement among the Company, the Canadian federal taxing authority and the U.S. federal taxing authority. The Company has fully complied with the agreement since entering into it and believes this action is highly unusual. The Company is seeking to enforce the agreement, which provided the basis upon which the returns were previously filed and settled. The total amount of the reassessments, including penalties and interest through December 31, 2016, related to this matter totals approximately $94.1 million. The Company has posted collateral in the form of a $21.2 million performance bond and a $36.0 million bank letter guarantee, which is necessary to proceed with future appeals or litigation. In July 2016, a trial commenced in the Tax Court of Canada with respect to the Canadian federal tax issues for these matters. Written closing arguments were submitted in September 2016, and the outcome of the trial is pending.
The Company received Canadian income tax reassessments for years 2007-2008. The total amount of the reassessments, including penalties and interest through December 31, 2016, related to this matter is approximately $33.6 million. The Company does not agree with these adjustments and is receiving assistance from the tax jurisdictions for relief from the impact of double taxation as available in the tax treaty between the U.S. and Canada. The Company has filed protective Notices of Objection and has posted collateral in the form of a $9.5 million performance bond and a $9.8 million bank letter guarantee, which is necessary to proceed with future appeals or litigation. Although the outcome of examinations by taxing authorities is uncertain, the Company believes it has adequately reserved for this matter.
The Company will be required by the same local regulations to provide security for additional interest on the above disputed amounts and for any future reassessments issued by these Canadian tax authorities in the form of cash, letters of credit, performance bonds, asset liens or other arrangements agreeable with the tax authorities until the dispute is resolved.
The Company expects that the ultimate outcome of these matters will not have a material impact on its results of operations or financial condition. However, the Company can provide no assurance as to the ultimate outcome of these matters and the impact
69 | ||
COMPASS MINERALS INTERNATIONAL, INC. | 2016 FORM 10-K | |
could be material if they are not resolved in the Company’s favor. As of December 31, 2016, the amount reserved related to these reassessments was immaterial to the Company’s Consolidated Financial Statements.
Additionally, the Company has other uncertain tax positions as well as assessments and disputed positions with taxing authorities in its various jurisdictions.
9. PENSION PLANS AND OTHER BENEFITS
The Company has a defined benefit pension plan for certain of its U.K. employees. Benefits of this pension plan are based on a combination of years of service and compensation levels. This plan was closed to new participants in 1992. Beginning December 1, 2008, future benefits ceased to accrue for the remaining active employee participants in the pension plan concurrent with the establishment of a defined contribution plan for these employees. In addition, the Company has a defined benefit plan with certain Produquímica employees. The pension assets, obligations and net pension expense related to this plan are immaterial.
The Company’s U.K. pension fund investment strategy is to maximize return on investments while minimizing risk. This is accomplished by investing in high-grade equity and debt securities. The Company’s portfolio guidelines recommend that equity securities comprise approximately 75% of the total portfolio and that approximately 25% be invested in debt securities. In 2015 and 2016, the Company’s portfolio shifted to a smaller proportion of equity funds due to the increased volatility of these funds over the last several years, and it is researching strategies that will reduce volatility, while also maximizing returns. Investment strategies and portfolio allocations are based on the plan’s benefit obligations and its funded or underfunded status, expected returns, and the Company’s portfolio guidelines and are monitored on a regular basis. The weighted-average asset allocations by asset category are as follows:
Plan Assets at December 31, | ||||||
Asset Category | 2016 | 2015 | ||||
Cash and cash equivalents | 3 | % | 1 | % | ||
Blended funds | 30 | % | 32 | % | ||
Bond funds | 48 | % | 45 | % | ||
Insurance policy | 19 | % | 22 | % | ||
Total | 100 | % | 100 | % | ||
The fair value of the Company’s U.K. pension plan assets at December 31, 2016 and 2015 by asset category (see Note 14 for a discussion regarding fair value measurements) are as follows (in millions):
Market Value at December 31, 2016 | Level One | Level Two | Level Three | |||||||||||||
Asset category: | ||||||||||||||||
Cash and cash equivalents(a) | $ | 2.0 | $ | 2.0 | $ | — | $ | — | ||||||||
Blended funds(b) | 18.9 | — | 18.9 | — | ||||||||||||
Bond funds(c): | ||||||||||||||||
Treasuries | 29.5 | — | 29.5 | — | ||||||||||||
Insurance policy(d) | 11.9 | — | — | 11.9 | ||||||||||||
Total Pension Assets | $ | 62.3 | $ | 2.0 | $ | 48.4 | $ | 11.9 | ||||||||
70 | ||
COMPASS MINERALS INTERNATIONAL, INC. | 2016 FORM 10-K | |
Market Value at December 31, 2015 | Level One | Level Two | Level Three | |||||||||||||
Asset category: | ||||||||||||||||
Cash and cash equivalents(a) | $ | 0.9 | $ | 0.9 | $ | — | $ | — | ||||||||
Blended funds(b) | 21.1 | — | 21.1 | — | ||||||||||||
Bond funds(c): | ||||||||||||||||
Treasuries | 30.3 | — | 30.3 | — | ||||||||||||
Insurance policy(d) | 14.6 | — | — | 14.6 | ||||||||||||
Total Pension Assets | $ | 66.9 | $ | 0.9 | $ | 51.4 | $ | 14.6 | ||||||||
(a) | The fair value of cash and cash equivalents is its carrying value. |
(b) | The Company is invested in a diversified growth fund. The diversified growth fund is valued at the last traded or official close for the underlying equities and bid or mid for the underlying fixed income securities depending on the portfolio benchmark. Where representative prices are unavailable, underlying fixed income investments are valued based on other observable market-based inputs. |
(c) | This category includes investments in investment-grade fixed-income instruments and funds linked to U.K. treasury notes. The funds are valued using the bid amounts for each fund. All of the Company’s bond fund pension assets are invested in U.K.-linked treasuries as of December 31, 2016 and December 31, 2015. |
(d) | The insurance policy has been written by an insurance company with an A+ rating from Standard and Poors. The policy derives its value primarily from its underlying investments which consists of separate funds also managed by the underwriter. The policy’s holdings consist primarily of a unit trust fund, which is valued based on its underlying holdings of equities, fixed income securities, cash and derivative instruments. Those underlying investments are valued at bid price on the last business day of the period when available. Other investments use the last available authorized price of the last business day of the period. Unquoted investments are valued based upon the fund manager’s opinion of fair value based primarily on other observable market-based inputs. Open positions in derivative contracts or foreign currency transactions are included at their mark to market value. Money market instruments are valued based upon amortized cost. Term deposits are valued at their nominal value. |
The changes in Level 3 U.K. pension plan assets for the year ended December 31, 2016 were as follows (in millions):
Year Ended December 31, 2016 | Value of Insurance Policy | |||
Beginning balance as of January 1, 2016 | $ | 14.6 | ||
Purchase | — | |||
Unrealized loss | (0.4 | ) | ||
Currency fluctuation adjustment | (2.3 | ) | ||
Ending balance as of December 31, 2016 | $ | 11.9 | ||
As of December 31, 2016, and 2015, amounts recognized in accumulated other comprehensive income, net of tax, consisted of actuarial net losses of $3.7 million (including $5.1 million of accumulated loss less prior service cost of $1.4 million) and $3.8 million (including $5.6 million of accumulated loss less prior service cost of $1.8 million), respectively. During 2016, the amounts recognized in accumulated other comprehensive income (loss), net of tax, consisted of actuarial net losses of $(1.0) million, amortization of loss of $0.3 million, amortization of prior service cost of $(0.1) million and foreign exchange of $0.9 million. During 2015, the amounts recognized in accumulated other comprehensive income (loss), net of tax, consisted of actuarial net losses of $3.7 million, amortization of loss of $1.2 million, amortization of prior service cost of $(0.1) million and foreign exchange of $0.4 million. During 2014, the amounts recognized in accumulated other comprehensive income (loss), net of tax, consisted of actuarial net losses of $(1.6) million, amortization of loss of $1.4 million, amortization of prior service cost of $(0.1) million and foreign exchange of $0.6 million. The Company expects to recognize approximately $0.3 million ($0.4 million of amortization of loss less $0.1 million of prior service cost) of losses from accumulated other comprehensive income as a component of net periodic benefit cost in 2017. Total net periodic benefit cost (benefit) in 2017 is expected to be $(0.3) million.
The assumptions used in determining pension information for the plans for the years ended December 31 were as follows:
2016 | 2015 | 2014 | |||||||
Discount rate | 3.80 | % | 3.40 | % | 4.40 | % | |||
Expected return on plan assets | 4.50 | % | 4.30 | % | 5.30 | % | |||
The overall expected long-term rate of return on plan assets is a weighted-average expectation based on the fair value of targeted and expected portfolio composition. The Company considers historical performance and current benchmarks to arrive at expected long-term rates of return in each asset category. The Company determines its discount rate based on a forward yield curve for a
71 | ||
COMPASS MINERALS INTERNATIONAL, INC. | 2016 FORM 10-K | |
portfolio of high-credit-quality bonds with expected cash flows and an average duration closely matching the expected benefit payments under the plan.
The Company’s funding policy is to make the minimum annual contributions required by applicable regulations or agreements with the plan administrator. Management expects total contributions during 2017 will be approximately $1.2 million. In addition, the Company may periodically make contributions to the plan based upon the underfunded status of the plan or other transactions, which warrant incremental contributions in the judgment of management.
The U.K. pension plan includes a provision whereby supplemental benefits may be available to participants under certain circumstances after case review and approval by the plan trustees. Because instances of this type of benefit have historically been infrequent, the development of the projected benefit obligation and net periodic pension cost has not provided for any future supplemental benefits. If additional benefits are approved by the trustees, it is likely that an additional contribution would be required and the amount of incremental benefits would be expensed by the Company.
The Company expects to pay the following benefit payments (in millions):
Calendar Year | Future Expected Benefit Payments | ||
2017 | $ | 2.4 | |
2018 | 2.4 | ||
2019 | 2.5 | ||
2020 | 2.6 | ||
2021 | 2.7 | ||
2022 – 2026 | 14.8 | ||
The following table sets forth pension obligations and plan assets for the Company’s defined benefit plan, as of December 31 (in millions):
2016 | 2015 | |||||||
Change in benefit obligation: | ||||||||
Benefit obligation as of January 1 | $ | 66.9 | $ | 76.8 | ||||
Interest cost | 2.3 | 2.5 | ||||||
Actuarial (gain) loss | 7.3 | (5.5 | ) | |||||
Benefits paid | (3.4 | ) | (2.9 | ) | ||||
Currency fluctuation adjustment | (11.4 | ) | (4.0 | ) | ||||
Benefit obligation as of December 31 | 61.7 | 66.9 | ||||||
Change in plan assets: | ||||||||
Fair value as of January 1 | 66.9 | 70.3 | ||||||
Actual return | 8.8 | 1.9 | ||||||
Company contributions | 1.4 | 1.5 | ||||||
Currency fluctuation adjustment | (11.4 | ) | (3.9 | ) | ||||
Benefits paid | (3.4 | ) | (2.9 | ) | ||||
Fair value of plan assets as of December 31 | 62.3 | 66.9 | ||||||
Overfunded status of the plan | $ | 0.6 | $ | — | ||||
The Company’s defined benefit plan was overfunded as of December 31, 2016 and accordingly, $0.6 million has been recorded as a noncurrent asset in the Consolidated Balance Sheets. The defined benefit plan was adequately funded as of December 31, 2015 and accordingly, an immaterial noncurrent asset has been recorded in the Consolidated Balance Sheets. The accumulated benefit obligation for the defined benefit pension plan was $61.7 million and $66.9 million as of December 31, 2016 and 2015, respectively. The plan assets were in excess of the accumulated benefit obligation as of December 31, 2016. The accumulated benefit obligation was approximately the same as the plan’s assets as of December 31, 2015. The vested benefit obligation is the actuarial present value of the vested benefits to which the employee is currently entitled but based on the employee’s expected date of retirement. Since all employees are vested, the accumulated benefit obligation and the vested benefit obligation are the same amount.
72 | ||
COMPASS MINERALS INTERNATIONAL, INC. | 2016 FORM 10-K | |
The Company uses a straight-line methodology of amortization subject to a corridor based upon the higher of the fair value of assets and the pension benefit obligation over a five-year period. The components of net pension expense were as follows for the years ended December 31 (in millions):
2016 | 2015 | 2014 | ||||||||||
Interest cost on projected benefit obligation | $ | 2.3 | $ | 2.5 | $ | 3.2 | ||||||
Prior service cost | (0.1 | ) | (0.1 | ) | (0.1 | ) | ||||||
Expected return on plan assets | (2.8 | ) | (2.9 | ) | (3.5 | ) | ||||||
Net amortization | 0.4 | 1.5 | 1.7 | |||||||||
Net pension expense | $ | (0.2 | ) | $ | 1.0 | $ | 1.3 | |||||
The Company has defined contribution and pre-tax savings plans (the “Savings Plans”) for certain of its employees. Under each of the Savings Plans, participants are permitted to defer a portion of their compensation. Company matching contributions to the Savings Plans are based on a percentage of employee contributions. Additionally, certain of the Savings Plans have a profit sharing feature for salaried and non-union hourly employees. The Company contribution to the profit-sharing feature is based on the employee’s pay and the Company’s financial performance. Expense attributable to all Savings Plans was $10.9 million, $8.9 million and $11.5 million for the years ended December 31, 2016, 2015 and 2014, respectively.
The Savings Plans include a non-qualified plan for its executive officers and other key employees who are limited in their ability to participate in qualified plans due to existing regulations. These employees are allowed to defer a portion of their compensation, upon which they will be entitled to receive Company contributions as if the limitations imposed by current U.S. regulations for qualified plans were not in place. The Company’s contributions include matching contributions based on a percentage of the employee’s deferred salary, profit sharing contributions and any investment income (loss) that would have been credited to their account had the contributions been made according to employee-designated investment specifications. Although not required to do so, the Company invests amounts equal to the salary deferrals, the corresponding Company match and profit sharing amounts according to the employee-designated investment specifications. As of December 31, 2016 and 2015, investments in marketable securities totaling $1.8 million and $1.6 million, respectively, were included in other noncurrent assets with a corresponding deferred compensation liability included in other noncurrent liabilities in the Consolidated Balance Sheets. Compensation expense recorded for this plan totaled $0.1 million for each of the years ended December 31, 2016, 2015 and 2014. The total including amounts attributable to investment income was immaterial in 2016, 2015 and 2014, and was included in other, net in the Consolidated Statements of Operations.
10. LONG TERM DEBT
In December 2013, the Company amended and extended its existing $125 million revolving credit facility to August 2017 (previously October 2015). In connection with this transaction, the Company paid and capitalized approximately $0.6 million of deferred financing costs. In December 2015, the Company amended its 2012 senior secured credit facility to enter into a new U.S. dollars denominated $100.0 million Term Loan E with certain existing lenders. The proceeds were used to fund the acquisition of 35% of Produquímica’s equity. In connection with the Term Loan E transaction, the Company paid and expensed approximately $0.3 million in fees in other expense in its Consolidated Statements of Operations in 2015.
In April 2016, the Company entered into a new credit agreement (as amended, the “Credit Agreement”) to refinance its existing senior secured facilities, consisting of $471 million of term loans and a $125 million revolving credit facility, with a new senior secured credit facilities, consisting of a $400 million term loan and a $300 million revolving credit facility. The new term loan and revolving credit facility mature July 1, 2021, and bear interest at the Eurodollar rate (“LIBOR”) plus 1.75% based on the Company’s current leverage ratio and credit rating. In connection with the refinancing, the Company incurred $5.8 million of refinancing fees ($1.4 million was recorded as an expense and $4.4 million was capitalized as deferred financing costs) and wrote-off $0.1 million of existing deferred financing costs related to its previous term loans and revolving credit facility. In September 2016, the Company amended the Credit Agreement and entered into a new $450 million term loan tranche to fund the acquisition of the remaining 65% of Produquímica’s equity in October 2016 (see Note 3). This additional term loan tranche will mature July 1, 2021, and bears interest at LIBOR plus 2.0%. In connection with this transaction, the Company incurred $2.2 million of financing fees ($0.7 million was recorded as an expense and $1.5 million was capitalized as deferred financing costs).
Under the revolving credit facility, $40 million may be drawn in Canadian dollars and $10 million may be drawn in British pounds sterling. Additionally, the revolving credit facility includes a sub-limit for short-term letters of credit in an amount not to exceed $50 million. As of December 31, 2016, there was $105.4 million outstanding under the revolving credit facility, and, after deducting outstanding letters of credit totaling $6.2 million, the Company’s borrowing availability was $188.4 million. The Company incurs participation fees related to its outstanding letters of credit and commitment fees on its available borrowing capacity. The rates vary depending on the Company’s leverage ratio. Bank fees are not material.
73 | ||
COMPASS MINERALS INTERNATIONAL, INC. | 2016 FORM 10-K | |
The Company’s outstanding term loans are due in quarterly installments of principal and interest. The term loans can be prepaid at any time without penalty. Interest on the Company’s outstanding Credit Agreement borrowings is variable based on either the LIBOR or a base rate (defined as the greater of a specified U.S. or Canadian prime lending rate or the federal funds effective rate, increased by 0.5%) plus a margin, which is dependent upon the Company’s leverage ratio and the type of term loan borrowing. As of December 31, 2016, the weighted average interest rate was 2.5% on all borrowings outstanding under the Credit Agreement.
The Company’s Credit Agreement borrowings are secured by substantially all existing and future U.S. assets of the Company, the Goderich mine in Ontario, Canada, and capital stock of certain subsidiaries. Additionally, the Credit Agreement requires the Company to maintain certain financial ratios, including a minimum interest coverage ratio and a maximum total leverage ratio. As of December 31, 2016, the Company was in compliance with each of its covenants.
In June 2014, the Company issued 4.875% Senior Notes due 2024 (the “4.875% Notes) with an aggregate face amount of $250.0 million which bear interest at a rate of 4.875% per year payable semi-annually in January and July, beginning in January 2015. The 4.875% Notes were issued at their face value. With the proceeds of the 4.875% Notes, the Company redeemed all of its previously outstanding $100.0 million aggregate principal amount of 8% Senior Notes due 2019 (the “8% Notes”). In connection with the debt refinancing, the Company incurred approximately $8.1 million of costs, including $4.1 million of fees that were capitalized as deferred financing costs related to the 4.875% Notes and $4.0 million in call premiums. The $4.0 million paid for call premiums along with the write-off of $1.4 million of the Company’s unamortized deferred financing costs and approximately $1.5 million of original issue discount, each related to the 8% Notes, were recorded in other expense in the Consolidated Statements of Operations for 2014.
In connection with the acquisition of Produquímica, the Company assumed various outstanding loans. These loans have maturity dates ranging from January 2017 through November 2023 and bear interest at rates at either a Brazilian federal funds effective rate or LIBOR plus a margin. The loans are denominated in either Brazilian Reais or U.S. dollar. The Company has cash flow hedges related to this debt (see Note 11 for additional information).
The Credit Agreement and the agreements governing the 4.875% Notes and other indebtedness contain covenants that limit the Company’s ability, among other things, to incur additional indebtedness or contingent obligations or grant liens; pay dividends or make distributions to stockholders; repurchase or redeem the Company’s stock; make investments or dispose of assets; prepay, or amend the terms of, certain junior indebtedness; engage in sale and leaseback transactions; make changes to the Company’s organizational documents or fiscal periods; enter into third-party agreements that limit the Company’s ability to grant liens on the Company’s assets or make certain intercompany dividends, investments or asset transfers; enter into new lines of business; enter into transactions with the Company’s stockholders and affiliates; and acquire the assets of, or merge or consolidate with, other companies.
74 | ||
COMPASS MINERALS INTERNATIONAL, INC. | 2016 FORM 10-K | |
The 4.875% Notes in the table below are subordinate to the Credit Agreement borrowings. Third-party long-term debt consists of the following at December 31 (in millions):
2016 | 2015 | |||||||
Term Loans due July 2021 | $ | 845.9 | $ | — | ||||
Term Loan due May 2017 | — | 472.5 | ||||||
Revolving Credit Facility due August 2017 | — | 4.5 | ||||||
Revolving Credit Facility due July 2021 | 105.4 | — | ||||||
4.875% Senior Notes due July 2024 | 250.0 | 250.0 | ||||||
Banco Bradesco Loan due February 2017 | 13.2 | — | ||||||
Banco Votorantim Loan due April 2017 | 12.4 | — | ||||||
Banco Bradesco Loan due July 2017 | 4.8 | — | ||||||
Scotiabank Loan due August 2017 | 20.2 | — | ||||||
Banco Itaú Loan due September 2017 | 15.1 | — | ||||||
Scotiabank Loan due September 2017 | 15.1 | — | ||||||
Banco Votorantim Loan due September 2017 | 0.8 | — | ||||||
Banco Bradesco Loan due October 2017 | 16.8 | — | ||||||
Rabobank Loan due November 2017 | 22.6 | — | ||||||
Banco Itaú Loans due May 2019 to April 2020 | 3.1 | — | ||||||
Financiadora de Estudos e Projetos Loan due November 2023 | 7.4 | — | ||||||
1,332.8 | 727.0 | |||||||
Less unamortized debt issuance costs | (7.8 | ) | (4.1 | ) | ||||
Total debt | 1,325.0 | 722.9 | ||||||
Less current portion | (130.2 | ) | (4.9 | ) | ||||
Long-term debt | $ | 1,194.8 | $ | 718.0 | ||||
In the first quarter of 2016, the Company adopted guidance which requires debt issuance costs to be presented as a reduction to the carrying value of the related debt rather than as a deferred charge. In connection with this adoption, the Company reclassified $3.5 million of debt issuance costs related to its 4.875% Notes and $0.6 million of debt issuance costs related to its term loan due May 2017 in its Consolidated Balance Sheets as of December 31, 2015.
Future maturities of long-term debt for the years ending December 31, are as follows (in millions):
Debt Maturity | |||
2017 | $ | 130.2 | |
2018 | 10.9 | ||
2019 | 10.7 | ||
2020 | 9.9 | ||
2021 | 918.7 | ||
Thereafter | 252.4 | ||
Total | $ | 1,332.8 | |
11. DERIVATIVES AND FAIR VALUES OF FINANCIAL INSTRUMENTS
The Company is subject to various types of market risks including interest rate risk, foreign currency exchange rate transaction and translation risk, and commodity pricing risk. Management may take actions to mitigate the exposure to these types of risks, including entering into forward purchase contracts and other financial instruments. Currently, the Company manages a portion of its commodity pricing risk by using derivative instruments. The Company does not seek to engage in trading activities or take speculative positions with any financial instrument arrangements. The Company has entered into natural gas derivative instruments and foreign currency swaps with counterparties it views as creditworthy. However, management does attempt to mitigate its
75 | ||
COMPASS MINERALS INTERNATIONAL, INC. | 2016 FORM 10-K | |
counterparty credit risk exposures by, among other things, entering into master netting agreements with these counterparties. The Company records derivative financial instruments as either assets or liabilities at fair value in the consolidated statements of financial position.
Derivatives Not Designated as Hedging Instruments
In conjunction with the acquisition of Produquímica, the Company assumed U.S. dollar denominated debt which was previously held by Produquímica. Prior to the acquisition, Produquímica entered into foreign currency swap agreements whereby the Company agrees to swap interest and principal payments on the loans denominated in U.S. dollars for principal and interest payments denominated in Brazilian Reais, Produquímica’s functional currency. The objective of the swap agreements is to mitigate the foreign currency fluctuation risk related to holding debt denominated in a currency other than Produquímica’s functional currency. The Company may either continue to hedge this exposure or borrow in Brazilian Reais to meet the capital needs of the Company’s Brazilian operations.
As of December 31, 2016, the Company had swap contracts in place to hedge $119.6 million of loans denominated in foreign currencies. The Company did not have any foreign currency swap agreements prior to 2016. The foreign currency swaps derivative instruments are not designated as hedges. For derivative instruments that are not accounted for as hedges the change in fair value is recorded through earnings in the period of change. During the year ended December 31, 2016, the Company recognized a loss of $0.1 million included in the interest expense line item of the Consolidated Statement of Operations.
Derivatives Designated as Hedging Instruments
As of December 31, 2016, the Company has entered into natural gas derivative instruments. Derivatives qualify for treatment as hedges when there is a high correlation between the change in fair value of the derivative instrument and the related change in value of the underlying hedged item. Depending on the exposure being hedged, the Company must designate the hedging instrument as a fair value hedge, a cash flow hedge or a net investment in foreign operations hedge. All natural gas derivative instruments held by the Company as of December 31, 2016, and 2015 qualified as cash flow hedges. For these qualifying hedges, the effective portion of the change in fair value is recognized through earnings when the underlying transaction being hedged affects earnings, allowing a derivative’s gains and losses to offset related results from the hedged item in the statements of operations. Any ineffectiveness related to these hedges was not material for any of the periods presented.
Natural gas is consumed at several of the Company’s production facilities, and a change in natural gas prices impacts the Company’s operating margin. As of December 31, 2016, the Company had entered into natural gas derivative instruments to hedge a portion of its natural gas purchase requirements through December 2018. The Company’s objective is to reduce the earnings and cash flow impacts of changes in market prices of natural gas by fixing the purchase price of up to 90% of its forecasted natural gas usage. It is the Company’s policy to consider hedging portions of its natural gas usage up to 36 months in advance of the forecasted purchase. As of December 31, 2016, and 2015, the Company had agreements in place to hedge forecasted natural gas purchases of 2.3 million and 2.8 million MMBtus, respectively.
As of December 31, 2016, the Company expects to reclassify from accumulated other comprehensive loss to earnings during the next 12 months approximately $0.8 million of net gains on derivative instruments related to its natural gas hedges.
76 | ||
COMPASS MINERALS INTERNATIONAL, INC. | 2016 FORM 10-K | |
The following tables present the fair value of the Company’s derivatives as of December 31, 2016, and December 31, 2015 (in millions):
Asset Derivatives | Liability Derivatives | |||||||||||
Derivatives designated as hedging instruments: | Balance Sheet Location | December 31, 2016 | Balance Sheet Location | December 31, 2016 | ||||||||
Commodity contracts | Other current assets | $ | 1.2 | Accrued expenses | $ | 0.3 | ||||||
Commodity contracts | Other assets | 0.1 | Other noncurrent liabilities | 0.1 | ||||||||
Total derivatives designated as hedging instruments(a) | $ | 1.3 | $ | 0.4 | ||||||||
Derivatives not designated as hedging instruments: | ||||||||||||
Swap contracts | Other current assets | $ | — | Accrued expenses | $ | 25.8 | ||||||
Swap contracts | Other assets | — | Other noncurrent liabilities | — | ||||||||
Total derivatives not designated as hedging instruments | $ | — | $ | 25.8 | ||||||||
Total Derivatives(b) | $ | 1.3 | $ | 26.2 | ||||||||
(a) | The Company has master netting agreements with its commodity hedge counterparties and accordingly has netted in its Consolidated Balance Sheets approximately 0.4 million of its commodity contracts that are in a payable position against its contracts in receivable positions. |
(b) | The Company has commodity hedge and foreign currency swap agreements with two and five counterparties, respectively. Amounts recorded as assets for the Company’s commodity contracts are receivable from both counterparties, and amounts recorded as liabilities for the Company’s swap contracts are payable to all five counterparties. |
Asset Derivatives | Liability Derivatives | |||||||||||
Derivatives designated as hedging instruments(a): | Balance Sheet Location | December 31, 2015 | Balance Sheet Location | December 31, 2015 | ||||||||
Commodity contracts(b) | Other current assets | $ | 0.1 | Accrued expenses | $ | 2.6 | ||||||
Commodity contracts | Other assets | — | Other noncurrent liabilities | 0.1 | ||||||||
Total derivatives designated as hedging instruments | $ | 0.1 | $ | 2.7 | ||||||||
(a) | The Company has commodity hedge agreements with two counterparties. Amounts recorded as liabilities for the Company’s commodity contracts are payable to both counterparties. |
(b) | The Company has master netting agreements with its counterparties and accordingly has netted in its Consolidated Balance Sheets approximately $0.1 million of its commodity contracts that are in a receivable position against its contracts in payable positions. |
The following tables present activity related to the Company’s other comprehensive income before taxes for the twelve months ended December 31, 2016 and December 31, 2015 (in millions):
Twelve Months Ended December 31, 2016 | ||||||||||
Derivatives in Cash Flow Hedging Relationships | Location of Gain (Loss) Reclassified from Accumulated OCI Into Income (Effective Portion) | Amount of (Gain) Loss Recognized in OCI on Derivative (Effective Portion) | Amount of Gain (Loss) Reclassified from Accumulated OCI Into Income (Effective Portion) | |||||||
Commodity contracts | Product cost | $ | (0.8 | ) | $ | (2.7 | ) | |||
Total | $ | (0.8 | ) | $ | (2.7 | ) | ||||
Twelve Months Ended December 31, 2015 | ||||||||||
Derivatives in Cash Flow Hedging Relationships | Location of Gain (Loss) Reclassified from Accumulated OCI Into Income (Effective Portion) | Amount of (Gain) Loss Recognized in OCI on Derivative (Effective Portion) | Amount of Gain (Loss) Reclassified from Accumulated OCI Into Income (Effective Portion) | |||||||
Commodity contracts | Product cost | $ | 2.4 | $ | (3.1 | ) | ||||
Total | $ | 2.4 | $ | (3.1 | ) | |||||
77 | ||
COMPASS MINERALS INTERNATIONAL, INC. | 2016 FORM 10-K | |
12. COMMITMENTS AND CONTINGENCIES
Contingent Obligations:
The Company is involved in proceedings alleging unfair labor practices at its Cote Blanche, Louisiana, mine. This matter arises out of a labor dispute between the Company and the United Steelworkers Union over the terms of a new contract for certain employees at the mine. These employees initiated a strike that began on April 7, 2010, and ended on June 15, 2010. In September 2012, the U.S. National Labor Relations Board issued a decision finding that the Company had committed unfair labor practices in connection with the labor dispute. Under the ruling, the Company is responsible for back pay to affected employees as a result of changes made in union work rules and past practices beginning April 1, 2010. Any requirement for the Company to pay back wages will be offset by any wages earned at other places of employment during this period. In the fourth quarter of 2013, this ruling was upheld by an appeals court and the Company recorded a reserve of $5.0 million in its Consolidated Financial Statements related to expected payments required to resolve the dispute.
In the first quarter of 2015, additional information became available and the Company recorded an additional $2.0 million reserve for this matter in its Consolidated Financial Statements. The Company is also recording interest on the amount reserved at approximately 4% per year. Both parties are currently negotiating in an effort to reach a settlement. If the Company is unable to come to terms with the union, the parties may agree to arbitration and any decisions reached in arbitration would be binding. The Company is currently accrued at the minimum of its estimated range and may need to record additional losses in its financial statements as a result of future developments.
The Wisconsin Department of Agriculture, Trade and Consumer Protection (“DATCP”) has information indicating that agricultural chemicals are present within the subsurface area of the Company’s Kenosha, Wisconsin, plant. The agricultural chemicals were used by previous owners and operators of the site. None of the identified chemicals have been used in association with the Company’s operations since it acquired the property in 2002. DATCP directed the Company to conduct further investigations into the possible presence of agricultural chemicals in soil and ground water at the Kenosha plant. The Company has completed Phase I of these investigations and has provided the findings to DATCP. Phase II sampling and analysis is underway. All investigations and mitigation activities to date, and any potential future remediation work, are being conducted under the Wisconsin Agricultural Chemical Cleanup Program (“ACCP”), which would provide for reimbursement of some of the costs. The Company may seek participation by, or cost reimbursement from, other parties responsible for the presence of any agricultural chemicals found in soil and ground water at this site if the Company does not receive an acknowledgment of no further action and is required to conduct further investigation or remedial work that may not be eligible for reimbursement under the ACCP.
The Company conducts business operations in several countries, and it is subject to various federal and local labor, social security, environmental and tax laws. While the Company believes it complies with such laws, they are complex and subject to interpretation. In addition to the tax assessments discussed in Note 8, the Company’s Brazilian subsidiaries are party to administrative tax proceedings and claims which total $25.2 million and relate primarily to value added tax, state tax (“ICMS”) and social security tax (PIC and COFINS) assessments. The Company has assessed the likelihood of a loss at less than probable and therefore, has not reserved for these matters. The Company also has assumed liabilities for labor-related matters in connection with the acquisition of Produquímica, which are primarily related to compensation, labor benefits and consequential tax claims totaled $15.3 million as of December 31, 2016. The Company believes the maximum exposure for these other labor matters total approximately $48 million. As discussed in Note 3, the contingencies are still preliminary as of December 31, 2016.
The Company is also involved in legal and administrative proceedings and claims of various types from the ordinary course of the Company’s business.
Management cannot predict the outcome of legal claims and proceedings with certainty. Nevertheless, management believes that the outcome of legal proceeding and claims, which are pending or known to be threatened, even if determined adversely, will not, individually or in the aggregate, have a material adverse effect on the Company’s results of operations, cash flows or financial position.
Approximately 40% of workforce in the U.S., Canada and the U.K. and approximately 25% of the Company’s global workforce is represented by collective bargaining agreements. Of the Company’s 13 collective bargaining agreements, four will expire in 2017 (representing approximately 7% of the Company’s total workforce), four will expire in 2018, and five will expire in 2019. Trade union membership is common in Europe and required in Brazil where approximately 5% and 35% of the Company’s workforce is located, respectively. The Company considers its overall labor relations to be good.
78 | ||
COMPASS MINERALS INTERNATIONAL, INC. | 2016 FORM 10-K | |
Commitments:
Leases: The Company leases certain property and equipment under non-cancelable operating leases for varying periods. The aggregate future minimum annual rentals under lease arrangements as of December 31, 2016, are as follows (in millions):
Operating Leases | |||
2017 | $ | 14.4 | |
2018 | 7.7 | ||
2019 | 5.1 | ||
2020 | 3.0 | ||
2021 | 1.8 | ||
Thereafter | 5.8 | ||
Total | $ | 37.8 | |
The Company also leases certain property and equipment under capital lease for various periods. The aggregate future minimum annual rentals under these lease arrangements as of December 31, 2016, are as follows (in millions):
Capital Leases | |||
2017 | $ | 1.0 | |
2018 | 0.9 | ||
2019 | 0.9 | ||
2020 | 0.9 | ||
2021 | 0.9 | ||
Thereafter | 6.1 | ||
Total | $ | 10.7 | |
Rental expense, net of sublease income, was $20.4 million, $20.7 million and $18.6 million for the years ended December 31, 2016, 2015 and 2014, respectively.
Royalties: The Company has various private, state and Canadian provincial leases associated with the salt and specialty potash businesses, most of which are renewable by the Company. Many of these leases provide for a royalty payment to the lessor based on a specific amount per ton of mineral extracted or as a percentage of revenue. Royalty expense related to these leases was $15.2 million, $14.0 million and $17.8 million for the years ended December 31, 2016, 2015 and 2014.
Performance Bonds: The Company has various salt and other deicing product sales contracts that include performance provisions governing delivery and product quality. These sales contracts either require the Company to maintain performance bonds for stipulated amounts or contain contractual penalty provisions in the event of non-performance. For the three years ended December 31, 2016, the Company has had no material penalties related to these sales contracts. At December 31, 2016, the Company had approximately $182.9 million of outstanding performance bonds, which includes the bonds outstanding for the Company’s tax reassessments and approximately $45.8 million for bank letter guarantees.
Purchase Commitments: In connection with the operations of the Company’s facilities, the Company purchases electricity, other raw materials and services from third parties under contracts extending, in some cases, for multiple years. Purchases under these contracts are generally based on prevailing market prices. The Company has purchase contracts with suppliers for salt. Additionally, the Company has minimum throughput contracts with some of its depots. The purchase commitments for these contracts are estimated to be approximately $10.0 million for 2017 and $1.7 million in 2018.
13. STOCKHOLDERS’ EQUITY AND EQUITY INSTRUMENTS
The Company paid dividends of $2.78 per share in 2016 and currently intends to continue paying quarterly cash dividends. The declaration and payment of future dividends to holders of the Company’s common stock will be at the discretion of the Company’s board of directors and will depend upon many factors, including the Company’s financial condition, earnings, legal requirements, restrictions in its debt agreements (see Note 10) and other factors the Company’s board of directors deems relevant.
79 | ||
COMPASS MINERALS INTERNATIONAL, INC. | 2016 FORM 10-K | |
Non-employee directors may defer all or a portion of the fees payable for their service into deferred stock units, equivalent to the value of the Company’s common stock. Additionally, as dividends are declared on the Company’s common stock, these deferred stock units are entitled to accrete dividends in the form of additional units based on the stock price on the dividend payment date. Accumulated deferred stock units are distributed in the form of Company common stock at a future specified date or following resignation from the board of directors, based upon the director’s annual election. During the years ended December 31, 2016, 2015 and 2014, members of the board of directors were credited with 10,078, 12,542 and 14,340 deferred stock units, respectively. During the years ended December 31, 2016, 2015 and 2014, 12,153, 31,954 and 976 shares of common stock, respectively, were issued from treasury shares for director compensation.
Preferred stock
The Company is authorized to issue up to 10,000,000 shares of preferred stock, of which no shares are currently issued or outstanding. Of those, 200,000 shares of preferred stock were designated as series A junior participating preferred stock in connection with the Company’s now expired rights agreement.
Equity Compensation Awards
In 2005, the Company adopted the 2005 Incentive Award Plan (the “2005 Plan”),which authorizes the issuance of 3,240,000 shares of Company common stock. In May 2015, the Company’s shareholders approved the 2015 Incentive Award Plan (the “2015 Plan”), which authorizes the issuance of 3,000,000 shares of Company common stock. Since the date the 2015 Plan was approved, the Company ceased issuing equity awards under the 2005 Plan. The 2005 Plan and 2015 Plan allow for grants of equity awards to executive officers, other employees and directors, including restricted stock units (“RSUs”), performance stock units (“PSUs”), stock options and deferred stock units. The grants occur following approval by the compensation committee of the Company’s board of directors, with the amount and terms communicated to employees shortly thereafter. The strike price of options is equal to the closing stock price on the day of grant.
Options
Substantially all stock options granted under the 2005 Plan and 2015 Plan vest ratably, in tranches, over a four-year service period. Unexercised options expire after 7 years. Options do not have dividend or voting rights. Upon vesting, each option can be exercised to purchase one share of the Company’s common stock. The exercise price of options is equal to the closing stock price on the day of grant.
To estimate the fair value of options on the grant date, the Company uses the Black-Scholes option valuation model. Award recipients are grouped according to expected exercise behavior. Unless better information is available to estimate the expected term of the options, the estimate is based on historical exercise experience. The risk-free rate, using U.S. Treasury yield curves in effect at the time of grant, is selected based on the expected term of each group. The Company’s historical stock price is used to estimate expected volatility. The weighted average assumptions and fair values for options granted for each of the years ended December 31 is included in the following table.
2016 | 2015 | 2014 | ||||||||||
Fair value of options granted | $ | 10.17 | $ | 14.78 | $ | 15.25 | ||||||
Expected term (years) | 4.5 | 4.8 | 4.8 | |||||||||
Expected volatility | 24.4 | % | 24.9 | % | 27.8 | % | ||||||
Dividend yield | 3.3 | % | 3.1 | % | 3.4 | % | ||||||
Risk-free interest rates | 1.2 | % | 1.6 | % | 1.5 | % | ||||||
RSUs
Substantially all of the RSUs granted under both the 2005 Plan and 2015 Plan vest after three years of service entitling the holders to one share of common stock for each vested RSU. The unvested RSUs do not have voting rights but are entitled to receive non-forfeitable dividends (generally after a performance hurdle has been satisfied for the year of the grant) or other distributions that may be declared on the Company’s common stock equal to the per-share dividend declared. The closing stock price on the day of grant is used to determine the fair value of RSUs.
PSUs
Substantially all of the PSUs granted under both the 2005 Plan and 2015 Plan are either total shareholder return PSUs (the “TSR PSUs”) or return on invested capital PSUs (the “ROIC PSUs”). The actual number of shares of common stock that may be earned with respect to TSR PSUs is calculated by comparing the Company’s total shareholder return to the total shareholder return for each company comprising the Russell 3000 Index over the three-year performance period and may range from 0% to 150% of the target number of shares based upon the attainment of these performance conditions. The actual number of shares of common stock that may be earned with respect to ROIC PSUs is calculated based on the average of the Company’s annual return on invested
80 | ||
COMPASS MINERALS INTERNATIONAL, INC. | 2016 FORM 10-K | |
capital for each year in the three-year performance period and may range from 0% to 200% of the target number of shares based upon the attainment of these performance conditions.
ROIC PSUs granted in 2016 have a three-year performance period that begins on the grant date and vest on the third anniversary following the grant date. TSR PSUs granted in 2016 have a three-year performance period that begins in 2016 and ends in 2018. PSUs represent a target number of shares of Company common stock that may be earned before adjustment based upon the attainment of certain performance conditions. Holders of PSUs are entitled to receive non-forfeitable dividends or other distributions equal to those declared on the Company’s common stock for PSUs that are earned, which are paid when the shares underlying the PSUs are paid.
To estimate the fair value of the TSR PSUs on the grant date, the Company uses a Monte-Carlo simulation model, which simulates future stock prices of the Company as well as the companies comprising the Russell 3000 Index. This model uses historical stock prices to estimate expected volatility and the Company’s correlation to the Russell 3000 Index. The risk-free rate was determined using the same methodology as the option valuations as discussed above. The Company’s closing stock price on the grant date was used to estimate the fair value of the ROIC PSUs. The Company will adjust the expense of the ROIC PSUs based upon its estimate of the number of shares that will ultimately vest at each interim date during the three-year vesting period.
The following is a summary of the Company’s stock option, RSU and PSU activity and related information for the following periods:
Stock Options | RSUs | PSUs | |||||||||||||||||||
Number | Weighted-average exercise price | Number | Weighted-average fair value | Number | Weighted-average fair value | ||||||||||||||||
Outstanding at December 31, 2013 | 328,364 | $ | 72.88 | 95,718 | $ | 76.09 | 55,149 | $ | 80.89 | ||||||||||||
Granted | 95,610 | 87.18 | 20,268 | 86.74 | 27,574 | 105.77 | |||||||||||||||
Exercised(a) | (112,005 | ) | 67.35 | — | — | — | — | ||||||||||||||
Released from restriction(a) | — | — | (15,636 | ) | 86.48 | (3,998 | ) | 93.82 | |||||||||||||
Cancelled/Expired | (33,540 | ) | 79.81 | (11,818 | ) | 76.95 | (19,098 | ) | 89.77 | ||||||||||||
Outstanding at December 31, 2014 | 278,429 | $ | 79.23 | 88,532 | $ | 76.58 | 59,627 | $ | 88.69 | ||||||||||||
Granted | 120,956 | 91.76 | 21,317 | 90.94 | 35,584 | 100.49 | |||||||||||||||
Exercised(a) | (33,906 | ) | 72.53 | — | — | — | — | ||||||||||||||
Released from restriction(a) | — | — | (15,952 | ) | 71.69 | (10,454 | ) | 74.49 | |||||||||||||
Cancelled/Expired(b) | (12,392 | ) | 84.71 | (2,889 | ) | 81.43 | (7,392 | ) | 82.46 | ||||||||||||
Outstanding at December 31, 2015 | 353,087 | $ | 83.94 | 91,008 | $ | 80.65 | 77,365 | $ | 96.63 | ||||||||||||
Granted | 157,887 | 70.48 | 34,975 | 72.06 | 43,902 | 73.86 | |||||||||||||||
Exercised(a) | (11,377 | ) | 62.50 | — | — | — | — | ||||||||||||||
Released from restriction(a) | — | — | (53,983 | ) | 75.18 | (10,258 | ) | 78.49 | |||||||||||||
Cancelled/Expired(b) | (56,842 | ) | 80.95 | (8,220 | ) | 83.16 | (21,998 | ) | 88.79 | ||||||||||||
Outstanding at December 31, 2016 | 442,755 | $ | 80.07 | 63,780 | $ | 80.25 | 89,011 | $ | 89.43 | ||||||||||||
(a) | Common stock issued for exercised options, vested RSUs and vested and earned PSUs were issued from treasury shares. |
(b) | The performance period for the 2014 PSU grant was completed in 2016. The Company expects to issue 12,964 shares in March 2017 when the 2014 PSU grant vests. |
81 | ||
COMPASS MINERALS INTERNATIONAL, INC. | 2016 FORM 10-K | |
As of December 31, 2015, there were 353,087 options outstanding of which 124,282 were exercisable. The following table summarizes information about options outstanding and exercisable at December 31, 2016.
Options Outstanding | Options Exercisable | ||||||||||||||||||
Range of exercise prices | Options outstanding | Weighted-average remaining contractual life (years) | Weighted-average exercise price of options outstanding | Options exercisable | Weighted-average remaining contractual life (years) | Weighted-average exercise price of exercisable options | |||||||||||||
$70.48 - $71.09 | 136,464 | 6.2 | $ | 70.48 | — | — | $ | — | |||||||||||
$71.10 - $77.75 | 97,493 | 3.0 | 75.53 | 77,299 | 2.9 | 75.20 | |||||||||||||
$77.76 - $86.83 | 38,209 | 0.7 | 82.49 | 38,209 | 0.7 | 82.49 | |||||||||||||
$86.84 - $89.47 | 73,044 | 4.2 | 87.18 | 35,896 | 4.2 | 87.18 | |||||||||||||
$89.48 - $93.26 | 97,545 | 5.2 | 91.77 | 27,347 | 5.2 | 91.77 | |||||||||||||
Totals | 442,755 | 4.5 | $ | 80.07 | 178,751 | 3.0 | $ | 81.70 | |||||||||||
During the years ended December 31, 2016, 2015 and 2014, the Company recorded compensation expense of $4.9 million, $6.1 million and $4.9 million, respectively, related to its stock-based compensation awards that are expected to vest. No amounts have been capitalized. The fair value of options vested was approximately $1.3 million, $1.1 million and $1.3 million in 2016, 2015 and 2014, respectively.
As of December 31, 2016, unrecorded compensation cost related to non-vested awards of $6.2 million is expected to be recognized from 2016 through 2019, with a weighted average period of 2.1 years.
The intrinsic value of stock options exercised during the twelve months ended December 31, 2016, 2015 and 2014 totaled $0.1 million, $0.6 million and $2.3 million, respectively. As of December 31, 2016, the intrinsic value of options outstanding totaled $1.3 million, of which 178,751 options with an intrinsic value of $0.2 million were exercisable. The number of shares held in treasury is sufficient to cover all outstanding equity awards as of December 31, 2016.
Accumulated Other Comprehensive Income (Loss)
The Company’s comprehensive income (loss) is comprised of net earnings, net amortization of the unrealized loss of the pension obligation, the change in the unrealized gain (loss) on natural gas and foreign currency cash flow hedges, and foreign currency translation adjustments. The components of and changes in accumulated other comprehensive income (loss) (“AOCI”) for the twelve months ended December 31, 2016 and 2015 are as follows (in millions):
Twelve Months Ended December 31, 2016(a) | Gains and (Losses) on Cash Flow Hedges | Defined Benefit Pension | Foreign Currency | Total | ||||||||||||
Beginning balance | $ | (1.6 | ) | $ | (3.8 | ) | $ | (102.9 | ) | $ | (108.3 | ) | ||||
Other comprehensive income (loss) before reclassifications | 0.5 | (0.1 | ) | 1.1 | 1.5 | |||||||||||
Amounts reclassified from accumulated other comprehensive loss | 1.7 | 0.2 | — | 1.9 | ||||||||||||
Net current period other comprehensive income (loss) | 2.2 | 0.1 | 1.1 | 3.4 | ||||||||||||
Ending balance | $ | 0.6 | $ | (3.7 | ) | $ | (101.8 | ) | $ | (104.9 | ) | |||||
(a) | With the exception of the cumulative foreign currency translation adjustment, for which no tax effect is recorded, the changes in the components of accumulated other comprehensive gain (loss) presented in the table are reflected net of applicable income taxes. |
82 | ||
COMPASS MINERALS INTERNATIONAL, INC. | 2016 FORM 10-K | |
Twelve Months Ended December 31, 2015(a) | Gains and (Losses) on Cash Flow Hedges | Defined Benefit Pension | Foreign Currency | Total | ||||||||||||
Beginning balance | $ | (2.0 | ) | $ | (9.0 | ) | $ | (4.5 | ) | $ | (15.5 | ) | ||||
Other comprehensive income (loss) before reclassifications | (1.5 | ) | 4.1 | (98.4 | ) | (95.8 | ) | |||||||||
Amounts reclassified from accumulated other comprehensive loss | 1.9 | 1.1 | — | 3.0 | ||||||||||||
Net current period other comprehensive income (loss) | 0.4 | 5.2 | (98.4 | ) | (92.8 | ) | ||||||||||
Ending balance | $ | (1.6 | ) | $ | (3.8 | ) | $ | (102.9 | ) | $ | (108.3 | ) | ||||
(a) | With the exception of the cumulative foreign currency translation adjustment, for which no tax effect is recorded, the changes in the components of accumulated other comprehensive gain (loss) presented in the table are reflected net of applicable income taxes. |
Amount Reclassified from AOCI | ||||||
Twelve Months Ended December 31, 2016 | Line Item Impacted in the Consolidated Statement of Operations | |||||
Gains and (losses) on cash flow hedges: | ||||||
Natural gas instruments | $ | (2.7 | ) | Product cost | ||
1.0 | Income tax expense (benefit) | |||||
(1.7 | ) | |||||
Amortization of defined benefit pension: | ||||||
Amortization of loss | $ | 0.3 | Product cost | |||
(0.1 | ) | Income tax expense (benefit) | ||||
0.2 | ||||||
Total reclassifications, net of income taxes | $ | (1.5 | ) | |||
Amount Reclassified from AOCI | ||||||
Twelve Months Ended December 31, 2015 | Line Item Impacted in the Consolidated Statement of Operations | |||||
Gains and (losses) on cash flow hedges: | ||||||
Natural gas instruments | $ | 3.1 | Product cost | |||
(1.2 | ) | Income tax expense (benefit) | ||||
1.9 | ||||||
Amortization of defined benefit pension: | ||||||
Amortization of loss | $ | 1.4 | Product cost | |||
(0.3 | ) | Income tax expense (benefit) | ||||
1.1 | ||||||
Total reclassifications, net of income taxes | $ | 3.0 | ||||
14. FAIR VALUE MEASUREMENTS
As required, the Company’s financial instruments are measured and reported at their estimated fair value. Fair value is the price that would be received to sell an asset or paid to transfer a liability in an orderly transaction. When available, the Company uses quoted prices in active markets to determine the fair values for its financial instruments (Level 1 inputs), or absent quoted market prices, observable market-corroborated inputs over the term of the financial instruments (Level 2 inputs). The Company does not have any unobservable inputs that are not corroborated by market inputs (Level 3 inputs) except as stated in Notes 3 and 9.
The Company holds marketable securities associated with its Savings Plans, which are valued based on readily available quoted market prices. The Company also holds short-term investments which are classified as trading securities with any gains or losses recognized through earnings. The Company utilizes derivative instruments to manage its risk of changes in natural gas prices and
83 | ||
COMPASS MINERALS INTERNATIONAL, INC. | 2016 FORM 10-K | |
its risk of changes in foreign currency exchange rates (see Note 11). The fair value of the natural gas derivative instruments and the foreign currency swaps are determined using market data of forward prices for all of the Company’s contracts.
The estimated fair values for each type of instrument are presented below (in millions).
December 31, 2016 | Level One | Level Two | Level Three | |||||||||||||
Asset Class: | ||||||||||||||||
Mutual fund investments in a non-qualified savings plan(a) | $ | 1.8 | $ | 1.8 | $ | — | $ | — | ||||||||
Derivatives - natural gas instruments | 0.9 | — | 0.9 | — | ||||||||||||
Trading securities | 1.8 | — | 1.8 | — | ||||||||||||
Total Assets | $ | 4.5 | $ | 1.8 | $ | 2.7 | $ | — | ||||||||
Liability Class: | ||||||||||||||||
Liabilities related to non-qualified savings plan | $ | (1.8 | ) | $ | (1.8 | ) | $ | — | $ | — | ||||||
Derivatives - foreign currency swaps | (25.8 | ) | $ | — | (25.8 | ) | — | |||||||||
Total Liabilities | $ | (27.6 | ) | $ | (1.8 | ) | $ | (25.8 | ) | $ | — | |||||
(a) | Includes mutual fund investments of approximately 25% in the common stock of large-cap U.S. companies, 10% in the common stock of small to mid-cap U.S. companies, 5% in the common stock of international companies, 5% in bond funds, 40% in short-term investments and 15% in blended funds. |
December 31, 2015 | Level One | Level Two | Level Three | |||||||||||||
Asset Class: | ||||||||||||||||
Mutual fund investments in a non-qualified savings plan(a) | $ | 1.6 | $ | 1.6 | $ | — | $ | — | ||||||||
Total Assets | $ | 1.6 | $ | 1.6 | $ | — | $ | — | ||||||||
Liability Class: | ||||||||||||||||
Liabilities related to non-qualified savings plan | $ | (1.6 | ) | $ | (1.6 | ) | $ | — | $ | — | ||||||
Derivatives – natural gas instruments | (2.6 | ) | — | (2.6 | ) | — | ||||||||||
Total Liabilities | $ | (4.2 | ) | $ | (1.6 | ) | $ | (2.6 | ) | $ | — | |||||
(a) | Includes mutual fund investments of approximately 20% in the common stock of large-cap U.S. companies, 5% in the common stock of small to mid-cap U.S. companies, 5% in the common stock of international companies, 5% in bond funds, 35% in short-term investments and 30% in blended funds. |
Cash and cash equivalents, accounts receivable (net of reserve for bad debts) and payables are carried at cost, which approximates fair value due to their liquid and short-term nature. The Company’s investments related to its nonqualified retirement plan of $1.8 million and $1.6 million as of December 31, 2016 and December 31, 2015, respectively, are stated at fair value based on quoted market prices. As of December 31, 2016, the estimated fair value of the fixed-rate 4.875% Notes, based on available trading information, totaled $236.3 million (Level 2) compared with the aggregate principal amount at maturity of $250.0 million. The fair value at December 31, 2016 of amounts outstanding under the Credit Agreement, based upon available bid information received from the Company’s lender, totaled approximately $940.5 million (Level 2), compared with the aggregate principal amount at maturity of $951.3 million.
15. OPERATING SEGMENTS
The Company’s reportable segments are strategic business units that offer different products and services, and each business requires different technology and marketing strategies. The Company has three reportable segments: Salt, Plant Nutrition North America and Plant Nutrition South America. The Salt segment produces and markets salt and magnesium chloride for use in road deicing and dust control, food processing, water softeners and agricultural and industrial applications. SOP crop nutrients, industrial-grade SOP, micronutrients and magnesium chloride for agricultural purposes are produced and marketed through the Plant Nutrition North America segment. In October 2016, the Company acquired Produquímica, which operates two primary businesses in Brazil – agricultural productivity and chemical solutions. See Note 3 for a further discussion of acquisition. The agricultural productivity division manufactures and distributes a broad offering of specialty plant nutrition solution-based products that are used in direct soil and foliar applications, as well as through irrigation systems and for seed treatment. Produquímica also manufactures and markets specialty chemicals for the industrial chemical industry. The Company’s new Plant Nutrition South America segment represents the results of the acquired business.
84 | ||
COMPASS MINERALS INTERNATIONAL, INC. | 2016 FORM 10-K | |
The accounting policies of the segments are the same as those described in the summary of significant accounting policies. All intersegment sales prices are market-based. The Company evaluates performance based on the operating earnings of the respective segments.
Segment information as of and for the years ended December 31, is as follows (in millions):
2016 | Salt | Plant Nutrition North America | Plant Nutrition South America | Corporate & Other(a) | Total | |||||||||||||||
Sales to external customers | $ | 811.9 | $ | 203.0 | $ | 113.5 | $ | 9.6 | $ | 1,138.0 | ||||||||||
Intersegment sales | — | 5.2 | — | (5.2 | ) | — | ||||||||||||||
Shipping and handling cost | 214.5 | 25.0 | 5.4 | — | 244.9 | |||||||||||||||
Operating earnings (loss) | 200.6 | 21.1 | 7.4 | (54.5 | ) | 174.6 | ||||||||||||||
Depreciation, depletion and amortization | 46.7 | 33.4 | 5.0 | 5.2 | 90.3 | |||||||||||||||
Total assets | 980.3 | 592.3 | 844.9 | 49.0 | 2,466.5 | |||||||||||||||
Capital expenditures | 103.4 | 63.6 | 2.1 | 13.1 | 182.2 | |||||||||||||||
2015 | Salt | Plant Nutrition North America | Plant Nutrition South America | Corporate & Other(a) | Total | |||||||||||||||
Sales to external customers | $ | 849.0 | $ | 238.4 | $ | — | $ | 11.3 | $ | 1,098.7 | ||||||||||
Intersegment sales | 0.1 | 7.7 | — | (7.8 | ) | — | ||||||||||||||
Shipping and handling cost | 239.1 | 22.4 | — | — | 261.5 | |||||||||||||||
Operating earnings (loss) | 215.2 | 57.9 | — | (51.7 | ) | 221.4 | ||||||||||||||
Depreciation, depletion and amortization | 43.9 | 29.8 | — | 4.6 | 78.3 | |||||||||||||||
Total assets(b) | 896.5 | 679.7 | — | 48.6 | 1,624.8 | |||||||||||||||
Capital expenditures | 106.5 | 92.8 | — | 18.3 | 217.6 | |||||||||||||||
2014 | Salt | Plant Nutrition North America | Plant Nutrition South America | Corporate & Other(a) | Total | |||||||||||||||
Sales to external customers | $ | 1,002.6 | $ | 270.2 | $ | — | $ | 9.7 | $ | 1,282.5 | ||||||||||
Intersegment sales | 0.9 | 7.1 | — | (8.0 | ) | — | ||||||||||||||
Shipping and handling cost | 309.3 | 28.4 | — | — | 337.7 | |||||||||||||||
Operating earnings (loss)(c) | 291.4 | 74.8 | — | (55.2 | ) | 311.0 | ||||||||||||||
Depreciation, depletion and amortization | 44.8 | 27.3 | — | 5.9 | 78.0 | |||||||||||||||
Total assets | 1,045.2 | 536.2 | — | 50.8 | 1,632.2 | |||||||||||||||
Capital expenditures | 67.9 | 42.1 | — | 15.2 | 125.2 | |||||||||||||||
(a) | Corporate and Other includes corporate entities, records management operations and other incidental operations and eliminations. Operating earnings (loss) for corporate and other includes indirect corporate overhead including costs for general corporate governance and oversight, as well as costs for the human resources, information technology and finance functions. In 2014, the operating loss includes costs of approximately $4.2 million to consolidate its records management locations by closing one location in London, England. |
(b) | In 2015, the Company’s equity investment in Produquímica is included in total assets for its Plant Nutrition North America segment. In addition, the Company’s assets held for sale have been presented in corporate and other. Total assets in 2015 for both operating segments were negatively impacted by the impact of translating the Company’s foreign-denominated assets into U.S. dollars. |
(c) | In 2014, the Company recorded a gain of $82.3 million in the Salt segment and $1.0 million in Corporate and Other resulting from an insurance settlement related to a tornado at its Goderich, Ontario facilities in 2011. |
85 | ||
COMPASS MINERALS INTERNATIONAL, INC. | 2016 FORM 10-K | |
Financial information relating to the Company’s operations by geographic area for the years ended December 31 is as follows (in millions):
Sales | 2016 | 2015 | 2014 | |||||||||
United States(a) | $ | 762.6 | $ | 834.6 | $ | 975.2 | ||||||
Canada | 212.5 | 198.4 | 260.0 | |||||||||
Brazil | 111.7 | — | — | |||||||||
United Kingdom | 40.6 | 56.8 | 41.2 | |||||||||
Other | 10.6 | 8.9 | 6.1 | |||||||||
Total sales | $ | 1,138.0 | $ | 1,098.7 | $ | 1,282.5 | ||||||
(a) | United States sales exclude product sold to foreign customers at U.S. ports. |
Financial information relating to the Company’s long-lived assets, including deferred financing costs and other long-lived assets but excluding the investments related to the nonqualified retirement plan and pension plan assets, by geographic area as of December 31 (in millions):
Long-Lived Assets | 2016 | 2015 | ||||||
United States | $ | 568.5 | $ | 498.0 | ||||
Canada | 461.5 | 394.3 | ||||||
United Kingdom | 66.8 | 95.7 | ||||||
Brazil | 645.8 | 116.4 | ||||||
Other | 6.5 | 6.5 | ||||||
Total long-lived assets | $ | 1,749.1 | $ | 1,110.9 | ||||
16. EARNINGS PER SHARE
The two-class method requires allocating the Company’s net earnings to both common shares and participating securities. The following table sets forth the computation of basic and diluted earnings per common share (in millions, except for share and per share data):
Year ended December 31, | 2016 | 2015 | 2014 | |||||||||
Numerator: | ||||||||||||
Net earnings | $ | 162.7 | $ | 159.2 | $ | 217.9 | ||||||
Less: Net earnings allocated to participating securities(a) | (0.8 | ) | (1.0 | ) | (1.5 | ) | ||||||
Net earnings available to common shareholders | $ | 161.9 | $ | 158.2 | $ | 216.4 | ||||||
Denominator (in thousands): | ||||||||||||
Weighted average common shares outstanding, shares for basic earnings per share(b) | 33,776 | 33,677 | 33,557 | |||||||||
Weighted average equity awards outstanding | 4 | 15 | 24 | |||||||||
Shares for diluted earnings per share | 33,780 | 33,692 | 33,581 | |||||||||
Net earnings per common share, basic | $ | 4.79 | $ | 4.70 | $ | 6.45 | ||||||
Net earnings per common share, diluted | $ | 4.79 | $ | 4.69 | $ | 6.44 | ||||||
(a) | Participating securities include PSUs and RSUs that receive non-forfeitable dividends. Net earnings were allocated to participating securities of 164,000, 198,000 and 227,000 for 2016, 2015 and 2014, respectively. |
(b) | For the calculation of diluted earnings per share, the Company uses the more dilutive of either the treasury stock method or the two-class method to determine the weighted average number of outstanding common shares. In addition, the Company had 509,000, 432,000 and 381,000 weighted options outstanding for 2016, 2015 and 2014, respectively, which were anti-dilutive and therefore not included in the diluted earnings per share calculation. |
86 | ||
COMPASS MINERALS INTERNATIONAL, INC. | 2016 FORM 10-K | |
17. QUARTERLY RESULTS (Unaudited) (in millions, except share and per share data)
Quarter | First | Second | Third | Fourth | ||||||||||||
2016 | ||||||||||||||||
Sales | $ | 345.7 | $ | 169.5 | $ | 179.6 | $ | 443.2 | ||||||||
Gross profit | 102.6 | 41.3 | 45.2 | 110.4 | ||||||||||||
Net earnings(a) | 49.7 | 6.3 | 9.1 | 97.6 | ||||||||||||
Net earnings per share, basic(a) | 1.47 | 0.18 | 0.27 | 2.88 | ||||||||||||
Net earnings per share, diluted(a) | 1.46 | 0.18 | 0.27 | 2.87 | ||||||||||||
Basic weighted-average shares outstanding (in thousands) | 33,746 | 33,784 | 33,786 | 33,788 | ||||||||||||
Diluted weighted-average shares outstanding (in thousands) | 33,748 | 33,787 | 33,789 | 33,793 | ||||||||||||
2015 | ||||||||||||||||
Sales | $ | 393.0 | $ | 183.7 | $ | 232.7 | $ | 289.3 | ||||||||
Gross profit | 113.2 | 50.6 | 68.0 | 98.3 | ||||||||||||
Net earnings | 60.6 | 13.2 | 27.0 | 58.4 | ||||||||||||
Net earnings per share, basic | 1.79 | 0.39 | 0.80 | 1.72 | ||||||||||||
Net earnings per share, diluted | 1.79 | 0.39 | 0.80 | 1.72 | ||||||||||||
Basic weighted-average shares outstanding (in thousands) | 33,626 | 33,682 | 33,696 | 33,701 | ||||||||||||
Diluted weighted-average shares outstanding (in thousands) | 33,649 | 33,701 | 33,708 | 33,714 | ||||||||||||
(a) | In the fourth quarter of 2016, the Company recognized a gain of $59.3 million on the remeasurement of its equity investment as part of the acquisition of the remaining 65% of Produquímica’s equity. |
18. SUBSEQUENT EVENT
Dividend Declared:
On February 2, 2017, the board of directors declared a quarterly cash dividend of $0.72 per share on the Company’s outstanding common stock, an increase of 3.6% from the quarterly cash dividends paid in 2016 of $0.695 per share. The dividend will be paid on March 15, 2017, to stockholders of record as of the close of business on March 1, 2017.
ITEM 9. | CHANGES IN AND DISAGREEMENTS WITH ACCOUNTANTS ON ACCOUNTING AND FINANCIAL DISCLOSURE |
None.
ITEM 9A. | CONTROLS AND PROCEDURES |
Disclosure Controls and Procedures
The Company maintains disclosure controls and procedures that are designed to provide reasonable assurance that information required to be disclosed in the Company’s reports under the Securities Exchange Act of 1934, as amended (the “Exchange Act”), is recorded, processed, summarized and reported within the time periods specified in the Securities and Exchange Commission’s (“SEC’s”) rules and forms, and that such information is accumulated and communicated to management, including the Company’s Chief Executive Officer (“CEO”) and Interim Chief Financial Officer (“Interim CFO”), as appropriate, to allow timely decisions regarding required disclosure. In designing and evaluating the disclosure controls and procedures, management recognizes that any controls and procedures, no matter how well designed and operated, can provide only reasonable assurance of achieving the desired control objectives. Management necessarily was required to apply its judgment in evaluating the cost-benefit relationship of possible controls and procedures.
In connection with the preparation of this Annual Report on Form 10-K, an evaluation is performed under the supervision and with the participation of the Company’s management, including the CEO and Interim CFO, of the effectiveness of the design and operation of the Company’s disclosure controls and procedures (as defined in Rule 13a-15(e) under the Exchange Act) as of December 31, 2016. The scope of this assessment did not include any disclosure controls or procedures (to the extent that they are subsumed by internal control over financial reporting) of Produquímica, which the Company acquired on October 3, 2016. Based on that evaluation, the CEO and Interim CFO conclude whether the Company’s disclosure controls and procedures are effective as of December 31, 2016, at the reasonable assurance level.
87 | ||
COMPASS MINERALS INTERNATIONAL, INC. | 2016 FORM 10-K | |
In connection with this Annual Report on Form 10-K for the year ended December 31, 2016, an evaluation was performed of the effectiveness of the design and operation of the Company’s disclosure controls and procedures as of December 31, 2016. Based on that evaluation, the CEO and Interim CFO concluded that the disclosure controls and procedures were effective as of December 31, 2016, at the reasonable assurance level.
Management’s Report on Internal Control Over Financial Reporting
The Company’s management is responsible for establishing and maintaining adequate internal control over financial reporting, as defined in Rule 13a-15(f) under the Exchange Act. The Company’s internal control over financial reporting is a process designed to provide reasonable assurance regarding the reliability of financial reporting and the preparation of financial statements for external purposes in accordance with generally accepted accounting principles. Because of its inherent limitations, internal control over financial reporting may not prevent or detect misstatements. Also, projections of any evaluation of effectiveness to future periods are subject to the risk that controls may become inadequate because of changes in conditions, or that the degree of compliance with the policies or procedures may deteriorate.
Management conducts an evaluation and assesses the effectiveness of the Company’s internal control over financial reporting as of the reporting date. The assessment of the effectiveness of internal control over financial reporting as of December 31, 2016, did not include the internal controls of Produquímica, which the Company acquired on October 3, 2016. SEC guidance allows companies to exclude certain acquisitions from their assessment of internal control over financial reporting during the first year of an acquisition. The total and net assets of Produquímica represented approximately 34% of total assets as of December 31, 2016, and 10% of total revenues and 2% of net income for the year ended December 31, 2016. Further discussion of this acquisition can be found in Note 3 to the Company’s Consolidated Financial Statements. In making its assessment of internal control over financial reporting, management uses the criteria set forth by the Committee of Sponsoring Organizations of the Treadway Commission (“COSO”) in Internal Control-Integrated Framework (2013).
A material weakness is a control deficiency, or combination of control deficiencies, that result in more than a remote likelihood that a material misstatement of the annual or interim financial statements will not be prevented or detected. As of December 31, 2016, management conducted an evaluation and assessed the effectiveness of the Company’s internal control over financial reporting. Based on its evaluation, management concluded that the Company’s internal control over financial reporting was effective as of December 31, 2016. Ernst & Young LLP, the Company’s independent registered public accounting firm, has audited the Company’s Consolidated Financial Statements for the year ended December 31, 2016, and has also issued an audit report dated March 1, 2017, on the effectiveness of the Company’s internal control over financial reporting as of December 31, 2016, which is included in this Annual Report on Form 10-K.
Changes in Internal Control Over Financial Reporting
Except as described below, there have been no changes in the Company’s internal control over financial reporting during the most recently completed fiscal quarter that have materially affected, or are reasonably likely to materially affect, the Company’s internal control over financial reporting. The Company is in the process of integrating Produquímica’s operations, including integration of financial reporting processes and procedures and internal controls over financial reporting. Because of the size, complexity and timing of the Produquímica acquisition, the internal controls over financial reporting of Produquímica have been excluded from the Company’s assessment of the effectiveness of its internal control over financial reporting as of December 31, 2016 (as described above).
ITEM 9B. | OTHER INFORMATION |
None.
PART III
ITEM 10. | DIRECTORS, EXECUTIVE OFFICERS AND CORPORATE GOVERNANCE |
Information regarding the Company’s executive officers is included in Part I to this Form 10-K under the caption “Executive Officers of Registrant” and is incorporated herein by reference.
The information required by this item will be included under the captions “Proposal 1 – Election of Directors,” “Corporate Governance,” “Board of Directors and Board Committees” and “Section 16(a) Beneficial Ownership Reporting Compliance” in the Company’s proxy statement for its 2017 annual meeting of stockholders (the “2017 Proxy Statement”) and is incorporated herein by reference.
88 | ||
COMPASS MINERALS INTERNATIONAL, INC. | 2016 FORM 10-K | |
Code of Ethics and Business Conduct
The Company has adopted a Code of Ethics and Business Conduct that applies to all employees, including the Company’s principal executive officer, principal financial officer and principal accounting officer, as well as members of the Board of Directors of the Company. The Code of Ethics and Business Conduct is available on the Company’s website at www.compassminerals.com. The Company intends to disclose any changes in, or waivers from, this Code of Ethics and Business Conduct by posting such information on the same website or by filing a Current Report on Form 8-K, in each case to the extent such disclosure is required by SEC or New York Stock Exchange rules.
ITEM 11. | EXECUTIVE COMPENSATION |
The information required by this item will be included under the captions “2016 Non-Employee Director Compensation,” “Corporate Governance—Compensation Committee Interlocks and Insider Participation,” “Compensation Discussion and Analysis,” “Compensation Committee Report” and “Executive Compensation Tables” in the 2017 Proxy Statement and is incorporated herein by reference.
ITEM 12. | STOCK OWNERSHIP OF CERTAIN BENEFICIAL OWNERS AND MANAGEMENT AND RELATED STOCKHOLDER MATTERS |
The information required by this item will be included under the caption “Stock Ownership of Certain Beneficial Owners and Management” in the 2017 Proxy Statement and is incorporated herein by reference. Information regarding the Company’s equity compensation plans is included in Part II , Item 5 to this Form 10-K under the caption “Equity Compensation Plan Information” and is incorporated herein by reference.
ITEM 13. | CERTAIN RELATIONSHIPS AND OTHER TRANSACTIONS AND DIRECTOR INDEPENDENCE |
The information required by this item will be included under the captions “Corporate Governance—Review and Approval of Transactions with Related Persons” and “Board of Directors and Board Committees—Director Independence” in the 2017 Proxy Statement and is incorporated herein by reference.
ITEM 14. | PRINCIPAL ACCOUNTING FEES AND SERVICES |
The information required by this item will be included under the caption “Proposal 4 – Ratification of Appointment of Independent Registered Accounting Firm” in the 2017 Proxy Statement and is incorporated herein by reference.
89 | ||
COMPASS MINERALS INTERNATIONAL, INC. | 2016 FORM 10-K | |
PART IV
ITEM 15. | EXHIBITS, FINANCIAL STATEMENT SCHEDULES |
(a)(1) Financial statements and supplementary data required by this Item 15 are set forth below:
Description | Page |
Management’s Report on Internal Controls Over Financial Reporting | 88 |
Reports of Independent Registered Public Accounting Firm | 51 |
Consolidated Balance Sheets as of December 31, 2016 and 2015 | 53 |
Consolidated Statements of Operations for each of the three years in the period ended December 31, 2016 | 54 |
Consolidated Statements of Comprehensive Income for each of the three years in the period ended December 31, 2016 | 55 |
Consolidated Statements of Stockholders’ Equity for each of the three years in the period ended December 31, 2016 | 56 |
Consolidated Statements of Cash Flows for each of the three years in the period ended December 31, 2016 | 57 |
Notes to Consolidated Financial Statements | 58 |
Schedule II – Valuation Reserves | 90 |
(a)(2) Financial Statement Schedule:
Schedule II — Valuation Reserves
Compass Minerals International, Inc.
December 31, 2016, 2015 and 2014
Description (in millions) | Balance at the Beginning of the Year | Additions (Deductions) Charged to Expense | Deductions(1) | Balance at the End of the Year | ||||||||||||
Deducted from Receivables — Allowance for Doubtful Accounts | ||||||||||||||||
2016(2) | $ | 1.3 | $ | 8.0 | $ | (0.3 | ) | $ | 9.0 | |||||||
2015 | 1.4 | 0.6 | (0.7 | ) | 1.3 | |||||||||||
2014 | 1.6 | 0.3 | (0.5 | ) | 1.4 | |||||||||||
Deducted from Deferred Income Taxes — Valuation Allowance | ||||||||||||||||
2016(3) | $ | 0.9 | $ | 34.3 | $ | (1.6 | ) | $ | 33.6 | |||||||
2015 | 1.0 | 0.1 | (0.2 | ) | 0.9 | |||||||||||
2014 | 1.1 | 0.2 | (0.3 | ) | 1.0 | |||||||||||
(1) | Deduction for purposes for which reserve was created. |
(2) | The 2016 additions include $7.4 million related to the acquisition of Produquímica. This amount was not charged to expense. |
(3) | The 2016 additions relate to the acquisition of Produquímica. This amount was not charged to expense. |
90 | ||
COMPASS MINERALS INTERNATIONAL, INC. | 2016 FORM 10-K | |
EXHIBIT INDEX
Exhibit No. | Description of Exhibit |
2.1 | Agreement and Plan of Merger, dated October 13, 2001, among IMC Global Inc., Compass Minerals International, Inc. (formerly known as Salt Holdings Corporation), YBR Holdings LLC and YBR Acquisition Corp (incorporated herein by reference to Exhibit 2.1 to Compass Minerals’ Registration Statement on Form S-4, File No. 333-104603). |
2.2 | Amendment No. 1 to Agreement and Plan of Merger, dated November 28, 2001, among IMC Global Inc., Compass Minerals International, Inc. (formerly known as Salt Holdings Corporation), YBR Holdings LLC and YBR Acquisition Corp (incorporated herein by reference to Exhibit 2.2 to Compass Minerals Registration Statement on Form S-4, File No. 333-104603). |
2.3 | Subscription Agreement and Other Covenants, dated December 16, 2015, among Compass Minerals do Brasil Ltda., certain shareholders of Produquímica Indústria e Comércio S.A. and Produquímica Indústria e Comércio S.A.(incorporated by reference to Exhibit 2.3 to Compass Minerals International, Inc.’s Annual Report on Form 10-K for the year ended December 31, 2015). |
2.4 | Second Amendment, dated August 12, 2016, to the Subscription Agreement and Other Covenants, dated December 16, 2015, among Compass Minerals do Brasil Ltda., certain shareholders of Produquímica Indústria e Comércio S.A. and Produquímica Indústria e Comércio S.A. (incorporated herein by reference to Exhibit 2.1 to Compass Minerals International Inc.’s Current Report on Form 8-K filed on August 15, 2016). |
2.5 | Share Purchase and Sale Agreement, dated December 16, 2015, among Compass Minerals do Brasil Ltda., certain shareholders of Produquímica Indústria e Comércio S.A. and Produquímica Indústria e Comércio S.A. (incorporated by reference to Exhibit 2.3 to Compass Minerals International, Inc.’s Annual Report on Form 10-K for the year ended December 31, 2015). |
3.1 | Amended and Restated Certificate of Incorporation of Compass Minerals International, Inc. (incorporated herein by reference to Exhibit 3.1 to Compass Minerals International, Inc.’s Registration Statement on Form S-4, File No. 333-111953). |
3.2 | By-laws of Compass Minerals International, Inc., amended and restated as of December 22, 2014 (incorporated herein by reference to Exhibit 3.2 to Compass Minerals International, Inc.’s Current Report on Form 8-K filed on December 23, 2014). |
4.1 | Indenture, dated as of June 23, 2014, by and among Compass Minerals International, Inc., the Guarantors named therein, and U.S. National Bank Association, as trustee, relating to the 4.875% Senior Notes due 2024 (incorporated herein by reference to Exhibit 4.1 to Compass Minerals International, Inc.’s Current Report on Form 8-K filed on June 26, 2014). |
4.2 | Form of 4.875% Senior Notes due 2024 (included as Exhibit 1 to Exhibit 4.1). |
10.1 | Salt Mining Lease, dated November 9, 2001, between the Province of Ontario, as lessor, and Sifto Canada Inc. as lessee (incorporated herein by reference to Exhibit 10.1 to Compass Minerals’ Registration Statement on Form S-4, File No. 333-104603). |
10.2 | Amended and Restated Salt and Surface Lease, effective January 1, 2014, between Island Partnership, L.L.C., JMB Cote Blanche L.L.C., CFB, LLC and Carey Salt Company (incorporated herein by reference to Exhibit 10.7 to Compass Minerals International, Inc.’s Quarterly Report on Form 10-Q for the quarter ended March 31, 2014). |
10.3 | Royalty Agreement, dated September 1, 1962, between Great Salt Lake Minerals Corporation and the Utah State Land Board (incorporated herein by reference to Exhibit 10.3 to Compass Minerals’ Registration Statement on Form S-4, File No. 333-104603). |
10.4 | Share Purchase Agreement, dated March 19, 2014, between Compass Minerals Manitoba Inc., Compass Minerals International, Inc. and the shareholders of Wolf Trax Inc. (incorporated herein by reference to Exhibit 10.8 to Compass Minerals International, Inc.’s Quarterly Report on Form 10-Q for the quarter ended March 31, 2014). |
10.5 | Credit Agreement, dated April 20, 2016, among Compass Minerals International, Inc., Compass Minerals Canada Corp., Compass Minerals UK Limited, the lenders party thereto from time to time and JPMorgan Chase Bank, N.A., as administrative agent (incorporated by reference to Exhibit 10.1 to Compass Minerals International, Inc.’s Quarterly Report on Form 10-Q for the quarter ended June 30, 2016). |
10.6 | Incremental Amendment, dated September 28, 2016, to the Credit Agreement, dated April 20, 2016, among Compass Minerals International, Inc., Compass Minerals Canada Corp. and Compass Minerals UK Limited, JPMorgan Chase Bank, N.A., as administrative agent, and the lenders party thereto (incorporated by reference to Exhibit 10.1 to Compass Minerals International, Inc.’s Current Report on Form 8-K dated September 28, 2016). |
10.7 | Certificate of Designation for the Series A Junior Participating Preferred Stock, par value $0.01 per share (incorporated herein by reference to Exhibit 4.1 to Compass Minerals International, Inc.’s Current Report on Form 8-K filed on December 19, 2012). |
10.8+ | Compass Minerals International, Inc. Directors’ Deferred Compensation Plan, Amended and Restated Effective as of January 1, 2005 (incorporated herein by reference to Exhibit 10.26 to Compass Minerals International, Inc.’s Annual Report on Form 10-K for the year ended December 31, 2006). |
91 | ||
COMPASS MINERALS INTERNATIONAL, INC. | 2016 FORM 10-K | |
10.9+ | First Amendment to the Compass Minerals International, Inc. Directors’ Deferred Compensation Plan effective January 1, 2007 (incorporated herein by reference to Exhibit 10.28 to Compass Minerals International, Inc.’s Annual Report on Form 10-K for the year ended December 31, 2006). |
10.10+ | Second Amendment to the Compass Minerals International, Inc. Directors’ Deferred Compensation Plan (incorporated herein by reference to Exhibit 10.4 to Compass Minerals International, Inc.’s Quarterly Report on Form 10-Q for the quarter ended March 31, 2009). |
10.11+ | Amendment to 2012 and 2013 Independent Director Deferred Stock Award Agreement for Eric Ford (incorporated herein by reference to Exhibit 10.15 to Compass Minerals International, Inc.’s Annual Report on Form 10-K for the year ended December 31, 2013). |
10.12+ | Form of 2012 Independent Director Deferred Stock Award Agreement (incorporated herein by reference to Exhibit 10.3 to Compass Minerals International, Inc.’s Quarterly Report on Form 10-Q for the quarter ended March 31, 2012). |
10.13+ | Form of 2014 Foreign Director Deferred Stock Award Agreement (incorporated herein by reference to Exhibit 10.6 to Compass Minerals International, Inc.’s Quarterly Report on Form 10-Q for the quarter ended March 31, 2014). |
10.14+ | 2015 Form of Independent Director Deferred Award Agreement (incorporated by reference to Exhibit 10.2 to Compass Minerals International, Inc.’s Quarterly Report on Form 10-Q for the quarter ended June 30, 2015). |
10.15+ | 2015 Form of Independent Foreign Director Deferred Award Agreement (incorporated by reference to Exhibit 10.3 to Compass Minerals International, Inc.’s Quarterly Report on Form 10-Q for the quarter ended June 30, 2015). |
10.16+ | Non-Employee Director Compensation Policy, effective January 1, 2017 (incorporated by reference to Exhibit 10.2 to Compass Minerals International, Inc.’s Current Report on Form 8-K filed on February 2, 2017). |
10.17+ | Summary of Non-Employee Director Compensation, as of January 1, 2017 (incorporated by reference to Exhibit 10.1 to Compass Minerals International, Inc.’s Current Report on Form 8-K filed on February 2, 2017). |
10.18+ | Form of Indemnification Agreement for Directors of Compass Minerals International, Inc. (incorporated by reference to Exhibit 10.1 to Compass Minerals International, Inc.’s Current Report on Form 8-K filed on March 26, 2009). |
10.19+ | Compass Minerals International, Inc. 2005 Incentive Award Plan as approved by stockholders on August 4, 2005 (incorporated herein by reference to Exhibit 10.15 to Compass Minerals International, Inc.’s Annual Report on Form 10-K for the year ended December 31, 2005). |
10.20+ | First Amendment to the Compass Minerals International, Inc. 2005 Incentive Award Plan (incorporated herein by reference to Exhibit 10.5 to Compass Minerals International, Inc.’s Quarterly Report on Form 10-Q for the quarter ended March 31, 2007). |
10.21+ | Second Amendment to the Compass Minerals International, Inc. 2005 Incentive Award Plan (incorporated herein by reference to Exhibit 10.6 to Compass Minerals International, Inc.’s Quarterly Report on Form 10-Q for the quarter ended March 31, 2009). |
10.22+ | Third Amendment to the Compass Minerals International, Inc. 2005 Incentive Award Plan (incorporated herein by reference to Exhibit 10.22 to Compass Minerals International, Inc.’s Annual Report on Form 10-K for the year ended December 31, 2011). |
10.23+ | Fourth Amendment to the Compass Minerals International, Inc. 2005 Incentive Award Plan (incorporated herein by reference to Exhibit 10.23 to Compass Minerals International, Inc.’s Annual Report on Form 10-K for the year ended December 31, 2011). |
10.24+ | Compass Minerals International, Inc. 2015 Incentive Award Plan (incorporated by reference to Exhibit 99.1 to Compass Minerals International, Inc.’s Registration Statement on Form S-8, File No. 333-203922). |
10.25+ | 2010 and 2011 Form of Non-Qualified Stock Option Award Agreement (incorporated herein by reference to Exhibit 10.1 to Compass Minerals International, Inc.’s Quarterly Report on Form 10-Q for the quarter ended March 31, 2010). |
10.26+ | 2012 Form of Non-Qualified Stock Option Award Agreement (incorporated herein by reference to Exhibit 10.4 to Compass Minerals International, Inc.’s Quarterly Report on Form 10-Q for the quarter ended March 31, 2012). |
10.27+ | 2013 Form of Non-Qualified Stock Option Award Agreement (incorporated herein by reference to Exhibit 10.5 to Compass Minerals International, Inc.’s Quarterly Report on Form 10-Q for the quarter ended March 31, 2013). |
10.28+ | 2014 Form of Non-Qualified Stock Option Award Agreement (incorporated herein by reference to Exhibit 10.4 to Compass Minerals International, Inc.’s Quarterly Report on Form 10-Q for the quarter ended March 31, 2014). |
10.29+ | 2015 Form of Non-Qualified Stock Option Award Agreement (incorporated herein by reference to Exhibit 10.5 to Compass Minerals International, Inc.’s Quarterly Report on Form 10-Q for the quarter ended March 31, 2015). |
10.30+ | 2016 Form of Non-Qualified Stock Option Award Agreement (incorporated by reference to Exhibit 10.4 to Compass Minerals International, Inc.’s Quarterly Report on Form 10-Q for the quarter ended June 30, 2016). |
10.31+ | 2014 Form of Performance-Based Restricted Stock Unit Award Agreement (incorporated herein by reference to Exhibit 10.5 to Compass Minerals International Inc.’s Quarterly Report on Form 10-Q for the quarter ended March 31, 2014). |
10.32+ | 2015 Form of Restricted Stock Unit Award Agreement (incorporated by reference to Exhibit 10.6 to Compass Minerals International, Inc.’s Quarterly Report on Form 10-Q for the quarter ended March 31, 2015). |
92 | ||
COMPASS MINERALS INTERNATIONAL, INC. | 2016 FORM 10-K | |
10.33+ | 2016 Form of Restricted Stock Unit Award Agreement (incorporated by reference to Exhibit 10.5 to Compass Minerals International, Inc.’s Quarterly Report on Form 10-Q for the quarter ended June 30, 2016). |
10.34+ | 2014 Form of Three-Year Performance Stock Unit Award Agreement (incorporated herein by reference to Exhibit 10.3 to Compass Minerals International Inc.’s Quarterly Report for the quarter ended March 31, 2014). |
10.35+ | 2015 Form of Three-Year Performance Stock Unit Award Agreement (ROIC) (incorporated by reference to Exhibit 10.3 to Compass Minerals International, Inc.’s Quarterly Report on Form 10-Q for the quarter ended March 31, 2015). |
10.36+ | 2015 Form of Three-Year Performance Stock Unit Award Agreement (rTSR) (incorporated by reference to Exhibit 10.4 to Compass Minerals International, Inc.’s Quarterly Report on Form 10-Q for the quarter ended March 31, 2015). |
10.37+ | 2016 Form of Three-Year Performance Stock Unit Award Agreement (ROIC) (incorporated by reference to Exhibit 10.2 to Compass Minerals International, Inc.’s Quarterly Report on Form 10-Q for the quarter ended June 30, 2016). |
10.38+ | 2016 Form of Three-Year Performance Stock Unit Award Agreement (rTSR) (incorporated by reference to Exhibit 10.3 to Compass Minerals International, Inc.’s Quarterly Report on Form 10-Q for the quarter ended June 30, 2016). |
10.39+ | 2015 Rules, Policies and Procedures for Equity Awards Granted to Employees (incorporated by reference to Exhibit 10.7 to Compass Minerals International, Inc.’s Quarterly Report on Form 10-Q for the quarter ended March 31, 2015). |
10.40+ | 2016 Rules, Policies and Procedures for Equity Awards Granted to Employees (incorporated by reference to Exhibit 10.6 to Compass Minerals International, Inc.’s Quarterly Report on Form 10-Q for the quarter ended June 30, 2016) |
10.41+ | Compass Minerals International, Inc. Restoration Plan (incorporated herein by reference to Exhibit 10.2 to Compass Minerals International, Inc.’s Quarterly Report on Form 10-Q for the quarter ended June 30, 2007). |
10.42+ | First Amendment to the Compass Minerals International, Inc. Restoration Plan dated as of December 5, 2007 (incorporated herein by reference to Exhibit 10.27 to Compass Minerals International, Inc.’s Annual Report on Form 10-K for the year ended December 31, 2007). |
10.43+ | Second Amendment to the Compass Minerals International, Inc. Restoration Plan (incorporated herein by reference to Exhibit 10.5 to Compass Minerals International, Inc.’s Quarterly Report on Form 10-Q for the quarter ended March 31, 2009). |
10.44*+ | 2013 Form of Change in Control Severance Agreement. |
10.45*+ | 2017 Form of Restrictive Covenant Agreement. |
10.46+ | Employment Agreement, effective January 17, 2013, between Compass Minerals International, Inc. and Francis J. Malecha (incorporated herein by reference to Exhibit 10.1 to Compass Minerals International, Inc.’s Current Report on Form 8-K filed on January 10, 2013). |
10.47+ | Change in Control Severance Agreement, dated January 17, 2013, between Compass Minerals International, Inc. and Francis J. Malecha (incorporated herein by reference to Exhibit 10.40 to Compass Minerals International, Inc.’s Annual Report on Form 10-K for the annual period ended December 31, 2012). |
10.48*+ | Restrictive Covenant Agreement, dated January 5, 2013, between Compass Minerals International, Inc. and Francis J. Malecha. |
10.49+ | Separation Letter Agreement and Final Release and Waiver of Claims, dated February 17, 2016, between Compass Minerals International, Inc. and Keith E. Espelien (incorporated by reference to Exhibit 10.1 to Compass Minerals International, Inc.’s Current Report on Form 8-K filed on February 23, 2016). |
12.1* | Statement of Computation of Ratio of Earnings to Fixed Charges. |
14.1 | Code of Ethics and Business Conduct, adopted by Compass Minerals International, Inc. on May 4, 2016 (incorporated by reference to Exhibit 14.1 to the Company’s Current Report on Form 8-K filed on May 5, 2016). |
21.1* | Subsidiaries of the Registrant. |
23.1* | Consent of Ernst & Young LLP. |
24.1* | Power of Attorney. |
31.1* | Section 302 Certifications of Francis J. Malecha, President and Chief Executive Officer. |
31.2* | Section 302 Certifications of John D. Craft, Interim Chief Financial Officer. |
32** | Certification Pursuant to 18 U.S.C.§1350 of Francis J. Malecha, President and Chief Executive Officer and John D. Craft, Interim Chief Financial Officer. |
95* | Mine Safety Disclosures. |
101** | The following financial statements from the Compass Minerals International, Inc.’s Annual Report on Form 10-K for the year ended December 31, 2016, formatted in Extensive Business Reporting Language (XBRL): (i) Consolidated Balance Sheets, (ii) Consolidated Statements of Operations, (iii) Consolidated Statements of Comprehensive Income (iv) Consolidated Statement of Stockholders’ Equity, (v) Consolidated Statements of Cash Flows, and (vi) the Notes to the Consolidated Financial Statements. |
* | Filed herewith. |
** | Furnished herewith. |
+ | Management contracts and compensatory plans or arrangements. |
93 | ||
COMPASS MINERALS INTERNATIONAL, INC. | 2016 FORM 10-K | |
SIGNATURES
Pursuant to the requirements of Section 13 or 15(d) of the Securities Exchange Act of 1934, the registrant has duly caused this report to be signed on its behalf by the undersigned, thereunto duly authorized.
COMPASS MINERALS INTERNATIONAL, INC. | |||
Date: March 1, 2017 | By: | /s/ John D. Craft | |
John D. Craft | |||
Interim Chief Financial Officer | |||
Pursuant to the requirements of the Securities Exchange Act of 1934, this report has been signed below by the following persons on behalf of the registrant and in the capacities indicated on March 1, 2017.
Signature | Capacity | ||
/s/ Francis J. Malecha | President, Chief Executive Officer | ||
Francis J. Malecha | and Director (Principal Executive Officer) | ||
/s/ John D. Craft | Interim Chief Financial Officer | ||
John D. Craft | (Principal Financial and Accounting Officer) | ||
/s/ David J. D’Antoni | Director | ||
David J. D’Antoni | |||
/s/ Valdemar L. Fischer | Director | ||
Valdemar L. Fischer | |||
/s/ Eric Ford | Director | ||
Eric Ford | |||
/s/ Richard S. Grant | Director | ||
Richard S. Grant | |||
/s/ Allan R. Rothwell | Director | ||
Allan R. Rothwell | |||
/s/ Lori A. Walker | Director | ||
Lori A. Walker | |||
/s/ Paul S. Williams | Director | ||
Paul S. Williams | |||
/s/ Amy J. Yoder | Director | ||
Amy J. Yoder | |||
94 | ||