Attached files
| file | filename |
|---|---|
| EX-32.2 - EXHIBIT 32.2 - SINCLAIR BROADCAST GROUP INC | a322sbgi-20161231x10k.htm |
| EX-32.1 - EXHIBIT 32.1 - SINCLAIR BROADCAST GROUP INC | a321sbgi-20161231x10k.htm |
| EX-31.2 - EXHIBIT 31.2 - SINCLAIR BROADCAST GROUP INC | a312sbgi-20161231x10k.htm |
| EX-31.1 - EXHIBIT 31.1 - SINCLAIR BROADCAST GROUP INC | a311sbgi-20161231x10k.htm |
| EX-23 - EXHIBIT 23 - SINCLAIR BROADCAST GROUP INC | q42016ex23consentofpwc.htm |
| EX-21 - EXHIBIT 21 - SINCLAIR BROADCAST GROUP INC | exhibit21-q42016subsidiari.htm |
| EX-12 - EXHIBIT 12 - SINCLAIR BROADCAST GROUP INC | exhibit12-2016computationo.htm |
UNITED STATES
SECURITIES AND EXCHANGE COMMISSION
WASHINGTON, D.C. 20549
FORM 10-K
ý ANNUAL REPORT PURSUANT TO SECTION 13 OR 15(d) OF THE SECURITIES EXCHANGE ACT OF 1934
FOR THE FISCAL YEAR ENDED DECEMBER 31, 2016
OR
o TRANSITION REPORT PURSUANT TO SECTION 13 OR 15(d) OF THE SECURITIES EXCHANGE ACT OF 1934
FOR THE TRANSITION PERIOD FROM TO .
COMMISSION FILE NUMBER: 000-26076
SINCLAIR BROADCAST GROUP, INC.
(Exact name of Registrant as specified in its charter)
Maryland | 52-1494660 | |
(State or other jurisdiction of | (I.R.S. Employer Identification No.) | |
incorporation or organization) | ||
10706 Beaver Dam Road
Hunt Valley, MD 21030
(Address of principal executive offices)
(410) 568-1500
(Registrant’s telephone number, including area code)
Securities registered pursuant to Section 12(b) of the Act:
Title of each class | Name of each exchange on which registered | |
Class A Common Stock, par value $ 0.01 per share | The NASDAQ Stock Market LLC | |
Securities registered pursuant to Section 12(g) of the Act: None
Indicate by check mark if the registrant is a well-known seasoned issuer, as defined in Rule 405 of the Securities Act. Yes ý No o
Indicate by check mark if the registrant is not required to file reports pursuant to Section 13 or Section 15(d) of the Act. Yes o No ý
Indicate by check mark whether the registrant (1) has filed all reports required to be filed by Section 13 or 15(d) of the Securities Exchange Act of 1934 during the preceding 12 months (or for such shorter period that the registrant was required to file such reports), and (2) has been subject to such filing requirements for the past 90 days. Yes ý No o
Indicate by check mark whether the registrant has submitted electronically and posted on its corporate Website, if any, every Interactive Data File required to be submitted and posted pursuant to Rule 405 of Regulation S-T (§ 232.405 of this chapter) during the preceding 12 months (or for such shorter period that the registrant was required to submit and post such files). Yes ý No o
Indicate by check mark if disclosure of delinquent filers pursuant to Item 405 of Regulation S-K (§ 229.405 of this chapter) is not contained herein, and will not be contained, to the best of registrant’s knowledge, in definitive proxy or information statements incorporated by reference in Part III of this Form 10-K or any amendment to this Form 10-K. o
Indicate by check mark whether the registrant is a large accelerated filer, an accelerated filer, a non-accelerated filer or a smaller reporting company. See the definitions of “large accelerated filer,” “accelerated filer” and “smaller reporting company” in Rule 12b-2 of the Exchange Act.
Large accelerated filer x | Accelerated filer o | Non-accelerated filer o | Smaller reporting company o | |||
Indicate by check mark whether the registrant is a shell company (as defined in Rule 12b-2 of the Act). Yes o No ý
Based on the closing sales price of $29.86 per share as of June 30, 2016, the aggregate market value of the voting and non-voting common equity of the Registrant held by non-affiliates was approximately $2,048.4 million.
Indicate the number of shares outstanding of each of the registrant’s classes of common stock, as of the latest practicable date.
Title of each class | Number of shares outstanding as of February 20, 2017 | |
Class A Common Stock | 64,669,100 | |
Class B Common Stock | 25,670,684 | |
Documents Incorporated by Reference - Portions of our definitive Proxy Statement relating to our 2017 Annual Meeting of Shareholders are incorporated by reference into Part III of this Form 10-K. We anticipate that our Proxy Statement will be filed with the Securities and Exchange Commission within 120 days after the end of our fiscal year ended December 31, 2016.
SINCLAIR BROADCAST GROUP, INC.
FORM 10-K FOR THE YEAR ENDED DECEMBER 31, 2016
TABLE OF CONTENTS
2
FORWARD-LOOKING STATEMENTS
This report includes or incorporates forward-looking statements within the meaning of Section 27A of the Securities Act of 1933, as amended, and Section 21E of the Securities Exchange Act of 1934, as amended (the Exchange Act), and the U.S. Private Securities Litigation Reform Act of 1995. We have based these forward-looking statements on our current expectations and projections about future events. These forward-looking statements are subject to risks, uncertainties and assumptions about us, including, among other things, the following risks:
General risks
• | the impact of changes in national and regional economies and credit and capital markets; |
• | consumer confidence; |
• | the potential impact of changes in tax law; |
• | the activities of our competitors; |
• | terrorist acts of violence or war and other geopolitical events; |
• | natural disasters that impact our advertisers and our stations; and |
• | cybersecurity. |
Industry risks
• | the business conditions of our advertisers particularly in the automotive and service industries; |
• | competition with other broadcast television stations, radio stations, multi-channel video programming distributors (MVPDs), internet and broadband content providers and other print and media outlets serving in the same markets; |
• | the performance of networks and syndicators that provide us with programming content, as well as the performance of internally originated programming; |
• | the availability and cost of programming from networks and syndicators, as well as the cost of internally originated programming; |
• | our relationships with networks and their strategies to distribute their programming via means other than their local television affiliates, such as over-the-top content; |
• | the effects of the Federal Communications Commission’s (FCC’s) National Broadband Plan, the impact of the incentive auction and the potential repacking of our broadcasting spectrum within a limited timeframe and funding allocated; |
• | the potential for additional governmental regulation of broadcasting or changes in those regulations and court actions interpreting those regulations, including ownership regulations limiting over-the-air television's ability to compete effectively (including regulations relating to Joint Sales Agreements (JSA) and Shared Services Agreements (SSA), and the national ownership cap), arbitrary enforcement of indecency regulations, retransmission consent regulations and political or other advertising restrictions, such as payola rules; |
• | the impact of FCC and Congressional efforts to limit the ability of a television station to negotiate retransmission consent agreements for the same-market stations it does not own and other FCC efforts which may restrict a television station's retransmission consent negotiations; |
• | the impact of FCC rules requiring broadcast stations to publish, among other information, political advertising rates online; |
• | labor disputes and legislation and other union activity associated with film, acting, writing and other guilds and professional sports leagues; |
• | the broadcasting community’s ability to develop and adopt a viable mobile digital broadcast television (mobile DTV) strategy and platform, such as the adoption of ATSC 3.0 broadcast standard, and the consumer’s appetite for mobile television; |
• | the impact of programming payments charged by networks pursuant to their affiliation agreements with broadcasters requiring compensation for network programming; |
• | the effects of declining live/appointment viewership as reported through rating systems and local television efforts to adopt and receive credit for same day viewing plus viewing on-demand thereafter; |
• | changes in television rating measurement methodologies that could negatively impact audience results; |
• | the ability of local MVPD's to coordinate and determine local advertising rates as a consortium; |
• | changes in the makeup of the population in the areas where stations are located; |
• | the operation of low power devices in the broadcast spectrum, which could interfere with our broadcast signals; |
• | Over-the-top (OTT) technologies and their potential impact on cord-cutting; |
• | the impact of MVPD’s offering “skinny” programming bundles that may not include television broadcast stations; and |
• | fluctuations in advertising rates and availability of inventory. |
3
Risks specific to us
• | the effectiveness of our management; |
• | our ability to attract and maintain local, national, and network advertising and successfully participate in new sales channels such as programmatic advertising through business partnership ventures and the development of technology; |
• | our ability to service our debt obligations and operate our business under restrictions contained in our financing agreements; |
• | our ability to successfully implement and monetize our own content management system (CMS) designed to provide our viewers significantly improved content via the internet and other digital platforms; |
• | our ability to successfully renegotiate retransmission consent agreements; |
• | our ability to renew our FCC licenses; |
• | our limited ability to obtain FCC approval for any future acquisitions, as well as, in certain cases, customary antitrust clearance for any future acquisitions; |
• | our ability to identify media business investment opportunities and to successfully integrate any acquired businesses, as well as the success of our digital initiatives in a competitive environment, such as the investment in the re-launch of Circa; |
• | our ability to maintain our affiliation and programming service agreements with our networks and program service providers and at renewal, to successfully negotiate these agreements with favorable terms; |
• | our ability to effectively respond to technology affecting our industry and to increasing competition from other media providers; |
• | the strength of ratings for our local news broadcasts including our news sharing arrangements; |
• | the successful execution of our program development and multi-channel broadcasting initiatives including American Sports Network (ASN), COMET, and other original programming, and mobile DTV; and |
• | the results of prior year tax audits by taxing authorities. |
Other matters set forth in this report and other reports filed with the Securities and Exchange Commission (SEC), including the Risk Factors set forth in Item 1A of this report may also cause actual results in the future to differ materially from those described in the forward-looking statements. However, additional factors and risks not currently known to us or that we currently deem immaterial may also cause actual results in the future to differ materially from those described in the forward-looking statements. You are cautioned not to place undue reliance on any forward-looking statements, which speak only as of the date on which they are made. We undertake no obligation to update or revise any forward-looking statements, whether as a result of new information, future events or otherwise. In light of these risks, uncertainties and assumptions, events described in the forward-looking statements discussed in this report might not occur.
4
PART I
ITEM 1. BUSINESS
We are a diversified television broadcasting company with national reach with a strong focus on providing high-quality content on our local television stations and digital platforms. The content, distributed through our broadcast platform, consists of programming provided by third-party networks and syndicators, local news, our own networks, and other original programming produced by us. We also distribute our original programming, and owned and operated networks, on other third-party platforms. Additionally, we own digital and internet media products that are complementary to our extensive portfolio of television station related digital properties. We focus on offering marketing solutions to advertisers through our television and digital platforms and digital agency services. Outside of our media related businesses, we operate technical services companies focused on supply and maintenance of broadcast transmission systems as well as research and development for the advancement of broadcast technology, and we manage other non-media related investments.
Broadcast
As of December 31, 2016, our broadcast distribution platform is a single reportable segment for accounting purposes. It consists primarily of our broadcast television stations, which we own, provide programming and operating services pursuant to local marketing agreements (LMAs), or provide sales services and other non-programming operating services pursuant to other outsourcing agreements (such as JSAs and SSAs) to 173 stations in 81 markets. These stations broadcast 483 channels, including 221 channels affiliated with primary networks or program service providers comprised of: FOX (54), ABC (36), CBS (30), NBC (22), CW (43), and MyNetworkTV (MNT) (36). The other 262 channels broadcast programming from Antenna TV, American Sports Network (ASN), Azteca, Bounce Network, COMET, Decades, Estrella TV, Get TV, Grit, Me TV, MundoFox, Retro TV, Telemundo, This TV, News & Weather, Univision, Zuus Country, and two channels broadcasts independent programming. For the purpose of this report, these channels are referred to as “our” stations. Refer to our Television Markets and Stations table later in this Item 1. for more information. As discussed under Pending Matters within Federal Regulation of Television Broadcasting within this Item 1., we do not expect the results of the FCC incentive auction to have a material change on the above operations.
Our broadcast segment provides free over-the-air programming to television viewing audiences in the communities we serve through our local television stations. The programming that we provide on our primary channels consists of network provided programs, locally-produced news, local sporting events, programming from program service arrangements, syndicated entertainment programs, and internally originated programming provided by our other media subsidiaries. We provide live local sporting events on many of our stations by acquiring the local television broadcast rights for these events. Additionally, we purchase and barter for popular syndicated programming from third party television producers.
We are the nation's largest producer of local news. We produce approximately 2,200 hours of news per week at 112 stations in 76 markets, including three stations which produce news pursuant to a local news sharing arrangement for competitive stations in that market. We have 20 stations which have local news sharing arrangements with a competitive station in that market that produces the news aired on our station.
See Operating Strategy later in this Item 1. for more information regarding the news and programming we provide.
Our primary source of revenue is the sale of commercial inventory on our television stations to our advertising customers. We also earn revenues by providing digital content to non-linear devices via websites, mobile, and social media advertisements. Our objective is to meet the needs of our advertising customers by delivering significant audiences in key demographics. Our strategy is to achieve this objective by providing quality local news programming, popular network, syndicated and live sports programs, and other original content to our viewing audience. We attract most of our national television advertisers through national marketing representation firms which have offices in New York City, Los Angeles, Chicago and Atlanta. Our local television advertisers are attracted through the use of a local sales force at each of our television stations, which is comprised of approximately 700 sales account executives and 100 local sales managers company-wide.
We also earn revenue from our retransmission consent agreements through payments from multichannel video programming distributors ("MVPDs") in our markets. The MVPDs are local cable companies, satellite television, and local telecommunication video providers. The revenues primarily represent payments from the MVPDs for access to our broadcast signal and are typically based on the number of subscribers they have.
5
Our operating results are subject to cyclical fluctuations from political advertising. Political spending has been significantly higher in the even-number years due to the cyclicality of political elections. In addition, every four years, political spending is typically elevated further due to the advertising related to the presidential election. Because of the political election cyclicality, there has been a significant difference in our operating results when comparing even-numbered years’ performance to the odd numbered years’ performance. Additionally, our operating results are impacted by the number and importance of individual political races and issues discussed on a national level as well as those within the local communities we serve. We believe political advertising will continue to be a strong advertising category in our industry. With increased spending by Political Action Committees (PACs), including so-called Super PACs, and as political-activism around social, political, economic and environmental causes continues to draw attention, political advertising levels may increase further.
Original Networks and Content
We own and operate various networks carried on distribution platforms owned by us or others: Tennis Channel (Tennis), a cable network acquired in March 2016, which includes coverage of the top 100 tournaments and original professional sport and tennis lifestyle shows; COMET, our science fiction multicast network which debuted in October 2015; and ASN, our regional sports network.
We expect to launch, CHARGE!, our adventure and action-based emerging network, in the first quarter of 2017, and TBD, the first multiscreen TV network in the U.S. market to bring premium internet-first content to TV homes across America, in early 2017.
Our internally developed content includes Ring of Honor ("ROH"), our professional wrestling promotion and Full Measure with Sharyl Attkisson ("Full Measure"), our national Sunday morning investigative and political analysis program, launched in October 2015.
Digital and Internet
Sinclair Digital Ventures focuses on investment in emerging digital technologies and digital content companies that support and expand Sinclair's digital capabilities and non-linear footprint. We earn revenues from Compulse Integrated Marketing, a full service digital agency which uses our digital expertise to help businesses run social media, search, advertising, email marketing, web design, mobile marketing, creative services, and navigate and compete in a world of constant innovation and changes in consumer behavior. Circa is a national digital news operation offering video-rich news and entertainment tailored for mobile devices and aimed at the younger demographic.
Technical Services
We own subsidiaries which are dedicated to providing broadcast related technical services to the broadcast industry including: Acrodyne Technical Services, a provider of service and support for broadcast transmitters throughout the world; Dielectric, a designer and manufacturer of broadcast systems including all components from transmitter output to antenna; and ONE Media, a technology innovator at the forefront of developing industry standards and related technologies for Next Generation Broadcast Platforms (Next Gen) encompassing its flexible and enhanced vision for broadcasting. In April 2016, we launched ONE Media 3.0, a wholly-owned subsidiary whose purpose will be to develop business opportunities, products, and service associated with ATSC 3.0 "Next Generation" broadcast transmission standard and TV platform.
Other Non-media Investments
We own various non-media related investments through our subsidiary Keyser Capital which is an originator, underwriter, and manager of our investments across multiple asset classes including private equity, mezzanine financing, and real estate investments. Some of the largest investments include: Triangle Sign and Service (Triangle), a sign designer and fabricator; Alarm Funding Associates (Alarm Funding), a regional security alarm operator and bulk acquisition company; Bay Creek South (Bay Creek), a land developer for a planned resort community in Cape Charles, VA; and Jefferson Place, a mixed use land development project in Frederick, MD.
We are a Maryland corporation formed in 1986. Our principal offices are located at 10706 Beaver Dam Road, Hunt Valley, Maryland 21030. Our telephone number is (410) 568-1500 and our website address is www.sbgi.net. The information contained on, or accessible through, our website is not part of this annual report on Form 10-K and is not incorporated herein by reference.
6
Television Markets and Stations
As of December 31, 2016, we own and operate or provide programming and/or sales and other shared services to television stations in the following 81 markets:
Market | Market Rank (a) | Number of Channels | Stations | Network Affiliation (b) | ||||
Washington, DC | 7 | 3 | WJLA | ABC | ||||
Seattle / Tacoma, WA | 14 | 5 | KOMO, KUNS | ABC | ||||
Minneapolis / St. Paul, MN | 15 | 4 | WUCW | CW | ||||
St. Louis, MO | 21 | 3 | KDNL | ABC | ||||
Pittsburgh, PA | 23 | 7 | WPGH, WPNT | FOX, MNT | ||||
Raleigh / Durham, NC | 24 | 5 | WLFL, WRDC | CW, MNT | ||||
Portland, OR | 25 | 9 | KATU, KUNP, KUNP-LP | ABC | ||||
Baltimore, MD | 26 | 10 | WBFF, WUTB(d), WNUV(c) | FOX, CW, MNT | ||||
Nashville, TN | 29 | 9 | WZTV, WUXP, WNAB(d) | FOX, MNT, CW | ||||
San Antonio, TX | 31 | 6 | KABB, KMYS(d), WOAI | FOX, NBC, CW | ||||
Columbus, OH | 32 | 9 | WSYX, WWHO(d), WTTE(c) | ABC, FOX, CW, MNT | ||||
Salt Lake City, UT | 34 | 7 | KUTV, KMYU, KENV(d), KJZZ | CBS, NBC, MNT, IND | ||||
Milwaukee, WI | 35 | 5 | WCGV, WVTV | CW, MNT | ||||
Cincinnati, OH | 36 | 7 | WSTR(d), WKRC | CBS, CW, MNT | ||||
Asheville, NC / Greenville, SC | 37 | 7 | WMYA(c), WLOS | ABC, MNT | ||||
West Palm Beach / Fort Pierce, FL | 38 | 9 | WTVC, WTCN-CA, WWHB-CA, WPEC | CBS, CW, MNT | ||||
Austin, TX | 39 | 2 | KEYE | CBS | ||||
Las Vegas, NV | 40 | 6 | KSNV, KVCW | NBC, CW, MNT | ||||
Oklahoma City, OK | 41 | 6 | KOCB, KOKH | FOX, CW | ||||
Norfolk, VA | 42 | 4 | WTVZ | MNT | ||||
Harrisburg / Lancaster / Lebanon / York, PA | 43 | 3 | WHP | CBS, CW, MNT | ||||
Grand Rapids / Kalamazoo, MI | 44 | 3 | WWMT | CBS, CW | ||||
Birmingham / Tuscaloosa, AL | 45 | 13 | WTTO, WABM, WDBB(c), WBMA-LD | ABC, CW, MNT | ||||
Greensboro / High Point / Winston Salem, NC | 46 | 6 | WXLV, WMYV | ABC, MNT | ||||
Providence, RI / New Bedford, MA | 52 | 3 | WJAR | NBC | ||||
Buffalo, NY | 53 | 7 | WUTV, WNYO | FOX, MNT | ||||
Fresno / Visalia, CA | 54 | 9 | KMPH, KFRE, KMPH-CD | FOX, CW | ||||
Richmond, VA | 55 | 3 | WRLH | FOX, MNT | ||||
Wilkes Barre / Scranton, PA | 56 | 10 | WOLF(c), WQMY(c), WSWB(d) | FOX, CW, MNT | ||||
Little Rock / Pine Bluff, AR | 57 | 3 | KATV | ABC | ||||
Tulsa, OK | 58 | 3 | KTUL | ABC | ||||
Albany, NY | 59 | 6 | WRGB, WCWN | CBS, CW | ||||
Mobile, AL / Pensacola, FL | 60 | 9 | WEAR, WJTC(d), WFGX, WPMI(d) | ABC, NBC, MNT, IND | ||||
Lexington, KY | 63 | 3 | WDKY | FOX | ||||
7
Market | Market Rank (a) | Number of Channels | Stations | Network Affiliation (b) | ||||
Dayton, OH | 64 | 7 | WKEF, WRGT(d) | ABC, FOX, MNT | ||||
Wichita / Hutchinson, KS | 66 | 17 | KSAS, KMTW(c), KOCW, KAAS, KAAS-LP, KSAS-LP | FOX, MNT | ||||
Roanoke / Lynchburg, VA | 67 | 4 | WSET | ABC | ||||
Green Bay / Appleton, WI | 68 | 4 | WLUK, WCWF | FOX, CW | ||||
Des Moines, IA | 69 | 3 | KDSM | FOX | ||||
Charleston / Huntington, WV | 70 | 7 | WCHS, WVAH(d) | ABC, FOX | ||||
Flint / Saginaw / Bay City, MI | 72 | 9 | WSMH, WEYI(d), WBSF(d) | FOX, NBC, CW | ||||
Spokane, WA | 73 | 3 | KLEW | CBS | ||||
Omaha, NE | 74 | 6 | KPTM, KXVO(c) | FOX, CW, MNT | ||||
Rochester, NY | 76 | 6 | WUHF, WHAM(d) | ABC, FOX, CW | ||||
Columbia, SC | 77 | 3 | WACH | FOX | ||||
Toledo, OH | 78 | 4 | WNWO | NBC | ||||
Madison, WI | 80 | 3 | WMSN | FOX | ||||
Portland, ME | 81 | 6 | WGME, WPFO(d) | CBS, FOX | ||||
Paducah, KY/ Cape Girardeau, MO | 83 | 6 | KBSI, WDKA(c) | FOX, MNT | ||||
Harlingen / Weslaco / Brownsville / McAllen, TX | 84 | 3 | KGBT | CBS | ||||
Syracuse, NY | 85 | 6 | WSTM, WSTQ-LP, WTVH(d) | CBS, NBC, CW | ||||
Champaign / Springfield / Decatur, IL | 86 | 14 | WICS, WCCU(d), WICD, WRSP(d), WBUI(d) | ABC, FOX, CW | ||||
Chattanooga, TN | 89 | 6 | WTVC, WFLI(c) | ABC, FOX, CW, MNT | ||||
Cedar Rapids, IA | 90 | 6 | KGAN, KFXA(d) | CBS, FOX | ||||
Savannah, GA | 91 | 3 | WTGS | FOX | ||||
El Paso, TX | 92 | 6 | KFOX, KDBC(d) | FOX, CBS, MNT | ||||
Charleston, SC | 94 | 3 | WCIV | ABC, MNT | ||||
South Bend-Elkhart, IN | 96 | 2 | WSBT | CBS, FOX | ||||
Myrtle Beach / Florence, SC | 102 | 6 | WPDE, WWMB(c) | ABC, CW | ||||
Johnstown / Altoona, PA | 104 | 4 | WJAC | NBC | ||||
Lincoln and Hasting-Kearney, NE | 105 | 10 | KHGI, KFXL, KHGI-LD, KWNB, KHGI-CD, KWNB-LD | ABC, FOX | ||||
Boise, ID | 106 | 6 | KBOI, KYUU-LD | CBS, CW Plus | ||||
Tallahassee, FL | 107 | 5 | WTWC, WTLF(d) | FOX, NBC, CW Plus | ||||
Reno, NV | 112 | 8 | KRXI, KAME(c), KRNV(d) | FOX, MNT, NBC, CW | ||||
Eugene, OR | 117 | 18 | KVAL, KCBY, KPIC(e), KMTR(d), KMCB, KTCW | CBS, NBC | ||||
Peoria / Bloomington, IL | 118 | 1 | WHOI | Comet | ||||
Traverse City / Cadillac, MI | 119 | 12 | WPBN, WGTU(d), WTOM, WGTQ(d) | ABC, NBC | ||||
Macon, GA | 121 | 3 | WGXA | ABC, FOX | ||||
Yakima / Pasco / Richland / Kennewick, WA | 122 | 12 | KIMA, KEPR, KUNW-CD, KVVK-CD, KORX-CD | CBS, CW Plus | ||||
Bakersfield, CA | 126 | 6 | KBAK, KBFX-CD | CBS, FOX | ||||
Corpus Christi, TX | 128 | 5 | KUQI, KTOV-LP, KXPX-LP | FOX, MNT | ||||
Amarillo, TX | 131 | 6 | KVII, KVIH | ABC | ||||
Columbia / Jefferson City, MO | 136 | 4 | KRCG | CBS | ||||
Medford, OR | 139 | 4 | KTVL | CBS, CW Plus | ||||
8
Market | Market Rank (a) | Number of Channels | Stations | Network Affiliation (b) | ||||
Beaumont/Port Arthur/Orange, TX | 141 | 6 | KFDM, KBTV(d) | CBS, FOX, CW Plus | ||||
Sioux City, IA | 149 | 8 | KBVK-LP, KMEG(d), KPTH, KPTP-LD | CBS, FOX, MNT | ||||
Albany, GA | 152 | 3 | WFXL | FOX | ||||
Wheeling, WV / Steubenville, OH | 158 | 3 | WTOV | FOX, NBC | ||||
Gainesville, FL | 161 | 6 | WGFL(c), WYME-CD, WNBW(d) | CBS, NBC, MNT | ||||
Quincy, IL / Hannibal, MO / Keokuk, IA | 170 | 3 | KHQA | ABC, CBS | ||||
Ottumwa, IA / Kirksville, MO | 200 | 3 | KTVO | ABC, CBS | ||||
Total Television Channels | 483 | |||||||
(a) | Rankings are based on the relative size of a station’s Designated Market Area (DMA) among the 210 generally recognized DMAs in the United States as estimated by Nielsen as of September 2016. |
(b) | We broadcast programming from the following providers on our channels: |
Affiliation | Number of Channels | Number of Markets | Expiration Dates (1) | |||
ABC | 36 | 25 | September 30, 2017 through December 31, 2020 | |||
CBS | 30 | 24 | April 29, 2017 through December 31, 2021 | |||
NBC | 22 | 32 | December 31, 2017 through December 31, 2018 | |||
FOX | 54 | 36 | June 30, 2017 through December 31, 2019 | |||
MNT | 36 | 26 | August 31, 2018 | |||
CW | 43 | 16 | August 31, 2021 | |||
Total Major Network Affiliates | 221 | |||||
9
Affiliation | Number of Channels | Number of Markets | Expiration Dates (1) | |||
Antenna TV | 23 | 19 | December 31, 2017 through January 1, 2019 | |||
ASN | 19 | 17 | (f) | |||
Azteca | 3 | 3 | February 28, 2017 through February 28, 2018 | |||
Bounce Network | 4 | 4 | August 31, 2019 | |||
COMET | 84 | 70 | (f) | |||
Decades | 1 | 1 | May 31, 2018 | |||
Estrella TV | 2 | 2 | September 30, 2017 | |||
Get TV | 22 | 23 | June 30, 2017 | |||
Grit | 47 | 45 | December 31, 2019 | |||
Independent programming | 2 | 2 | N/A | |||
Me TV | 14 | 14 | May 31, 2017 through February 28, 2019 | |||
MundoFox | 3 | 3 | September 30, 2015 through December 31, 2016 | |||
Retro TV | 5 | 5 | December 31, 2014 through January 7, 2017 | |||
Telemundo | 1 | 1 | January 14, 2017 | |||
This TV | 12 | 9 | November 1, 2014 through December 31, 2015 | |||
News & Weather | 10 | 9 | December 31, 2017 | |||
Univision | 6 | 4 | December 31, 2019 | |||
Zuus Country | 4 | 4 | September 30, 2014 | |||
Total Other Affiliates | 262 | |||||
Total Television Channels | 483 | |||||
(1) | When we negotiate the terms of our network affiliations or program service arrangements, we generally negotiate on behalf of all of our stations affiliated with that entity simultaneously. This results in substantially similar terms for our stations, including the expiration date of the network affiliations or program service arrangements. If the affiliation agreement expires, we may continue to operate under the existing affiliation agreement on a temporary basis while we negotiate a new affiliation agreement. |
(c) | The license assets for these stations are currently owned by third parties. We provide programming, sales, operational and administrative services to these stations pursuant to certain service agreements, such as LMAs. |
(d) | The license and programming assets for these stations are currently owned by third parties. We provide certain non-programming related sales, operational and administrative services to these stations pursuant to service agreements, such as joint sales and shared services agreements. |
(e) | We provide programming, sales, operational, and administrative services to this station, of which 50% is owned by a third party. |
(f) | We own and operate the networks, which are carried on our multi-cast distribution platform. |
10
Operating Strategy
Programming to Attract Viewership. We seek to target our programming offerings to attract viewership, to meet the needs of the communities in which we serve and to meet the needs of our advertising customers. In pursuit of this strategy, we seek to develop original programming or obtain, at attractive prices, popular syndicated programming that is complementary to each station’s network programming. We also seek to broadcast live local and national sporting events that would appeal to a large segment of the local community. See Popular Sporting Events below for further discussion. Moreover, we produce local news at 112 stations in 76 markets, including three stations which have a local news sharing agreement with a competitive station in that market. See Local News below for further discussion.
Television advertising prices are primarily based on ratings information measured and distributed by Nielsen. Nielsen is currently not accredited by the Media Rating Council, an independent organization that monitors rating services, which revoked Nielsen’s accreditation in the 154 markets in which Nielsen measures ratings exclusively by its diary methodology. As of December 31, 2016, approximately 42 of our 81 markets are diary only markets. We have entered into a contract with comScore (formerly Rentrak), an alternative rating service provider that uses set-top box television measurements to provide us additional measurement information to the ratings services that Nielsen provides for all 173 of our stations in our 81 markets.
News. We believe that the production and broadcasting of local news is an important link to the community and an aid to a station’s efforts to expand its viewership. In addition, local news programming can provide access to advertising sources targeted specifically to local news viewers. Our news stations also produce content on digital platforms such as websites, mobile applications, and social media.
During 2016, we expanded news in 11 markets and plan to add additional newscasts in 14 markets in 2017. During the year ended December 31, 2016, 32% of our net time sales were earned during the local news we produce each week.
Our local news initiatives are an important part of our strategy. We have entered into local news sharing arrangements in which we receive news in 20 markets from other in-market broadcasters and provide news in 3 markets to other in-market broadcasters. We believe that, in the markets where we have news share arrangements, such arrangements generally provide both higher viewer ratings and revenues for the station receiving the news and generate a profit for the news share provider. Generally, both parties and the local community are beneficiaries of these arrangements.
In addition to our traditional local news stories, we have utilized our national reach and placement in the nation's capital to provide our local viewers with broader national news stories which are relevant to our local viewers.
Our local news coverage is complemented with airing Full Measure. Additionally, our national news desk and Capitol Hill bureau news teams produce daily unique stories unavailable from other sources and focused on government accountability storytelling that provides a significant point of difference for our stations. Available on-air and online, the bureau not only expands our news presence, but gives our local station viewers an opportunity to hear the views of their members of Congress through programs such as "Connect to Congress," our weekly on-air and digital feature which provides an electronic video pathway for lawmakers to speak to their constituents.
We also provide our viewers with "Town Halls," which brings together our viewers to discuss major local and national topics. During 2016 we produced "Town Halls" covering both local and national elections, including political debates, immigration, firearms, drugs, the Black Lives Matter Movement, and law enforcement and community. During 2017, we expect to produce over 100 hours of such coverage.
As discussed under Expansion of digital and internet below, in 2016 we launched Circa, a national online digital news operation aimed at the Millennial demographic which both leverages and adds to our local and national new coverage.
11
Popular Sporting Events. At some of our stations, we have been able to acquire local television broadcast rights for certain sporting events, including NBA basketball, MLB, NFL football, NHL hockey, ACC basketball and both Big Ten and SEC football and basketball and certain other college and high school sports. Our CW and MyNetworkTV stations generally face fewer preemption restrictions on broadcasting live local sporting events compared with our FOX, ABC, CBS and NBC stations, which are required to broadcast a greater number of hours of programming supplied by the networks. In addition, our stations that are affiliated with FOX, ABC, CBS and NBC have network arrangements to broadcast certain NBA basketball games, MLB baseball games, NFL football games, NHL hockey games, NASCAR races and PGA golf events, as well as other popular sporting events. Tennis has telecast rights to the U.S. Open, Wimbledon, Roland Garros (French Open), Australian Open, Emirates Airline US Open Series, ATP World Tour Masters 1000 events, top-tier WTA competitions, Davis Cup and Fed Cup by BNP Paribas, and Hopman Cup. Our stations also broadcast programming and other content provided by ASN and Tennis. Also, we provide access to certain events through our premium OTT offering, Tennis Channel Plus. See Development of Original Networks and Content below for the discussion related to the operating strategy of Tennis and ASN.
Control of Operating and Programming Costs. By employing a disciplined approach to managing programming acquisition and other costs, we have been able to achieve operating margins that we believe are very competitive within the television broadcast industry. We believe our national reach as of December 31, 2016 of over 38.0% of the country provides us with a strong position to negotiate with programming providers and, as a result, the opportunity to purchase high quality programming at more favorable prices. Moreover, we emphasize control of each of our station’s programming and operating costs through program-specific profit analysis, detailed budgeting, regionalization of staff and detailed long-term planning models. We also control our programming cost by creating original high-quality programming that is distributed on our broadcast platform. This original programming includes our ASN and COMET networks, and ROH and Full Measure programs.
Developing Local Franchises. We believe the greatest opportunity for a sustainable and growing customer base lies within our local communities. Therefore, we have focused on developing a strong local sales force at each of our television stations, which is comprised of approximately 700 sales account executives and 100 local sales managers company-wide. Excluding political advertising revenue, retransmission revenues, and other local revenues, 70.5% and 71.1% of our same station net time sales were local for the years ended December 31, 2016 and 2015 respectively. Market share survey results reflect that our stations' share of the local television advertising market decreased to 24.6% in 2016 from 25.2% in 2015. Our goal is to grow our local revenues by increasing our market share and by developing new business opportunities and offering marketing solutions across our platforms.
Attract and Retain High Quality Management. We believe that much of our success is due to our ability to attract and retain highly skilled and motivated managers at both the corporate and local station levels. We provide a combination of base salary, long-term incentive compensation including equity awards and, where appropriate, cash bonus pay designed to be competitive with comparable employers in the television broadcast industry. A significant portion of the compensation available to certain members of our senior management and our sales force is based on their achievement of certain performance goals. We also encourage station managers and employees to utilize our diverse station group to grow in their careers while remaining in the Sinclair family of stations via internal promotion and relocation.
Multi-Channel Broadcasting. FCC rules allow broadcasters to transmit additional digital channels within the spectrum allocated to each FCC license holder. This provides viewers with additional programming alternatives at no additional cost to them. We may consider other alternative programming formats that we could air using our multi-channel digital spectrum space with the goal towards achieving higher profits and community service. As of December 31, 2016, we have 310 multi-channels in our digital spectrum.
Retransmission Consent Agreements. We have retransmission consent agreements with MVPDs, such as cable, satellite and telecommunications operators in our markets. MVPDs compensate us for the right to retransmit our broadcast signals. Our successful negotiations with MVPDs have created agreements that now produce meaningful sustainable revenue streams.
Improvement and maintenance of our distribution platforms. We continue to improve and maintain a strong distribution platform that consists of our traditional broadcast network and our digital platforms. Our Acrodyne and Dielectric subsidiaries are leaders in servicing and manufacturing broadcast infrastructure. As a result, we maintain a strong infrastructure through which we provide high quality uninterrupted content on our broadcast stations. Further, we expect that these subsidiaries will be critical in both the repack of the broadcast spectrum and the buildout of the infrastructure behind the Advanced Television Systems Committee standard 3.0 (ATSC 3.0) for both our stations and other broadcasters. See Development of Next Generation Broadcast Platforms (Next Gen) below for further discussion related to ATSC 3.0.
Developing New Business. We strive to develop new business models to complement or enhance our traditional television broadcast business. We have developed new ways to sell online, mobile text messaging and social media advertising along with
12
our traditional commercial broadcasting model. Additionally, we continue to leverage our national reach to provide new high quality content to our local communities.
We continue to expand our digital distribution platforms through initiatives such as our new video management system, which simplifies and automates our broadcast-to-digital streaming workflow and allows for dynamic replacement of broadcast ads with digital ads targeted to each individual viewer. By using a single ad-serving system across all of our web sites, mobile apps and other digital assets, we are able to streamline our sales workflow, optimize yield and deliver comprehensive sales opportunities across our digital footprint. Additionally, we are deploying over-the-top initiatives (OTT), such as the NewsOn app, as well as our own content applications.
Strategic Realignment of Station Portfolio. We routinely review and conduct investigations of potential television station acquisitions, dispositions and station swaps. At any given time, we may be in discussions with one or more television station owners.
Development of Original Networks and Content. In March 2016, we acquired Tennis Channel. Unlike fully distributed cable networks that are in a declining business, Tennis Channel, with its live tournaments and matches, passionate fan base and established brand, is under-distributed. With the support of Sinclair and our relationships with the multi-video program distributors (MVPDs), we have been successful in negotiating significant increases in carriage with MVPDs, with more penetration expected. Among the many benefits of the expanded carriage and pairing their content with our broadcast promotional capabilities, are additional MVPD subscriber fees, viewers, and advertising revenues.
In October 2015, we led the market in launching the first-ever science fiction multicast network, COMET, featuring over 1,500 hours of premium MGM content and already reaching approximately 70 million households with more coverage expected. In January 2017, we announced that we plan to follow COMET's success with the first quarter of 2017 launch of CHARGE!, a new 24/7 adventure and action-based network that will feature more than 2,300 hours of TV series content and more than 2,000 movie titles. CHARGE! is expected to reach in excess of 50% of the country by the end of the second quarter by way of distribution deals outside of Sinclair’s footprint.
We seek to expand our sports broadcasting in DMAs as profitable opportunities arise. ASN became a 24/7 sports network in January 2016 and is currently carried in 19 markets which we plan to expand as we build a regional strategy with a national reach. ASN has sports rights agreements with a number of distinguished NCAA Division I conferences including Conference USA, the Colonial Athletic Association, Mid-Atlantic Athletic Conference, Ivy League, and American Athletic Conference. In addition to its college initiative, ASN produces local high school sports under the “Thursday Night Lights” and “Friday Night Rivals” brands.
In early 2017, we plan to launch TBD, the first multiscreen TV network in the U.S. market to bring premium internet-first content to TV homes across America. TBD will include web series, short films, fashion, comedy, lifestyle, eSports, music and viral content, through partnerships with creators such as Nerdist, Whistle Sports, Geek and Sundry, The Lizzie Bennet Diaries, Kinonation Movies, and Fail Army.
Expansion of digital and internet. In 2016, we launched Circa, a national online digital news operation aimed at the Millennial demographic. The site is focused on issues trending from around the country, delivered in an independent-minded style, with a heavy focus on short and long form video, optimized for mobile and social media engagement. In addition to its unique stories, news talent and creativity, Circa has the added benefit of capitalizing on our broadcast branding and promotional platform to drive viewing impressions, an opportunity not available to other online news providers.
We have leveraged our digital expertise by launching Compulse through which we run effective, integrated, and multi-platform digital marketing programs that drive loyalty, engage consumers and help businesses achieve their goals.
These innovative products and extension of our core broadcast business allow us to compete for digital, internet, network, and print impressions and revenues. We continue to seek additional opportunities to invest in emerging digital technologies and digital content companies that support and expand Sinclair's digital capabilities and non-linear footprint.
13
Development of Next Generation Broadcast Platforms (Next Gen). ONE Media has developed, successfully demonstrated, and received approval for inclusion in the ATSC 3.0 transmission standard, the critical signaling and framing technology that is core to building Next Gen. ATSC 3.0 is an enhancement to the current broadcast standard and provides for increased data bits that are mobile, universal and Internet Protocol (IP) based with conditional access. Next Gen provides a common IP pipe for broadband and broadcast convergence and compelling hybrid functionality; a way to make the broadcast platform an integral piece in the much broader wireless ecosystem. In addition, it opens opportunities to deliver enhanced core television services such as higher quality 4K “Ultra High Definition” video and immersive “3D Audio” sound, as well as the entire range of targeted advertising, personalized content delivery, and data collection and measurement. Additionally, Next Gen will allow us to deploy multiple new business opportunities. This could include partnerships with video and audio programming and other datacasting services, content delivery networks seeking to expand “edge” services, and other users seeking alternatives for regional and national content distribution.
Other Non-media Investments. We have sought ways to diversify our business and return additional value to our shareholders through investments in non-media based businesses and real estate. We carry investments in various companies from different industries including sign design and fabrication and security alarm monitoring and bulk acquisition. In addition, we invest in various real estate ventures including developmental land, operating commercial and multi-family residential real estate properties and apartments. We also invest in private equity and structured debt / mezzanine financing investment funds. Currently, operating results from our investments represent a small portion of our overall operating results.
FEDERAL REGULATION OF TELEVISION BROADCASTING
The ownership, operation and sale of television stations are subject to the jurisdiction of the FCC, which acts under the authority granted by the Communications Act of 1934, as amended (the Communications Act). Among other things, the FCC assigns frequency bands for broadcasting; determines the particular frequencies, locations and operating power of stations; issues, renews, revokes and modifies station licenses; regulates equipment used by stations; adopts and implements regulations and policies that directly or indirectly affect the ownership, operation and employment practices of stations; and has the power to impose penalties for violations of its rules and regulations of the Communications Act.
The following is a summary of certain provisions of the Communications Act and specific FCC regulations and policies. Reference should be made to the Communications Act, FCC rules and the public notices and rulings of the FCC for further information concerning the nature and extent of federal regulation of broadcast stations.
License Grant and Renewal
Television stations operate pursuant to broadcasting licenses that are granted by the FCC for maximum terms of eight years and are subject to renewal upon application to the FCC. During certain periods when renewal applications are pending, petitions to deny license renewals can be filed by interested parties, including members of the public.
Although historically renewal of a license, including those of the Company, is granted in the vast majority of cases, even when petitions to deny are filed, there can be no assurance that the license of any station will be renewed or, if renewed, that the renewal terms will be for the maximum term permitted.
All of our stations' most recent license renewal applications have been granted for the maximum term permitted. The next television license renewal application cycle will begin on June 1, 2020.
Ownership Matters
General. The Communications Act prohibits the assignment of a broadcast license or the transfer of control of a broadcast license without the prior approval of the FCC. In determining whether to permit the assignment or transfer of control of, or the grant or renewal of, a broadcast license, the FCC considers a number of factors pertaining to the licensee, including compliance with various rules limiting common ownership of media properties, the “character” of the licensee and those persons holding “attributable” interests in that licensee and compliance with the Communications Act’s limitations on foreign ownership. The FCC has indicated that in order to approve an assignment or transfer of a broadcast license the FCC must make an affirmative determination that the proposed transaction serves the public interest, not merely that the transaction does not violate its rules or shares factual elements with other transactions previously approved by the FCC, and that it may deny a transaction if it determines that the transaction was not in the public interest.
14
The FCC generally applies its ownership limits to “attributable” interests held by an individual, corporation, partnership or other association. In the case of corporations holding, or through subsidiaries controlling, broadcast licenses, the interests of officers, directors and those who, directly or indirectly, have the right to vote 5% or more of the corporation’s stock (or 20% or more of such stock in the case of insurance companies, investment companies and bank trust departments that are passive investors) are generally attributable. In addition, pursuant to what is known as the equity-debt-plus rule, a major programming supplier or same-market media entity will be an attributable owner of a station if the supplier or same-market media entity holds debt or equity, or both, in the station that is greater than 33% of the value of the station’s total debt plus equity. Further, the Communications Act generally prohibits foreign parties from having more than a 20% interest (voting or equity) in a broadcast licensee or more than a 25% interest in the parent of that licensee. Following a Declaratory Ruling in 2013 in which the Commission indicated that it was open to considering proposals for foreign investment in broadcast licenses that exceed the 25% benchmark on a case by case basis, on September 29, 2016, the FCC adopted a Report and Order which among other things, (i) simplified the foreign ownership approval process for broadcast licensees seeking to exceed the 25% benchmark and (ii) modified the methodology a licensee may use to determine compliance with the foreign ownership rules.
Sinclair and its subsidiaries are domestic corporations, and the members of the Smith family (who, as of December 31, 2016, together hold approximately 77.3% of the common voting rights of Sinclair) are all United States citizens. Our amended and restated Articles of Incorporation (the Amended Certificate) contain limitations on alien ownership and control that are substantially similar to those contained in the Communications Act. Pursuant to the Amended Certificate, we have the right to repurchase alien-owned shares at their fair market value to the extent necessary, in the judgment of the Board of Directors, to comply with the alien ownership restrictions.
Additional ownership rules as currently in effect are as follows:
Radio / Television Cross-Ownership Rule. The FCC’s radio / television cross-ownership rule generally permits a party to own a combination of up to two television stations and six radio stations in the same market, depending on the number of independent media voices in the market.
Newspaper / Broadcast Cross-Ownership Rule. The FCC’s rule generally prohibits the common ownership of a radio or television broadcast station and a daily newspaper in the same market. We do not currently own any daily newspapers.
National Ownership Rule. By statute, the national television viewing audience reach cap is 39%. Under this rule, where an individual or entity has an attributable interest in more than one television station in a market, the percentage of the national television viewing audience encompassed within that market is only counted once. Additionally, because VHF stations (channels 2 through 13) historically covered a larger portion of the market than UHF stations (channels 14 through 51), only half of the households in the market area of any UHF station were, until recently, included when calculating an entity’s national television viewing audience (commonly referred to as the UHF discount). On September 6, 2016, the FCC released a Report and Order eliminating the UHF discount. This Order is currently the subject of a Petition for Reconsideration filed with the FCC and Petitions for Review filed in the U.S. Court of Appeals for the D.C. Circuit. We cannot predict the outcome of these proceedings.
The majority of the stations we own and operate, or to which we provide programming services, are UHF. As a result of the recent elimination of the UHF discount, counting all our present stations and pending transactions, we reach over 38% of U.S. households, limiting our future ability to make television station acquisitions. If the UHF discount is restored, this would reduce our reach (for FCC purposes) to approximately 24% of U.S. households, which would expand our ability to make televisions station acquisitions in the future. See Item 1A. Risk Factors for further discussion of the risk related to the outcome of rules governing the UHF discount.
Local Television (Duopoly) Rule. A party may own television stations in adjoining markets, even if there is a digital noise limited service contour overlap between the two stations’ broadcast signals, and generally may own two stations in the same market only (i) if there is no digital overlap between the stations; or (ii) if the market containing both the stations will contain at least eight independently owned full-power television stations post-merger (the eight voices test) and not more than one station is among the top-four rated stations in the market.
15
Local Marketing and Outsourcing Agreements
Certain of our stations have entered into agreements with other stations in the same market, through which we provide programming and operating services pursuant to time brokerage or local marketing agreements (LMAs) or provide sales services and other non-programming operating services pursuant to outsourcing agreements, such as joint sales agreements (JSAs) and shared services agreements (SSAs). LMAs and JSAs are attributable where a licensee holds an attributable interest in a television station and (i) programs more than 15% of the weekly broadcast hours and/or (ii) sells more than 15% of the weekly advertising time on another television station in the same market.
LMAs existing prior to November 5, 1996 are currently grandfathered until further FCC action. In August 2016, the FCC completed both its 2010 and 2014 quadrennial reviews of its media ownership rules and issued an order ("Ownership Order") which left most of the existing multiple ownership rules intact, but amended the rules to provide for the attribution of JSAs where two television stations are located in the same market, and a party with an attributable interest in one station sells more than 15% of the advertising time per week of the other station. JSAs existing as of March 31, 2014 were grandfathered until October 1, 2025, at which point they must be terminated, amended or otherwise come into compliance with the new rules. In addition, these "grandfathered" JSAs may be transferred or assigned without losing grandfathering status. These new rules could limit our future ability to create duopolies or other two station operations in certain markets. We cannot predict whether we will be able to terminate or restructure such arrangements prior to October 1, 2025, on terms that are as advantageous to us as the current arrangements. If we are required to terminate or modify our LMAs or JSAs, our business could be adversely affected in several ways, including losses on investments and termination penalties. Petitions for Reconsideration of the Ownership Order, including the new JSA attribution rules, were filed with the FCC and Petitions for Review of the Ownership Order were filed in the U.S. Court of Appeals for the D.C. Circuit. We cannot predict the outcome of these proceedings. For more information on the risks, see Changes in rules on local marketing agreements within The FCC’s multiple ownership rules limit our ability to operate multiple television stations in some markets and may result in a reduction in our revenue or prevent us from reducing costs. Changes in these rules may threaten our existing strategic approach to certain television markets within Risk Factors and Changes in the Rules on Television Ownership within Note 11. Commitments and Contingencies for further discussion.
In March, 2014, the FCC issued a public notice on the processing of broadcast television applications proposing sharing arrangements and contingent interests. The public notice indicated that the FCC will closely scrutinize any broadcast assignment or transfer application that proposes that two or more stations in the same market will enter into an agreement to share facilities, employees and/or services or to jointly acquire programming or sell advertising including through a JSA, LMA or similar agreement and enter into an option, right of first refusal, put /call arrangement or other similar contingent interest, or a loan guarantee. In February 2017, this guidance was rescinded by the FCC.
Antitrust Regulation. DOJ and the Federal Trade Commission have increased their scrutiny of the television industry and have reviewed matters related to the concentration of ownership within markets (including LMAs and outsourcing agreements) even when ownership or the LMA or other outsourcing agreement in question is permitted under the laws administered by the FCC or by FCC rules and regulations. The DOJ takes the position that an LMA or other outsourcing agreement entered into in anticipation of a station’s acquisition with the proposed buyer of the station constitutes a change in beneficial ownership of the station which, if subject to filing under the Hart-Scott-Rodino Antitrust Improvements Act, cannot be implemented until the waiting period required by that statute has ended or been terminated.
Satellite Carriage
The Satellite Home Viewer Act (SHVA), as extended by The Satellite Home Viewer Improvement Act of 1999 (SHVIA), the Satellite Home Viewer Extension and Reauthorization Act (SHVERA), the Satellite Television Extension and Localism Act of 2010 (STELA) and the Satellite Television Extension and Localism Act Reauthorization (STELAR) among other things, (i) allows satellite carriers to provide local television signals by satellite within a station market, and to carry all local signals in any market where they carry any local signals, (ii) requires all television stations to elect to exercise certain “must-carry” or “retransmission consent” rights in connection with their carriage by satellite carriers, and (iii) authorizes satellite delivery of distant network signals, significantly viewed signals and local low-power television station signals into local markets under defined circumstances.
16
Must-Carry / Retransmission Consent
Television broadcasters are required to make triennial elections to exercise either certain “must-carry” or “retransmission consent” rights in connection with their carriage by cable systems in each broadcaster’s local market. By electing to exercise must-carry rights, a broadcaster demands carriage and receives a specific channel on cable systems within its DMA. Must carry rights are not absolute and are dependent on a number of factors which may or may not be present in a particular case. Alternatively, if a broadcaster chooses to exercise retransmission consent rights, it can prohibit cable systems from carrying its signal or grant the appropriate cable system the authority to retransmit the broadcast signal for a fee or other consideration. We have elected to exercise our retransmission consent rights with respect to all our stations. In February 2015, the FCC issued an order implementing certain statutorily required changes to its rules governing the duty to negotiate retransmission consent agreements in good faith. Under these rules, unless the stations are directly or indirectly under common de jure control as permitted under the regulations of the Commission, a station may not delegate authority to negotiate or approve a retransmission consent agreement to a station located in the same market or to a third party that negotiates together with another television station in the same market, nor may stations in the same market facilitate or agree to facilitate coordinated negotiation of retransmission consent terms for their stations in that market, including through the sharing of information.
Further, in September 2015, the FCC released a Notice of Proposed Rulemaking in response to a Congressional directive in STELAR to examine the “totality of the circumstances test” for good-faith negotiations of retransmission consent. The proposed rulemaking sought comment on new factors and evidence to consider in its evaluation of claims of bad faith negotiation, including service interruptions prior to a “marquee sports or entertainment event,” restrictions on online access to broadcast programming during negotiation impasses, broadcasters’ ability to offer bundles of broadcast signals with other broadcast stations or cable networks, and broadcasters’ ability to invoke the FCC’s exclusivity rules during service interruptions. On July 14, 2016, the FCC's Chairman announced that the FCC would not, at that time, proceed to adopt additional rules governing good faith negotiations of retransmission consent. No formal action has yet been taken on this Proposed Rulemaking, and we cannot predict if the full Commission will agree to terminate the Rulemaking without action.
Network Non-Duplication / Syndicated Exclusivity / Territorial Exclusivity
The FCC’s syndicated exclusivity rules allow local broadcast television stations to demand that cable operators black out syndicated non-network programming carried on “distant signals” (i.e. signals of broadcast stations, including so-called “superstations,” which serve areas substantially removed from the cable systems’ local community). The FCC’s network non-duplication rules allow local broadcast, network affiliated stations to require that cable operators black out duplicate network programming carried on distant signals. Both rules are subject to various exceptions and limitations. In a number of markets in which we own or program stations affiliated with a network, a station that is affiliated with the same network in a nearby market is carried on cable systems in our markets. Such significantly viewed signals are not subject to black out pursuant to FCC’s network non-duplication rules. The carriage of two network stations on the same cable system could result in a decline of viewership, adversely affecting the revenues of our owned or programmed stations. In March, 2014, the FCC issued a Report And Order And Further Notice Of Proposed Rulemaking, requesting comments on whether it has authority to, and should, eliminate or modify its network non-duplication and/or syndicated exclusivity rules. This proceeding is pending and we cannot predict when or how the FCC will resolve that rulemaking.
Digital Television
FCC rules provide that television broadcast licensees may use their digital television (DTV) channels for a wide variety of services such as HD television, multiple standard definition television programming, audio, data and other types of communications, subject to the requirement that each broadcaster provide at least one free video channel equal in quality to the current technical standard and further subject to the requirement that broadcasters pay a fee of 5% of gross revenues from any DTV ancillary or supplementary service for which there is a subscription fee or for which the licensee receives a fee from a third party.
17
Programming and Operations
The Communications Act requires broadcasters to serve the “public interest.” The FCC has relaxed or eliminated many of the more formalized procedures it had developed in the past to promote the broadcast of certain types of programming responsive to the needs of a station’s community of license. FCC licensees continue to be required, however, to present programming that is responsive to the needs and interests of their communities and to maintain certain records demonstrating such responsiveness. Complaints from viewers concerning a station’s programming may be considered by the FCC when it evaluates renewal applications of a licensee, although such complaints may be filed at any time and generally may be considered by the FCC at any time. Stations also must pay regulatory and application fees and follow various rules promulgated under the Communications Act that regulate, among other things, political advertising, sponsorship identifications, obscene and indecent broadcasts and technical operations, including limits on radio frequency radiation. In addition, television licensees have obligations to create and follow employment outreach programs, provide a minimum amount of programming for children, comply with rules relating to the emergency alert system (EAS), maintain an online public inspection file and abide by regulations specifying requirements to provide closed captions for its programming. FCC licensees are, in general, responsible for the content of their broadcast programming, including that supplied by television networks. Accordingly, there is a risk of being fined as a result of our broadcast programming, including network programming.
Pending Matters
Congress and the FCC have under consideration and in the future may consider and adopt, new laws, regulations and policies regarding a wide variety of matters that could affect, directly or indirectly, the operation, ownership and profitability of our broadcast stations, result in the loss of audience share and advertising revenues for our broadcast stations and affect our ability to acquire additional broadcast stations or finance such acquisitions.
Other matters that could affect our broadcast properties include technological innovations and developments generally affecting competition in the mass communications industry, such as direct television broadcast satellite service, Class A television service, the continued establishment of wireless cable systems and low power television stations, digital television technologies, the internet and mobility and portability of our broadcast signal to hand-held devices.
Congress authorized the FCC to conduct so-called “incentive auctions” to auction and re-purpose broadcast television spectrum for mobile broadband use. Pursuant to the auction, television broadcasters submitted bids to receive compensation for relinquishing all or a portion of its rights in the television spectrum of their full-service and Class A stations. Low power stations were not eligible to participate in the auction and are not protected and therefore may be displaced or forced to go off the air as a result of the post-auction repacking process. This "reverse" portion of the spectrum auction was completed in early 2017. Based on the bids accepted by the FCC, we anticipate that we will receive later in 2017 an estimated $313.0 million of gross proceeds from the auction. The results of the auction are not expected to produce any material change in operations or results of the Company. In the repacking process associated with the auction, the FCC has reassigned some stations to new post-auction channels. We do not expect reassignment to new channels to have a material impact on our coverage. We received letters from the FCC in February 2017 notifying us that 93 of our stations have been assigned to new channels. The legislation authorizing the incentive auction provides the FCC with a $1.75 billion fund to reimburse reasonable costs incurred by stations that are reassigned to new channels in the repack. We expect that Dielectric will be critical in the repack of the broadcast spectrum for both our stations and other broadcasters.
Other Considerations
The preceding summary is not a complete discussion of all provisions of the Communications Act or other congressional acts or of the regulations and policies of the FCC, or in some cases, the DOJ. For further information, reference should be made to the Communications Act other congressional acts and regulations and public notices circulated from time to time by the FCC, or in some cases, the DOJ. There are additional regulations and policies of the FCC and other federal agencies that govern political broadcasts, advertising, equal employment opportunity and other matters affecting our business and operations.
18
ENVIRONMENTAL REGULATION
Prior to our ownership or operation of our facilities, substances or waste that are, or might be considered, hazardous under applicable environmental laws may have been generated, used, stored or disposed of at certain of those facilities. In addition, environmental conditions relating to the soil and groundwater at or under our facilities may be affected by the proximity of nearby properties that have generated, used, stored or disposed of hazardous substances. As a result, it is possible that we could become subject to environmental liabilities in the future in connection with these facilities under applicable environmental laws and regulations. Although we believe that we are in substantial compliance with such environmental requirements and have not in the past been required to incur significant costs in connection therewith, there can be no assurance that our costs to comply with such requirements will not increase in the future or that we will not become subject to new governmental regulations, including those pertaining to potential climate change legislation, that may impose additional restrictions or costs on us. We presently believe that none of our properties have any condition that is likely to have a material adverse effect on our consolidated balance sheets, consolidated statements of operations or consolidated statements of cash flows.
COMPETITION
Our television stations compete for audience share and advertising revenue with other television stations in their respective DMAs, as well as with other advertising media such as MVPDs, cable networks, radio, newspapers, magazines, outdoor advertising, transit advertising, telecommunications providers, direct mail, and internet and other digital media, such as OTT. Some competitors are part of larger organizations with substantially greater financial, technical and other resources than we have. Other factors that are material to a television station’s competitive position include signal coverage, local program acceptance, network affiliation or program service, audience characteristics and assigned broadcast frequency.
Competition in the television broadcasting industry occurs primarily in individual DMAs. Generally, a television broadcasting station in one DMA does not compete with stations in other DMAs. Our television stations are located in highly competitive DMAs. MVPDs can increase competition for a broadcast television station by bringing into its market additional cable network channels. These narrow cable network channels are typically low rated, and, as a result, advertisements are inexpensive to the local advertisers. In addition, certain of our DMAs are overlapped by over-the-air station from adjacent DMAs and MVPDs of stations from other DMAs, which tends to spread viewership and advertising expenditures over a larger number of television stations.
Television stations compete for audience share primarily on the basis of program popularity, which has a direct effect on advertising rates. Our network affiliated stations are largely dependent upon the performance of network provided programs in order to attract viewers. Non-network time periods are programmed by the station primarily with syndicated programs purchased for cash, cash and barter or barter-only, as well as through self-produced news, public affairs programs, live local sporting events, paid-programming and other entertainment programming.
Television advertising rates are based upon factors which include the size of the DMA in which the station operates, a program’s popularity among the viewers that an advertiser wishes to attract, the number of advertisers competing for the available time, the demographic makeup of the DMA served by the station, the availability of alternative advertising media in the DMA, the aggressiveness and knowledge of the sales forces in the DMA and development of projects, features and programs that tie advertiser messages to programming. We believe that our sales and programming strategies allow us to compete effectively for advertising revenues within our DMAs.
The television broadcasting industry is continuously faced with technical changes and innovations, competing entertainment and communications media, changes in labor conditions and governmental restrictions or actions of federal regulatory bodies, including the FCC, any of which could possibly have a material effect on a television station’s operations and profits.
Moreover, technology advances and regulatory changes affecting programming delivery through fiber optic lines, video compression, and new wireless uses could lower entry barriers for new video channels and encourage the further development of increasingly specialized “niche” programming. Telephone companies are permitted to provide video distribution services, on a common carrier basis, as “cable systems” or as “open video systems,” each pursuant to different regulatory schemes. Additionally, over-the-top (OTT) services allows consumers to consume programming on-demand and without a subscription with an MVPD. We continue to compete with the OTT services for viewership.
DTV technology allows us to provide viewers multiple channels of digital television over each of our existing standard digital channels, to provide certain programming in HD television format and to deliver other channels of information in the forms of data and programming to the internet, PCs, smart phones, tablet computers and mobile devices. These additional capabilities may provide us with additional sources of revenue, as well as additional competition.
19
We also compete for programming which involves negotiating with national program distributors or syndicators that sell first-run and rerun packages of programming. Our stations compete for access to those programs against in-market broadcast station competitors for syndicated products and with national cable networks. Public broadcasting stations generally compete with commercial broadcasters for viewers, but not for advertising dollars.
We believe we compete favorably against other television stations because of our management skill and experience, our ability historically to generate revenue share greater than our audience share, our network affiliations and program service arrangements and our local program acceptance. In addition, we believe that we benefit from the operation of multiple broadcast properties, affording us certain non-quantifiable economies of scale and competitive advantages in the purchase of programming.
EMPLOYEES
As of December 31, 2016, we had approximately 8,400 employees. Approximately 800 employees are represented by labor unions under certain collective bargaining agreements. We have not experienced any significant labor problems and consider our overall labor relations to be good.
AVAILABLE INFORMATION
We regularly use our website as a source of company information and it can be accessed at www.sbgi.net. We make available, free of charge through our website, our annual report on Form 10-K, quarterly reports on Form 10-Q, current reports on Form 8-K and amendments to those reports filed or furnished pursuant to Section 13(a) or 15(d) of the Exchange Act as soon as reasonably practicable after such documents are electronically submitted to the SEC, who also makes these reports available at http://www.sec.gov. In addition, a replay of each of our quarterly earnings conference calls is available on our website until the subsequent quarter’s earnings call. The information contained on, or otherwise accessible through, our website is not a part of this Annual Report on Form 10-K and is not incorporated herein by reference.
ITEM 1A. RISK FACTORS
You should carefully consider the risks described below before investing in our securities. Our business is also subject to the risks that affect many other companies such as general economic conditions, geopolitical events, competition, technological obsolescence and employee relations. The risks described below, along with risks not currently known to us or that we currently believe are immaterial, may impair our business operations and our liquidity in an adverse way.
Our advertising revenue can vary substantially from period to period based on many factors beyond our control. This volatility affects our operating results and may reduce our ability to repay indebtedness or reduce the market value of our securities.
We rely on sales of advertising time for the majority of our revenues and, as a result, our operating results depend on the amount of advertising revenue we generate. If we generate less advertising revenue, it may be more difficult for us to repay our indebtedness and the value of our business may decline. Our ability to sell advertising time depends on:
• | the levels of automobile advertising, which historically have represented about one quarter of our advertising revenue; for the year ended December 31, 2016, automobile advertising represented 22.5% of our net time sales and internet revenue; |
• | the health of the economy in the areas where our television stations are located and in the nation as a whole; |
• | the popularity of our programming and that of our competition; |
• | the levels of political advertising, which are affected by campaign finance laws and the ability of political candidates and political action committees to raise and spend funds, which are subject to seasonal fluctuations; |
• | the effects of declining live/appointment viewership as reported through rating systems and local television efforts to adopt and receive credit for same day viewing plus viewing on-demand thereafter; |
• | the effects of new rating methodologies; |
• | changes in the makeup of the population in the areas where our stations are located; |
• | the activities of our competitors, including increased competition from other forms of advertising-based mediums, such as other broadcast television stations, radio stations, MVPDs, internet and broadband content providers and other print, outdoor, and media outlets serving in the same markets; |
• | over-the-top (OTT) and other emerging technologies and their potential impact on cord-cutting; |
• | the impact of MVPD’s offering “skinny” programming bundles that may not include television broadcast stations; |
• | changes in pricing and sellout levels; and |
20
• | other factors that may be beyond our control. |
There can be no assurance that our advertising revenue will not be volatile in the future or that such volatility will not have an adverse impact on our business, financial condition or results of operations.
Our substantial indebtedness could adversely affect our financial condition and prevent us from fulfilling our debt obligations.
We have a high level of debt, totaling $4,203.8 million at December 31, 2016, compared to the book value of shareholders’ equity of $557.9 million on the same date. Our relatively high level of debt poses the following risks, particularly in periods of declining revenues:
• | we may be unable to service our debt obligations, including payments on notes as they come due, especially during general negative economic, financial credit, and market industry conditions; |
• | we may use a significant portion of our cash flow to pay principal and interest on our outstanding debt, especially during general negative economic and market industry conditions; |
• | the amount available for working capital, capital expenditures, dividends and other general corporate purposes may be limited because a significant portion of cash flow is used to pay principal and interest on outstanding debt; |
• | our lenders may not be as willing to lend additional amounts to us for future working capital needs, additional acquisitions or other general corporate purposes; |
• | the cost to borrow from lenders may increase; |
• | our ability to access the capital markets may be limited, and we may be unable to issue securities with pricing or other terms that we find attractive, if at all; |
• | if our cash flow were inadequate to make interest and principal payments, we might have to restructure or refinance our indebtedness or sell one or more of our stations to reduce debt service obligations; |
• | we may be more vulnerable to adverse economic conditions than less leveraged competitors and thus, less able to withstand competitive pressures; and |
• | because the interest rate under the Bank Credit Agreement is a floating rate, any increase will reduce the funds available to repay our obligations and for operations and future business opportunities and will make us more vulnerable to the consequences of our leveraged capital structure. As of December 31, 2016, approximately $1,637.8 million principal amount of our recourse debt relates to the Bank Credit Agreement. |
Any of these events could reduce our ability to generate cash available for investment, debt repayment or capital improvements or to respond to events that would enhance profitability.
Commitments we have made to our lenders limit our ability to take actions that could increase the value of our securities and business or may require us to take actions that decrease the value of our securities and business.
Our existing financing agreements prevent us from taking certain actions and require us to meet certain tests. These restrictions and tests may require us to conduct our business in ways that make it more difficult to repay unsecured debt or decrease the value of our securities and business. These restrictions and tests include the following:
• | restrictions on additional debt; |
• | restrictions on our ability to pledge our assets as security for indebtedness; |
• | restrictions on payment of dividends, the repurchase of stock and other payments relating to our capital stock; |
• | restrictions on some sales of certain assets and the use of proceeds from asset sales; |
• | restrictions on mergers and other acquisitions, satisfaction of conditions for acquisitions and a limit on the total amount of acquisitions without the consent of bank lenders; |
• | restrictions on permitted investments; |
• | restrictions on the lines of business we and our subsidiaries may operate; and |
• | financial ratio and condition tests including, the ratio of first lien indebtedness to adjusted EBITDA and the ratio of Sinclair Television Group, Inc. (STG) total indebtedness to adjusted EBITDA. |
Future financing arrangements may contain additional restrictions and tests. All of these restrictive covenants may limit our ability to pursue our business strategies, prevent us from taking action that could increase the value of our securities or may require actions that decrease the value of our securities. In addition, we may fail to meet the tests and thereby default on one or more of our obligations (particularly if the economy weakens and thereby reduces our advertising revenues). If we default on our obligations, creditors could require immediate payment of the obligations or foreclose on collateral. If this happens,
21
we could be forced to sell assets or take other actions that could significantly reduce the value of our securities and business and we may not have sufficient assets or funds to pay our debt obligations.
A failure to comply with covenants under our debt instruments could result in a default under such debt instruments, acceleration of amounts due under our debt and loss of assets securing our loans.
Certain of our debt agreements contain cross-default provisions with our other debt, which means that a default under certain of our debt instruments may cause a default under certain indentures or the Bank Credit Agreement.
If we breach certain of our debt covenants, our lenders could require us to repay the debt immediately, and, if the debt is secured, could immediately take possession of the property securing such debt. In addition, if any other lender declared its loan due and payable as a result of a default, the holders of our outstanding notes, along with the lenders under the Bank Credit Agreement, might be able to require us to pay those debts immediately.
As a result, any default under our debt covenants could have a material adverse effect on our financial condition and our ability to meet our obligations.
Any insolvency or bankruptcy proceeding relating to material third-party licensees as defined by our Bank Credit Agreement, would cause a default and potential acceleration under the Bank Credit Agreement.
Our Bank Credit Agreement contains certain cross-default provisions with certain material third-party licensees, defined as any party that owns the license assets of one or more television stations which we provide services to pursuant to LMAs and/or other outsourcing agreements and those stations provide 20% or more of our aggregate broadcast cash flows. A default caused by an involuntary or voluntary petition filed for liquidation, reorganization or other relief of insolvency by a material third-party licensee, or a failure of a material third-party licensee to preserve and maintain its legal existence or any of its material rights, privileges or franchises including its broadcast licenses, would cause an event of default and potential acceleration under our Bank Credit Agreement. As of December 31, 2016, there were no material third party licensees as defined in our Bank Credit Agreement.
Despite current debt levels, we may be able to incur significantly more debt in the future, which could increase the foregoing risks related to our indebtedness.
At December 31, 2016, we had $483.3 million available (subject to certain borrowing conditions) for additional borrowings under the revolving credit facility (the Revolving Credit Facility) of the Bank Credit Agreement. Under the terms of the debt instruments to which we are subject, and provided we meet certain financial and other covenants, we may be able to incur substantial additional indebtedness in the future, including additional senior debt and secured debt. If we incur additional indebtedness, the risks described in the risk factors in this report relating to having substantial debt could intensify.
Our strategic acquisitions and investments could pose various risks and increase our leverage.
We have pursued and intend to selectively continue to pursue strategic acquisitions and investments, subject to market conditions, our liquidity and the availability of attractive acquisition and investment candidates, with the goal of improving our business.
We may not be able to identify other attractive acquisition or investment targets or we may not be able to fund additional acquisitions or investments in the future. Acquisitions involve inherent risks, such as increasing leverage and debt service requirements and combining company cultures and facilities, which could have a material adverse effect on our results of operations and could strain our human resources. We may not be able to successfully implement effective cost controls or increase revenues as a result of an acquisition. In addition, future acquisitions may result in our assumption of unexpected liabilities and may result in the diversion of management’s attention from the operation of our core business.
Certain acquisitions, such as television stations, are subject to the approval of the FCC and potentially, other regulatory authorities. The need for FCC and other regulatory approvals could restrict our ability to consummate future transactions and potentially require us to divest certain television stations if the FCC believes that a proposed acquisition would result in excessive concentration in a market, even if the proposed combinations may otherwise comply with FCC ownership limitations.
22
Our investments in other non-media related businesses involve risks, including the diversion of resources, that may adversely affect our business or results of operations.
We have made investments in certain non-media related businesses. See Item 1. Business for further description of such investments and/or subsidiaries. Managing the operations of these businesses and the costs incurred by these businesses involve risks, including the diversion of our management’s attention from managing the operations of our broadcast businesses and diverting other resources that could be used in our broadcast businesses. Such diversion of resources may adversely affect our business and results of operations. In addition, our investments in real estate ventures carry inherent risks related to owning interests in real property, including, among others, the relative illiquidity of real estate, potential adverse changes in real estate market conditions, and changes in tenant preferences. There can be no assurance that our investments in these businesses will yield a positive rate of return or otherwise be recoverable.
Financial and economic conditions may have an adverse impact on our industry, business, and results of operations or financial condition.
Financial and economic conditions could have an adverse effect on the fundamentals of our business, results of operations and/or financial condition. Poor economic and industry conditions could have a negative impact on our industry or the industry of those customers who advertise on our stations, including, among others, the automotive industry and service businesses, each of which is a significant source of our advertising revenue. Additionally, financial institutions, capital providers, or other consumers may be adversely affected. Potential consequences of any financial and economic decline include:
• | the financial condition of those companies that advertise on our stations and digital platforms, including, among others, the automobile manufacturers and dealers, may be adversely affected and could result in a significant decline in our advertising revenue; |
• | our ability to pursue the acquisition of attractive television and non-television assets may be limited if we are unable to obtain any necessary additional capital on favorable terms, if at all; |
• | our ability to pursue the divestiture of certain television and non-television assets at attractive values may be limited; |
• | the possibility that our business partners, such as counterparties to our outsourcing and news share arrangements, could be negatively impacted and our ability to maintain these business relationships could also be impaired; and |
• | our ability to refinance our existing debt on terms and at interest rates we find attractive, if at all, may be impaired; |
• | our ability to make certain capital expenditures may be significantly impaired; and |
• | the possibility of consumers cutting the cord, thereby impacting our retransmission revenues. |
We purchase television programming in advance based on expectations about future revenues. Actual revenues may be lower than our expectations. If this happens, we could experience losses that may make our securities less valuable.
One of our most significant costs is network and syndicated programming. Our ability to generate revenue to cover this cost may affect the value of our securities. If a particular network or program is not popular in relation to its costs, we may not be able to sell enough advertising time to cover the cost.
We generally purchase syndicated programming content from others rather than producing such content ourselves, therefore, we have limited control over the costs of the programming. Often we must purchase syndicated programming several years in advance and may have to commit to purchase more than one year’s worth of programming. We may replace programs that are doing poorly before we have recaptured any significant portion of the costs we incurred or before we have fully amortized the costs. We also receive programming from networks with which we have network affiliation agreements. Generally, the agreements are for many years. The popularity of networks can affect revenue earned on those channels. Any of these factors could reduce our revenues or otherwise cause our costs to escalate relative to revenues. These factors are exacerbated during a weak advertising market.
23
We internally originate television programming in advance based on expectations about future revenues. Actual revenues could fluctuate and may be lower than our expectations. If this happens, we could experience losses that may make our securities less valuable.
The production of internally originated programming requires a large up-front investment and the revenues derived from the airing of internally originated programming primarily depends upon its acceptance by the public, which is difficult to predict. The commercial success of original content also depends upon the quality and acceptance of other competing content released into the marketplace at or near the same time, the availability of a growing number of alternative forms of entertainment, general economic conditions and their effects on consumer spending and other tangible and intangible factors, all of which can change and cannot be predicted with certainty. Any of these factors could reduce our revenues or otherwise cause our costs to escalate relative to revenues. These factors are exacerbated during a weak advertising market.
We may lose a large amount of programming if a network terminates its affiliation or program service arrangement with us, we are not able to negotiate arrangements at terms comparable to or more favorable than our current agreements, or if networks make programming available through services other than our local affiliates, which could increase our costs and/or reduce our revenue.
The networks produce and distribute programming in exchange for each station’s commitment to air the programming at specified times and for commercial announcement time during programming. The amount and quality of programming provided by each network varies. See Television Markets and Stations within Item 1. Business for a detailed listing of our stations and channels.
As network affiliation agreements come up for renewal, we (or licensees of the stations we provide programming and/or sales services to), may not be able to negotiate terms comparable to or more favorable than our current agreements. The non-renewal or termination of any of our network affiliation agreements would prevent us from being able to carry programming of the relevant network. This loss of programming would require us to obtain replacement programming, which may involve higher costs and which may not be as attractive to our target audiences, resulting in reduced revenues. Upon the termination of any of our network affiliation agreements, we would be required to establish a new network affiliation agreement for the affected station with another network or operate as an independent station. At such time, the remaining value of the network affiliation asset could become impaired and we would be required to record impairment charges to write down the value of the asset to its estimated fair value.
We cannot predict the outcome of any future negotiations relating to our affiliation agreements or what impact, if any, they may have on our financial condition and results of operations. In addition, the impact of an increase in reverse network compensation payments, under which we compensate the network for programming pursuant to our affiliation agreements, may have a negative effect on our financial condition or results of operations.
We may not be able to renegotiate retransmission consent agreements at terms comparable to or more favorable than our current agreements and networks with which we are affiliated are currently, or in the future are expected to, require us to share revenue from retransmission consent agreements with them.
As retransmission consent agreements expire, we may not be able to renegotiate such agreements at terms comparable to or more favorable than our current agreements. This may cause revenues and/or revenue growth from our retransmission consent agreements to decrease under the renegotiated terms despite the fact that our current retransmission consent agreements include automatic annual fee escalators. In addition, certain networks or program service providers with which we are affiliated are currently, or in the future are expected to, require us to share revenue from retransmission consent agreements with them as part of renewing expiring affiliation agreements or pursuant to certain rights contained in existing affiliation agreements. Generally, our retransmission consent agreements and agreements with networks or program service providers are for different lengths of time and expire in different periods. If we are unable to negotiate a retransmission consent agreement or the revenue received as part of those agreements declines over time, then we may be exposed to a reduction in or loss from retransmission revenue net of revenue shared with networks and program service providers. We cannot predict the outcome or provide assurances as to the outcome of any future negotiations relating to our affiliation agreements or what impact, if any, they may have on our financial condition and results of operations. During 2016, we entered into a consent decree with the FCC pursuant to an investigation regarding allegations made by an MVPD that we violated FCC rules around negotiating retransmission consent agreements. See Changes in the Rules on Television Ownership within Note 10. Commitments and Contingencies with the Consolidated Financial Statements for further discussion.
24
The effects of the economic environment could require us to record an asset impairment of goodwill and indefinite-lived intangible assets.
We are required to analyze goodwill and certain other intangible assets for impairment. The accounting guidance establishes a method of testing goodwill and broadcast licenses for impairment on an annual basis, or on an interim basis if an event occurs that would reduce the fair value of a reporting unit or an indefinite-lived asset below its carrying value. For additional information regarding impairments to our goodwill and broadcast licenses, see Valuation of Goodwill and Intangible Assets and Equity and Cost Method Investments under Critical Accounting Policies and Estimates within Item 7. Management’s Discussion and Analysis of Financial Condition and Results of Operations and Note 5. Goodwill, Indefinite-Lived Intangible Assets and Other Intangible Assets within the Consolidated Financial Statements.
Key officers and directors have financial interests that are different and sometimes opposite from ours and we may engage in transactions with these officers and directors that may benefit them to the detriment of other security holders.
Some of our officers, directors and majority shareholders own stock or partnership interests in businesses that do business with us or otherwise do business that conflicts with our interests. They may transact some business with us upon approval by the independent members of our board of directors even if there is a conflict of interest or they may engage in business competitive to our business and those transactions may benefit the officers, directors or majority shareholders to the detriment of our security holders. Each of David D. Smith, Frederick G. Smith, and J. Duncan Smith is an officer and director of Sinclair and Robert E. Smith is a director of Sinclair. Together, the Smiths hold shares of our common stock that control the outcome of most matters submitted to a vote of shareholders.
David D. Smith, Frederick G. Smith, J. Duncan Smith, Robert E. Smith and David B. Amy, our Vice Chairman, together own interests (less than 5% in aggregate) in Allegiance Capital Limited Partnership, a limited partnership in which we also hold an interest. Frederick G. Smith owns an interest (less than 1%) in Patriot Capital II, L.P., a limited partnership in which we also hold an interest. David Smith owns an interest (less than 3%) in Towson Row LLC, a real estate venture, in which we also hold an interest. For additional information regarding our related person transactions, see Note 11. Related Person Transactions within the Consolidated Financial Statements. We can give no assurance that these transactions or any transactions that we may enter into in the future with our officers, directors or majority shareholders, have been, or will be, negotiated on terms as favorable to us as we would obtain from unrelated parties. Maryland law and our financing agreements limit the extent to which our officers, directors and majority shareholders may transact business with us and pursue business opportunities that we might pursue. These limitations do not, however, prohibit all such transactions.
We depend on key personnel and we may not be able to operate and grow our business effectively if we lose the services of our senior executive officers or are unable to attract and retain qualified personnel in the future.
We depend on the efforts of our management and other key employees. The success of our business depends heavily on our ability to develop and retain management and to attract and retain qualified personnel in the future. Competition for senior management personnel is intense, and we may not be able to retain our key personnel. If we are unable to do so, our business, financial condition or results of operations may be adversely affected.
The Smiths exercise control over most matters submitted to a shareholder vote and may have interests that differ from other security holders. They may, therefore, take actions that are not in the interests of other security holders.
David D. Smith, Frederick G. Smith, J. Duncan Smith and Robert E. Smith hold shares representing approximately 77.4% of the common stock voting rights of the Company and, therefore, control the outcome of most matters submitted to a vote of shareholders, including, but not limited to, electing directors, adopting amendments to our certificate of incorporation and approving corporate transactions. The Smiths hold substantially all of the Class B Common Stock, which have ten votes per share. Our Class A Common Stock has only one vote per share. In addition, the Smiths hold half our board of directors’ seats and, therefore, have the power to exert significant influence over our corporate management and policies. The Smiths have entered into a stockholders’ agreement pursuant to which they have agreed to vote for each other as candidates for election to our board of directors until December 31, 2025.
Although in the past the Smiths have recused themselves from related person transactions, circumstances may occur in which the interests of the Smiths, as the controlling security holders, could be in conflict with the interests of other security holders and the Smiths would have the ability to cause us to take actions in their interest. In addition, the Smiths could pursue acquisitions, divestitures or other transactions that, in their judgment, could enhance their equity investment, even though such transactions might involve risks to our other security holders. Further, the concentration of ownership the Smiths have may have the effect of discouraging, delaying or preventing a future change of control, which could deprive our stockholders
25
of an opportunity to receive a premium for their shares as part of a sale of our company and might reduce the price of our shares.
(See Item 12. Security Ownership of Certain Beneficial Owners and Management and Related Stockholder Matters and Item 13. Certain Relationships and Related Transactions, which will be included as part of our Proxy Statement for our 2016 Annual Meeting.)
Significant divestitures by the Smiths could cause them to own or control less than 51% of the voting power of our shares, which would in turn give Cunningham the right to terminate the LMAs and other outsourcing agreements with Cunningham due to a “change in control.” Any such terminations would have an adverse effect on our results of operations. The FCC’s multiple ownership rules limit our ability to operate multiple television stations in some markets and may result in a reduction in our revenue or prevent us from reducing costs. Changes in these rules may threaten our existing strategic approach to certain television markets. See the risk factor below regarding the FCC's multiple ownership rules.
We may be subject to fines and other penalties related to violations of FCC indecency rules and other FCC rules and policies, the enforcement of which has increased in recent years, and complaints related to such violations may delay our renewal applications with the FCC.
We provide a significant amount of live news reporting that is provided by the broadcast networks or is controlled by our on-air news talent. Although both broadcast network and our on-air talent have generally been professional and careful in what they say, there is always the possibility that information may be reported that is inaccurate or even in violation of certain indecency rules promulgated by the FCC. In addition, entertainment and sports programming provided by broadcast syndicators and networks may contain content that is in violation of the indecency rules promulgated by the FCC. Because the interpretation by the courts and the FCC of the indecency rules is not always clear, it is sometimes difficult for us to determine in advance what may be indecent programming. We have insurance to cover some of the liabilities that may occur, but the FCC has enhanced its enforcement efforts relating to the regulation of indecency. Violation of the indecency rules could potentially subject us to penalties, license revocation, or renewal or qualification proceedings. There can be no assurance that an incident that may lead to significant fines or other penalties by the FCC can be avoided.
From time to time, we may have received or been promised payment for airing program material. FCC rules require that all such sponsored material be explicitly identified at the time of the broadcast as paid for and by whom, except when it is clear that the mention of a product or service constitutes sponsorship identification. There can be no assurance that an incident that may lead to significant fines or other penalties by the FCC can be avoided. The FCC has undertaken an investigation in response to a complaint it received alleging possible violations of the FCC’s sponsorship identification rules by the Company. We cannot predict the outcome of any potential FCC action related to this matter but it is possible that such action could include fines and/or compliance programs.
Federal regulation of the broadcasting industry limits our operating flexibility, which may affect our ability to generate revenue or reduce our costs.
The FCC regulates our business, just as it does all other companies in the broadcasting industry. We must obtain the FCC’s approval whenever we need a new license, seek to renew, assign or modify a license, purchase a new station, sell an existing station or transfer the control of one of our subsidiaries that hold a license. Our FCC licenses and those of the licensees which we provide services to pursuant to LMAs and other outsourcing agreements are critical to our operations; we cannot operate without them. We cannot be certain that the FCC will renew these licenses in the future or approve new acquisitions in a timely manner, if at all. If licenses are not renewed or acquisitions are not approved, we may lose revenue that we otherwise could have earned.
In addition, Congress and the FCC may, in the future, adopt new laws, regulations and policies regarding a wide variety of matters (including, but not limited to, technological changes in spectrum assigned to particular services) that could, directly or indirectly, materially and adversely affect the operation and ownership of our broadcast properties. (See Item 1. Business.)
26
The FCC’s multiple ownership rules limit our ability to operate multiple television stations in some markets and may result in a reduction in our revenue or prevent us from reducing costs. Changes in these rules may threaten our existing strategic approach to certain television markets.
Television ownership
As discussed in National Ownership Rule within Federal Regulation of Television Broadcasting within Item 1. Business, in September 2016, the FCC recently eliminated the UHF discount. Because we are near the 39% cap without application of the UHF discount, this change, could limit our ability to acquire television stations in additional markets. The FCC’s elimination of the UHF discount is currently the subject of a Petition for Reconsideration filed with the FCC and Petitions for Review filed in the U.S. Court of Appeals for the D.C. Circuit. We cannot predict the outcome of these proceedings.
Under federal law, the FCC is required to review its ownership rules every four years (a ‘‘Quadrennial Review’’) to determine whether they are necessary in the public interest as the result of competition and to repeal or modify any regulation the FCC determines to be no longer in the public interest.
In August 2016, the FCC completed both its 2010 and 2014 quadrennial reviews of tis media ownership rules and issued an order (the "Ownership Order") which left most of the existing multiple ownership rules intact, but amended the rules to provide that, for JSAs where two television stations are located in the same market, and a party with an attributable ownership interest in the second station. The Ownership Order also requires that JSAs that existed prior to March 31, 2014, may remain in place until October 1, 2025, at which point they must be terminated, amended or otherwise come into compliance with the rules. These "grandfathered" JSAs may be transferred or assigned without losing grandfathering status. Among other things, the new JSA rule could limit our future ability to create duopolies or other two-station operations in certain markets. We cannot predict whether we will be able to terminate or restructure such arrangements prior to October 1, 2025, on terms that are as advantageous to us as the current arrangements. The revenues of these JSA arrangements we earned during the years ended December 31, 2016 and 2015 were $58.6 million and $46.8 million, respectively. The Ownership Order is the subject of an appeal to the U.S. Court of Appeals for the D.C. Circuit and of Petitions for Reconsideration before the FCC. We cannot predict the outcome of that appeal or petitions.
Certain of our stations have entered into what have commonly been referred to as local marketing agreements or LMAs. One typical type of LMA is a programming agreement between two separately owned television stations serving the same market, whereby the licensee of one station programs substantial portions of the broadcast day and sells advertising time during such programming segments on the other licensee’s station subject to the ultimate editorial and other controls being exercised by the latter licensee. We believe these arrangements allow us to reduce our operating expenses and enhance profitability. During the year ended December 31, 2016 and 2015, we generated net revenue from our LMAs of $88.7 million and $109.7 million, respectively.
In addition to our LMAs, we have entered into outsourcing agreements (such as JSAs) whereby 31 stations provide various non-programming related services such as sales, operational and managerial services to or by other stations within the same markets. We believe this structure allows stations to achieve operational efficiencies and economies of scale, which should otherwise improve broadcast cash flow and competitive positions. For additional information, refer to Television Markets and Stations within Item 1. Business.
See Changes in the Rules on Television Ownership within Note 10. Commitments and Contingencies with the Consolidated Financial Statements for further discussion.
If we are required to terminate or modify our LMAs and other outsourcing agreements, our business could be affected in the following ways:
• | Loss of revenues. If the FCC requires us to modify or terminate existing arrangements, we would lose some or all of the revenues generated from those arrangements. We would lose revenue because we will have fewer demographic options, a smaller audience distribution and lower revenue share to offer to advertisers. |
• | Increased costs. If the FCC requires us to modify or terminate existing arrangements, our cost structure would increase as we would potentially lose significant operating synergies and we may also need to add new employees. With termination of LMAs, we likely would incur increased programming costs because we will be competing with the separately owned station for syndicated programming. |
27
• | Losses on investments. As part of certain of our arrangements, we own the non-license assets used by the stations with which we have arrangements. If certain of these arrangements are no longer permitted, we would be forced to sell these assets, restructure our agreements or find another use for them. If this happens, the market for such assets may not be as good as when we purchased them and, therefore, we cannot be certain of a favorable return on our original investments. |
• | Termination penalties. If the FCC requires us to modify or terminate existing arrangements before the terms of the arrangements expire, or under certain circumstances, we elect not to extend the terms of the arrangements, we may be forced to pay termination penalties under the terms of certain of our arrangements. Any such termination penalties could be material. |
• | Alternative arrangements. If the FCC requires us to terminate the existing arrangements, we may enter into one or more alternative arrangements. Any such arrangements may be on terms that are less beneficial to us than the existing arrangements. |
Failure of owner / licensee to exercise control
The FCC requires the owner / licensee of a station to maintain independent control over the programming and operations of the station. As a result, the owners / licensees of those stations with which we have LMAs can exert their control in ways that may be counter to our interests, including the right to preempt or terminate programming in certain instances. The preemption and termination rights cause some uncertainty as to whether we will be able to air all of the programming that we have purchased under our LMAs and therefore, uncertainty about the advertising revenue that we will receive from such programming. In addition, if the FCC determines that the owner / licensee is not exercising sufficient control, it may penalize the owner licensee by a fine, revocation of the license for the station or a denial of the renewal of that license. Any one of these scenarios, especially the revocation of or denial of renewal of a license, might result in a reduction of our cash flow or margins and an increase in our operating costs. In addition, penalties might also affect our qualifications to hold FCC licenses, putting our own licenses at risk.
The pendency and indeterminacy of the outcome of these ownership rules, which may limit our ability to provide services to additional or existing stations pursuant to licenses, LMAs, outsourcing agreements or otherwise, expose us to a certain amount of volatility, particularly if the outcomes are adverse to us. Further, resolution of these ownership rules has been and will likely continue to be a cost burden and a distraction to our management and the continued absence of a resolution may have a negative effect on our business.
The FCC’s National Broadband Plan may result in a loss of spectrum for our stations potentially adversely impacting our ability to compete.
As discussed in Pending Matters under Federal Regulation of Television Broadcasting within Item. 1 Business, Congress has authorized the FCC to conduct so-called “incentive auctions” to auction and repurpose broadcast television spectrum for mobile broadband use. Even though participation in the incentive auction is voluntary, a broadcaster may still be required to relocate its station to another channel or make technical changes to facilitate repacking the band. Pursuant to the auction, television broadcasters submitted bids to receive compensation for relinquishing all or a portion of its rights in the television spectrum of their full-service and Class A stations. The reverse portion of the spectrum auction was completed in early 2017. Based on the bids accepted by the FCC, we anticipate that we will receive later in 2017 an estimated $313.0 million of gross proceeds from the auction. The results of the auction are not expected to produce any material change in the operations or results of the Company. In the repacking process associated with the auction, the FCC has reassigned some stations to new post-auction channels. We received letters from the FCC in February 2017 notifying us that 93 of our stations have been assigned to new channels. The legislation authorizing the incentive auction provides the FCC with a $1.75 billion fund to reimburse certain costs incurred by stations that are reassigned to new channels in the repack.
We further cannot predict the outcome of the incentive auction or its effect upon our ability to compete. Additionally, we cannot predict whether the FCC or Congress might adopt even more stringent requirements or incentives to abandon current spectrum if the incentive auction does not have the desired result of freeing what the agency deems to be sufficient spectrum for wireless broadband use.
28
Competition from other broadcasters or other content providers and changes in technology may cause a reduction in our advertising revenues and/or an increase in our operating costs.
New technology and the subdivision of markets
Cable providers, direct broadcast satellite companies and telecommunication companies are developing new technology that allows them to transmit more channels on their existing equipment to highly targeted audiences, reducing the cost of creating channels and potentially leading to the division of the television industry into ever more specialized niche markets. Competitors who target programming to such sharply defined markets may gain an advantage over us for television advertising revenues. The decreased cost of creating channels may also encourage new competitors to enter our markets and compete with us for advertising revenue. In addition, technologies that allow viewers to digitally record, store and play back television programming may decrease viewership of commercials as recorded by media measurement services such as Nielsen Media Research and, as a result, lower our advertising revenues. The current ratings provided by Nielsen for use by broadcast stations are limited to live viewing Digital Video Recording playback and give broadcasters no credit whatsoever for viewing that occurs on a delayed basis after the original air date. However, the effects of new ratings system technologies, including ‘‘code readers’’, ‘‘viewer assignment’’, ‘‘people meters’’ and ‘‘set-top boxes,’’ and the ability of such technologies to be a reliable standard that can be used by advertisers is currently unknown. The Media Rating Council, an independent organization that monitors rating services, in the 154 markets it measures ratings exclusively by its diary methodology. As of December 31, 2016, approximately 42 of out 81 markets are diary only markets.
Since digital television technology allows broadcasting of multiple channels within the additional allocated spectrum, this technology could expose us to additional competition from programming alternatives. In addition, technological advancements and the resulting increase in programming alternatives, such as cable television, direct broadcast satellite systems, pay-per-view, home video and entertainment systems, video-on-demand, OTT, mobile video and the Internet have also created new types of competition to television broadcast stations and will increase competition for household audiences and advertisers. We cannot provide any assurances that we will remain competitive with these developing technologies.
Types of competitors
We also face competition from rivals that may have greater resources than we have. These include:
• | other local free over-the-air broadcast television and radio stations; |
• | telecommunication companies; |
• | cable and satellite system operators and cable networks; |
• | print media providers such as newspapers, direct mail and periodicals; |
• | internet search engines, internet service providers, websites, and mobile applications; and |
• | other emerging technologies including mobile television, over-the-top technologies, and MVPD "skinny" packages. |
Deregulation
The Telecommunications Act of 1996 and subsequent actions by the FCC and the courts have removed some limits on station ownership, allowing telephone, cable and some other companies to provide video services in competition with us. In addition, the FCC has reallocated and auctioned off a portion of the spectrum for new services including fixed and mobile wireless services and digital broadcast services. As a result of these changes, new companies are able to enter our markets and compete with us.
We have invested and will continue to invest in new technology initiatives which may not result in usable technology.
We have heavily invested in the development of the Next Gen platforms as discussed in Development of Next Generation Broadcast Platforms (Next Gen) within Operating Strategy within Item 1. Business. We do not know whether the outcome of our research and development will result in technology that will be usable on our distribution platform or available to license to third parties. Additionally, even if our efforts result in usable technology, we do not know whether it will be included within the ATSC 3.0 framework. Any failure to develop this technology could result in the loss of our investment. Our cost incurred related to the development of the Next Gen platform is recorded within research and development within our consolidated statement of operations.
29
We could be adversely affected by labor disputes and legislation and other union activity.
The cost of producing and distributing entertainment programming has increased substantially in recent years due to, among other things, the increasing demands of creative talent and industry-wide collective bargaining agreements. Although we generally purchase programming content from others rather than produce such content ourselves, our program suppliers engage the services of writers, directors, actors and on-air and other talent, trade employees and others, some of whom are subject to these collective bargaining agreements. Approximately 800 of our employees, are represented by labor unions under collective bargaining agreements. If we or our program suppliers are unable to renew expiring collective bargaining agreements, it is possible that the affected unions could take action in the form of strikes or work stoppages. Failure to renew these agreements, higher costs in connection with these agreements or a significant labor dispute could adversely affect our business by causing, among other things, delays in production that lead to declining viewers, a significant disruption of operations and reductions in the profit margins of our programming and the amounts we can charge advertisers for time. Our stations also broadcast certain professional sporting events, including NBA basketball games, MLB baseball games, NFL football games, and other sporting events, and our viewership may be adversely affected by player strikes or lockouts, which could adversely affect our advertising revenues and results of operations. Further, any changes in the existing labor laws, including the possible enactment of the Employee Free Choice Act, may further the realization of the foregoing risks.
Unrelated third parties may bring claims against us based on the nature and content of information posted on websites maintained by us.
We host internet services that enable individuals to exchange information, generate content, comment on our content, and engage in various online activities. The law relating to the liability of providers of these online services for activities of their users is currently unsettled both within the United States and internationally. Claims may be brought against us for defamation, negligence, copyright or trademark infringement, unlawful activity, tort, including personal injury, fraud, or other theories based on the nature and content of information that may be posted online or generated by our users. Our defense of such actions could be costly and involve significant time and attention of our management and other resources.
Costs of complying with changes in governmental laws and regulations may adversely affect our results of operations.
We cannot predict what other governmental laws or regulations will be enacted in the future, how future laws or regulations will be administered or interpreted or how future laws or regulations will affect us. Compliance with new laws or regulations, including proposed legislation to address climate change, or stricter interpretation of existing laws, may require us to incur significant expenditures or impose significant restrictions on us and could cause a material adverse effect on our results of operations.
Changes in accounting standards can affect reported earnings and results of operations.
Generally accepted accounting principles and accompanying pronouncements and implementation guidelines for many aspects of our business, including those related to revenues, leases, consolidation, programming, intangible assets, pensions, income taxes, share-based compensation and broadcast rights, are complex and involve significant judgments. Changes in rules or their interpretation could significantly change our reported earnings, results of operations, and compliance with debt covenants.
If we fail to maintain the requirements for continued listing on the NASDAQ stock market, our common stock could be delisted from trading, which would adversely affect the liquidity of our common stock and our ability to raise additional capital.
Our common stock is currently listed for quotation on the NASDAQ stock market. We are required to meet specified listing criteria in order to maintain our listing. If we fail to satisfy continued listing requirements, our common stock could be delisted. Any potential delisting of our common stock from the NASDAQ would make it more difficult for our stockholders to sell our stock in the public market and would likely result in decreased liquidity and increased volatility for our common stock.
Terrorism or armed conflict domestically or abroad may negatively impact our advertising revenues and results of operations. Future conflicts, terrorist attacks or other acts of violence may have a similar effect.
If the United States becomes engaged in global conflicts in the future, there may be an adverse effect on our results of operations. Also, any terrorist attacks or other acts of violence may have a similar negative effect on our business or results of operations.
30
Cybersecurity risks, cyber incidents, data privacy, and other information technology failures could adversely affect our business and disrupt operations.
Our information technology systems are critically important to operating our business efficiently and effectively. We rely on our information technology systems to manage our business data, communications, news and advertising content, digital products, order entry, fulfillment and other business processes. Despite our security measures, network and information systems‑related events, such as computer hackings, cyber threats, security breaches, viruses or other destructive or disruptive software, process breakdowns, or malicious or other activities, and natural or other disasters could result in a disruption of our services and operations. These events could also result in, but are not limited to, the improper disclosure of personal data or confidential information, including through third parties which receive any of such information on a confidential basis for business purposes and could be subject to any of these events, and damage our reputation and require us to expend resources to remedy any such breaches. The occurrence of any of these events could have a material adverse effect on our business and results of operations.
ITEM 1B. UNRESOLVED STAFF COMMENTS
None.
ITEM 2. PROPERTIES
Generally, each of our stations has facilities consisting of offices, studios, sales offices, and tower and transmitter sites. Transmitter and tower sites are located in areas to provide maximum signal coverage to our stations’ markets. We believe that all of our properties, both owned and leased, are generally in good operating condition, subject to normal wear and tear and are suitable and adequate for our current business operations. See Television Markets and Stations within Item 1. Business, for a listing of our station locations. We believe that no one property represents a material amount of the total properties owned or leased. The following is a summary of our principal owned and leased real properties as of December 31, 2016:
Owned | Leased | |||||||||||
Square Feet | Acres | Square Feet | Acres | |||||||||
Broadcast Related Real Estate | ||||||||||||
Office and studio properties | 1,820,621 | 889 | 512,216 | 6 | ||||||||
Antenna and transmitter properties | 294,754 | 2,549 | 87,062 | 1,503 | ||||||||
Other Operating Real Estate | ||||||||||||
Corporate offices | — | — | 110,300 | — | ||||||||
Office and warehouse property | 1,250 | — | 290,702 | — | ||||||||
Other Non-Media Investment Real Estate | ||||||||||||
Rental property | 99,913 | 1 | — | — | ||||||||
Recreational property | 28,000 | 725 | — | — | ||||||||
Land held for development | — | 735 | — | — | ||||||||
ITEM 3. LEGAL PROCEEDINGS
We are a party to lawsuits and claims from time to time in the ordinary course of business. Actions currently pending are in various stages and no material judgments or decisions have been rendered by hearing boards or courts in connection with such actions. After reviewing developments to date with legal counsel, our management is of the opinion that none of our pending and threatened matters are material. See Note 10. Commitments and Contingencies within the Consolidated Financial Statements for further discussion.
ITEM 4. MINE SAFETY DISCLOSURES
None.
31
PART II
ITEM 5. MARKET FOR REGISTRANT’S COMMON EQUITY, RELATED STOCKHOLDER MATTERS AND ISSUER PURCHASES OF EQUITY SECURITIES
Our Class A Common Stock is listed for trading on the NASDAQ stock market under the symbol SBGI. Our Class B Common Stock is not traded on a public trading market or quotation system. The following tables set forth for the periods indicated the high and low closing sales prices on the NASDAQ stock market for our Class A Common Stock.
2016 | High | Low | ||||||
First Quarter | $ | 31.25 | $ | 30.11 | ||||
Second Quarter | $ | 31.70 | $ | 30.87 | ||||
Third Quarter | $ | 29.33 | $ | 28.67 | ||||
Fourth Quarter | $ | 34.90 | $ | 30.80 | ||||
2015 | High | Low | ||||||
First Quarter | $ | 32.43 | $ | 24.20 | ||||
Second Quarter | $ | 32.03 | $ | 27.52 | ||||
Third Quarter | $ | 30.23 | $ | 24.04 | ||||
Fourth Quarter | $ | 35.89 | $ | 24.80 | ||||
As of February 20, 2017, there are approximately 50 shareholders of record of our Class A common stock. This number does not include beneficial owners holding shares through nominee names.
See Note. 3 Stock-Based Compensation within the Consolidated Financial Statements for discussion of our stock-based compensation plans.
Dividend Policy
During 2015, our Board of Directors declared a quarterly dividend of $0.165 per share in the months of February, April, August and November, which were paid in March, June, September and December, respectively. Total dividend payments for the year ended December 31, 2015 were $0.66 per share. During 2016, our Board of Directors declared a quarterly dividend of $0.165 per share in the month of February which was paid in March. In May, August, and November our Board of Directors declared a quarterly dividend of $0.18 per share, which were paid out in June, September, and December, respectively. Total dividend payments for the year ended December 31, 2016 were $0.705 per share. In February 2017, our Board of Directors declared a quarterly dividend of $0.18 per share. Future dividends on our common shares, if any, will be at the discretion of our Board of Directors and will depend on several factors including our results of operations, cash requirements and surplus, financial condition, covenant restrictions and other factors that the Board of Directors may deem relevant. The Class A Common Stock and Class B Common Stock holders have the same rights related to dividends. Under our Bank Credit Agreement, there are certain terms that may restrict our ability to make dividend payments. See Note 8. Common Stock within the Consolidated Financial Statements for further discussion.
32
Comparative Stock Performance
The following line graph compares the yearly percentage change in the cumulative total shareholder return on our Class A Common Stock with the cumulative total return of the NASDAQ Composite Index and the cumulative total return of the NASDAQ Telecommunications Index (an index containing performance data of radio and television broadcast companies and communication equipment and accessories manufacturers) from December 31, 2011 through December 31, 2016. The performance graph assumes that an investment of $100 was made in the Class A Common Stock and in each Index on December 31, 2011 and that all dividends were reinvested. Total shareholder return is measured by dividing total dividends (assuming dividend reinvestment) plus share price change for a period by the share price at the beginning of the measurement period.
Company/Index/Market | 12/31/2011 | 12/31/2012 | 12/31/2013 | 12/31/2014 | 12/31/2015 | 12/31/2016 | ||||||||||||
Sinclair Broadcast Group, Inc. | 100.00 | 127.97 | 372.10 | 291.11 | 353.97 | 371.10 | ||||||||||||
NASDAQ Composite Index | 100.00 | 116.41 | 165.47 | 188.69 | 200.32 | 216.54 | ||||||||||||
NASDAQ Telecommunications Index | 100.00 | 102.78 | 143.40 | 149.42 | 144.02 | 153.88 | ||||||||||||
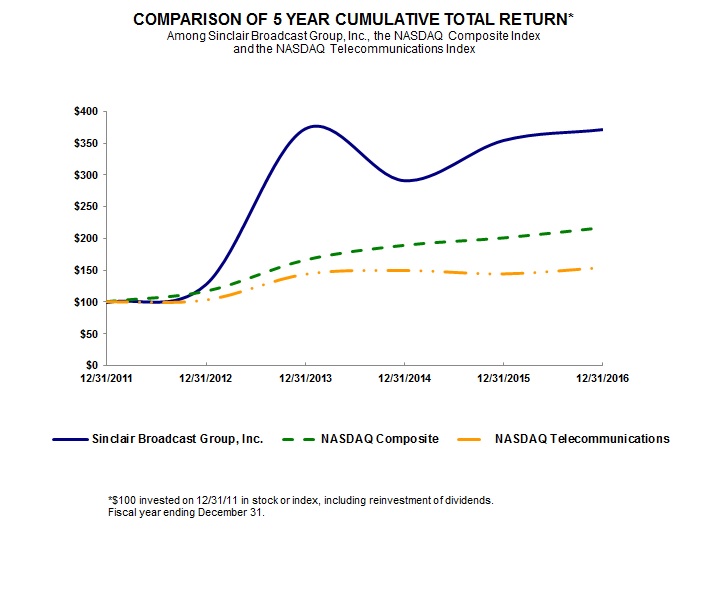
33
The following table summarizes repurchases of our stock in the quarter ended December 31, 2016:
Period | Total Number of Shares Purchased (1) | Average Price Per Share | Total Number of Shares Purchased as Part of a Publicly Announced Program | Approximate Dollar Value of Shares That May Yet Be Purchased Under the Program (in millions) | |||||||||
Class A Common Stock : (2) | |||||||||||||
10/01/16 – 10/31/16 | 876,760 | 28.07 | 876,760 | 129.7 | |||||||||
11/01/16 – 11/30/16 | 405,500 | 25.99 | 405,500 | 119.1 | |||||||||
12/01/16 – 12/31/16 | — | — | — | — | |||||||||
(1) All repurchases were made in open-market transactions.
(2) On March 20, 2014, the Board of Directors authorized an additional $150.0 million share repurchase authorization. On September 6, 2016 the Board of Directors authorized an additional $150.0 million share repurchase authorization. There is no expiration date and currently, management has no plans to terminate this program. For the year ended December 31, 2016, we have purchased approximately 4.9 million shares of Class A Common Stock for $136.4 million. As of December 31, 2016, the total remaining authorization was $119.1 million.
ITEM 6. SELECTED FINANCIAL DATA
The selected consolidated financial data for the years ended December 31, 2016, 2015, 2014, 2013 and 2012 have been derived from our audited consolidated financial statements.
The information below should be read in conjunction with Item 7. Management’s Discussion and Analysis of Financial Condition and Results of Operations and the Consolidated Financial Statements included elsewhere in this annual report on Form 10-K.
34
STATEMENTS OF OPERATIONS DATA
(In thousands, except per share data)
As of December 31, | |||||||||||||||||||
2016 | 2015 | 2014 | 2013 | 2012 | |||||||||||||||
Statements of Operations Data: | |||||||||||||||||||
Media revenues (a) | $ | 2,499,549 | $ | 2,011,946 | $ | 1,784,641 | $ | 1,219,091 | $ | 922,161 | |||||||||
Revenues realized from station barter arrangements | 135,566 | 111,337 | 122,262 | 88,680 | 86,905 | ||||||||||||||
Other non-media revenues | 101,834 | 95,853 | 69,655 | 55,360 | 52,613 | ||||||||||||||
Total revenues | 2,736,949 | 2,219,136 | 1,976,558 | 1,363,131 | 1,061,679 | ||||||||||||||
Media production expenses | 953,089 | 733,199 | 578,687 | 386,646 | 257,494 | ||||||||||||||
Media selling, general and administrative expenses | 501,589 | 431,728 | 372,220 | 251,294 | 172,628 | ||||||||||||||
Expenses recognized from station barter arrangements | 116,954 | 93,204 | 107,716 | 77,349 | 79,834 | ||||||||||||||
Depreciation and amortization (b) | 282,324 | 264,887 | 228,787 | 141,374 | 85,172 | ||||||||||||||
Amortization of program contract costs and net realizable value adjustments | 127,880 | 124,619 | 106,629 | 80,925 | 60,990 | ||||||||||||||
Other non-media expenses | 80,648 | 71,803 | 55,615 | 45,005 | 42,892 | ||||||||||||||
Corporate general and administrative expenses | 73,556 | 64,246 | 62,495 | 53,126 | 33,391 | ||||||||||||||
Research and development | 4,085 | 12,436 | 6,918 | — | — | ||||||||||||||
(Gain) loss on asset dispositions | (6,029 | ) | 278 | (37,160 | ) | 3,392 | (7 | ) | |||||||||||
Operating income | 602,853 | 422,736 | 494,651 | 324,020 | 329,285 | ||||||||||||||
Interest expense and amortization of debt discount and deferred financing costs | (211,143 | ) | (191,447 | ) | (174,862 | ) | (162,937 | ) | (128,553 | ) | |||||||||
Loss from extinguishment of debt | (23,699 | ) | — | (14,553 | ) | (58,421 | ) | (335 | ) | ||||||||||
Income from equity and cost method investees | 1,735 | 964 | 2,313 | 621 | 9,670 | ||||||||||||||
Other income, net | 3,144 | 1,540 | 4,998 | 2,225 | 2,273 | ||||||||||||||
Income from continuing operations before income taxes | 372,890 | 233,793 | 312,547 | 105,508 | 212,340 | ||||||||||||||
Income tax provision | (122,128 | ) | (57,694 | ) | (97,432 | ) | (41,249 | ) | (67,852 | ) | |||||||||
Income from continuing operations | 250,762 | 176,099 | 215,115 | 64,259 | 144,488 | ||||||||||||||
Discontinued operations: | |||||||||||||||||||
Income from discontinued operations, net of related income taxes | — | — | — | 11,558 | 465 | ||||||||||||||
Net income | 250,762 | 176,099 | 215,115 | 75,817 | 144,953 | ||||||||||||||
Net income attributable to noncontrolling interests | (5,461 | ) | (4,575 | ) | (2,836 | ) | (2,349 | ) | (287 | ) | |||||||||
Net income attributable to Sinclair Broadcast Group | $ | 245,301 | $ | 171,524 | $ | 212,279 | $ | 73,468 | $ | 144,666 | |||||||||
Earnings Per Common Share Attributable to Sinclair Broadcast Group: | |||||||||||||||||||
Basic earnings per share from continuing operations | $ | 2.62 | $ | 1.81 | $ | 2.19 | $ | 0.66 | $ | 1.78 | |||||||||
Basic earnings per share | $ | 2.62 | $ | 1.81 | $ | 2.19 | $ | 0.79 | $ | 1.79 | |||||||||
Diluted earnings per share from continuing operations | $ | 2.60 | $ | 1.79 | $ | 2.17 | $ | 0.66 | $ | 1.78 | |||||||||
Diluted earnings per share | $ | 2.60 | $ | 1.79 | $ | 2.17 | $ | 0.78 | $ | 1.78 | |||||||||
Dividends declared per share | $ | 0.71 | $ | 0.66 | $ | 0.63 | $ | 0.60 | $ | 1.54 | |||||||||
35
Years Ended December 31, | |||||||||||||||||||
2016 | 2015 | 2014 | 2013 | 2012 | |||||||||||||||
Balance Sheet Data: | |||||||||||||||||||
Cash and cash equivalents | $ | 259,984 | $ | 149,972 | $ | 17,682 | $ | 280,104 | $ | 22,865 | |||||||||
Total assets | $ | 5,963,168 | $ | 5,432,315 | $ | 5,410,328 | $ | 4,103,417 | $ | 2,690,768 | |||||||||
Total debt (c) | $ | 4,203,848 | $ | 3,854,360 | $ | 3,886,872 | $ | 2,989,985 | $ | 2,234,450 | |||||||||
Total equity (deficit) | $ | 557,936 | $ | 499,678 | $ | 405,343 | $ | 405,704 | $ | (100,053 | ) | ||||||||
(a) | Media revenues is defined as broadcast revenues, net of agency commissions, retransmission fees, and other media related revenues. |
(b) | Depreciation and amortization includes depreciation and amortization of property and equipment and amortization of definite-lived intangible assets and other assets. |
(c) | Total debt is defined as notes payable, capital leases and commercial bank financing, including the current and long-term portions. |
ITEM 7. MANAGEMENT’S DISCUSSION AND ANALYSIS OF FINANCIAL CONDITION AND RESULTS OF OPERATIONS
The following Management’s Discussion and Analysis provides qualitative and quantitative information about our financial performance and condition and should be read in conjunction with the other sections in this Annual Report, including Item 1. Business, Item 6. Selected Financial Data, and our Consolidated Financial Statements including the accompanying notes to those statements. This discussion consists of the following sections:
Executive Overview — a description of our business, summary of significant events and financial highlights from 2016, and information about industry trends;
Critical Accounting Policies and Estimates — a discussion of the accounting policies that are most important in understanding the assumptions and judgments incorporated in the consolidated financial statements and a summary of recent accounting pronouncements;
Results of Operations — a summary of the components of our revenues by category and by network affiliation or program service arrangement, a summary of other operating data and an analysis of our revenues and expenses for 2016, 2015 and 2014, including comparisons between years and certain expectations for 2017; and
Liquidity and Capital Resources — a discussion of our primary sources of liquidity, an analysis of our cash flows from or used in operating activities, investing activities and financing activities, a discussion of our dividend policy and a summary of our contractual cash obligations and off-balance sheet arrangements.
EXECUTIVE OVERVIEW
We are a diversified television broadcasting company with national reach with a strong focus on providing high-quality content on our local television stations and digital platforms. The content, distributed through our broadcast platform, consists of programming provided by third-party networks and syndicators, local news, our own networks, and other original programming produced by us. We also distribute our original programming, and owned and operated networks, on other third-party platforms. Additionally, we own digital and internet media products that are complementary to our extensive portfolio of television station related digital properties. We focus on offering marketing solutions to advertisers through our television and digital platforms and digital agency services. Outside of our media related businesses, we operate technical services companies focused on supply and maintenance of broadcast transmission systems as well as research and development for the advancement of broadcast technology, and we manage other non-media related investments.
We have one reportable operating segment: “Broadcast.” Our Broadcast segment is comprised of all of our television stations. We also earn revenues from our original networks, original content, digital and internet services, technical services, and non-media investments. These businesses are included within "Other". Corporate and unallocated expenses primarily include our costs to operate as a public company and to operate our corporate headquarters location. Other and Corporate are not reportable segments.
36
STG, for which certain assets and results of operations are included in the Broadcast segment and which is a wholly owned subsidiary of Sinclair Broadcast Group, Inc. (SBG), is the primary obligor under our Bank Credit Agreement, the 5.375% Notes, 5.625% Notes, 6.125% Notes, 5.125% Notes, 5.875% Notes, and until they were redeemed, the 6.375% Notes. SBG is a guarantor under all of these debt instruments. Our Class A Common Stock and Class B Common Stock remain obligations or securities of SBG and not obligations or securities of STG.
For more information about our business, reportable segments and our operating strategy, see Item 1. Business in this Annual Report.
Summary of Significant Events and Financial Highlights from 2016
Television Acquisitions
• | In January 2016, we closed on the previously announced purchase of the assets of KUQI (FOX), KTOV-LP (MNT) and KXPX-LP (Retro TV) in Corpus Christi, Texas for $9.3 million. |
• | In February 2016, we completed the acquisition of the broadcast assets of WSBT (CBS) in South Bend-Elkhart, Indiana, owned by Schurz Communications, Inc., and sold the broadcast assets of WLUC (NBC and FOX) in Marquette, Michigan to Gray Television, Inc. |
• | In May 2016, we closed on the previously announced purchase of the assets of KFXL (FOX) and KHGI, KHGI-LD, KWNB and KWNB-LD (ABC), in Lincoln, Nebraska for $31.3 million. |
Content and Distribution
• | In March 2016, we closed on the purchase of the stock of Tennis Channel for $350.0 million. |
• | In July 2016, we launched the new Circa.com website. This site uses new technology designed for enhanced mobile video and new-generation news consumers. |
• | In July 2016, we rebranded our digital agency solutions group under the name Compulse Integrated Marketing to provide in-depth digital marketing services aimed at small and medium sized businesses. |
• | In July 2016, we entered into agreements with FOX for the renewal of FOX affiliations in five markets. The FOX affiliations were also renewed in three markets by the licensees of stations that we provide sales and other services to under joint sales agreements. |
• | In August 2016, we signed a multi-year retransmission consent agreement with Comcast Cable for carriage of our broadcast television stations. |
• | In September 2016, the Tennis Channel signed an eight-year rights agreement with the Volvo Car Open in Charleston, S.C., one of the largest women's-only tennis tournaments in the world. |
• | In January 2017, Circa launched a new user-generated platform empowering college students to provide video content about news and entertainment events on their campuses via widgets available on Circa’s web site and social media pages. |
• | In January 2017, we announced with Metro-Goldwyn-Mayer ("MGM") the launch of "CHARGE!," a new 24/7 action-based network that will feature more than 2,300 hours of TV series content and more than 2,000 movie titles. CHARGE! is expected to debut during the first quarter of 2017. |
• | In February 2017, we launched TBD, the first multiscreen TV network in the U.S. market to bring premium internet-first content to TV homes across America. TBD will include web series, short films, fashion, comedy, lifestyle, eSports, music and viral content, through partnerships with creators. |
• | Effective February 1, 2017, we reached an agreement in principle to renew its retransmission consent agreement with Frontier Cable for carriage of KOMO (ABC in Seattle, Washington), KATU (ABC in Portland, Oregon), and Tennis Channel. |
• | In February 2017, we extended our programming agreement with MyNetwork Television through the 2017-2018 broadcast season. |
ATSC 3.0
• | In March 2016, we began broadcasting "NextGen" Single Frequency Network (SFN) using the base elements of the new ATSC 3.0 transmission standard through the authority granted by the Federal Communications Commission (FCC). |
• | In March 2016, we hosted “Plug Fest 2016,” an event for “Validation and Verification” compatibility testing of the ATSC 3.0 digital TV standard. |
37
• | In March 2016, the Advanced Television Systems Committee (ATSC) developing the Next Generation Broadcast Transmission Standard (ATSC 3.0) approved as a Full Standard the key element of the Physical Layer, the so-called “Bootstrap” or the Discovery and Signaling feature of the standard. The Bootstrap includes the designs developed by ONE Media and supported by other broadcasters and equipment manufacturers. |
• | In April 2016, we announced the formation of ONE Media 3.0, LLC, a wholly-owned subsidiary whose purpose will be to develop business opportunities, products, and services associated with the ATSC 3.0 broadcast transmission standard approved in March 2016. |
Financing and Shareholder Returns
• | In March 2016, we issued $350.0 million in senior unsecured notes, which bear interest at a rate of 5.875% per annum and mature on March 15, 2026. The proceeds were used to repay amounts drawn under Sinclair Television Group’s revolving credit facility and for other general corporate purposes. |
• | In July 2016, we extended the maturity date of certain loans and commitments under our existing bank credit facility until July 31, 2021. |
• | In August 2016, we issued $400 million in senior unsecured notes, which bear interest at a rate of 5.125% per annum and mature on February 15, 2027. The proceeds were used to redeem $350 million in senior unsecured notes due in 2021 and for general corporate purposes. |
• | In January 2017, we extended the maturity of our term B Loans from April 9, 2020 and July 31, 2021 to January 3, 2024. In connection with the extension, we added additional operating flexibility, including a reduction in certain pricing terms related to the Loans and its existing revolving credit facility and revisions to certain covenant ratio requirements. |
• | For the year ended December 31, 2016, we repurchased approximately 4.9 million shares of Class A Common Stock for $136.4 million. As of December 31, 2016, the total remaining repurchase authorization was $119.1 million. |
• | For the year ended December 31, 2016 we paid dividends of $0.705 per share. |
• | In February 2017, our Board of Directors declared a quarterly dividend of $0.18 per share, payable on March 15, 2017 to the holders of record at the close of business on March 1, 2017. |
Other Events
• | In May 2016, the Third Circuit Court ruled to vacate the rule to make Joint Sales Agreements (JSAs) attributable. |
• | In July 2016, we entered into a Consent Decree with the FCC resolving a number of previously disclosed matters relating to certain content broadcast on our stations, technical issues relating to LMAs, and the FCC's rule regarding retransmission consent negotiations. The FCC dismissed all pending claims against us with the Media Bureau and issued renewals for 90 television stations. In September 2016, as part of the settlement, we paid $9.5 million. |
• | In November 2016, we announced executive promotions and changes which became effective January 1, 2017: David Smith from Chairman, President & Chief Executive Officer to Executive Chairman; Christopher Ripley from Chief Financial Officer to President & Chief Executive Officer; Lucy Rutishauser from SVP Corporate Finance & Treasurer to SVP Chief Financial Officer & Treasurer; David Amy from EVP and Chief Operating Officer to Vice Chairman; Barry Faber from EVP & General Counsel to EVP, General Counsel, Distribution and Network Relations; Steven Pruett from Co- Chief Operating Officer, Sinclair Television Group to EVP & Chief TV Development Officer; Steven Marks from Co-Chief Operating Officer, Sinclair Television Group to EVP & Chief Operating Officer, Sinclair Television Group; and Robert Malandra from SVP Television Finance to SVP Advanced Revenue Development & Analytics. |
• | In February 2017, we announced that we expect to receive an estimated $313 million of gross proceeds as a result of the National Broadband Plan Spectrum Auction. The results of the auction are not expected to produce any material change in our operations or results. The proceeds are expected to be received later this year. |
Industry Trends
• | Political spending is significantly higher in the even-numbered years due to the cyclicality of political elections. In addition, every four years, political spending is typically elevated further due to the advertising related to the presidential election. |
• | The FCC has permitted broadcast television stations to use their digital spectrum for a wide variety of services including multi-channel broadcasts. The FCC “must-carry” rules only apply to a station’s primary digital stream. |
• | Retransmission consent rules provide a mechanism for broadcasters to seek payment from MVPDs who carry broadcasters’ signals. Recognition of the value of the programming content provided by broadcasters, including local news and other programming and network programming all in HD has generated increased local revenues. |
• | Many broadcasters are enhancing / upgrading their websites to use the internet to deliver rich media content, such as newscasts and weather updates, to attract advertisers and to compete with other internet sites and smart phone and tablet device applications and other social media outlets. |
38
• | Seasonal advertising increases occur in the second and fourth quarters due to the anticipation of certain seasonal and holiday spending by consumers. |
• | Broadcasters have found ways to increase returns on their news programming initiatives while continuing to maintain locally produced content through the use of news sharing arrangements. |
• | Advertising revenue related to the Olympics occurs in even numbered years and the Super Bowl is aired on a different network each year. Both of these popularly viewed events can have an impact on our advertising revenues. |
CRITICAL ACCOUNTING POLICIES AND ESTIMATES
This discussion and analysis of our financial condition and results of operations is based on our consolidated financial statements which have been prepared in accordance with accounting principles generally accepted in the United States. The preparation of these financial statements requires us to make estimates and judgments that affect the reported amount of assets, liabilities, revenues and expenses and related disclosure of contingent assets and liabilities. On an on-going basis, we evaluate our estimates including those related to goodwill and intangible assets, program contract costs, income taxes, and variable interest entities. We base our estimates on historical experience and on various other assumptions that are believed to be reasonable under the circumstances, the results of which form the basis for making judgments about the carrying values of assets and liabilities that are not readily apparent from other sources. These estimates have been consistently applied for all years presented in this report and in the past we have not experienced material differences between these estimates and actual results. However, because future events and their effects cannot be determined with certainty, actual results could differ from our estimates and such differences could be material.
We consider the following accounting policies to be the most critical as they are important to our financial condition and results of operations, and require significant judgment and estimates on the part of management in their application. For a detailed discussion of the application of these and other accounting policies, see Note 1. Nature of Operations and Summary of Significant Accounting Policies within the Consolidated Financial Statements.
Valuation of Goodwill and Indefinite-Lived Intangible Assets. We evaluate our goodwill and indefinite-lived intangible assets for impairment annually, or more frequently, if events or changes in circumstances indicate an impairment may exist. As of December 31, 2016, our consolidated balance sheet includes $1,990.7 million and $156.3 million of goodwill and indefinite-lived intangible assets, respectively.
In the performance of our annual goodwill and indefinite-lived intangible asset impairment assessments we have the option to qualitatively assess whether it is more-likely-than-not that the respective asset has been impaired. If we conclude that it is more-likely-than-not that a reporting unit or an indefinite-lived intangible asset is impaired, we apply the quantitative assessment, which involves comparing the estimated fair value of the reporting unit or indefinite-lived intangible asset to its respective carrying value. See Impairment of Goodwill, Intangibles and Other Long-Lived Assets within Note 1. Nature of Operations and Summary of Significant Accounting Policies within the Consolidated Statement of Operations for further discussion of the significant judgments and estimates inherent in both qualitatively assessing whether impairment may exist and estimating the fair values of the reporting units and indefinite-lived intangible assets. See Note 5. Goodwill, Indefinite-Lived Intangible Assets and Other Intangible Assets within the Consolidated Financial Statements for the results of our annual impairment tests during the years ended December 31, 2016, 2015 and 2014.
For our annual goodwill impairment tests in 2016, 2015 and 2014, we concluded that it was more-likely-than-not that goodwill was not impaired based on our qualitative assessments. For one reporting unit in 2016, we elected to perform a quantitative assessment and concluded that its fair value significantly exceeded the carrying value. For our annual impairment tests for indefinite-lived intangible assets in 2016, 2015 and 2014, we concluded that it was more-likely-than-not that the assets were not impaired based on our qualitative assessments, except for broadcast licenses with an aggregate carrying value of $45.2 million in 2016, $15.3 million in 2015, and $38.1 million in 2014 for which we performed the quantitative assessments. During 2014, we recorded $3.2 million of impairment, which was recorded in amortization of definite-lived intangibles and other assets in our consolidated statement of operations, primarily as a result of declines in projected future market revenues related to the radio broadcast licenses. The results of our quantitative tests of indefinite-lived intangible assets in 2016 indicated that the fair values significantly exceeded the carrying value.
We believe we have made reasonable estimates and utilized appropriate assumptions to evaluate whether the fair values of our reporting units and indefinite-lived intangible assets were less than their carrying values. If future results are not consistent with our assumptions and estimates, including future events such as a deterioration of market conditions or significant increases in discount rates, we could be exposed to impairment charges in the future. Any resulting impairment loss could have a material adverse impact on our consolidated balance sheets, consolidated statements of operations and consolidated statements of cash flows.
39
Program Contract Costs. As discussed under Programming within Note 1. Nature of Operations and Summary of Significant Accounting Policies within the Consolidated Financial Statements, we record an asset and corresponding liability for programming rights when the cost of each program is known or reasonably determinable, the program material has been accepted by the licensee in accordance with the conditions of the license agreement and the program is available for its first showing or telecast. These costs are expensed over the period in which an economic benefit is expected to be derived. To ensure the related assets for the programming rights are reflected in the consolidated balance sheets at the lower of unamortized cost or estimated net realizable value (NRV), management estimates future advertising revenue, net of sales commissions, to be generated by the remaining program material available under the contract terms. Management’s judgment is required in determining the timing of expense for these costs, which is dependent on the economic benefit expected to be generated from the program and may significantly differ from the timing of related payments under the contractual obligation. If our estimates of future advertising revenues decline, amortization expense could be accelerated or NRV adjustments may be required.
Income Tax. As discussed under Income Taxes within Note 1. Nature of Operations and Summary of Significant Accounting Policies within the Consolidated Financial Statements, we recognize deferred tax assets and liabilities based on the differences between the financial statement carrying amounts and the tax basis of assets and liabilities. We provide a valuation allowance for deferred tax assets if we determine that it is more-likely-than not that some or all of the deferred tax assets will not be realized. In evaluating our ability to realize net deferred tax assets, we consider all available evidence, both positive and negative, including our past operating results, tax planning strategies and forecasts of future taxable income. In considering these sources of taxable income, we must make certain judgments that are based on the plans and estimates used to manage our underlying businesses on a long-term basis. As of December 31, 2016 and 2015, a valuation allowance has been provided for deferred tax assets related to a substantial amount of our available state net operating loss carryforwards based on past operating results, expected timing of the reversals of existing temporary book/tax basis differences, alternative tax strategies and projected future taxable income. Future changes in operating and/or taxable income or other changes in facts and circumstances could significantly impact the ability to realize our deferred tax assets which could have a material effect on our consolidated financial statements.
Management periodically performs a comprehensive review of our tax positions and we record a liability for unrecognized tax benefits when such tax positions do not meet the “more-likely-than-not” threshold. Significant judgment is required in determining whether a tax position meets the “more-likely-than-not” threshold, and is based on a variety of facts and circumstances, including interpretation of the relevant federal and state income tax codes, regulations, case law and other authoritative pronouncements. Based on this analysis, the status of ongoing audits and the expiration of applicable statute of limitations, liabilities are adjusted as necessary. The resolution of audits is unpredictable and could result in tax liabilities that are significantly higher or lower than for what we have provided. See Note 9. Income Taxes within the Consolidated Financial Statements, for further discussion of accrued unrecognized tax benefits.
Variable Interest Entities. As discussed under Variable Interest Entities within Note 1. Nature of Operations and Summary of Significant Accounting Policies within the Consolidated Financial Statements, we have determined that certain third-party licensees of stations for which we perform services to pursuant to arrangements, including LMAs and JSAs/SSAs, are VIEs and we are the primary beneficiary of those variable interests because, subject to the ultimate control of the licensees, we have the power to direct the activities which significantly impact the economic performance of the VIE through the services we provide and because we absorb losses and returns that would be considered significant to the VIEs. Determining whether an entity is a VIE and whether we are the primary beneficiary of the variable interests requires judgment which is based on quantitative and qualitative factors that indicate whether or not we are absorbing a majority of the entity’s economic risks or receiving a majority of the entity’s economic rewards, based on the terms of the arrangements with the entity.
Transactions with Related Parties. We have determined that we conduct certain business related transactions with related persons or entities. See Note 11. Related Person Transactions within the Consolidated Financial Statements for discussion of these transactions.
Recent Accounting Pronouncements
See Recent Accounting Pronouncements within Note 1. Nature of Operations and Summary of Significant Accounting Policies within the Consolidated Financial Statements for discussion on recent accounting policies and impact our financial statements.
40
RESULTS OF OPERATIONS
In general, this discussion is related to the results of operations. The results of the acquired stations during the years ended 2014, 2015, and 2016 are included in our results of our operations for the years ended 2014, 2015, and 2016 from their respective dates of acquisition. See Note 2. Acquisitions and Disposition of Assets within the Consolidated Financial Statements for further discussion of stations acquired. Unless otherwise indicated, references in this discussion and analysis to 2016, 2015 and 2014 are to our fiscal years ended December 31, 2016, 2015 and 2014, respectively. Additionally, any references to the first, second, third or fourth quarters are to the three months ended March 31, June 30, September 30 and December 31, respectively, for the year being discussed. We have one reportable segment, “broadcast” that is disclosed separately from our other and corporate activities.
Seasonality / Cyclicality
Our operating results are usually subject to seasonal fluctuations. Usually, the second and fourth quarter operating results are higher than the first and third quarters’ because advertising expenditures are increased in anticipation of certain seasonal and holiday spending by consumers.
Our operating results are usually subject to fluctuations from political advertising. In even numbered years, political spending is usually significantly higher than in odd numbered years due to advertising expenditures preceding local and national elections. Additionally, every four years, political spending is usually elevated further due to advertising expenditures preceding the presidential election.
Consolidated Operating Data
The following table sets forth certain of our consolidated operating data for the years ended December 31, 2016, 2015 and 2014 (in millions). For definitions of terms, see the footnotes to the table in Item 6. Selected Financial Data.
Years Ended December 31, | |||||||||||
2016 | 2015 | 2014 | |||||||||
Media revenues (a) | $ | 2,499.5 | $ | 2,011.9 | $ | 1,784.6 | |||||
Revenues realized from station barter arrangements | 135.6 | 111.3 | 122.3 | ||||||||
Other non-media revenues | 101.8 | 95.9 | 69.7 | ||||||||
Total revenues | 2,736.9 | 2,219.1 | 1,976.6 | ||||||||
Media production expenses (a) | 953.1 | 733.2 | 578.7 | ||||||||
Media selling, general and administrative expenses (a) | 501.6 | 431.7 | 372.2 | ||||||||
Expenses recognized from station barter arrangements | 117.0 | 93.2 | 107.7 | ||||||||
Depreciation and amortization | 410.0 | 389.6 | 335.5 | ||||||||
Other non-media expenses | 80.6 | 71.8 | 55.6 | ||||||||
Corporate general and administrative expenses | 73.6 | 64.2 | 62.5 | ||||||||
Research and development | 4.1 | 12.4 | 6.9 | ||||||||
(Gain) loss on asset dispositions | (6.0 | ) | 0.3 | (37.2 | ) | ||||||
Operating income | $ | 602.9 | $ | 422.7 | $ | 494.7 | |||||
Net income attributable to Sinclair Broadcast Group | $ | 245.3 | $ | 171.5 | $ | 212.3 | |||||
(a) Our media related revenues and expenses are primarily derived from our broadcast segment, but also from our other media related business, including our networks and content such as Tennis Channel, COMET, ASN, and non-broadcast digital properties. The results of our broadcast segment and the other media businesses are discussed further below under Broadcast Segment and Other, respectively.
41
BROADCAST SEGMENT
Revenues
The following table presents our media revenues, net of agency commissions, for the years ended December 31, 2016, 2015 and 2014 (in millions):
Percent Change | |||||||||||||||||
2016 | 2015 | 2014 | ‘16 vs. ‘15 | ‘15 vs. ‘14 | |||||||||||||
Local revenues: | |||||||||||||||||
Non-political | $ | 1,841.9 | $ | 1,627.6 | $ | 1,341.5 | 13.2 | % | 21.3 | % | |||||||
Political | 24.2 | 9.7 | 22.3 | (b) | (b) | ||||||||||||
Total local | 1,866.1 | 1,637.3 | 1,363.8 | 14.0 | % | 20.1 | % | ||||||||||
National revenues (a): | |||||||||||||||||
Non-political | 357.2 | 353.3 | 309.2 | 1.1 | % | 14.3 | % | ||||||||||
Political | 175.1 | 16.1 | 109.5 | (b) | (b) | ||||||||||||
Total national | 532.3 | 369.4 | 418.7 | 44.1 | % | (11.8 | )% | ||||||||||
Total broadcast segment media revenues | $ | 2,398.4 | $ | 2,006.7 | $ | 1,782.5 | 19.5 | % | 12.6 | % | |||||||
(a) | National revenue relates to advertising sales sourced from our national representation firm. |
(b) | Political revenue is not comparable from year to year due to the cyclicality of elections. See Political Revenues below for more information. |
Media Revenues. Media revenues increased $391.7 million in 2016 when compared to 2015, of which $37.6 million was related to stations not included in the same period in 2015. The remaining increase was primarily related to an increase in political net time sales as 2016 was a presidential election year, an increase in retransmission and digital revenues, and an increase in advertising revenues generated from the services, home products, automotive, direct response, media, entertainment, pharmaceutical/cosmetics, restaurant, and travel sectors. These increases were partially offset by a decrease in advertising revenues generated from the schools, telecommunications, retail, fast food, paid programing, and internet sectors. Automotive, which typically is our largest category, represented 22.5% of net time sales for the year ended December 31, 2016.
Media revenues increased $224.2 million in 2015 when compared to 2014, of which $220.5 million was related to stations not included in the same period in 2014. The remaining increase was due to an increase in retransmission revenues from MVPDs and increases in advertising revenues generated from the services, medical, and furniture sectors. These increases were partially offset by a decrease in advertising revenues generated from the political, schools, and fast food sectors. Automotive, which typically is our largest category, represented 25.5% of net time sales for the year ended December 31, 2015.
42
From a network affiliation or program service arrangement perspective, the following table sets forth our affiliate percentages of net time sales for the years ended December 31, 2016 and 2015:
# of | Percent of Net Time Sales for the Twelve Months Ended December 31, | Net Time Sales Percent Change | ||||||||||||||
Channels (a) | 2016 | 2015 | 2014 | ‘16 vs. ‘15 | ‘15 vs. ‘14 | |||||||||||
ABC | 36 | 27.1 | % | 28.7 | % | 25.7 | % | (5.6 | )% | 12.5 | % | |||||
FOX | 54 | 24.3 | % | 25.9 | % | 27.3 | % | (6.2 | )% | (3.8 | )% | |||||
CBS | 30 | 19.7 | % | 17.7 | % | 20.0 | % | 11.3 | % | (10.3 | )% | |||||
NBC | 22 | 14.2 | % | 11.7 | % | 9.4 | % | 21.4 | % | 25.7 | % | |||||
CW | 43 | 7.3 | % | 8.0 | % | 8.5 | % | (8.8 | )% | (4.3 | )% | |||||
MNT | 36 | 5.8 | % | 6.5 | % | 7.8 | % | (10.8 | )% | (14.7 | )% | |||||
Other (b) | 262 | 1.7 | % | 1.5 | % | 1.4 | % | 13.3 | % | 16.3 | % | |||||
Total | 483 | |||||||||||||||
(a) | See Television Markets and Stations within Item 1. Business for further detail on our channels. We have acquired a significant number of television stations during 2016, 2015, and 2014, with a variety of network affiliations. This acquisition activity affects the year-over-year comparability of revenue by affiliation. See Note 2. Acquisitions and Disposition of Assets within the Consolidated Financial Statements for further discussion of stations acquired. |
(b) | We broadcast other programming from the following providers on our channels including: ASN, Antenna TV, Azteca, Bounce Network, COMET, Decades, Estrella TV, Get TV, Grit, Me TV, MundoFox, Retro TV, Telemundo, This TV, News & Weather, Univision and Zuus Country. |
Political Revenues. Political revenues, which include time sales from political advertising, increased by $173.5 million to $199.3 million for 2016 when compared to 2015. Political revenues decreased by $106.0 million to $25.8 million for 2015 when compared to 2014. Political revenues are typically higher in election years such as 2016.
Local Revenues. Excluding political revenues, our local media revenues, which include local times sales, retransmission revenues, digital, and other local revenues, were up $214.3 million for 2016 when compared to 2015, of which $28.9 million was related to the stations not included in the same period in 2015. The remaining increase was primarily related to an increase in retransmission and digital revenues and an increase in advertising revenues generated from services, media, automotive, entertainment, furniture, and travel sectors. These increases were partially offset by lower advertising revenues generated from the schools, retail, medical, fast food, paid programming, direct response, and pharmaceutical/cosmetics sectors. Excluding political revenues, our local media revenues were up $286.1 million for 2015 when compared to 2014, of which $176.7 million related to the stations not included in the same period in 2014. The remaining increase was due to an increase in advertising spending particularly in the entertainment, direct response, and home products sectors and an increase in retransmission revenues from MVPDs. These increases were partially offset by a decline in advertising revenues from the automotive, fast food, and schools sectors.
National Revenues. Our national media revenues, excluding political revenues, which include national time sales and other national revenues, were up $3.9 million for 2016 when compared to 2015, of which $3.5 million was related to the stations not included in the same period in 2015. The remaining increase was primarily related to an increase in retransmission and digital revenues and an increase in advertising revenues generated from home products, direct response, medical, pharmaceutical/cosmetics, restaurants, and fast food. These increases were partially offset by lower advertising revenues generated from the telecommunications, retail, automotive, internet, and services sectors. Excluding political revenues, our national media revenues increased $44.1 million for 2015 when compared to 2014, which primarily related to the stations acquired in 2015. The remaining increase was due to an increase in advertising revenues generated from the pharmaceutical/cosmetics, retail/department stores, and furniture sectors. These increases were partially offset by a decrease in advertising revenues in the telecommunications, paid programs, and automotive sectors.
43
Expenses
The following table presents our significant operating expense categories for the years ended December 31, 2016, 2015 and 2014 (in millions):
Percent Change (Increase/(Decrease)) | |||||||||||||||||
2016 | 2015 | 2014 | ‘16 vs. ‘15 | ‘15 vs. ‘14 | |||||||||||||
Media production expenses | $ | 874.1 | $ | 714.1 | $ | 572.2 | 22.4 | % | 24.8 | % | |||||||
Media selling, general and administrative expenses | $ | 466.2 | $ | 427.2 | $ | 369.6 | 9.1 | % | 15.6 | % | |||||||
Amortization of program contract costs and net realizable value adjustments | $ | 127.9 | $ | 124.6 | $ | 106.6 | 2.6 | % | 16.9 | % | |||||||
Corporate general and administrative expenses | $ | 67.0 | $ | 55.8 | $ | 55.8 | 20.1 | % | — | % | |||||||
Depreciation and amortization expenses | $ | 247.1 | $ | 251.7 | $ | 218.5 | (1.8 | )% | 15.2 | % | |||||||
Media production expenses. Media production expenses increased $160.0 million during 2016 compared to 2015, of which $14.4 million related to the stations not included in the same period in 2015, net of dispositions. The remaining increase for the year was primarily due to increases in fees pursuant to network affiliation agreements mainly in relation to higher retransmission revenue, further investment in original programming content, increased costs related to sports programming content and expansion of news, an increase in costs related to viewership measurement, and increased compensation expense.
Media production expenses increased $141.9 million during 2015 compared to 2014, of which $93.0 million related to stations not included in the same period of 2014, net of dispositions. The remaining increase was primarily due to increases in fees pursuant to network affiliation agreements, increased compensation expense, and increased costs related to sports programming content.
Media selling, general and administrative expenses. Media selling, general and administrative expenses increased $39 million during 2016 compared to 2015, of which $6.0 million related to stations not included in the same period in 2015, net of dispositions. The remaining increases for the year were primarily due to an increase in information technology infrastructure costs, increased compensation expense, increased digital interactive costs, which was partially offset by the $9.3 million charge in 2015 related to settling the benefit obligation of an inherited pension plan.
Media selling, general and administrative expenses increased $57.6 million during 2015 compared to 2014, of which $41.6 million related to the stations not included in the same period in 2014, net of dispositions. The remaining increase for the year was primarily due to an increase in information technology infrastructure costs, increased compensation expense, increased insurance costs, increased digital interactive costs, and a $9.3 million charge related to settling the benefit obligation of an inherited pension plan.
Amortization of program contract costs and net realizable value adjustments. The amortization of program contract costs increased $3.3 million during 2016 compared to 2015, of which $2.1 million related to the stations not included in the same period of 2015, net of dispositions. The amortization of program contract costs increased $18.0 million during 2015 compared to 2014, of which $5.7 million related to the stations not included in the same period of 2014, net of dispositions. The remaining increases for both periods due to expanding high quality film content across our broadcast platform.
Corporate general and administrative expenses. See explanation under Corporate and Unallocated Expenses.
Depreciation and amortization expenses. Depreciation of property and equipment and amortization of definite-lived intangibles and other assets decreased $4.6 million during 2016 compared 2015 primarily due to the depreciation of property and equipment of assets which became fully depreciated in 2015, which was greater than the depreciation that resulted from 2016 additions, of which $1.3 million related to the stations not included in the same period of 2015, net of dispositions. Depreciation and amortization expenses increased $33.2 million during 2015 compared to 2014, of which $36.0 million related to a station not included in the same period of 2014, net of dispositions.
44
OTHER
Media revenues, media production expenses, and media selling, general, and administrative expense. The media revenue included within Other primarily relates to original networks and content, as well as our digital and internet businesses. For the years ended December 31, 2016, 2015 and 2014, we recorded revenue of $101.2 million, $5.2 million, and $2.1 million, respectively. The year-over-year increases in media revenues primarily relate to the recently acquired Tennis Channel as well as our science-fiction and sports networks. For the years ended December 31, 2016, 2015 and 2014, we recorded expenses of $114.4 million, $23.6 million, and $9.1 million, respectively. Our expenses relate to the programming and production, and general and administrative expenses related to the operations of our network, content, and digital and internet businesses. The year-over-year increases primarily relate to the recently acquired Tennis Channel and general and administrative costs related to the start-up of our original networks and content, production costs of new original programming, and new digital and internet initiatives such as Circa. See Item 1. Business. for a further discussion of these businesses.
Other non-media revenues and expenses. The following table presents our other non-media revenues and expenses for the years ended December 31, 2016, 2015 and 2014 (in millions):
Percent Change | |||||||||||||||||
2016 | 2015 | 2014 | ‘16 vs. ‘15 | ‘15 vs. ‘14 | |||||||||||||
Revenues: | |||||||||||||||||
Investments in real estate ventures | $ | 18.9 | $ | 23.2 | $ | 7.9 | (18.5 | )% | 193.7 | % | |||||||
Investments in private equity | $ | 72.3 | $ | 62.5 | $ | 53.9 | 15.7 | % | 16.0 | % | |||||||
Technical services | $ | 10.7 | $ | 10.2 | $ | 7.4 | 4.9 | % | 37.8 | % | |||||||
Expenses: (a) | |||||||||||||||||
Investments in real estate ventures | $ | 28.7 | $ | 27.6 | $ | 13.9 | 4.0 | % | 98.6 | % | |||||||
Investments in private equity | $ | 59.8 | $ | 52.3 | $ | 44.3 | 14.3 | % | 18.1 | % | |||||||
Technical services | $ | 12.6 | $ | 11.2 | $ | 9.3 | 12.5 | % | 20.4 | % | |||||||
(a) | Comprises total expenses of the entity including general and administrative, depreciation and amortization and applicable other income and expense items such as interest expense and non-cash stock-based compensation expense related to issuances of subsidiary stock awards and excludes equity method investment income. |
Investments in real estate ventures. We have controlling interests in certain real estate investments owned by Keyser Capital which we consolidate. For the year ended December 31, 2016, revenues from the investments decreased $4.3 million compared to 2015, of which $4.1 million related to real estate development projects. For the year ended December 31, 2016, expenses from these investments increased $1.1 million compared to 2015. This increase was primarily composed of a $2.6 million increase in expenses related to real estate development projects partially offset by a decrease of expenses related to our rental real estate investments and gain on sale of certain real estate assets.
For the year ended December 31, 2015, revenues from these investments increased $15.3 million compared to 2014, which primarily related to real estate development projects. For the year ended December 31, 2015, expenses from these investments increased $13.7 million compared to 2014, of which $9.9 million related to real estate development projects.
Investments in private equity. We have controlling interests in certain private equity investments owned by Keyser Capital, which we consolidate, including Triangle, a sign designer and fabricator, and Alarm Funding, a regional security alarm operating and bulk acquisition company. For the year ended December 31, 2016, revenues from investments in private equity increased $9.8 million compared to 2015, primarily relating to an increase in transaction volume from our sign and alarm businesses. For the year ended December 31, 2016, expenses from investments in private equity increased $7.5 million compared to 2015, which was primarily due to an increase of $8.4 million related to transaction volume from our sign and alarm businesses.
For the year ended December 31, 2015, revenues and expenses from investments in private equity increased $8.6 million and $8 million, respectively, compared to 2014, primarily related to an increase in transaction volume from our sign and alarm businesses.
45
Technical Services. We own certain subsidiaries which provide service and support for broadcast transmitters, and design and manufacture broadcast systems. See Item 1. Business for a further discussion of these businesses. For the year ended December 31, 2016, revenues and expenses related to Technical Services increased $0.5 million and $1.4 million, respectively, compared to 2015. For the year ended December 31, 2015 revenues and expenses related to Technical Services increased $2.8 million and $1.9 million, respectively, compared to 2014. The increases in both revenues and expenses related to Technical Services for both 2016 and 2015 are due to increased transaction volume.
Research and development expenses. Our research and development expenses relate to our costs to create Next Gen. See Development of Next Generation Broadcast Platforms (Next Gen) under Operating Strategy under Item 1. Business for further discussion of this initiative. For the years ended December 31, 2016, 2015, and 2014, research and development costs related to ONE Media, LLC were $4.1 million, $12.4 million, and $6.9 million, respectively.
Income from Equity and Cost Method Investments. As of December 31, 2016 and 2015, the carrying value of our investments in private equity and real estate ventures, accounted for under the equity or cost method, was $44.2 million and $84.3 million and $20.8 million and $84.6 million, respectively. Results of our equity and cost method investments in private equity investments and real estate ventures are included in income from equity and cost method investments in our consolidated statements of operations. During 2016, we recorded income of $2.0 million related to certain private equity investments and a loss of $0.3 million related to our real estate ventures. During 2015, we recorded income of $3.6 million related to certain private investment funds and a loss of $2.7 million related to our real estate ventures, which included an impairment charge of $6.0 million related to one of our real estate ventures. During 2014, we recorded income of $3.1 million related to certain private equity funds and a loss of $1.0 million related to our real estate ventures.
CORPORATE AND UNALLOCATED EXPENSES
Percent Change (Increase/(Decrease)) | |||||||||||||||||
2016 | 2015 | 2014 | ‘16 vs. ‘15 | ‘15 vs. ‘14 | |||||||||||||
Corporate general and administrative expenses | $ | 4.1 | $ | 5.4 | $ | 5.3 | (24.1 | )% | 1.9 | % | |||||||
Interest expense | $ | 199.1 | $ | 186.5 | $ | 170.8 | 6.8 | % | 9.2 | % | |||||||
Loss from extinguishment of debt | $ | 23.7 | $ | — | $ | 14.6 | n/a | n/a | |||||||||
Income tax provision | $ | 122.1 | $ | 57.7 | $ | 97.4 | 111.6 | % | (40.8 | )% | |||||||
n/a — not applicable
Corporate general and administrative expenses. We allocate most of our corporate general and administrative expenses to the broadcast segment. The explanation that follows combines corporate general and administrative expenses found in the Broadcast Segment section with the corporate general and administrative expenses found in this section, Corporate and Unallocated Expenses.
Combined corporate general and administrative expenses increased to $73.6 million in 2016 from $64.2 million in 2015. This increase primarily related to legal costs related to acquisitions and an increase in compensation costs related to merit increases. Combined corporate general and administrative expenses increased to $64.2 million in 2015 from $62.5 million in 2014.
We expect corporate general and administrative expenses to decrease in 2017 compared to 2016 primarily as a result of lower insurance costs and outside and other legal fees.
Interest expense. Interest expense increased in 2016 compared to 2015 primarily due to the issuance of the $350.0 million of 5.875% Notes in 2016. See Note 6. Notes Payable and Commercial Bank Financing within the Consolidated Financial Statements for further discussion.
Interest expense increased in 2015 compared to 2014 primarily due to the issuance of $550.0 million of 5.625% Notes in 2014 and incremental borrowings on our Bank Credit Agreement. The increase in interest expense was partially offset by a decrease in interest expense due to the redemption of 8.375% Notes during 2014.
We expect interest expense to increase in 2017 compared to 2016 as a result of fees incurred in 2017 related to the amendment and extension of our Term Loan B, partially offset by interest savings on the notes redeemed in 2016 as discussed in Note. 6 Notes Payable and Commercial Bank Financing within the Consolidated Financial Statements.
46
Loss from extinguishment of debt. We recognized a loss on extinguishment of debt of $23.7 million for the year ended December 31, 2016 related to the redemption of the 6.375% Notes in August 2016. See Note 6. Notes Payable and Commercial Bank Financing within the Consolidated Financial Statements for further discussion.
Income tax provision. The 2016 income tax provision for our pre-tax income (including the effects of noncontrolling interest) of $367.4 million resulted in an effective tax rate of 33.3%. The 2015 income tax provision for our pre-tax income (including the effects of the noncontrolling interest) of $229.2 million resulted in an effective tax rate of 25.2%. The increase in the effective tax rate from 2015 to 2016 is primarily due to a $12.6 million benefit related to the realization of a capital loss from the 2015 sale of the stock of a subsidiary.
The 2014 income tax provision for our pre-tax income (including the effects of the noncontrolling interest) of $309.7 million resulted in an effective tax rate of 31.5%. The decrease in the effective tax rate from 2014 to 2015 is primarily due to a $12.6 million benefit related to the realization of a capital loss from the 2015 sale of stock of a subsidiary.
As of December 31, 2016, we had a net deferred tax liability of $609.3 million as compared to a net deferred tax liability of $585.1 million as of December 31, 2015. The increase primarily relates to an increase in net deferred tax liabilities resulting from the acquisition of Tennis Channel in 2016. See Note 2. Acquisitions and Dispositions of Assets and Note 9. Income Taxes in the Consolidated Financial Statements for further information.
As of December 31, 2016, we had $4.7 million of gross unrecognized tax benefits. Of this total, $3.9 million (net of federal effect on state tax issues) represents the amount of unrecognized tax benefits that, if recognized, would favorably affect our effective tax rate. As of December 31, 2015, we had $3.3 million of gross unrecognized tax benefits. Of this total, $2.6 million (net of federal effect on state tax issues) represents the amount of unrecognized tax benefits that, if recognized, would favorably affect our effective tax rate. We recognized $0.2 million of income tax expense for interest related to uncertain tax positions for each of the years ended December 31, 2016 and 2015. See Note 9. Income Taxes in the Consolidated Financial Statements for further information.
LIQUIDITY AND CAPITAL RESOURCES
As of December 31, 2016, we had $260.0 million in cash and cash equivalent balances, net working capital of approximately $268.6 million, and $483.3 million remaining borrowing capacity under our revolving credit facility. Cash generated by our operations and borrowing capacity under the Bank Credit Agreement are used as our primary sources of liquidity.
In January 2017, we amended and restated our existing Term B Loan under the Bank Credit Agreement extending the maturity date to January 2024. See Bank Credit Agreement within Note 6. Notes Payable and Commercial Bank Financing within the Consolidated Financial Statements for further discussion.
In August 2016, we issued $400 million in senior unsecured notes, which bear interest at a rate of 5.125% per annum and mature on February 15, 2027. The proceeds from the offering, were used to redeem our 6.375% Notes and for general corporate purposes. See Note 6. Notes Payable and Commercial Bank Financing in our consolidated financial statements for further discussion.
In March 2016, we issued $350 million in senior unsecured notes, which bear interest at a rate of 5.875% per annum and mature on March 15, 2026. The proceeds from the offering, were used to repay amounts outstanding at the time under our revolving credit facility and for other general corporate purposes. See Note 6. Notes Payable and Commercial Bank Financing in our consolidated financial statements for further discussion.
We anticipate that existing cash and cash equivalents, cash flow from our operations and borrowing capacity under the revolving credit facility will be sufficient to satisfy our debt service obligations, capital expenditure requirements and working capital needs for the next twelve months. For our long-term liquidity needs, in addition to the sources described above, we may rely upon the issuance of long-term debt, the issuance of equity or other instruments convertible into or exchangeable for equity, or the sale of non-core assets. However, there can be no assurance that additional financing or capital or buyers of our non-core assets will be available, or that the terms of any transactions will be acceptable or advantageous to us.
On September 6, 2016 the Board of Directors approved an additional $150.0 million share repurchase authorization. There is no expiration date, and currently management has no plans to terminate this program. For the year ended December 31, 2016, we repurchased approximately 4.9 million shares for $136.4 million. As of December 31, 2016, the total remaining repurchase authorization was $119.1 million.
47
For the year ended December 31, 2016, we were in compliance with all of the covenants related to our Bank Credit Agreement, 5.125% Notes, 5.375% Notes, 5.625% Notes, 5.875% Notes, and 6.125% Notes.
Sources and Uses of Cash
The following table sets forth our cash flows for the years ended December 31, 2016, 2015 and 2014 (in millions):
2016 | 2015 | 2014 | |||||||||
Net cash flows from operating activities | $ | 591.8 | $ | 402.9 | $ | 432.6 | |||||
Cash flows used in investing activities: | |||||||||||
Acquisition of property and equipment | $ | (94.5 | ) | $ | (91.4 | ) | $ | (81.5 | ) | ||
Payments for acquisitions of businesses | (425.9 | ) | (17.0 | ) | (1,485.0 | ) | |||||
Proceeds from the sale of assets | 16.4 | 23.7 | 176.7 | ||||||||
Purchase of alarm monitoring contracts | (40.2 | ) | (39.2 | ) | (27.7 | ) | |||||
Decrease (increase) in restricted cash | 3.7 | (3.7 | ) | 11.6 | |||||||
Investments in equity and cost method investees | (51.2 | ) | (44.7 | ) | (8.1 | ) | |||||
Distributions from equity and cost method investees | 6.8 | 21.7 | 3.9 | ||||||||
Proceeds from termination of life insurance policies | — | — | 17.0 | ||||||||
Loan to affiliates | (19.5 | ) | — | — | |||||||
Other, net | (1.6 | ) | (0.7 | ) | (4.3 | ) | |||||
Net cash flows used in investing activities | $ | (606.0 | ) | $ | (151.3 | ) | $ | (1,397.4 | ) | ||
Cash flows from financing activities: | |||||||||||
Proceeds from notes payable, commercial bank financing and capital leases | $ | 1,024.9 | $ | 382.9 | $ | 1,500.7 | |||||
Repayments of notes payable, commercial bank financing and capital leases | (671.2 | ) | (395.2 | ) | (582.8 | ) | |||||
Dividends paid on Class A and Class B common stock | (65.9 | ) | (62.7 | ) | (61.1 | ) | |||||
Repurchase of outstanding Class A Common Stock | (136.3 | ) | (28.8 | ) | (133.2 | ) | |||||
Payments for deferred financing costs | (15.7 | ) | (3.8 | ) | (16.6 | ) | |||||
Noncontrolling interest contributions | (10.5 | ) | (9.9 | ) | (8.2 | ) | |||||
Other, net | (1.1 | ) | (1.7 | ) | 3.4 | ||||||
Net cash flows from (used in) financing activities | $ | 124.2 | $ | (119.2 | ) | $ | 702.2 | ||||
Operating Activities
Net cash flows from operating activities increased during the year ended December 31, 2016 compared to the same period in 2015. This change is primarily due to an increase in cash received from customers due to businesses acquired since December 2015 and increased political advertising spending in an election year.
Net cash flows from operating activities decreased during the year ended December 31, 2015 compared to the same period in 2014. The decrease was due to higher program payments, interest payments, and income taxes, compared to the same period in 2014, offset by an increase in cash received from customers. The increase in cash received from customers and program payments is primarily related to stations acquired in the second half of 2014.
Investing Activities
Net cash flows used in investing activities increased during the year ended December 31, 2016, compared to the same period in 2015. This increase is primarily due to the acquisition of Tennis Channel.
Net cash flows used in investing activities decreased during the year ended December 31, 2015, compared to the same period in 2014. This decrease is primarily due to fewer acquisitions of broadcast assets, partially offset by higher capital expenditures, a decrease in proceeds from the sale of broadcast assets, increase in the purchase of alarm contracts, and an increase in equity and cost method investments.
48
Financing Activities
Net cash flows from financing activities increased during the year ended December 31, 2016, compared to the same period in 2015, due primarily to the proceeds received from the 5.875% Notes issued in March 2016 and partially offset by the increased repurchases of Class A Common Stock during 2016.
Net cash flows from financing activities decreased during the year ended December 31, 2015, compared to the same period in 2014, was primarily due to a decrease in net proceeds from notes payable from less activity in 2015 compared to 2014, partially offset by lower financing costs and less repurchases of Class A Common Stock.
During 2015, our Board of Directors declared a quarterly dividend of $0.165 per share in the months of February, May, August and November which were paid in March, June, September and December, respectively. Total dividend payments for the year ended December 31, 2015 were $0.66 per share. During 2016, our Board of Directors declared a quarterly dividend of $0.165 per share in the month of February, which was paid in March. In May, August, and November, our Board of Directors declared a quarterly dividend of $0.18 per share, which were paid in June, September and December, respectively. Total dividend payments for the year ended December 31, 2016 were $0.705 per share. In February 2017, our Board of Directors declared a quarterly dividend of $0.18 per share. Future dividends on our common shares, if any, will be at the discretion of our Board of Directors and will depend on several factors including our results of operations, cash requirements and surplus, financial condition, covenant restrictions and other factors that the Board of Directors may deem relevant. The Class A Common Stock and Class B Common Stock holders have the same rights related to dividends. Under our Bank Credit Agreement, in certain circumstances, we may make up to $200.0 million in unrestricted annual cash payments including but not limited to dividends, of which $50.0 million may carry over to the next year.
Contractual Obligations
We have various contractual obligations which are recorded as liabilities in our consolidated financial statements. Other items, such as certain purchase commitments and other executory contracts are not recognized as liabilities in our consolidated financial statements but are required to be disclosed. For example, we are contractually committed to acquire future programming and make certain minimum lease payments for the use of property under operating lease agreements.
The following table reflects a summary of our contractual cash obligations as of December 31, 2016 and the future periods in which such obligations are expected to be settled in cash (in millions):
CONTRACTUAL OBLIGATIONS (a)
Total | 2017 | 2018-2019 | 2020-2021 | 2022 and thereafter | |||||||||||||||
Notes payable, capital leases and commercial bank financing (b), (c) | $ | 5,361.0 | $ | 364.9 | $ | 567.4 | $ | 2,314.1 | $ | 2,114.6 | |||||||||
Notes and capital leases payable to affiliates (b) | 24.1 | 5.1 | 5.8 | 6.1 | 7.1 | ||||||||||||||
Operating leases | 196.7 | 22.6 | 43.2 | 38.9 | 92.0 | ||||||||||||||
Program content (d) | 1,317.7 | 534.8 | 582.8 | 194.2 | 5.9 | ||||||||||||||
Programming services (e) | 246.3 | 87.4 | 83.7 | 45.3 | 29.9 | ||||||||||||||
Investments and loan commitments (f) | 13.5 | 13.5 | — | — | — | ||||||||||||||
Other (g) | 105.0 | 12.9 | 20.1 | 16.6 | 55.4 | ||||||||||||||
Total contractual cash obligations | $ | 7,264.3 | $ | 1,041.2 | $ | 1,303.0 | $ | 2,615.2 | $ | 2,304.9 | |||||||||
(a) | Excluded from this table are $4.7 million of accrued unrecognized tax benefits. Due to inherent uncertainty, we cannot make reasonable estimates of the amount or the period payments will be made. |
(b) | Includes interest on debt and capital leases. Estimated interest on our variable rate debt has been calculated at an effective weighted interest rate of 3.32%. Variable rate debt represents $1.8 billion of our $4.2 billion total face value of debt as of December 31, 2016. |
(c) | See Note 6. Notes Payable and Commercial Bank Financing within the Consolidated Financial Statements for further discussion of the changes to notes payable, capital leases, and commercial bank financing during 2016. |
49
(d) | Our Program content includes contractual amounts owed through the expiration date of the underlying agreement for active and future program contracts, network programming and additional advertising inventory in various dayparts. Active program contracts are included in the balance sheet as an asset and liability while future program contracts are excluded until the cost is known, the program is available for its first showing or telecast and the licensee has accepted the program. Industry protocol typically enables us to make payments for program contracts on a three-month lag, which differs from the contractual timing within the table. Network programming agreements may include variable fee components such as subscriber levels, which in certain circumstances have been estimated and reflected in the table. |
(e) | Includes obligations related to rating service fees, music license fees, market research, weather and news services. |
(f) | Commitments to contribute capital to various non-media private equity investments. |
(g) | Other includes obligations related to post-retirement benefits, maintenance and support, other corporate contracts, other long term liabilities, and LMA and outsourcing agreements. Excluded from the table are estimated amounts due pursuant to LMAs and outsourcing agreements where we consolidate the counter-party. The fees that we are required to pay under these agreements total $5.7 million, $10.7 million, $7.6 million and $0.1 million for the periods 2017, 2018-2019, 2020-2021 and 2022 and thereafter, respectively. Certain station related operating expenses are paid by the licensee and reimbursed by us under the LMA agreements. Certain of these expenses that are in connection with contracts are included in table above. |
Off Balance Sheet Arrangements
Off balance sheet arrangements as defined by the SEC means any transaction, agreement or other contractual arrangement to which an entity unconsolidated with the registrant is a party, under which the registrant has: obligations under certain guarantees or contracts; retained or contingent interest in assets transferred to an unconsolidated entity or similar arrangements; obligations under certain derivative arrangements; and obligations arising out of a material variable interest in an unconsolidated entity. As of December 31, 2016, we do not have any material off balance sheet arrangements.
ITEM 7A. QUANTITATIVE AND QUALITATIVE DISCLOSURES ABOUT MARKET RISK
We are exposed to market risk from changes in interest rates. At times we enter into derivative instruments primarily for the purpose of reducing the impact of changing interest rates on our floating rate debt and to reduce the impact of changing fair market values on our fixed rate debt. See Note 6. Notes Payable and Commercial Bank Financing within the Consolidated Financial Statements, for further discussion. As of December 31, 2016, we did not have any outstanding derivative instruments.
We are exposed to risk from the changing interest rates of our variable rate debt, primarily related to our Bank Credit Agreement. For the year ended December 31, 2016, interest expense on our term loans and revolver related to our Bank Credit Agreement was $54.4 million. We estimate that adding 1.0% to respective interest rates would result in an increase in our interest expense of $16.7 million for the year ended December 31, 2016. We also have $135.2 million of variable rate debt associated with our other non-media related investments. We estimate that adding 1.0% to respective interest rates would result in $1.2 million of additional interest expense for the year ended December 31, 2016. Our consolidated VIEs have $23.2 million of variable rate debt associated with the stations that we provide services to pursuant to LMAs and other outsourcing arrangements. We estimate that adding 1.0% to respective interest rates would result in an increase interest expense of the VIEs by $0.2 million for the year ended December 31, 2016.
ITEM 8. FINANCIAL STATEMENTS AND SUPPLEMENTARY DATA
The financial statements and supplementary data required by this item are filed as exhibits to this report, are listed under Item 15(a)(1) and (2) and are incorporated by reference in this report.
ITEM 9. CHANGES IN AND DISAGREEMENTS WITH ACCOUNTANTS ON ACCOUNTING AND FINANCIAL DISCLOSURE
There were no changes in and/or disagreements with accountants on accounting and financial disclosure during the year ended December 31, 2016.
50
ITEM 9A. CONTROLS AND PROCEDURES
Evaluation of Disclosure Controls and Procedures and Internal Control over Financial Reporting
Our management, under the supervision and with the participation of our Chief Executive Officer and Chief Financial Officer, evaluated the design and effectiveness of our disclosure controls and procedures and our internal control over financial reporting as of December 31, 2016.
The term “disclosure controls and procedures,” as defined in Rules 13a-15(e) and 15d-15(e) under the Exchange Act, means controls and other procedures of a company that are designed to provide reasonable assurance that information required to be
disclosed by a company in the reports that it files or submits under the Exchange Act is recorded, processed, summarized and reported, within the time periods specified in the SEC’s rules and forms. Disclosure controls and procedures include, without limitation, controls and procedures designed to provide reasonable assurance that information required to be disclosed by a company in the reports that it files or submits under the Exchange Act is accumulated and communicated to our management, including its principal executive and principal financial officers, as appropriate, to allow timely decisions regarding required disclosure. Management recognizes that any controls and procedures, no matter how well designed and operated, can provide only reasonable assurance of achieving their objectives and management necessarily applies its judgment in evaluating the cost-benefit relationship of possible controls and procedures.
The term “internal control over financial reporting,” as defined in Rules 13a-15d-15(f) under the Exchange Act, means a process designed by, or under the supervision of our Chief Executive and Chief Financial Officers and effected by our Board of Directors, management and other personnel, to provide reasonable assurance regarding the reliability of financial reporting and the preparation of financial statements for external purposes in accordance with generally accepted accounting principles (GAAP) and includes those policies and procedures that:
• | pertain to the maintenance of records that in reasonable detail accurately and fairly reflect the transactions and dispositions of our assets; |
• | provide reasonable assurance that transactions are recorded as necessary to permit preparation of financial statements in accordance with GAAP and that our receipts and expenditures are being made in accordance with authorizations of management or our Board of Directors; and |
• | provide reasonable assurance regarding prevention or timely detection of unauthorized acquisition, use or disposition of our assets that could have a material adverse effect on our financial statements. |
Assessment of Effectiveness of Disclosure Controls and Procedures
Based on the evaluation of our disclosure controls and procedures as of December 31, 2016, our Chief Executive Officer and Chief Financial Officer concluded that, as of such date, our disclosure controls and procedures were effective at the reasonable assurance level.
Report of Management on Internal Control over Financial Reporting
Our management is responsible for establishing and maintaining adequate internal control over financial reporting. Under the supervision and with the participation of our management, including our Chief Executive Officer and Chief Financial Officer, we assessed the effectiveness of our internal control over financial reporting as of December 31, 2016 based on the criteria set forth in Internal Control - Integrated Framework issued by the Committee of Sponsoring Organizations of the Treadway Commission (2013 framework) (COSO). Based on our assessment, management has concluded that, as of December 31, 2016, our internal control over financial reporting was effective based on those criteria.
Management has excluded the Tennis Channel and certain television stations (KUQI, KTOV, KXPX, WTVH, WSBT, KHGI, KWNB, KFXL, KJZZ, WSJV) from its assessment of internal control over financial reporting as of December 31, 2016 because they were acquired by the Company in purchase business combinations during 2016. The Tennis Channel and these television stations (KUQI, KTOV, KXPX, WTVH, WSBT, KHGI, KWNB, KFXL, KJZZ, and WSJV) are wholly-owned subsidiaries whose total assets and total revenues represent 8% and 5%, respectively, of the related consolidated financial statement amounts as of and for the year ended December 31, 2016.
The effectiveness of our internal control over financial reporting as of December 31, 2016 has been audited by PricewaterhouseCoopers LLP, an independent registered public accounting firm, as stated in their report which is included herein.
51
Changes in Internal Control over Financial Reporting
There have been no changes in our internal control over financial reporting (as defined in Rules 13a-15(f) and 15d-15(f) under the Exchange Act) during the quarter ended December 31, 2016, that have materially affected, or are reasonably likely to materially affect, our internal control over financial reporting.
Limitations on the Effectiveness of Controls
Management, including our Chief Executive Officer and Chief Financial Officer, do not expect that our disclosure controls and procedures or our internal control over financial reporting will prevent all errors and all fraud. A control system, no matter how well designed and operated, can provide only reasonable, not absolute, assurance that the objectives of the control system are met. Further, the design of a control system must reflect the fact that there are resource constraints and the benefits of controls must be considered relative to their costs. Because of the inherent limitations in all control systems, no evaluation of controls can provide absolute assurance that all control issues and instances of fraud, if any, within our company have been detected. These inherent limitations include the realities that judgments in decision-making can be faulty and that breakdowns can occur because of simple error or mistake. Additionally, controls can be circumvented by the individual acts of some persons, by collusion of two or more people, or by management’s override of the control. The design of any system of controls also is based in part upon certain assumptions about the likelihood of future events and there can be no assurance that any design will succeed in achieving its stated goals under all potential future conditions; over time, controls may become inadequate because of changes in conditions, or the degree of compliance with the policies or procedures may deteriorate. Because of the inherent limitations in a cost-effective control system, misstatements due to error or fraud may occur and not be detected.
ITEM 9B. OTHER INFORMATION
None.
PART III
ITEM 10. DIRECTORS, EXECUTIVE OFFICERS AND CORPORATE GOVERNANCE
The information required by this Item will be included in our Proxy Statement for the 2017 Annual Meeting of shareholders under the captions, “Directors, Executive Officers and Key Employees,” “Section 16(A) Beneficial Ownership Reporting Compliance,” “Code of business Conduct and Ethics” and “Corporate Governance,” which will be filed with the SEC no later than 120 days after the close of the fiscal year ended December 31, 2016 and is incorporated by reference in this report.
ITEM 11. EXECUTIVE COMPENSATION
The information required by this Item will be included in our Proxy Statement for the 2017 Annual Meeting of shareholders under the captions, “Compensation Discussion and Analysis”, “Director Compensation for 2016,” “Compensation Committee Interlocks and Insider Participation” and “Compensation Committee Report,” which will be filed with the SEC no later than 120 days after the close of the fiscal year ended December 31, 2016 and is incorporated by reference in this report.
ITEM 12. SECURITY OWNERSHIP OF CERTAIN BENEFICIAL OWNERS AND MANAGEMENT AND RELATED STOCKHOLDER MATTERS
The information required by this Item will be included in our Proxy Statement for the 2017 Annual Meeting of shareholders under the caption, “Security Ownership Of Certain Beneficial Owners and Management,” which will be filed with the SEC no later than 120 days after the close of the fiscal year ended December 31, 2016 and is incorporated by reference in this report.
ITEM 13. CERTAIN RELATIONSHIPS AND RELATED TRANSACTIONS, AND DIRECTOR INDEPENDENCE
The information required by this Item will be included in our Proxy Statement for the 2017 Annual Meeting of shareholders under the captions, “Related Person Transactions” and “Director Independence,” which will be filed with the SEC no later than 120 days after the close of the fiscal year ended December 31, 2016 and is incorporated by reference in this report.
52
ITEM 14. PRINCIPAL ACCOUNTING FEES AND SERVICES
The information required by this Item will be included in our Proxy Statement for the 2017 Annual Meeting of shareholders under the caption, “Disclosure of Fees Charged by Independent Registered Public Accounting Firm,” which will be filed with the SEC no later than 120 days after the close of the fiscal year ended December 31, 2016 and is incorporated by reference in this report.
PART IV
ITEM 15. EXHIBITS, FINANCIAL STATEMENT SCHEDULES
(a) (1) Financial Statements
The following financial statements required by this item are submitted in a separate section beginning on page F-1 of this report.
Sinclair Broadcast Group, Inc. Financial Statements: | Page: | |
(a) (2) Financial Statements Schedules
All schedules are omitted because they are not applicable or the required information is shown in the Financial Statements or the accompanying notes.
(a) (3) Exhibits
The following exhibits are filed with this report:
EXHIBIT NO. | EXHIBIT DESCRIPTION | |
3.1 | Amended and Restated Certificate of Incorporation. (Incorporated by reference from Registrant’s Report on Form 10-Q for the quarter ended June 30, 1998). | |
3.2 | Amended By-Laws of Sinclair Broadcast Group, Inc. as further amended by the Second Amendment to the Amended By-Laws of Sinclair Broadcast Group, Inc., dated March 3, 2009. (Incorporated by reference from Registrant’s Current Report on Form 8-K filed March 6, 2009). | |
4.1 | Indenture, dated as of October 12, 2012, by and among Sinclair Television Group, Inc., the guarantors identified therein and U.S. Bank National Association, as trustee. (Incorporated by reference from Registrant’s Current Report on Form 8-K filed on October 17, 2012). | |
4.2 | Indenture, dated as of April 2, 2013, by and among Sinclair Television Group, Inc., the guarantors identified therein and U.S. Bank National Association, as trustee. (Incorporated by reference from Registrant’s Current Report on Form 8-K filed on April 4, 2013). | |
4.3 | Indenture, dated as of October 11, 2013, by and among Sinclair Television Group, Inc., the guarantors identified therein and U.S. Bank National Association, as trustee. (Incorporated by reference from Registrant’s Current Report on Form 8-K filed on October 17, 2013). | |
4.4 | Indenture, dated as of July 23, 2014, by and among Sinclair Television Group, Inc., the guarantors identified therein and U.S. Bank National Association, as trustee. (Incorporated by reference from Registrant’s Current Report on Form 8-K filed on July 28, 2014). | |
4.5 | Indenture, dated as of March 23, 2016, by and among Sinclair Television Group, Inc., the guarantors identified therein and U.S. Bank National Association, as trustee. (Incorporated by reference from Registrant’s Current Report on Form 8-K filed on March 25, 2016). | |
53
EXHIBIT NO. | EXHIBIT DESCRIPTION | |
4.6 | Indenture, dated as of August 30, 2016, by and among Sinclair Television Group, Inc., the guarantors identified therein and U.S. Bank National Association, as trustee. (Incorporated by reference from Registrant’s Current Report on Form 8-K filed on September 2, 2016). | |
10.1* | First Amendment to Incentive Stock Option Plan for Sinclair Broadcast Group, Inc., adopted April 10, 1996. (Incorporated by reference from Registrant’s Report on Form 10-K/A for the year ended December 31, 1996). | |
10.2* | Second Amendment to Incentive Stock Option Plan for Sinclair Broadcast Group, Inc., adopted May 31, 1996. (Incorporated by reference from Registrant’s Report on Form 10-K/A for the year ended December 31, 1996). | |
10.3* | 1996 Long-Term Incentive Plan for Sinclair Broadcast Group, Inc. (Incorporated by reference from Registrant’s Report on Form 10-K/A for the year ended December 31, 1996). | |
10.4* | First Amendment to 1996 Long-Term Incentive Plan for Sinclair Broadcast Group, Inc. (Incorporated by reference from Registrant’s Proxy Statement on Schedule 14A for the year ended December 31, 1998). | |
10.5* | Employment Agreement by and between Sinclair Broadcast Group, Inc. and Frederick G. Smith, dated June 12, 1998. (Incorporated by reference from Registrant’s Report on Form 10-Q for the quarter ended September 30, 1998). | |
10.6* | Employment Agreement by and between Sinclair Broadcast Group, Inc. and J. Duncan Smith, dated June 12, 1998. (Incorporated by reference from Registrant’s Report on Form 10-Q for the quarter ended September 30, 1998). | |
10.7* | Employment Agreement by and between Sinclair Broadcast Group, Inc. and Lucy Rutishauser dated March 19, 2001. (Incorporated by reference from Registrant’s Report on Form 10-K/A filed on April 29, 2005). | |
10.8* | Form of Restricted Stock Award Agreement. (Incorporated by reference from Registrant’s Report on Form 10-Q for the quarter ended June 30, 2006). | |
10.9* | Stock Appreciation Right Agreement between Sinclair Broadcast Group, Inc. and David D. Smith dated April 2, 2007. (Incorporated by reference from Registrant’s Report on Form 10-Q for the quarter ended March 31, 2007). | |
10.10 | Agreement of Lease dated as of March 28, 2008 by and between Beaver Dam Limited Liability Company and Sinclair Broadcast Group, Inc. (Incorporated by reference from Registrant’s Current Report on Form 8-K filed on April 3, 2008). | |
10.11 | Amended and restated lease dated as of February 8, 2010 between Gerstell Development Limited Partnership and Sinclair Media I, Inc. (Incorporated by reference from Registrant’s Report on Form 10-K for the year ended December 31, 2009). | |
10.12 | Amended and restated lease dated as of February 8, 2010 between Cunningham Communications, Inc. and Sinclair Communications, LLC. (Incorporated by reference from Registrant’s Report on Form 10-K for the year ended December 31, 2009). | |
10.13 | Amended and restated lease dated as of February 8, 2010 between Keyser Investment Group, Inc. and Sinclair Communications, LLC. (Incorporated by reference from Registrant’s Report on Form 10-K for the year ended December 31, 2009). | |
10.14 | Amended and restated lease dated as of February 8, 2010 between Keyser Investment Group, Inc. and Sinclair Communications, LLC. (Incorporated by reference from Registrant’s Report on Form 10-K for the year ended December 31, 2009). | |
10.15* | Stock Appreciation Right Agreement, between Sinclair Broadcast Group, Inc. and David D. Smith dated March 22, 2011. (Incorporated by reference from Registrant’s Report on Form 10-K for the year ended December 31, 2010). | |
10.16* | Amended and Restated Employment Agreement by and between Sinclair Broadcast Group, Inc. and David B. Amy, dated November 11, 2011. (Incorporated by reference from Registrant’s Report on Form 10-K for the year ended December 31, 2011). | |
10.17* | Amended and Restated Employment Agreement by and between Sinclair Broadcast Group, Inc. and Barry M. Faber, dated August 31, 2015. (Incorporated by reference from Registrant’s Report on Form 10-Q for the quarter ended September 30, 2015). | |
10.18* | Amended and Restated Employment Agreement by and between Sinclair Broadcast Group, Inc. and Steven M. Marks, dated November 14, 2011. (Incorporated by reference from Registrant’s Report on Form 10-K for the year ended December 31, 2011). | |
10.19* | Stock Appreciation Right Agreement, between Sinclair Broadcast Group, Inc. and David D. Smith dated March 9, 2012. (Incorporated by reference form Registrant’s Report on Form 10-Q for the quarter ended March 31, 2012) | |
54
EXHIBIT NO. | EXHIBIT DESCRIPTION | |
10.20 | Amended and restated lease dated January 1, 2013 between Keyser Investment Group, Inc. and Sinclair Communications LLC. (Incorporated by reference from Registrant’s Report on Form 10-K filed on March 12, 2013). | |
10.21* | Stock Appreciation Right Agreement, between Sinclair Broadcast Group, Inc. and David D. Smith dated February 5, 2013. (Incorporated by reference from Registrant’s Report on Form 10-K filed on March 12, 2013). | |
10.22* | Employment Agreement for Steven J. Pruett, Chief Operating Officer. (Incorporated by reference from Registrant’s Report on Form 10-Q for the quarter ended March 31, 2013). | |
10.23* | Amendment to the 1996 Long-Term Incentive Plan of Sinclair Broadcast Group, Inc., by and among Sinclair Broadcast Group, Inc (Incorporated by reference from Registrant’s Report on Form 10-K filed on March 3, 2014). | |
10.24* | Stock Appreciation Right Agreement, between Sinclair Broadcast Group, Inc. and David D. Smith dated February 11, 2014. (Incorporated by reference from Registrant’s Report on Form 10-K filed on March 3, 2014). | |
10.25* | Employment Agreement for Christopher S. Ripley, Chief Financial Officer (Incorporated by reference from Registrant’s Report on Form 10-Q for the quarter ended March 31, 2014). | |
10.26 | Sixth Amended and Restated Credit Agreement, dated July 31, 2014, by and among Sinclair Television Group, Inc., the guarantors party thereto, JP Morgan Chase Bank, N.A., as administrative agent, and the lenders party thereto. (Incorporated by reference from Registrant’s Current Report on Form 8-K filed on August 8, 2014. | |
10.27 | First Amendment to the Sixth Amended and Restated Credit Agreement and First Amendment to the Fourth Amended and Restated Security Agreement, dated as of April 30, 2015, by and among Sinclair Television Group, Inc., the guarantors party thereto, JP Morgan Chase Bank, N.A., as administrative agent, and the lenders and other parties thereto. (Incorporated by reference from Registrant’s Current Report on Form 8-K filed on May 6, 2015). | |
10.28 | Incremental Loan Amendment No. 1, dated as of April 30, 2015, by and among Sinclair Television Group, Inc., the guarantors party thereto, JP Morgan Chase Bank, N.A., as administrative agent, and the lenders and other parties thereto. (Incorporated by reference from Registrant’s Current Report on Form 8-K filed on May 6, 2015). | |
10.29* | Stock Appreciation Right Agreement, between Sinclair Broadcast Group, Inc. and David D. Smith dated February 2, 2015. (Incorporated by reference from Registrant's Report on Form 10-K filed on March 2, 2015.) | |
10.30* | Stock Appreciation Right Agreement, between Sinclair Broadcast Group, Inc. and David D. Smith dated March 1, 2016. (Incorporated by reference from Registrant’s Quarterly Report on Form 10-Q filed on May 10, 2016.) | |
10.31 | Second Amendment to the Sixth Amended and Restated Credit Agreement, dated as of July 19, 2016, by and among Sinclair Television Group, Inc., the guarantors party thereto, JP Morgan Chase Bank, N.A., as administrative agent, and the lenders and other parties thereto. (Incorporated by reference from Registrant’s Current Report on Form 8-K filed on July 25, 2016). | |
10.32 | Third Amendment to the Sixth Amended and Restated Credit Agreement, dated as of January 3, 2017, by and among Sinclair Television Group, Inc., the guarantors party thereto, JP Morgan Chase Bank, N.A., as administrative agent, and the lenders and other parties thereto. (Incorporated by reference from Registrant’s Current Report on Form 8-K filed on November 2, 2016). | |
12 | Computation of Ratio of Earnings to Fixed Charges. | |
21 | Subsidiaries of the Registrant. | |
23 | Consent of PricewaterhouseCoopers LLP Independent Registered Public Accounting Firm. | |
24 | Power of Attorney; included above registrants signatures of this Form 10-K. | |
31.1 | Certification by Christopher S. Ripley, as Chief Executive Officer of Sinclair Broadcast Group, Inc., pursuant to § 302 of the Sarbanes-Oxley Act of 2002 (15 U.S.C. § 7241). | |
31.2 | Certification by Lucy A. Rutishauser, as Chief Financial Officer of Sinclair Broadcast Group, Inc., pursuant to § 302 of the Sarbanes-Oxley Act of 2002 (15 U.S.C. § 7241). | |
32.1 | Certification by Christopher S. Ripley, as Chief Executive Officer of Sinclair Broadcast Group, Inc., pursuant to § 906 of the Sarbanes-Oxley Act of 2002 (18 U.S.C. § 1350). | |
32.2 | Certification by Lucy A. Rutishauser, as Chief Financial Officer of Sinclair Broadcast Group, Inc., pursuant to § 906 of the Sarbanes-Oxley Act of 2002 (18 U.S.C. § 1350). | |
99 | Stockholders’ Agreement dated April 2, 2015 by and among the Smith Brothers. (Incorporated by reference from Registrant’s Current Report on Form 8-K filed on April 6, 2015). | |
55
EXHIBIT NO. | EXHIBIT DESCRIPTION | |
101.INS | XBRL Instance Document | |
101.SCH | XBRL Taxonomy Extension Schema | |
101.CAL | XBRL Taxonomy Extension Calculation Linkbase | |
101.LAB | XBRL Taxonomy Extension Label Linkbase | |
101.PRE | XBRL Taxonomy Extension Presentation Linkbase | |
101.DEF | XBRL Taxonomy Extension Definition Linkbase | |
* Management contracts and compensatory plans or arrangements required to be filed as an exhibit pursuant to Item 15(b) of Form 10-K.
(b) Exhibits
The exhibits required by this Item are listed under Item 15 (a) (3).
56
ITEM 16. FORM 10-K SUMMARY
Not applicable
SIGNATURES
Pursuant to the requirements of Section 13 or 15(d) of the Securities Exchange Act of 1934, the registrant has duly caused this report on Form 10-K to be signed on its behalf by the undersigned, thereunto duly authorized on this 28th day of February 2017.
SINCLAIR BROADCAST GROUP, INC. | ||
By: | /s/ Christopher S. Ripley | |
Christopher S. Ripley | ||
Chief Executive Officer | ||
POWER OF ATTORNEY
KNOW ALL MEN BY THESE PRESENTS, that each person whose signature appears below under the heading “Signature” constitutes and appoints Christopher S. Ripley as his true and lawful attorney-in-fact each acting alone, with full power of substitution and resubstitution, for him and in his name, place and stead in any and all capacities to sign any or all amendments to this 10-K and to file the same, with all exhibits thereto, and other documents in connection therewith, with the SEC, granting unto said attorney-in-fact full power and authority to do and perform each and every act and thing requisite and necessary to be done in and about the premises, as fully for all intents and purposes as he might or could do in person, hereby ratifying and confirming all that said attorney-in-fact, or their substitutes, each acting alone, may lawfully do or cause to be done in virtue hereof.
Pursuant to the requirements of the Securities Exchange Act of 1934, this report has been signed below by the following persons on behalf of the registrant and in the capacities and on the dates indicated.
57
Signature | Title | Date | ||
/s/ Christopher S. Ripley | President and Chief Executive Officer | |||
Christopher S. Ripley | February 28, 2017 | |||
/s/ Lucy A. Rutishauser | Chief Financial Officer | |||
Lucy A. Rutishauser | February 28, 2017 | |||
/s/ David R. Bochenek | Senior Vice President and | |||
David R. Bochenek | Chief Accounting Officer | February 28, 2017 | ||
/s/ David D. Smith | Chairman of the Board and Executive Chairman | |||
David D. Smith | February 28, 2017 | |||
/s/ Frederick G. Smith | ||||
Frederick G. Smith | Director | February 28, 2017 | ||
/s/ J. Duncan Smith | ||||
J. Duncan Smith | Director | February 28, 2017 | ||
/s/ Robert E. Smith | ||||
Robert E. Smith | Director | February 28, 2017 | ||
/s/ Lawrence E. McCanna | ||||
Lawrence E. McCanna | Director | February 28, 2017 | ||
/s/ Daniel C. Keith | ||||
Daniel C. Keith | Director | February 28, 2017 | ||
/s/ Martin R. Leader | ||||
Martin R. Leader | Director | February 28, 2017 | ||
/s/ Howard E. Friedman | ||||
Howard E. Friedman | Director | February 28, 2017 | ||
58
SINCLAIR BROADCAST GROUP, INC.
INDEX TO FINANCIAL STATEMENTS
Page | |
F-1
Report of Independent Registered Public Accounting Firm
To the Board of Directors and Shareholders of Sinclair Broadcast Group, Inc.:
In our opinion, the accompanying consolidated balance sheets and the related consolidated statements of operations, of comprehensive income, of equity (deficit), and of cash flows present fairly, in all material respects, the financial position of Sinclair Broadcast Group, Inc. and its subsidiaries (the Company) at December 31, 2016 and December 31, 2015, and the results of their operations and their cash flows for each of the three years in the period ended December 31, 2016 in conformity with accounting principles generally accepted in the United States of America. Also in our opinion, the Company maintained, in all material respects, effective internal control over financial reporting as of December 31, 2016, based on criteria established in Internal Control - Integrated Framework (2013) issued by the Committee of Sponsoring Organizations of the Treadway Commission (COSO). The Company's management is responsible for these financial statements, for maintaining effective internal control over financial reporting and for its assessment of the effectiveness of internal control over financial reporting, included in the Report of Management on Internal Control over Financial Reporting appearing under Item 9A. Our responsibility is to express opinions on these financial statements and on the Company's internal control over financial reporting based on our integrated audits. We conducted our audits in accordance with the standards of the Public Company Accounting Oversight Board (United States). Those standards require that we plan and perform the audits to obtain reasonable assurance about whether the financial statements are free of material misstatement and whether effective internal control over financial reporting was maintained in all material respects. Our audits of the financial statements included examining, on a test basis, evidence supporting the amounts and disclosures in the financial statements, assessing the accounting principles used and significant estimates made by management, and evaluating the overall financial statement presentation. Our audit of internal control over financial reporting included obtaining an understanding of internal control over financial reporting, assessing the risk that a material weakness exists, and testing and evaluating the design and operating effectiveness of internal control based on the assessed risk. Our audits also included performing such other procedures as we considered necessary in the circumstances. We believe that our audits provide a reasonable basis for our opinions.
A company’s internal control over financial reporting is a process designed to provide reasonable assurance regarding the reliability of financial reporting and the preparation of financial statements for external purposes in accordance with generally accepted accounting principles. A company’s internal control over financial reporting includes those policies and procedures that (i) pertain to the maintenance of records that, in reasonable detail, accurately and fairly reflect the transactions and dispositions of the assets of the company; (ii) provide reasonable assurance that transactions are recorded as necessary to permit preparation of financial statements in accordance with generally accepted accounting principles, and that receipts and expenditures of the company are being made only in accordance with authorizations of management and directors of the company; and (iii) provide reasonable assurance regarding prevention or timely detection of unauthorized acquisition, use, or disposition of the company’s assets that could have a material effect on the financial statements. Because of its inherent limitations, internal control over financial reporting may not prevent or detect misstatements. Also, projections of any evaluation of effectiveness to future periods are subject to the risk that controls may become inadequate because of changes in conditions, or that the degree of compliance with the policies or procedures may deteriorate.
As described in the Report of Management on Internal Control over Financial Reporting appearing under Item 9A, management has excluded the Tennis Channel and certain television stations (KUQI, KTOV, KXPX, WTVH, WSBT, KHGI, KWNB, KFXL, KJZZ and WSJV) from its assessment of internal control over financial reporting as of December 31, 2016 because they were acquired by the Company in purchase business combinations during 2016. We have also excluded the Tennis Channel and these television stations (KUQI, KTOV, KXPX, WTVH, WSBT, KHGI, KWNB, KFXL, KJZZ and WSJV) from our audit of internal control over financial reporting. The Tennis Channel and these television stations (KUQI, KTOV, KXPX, WTVH, WSBT, KHGI, KWNB, KFXL, KJZZ and WSJV) are wholly-owned subsidiaries whose total assets and total revenues represent 8% and 5%, respectively, of the related consolidated financial statement amounts as of and for the year ended December 31, 2016.
/s/ PricewaterhouseCoopers LLP
Baltimore, Maryland
February 28, 2017
F-2
SINCLAIR BROADCAST GROUP, INC.
CONSOLIDATED BALANCE SHEETS
(In thousands, except share and per share data)
As of December 31, | |||||||
2016 | 2015 | ||||||
ASSETS | |||||||
CURRENT ASSETS: | |||||||
Cash and cash equivalents | $ | 259,984 | $ | 149,972 | |||
Accounts receivable, net of allowance for doubtful accounts of $2,124 and $4,495, respectively | 513,954 | 424,608 | |||||
Current portion of program contract costs | 83,601 | 91,466 | |||||
Income taxes receivable | 5,500 | 823 | |||||
Prepaid expenses and other current assets | 36,267 | 26,903 | |||||
Deferred barter costs | 5,782 | 7,991 | |||||
Total current assets | 905,088 | 701,763 | |||||
PROGRAM CONTRACT COSTS, less current portion | 8,919 | 18,996 | |||||
PROPERTY AND EQUIPMENT, net | 717,576 | 717,137 | |||||
RESTRICTED CASH | — | 3,725 | |||||
GOODWILL | 1,990,746 | 1,931,093 | |||||
INDEFINITE-LIVED INTANGIBLE ASSETS | 156,306 | 132,465 | |||||
DEFINITE-LIVED INTANGIBLE ASSETS, net | 1,944,403 | 1,751,570 | |||||
NOTES RECEIVABLE FROM AFFILIATES | 19,500 | — | |||||
OTHER ASSETS | 220,630 | 175,566 | |||||
Total assets (a) | $ | 5,963,168 | $ | 5,432,315 | |||
LIABILITIES AND EQUITY | |||||||
CURRENT LIABILITIES: | |||||||
Accounts payable and accrued liabilities | $ | 322,505 | $ | 251,313 | |||
Income taxes payable | 23,491 | — | |||||
Current portion of notes payable, capital leases and commercial bank financing | 171,131 | 164,184 | |||||
Current portion of notes payable and capital leases payable to affiliates | 3,604 | 3,166 | |||||
Current portion of program contracts payable | 109,702 | 108,260 | |||||
Deferred barter revenues | 6,040 | 8,080 | |||||
Total current liabilities | 636,473 | 535,003 | |||||
LONG-TERM LIABILITIES: | |||||||
Notes payable, capital leases and commercial bank financing, less current portion | 4,014,932 | 3,669,160 | |||||
Notes payable and capital leases to affiliates, less current portion | 14,181 | 17,850 | |||||
Program contracts payable, less current portion | 53,836 | 56,921 | |||||
Deferred tax liabilities | 609,317 | 585,072 | |||||
Other long-term liabilities | 76,493 | 68,631 | |||||
Total liabilities (a) | 5,405,232 | 4,932,637 | |||||
COMMITMENTS AND CONTINGENCIES (See Note 10) | |||||||
EQUITY: | |||||||
SINCLAIR BROADCAST GROUP SHAREHOLDERS’ EQUITY: | |||||||
Class A Common Stock, $.01 par value, 500,000,000 shares authorized, 64,558,207 and 68,792,483 shares issued and outstanding, respectively | 646 | 688 | |||||
Class B Common Stock, $.01 par value, 140,000,000 shares authorized, 25,670,684 and 25,928,357 shares issued and outstanding, respectively, convertible into Class A Common Stock | 257 | 259 | |||||
Additional paid-in capital | 843,691 | 962,726 | |||||
Accumulated deficit | (255,804 | ) | (437,029 | ) | |||
Accumulated other comprehensive loss | (807 | ) | (834 | ) | |||
Total Sinclair Broadcast Group shareholders’ equity | 587,983 | 525,810 | |||||
Noncontrolling interests | (30,047 | ) | (26,132 | ) | |||
Total equity | 557,936 | 499,678 | |||||
Total liabilities and equity | $ | 5,963,168 | $ | 5,432,315 | |||
The accompanying notes are an integral part of these consolidated financial statements.
_____________________________________________________
(a) Our consolidated total assets as of December 31, 2016 and 2015 include total assets of variable interest entities (VIEs) of $142.3 million and $152.4 million, respectively, which can only be used to settle the obligations of the VIEs. Our consolidated total liabilities as of December 31,
F-3
2016 and 2015 include total liabilities of the VIEs of $40.9 million and $35.6 million, respectively, for which the creditors of the VIEs have no recourse to us. See Note 1. Nature of Operations and Summary of Significant Accounting Policies.
F-4
SINCLAIR BROADCAST GROUP, INC.
CONSOLIDATED STATEMENTS OF OPERATIONS
FOR THE YEARS ENDED DECEMBER 31, 2016, 2015 AND 2014
(In thousands, except per share data)
2016 | 2015 | 2014 | |||||||||
REVENUES: | |||||||||||
Media revenues | $ | 2,499,549 | $ | 2,011,946 | $ | 1,784,641 | |||||
Revenues realized from station barter arrangements | 135,566 | 111,337 | 122,262 | ||||||||
Other non-media revenues | 101,834 | 95,853 | 69,655 | ||||||||
Total revenues | 2,736,949 | 2,219,136 | 1,976,558 | ||||||||
OPERATING EXPENSES: | |||||||||||
Media production expenses | 953,089 | 733,199 | 578,687 | ||||||||
Media selling, general and administrative expenses | 501,589 | 431,728 | 372,220 | ||||||||
Expenses recognized from station barter arrangements | 116,954 | 93,204 | 107,716 | ||||||||
Amortization of program contract costs and net realizable value adjustments | 127,880 | 124,619 | 106,629 | ||||||||
Other non-media expenses | 80,648 | 71,803 | 55,615 | ||||||||
Depreciation of property and equipment | 98,529 | 103,433 | 103,291 | ||||||||
Corporate general and administrative expenses | 73,556 | 64,246 | 62,495 | ||||||||
Amortization of definite-lived intangible and other assets | 183,795 | 161,454 | 125,496 | ||||||||
Research and development expenses | 4,085 | 12,436 | 6,918 | ||||||||
(Gain) loss on asset dispositions | (6,029 | ) | 278 | (37,160 | ) | ||||||
Total operating expenses | 2,134,096 | 1,796,400 | 1,481,907 | ||||||||
Operating income | 602,853 | 422,736 | 494,651 | ||||||||
OTHER INCOME (EXPENSE): | |||||||||||
Interest expense and amortization of debt discount and deferred financing costs | (211,143 | ) | (191,447 | ) | (174,862 | ) | |||||
Loss from extinguishment of debt | (23,699 | ) | — | (14,553 | ) | ||||||
Income from equity and cost method investments | 1,735 | 964 | 2,313 | ||||||||
Other income, net | 3,144 | 1,540 | 4,998 | ||||||||
Total other expense | (229,963 | ) | (188,943 | ) | (182,104 | ) | |||||
Income before income taxes | 372,890 | 233,793 | 312,547 | ||||||||
INCOME TAX PROVISION | (122,128 | ) | (57,694 | ) | (97,432 | ) | |||||
NET INCOME | 250,762 | 176,099 | 215,115 | ||||||||
Net income attributable to the noncontrolling interests | (5,461 | ) | (4,575 | ) | (2,836 | ) | |||||
NET INCOME ATTRIBUTABLE TO SINCLAIR BROADCAST GROUP | $ | 245,301 | $ | 171,524 | $ | 212,279 | |||||
Dividends declared per share | $ | 0.71 | $ | 0.66 | $ | 0.63 | |||||
EARNINGS PER COMMON SHARE ATTRIBUTABLE TO SINCLAIR BROADCAST GROUP: | |||||||||||
Basic earnings per share | $ | 2.62 | $ | 1.81 | $ | 2.19 | |||||
Diluted earnings per share | $ | 2.60 | $ | 1.79 | $ | 2.17 | |||||
Weighted average common shares outstanding | 93,567 | 95,003 | 97,114 | ||||||||
Weighted average common and common equivalent shares outstanding | 94,433 | 95,728 | 97,819 | ||||||||
The accompanying notes are an integral part of these consolidated financial statements.
F-5
SINCLAIR BROADCAST GROUP, INC.
CONSOLIDATED STATEMENTS OF COMPREHENSIVE INCOME
FOR THE YEARS ENDED DECEMBER 31, 2016, 2015 AND 2014
(In thousands)
2016 | 2015 | 2014 | |||||||||
Net income | $ | 250,762 | $ | 176,099 | $ | 215,115 | |||||
Amortization of net periodic pension benefit costs, net of taxes | — | 190 | 173 | ||||||||
Adjustments to pension obligations, net of taxes | 27 | 621 | (3,814 | ) | |||||||
Pension settlement | — | 4,810 | — | ||||||||
Unrealized gain on investments, net of taxes | — | — | 285 | ||||||||
Comprehensive income | 250,789 | 181,720 | 211,759 | ||||||||
Comprehensive income attributable to the noncontrolling interests | (5,461 | ) | (4,575 | ) | (2,836 | ) | |||||
Comprehensive income attributable to Sinclair Broadcast Group | $ | 245,328 | $ | 177,145 | $ | 208,923 | |||||
The accompanying notes are an integral part of these consolidated financial statements
F-6
SINCLAIR BROADCAST GROUP, INC.
CONSOLIDATED STATEMENTS OF EQUITY (DEFICIT)
FOR THE YEARS ENDED DECEMBER 31, 2016, 2015 AND 2014
(In thousands, except share data)
Sinclair Broadcast Group Shareholders | |||||||||||||||||||||||||||||||||
Class A Common Stock | Class B Common Stock | Additional Paid-In Capital | Accumulated Deficit | Accumulated Other Comprehensive Loss | Noncontrolling Interests | Total Equity (Deficit) | |||||||||||||||||||||||||||
Shares | Values | Shares | Values | ||||||||||||||||||||||||||||||
BALANCE, December 31, 2013 | 74,145,569 | $ | 741 | 26,028,357 | $ | 260 | $ | 1,094,918 | $ | (696,996 | ) | $ | (2,553 | ) | $ | 9,334 | $ | 405,704 | |||||||||||||||
Dividends declared on Class A and Class B Common Stock | — | — | — | — | — | (61,103 | ) | — | — | (61,103 | ) | ||||||||||||||||||||||
Class B Common Stock converted into Class A Common Stock | 100,000 | 1 | (100,000 | ) | (1 | ) | — | — | — | — | — | ||||||||||||||||||||||
Repurchases of Class A Common Stock | (4,876,121 | ) | (48 | ) | — | — | (133,109 | ) | — | — | — | (133,157 | ) | ||||||||||||||||||||
Class A Common Stock issued pursuant to employee benefit plans | 209,451 | 2 | — | — | 11,510 | — | — | — | 11,512 | ||||||||||||||||||||||||
Tax benefit on share based awards | — | — | — | — | 1,365 | — | — | — | 1,365 | ||||||||||||||||||||||||
Distributions to noncontrolling interests | — | — | — | — | — | — | — | (6,936 | ) | (6,936 | ) | ||||||||||||||||||||||
Deconsolidation of variable interest entity | — | — | — | — | 4,518 | — | (546 | ) | (27,773 | ) | (23,801 | ) | |||||||||||||||||||||
Other comprehensive income | — | — | — | — | — | — | (3,356 | ) | — | (3,356 | ) | ||||||||||||||||||||||
Net income | — | — | — | — | — | 212,279 | — | 2,836 | 215,115 | ||||||||||||||||||||||||
BALANCE, December 31, 2014 | 69,578,899 | $ | 696 | 25,928,357 | $ | 259 | $ | 979,202 | $ | (545,820 | ) | $ | (6,455 | ) | $ | (22,539 | ) | $ | 405,343 | ||||||||||||||
The accompanying notes are an integral part of these consolidated financial statements.
F-7
SINCLAIR BROADCAST GROUP, INC.
CONSOLIDATED STATEMENTS OF EQUITY
FOR THE YEARS ENDED DECEMBER 31, 2016, 2015 AND 2014
(In thousands, except share data)
Sinclair Broadcast Group Shareholders | |||||||||||||||||||||||||||||||||
Class A Common Stock | Class B Common Stock | Additional Paid-In Capital | Accumulated Deficit | Accumulated Other Comprehensive Loss | Noncontrolling Interests | Total Equity | |||||||||||||||||||||||||||
Shares | Values | Shares | Values | ||||||||||||||||||||||||||||||
BALANCE, December 31, 2014 | 69,578,899 | $ | 696 | 25,928,357 | $ | 259 | $ | 979,202 | $ | (545,820 | ) | $ | (6,455 | ) | $ | (22,539 | ) | $ | 405,343 | ||||||||||||||
Dividends declared and paid on Class A and Class B Common Stock | — | — | — | — | — | (62,733 | ) | — | — | (62,733 | ) | ||||||||||||||||||||||
Repurchases of Class A Common Stock | (1,107,887 | ) | (11 | ) | — | — | (28,812 | ) | — | — | — | (28,823 | ) | ||||||||||||||||||||
Class A Common Stock issued pursuant to employee benefit plans | 321,471 | 3 | — | — | 11,624 | — | — | — | 11,627 | ||||||||||||||||||||||||
Tax benefit on share based awards | — | — | — | — | 712 | — | — | — | 712 | ||||||||||||||||||||||||
Distributions to noncontrolling interests | — | — | — | — | — | — | — | (9,918 | ) | (9,918 | ) | ||||||||||||||||||||||
Issuance of subsidiary stock awards | — | — | — | — | — | — | — | 1,750 | 1,750 | ||||||||||||||||||||||||
Other comprehensive income | — | — | — | — | — | — | 5,621 | — | 5,621 | ||||||||||||||||||||||||
Net income | — | — | — | — | — | 171,524 | — | 4,575 | 176,099 | ||||||||||||||||||||||||
BALANCE, December 31, 2015 | 68,792,483 | $ | 688 | 25,928,357 | $ | 259 | $ | 962,726 | $ | (437,029 | ) | $ | (834 | ) | $ | (26,132 | ) | $ | 499,678 | ||||||||||||||
The accompanying notes are an integral part of these consolidated financial statements.
F-8
SINCLAIR BROADCAST GROUP, INC.
CONSOLIDATED STATEMENTS OF EQUITY
FOR THE YEARS ENDED DECEMBER 31, 2016, 2015 AND 2014
(In thousands, except share data)
Sinclair Broadcast Group Shareholders | |||||||||||||||||||||||||||||||||
Class A Common Stock | Class B Common Stock | Additional Paid-In Capital | Accumulated Deficit | Accumulated Other Comprehensive Loss | Noncontrolling Interests | Total Equity | |||||||||||||||||||||||||||
Shares | Values | Shares | Values | ||||||||||||||||||||||||||||||
BALANCE, December 31, 2015 | 68,792,483 | $ | 688 | 25,928,357 | $ | 259 | $ | 962,726 | $ | (437,029 | ) | $ | (834 | ) | $ | (26,132 | ) | $ | 499,678 | ||||||||||||||
Cumulative effect of adoption of new accounting standard | — | — | — | — | 431 | 1,833 | — | — | 2,264 | ||||||||||||||||||||||||
Dividends declared and paid on Class A and Class B Common Stock | — | — | — | — | — | (65,909 | ) | — | — | (65,909 | ) | ||||||||||||||||||||||
Class B Common Stock converted into Class A Common Stock | 257,673 | 2 | (257,673 | ) | (2 | ) | — | — | — | — | — | ||||||||||||||||||||||
Repurchases of Class A Common Stock | (4,892,461 | ) | (48 | ) | — | — | (136,235 | ) | — | — | — | (136,283 | ) | ||||||||||||||||||||
Class A Common Stock issued pursuant to employee benefit plans | 400,512 | 4 | — | — | 16,769 | — | — | — | 16,773 | ||||||||||||||||||||||||
Distributions to noncontrolling interests, net | — | — | — | — | — | — | — | (10,722 | ) | (10,722 | ) | ||||||||||||||||||||||
Issuance of subsidiary stock awards | — | — | — | — | — | — | — | 1,346 | 1,346 | ||||||||||||||||||||||||
Other comprehensive income | — | — | — | — | — | — | 27 | — | 27 | ||||||||||||||||||||||||
Net income | — | — | — | — | — | 245,301 | — | 5,461 | 250,762 | ||||||||||||||||||||||||
BALANCE, December 31, 2016 | 64,558,207 | $ | 646 | 25,670,684 | $ | 257 | $ | 843,691 | $ | (255,804 | ) | $ | (807 | ) | $ | (30,047 | ) | $ | 557,936 | ||||||||||||||
The accompanying notes are an integral part of these consolidated financial statements.
F-9
SINCLAIR BROADCAST GROUP, INC.
CONSOLIDATED STATEMENTS OF CASH FLOWS
FOR THE YEARS ENDED DECEMBER 31, 2016, 2015 AND 2014
(In thousands)
2016 | 2015 | 2014 | |||||||||
CASH FLOWS FROM OPERATING ACTIVITIES: | |||||||||||
Net income | $ | 250,762 | $ | 176,099 | $ | 215,115 | |||||
Adjustments to reconcile net income to net cash flows from operating activities: | |||||||||||
Depreciation of property and equipment | 98,529 | 103,433 | 103,291 | ||||||||
Amortization of definite-lived intangible assets | 183,795 | 161,454 | 125,496 | ||||||||
Amortization of program contract costs and net realizable value adjustments | 127,880 | 124,619 | 106,629 | ||||||||
Loss on extinguishment of debt, non-cash portion | 3,875 | — | 4,605 | ||||||||
Stock-based compensation | 16,939 | 18,315 | 14,296 | ||||||||
Deferred tax (benefit) provision | 6,118 | (28,446 | ) | (818 | ) | ||||||
(Gain) loss on the sale of assets | (6,029 | ) | 278 | (37,160 | ) | ||||||
Changes in assets and liabilities, net of effects of acquisitions and dispositions: | |||||||||||
Increase in accounts receivable | (71,718 | ) | (38,666 | ) | (44,253 | ) | |||||
Net change in net income taxes payable/receivable | 18,814 | 3,203 | 8,253 | ||||||||
Increase in prepaid expenses and other current assets | (969 | ) | (3,474 | ) | (2,215 | ) | |||||
Increase (decrease) in accounts payable and accrued liabilities | 60,086 | (15,902 | ) | 55,457 | |||||||
Payments on program contracts payable | (111,506 | ) | (109,057 | ) | (93,682 | ) | |||||
Real estate held for development and sale | 1,075 | (2,674 | ) | (20,683 | ) | ||||||
Other, net | 14,115 | 13,745 | (1,732 | ) | |||||||
Net cash flows from operating activities | 591,766 | 402,927 | 432,599 | ||||||||
CASH FLOWS USED IN INVESTING ACTIVITIES: | |||||||||||
Acquisition of property and equipment | (94,465 | ) | (91,421 | ) | (81,458 | ) | |||||
Acquisition of businesses, net of cash acquired | (425,857 | ) | (17,011 | ) | (1,485,039 | ) | |||||
Proceeds from the sale of assets | 16,396 | 23,650 | 176,675 | ||||||||
Purchase of alarm monitoring contracts | (40,206 | ) | (39,185 | ) | (27,701 | ) | |||||
Decrease (increase) in restricted cash | 3,725 | (3,725 | ) | 11,616 | |||||||
Investments in equity and cost method investees | (51,247 | ) | (44,715 | ) | (8,104 | ) | |||||
Proceeds from termination of life insurance policies | — | — | 17,042 | ||||||||
Distributions from equity and cost method investees | 6,786 | 21,749 | 3,869 | ||||||||
Loans to affiliates | (19,500 | ) | — | — | |||||||
Other, net | (1,635 | ) | (653 | ) | (4,256 | ) | |||||
Net cash flow used in investing activities | (606,003 | ) | (151,311 | ) | (1,397,356 | ) | |||||
CASH FLOWS FROM (USED IN) FINANCING ACTIVITIES: | |||||||||||
Proceeds from notes payable, commercial bank financing and capital leases | 1,024,912 | 382,887 | 1,500,720 | ||||||||
Repayments of notes payable, commercial bank financing and capital leases | (671,215 | ) | (395,147 | ) | (582,764 | ) | |||||
Repurchase of outstanding Class A Common Stock | (136,283 | ) | (28,823 | ) | (133,157 | ) | |||||
Dividends paid on Class A and Class B Common Stock | (65,909 | ) | (62,733 | ) | (61,103 | ) | |||||
Payments for deferred financing costs | (15,681 | ) | (3,847 | ) | (16,590 | ) | |||||
Noncontrolling interests distributions | (10,464 | ) | (9,918 | ) | (8,184 | ) | |||||
Other, net | (1,111 | ) | (1,745 | ) | 3,413 | ||||||
Net cash flows from (used in) financing activities | 124,249 | (119,326 | ) | 702,335 | |||||||
NET INCREASE (DECREASE) IN CASH AND CASH EQUIVALENTS | 110,012 | 132,290 | (262,422 | ) | |||||||
CASH AND CASH EQUIVALENTS, beginning of year | 149,972 | 17,682 | 280,104 | ||||||||
CASH AND CASH EQUIVALENTS, end of year | $ | 259,984 | $ | 149,972 | $ | 17,682 | |||||
The accompanying notes are an integral part of these consolidated financial statements.
F-10
SINCLAIR BROADCAST GROUP, INC.
NOTES TO THE CONSOLIDATED FINANCIAL STATEMENTS
1. NATURE OF OPERATIONS AND SUMMARY OF SIGNIFICANT ACCOUNTING POLICIES:
Nature of Operations
Sinclair Broadcast Group, Inc. is a diversified television broadcasting company with national reach with a strong focus on providing high-quality content on our local television stations and digital platforms. The content, distributed through our broadcast platform, consists of programming provided by third-party networks and syndicators, local news, and other original programming produced by us. We also distribute our original programming, and owned and operated network affiliates, on other third-party platforms. Additionally, we own digital media products that are complementary to our extensive portfolio of television station related digital properties. We focus on offering marketing solutions to advertisers through our television and digital platforms and digital agency services. Outside of our media related businesses, we operate technical services companies focused on supply and maintenance of broadcast transmission systems as well as research and development for the advancement of broadcast technology, and we manage other non-media related investments.
As of December 31, 2016, our broadcast distribution platform is a single reportable segment for accounting purposes. It consists primarily of our broadcast television stations, which we own, provide programming and operating services pursuant to agreements commonly referred to as local marketing agreements (LMAs), or provide sales services and other non-programming operating services pursuant to other outsourcing agreements (such as joint sales agreements (JSAs) and shared services agreements (SSAs)) to 173 stations in 81 markets. These stations broadcast 483 channels as of December 31, 2016. For the purpose of this report, these 173 stations and 483 channels are referred to as “our” stations and channels.
Principles of Consolidation
The consolidated financial statements include our accounts and those of our wholly-owned and majority-owned subsidiaries and variable interest entities (VIEs) for which we are the primary beneficiary. Noncontrolling interest represents a minority owner’s proportionate share of the equity in certain of our consolidated entities. All intercompany transactions and account balances have been eliminated in consolidation.
Variable Interest Entities
In determining whether we are the primary beneficiary of a VIE for financial reporting purposes, we consider whether we have the power to direct the activities of the VIE that most significantly impact the economic performance of the VIE and whether we have the obligation to absorb losses or the right to receive returns that would be significant to the VIE. We consolidate VIEs when we are the primary beneficiary. The assets of each of our consolidated VIEs can only be used to settle the obligations of the VIE. All the liabilities are non-recourse to us except for certain debt of VIEs which we guarantee.
Third-party station licensees. Certain of our stations provide services to other station owners within the same respective market, such as LMAs, where we provide programming, sales, operational and administrative services, and JSAs and SSAs, where we provide non-programming, sales, operational and administrative services. In certain cases, we have also entered into purchase agreements or options to purchase, the license related assets of the licensee. We typically own the majority of the non-license assets of the stations and in some cases where the licensee acquired the license assets concurrent with our acquisition of the non-license assets of the station, we have provided guarantees to the bank for the licensee’s acquisition financing. The terms of the agreements vary, but generally have initial terms of over five years with several optional renewal terms. As of December 31, 2016 and 2015, we have concluded that 37 of these licensees are VIEs, respectively. Based on the terms of the agreements and the significance of our investment in the stations, we are the primary beneficiary of the variable interests because, subject to the ultimate control of the licensees, we have the power to direct the activities which significantly impact the economic performance of the VIE through the services we provide and because we absorb losses and returns that would be considered significant to the VIEs. Several of these VIEs are owned by a related party, Cunningham Broadcasting Corporation (Cunningham). See Note 11. Related Person Transactions for more information about the arrangements with Cunningham. The net revenues of the stations which we consolidate were $310.4 million, $284.4 million and $286.3 million for the years ended December 31, 2016, 2015, and 2014, respectively. The fees paid between us and the licensees pursuant to these arrangements are eliminated in consolidation. See Changes in the Rules of Television Ownership and Joint Sale Agreements within Note 10. Commitments and Contingencies for discussion of recent changes in FCC rules related to JSAs.
F-11
As of the dates indicated, the carrying amounts and classification of the assets and liabilities of the VIEs mentioned above which have been included in our consolidated balance sheets as of December 31, 2016 and 2015 were as follows (in thousands):
2016 | 2015 | ||||||
ASSETS | |||||||
CURRENT ASSETS: | |||||||
Accounts receivable | $ | 21,879 | $ | 21,719 | |||
Other current assets | 12,076 | 14,108 | |||||
Total current asset | 33,955 | 35,827 | |||||
PROGRAM CONTRACT COSTS, less current portion | 2,468 | 4,541 | |||||
PROPERTY AND EQUIPMENT, net | 2,996 | 7,609 | |||||
GOODWILL | 791 | 787 | |||||
INDEFINITE-LIVED INTANGIBLE ASSETS | 15,684 | 17,599 | |||||
DEFINITE-LIVED INTANGIBLE ASSETS, net | 79,509 | 79,086 | |||||
OTHER ASSETS | 6,871 | 6,924 | |||||
Total assets | $ | 142,274 | $ | 152,373 | |||
LIABILITIES | |||||||
CURRENT LIABILITIES: | |||||||
Other current liabilities | 18,992 | 17,554 | |||||
LONG-TERM LIABILITIES: | |||||||
Notes payable, capital leases and commercial bank financing, less current portion | 19,449 | 24,594 | |||||
Program contracts payable, less current portion | 14,353 | 13,679 | |||||
Other long term liabilities | 12,921 | 8,067 | |||||
Total liabilities | $ | 65,715 | $ | 63,894 | |||
The amounts above represent the consolidated assets and liabilities of the VIEs described above, for which we are the primary beneficiary, and have been aggregated as they all relate to our broadcast business. Excluded from the amounts above are payments made to Cunningham under the LMA which are treated as a prepayment of the purchase price of the stations and capital leases between us and Cunningham which are eliminated in consolidation. The total payments made under these LMAs as of December 31, 2016 and 2015, which are excluded from liabilities above, were $40.8 million and $37.6 million, respectively. The total capital lease liabilities, net of capital lease assets, excluded from the above were $4.5 million, for both years ended December 31, 2016 and 2015. Also excluded from the amounts above are liabilities associated with the certain outsourcing agreements and purchase options with certain VIEs totaling $74.5 million and $72.5 million as of December 31, 2016 and December 31, 2015, respectively, as these amounts are eliminated in consolidation. The risk and reward characteristics of the VIEs are similar.
Other investments. We have investments in other real estate ventures and investment companies which are considered VIEs. However, we do not participate in the management of these entities including the day-to-day operating decisions or other decisions which would allow us to control the entity, and therefore, we are not considered the primary beneficiary of these VIEs. We account for these entities using the equity or cost method of accounting.
The carrying amounts of our investments in these VIEs for which we are not the primary beneficiary as of December 31, 2016 and 2015 was $117.0 million and $18.1 million, respectively, are included in other assets in the consolidated balance sheets. See Other Assets below for more information related to our equity and cost method investments. The increase in 2016 was due to the adoption of the revised accounting guidance during the first quarter of 2016 related to consolidation as discussed under Recent Accounting Pronouncements below, which resulted in additional investments being considered VIEs. Our maximum exposure is equal to the carrying value of our investments. The income and loss related to these investments are recorded in income from equity and cost method investments in the consolidated statement of operations. We recorded income of $2.5 million, $7.7 million and $2.2 million for the years ended December 31, 2016, 2015 and 2014, respectively, related to these investments.
F-12
Use of Estimates
The preparation of financial statements in accordance with accounting principles generally accepted in the United States of
America requires management to make estimates and assumptions that affect the reported amounts of assets, liabilities, revenues and expenses in the consolidated financial statements and in the disclosures of contingent assets and liabilities. Actual results could differ from those estimates.
Recent Accounting Pronouncements
In May 2014, the Financial Accounting Standards Board (FASB) issued guidance on revenue recognition for revenue from contracts with customers. This guidance requires an entity to recognize the amount of revenue to which it expects to be entitled for the transfer of promised goods or services to customers and will replace most existing revenue recognition guidance when it becomes effective. The new standard will be effective for annual reporting periods beginning after December 15, 2017. The standard permits the use of either the retrospective or cumulative effect transition method. Since ASU 2014-09 was issued, several additional ASUs have been issued and incorporated within ASC 606 to clarify various elements of the guidance. We do not currently believe that the adoption of this guidance will have a material impact on our station advertising or retransmission consent revenue; however, we have not finalized our assessment of the impact of this guidance on our consolidated financial statements.
In August 2014, the FASB issued guidance on disclosure of uncertainties about an entity’s ability to continue as a going concern. The new standard is effective for the annual period ending after December 15, 2016, and for annual periods and interim periods thereafter. We adopted this guidance beginning December 31, 2016, which involves adding policies and procedures around our assessments to continue as a going concern.
In February 2015, the FASB issued new guidance that amends the current consolidation guidance on the determination of whether an entity is a variable interest entity. The new standard is effective for the interim and annual periods beginning after December 15, 2015. We adopted this revised guidance on a modified retrospective basis during the three months ended March 31, 2016. As disclosed under Other investments under Variable Interest Entities above, the adoption of the revised guidance resulted in additional investments in real estate ventures and investment companies being considered VIEs, however we concluded that we were not the primary beneficiary of these investments. The revised guidance did not have any other impact on our consolidation conclusions.
In February 2016, the FASB issued new guidance related to accounting for leases, which requires the assets and liabilities that arise from leases to be recognized on the balance sheet. Currently only capital leases are recorded on the balance sheet. This update will require the lessee to recognize a lease liability equal to the present value of the lease payments and a right-of-use asset representing its right to use the underlying asset for the lease term for all leases longer than 12 months. For leases with a term of 12 months or less, a lessee is permitted to make an accounting policy election by class of underlying asset not to recognize lease assets and liabilities and recognize the lease expense for such leases generally on a straight-line basis over the lease term. This new guidance will be effective for fiscal periods beginning after December 15, 2018, including interim periods within that reporting period. Early adoption is permitted. We are currently evaluating the impact of this guidance on our consolidated financial statements.
In March 2016, the FASB issued new guidance that simplifies several aspects of the accounting for employee share-based payment transactions, including the accounting for income tax effects, forfeitures, the impact of employee income tax withholdings and classification of certain related items in the statement of cash flows. We early adopted this guidance effective January 1, 2016, which did not have a material effect on the consolidated financial statements. The adoption of the various changes in the guidance were applied as required by the guidance either on the prospective, modified retrospective, or full retrospective basis. As shown in the consolidated statement of stockholders' equity, upon adoption, we recorded a $0.4 million increase to additional paid in capital and a $1.8 million decrease in accumulated deficit, net of taxes, to record the cumulative effect of changing the classification of certain liability awards to equity classification. Additionally, for the years ended December 31, 2015 and 2014, we reclassified $2.2 million and $2.1 million, respectively from net cash flows from operating activities to net cash flows from financing activities in our consolidated statement of cash flows related to cash payments made to taxing authorities on certain employees' behalf for shares withheld.
In August 2016, the FASB issued new guidance related to the classification of certain cash receipts and cash payments. The new standard, which includes eight specific cash flow issues with the objective of reducing the existing diversity in practice as to how cash receipts and cash payments are represented in the statement of cash flow. The new standard is effective for fiscal year beginning after December 15, 2017, including the interim periods within that reporting period. Early adoption is permitted. We are currently evaluating the impact of this guidance on our consolidated financial statements.
F-13
In October 2016, the FASB issued new guidance related to the accounting for income tax consequences of intra-entity transfers of assets other than inventory. Currently the recognition of current and deferred income taxes for an intra-entity are prohibited until the asset has been sold to an outside party. This update requires an entity to recognize the income tax consequences of an intra-entity transfer of an asset other than inventory when the transfer occurs. We are currently evaluating the impact of this guidance on our consolidated financial statements.
In October 2016, the FASB issued new guidance which relates to related party considerations in the variable interest entities assessment. The new standard is effective for the interim and annual periods beginning after December 15, 2017. We are currently evaluating the impact of the guidance on our consolidated financial statements.
In November 2016, FASB issued new guidance related to the classification and presentation of changes in restricted cash on the statement of cash flows. This new standard requires that a statement of cash flow explain change during the period in the total of cash, cash equivalents, and amounts generally described as restricted cash or restricted cash equivalents. Amounts generally described as restricted cash and restricted cash equivalents should be included with cash and cash equivalents when reconciling from period to period as shown on the cash flow. The new standard is effective for the fiscal year beginning after December 15, 2017, including the interim periods within that reporting period. Early adoption is permitted. We are currently evaluating the impact of this guidance on our consolidated financial statements.
In January 2017, the FASB issued guidance which clarifies the definition of a business with additional guidance to assist entities with evaluating whether transactions should be accounted for as acquisitions (or disposals) of assets or businesses. The new standard should be applied prospectively and is effective for the interim and annual periods beginnings after December 31, 2017. We are currently evaluating the impact of this guidance on our consolidated financial statements.
In January 2017, the FASB issued guidance which eliminates the requirement to calculate the implied fair value of goodwill to measure a goodwill impairment charge. The new standard should be applied prospectively and is effective for the interim and annual periods beginnings after December 31, 2019. Early adoption is permitted. We are currently evaluating the impact of this guidance on our consolidated financial statements.
Cash and Cash Equivalents
We consider all highly liquid investments with an original maturity of three months or less when purchased to be cash equivalents.
Restricted Cash
During 2015, we entered into certain definitive agreements to purchase certain stations, which required certain deposits to be made in escrow accounts. As of the year ended December 31, 2015, we had $3.7 million restricted cash held on our balance sheet.
Accounts Receivable
Management regularly reviews accounts receivable and determines an appropriate estimate for the allowance for doubtful accounts based upon the impact of economic conditions on the merchant’s ability to pay, past collection experience and such other factors which, in management’s judgment, deserve current recognition. In turn, a provision is charged against earnings in order to maintain the appropriate allowance level.
A rollforward of the allowance for doubtful accounts for the years ended December 31, 2016, 2015 and 2014 is as follows (in thousands):
2016 | 2015 | 2014 | |||||||||
Balance at beginning of period | $ | 4,495 | $ | 4,246 | $ | 3,379 | |||||
Charged to expense | 1,974 | 1,292 | 2,186 | ||||||||
Net write-offs | (4,345 | ) | (1,043 | ) | (1,319 | ) | |||||
Balance at end of period | $ | 2,124 | $ | 4,495 | $ | 4,246 | |||||
F-14
Programming
We have agreements with distributors for the rights to television programming over contract periods, which generally run from one to seven years. Contract payments are made in installments over terms that are generally equal to or shorter than the contract period. Pursuant to accounting guidance for the broadcasting industry, an asset and a liability for the rights acquired and obligations incurred under a license agreement are reported on the balance sheet where the cost of each program is known or reasonably determinable, the program material has been accepted by the licensee in accordance with the conditions of the license agreement and the program is available for its first showing or telecast. The portion of program contracts which becomes payable within one year is reflected as a current liability in the accompanying consolidated balance sheets.
The rights to this programming are reflected in the accompanying consolidated balance sheets at the lower of unamortized cost or estimated net realizable value. With the exception of one and two-year contracts, amortization of program contract costs is computed using an accelerated method. Program contract costs are amortized on a straight-line basis for one and two-year contracts. Program contract costs estimated by management to be amortized in the succeeding year are classified as current assets. Payments of program contract liabilities are typically made on a scheduled basis and are not affected by adjustments for amortization or estimated net realizable value.
Estimated net realizable values are based on management’s expectation of future advertising revenues, net of sales commissions, to be generated by the program material. We perform a net realizable value calculation quarterly for each of our program contract costs in accordance with the accounting guidance for the broadcasting industry. We utilize sales information to estimate the future revenue of each commitment and measure that amount against the commitment. If the estimated future revenue is less than the amount of the commitment, a loss is recorded in amortization of program contract costs and net realizable value adjustments in the consolidated statements of operations.
Barter Arrangements
Certain program contracts provide for the exchange of advertising airtime in lieu of cash payments for the rights to such programming. The revenues realized from station barter arrangements are recorded as the programs are aired at the estimated fair value of the advertising airtime given in exchange for the program rights. Program service arrangements are accounted for as station barter arrangements, however, network affiliation programming is excluded from these calculations. Revenues are recorded as revenues realized from station barter arrangements and the corresponding expenses are recorded as expenses recognized from station barter arrangements.
We broadcast certain customers’ advertising in exchange for equipment, merchandise and services. The estimated fair value of the equipment, merchandise or services received is recorded as deferred barter costs and the corresponding obligation to broadcast advertising is recorded as deferred barter revenues. The deferred barter costs are expensed or capitalized as they are used, consumed or received and are included in station production expenses and station selling, general and administrative expenses, as applicable. Deferred barter revenues are recognized as the related advertising is aired and are recorded in revenues realized from station barter arrangements.
Other Assets
Other assets as of December 31, 2016 and 2015 consisted of the following (in thousands):
2016 | 2015 | ||||||
Equity and cost method investments | $ | 168,572 | $ | 116,031 | |||
Unamortized costs related to debt issuances | 4,936 | 3,663 | |||||
Other | 47,122 | 55,872 | |||||
Total other assets | $ | 220,630 | $ | 175,566 | |||
We have equity and cost method investments primarily in private equity investments and real estate ventures. In the event that one or more of our investments are significant, we are required to disclose summarized financial information. For the years ended December 31, 2016, 2015 and 2014, none of our investments were significant individually or in the aggregate.
As of December 31, 2016 and 2015, our unfunded commitments related to private equity investment funds totaled $13.5 million and $22.1 million, respectively.
F-15
When factors indicate that there may be a decrease in value of an equity or cost method investment, we assess whether a loss in value has occurred related to the investment. If that loss is deemed to be other than temporary, an impairment loss is recorded accordingly. For any investments that indicate a potential impairment, we estimate the fair values of those investments using discounted cash flow models, unrelated third party valuations or industry comparables, based on the various facts available to us. For the year ended December 31, 2016, we recorded a $2.5 million impairment charge related to one real estate investment. For the year ended December 31, 2015, there were $6.0 million of impairment charges recorded. For the year ended December 31, 2014, no impairment charges were recorded. The impairments are recorded in the income (loss) from equity and cost method investments in our consolidated statement of operations.
Unamortized costs related to debt issuances represent costs related to our revolving credit facility. Unamortized costs related to our other debt issuances is recorded as a direct deduction from the carrying value of the debt recorded as liability. We amortize our deferred debt financing costs to interest expense over the term of the respective debt instruments using the effective interest method. Previously capitalized debt financing costs are recognized as a loss on extinguishment of debt if we determine that there has been a an extinguishment of the related debt.
Impairment of Goodwill, Intangibles and Other Long-Lived Assets
We evaluate our goodwill and indefinite lived intangible assets for impairment annually in the fourth quarter or more frequently, if events or changes in circumstances indicate that an impairment may exist. Our goodwill has been allocated to and is tested for impairment at the reporting unit level. A reporting unit is an operating segment or a component of an operating segment to the extent that the component constitutes a business for which discrete financial information is available regularly reviewed by segment management. Components of an operating segment with similar economic characteristics are aggregated when testing goodwill for impairment. Our indefinite-lived intangible assets consist primarily of our broadcast licenses and a trade name.
In the performance of our annual assessment of goodwill for impairment we have the option to qualitatively assess whether it is more likely than not a reporting unit has been impaired. As part of this qualitative assessment, for each reporting unit, we weigh the relative impact of factors that are specific to the reporting unit as well as industry and macroeconomic factors. The reporting unit specific factors that we consider include current and forecasted financial performance, the significance of the excess fair value over carrying value in prior quantitative assessments, and any changes to the reporting units’ net book value since the most recent impairment tests. We also consider whether there were any significant changes in the regulatory environment and business climate of the industry, and whether there were any negative pressures on growth rates and discount rates.
If we conclude that it is more likely than not that a reporting unit is impaired, or if we elect not to perform the optional qualitative assessment, we will apply the quantitative two-step impairment test. In the first step, we determine and compare the fair value of the reporting unit to the net book value of the reporting unit. We estimate the fair value of our reporting units utilizing a combination of a market based approach which considers earnings and cash flow multiples of comparable businesses and recent market transactions as well as an income approach involving the performance of a discounted cash flow analysis. Our discounted cash flow model is based on our judgment of future market conditions based on our internal forecast of future performance, as well as discount rates that are based on a number of factors including market interest rates, a weighted average cost of capital analysis, and includes adjustments for market risk and company specific risk. If the net book value of the reporting unit were to exceed the fair value, we would then perform the second step of the impairment test, which requires allocation of the reporting unit’s fair value to all of its assets and liabilities in a manner similar to a purchase price allocation, with any residual fair value being allocated to goodwill to determine the implied fair value. An impairment charge will be recognized only when the implied fair value of a reporting unit’s goodwill is less than its carrying amount.
For our annual impairment test for indefinite-lived intangible assets we have the option to perform a qualitative assessment to determine whether it is more likely than not that these assets are impaired. As part of this qualitative assessment we weigh the relative impact of factors that are specific to the indefinite-lived intangible assets as well as industry and macroeconomic factors that could affect the significant inputs used to determine the fair value of the assets. The market specific factors that we consider include recent market projections from both independent and internal sources for advertising revenue and operating costs, estimated normal market share and capital expenditures, as well as the significance of the excess fair value over carrying value in prior quantitative assessments. We also consider whether there were any significant changes in the regulatory environment and business climate of the industry, and whether there were any negative pressures on growth rates and discount rates. When evaluating our broadcast licenses for impairment, the qualitative assessment is done at the market level because the broadcast licenses within the market are complementary and together enhance the single broadcast license of each station. If we conclude that it is more likely than not that one of our broadcast licenses is impaired, we will perform a quantitative assessment by comparing the aggregate fair value of the broadcast licenses in the market to the respective carrying values. We estimate the fair values of our broadcast licenses using the Greenfield method which is an income approach. This method involves a discounted cash flow
F-16
model that incorporates several variables, including, but not limited to, market revenues and long term growth projections, estimated market share for the typical participant without a network affiliation and estimated profit margins based on market size and station type. The model also assumes outlays for capital expenditures, future terminal values, an effective tax rate assumption and a discount rate based on a number of factors including market interest rates, a weighted average cost of capital analysis based on the target capital structure for a television station, and includes adjustments for market risk and company specific risk. If the carrying amount of the broadcast licenses exceeds the fair value, then an impairment loss is recorded to the extent that the carrying value of the broadcast licenses exceeds the fair value.
We periodically evaluate our long-lived assets for impairment and continue to evaluate them as events or changes in circumstances indicate that the carrying amount of such assets may not be fully recoverable. We evaluate the recoverability of long-lived assets by measuring the carrying amount of the assets against the estimated undiscounted future cash flows associated with them. At the time that such evaluations indicate that the future undiscounted cash flows of certain long-lived assets are not sufficient to recover the carrying value of such assets, the assets are tested for impairment by comparing their estimated fair value to the carrying value. We typically estimate fair value using discounted cash flow models and appraisals. See Note 5. Goodwill, Indefinite-Lived Intangible Assets and Other Intangible Assets, for more information.
Accounts Payable and Accrued Liabilities
Accrued liabilities consisted of the following as of December 31, 2016 and 2015 (in thousands):
2016 | 2015 | ||||||
Compensation and employee health insurance | $ | 78,682 | $ | 65,364 | |||
Interest | 41,979 | 32,788 | |||||
Deferred revenue | 25,692 | 24,837 | |||||
Programming related obligations | 76,962 | 54,381 | |||||
Other accruals relating to operating expenses | 99,190 | 73,943 | |||||
Total accounts payable and accrued liabilities | $ | 322,505 | $ | 251,313 | |||
We expense these activities when incurred.
Income Taxes
We recognize deferred tax assets and liabilities based on the differences between the financial statement carrying amounts and the tax bases of assets and liabilities. We provide a valuation allowance for deferred tax assets if we determine that it is more likely than not that some or all of the deferred tax assets will not be realized. In evaluating our ability to realize net deferred tax assets, we consider all available evidence, both positive and negative, including our past operating results, tax planning strategies and forecasts of future taxable income. In considering these sources of taxable income, we must make certain judgments that are based on the plans and estimates used to manage our underlying businesses on a long-term basis. As of December 31, 2016 and 2015, a valuation allowance has been provided for deferred tax assets related to a substantial amount of our available state net operating loss carryforwards based on past operating results, expected timing of the reversals of existing temporary book/tax basis differences, alternative tax strategies and projected future taxable income. Future changes in operating and/or taxable income or other changes in facts and circumstances could significantly impact the ability to realize our deferred tax assets which could have a material effect on our consolidated financial statements.
Management periodically performs a comprehensive review of our tax positions and we record a liability for unrecognized tax benefits when such tax positions do not meet the “more-likely-than-not” threshold. Significant judgment is required in determining whether a tax position meets the “more-likely-than-not” threshold, and it is based on a variety of facts and circumstances, including interpretation of the relevant federal and state income tax codes, regulations, case law and other authoritative pronouncements. Based on this analysis, the status of ongoing audits and the expiration of applicable statute of limitations, liabilities are adjusted as necessary. The resolution of audits is unpredictable and could result in tax liabilities that are significantly higher or lower than for what we have provided. See Note 9. Income Taxes, for further discussion of accrued unrecognized tax benefits.
F-17
Supplemental Information — Statements of Cash Flows
During 2016, 2015 and 2014, we had the following cash transactions (in thousands):
2016 | 2015 | 2014 | |||||||||
Income taxes paid | $ | 108,347 | $ | 106,979 | $ | 100,986 | |||||
Income tax refunds | $ | 12,193 | $ | 196 | $ | 1,407 | |||||
Interest paid | $ | 191,117 | $ | 182,425 | $ | 157,349 | |||||
For the year ended December 31, 2016, non-cash investing activities include property and equipment purchases accrued as of December 31, 2016 of $5.9 million. For the year ended December 31, 2015, non-cash transactions related to capital lease obligations were $2.8 million. For the year ended December 31, 2014, non-cash conversion of the 4.875% Notes into Class A Common Stock was $8.6 million, net of taxes for the year ended December 31, 2014.
Revenue Recognition
Total revenues include: (i) station advertising revenue, net of agency commissions; (ii) barter advertising revenues; (iii) retransmission consent fees; (iv) network compensation; (v) other media revenues and (vi) revenues from our other businesses.
Advertising revenues, net of agency commissions, are recognized in the period during which advertisements are placed.
Some of our retransmission consent agreements contain both advertising and retransmission consent elements. We have determined that these retransmission consent agreements are revenue arrangements with multiple deliverables. Advertising and retransmission consent deliverables sold under our agreements are separated into different units of accounting at fair value. Revenue applicable to the advertising element of the arrangement is recognized similar to the advertising revenue policy noted above. Revenue applicable to the retransmission consent element of the arrangement is recognized over the life of the agreement.
Network compensation revenue is recognized over the term of the contract. All other significant revenues are recognized as services are provided.
Share Repurchase Program
On March 20, 2014, the Board of Directors approved an $150.0 million share repurchase authorization. On September 6, 2016 the Board of Directors approved an additional $150.0 million share repurchase authorization. There is no expiration date and currently, management has no plans to terminate this program. For the year ended December 31, 2016, we have repurchased approximately 4.9 million shares of Class A Common Stock for $136.4 million. As of December 31, 2016, the total remaining repurchase authorization was $119.1 million.
Advertising Expenses
Promotional advertising expenses are recorded in the period when incurred and are included in media production and other non-media expenses. Total advertising expenses, net of advertising co-op credits, were $18.5 million, $23.9 million and $21.3 million for the years ended December 31, 2016, 2015 and 2014, respectively.
Financial Instruments
Financial instruments, as of December 31, 2016 and 2015, consisted of cash and cash equivalents, trade accounts receivable, accounts payable, accrued liabilities and notes payable. The carrying amounts approximate fair value for each of these financial instruments, except for the notes payable. See Note 6. Notes Payable and Commercial Bank Financing, for additional information regarding the fair value of notes payable.
F-18
Post-retirement Benefits
During the fourth quarter of 2015, we fully settled the benefit obligation of our pension plan. We relieved our benefit obligation via lump sum distributions and/or the purchase of annuity contracts. Upon settlement we recorded $9.3 million of pension expense, including the recognition of $8.0 million of unamortized actuarial loses which was recorded in accumulated other comprehensive income, and $4.6 million of pension liability, representing the underfunded status of our defined pension plan, which was included within other long-term liabilities within our consolidated balance sheet.
We maintain a supplemental executive retirement plan (SERP) which we inherited upon the acquisition of certain stations. As of December 31, 2016, the estimated projected benefit obligation was $21.5 million, of which $1.7 million is included in accrued expenses in the consolidated balance sheet and the $19.8 million is included in other long-term liabilities. During the years ended December 31, 2016 and 2015, we made $1.7 million and $1.5 million in benefit payments, recognized $0.9 million and $0.9 million of periodic pension expense, reported in other expenses in the consolidated statement of operations, and $0.1 million and $1.0 million of actuarial gains through other comprehensive income, respectively.
At December 31, 2016, the projected benefit obligation was measured using a 3.89% discount rate compared to a discount rate of 4.11% for the year ended December 31, 2015. We estimated its discount rate, in consultation with our independent actuaries, based on a yield curve constructed from a portfolio of high quality bonds for which the timing and amount of cash outflows approximate the estimated payouts of the plan.
We estimate that benefits expected to be paid to participants under the SERP as follows (in thousands):
December 31, | |||
2017 | $ | 1,749 | |
2018 | 1,669 | ||
2019 | 1,597 | ||
2020 | 1,538 | ||
2021 | 1,479 | ||
Next 5 years | 6,532 | ||
Reclassifications
Certain reclassifications have been made to prior years’ consolidated financial statements to conform to the current year’s presentation.
F-19
2. ACQUISITIONS AND DISPOSITION OF ASSETS:
During the years ended December 31, 2016, 2015 and 2014, we acquired certain assets for an aggregate purchase price of $1,872.0 million plus working capital of $56.3 million.
All of these acquisitions provide expansion into additional markets and increases value based on the synergies we can achieve. The following summarizes the material acquisition activity during the years ended December 31, 2016, 2015 and 2014:
2016 Acquisitions
Tennis Channel. In March 2016, we acquired all of the outstanding common stock of Tennis Channel (Tennis), a cable network which includes coverage of the top 100 tennis tournaments and original professional sport and tennis lifestyle shows, for $350.0 million plus a working capital of $9.2 million. This was funded through cash on hand and a draw on the Bank Credit Agreement. The acquisition provides an expansion of our network business and increases value based on the synergies we can achieve. Tennis is reported within Other within Note 13. Segment Data.
The following table summarizes the allocated fair value of acquired assets and assumed liabilities of Tennis (in thousands):
Cash | $ | 5,111 | ||
Accounts receivable | 17,629 | |||
Prepaid expenses and other current assets | 6,518 | |||
Property and equipment | 5,964 | |||
Definite-lived intangible assets | 272,686 | |||
Indefinite-lived intangible assets | 23,400 | |||
Other assets | 619 | |||
Accounts payable and accrued liabilities | (7,414 | ) | ||
Capital leases | (115 | ) | ||
Deferred tax liability | (16,991 | ) | ||
Other long term liabilities | (1,669 | ) | ||
Fair value of identifiable net assets acquired | 305,738 | |||
Goodwill | 53,427 | |||
Total | $ | 359,165 | ||
The allocations presented above are based upon management’s estimate of the fair values using valuation techniques including income, cost and market approaches. In estimating the fair value of the acquired assets and assumed liabilities, the fair value estimates are based on, but not limited to, expected future revenue and cash flows, expected future growth rates, and estimated discount rates. The purchase prices have been allocated to the acquired assets and assumed liabilities based on estimated fair values.
The definite-lived intangible assets of $272.7 million related primarily to customer relationships, which represent existing advertiser relationships and contractual relationships with MVPDs and will be amortized over a weighted average useful life of 15 years. Acquired property and equipment will be depreciated on a straight-line basis over the respective estimated remaining useful lives. Goodwill is calculated as the excess of the consideration transferred over the fair value of the identifiable net assets acquired and represents the future economic benefits expected to arise from other intangible assets acquired that do not qualify for separate recognition, including assembled workforce and noncontractual relationships, as well as expected future synergies. Goodwill will not be deductible for tax purposes.
Other 2016 Acquisitions. During the year ended December 31, 2016, we acquired certain television station related assets for an aggregate purchase price of $72.0 million less working capital of $0.2 million. We also exchanged certain broadcast assets which had a carrying value of $23.8 million with another broadcaster for no cash consideration, and recognized a gain on the derecognition of those broadcast assets of $4.4 million, respectively.
F-20
2015 Acquisition
During the year ended December 31, 2015, we acquired one television station for a cash purchase price of $15.5 million, which was financed with cash on hand.
2014 Acquisitions
Allbritton. Effective August 1, 2014, we completed the acquisition of all of the outstanding common stock of Perpetual Corporation and equity interest of Charleston Television, LLC (together the “Allbritton Companies”) for $985.0 million plus working capital of $50.1 million. The Allbritton Companies owned and operated nine television stations in the following seven markets, all of which were affiliated with ABC. Also included in the purchase was NewsChannel 8, a 24-hour cable/satellite news network covering the Washington, D.C. metropolitan area. We financed the total purchase price with proceeds from the issuance of 5.625% senior unsecured notes, a draw on our amended bank credit agreement, and cash on hand. See Note 6. Notes Payable and Commercial Bank Financing.
Concurrent with the acquisition of the Allbritton companies, due to FCC multiple ownership rules, we sold WHTM in Harrisburg/Lancaster/York, PA to Media General in September 2014 for $83.4 million, less working capital of $0.2 million and the non-license assets of WTAT in Charleston, SC to Cunningham for $14.0 million, effective August 1, 2014. WHTM was acquired from the Allbritton companies and assets of WHTM were classified as assets held for sale in the Allbritton purchase price allocation. We did not recognize a gain or loss on this transaction. Prior to the sale of WTAT, we operated the station under an LMA and purchase agreement with Cunningham. This sale was accounted for as a transaction between parties under common control. See Note 11. Related Person Transactions for further discussion.
MEG Stations. Effective December 19, 2014, we completed the acquisition of four television stations in three markets from Media General, Inc (MEG Stations) for a purchase price of $207.5 million less working capital of $1.6 million. We financed the purchase price with cash on hand and borrowing under our revolving credit facility. We financed the purchase price, net of the proceeds received from the sale of those stations, with borrowings under our revolving credit facility.
Simultaneously, in December 2014, we sold to Media General the broadcast assets of two stations for $93.1 million less working capital of $0.6 million, which resulted in a gain on sale of $39.0 million.
KSNV. Effective November 1, 2014, we completed the acquisition of certain of assets of KSNV (NBC) in Las Vegas, NV from Intermountain West Communications Company (Intermountain West) for $118.5 million less working capital of $0.2 million. In conjunction with the purchase, we assumed the rights under the affiliation agreement with NBC and swapped our KVMY call letters for the KSNV call letters. We financed the total purchase price with cash on hand and borrowings under our revolving credit facility.
Other 2014 Acquisitions. During the year ended December 31, 2014, we acquired certain assets related to eight other television stations in four markets. The purchase price for these stations was $123.5 million less working capital of $1.1 million which was financed with cash on hand and borrowings under our revolving credit facility.
F-21
The following tables summarize the allocated fair value of acquired assets and assumed liabilities, including the net assets of consolidated VIEs (in thousands):
MEG Station | KSNV | Allbritton | Other | Total 2014 acquisitions | |||||||||||||||
Accounts receivable | — | — | 38,542 | — | 38,542 | ||||||||||||||
Prepaid expenses and other current assets | 476 | 67 | 19,890 | 79 | 20,512 | ||||||||||||||
Program contract costs | 1,954 | 482 | 1,204 | 2,561 | 6,201 | ||||||||||||||
Property and equipment | 23,462 | 8,300 | 46,600 | 8,352 | 86,714 | ||||||||||||||
Indefinite-lived intangible assets | 675 | — | 13,700 | 225 | 14,600 | ||||||||||||||
Definite-lived intangible assets | 125,925 | 70,375 | 564,100 | 87,915 | 848,315 | ||||||||||||||
Other assets | — | — | 20,352 | 1,500 | 21,852 | ||||||||||||||
Assets held for sale | — | — | 83,200 | — | 83,200 | ||||||||||||||
Accounts payable and accrued liabilities | (2,085 | ) | (277 | ) | (8,351 | ) | (1,143 | ) | (11,856 | ) | |||||||||
Program contracts payable | (1,914 | ) | (481 | ) | (1,140 | ) | (2,554 | ) | (6,089 | ) | |||||||||
Deferred tax liabilities | — | — | (261,291 | ) | — | (261,291 | ) | ||||||||||||
Other long term liabilities | — | (1,200 | ) | (17,263 | ) | — | (18,463 | ) | |||||||||||
Fair value of identifiable net assets acquired | 148,493 | 77,266 | 499,543 | 96,935 | 822,237 | ||||||||||||||
Goodwill | 57,398 | 41,024 | 535,694 | 25,501 | 659,617 | ||||||||||||||
Total | $ | 205,891 | $ | 118,290 | $ | 1,035,237 | $ | 122,436 | $ | 1,481,854 | |||||||||
The allocations presented above are based upon management’s estimate of the fair values using valuation techniques including income, cost and market approaches. In estimating the fair value of the acquired assets and assumed liabilities, the fair value estimates are based on, but not limited to, expected future revenue and cash flows, expected future growth rates, and estimated discount rates. The purchase prices have been allocated to the acquired assets and assumed liabilities based on estimated fair values.
During the year ended December 31, 2015, we made certain measurement period adjustments to the initial purchase accounting for the acquisitions in 2014, resulting in reclassifications between certain noncurrent assets and noncurrent liabilities, including a decrease to property and equipment of approximately $12.5 million, a decrease to broadcast licenses of $3.4 million, an increase to definite-lived intangible assets of $58.3 million, and a decrease to goodwill of $42.2 million, as well as a corresponding decrease to depreciation of $0.7 million and a decrease to amortization of $0.7 million during the year ended December 31, 2015.
The intangible assets will be amortized over the weighted average useful lives of 15 years for network affiliations and 14 years for the customer relationships, which represent existing advertiser relationships and contractual relationships with MVPDs. Acquired property and equipment will be depreciated on a straight-line basis over the respective estimated remaining useful lives. Goodwill is calculated as the excess of the consideration transferred over the fair value of the identifiable net assets acquired and represents the future economic benefits expected to arise from other intangible assets acquired that do not qualify for separate recognition, including assembled workforce and noncontractual relationships, as well as expected future synergies. Other intangible assets will be amortized over the respective weighted average useful lives ranging from 14 to 15 years.
The following tables summarize the amounts allocated to definite-lived intangible assets representing the estimated fair values and estimated goodwill deductible for tax purposes (in thousands):
MEG Stations | KSNV | Allbritton | Other | Total 2014 acquisitions | |||||||||||||||
Network affiliations | $ | 56,925 | $ | 44,775 | $ | 356,900 | $ | 27,575 | $ | 486,175 | |||||||||
Customer relationships | 45,500 | 25,600 | 207,200 | 44,800 | 323,100 | ||||||||||||||
Other intangible assets | 23,500 | — | — | 15,540 | 39,040 | ||||||||||||||
Fair value of identifiable definite-lived intangible assets acquired | $ | 125,925 | $ | 70,375 | $ | 564,100 | $ | 87,915 | $ | 848,315 | |||||||||
Estimated definite-lived intangible assets deductible for tax purposes | $ | 57,398 | $ | 41,024 | — | $ | 25,501 | $ | 123,923 | ||||||||||
F-22
Financial Results of Acquisitions
The following tables summarize the results of the net media revenues and operating income (loss) included in the financial statements of the Company beginning on the acquisition date of each acquisition as listed below (in thousands):
Revenues | 2016 | 2015 | 2014 | |||||||||
Tennis Channel | $ | 84,040 | $ | — | $ | — | ||||||
MEG Stations | 86,466 | 69,275 | 2,299 | |||||||||
KSNV | 63,818 | 32,471 | 5,972 | |||||||||
Allbritton | 253,845 | 231,300 | 106,258 | |||||||||
Other stations acquired in: | ||||||||||||
2016 | 49,186 | — | — | |||||||||
2015 | 2,676 | 1,007 | — | |||||||||
2014 | 49,298 | 42,470 | 9,172 | |||||||||
Total net media revenues | $ | 589,329 | $ | 376,523 | $ | 123,701 | ||||||
Operating Income (Loss) | 2016 | 2015 | 2014 | |||||||||
Tennis Channel | $ | (1,990 | ) | $ | — | $ | — | |||||
MEG Stations | 26,728 | 15,246 | 1,010 | |||||||||
KSNV | 36,446 | 7,206 | 2,108 | |||||||||
Allbritton | 49,777 | 39,550 | 26,914 | |||||||||
Other stations acquired in: | ||||||||||||
2016 | 18,311 | — | — | |||||||||
2015 | 646 | 426 | — | |||||||||
2014 | 11,644 | 8,451 | 1,569 | |||||||||
Total operating income | $ | 141,562 | $ | 70,879 | $ | 31,601 | ||||||
In connection with the 2016, 2015, and 2014 acquisitions, for the years ended December 31, 2016, 2015, and 2014, we incurred $1.4 million, $0.5 million, and $5.7 million, respectively, of costs primarily related to legal and other professional services, which we expensed as incurred and classified as corporate general and administrative expenses in the consolidated statements of operations.
F-23
Pro Forma Information
The following table sets forth unaudited pro forma results of operations, assuming that Tennis and the 2014 Acquisitions, along with transactions necessary to finance the acquisition, occurred at the beginning of the year preceding the year of acquisition. The pro forma results exclude the acquisitions presented under Other 2016 Acquisitions, 2015 Acquisitions, and Other 2014 Acquisitions above, as they were deemed not material both individually and in the aggregate. The 2014 period does not include the pro forma effects of the Tennis acquisition, and as such will not provide comparability to the 2015 and 2016 pro forma periods presented in the following table (in thousands, except per share data):
Unaudited | ||||||||||||
2016 | 2015 | 2014 | ||||||||||
Total revenues | $ | 2,751,441 | $ | 2,310,202 | $ | 2,150,124 | ||||||
Net Income | $ | 249,722 | $ | 168,364 | $ | 189,174 | ||||||
Net Income attributable to Sinclair Broadcast Group | $ | 244,261 | $ | 163,789 | $ | 186,338 | ||||||
Basic earnings per share attributable to Sinclair Broadcast Group | $ | 2.61 | $ | 1.72 | $ | 1.92 | ||||||
Diluted earnings per share attributable to Sinclair Broadcast Group | $ | 2.59 | $ | 1.71 | $ | 1.90 | ||||||
This pro forma financial information is based on historical results of operations, adjusted for the allocation of the purchase price and other acquisition accounting adjustments, and is not indicative of what our results would have been had we operated the businesses since the beginning of the annual period presented because the pro forma results do not reflect expected synergies. The pro forma adjustments reflect depreciation expense, amortization of intangibles and amortization of program contract costs related to the fair value adjustments of the assets acquired, additional interest expense related to the financing of the transactions, and exclusion of nonrecurring financing and transaction related costs. Depreciation and amortization expense are higher than amounts recorded in the historical financial statements of the acquirees due to the fair value adjustments recorded for long-lived tangibles and intangible assets in purchase accounting.
F-24
3. STOCK-BASED COMPENSATION PLANS:
In June 1996, our Board of Directors adopted, upon approval of the shareholders by proxy, the 1996 Long-Term Incentive Plan (LTIP). The purpose of the LTIP is to reward key individuals for making major contributions to our success and the success of our subsidiaries and to attract and retain the services of qualified and capable employees. Under the LTIP, we have issued restricted stock awards (RSAs), stock grants to our non-employee directors, stock-settled appreciation rights (SARs) and stock options. A total of 14,000,000 shares of Class A Common Stock are reserved for awards under this plan. As of December 31, 2016, 7,111,609 shares (including forfeited shares) were available for future grants. Additionally, we have the following arrangements that involve stock-based compensation: employer matching contributions (the Match) for participants in our 401(k) plan, an employee stock purchase plan (ESPP), and subsidiary stock awards. Stock-based compensation expense has no effect on our consolidated cash flows. For the years ended December 31, 2016, 2015 and 2014, we recorded stock-based compensation of $16.9 million, $18.0 million and $13.9 million, respectively. Below is a summary of the key terms and methods of valuation of our stock-based compensation awards:
RSAs. RSAs issued in 2016, 2015 and 2014 have certain restrictions that lapse over two years at 50% and 50%, respectively. As the restrictions lapse, the Class A Common Stock may be freely traded on the open market. Unvested RSAs are entitled to dividends, and therefore, are included in weighted shares outstanding which results in a dilutive effect on basic and diluted earnings per share. The fair value assumes the closing value of the stock on the measurement date.
The following is a summary of changes in unvested restricted stock:
RSAs | Weighted-Average Price | |||||
Unvested shares at December 31, 2015 | 137,900 | $ | 25.81 | |||
2016 Activity: | ||||||
Granted | 96,450 | 31.40 | ||||
Vested | (87,375 | ) | 26.32 | |||
Unvested shares at December 31, 2016 | 146,975 | 29.18 | ||||
For the years ended December 31, 2016, 2015 and 2014, we recorded compensation expense of $2.8 million, $5.3 million and $3.2 million, respectively. The majority of the unrecognized compensation expense of $1.7 million as of December 31, 2016 will be recognized in 2017.
Stock Grants to Non-Employee Directors. In addition to directors fees paid, on the date of each of our annual meetings of shareholders, each non-employee director receives a grant of unrestricted shares of Class A Common Stock. In 2016, 2015 and 2014, we issued 20,000 shares, 20,000 shares and 12,000 shares, respectively. We recorded expense of $0.6 million, $0.6 million and $0.4 million for each of the years ended December 31, 2016, 2015 and 2014, respectively, which was based on the average share price of the stock on the date of grant. Additionally, these shares are included in the total shares outstanding, which results in a dilutive effect on our basic and diluted earnings per share.
F-25
SARs. During the years ended December 31, 2016, 2015 and 2014, 400,000, 310,000 and 200,000 SARs were granted with base values per share of $31.40, $24.93 and $27.86, respectively, to our Executive Chairman. The SARs have a 10-year term and vest immediately. The base value of each SAR is equal the closing price of our Class A Common Stock on the grant date. For the years ended December 31, 2016, 2015 and 2014, we recorded compensation expense equal to the estimated fair value at the grant date, of $4.0 million, $2.6 million and $2.6 million, respectively. We valued the SARs using the Black-Scholes model and the following assumptions:
2016 | 2015 | 2014 | ||||||
Risk-free interest rate | 1.2 | % | 1.3 | % | 1.5 | % | ||
Expected years until exercise | 5 years | 5 years | 5 years | |||||
Expected volatility | 42 | % | 47 | % | 65 | % | ||
Annual dividend yield | 2.1 | % | 2.7 | % | 2.2 | % | ||
The risk-free interest rate is based on the U.S. Treasury yield curve in effect at the time of grant for U.S. Treasury zero coupon separate trading of registered interest and principal securities, commonly known as STRIPS, that approximate the expected life of the options. The expected volatility is based on our historical stock prices over a period equal to the expected life of the options. The annual dividend yield is based on the annual dividend per share divided by the share price on the grant date.
The following is a summary of the 2016 activity:
SARs | Weighted- Average Price | |||||
Outstanding SARs at December 31, 2015 | 1,910,000 | $ | 16.68 | |||
2016 Activity: | ||||||
Granted | 400,000 | 31.40 | ||||
Outstanding SARs at December 31, 2016 | 2,310,000 | 19.23 | ||||
The aggregate intrinsic value of the 2,310,000 outstanding as of December 31, 2016 was $32.6 million, and the outstanding SARs have a weighted average remaining contractual life of 6.08 years as of December 31, 2016. During 2016, 2015 and 2014, outstanding SARs increased the weighted average shares outstanding for purposes of determining dilutive earnings per share.
Options. Effective April 1, 2014, we entered into an employment agreement with our Chief Executive Officer, to grant annually on each December 31, an option to purchase 125,000 shares of Class A Common Stock beginning December 31, 2014 through December 31, 2021. Upon grant, the stock options are immediately exercisable. The maximum aggregate intrinsic value that can be earned under the arrangement cannot exceed $20 million. The stock options are granted with an exercise price equal to the closing price of the stock on the date of grant and have a 10 year contractual life.
Options | Weighted- Average Price | |||||
Outstanding Options at December 31, 2015 | 250,000 | $ | 29.95 | |||
2016 Activity: | ||||||
Granted | 125,000 | 33.35 | ||||
Outstanding Options at December 31, 2016 | 375,000 | 31.08 | ||||
Since the stock options are fully vested upon grant and requisite service must be satisfied to receive the award, we estimate the fair value of each annual tranche of the options to be issued in the future and recognize the compensation expense over the period until the actual grant date. The fair value of each award is remeasured each period until the actual grant with the ultimate cumulative expense equaling the grant date fair value of the award. During the years ended December 31, 2016, 2015, and 2014 we recorded $0.4 million, $0.8 million, and $1.5 million of stock-based compensation expense related to this arrangement, respectively, based on estimated fair values of each of the options, of which $0.5 million, $0.8 million, and $1.1 million were attributable to the options granted on December 31, 2016, 2015, and 2014, respectively.
F-26
We value stock options using the Black-Scholes pricing model and the following assumptions:
2016 | 2015 | 2014 | ||||||
Risk-free interest rate | 1.9 | % | 1.9 | % | 1.8 | % | ||
Expected years to exercise | 5 years | 5 years | 5 years | |||||
Expected volatility | 37.5 | % | 42.1 | % | 47.6 | % | ||
Annual dividend yield | 2.1 | % | 2.0 | % | 2.3 | % | ||
The risk-free interest rate is based on the U.S. Treasury yield curve, in effect at the time of grant, for U.S. Treasury STRIPS that approximate the expected life of the options. The expected volatility is based on our historical stock prices over a period equal to the expected life of the options. The annual dividend yield is based on the annual dividend per share divided by the share price on the grant date. During 2016, 2015, and 2014, outstanding stock options increased the weighted average shares outstanding for purposes of determining dilutive earnings per share.
Match. The Sinclair Broadcast Group, Inc. 401(k) Profit Sharing Plan and Trust (the 401(k) Plan) is available as a benefit for our eligible employees. Contributions made to the 401(k) Plan include an employee elected salary reduction amount, the Match and an additional discretionary amount determined each year by the Board of Directors. The Match and any additional
discretionary contributions may be made using our Class A Common Stock if the Board of Directors so chooses. Typically, we make the Match using our Class A Common Stock.
The value of the Match is based on the level of elective deferrals into the 401(k) Plan. The amount of shares of our Class A Common Stock used to make the Match is determined using the closing price on or about March 1 of each year for the previous calendar year’s Match. The Match is discretionary and is equal to a maximum of 50% of elective deferrals by eligible employees, capped at 4% of the employee’s total cash compensation. For the years ended December 31, 2016, 2015 and 2014, we recorded $6.9 million, $6.2 million and $5.2 million, respectively, of stock-based compensation expense related to the Match. A total of 3,000,000 shares of Class A Common Stock are reserved for matches under the plan. As of December 31, 2016, 410,119 shares were available for future grants.
ESPP. The ESPP allows eligible employees to purchase Class A Common Stock at 85% of the lesser of the fair value of the common stock as of the first day of the quarter and as of the last day of that quarter, subject to certain limits as defined in the ESPP. The stock-based compensation expense recorded related to the ESPP for the years ended December 31, 2016, 2015 and 2014 was $0.9 million, $0.7 million and $0.7 million, respectively. A total of 3,200,000 shares of Class A Common Stock are reserved for awards under the plan. As of December 31, 2016, 995,349 shares were available for future grants.
Subsidiary Stock Awards. From time to time, we grant subsidiary stock awards to employees. The subsidiary stock is typically in the form of a membership interest in a consolidated limited liability company, not traded on a public exchange and valued based on the estimated fair value of the subsidiary. Fair value is typically estimated using discounted cash flow models and/or appraisals. These stock awards vest immediately. For the years ended December 31, 2016, 2015 and 2014, we recorded compensation expense of $1.3 million, $1.8 million and $0.2 million, respectively, related to these awards which increase noncontrolling interest equity. These awards have no effect on the shares used in our basic and diluted earnings per share.
4. PROPERTY AND EQUIPMENT:
Property and equipment are stated at cost, less accumulated depreciation. Depreciation is generally computed under the straight-line method over the following estimated useful lives:
Buildings and improvements | 10 - 30 years | |
Station equipment | 5 - 10 years | |
Office furniture and equipment | 5 - 10 years | |
Leasehold improvements | Lesser of 10 - 30 years or lease term | |
Automotive equipment | 3 - 5 years | |
Property and equipment under capital leases | Lease term | |
Acquired property and equipment as discussed in Note 2. Acquisitions and Disposition of Assets, is depreciated on a straight-line basis over the respective estimated remaining useful lives.
F-27
Property and equipment consisted of the following as of December 31, 2016 and 2015 (in thousands):
2016 | 2015 | ||||||
Land and improvements | $ | 73,124 | $ | 60,678 | |||
Real estate held for development and sale | 90,087 | 91,106 | |||||
Buildings and improvements | 239,603 | 210,597 | |||||
Station equipment | 702,004 | 667,454 | |||||
Office furniture and equipment | 101,252 | 85,411 | |||||
Leasehold improvements | 24,762 | 22,693 | |||||
Automotive equipment | 56,507 | 47,402 | |||||
Capital leased assets | 84,516 | 84,474 | |||||
Construction in progress | 30,880 | 34,666 | |||||
1,402,735 | 1,304,481 | ||||||
Less: accumulated depreciation | (685,159 | ) | (587,344 | ) | |||
$ | 717,576 | $ | 717,137 | ||||
Capital leased assets are related to building, tower and equipment leases. Depreciation related to capital leases is included in depreciation expense in the consolidated statements of operations. We recorded capital lease depreciation expense of $4.2 million, $3.9 million and $3.7 million for the years ended December 31, 2016, 2015 and 2014, respectively.
F-28
5. GOODWILL, INDEFINTE-LIVED INTANGIBLE ASSETS AND OTHER INTANGIBLE ASSETS:
Goodwill, which arises from the purchase price exceeding the assigned value of the net assets of an acquired business, represents the value attributable to unidentifiable intangible elements being acquired. Goodwill totaled $1,990.7 million and $1,931.1 million at December 31, 2016 and 2015, respectively. The change in the carrying amount of goodwill was as follows (in thousands):
Broadcast | Other | Consolidated | |||||||||
Balance at December 31, 2014 | |||||||||||
Goodwill | $ | 2,377,613 | $ | 513 | $ | 2,378,126 | |||||
Accumulated impairment losses | (413,573 | ) | — | (413,573 | ) | ||||||
1,964,040 | 513 | 1,964,553 | |||||||||
Acquisitions (a) | 5,802 | — | 5,802 | ||||||||
Measurement period adjustments related to prior year acquisitions | (42,237 | ) | — | (42,237 | ) | ||||||
Change in assets held for sale (b) | — | 2,975 | 2,975 | ||||||||
Balance at December 31, 2015 (c) | |||||||||||
Goodwill | 2,341,178 | 3,488 | 2,344,666 | ||||||||
Accumulated impairment losses | (413,573 | ) | — | (413,573 | ) | ||||||
1,927,605 | 3,488 | 1,931,093 | |||||||||
Acquisitions (a) | 11,626 | 53,427 | 65,053 | ||||||||
Measurement period adjustments related to prior year acquisitions | 40 | — | 40 | ||||||||
Disposition of assets (d) | (5,440 | ) | — | (5,440 | ) | ||||||
Balance at December 31, 2016 (c) | |||||||||||
Goodwill | 2,347,404 | 56,915 | 2,404,319 | ||||||||
Accumulated impairment losses | (413,573 | ) | — | (413,573 | ) | ||||||
$ | 1,933,831 | $ | 56,915 | $ | 1,990,746 | ||||||
_______________________________________________________
(a) | In 2016 and 2015, we acquired goodwill as a result of acquisitions as discussed in Note 2. Acquisitions and Disposition of Assets. |
(b) | We concluded in 2015 that certain non-media related assets that were classified as assets held for sale as of December 31, 2014 no longer met the held for sale criteria. |
(c) | Approximately $0.8 million of goodwill relates to consolidated VIEs as of December 31, 2016 and 2015. |
(d) | Amounts relate to the 2016 sale of broadcast assets as discussed in Note 2. Acquisitions and Disposition of Assets. |
For our annual goodwill impairment tests in 2016, 2015 and 2014, we concluded that it was more-likely-than-not that goodwill was not impaired for the reporting units in which we performed a qualitative assessment. For one reporting unit in 2016, we elected to perform a quantitative assessment and concluded that its fair value substantially exceeded its carrying value. The qualitative factors reviewed during our annual assessments, indicated stable or improving margins and favorable or stable forecasted economic conditions including stable discount rates and comparable or improving business multiples. Additionally, the results of prior quantitative assessments supported significant excess fair value over carrying value of our reporting units. We did not have any indicators of impairment in any interim period in 2016, 2015, or 2014, and therefore did not perform interim impairment tests for goodwill during those periods.
The key assumptions used to determine the fair value of our broadcast reporting unit consisted primarily of significant unobservable inputs (Level 3 fair value inputs), including discount rates, estimated cash flows, profit margins and growth rates. The discount rate used to determine the fair value of our broadcast reporting unit is based on a number of factors including market interest rates, a weighted average cost of capital analysis based on the target capital structure for a television broadcasting company, and includes adjustments for market risk and company specific risk. Estimated cash flows are based upon internally developed estimates and the growth rates and profit margins are based on market studies, industry knowledge and historical performance.
F-29
As of December 31, 2016 and 2015, the carrying amount of our indefinite-lived intangible assets was as follows (in thousands):
Broadcast | Other | Consolidated | |||||||||
Balance at December 31, 2014 | $ | 135,075 | $ | — | $ | 135,075 | |||||
Acquisitions (a) | 992 | — | 992 | ||||||||
Sale of assets | (175 | ) | — | (175 | ) | ||||||
Measurement period adjustments related to prior year acquisitions | (3,427 | ) | — | (3,427 | ) | ||||||
Balance at December 31, 2015 (b) | 132,465 | — | 132,465 | ||||||||
Acquisitions (a) | 2,406 | 23,400 | 25,806 | ||||||||
Disposition of assets | (1,965 | ) | — | (1,965 | ) | ||||||
Balance at December 31, 2016 (b) (c) | $ | 132,906 | $ | 23,400 | $ | 156,306 | |||||
(a) | In 2016 and 2015, we acquired indefinite-lived intangible assets as a result of acquisitions as discussed in Note 2. Acquisitions and Disposition of Assets. |
(b) | Approximately $15.7 million and $17.6 million of indefinite-lived intangible assets relate to consolidated VIEs as of December 31, 2016 and 2015, respectively. |
(c) | Our indefinite-lived intangible assets in Broadcast relates to broadcast licenses and our indefinite-lived intangible assets in Other relates to trade names. |
We did not have any indicators of impairment for our indefinite-lived intangible assets in any interim period in 2016 or 2015, and therefore did not perform interim impairment tests during those periods. We performed our annual impairment tests for indefinite-lived intangibles in the fourth quarter of 2016 and 2015 and as a result of our qualitative and quantitative assessments, we recorded no impairment. We performed our annual impairment tests for indefinite-lived intangibles in the fourth quarter of 2014 and as a result of our qualitative and/or quantitative assessments we recorded $3.2 million of impairment charges, included within amortization of definite-lived intangible and other assets within the consolidated statement of operations, related to broadcast licenses with a carrying value of $21.1 million, compared to their estimated fair value of $17.9 million, as a result of a decrease in the projected future market revenues related to our radio broadcast licenses in Seattle, WA.
The key assumptions used to determine the fair value of our broadcast licenses consisted primarily of significant unobservable inputs (Level 3 fair value inputs), including discount rates, estimated market revenues, normalized market share, normalized profit margin, and estimated start-up costs. The qualitative factors for our broadcast licenses indicated an increase in market revenues, stable market shares and stable cost factors. The revenue, expense and growth rates used in determining the fair value of our broadcast licenses remained constant or increased slightly from 2015 to 2016. The growth rates are based on market studies, industry knowledge and historical performance. The discount rates used to determine the fair value of our broadcast licenses did not change significantly over the last three years. The discount rate is based on a number of factors including market interest rates, a weighted average cost of capital analysis based on the target capital structure for a television station, and includes adjustments for market risk and company specific risk.
F-30
The following table shows the gross carrying amount and accumulated amortization of definite-lived intangibles (in thousands):
As of December 31, 2016 | |||||||||||
Gross Carrying Value | Accumulated Amortization | Net | |||||||||
Amortized intangible assets: | |||||||||||
Network affiliation (a) | $ | 1,398,451 | $ | (427,484 | ) | $ | 970,967 | ||||
Customer Relationships (a) | 1,102,591 | (294,114 | ) | 808,477 | |||||||
Other (b) | 243,253 | (78,294 | ) | 164,959 | |||||||
Total | $ | 2,744,295 | $ | (799,892 | ) | $ | 1,944,403 | ||||
As of December 31, 2015 | |||||||||||
Gross Carrying Value | Accumulated Amortization | Net | |||||||||
Amortized intangible assets: | |||||||||||
Network affiliation (a) | $ | 1,378,425 | $ | (343,729 | ) | $ | 1,034,696 | ||||
Customer Relationships (a) | 806,727 | (225,176 | ) | 581,551 | |||||||
Other (b) | 193,594 | (58,271 | ) | 135,323 | |||||||
Total | $ | 2,378,746 | $ | (627,176 | ) | $ | 1,751,570 | ||||
_______________________________________________________
(a) | Changes between the gross carrying value from December 31, 2015 to December 31, 2016, relate to acquisitions in 2016, as discussed in Note 2. Acquisitions and Disposition of Assets. |
(b) | The increase in other intangible assets is primarily due to the purchase of additional alarm monitoring contracts of $40.2 million. |
Definite-lived intangible assets and other assets subject to amortization are being amortized on a straight-line basis over their estimated useful lives which generally range from 5 to 25 years. The total weighted average useful life of all definite-lived intangible assets and other assets subject to amortization acquired as a result of the acquisitions discussed in Note 2. Acquisitions and Disposition of Assets is 14 years. The amortization expense of the definite-lived intangible and other assets for the years ended December 31, 2016, 2015 and 2014 was $183.8 million, $161.5 million and $125.5 million, respectively. We analyze specific definite-lived intangibles for impairment when events occur that may impact their value in accordance with the respective accounting guidance for long-lived assets. There were no impairment charges recorded for the years ended December 31, 2016, 2015 and 2014.
The following table shows the estimated amortization expense of the definite-lived intangible assets for the next five years (in thousands):
For the year ended December 31, 2017 | $ | 175,942 | |
For the year ended December 31, 2018 | 174,593 | ||
For the year ended December 31, 2019 | 173,586 | ||
For the year ended December 31, 2020 | 173,006 | ||
For the year ended December 31, 2021 | 171,988 | ||
Thereafter | 1,075,288 | ||
$ | 1,944,403 | ||
F-31
6. NOTES PAYABLE AND COMMERCIAL BANK FINANCING:
Bank Credit Agreement
We have a syndicated credit facility which includes both revolving credit and issued term loans (Bank Credit Agreement). During the years ended December 31, 2016, 2015 and 2014, the Bank Credit Agreement has been restated and amended several times to provide incremental financing to the acquisitions as discussed under Note 2. Acquisitions and Disposition of Assets. As of December 31, 2016, $1,624.5 million, net of $10.5 million and $2.8 million deferred financing costs and debt discounts, respectively, of aggregate borrowings were outstanding under the Bank Credit Agreement, which consists of the following:
Term Loan A. On July 19, 2016, we entered into an amendment and extension of our bank credit agreement and extended the maturity date of $139.5 million of term A loans to July 31, 2021. The remaining $153.5 million of outstanding term loan A loans mature April 9, 2018. In connection with the transaction, we also amended certain pricing terms related to the loans. In connection with the amendment of the Term Loan A and Revolver discussed below, we incurred approximately $2.7 million of financing costs, of which $0.3 million was expensed and the remaining $2.4 million was capitalized as deferred financing cost as of December 31, 2016. As of December 31, 2016, $140.9 million of term loans which mature April 9, 2018, and bear interest at LIBOR plus 2.25% and $130.1 million of term loans which mature July 31, 2021 and bear interest at LIBOR plus 2.25%, which is adjusted for changes in our First Lien Indebtedness ratio, (together Term Loan A loans) were outstanding, net of $1.2 million in deferred financing costs. As of December 31, 2015, $312.1 million of Term Loan A was outstanding.
Term Loan B. As of December 31, 2016, $1,353.5 million of term loans, net of $9.3 million deferred financing costs and debt discounts of $2.8 million, were outstanding. As of December 31, 2015, $1,364.6 million of Term Loan B, net of $11.4 million deferred financing cost and debt discounts of $3.6 million, was outstanding. The Term Loan B bears interest at LIBOR plus 2.25%.
In January 2017, we amended our Bank Credit Agreement. We extended the maturity date of the Term Loan B from April 9, 2020 and July 31, 2021 to January 3, 2024. In connection with the extension, we added additional operating flexibility, including a reduction in certain pricing terms related to Term Loan B and our existing revolving credit facility (Revolver) and revisions to certain covenant ratio requirements. Prior to July 3, 2017, if we repay, refinance, substitute, or replace the Term Loan B, we are subject to a prepayment premium of 1% of the aggregate principal balance of the repayment.
Revolving Credit Facility. As of December 31, 2016 and 2015, our total commitments under the Revolver were $485.2 million which bears interest at LIBOR plus 2.25%, and is adjusted for changes in our First Lien Indebtedness ratio. On July 19, 2016, we entered into an amendment and extension of our bank credit agreement and extended the maturity of the Revolver to July 31, 2021. We incur a commitment fee on undrawn capacity of 0.25% to 0.5%, which is adjusted for changes in our First Lien Indebtedness ratio. As of December 31, 2016, there were no outstanding borrowings and $1.9 million of letters of credit were issued under the Revolver. The remaining borrowing capacity under the Revolver was $483.3 million and $482.9 million as of December 31, 2016 and 2015, respectively.
Cash interest expense related to the Bank Credit Agreement, including the Revolver, in our consolidated statements of operations was $54.4 million, $53.0 million and $38.0 million for the years ended December 31, 2016, 2015 and 2014, respectively. We capitalized $2.0 million, $3.6 million and $3.8 million as deferred financing costs, during the years ended December 31, 2016, 2015 and 2014, respectively. Deferred financing costs are classified within our notes payable and commercial bank financing within our consolidated balance sheet, except for deferred financing costs related to our Revolver as discussed in Other Assets within Note 1. Nature of Operations and Summary of Significant Accounting Policies. The weighted average effective interest rate of the Term Loan B for the years ended December 31, 2016 and 2015 was 3.53% and 3.54%, respectively. The weighted average effective interest rate of the Term Loan A for the years ended December 31, 2016 and 2015 was 2.72% and 2.47%, respectively. The weighted average effective interest rate of the Revolver for the year ended December 31, 2016 was 2.98% and 2.38%, respectively.
Our Bank Credit Agreement, as well as indentures governing our outstanding notes as described below, contains a number of covenants that, among other things, restrict our ability and our subsidiaries’ ability to incur additional indebtedness with certain exceptions, pay dividends (See Note 8. Common Stock), incur liens, engage in mergers or consolidations, make acquisitions, investments or disposals and engage in activities with affiliates. In addition, under the Bank Credit Agreement, we are required to maintain a ratio of First Lien Indebtedness of 4.25 times EBITDA. As of December 31, 2016, we were in compliance with all financial ratios and covenants.
Our Bank Credit Agreement also contains certain cross-default provisions with certain material third-party licensees, defined as any party that owns the license assets of one or more television stations for which we provided services pursuant to LMAs and/or other outsourcing agreements and those stations provide 20% or more of our aggregate broadcast cash flows. A default by a
F-32
material third-party licensee under our agreements with such parties, including a default caused by insolvency, would cause an event of default under our Bank Credit Agreement. As of December 31, 2016, there were no material third party licensees as defined in our Bank Credit Agreement.
Substantially all of our stock in our wholly-owned subsidiaries has been pledged as security for the Bank Credit Agreement.
5.125% Senior Notes, due 2027
On August 30, 2016, we issued $400.0 million of senior unsecured notes, which bear interest at a rate of 5.125% per annum and mature on February 15, 2027 (the 5.125% Notes), pursuant to an indenture dated August 30, 2016 (the 5.125% Indenture). The 5.125% Notes were priced at 100% of their par value and interest is payable semi-annually on February 15 and August 15, commencing on February 15, 2017. Prior to August 15, 2021, we may redeem the 5.125% Notes, in whole or in part, at any time or from time to time at a price equal to 100% of the principal amount of the 5.125% Notes plus accrued and unpaid interest, if any, to the date of redemption, plus a “make-whole” premium as set forth in the 5.125% Indenture. In addition, on or prior to August 15, 2019, we may redeem up to 35% of the 5.125% Notes, using proceeds of certain equity offerings. If we sell certain of our assets or experience specific kinds of changes of control, the holders of the 5.125% Notes may require us to repurchase some or all of the notes. There are no registration rights associated with the 5.125% Notes. The net proceeds of the 5.125% Notes were used to redeem aggregate principal amount of the 6.375% Notes and for general corporate purposes. We incurred $6.6 million of deferred financing costs in connection with the issuance of the 5.125% Notes as of December 31, 2016.
Cash interest expense was $6.9 million for the years ended December 31, 2016. The weighted average effective interest rate for the 5.125% Notes was 5.33% for the year ended December 31, 2016.
5.875% Senior Notes, due 2026
On March 23, 2016, we issued $350.0 million of senior unsecured notes, which bear interest at a rate of 5.875% per annum and mature on March 15, 2026 (the 5.875% Notes), pursuant to an indenture dated March 23, 2016 (the 5.875% Indenture). The 5.875% Notes were priced at 100% of their par value and interest is payable semi-annually on March 15 and September 15, commencing on September 15, 2016. Prior to March 15, 2021, we may redeem the 5.875% Notes, in whole or in part, at any time or from time to time at a price equal to 100% of the principal amount of the 5.875% Notes plus accrued and unpaid interest, if any, to the date of redemption, plus a “make-whole” premium as set forth in the 5.875% Indenture. In addition, on or prior to March 15, 2019, we may redeem up to 35% of the 5.875% Notes, using proceeds of certain equity offerings. If we sell certain of our assets or experience specific kinds of changes of control, the holders of the 5.875% Notes may require us to repurchase some or all of the notes. There are no registration rights associated with the 5.875% Notes. We incurred $5.9 million of deferred financing costs in connection with the issuance of the 5.875% Notes which were capitalized and are classified net of the carrying value of debt and amortized using the effective interest method.
Cash interest expense was $15.8 million for the years ended December 31, 2016. The weighted average effective interest rate for the 5.875% Notes was 6.1% for the year ended December 31, 2016.
As discussed in Note 2. Acquisitions and Disposition of Assets, we completed the acquisition of Tennis in March 2016. The acquisition was funded, in part, by a draw on our revolving line of credit which was repaid using the proceeds from the 5.875% Notes discussed above.
F-33
5.625% Senior Unsecured Notes, due 2024
On July 23, 2014, we issued $550.0 million in senior unsecured notes, which bear interest at a rate of 5.625% per annum and mature on August 1, 2024 (the 5.625% Notes), pursuant to an indenture dated July 23, 2014 (the 5.625% Indenture). The 5.625% Notes were priced at 100% of their par value and interest is payable semi-annually on February 1 and August 1, commencing on February 1, 2015. Prior to August 1, 2019, we may redeem the 5.625% Notes, in whole or in part, at any time or from time to time at a price equal to 100% of the principal amount of the 5.625% Notes plus accrued and unpaid interest, if any, to the date of redemption, plus a “make-whole” premium as set forth in the 5.625% Indenture. In addition, on or prior to August 1, 2019, we may redeem up to 35% of the 5.625% Notes, using proceeds of certain equity offerings. If we sell certain of our assets or have certain changes of control, the holders of the 5.625% Notes may require us to repurchase some or all of the notes. The proceeds from the offering of the 5.625% Notes, together with borrowings under our Bank Credit Agreement and cash on hand, were used to finance the acquisition of the Allbritton companies effective August 1, 2014.
Cash interest expense was $30.9 million for both years ended December 31, 2016 and 2015, respectively, and $13.6 million for the year ended December 31, 2014. The weighted average effective interest rate for the 5.625% Notes was 5.83% for the year ended December 31, 2016.
6.375% Senior Notes, due 2021
Effective August 15, 2016, we redeemed all of the outstanding 6.375% Senior Unsecured Notes, representing $350.0 million in aggregate principal amount. Upon the redemption, along with the principal, we paid the accrued and unpaid interest and a make whole premium, for a total of $377.2 million paid to noteholders. We recorded a loss on extinguishment of $23.7 million in the third quarter of 2016 related to this redemption, which included the write-off of the unamortized deferred financing costs of $3.9 million and prepayment penalty of $19.8 million.
Cash interest expense was $14.8 million, $22.3 million, and $22.4 million for the year ended December 31, 2016, 2015 and 2014, respectively.
5.375% Senior Unsecured Notes, due 2021
On April 2, 2013, we issued $600.0 million of senior unsecured notes, which bear interest at a rate of 5.375% per annum and mature on April 1, 2021 (the 5.375% Notes), pursuant to an indenture dated April 2, 2013 (the 5.375% Indenture). The 5.375% Notes were priced at 100% of their par value and interest is payable semi-annually on April 1 and October 1, commencing on October 1, 2013. Prior to April 1, 2016, we may redeem the 5.375% Notes, in whole or in part, at any time or from time to time at a price equal to 100% of the principal amount of the 5.375% Notes plus accrued and unpaid interest, if any, to the redemption date, plus a “make-whole” premium as set forth in the 5.375% Indenture. Beginning on April 1, 2016, we may redeem some or all of the 5.375% Notes at any time or from time to time at a redemption price set forth in the 5.375% Indenture. In addition, on or prior to April 1, 2016, we may redeem up to 35% of the 5.375% Notes using proceeds of certain equity offerings. If we sell certain of our assets or experience specific kinds of changes of control, holders of the 5.375% Notes may require us to repurchase some or all of the Notes. The net proceeds from the offering of the 5.375% Notes were used to pay down outstanding indebtedness under our bank credit facility.
Cash interest expense was $32.3 million for the years ended December 31, 2016, 2015 and 2014, respectively. The weighted average effective interest rate for the 5.375% Notes was 5.58% for the year ended December 31, 2016.
F-34
6.125% Senior Unsecured Notes, due 2022
On October 12, 2012, we issued $500.0 million of senior unsecured notes, which bear interest at a rate of 6.125% per annum and mature on October 1, 2022 (the 6.125% Notes), pursuant to an indenture dated October 12, 2012 (the 6.125% Indenture). The 6.125% Notes were priced at 100% of their par value and interest is payable semi-annually on April 1 and October 1, commencing on April 1, 2013. Prior to October 1, 2017, we may redeem the 6.125% Notes, in whole or in part, at any time or from time to time at a price equal to 100% of the principal amount of the 6.125% Notes plus accrued and unpaid interest, if any, to the redemption date, plus a “make-whole” premium as set forth in the 2012 Indenture. Beginning on October 1, 2017, we may redeem some or all of the 6.125% Notes at any time or from time to time at a redemption price set forth in the 6.125% Indenture. In addition, on or prior to October 1, 2015, we could have redeemed up to 35% of the 6.125% Notes using proceeds of certain equity offerings. If we sell certain of our assets or experience specific kinds of changes of control, holders of the 6.125% Notes may require us to repurchase some or all of the Notes. The net proceeds from the offering of the 6.125% Notes were used to pay down outstanding indebtedness under the revolving credit facility under our Bank Credit Agreement and fund certain acquisitions and for general corporate purposes.
Cash interest expense was $30.6 million for the years ended December 31, 2016, 2015 and 2014, respectively. The weighted average effective interest rate for the 6.125% Notes was 6.310% for the year ended December 31, 2016.
8.375% Senior Unsecured Notes, due 2018
Effective October 15, 2014, we redeemed all of the outstanding 8.375% Senior Notes due 2018, representing $237.5 million aggregate principal amount of Notes as of October 15, 2014. Upon the redemption, along with the principal, we paid the accrued and unpaid interest and a make whole premium of $9.9 million, for a total of $257.4 million paid to note holders. We recorded a loss on extinguishment of $14.6 million in the fourth quarter of 2014 related to this redemption.
Cash interest expense was $15.7 million for the years ended December 31, 2014.
Debt of other non-media subsidiaries
Debt of our consolidated subsidiaries related to our non-media private equity investment and real estate ventures is non-recourse to us. Interest was paid on this debt at rates typically ranging from LIBOR plus 2.5% to a fixed 6.5% during 2016. During 2016, 2015 and 2014, interest expense on this debt was $5.9 million, $3.8 million and $3.1 million, respectively.
Debt of variable interest entities
Our consolidated VIEs have $23.0 million, net of $0.2 million deferred financing costs, in outstanding debt for which the proceeds were used to purchase the license assets of certain stations. See Variable Interest Entities under Note 1. Nature of Operations and Summary of Significant Accounting Policies for more information. The credit agreements and term loans of these VIEs each bear interest of LIBOR plus 2.5%. We have jointly and severally, unconditionally and irrevocably guaranteed the debt of the VIEs, as a primary obligor, including the payment of all unpaid principal of and interest on the loans.
For the years ended December 31, 2016, 2015 and 2014, the interest expense relating to the debt of our VIEs which was jointly and severally, unconditionally and irrevocably guaranteed was $0.9 million, $1.7 million and $2.2 million, respectively.
F-35
Summary
Notes payable, capital leases and the Bank Credit Agreement consisted of the following as of December 31, 2016 and 2015 (in thousands):
2016 | 2015 | ||||||
Bank Credit Agreement, Term Loan A | $ | 272,198 | $ | 313,620 | |||
Bank Credit Agreement, Term Loan B | 1,365,625 | 1,379,626 | |||||
6.375% Senior Unsecured Notes, due 2021 | — | 350,000 | |||||
5.375% Senior Unsecured Notes, due 2021 | 600,000 | 600,000 | |||||
6.125% Senior Unsecured Notes, due 2022 | 500,000 | 500,000 | |||||
5.625% Senior Unsecured Notes, due 2024 | 550,000 | 550,000 | |||||
5.875% Senior Unsecured Notes, due 2026 | 350,000 | — | |||||
5.125% Senior Unsecured Notes, due 2027 | 400,000 | — | |||||
Debt of variable interest entities | 23,198 | 26,682 | |||||
Debt of other non-media subsidiaries | 135,211 | 120,969 | |||||
Capital leases | 33,280 | 34,774 | |||||
Total outstanding principal | 4,229,512 | 3,875,671 | |||||
Less: Deferred financing costs and discount | (43,449 | ) | (42,327 | ) | |||
Less: Current portion | (171,131 | ) | (164,184 | ) | |||
Net carrying value of long-term debt | $ | 4,014,932 | $ | 3,669,160 | |||
Indebtedness under the notes payable, capital leases and the Bank Credit Agreement as of December 31, 2016 matures as follows (in thousands):
Notes and Bank Credit Agreement | Capital Leases | Total | |||||||||
2017 | $ | 169,247 | $ | 4,845 | $ | 174,092 | |||||
2018 | 156,562 | 4,880 | 161,442 | ||||||||
2019 | 34,674 | 4,989 | 39,663 | ||||||||
2020 | 643,068 | 4,733 | 647,801 | ||||||||
2021 | 1,372,406 | 4,759 | 1,377,165 | ||||||||
2022 and thereafter | 1,820,275 | 28,443 | 1,848,718 | ||||||||
Total minimum payments | 4,196,232 | 52,649 | 4,248,881 | ||||||||
Less: Deferred financing costs and discount | (43,449 | ) | — | (43,449 | ) | ||||||
Less: Amount representing future interest | — | (19,369 | ) | (19,369 | ) | ||||||
Net carrying value of debt | $ | 4,152,783 | $ | 33,280 | $ | 4,186,063 | |||||
As of December 31, 2016, we had 32 capital leases with non-affiliates; including 24 broadcast tower leases and six other non-media equipment leases. All of our tower leases will expire within the next 16 years and the equipment leases expire within the next 5 years. Most of our leases have 5-10 year renewal options and it is expected that these leases will be renewed or replaced within the normal course of business. For information related to our affiliate notes and capital leases, see Note 11. Related Person Transactions.
Interest expense on the Consolidated Statements of Operations was $211.1 million, $191.4 million, and $174.9 million for the years ended December 31, 2016, 2015 and 2014, respectively. Interest expense included $10.8 million, $9.7 million, and $9.3 million in amortization of deferred financing costs and debt discount for the years ended December 31, 2016, 2015 and 2014, respectively.
F-36
7. PROGRAM CONTRACTS:
Future payments required under program contracts as of December 31, 2016 were as follows (in thousands):
2017 | $ | 109,702 | |
2018 | 21,844 | ||
2019 | 14,303 | ||
2020 | 10,924 | ||
2021 | 6,765 | ||
Total | 163,538 | ||
Less: Current portion | 109,702 | ||
Long-term portion of program contracts payable | $ | 53,836 | |
Each future period’s film liability includes contractual amounts owed, however, what is contractually owed does not necessarily reflect what we are expected to pay during that period. While we are contractually bound to make the payments reflected in the table during the indicated periods, industry protocol typically enables us to make film payments on a three months lag. Included in the current portion amount are payments due in arrears of $27.3 million. In addition, we have entered into non-cancelable commitments for future program rights aggregating to $150.9 million as of December 31, 2016.
8. COMMON STOCK:
Holders of Class A Common Stock are entitled to one vote per share and holders of Class B Common Stock are entitled to ten votes per share, except for votes relating to “going private” and certain other transactions. Substantially all of the Class B Common Stock is held by David D. Smith, Frederick G. Smith, J. Duncan Smith and Robert E. Smith who entered into a stockholders’ agreement pursuant to which they have agreed to vote for each other as candidates for election to our board of directors until December 31, 2025. The Class A Common Stock and the Class B Common Stock vote together as a single class, except as otherwise may be required by Maryland law, on all matters presented for a vote. Holders of Class B Common Stock may at any time convert their shares into the same number of shares of Class A Common Stock. During 2016, 257,673 Class B Common Stock shares were converted into Class A Common Stock shares. During 2015, no Class B Common Stock shares were converted into Class A Common Stock shares.
Our Bank Credit Agreement and some of our subordinated debt instruments have restrictions on our ability to pay dividends. Under our Bank Credit Agreement, in certain circumstances, we may make unrestricted cash payments as long as our first lien indebtedness ratio does not exceed 3.75 to 1.00. Once our first lien indebtedness ratio exceeds 3.75 to 1.00, we have the ability to make up to $200.0 million in unrestricted annual cash payments including but not limited to dividends, of which $50.0 million may carry over to the next year, as long as we are in compliance with our first lien indebtedness ratio under the Bank Credit Agreement of 4.00 to 1.00. In addition, we have an aggregate basket of up to $250.0 million, as long as we are in compliance with our first lien indebtedness ratio of 4.00 to 1.00, and an aggregate basket of $50.0 million, as long as no Event of Default has occurred. Under the indentures governing the 6.125% Notes, 5.875% Notes, 5.375% Notes, 5.125% Notes, and 5.625% Notes, we are restricted from paying dividends on our common stock unless certain specified conditions are satisfied, including that:
• | no event of default then exists under each indenture or certain other specified agreements relating to our indebtedness; and |
• | after taking into account the dividends payment, we are within certain restricted payment requirements contained in each indenture. |
In January 2017, we amended certain terms and extended the maturity date of certain loans under our Bank Credit Agreement. See Note. 6 Notes Payable and Commercial Bank Financing for further discussion.
F-37
During 2015, our Board of Directors declared a quarterly dividend of $0.165 per share in the months of February, May, August and November which were paid in March, June, September and December. Total dividend payments for the year ended December 31, 2015 were $0.66 per share. During 2016, our Board of Directors declared a quarterly dividend of $0.165 per share in the month of February which was paid in March. In May, August, and November our Board of Directors declared a quarterly dividend of $0.18 per share. Total dividend payments for the year ended December 31, 2016 were $0.71 per share. In February 2017, our Board of Directors declared a quarterly dividend of $0.18 per share. Future dividends on our common shares, if any, will be at the discretion of our Board of Directors and will depend on several factors including our results of operations, cash requirements and surplus, financial condition, covenant restrictions and other factors that the Board of Directors may deem relevant. The Class A Common Stock and Class B Common Stock holders have the same rights related to dividends.
On March 20, 2014, the Board of Directors approved a $150.0 million share repurchase authorization. On September 6, 2016; the Board of Directors approved an additional $150.0 million share repurchase authorization. There is no expiration date and currently, management has no plans to terminate this program. During 2016, we repurchased approximately 4.9 million shares of Class A Common Stock for approximately $136.4 million on the open market including transaction costs. As of December 31, 2016, the total remaining authorization was $119.1 million.
9. INCOME TAXES:
The provision (benefit) for income taxes consisted of the following for the years ended December 31, 2016, 2015 and 2014 (in thousands):
2016 | 2015 | 2014 | |||||||||
Provision for income taxes | $ | 122,128 | $ | 57,694 | $ | 97,432 | |||||
Current provision for income taxes: | |||||||||||
Federal | $ | 113,737 | $ | 80,420 | $ | 92,609 | |||||
State | 2,273 | 5,720 | 5,641 | ||||||||
116,010 | 86,140 | 98,250 | |||||||||
Deferred provision (benefit) for income taxes: | |||||||||||
Federal | 8,555 | (26,637 | ) | 3,170 | |||||||
State | (2,437 | ) | (1,809 | ) | (3,988 | ) | |||||
6,118 | (28,446 | ) | (818 | ) | |||||||
Provision for income taxes | $ | 122,128 | $ | 57,694 | $ | 97,432 | |||||
The following is a reconciliation of federal income taxes at the applicable statutory rate to the recorded provision:
2016 | 2015 | 2014 | ||||||
Federal statutory rate | 35.0 | % | 35.0 | % | 35.0 | % | ||
Adjustments: | ||||||||
State income taxes, net of federal tax benefit (1) | 0.2 | % | 0.6 | % | (0.1 | )% | ||
Non-deductible items (2) | 1.0 | % | 1.2 | % | 3.4 | % | ||
Domestic Production Activities Deduction | (3.4 | )% | (3.9 | )% | (3.2 | )% | ||
Effect of consolidated VIEs (3) | 1.2 | % | 1.4 | % | 0.8 | % | ||
Changes in unrecognized tax benefits (4) | 0.3 | % | (1.9 | )% | (3.4 | )% | ||
Basis in stock of subsidiaries (5) | — | % | (5.5 | )% | — | % | ||
Federal Research and Development Credit | (0.4 | )% | (1.1 | )% | — | % | ||
Other | (0.6 | )% | (0.6 | )% | (1.0 | )% | ||
Effective income tax rate | 33.3 | % | 25.2 | % | 31.5 | % | ||
_______________________________________________________
(1) | Included in state income taxes are deferred income tax effects related to certain acquisitions and/or intercompany mergers. |
(2) | Included in 2014 is the current income taxes related to the taxable gain on sale of certain broadcast assets, which we acquired with the stock purchase of the Allbritton Companies in the same year. There was no book gain on this sale. |
F-38
Since a deferred tax liability was not established for the excess of book basis over tax basis of goodwill, a deferred tax benefit does not offset the current tax expense.
(3) | Certain of our consolidated VIEs incur expenses that are not attributable to non-controlling interests because we absorb certain related losses of the VIEs. These expenses are not tax-deductible by us, and since these VIEs are treated as pass-through entities for income tax purposes, deferred income tax benefits are not recognized. |
(4) | During the year ended December 31, 2016, 2015, and 2014, we recorded a $1.0 million, $5.7 million, and $10.8 million benefit, respectively, related to the release of liabilities for unrecognized tax benefits as a result of expiration of the applicable statute of limitations and settlements with taxing authorities. See table below which summarizes the activity related to our accrued unrecognized tax benefits. |
(5) | During the year ended December 31, 2015, we recorded a $12.6 million benefit related to the realization of a capital loss upon the sale of the stock of a subsidiary. |
Temporary differences between the financial reporting carrying amounts and the tax bases of assets and liabilities give rise to deferred taxes. Total deferred tax assets and deferred tax liabilities as of December 31, 2016 and 2015 were as follows (in thousands):
2016 | 2015 | ||||||
Deferred Tax Assets: | |||||||
Net operating and capital losses: | |||||||
Federal | $ | 68,455 | $ | 14,884 | |||
State | 63,630 | 65,822 | |||||
Goodwill and intangible assets | 28,879 | 33,979 | |||||
Other | 44,873 | 37,812 | |||||
205,837 | 152,497 | ||||||
Valuation allowance for deferred tax assets | (51,846 | ) | (58,333 | ) | |||
Total deferred tax assets | $ | 153,991 | $ | 94,164 | |||
Deferred Tax Liabilities: | |||||||
Goodwill and intangible assets | $ | (650,139 | ) | $ | (561,812 | ) | |
Property & equipment, net | (80,950 | ) | (76,106 | ) | |||
Contingent interest obligations | (20,277 | ) | (30,575 | ) | |||
Other | (11,942 | ) | (10,743 | ) | |||
Total deferred tax liabilities | (763,308 | ) | (679,236 | ) | |||
Net deferred tax liabilities | $ | (609,317 | ) | $ | (585,072 | ) | |
Our remaining federal and state capital and net operating losses will expire during various years from 2017 to 2036, and some of them are subject to annual limitations under the Internal Revenue Code Section 382 and similar state provisions. As discussed in Income taxes under Note 1. Nature of Operations and Summary of Significant Accounting Policies, we establish valuation allowances in accordance with the guidance related to accounting for income taxes. As of December 31, 2016, a valuation allowance has been provided for deferred tax assets related to a substantial portion of our available state net operating loss carryforwards based on past operating results, expected timing of the reversals of existing temporary book/tax basis differences, alternative tax strategies and projected future taxable income. Although realization is not assured for the remaining deferred tax assets, we believe it is more likely than not that they will be realized in the future. During the year ended December 31, 2016, we decreased our valuation allowance by $6.5 million to $51.8 million. The reduction in valuation allowance was primarily due to changes in estimates of apportionment and a tax rate reduction in certain states. During the year ended December 31, 2015, we decreased our valuation allowance by $0.6 million to $58.3 million. The reduction in valuation allowance was primarily due to changes in estimates of apportionment for certain states. During the year ended December 31, 2014, we increased our valuation allowance by $7.8 million to $58.9 million. The increase in valuation allowance was primarily due to intercompany mergers, effective December 31, 2014, which we expected to decrease the utilization of state NOL carryforwards.
As of December 31, 2016 and 2015, we had $4.7 million and $3.3 million of gross unrecognized tax benefits, respectively. Of this total, for the years ended December 31, 2016 and 2015, $3.9 and $2.6 million (net of federal effect on state tax issues) represent the amounts of unrecognized tax benefits that, if recognized, would favorably affect our effective tax rates.
F-39
The following table summarizes the activity related to our accrued unrecognized tax benefits (in thousands):
2016 | 2015 | 2014 | |||||||||
Balance at January 1, | $ | 3,257 | $ | 7,138 | $ | 16,883 | |||||
Additions related to prior year tax positions | 420 | 1,458 | — | ||||||||
Additions related to current year tax positions | 2,053 | 472 | 1,450 | ||||||||
Reductions related to settlements with taxing authorities | — | (1,517 | ) | (2,910 | ) | ||||||
Reductions related to expiration of the applicable statute of limitations | (991 | ) | (4,294 | ) | (8,285 | ) | |||||
Balance at December 31, | $ | 4,739 | $ | 3,257 | $ | 7,138 | |||||
In addition, we recognize accrued interest and penalties related to unrecognized tax benefits in income tax expense. We recognized $0.2 million, $0.2 million, and $0.7 million of income tax expense for interest related to uncertain tax positions for the years ended December 31, 2016, 2015 and 2014, respectively.
We are subject to U.S. federal income tax as well as income tax of multiple state jurisdictions. All of our 2013 and subsequent federal and state tax returns remain subject to examination by various tax authorities. Some of our pre-2013 federal and state tax returns may also be subject to examination. We do not anticipate the resolution of these matters will result in a material change to our consolidated financial statements. In addition, we don’t believe that our liability for unrecognized tax benefits would be materially impacted, in the next twelve months, as a result of expected statute of limitations expirations, the application of limits under available state administrative practice exceptions, and the resolution of examination issues and settlements with federal and certain state tax authorities.
10. COMMITMENTS AND CONTINGENCIES:
Litigation
We are a party to lawsuits and claims from time to time in the ordinary course of business. Actions currently pending are in various stages and no material judgments or decisions have been rendered by hearing boards or courts in connection with such actions. After reviewing developments to date with legal counsel, our management is of the opinion that none of our pending and threatened matters are material. The FCC has undertaken an investigation in response to a complaint it received alleging possible violations of the FCC’s sponsorship identification rules by the Company and certain of its subsidiaries. We cannot predict the outcome of any potential FCC action related to this matter but it is possible that such action could include fines and/or compliance programs.
Operating Leases
We have entered into operating leases for certain property and equipment under terms ranging from one to 40 years. The rent expense under these leases, as well as certain leases under month-to-month arrangements, for the years ended December 31, 2016, 2015 and 2014 was approximately $26.0 million, $21.7 million and $19.4 million, respectively.
Future minimum payments under the leases are as follows (in thousands):
2017 | $ | 22,627 | |
2018 | 22,267 | ||
2019 | 20,899 | ||
2020 | 20,177 | ||
2021 | 18,752 | ||
2022 and thereafter | 92,019 | ||
$ | 196,741 | ||
F-40
Changes in the Rules on Television Ownership
Certain of our stations have entered into what have commonly been referred to as local marketing agreements or LMAs. One typical type of LMA is a programming agreement between two separately owned television stations serving the same market, whereby the licensee of one station programs substantial portions of the broadcast day and sells advertising time during such programming segments on the other licensee’s station subject to the latter licensee’s ultimate editorial and other controls. We believe these arrangements allow us to reduce our operating expenses and enhance profitability.
In 1999, the FCC established a new local television ownership rule. LMAs fell under this rule, however, the rule grandfathered LMAs that were entered into prior to November 5, 1996, and permitted the applicable stations to continue operations pursuant to the LMAs until the conclusion of the FCC’s 2004 biennial review. The FCC stated it would conduct a case-by-case review of grandfathered LMAs and assess the appropriateness of extending the grandfathering periods. The FCC did not initiate any review of grandfathered LMAs in 2004 or as part of its subsequent quadrennial reviews. We do not know when, or if, the FCC will conduct any such review of grandfathered LMAs. Currently, all of our LMAs are grandfathered under the local television ownership rule because they were entered into prior to November 5, 1996. If the FCC were to eliminate the grandfathering of these LMAs, we would have to terminate or modify these LMAs.
In February 2015, the FCC issued an order implementing certain statutorily required changes to its rules governing the duty to negotiate retransmission consent agreements in good faith. With these changes, a television broadcast station is prohibited from negotiating retransmission consent jointly with another television station in the same market unless the “stations are directly or indirectly under common de jure control permitted under the regulations of the Commission.” During a 2015 retransmission consent negotiation, an MVPD filed a complaint with the FCC accusing us of violating this rule. Although we reached agreement with the MVPD and they withdrew their complaint, the FCC undertook its own internal investigation regarding the allegations made by the MVPD and whether we negotiated in good faith as defined by the rules. In order to resolve the issues raised by the investigation described above and all other pending matters before the FCC's Media Bureau (Bureau), the Company, on July 29, 2016, without any admission of liability, entered into a consent decree with the FCC pursuant to which the Bureau agreed (i) to terminate their investigation regarding the retransmission consent negotiations described above as well as any other investigations pending before the Bureau, (ii) to dismiss with prejudice or deny any outstanding adversarial pleadings against the Company pending before the Bureau, (iii) to cancel outstanding forfeiture orders issued by the Bureau relating to the Company, and (iv) to grant all of the Company’s pending license renewals, subject to a payment by the Company to the United States Treasury in the amount of $9.5 million which was paid in September 2016. In addition, pursuant to the terms of the consent decree, the Company agreed to be subject to ongoing compliance monitoring by the FCC for a period of 36 months.
In September 2015, the FCC released a Notice of Proposed Rulemaking in response to a Congressional directive in STELAR to examine the “totality of the circumstances test” for good-faith negotiations of retransmission consent. The proposed rulemaking seeks comment on new factors and evidence to consider in its evaluation of claims of bad faith negotiation, including service interruptions prior to a “marquee sports or entertainment event,” restrictions on online access to broadcast programming during negotiation impasses, broadcasters’ ability to offer bundles of broadcast signals with other broadcast stations or cable networks, and broadcasters’ ability to invoke the FCC’s exclusivity rules during service interruptions. On July 14, 2016, the FCC’s Chairman announced that the FCC would not, at this time, proceed to adopt additional rules governing good faith negotiations of retransmission consent. No formal action has yet been taken on this Proposed Rulemaking, and we cannot predict if the full Commission will agree to terminate the Rulemaking without action.
In August 2016, the FCC completed both its 2010 and 2014 quadrennial reviews of its media ownership rules and issued an order (the "Ownership Order") which left most of the existing multiple ownership rules intact, but amended the rules to provide that, for JSAs where two television stations are located in the same market, and a party with an attributable ownership interest in the second station. The Ownership Order also requires that JSAs that existed prior to March 31, 2014, may remain in place until October 1, 2025, at which point they must be terminated, amended or otherwise come into compliance with the rules. These "grandfathered" JSAs may be transferred or assigned without losing grandfathering status. Among other things, the new JSA rule could limit our future ability to create duopolies or other two-station operations in certain markets. We cannot predict whether we will be able to terminate or restructure such arrangements prior to October 1, 2025, on terms that are as advantageous to us as the current arrangements. The revenues of these JSA arrangements we earned during the years ended December 31, 2016 and 2015 were $58.6 million and $46.8 million, respectively. The Ownership Order is the subject of an appeal to the U.S. Court of Appeals for the D.C. Circuit and of Petitions for Reconsideration before the FCC. We cannot predict the outcome of that appeal or petitions.
F-41
On September 6, 2016, the FCC released an order eliminating the UHF discount (the UHF Discount Order"). The UHF discount allowed television station owners to discount the coverage of UHF stations when calculating compliance with the FCC’s national ownership cap, which prohibits a single entity from owning television stations that reach, in total, more than 39% of all the television households in the nation. All but 28 of the stations we own and operate, or to which we provide programming services are UHF. As a result of the elimination of the UHF discount, counting all our present stations and pending transactions, we reach over 38% of U.S. households (approximately 24% if the UHF discount was still intact). The changes to the national ownership cap could limit our future ability to make television station acquisitions. The UHF Discount Order is the subject of an appeal to the U.S. Court of Appeals for the D.C. Circuit and a Petition for Reconsideration of the UHF Discount Order has also been filed with the FCC. We cannot predict the outcome of the appeal or the Petitions.
If we are required to terminate or modify our LMAs or JSAs, our business could be affected in the following ways:
Losses on investments. In some cases, we own the non-license assets used by the stations we operate under LMAs and JSAs. If certain of these arrangements are no longer permitted, we could be forced to sell these assets, restructure our agreements or find another use for them. If this happens, the market for such assets may not be as good as when we purchased them and, therefore, we cannot be certain of a favorable return on our original investments.
Termination penalties. If the FCC requires us to modify or terminate existing LMAs or JSAs before the terms of the agreements expire, or under certain circumstances, we elect not to extend the terms of the agreements, we may be forced to pay termination penalties under the terms of some of our agreements. Any such termination penalties could be material.
Congress authorized the FCC to conduct so-called “incentive auctions” to auction and re-purpose broadcast television spectrum for mobile broadband use. Pursuant to the auction, television broadcasters submitted bids to receive compensation for relinquishing all or a portion of its rights in the television spectrum of their full-service and Class A stations. Low power stations were not eligible to participate in the auction and are not protected and therefore may be displaced or forced to go off the air as a result of the post-auction repacking process. This "reverse" portion of the spectrum auction was completed in early 2017. Based on the bids accepted by the FCC, we anticipate that we will receive later in 2017 an estimated $313.0 million of gross proceeds from the auction. The results of the auction are not expected to produce any material change in operations or results of the Company. In the repacking process associated with the auction, the FCC has reassigned some stations to new post-auction channels. We do not expect reassignment to new channels to have a material impact on our coverage. We received letters from the FCC in February 2017 notifying us that 93 of our stations have been assigned to new channels. The legislation authorizing the incentive auction provides the FCC with a $1.75 billion fund to reimburse reasonable costs incurred by stations that are reassigned to new channels in the repack.
F-42
11. RELATED PERSON TRANSACTIONS:
Transactions with our controlling shareholders
David, Frederick, J. Duncan and Robert Smith (collectively, the controlling shareholders) are brothers and hold substantially all of the Class B Common Stock and some of our Class A Common Stock. We engaged in the following transactions with them and/or entities in which they have substantial interests:
Leases. Certain assets used by us and our operating subsidiaries are leased from entities owned by the controlling shareholders. Lease payments made to these entities were $5.1 million for the years ended December 31, 2016, 2015, and 2014.
In September 2015, we were granted authority by the Federal Communications Commission (FCC) to operate an experimental facility in the Washington D.C. and Baltimore markets to implement a Single Frequency Network (SFN) using the base elements of the new ATSC 3.0 transmission standard. In conjunction with this experimental facility, Cunningham Communications, Inc. provides tower space without charge.
Capital leases payable related to the aforementioned relationships consisted of the following as of December 31, 2016 and 2015 (in thousands):
2016 | 2015 | ||||||
Capital lease for building, interest at 8.54% | $ | 1,858 | $ | 3,508 | |||
Capital leases for building, interest at 7.93% | 317 | 679 | |||||
Capital leases for building, interest at 8.11% | 6,934 | 7,432 | |||||
Capital leases for broadcasting tower facilities, interest at 8.0% | 2,396 | 2,749 | |||||
Capital leases for broadcasting tower facilities, interest at 9.0% | 1,755 | 1,958 | |||||
Capital leases for broadcasting tower facilities, interest at 10.5% | 4,525 | 4,690 | |||||
17,785 | 21,016 | ||||||
Less: Current portion | (3,604 | ) | (3,166 | ) | |||
$ | 14,181 | $ | 17,850 | ||||
Capital leases payable related to the aforementioned relationships as of December 31, 2016 mature as follows (in thousands):
2017 | $ | 5,061 | |
2018 | 2,868 | ||
2019 | 2,978 | ||
2020 | 3,093 | ||
2021 | 3,046 | ||
2022 and thereafter | 7,127 | ||
Total minimum payments due | 24,173 | ||
Less: Amount representing interest | (6,388 | ) | |
$ | 17,785 | ||
Charter Aircraft. We lease aircraft owned by certain controlling shareholders, including a new lease agreement as of February 2016 for the term of thirty months and will be renewed thereafter for successive terms of twelve months. For all leases, we incurred expenses of $1.4 million for both of the years ended December 31, 2016 and 2015 and $1.5 million for the year ended December 31, 2014.
Cunningham Broadcasting Corporation
Cunningham owns a portfolio of television stations including: WNUV-TV Baltimore, Maryland; WRGT-TV Dayton, Ohio; WVAH-TV Charleston, West Virginia; WMYA-TV Anderson, South Carolina; WTTE-TV Columbus, Ohio; WDBB-TV Birmingham, Alabama; WBSF-TV Flint, Michigan; and WGTU-TV/WGTQ-TV Traverse City/Cadillac, Michigan (collectively, the Cunningham Stations). Certain of our stations provide services to these Cunningham Stations pursuant to LMAs or JSAs and SSAs. See Note 1. Nature of Operations and Summary of Significant Accounting Policies, for further discussion of the scope of services provided under these types of arrangements.
F-43
The estate of Carolyn C. Smith, the mother of our controlling shareholders, currently owns all of the voting stock of the Cunningham Stations. In 2014, Cunningham purchased the remaining amount of non-voting stock from the controlling shareholders, that was previously distributed from the estate for an aggregate purchase price of $2.0 million. The estate of Mrs. Smith currently owns all of the voting stock. The sale of the voting stock by the estate to an unrelated party is pending approval of the FCC. All of the non-voting stock is owned by trusts for the benefit of the children of our controlling shareholders. We consolidate certain subsidiaries of Cunningham, with which we have variable interests through various arrangements related to the Cunningham Stations discussed further below.
The services provided to WNUV-TV, WMYA-TV, WTTE-TV, WRGT-TV and WVAH-TV are governed by a master agreement which has a current term that expires on July 1, 2023 and there are two additional 5 years renewal terms remaining with final expiration on July 1, 2033. We also executed purchase agreements to acquire the license related assets of these stations from Cunningham, which grant us the right to acquire, and grant Cunningham the right to require us to acquire, subject to applicable FCC rules and regulations, 100% of the capital stock or the assets of these individual subsidiaries of Cunningham. Our applications to acquire these license related assets are pending FCC approval. Pursuant to the terms of this agreement we are obligated to pay Cunningham an annual fee for the television stations equal to the greater of (i) 3% of each station’s annual net broadcast revenue and (ii) $4.7 million. The aggregate purchase price of these television stations increases by 6% annually. A portion of the fee is required to be applied to the purchase price to the extent of the 6% increase. The remaining aggregate purchase price of these stations as of December 31, 2016 was approximately $53.6 million. Additionally, we provide services to WDBB-TV pursuant to an LMA, which expires April 22, 2025, and a purchase option to acquire for $0.2 million. We paid Cunningham under these agreements, $8.9 million, $8.8 million, and $10.8 million for the years ended December 31, 2016, 2015, and 2014, respectively.
The agreements with WBSF-TV and WGTU-TV/WGTQ-TV expire in November 2021 and August 2023, respectively, and each has renewal provisions for successive eight year periods. We earned $5.4 million, $5.8 million, and $6.0 million from the services we performed for these stations for the years ended December 31, 2016, 2015, and 2014, respectively.
As we consolidate the licensees as VIEs, the amounts we earn or pay under the arrangements are eliminated in consolidation and the gross revenues of the stations are reported within our consolidated statement of operations. Our consolidated revenues related to the Cunningham Stations include $114.9 million, $109.5 million and $111.3 million for the years ended December 31, 2016, 2015, and 2014, respectively.
In July 2014, concurrent with the Allbritton acquisition we terminated the LMA with WTAT (FOX) in Charleston, SC and sold to Cunningham the non-license assets related to this station. Although we have no continuing involvement in the operations of the station, because we had consolidated Cunningham Broadcasting Corporation (the parent company) up until September 2014 (see Variable Interest Entities under Note 1. Nature of Operations and Summary of Significant Accounting Policies), the assets of WTAT were not derecognized and the transaction wa accounted for a transaction between consolidated entities, and no gain on sale was recognized. Upon deconsolidation of Cunningham Broadcasting Corporation, the difference between proceeds received for the sale of WTAT and WYZZ, a station we sold to Cunningham in 2013, and the carrying values of the net assets, which was previously eliminated in consolidation, was reflected as an increase to additional paid in capital in the consolidated balance sheet.
During January 2016, Cunningham entered into a promissory note to borrow $19.5 million from us which is included within notes receivable from affiliates on our consolidated balance sheet. The note bears interest at a fixed rate of 5.0% per annum, which is payable quarterly, commencing March 31, 2016. The note matures in January 2021, with additional one-year renewal periods upon our approval.
In April 2016, we entered into an agreement with Cunningham to provide master control equipment and provide master control services to a station in Johnstown, PA with which they have an LMA that expires in April 2019. Cunningham will pay us an initial fee of $0.7 million and $0.2 million annually for master control services plus the cost to maintain and repair the equipment. Also, in August 2016, we entered into an agreement, expiring October 2021, with Cunningham to provide a news share service with their station in Johnstown, PA beginning in October 2016 for an annual fee of $1.0 million per year.
F-44
Atlantic Automotive Corporation
We sold advertising time to and purchased vehicles and related vehicle services from Atlantic Automotive Corporation (Atlantic Automotive), a holding company that owns automobile dealerships and an automobile leasing company. David D. Smith, our President and Chief Executive Officer until January 1, 2017, and now Executive Chairman, has a controlling interest in, and is a member of the Board of Directors of Atlantic Automotive. We received payments for advertising totaling $0.6 million for the year ended December 31, 2016, and $0.4 million for both the years ended December 31, 2015 and 2014. Additionally, Atlantic Automotive leases office space owned by one of our non-media investments which is accounted for under equity method. Atlantic Automotive paid $1.1 million, $1.2 million, and $1.0 million in rent during years ended December 31, 2016, 2015, and 2014, respectively.
Leased property by real estate ventures
Certain of our real estate ventures have entered into leases with entities owned by David Smith to lease restaurant space. There are leases for three restaurants in a building owned by one of our consolidated real estate ventures in Baltimore, MD. Total rent received under these leases was $0.7 million, $0.6 million, and $0.5 million for the years ended December 31, 2016, 2015, and 2014, respectively. Additionally, there is also one lease for a restaurant in a building owned by one of our non-media investments which is accounted for under equity method. Total rent received under this lease was $0.4 million for the year ended December 31, 2016, and $0.3 million for both the years ended December 31, 2015 and 2014.
Payments for services provided by these three restaurants to us was less than $0.1 million for the years ended December 31, 2016, 2015 and 2014.
12. EARNINGS PER SHARE:
The following table reconciles income (numerator) and shares (denominator) used in our computations of earnings per share for the years ended December 31, 2016, 2015 and 2014 (in thousands):
2016 | 2015 | 2014 | |||||||||
Income (Numerator) | |||||||||||
Net Income | $ | 250,762 | $ | 176,099 | $ | 215,115 | |||||
Net income attributable to noncontrolling interests | (5,461 | ) | (4,575 | ) | (2,836 | ) | |||||
Numerator for diluted earnings available to common shareholders | $ | 245,301 | $ | 171,524 | $ | 212,279 | |||||
Shares (Denominator) | |||||||||||
Weighted-average common shares outstanding | 93,567 | 95,003 | 97,114 | ||||||||
Dilutive effect of outstanding stock settled appreciation rights and stock options | 866 | 725 | 705 | ||||||||
Weighted-average common and common equivalent shares outstanding | 94,433 | 95,728 | 97,819 | ||||||||
Potentially dilutive securities which would have an anti-dilutive effect on earnings per share were 0.7 million, 0.1 million, and 0.3 million shares for the years ended December 31, 2016, 2015 and 2014, respectively, and therefore excluded from the diluted effect above. The net earnings per share amounts are the same for Class A and Class B Common Stock because the holders of each class are legally entitled to equal per share distributions whether through dividends or in liquidation.
F-45
13. SEGMENT DATA:
We measure segment performance based on operating income (loss). Our broadcast segment, which is our only reportable segment, includes stations in 81 markets located throughout the continental United States. Other primarily consists of original networks and content, digital and internet solutions, technical services and other non-media investments. All of our businesses included in Other are located within the United States. Corporate costs primarily include our costs to operate as a public company and to operate our corporate headquarters location. Other and Corporate are not reportable segments but are included for reconciliation purposes.
We had approximately $233.3 million and $226.2 million of intercompany loans between broadcast, other and corporate as of December 31, 2016 and 2015, respectively. We had $24.4 million, $23.1 million, and $20.7 million in intercompany interest expense related to intercompany loans between broadcast, other and corporate for the years ended December 31, 2016, 2015 and 2014, respectively. All other intercompany transactions are immaterial.
Financial information for our reportable segment is included in the following tables for the years ended December 31, 2016, 2015 and 2014 (in thousands):
For the year ended December 31, 2016 | Broadcast | Other | Corporate | Consolidated | ||||||||||||
Revenue | $ | 2,530,510 | $ | 206,439 | $ | — | $ | 2,736,949 | ||||||||
Depreciation of property and equipment | 91,573 | 5,772 | 1,184 | 98,529 | ||||||||||||
Amortization of definite-lived intangible assets and other assets | 155,479 | 28,316 | — | 183,795 | ||||||||||||
Amortization of program contract costs and net realizable value adjustments | 127,880 | — | — | 127,880 | ||||||||||||
General and administrative overhead expenses | 67,035 | 2,459 | 4,062 | 73,556 | ||||||||||||
Research and development | — | 4,085 | — | 4,085 | ||||||||||||
Operating income (loss) | 639,422 | (31,258 | ) | (5,311 | ) | 602,853 | ||||||||||
Interest expense | 5,641 | 6,371 | 199,131 | 211,143 | ||||||||||||
Income from equity and cost method investments | — | 1,735 | — | 1,735 | ||||||||||||
Goodwill | 1,933,831 | 56,915 | — | 1,990,746 | ||||||||||||
Assets | 4,815,633 | 866,845 | 280,690 | 5,963,168 | ||||||||||||
Capital expenditures | 78,909 | 8,084 | 7,472 | 94,465 | ||||||||||||
For the year ended December 31, 2015 | Broadcast | Other | Corporate | Consolidated | ||||||||||||
Revenue | $ | 2,118,021 | $ | 101,115 | $ | — | $ | 2,219,136 | ||||||||
Depreciation of property and equipment | 99,616 | 2,753 | 1,064 | 103,433 | ||||||||||||
Amortization of definite-lived intangible assets and other assets | 152,049 | 9,405 | — | 161,454 | ||||||||||||
Amortization of program contract costs and net realizable value adjustments | 124,619 | — | — | 124,619 | ||||||||||||
General and administrative overhead expenses | 55,848 | 2,952 | 5,446 | 64,246 | ||||||||||||
Research and development | — | 12,436 | — | 12,436 | ||||||||||||
Operating income (loss) | 451,015 | (21,800 | ) | (6,479 | ) | 422,736 | ||||||||||
Interest expense | — | 4,955 | 186,492 | 191,447 | ||||||||||||
Income from equity and cost method investments | — | 964 | — | 964 | ||||||||||||
Goodwill | 1,927,705 | 3,388 | — | 1,931,093 | ||||||||||||
Assets | 4,838,531 | 415,278 | 178,506 | 5,432,315 | ||||||||||||
Capital expenditures | 74,902 | 8,909 | 7,610 | 91,421 | ||||||||||||
F-46
For the year ended December 31, 2014 | Broadcast | Other | Corporate | Consolidated | ||||||||||||
Revenue | $ | 1,904,776 | $ | 71,782 | $ | — | $ | 1,976,558 | ||||||||
Depreciation of property and equipment | 99,823 | 2,350 | 1,118 | 103,291 | ||||||||||||
Amortization of definite-lived intangible assets and other assets | 118,654 | 6,842 | — | 125,496 | ||||||||||||
Amortization of program contract costs and net realizable value adjustments | 106,629 | — | — | 106,629 | ||||||||||||
General and administrative overhead expenses | 55,837 | 1,315 | 5,343 | 62,495 | ||||||||||||
Research and development | — | 6,918 | — | 6,918 | ||||||||||||
Operating income (loss) | 511,783 | (10,671 | ) | (6,461 | ) | 494,651 | ||||||||||
Interest expense | — | 4,042 | 170,820 | 174,862 | ||||||||||||
Income from equity and cost method investments | — | 2,313 | — | 2,313 | ||||||||||||
14. FAIR VALUE MEASUREMENTS:
Accounting guidance provides for valuation techniques, such as the market approach (comparable market prices), the income approach (present value of future income or cash flow), and the cost approach (cost to replace the service capacity of an asset or replacement cost). A fair value hierarchy using three broad levels prioritizes the inputs to valuation techniques used to measure fair value. The following is a brief description of those three levels:
• | Level 1: Observable inputs such as quoted prices (unadjusted) in active markets for identical assets or liabilities. |
• | Level 2: Inputs other than quoted prices that are observable for the asset or liability, either directly or indirectly. These include quoted prices for similar assets or liabilities in active markets and quoted prices for identical or similar assets or liabilities in markets that are not active. |
• | Level 3: Unobservable inputs that reflect the reporting entity’s own assumptions. |
The carrying value and fair value of our notes and debentures as of December 31, 2016 and 2015 were as follows (in thousands):
2016 | 2015 | ||||||||||||||
Carrying Value (b) | Fair Value | Carrying Value (b) | Fair Value | ||||||||||||
Level 2: | |||||||||||||||
6.375% Senior Unsecured Notes due 2021 (a) | $ | — | $ | — | $ | 350,000 | $ | 367,325 | |||||||
6.125% Senior Unsecured Notes due 2022 | 500,000 | 521,240 | 500,000 | 512,500 | |||||||||||
5.875% Senior Unsecured Notes due 2026 (a) | 350,000 | 351,456 | — | — | |||||||||||
5.625% Senior Unsecured Notes due 2024 | 550,000 | 562,755 | 550,000 | 539,000 | |||||||||||
5.375% Senior Unsecured Notes due 2021 | 600,000 | 617,892 | 600,000 | 605,658 | |||||||||||
5.125% Senior Unsecured Notes due 2027 (a) | 400,000 | 382,028 | — | — | |||||||||||
Term Loan A | 272,198 | 271,517 | 313,620 | 308,916 | |||||||||||
Term Loan B | 1,365,625 | 1,364,841 | 1,376,007 | 1,365,461 | |||||||||||
Debt of variable interest entities | 23,198 | 23,198 | 26,682 | 26,682 | |||||||||||
Debt of other non-media related subsidiaries | 135,211 | 135,211 | 120,969 | 120,969 | |||||||||||
(a) During the year ended 2016, we redeemed the 6.375% Notes and issued the 5.875% and 5.125% Notes. See Note 6. Notes Payable and Commercial Bank Financing, for additional information.
(b) Amounts are carried net of debt discount and deferred financing costs, which are excluded in the above table, of $43.4 million and $42.3 million as of December 31, 2016 and 2015.
F-47
15. CONDENSED CONSOLIDATED FINANCIAL STATEMENTS:
Sinclair Television Group, Inc. (STG), a wholly-owned subsidiary and the television operating subsidiary of Sinclair Broadcast Group, Inc. (SBG), is the primary obligor under the Bank Credit Agreement, the 5.375% Notes, the 5.625% Notes, 6.125% Notes, 5.875% Notes, 5.125% Notes, and until they were redeemed, the 6.375% Notes. Our Class A Common Stock and Class B Common Stock as of December 31, 2016, were obligations or securities of SBG and not obligations or securities of STG. SBG is a guarantor under the Bank Credit Agreement, the 5.375% Notes, 5.625% Notes, 6.125% Notes, 5.875% Notes, 5.125% Notes, and until they were redeemed, the 6.375% Notes. As of December 31, 2016, our consolidated total debt of $4,203.8 million included $4,066.8 million of debt related to STG and its subsidiaries of which SBG guaranteed $4,018.0 million.
SBG, KDSM, LLC, a wholly-owned subsidiary of SBG, and STG’s wholly-owned subsidiaries (guarantor subsidiaries), have fully and unconditionally guaranteed, subject to certain customary automatic release provisions, all of STG’s obligations. Those guarantees are joint and several. There are certain contractual restrictions on the ability of SBG, STG or KDSM, LLC to obtain funds from their subsidiaries in the form of dividends or loans.
The following condensed consolidating financial statements present the consolidated balance sheets, consolidated statements of operations and comprehensive income, and consolidated statements of cash flows of SBG, STG, KDSM, LLC and the guarantor subsidiaries, the direct and indirect non-guarantor subsidiaries of SBG and the eliminations necessary to arrive at our information on a consolidated basis.
These statements are presented in accordance with the disclosure requirements under SEC Regulation S-X, Rule 3-10.
F-48
CONDENSED CONSOLIDATED BALANCE SHEET
AS OF DECEMBER 31, 2016
(In thousands)
Sinclair Broadcast Group, Inc. | Sinclair Television Group, Inc. | Guarantor Subsidiaries and KDSM, LLC | Non- Guarantor Subsidiaries | Eliminations | Sinclair Consolidated | ||||||||||||||||||
Cash and cash equivalents | $ | — | $ | 232,297 | $ | 10,675 | $ | 17,012 | $ | — | $ | 259,984 | |||||||||||
Accounts and other receivables | — | — | 478,190 | 37,024 | (1,260 | ) | 513,954 | ||||||||||||||||
Other current assets | 5,561 | 3,143 | 124,313 | 25,406 | (27,273 | ) | 131,150 | ||||||||||||||||
Total current assets | 5,561 | 235,440 | 613,178 | 79,442 | (28,533 | ) | 905,088 | ||||||||||||||||
Property and equipment, net | 1,820 | 17,925 | 570,289 | 131,326 | (3,784 | ) | 717,576 | ||||||||||||||||
Investment in consolidated subsidiaries | 551,250 | 3,614,605 | 4,179 | — | (4,170,034 | ) | — | ||||||||||||||||
Other long-term assets | 46,586 | 819,506 | 103,808 | 169,817 | (890,668 | ) | 249,049 | ||||||||||||||||
Goodwill | — | — | 1,986,467 | 4,279 | — | 1,990,746 | |||||||||||||||||
Indefinite-lived intangible assets | — | — | 140,597 | 15,709 | — | 156,306 | |||||||||||||||||
Definite-lived intangible assets | — | — | 1,770,512 | 233,368 | (59,477 | ) | 1,944,403 | ||||||||||||||||
Total assets | $ | 605,217 | $ | 4,687,476 | $ | 5,189,030 | $ | 633,941 | $ | (5,152,496 | ) | $ | 5,963,168 | ||||||||||
Accounts payable and accrued liabilities | $ | 100 | $ | 69,118 | $ | 225,645 | $ | 48,815 | $ | (21,173 | ) | $ | 322,505 | ||||||||||
Current portion of long-term debt | — | 55,501 | 1,851 | 113,779 | — | 171,131 | |||||||||||||||||
Current portion of affiliate long-term debt | 1,857 | — | 1,514 | 2,336 | (2,103 | ) | 3,604 | ||||||||||||||||
Other current liabilities | — | — | 127,967 | 13,590 | (2,324 | ) | 139,233 | ||||||||||||||||
Total current liabilities | 1,957 | 124,619 | 356,977 | 178,520 | (25,600 | ) | 636,473 | ||||||||||||||||
Long-term debt | — | 3,939,463 | 31,014 | 44,455 | — | 4,014,932 | |||||||||||||||||
Affiliate long-term debt | — | — | 12,663 | 396,957 | (395,439 | ) | 14,181 | ||||||||||||||||
Other liabilities | 15,277 | 31,817 | 1,190,717 | 183,418 | (681,583 | ) | 739,646 | ||||||||||||||||
Total liabilities | 17,234 | 4,095,899 | 1,591,371 | 803,350 | (1,102,622 | ) | 5,405,232 | ||||||||||||||||
Total Sinclair Broadcast Group equity | 587,983 | 591,577 | 3,597,659 | (134,991 | ) | (4,054,245 | ) | 587,983 | |||||||||||||||
Noncontrolling interests in consolidated subsidiaries | — | — | — | (34,418 | ) | 4,371 | (30,047 | ) | |||||||||||||||
Total liabilities and equity | $ | 605,217 | $ | 4,687,476 | $ | 5,189,030 | $ | 633,941 | $ | (5,152,496 | ) | $ | 5,963,168 | ||||||||||
F-49
CONDENSED CONSOLIDATED BALANCE SHEET
AS OF DECEMBER 31, 2015
(In thousands)
Sinclair Broadcast Group, Inc. | Sinclair Television Group, Inc. | Guarantor Subsidiaries and KDSM, LLC | Non- Guarantor Subsidiaries | Eliminations | Sinclair Consolidated | ||||||||||||||||||
Cash and cash equivalents | $ | — | $ | 115,771 | $ | 235 | $ | 33,966 | $ | — | $ | 149,972 | |||||||||||
Accounts and other receivables | — | 1,775 | 390,142 | 33,949 | (1,258 | ) | 424,608 | ||||||||||||||||
Other current assets | 3,648 | 5,172 | 99,118 | 23,278 | (4,033 | ) | 127,183 | ||||||||||||||||
Total current assets | 3,648 | 122,718 | 489,495 | 91,193 | (5,291 | ) | 701,763 | ||||||||||||||||
Property and equipment, net | 2,884 | 20,336 | 559,042 | 143,667 | (8,792 | ) | 717,137 | ||||||||||||||||
Investment in consolidated subsidiaries | 497,262 | 3,430,434 | 4,179 | — | (3,931,875 | ) | — | ||||||||||||||||
Other long-term assets | 52,128 | 673,915 | 110,507 | 140,910 | (779,173 | ) | 198,287 | ||||||||||||||||
Goodwill | — | — | 1,926,814 | 4,279 | — | 1,931,093 | |||||||||||||||||
Indefinite-lived intangible assets | — | — | 114,841 | 17,624 | — | 132,465 | |||||||||||||||||
Definite-lived intangible assets | — | — | 1,602,454 | 206,975 | (57,859 | ) | 1,751,570 | ||||||||||||||||
Total assets | $ | 555,922 | $ | 4,247,403 | $ | 4,807,332 | $ | 604,648 | $ | (4,782,990 | ) | $ | 5,432,315 | ||||||||||
Accounts payable and accrued liabilities | $ | 104 | $ | 49,428 | $ | 179,156 | $ | 27,462 | $ | (4,837 | ) | $ | 251,313 | ||||||||||
Current portion of long-term debt | — | 57,640 | 1,611 | 106,358 | (1,425 | ) | 164,184 | ||||||||||||||||
Current portion of affiliate long-term debt | 1,651 | — | 1,311 | 456 | (252 | ) | 3,166 | ||||||||||||||||
Other current liabilities | — | — | 103,627 | 12,713 | — | 116,340 | |||||||||||||||||
Total current liabilities | 1,755 | 107,068 | 285,705 | 146,989 | (6,514 | ) | 535,003 | ||||||||||||||||
Long-term debt | — | 3,594,218 | 32,743 | 42,199 | — | 3,669,160 | |||||||||||||||||
Affiliate long-term debt | 1,857 | — | 14,240 | 366,042 | (364,289 | ) | 17,850 | ||||||||||||||||
Other liabilities | 26,500 | 28,866 | 1,060,211 | 171,102 | (576,055 | ) | 710,624 | ||||||||||||||||
Total liabilities | 30,112 | 3,730,152 | 1,392,899 | 726,332 | (946,858 | ) | 4,932,637 | ||||||||||||||||
Total Sinclair Broadcast Group equity | 525,810 | 517,251 | 3,414,433 | (91,703 | ) | (3,839,981 | ) | 525,810 | |||||||||||||||
Noncontrolling interests in consolidated subsidiaries | — | — | — | (29,981 | ) | 3,849 | (26,132 | ) | |||||||||||||||
Total liabilities and equity | $ | 555,922 | $ | 4,247,403 | $ | 4,807,332 | $ | 604,648 | $ | (4,782,990 | ) | $ | 5,432,315 | ||||||||||
F-50
CONDENSED CONSOLIDATED STATEMENT OF OPERATIONS AND COMPREHENSIVE INCOME
FOR THE YEAR ENDED DECEMBER 31, 2016
(In thousands)
Sinclair Broadcast Group, Inc. | Sinclair Television Group, Inc. | Guarantor Subsidiaries and KDSM, LLC | Non- Guarantor Subsidiaries | Eliminations | Sinclair Consolidated | ||||||||||||||||||
Net revenue | $ | — | $ | — | $ | 2,579,284 | $ | 265,855 | $ | (108,190 | ) | $ | 2,736,949 | ||||||||||
Media production expenses | — | — | 918,200 | 135,511 | (100,622 | ) | 953,089 | ||||||||||||||||
Selling, general and administrative | 4,062 | 70,503 | 489,882 | 10,804 | (106 | ) | 575,145 | ||||||||||||||||
Depreciation, amortization and other operating expenses | 1,064 | 7,331 | 465,680 | 133,810 | (2,023 | ) | 605,862 | ||||||||||||||||
Total operating expenses | 5,126 | 77,834 | 1,873,762 | 280,125 | (102,751 | ) | 2,134,096 | ||||||||||||||||
Operating (loss) income | (5,126 | ) | (77,834 | ) | 705,522 | (14,270 | ) | (5,439 | ) | 602,853 | |||||||||||||
Equity in earnings of consolidated subsidiaries | 244,580 | 463,598 | 220 | — | (708,398 | ) | — | ||||||||||||||||
Interest expense | (238 | ) | (198,893 | ) | (4,481 | ) | (32,521 | ) | 24,990 | (211,143 | ) | ||||||||||||
Other income (expense) | 3,613 | (22,867 | ) | 715 | (281 | ) | — | (18,820 | ) | ||||||||||||||
Total other income (expense) | 247,955 | 241,838 | (3,546 | ) | (32,802 | ) | (683,408 | ) | (229,963 | ) | |||||||||||||
Income tax benefit (provision) | 2,472 | 99,148 | (231,504 | ) | 7,756 | — | (122,128 | ) | |||||||||||||||
Net income (loss) | 245,301 | 263,152 | 470,472 | (39,316 | ) | (688,847 | ) | 250,762 | |||||||||||||||
Net income attributable to the noncontrolling interests | — | — | — | (4,937 | ) | (524 | ) | (5,461 | ) | ||||||||||||||
Net income (loss) attributable to Sinclair Broadcast Group | $ | 245,301 | $ | 263,152 | $ | 470,472 | $ | (44,253 | ) | $ | (689,371 | ) | $ | 245,301 | |||||||||
Comprehensive income (loss) | $ | 250,789 | $ | 263,179 | $ | 470,472 | $ | (39,316 | ) | $ | (694,335 | ) | $ | 250,789 | |||||||||
F-51
CONDENSED CONSOLIDATED STATEMENT OF OPERATIONS AND COMPREHENSIVE INCOME
FOR THE YEAR ENDED DECEMBER 31, 2015
(In thousands)
Sinclair Broadcast Group, Inc. | Sinclair Television Group, Inc. | Guarantor Subsidiaries and KDSM, LLC | Non- Guarantor Subsidiaries | Eliminations | Sinclair Consolidated | ||||||||||||||||||
Net revenue | $ | — | $ | — | $ | 2,076,851 | $ | 221,633 | $ | (79,348 | ) | $ | 2,219,136 | ||||||||||
Media production expenses | — | — | 725,037 | 82,450 | (74,288 | ) | 733,199 | ||||||||||||||||
Selling, general and administrative | 4,441 | 58,543 | 418,885 | 14,272 | (167 | ) | 495,974 | ||||||||||||||||
Depreciation, amortization and other operating expenses | 1,065 | 3,779 | 433,690 | 131,373 | (2,680 | ) | 567,227 | ||||||||||||||||
Total operating expenses | 5,506 | 62,322 | 1,577,612 | 228,095 | (77,135 | ) | 1,796,400 | ||||||||||||||||
Operating (loss) income | (5,506 | ) | (62,322 | ) | 499,239 | (6,462 | ) | (2,213 | ) | 422,736 | |||||||||||||
Equity in earnings of consolidated subsidiaries | 170,104 | 343,183 | 195 | — | (513,482 | ) | — | ||||||||||||||||
Interest expense | (382 | ) | (180,166 | ) | (4,658 | ) | (30,022 | ) | 23,781 | (191,447 | ) | ||||||||||||
Other income (expense) | 4,765 | (151 | ) | 269 | (2,379 | ) | — | 2,504 | |||||||||||||||
Total other income (expense) | 174,487 | 162,866 | (4,194 | ) | (32,401 | ) | (489,701 | ) | (188,943 | ) | |||||||||||||
Income tax benefit (provision) | 2,543 | 81,626 | (146,331 | ) | 4,468 | — | (57,694 | ) | |||||||||||||||
Net income (loss) | 171,524 | 182,170 | 348,714 | (34,395 | ) | (491,914 | ) | 176,099 | |||||||||||||||
Net income attributable to the noncontrolling interests | — | — | — | (4,914 | ) | 339 | (4,575 | ) | |||||||||||||||
Net income (loss) attributable to Sinclair Broadcast Group | $ | 171,524 | $ | 182,170 | $ | 348,714 | $ | (39,309 | ) | $ | (491,575 | ) | $ | 171,524 | |||||||||
Comprehensive income (loss) | $ | 181,720 | $ | 187,791 | $ | 351,760 | $ | (39,309 | ) | $ | (500,242 | ) | $ | 181,720 | |||||||||
F-52
CONDENSED CONSOLIDATED STATEMENT OF OPERATIONS AND COMPREHENSIVE INCOME
FOR THE YEAR ENDED DECEMBER 31, 2014
(In thousands)
Sinclair Broadcast Group, Inc. | Sinclair Television Group, Inc. | Guarantor Subsidiaries and KDSM, LLC | Non- Guarantor Subsidiaries | Eliminations | Sinclair Consolidated | ||||||||||||||||||
Net revenue | $ | — | $ | — | $ | 1,870,408 | $ | 192,616 | $ | (86,466 | ) | $ | 1,976,558 | ||||||||||
Media production expenses | — | 76 | 573,725 | 86,266 | (81,380 | ) | 578,687 | ||||||||||||||||
Selling, general and administrative | 4,320 | 57,799 | 359,880 | 14,795 | (2,079 | ) | 434,715 | ||||||||||||||||
Depreciation, amortization and other operating expenses | 1,068 | 5,425 | 367,514 | 96,265 | (1,767 | ) | 468,505 | ||||||||||||||||
Total operating expenses | 5,388 | 63,300 | 1,301,119 | 197,326 | (85,226 | ) | 1,481,907 | ||||||||||||||||
Operating (loss) income | (5,388 | ) | (63,300 | ) | 569,289 | (4,710 | ) | (1,240 | ) | 494,651 | |||||||||||||
Equity in earnings of consolidated subsidiaries | 211,782 | 373,228 | (201 | ) | — | (584,809 | ) | — | |||||||||||||||
Interest expense | (573 | ) | (163,347 | ) | (4,869 | ) | (27,364 | ) | 21,291 | (174,862 | ) | ||||||||||||
Other income (expense) | 4,377 | (14,651 | ) | 998 | 2,024 | 10 | (7,242 | ) | |||||||||||||||
Total other income (expense) | 215,586 | 195,230 | (4,072 | ) | (25,340 | ) | (563,508 | ) | (182,104 | ) | |||||||||||||
Income tax benefit (provision) | 2,081 | 83,897 | (185,193 | ) | 1,783 | — | (97,432 | ) | |||||||||||||||
Income from discontinued operations, net of tax | — | — | — | — | — | — | |||||||||||||||||
Net income (loss) | 212,279 | 215,827 | 380,024 | (28,267 | ) | (564,748 | ) | 215,115 | |||||||||||||||
Net income attributable to the noncontrolling interests | — | — | — | (2,836 | ) | — | (2,836 | ) | |||||||||||||||
Net income (loss) attributable to Sinclair Broadcast Group | $ | 212,279 | $ | 215,827 | $ | 380,024 | $ | (31,103 | ) | $ | (564,748 | ) | $ | 212,279 | |||||||||
Comprehensive income (loss) | $ | 211,759 | $ | 213,284 | $ | 378,926 | $ | (27,982 | ) | $ | (564,228 | ) | $ | 211,759 | |||||||||
F-53
CONDENSED CONSOLIDATED STATEMENT OF CASH FLOWS
FOR THE YEAR ENDED DECEMBER 31, 2016
(In thousands)
Sinclair Broadcast Group, Inc. | Sinclair Television Group, Inc. | Guarantor Subsidiaries and KDSM, LLC | Non- Guarantor Subsidiaries | Eliminations | Sinclair Consolidated | ||||||||||||||||||
NET CASH FLOWS (USED IN) FROM OPERATING ACTIVITIES | $ | (11,784 | ) | $ | (150,230 | ) | $ | 721,991 | $ | 7,914 | $ | 23,875 | 591,766 | ||||||||||
CASH FLOWS (USED IN) FROM INVESTING ACTIVITIES: | |||||||||||||||||||||||
Acquisition of property and equipment | — | (8,006 | ) | (82,450 | ) | (5,009 | ) | 1,000 | (94,465 | ) | |||||||||||||
Payments for acquisition of television stations | — | — | (415,482 | ) | (10,375 | ) | — | (425,857 | ) | ||||||||||||||
Purchase of alarm monitoring contracts | — | — | — | (40,206 | ) | — | (40,206 | ) | |||||||||||||||
Proceeds from sale of assets | — | — | 7,263 | 9,133 | — | 16,396 | |||||||||||||||||
Investments in equity and cost method investees | (2,945 | ) | (15,620 | ) | (27 | ) | (32,655 | ) | — | (51,247 | ) | ||||||||||||
Other, net | 1,714 | (21,395 | ) | 3,985 | 5,072 | — | (10,624 | ) | |||||||||||||||
Net cash flows (used in) from investing activities | (1,231 | ) | (45,021 | ) | (486,711 | ) | (74,040 | ) | 1,000 | (606,003 | ) | ||||||||||||
CASH FLOWS FROM (USED IN) FINANCING ACTIVITIES: | |||||||||||||||||||||||
Proceeds from notes payable, commercial bank financing and capital leases | — | 995,000 | — | 29,912 | — | 1,024,912 | |||||||||||||||||
Repayments of notes payable, commercial bank financing and capital leases | — | (650,422 | ) | (1,633 | ) | (19,160 | ) | — | (671,215 | ) | |||||||||||||
Dividends paid on Class A and Class B Common Stock | (65,909 | ) | — | — | — | — | (65,909 | ) | |||||||||||||||
Repurchase of outstanding Class A Common Stock | (136,283 | ) | — | — | — | — | (136,283 | ) | |||||||||||||||
Payments for deferred financing cost | — | (15,430 | ) | — | (251 | ) | — | (15,681 | ) | ||||||||||||||
Noncontrolling interests distributions | — | — | — | (10,464 | ) | — | (10,464 | ) | |||||||||||||||
Increase (decrease) in intercompany payables | 218,054 | (17,778 | ) | (224,551 | ) | 49,403 | (25,128 | ) | — | ||||||||||||||
Other, net | (2,847 | ) | 407 | 1,344 | (268 | ) | 253 | (1,111 | ) | ||||||||||||||
Net cash flows (used in) from financing activities | 13,015 | 311,777 | (224,840 | ) | 49,172 | (24,875 | ) | 124,249 | |||||||||||||||
NET INCREASE (DECREASE) IN CASH AND CASH EQUIVALENTS | — | 116,526 | 10,440 | (16,954 | ) | — | 110,012 | ||||||||||||||||
CASH AND CASH EQUIVALENTS, beginning of period | — | 115,771 | 235 | 33,966 | — | 149,972 | |||||||||||||||||
CASH AND CASH EQUIVALENTS, end of period | $ | — | $ | 232,297 | $ | 10,675 | $ | 17,012 | $ | — | $ | 259,984 | |||||||||||
F-54
CONDENSED CONSOLIDATED STATEMENT OF CASH FLOWS
FOR THE YEAR ENDED DECEMBER 31, 2015
(In thousands)
Sinclair Broadcast Group, Inc. | Sinclair Television Group, Inc. | Guarantor Subsidiaries and KDSM, LLC | Non- Guarantor Subsidiaries | Eliminations | Sinclair Consolidated | ||||||||||||||||||
NET CASH FLOWS (USED IN) FROM OPERATING ACTIVITIES | $ | (3,759 | ) | $ | (131,363 | ) | $ | 530,768 | $ | (16,864 | ) | $ | 24,145 | $ | 402,927 | ||||||||
CASH FLOWS (USED IN) FROM INVESTING ACTIVITIES: | |||||||||||||||||||||||
Acquisition of property and equipment | — | (6,605 | ) | (84,079 | ) | (2,586 | ) | 1,849 | (91,421 | ) | |||||||||||||
Payments for acquisition of television stations | — | — | (17,011 | ) | — | — | (17,011 | ) | |||||||||||||||
Purchase of alarm monitoring contracts | — | — | — | (39,185 | ) | — | (39,185 | ) | |||||||||||||||
Proceeds from sale of broadcast assets | — | — | 23,650 | — | — | 23,650 | |||||||||||||||||
Investments in equity and cost method investees | — | (8,998 | ) | (27 | ) | (35,690 | ) | — | (44,715 | ) | |||||||||||||
Other, net | 4,598 | (5,447 | ) | 575 | 17,645 | — | 17,371 | ||||||||||||||||
Net cash flows (used in) from investing activities | 4,598 | (21,050 | ) | (76,892 | ) | (59,816 | ) | 1,849 | (151,311 | ) | |||||||||||||
CASH FLOWS FROM (USED IN) FINANCING ACTIVITIES: | |||||||||||||||||||||||
Proceeds from notes payable, commercial bank financing and capital leases | — | 349,562 | — | 33,325 | — | 382,887 | |||||||||||||||||
Repayments of notes payable, commercial bank financing and capital leases | (528 | ) | (382,691 | ) | (1,286 | ) | (10,642 | ) | — | (395,147 | ) | ||||||||||||
Dividends paid on Class A and Class B Common Stock | (62,733 | ) | — | — | — | — | (62,733 | ) | |||||||||||||||
Repurchase of outstanding Class A Common Stock | (28,823 | ) | — | — | — | — | (28,823 | ) | |||||||||||||||
Payments for deferred financing costs | — | (3,604 | ) | — | (243 | ) | — | (3,847 | ) | ||||||||||||||
Noncontrolling interest distributions | — | — | — | (9,918 | ) | — | (9,918 | ) | |||||||||||||||
Increase (decrease) in intercompany payables | 89,319 | 303,755 | (452,897 | ) | 85,953 | (26,130 | ) | — | |||||||||||||||
Other, net | 1,926 | (2,232 | ) | (1,207 | ) | (368 | ) | 136 | (1,745 | ) | |||||||||||||
Net cash flows (used in) from financing activities | (839 | ) | 264,790 | (455,390 | ) | 98,107 | (25,994 | ) | (119,326 | ) | |||||||||||||
NET INCREASE (DECREASE) IN CASH AND CASH EQUIVALENTS | — | 112,377 | (1,514 | ) | 21,427 | — | 132,290 | ||||||||||||||||
CASH AND CASH EQUIVALENTS, beginning of period | — | 3,394 | 1,749 | 12,539 | — | 17,682 | |||||||||||||||||
CASH AND CASH EQUIVALENTS, end of period | $ | — | $ | 115,771 | $ | 235 | $ | 33,966 | $ | — | $ | 149,972 | |||||||||||
F-55
CONDENSED CONSOLIDATED STATEMENT OF CASH FLOWS
FOR THE YEAR ENDED DECEMBER 31, 2014
(In thousands)
Sinclair Broadcast Group, Inc. | Sinclair Television Group, Inc. | Guarantor Subsidiaries and KDSM, LLC | Non- Guarantor Subsidiaries | Eliminations | Sinclair Consolidated | ||||||||||||||||||
NET CASH FLOWS (USED IN) FROM OPERATING ACTIVITIES | $ | (26,528 | ) | $ | (145,795 | ) | $ | 628,103 | $ | (35,694 | ) | $ | 12,513 | $ | 432,599 | ||||||||
CASH FLOWS (USED IN) FROM INVESTING ACTIVITIES: | |||||||||||||||||||||||
Acquisition of property and equipment | — | (8,864 | ) | (71,152 | ) | (2,722 | ) | 1,280 | (81,458 | ) | |||||||||||||
Payments for acquisition of television stations | — | — | (1,485,039 | ) | — | — | (1,485,039 | ) | |||||||||||||||
Purchase of alarm monitoring contracts | — | — | — | (27,701 | ) | — | (27,701 | ) | |||||||||||||||
Proceeds from sale of broadcast assets | — | — | 176,675 | — | — | 176,675 | |||||||||||||||||
Decrease in restricted cash | — | 11,525 | 91 | — | — | 11,616 | |||||||||||||||||
Investments in equity and cost method investees | — | — | — | (8,104 | ) | — | (8,104 | ) | |||||||||||||||
Proceeds from insurance settlement | — | 17,042 | — | — | — | 17,042 | |||||||||||||||||
Other, net | 1,000 | — | 392 | (1,779 | ) | — | (387 | ) | |||||||||||||||
Net cash flows (used in) from investing activities | 1,000 | 19,703 | (1,379,033 | ) | (40,306 | ) | 1,280 | (1,397,356 | ) | ||||||||||||||
CASH FLOWS FROM (USED IN) FINANCING ACTIVITIES: | |||||||||||||||||||||||
Proceeds from notes payable, commercial bank financing and capital leases | — | 1,466,500 | 507 | 33,713 | — | 1,500,720 | |||||||||||||||||
Repayments of notes payable, commercial bank financing and capital leases | (556 | ) | (574,584 | ) | (1,028 | ) | (6,596 | ) | — | (582,764 | ) | ||||||||||||
Dividends paid on Class A and Class B Common Stock | (61,103 | ) | — | — | — | — | (61,103 | ) | |||||||||||||||
Repurchases of outstanding Class A Common Stock | (133,157 | ) | — | — | — | — | (133,157 | ) | |||||||||||||||
Payments for deferred financing costs | — | (16,590 | ) | — | — | — | (16,590 | ) | |||||||||||||||
Noncontrolling interest distributions | — | — | — | (8,184 | ) | — | (8,184 | ) | |||||||||||||||
Increase (decrease) in intercompany payables | 218,081 | (981,669 | ) | 725,678 | 51,703 | (13,793 | ) | — | |||||||||||||||
Other, net | 2,263 | (2,145 | ) | (1,072 | ) | 4,367 | — | 3,413 | |||||||||||||||
Net cash flows (used in) from financing activities | 25,528 | (108,488 | ) | 724,085 | 75,003 | (13,793 | ) | 702,335 | |||||||||||||||
NET INCREASE (DECREASE) IN CASH AND CASH EQUIVALENTS | — | (234,580 | ) | (26,845 | ) | (997 | ) | — | (262,422 | ) | |||||||||||||
CASH AND CASH EQUIVALENTS, beginning of period | — | 237,974 | 28,594 | 13,536 | — | 280,104 | |||||||||||||||||
CASH AND CASH EQUIVALENTS, end of period | $ | — | $ | 3,394 | $ | 1,749 | $ | 12,539 | $ | — | $ | 17,682 | |||||||||||
F-56
QUARTERLY FINANCIAL INFORMATION (UNAUDITED):
(In thousands, except per share data)
For the Quarter Ended | |||||||||||||||
3/31/2016 | 6/30/2016 | 9/30/2016 | 12/31/2016 | ||||||||||||
Total revenues, net | $ | 578,889 | $ | 666,534 | $ | 693,835 | $ | 797,691 | |||||||
Operating income | $ | 86,339 | $ | 129,074 | $ | 153,994 | $ | 233,446 | |||||||
Net income | $ | 25,629 | $ | 50,600 | $ | 52,033 | $ | 122,500 | |||||||
Net income attributable to Sinclair Broadcast Group | $ | 24,140 | $ | 49,419 | $ | 50,845 | $ | 120,897 | |||||||
Basic earnings per common share | $ | 0.25 | $ | 0.52 | $ | 0.54 | $ | 1.34 | |||||||
Diluted earnings per common share | $ | 0.25 | $ | 0.52 | $ | 0.54 | $ | 1.32 | |||||||
For the Quarter Ended | |||||||||||||||
3/31/2015 | 6/30/2015 | 9/30/2015 | 12/31/2015 | ||||||||||||
Total revenues, net | $ | 504,775 | $ | 554,167 | $ | 548,404 | $ | 611,790 | |||||||
Operating income | $ | 84,547 | $ | 114,340 | $ | 99,606 | $ | 124,243 | |||||||
Net income | $ | 24,836 | $ | 46,399 | $ | 44,034 | $ | 60,830 | |||||||
Net income attributable to Sinclair Broadcast Group | $ | 24,282 | $ | 45,787 | $ | 43,255 | $ | 58,200 | |||||||
Basic earnings per common share | $ | 0.26 | $ | 0.48 | $ | 0.46 | $ | 0.62 | |||||||
Diluted earnings per common share | $ | 0.25 | $ | 0.48 | $ | 0.45 | $ | 0.61 | |||||||
F-57