Attached files
| file | filename |
|---|---|
| EX-32.2 - JIVE-12.31.2016-EX32.2 - Jive Software, Inc. | jive-12312016xex322.htm |
| EX-32.1 - JIVE-12.31.2016-EX32.1 - Jive Software, Inc. | jive-12312016xex321.htm |
| EX-31.2 - JIVE-12.31.2016-EX31.2 - Jive Software, Inc. | jive-12312016xex312.htm |
| EX-31.1 - JIVE-12.31.2016-EX31.1 - Jive Software, Inc. | jive-12312016xex311.htm |
| EX-23.1 - JIVE-12.31.2016-EX23.1 - Jive Software, Inc. | jive-12312016xex231.htm |
| EX-21.1 - JIVE-12.31.2016-EX21.1 - Jive Software, Inc. | jive-12312016xex211.htm |
| EX-10.12 - JIVE-12.31.2016-EX10.12 - Jive Software, Inc. | jive-12312016xex1012.htm |
| EX-10.11 - JIVE-12.31.2016-EX10.11 - Jive Software, Inc. | jive-12312016xex1011.htm |
UNITED STATES
SECURITIES AND EXCHANGE COMMISSION
WASHINGTON, D.C. 20549
________________________
FORM 10-K
________________________
ý ANNUAL REPORT PURSUANT TO SECTION 13 OR 15(d) OF THE SECURITIES EXCHANGE ACT OF 1934
For the Fiscal Year Ended: December 31, 2016
OR
¨ TRANSITION REPORT PURSUANT TO SECTION 13 OR 15(d) OF THE SECURITIES EXCHANGE ACT OF 1934
Commission File Number: 001-35367
________________________
JIVE SOFTWARE, INC.
(Exact name of registrant as specified in its charter)
________________________
Delaware | 42-1515522 | |
(State or other jurisdiction of incorporation or organization) | (I.R.S. Employer Identification No.) | |
325 Lytton Avenue, Suite 200, Palo Alto, California | 94301 | |
(Address of principal executive offices) | (Zip Code) | |
Registrant’s telephone number, including area code: 650-319-1920
Securities Registered pursuant to Section 12(b) of the Act:
Title of each class | Name of each exchange on which registered | |
Common Stock, $0.0001 par value per share | The NASDAQ Global Select Market | |
Securities registered pursuant to Section 12(g) of the Act: None
________________________
Indicate by check mark if the Registrant is a well-known seasoned issuer, as defined in Rule 405 of the Securities Act: Yes ¨ No ý
Indicate by check mark if the Registrant is not required to file reports pursuant to Section 13 or Section 15(d) of the Act: Yes ¨ No ý
Indicate by check mark whether the Registrant (1) has filed all reports required to be filed by Section 13 or 15(d) of the Securities Exchange Act of 1934 during the preceding 12 months (or for such shorter period that the Registrant was required to file such reports), and (2) has been subject to such filing requirements for the past 90 days. Yes ý No ¨
Indicate by check mark whether the registrant has submitted electronically and posted on its corporate Web site, if any, every Interactive Data File required to be submitted and posted pursuant to Rule 405 of Regulation S-T (§ 229.405 of this chapter) during the preceding 12 months (or for such shorter period that the registrant was required to submit and post such files). Yes ý No ¨
Indicate by check mark if disclosure of delinquent filers pursuant to Item 405 of Regulation S-K is not contained herein, and will not be contained, to the best of Registrant’s knowledge, in definitive proxy or information statements incorporated by reference in Part III of this Form 10-K, or any amendment to this Form 10-K. ¨
Indicate by check mark whether the registrant is a large accelerated filer, an accelerated filer, a non-accelerated filer or a smaller reporting company. See the definitions of “large accelerated filer,” “accelerated filer” and “smaller reporting company” in Rule 12b-2 of the Exchange Act.
Large accelerated filer | ¨ | Accelerated filer | ý | |||
Non-accelerated filer | ¨ (Do not check if a smaller reporting company) | Smaller reporting company | ¨ | |||
Indicate by check mark whether the registrant is a shell company (as defined in Rule 12b-2 of the Exchange Act). Yes ¨ No ý
As of June 30, 2016, the aggregate market value of shares of common stock held by non-affiliates of the registrant was $159.9 million computed by reference to the last sales price as reported by the NASDAQ Global Select Market, as of the last business day of the Registrant’s most recently completed second fiscal quarter (June 30, 2016). Shares of common stock held by each executive officer, director, and holder of 5% or more of the outstanding common stock have been excluded in that such persons may be deemed to be affiliates. This determination of affiliate status is not necessarily a conclusive determination for other purposes.
The number of shares outstanding of the Registrant’s Common Stock as of February 23, 2017 was 79,173,489 shares.
Documents Incorporated by Reference
Portions of the registrant’s definitive Proxy Statement for the 2017 Annual Stockholders’ Meeting are incorporated by reference into Part III of the Annual Report on Form 10-K where indicated. Such proxy statement will be filed with the Securities and Exchange Commission within 120 days of the registrant’s fiscal year ended December 31, 2016.
1
JIVE SOFTWARE, INC.
2016 FORM 10-K ANNUAL REPORT
TABLE OF CONTENTS
Page | ||
1
PART I
ITEM 1. BUSINESS
Forward-Looking Statements
This Annual Report on Form 10-K, including the section titled “Management’s Discussion and Analysis of Financial Condition and Results of Operations” in Item 7, contains forward-looking statements within the meaning of Section 27A of the Securities Act of 1933, as amended and Section 21E of the Securities Exchange Act of 1934, as amended. Forward-looking statements may be identified by the use of forward-looking words such as “believe,” “may,” “will,” “estimate,” “continue,” “anticipate,” “intend,” “could,” “would,” “project,” “plan,” “expect,” “target,” “contemplate,” “predict,” “potential,” “ensure,” or the negative or plural of these words or similar expressions. These forward-looking statements include, but are not limited to, statements concerning the following:
• | our future financial performance, including our expectations regarding our revenue, cost of revenue, gross profit or gross margin, operating expenses, ability to generate cash flow, mix of revenue streams, and ability to maintain future profitability; |
• | anticipated trends, growth rates and challenges in our business and in the markets in which we operate; |
• | the effects of increased competition in our market; |
• | the impact and effectiveness of the 2016 Realignment Plan; |
• | the execution of our new business initiatives and changes in go-to-market strategies, product roadmap and development; |
• | our ability to sell our products, successfully enter new markets and manage our international expansion; |
• | our ability to timely and effectively acquire or develop new products that meet the needs and expectations of our market; |
• | our ability to increase adoption of our platform by our customers’ internal and external users; |
• | our ability to grow our external community business; |
• | our ability to protect our users’ information and adequately address security and privacy concerns; |
• | our ability to maintain an adequate rate of growth; |
• | our future expenses; |
• | our ability to effectively manage our growth; |
• | our ability to maintain, protect and enhance our brand and intellectual property; |
• | the attraction and retention of qualified employees and key personnel; and |
• | other risk factors included under "Risk Factors" in this Annual Report on Form 10-K. |
These forward-looking statements are subject to risks, uncertainties and assumptions that are difficult to predict. Therefore, actual results may differ materially and adversely from those expressed in any forward-looking statements. Please refer to Item 1A. Risk Factors in this Annual Report on Form 10-K for a discussion of reasons why our actual results may differ materially from our forward-looking statements. While we may elect to update forward-looking statements at some point in the future, we specifically disclaim any obligation to do so, even if our expectations change.
Overview
We incorporated in Delaware in February 2001, and our mission is to empower people and organizations to connect, communicate and collaborate in order to improve the way work gets done. We believe that our products drive top line revenue growth and cost savings by unleashing creativity, driving innovation and improving productivity through increased involvement and collaboration within the enterprise, and through engagement with employees, customers and partners.
We provide products that we believe improve business results by enabling a more productive and effective workforce through enhanced communications and collaboration both inside and outside the enterprise. Organizations deploy our products to improve the level of engagement, the quality of interaction and the overall relationship they have with their employees, customers and partners. Our traditional enterprise software product offerings, based on the Jive platform (the "Jive Platform"), are provided to customers as cloud-based, hosted or on-premise solutions. Our products are primarily offered on a subscription basis and can be used for internal or external communities. We generate revenues from product subscription license fees as well as from professional service fees for strategic consulting, configuration, implementation and training.
Our software has been recognized as a leading platform by industry analysts. In 2016, Jive was ranked as a leader in The Forrester Wave: Enterprise Collaboration, Q4 2016 report, which analyzed the state of the market for collaboration software and evaluated nine of the most significant vendors.
2
We sell our products primarily through a direct sales force, both domestically and internationally. As of December 31, 2016, we had 981 customers.
2016 Highlights and Recent Developments
In February 2016, Jive delivered an updated release of its “interactive intranet” employee community product and its external community products, including a redesign of our product portfolio and new optimized processes to engage employees, customers and partners.
Also, in February 2016, we introduced Jive WorkHub offerings representing packaged solutions focused on distinct verticals and lines of business including, the healthcare vertical, employee engagement and customer engagement. These out-of-the-box packages were developed to provide an easy way for customers to quickly adopt solutions built to meet their specific needs.
In May 2016, the Company introduced the 2016 Realignment Plan intended to create a path to profitability for the Company and to re-balance staffing levels to better align them with the evolving needs of our business.
In October 2016, Jive entered into a lease with Water Tower Fee Owner, LLC for approximately 12,500 square feet of office space in Campbell, California with occupancy beginning in March 2017. In October, the Company separately entered into an amendment to its office lease with TTC Partners, LLC for the Company’s existing corporate headquarters in Palo Alto, California that provides for an early termination of such lease in March 2017.
In November 2016, Jive made the strategic decision to transition its cloud infrastructure to Amazon Web Services. The transition of our cloud infrastructure is intended to be completed by the end of 2017 and is anticipated to drive greater customer value by accelerating delivery of new cloud functionality.
In December 2016, Jive received sponsorship from an existing customer for the Federal Risk and Authorization Program, or FedRAMP, “in process” certification program.
Jive Platform Offerings
As we have described above, we deliver products that allow companies to connect, communicate and collaborate more effectively with employees, customers and partners. Our products provide the innovation, creativity and ease of use found in consumer applications combined with the security, flexibility and scalability necessary for enterprise deployment. The Jive Platform product offerings are delivered in two key configurations, Jive Internal (Jive-n) for employee networks, and Jive External (Jive-x) as a platform for customer and partner communities. These products can be expanded by adding optional modules, as well as connectors and integrations into existing enterprise systems and applications. Our Jive Platform products can also be extended to integrate cloud and customer-built applications through published application programming interfaces (“APIs”) and software development kits ("SDKs").
Business Benefits
• | Improve corporate communication and strategic alignment. Our products help our customers to improve and accelerate company communication and alignment. They increase the flow of ideas, recommend the most relevant content and deliver a comprehensive set of analytics that measure business impact. |
• | Improve employee productivity. Our centralized collaboration products and proprietary recommendation engine leverages relationships, expertise and areas of interest to efficiently connect employees with one another, simplify the process of finding people and information and substantially reduce duplicate tasks. Employees can also collaborate more effectively through sharing and commenting using our platform and leveraging our integrations with legacy business applications. |
• | Retain Corporate Memory. Our products assist our customers in preventing loss of institutional knowledge by allowing customers to retain and search critical communications and content developed over time. Our collaboration solutions can serve as a valuable repository for customer corporate memory. |
• | Enhance revenue opportunities. Our products help our customers to create and manage external communities, which can promote engagement, increase brand awareness, attract new customers, inspire new product ideas and deliver referrals to sales teams. Internal communities can also make our customers’ sales representatives more efficient by quickly connecting them with relevant information and expertise within the enterprise. |
3
• | Lower operational costs. Our products help our customers reduce operating costs via communication efficiencies and improved knowledge management. Internally, our solution can replace or supplement aging intranets to reduce information discovery time for end-users, reduce ramp time for new hires and increase employee efficiency. Externally, our solution enables our customers to provide more effective and efficient support communities while significantly reducing customer support infrastructure expenses, including call centers. |
• | Increase customer retention. We enable enterprises to strengthen connections to their customers by establishing communities to support and enable their end-users to interact with each other. This support and interaction allows our customers to more quickly and effectively process end-user queries and feedback. |
Core Platform Capabilities and Features
The Jive Platform includes the following capabilities and features:
• | Comprehensive communication environment. Our platform enables corporate news, blogging, micro-blogging, discussions, content creation and direct messaging and aggregates these familiar methods of social communications into both streams and a social inbox to allow users to find relevant information quickly and easily. |
• | Content and collaboration. Our platform includes wikis, document sharing, an easy-to-use rich text editor and full-fidelity rendering of Microsoft Office and Adobe documents with inline commenting, allowing users to collaborate in real-time. Our platform enhances collaboration by allowing users to control access to content at the individual, group or document level. |
• | Engaging social features. Our platform provides a streamlined and intuitive user interface and enables commenting, sharing Web bookmarks, “liking,” reviews and rating capabilities designed to capture the attention of a user and drive interaction and adoption. |
• | Social networking capability. Our platform enables rich social profiles, visual enterprise directories, connections and expertise identification. Users can easily find, follow and access both people and data through structured spaces, including public and private social groups and projects. This provides users with continuous access to relevant and critical information. Our platform also integrates with social media companies, such as Twitter and Facebook, providing users with more sharing capabilities. |
• | Reputation and recognition. Our platform provides a variety of mechanisms for users to be recognized for their contributions to the community and to proactively build their reputations, including community status leaderboards, user achievement badges, user rewards, and trending people and content. |
• | Search. Our platform includes advanced search capabilities to locate relevant people, content and groups using information captured in the enterprise work graph, such as users’ unique skills or profile information. |
• | External groups. Our platform enables an enterprise to expand its operating ecosystem, bringing discussions and questions in external communities back into the enterprise and allows internal users to create an external group for secure, private and ad-hoc collaboration with non-employees. |
• | Security. Our platform allows customers to control access to specific content and groups. In addition, it is designed to take advantage of and integrate with existing security and authentication systems. |
• | Connections and integrations with enterprise systems. Our platform can integrate with numerous enterprise systems, such as email and productivity applications, cloud office applications, storage applications, support and ticketing tools, as customer relationship management, enterprise resource planning, software configuration management or product lifecycle management systems, via our APIs and SDKs. |
• | Readily deployable and configurable. Our platform was developed to facilitate easy deployment with familiar interfaces. We offer our customers the ability to configure our solutions to deliver the specific functionality and user experience they want for their end-users along with the ability to modify the look and feel of our solutions to conform to their branding or other requirements. |
Recommendations
The Jive recommendation engine is an innovative user interface that makes it easy to track, consume, manage and filter critical business information, communications and actions. A key component is a highly tuned enterprise activity stream that enables users to rapidly access, discover and interact with conversations, content and decisions. Our noise filtering capability addresses the challenges of information overload, helping users focus on mission critical and timely information. Additionally, the recommendation engine draws on real-time intelligence derived from the enterprise work graph to predict and recommend content, people and groups to users, based upon employee roles, positions and previous communications.
4
Integration and Extension
The Jive Platform is a communication and collaboration hub, bringing together information and conversations from many different systems. In addition to the many integrations included with the Jive Platform, Jive provides extensive capabilities for integrating our platform with other systems. Jive provides rich developer APIs and tools that enable bi-directional exchange of content, conversation, streams and data between Jive and other systems. Many third-party developers have created commercial integrations that are available in the Jive Add-ons directory. Further, the APIs and developer tools are available for in-house IT teams to integrate and extend our platform based on company-specific requirements.
Jive Anywhere
Jive Anywhere enables users to import any content from a web browser into the Jive Platform. This feature automatically connects conversation, content and context within a user’s Jive network with any website or web application. Jive Anywhere helps users avoid complicated point-to-point integrations between their collaborative platform and other enterprise systems and websites by making it easy to discuss and share content with one click.
Product Modules and Advanced Features
Jive offers additional functionality in modules and advanced features built to integrate with the Jive Platform products.
Enterprise Integrations. Jive provides several pre-built integrations with common content management applications, communication systems and systems of record, including the following:
• | Microsoft Outlook. Enables users to interact with our platform from the familiar interface of Microsoft Outlook. Users can see activity streams and social profiles, comment on documents and blog posts and create status updates and discussions, from within Microsoft Outlook. Users can also turn email threads into discussions and post email attachments directly to our platform. Users can use the search feature to include people, emails, appointments and attachments from Microsoft Outlook, as well as documents and discussions from the Jive Platform. |
• | Microsoft Office. Users can collaborate on Microsoft Office documents, including simultaneously co-authoring across different Microsoft Office versions, publishing content directly to our platform and participating in document discussions directly within Microsoft Word, PowerPoint or Excel. |
• | Jive StreamOnce. Jive StreamOnce automatically feeds information into Jive from a wide range of sources such as email, activity streams, social media and content apps, consolidating streams in one place. Users can see and respond to these streams directly from the Jive Platform. |
• | Content management systems. Content management systems, such as Microsoft SharePoint, can be integrated into our platform so that content can be shared across our platform and these systems. Users can search our platform and content management systems simultaneously and can access our social capabilities from within these systems. |
• | Enterprise IM. Enterprise instant messaging systems can be integrated into our platform. |
• | Jabber and Webex. Through Jive’s partnership with Cisco, users can obtain product integrations between Jive and Cisco’s Jabber and WebEx communication products. |
Gamification. We include game mechanics as a standard feature. Our Gamification Modules expand on these core features to deliver a more personalized experience. Gamification makes it easier to create custom missions and competitions to kickstart user participation and drive user behavior, such as encouraging sales reps to complete training or customer service agents to answer customer questions in a timely fashion.
Analytics. Jive Analytics provides detailed, easy-to-read metrics and reports for community managers, business leaders and individual users.
External Groups. Users can collaborate with their entire extended team, including those outside the firewall. Security and permissions controls let users specify who sees what, without exposing confidential information to people outside the company or outside the relationship.
Encryption at Rest. Jive Encryption at Rest provides a hardware-based security solution that’s non-disruptive, comprehensive and easy to use. The single-source solution increases overall compliance with industry and government regulations without compromising storage efficiency.
5
Enhanced Disaster Recovery. In the event of an extended interruption in hosting services, Jive makes every reasonable effort to restore customers’ instances as soon as possible. For customers with more stringent compliance requirements or for whom Jive is simply mission critical, we offer Enhanced Disaster Recovery services that include documented plans, recovery point and time objectives, as well as specific service level agreements (SLAs) if needed.
Ideation. Our Ideation module involves employees, customers and partners in the process of capturing, refining and prioritizing innovative ideas. Once an idea is submitted, users can vote it up or down, and discuss ways to improve the idea. Those managing the ideation process can categorize ideas to keep participants informed of progress.
Jive Resonata. For our Jive-x Platform, Jive Resonata analyzes the activity in a Jive-x customer community and reveals the sentiments, behaviors and motivations that drive participation and satisfaction. It identifies a community’s champions and detractors, tracks trends and spots emerging problems.
Mobile. For our Jive-n Platform, Jive offers its mobile Jive Daily service allowing customers’ employees to stay connected and engaged with the ability to access their interactive intranet on-the-go from their mobile device.
Records Retention. Records Retention helps customers meet legal and compliance requirements in regulated industries. With Records Retention, customers can integrate the Jive product with their own retention and e-discovery systems.
Video. The Jive Platform includes the ability to embed videos in different content types and to create a secure video storage, management and streaming service as part of an internal or external community.
Professional Services and Customer Support
Our professional services team provides a range of offerings including strategy consulting, project management, technical expertise, and education and training. Our team can lead the design, implementation and launch of the Jive Platform and seeks to ensure that our solution meets the design and implementation parameters established by our customers with clear, measurable business benefits. We also provide post-launch support and on-going assistance to encourage and facilitate adoption within the enterprise.
We offer training services to our customers and partners. We offer training either in-person or over the web and online educational classes. We also provide a variety of training videos and quick start guides that are available online. Our education offerings are targeted at training partners, users, community managers and system administrators.
Our global customer support organization provides both proactive and customer-initiated support. Assistance is available by email, telephone and through our online Jive community, called JiveWorks, built on our social business platform. Customers can track the status and relevant information relating to their queries in real-time and have access to a wide range of information sharing utilities that facilitate access to both internal and external community feedback.
Our support team is staffed with experienced support specialists and engineers who have experience with the software systems with which our products integrate. We engage in regular training and certification processes as new products and technologies are introduced.
Our basic deployment includes “Silver Level” support. Our customers may contract for increased levels of support (“Gold Level” or “Platinum Level”), which provide for higher required service levels for reduced response times, as well as additional support services.
Technology and Operations
Our product portfolio brings the Jive experience to a broad set of platforms and applications and is designed to bring powerful communication capabilities and valuable context to users, regardless of where or how they are working. Our platform can be accessed from mobile phones, tablets and desktop computers; as a browser, Microsoft Office or SharePoint plugin; and through a rich set of REST, JavaScript and Objective C APIs. System integrators, third-party vendors and customers leverage our APIs to extend, customize and integrate with our platform.
6
Our core application is written primarily in Java and is designed to run on both public and private cloud deployments. It runs on the Linux operating system and is compatible with Microsoft SQL Server, MySQL, Oracle and PostgreSQL. In our public cloud, we are developing and porting an increasing portion of our features to multi-tenant architectures. Through connectivity to our cloud, private cloud deployments can also access such functionality, which includes activity streams and mobile. The Jive Platform integrates with existing enterprise systems and can be extended with new functionality through the utilization of a broad set of APIs. These APIs facilitate the building of custom integrations to our platform.
In our cloud, hosted and on-premise offerings, our customers can customize our platform to meet their enterprise requirements for branding and security, through customer-specific domain names, SSL encryption and other mechanisms.
We host our cloud and hosted communities for hundreds of our customers and millions of end-users. We work with large data center vendors to provide the international foundation of our social business platform. Our enterprise-class hardware platforms provide high levels of performance, flexibility and security. We currently utilize multiple data center facilities located in North America and Europe. Each facility utilizes multiple network providers, as well as services to help ensure security, reliability, redundancy and performance. We maintain and operate additional facilities in geographically diverse locations for offsite backup storage and disaster recovery.
We recently made the decision to transition our cloud offering infrastructure to Amazon Web Services (AWS) and expect to substantially complete the transition of our cloud customers to AWS by the end of 2017. Data for customers with cloud offerings will be hosted either in AWS data centers in United States or in Europe.
Our architecture and security teams are based in our Palo Alto, California office, which will be moving to our new Campbell, California facility in the first quarter of 2017, and in Portland, Oregon, with our network operations center and deployment teams based in Portland, Oregon and the United Kingdom.
Sales and Marketing
We sell our platform primarily through our global direct sales organization. Our direct sales team is comprised of inside sales and field sales personnel who are organized by prospect company size and geographic regions, including the North America, Europe and Asia Pacific. We also work with channel partners, including resellers, implementation partners, leading global outsourcing vendors and system integrators domestically and internationally. As of December 31, 2016, we had 156 employees in sales and marketing and we had more than 60 Jive Alliance Partners, which create referrals and resell our platform worldwide.
We generate customer leads, accelerate sales opportunities and build brand awareness through our marketing programs. Our marketing programs target company executives both inside and outside of information technology organizations, senior business leaders and other technology professionals. Our principal marketing programs include:
• | use of our website to provide product and company information, as well as learning opportunities for potential customers; |
• | regional field marketing events for customers and prospects; |
• | in house and contracted sales development teams who prospect for new leads and respond to incoming leads to convert them into new sales opportunities; |
• | participation in, and sponsorship of, user conferences, trade shows and industry events; |
• | customer programs, including user meetings and our online customer community; |
• | online marketing activities, including direct email, online web advertising, blogs and webinars; |
• | public relations and social networking initiatives; |
• | cooperative marketing efforts with partners, including joint press announcements, joint trade show activities, channel marketing campaigns and joint seminars; and |
• | sponsorships and participation in marketing programs in the broader Jive ecosystem. |
In addition, we host a periodic user conference, called JiveWorld, where current and potential customers participate in a variety of programs designed to help drive business results through the use of our platform. This conference features a variety of prominent keynote and customer speakers, panelists and presentations focused on businesses of all sizes, across a wide range of industries and lines of business. Attendees also gain insight into our recent product releases and enhancements and participate in interactive sessions that give them the opportunity to express opinions on new features and functionality.
7
Customers
We generally sell our platform and related services through our global sales organization directly to businesses, government agencies and other enterprises. As of December 31, 2016, we had 981 Jive Platform customers in diverse industries, including consulting services, education, financial services, healthcare, life sciences, manufacturing, retail, telecommunications and technology. No individual customer represented more than 10% of our total revenues in 2016, 2015 or 2014.
The following table sets forth a representative list of a selection of our largest customers by industry category:
Financial Services | Healthcare | Retail | ||
The Bank of New York Mellon | Aetna | Adeo Services | ||
Credit Suisse | Humana | GAP | ||
Fidelity | Spectrum Health | lululemon athletica | ||
Liberty Mutual | Swedish Partners Medical Group | NBC Universal Media | ||
Societe Generale | United Health Group | Starwood Hotels and Resorts | ||
Technology | Telecommunications | |||
Adobe | Alcatel-Lucent | |||
Cisco | Motorola Solutions | |||
EMC Corporation | Sprint | |||
Hitachi Data Systems | T-Mobile | |||
McAfee | Verizon | |||
Research and Development
We base a meaningful amount of our product development on the needs of our customers. We work closely with our user community to continually improve and enhance our platform through organic development and the acquisition of new products and features. We emphasize collaboration with customers throughout all areas of our organization in the development process. Our online Jive community, known as JiveWorks, is a collaborative workspace for customers to suggest and comment on new features and functionality. This input is utilized in many of our development plans and provides valuable customer insight that we use to establish the priorities of our engineering team. We also incorporate feedback from our employees, all of whom use our products and test alpha versions before each major release.
We also focus our research and development efforts on rapidly delivering new products and upgrades of our existing products to our customers. We leverage open source technology wherever appropriate and contribute many of the improvements we make back to the open source community. We maintain healthy code and adhere to sound engineering practices to ensure a fast pace of development. We have teams dedicated to developing and testing innovative new products and users' experiences, advancing our core architecture and improving the speed and completeness of our automated continuous integration pipeline.
As of December 31, 2016, we had 173 employees in research and development.
Competition
The overall market for social business platform solutions is rapidly evolving, highly competitive, and subject to changing technology, shifting customer needs and frequent introductions of new products and services. We currently compete with large, well-established multi-solution enterprise software vendors, such as Microsoft, IBM and salesforce.com, inc., enterprise software application providers which are adding social features to their existing applications and platforms, such as Facebook, and smaller specialized software vendors. Facebook recently launched Workplace by Facebook to provide an enterprise version of its social network service. Additionally, in December 2016, Microsoft Corporation acquired LinkedIn, Inc., in an effort to combine Microsoft's existing products and services with LinkedIn's professional networking capabilities. In January 2017, Slack introduced Slack Enterprise Grid, a new version of its collaboration application designed specifically for large-scale enterprises. Our primary competition for internal communities currently comes from established enterprise software companies that have greater name recognition, larger customer bases, much longer operating histories and significantly greater financial, technical, sales, marketing and other resources than we have and are able to provide comprehensive business solutions that are broader in scope than the solution we offer. Additionally, we compete with smaller companies who may be able to adapt better to changing conditions in the market.
8
We expect that the competitive landscape will change as the market for social business platforms consolidates and matures.
We believe the principal competitive factors in our market include the following:
• | total cost of ownership; |
• | breadth and depth of product functionality; |
• | brand awareness and reputation; |
• | ease of deployment and use of solutions; |
• | level of customization, configurability, security, scalability and reliability of solutions; |
• | ability to innovate and respond to customer needs rapidly; |
• | perceived return on investment through the use of social technologies; |
• | size of customer base and level of user adoption; and |
• | ability to integrate with legacy enterprise infrastructures and third-party applications. |
We believe that we compete favorably on the basis of these factors. Notwithstanding the fact that some of our competitors offer the basic versions of their products for free or as low-cost additions to other software suites, we have demonstrated that customers are willing to pay for the business value that our platform delivers. Our ability to remain competitive will depend, to a great extent, upon our ongoing performance in the areas of product development and customer support.
Intellectual Property
We protect our intellectual property rights by relying on federal, state and common law rights, as well as contractual restrictions. We control access to our proprietary technology by entering into confidentiality and invention assignment agreements with our employees, contractors and consultants, and confidentiality agreements with third parties. We also rely on a combination of trade secret, copyright, trademark, trade dress and domain name reservations to protect our intellectual property. We have continued to seek patent protections for our technology and processes. We pursue the registration of our domain names and trademarks and service marks in the United States and in certain locations outside the United States. As of December 31, 2016, we had nine patent applications pending and 10 patents registered.
Circumstances outside our control could pose a threat to our intellectual property rights. For example, effective intellectual property protection may not be available in the United States or other countries in which our products and solutions are distributed. Also, protecting our intellectual property rights is costly and time-consuming and the efforts we have taken to protect our proprietary rights may not be sufficient or effective. Any impairment of our intellectual property rights could harm our business or our ability to compete and harm our operating results.
Employees
As of December 31, 2016, we had 595 regular full-time employees, including 44 in hosting, 73 in support, 56 in professional services, 173 in research and development, 156 in sales and marketing and 93 in general and administrative roles. None of our employees are represented by a labor union or covered by a collective bargaining agreement. We have not experienced any work stoppages and we consider our relations with our employees to be good.
Segments
We sell a single platform, have one business activity and there are no segment managers who are held accountable for operations, operating results or plans for levels or components below the consolidated unit level. Accordingly, we have determined that we operate in a single reporting segment, software sales and services.
Geographic Information
See Note 13 of Notes to Consolidated Financial Statements included in Part II, Item 8 of this Form 10-K.
Seasonality
See Part II, Item 7, Management's Discussion and Analysis of Financial Condition and Results of Operations, for information regarding seasonality.
9
Backlog
See “Management’s Discussion and Analysis of Financial Condition and Results of Operations — Non-GAAP Key Metrics” for information regarding our backlog.
Available Information
We file annual, quarterly and other reports, proxy statements and other information with the Securities and Exchange Commission (“SEC”) under the Securities Exchange Act of 1934, as amended (“Exchange Act”). We also make available, free of charge on our website at www.jivesoftware.com, our Annual Report on Form 10-K, quarterly reports on Form 10-Q, current reports on Form 8-K, and amendments to those reports filed or furnished pursuant to Section 13(a) or 15(d) of the Exchange Act as soon as reasonably practicable after they are filed electronically with the SEC. You can inspect and copy our reports, proxy statements and other information filed with the SEC at the offices of the SEC’s Public Reference Room located at 100 F Street, NE, Washington D.C. 20549. Please call the SEC at 1-800-SEC-0330 for further information on the operation of Public Reference Rooms. The SEC also maintains an Internet website at http://www.sec.gov/ where you can obtain most of our SEC filings. You can also obtain paper copies of these reports, without charge, by contacting Investor Relations at (669) 282-4000.
ITEM 1A. RISK FACTORS
Our operations and financial results are subject to various risks and uncertainties including those described below. You should carefully consider the following risk factors, together with all of the other information in this Annual Report on Form 10-K, including the Consolidated Financial Statements and the related notes included elsewhere herein, before deciding whether to invest in shares of our common stock. The risks and uncertainties described below are not the only ones we face. Additional risks and uncertainties that we are unaware of, or that we currently believe are not material, may become important factors that affect us. If any of the following risks or others not specified below materialize, our business, financial condition and results of operations could be materially adversely affected. In that case, the market price of our common stock could decline.
Risks Related to our Business and Industry
We have a history of cumulative losses and we do not expect to have sustained profitability for the foreseeable future.
We have incurred losses in each of the last eight years, including a net loss of $14.0 million in 2016, $34.9 million in 2015 and $56.2 million in 2014. At December 31, 2016, we had an accumulated deficit of $332.5 million. As we continue to invest in development of our solutions and international operations and changes to our sales and marketing efforts, our operating expenses may continue to increase. Further, the changes to our sales and marketing efforts are designed to align more closely with our go-to-market strategies, and increase our focus on the large and mid-sized enterprise segments. The alignment to these markets may not result in increases in our revenues or billings or provide the gross margin improvements we anticipated, which may result in us undertaking additional cost savings initiatives or identifying opportunities to achieve greater efficiencies in how we conduct our business. Additionally, the cost savings initiatives we have implemented in connection with the 2016 Realignment Plan, and any cost savings initiatives we implement in the future, may not achieve their intended results and could materially and adversely affect our business, billings, revenue, renewal rates and operating results.
Although we have experienced revenue growth in prior periods, our revenue growth has slowed and you should not consider any previous revenue growth or growth rates as indicative of our future performance. While we recently achieved GAAP profitability in the fourth quarter of 2016, we cannot assure you that we will achieve sustained profitability on a GAAP basis in the future.
Our quarterly results are likely to fluctuate due to a number of factors, and the value of our stock could decline substantially.
Our quarterly operating results are likely to fluctuate. For example, our fourth quarter has historically been our strongest quarter for new billings and renewals. This pattern may be amplified over time if the number of customers with renewal dates occurring in the fourth quarter continues to increase. Fluctuations in our quarterly financial results may be caused by a number of factors, many of which are out of our control. These factors include, but are not limited to, the following:
• | the renewal rates for our products; |
• | upsell rates for our solutions and services; |
• | changes in deferred revenue balances due to changes in the average duration of subscriptions, rate of renewals, timing of renewal billings, composition of billings for professional services, amount of multi-year prepayments, amount of non-renewable perpetual license billings and the rate of new business growth; |
• | changes in the composition of current period billings; |
10
• | changes in the mix of the average term length and payment terms; |
• | changes in the mix of our revenue derived from internal and external communities; |
• | the number of orders in any given quarter; |
• | the amount and timing of operating costs and capital expenditures related to the operations and expansion of our business; |
• | the continued impact and effectiveness of the 2016 Realignment Plan |
• | changes in our pricing policies, whether initiated by us or as a response to competitive or other factors; |
• | the cost and timing associated with, and management effort for, the introduction of new products and product features; |
• | the rate of expansion and productivity of our sales force; |
• | the length of the sales cycle for our products; |
• | changes in our go-to-market strategy; |
• | the success of our channel partners and strategic partners in reselling our products; |
• | the success of our international expansion strategy; |
• | new solution introductions by our competitors; |
• | our success in selling our platform to large enterprises; |
• | our success in selling into the IT department of our customers; |
• | general economic conditions that may adversely affect either our customers’ ability or willingness to purchase additional subscriptions or a larger deployment, or hinder or delay a prospective customer’s purchasing decision, or reduce the value of new subscriptions, or affect renewal rates or the timing of renewals; |
• | timing of additional investments in the development of our platform or deployment of our services; |
• | disruptions in our hosting services or our inability to meet service level agreements and any resulting refunds to customers; |
• | security breaches and potential financial penalties to customers and government entities; |
• | concerns over U.S. government activities, including government-sponsored electronic surveillance and initiatives relating to government access over non-U.S. citizens' data; |
• | costs relating to our cloud infrastructure migration and continuing costs relating to managing our existing hosting facilities; |
• | regulatory compliance costs; |
• | potential delay in revenue recognition for product acceptance rights; |
• | the timing of customer payments and payment defaults by customers; |
• | the impact on services margins as a result of the use of third-party contractors to fulfill demand; |
• | the impact on services margins as a result of periods of less than full utilization of our full-time services employees; |
• | costs associated with acquisitions of companies and technologies; |
• | potential goodwill, other long-lived asset or capitalized software development cost impairment; |
• | the impact of capitalized research and development costs on current and future periods; |
• | extraordinary expenses such as litigation or other dispute-related settlement payments; |
• | adjustments arising from future foreign, federal, state and local sales and income tax examinations; |
• | the impact of new accounting pronouncements; and |
• | the timing and size of stock awards to employees. |
Based on the factors described above, we believe that our quarterly operating results may vary significantly in the future and that period-to-period comparisons of our operating results may not be indicative of future results.
In addition, due to our evolving business model, the rapid pace of technological change, the unpredictability of the emerging market in which we participate, and potential fluctuations in future general economic and financial market conditions, we may not be able to accurately forecast our rate of growth. We plan our expense levels and investments on estimates of future billings, revenues and anticipated rate of growth. We may not be able to adjust our spending quickly enough if the addition of new customers, the upsell rate for existing customers, or the price for which we are able to sell our platform is below our expectations. As a result, we expect that our billings, revenues, operating results and cash flows may fluctuate significantly and comparisons of our billings, revenues, operating results and cash flows may not be meaningful and should not be relied upon as an indication of future performance.
Furthermore, we may fail to meet or exceed the expectations of securities analysts and investors, and the market price for our common stock could decline. If one or more securities analysts adversely change their recommendation regarding our stock, the market price for our common stock could decline. Additionally, our stock price may be based on expectations, estimates or forecasts of our future performance that may be unrealistic or may not be achieved. Further, our stock price may be affected by financial media, including press reports and blogs.
11
Because we generally recognize revenues from subscriptions for our products ratably over the term of the agreement, near term changes in sales may not be reflected immediately in our operating results.
We generally recognize revenues from customers ratably over the term of their agreements, which generally range from 12 to 36 months. As a result, most of the revenues we report in each quarter are derived from the recognition of deferred revenue relating to subscription agreements entered into during previous quarters or years. Consequently, a decline in new or renewed subscriptions in any one quarter is not likely to be reflected immediately in our revenues results for that quarter. Such declines, however, would negatively affect our revenues in future periods and the effect of significant downturns in sales and market acceptance of our solutions, and potential changes in our rate of renewals, may not be fully reflected in our results of operations until future periods. Our subscription model also makes it difficult for us to rapidly increase our total revenues through additional sales in any period, as revenues from new customers must be recognized over the applicable subscription term. In some instances, our customers choose to pre-pay the entire term of their multi-year subscriptions up front. As a result, billings can fluctuate significantly from quarter to quarter.
Our future success is, in large part, dependent upon the widespread adoption of collaboration software by enterprises and it is difficult to forecast the rate at which this will happen.
Collaboration software for enterprises remains at an early stage of technological and market development and the extent to which enterprise collaboration software will become widely adopted remains uncertain. It continues to remain difficult to predict customer adoption rates, customer demand for our platform, the future growth rate and size of this market and the entry of competitive solutions. Any expansion of the enterprise collaboration software market depends on a number of factors, including the cost, performance and perceived value and benefits associated with enterprise collaboration software. If enterprise collaboration software does not achieve widespread adoption, or if there is a reduction in demand for enterprise collaboration software caused by a lack of customer acceptance, technological challenges, weakening economic conditions, competing technologies and products, decreases in corporate spending or otherwise, it could result in lower billings, reduced renewal rates and decreased revenues and our business could be adversely affected. Additionally, mergers or consolidations among our customers could reduce the number of our customers and could adversely affect our revenues and billings. In particular, if our customers are acquired by entities that are not our customers, are customers of our competitors, or that use fewer of our solutions, or that have more favorable contract terms and choose to discontinue, reduce or change the terms of their use of our platform, our business and operating results could be materially and adversely affected.
The market for enterprise collaboration software is intensely competitive, and if we do not compete effectively, our business will be harmed.
The overall market for social business platform solutions is rapidly evolving, highly competitive, and subject to changing technology, shifting customer needs and frequent introductions of new products and services. We currently compete with large, well-established multi-solution enterprise software vendors, such as Microsoft, IBM and salesforce.com,inc., enterprise software application providers which are adding social features to their existing applications and platforms, such as Facebook, and smaller specialized software vendors. Facebook recently launched Workplace by Facebook to provide an enterprise version of its social network service. Additionally, in December 2016, Microsoft Corporation acquired LinkedIn, Inc., in an effort to combine Microsoft's existing products and services with LinkedIn's professional networking capabilities. In January 2017, Slack introduced Slack Enterprise Grid, a new version of its collaboration application designed specifically for large-scale enterprises.
Our primary competition for internal communities currently comes from established enterprise software companies that have greater name recognition, larger customer bases, much longer operating histories and significantly greater financial, technical, sales, marketing and other resources than we have and are able to provide comprehensive business solutions that are broader in scope than the solution we offer. Additionally, we compete with smaller companies who may be able to adapt better to changing conditions in the market. To the extent that our competitors are successful in combining these social networking capabilities with their existing products and to the extent social and professional networking providers are able to adapt their solutions to the enterprise collaboration market, we could experience increased competition, which could adversely affect our billings, renewal rates, revenues and margins.
Some of our competitors offer their solutions at a lower price or at no incremental cost, which has resulted in pricing pressures and increased competition. If we are unable to price our solutions appropriately, our operating results could be negatively impacted. In addition, lower margins, pricing pressures and increased competition generally could result in reduced sales and billings, losses or the failure of our platform to achieve or maintain more widespread market acceptance, any of which could harm our business. Our current and potential competitors may also establish cooperative relationships among themselves or with third parties that may further enhance their product offerings or resources. Certain current competitors have been, and current or potential competitors may be, acquired by third parties with greater available resources and as a result of such acquisitions, might be able to adapt more
12
quickly to new technologies and customer needs, devote greater resources to the promotion or sale of their solutions, initiate or withstand substantial price competition, take advantage of other opportunities more readily or develop and expand their offerings more quickly than we do. If we are unable to compete effectively for a share of our market, our business, operating results and financial condition could be materially and adversely affected.
Actions that we have taken to restructure our business in 2016 to better align with our business model transition strategy may ultimately not be as effective as anticipated.
In May 2016, we implemented our 2016 Realignment Plan, which was designed to ensure that we have the correct cost structure and go-to-market strategies in place to achieve our desired corporate and operating results going forward, as well as align our operations with evolving business needs and improve efficiencies. While we have made some progress toward our goals since the initiation of the 2016 Realignment Plan, the restructuring activities may not produce the full efficiency and cost reduction benefits anticipated. Further, the benefits may be realized later than expected and the actual cost of implementing these measures may be greater than anticipated. If these measures are not successful, we may need to undertake additional cost reduction efforts, which could result in future charges.
We have made changes to the structure, scale and makeup of the sales organization and their focus which may harm our future operating results.
In connection with the 2016 Realignment Plan, we increased our sales focus on large and mid-sized enterprise customers, reduced the size of our inside sales organization, placed greater emphasis on selling our cloud-based solutions, and continued to migrate customers to the cloud and rebalance our investments to align with our more focused go-to market strategies. There is no guarantee that the changes will increase our revenue over time and, instead, could ultimately adversely affect billings, renewal rates and revenues and our business and operating results could be negatively impacted.
We cannot accurately predict new subscription, subscription renewal or upsell rates and the impact these rates may have on our future revenues and operating results.
In order for us to improve our operating results and continue to grow our business, it is important that we continually attract new customers and that existing customers renew their subscriptions with us when their existing contract term expires. Our existing customers have no contractual obligation to renew their subscriptions after the initial subscription period and we cannot accurately predict renewal rates. Our customers’ renewal rates may decline or fluctuate as a result of a number of factors, including, but not limited to, their satisfaction with our products and our customer support, the level of usage of our platform within their enterprise, the frequency and severity of outages, our product uptime or latency, the pricing of our, or competing, software or professional services, the effects of global economic conditions, and reductions in spending levels or changes in our customers’ strategies regarding enterprise collaboration tools. If our customers renew their subscriptions, they may renew for fewer users or page views, for shorter contract lengths or on other terms that are less economically beneficial to us. For 2016, our renewal rates, excluding upsell, were below 90% for transactions over $50,000, and we expect them to continue to fluctuate in future periods. If customers enter into shorter initial subscription periods, the risk of customers not renewing their subscriptions with us would increase and our billings and revenues may be adversely impacted. We cannot assure you that our customers will renew their subscriptions, and if our customers do not renew their agreements or renew on less favorable terms, our revenues may grow more slowly than expected or decline and our billings may be adversely impacted.
To the extent we are successful in increasing our customer base, we could incur increased losses because costs associated with generating customer agreements and performing services are generally incurred up front, while revenue is recognized ratably over the term of the agreement. This risk is particularly applicable for those customers who choose to deploy our products in the public cloud. If new customers sign agreements with short initial subscription periods and do not renew their subscriptions, our operating results could be negatively impacted due to the upfront expenses associated with our sales and implementation efforts. Alternatively, to the extent we are unsuccessful in increasing our customer base, we could also incur increased losses as costs associated with marketing programs and new products intended to attract new customers would not be offset by future incremental revenues and cash flow.
In order for us to improve our operating results, it is important that our customers make additional significant purchases of our functionality and offerings, including additional communities, modules, users or page views or professional services. If our customers do not purchase additional functionality or offerings, our revenues may grow more slowly than expected. Additionally, increasing incremental sales to our current customer base requires increasingly sophisticated and costly sales efforts that are targeted at senior management. We also invest various resources targeted at expanding the utilization rates of our products. There
13
can be no assurance that our efforts would result in increased sales to existing customers, or upsells, and additional revenues. If our efforts to upsell to our customers are not successful, our business will suffer.
Additionally, our quarterly sales cycles are frequently more heavily weighted toward the end of the quarter with an increased volume of sales in the last few weeks of the quarter. If this trend becomes more exaggerated, it could negatively impact the timing of recognized revenues, cash collections and delivery of professional services in subsequent periods. Furthermore, the concentration of contract negotiations in the last few weeks of the quarter could require us to hire additional sales, legal and finance employees.
We depend on key personnel, members of our board of directors, and our senior management team to run and oversee our business, and the loss of one or more key employees or the inability of replacements to quickly and successfully perform in their roles could harm our business and prevent us from implementing our business plan in a timely manner.
Our success depends largely upon the continued services of our executive officers, which includes key leadership in the areas of research and development, marketing, sales, product, services and the general and administrative functions. The loss of the services of our senior management or any of our key personnel, the inability to attract or retain qualified personnel, or delays in hiring required personnel could significantly delay or prevent the achievement of our development and strategic objectives, and may adversely affect our business, financial condition and operating results. Our productivity and the quality of our products may be adversely affected if we do not integrate and train our new employees quickly and effectively.
In the last year, we announced the departure of three of our board members, including those who were not nominated for re-election, and the addition of three new board members. In addition, some of the members of our current management team have only been working together for a short period of time. Furthermore, from time to time, there may be additional changes in our executive management team resulting from the hiring or departure of executives. In the future, there may be additional changes to our board of directors or management team which could divert management’s attention and disrupt our business.
Our personnel do not have employment arrangements that require them to continue to work for us for any specified period and, therefore, they could terminate their employment with us at any time. We do not maintain key person life insurance policies on any of our employees. The loss of one or more of our key employees or groups could seriously harm our business.
Because competition for our target employees is intense, we may not be able to attract and retain the highly skilled employees we need to support our operations and growing customer base.
Our future success will depend on our continued ability to identify, hire, develop, motivate and retain talent. In the software industry in general, and in the San Francisco Bay and Portland metropolitan areas specifically, there is substantial and continuous competition for software engineers with high levels of experience in designing, developing and managing software, as well as competition for sales executives and operations personnel. We may not be successful in attracting and retaining qualified personnel. We have, from time to time, experienced, and we expect to continue to experience, difficulty in hiring and retaining highly skilled employees with appropriate qualifications. In addition, job candidates and existing employees often consider the value of the stock awards they receive in connection with their employment. If the value of our stock does not increase or declines, it may adversely affect our ability to retain highly skilled employees. In addition, since we expense all stock-based compensation, we may periodically change our stock compensation practices, which may include reducing the number of employees eligible for equity or reducing the size of equity awards granted per employee. If the anticipated value of such stock-based incentive awards does not materialize, if our stock-based compensation otherwise ceases to be viewed as a valuable benefit, or if our total compensation package is not viewed as being competitive, our ability to attract, retain, and motivate executives and key employees could be weakened. If we fail to attract new personnel or fail to retain and motivate our current personnel, our business and future growth prospects could be severely harmed.
Because our long-term success depends, in part, on our ability to expand our sales to customers outside the United States, our business will be susceptible to risks associated with international operations.
We sell our products primarily through our direct sales organization, which is comprised of inside sales and field sales personnel located in a variety of geographic regions, including the United States, Canada, the Asia Pacific region and Europe. Sales outside of the United States represented approximately 27%, 27% and 24% of our total revenues in the fiscal years ended December 31, 2016, 2015 and 2014, respectively. As we continue to expand sales of our products to customers located outside the United States, our business will be increasingly susceptible to risks associated with international operations. However, we have a limited operating history outside the United States, and our ability to manage our business and conduct our operations internationally, particularly in new geographies, requires considerable management attention and resources and is subject to particular challenges of supporting a business in an environment of diverse cultures, languages, customs, tax laws, legal systems, alternate dispute systems and regulatory systems. The risks and challenges associated with international expansion include:
14
• | the effects and any resulting negative economic impact of the U.K.’s referendum to exit the EU; |
• | continued localization of our platform, sales collateral and legal agreements, including translation into foreign languages and associated expenses; |
• | laws and business practices favoring local competitors; |
• | compliance with multiple, conflicting and changing governmental laws and regulations, including employment, tax, privacy and data protection laws and regulations; |
• | compliance with anti-bribery laws, including compliance with the Foreign Corrupt Practices Act and the UK Anti-Bribery Act; |
• | international customers’ potential reluctance to do business with U.S. companies as a result of concerns around alleged data monitoring activities by the United States National Security Administration (the “NSA”); |
• | regional data privacy laws that apply to the processing of personal information, particularly those focused on the transmission of our customers’ data across international borders; |
• | ability to provide local hosting, consulting and support services; |
• | different pricing environments, including invoicing and collecting in foreign currencies and associated foreign currency exposure; |
• | difficulties in staffing and managing foreign operations and the increased travel, infrastructure, accounting, tax and legal compliance costs associated with international operations; |
• | different or lesser protection of our intellectual property rights; |
• | difficulties in enforcing contracts and collecting accounts receivable, longer payment cycles and other collection difficulties; |
• | regional economic and political conditions; |
• | disruption as a result of the obligation of certain of our personnel in Israel to perform military service; and |
• | security concerns, such as civil or military unrest and terrorist activities. |
Additionally, our international customers currently pay us in U.S. dollars and, as a result, fluctuations in the value of the U.S. dollar and foreign currencies may make our platform more expensive for international customers, which could harm our business. In the future, an increasing number of our customers may pay us in foreign currencies. Any fluctuation in the exchange rate of these foreign currencies or pressure on the creditworthiness of sovereign nations, particularly in Europe, may negatively impact our business. If we are unable to successfully manage the challenges of international operations and expansion, our growth could be limited, and our business and operating results could be adversely affected.
Our sales cycle can be long and unpredictable, particularly with respect to large enterprises, and we may have to delay revenue recognition for some of the more complex transactions, which could harm our business and operating results.
The timing of our sales is difficult to predict. Our sales efforts involve educating our customers, frequently at an executive level, about the use, potential return on investment, technical capabilities, security and other benefits of our products. Customers often undertake a prolonged product-evaluation process which frequently involves not only our solutions but also those of our competitors. As we continue to target our sales efforts at large enterprise customers, we will face greater costs, long sales cycles and less predictability in completing some of our sales. In this market segment, the customer’s decision to subscribe to our platform may be an enterprise-wide decision and, if so, may require us to provide even greater levels of education regarding the use and benefits of our products and obtain support from multiple departments within larger enterprises, as well as obtain support from the IT departments. In addition, prospective enterprise customers may require customized features and functions unique to their business process and may require acceptance testing related to those unique features. As a result of these factors, these sales opportunities may require us to devote greater sales support, operational support, technical support and professional services resources to individual customers, increasing costs and time required to complete sales and diverting our own sales and professional services resources to a smaller number of larger transactions, while potentially requiring us to delay revenue recognition on some of these transactions until the acceptance requirements have been met.
Our internally managed data hosting facilities expose us to additional risks which could result in operational inefficiencies, increase our costs and ultimately have a negative impact on our business.
We currently host customer communities through internally managed hosting facilities. These facilities are vulnerable to damage or interruption from natural disasters, fires, power loss, telecommunications failures and similar events. They are also subject to employee negligence, break-ins, computer viruses, sabotage, intentional acts of vandalism and other misconduct. The occurrence of any of these disasters, or other unanticipated problems, could result in lengthy interruptions in our service, which would materially impact our customers’ use of our offerings and may result in financial penalties for which we will be directly and solely responsible.
15
In addition, we are subject to other risks and challenges inherent in managing the infrastructure that currently hosts customer communities, including any failure to properly plan for our infrastructure capacity requirements and our inability to obtain and maintain the technologies and personnel necessary to cause the hosting services to operate efficiently and in accordance with our contractual commitments, including those pertaining to uptime and security.
To the extent that we are required to add data center capacity to accommodate customer demands for additional bandwidth or storage to enable their communities, we may need to significantly increase the bandwidth, storage, power or other elements of our hosting operations, and the costs associated with adjustments to our data center architecture could also negatively affect our margins and operating results.
We rely on third-party service providers, including Amazon Web Services, to host some of our solutions and services and any interruptions or delays in services from such third parties could impair the delivery of our products and harm our business.
We currently outsource some of our hosting services to third-party hosting providers. In addition, we may outsource a larger portion of our hosting services and core offerings in the future. For example, we recently made the decision to transition our cloud offering infrastructure to AWS and expect to substantially complete the transition by the end of 2017. We do not control the operation of third party providers’ facilities and therefore must rely on such providers to ensure that our technology and customer data is adequately protected. The third party providers’ facilities may be vulnerable to damage or interruption from natural disasters, fires, power loss, telecommunications failures and similar events. They are also subject to employee negligence, break-ins, computer viruses, sabotage, intentional acts of vandalism and other misconduct. The occurrence of any of these disasters, a decision by the provider to close the facilities without adequate notice or other unanticipated problems could result in lengthy interruptions in our service which would materially impact our customers’ use of our offerings and may result in financial penalties.
Interruptions or delays in our service as a result of a variety of factors could impair the delivery of our service and harm our business.
The availability of our platform could be interrupted by a number of factors, including disaster events at our hosting facilities or our hosting providers' facilities, our customers’ inability to access the Internet, the failure of our network or software systems due to human or other error, security breaches or inability of the infrastructure to handle spikes in customer usage. We may be required to issue credits or refunds or indemnify or otherwise be liable to customers or third parties for damages that may occur resulting from certain of these events. In December 2013, we experienced a hosting outage, which impacted several of our U.S. customers for up to 11.5 hours, as well as shorter outages in March 2014 and April 2015. Additionally, in November 2015, we experienced a hosting outage which resulted in varying periods of downtime during an approximately nine hour time period affecting several of our U.S. customers. As a result of these outages, we provided service credits to certain customers. Service credits provided to date have not been material, both individually and in the aggregate. If we experience similar outages in the future, we may experience customer dissatisfaction, the termination of customer contracts, potential contract liability and potential loss of confidence, which could harm our reputation and impact future revenues from these customers.
If our internal or third-party vendors’ security measures are breached or unauthorized access to customer data is otherwise obtained, our solutions may be perceived as not being secure, customers may reduce the use of or stop using our solutions and we may incur significant liabilities.
Our hosting operations involve the storage and transmission of customer data. In certain circumstances, we use third-party providers to assist in these operations for certain lines of our business. Security breaches or unauthorized access to customer data that we, or our third-party hosting providers, host could result in the misuse or loss of this information, litigation, indemnity obligations, regulatory fines and penalties and other liabilities.
Many of our customer and partner contracts provide that we assume full responsibility and will indemnify our customers for data privacy or security breaches or unauthorized access of customer data. If such a breach occurs, we could face contractual damages, damages and fees arising from our indemnification obligations, penalties for violation of applicable laws or regulations, possible lawsuits by affected individuals and significant remediation costs and efforts to prevent future occurrences. These risks increase as the adoption of our cloud-based products by enterprise customers increases.
In addition, whether there is an actual or a perceived breach of our security, the market perception of the effectiveness of our security measures could be harmed significantly and we could lose current or potential customers. For example, in August 2016, we became aware that usernames and passwords for our Producteev tool were held in a file outside our normal encryption procedures and we believe that this file may have potentially been accessed by an unauthorized third party. The Producteev tool is a standalone tool not utilizing the Jive core platform. Although we are unable to confirm whether or not any username and/or password data
16
was in fact accessed, we notified all Producteev customers of this potential breach, which to date has not led to a material loss of revenue but may have had an effect on market perception of our security measures.
While we and our third-party vendors have security measures in place, these systems and networks are subject to ongoing threats and, therefore, these security measures may be breached as a result of third-party action, including cyber attacks or other intentional misconduct by computer hackers, employee error, failure to implement appropriate processes and procedures, malfeasance or otherwise. The frequency, severity, sophistication and public awareness of these cyber attacks or other intentional misconduct by computer hackers increased in recent years. If any such security breaches were to occur, it could result in one or more third parties obtaining unauthorized access to our customers’ data or our data, including personally identifiable information, information covered by HIPAA, intellectual property and other confidential business information. Third parties may also attempt to fraudulently induce employees or customers into disclosing sensitive information such as user names, passwords or other information in order to gain access to our customers’ data or our data, including intellectual property and other confidential business information.
Our hosting, support and professional services personnel sometimes must access customer communities to fulfill our contractual obligations to provide these services to our customers. This access may result in exposure to confidential customer data and personally-identifiable information that is stored within our platform. If our personnel or our software systems were to permit unauthorized loss or access to this data by a third party, our reputation could be damaged and we could incur significant liability.
As described above, some of our lines of business rely on certain third-party service providers to host and deliver services and data, and any interruptions or delays in these hosted services, any security or privacy breaches, or any failures in data collection could expose us to liability and harm our business and reputation. A security incident at any third-party hosting facility may compromise the confidentiality, integrity or availability of customer data.
Additionally, while our platform is not intended for the transmission or storage of credit card data, sensitive health, personal account or financial information and we contractually prohibit our customers from doing so, neither we nor our suppliers monitor or review the content that our customers upload and store within their communities. Therefore, we have no direct control over the substance or use of the content within our hosted communities. If customers use our platform for the transmission or storage of sensitive health, credit card, personal account or financial information and our security measures are breached our reputation could be damaged, our business may suffer and we could incur significant liability as many domestic and international laws place a higher burden of care on organizations that transmit and process this type of information.
Because techniques used to obtain unauthorized access or sabotage systems change frequently and generally are not identified until they are launched against a target, we may be unable to anticipate these techniques, to implement adequate preventative or mitigation measures or to detect any such security breaches in a timely manner. If an actual or perceived breach of our, or our third-party vendors, security occurs, it could negatively impact our ability to attract new customers and increase engagement by existing customers, cause existing customers to elect to not renew their subscriptions, subject us to third-party lawsuits, regulatory fines or other action or liability, thereby harming our reputation and our operating results.
In addition, through the APIs we make available to our customers and technology partners and through our add-on modules we deliver our customers may obtain third-party applications which access the data stored within their community. Because we do not control the transmissions between our customers and these third-party technology providers, or the processing of such data by third-party technology providers, we cannot ensure the complete integrity or security of such transmissions or processing. Any security breach could result in a loss of confidence in the security of our service, damage our reputation, disrupt our business, lead to legal and financial liability and negatively impact our future sales.
Because our platform could be used to collect and store personal information of our customers’ employees or customers, privacy concerns could result in additional cost and liability to us or inhibit sales of our platform.
Personal privacy has become a significant issue in the United States and in many other countries where we offer our solutions. The regulatory framework for privacy issues worldwide is currently evolving and is likely to remain uncertain for the foreseeable future. Many federal, state and foreign government bodies and agencies have adopted or are considering adopting laws and regulations regarding the collection, use, disclosure, control and deletion of personal information. In the United States, these include, without limitation, rules and regulations promulgated under the authority of the Federal Trade Commission, HIPAA and state breach notification laws. Internationally, virtually every jurisdiction in which we operate has established its own data security and privacy legal framework with which we and our customers must comply. These obligations include, for example, the Data Protection Directive established in the European Union (“EU”), European Directive 2002/58/EC (commonly known as the “EU Cookie Law”), laws and regulations of EU member states, such as the German Federal Data Protection Act, and the Personal Data Protection Ordinance promulgated in Hong Kong.
17
Many of these obligations are frequently modified or updated and require ongoing supervision. For example, on April 14, 2016, the European Parliament formally adopted the General Data Protection Regulation (the GDPR), which will establish a new framework for data protection in Europe. The GDPR alters data protection requirements that exist under the Data Protection Directive and the EU Cookie Law, and may affect EU member state implementations for the Data Protection Directive. Between now and the time that the GDPR becomes effective in May 2018, we may need to modify our platform or our business to comply with new requirements contained in the GDPR or to address customer concerns relating to the GDPR, and any such measures may result in costs and expenses, and any failure to achieve required data protection standards may result in lawsuits, regulatory fines, or other actions or liability, all of which may harm our operating results.
In addition, with regard to transfers of personal data, from our employees and European customers to the United States, we historically relied upon adherence to the U.S. Department of Commerce’s Safe Harbor Privacy Principles and compliance with the U.S.-EU and U.S.-Swiss Safe Harbor Frameworks agreed to by the U.S. Department of Commerce, the European Union and Switzerland. The U.S.-EU Safe Harbor Framework, which, together with the U.S.-Swiss Safe Harbor Framework, established means for legitimizing the transfer of personal data by U.S. companies from the European Economic Area (the “EEA”), to the United States, was invalidated in October 2015 by a decision of the European Court of Justice (the “ECJ Ruling”). As a result of the ECJ Ruling, the Swiss data protection regulator has questioned the status of the U.S.-Swiss Safe Harbor Framework. In light of these events, we have engaged in certain measures designed to legitimize our transfers of personal data from the EEA to the United States, and may find it necessary or desirable to make other changes to our personal data handling. U.S. and EU authorities reached a political agreement on February 2, 2016 regarding a new potential means for legitimizing personal data transfers from the EEA to the United States, the EU-U.S. Privacy Shield. The EU-U.S. Privacy Shield was granted an adequacy decision by the EU College of Commissioners on July 12, 2016, and became available to U.S. companies on August 1, 2016, and we recently became self-certified under the EU-U.S. Privacy Shield. The U.S.-EU Privacy Shield has been subject to legal challenge, however, and it is unclear whether the EU-U.S. Privacy Shield will continue to serve as an appropriate means for us to legitimize personal data transfers from the EEA to the United States. We may be unsuccessful in maintaining legitimate means for our transfer of personal data from the EEA or otherwise responding to developments with regard to data protection in the EEA, and we may experience reluctance or refusal by current or prospective European customers to use our solutions. Our response to developments with regard to data protection in the EEA may cause us to assume additional liabilities or incur additional expenses for implementing compliance requirements, and any such developments and our response could adversely affect our billings. Additionally, we and our customers may face a risk of enforcement actions by data protection authorities in the EEA in connection with any future developments with respect to applicable EU data protection law.
In addition to government regulation, privacy advocacy and industry groups may propose new and different self-regulatory standards that either legally or contractually apply to us. Because the interpretation and application of privacy and data protection laws, regulations and standards are uncertain, it is possible that these laws, regulations and standards may be interpreted and applied in a manner that is inconsistent with our data management practices or the technological features of our solutions. If so, in addition to the possibility of fines, investigations, lawsuits and other claims and proceedings, it may be necessary or desirable for us to fundamentally change our business activities and practices or modify our software, which could have an adverse effect on our business. We may be unable to make such changes or modifications in a commercially reasonable manner or at all. Any inability to adequately address privacy concerns, even if unfounded, or any actual or perceived failure to comply with applicable privacy or data protection laws, regulations, standards and policies, could result in additional cost and liability to us, damage our reputation, inhibit sales and harm our business.
We expect that there will continue to be new proposed laws, regulations and industry standards concerning privacy, data protection and information security in the United States, the EU and other jurisdictions, and we cannot yet determine the impact such future laws, regulations and standards may have on our business. Because global laws, regulations and industry standards concerning privacy, data protection and information security have continued to develop and evolve rapidly, it is possible that our products may not be, or may not have been, compliant with each such applicable law, regulation, and industry standard.
Any such new laws, regulations, other legal obligations or industry standards, or any changed interpretation of existing laws, regulations or other standards may require us to incur additional costs and restrict our business operations. For instance, the U.K.’s referendum to exit the EU has also created uncertainty with regard to the regulation of data protection in the U.K. In particular, it is unclear whether the U.K. will enact the EU Data Protection Directive, and how data transfers to and from the U.K. will be regulated. If our privacy or data security measures fail to comply with current or future laws, regulations, policies, legal obligations or industry standards, we may be subject to litigation, regulatory investigations, fines or other liabilities, as well as negative publicity and a potential loss of business. Moreover, if future laws, regulations, other legal obligations or industry standards, or any changed interpretations of the foregoing limit our customers’ or partners’ ability to use and share personally identifiable information or our ability to store, process and share personally identifiable information or other data, demand for our products could decrease, our costs could increase and our business, operating results and financial condition could be harmed.
18
Furthermore, the costs of compliance with, and other burdens imposed by, the laws, regulations, standards and policies that are applicable to the businesses of our customers may limit the use and adoption of, and reduce the overall demand for, our platform. Privacy concerns, whether valid or not valid, may inhibit market adoption of our platform particularly in certain industries and foreign countries.
For instance, the publicity in the United States and abroad regarding the alleged surveillance activities of the NSA may cause our current and prospective customers to require additional information regarding our data disclosure policies which may elongate our sales cycles, require us to make additional contractual commitments, assume additional liabilities and adversely affect our billings.
If we fail to manage our growth effectively, we may be unable to execute our business plan, maintain high levels of service or adequately address competitive challenges.
We have experienced significant growth in recent periods. For example, we have grown from 527 employees at December 31, 2012 to 595 at December 31, 2016 and we have acquired six companies since January 2011. This growth has placed, and any future growth may place, a significant strain on our management and operational infrastructure, including our hosting operations and enterprise resource planning system. Our success will depend, in part, on our ability to manage these changes effectively. We will need to continue to improve our operational, financial and management controls and our reporting systems and procedures, which may include the implementation of a new enterprise resource planning system in the future. Failure to effectively manage growth could result in declines in quality or customer satisfaction, increases in costs, difficulties in introducing new features or other operational difficulties. Any failure to effectively manage growth could adversely impact our business and reputation.
Changes in laws and/or regulations related to the Internet or related to privacy and data security concerns or changes in the Internet infrastructure itself may cause our business to suffer.
The future success of our business depends upon the continued use of the Internet as a primary medium for commerce, communication and business applications. Federal, state or foreign government bodies or agencies have in the past adopted, and may in the future adopt, laws or regulations affecting data privacy and the transmission of certain types of content using the Internet. For example, the State of California has adopted legislation requiring operators of commercial websites and mobile applications that collect personal information from California residents to conspicuously post and comply with privacy policies that satisfy certain requirements. Several other U.S. states have adopted legislation requiring companies to protect the security of personal information that they collect from consumers over the Internet, and more states may adopt similar legislation in the future. Additionally, the Federal Trade Commission has used its authority under Section 5 of the Federal Trade Commission Act to bring actions against companies for failing to maintain adequate security for personal information collected from consumers over the Internet and for failing to comply with privacy-related representations made to Internet users. The U.S. Congress has at various times proposed federal legislation intended to protect the privacy of Internet users and the security of personal information collected from Internet users that would impose additional compliance burdens upon companies collecting personal information from Internet users, and the U.S. Congress may adopt such legislation in the future. The EU also has adopted various directives regulating data privacy and security and the transmission of content using the Internet involving residents of the EU, including those directives known as the Data Protection Directive, the E-Privacy Directive, and the Privacy and Electronic Communications Directive, the GDPR and may adopt similar directives in the future. Additionally, various EU member states have passed legislation addressing data privacy and security, such as the German Federal Data Protection Act. Several other countries, including Canada and several Latin American and Asian countries, have constitutional protections for, or have adopted legislation protecting, individuals’ personal information. Additionally, some federal, state, or foreign governmental bodies have established laws which seek to censor the transmission of certain types of content over the Internet or require that individuals be provided with the ability to permanently delete all electronic personal information, such as the German Multimedia Law of 1997.
Given the variety of global privacy and data protection regimes, as well as their uncertain interpretation and application, it is possible we may find ourselves subject to inconsistent obligations. For instance, the USA Patriot Act is considered by some to be in conflict with certain directives of the EU. Situations such as these require that we make prospective determinations regarding compliance with conflicting regulations. Increased enforcement of existing laws and regulations, as well as any laws, regulations or changes that may be adopted or implemented in the future, could limit the growth of the use of public cloud applications or communications generally, result in a decline in the use of the Internet and the viability of Internet-based applications such as our public cloud solutions, require implementation of additional technological safeguards and reduce the demand for our enterprise collaboration software platform. Additionally, due to the complexity and diversity of these laws, our customers often include contractual obligations which can impose significant risk of termination and financial penalties if we fail to comply.
19
If we are not able to develop and introduce enhancements and new features that achieve market acceptance or that keep pace with technological developments, our business could be harmed.
We operate in a dynamic environment characterized by rapidly changing technologies and industry and legal standards. The introduction of new enterprise collaboration software products by our competitors or new market entrants, the market acceptance of solutions or products based on new or alternative technologies, or the emergence of new industry standards could affect our ability to compete or potentially render our platform obsolete. Our ability to compete successfully, attract new customers and increase revenues from existing customers depends in large part on our ability to enhance and improve our existing enterprise collaboration software platform and to continually introduce or acquire new features that are in demand by the market we serve. The success of any enhancement or new solution depends on several factors, including timely completion and integration, adequate quality testing, introduction and market acceptance. Any new platform or feature that we develop or acquire may not be introduced in a timely or cost-effective manner, may contain defects or may not achieve the broad market acceptance necessary to generate significant revenues. If we are unable to anticipate or timely and successfully develop or acquire new offerings or features or enhance our existing platform to meet customer requirements, our business and operating results will be adversely affected. Additionally, for technologies that are acquired, we may not be able to successfully integrate or monetize the acquired technology at a rate that is consistent with the market’s expectations.
Our platform must integrate with a variety of operating systems, software applications and hardware that are developed by others and, if we are unable to devote the necessary resources to ensure that our solutions interoperate with such software and hardware, we may fail to increase, or we may lose, market share and we may experience a weakening demand for our platform.
Our enterprise collaboration software platform must integrate with a variety of network, hardware and software platforms and cloud-based product suites, including Microsoft Office, and we need to continuously modify and enhance our platform to adapt to changes in Internet-related hardware, software, communication, browser and database technologies. Any failure of our solutions to operate effectively with future network platforms and technologies could reduce the demand for our platform, result in customer dissatisfaction and harm our business. If we are unable to respond in a timely manner to these changes in a cost-effective manner, our solutions may become less marketable and less competitive or obsolete and our operating results may be negatively impacted. In addition, an increasing number of individuals within the enterprise are utilizing devices other than personal computers, such as mobile phones and other handheld devices, to access the Internet and corporate resources and conduct business. While we currently offer a mobile version of our Jive interactive intranet, we do not currently offer a mobile-enabled version of our Jive-x offering. If we cannot effectively make our services available on mobile devices, we may experience difficulty attracting and retaining customers.
We derive a substantial portion of our revenues from a single software platform.
We have historically derived a substantial portion of our total revenues from sales of a single software platform, the Jive Platform, and related modules. As such, any factor adversely affecting sales of this platform, including product release cycles, market acceptance, product competition, performance and reliability, reputation, price competition, and economic and market conditions, could harm our business and operating results.
Our business could be adversely affected if our customers are not satisfied with our implementation, customization or other professional services we provide.
Our business depends on our ability to satisfy our customers and meet our customers’ business needs. If a customer is not satisfied with the type of solutions and professional services we or our partners deliver, we could incur additional costs to remedy the situation, the profitability of that work might be impaired, and the customer’s dissatisfaction with our services could damage our ability to obtain additional services from that customer or our ability to renew that customer’s subscription in subsequent periods. If we are not able to accurately estimate the cost of services requested by the customer, it might result in providing services on a discounted basis or free of charge until customer satisfaction is achieved. In addition, negative publicity related to our customer relationships, regardless of its accuracy, may further damage our business by affecting our ability to compete for new business with current and prospective customers. Further, we have customer payment obligations not yet due that are attributable to software we have already delivered. These customer obligations are typically not cancelable, but will not yield the expected revenues and cash flow if the customer defaults and fails to pay amounts owed, which could have a negative impact on our financial condition and operating results.
Additionally, large enterprises may request or require customized features and functions unique to their particular business processes. If prospective large customers require customized features or functions that we do not offer, then the market for our platform will be more limited and our business could suffer, particularly given our increased focus on the large and mid-sized enterprise segments of our markets. If a large enterprise contract requires customized features and functions, we cannot recognize
20
any revenue related to the contract until the customized features and functions have been delivered to the customer. In addition, supporting large enterprise customers could require us to devote significant development services and support personnel and strain our personnel resources and infrastructure. If we are unable to address the needs of these customers in a timely fashion or further develop and enhance our platform, these customers may not renew their subscriptions, seek to terminate their relationship, renew on less favorable terms or fail to purchase additional features. If any of these were to occur, our revenues and billings may decline and we may not realize significantly improved operating results.
We might experience significant errors or security flaws in our platform.
Despite testing prior to their release, software products frequently contain undetected errors, defects or security vulnerabilities, especially when initially introduced or when new versions are released. Errors in our products could affect the ability of our products to interoperate with other hardware or software products, impact functionality and delay the development or release of new solutions or new versions of solutions and adversely affect market acceptance of our products. The detection and correction of any bugs or security flaws can be time consuming and costly. Some errors in our platform and related solutions may only be discovered after installation and use by customers. Any errors, defects or security vulnerabilities discovered after commercial release or contained in custom implementations could result in loss of revenues or delay in revenue recognition, loss of customers or increased service and warranty cost, any of which could adversely affect our business, financial condition and results of operations. Our products have contained, and may contain, undetected errors, defects or security vulnerabilities that could result in data unavailability, data security breaches, data loss or corruption or other harm to our customers. Undiscovered vulnerabilities in our products could expose them to hackers or other unscrupulous third parties who develop and deploy viruses, worms, and other malicious software programs that could attack our solutions, result in unauthorized access to customer data, or fraudulently induce individuals to provide their log-in credentials. Actual or perceived security vulnerabilities in our products could result in contractual or regulatory liability, harm our reputation and lead some customers to cancel subscriptions, reduce or delay future purchases or use competitive solutions.
Failure to adequately expand and retain our direct sales force will impede our growth.
We will continue to expand and optimize our sales and marketing infrastructure in order to grow our customer base and our business. We plan to continue to invest in our direct sales force, both domestically and internationally. Identifying and recruiting qualified personnel and training them requires significant time, expense and attention. It can take nine to 12 months or longer before our new sales representatives are fully trained and productive. Our business may be harmed if our efforts to expand and train our direct sales force do not generate a corresponding significant increase in billings and revenues. In particular, if we are unable to hire, develop and retain talented sales personnel or if new direct sales personnel are unable to achieve desired productivity levels in a reasonable period of time, we may not be able to realize the expected benefits of this investment or increase our billings and revenues or grow our business.
Our growth depends in part on the success of our strategic relationships with third parties.
Our future growth may depend on our ability to enter into successful strategic relationships with third parties. For example, we are investing resources in building our indirect sales channel by establishing relationships with third parties to facilitate incremental sales and to implement and customize our platform. In addition, we are also establishing relationships with other third parties to develop integrations with compatible technology and content. These relationships may not result in additional customers or enable us to generate significant billings or revenues. Identifying partners as well as negotiating and documenting relationships with them requires significant time and resources. Our agreements for these relationships are typically non-exclusive and do not prohibit the other party from working with our competitors or from offering competing services. If we are unsuccessful in establishing or maintaining our relationships with these third parties, our ability to compete in the marketplace or to grow our revenues and billings could be impaired and our operating results would suffer.
Our use of open source technology could impose limitations on our ability to commercialize our products.
Our products contain software modules licensed to us by third-party authors under “open source” licenses. Use and distribution of open source software may entail greater risks than use of third-party commercial software, as open source licensors generally do not provide warranties or other contractual protections regarding infringement claims or the quality of the code. Some open source licenses contain provisions that require attribution or that we make available source code for modifications or derivative works we create based upon the type of open source software used. If we combine our proprietary software with open source software in a certain manner, we could, under certain open source licenses, be required to release the source code of our proprietary software to the public at no cost. This would allow our competitors to create similar products with lower development effort and time and ultimately could result in an adverse impact upon our intellectual property rights and ability to commercialize our products.
21
Although we monitor our use of open source software to avoid subjecting our products to conditions we do not intend, the terms of many open source licenses have not been interpreted by U.S. courts, and there is a risk that these licenses could be construed in a way that could impose unanticipated conditions or restrictions on our ability to commercialize our products. Moreover, we cannot assure you that our processes for controlling our use of open source software in our products will be effective. If we are held to have breached the terms of an open source software license, we could be required to seek licenses from third parties to continue offering our products on terms that are not economically feasible, to re-engineer our products, to discontinue the sale of our products if re-engineering could not be accomplished on a timely basis, or to make generally available, in source code form, our proprietary code, any of which could adversely affect our business, operating results and financial condition.
We, or our customers, may be sued by third parties for alleged infringement or misuse of their intellectual property.
The software industry is characterized by the existence of a large number of patents, copyrights, trademarks, trade secrets and other intellectual property and proprietary rights. In the past, a number of large software, technology and social networking companies have become active in initiating litigation against competitors and other third parties for misuse of these rights. Additionally, within the United States in particular, non-practicing entities have significantly increased their activities of pursuing patent litigation against technology companies and their customers. As a result, technology and software companies are increasingly required to defend against litigation claims that are based on allegations of infringement or other violations of intellectual property rights. Our technologies may not be able to withstand any third-party claims or rights against their use. As a result, our success depends upon our not infringing upon or misappropriating the intellectual property rights of others. Our competitors, as well as a number of other entities and individuals, may own or claim to own confidential information or certain intellectual property. In addition, as we continue to expand globally, we may need to increase our headcount and, in doing so, we may hire individuals from competing industries and companies. While we have implemented procedures designed to ensure that we do not receive confidential information from third parties in such situations third parties may believe that their former employees may misuse confidential information obtained during their previous employment which may lead to an increased risk of litigation related to claims of misuse or unauthorized use of such competitors’ proprietary information.
From time to time, third parties have claimed, and may claim, that we infringe upon or have misappropriated their intellectual property rights, and we may be found to be infringing upon or misappropriating such rights. In the future, we, or our customers, may be the subject of claims that our platform, underlying technology or our actions in connection therewith infringe, misappropriate or violate the intellectual property rights of others. As a result of disclosure of information in filings required of a public company, our business and financial condition will become more visible, which we believe may result in threatened or actual litigation, including by competitors and other third parties. Any claims or litigation could cause us to incur significant expenses and, if successfully asserted against us, could require that we pay substantial damages or ongoing royalty payments, prevent us from offering our solutions, or require that we comply with other unfavorable terms. Even if the claims do not result in litigation or are resolved in our favor, these claims, and the time and resources necessary to resolve them, could divert the resources of our management and harm our business and operating results. As most of our customer and partner agreements obligate us to provide indemnification in connection with any such litigation and to obtain licenses, modify our platform, or refund fees, we have in the past been, and may in the future be, requested to indemnify our customers and business partners which could expose us to significant legal and financial liability. We expect that the occurrence of infringement claims is likely to grow as the market for enterprise collaboration software grows. Accordingly, our exposure to damages resulting from infringement claims could be increased and this could further exhaust our financial and management resources.
The outcome of any litigation, regardless of its merits, is inherently uncertain. Any intellectual property claim or lawsuit could be time-consuming and expensive to resolve, divert management attention from executing our business plan and require us to change our technology, change our business practices and/or pay monetary damages or enter into short- or long-term royalty or licensing agreements. In addition, in certain circumstances, such as those in which the opposing parties are large and well-funded companies, we may face a more expensive and protracted path to resolution of such claims or lawsuits.
Any failure to protect our intellectual property rights could impair our ability to protect our proprietary technology and our brand.
Our success and ability to compete depend in part upon our intellectual property. We primarily rely on a combination of copyright, trade secret, trademark and patent laws, as well as confidentiality procedures and contractual restrictions with our employees, customers, partners and others to establish and protect our intellectual property rights. However, the steps we take to protect our intellectual property rights may be inadequate or we may be unable to secure intellectual property protection for all of our solutions.
Moreover, others may independently develop technologies that are competitive to ours or infringe our intellectual property. The enforcement of our intellectual property rights also depends on our legal actions against these infringers being successful, but we cannot be sure these actions will be successful, even when our rights have been infringed. If we fail to protect our intellectual
22
property rights adequately, our competitors might gain access to our technology, and our business and operating results might be harmed. In addition, defending our intellectual property rights might entail significant expense and the diversion of management resources. Any of our intellectual property rights may be challenged by others or invalidated through administrative process or litigation. Any patents we hold or that are issued in the future may not provide us with competitive advantages, or may be successfully challenged by third parties.
Furthermore, legal standards relating to the validity, enforceability and scope of protection of intellectual property rights are uncertain. Effective protection of our intellectual property may not be available to us in every country in which our solutions are available. The laws of some foreign countries may not be as protective of intellectual property rights as those in the United States, and mechanisms for enforcement of intellectual property rights may be inadequate. Accordingly, despite our efforts, we may be unable to prevent third parties from infringing upon or misappropriating our intellectual property.
Additionally, in the United States, the central provisions of the Leahy-Smith America Invents Act (AIA) became effective on March 16, 2013. Among other things, this law has switched U.S. patent rights from prior “first-to-invent” system to the present “first inventor-to-file” system. This may result in inventors and companies having to file patent applications more frequently to preserve rights in their inventions. This may favor larger competitors that have the resources to file more patent applications.
We might be required to spend significant resources to monitor and protect our intellectual property rights, and our efforts to enforce our intellectual property rights may be met with defenses, counterclaims and countersuits attacking the validity and enforceability of our intellectual property rights. Litigation to protect and enforce our intellectual property rights could be costly, time-consuming and distracting to management, whether or not it is resolved in our favor, and could ultimately result in the impairment or loss of portions of our intellectual property.
The outcome of the U.K.’s referendum on membership in the EU may have a negative effect on global economic conditions, financial markets, and on the U.K. and European economies, any or all of which could have a material adverse effect on our U.K. and international businesses.
On June 23, 2016, a referendum was held on the U.K.’s membership in the EU, the outcome of which was a vote in favor of leaving the EU. The U.K.’s vote to leave the EU creates an uncertain political and economic environment in the U.K. and potentially across other EU member states, which may last for a number of months or years.
The result of the referendum means that the long-term nature of the U.K.’s relationship with the EU is unclear and that there is considerable uncertainty as to when any such relationship will be agreed and implemented. Should the U.K. leave the EU, it is unclear what trade agreements the U.K. will reach with the EU and also with other countries around the world and this will affect tariff agreements. Further, it is unclear to what extent EU regulation currently in effect in the U.K. will remain in place. In the interim, there is a risk of instability for both the U.K. and the EU, which could adversely affect our results, financial condition and prospects.
The nature of our business requires the application of complex revenue and expense recognition rules and the current legislative and regulatory environment affecting generally accepted accounting principles is uncertain. Significant changes in current principles could affect our financial statements going forward and changes in financial accounting standards or practices may cause adverse, unexpected financial reporting fluctuations and harm our operating results.
The accounting rules and regulations that we must comply with are complex and subject to interpretation by the Financial Accounting Standards Board (FASB), the SEC and various bodies formed to promulgate and interpret appropriate accounting principles. Recent actions and public comments from the FASB and the SEC have focused on the integrity of financial reporting and internal controls. In addition, many companies’ accounting policies are being subject to heightened scrutiny by regulators and the public. Further, the accounting rules and regulations are continually changing in ways that could materially impact our financial statements.
In May 2014, the Financial Accounting Standards Board (“FASB”) issued Accounting Standards Update (“ASU”) No. 2014-09, “Revenue from Contracts with Customers,” which requires an entity to recognize the amount of revenue to which it expects to be entitled for the transfer of promised goods or services to customers. In addition, the standard requires disclosure of the nature, amount, timing and uncertainty of revenue and cash flows arising from contracts with customers. The FASB has recently issued several amendments to the standard, including clarification on accounting for licenses of intellectual property and identifying performance obligations. The ASU will replace most existing revenue recognition guidance in GAAP when it becomes effective. The new standard, as amended, is effective for annual reporting periods beginning after December 15, 2017, with early adoption permitted for annual reporting periods beginning after December 15, 2016. We do not plan to early adopt, and thus the new standard will become effective for us on January 1, 2018.
23
The new standard permits adoption either by using (i) a full retrospective approach for all periods presented in the period of adoption or (ii) a modified retrospective approach with the cumulative effect of initially applying the new standard recognized at the date of initial application and providing certain additional disclosures. We currently plan to adopt using the modified retrospective approach. However, our decision regarding the adoption method has not been finalized at this time. Our final determination will depend on a number of factors, such as the significance of the impact of the new standard on our financial results, system readiness, including that of software procured from third-party providers, and our ability to accumulate and analyze the information necessary to assess the impact on prior period financial statements.
We are in the initial stages of our assessment of the impact of the new standard on our accounting policies, processes and system requirements. We have assigned internal resources and engaged third party service providers to assist with the assessment and implementation and we have made and will continue to make investments in systems to enable timely and accurate reporting under the new standard. Although we have not concluded on what impact the new standard will have, we anticipate the impact on our consolidated financial statements will be material.
We currently believe the most significant impact relates to our accounting for software license revenue and professional services revenue. Under current industry-specific software revenue recognition guidance, we have historically concluded that we did not have vendor-specific objective evidence ("VSOE") of fair value for the undelivered services related to time-based licenses, and accordingly, we have recognized time-based licenses and related services ratably over the subscription term. Professional services included in an arrangement with subscription revenue have also been recognized ratably over the subscription term. The new standard does not retain the concept of VSOE, and thus requires an evaluation of whether time-based licenses and related services, including professional services, are distinct performance obligations and, therefore, should be separately recognized at a point in time or over time. Based on our current assessment, we expect that software license revenue and professional services revenue, bundled with other elements, will be recognized upon delivery after adoption of the new standard. We expect revenue related to support and maintenance, hosting, and standalone professional services to remain substantially unchanged. Due to the complexity of certain of our software license subscription contracts, the actual revenue recognition treatment required under the standard will be dependent on contract-specific terms, and may vary in some instances from recognition at the time of delivery.
We have also considered the impact of the guidance in ASC 340-40, Other Assets and Deferred Costs; Contracts with Customers, with respect to capitalization and amortization of incremental costs of obtaining a contract. The new cost guidance, as interpreted by the FASB Transition Resource Group for Revenue Recognition (“TRG”), requires the capitalization of all incremental costs to obtain a contract with a customer that would not have been incurred if the contract had not been obtained, provided the costs are expected to be recovered. The new cost guidance also requires entities to determine whether the costs relate to specific anticipated contracts, potentially extending the amortization period beyond the initial contract period. We currently believe this guidance will result in capitalizing additional costs of obtaining a contract with a customer, including additional sales commissions and that the period of benefit for deferred commission costs will likely be longer than the initial contract period. Under our current accounting policy, we amortize the capitalized costs over the underlying contractual period.
While we continue to assess the potential impacts of the new standard, including the areas described above, and anticipate this standard will have a material impact on our consolidated financial statements, we do not know and cannot reasonably estimate quantitative information related to the impact of the new standard on our financial statements at this time.
Adverse economic conditions or reduced information technology spending may adversely impact our business and operating results.
Our business depends on the overall demand for information technology. In addition, the purchase of our products is often discretionary and may involve a significant commitment of capital and other resources. Weak or unstable global economic conditions, including the potential effects of the U.K.'s referendum to leave the EU, or a reduction in information technology spending even if economic conditions improve, could adversely impact our business, financial condition and operating results. As global economic conditions continue to be volatile or economic uncertainty remains, trends in information technology spending also remain unpredictable and subject to reductions due to credit constraints and uncertainties about the future. Unfavorable economic conditions could adversely affect, our customers’ ability or willingness to purchase our enterprise collaboration software platform, and could delay prospective customers’ purchasing decisions, reduce the value or duration of their subscriptions, or affect renewal rates, all of which could adversely affect our operating results. Our sensitivity to economic cycles and any related fluctuation in demand may have a material adverse effect on our business, financial condition and operating results.
24
Catastrophic events may disrupt our business.
Our corporate headquarters are located in the San Francisco Bay Area and a high portion of our technology and services personnel are located in our Portland, Oregon office. The West Coast, and California in particular, are active earthquake zones. Additionally, we rely on our network and third-party infrastructure and enterprise applications, internal technology systems and our website for our development, marketing, operational, support, hosted services and sales activities. In the event of a major earthquake or catastrophic event such as fire, power loss, telecommunications failure, cyber attack, war or terrorist attack, we may be unable to continue our corporate operations and may endure system interruptions, reputational harm, loss of intellectual property, contractual and financial liabilities, delays in our product development, lengthy interruptions in our services, breaches of data security and loss of critical data, all of which could harm our future operating results.
Although we back up customer data stored on our systems at least daily to a geographically distinct location, the data is not mirrored in real-time to this site. Thus, in the event of a physical disaster, or certain other failures of our computing infrastructure, customer data from very recent transactions may be permanently lost. Further, our full production infrastructure is not mirrored to a geographically distinct location and thus in the event of a disaster, production capacity may be impacted for an extended amount of time while the infrastructure is procured and rebuilt and data is restored.
We might require additional capital to support business growth, and this capital might not be available on acceptable terms, if at all.
We intend to continue to make investments to support our business growth and may require additional funds to respond to business challenges, including the need to develop new solutions or enhance our existing solutions, enhance our operating infrastructure and acquire complementary businesses and technologies. Accordingly, we may need to engage in equity or debt financings to secure additional funds. If we raise additional funds through further issuances of equity or convertible debt securities, our existing stockholders could suffer significant dilution, and any new equity securities we issue could have rights, preferences and privileges superior to those of holders of our common stock. Any debt financing secured by us in the future could involve restrictive covenants relating to our capital raising activities and other financial and operational matters, which may make it more difficult for us to obtain additional capital and to pursue business opportunities, including potential acquisitions. In addition, we may not be able to obtain additional financing on terms favorable to us, if at all. If we are unable to obtain adequate financing or financing on terms satisfactory to us, when we require it, our ability to continue to support our business growth and to respond to business challenges could be significantly limited, and our business, operating results, financial condition and prospects could be adversely affected.
The forecasts of market growth included in this document may prove to be inaccurate, and even if the markets in which we compete achieve the forecasted growth, we cannot assure you our business will grow at similar rates, if at all.
Growth forecasts are subject to significant uncertainty and are based on assumptions and estimates which may not prove to be accurate. Forecasts relating to the expected growth in the enterprise collaboration software market and other markets may prove to be inaccurate. Even if these markets experience the forecasted growth, we may not grow our business at similar rates, or at all. Our growth is subject to many factors, including our success in implementing our business strategy, which is subject to many risks and uncertainties.
There are limitations on the effectiveness of controls and the failure of our control systems may materially and adversely impact us.
We do not expect that disclosure controls or internal controls over financial reporting will prevent all errors and all fraud. A control system, no matter how well designed and operated, can provide only reasonable, not absolute, assurance that the control system’s objectives will be met. Further, the design of a control system must reflect the fact that there are resource constraints and the benefits of controls must be considered relative to their costs. Because of the inherent limitations in all control systems, no evaluation of controls can provide absolute assurance that all control issues and instances of fraud, if any, have been detected. Failure of our control systems to prevent error or fraud could materially and adversely impact us.
25
The intended operational and tax benefits of our corporate structure and intercompany arrangements depend on the application of the tax laws of various jurisdictions and how we operate our business, and may be challenged by tax authorities.
Our corporate structure and intercompany agreements with our foreign subsidiaries are intended to optimize our operating structure and our worldwide effective tax rate, including the manner in which we develop and use our intellectual property, manage our cash flow, and the pricing of our intercompany transactions. Based on our current corporate structure, we may be subject to taxation in several jurisdictions around the world with increasingly complex tax laws, the application of which can be uncertain. For instance, we have a wholly owned subsidiary in the U.K. which provides tax benefits to us. Depending on the terms reached regarding any exit from the EU, it is possible that there could be changes in the tax laws of the U.K. impacting the tax benefits we receive from our corporate structures, which could harm our operating results.
Our foreign subsidiaries operate under cost plus transfer pricing agreements with us. These agreements provide for sales, support and development activities for our benefit. The taxing authorities of the jurisdictions in which we operate may challenge our methodologies for valuing technology or our transfer pricing arrangements, or determine that the manner in which we operate our business does not achieve the intended tax objectives, which could increase our international tax exposure and harm our operating results. For example, from May 2012 through June 30, 2013, we were under a U.S. federal tax examination for the tax years ended December 31, 2010 and 2011. Such examinations ended on June 13, 2013 and did not have a material financial impact. Further, from August 2014 through December 2014, we were under examination in Israel for the years ended December 31, 2010, 2011 and 2012. The examination officially concluded as of December 26, 2014 and did not have a material financial impact.
Our business could be negatively affected as a result of actions of activist shareholders.
If a proxy contest with respect to election of our directors is initiated in the future by any activist stockholder, or if other activist stockholder activities occur, our business could be adversely affected because:
• | responding to a proxy contest and other actions by activist stockholders can be costly and time-consuming, disrupting our operations and diverting the attention of management and our employees; |
• | perceived uncertainties as to our future direction caused by activist activities may result in the loss of potential business opportunities, and may make it more difficult to attract and retain qualified personnel and business partners; and |
• | if individuals are elected to our board of directors with a specific agenda, it may adversely affect our ability to effectively and timely implement our strategic plans. |
We may acquire or invest in other companies or technologies in the future, which could divert management’s attention, result in additional dilution to our stockholders, increase expenses, disrupt our operations and harm our operating results.
We have in the past, and may in the future, acquire or invest in other businesses, products or technologies that we believe could complement or expand our platform, enhance our technical capabilities or otherwise offer growth opportunities. We cannot assure you that we will realize the anticipated benefits of our past acquisitions or any future acquisition. The pursuit of potential acquisitions may divert the attention of management and cause us to incur various expenses related to identifying, investigating and pursuing suitable acquisitions, whether or not they are consummated.
There are inherent risks in integrating and managing acquisitions. If we acquire additional businesses, we may not be able to assimilate or integrate the acquired personnel, operations and technologies successfully or effectively manage the combined business following the acquisition. We also may not achieve the anticipated benefits from the acquired business due to a number of factors, including:
• | unanticipated costs or liabilities associated with the acquisition; |
• | incurrence of acquisition-related costs, which would be recognized as a current period expense; |
• | inability to generate sufficient revenues to offset acquisition or investment costs; |
• | the inability to maintain relationships with customers and partners of the acquired business; |
• | the difficulty of incorporating acquired technology and rights into our platform and of maintaining quality standards consistent with our brand; |
• | difficulty in incorporating new people; |
• | delays in customer purchases due to uncertainty related to any acquisition; |
• | the need to implement additional controls, procedures and policies; |
• | in the case of foreign acquisitions, the challenges associated with currency and regulatory risks; |
• | challenges caused by distance, language and cultural differences; |
• | harm to our existing business relationships with business partners and customers as a result of the acquisition; |
26
• | the potential loss of key employees; |
• | use of resources that are needed in other parts of our business; |
• | the inability to recognize acquired revenues in accordance with our revenue recognition policies, and the loss of acquired deferred revenue; and |
• | use of substantial portions of our available cash or the incurrence of debt to consummate the acquisition. |
In addition, a significant portion of the purchase price of companies we acquire may be allocated to goodwill and other intangible assets, which must be assessed for impairment at least annually. Also, contingent considerations related to acquisitions will be remeasured to fair value at each reporting period, with any changes in the value recorded as income or expense. In the future, if our acquisitions do not yield expected returns, we may be required to take charges to our operating results based on the impairment assessment process, which could harm our results of operations.
Acquisitions could also result in dilutive issuances of equity securities or the incurrence of debt, which could adversely affect our operating results. In addition, if an acquired business fails to meet our expectations, our operating results, business and financial condition may suffer.
If we are unable to maintain effective internal control over financial reporting in the future, investors may lose confidence in our company and, as a result, the value of our common stock may be adversely affected.
We are subject to Section 404 of the Sarbanes-Oxley Act, which requires us to maintain internal controls over financial reporting and to report any material weaknesses in such internal controls. We have consumed and will continue to consume management resources and incur expenses for this compliance on an ongoing basis. Additionally, if we identify one or more material weaknesses in our internal control over financial reporting, we may be unable to assert that our internal controls are effective. If we are unable to assert that our internal control over financial reporting is effective, or if our auditors are unable to attest to the effectiveness of our internal controls, we could lose investor confidence in the accuracy and completeness of our financial reports, which would have a material adverse effect on the price of our common stock.
Risk Related to Ownership of our Common Stock
The market price of our common stock is likely to be volatile and could subject us to litigation.
The trading prices of the securities of technology companies have been highly volatile. Accordingly, the market price of our common stock has been, and is likely to continue to be, subject to wide fluctuations. Factors affecting the market price of our common stock include:
• | variations in our billings, renewal rates, operating results, cash flow, loss per share and how these results compare to analyst expectations; |
• | the net increase in the number of customers acquired, either independently or as compared with published expectations of analysts that cover us; |
• | forward looking guidance on billings, revenues, cash flows and loss per share; |
• | announcements of technological innovations, new products or services, strategic alliances or significant agreements by us or by our competitors; |
• | disruptions in our hosted and cloud services; |
• | changes in the executive management team; |
• | the economy as a whole, market conditions in our industry, and the industries of our customers; and |
• | any other factors discussed herein. |
In addition, if the market for technology stocks, especially software related stocks, or the stock market in general experiences uneven investor confidence, the market price of our common stock could decline for reasons unrelated to our business, operating results or financial condition. The market price for our stock might also decline in reaction to events that affect other companies within, or outside, our industry, even if these events do not directly affect us. Some companies that have experienced volatility in the trading price of their stock have been subject of securities litigation. If we are the subject of such litigation, it could result in substantial costs and a diversion of management’s attention and resources.
27
Our charter documents and Delaware law could discourage takeover attempts and lead to management entrenchment.
Our amended and restated certificate of incorporation and amended and restated bylaws contain provisions that could delay or prevent a change in control of our company. These provisions could also make it difficult for stockholders to elect directors that are not nominated by the current members of our board of directors or take other corporate actions, including effecting changes in our management. These provisions include:
• | a classified board of directors with three-year staggered terms, which could delay the ability of stockholders to change the membership of a majority of our board of directors; |
• | the ability of our board of directors to issue shares of preferred stock and to determine the price and other terms of those shares, including preferences and voting rights, without stockholder approval, which could be used to significantly dilute the ownership of a hostile acquiror; |
• | the exclusive right of our board of directors to elect a director to fill a vacancy created by the expansion of our board of directors or the resignation, death or removal of a director, which prevents stockholders from being able to fill vacancies on our board of directors; |
• | a prohibition on stockholder action by written consent, which forces stockholder action to be taken at an annual or special meeting of our stockholders; |
• | the requirement that a special meeting of stockholders may be called only by the chairman of our board of directors, our president, our secretary, or a majority vote of our board of directors, which could delay the ability of our stockholders to force consideration of a proposal or to take action, including the removal of directors; |
• | the requirement for the affirmative vote of holders of at least 66 2/3% of the voting power of all of the then outstanding shares of the voting stock, voting together as a single class, to amend the provisions of our amended and restated certificate of incorporation relating to the issuance of preferred stock and management of our business or our amended and restated bylaws, which may inhibit the ability of an acquiror to affect such amendments to facilitate an unsolicited takeover attempt; |
• | the ability of our board of directors, by majority vote, to amend the bylaws, which may allow our board of directors to take additional actions to prevent an unsolicited takeover and inhibit the ability of an acquiror to amend the bylaws to facilitate an unsolicited takeover attempt; and |
• | advance notice procedures with which stockholders must comply to nominate candidates to our board of directors or to propose matters to be acted upon at a stockholders’ meeting, which may discourage or deter a potential acquiror from conducting a solicitation of proxies to elect the acquiror’s own slate of directors or otherwise attempting to obtain control of us. |
In addition, as a Delaware corporation, we are subject to Section 203 of the Delaware General Corporation Law. These provisions may prohibit large stockholders, in particular those owning 15% or more of our outstanding voting stock, from merging or combining with us for a certain period of time.
ITEM 1B. UNRESOLVED STAFF COMMENTS
None.
ITEM 2. PROPERTIES
Office Facilities | Number of Square Feet | Lease Expiration Date | ||
Palo Alto, California | 10,500 | March 2017 | ||
Portland, Oregon | 52,000 | September 2018 | ||
Campbell, California | 12,500 | May 2022 | ||
San Francisco, California | 7,000 | October 2022 | ||
United Kingdom | 8,000 | May 2018 | ||
Israel | 18,000 | February 2021 | ||
Data Centers | ||||
Arizona | * | December 2019 | ||
New Jersey | * | July 2019 | ||
Netherlands | * | October 2017 | ||
United Kingdom | * | March 2017 | ||
* Immaterial
28
In addition to the above, we currently occupy a number of smaller sales and service offices around the world. We believe that our current facilities are suitable and adequate to meet our current needs, and that suitable additional or substitute space will be available as needed to accommodate expansion of our operations. See Note 12 to the Consolidated Financial Statements and “Management’s Discussion and Analysis of Financial Condition and Results of Operations — Contractual Payment Obligations” for information regarding our lease obligations.
ITEM 3. LEGAL PROCEEDINGS
We currently have no material outstanding litigation.
Many of our subscription agreements require us to indemnify our customers for third-party intellectual property infringement claims, which could increase the cost to us of an adverse ruling on such a claim. Any adverse determination related to intellectual property claims or litigation could prevent us from offering our service to others, could be material to our net income or cash flows or both or could otherwise adversely affect our operating results.
ITEM 4. MINE SAFETY DISCLOSURE
Not applicable.
PART II
ITEM 5. | MARKET FOR REGISTRANT’S COMMON EQUITY, RELATED STOCKHOLDER MATTERS AND ISSUER PURCHASES OF EQUITY SECURITIES |
Stock Price and Dividends
Our common stock, $0.0001 par value, trades on the NASDAQ Global Select Market, where its prices are quoted under the symbol “JIVE.” As of February 23, 2017 there were 49 holders of record of our common stock. Because many of our shares of common stock are held by brokers and other institutions on behalf of stockholders, we are unable to estimate the total number of stockholders represented by these record holders.
The following table sets forth the reported high and low sales prices of our common stock for each of the eight quarters in the two-year period ended December 31, 2016 as regularly quoted on the NASDAQ Global Select Market:
2016 | High | Low | |||||
Quarter 1 | $ | 4.05 | $ | 2.84 | |||
Quarter 2 | 4.20 | 3.51 | |||||
Quarter 3 | 4.59 | 3.50 | |||||
Quarter 4 | 4.45 | 3.75 | |||||
2015 | |||||||
Quarter 1 | $ | 6.33 | $ | 4.88 | |||
Quarter 2 | 5.99 | 5.05 | |||||
Quarter 3 | 5.49 | 3.51 | |||||
Quarter 4 | 5.21 | 3.97 | |||||
We have never declared or paid, and do not anticipate declaring or paying in the foreseeable future, any cash dividends on our capital stock. Any future determination as to the declaration and payment of dividends, if any, will be at the discretion of our board of directors, subject to applicable laws and will depend on then existing conditions, including our financial condition, operating results, contractual restrictions, capital requirements, business prospects, and other factors our board of directors may deem relevant. In addition, our revolving loan and term loan facility with Silicon Valley Bank restricts our ability to pay dividends by requiring the written consent of Silicon Valley Bank to pay cash dividends to our stockholders.
29
Securities Authorized for Issuance
See Item 12, “Security Ownership of Certain Beneficial Owners and Management and Related Stockholder Matters” for information regarding securities authorized for issuance.
Unregistered Sales of Equity Securities
None.
Stock Performance Graph
This chart compares the cumulative total return on our common stock with that of the NASDAQ Composite index and the NASDAQ Computer and Data Processing index. The chart assumes $100 was invested on December 31, 2011, in our common stock, the NASDAQ Composite index and the NASDAQ Computer index. The peer group indices utilize the same methods of presentation and assumptions for the total return calculation as does Jive and the NASDAQ Composite index. All companies in the peer group index are weighted in accordance with their market capitalizations.
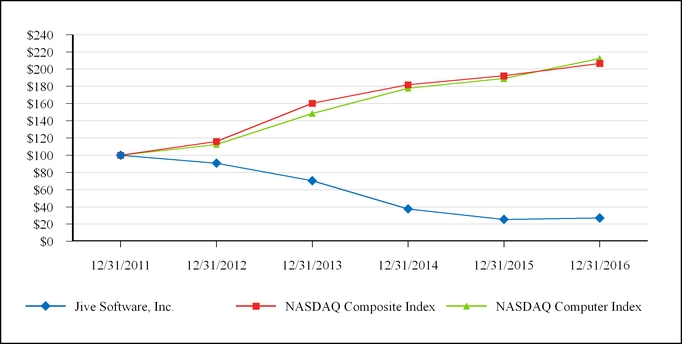
Base | Indexed Returns | ||||||||||||||||||||||
Period | Year Ended December 31, | ||||||||||||||||||||||
Company/Index | 12/31/11 | 2012 | 2013 | 2014 | 2015 | 2016 | |||||||||||||||||
Jive Software, Inc. | $ | 100.00 | $ | 90.81 | $ | 70.31 | $ | 37.69 | $ | 25.50 | $ | 27.19 | |||||||||||
NASDAQ Composite Index | 100.00 | 115.91 | 160.32 | 181.80 | 192.21 | 206.63 | |||||||||||||||||
NASDAQ Computer Index | 100.00 | 112.48 | 148.41 | 177.91 | 189.02 | 212.21 | |||||||||||||||||
ITEM 6. SELECTED FINANCIAL DATA
The following selected consolidated financial data should be read in conjunction with our audited consolidated financial statements and related notes thereto and with Management’s Discussion and Analysis of Financial Condition and Results of Operation, which are included elsewhere in this Form 10-K. The Consolidated Statement of Operations data for fiscal 2016, 2015 and 2014, and the selected Consolidated Balance Sheet data as of December 31, 2016 and 2015 are derived from the audited consolidated financial statements which are included in this Form 10-K. The Consolidated Statement of Operations data for fiscal 2013 and 2012 and the Consolidated Balance Sheet data as of December 31, 2014, 2013 and 2012 are derived from audited consolidated financial statements which are not included in this Form 10-K.
30
For the Year Ended December 31, | |||||||||||||||||||
(In thousands, except per share amounts) | 2016 | 2015 | 2014 | 2013 | 2012 | ||||||||||||||
Consolidated Statements of Operations Data | |||||||||||||||||||
Revenues: | |||||||||||||||||||
Product | $ | 187,313 | $ | 180,172 | $ | 162,185 | $ | 131,507 | $ | 100,040 | |||||||||
Professional services | 16,781 | 15,621 | 16,508 | 14,256 | 13,626 | ||||||||||||||
Total revenues | 204,094 | 195,793 | 178,693 | 145,763 | 113,666 | ||||||||||||||
Cost of revenues: | |||||||||||||||||||
Product | 48,217 | 49,816 | 43,494 | 37,419 | 30,240 | ||||||||||||||
Professional services | 19,195 | 22,378 | 23,179 | 17,873 | 14,625 | ||||||||||||||
Total cost of revenues | 67,412 | 72,194 | 66,673 | 55,292 | 44,865 | ||||||||||||||
Gross profit | 136,682 | 123,599 | 112,020 | 90,471 | 68,801 | ||||||||||||||
Operating expenses: | |||||||||||||||||||
Research and development | 45,769 | 52,818 | 52,275 | 55,742 | 39,190 | ||||||||||||||
Sales and marketing | 74,654 | 78,684 | 90,141 | 86,083 | 60,235 | ||||||||||||||
General and administrative | 25,913 | 26,708 | 24,633 | 24,613 | 16,444 | ||||||||||||||
Restructuring | 4,103 | — | — | — | — | ||||||||||||||
Total operating expenses | 150,439 | 158,210 | 167,049 | 166,438 | 115,869 | ||||||||||||||
Loss from operations(1) | (13,757 | ) | (34,611 | ) | (55,029 | ) | (75,967 | ) | (47,068 | ) | |||||||||
Total other income (expense), net(2) | 1,016 | 1,009 | 14 | (414 | ) | (339 | ) | ||||||||||||
Loss before income taxes | (12,741 | ) | (33,602 | ) | (55,015 | ) | (76,381 | ) | (47,407 | ) | |||||||||
Provision for (benefit from) income taxes(3) | 1,223 | 1,251 | 1,138 | (1,010 | ) | 28 | |||||||||||||
Net loss | $ | (13,964 | ) | $ | (34,853 | ) | $ | (56,153 | ) | $ | (75,371 | ) | $ | (47,435 | ) | ||||
Basic and diluted net loss per common share | $ | (0.18 | ) | $ | (0.46 | ) | $ | (0.79 | ) | $ | (1.12 | ) | $ | (0.76 | ) | ||||
Shares used in per share calculations | 77,494 | 75,217 | 70,751 | 67,381 | 62,614 | ||||||||||||||
(1) | Stock-based compensation was included in our Consolidated Statements of Operations data as follows (in thousands): |
Year Ended December 31, | |||||||||||||||||||
2016 | 2015 | 2014 | 2013 | 2012 | |||||||||||||||
Cost of revenues | $ | 2,162 | $ | 3,029 | $ | 4,276 | $ | 3,450 | $ | 2,035 | |||||||||
Research and development | 3,809 | 7,078 | 10,642 | 14,133 | 6,250 | ||||||||||||||
Sales and marketing | 3,373 | 3,775 | 10,852 | 10,614 | 4,970 | ||||||||||||||
General and administrative | 6,239 | 6,423 | 7,138 | 6,557 | 4,954 | ||||||||||||||
Restructuring | 21 | — | — | — | — | ||||||||||||||
Total stock-based compensation | $ | 15,604 | $ | 20,305 | $ | 32,908 | $ | 34,754 | $ | 18,209 | |||||||||
(2) | Total other income (expense), net in 2015 includes $1.1 million we received from a stockholder in settlement of a claim under Section 16(b) of the Exchange Act. |
(3) | Provision for (benefit from) income taxes in 2013 and 2012 includes tax benefits of $1.4 million and $0.3 million, respectively, related to the release of the valuation allowance on our deferred tax assets in connection with acquisitions. |
December 31, | |||||||||||||||||||
Consolidated Balance Sheet Data | 2016 | 2015 | 2014 | 2013 | 2012 | ||||||||||||||
Cash and cash equivalents | $ | 29,560 | $ | 9,870 | $ | 20,594 | $ | 38,415 | $ | 48,955 | |||||||||
Working capital | 33,266 | 20,775 | 44,389 | 39,287 | 93,376 | ||||||||||||||
Total assets | 228,880 | 235,145 | 262,857 | 275,935 | 282,280 | ||||||||||||||
Long-term obligations excluding deferred revenue | 2,678 | 3,882 | 4,888 | 7,605 | 8,938 | ||||||||||||||
Total stockholders’ equity | 64,143 | 62,141 | 76,597 | 96,234 | 129,858 | ||||||||||||||
31
ITEM 7. | MANAGEMENT’S DISCUSSION AND ANALYSIS OF FINANCIAL CONDITION AND RESULTS OF OPERATIONS |
You should read the following discussion and analysis of our financial condition and results of operations together with the consolidated financial statements and related notes that are included elsewhere in this Form 10-K. This discussion contains forward-looking statements based upon current expectations that involve risks and uncertainties. Our actual results may differ materially from those anticipated in these forward-looking statements as a result of various factors, including those set forth under “Risk Factors” or in other parts of this Form 10-K.
Overview
We provide products that we believe improve business results by enabling a more productive and effective workforce through enhanced communications and collaboration both inside and outside the enterprise. Organizations deploy our products to improve the level of engagement, the quality of interaction and the overall relationship they have with their employees, customers and partners. Our products are primarily sold on a subscription basis, deployable in on-premise, hosted and cloud instances and used for internal or external communities. We generate revenues from product subscription license fees as well as from professional service fees for strategic consulting, configuration, implementation and training.
We sell our comprehensive Jive Platform across two principal communities: internally for employees within the enterprise and externally for customers and partners outside the enterprise. Internally focused communities comprised 77.3% of revenues derived from the Jive Platform in 2016 compared to 76.2% in 2015. As the market opportunity for enterprise collaboration software within the enterprise continues to grow, we expect revenues generated from internally focused communities to continue to be a higher percentage of our total revenues than revenues generated from externally focused communities. However, we continue to believe there is a meaningful growth opportunity in the external community market as well, and are continuing to invest in our external community technology with the goal of growing market-share.
Our products are provided as cloud services with certain products also being available on-premise. In 2012, we made our first release of a non-customizable version of our cloud based platform, referred to as Jive Cloud, which is generally on a quarterly release cycle for new features and functionality. In 2016, product revenues from all public cloud deployments represented 70.1% of total product revenues compared to 67.3% in 2015. With the release of Jive Cloud and the increase in overall adoption by enterprises of cloud-based technologies, we anticipate that, over the long-term, public cloud deployments of our platform will comprise an increasing portion of our business.
Historically, we have generated the majority of our revenues from sales to customers within the United States. Revenues from customers in the United States accounted for 73.2% of total revenues in 2016 compared to 73.5% in 2015. We are continuing to focus on strengthening our direct sales presence and network of channel partners internationally, and we anticipate the percentage of our revenues generated outside of the United States will increase in the future.
In February 2016, Jive delivered an updated release of its “interactive intranet” employee community product and its external community products, including a redesign of our product portfolio and new optimized processes to engage employees, customers and partners.
Also, in February 2016, we introduced Jive WorkHub offerings representing packaged solutions focused on distinct verticals and lines of business including, healthcare vertical, employee engagement and customer engagement. These out-of-the-box packages were developed to provide an easy way for customers to quickly adopt solutions built to meet their specific needs.
On May 5, 2016, our board of directors approved the 2016 Realignment Plan designed to ensure that we have the correct cost structure and go-to-market strategies in place to achieve our desired corporate and operating results going forward, align our operations with evolving business needs and improve efficiencies. The 2016 Realignment Plan included a reduction in our workforce that resulted in the termination of approximately 14% of our personnel across our global operations and was substantially completed by September 30, 2016. In 2016, we incurred charges of $4.1 million, substantially all of which were related to employee severance and benefits, and included them as Restructuring on our Consolidated Statements of Operations. Cash payments of $4.0 million were made during 2016, with the remaining $0.1 million expected to be paid by June 30, 2017. Savings from the realignment are expected to be $30.0 million annually.
In October 2016, Jive entered into a lease with Water Tower Fee Owner, LLC for approximately 12,500 square feet of office space in Campbell, California with occupancy beginning in March 2017. In October, the Company separately entered into an amendment to its office lease with TTC Partners, LLC for the Company’s existing corporate headquarters in Palo Alto, California that provides for an early termination of such lease in March 2017.
32
In November 2016, Jive made the strategic decision to transition its cloud infrastructure to Amazon Web Services. The transition of our cloud infrastructure is intended to be substantially completed by the end of 2017 and is anticipated to drive greater customer value by accelerating delivery of new cloud functionality.
In December 2016, Jive received sponsorship from an existing customer for the Federal Risk and Authorization Program, or FedRAMP “in process” certification program.
Seasonality
Our fourth quarter has historically been our strongest quarter for new billings and renewals. This pattern may be amplified over time if the number of our customers with renewal dates occurring in the fourth quarter continues to increase. Furthermore, our quarterly sales cycles are frequently weighted toward the end of the quarter, with an increased volume of sales in the last few weeks of each quarter. The year-over-year compounding effect of this seasonality in billing patterns, overall new business and renewal activity has historically resulted in the value of invoices that we generate in the fourth quarter to increase in proportion to our billings in the other three quarters of our fiscal year. As a result, our first quarter has become our largest quarter for collections and operating cash flow. We expect this trend to continue in future years.
Components of Results of Operations
Revenues
We generate revenues primarily in the form of software subscription fees and professional services for strategic consulting, upgrade services, configuration, implementation and other services related to our software. We offer our products with subscription terms typically ranging from 12 to 36 months. In addition to license fees for our platform, our revenues include fees for sales of modules, premium support offerings, additional users and page views. While subscription-based licenses make up the substantial majority of our product revenues, we occasionally license our software to customers on a perpetual basis, with ongoing support and maintenance services. Revenues generated through the sale of subscription licenses also include fees, embedded in the total license fee, for updates and maintenance. We recognize revenue from professional services ratably over the subscription term when they are bundled with a subscription license, because we do not have VSOE of fair value for all of our undelivered elements, including support and professional services. When professional services are sold on a standalone basis, the contract revenue is recognized as the services are delivered. These amounts, when recognized, are classified as professional services revenue on our Consolidated Statements of Operations.
Cost of Revenues
Cost of product revenues includes all direct costs to produce and distribute our product offerings, including data center and support personnel, depreciation and maintenance related to equipment located at our hosting service providers and in our Jive managed data centers, salaries, amortization related to capitalized software development costs, rent expense for our data centers, web hosting services expense for cloud implementations, third-party royalty costs, benefits, amortization of acquired intangible assets and stock-based compensation. We recognize expense related to cost of revenues as they are incurred, while the associated product revenues are recognized ratably over the subscription term.
Cost of professional services revenues includes all direct costs to provide our professional services, which primarily include salaries, benefits and stock-based compensation for our professional services personnel, as well as third-party sub-contracting and outside services fees. We recognize expenses related to our professional services organization as they are incurred, while the majority of associated professional services revenues are recognized ratably over the subscription term.
Cost of revenues also includes allocated overhead costs for facilities and information technology. Allocated costs for facilities consist of rent and depreciation of equipment and leasehold improvements related to our facilities. Our allocated costs for information technology include costs for compensation of our information technology personnel and the cost associated with our information technology infrastructure. Our overhead costs are allocated to all departments based on headcount.
We expect that cost of revenues will fluctuate in the future depending on the growth of new customers and billings and our need to support the implementation, hosting and support of those new customers. We also expect that cost of revenues as a percentage of total revenues could fluctuate from period to period depending on growth of our services business and any associated costs relating to the delivery of services, the timing of sales of products that have royalties associated with them, the amount and timing of amortization of intangibles from acquisitions and capitalized software development costs and the timing of significant expenditures. Additionally, we expect professional services gross margin to continue to be negative throughout 2017 as we continue to focus our professional services organization on strategic consulting, user adoption and enablement.
33
Research and Development
Research and development costs include salaries, benefits and stock-based compensation for our engineers and developers, allocated facilities costs and payments to third parties for research and development of new software. We focus our research and development efforts on developing new versions of our platform with new and expanded features and enhancing the ease of use of our platform.
Through the third quarter of 2014, we capitalized costs to develop internal-use software during the application development stage. In the third quarter of 2014, management developed a substantive plan to repurpose the in-process development into our existing software platform and new software products. As a result of this decision, the associated capitalized internal-use software costs became governed by the accounting standards related to development costs for software to be sold. As such, subsequent to July 2014, we no longer capitalize costs related to internal-use software and we account for our current capitalized costs as development costs for software to be sold.
Software development costs incurred subsequent to establishing technological feasibility through the general release of the software products are capitalized. Technological feasibility is demonstrated by the completion of a detailed program design or, working model if no program design is completed. Historically, technological feasibility has occurred concurrently with the commercial release of our products and as a result we have not capitalized software development costs. We do not anticipate capitalizing material software development costs in future periods.
The software development costs are being amortized on a straight-line basis over their estimated useful life and recorded as a component of cost of product revenues. Amortization of the capitalized costs begins when the associated product or enhancement is released. As of December 31, 2016, we have released all of the products and enhancements related to the $9.0 million of capitalized costs.
We make ongoing evaluations of the recoverability of our capitalized software by comparing the amount of capitalized software development costs for each product to the estimated net realizable value of the underlying asset. If such evaluations indicate the unamortized software development costs exceed the net realizable value, we write off the amount by which the unamortized software development costs exceed net realizable value. There was no impairment charge related to capitalized software development costs during the years ended December 31, 2016, 2015 or 2014.
Capitalized software development costs consisted of the following (in thousands):
December 31, | |||||||
2016 | 2015 | ||||||
Capitalized software development costs | $ | 8,981 | $ | 8,981 | |||
Accumulated amortization | (5,305 | ) | (2,077 | ) | |||
$ | 3,676 | $ | 6,904 | ||||
Sales and Marketing
Sales and marketing expenses primarily consist of salaries, incentive compensation and benefits, travel expense, marketing program fees, partner referral fees and stock-based compensation. Sales incentive compensation is recorded as earned, and is earned at the time a customer enters into a binding purchase agreement while the associated revenue is recognized ratably over the subscription term. In addition, sales and marketing expenses include customer acquisition marketing, branding, advertising, customer events and public relations costs, as well as allocated facilities costs. We plan to continue investing in sales and marketing to expand our global operations, increase revenues from current customers, build brand awareness and expand our indirect sales channel.
General and Administrative
General and administrative expenses primarily consist of salaries, benefits and stock-based compensation for our executive, finance, legal, information technology, human resources and other administrative employees. In addition, general and administrative expenses include legal and accounting services, outside consulting, facilities and other supporting overhead costs not allocated to other departments.
Restructuring
Restructuring expenses primarily consist of severance and severance related benefits as well as legal and consulting costs related to our 2016 Realignment Plan, which we announced in May 2016.
34
Other Income, Net
Other income, net consists primarily of interest expense on our outstanding debt and foreign exchange gains and losses, as well as income related to our investments. Included in other income for 2015 is a gain related to the disgorgement of profits from a stockholder to us in settlement of a claim under Section 16(b) of the Exchange Act.
Provision for Income Taxes
Provision for income taxes consists of federal and state income taxes in the United States and income taxes in certain foreign tax jurisdictions. Since we have generated net losses, we have placed a valuation allowance against any potential future benefits for loss carryforwards and research and development and other tax credits.
Critical Accounting Policies and Estimates
Our discussion and analysis of our financial condition and results of operations are based upon our financial statements, which have been prepared in accordance with GAAP. These principles require us to make estimates and judgments that affect the reported amounts of assets, liabilities, revenue and expenses, cash flow and related disclosure of contingent assets and liabilities. Our estimates include those related to revenue recognition, stock-based compensation, recoverability of property and equipment and other long-lived assets, including goodwill, and accounting for income taxes. We base our estimates on historical experience and on various other assumptions that we believe to be reasonable under the circumstances. Actual results may differ from these estimates. To the extent that there are material differences between these estimates and our actual results, our future financial statements will be affected.
We believe that of our significant accounting policies, which are described in Note 2 of Notes to Consolidated Financial Statements included in this Form 10-K, the following accounting policies involve a greater degree of judgment and complexity. Accordingly, we believe these are the most critical to fully understand and evaluate our financial condition and results of operations.
Revenue Recognition
We generate revenues in the form of product fees and related professional service fees. Product fees include subscription fees, perpetual license fees, associated support and maintenance fees and hosting fees. Professional services primarily consist of fees for strategic consulting, configuration, training, consultation and implementation services, which are not essential to functionality. For statement of operations classification purposes, we allocate revenues to professional services based on the hourly rate billed for time and materials arrangements and based on the total fixed fee for fixed fee professional services. We recognize revenue when all of the following conditions are met:
• | there is persuasive evidence of an arrangement; |
• | the product or services have been delivered to the customer; |
• | the amount of fees to be paid by the customer is fixed or determinable; and |
• | the collection of the related fees is reasonably assured. |
Signed agreements are used as evidence of an arrangement. If a contract signed by the customer does not exist, we have historically used a purchase order as evidence of an arrangement. In cases where both a signed contract and a purchase order exist, we consider the signed contract to be the final persuasive evidence of an arrangement. Software and corresponding license keys are delivered to customers electronically. Electronic delivery occurs when we provide the customer with access to the software. We assess whether a fee is fixed or determinable at the outset of the arrangement, primarily based on the payment terms associated with the transaction. We do not generally offer extended payment terms with typical terms of payment due between 30 and 60 days from delivery of product or services. For professional services that are billable under a time and materials based arrangement, these fees are neither fixed nor determinable until the work is performed and the fee becomes billable to the customer. We assess collectability of the customer receivable based on a number of factors such as collection history with the customer and creditworthiness of the customer. If we determine that collectability is not reasonably assured, revenue is deferred until collectability becomes reasonably assured, generally upon receipt of cash.
We offer subscriptions of our solutions to customers most frequently on a term basis with terms typically ranging from 12 to 36 months. While term-based licenses make up the majority of our total revenues, we have occasionally licensed our solutions to customers on a perpetual basis with on-going support and maintenance services. We recognize license revenue in accordance with software industry specific guidance. Revenues related to term license fees are recognized ratably over the contract term beginning on the date the customer has access to the software license key and continuing through the end of the contract term. For term-based licenses, we do not charge separately for standard support and maintenance, and, therefore, inherent in the license fees are fees for support and maintenance services for the duration of the license term. As fees for support and maintenance are always bundled with the license over the entire term of the contract, we do not have VSOE of fair value for support and maintenance. Revenues generated from perpetual license sales also include support and maintenance services for an initial stated term and term-
35
based subscriptions for certain of our modules. We do not have VSOE of fair value for support and maintenance on perpetual licenses as we have not had sufficient, consistently-priced standalone sales of support and maintenance, nor have we offered substantive renewal rates for support and maintenance. Because we do not have VSOE of fair value for either the support and maintenance on the perpetual license or the module, revenue is recognized ratably over the longer of the initial maintenance term for the perpetual license or the term for the subscription elements.
In situations where we have contractually committed to an individual customer specific technology, we defer all of the revenue for that customer until the technology is delivered and accepted. Once delivery occurs, we record a cumulative revenue catch-up and then recognize the remaining revenue over the remaining contract term.
License arrangements may also include professional services, such as strategic consulting, installation, upgrades and training services, which are typically delivered early in the contract term. This combination of products and services represents a multiple-element arrangement for revenue recognition purposes. We have determined that we do not have VSOE of fair value for each element of a multiple-element sales arrangement and, accordingly, we account for fees received under that multiple-element arrangement as a single unit of accounting and recognize the fees for the entire arrangement ratably, commencing on delivery of the software, over the longer of the term of the support and maintenance or the period over which professional services are delivered. Support and maintenance is always the last undelivered element in the arrangement and, therefore, we recognize the fixed portion of the fees ratably over the support and maintenance term. For contracts with multiple elements, we recognize the license, support and maintenance, and fixed fee professional service revenue ratably over the term of the arrangement beginning upon delivery of the software. We believe this method most closely reflects the economics of the transaction as we deliver access to the software and we begin providing support and maintenance services as of the date the software is delivered.
Professional services are offered on both our fixed fee and our time and materials hourly billing arrangements. For time and materials-based professional services that are part of a multiple-element arrangement where the fees for the professional services are not fixed or determinable upon delivery of the software, revenue is recognized ratably over the contract term as the related fees become fixed. These fees are not considered fixed at the outset of the arrangement and become fixed as the related work is performed and the fees are earned and billed. These services are typically provided early in the contract term with completion typically occurring in the first six months. As these fees become fixed, they are added to the total fee for the multiple-element arrangement and recognized ratably with all other arrangement fees over the entire contract term. When billed, a cumulative revenue catch-up is calculated as the revenue earned from the date the software was made available to the customer to the date services have been completed, with recognition continuing ratably to the end of the contract term. These amounts, when recognized in our Consolidated Statements of Operations, are classified as professional services revenues based on the hourly rates at which they are billed. If there are significant acceptance clauses associated with the license or services or uncertainty associated with our ability to perform the professional services, revenues are deferred until the acceptance is received or the uncertainty is resolved. We record amounts that have been invoiced, in accordance with the terms of the agreement, in accounts receivable and in deferred revenues or revenues, depending on whether the revenue recognition criteria have been met.
Hosting revenues are derived from providing our software solutions in a hosted environment where the customer does not take possession of the software on their premises. With the exception of Jive Cloud, customers have the option to elect to take possession of the software and install on their premises or sub-contract the hosting services through us. Such arrangements are considered software sales as the customer has the same rights to the software license regardless of their election to have us host on their behalf or install on their premises. As a result, the fees associated with license, support and hosted services are recognized as revenue ratably over the term of the arrangement. For Jive Cloud licensing arrangements, customers do not have the right to take possession of the software supporting the cloud-based application service at any time.
We occasionally sell professional services separately and recognize revenues resulting from those as professional services are performed. If there is significant uncertainty about the project completion or receipt of payment for the consulting services, revenues are deferred until the uncertainty is resolved. If acceptance provisions exist within a professional services arrangement, revenues will be deferred until the services are accepted or the acceptance period has expired.
Our policy is to record revenues net of any applicable sales, use or excise taxes.
Goodwill
Goodwill represents the excess of the purchase price over the estimated fair value of the net tangible and intangible assets of acquired entities. We perform a goodwill impairment test annually during the fourth quarter of our fiscal year and more frequently if an event or circumstance indicates that an impairment may have occurred. Such events or circumstances may include significant adverse changes in the general business climate, among other things. We may first make a qualitative assessment to determine whether it is more likely than not that goodwill is impaired before applying the two-step goodwill impairment test. We elected to forgo the qualitative assessment, and proceed to the first step of the test for goodwill impairment. Step one of the impairment test
36
is performed by determining the reporting unit’s fair value based on estimated discounted future cash flows and considering the estimated fair market value of our common stock. We have determined that we have one reporting unit, which represents the activities of the entire company. If the reporting unit’s carrying value is less than its fair value, then the fair value is allocated to the reporting unit’s assets and liabilities (including any unrecognized intangible assets) as if the fair value was the purchase price to acquire us. The excess of the fair value over the amounts assigned to our assets and liabilities is the implied fair value of the goodwill. If the carrying amount of goodwill exceeds the implied fair value of that goodwill, an impairment loss is recognized in an amount equal to that excess.
Goodwill was $29.8 million as of December 31, 2016 and 2015 and relates to our acquisitions of Clara and StreamOnce in 2013, Producteev and Meetings.io in 2012, OffiSync in 2011 and Filtrbox in 2010. Our impairment tests performed in the fourth quarter of 2016, 2015 and 2014 did not indicate any impairment of goodwill as the fair value of our business substantially exceeded its carrying value in all periods presented.
Valuation of Capitalized Software Development Costs
We make ongoing evaluations of the recoverability of our capitalized software development costs by comparing the amount capitalized to its estimated net realizable value. If such evaluations indicate that the unamortized software development costs exceed the net realizable value, we write off the amount by which the unamortized software development costs exceed net realizable value. Any resulting impairment loss could have a material adverse impact on our financial position and results of operations. There was no impairment charge related to capitalized software during the years ended December 31, 2016, 2015 and 2014. We amortize capitalized software development costs ratably based on the projected revenues associated with the related software or on a straight-line basis over two years, whichever method results in a higher level of amortization. Amortization of capitalized software development costs is included in the cost of product revenues in the Consolidated Statements of Operations.
Deferred Tax Asset Valuation Allowance
We record deferred tax assets and liabilities for the expected future tax consequences of temporary differences between the financial statement carrying amounts and the tax basis of the assets and liabilities. Deferred tax assets are reduced by a valuation allowance when it is estimated to become more likely than not that a portion of the deferred tax assets will not be realized. Accordingly, we currently maintain a full valuation allowance against our net deferred tax assets, with the exception of deferred tax liabilities related to the amortization of goodwill for tax purposes. The valuation allowance totaled $123.9 million and $121.7 million, respectively, as of December 31, 2016 and 2015.
Uncertainty in Income Taxes
We recognize the effect of income tax positions only if those positions are “more likely than not” of being sustained. Interest and penalties accrued on unrecognized tax benefits are recorded as tax expense within our consolidated financial statements. Only $0.4 million of the unrecognized tax benefits would have an impact on the effective tax rate if recognized. The interest and penalties accrued on unrecognized tax benefits were insignificant.
Stock-Based Compensation
We measure and recognize compensation expense for all share-based payment awards granted to our employees and directors, including stock options, restricted stock and purchases under our employee stock purchase plan, based on the estimated fair value of the award on the grant date. We use the Black-Scholes-Merton valuation model to estimate the fair value of stock option awards. The fair value is recognized as expense, net of estimated forfeitures, over the requisite service period, which is generally four years.
Stock-based compensation expense is recognized for performance-based restricted stock awards based on the probability of achieving the performance criteria. We estimate the number of performance-based restricted stock awards ultimately expected to vest and recognize over the requisite service period, which is generally the vesting period of the respective award.
The determination of the grant date fair value of options using an option-pricing model is affected by our common stock fair value, as well as assumptions regarding a number of other complex and subjective variables, including our expected stock price volatility over the expected term of the options, stock option exercise and cancellation behaviors, risk-free interest rates and expected dividends.
If any of the assumptions used in the Black-Scholes-Merton model changes significantly, stock-based compensation for future awards may differ materially compared with the awards granted previously.
37
We account for stock options issued to non-employees based on the estimated fair value of the awards using the Black-Scholes-Merton option pricing model. The measurement of stock-based compensation is subject to quarterly adjustments as the underlying equity instruments vest and the resulting change in fair value is recognized in our Consolidated Statement of Operations during the period the related services are rendered.
Results of Operations
Year Ended December 31, | |||||||||||
(In thousands, except per share amounts) | 2016 | 2015 | 2014 | ||||||||
Consolidated Statements of Operations Data(1) | |||||||||||
Revenues: | |||||||||||
Product | $ | 187,313 | $ | 180,172 | $ | 162,185 | |||||
Professional services | 16,781 | 15,621 | 16,508 | ||||||||
Total revenues | 204,094 | 195,793 | 178,693 | ||||||||
Cost of revenues: | |||||||||||
Product | 48,217 | 49,816 | 43,494 | ||||||||
Professional services | 19,195 | 22,378 | 23,179 | ||||||||
Total cost of revenues | 67,412 | 72,194 | 66,673 | ||||||||
Gross profit: | |||||||||||
Product | 139,096 | 130,356 | 118,691 | ||||||||
Professional services | (2,414 | ) | (6,757 | ) | (6,671 | ) | |||||
Total gross profit | 136,682 | 123,599 | 112,020 | ||||||||
Operating expenses: | |||||||||||
Research and development | 45,769 | 52,818 | 52,275 | ||||||||
Sales and marketing | 74,654 | 78,684 | 90,141 | ||||||||
General and administrative | 25,913 | 26,708 | 24,633 | ||||||||
Restructuring | 4,103 | — | — | ||||||||
Total operating expenses | 150,439 | 158,210 | 167,049 | ||||||||
Loss from operations | (13,757 | ) | (34,611 | ) | (55,029 | ) | |||||
Total other income, net(2) | 1,016 | 1,009 | 14 | ||||||||
Loss before income taxes | (12,741 | ) | (33,602 | ) | (55,015 | ) | |||||
Provision for income taxes | 1,223 | 1,251 | 1,138 | ||||||||
Net loss | $ | (13,964 | ) | $ | (34,853 | ) | $ | (56,153 | ) | ||
Basic and diluted net loss per common share | $ | (0.18 | ) | $ | (0.46 | ) | $ | (0.79 | ) | ||
Shares used in per share calculations | 77,494 | 75,217 | 70,751 | ||||||||
(1) | Stock-based compensation was included in our Consolidated Statements of Operations data as follows (in thousands): |
Year Ended December 31, | |||||||||||
2016 | 2015 | 2014 | |||||||||
Cost of revenues | $ | 2,162 | $ | 3,029 | $ | 4,276 | |||||
Research and development | 3,809 | 7,078 | 10,642 | ||||||||
Sales and marketing | 3,373 | 3,775 | 10,852 | ||||||||
General and administrative | 6,239 | 6,423 | 7,138 | ||||||||
Restructuring | 21 | — | — | ||||||||
Total stock-based compensation | $ | 15,604 | $ | 20,305 | $ | 32,908 | |||||
(2) | Total other income, net in 2015 includes $1.1 million we received from a stockholder in settlement of a claim under Section 16(b) of the Exchange Act. |
38
Revenues
(Dollars in thousands) | Year Ended December 31, | Dollar | ||||||||||||
2016 | 2015 | Change | % Change | |||||||||||
Product | $ | 187,313 | $ | 180,172 | $ | 7,141 | 4.0 | % | ||||||
Professional services | 16,781 | 15,621 | 1,160 | 7.4 | % | |||||||||
Total revenues | $ | 204,094 | $ | 195,793 | $ | 8,301 | 4.2 | % | ||||||
(Dollars in thousands) | Year Ended December 31, | Dollar | ||||||||||||
2015 | 2014 | Change | % Change | |||||||||||
Product | $ | 180,172 | $ | 162,185 | $ | 17,987 | 11.1 | % | ||||||
Professional services | 15,621 | 16,508 | (887 | ) | (5.4 | )% | ||||||||
Total revenues | $ | 195,793 | $ | 178,693 | $ | 17,100 | 9.6 | % | ||||||
Product Revenues
The increase in product revenues in 2016 compared to 2015 was primarily related to an increase of 3% in the average annual subscription value in 2015, which was ratably recognized in 2016. The increase in 2015 compared to 2014 was primarily the result of increases in the average annual subscription value and in the aggregate number of customers on the Jive Platform, which increased by 43 in 2015 compared to 2014. The increases in the average annual subscription value were primarily driven by upsell to existing customers. The average new customer initial contract size decreased in 2016 compared to 2015 while remaining consistent in 2015 compared to 2014.
Certain information regarding our revenues was as follows:
Year Ended December 31, | ||||||||
2016 | 2015 | 2014 | ||||||
Dollar value of total revenues generated in the U.S. | $149.4 million | $143.8 million | $135.9 million | |||||
Percentage of total revenues generated in the U.S. | 73.2 | % | 73.5 | % | 76.0 | % | ||
Product revenues from public cloud deployments as a percentage of total product revenues | 70.1 | % | 67.3 | % | 67.7 | % | ||
Product revenues from private cloud deployments as a percentage of total product revenues | 29.9 | % | 32.7 | % | 32.3 | % | ||
Percentage of Jive Platform revenues that represented internally focused communities | 77.3 | % | 76.2 | % | 73.6 | % | ||
Percentage of Jive Platform revenues that represented externally focused communities | 22.7 | % | 23.8 | % | 26.4 | % | ||
Renewal rates, excluding upsell, were below 90% for transactions over $50,000 in 2016 and 2015 and were above 90% in 2014.
Professional Services Revenues
The increase in professional services revenues in 2016 compared to 2015 was primarily due to an increase in bundled services sold during 2015 and ratably recognized in 2016. Professional services revenues as a percentage of product revenues increased slightly in 2016 compared to 2015. We expect this percentage to experience minor fluctuations as we continue to focus our professional services organization on migrating existing customers to the Jive Cloud, which requires less customization work to implement.
The decrease in professional services revenues in 2015 compared to 2014 was primarily due to a decrease in standalone services sold during 2015. Professional services revenues as a percentage of product revenues decreased slightly in 2015 compared to 2014.
We offer professional services as both standalone and bundled services. When sold as standalone services, the contract revenue is recognized as the services are delivered. For our bundled services, the amounts are recognized ratably over the subscription term of the bundled subscription agreements. Standalone professional services revenues decreased $0.1 million in 2016 compared to 2015 and decreased $0.9 million in 2015 compared to 2014.
39
Cost of Revenues and Gross Margins
Cost of Revenues: Product
Year Ended December 31, | Dollar | |||||||||||||
(Dollars in thousands) | 2016 | 2015 | Change | % Change | ||||||||||
Cost of revenues: product | $ | 48,217 | $ | 49,816 | $ | (1,599 | ) | (3.2 | )% | |||||
Product gross margin | 74.3 | % | 72.4 | % | ||||||||||
Year Ended December 31, | Dollar | |||||||||||||
(Dollars in thousands) | 2015 | 2014 | Change | % Change | ||||||||||
Cost of revenues: product | $ | 49,816 | $ | 43,494 | $ | 6,322 | 14.5 | % | ||||||
Product gross margin | 72.4 | % | 73.2 | % | ||||||||||
The decrease in cost of revenues for products in 2016 compared to 2015 was primarily due to:
• | a $1.3 million decrease in amortization of acquired intangibles; |
• | a $1.2 million decrease in depreciation expense; |
• | a $0.9 million decrease in third-party royalties; and |
• | a $0.6 million decrease in stock-based compensation. |
The decreases noted above were partially offset by a $1.2 million increase in capitalized software amortization and a $1.0 million increase in salaries and benefits.
The increase in cost of revenues for products in 2015 compared to 2014 included the following:
• | a $2.2 million increase in third-party hosting services; |
• | a $1.9 million increase in capitalized software amortization; |
• | a $1.5 million increase in subscription services; |
• | a $1.4 million increase in salaries and benefits; |
• | a $0.8 million increase in third-party royalties; |
• | a $0.7 million increase in overhead costs allocated to cost of revenues for products based on relative headcount; and |
• | a $0.4 million increase in rent expense. |
The increase in costs of revenues for products in 2015 compared to 2014 was partially offset by a $1.7 million decrease in depreciation expense, a $0.8 million decrease in stock-based compensation and a $0.1 million decrease in other miscellaneous costs.
Cost of Revenues: Professional Services
Year Ended December 31, | Dollar | |||||||||||||
(Dollars in thousands) | 2016 | 2015 | Change | % Change | ||||||||||
Cost of revenues: professional services | $ | 19,195 | $ | 22,378 | $ | (3,183 | ) | (14.2 | )% | |||||
Professional services gross margin | (14.4 | )% | (43.3 | )% | ||||||||||
Year Ended December 31, | Dollar | |||||||||||||
(Dollars in thousands) | 2015 | 2014 | Change | % Change | ||||||||||
Cost of revenues: professional services | $ | 22,378 | $ | 23,179 | $ | (801 | ) | (3.5 | )% | |||||
Professional services gross margin | (43.3 | )% | (40.4 | )% | ||||||||||
The decreases in cost of revenues for professional services in 2016 compared to 2015 was primarily due to a $1.7 million decrease in salaries and benefits and a $0.5 million decrease in consulting fees.
40
The decreases in cost of revenues for professional services in 2015 compared to 2014 was primarily due to
• | a $1.0 million decrease, respectively, in consulting fees; |
• | a $0.5 million decrease in stock-based compensation; and |
• | a $0.2 million decrease in other miscellaneous costs. |
The decrease in cost of revenues for professional services in 2015 compared to 2014 was partially offset by a $0.6 million increase in salaries and benefits and a $0.3 million increase in overhead costs allocated to cost of revenues for professional services based on relative headcount.
The improvement in professional services gross margin in 2016 compared to 2015 was primarily driven by the 2016 Realignment Plan, which resulted in a 29% decrease in headcount within the professional services organization in 2016 compared to 2015.
The decrease in professional services gross margin in 2015 compared to 2014 was primarily due to a decrease in standalone professional services revenue.
Research and Development
Year Ended December 31, | Dollar | |||||||||||||
(Dollars in thousands) | 2016 | 2015 | Change | % Change | ||||||||||
Research and development | $ | 45,769 | $ | 52,818 | $ | (7,049 | ) | (13.3 | )% | |||||
Percentage of total revenues | 22.4 | % | 27.0 | % | ||||||||||
Year Ended December 31, | Dollar | |||||||||||||
(Dollars in thousands) | 2015 | 2014 | Change | % Change | ||||||||||
Research and development | $ | 52,818 | $ | 52,275 | $ | 543 | 1.0 | % | ||||||
Percentage of total revenues | 27.0 | % | 29.3 | % | ||||||||||
The decrease in research and development expenses in 2016 compared to 2015 was primarily due to:
• | a $3.3 million decrease in stock-based compensation; |
• | a $2.9 million decrease in salaries and benefits; |
• | a $0.7 million decrease in amortization expense; and |
• | a $0.7 million decrease in overhead costs allocated to research and development based on relative headcount. |
The decrease in research and development expenses in 2016 compared to 2015 were partially offset by a $0.6 million increase in professional fees and a $0.5 million increase in internal hosting services.
The increase in research and development expenses in 2015 compared to 2014 was primarily due to:
• | a $1.5 million increase in salaries and benefits; |
• | a $1.2 million increase in overhead costs allocated to research and development based on relative headcount; |
• | a $0.7 million increase in consulting fees; |
• | a $0.5 million increase in third-party hosting services; and |
• | a $0.2 million increase in other miscellaneous costs. |
The increase in research and development expenses in 2015 compared to 2014 was partially offset by a $3.6 million decrease in stock-based compensation.
41
Sales and Marketing
Year Ended December 31, | Dollar | |||||||||||||
(Dollars in thousands) | 2016 | 2015 | Change | % Change | ||||||||||
Sales and marketing | $ | 74,654 | $ | 78,684 | $ | (4,030 | ) | (5.1 | )% | |||||
Percentage of total revenues | 36.6 | % | 40.2 | % | ||||||||||
Year Ended December 31, | Dollar | |||||||||||||
(Dollars in thousands) | 2015 | 2014 | Change | % Change | ||||||||||
Sales and marketing | $ | 78,684 | $ | 90,141 | $ | (11,457 | ) | (12.7 | )% | |||||
Percentage of total revenues | 40.2 | % | 50.4 | % | ||||||||||
The decrease in sales and marketing expenses in 2016 compared to 2015 was primarily due to:
• | a $1.7 million decrease in salaries and benefits, including a $0.7 million decrease in sales commissions; |
• | a $1.5 million decrease in advertising-related costs; |
• | a $1.0 million decrease in travel and entertainment; |
• | a $1.0 million decrease in consulting fees; and |
• | a $0.5 million decrease in overhead costs allocated to sales and marketing based on relative headcount. |
The decreases noted above were partially offset by a $1.6 million increase in trade shows costs due to holding our user conference, JiveWorld.
The decrease in sales and marketing expenses in 2015 compared to 2014 was primarily due to:
• | a $7.1 million decrease in stock-based compensation; |
• | a $4.2 million decrease in general marketing expense largely driven by not holding our user conference, JiveWorld, in 2015; |
• | a $2.1 million decrease in salaries and benefits; |
• | a $1.3 million decrease in third party commissions; and |
• | a $0.4 million decrease in other miscellaneous costs. |
The decrease in sales and marketing expenses in 2015 compared to 2014 was partially offset by:
• | a $2.4 million increase in consulting fees; |
• | a $0.7 million increase in overhead costs allocated to sales and marketing based on relative headcount; and |
• | a $0.5 million increase in subscription services. |
General and Administrative
Year Ended December 31, | Dollar | |||||||||||||
(Dollars in thousands) | 2016 | 2015 | Change | % Change | ||||||||||
General and administrative | $ | 25,913 | $ | 26,708 | $ | (795 | ) | (3.0 | )% | |||||
Percentage of total revenues | 12.7 | % | 13.6 | % | ||||||||||
Year Ended December 31, | Dollar | |||||||||||||
(Dollars in thousands) | 2015 | 2014 | Change | % Change | ||||||||||
General and administrative | $ | 26,708 | $ | 24,633 | $ | 2,075 | 8.4 | % | ||||||
Percentage of total revenues | 13.6 | % | 13.8 | % | ||||||||||
The decrease in general and administrative expenses in 2016 compared to 2015 was primarily due to:
• | a $2.6 million decrease in professional fees; and |
• | a $1.0 million decrease in office related fees. |
42
The decrease in general and administrative expenses in 2016 compared to 2015 was partially offset by a $1.7 million increase in salaries and benefits and a $1.3 million increase in overhead costs allocated to general and administrative based on relative headcount.
The increase in general and administrative expenses in 2015 compared to 2014 was primarily due to:
• | a $2.3 million increase in salaries and benefits; |
• | a $1.1 million increase in third-party recruiting fees; |
• | a $0.8 million increase in consulting fees; |
• | a $0.6 million increase in other miscellaneous costs; |
• | a $0.4 million increase in subscription services; |
• | a $0.2 million increase in legal fees; |
• | a $0.2 million increase in property taxes; and |
• | a $0.2 million increase in depreciation expense. |
The increase in general and administrative expenses in 2015 compared to 2014 was partially offset by a $3.0 million decrease in overhead costs allocated to general and administrative expenses based on relative headcount and a $0.7 million decrease in stock-based compensation.
Restructuring
Year Ended December 31, | Dollar | ||||||||||||
(Dollars in thousands) | 2016 | 2015 | Change | % Change | |||||||||
Restructuring | $ | 4,103 | $ | — | $ | 4,103 | NM | ||||||
Percentage of total revenues | 2.0 | % | — | % | |||||||||
Restructuring expenses were related to our 2016 Realignment Plan, which was enacted during the second quarter of 2016, and primarily consists of severance and severance related benefits. No comparable plan existed in either 2015 or 2014. Savings from the alignment are expected to be $30.0 million annually.
Other Income, net
Year Ended December 31, | Dollar | ||||||||||||
(Dollars in thousands) | 2016 | 2015 | Change | % Change | |||||||||
Other income, net | $ | 1,016 | 1,009 | 7 | NM | ||||||||
Percentage of total revenues | 0.5 | % | 0.5 | % | |||||||||
Year Ended December 31, | Dollar | ||||||||||||
(Dollars in thousands) | 2015 | 2014 | Change | % Change | |||||||||
Other income, net | $ | 1,009 | $ | 14 | $ | 995 | NM | ||||||
Percentage of total revenues | 0.5 | % | 0.0 | % | |||||||||
Other income, net was unchanged in 2016 compared to 2015, however, there were fluctuations in the underlying balances. This was primarily due to an increase in realized foreign currency gains of $0.6 million. During the year we also realized a $0.3 million reduction in amortization of bond premiums. These income positive effects were almost entirely offset by a decrease in miscellaneous income as a result of a $1.1 million disgorgement of profit from a stockholder to us in connection with the settlement of a claim under Section 16(b) of the Exchange Act that occurred in 2015 with no similar event occurring in 2016.
The improvement in other income, net in 2015 compared to 2014 was primarily due to the $1.1 million disgorgement of profit that occurred in 2015 with no similar event occurring in 2014.
Provision For Income Taxes
Year Ended December 31, | |||||||||||
(Dollars in thousands) | 2016 | 2015 | 2014 | ||||||||
Provision for income taxes | $ | 1,223 | $ | 1,251 | $ | 1,138 | |||||
Percentage of loss before income taxes | 9.6 | % | 3.7 | % | 2.1 | % | |||||
43
In 2016, 2015 and 2014, we recorded income taxes that were principally attributable to state and foreign taxes. The 2014 provision for income taxes also includes a $0.5 million charge related to our Israeli tax examination.
We believe recognition of the deferred tax assets arising from future tax benefits due to pre-tax losses are not more likely than not to be realized. We therefore continued to record valuation allowances against our deferred tax assets and, accordingly, benefits generated related to losses were offset by increases in the valuation allowance.
Non-GAAP Key Metrics
In addition to traditional metrics of accounting principles generally accepted in the United States (“GAAP”), such as total revenues and gross margin, we also regularly review non-GAAP metrics such as short-term and total billings and other key metrics such as the number of Jive Platform customers. These non-GAAP metrics are used to evaluate our business, measure our performance, identify trends affecting our business, allocate capital and make strategic decisions. We believe that these non-GAAP measures offer valuable supplemental information regarding the performance of our business, and they will help investors better understand the sales volumes and performance of our business.
The following tables set forth a reconciliation of total revenues to short-term billings and total billings, respectively (dollars in thousands):
Short-Term Billings
Year Ended December 31, | Dollar | |||||||||||||
2016 | 2015 | Change | % Change | |||||||||||
Total revenues | $ | 204,094 | $ | 195,793 | ||||||||||
Deferred revenue, current, end of period | 127,574 | 131,850 | ||||||||||||
Less: deferred revenue, current, beginning of period | (131,850 | ) | (128,592 | ) | ||||||||||
Short-term billings | $ | 199,818 | $ | 199,051 | $ | 767 | 0.4 | % | ||||||
Year Ended December 31, | Dollar | |||||||||||||
2015 | 2014 | Change | % Change | |||||||||||
Total revenues | $ | 195,793 | $ | 178,693 | ||||||||||
Deferred revenue, current, end of period | 131,850 | 128,592 | ||||||||||||
Less: deferred revenue, current, beginning of period | (128,592 | ) | (112,432 | ) | ||||||||||
Short-term billings | $ | 199,051 | $ | 194,853 | $ | 4,198 | 2.2 | % | ||||||
Total Billings
Year Ended December 31, | Dollar | |||||||||||||
2016 | 2015 | Change | % Change | |||||||||||
Total revenues | $ | 204,094 | $ | 195,793 | ||||||||||
Deferred revenue, end of period | 139,859 | 148,242 | ||||||||||||
Less: deferred revenue, beginning of period | (148,242 | ) | (160,539 | ) | ||||||||||
Total billings | $ | 195,711 | $ | 183,496 | $ | 12,215 | 6.7 | % | ||||||
Year Ended December 31, | Dollar | |||||||||||||
2015 | 2014 | Change | % Change | |||||||||||
Total revenues | $ | 195,793 | $ | 178,693 | ||||||||||
Deferred revenue, end of period | 148,242 | 160,539 | ||||||||||||
Less: deferred revenue, beginning of period | (160,539 | ) | (147,337 | ) | ||||||||||
Total billings | $ | 183,496 | $ | 191,895 | $ | (8,399 | ) | (4.4 | )% | |||||
We monitor short-term billings and total billings, non-GAAP measures, in addition to other financial measures presented in accordance with GAAP to manage our business, make planning decisions, evaluate our performance and allocate resources.
44
Our uses of short-term billings and total billings have limitations as analytical tools, and should not be considered in isolation or as a substitute for total revenues or an analysis of our results as reported under GAAP. Some of these limitations are:
• | short-term billings and total billings are not substitutes for total revenues, as billings are recognized when invoiced, while revenue is primarily recognized ratably over the contract term. Short-term billings can include fees paid for license terms greater than 12 months in prior periods that were previously recorded on our Consolidated Balance Sheets as a component of non-current deferred revenue and were reclassified in the current period as deferred revenue, current and therefore does not always reflect billings that occurred in the period; |
• | total billings can include fees paid for license terms greater than 12 months and for subscription renewals prior to the expiration of the current subscription term and, therefore, do not always closely match with the timing of delivery of support, maintenance and hosting services and the costs associated with delivering those services; |
• | changes to the composition of current period short-term billings and total billings may impact the correlation of current period short-term billings and total billings to future period revenues; |
• | short-term billings and total billings would not exclude any agreements that contain customer acceptance provisions or other contractual contingencies that would require deferral of revenue required under GAAP; and |
• | other companies, including companies in our industry, may not use short-term billings or total billings, may calculate non-GAAP measures differently or may use other financial measures to evaluate their performance, all of which could reduce the usefulness of our non-GAAP measures as comparative measures. |
We consider short-term billings and total billings to be significant performance measures and leading indicators of future recognized revenue based on our business model of billing for subscription licenses annually and recognizing revenue ratably over the subscription term. The billings we record in any particular period reflect sales to new customers plus subscription renewals and upsell to existing customers, and represent amounts invoiced for product license fees and professional services. We typically invoice our customers for subscription fees in annual increments upon initiation of the initial contract or subsequent renewal. In addition, we also enter into arrangements with customers to purchase subscriptions for a term greater than 12 months, generally 24 to 36 months. For subscriptions greater than 12 months, the customer has the option of being invoiced annually or paying for the full term of the subscription at the time the contract is signed. If the customer elects to pay the full multi-year amount at the time the contract is signed, the total amount billed for the entire term will be reflected in total billings; but only the amount that will be recognized as revenue in the following 12 month period would be included in short-term billings until the portion of the total billings beyond 12 months is subsequently reclassified from non-current deferred revenue to deferred revenue, current in a future period. However, if the customer elects to be invoiced annually for a multi-year contract, only the amount billed for the 12-month period will be included in both short-term billings and total billings. The portion of subscription terms under contract and not yet invoiced is considered backlog and is not reflected on our Consolidated Balance Sheets as deferred revenue.
As of December 31, 2016 and 2015, we had backlog of approximately $39.5 million and $50.1 million, respectively. Of the $39.5 million in backlog as of December 31, 2016, approximately 72% is expected to be billed within 2017 and approximately 33% is expected to be recognized as revenue within 2017.
Billings for consulting services can occur either on a time and materials or fixed fee basis. Billings for time and materials contracts typically occur on a bi-weekly basis as the services are delivered. Billings for fixed fee contracts are typically billed 100% at the beginning of the contract or 50% upon either signing or initiation of the project and 50% upon completion of the project.
The slight increases in short-term billings in the periods presented were primarily driven by increased upsell of our products to existing customers. The reduced growth in short-term billings in 2016 compared to 2015 was a result of increased competitive pressures and changes made in our sales organization and their go-to-market efforts.
The increase in total billings in 2016 compared to 2015 was primarily due to increased upsell of our products to existing customers.
The decrease in total billings in 2015 compared to 2014 was primarily driven by a decrease in customers electing multi-year terms where the full amount was billed up front as well as increased competitive pressures, lower renewal rates, and changes made in our sales organization and their go-to-market efforts.
Jive Platform Customers
We define a Jive Platform customer as any customer under an active contract that carries a balance in our deferred revenue account at the end of that period. While a single customer may have multiple internal and external communities to support distinct departments, operating segments or geographies, we only include that customer once for purposes of this metric. We believe the number of Jive Platform customers is a leading indicator of our future revenues, billings and upsell opportunities.
45
Our Jive Platform customer count was as follows:
December 31, | |||||||||||
2016 | 2015 | Change | % Change | ||||||||
Jive Platform customer count | 981 | 993 | (12 | ) | (1.2 | )% | |||||
December 31, | |||||||||||
2015 | 2014 | Change | % Change | ||||||||
Jive Platform customer count | 993 | 950 | 43 | 4.5 | % | ||||||
Our customer count decreased in 2016 compared to 2015 primarily due to competitive pressures, as well as our increased focus on the large and mid-sized enterprise segments of our markets. We believe that our focus on the large and mid-sized enterprise segment of our markets has affected, and will continue to affect our customer count.
Our product revenue growth was 4.0% and 11.1%, respectively, in 2016 compared to 2015 and in 2015 compared to 2014. Our product revenues have grown at a faster rate than our customer count as we have continued to realize significant upsell opportunities with our existing customers as we continue to focus on large enterprise customers.
Liquidity and Capital Resources
Year Ended December 31, | |||||||||||
(Dollars in thousands) | 2016 | 2015 | 2014 | ||||||||
Cash flows provided by (used in) operating activities | $ | 4,286 | $ | 295 | $ | (9,657 | ) | ||||
Cash provided by (used in) investing activities | 19,351 | (10,064 | ) | (7,802 | ) | ||||||
Cash used in financing activities | (3,846 | ) | (1,006 | ) | (484 | ) | |||||
Increase (decrease) in cash and cash equivalents | $ | 19,791 | $ | (10,775 | ) | $ | (17,943 | ) | |||
We have financed our operations primarily through issuances of preferred stock, borrowings under our credit facility, cash generated from customer sales and the proceeds from our initial public offering (“IPO”), which closed on December 16, 2011.
Our principal source of liquidity at December 31, 2016 consisted of $29.6 million of cash and cash equivalents, and $79.7 million of short-term marketable securities. As of December 31, 2016, $3.3 million of our cash was held in foreign bank accounts. Our principal needs for liquidity include funding of our operating losses, working capital requirements, capital expenditures, debt service and acquisitions. We believe that our available resources are sufficient to fund our liquidity requirements for at least the next 12 months from December 31, 2016.
Free cash flow, which we define as cash flows provided by operating activities less principal payments on capital leases and purchases of property and equipment, was $1.0 million in 2016.
Year Ended December 31, | |||||||||||
(Dollars in thousands) | 2016 | 2015 | 2014 | ||||||||
Cash flows used in operating activities | $ | 4,286 | $ | 295 | $ | (9,657 | ) | ||||
Payments for purchase of property and equipment | (3,114 | ) | (6,450 | ) | (9,313 | ) | |||||
Principal payments for capital leases | (210 | ) | — | — | |||||||
Free cash flow | $ | 962 | $ | (6,155 | ) | $ | (18,970 | ) | |||
Cash Flows from Operating Activities
Cash flows provided by operating activities were $4.3 million in 2016 compared to $0.3 million in 2015. The increase in cash flows generated from operating activities primarily resulted from a lower net loss, and lower non-cash charges and changes in our operating assets and liabilities. Changes to our operating cash flows are historically impacted by the growth in our calculated total billings and our ability to maintain or improve the timeframe to collect the cash from outstanding accounts receivable, or days billings outstanding, offset by funding our growth and working capital needs.
46
The $4.3 million of cash provided by operating activities in 2016 resulted from our net loss of $14.0 million, more than offset by net non-cash charges of $28.6 million. Net cash provided by operating activities during 2016 increased $4.0 million over 2015 primarily due to higher collections than in the prior year and a decrease in net loss. Additionally, the timing of payments against accrued payroll and related liabilities contributed to the increase.
Cash Flows from Investing Activities
Our primary investing activities have consisted of purchases of investments and purchases of property and equipment, primarily related to the build out of our data centers and leased facilities. Cash flows generated from investing activities were $19.4 million, primarily due to $22.5 million provided by maturities and sales net of purchases of marketable securities, offset by $3.1 million used in the purchase of property and equipment.
Cash Flows from Financing Activities
Our financing activities have consisted primarily of repayments under our revolving credit facilities and the net proceeds from the issuance of common stock from employee option exercises and equity awards. Cash used in financing activities of $3.8 million in 2016 resulted from $3.0 million in principal payments on our term debt, $1.0 million in taxes paid related to the net settlement of equity awards and $0.2 million in principal payments on our capital leases partially offset by $0.3 million in cash receipts related to stock option exercises.
Debt Arrangements
Revolving Loan and Term Loan Facility
We have a secured revolving loan facility and term loan facility of up to $30.0 million with Silicon Valley Bank ("SVB"). Revolving loans may be converted into term loans under the facility, with all outstanding term loans reducing the availability under the revolving loan facility. Interest is accrued, at our option, at (i) an adjusted LIBOR rate, plus a margin of 2.0% or 2.25%, or (ii) the prime rate, plus a margin of 0.25% or 0.50%, in each case with such margin determined based on our adjusted quick ratio.
Repayment on our term loan began July 1, 2012, and is payable in 16 quarterly installments. Each of the installment payments is $0.6 million, plus accrued interest. At December 31, 2016, we had $0.6 million of outstanding letters of credit and no revolving loans outstanding. We have $0.6 million of term loans outstanding at an interest rate of 2.96% and we were in compliance with all financial and restrictive covenants. In the fourth quarter of 2016, we began to pay down our Loan Agreement with SVB prior to our installments coming due. We will continue to do this in the first quarter of 2017, during which time, we will pay the remaining outstanding obligation.
Contractual Payment Obligations
A summary of our contractual commitments and obligations as of December 31, 2016 is as follows (in thousands):
Payments Due By Period | |||||||||||||||||||
Contractual Obligation | Total | 2017 | 2018 and 2019 | 2020 and 2021 | 2022 and beyond | ||||||||||||||
Term loan | $ | 600 | $ | 600 | $ | — | $ | — | $ | — | |||||||||
Estimated interest on term loan | — | — | — | — | — | ||||||||||||||
Letter of Credit | 564 | 564 | — | — | — | ||||||||||||||
Contractual commitments | 10,844 | 4,844 | 6,000 | — | — | ||||||||||||||
Operating leases | 17,877 | 5,583 | 7,961 | 3,446 | 887 | ||||||||||||||
Total | $ | 29,885 | $ | 11,591 | $ | 13,961 | $ | 3,446 | $ | 887 | |||||||||
The contractual commitment amounts in the table above are associated with agreements that are enforceable and legally binding and that specify all significant terms, including: fixed or minimum services to be used; and fixed, and minimum or variable price provisions. Obligations under contracts that we can cancel without a significant penalty are not included in the table above.
Obligations under operating leases primarily relates to our office spaces, and, to a lesser extent, leases for third-party facilities that house our data centers.
47
Off-Balance Sheet Arrangements
Except as disclosed under the Contractual Payment Obligations section above, we do not have any off-balance sheet arrangements that have or are reasonably likely to have a material current or future effect on our financial condition, changes in financial condition, revenues or expenses, results of operations, liquidity, capital expenditures or capital resources.
Recent Accounting Guidance
See Note 18 of Notes to Consolidated Financial Statements included in Part II, Item 8 of this Form 10-K.
ITEM 7A. QUANTITATIVE AND QUALITATIVE DISCLOSURES ABOUT MARKET RISK
We are exposed to financial market risks, primarily changes in interest rates and currency exchange rates.
Interest Rate Risk
Our exposure to market risk for changes in interest rates primarily relates to our investments, our revolving credit facility and our variable-rate, long-term debt.
The primary objective of our investment activities is to preserve principal while maximizing yields without significantly increasing risk. This objective is accomplished by making diversified investments, consisting only of investment grade securities.
As of December 31, 2016, we held cash and cash equivalents and marketable securities of $109.2 million. Based on the nature of our marketable securities, a decline in interest rates over time would reduce our interest income, but would not have a material impact on our results of operations, financial position or cash flows, as we have classified our securities as available-for-sale and, therefore, may choose to sell or hold them as changes in the market occur. In addition, due to the nature of our highly liquid cash equivalents, a change in interest rates would not materially affect the fair value of our cash equivalents.
Our revolving credit facility and senior term loan bear interest at a variable rate tied to the prime or LIBOR rate, at our option. Based on amounts outstanding at December 31, 2016, a 10% increase in the prime or LIBOR rate would not materially increase our interest expense.
ITEM 8. FINANCIAL STATEMENTS AND SUPPLEMENTARY DATA
Information required by Item 8 begins on the following page.
48
Report of Independent Registered Public Accounting Firm
The Board of Directors and Stockholders
Jive Software, Inc.:
We have audited the accompanying consolidated balance sheets of Jive Software, Inc. and subsidiaries as of December 31, 2016 and 2015, and the related consolidated statements of operations, comprehensive loss, stockholders’ equity, and cash flows for each of the years in the three-year period ended December 31, 2016. These consolidated financial statements are the responsibility of the Company’s management. Our responsibility is to express an opinion on these consolidated financial statements based on our audits.
We conducted our audits in accordance with the standards of the Public Company Accounting Oversight Board (United States). Those standards require that we plan and perform the audit to obtain reasonable assurance about whether the financial statements are free of material misstatement. An audit includes examining, on a test basis, evidence supporting the amounts and disclosures in the financial statements. An audit also includes assessing the accounting principles used and significant estimates made by management, as well as evaluating the overall financial statement presentation. We believe that our audits provide a reasonable basis for our opinion.
In our opinion, the consolidated financial statements referred to above present fairly, in all material respects, the financial position of Jive Software, Inc. and subsidiaries as of December 31, 2016 and 2015, and the results of their operations and their cash flows for each of the years in the three-year period ended December 31, 2016, in conformity with U.S. generally accepted accounting principles.
We also have audited, in accordance with the standards of the Public Company Accounting Oversight Board (United States), Jive Software, Inc.’s internal control over financial reporting as of December 31, 2016, based on criteria established in Internal Control – Integrated Framework (2013) issued by the Committee of Sponsoring Organizations of the Treadway Commission (COSO), and our report dated February 28, 2017 expressed an unqualified opinion on the effectiveness of the Company’s internal control over financial reporting.
/s/ KPMG LLP
Portland, Oregon
February 28, 2017
49
JIVE SOFTWARE, INC.
CONSOLIDATED BALANCE SHEETS
(In thousands, except per share amount)
December 31, | |||||||
2016 | 2015 | ||||||
Assets | |||||||
Current assets: | |||||||
Cash and cash equivalents | $ | 29,560 | $ | 9,870 | |||
Short-term marketable securities | 79,656 | 96,410 | |||||
Accounts receivable, net | 57,386 | 54,090 | |||||
Prepaid expenses and other current assets | 16,438 | 13,135 | |||||
Total current assets | 183,040 | 173,505 | |||||
Marketable securities, noncurrent | — | 6,429 | |||||
Property and equipment, net | 9,583 | 12,747 | |||||
Goodwill | 29,753 | 29,753 | |||||
Intangible assets, net | 1,967 | 4,546 | |||||
Other assets | 4,537 | 8,165 | |||||
Total assets | $ | 228,880 | $ | 235,145 | |||
Liabilities and Stockholders’ Equity | |||||||
Current liabilities: | |||||||
Accounts payable | $ | 2,233 | $ | 3,684 | |||
Accrued payroll and related liabilities | 12,312 | 6,954 | |||||
Other accrued liabilities | 7,055 | 7,842 | |||||
Deferred revenue, current | 127,574 | 131,850 | |||||
Term debt, current | 600 | 2,400 | |||||
Total current liabilities | 149,774 | 152,730 | |||||
Deferred revenue, less current portion | 12,285 | 16,392 | |||||
Term debt, less current portion | — | 1,200 | |||||
Other long-term liabilities | 2,678 | 2,682 | |||||
Total liabilities | 164,737 | 173,004 | |||||
Commitments and contingencies (Note 12) | |||||||
Stockholders’ Equity: | |||||||
Common stock, $0.0001 par value. Authorized 290,000 shares; issued - 85,200 shares at December 31, 2016 and 82,820 at December 31, 2015; outstanding - 78,774 at December 31, 2016 and 76,395 at December 31, 2015 | 7 | 7 | |||||
Less treasury stock at cost | (3,352 | ) | (3,352 | ) | |||
Additional paid-in capital | 400,740 | 384,164 | |||||
Accumulated deficit | (332,501 | ) | (318,537 | ) | |||
Accumulated other comprehensive loss | (751 | ) | (141 | ) | |||
Total stockholders’ equity | 64,143 | 62,141 | |||||
Total liabilities and stockholders’ equity | $ | 228,880 | $ | 235,145 | |||
See accompanying Notes to Consolidated Financial Statements.
50
JIVE SOFTWARE, INC.
CONSOLIDATED STATEMENTS OF OPERATIONS
(In thousands, except per share amounts)
Year Ended December 31, | |||||||||||
2016 | 2015 | 2014 | |||||||||
Revenues: | |||||||||||
Product | $ | 187,313 | $ | 180,172 | $ | 162,185 | |||||
Professional services | 16,781 | 15,621 | 16,508 | ||||||||
Total revenues | 204,094 | 195,793 | 178,693 | ||||||||
Cost of revenues: | |||||||||||
Product | 48,217 | 49,816 | 43,494 | ||||||||
Professional services | 19,195 | 22,378 | 23,179 | ||||||||
Total cost of revenues | 67,412 | 72,194 | 66,673 | ||||||||
Gross profit | 136,682 | 123,599 | 112,020 | ||||||||
Operating expenses: | |||||||||||
Research and development | 45,769 | 52,818 | 52,275 | ||||||||
Sales and marketing | 74,654 | 78,684 | 90,141 | ||||||||
General and administrative | 25,913 | 26,708 | 24,633 | ||||||||
Restructuring | 4,103 | — | — | ||||||||
Total operating expenses | 150,439 | 158,210 | 167,049 | ||||||||
Loss from operations | (13,757 | ) | (34,611 | ) | (55,029 | ) | |||||
Other income (expense), net: | |||||||||||
Interest income | 549 | 277 | 205 | ||||||||
Interest expense | (130 | ) | (171 | ) | (269 | ) | |||||
Other, net | 597 | 903 | 78 | ||||||||
Total other income, net | 1,016 | 1,009 | 14 | ||||||||
Loss before provision for income taxes | (12,741 | ) | (33,602 | ) | (55,015 | ) | |||||
Provision for income taxes | 1,223 | 1,251 | 1,138 | ||||||||
Net loss | $ | (13,964 | ) | $ | (34,853 | ) | $ | (56,153 | ) | ||
Basic and diluted net loss per share | $ | (0.18 | ) | $ | (0.46 | ) | $ | (0.79 | ) | ||
Shares used in basic and diluted per share calculations | 77,494 | 75,217 | 70,751 | ||||||||
See accompanying Notes to Consolidated Financial Statements.
51
JIVE SOFTWARE, INC.
CONSOLIDATED STATEMENTS OF COMPREHENSIVE LOSS
(In thousands)
Year Ended December 31, | |||||||||||
2016 | 2015 | 2014 | |||||||||
Net loss | $ | (13,964 | ) | $ | (34,853 | ) | $ | (56,153 | ) | ||
Other comprehensive income (loss): | |||||||||||
Foreign currency translation | (696 | ) | (100 | ) | (205 | ) | |||||
Unrealized gain (loss) on marketable securities | 86 | (80 | ) | (32 | ) | ||||||
Other comprehensive loss | (610 | ) | (180 | ) | (237 | ) | |||||
Comprehensive loss | $ | (14,574 | ) | $ | (35,033 | ) | $ | (56,390 | ) | ||
See accompanying Notes to Consolidated Financial Statements.
52
JIVE SOFTWARE, INC.
CONSOLIDATED STATEMENTS OF STOCKHOLDERS’ EQUITY
Years ended December 31, 2014, 2015 and 2016
(In thousands)
Common stock | Treasury stock | Additional paid-in capital | Accumulated Deficit | Accumulated other comprehensive income (loss) | Total stockholders’ equity | |||||||||||||||||||||
Shares | Amount | |||||||||||||||||||||||||
Balance at December 31, 2013 | 69,653 | $ | 7 | $ | (3,352 | ) | $ | 326,834 | $ | (227,531 | ) | $ | 276 | $ | 96,234 | |||||||||||
Issuance of common stock for employee stock options exercised and vesting of restricted shares | 4,264 | — | — | 2,492 | — | — | 2,492 | |||||||||||||||||||
Stock-based compensation | — | — | — | 34,261 | — | — | 34,261 | |||||||||||||||||||
Foreign currency translation, net of tax | — | — | — | — | — | (205 | ) | (205 | ) | |||||||||||||||||
Unrealized gain on marketable securities, net of tax | — | — | — | — | — | (32 | ) | (32 | ) | |||||||||||||||||
Net loss | — | — | — | — | (56,153 | ) | — | (56,153 | ) | |||||||||||||||||
Balance at December 31, 2014 | 73,917 | 7 | (3,352 | ) | 363,587 | (283,684 | ) | 39 | 76,597 | |||||||||||||||||
Issuance of common stock for employee stock options exercised and vesting of restricted shares | 2,478 | — | — | 287 | — | — | 287 | |||||||||||||||||||
Stock-based compensation | — | — | — | 20,290 | — | — | 20,290 | |||||||||||||||||||
Foreign currency translation, net of tax | — | — | — | — | — | (100 | ) | (100 | ) | |||||||||||||||||
Unrealized gain on marketable securities, net of tax | — | — | — | — | — | (80 | ) | (80 | ) | |||||||||||||||||
Net loss | — | — | — | — | (34,853 | ) | — | (34,853 | ) | |||||||||||||||||
Balance at December 31, 2015 | 76,395 | 7 | (3,352 | ) | 384,164 | (318,537 | ) | (141 | ) | 62,141 | ||||||||||||||||
Issuance of common stock for employee stock options exercised and vesting of restricted shares | 2,379 | — | — | 974 | — | — | 974 | |||||||||||||||||||
Stock-based compensation | — | — | — | 15,602 | — | — | 15,602 | |||||||||||||||||||
Foreign currency translation, net of tax | — | — | — | — | — | (696 | ) | (696 | ) | |||||||||||||||||
Unrealized loss on marketable securities, net of tax | — | — | — | — | — | 86 | 86 | |||||||||||||||||||
Net loss | — | — | — | — | (13,964 | ) | — | (13,964 | ) | |||||||||||||||||
Balance at December 31, 2016 | 78,774 | $ | 7 | $ | (3,352 | ) | $ | 400,740 | $ | (332,501 | ) | $ | (751 | ) | $ | 64,143 | ||||||||||
See accompanying Notes to Consolidated Financial Statements.
53
JIVE SOFTWARE, INC.
CONSOLIDATED STATEMENTS OF CASH FLOWS
(In thousands)
Year Ended December 31, | |||||||||||
2016 | 2015 | 2014 | |||||||||
Cash flows from operating activities: | |||||||||||
Net loss | $ | (13,964 | ) | $ | (34,853 | ) | $ | (56,153 | ) | ||
Adjustments to reconcile net loss to net cash provided by (used in) operating activities: | |||||||||||
Depreciation and amortization | 12,663 | 15,605 | 15,458 | ||||||||
Stock-based compensation | 15,602 | 20,290 | 32,908 | ||||||||
Change in deferred taxes | 200 | 338 | 243 | ||||||||
Non-recurring gain | — | (1,107 | ) | — | |||||||
Other | 104 | 103 | 19 | ||||||||
(Increase) decrease in: | |||||||||||
Accounts receivable, net | (3,296 | ) | 12,639 | (7,900 | ) | ||||||
Prepaid expenses and other assets | (2,559 | ) | (307 | ) | (4,084 | ) | |||||
Increase (decrease) in: | |||||||||||
Accounts payable | (1,702 | ) | 535 | (2,622 | ) | ||||||
Accrued payroll and related liabilities | 6,620 | 300 | (883 | ) | |||||||
Other accrued liabilities | (592 | ) | (1,266 | ) | 139 | ||||||
Deferred revenue | (8,383 | ) | (12,297 | ) | 13,202 | ||||||
Other long-term liabilities | (407 | ) | 315 | 16 | |||||||
Net cash provided by (used in) operating activities | 4,286 | 295 | (9,657 | ) | |||||||
Cash flows from investing activities: | |||||||||||
Payments for purchase of property and equipment | (3,114 | ) | (6,450 | ) | (9,313 | ) | |||||
Purchases of marketable securities | (84,933 | ) | (133,314 | ) | (91,987 | ) | |||||
Sales of marketable securities | 10,300 | 25,383 | 36,174 | ||||||||
Maturities of marketable securities | 97,098 | 104,317 | 57,324 | ||||||||
Net cash provided by (used in) investing activities | 19,351 | (10,064 | ) | (7,802 | ) | ||||||
Cash flows from financing activities: | |||||||||||
Proceeds from exercise of stock options | 348 | 1,345 | 4,250 | ||||||||
Taxes paid related to net share settlement of equity awards | (984 | ) | (1,058 | ) | (1,758 | ) | |||||
Repayments of term loans | (3,000 | ) | (2,400 | ) | (2,400 | ) | |||||
Capital lease payments | (210 | ) | — | — | |||||||
Earnout payment for prior acquisition | — | — | (576 | ) | |||||||
Non-recurring gain | — | 1,107 | — | ||||||||
Net cash used in financing activities | (3,846 | ) | (1,006 | ) | (484 | ) | |||||
Net increase (decrease) in cash and cash equivalents | 19,791 | (10,775 | ) | (17,943 | ) | ||||||
Effect of exchange rate changes | (101 | ) | 51 | 122 | |||||||
Cash and cash equivalents, beginning of period | 9,870 | 20,594 | 38,415 | ||||||||
Cash and cash equivalents, end of period | $ | 29,560 | $ | 9,870 | $ | 20,594 | |||||
See accompanying Notes to Consolidated Financial Statements.
54
JIVE SOFTWARE, INC.
NOTES TO CONSOLIDATED FINANCIAL STATEMENTS
Note 1. Nature of Business
We provide products that we believe improve business results by enabling a more productive and effective workforce through enhanced communications and collaboration both inside and outside the enterprise. Organizations deploy our products to improve the level of engagement, the quality of interaction and the overall relationship they have with their employees, customers and partners. Our products are primarily offered on a subscription basis, deployable in a private or public cloud and used for internal or external communities. We generate revenues from product subscription license fees as well as from professional service fees for strategic consulting, configuration, implementation and training.
Note 2. Summary of Significant Accounting Policies
Use of Estimates
The preparation of financial statements in conformity with accounting principles generally accepted in the United States (“GAAP”), requires us to make estimates and assumptions that affect the reported amounts of assets and liabilities, revenues and expenses, and the related disclosure of contingent assets and liabilities in the financial statements and the accompanying notes. Significant estimates include the estimates relating to revenue recognition, the useful lives of property and equipment, stock-based compensation, assumptions used in testing for impairment of goodwill, other long-lived assets, capitalized software development costs, and the recoverability of deferred income tax assets and liabilities. Actual results could differ from those estimates, and such differences may be material to the consolidated financial statements.
Principles of Consolidation
The consolidated financial statements include the accounts of Jive Software, Inc. and its wholly-owned subsidiaries. All intercompany balances and transactions have been eliminated in consolidation.
Segments
An operating segment is defined as a component of an enterprise that meets the following criteria:
• | engages in business activities from which it may earn revenues and incur expenses; |
• | operating results are regularly reviewed by the enterprise’s chief operating decision maker to make decisions about resources to be allocated to the segment and assess its performance; and |
• | discrete financial information is available. |
We define the term “chief operating decision maker” to be our Chief Executive Officer. Our Chief Executive Officer reviews financial information presented on a consolidated basis, accompanied by information about revenue by product line and geographic region for purposes of allocating resources and evaluating financial performance. We have one business activity and there are no segment managers who are held accountable for operations, operating results or plans for levels or components below the consolidated unit level. Accordingly, we have determined that we operate in a single reporting segment, software sales and service.
Revenue Recognition
We generate revenues in the form of product fees and related professional service fees. Product fees include subscription fees, perpetual license fees, associated support and maintenance fees and hosting fees. Professional services primarily consist of fees for strategic consulting, configuration, training, consultation and implementation services, which are not essential to functionality. For statement of operations classification purposes, we allocate revenues to professional services based on the hourly rate billed for time and materials arrangements and based on the total fixed fee for fixed fee professional services. We recognize revenue when all of the following conditions are met:
• | there is persuasive evidence of an arrangement; |
• | the product or services have been delivered to the customer; |
• | the amount of fees to be paid by the customer is fixed or determinable; and |
• | the collection of the related fees is reasonably assured. |
Signed agreements are used as evidence of an arrangement. If a contract signed by the customer does not exist, we have historically used a purchase order as evidence of an arrangement. In cases where both a signed contract and a purchase order exist, we consider the signed contract to be the final persuasive evidence of an arrangement. Software and corresponding license keys are delivered to customers electronically. Electronic delivery occurs when we provide the customer with access to the software. We assess whether a fee is fixed or determinable at the outset of the arrangement, primarily based on the payment terms associated with the
55
transaction. We do not generally offer extended payment terms with typical terms of payment due between 30 and 60 days from delivery of product or services. For professional services that are billable under a time and materials based arrangement, these fees are neither fixed nor determinable until the work is performed and the fee becomes billable to the customer. We assess collectability of the customer receivable based on a number of factors such as collection history with the customer and creditworthiness of the customer. If we determine that collectability is not reasonably assured, revenue is deferred until collectability becomes reasonably assured, generally upon receipt of cash.
We offer subscriptions of our solutions to customers most frequently on a term basis with terms typically ranging from 12 to 36 months. While term-based licenses make up the majority of our total revenues, we have occasionally licensed our solutions to customers on a perpetual basis with on-going support and maintenance services. We recognize license revenue in accordance with software industry specific guidance. Revenues related to term license fees are recognized ratably over the contract term beginning on the date the customer has access to the software license key and continuing through the end of the contract term. For term-based licenses, we do not charge separately for standard support and maintenance, and, therefore, inherent in the license fees are fees for support and maintenance services for the duration of the license term. As fees for support and maintenance are always bundled with the license over the entire term of the contract, we do not have VSOE of fair value for support and maintenance. Revenues generated from perpetual license sales also include support and maintenance services for an initial stated term and term based subscriptions to certain of our modules. We do not have VSOE of fair value for support and maintenance on perpetual licenses as we have not had sufficient, consistently-priced standalone sales of support and maintenance, nor have we offered substantive renewal rates for support and maintenance. Because we do not have VSOE of fair value for either the support and maintenance on the perpetual license or the module, revenue is recognized ratably over the longer of the initial maintenance term for the perpetual license or the term for the subscription elements.
In situations where we have contractually committed to an individual customer specific technology, we defer all of the revenue for that customer until the technology is delivered and accepted. Once delivery occurs, we record a cumulative revenue catch-up and then recognize the remaining revenue over the remaining contract term.
License arrangements may also include professional services, such as strategic consulting, installation, upgrades and training services, which are typically delivered early in the contract term. This combination of products and services represents a multiple-element arrangement for revenue recognition purposes. We have determined that we do not have VSOE of fair value for each element of a multiple-element sales arrangement and, accordingly, we account for fees received under that multiple-element arrangement as a single unit of accounting and recognize the fees for the entire arrangement ratably, commencing on delivery of the software, over the longer of the term of the support and maintenance or the period over which professional services are delivered. Support and maintenance is always the last undelivered element in the arrangement and, therefore, we recognize the fixed portion of the fees ratably over the support and maintenance term. For contracts with multiple elements, we recognize the license, support and maintenance, and fixed fee professional service revenue ratably over the term of the arrangement beginning upon delivery of the software. We believe this method most closely reflects the economics of the transaction as we deliver access to the software and we begin providing support and maintenance services as of the date the software is delivered.
Professional services are offered on both our fixed fee and our time and materials hourly billing arrangements. For time and materials-based professional services that are part of a multiple-element arrangement where the fees for the professional services are not fixed or determinable upon delivery of the software, revenue is recognized ratably over the contract term as the related fees become fixed. These fees are not considered fixed at the outset of the arrangement and become fixed as the related work is performed and the fees are earned and billed. These services are typically provided early in the contract term with completion typically occurring in the first six months. As these fees become fixed, they are added to the total fee for the multiple-element arrangement and recognized ratably with all other arrangement fees over the entire contract term. When billed, a cumulative revenue catch-up is calculated as the revenue earned from the date the software was made available to the customer to the date services have been completed, with recognition continuing ratably to the end of the contract term. These amounts, when recognized in our Consolidated Statements of Operations, are classified as professional services revenues based on the hourly rates at which they are billed. If there are significant acceptance clauses associated with the license or services or uncertainty associated with our ability to perform the professional services, revenues are deferred until the acceptance is received or the uncertainty is resolved. We record amounts that have been invoiced, in accordance with the terms of the agreement, in accounts receivable and in deferred revenues or revenues, depending on whether the revenue recognition criteria have been met.
Hosting revenues are derived from providing our software solutions in a hosted environment where the customer does not take possession of the software on their premises. With the exception of Jive Cloud, customers have the option to elect to take possession of the software and install on their premises or sub-contract the hosting services through us. Such arrangements are considered software sales as the customer has the same rights to the software license regardless of their election to have us host on their behalf or install on their premises. As a result, the fees associated with license, support and hosted services are recognized as revenue
56
ratably over the term of the arrangement. For Jive Cloud licensing arrangements, customers do not have the right to take possession of the software supporting the cloud-based application service at any time.
We occasionally sell professional services separately and recognize revenues resulting from those as professional services are performed. If there is significant uncertainty about the project completion or receipt of payment for the consulting services, revenues are deferred until the uncertainty is resolved. If acceptance provisions exist within a professional services arrangement, revenues will be deferred until the services are accepted or the acceptance period has expired.
Our policy is to record revenues net of any applicable sales, use or excise taxes.
Taxes Collected from Customers and Remitted to Governmental Authorities
We account for tax assessed by a governmental authority that is directly imposed on a revenue-producing transaction (i.e., sales, use, value added) on a net (excluded from revenue) basis.
Cash and Cash Equivalents
We consider all highly liquid investments with an original maturity of three months or less to be cash equivalents. Our cash balances with financial institutions may exceed the deposit insurance limits. Included in cash and cash equivalents were cash equivalents of $16.1 million and $0.2 million at December 31, 2016 and 2015, respectively. Cash equivalents are stated at cost, which approximates market value.
Marketable Securities
We classify our marketable securities as available-for-sale and, accordingly, record them at fair value based on quoted market prices. Unrealized holding gains and losses are excluded from earnings and are reported as a separate component of stockholders’ equity until realized. See the Consolidated Statements of Comprehensive Loss.
We periodically evaluate whether declines in fair values of our marketable securities below their cost are “other-than-temporary.” This evaluation consists of qualitative and quantitative factors regarding the severity and duration of the unrealized loss, as well as our ability and intent to hold the marketable securities until a forecasted recovery occurs. Dividend and interest income is recognized when earned. Realized gains and losses are included in earnings and are derived using the specific identification method for determining the cost of securities sold.
Accounts Receivable and Allowance for Doubtful Accounts
Accounts receivable are carried at their original invoice amounts less the allowance for doubtful accounts and do not bear interest. Our policy is to maintain an allowance for estimated losses resulting from the inability or refusal of our customers to make required payments. In establishing the required allowance, management considers historical losses adjusted to take into account current market conditions and the customers’ financial condition, the amount of receivables in dispute, and the current receivables aging and current payment patterns. On a quarterly basis, we evaluate the collectability of our trade receivable balances based on a combination of factors. Past due balances over 90 days and over a specified amount are reviewed individually for collectability. Account balances are charged off against the allowance after all means of collection have been exhausted and the potential for recovery is considered remote. If the financial conditions of our customers were to materially change or there were other circumstances that resulted in their inability or unwillingness to pay, the estimates of recoverability of receivables could materially change.
Activity related to our allowance for doubtful accounts was as follows (in thousands):
Balance, December 31, 2013 | $ | 740 | |
Charges to expense and deferred revenue | 599 | ||
Write-offs | (780 | ) | |
Balance, December 31, 2014 | 559 | ||
Charges to expense and deferred revenue | 1,529 | ||
Write-offs | (918 | ) | |
Balance, December 31, 2015 | 1,170 | ||
Charges to expense and deferred revenue | 376 | ||
Write-offs | (1,223 | ) | |
Balance, December 31, 2016 | $ | 323 | |
57
Fair Value of Financial Assets and Liabilities
The carrying value of cash equivalents, accounts receivable, prepaid expenses and other current assets, accounts payable, accrued payroll and related liabilities and other accrued liabilities approximates their fair values due to the short-term nature of their maturities. The fair value of the long-term debt approximates its carrying value since the interest rate is variable and based on current market rates.
Property and Equipment
Property and equipment are stated at cost less accumulated depreciation. Depreciation is computed using the straight-line method over the estimated useful lives as follows:
• | three years for computer equipment, hardware and software; |
• | seven years for furniture, fixtures and equipment; and |
• | the lesser of five years or the remaining term of the underlying lease for leasehold improvements. |
Ordinary maintenance and repairs are expensed as incurred.
Research and Development
We expense research and development costs, including costs to develop software products to be marketed to external users, before technological feasibility of such products is reached. We believe our software development process is essentially complete concurrent with the establishment of technological feasibility; accordingly, development costs are expensed as incurred.
Software Development Costs and Internal-Use Software Development Costs
Through the third quarter of 2014, we capitalized costs to develop internal-use software during the application development stage. In the third quarter of 2014, management developed a substantive plan to repurpose the in-process development into our existing software platform and new software products. As a result of this decision, the associated capitalized internal-use software costs became governed by the accounting standards related to development costs for software to be sold. As such, subsequent to July 2014, we no longer capitalize costs related to internal-use software and we account for our current capitalized costs as development costs for software to be sold.
Software development costs incurred subsequent to establishing technological feasibility through the general release of the software products are capitalized. Technological feasibility is demonstrated by the completion of a detailed program design or, working model if no program design is completed. Historically, technological feasibility has occurred concurrently with the commercial release of our products and as a result we have not capitalized software development costs. We do not anticipate capitalizing material software development costs in future periods.
The software development costs are being amortized on a straight-line basis over their estimated useful life and recorded as a component of cost of product revenues. Amortization of the capitalized costs begins when the associated product or enhancement is released. As of December 31, 2016, we have released all of the products and enhancements related to the $9.0 million of capitalized costs.
We make ongoing evaluations of the recoverability of our capitalized software by comparing the amount of capitalized software development costs for each product to the estimated net realizable value of the underlying asset. If such evaluations indicate the unamortized software development costs exceed the net realizable value, we write off the amount by which the unamortized software development costs exceed net realizable value. There was no impairment charge related to capitalized software development costs during the years ended December 31, 2016, 2015 or 2014.
Year Ended December 31, | |||||||||||
(Dollars in thousands) | 2016 | 2015 | 2014 | ||||||||
Software development costs capitalized during period | $ | — | $ | — | $ | 5,924 | |||||
Amortization of capitalized software development costs | 3,228 | 2,012 | 65 | ||||||||
Capitalized software development costs consist of the following at December 31, 2016 and 2015 (in thousands):
2016 | 2015 | ||||||
Capitalized software development costs | $ | 8,981 | $ | 8,981 | |||
Accumulated amortization | (5,305 | ) | (2,077 | ) | |||
$ | 3,676 | $ | 6,904 | ||||
58
As of December 31, 2016 and 2015 the net balance of software development costs is included in other assets.
We expect future amortization expense to be as follows (in thousands):
2017 | $ | 2,479 | |
2018 | 1,197 | ||
$ | 3,676 | ||
Accounting for the Impairment of Long-Lived Assets
We evaluate the recoverability of our long-lived assets, which principally consist of property and equipment and acquired intangible assets with finite lives, whenever events or circumstances indicate that the carrying amount of these assets may not be recoverable. Recoverability of an asset is measured by comparing the carrying amount to the expected future undiscounted cash flows that the asset is expected to generate. If that review indicates that the carrying amount of the long-lived asset is not recoverable, an impairment loss is recorded for the amount by which the carrying amount of the asset exceeds its fair value.
We did not incur any long-lived asset impairment charges in the years ended December 31, 2016, 2015 or 2014.
Goodwill
Goodwill represents the excess of the purchase price over the estimated fair value of the net tangible and intangible assets of acquired entities. We perform a goodwill impairment test annually during the fourth quarter and more frequently if an event or circumstance indicates that an impairment may have occurred. Such events or circumstances may include significant adverse changes in the general business climate, among other things.
To test for impairment, we can choose to first make a qualitative assessment to determine whether it is more likely than not that goodwill is impaired before applying the two-step goodwill impairment test. If the conclusion is it is more likely than not that the fair value of a reporting unit is less than its carrying amount, we then perform a two-step goodwill impairment test. During 2016, 2015 and 2014, we elected to forgo the qualitative assessment, and proceeded to the first step of the test for goodwill impairment. Under the first step, the fair value of the reporting unit is compared with its carrying value, and, if an indication of goodwill impairment exists for the reporting unit, we must perform step two of the impairment test (measurement). Under step two, an impairment loss is recognized for any excess of the carrying amount of the reporting unit’s goodwill as determined by allocating the fair value of the reporting unit in a manner similar to a purchase price allocation. The residual fair value after this allocation is the implied fair value of the reporting unit goodwill. If the fair value of the reporting unit exceeds its carrying value, step two does not need to be performed. If the carrying amount of goodwill exceeds the implied fair value of that goodwill, an impairment loss is recognized in an amount equal to that excess. We determined that the fair value of the reporting unit substantially exceeded its carrying value and, accordingly, we did not record any charges related to goodwill impairment during the years ended December 31, 2016, 2015 or 2014.
Intangible Assets
Finite-lived intangible assets are amortized using the straight-line method over their estimated useful life. Finite-lived intangible assets are reviewed for impairment as discussed above under “Accounting for the Impairment of Long-Lived Assets.”
Other Assets
Other assets include deposits for facility leases, capitalized software development costs and other miscellaneous long-term assets.
Deferred Revenue
Deferred revenue consists of billings or payments received in advance of revenue recognition from our subscription license, perpetual license, hosting, professional services and support and maintenance revenues described above and are recognized as the revenue recognition criteria are met. We generally invoice our customers in annual installments. Accordingly, the deferred revenue balance does not represent the total contract value of annual or multi-year non-cancelable subscription agreements. Deferred revenue also includes certain deferred professional services fees, which are recognized as revenue ratably over the associated contract term. We defer the professional service fees in situations where the professional services and subscription or perpetual contracts are accounted for as a single unit of accounting. Deferred revenue that will be recognized during the succeeding 12-month period is recorded as current deferred revenue, and the remaining portion is recorded as noncurrent. Approximately 4% and 6% of total deferred revenue as of December 31, 2016 and 2015, respectively, related to deferred professional services revenues.
59
Concentration of Risk
Financial instruments that potentially subject us to concentrations of credit risk consist primarily of cash and trade receivables. Cash is placed on deposit in major financial institutions in the United States. Such deposits may be in excess of insured limits. Management believes that the financial institutions that hold our cash deposits are financially sound and, accordingly, minimal credit risk exists with respect to these balances.
We sell our products to companies in diverse industries and do not require our customers to provide collateral to support accounts receivable. When necessary, credit reviews of significant customers are performed prior to extending credit. The determination of a customer’s ability to pay requires significant judgment, and failure to collect from a customer can adversely affect revenue, cash and net income.
No individual customer accounted for 10% or more of total revenue in the years ended December 31, 2016, 2015 or 2014. No customer accounted for 10% or more of total accounts receivable at December 31, 2016 or 2015.
Stock-Based Compensation
We recognize compensation expense for all share-based payment awards, including stock options, restricted stock and purchases under the 2015 Employee Stock Purchase Plan (the "ESPP") based on the estimated fair value of the award on the grant date. We use the Black-Scholes-Merton valuation model to estimate the fair value of stock option awards. The fair value of the awards is recognized as expense, net of estimated forfeitures, on a straight-line basis over the requisite service period, which is generally the vesting period of the respective award.
We estimate the fair value of performance-based stock option awards using a Monte Carlo simulation model which requires the input of assumptions, including expected term, stock price volatility and the risk-free rate of return.
The determination of the grant date fair value of options using an option-pricing model is affected by assumptions regarding a number of other complex and subjective variables, which include our expected stock price volatility over the expected term of the options, stock option exercise and cancellation behaviors, risk-free interest rates and expected dividends.
Income Taxes
We record deferred tax assets and liabilities for the expected future tax consequences of temporary differences between the financial statement carrying amounts and the tax basis of the assets and liabilities. Deferred tax assets are reduced by a valuation allowance when it is estimated to be more likely than not that a portion of the deferred tax assets will not be realized.
We recognize the effect of income tax positions only if those positions are “more likely than not” of being sustained. Interest and penalties accrued on unrecognized tax benefits are recorded as tax expense within our consolidated financial statements.
Warranties and Indemnification
We typically warrant that our products will perform in a manner consistent with the product specifications provided to the customer for 180 days for sales to companies in the United States and 365 days for sales to companies in Europe. Historically, we have not been required to make payments under these obligations, and we have not recorded any liability for these obligations in our consolidated financial statements.
In our cloud and hosted agreements, we include service level commitments to customers relating to levels of uptime availability and permitting those customers to receive credits in the event that we fail to meet those levels. To date, we have not incurred any material costs as a result of such commitments and have not accrued any liabilities related to such obligations in the accompanying consolidated financial statements.
Our contracts also include provisions indemnifying customers against liabilities if our products infringe a third-party’s intellectual property rights. We have not incurred any costs as a result of such indemnification obligations and have not accrued any liabilities related to such obligations in the accompanying consolidated financial statements.
We have also agreed to indemnify our directors and executive officers for costs associated with any fees, expenses, judgments, fines and settlement amounts incurred by any of these persons in any action or proceeding to which any of those persons is, or is threatened to be, made a party by reason of the person’s service as a director or officer, arising out of that person’s services as our director or officer or that person’s services provided to any other company or enterprise at our request. We maintain director and officer insurance coverage that may enable us to recover a portion of any future amounts paid.
60
Commissions
Commissions are recorded as a component of sales and marketing expenses and consist of the variable compensation paid to our direct sales force. Generally, sales commissions are earned and recorded as an expense at the time that a customer has entered into a binding purchase agreement. Commissions paid to sales personnel are recoverable only in the case that we cannot collect against any invoiced fee associated with a sales order. Commission expense was $11.2 million, $11.8 million and $13.7 million, for the years ended December 31, 2016, 2015 and 2014, respectively.
Leases
We lease our facilities and certain equipment under operating leases. For facility leases that contain rent escalation or rent concession provisions, we record the total rent expense during the lease term on a straight-line basis over the term of the lease. For facility leases that contain tenant improvement allowances, we recognize a lease incentive liability and amortize these amounts on a straight-line basis over the term of the related leases as a reduction of rent expense. We record the difference between the rent paid and the straight-line rent expense as a deferred rent liability in other long-term liabilities in the accompanying Consolidated Balance Sheets.
Advertising Costs
Advertising costs are expensed as incurred as a component of sales and marketing expense and totaled $4.1 million, $5.6 million and $7.7 million for the years ended December 31, 2016, 2015 and 2014, respectively.
Legal Costs
We are party to legal proceedings arising in the normal course of business. Legal costs are expensed as incurred as a component of general and administrative expense.
Net Loss Per Share
Basic net loss per share is computed by dividing the net loss by the weighted-average number of shares of common stock outstanding during the period, less the weighted-average unvested common stock subject to repurchase or forfeiture. Diluted net loss per share is computed by giving effect to all potential shares of common stock, including preferred stock, stock options and warrants, to the extent dilutive. Since we were in a loss position for all periods presented, basic and diluted net loss per share was the same for each period presented as the inclusion of all potential common shares outstanding would have been anti-dilutive.
Foreign Currency Translation
The functional currency of our foreign subsidiaries is the local currency. Adjustments resulting from translating foreign functional currency financial statements into U.S. dollars are recorded as a separate component of stockholders’ equity. Income and expense accounts are translated into U.S. dollars at average rates of exchange prevailing during the periods presented. Foreign currency transaction gains and losses are included in net loss. All assets and liabilities denominated in a foreign currency are translated into U.S. dollars at the respective exchange rates in effect on the Consolidated Balance Sheet dates. Foreign currency transaction gains and losses were not material in the years ended December 31, 2016, 2015 or 2014.
61
Note 3. Cash and Cash Equivalents and Marketable Securities
Cash and cash equivalents and marketable securities consisted of the following as of December 31, 2016 and 2015 (in thousands):
December 31, 2016 | |||||||||||||||
Description | Cost | Unrealized Gains | Unrealized Losses | Estimated Fair Value | |||||||||||
Cash | $ | 13,434 | $ | — | $ | — | $ | 13,434 | |||||||
Cash equivalents: | |||||||||||||||
Money market mutual funds | 16,126 | — | — | 16,126 | |||||||||||
Total cash and cash equivalents | 29,560 | — | — | 29,560 | |||||||||||
Short-term marketable securities: | |||||||||||||||
Commercial paper | 11,664 | — | — | 11,664 | |||||||||||
Corporate notes and bonds | 35,555 | — | (37 | ) | 35,518 | ||||||||||
Government obligation | 5,004 | — | (1 | ) | 5,003 | ||||||||||
U.S. agency obligations | 27,479 | — | (8 | ) | 27,471 | ||||||||||
Total short-term marketable securities | 79,702 | — | (46 | ) | 79,656 | ||||||||||
Cash, cash equivalents and short-term marketable securities | $ | 109,262 | $ | — | $ | (46 | ) | $ | 109,216 | ||||||
December 31, 2015 | |||||||||||||||
Description | Cost | Unrealized Gains | Unrealized Losses | Estimated Fair Value | |||||||||||
Cash | $ | 9,624 | $ | — | $ | — | $ | 9,624 | |||||||
Cash equivalents: | |||||||||||||||
Money market mutual funds | 246 | — | — | 246 | |||||||||||
Total cash and cash equivalents | 9,870 | — | — | 9,870 | |||||||||||
Short-term marketable securities: | |||||||||||||||
Commercial paper | 7,485 | — | — | 7,485 | |||||||||||
Corporate notes and bonds | 44,483 | — | (60 | ) | 44,423 | ||||||||||
Government obligations | 12,010 | — | (12 | ) | 11,998 | ||||||||||
U.S. agency obligations | 32,543 | — | (39 | ) | 32,504 | ||||||||||
Total short-term marketable securities | 96,521 | — | (111 | ) | 96,410 | ||||||||||
Marketable securities, noncurrent: | |||||||||||||||
Corporate notes and bonds | 4,453 | — | (17 | ) | 4,436 | ||||||||||
Government obligations | 1,997 | — | (4 | ) | 1,993 | ||||||||||
Total marketable securities, noncurrent | 6,450 | — | (21 | ) | 6,429 | ||||||||||
Cash, cash equivalents, short-term marketable securities and marketable securities, noncurrent | $ | 112,841 | $ | — | $ | (132 | ) | $ | 112,709 | ||||||
As of December 31, 2016 and 2015, we did not consider any of our investments to be other-than-temporarily impaired and, as of December 31, 2016, we did not have any marketable securities, noncurrent.
As of December 31, 2016, all of our investments in marketable securities are considered available-for-sale.
See also Note 6.
62
Note 4. Property and Equipment, net
The following table sets forth the components of property and equipment (in thousands):
December 31, | |||||||
2016 | 2015 | ||||||
Computers, equipment and software | $ | 33,729 | $ | 37,249 | |||
Leasehold improvements | 5,555 | 5,546 | |||||
Capital leases | 826 | — | |||||
Furniture and fixtures | 2,867 | 2,630 | |||||
Construction in progress | 1,430 | 3,666 | |||||
44,407 | 49,091 | ||||||
Less accumulated depreciation and amortization | (34,824 | ) | (36,344 | ) | |||
$ | 9,583 | $ | 12,747 | ||||
Depreciation expense related to property and equipment was as follows (in thousands):
Year Ended December 31, | ||||
2016 | 2015 | 2014 | ||
$6,271 | $7,800 | $9,351 | ||
Note 5. Goodwill and Intangible Assets, net
Our goodwill balance did not change during the years ended December 31, 2016, 2015 or 2014.
The following table presents our intangible assets and their related useful lives (dollars in thousands):
Useful Life | December 31, 2016 | December 31, 2015 | |||||||
Acquired technology | 5-7 years | $ | 20,441 | $ | 20,441 | ||||
Accumulated amortization | (18,474 | ) | (16,103 | ) | |||||
1,967 | 4,338 | ||||||||
Perpetual software licenses | 2 years | 2,430 | 2,430 | ||||||
Accumulated amortization | (2,430 | ) | (2,430 | ) | |||||
— | — | ||||||||
Covenants not to compete | 1-4 years | 2,028 | 2,028 | ||||||
Accumulated amortization | (2,028 | ) | (1,976 | ) | |||||
— | 52 | ||||||||
Other | 2-7 years | 1,939 | 1,939 | ||||||
Accumulated amortization | (1,939 | ) | (1,783 | ) | |||||
— | 156 | ||||||||
Total intangible assets, net | $ | 1,967 | $ | 4,546 | |||||
Amortization expense related to intangible assets was as follows (in thousands):
Year Ended December 31, | ||||
2016 | 2015 | 2014 | ||
$2,579 | $4,902 | $4,862 | ||
Estimated future amortization expense as of December 31, 2016, is as follows (in thousands):
2017 | 1,587 | ||
2018 | 380 | ||
$ | 1,967 | ||
63
Note 6. Fair Value Measurements of Assets and Liabilities
Factors used in determining the fair value of financial assets and liabilities are summarized into three broad categories:
• | Level 1 – quoted prices in active markets for identical securities as of the reporting date; |
• | Level 2 – other significant directly or indirectly observable inputs, including quoted prices for similar securities, interest rates, prepayment speeds and credit risk; and |
• | Level 3 – significant inputs that are generally less observable than objective sources, including our own assumptions in determining fair value. |
The factors or methodology used for valuing securities are not necessarily an indication of the risk associated with investing in those securities.
The following table presents our financial assets that were measured at fair value on a recurring basis (in thousands):
December 31, 2016 | |||||||||||||||
Level 1 | Level 2 | Level 3 | Total | ||||||||||||
Assets: | |||||||||||||||
Cash equivalents | |||||||||||||||
Money market mutual funds | $ | 16,126 | $ | — | $ | — | $ | 16,126 | |||||||
Marketable securities | |||||||||||||||
Commercial paper | — | 11,664 | — | 11,664 | |||||||||||
Corporate notes and bonds | — | 35,518 | — | 35,518 | |||||||||||
Government obligations | — | 5,003 | — | 5,003 | |||||||||||
U.S. agency obligations | — | 27,471 | — | 27,471 | |||||||||||
— | 79,656 | — | 79,656 | ||||||||||||
Total | $ | 16,126 | $ | 79,656 | $ | — | $ | 95,782 | |||||||
December 31, 2015 | |||||||||||||||
Level 1 | Level 2 | Level 3 | Total | ||||||||||||
Assets: | |||||||||||||||
Cash equivalents | |||||||||||||||
Money market mutual funds | $ | 246 | $ | — | $ | — | $ | 246 | |||||||
Marketable securities | |||||||||||||||
Commercial paper | — | 7,485 | — | 7,485 | |||||||||||
Corporate notes and bonds | — | 48,859 | — | 48,859 | |||||||||||
Government obligations | — | 13,991 | — | 13,991 | |||||||||||
U.S. agency obligations | — | 32,504 | — | 32,504 | |||||||||||
— | 102,839 | — | 102,839 | ||||||||||||
Total | $ | 246 | $ | 102,839 | $ | — | $ | 103,085 | |||||||
We did not have any financial liabilities measured at fair value on a recurring basis at December 31, 2016 or 2015.
We classify our marketable securities as available-for-sale and, accordingly, record them at fair value based on quoted market prices for similar securities. Unrealized holding gains and losses are excluded from earnings and are reported as a separate component of stockholders’ equity until realized. See the Consolidated Statements of Comprehensive Loss.
We recognize or disclose the fair value of certain assets, such as non-financial assets, primarily long-lived assets, goodwill, intangible assets and certain other assets in connection with impairment evaluations. All of our non-recurring valuations use significant unobservable inputs and therefore fall under Level 3 of the fair value hierarchy. During 2016, 2015 and 2014 we did not record any other-than-temporary impairments on those financial and non-financial assets required to be measured at fair value on a non-recurring basis.
The carrying value of our term loan approximates its fair value and falls under Level 2 of the fair value hierarchy, as the interest rate is variable and based on current market rates.
There were no changes to our valuation techniques during 2016.
64
Note 7. Long-Term Debt
Credit Facility with Silicon Valley Bank
We have a secured revolving loan facility and term loan facility of up to $30.0 million with Silicon Valley Bank (“SVB”), which, as amended in March 2016, expires May 23, 2017 (the “Loan Agreement”). Revolving loans may be converted into term loans under the facility, with all outstanding term loans reducing the availability under the revolving loan facility. Interest is accrued, at our option, at (i) an adjusted LIBOR rate, plus a margin of 2.0% or 2.25%, or (ii) the prime rate, plus a margin of 0.25% or 0.50%, in each case with such margin determined based on our adjusted quick ratio.
Repayment on the term loan began July 1, 2012, and is payable in quarterly installments of $0.6 million, plus accrued interest.
The adjusted quick ratio is a ratio of our unrestricted cash and cash equivalents to our current liabilities minus the current portion of our deferred revenue. Interest on the revolving loans and the term loans is due and payable in arrears at the end of an interest period of 30, 60 or 90 days, as selected by us, for loans that bear interest based on the adjusted LIBOR rate, or quarterly for loans that bear interest based on the prime rate. Obligations under the loan facility are secured by a security interest in substantially all of our assets, excluding intellectual property.
The Loan Agreement contains affirmative and negative covenants subject to certain exceptions. We must also comply with financial covenants under the Loan Agreement, including a minimum quick ratio.
On February 18, 2014, we entered into a Second Loan Modification Agreement with SVB to modify the minimum adjusted EBITDA financial covenant for periods occurring after December 31, 2013. Additionally, the Second Loan Modification Agreement removed the fixed charge coverage ratio and maximum leverage ratio financial covenants, which were set to begin in periods occurring after December 31, 2013.
On March 31, 2015, we entered into a Third Loan Modification Agreement with SVB to modify the adjusted EBITDA financial covenant for periods ending after December 31, 2014 and to amend the expiration date of the Loan Agreement.
On March 29, 2016, we entered into a Fourth Loan Modification Agreement with SVB to modify the adjusted EBITDA financial covenant for periods ending after December 31, 2015.
The Loan Agreement also restricts our ability to pay dividends by requiring the written consent of SVB to pay cash dividends to our stockholders.
The Loan Agreement contains events of default including, among others, payment defaults, breaches of covenants, bankruptcy and insolvency events, cross defaults with certain material indebtedness, judgment defaults, and breaches of representations and warranties. Upon an event of default, all or a portion of the outstanding obligations may be declared to be immediately due and payable. During the existence of an event of default, interest on the obligations under the Loan Agreement could be increased by 5.0% per annum.
At December 31, 2016, we had $0.6 million of outstanding letters of credit, no revolving loans outstanding under the Loan Agreement, $0.6 million of term loans outstanding at an interest rate of 2.96%, $30.0 million was available under the revolving loan facility and we were in compliance with all covenants.
Summary
Our long-term debt is summarized as follows (in thousands):
December 31, | |||||||
2016 | 2015 | ||||||
Silicon Valley Bank loans | $ | 600 | $ | 3,600 | |||
Less current portion | (600 | ) | (2,400 | ) | |||
$ | — | $ | 1,200 | ||||
65
Note 8. Stock-Based Awards and Stock-Based Compensation
Stock Option Plans
2011 Plan
Our 2011 Equity Incentive Plan (the “2011 Plan”) provides our board of directors with broad discretion in creating employee equity incentives. Unless otherwise provided in the 2011 Plan document, the compensation committee, in its discretion, determines the stock option exercise prices, which may not be less than the fair value of our common stock at the date of grant, vesting periods, and expiration periods, which are a maximum of ten years from the date of grant.
The 2011 Plan replaced two previous plans. Awards that were outstanding upon termination of the previous plans remained outstanding pursuant to their original terms, and awards subsequently terminated return to the pool of shares available for grant under the 2011 Plan.
The 2011 Plan allows for grants of incentive stock options, nonstatutory stock options, stock appreciation rights, restricted stock, restricted stock units ("RSUs"), performance shares and performance stock units ("PSUs"). Generally, all stock option grants are issued under an option agreement that provides, among other things, that the option grant vests over a four-year period while RSU and PSU agreements vest between one and four years.
The number of shares available for issuance under the 2011 Plan increases on the first business day of each year in an amount equal to the lesser of (i) 5,000,000 shares; (ii) 3.9% of the outstanding shares on the last day of the immediately preceding year; or (iii) such number of shares as determined by the board of directors.
Option Exchange Program
On August 5, 2016, we commenced an option exchange which permitted employees (other than directors and named executive officers) to surrender certain outstanding stock options with per share exercise prices above $6.58 for cancellation in exchange for the grant of replacement RSUs covering a lesser number of shares and subject to a different vesting schedule. This option exchange was completed on September 2, 2016. Options to purchase a total of 586,275 shares of common stock with a weighted-average exercise price of $11.29 per share were canceled and replaced with 122,400 RSUs, with per share fair value of $4.33, on September 2, 2016. The replacement RSUs will vest quarterly over the next two years. We accounted for this option exchange as a stock option modification in accordance with the provisions of ASC 718 Share-Based Compensation. We recorded incremental stock-based compensation expense of $0.3 million in addition to the remaining stock-based compensation expense attributable to the exchanged stock options to be amortized over the two-year vesting period of the replacement RSUs.
2015 Employee Stock Purchase Plan
In May 2015, our stockholders approved the adoption of the ESPP, pursuant to which 2,000,000 shares of common stock have been reserved for issuance to participating employees. Eligible employees may elect to contribute up to 15% of their base salary during each pay period, up to $25,000 in a calendar year, for the purchase of up to 3,000 shares during a purchase period. The ESPP provides for separate overlapping 12 month offering periods starting every six months. Each offering has two purchase dates occurring every six months on designated dates. The offerings under the ESPP commence on May 15 and November 15 of each calendar year, with the first purchase having occurred in May 2016. Any eligible employee may participate in only one offering period at a time and may purchase shares only through payroll deductions permitted under the ESPP. At the end of each six-month period, the purchase price is determined and the accumulated funds are used to purchase shares of common stock. The purchase price per share is equal to 85% of the lesser of the fair market value of the common stock on the first day of the offering period or the date of purchase.
A total of 488,823 shares were purchased pursuant to the ESPP during 2016 at a weighted average purchase price of $3.30 per share, which represents a weighted average discount of $0.60 per share compared to the fair market value of our common stock on the dates of purchase. At December 31, 2016, 1,511,177 shares of our common stock remained available for purchase and were reserved for issuance under the ESPP.
66
Stock Option Activity
Certain information regarding stock option activity and stock options outstanding as of December 31, 2016 was as follows:
Shares Available for Grant | Outstanding Stock Options | Weighted average exercise price | Weighted average remaining life (in years) | Aggregate intrinsic value (in thousands) | |||||||||||
Balances, December 31, 2015 | 3,642,166 | 6,976,957 | $ | 5.59 | |||||||||||
Additional shares reserved | 2,979,417 | ||||||||||||||
Granted – stock options | (1,217,157 | ) | 1,217,157 | 3.49 | |||||||||||
Granted – performance based options | (920,000 | ) | 920,000 | 3.79 | |||||||||||
Forfeited – stock options | 1,701,245 | (1,701,245 | ) | 9.39 | |||||||||||
Exercised – stock options | (157,110 | ) | 1.75 | ||||||||||||
Granted – RSUs | (3,645,209 | ) | |||||||||||||
Forfeited – RSUs | 1,062,176 | ||||||||||||||
Vested RSUs adjusted for taxes | 256,666 | ||||||||||||||
Balances, December 31, 2016 | 3,859,304 | 7,255,759 | $ | 4.20 | 5.87 | $ | 8,641 | ||||||||
Exercisable at December 31, 2016 | 4,092,661 | $ | 4.10 | 3.48 | $ | 7,289 | |||||||||
Vested and expected to vest | 6,978,257 | $ | 4.18 | 5.77 | $ | 8,535 | |||||||||
On January 1, 2016, an additional 3,072,200 shares were reserved for future awards under the 2011 Plan.
Restricted Stock Activity
Restricted stock results from the grant of PSUs and RSUs. The shares of restricted stock vest over the period specified in the related PSU and RSU agreements.
Restricted stock activity was as follows:
Number of shares | Weighted average grant date fair value | |||||
Balances, December 31, 2015 | 4,498,292 | $ | 6.98 | |||
Granted – RSUs | 3,645,209 | 3.58 | ||||
Vested – RSUs | (1,989,039 | ) | 6.74 | |||
Forfeited – RSUs | (1,062,176 | ) | 5.98 | |||
Balances, December 31, 2016 | 5,092,286 | $ | 4.85 | |||
All shares to be issued upon the exercise of stock options and the vesting of RSUs will come from newly issued shares.
Stock-Based Compensation
The fair value of the stock-based options granted to employees was determined using the Black-Scholes-Merton option-pricing model with the following weighted average assumptions:
Year Ended December 31, | ||||||||
2016 | 2015 | 2014 | ||||||
Expected term (in years) | 6.0 | 6.0 | 6.0 | |||||
Risk-free interest rate | 1.37 | % | 1.75 | % | 1.83 | % | ||
Volatility | 50.24 | % | 50.62 | % | 50.43 | % | ||
Dividend yield | 0 | % | 0 | % | 0 | % | ||
We granted performance-based options to certain of our executives during the year ended December 31, 2016. These performance-based options will vest if the closing price of our common stock remains above certain predetermined target prices for 30 consecutive days within a 4-year period following the respective award's grant date, subject to continued service by the award holder through such date. No performance-based options were vested or released during the year ended December 31, 2016.
67
The following weighted average assumptions were used in determining the fair value pursuant to the Monte Carlo simulation:
Year Ended December 31, | ||||||||
2016 | 2015 | 2014 | ||||||
Expected term (in years) | 0.96 | 0 | 0 | |||||
Risk-free interest rate | 1.84 | % | 0 | % | 0 | % | ||
Volatility | 49.98 | % | 0 | % | 0 | % | ||
Dividend yield | 0 | % | 0 | % | 0 | % | ||
The following weighted average assumptions were used to determine the fair value of ESPP shares purchased in the periods presented:
Year Ended December 31, | ||||||||
2016 | 2015 | 2014 | ||||||
Expected term (in years) | 0.75 | 0.70 | 0 | |||||
Risk-free interest rate | 0.67 | % | 0.41 | % | 0 | % | ||
Volatility | 29.55 | % | 36.20 | % | 0 | % | ||
Dividend yield | 0 | % | 0 | % | 0 | % | ||
The expected terms of options granted were calculated using the simplified method, which defines the expected term as the average of the contractual term and the vesting period. We elected to use the simplified method due to a lack of term length data since we completed our initial public offering in December 2011 and our stock options meet the criteria of “plain-vanilla.” Estimated volatility incorporates a calculated volatility derived from the historical closing prices of common shares of our stock as well as similar entities whose share prices are publicly available for the expected term of the option. The risk-free interest rate is based on the U.S. Treasury constant maturities in effect at the time of grant for the expected term of the option. We use historical data to estimate the number of future stock option forfeitures.
The expected term for the ESPP is the weighted average length of the purchase periods. We utilize our historical volatility over the estimated expected term as the expected volatility.
Certain information regarding our stock-based compensation was as follows (in thousands, except per share data):
Year Ended December 31, | |||||||||||
2016 | 2015 | 2014 | |||||||||
Weighted average per share grant date fair value of stock options granted | $ | 1.65 | $ | 2.65 | $ | 3.68 | |||||
Weighted average per share grant date fair value of ESPP purchase rights | $ | 1.32 | $ | 1.32 | $ | — | |||||
Total intrinsic value of stock options exercised | $ | 319 | $ | 4,444 | $ | 12,573 | |||||
Total fair value of restricted stock and stock options vested | $ | 15,461 | $ | 19,320 | $ | 38,071 | |||||
Stock-based compensation was included in our Consolidated Statements of Operations as follows (in thousands):
Year Ended December 31, | |||||||||||
2016 | 2015 | 2014 | |||||||||
Cost of revenues | $ | 2,162 | $ | 3,029 | $ | 4,276 | |||||
Research and development | 3,809 | 7,078 | 10,642 | ||||||||
Sales and marketing | 3,373 | 3,775 | 10,852 | ||||||||
General and administrative | 6,239 | 6,423 | 7,138 | ||||||||
Restructuring | 21 | — | — | ||||||||
Total | $ | 15,604 | $ | 20,305 | $ | 32,908 | |||||
Stock-based compensation related to non-employee awards (included in stock-based compensation above) | $ | — | $ | — | $ | 41 | |||||
Stock-based compensation capitalized related to the development of internal-use software | $ | — | $ | — | $ | 1,370 | |||||
68
There were no grants of stock-based awards to non-employees in 2016, 2015 or 2014. Vesting of shares granted to non-employees was contingent on the individual continuing to provide service. Expense for these awards was calculated using the Black-Scholes-Merton option-pricing model. These awards are equity classified and were marked to market each period with the change in fair value recorded in earnings. At December 31, 2016, there were no options exercisable for shares of our common stock by non-employees.
As of December 31, 2016, we had unrecognized compensation expense related to all stock-based awards of $26.3 million, which will be recognized over the weighted average remaining vesting period of 2.2 years.
Note 9. Income Taxes
Income Tax Provision
Pretax income (loss) was as follows (in thousands):
Year Ended December 31, | |||||||||||
2016 | 2015 | 2014 | |||||||||
Domestic | $ | (13,584 | ) | $ | (35,009 | ) | $ | (55,660 | ) | ||
Foreign | 843 | 1,407 | 645 | ||||||||
Total | $ | (12,741 | ) | $ | (33,602 | ) | $ | (55,015 | ) | ||
The provision for federal, state and foreign income taxes was as follows (in thousands):
Year Ended December 31, | |||||||||||
2016 | 2015 | 2014 | |||||||||
Current tax provision: | |||||||||||
Federal | $ | — | $ | — | $ | — | |||||
State | 19 | 157 | 50 | ||||||||
Foreign | 1,085 | 965 | 1,015 | ||||||||
Total current tax provision | 1,104 | 1,122 | 1,065 | ||||||||
Deferred tax provision: | |||||||||||
Federal | 103 | 103 | 50 | ||||||||
State | 16 | 26 | 23 | ||||||||
Foreign | — | — | — | ||||||||
Total deferred tax expense | 119 | 129 | 73 | ||||||||
Provision for income taxes | $ | 1,223 | $ | 1,251 | $ | 1,138 | |||||
The reconciliation of the statutory federal income tax rate to the effective tax rate is as follows:
Year Ended December 31, | ||||||||
2016 | 2015 | 2014 | ||||||
Federal statutory tax rate | (34.0 | )% | (34.0 | )% | (34.0 | )% | ||
State tax | 0.3 | (11.1 | ) | (6.9 | ) | |||
Change in valuation allowance | 32.3 | 45.9 | 40.0 | |||||
Permanent differences | 11.0 | 5.4 | 5.3 | |||||
Tax credits | (5.3 | ) | (6.2 | ) | (3.8 | ) | ||
Foreign rate impact | (1.0 | ) | (0.6 | ) | (0.2 | ) | ||
Foreign tax withheld at source | 4.0 | 1.5 | — | |||||
Other | 2.3 | 2.8 | 1.7 | |||||
9.6 | % | 3.7 | % | 2.1 | % | |||
69
Deferred Income Taxes
Deferred income taxes reflect the net tax effects of (i) temporary differences between the carrying amounts of assets and liabilities for financial reporting purposes and the amounts used for income tax purposes, and (ii) operating losses and tax credit carryforwards. The tax effects of significant items comprising our deferred tax assets and liabilities are as follows (in thousands):
December 31, | |||||||
2016 | 2015 | ||||||
Deferred tax assets: | |||||||
Net operating loss (“NOL”) carryforwards | $ | 80,343 | $ | 74,486 | |||
Accrued expenses, reserves and allowances | 2,853 | 940 | |||||
Deferred revenue | 8,498 | 16,545 | |||||
Tax credit carryforwards | 10,632 | 12,079 | |||||
Deferred rent | 205 | 320 | |||||
Depreciation | 1,975 | 820 | |||||
Stock-based compensation | 18,097 | 16,077 | |||||
Amortizable intangibles | 1,090 | 203 | |||||
Other | 193 | 256 | |||||
Total deferred tax assets | 123,886 | 121,726 | |||||
Deferred tax liabilities: | |||||||
Indefinite lived intangibles | (485 | ) | (367 | ) | |||
Total deferred tax liabilities | (485 | ) | (367 | ) | |||
Valuation allowance | (123,886 | ) | (121,726 | ) | |||
Net deferred taxes | $ | (485 | ) | $ | (367 | ) | |
The tax benefit of net operating losses, temporary differences and credit carryforwards is recorded as an asset to the extent that we assess that realization is more likely than not. Realization of the future tax benefits is dependent on our ability to generate sufficient taxable income within the carryforward period. Due to our history of operating losses, we currently believe that the recognition of the deferred tax assets arising from the above mentioned future tax benefits is not more likely than not to be realized and, accordingly, have provided a full valuation allowance.
Certain other information regarding our deferred income taxes was as follows:
(Dollars in thousands) | Year Ended December 31, | ||||||||||
2016 | 2015 | 2014 | |||||||||
Increase in valuation allowance | $ | 2,160 | $ | 14,186 | $ | 21,463 | |||||
(Dollars in millions) | December 31, | ||||||
2016 | 2015 | ||||||
Federal NOL carryforwards | $ | 263.5 | $ | 250.2 | |||
State NOL carryforwards | 338.5 | 313.5 | |||||
Tax credit carryforwards | 11.3 | 12.9 | |||||
These carryforwards expire between 2017 and 2036.
Approximately $74.9 million of our NOL carryforwards at December 31, 2016 were generated as a result of excess tax deductions related to exercises of stock options and disqualifying dispositions. If utilized, this portion of our carryforwards, as tax effected, will be accounted for as a direct increase to contributed capital rather than as a reduction of that year’s provision for income taxes. NOL carryforwards created by excess tax benefits from the exercise of stock options are not recorded as deferred tax assets. Accordingly, the deferred tax assets related to the net operating losses were reduced by $31.1 million and $31.6 million at December 31, 2016 and 2015, respectively.
70
Unrecognized Tax Benefits
We recognize the effect of income tax positions only if those positions are more likely than not of being sustained. We recognize penalties and interest related to unrecognized tax benefits as a component of income tax expense. As of December 31, 2016 and 2015, the accrued penalties or interest recorded in the consolidated financial statements were insignificant. Only $0.4 million of the unrecognized tax benefits would currently have an impact on the effective tax rate if recognized. The following is a reconciliation of our unrecognized tax benefits (in thousands):
Year Ended December 31, | |||||||||||
2016 | 2015 | 2014 | |||||||||
Beginning balance | $ | 455 | $ | 567 | $ | 409 | |||||
Additions based on tax positions related to the current year | 165 | 185 | 240 | ||||||||
Reductions based on tax positions related to the current year | — | (74 | ) | — | |||||||
Additions based on prior year tax positions | 720 | — | 36 | ||||||||
Reductions for tax positions in prior years | (234 | ) | (223 | ) | (118 | ) | |||||
Settlements | — | — | — | ||||||||
Ending balance | $ | 1,106 | $ | 455 | $ | 567 | |||||
We are subject to income taxes in U.S. federal and various state, local and foreign jurisdictions. Generally, we are no longer subject to U.S. federal, state and local tax examinations for tax years ended before December 31, 2012. However, to the extent allowed by law, the tax authorities may have the right to examine prior periods where NOLs or tax credits were generated and carried forward, and make adjustments up to the amount of the NOL or credit carryforward. At December 31, 2016, we were not under exam in any jurisdictions. There could be a significant impact to our uncertain tax positions over the next twelve months depending on the outcome of any audit. We do not anticipate that unrecognized tax benefits will decrease relating to expiring statutes of limitation by the end of 2017.
Unrepatriated Foreign Earnings
We repatriated $0.1 million of earnings from our foreign subsidiaries in 2016. We did not repatriate any earnings of our foreign subsidiaries in 2015 or 2014. We plan to indefinitely reinvest the remaining earnings of all of our foreign subsidiaries overseas. Should we plan to repatriate any foreign earnings in the future, we will be required to establish an income tax liability and recognize additional income tax expense related to such earnings. As of December 31, 2016, we had $1.4 million of unrepatriated foreign earnings.
Note 10. Net Loss Per Share
The following table sets forth the computation of basic and diluted net loss per share (in thousands, except per share data):
Year Ended December 31, | |||||||||||
2016 | 2015 | 2014 | |||||||||
Numerator: | |||||||||||
Net loss | $ | (13,964 | ) | $ | (34,853 | ) | $ | (56,153 | ) | ||
Denominator: | |||||||||||
Weighted-average common shares outstanding | 77,494 | 75,365 | 71,251 | ||||||||
Less: Weighted-average unvested common shares subject to repurchase or forfeiture | — | 148 | 500 | ||||||||
Weighted-average shares used to compute net loss per share, basic and diluted | 77,494 | 75,217 | 70,751 | ||||||||
Net loss per share, basic and diluted | $ | (0.18 | ) | $ | (0.46 | ) | $ | (0.79 | ) | ||
71
Potentially dilutive securities that were not included in the diluted per share calculations because they would be anti-dilutive were as follows:
Year Ended December 31, | ||||||||
2016 | 2015 | 2014 | ||||||
Shares subject to outstanding common stock options | 7,255,759 | 6,976,957 | 7,329,575 | |||||
Unvested restricted common stock | 5,092,286 | 4,498,292 | 4,043,912 | |||||
Common stock subject to repurchase | — | — | 313,412 | |||||
Purchase rights from employee stock purchase plans | 83,831 | 8,268 | — | |||||
12,431,876 | 11,483,517 | 11,686,899 | ||||||
Note 11. Statements of Cash Flows
The summary of supplemental cash flows information is as follows (in thousands):
Year Ended December 31, | |||||||||||
2016 | 2015 | 2014 | |||||||||
Supplemental Cash Flow Information | |||||||||||
Cash paid for interest | $ | 117 | $ | 123 | $ | 181 | |||||
Cash paid for income taxes | 783 | 634 | 235 | ||||||||
Supplemental Non-Cash Information | |||||||||||
Construction costs funded by landlord tenant improvement allowance | $ | — | $ | 741 | $ | — | |||||
Property and equipment acquired through capital leases | $ | 826 | $ | — | $ | — | |||||
Note 12. Commitments and Contingencies
Legal Matters
From time to time, we may become involved in routine litigation arising in the ordinary course of business. While the results of such litigation cannot be predicted with certainty, we believe that the final outcome of such matters will not have a material adverse effect on our financial position, results of operations or cash flows.
Operating Leases
Operating lease payments primarily relate to equipment leases and non-cancelable operating leases.
Rent expense was as follows (in thousands):
Year Ended December 31, | |||||||||||
2016 | 2015 | 2014 | |||||||||
Gross rent expense | $ | 7,404 | $ | 7,677 | $ | 7,023 | |||||
Less: Sublease income | (217 | ) | (254 | ) | (45 | ) | |||||
Net rent expense | $ | 7,187 | $ | 7,423 | $ | 6,978 | |||||
As of December 31, 2016, we do not sublease any of our facilities.
The approximate future minimum lease payments required under operating leases were as follows (in thousands):
Year ending December 31, | |||
2017 | $ | 5,583 | |
2018 | 4,698 | ||
2019 | 3,263 | ||
2020 | 1,953 | ||
2021 | 1,493 | ||
Thereafter | 887 | ||
$ | 17,877 | ||
72
Contractual Commitments
We have commitments under non-cancelable purchase orders or vendor agreements of $10.8 million at December 31, 2016. The non-cancelable purchase order and vendor agreement commitments will be filled at various times through the fourth quarter of 2019.
Note 13. Geographic Information
Sales to countries which represented 10% or more of our total revenues, determined based on the location of the end customer, were as follows (in thousands):
Year Ended December 31, | |||||||||||
2016 | 2015 | 2014 | |||||||||
U.S. | $ | 149,403 | $ | 143,819 | $ | 135,876 | |||||
Rest of world | 54,691 | 51,974 | 42,817 | ||||||||
$ | 204,094 | $ | 195,793 | $ | 178,693 | ||||||
Our long-lived net assets are classified by major geographic areas as follows (in thousands):
Year Ended December 31, | |||||||
2016 | 2015 | ||||||
U.S. | $ | 8,990 | $ | 14,076 | |||
Israel | 2,322 | 2,199 | |||||
Netherlands | — | 634 | |||||
United Kingdom | 238 | 384 | |||||
$ | 11,550 | $ | 17,293 | ||||
Note 14. Employee Benefit Plan
We offer a 401(k) employee savings plan to our U.S.-based employees. We make a nondiscretionary matching contribution equal to 100% of the first 3% and 50% of the next 2% of compensation contributed by employees. We made matching contributions as follows (in thousands):
Year Ended December 31, | |||||||||||
2016 | 2015 | 2014 | |||||||||
401(k) matching contributions | $ | 2,351 | $ | 2,485 | $ | 2,413 | |||||
Note 15. Related-Party Transactions
Certain members of our board of directors also serve on the board of directors or are employees of certain of our customers and in some cases our board members are also investors of these customers. Certain information regarding these customers was as follows (in thousands):
December 31, | |||||||
2016 | 2015 | ||||||
Accounts receivable | $ | 63 | $ | 230 | |||
Deferred revenue, current | 372 | 461 | |||||
Deferred revenue, non-current | 7 | 56 | |||||
Year Ended December 31, | |||||||||||
2016 | 2015 | 2014 | |||||||||
Revenues | $ | 789 | $ | 1,046 | $ | 929 | |||||
73
Note 16. Disgorgement Funds Received
On January 8, 2015, we received $1.1 million from a stockholder in settlement of a claim under Section 16(b) of the Exchange Act of 1934, as amended. We recognized the amount when realized in other, net on our Consolidated Statements of Operations. The amount is reflected as a non-recurring gain in our financing cash flows on our Consolidated Statements of Cash Flows.
Note 17. Restructuring
In May 2016, our board of directors approved a restructuring plan (the “2016 Realignment Plan”)to ensure that we have the correct cost structure and go-to-market strategies in place to achieve our desired corporate and operating results going forward, align our operations with evolving business needs and improve efficiencies. During 2016, restructuring charges under the 2016 Realignment Plan included $4.1 million in employee severance benefits and other costs, which were included as restructuring on our Consolidated Statements of Operations. Other costs primarily consist of legal, consulting, and other costs related to employee terminations. The 2016 Realignment Plan included a reduction in our workforce that resulted in the termination of approximately 14% of our personnel across our global operations and was substantially completed by September 30, 2016.
The restructuring accrual, which is included in accrued payroll and related liabilities, is expected to be paid in full by the second quarter of 2017. Changes in the restructuring accrual during 2016 were as follows (in thousands):
Severance Costs | Other Costs | Total | |||||||||
Balance of restructuring accrual, December 31, 2015 | $ | — | $ | — | $ | — | |||||
Charges incurred | 3,697 | 406 | 4,103 | ||||||||
Cash payments made | (3,615 | ) | (406 | ) | (4,021 | ) | |||||
Balance of restructuring accrual, December 31, 2016 | $ | 82 | $ | — | $ | 82 | |||||
Note 18. New Accounting Pronouncements
Accounting Pronouncements Not Yet Adopted
In May 2014, the Financial Accounting Standards Board (“FASB”) issued Accounting Standards Update (“ASU”) No. 2014-09, “Revenue from Contracts with Customers,” which requires an entity to recognize the amount of revenue to which it expects to be entitled for the transfer of promised goods or services to customers. In addition, the standard requires disclosure of the nature, amount, timing, and uncertainty of revenue and cash flows arising from contracts with customers. The FASB has recently issued several amendments to the standard, including clarification on accounting for licenses of intellectual property and identifying performance obligations. The ASU will replace most existing revenue recognition guidance in GAAP when it becomes effective. The new standard, as amended, is effective for annual reporting periods beginning after December 15, 2017, with early adoption permitted for annual reporting periods beginning after December 15, 2016. We do not plan to early adopt, and thus the new standard will become effective for us on January 1, 2018.
The new standard permits adoption either by using (i) a full retrospective approach for all periods presented in the period of adoption or (ii) a modified retrospective approach with the cumulative effect of initially applying the new standard recognized at the date of initial application and providing certain additional disclosures. We currently plan to adopt using the modified retrospective approach. However, our decision regarding the adoption method has not been finalized at this time. Our final determination will depend on a number of factors, such as the significance of the impact of the new standard on our financial results, system readiness, including that of software procured from third-party providers, and our ability to accumulate and analyze the information necessary to assess the impact on prior period financial statements.
We are in the initial stages of our assessment of the impact of the new standard on our accounting policies, processes and system requirements. We have assigned internal resources and engaged third party service providers to assist with the assessment and implementation and we have made and will continue to make investments in systems to enable timely and accurate reporting under the new standard. Although we have not concluded on what impact the new standard will have, we anticipate the impact on our consolidated financial statements will be material.
We currently believe the most significant impact relates to our accounting for software license revenue and professional services revenue. Under current industry-specific software revenue recognition guidance, we have historically concluded that we did not have VSOE of fair value for the undelivered services related to time-based licenses, and accordingly, we have recognized time-based licenses and related services ratably over the subscription term. Professional services included in an arrangement with subscription revenue have also been recognized ratably over the subscription term. The new standard does not retain the concept of VSOE, and thus requires an evaluation of whether time-based licenses and related services, including professional services,
74
are distinct performance obligations and, therefore, should be separately recognized at a point in time or over time. Based on our current assessment, we expect that software license revenue and professional services revenue, bundled with other elements, will be recognized upon delivery after adoption of the new standard. We expect revenue related to support and maintenance, hosting, and standalone professional services to remain substantially unchanged. Due to the complexity of certain of our software license subscription contracts, the actual revenue recognition treatment required under the standard will be dependent on contract-specific terms, and may vary in some instances from recognition at the time of delivery.
We have also considered the impact of the guidance in ASC 340-40, Other Assets and Deferred Costs; Contracts with Customers, with respect to capitalization and amortization of incremental costs of obtaining a contract. The new cost guidance, as interpreted by the FASB Transition Resource Group for Revenue Recognition (“TRG”), requires the capitalization of all incremental costs to obtain a contract with a customer that would not have been incurred if the contract had not been obtained, provided the costs are expected to be recovered. The new cost guidance also requires entities to determine whether the costs relate to specific anticipated contracts, potentially extending the amortization period beyond the initial contract period. We currently believe this guidance will result in capitalizing additional costs of obtaining a contract with a customer, including additional sales commissions and that the period of benefit for deferred commission costs will likely be longer than the initial contract period. Under our current accounting policy, we amortize the capitalized costs over the underlying contractual period.
While we continue to assess the potential impacts of the new standard, including the areas described above, and anticipate this standard will have a material impact on our consolidated financial statements, we do not know and cannot reasonably estimate quantitative information related to the impact of the new standard on our financial statements at this time.
In February 2016, the FASB issued ASU No. 2016-02, "Leases," which, among other things, requires lessees to recognize most leases on-balance sheet. This will increase their reported assets and liabilities, in some cases very significantly. Lessor accounting remains substantially similar to current GAAP. ASU 2016-02 supersedes Topic 840, Leases. ASU 2016-02 is effective for us for annual and interim periods in fiscal years beginning after December 15, 2018. ASU 2016-02 mandates a modified retrospective transition method for all entities. While we are currently assessing the impact ASU 2016-02 will have on our consolidated financial statements, we expect the primary impact to our consolidated financial position upon adoption will be the recognition, on a discounted basis, of our minimum commitments under non-cancelable operating leases on our consolidated balance sheets resulting in the recording of right of use assets and lease obligations. Our current minimum commitments under noncancelable operating leases are disclosed in Note 12.
In March 2016, the FASB issued ASU 2016-09, "Compensation - Stock Compensation (Topic 718) - Improvements to Employee Share-Based Payment Accounting." ASU 2016-09 simplifies several aspects of the accounting for share-based payment transactions, including the income tax consequences, classification of awards as either equity or liabilities, and classification on the statement of cash flows. ASU 2016-09 is effective for public companies' annual periods, including interim periods within those fiscal years, beginning after December 15, 2016. Early adoption is permitted subject to certain requirements, and the method of application (i.e., retrospective, modified retrospective or prospective) depends on the transaction area that is being amended. We do not expect the adoption of ASU 2016-09 to have a material effect on our financial position, results of operations or cash flows.
In January 2017, the FASB issued ASU 2017-01, "Business Combinations (Topic 805) - Clarifying the Definition of a Business." ASU 2017-01 clarifies the definition of a business with the objective of adding guidance to assist entities with evaluating whether transactions should be accounted for as acquisitions (or disposals) of assets or businesses. ASU 2017-01 is effective for public companies' annual periods, including interim periods within those fiscal years, beginning after December 15, 2017 and should be applied prospectively on or after the effective date. We do not expect the adoption of ASU 2017-01 to have a material effect on our financial position, results of operations or cash flows.
In January 2017, the FASB issued ASU 2017-04, "Intangibles - Goodwill and Other (Topic 350) - Simplifying the Test for Goodwill Impairment." ASU 2017-04 simplifies the subsequent measurement of goodwill by eliminating Step 2 from the goodwill impairment test, which required an entity to determine the fair value of its assets and liabilities at the impairment testing date. ASU 2017-04 is effective for public companies' annual periods, including interim periods within those fiscal years, beginning after December 15, 2019. Early adoption is permitted. We do not expect the adoption of ASU 2017-04 to have a material effect on our financial position, results of operations or cash flows.
75
Note 19. Selected Quarterly Financial Data (Unaudited)
For the Quarter Ended | |||||||||||||||
(Dollars in thousands, except per share amounts) | March 31, 2016 | June 30, 2016 | Sept. 30, 2016 | Dec. 31, 2016 | |||||||||||
Total revenues | $ | 50,661 | $ | 51,017 | $ | 50,721 | $ | 51,695 | |||||||
Gross profit | 32,226 | 33,673 | 34,643 | 36,140 | |||||||||||
Net income (loss) | (7,409 | ) | (6,725 | ) | (745 | ) | 915 | ||||||||
Basic net income (loss) per share | (0.10 | ) | (0.09 | ) | (0.01 | ) | 0.01 | ||||||||
Diluted net income (loss) per share | (0.10 | ) | (0.09 | ) | (0.01 | ) | 0.01 | ||||||||
For the Quarter Ended | |||||||||||||||
(Dollars in thousands, except per share amounts) | March 31, 2015 | June 30, 2015 | Sept. 30, 2015 | Dec. 31, 2015 | |||||||||||
Total revenues | $ | 47,126 | $ | 48,611 | $ | 49,905 | $ | 50,151 | |||||||
Gross profit | 29,900 | 30,460 | 31,740 | 31,499 | |||||||||||
Net loss | (8,165 | ) | (9,310 | ) | (8,829 | ) | (8,549 | ) | |||||||
Basic net loss per share | (0.11 | ) | (0.12 | ) | (0.12 | ) | (0.11 | ) | |||||||
Diluted net loss per share | (0.11 | ) | (0.12 | ) | (0.12 | ) | (0.11 | ) | |||||||
Basic and diluted net income (loss) per share for the four quarters of each year in the table above may not sum to the total for each year because of the different number of weighted-average shares outstanding in each respective period.
ITEM 9. CHANGES IN AND DISAGREEMENTS WITH ACCOUNTANTS ON ACCOUNTING AND FINANCIAL DISCLOSURE
None.
ITEM 9A. CONTROLS AND PROCEDURES
Evaluation of Disclosure Controls and Procedures
Our management is responsible for establishing and maintaining adequate internal control over financial reporting. Management, with the participation of our chief executive officer and our chief financial officer, evaluated the effectiveness of our disclosure controls and procedures as of December 31, 2016. The term “disclosure controls and procedures,” as defined in Rules 13a-15(e) and 15d-15(e) under the Exchange Act, means controls and other procedures of a company that are designed to ensure that information required to be disclosed by a company in the reports that it files or submits under the Exchange Act is recorded, processed, summarized and reported, within the time periods specified in the SEC’s rules and forms. Disclosure controls and procedures include, without limitation, controls and procedures designed to ensure that information required to be disclosed by a company in the reports that it files or submits under the Exchange Act is accumulated and communicated to the company’s management, including its principal executive and principal financial officers, as appropriate to allow timely decisions regarding required disclosure. Management recognizes that any controls and procedures, no matter how well designed and operated, can provide only reasonable assurance of achieving their objectives and management necessarily applies its judgment in evaluating the cost-benefit relationship of possible controls and procedures. Based on the evaluation of our disclosure controls and procedures as of December 31, 2016, our chief executive officer and chief financial officer concluded that, as of such date, our disclosure controls and procedures were effective at the reasonable assurance level.
Report of Management on Internal Control over Financial Reporting
Our management is responsible for establishing and maintaining adequate internal control over financial reporting as defined in Rule 13a-15(f) and Rule 15d-15(f) of the Exchange Act. Our internal control system was designed to provide reasonable assurance to our management and Board of Directors regarding the preparation and fair presentation of published financial statements for external purposes in accordance with generally accepted accounting principles. Our internal control over financial reporting includes those policies and procedures that:
(i) | pertain to the maintenance of records that, in reasonable detail, accurately and fairly reflect the transactions and dispositions of our assets; |
(ii) | provide reasonable assurance that transactions are recorded as necessary to permit preparation of financial statements in accordance with generally accepted accounting principles, and that our receipts and expenditures are being made only in accordance with authorizations of our management and directors; and |
76
(iii) | provide reasonable assurance regarding prevention or timely detection of unauthorized acquisition, use or disposition of our assets that could have a material effect on the financial statements. |
The effectiveness of any system of internal control over financial reporting, including ours, is subject to inherent limitations, including the exercise of judgment in designing, implementing, operating, and evaluating the controls and procedures, and the inability to eliminate misconduct completely. Accordingly, any system of internal control over financial reporting, including ours, no matter how well designed and operated, can only provide reasonable, not absolute, assurances. Also, projections of any evaluation of effectiveness to future periods are subject to the risk that controls may become inadequate because of changes in conditions or that the degree of compliance with the policies or procedures may deteriorate. Our management assessed the effectiveness of our internal control over financial reporting as of December 31, 2016. In making this assessment, our management used the criteria set forth by the Committee of Sponsoring Organizations of the Treadway Commission (COSO) in Internal Control — Integrated Framework (2013).
Based on this evaluation, management concluded that our internal control over financial reporting was effective as of December 31, 2016.
KPMG LLP, an independent registered public accounting firm, has audited the effectiveness of our internal control over financial reporting as of December 31, 2016, as stated in their report, which is included herein.
Changes in Internal Control over Financial Reporting
There were no changes in our internal control over financial reporting identified in connection with the evaluation required by Rule 13a-15(d) and 15d-15(d) of the Exchange Act that occurred during the year ended December 31, 2016 that have materially affected, or are reasonably likely to materially affect, our internal control over financial reporting.
77
Report of Independent Registered Public Accounting Firm
The Board of Directors and Stockholders
Jive Software, Inc.:
We have audited Jive Software, Inc.’s internal control over financial reporting as of December 31, 2016, based on criteria established in Internal Control – Integrated Framework (2013) issued by the Committee of Sponsoring Organizations of the Treadway Commission (COSO). Jive Software, Inc.’s management is responsible for maintaining effective internal control over financial reporting and for its assessment of the effectiveness of internal control over financial reporting, included in the accompanying Report of Management on Internal Control over Financial Reporting. Our responsibility is to express an opinion on the Company’s internal control over financial reporting based on our audit.
We conducted our audit in accordance with the standards of the Public Company Accounting Oversight Board (United States). Those standards require that we plan and perform the audit to obtain reasonable assurance about whether effective internal control over financial reporting was maintained in all material respects. Our audit included obtaining an understanding of internal control over financial reporting, assessing the risk that a material weakness exists, and testing and evaluating the design and operating effectiveness of internal control based on the assessed risk. Our audit also included performing such other procedures as we considered necessary in the circumstances. We believe that our audit provides a reasonable basis for our opinion.
A company’s internal control over financial reporting is a process designed to provide reasonable assurance regarding the reliability of financial reporting and the preparation of financial statements for external purposes in accordance with generally accepted accounting principles. A company’s internal control over financial reporting includes those policies and procedures that (1) pertain to the maintenance of records that, in reasonable detail, accurately and fairly reflect the transactions and dispositions of the assets of the company; (2) provide reasonable assurance that transactions are recorded as necessary to permit preparation of financial statements in accordance with generally accepted accounting principles, and that receipts and expenditures of the company are being made only in accordance with authorizations of management and directors of the company; and (3) provide reasonable assurance regarding prevention or timely detection of unauthorized acquisition, use, or disposition of the company’s assets that could have a material effect on the financial statements.
Because of its inherent limitations, internal control over financial reporting may not prevent or detect misstatements. Also, projections of any evaluation of effectiveness to future periods are subject to the risk that controls may become inadequate because of changes in conditions, or that the degree of compliance with the policies or procedures may deteriorate.
In our opinion, Jive Software, Inc. maintained, in all material respects, effective internal control over financial reporting as of December 31, 2016, based on criteria established in Internal Control – Integrated Framework (2013) issued by the Committee of Sponsoring Organizations of the Treadway Commission (COSO).
We also have audited, in accordance with the standards of the Public Company Accounting Oversight Board (United States), the consolidated balance sheets of Jive Software, Inc. and subsidiaries as of December 31, 2016 and 2015, and the related consolidated statements of operations, comprehensive loss, stockholders’ equity, and cash flows for each of the years in the three-year period ended December 31, 2016, and our report dated February 28, 2017 expressed an unqualified opinion on those consolidated financial statements.
/s/ KPMG LLP
Portland, Oregon
February 28, 2017
ITEM 9B. OTHER INFORMATION
On February 26, 2017, our Compensation Committee took action to increase Ofer Ben-David’s base salary to $400,000, with such change effective April 1, 2017. This change was made after consideration of market data, Mr. Ben-David’s performance in his role, and the strategic importance of our engineering operations.
78
PART III
ITEM 10. DIRECTORS, EXECUTIVE OFFICERS AND CORPORATE GOVERNANCE
The information called for by this item is incorporated by reference to our Proxy Statement for our 2017 Annual Meeting of Stockholders (the “2017 Proxy Statement”) anticipated to be filed with the SEC, within 120 days after the end of the fiscal year ended December 31, 2016, pursuant to Regulation 14A under the Exchange Act. See “Election of Board of Directors,” “Meetings of the Board of Directors,” “Committees of the Board of Directors,” “Executive Officers and Key Employees” and “Section 16(a) Beneficial Ownership Reporting Compliance.”
On November 10, 2011 we adopted a code of business conduct and ethics that applies to all of our employees, including our executive officers and directors, and those employees responsible for financial reporting. The code of business conduct and ethics is available on our website at jivesoftware.com. We expect that, to the extent required by law, any amendments to the code, or any waivers of its requirements, will be disclosed on our website. We intend to disclose any waiver to the provisions of the code of business conduct and ethics that applies specifically to directors or executive officers by filing such information on a Current Report on Form 8-K with the SEC, to the extent such filing is required by the NASDAQ Global Select Market’s listing requirements; otherwise, we will disclose such waiver by posting such information on our website.
ITEM 11. EXECUTIVE COMPENSATION
The information called for by this item is incorporated by reference to our 2017 Proxy Statement. See “Executive Compensation,” “Non-Employee Director Compensation” and “Compensation Committee Report.”
ITEM 12. | SECURITY OWNERSHIP OF CERTAIN BENEFICIAL OWNERS AND MANAGEMENT AND RELATED STOCKHOLDER MATTERS |
The information called for by this item is incorporated by reference to our 2017 Proxy Statement. See “Security Ownership of Certain Beneficial Owners and Management” and “Equity Compensation Plan Information.”
ITEM 13. | CERTAIN RELATIONSHIPS AND RELATED TRANSACTIONS, AND DIRECTOR INDEPENDENCE |
The information called for by this item is incorporated by reference to our 2017 Proxy Statement. See Election of Board of Directors,” “Committees of the Board of Directors” and “Director Independence.”
ITEM 14. PRINCIPAL ACCOUNTANT FEES AND SERVICES
The information called for by this item is incorporated by reference to our 2017 Proxy Statement. See “Ratification of Appointment of Independent Registered Public Accounting Firm.”
79
PART IV
ITEM 15. EXHIBITS AND FINANCIAL STATEMENT SCHEDULES
Financial Statements and Schedules
The Consolidated Financial Statements, together with the report thereon of KPMG LLP, are included on the pages indicated below:
Page | |
Financial statement schedules have been omitted because they are not applicable or the required information is shown in the financial statements or notes thereto.
Exhibits
The documents listed in the Exhibit Index of this Annual Report on Form 10-K are incorporated by reference or are filed with this Annual Report on Form 10-K, in each case as indicated therein (numbered in accordance with Item 601 of Regulation S-K).
ITEM 16. FORM 10-K SUMMARY
None.
80
SIGNATURES
Pursuant to the requirements of Section 13 or 15(d) of the Securities Exchange Act of 1934, the Registrant has duly caused this report to be signed on its behalf by the undersigned, thereunto duly authorized.
Date: | February 28, 2017 | JIVE SOFTWARE, INC. | |
By: | /s/ Elisa Steele | ||
Elisa Steele | |||
Chief Executive Officer and Director | |||
Pursuant to the requirements of the Securities Exchange Act of 1934, this report has been signed below by the following persons on behalf of the Registrant and in the capacities indicated on February 28, 2017.
Principal Executive Officer and Director: | |||
By: | /s/ Elisa Steele | ||
Elisa Steele | |||
Chief Executive Officer and Director | |||
Principal Financial and Accounting Officer: | |||
By: | /s/ Bryan J. LeBlanc | ||
Bryan J. LeBlanc | |||
EVP and Chief Financial Officer | |||
Directors: | |||
By: | /s/ Margaret A. Breya | ||
Margaret A. Breya, Director | |||
By: | /s/ Stephen R. Darcy | ||
Stephen R. Darcy, Director | |||
By: | /s/ Philip Koen | ||
Philip Koen, Director | |||
By: | /s/ Tom J. Reilly | ||
Tom J. Reilly, Director | |||
By: | /s/ Charles J. Robel | ||
Charles J. Robel, Director | |||
By: | /s/ Gabrielle Toledano | ||
Gabrielle Toledano, Director | |||
By: | /s/ Balaji Yelamanchili | ||
Balaji Yelamanchili, Director | |||
By: | /s/ Anthony Zingale | ||
Anthony Zingale, Chairman | |||
81
INDEX TO EXHIBITS
Exhibit Number | Description | |
3.1 | Amended and Restated Certificate of Incorporation. (1) (Exhibit 3.2) | |
3.2 | Amended and Restated Bylaws. (1) (Exhibit 3.4) | |
4.1 | Form of Common Stock Certificate. (1) (Exhibit 4.1) | |
4.2 | Third Amended and Restated Investor Rights Agreement, by and among Jive Software, Inc. and the investors party thereto, dated March 28, 2011. (1) (Exhibit 4.2) | |
10.1* | 2007 Stock Incentive Plan, as amended, and Form of Stock Option Agreement under 2007 Stock Incentive Plan. (1) (Exhibit 10.1) | |
10.2* | 2002 Stock Incentive Plan, as amended, and Form of Stock Option Agreement under 2002 Stock Incentive Plan. (1) (Exhibit 10.2) | |
10.3* | 2011 Equity Incentive Plan and Form of Stock Option Agreement under 2011 Equity Incentive Plan. (1) (Exhibit 10.3) | |
10.4* | Form of Indemnification Agreement by and between Jive Software, Inc. and each of its directors and executive officers. (1) (Exhibit 10.4) | |
10.5* | Offer Letter, between Jive Software, Inc. and Bryan LeBlanc, dated June 6, 2008. (1) (Exhibit 10.6) | |
10.6* | Offer Letter, between Jive Software, Inc. and Ofer Ben-David, dated November 19, 2014. (8) (Exhibit 10.6) | |
10.7 | Lease Agreement between Jive Software, Inc. and Harsch Investment Properties, LLC, dated February 25, 2008. (1) (Exhibit 10.12) | |
10.8 | First Amendment to the Lease Agreement between Jive Software, Inc. and Harsch Investment Properties, dated October 1, 2010. (1) (Exhibit 10.13) | |
10.9 | Second Amendment to the Lease Agreement between Jive Software, Inc. and Harsch Investment Properties, dated October 31, 2012. (4) (Exhibit 10.14) | |
10.10 | Lease Agreement between Jive Software, Inc. and TTC Partners III, LLC, dated May 13, 2010. (1) (Exhibit 10.14) | |
10.11 | Amendment to Lease Agreement between Jive Software, Inc. and TTC Partners III, LLC, dated October 28, 2016 | |
10.12 | Lease Agreement between Jive Software, Inc. and Water Tower Fee Owner, LLC, dated October 14, 2016 | |
10.13 | Second Amended Loan Agreement with Silicon Valley Bank dated May 23, 2012. (3) (Exhibit 10.1) | |
10.14 | First Loan Modification Agreement between Jive Software, Inc. and Silicon Valley Bank, dated April 26, 2013. (5) (Exhibit 10.1) | |
10.15 | Second Loan Modification Agreement between Jive Software, Inc. and Silicon Valley Bank, dated February 18, 2014. (6) (Exhibit 10.1) | |
10.16 | Third Loan Modification Agreement between Jive Software, Inc. and Silicon Valley Bank, dated March 31, 2015. (9) (Exhibit 10.1) | |
10.17 | Fourth Loan Modification Agreement between Jive Software, Inc. and Silicon Valley Bank, dated March 29, 2016. (12) (Exhibit 10.1) | |
10.18* | Form of Change of Control and Retention Agreement for Bryan LeBlanc, Ofer Ben-David, Jeffrey Lautenbach and David Puglia. (1) (Exhibit 10.17) | |
10.19* | Transition Agreement dated November 3, 2014, by and between Jive Software, Inc. and Anthony Zingale. (7) (Exhibit 10.2) | |
10.20* | 2012 Executive Bonus Plan. (2) (Exhibit 10.1) | |
10.21* | Amended and Restated Offer Letter, dated February 9, 2015, by and between Jive Software, Inc. and Elisa Steele. (8) (Exhibit 10.17) | |
10.22* | Amended and Restated Change of Control and Retention Agreement, dated February 9, 2015, by and between Jive Software, Inc. and Elisa Steele. (8) (Exhibit 10.18) | |
E-1
Exhibit Number | Description | |
10.23* | 2015 Employee Stock Purchase Plan. (10) (Exhibit 4.5) | |
10.24* | Offer letter between Jive Software, Inc. and Jeffrey Lautenbach, dated August 3, 2015. (11) (Exhibit 10.1) | |
10.25* | Offer letter between Jive Software, Inc. and David Puglia, dated September 9, 2015. (11) (Exhibit 10.2) | |
21.1 | List of Subsidiaries. | |
23.1 | Consent of KPMG LLP, independent registered public accounting firm. | |
31.1 | Certification of Chief Executive Officer pursuant to Rule 13a-14(a) or Rule 15d-14(a) of the Securities Exchange Act of 1934, as adopted pursuant to Section 302 of The Sarbanes-Oxley Act of 2002. | |
31.2 | Certification of Chief Financial Officer pursuant to Rule 13a-14(a) or Rule 15d-14(a) of the Securities Exchange Act of 1934, as adopted pursuant to Section 302 of The Sarbanes-Oxley Act of 2002. | |
32.1** | Certification of Chief Executive Officer pursuant to Rule 13a-14(b) or Rule 15d-14(b) of the Securities Exchange Act of 1934 and 18 U.S.C. Section 1350 as adopted pursuant to Section 906 of The Sarbanes-Oxley Act of 2002. | |
32.2** | Certification of Chief Financial Officer pursuant to Rule 13a-14(b) or Rule 15d-14(b) of the Securities Exchange Act of 1934 and 18 U.S.C. Section 1350 as adopted pursuant to Section 906 of The Sarbanes-Oxley Act of 2002. | |
101.INS | XBRL Instance Document. | |
101.SCH | XBRL Taxonomy Extension Schema Document. | |
101.CAL | XBRL Taxonomy Extension Calculation Linkbase Document. | |
101.DEF | Taxonomy Extension Definition Linkbase Document. | |
101.LAB | XBRL Taxonomy Extension Label Linkbase Document. | |
101.PRE | XBRL Taxonomy Extension Presentation Linkbase Document. | |
* Management contract, compensatory plan or arrangement.
** | The certifications attached as Exhibit 32.1 and 32.2 that accompany this Annual Report on Form 10-K are not deemed filed with the Securities and Exchange Commission and are not to be incorporated by reference into any filing of Jive Software, Inc. under the Securities Act of 1933, as amended, or the Securities Exchange Act of 1934, as amended, whether made before or after the date of this Annual Report on Form 10-K, irrespective of any general incorporation language contained in such filing. |
(1) | Incorporated by reference to Form S-1 file number 333-176483 as declared effective by the Securities and Exchange Commission on December 12, 2011. The number given in parentheses indicates the corresponding exhibit number in such Form S-1. |
(2) | Incorporated by reference to Form 8-K as filed with the Securities and Exchange Commission on March 2, 2012. |
(3) | Incorporated by reference to Form 8-K as filed with the Securities and Exchange Commission on May 25, 2012. |
(4) | Incorporated by reference to Form 10-Q as filed with the Securities and Exchange Commission on November 7, 2012. |
(5) | Incorporated by reference to Form 10-Q as filed with the Securities and Exchange Commission on May 1, 2013. |
(6) | Incorporated by reference to Form 8-K as filed with the Securities and Exchange Commission on February 19, 2014. |
(7) | Incorporated by reference to Form 10-Q as filed with the Securities and Exchange Commission on November 6, 2014. |
(8) | Incorporated by reference to Form 10-K as filed with the Securities and Exchange Commission on February 27, 2015. |
(9) | Incorporated by reference to Form 10-Q as filed with the Securities and Exchange Commission on May 6, 2015. |
(10) | Incorporated by reference to Form S-8 as filed with the Securities and Exchange Commission on June 16, 2015. |
(11) | Incorporated by reference to Form 10-Q as filed with the Securities and Exchange Commission on November 9, 2015. |
(12) | Incorporated by reference to Form 10-Q as filed with the Securities and Exchange Commission on May 10, 2016. |
E-2