Attached files
| file | filename |
|---|---|
| EX-99.1 - EX-99.1 - IBERIABANK CORP | d252141dex991.htm |
| 8-K - 8-K - IBERIABANK CORP | d252141d8k.htm |

EXHIBIT 99.2
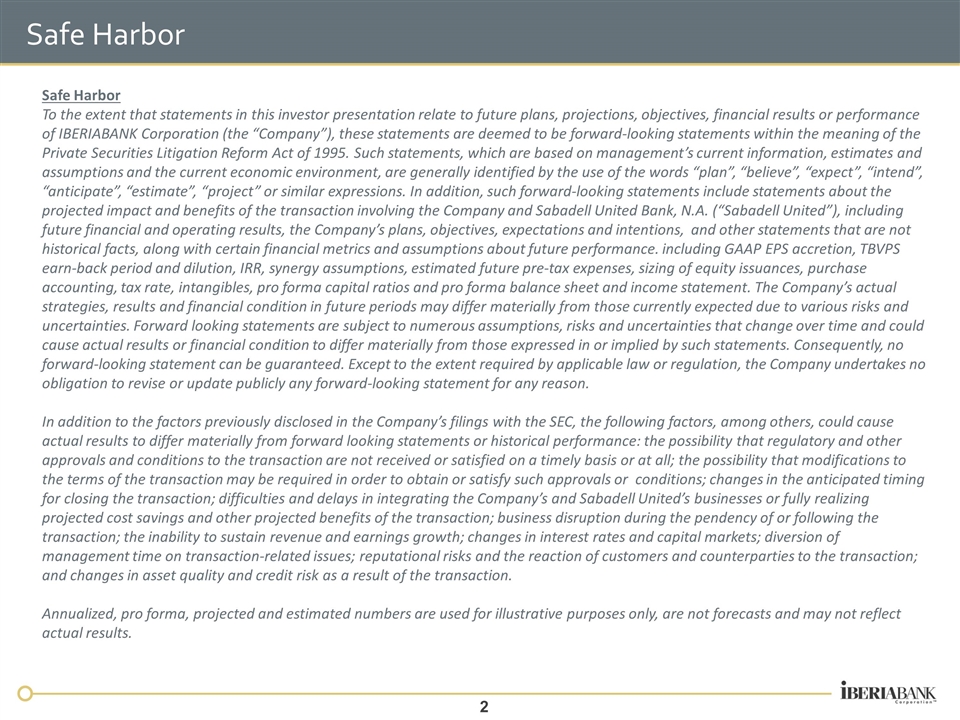
Safe Harbor Safe Harbor To the extent that statements in this investor presentation relate to future plans, projections, objectives, financial results or performance of IBERIABANK Corporation (the “Company”), these statements are deemed to be forward-looking statements within the meaning of the Private Securities Litigation Reform Act of 1995. Such statements, which are based on management’s current information, estimates and assumptions and the current economic environment, are generally identified by the use of the words “plan”, “believe”, “expect”, “intend”, “anticipate”, “estimate”, “project” or similar expressions. In addition, such forward-looking statements include statements about the projected impact and benefits of the transaction involving the Company and Sabadell United Bank, N.A. (“Sabadell United”), including future financial and operating results, the Company’s plans, objectives, expectations and intentions, and other statements that are not historical facts, along with certain financial metrics and assumptions about future performance. including GAAP EPS accretion, TBVPS earn-back period and dilution, IRR, synergy assumptions, estimated future pre-tax expenses, sizing of equity issuances, purchase accounting, tax rate, intangibles, pro forma capital ratios and pro forma balance sheet and income statement. The Company’s actual strategies, results and financial condition in future periods may differ materially from those currently expected due to various risks and uncertainties. Forward looking statements are subject to numerous assumptions, risks and uncertainties that change over time and could cause actual results or financial condition to differ materially from those expressed in or implied by such statements. Consequently, no forward-looking statement can be guaranteed. Except to the extent required by applicable law or regulation, the Company undertakes no obligation to revise or update publicly any forward-looking statement for any reason. In addition to the factors previously disclosed in the Company’s filings with the SEC, the following factors, among others, could cause actual results to differ materially from forward looking statements or historical performance: the possibility that regulatory and other approvals and conditions to the transaction are not received or satisfied on a timely basis or at all; the possibility that modifications to the terms of the transaction may be required in order to obtain or satisfy such approvals or conditions; changes in the anticipated timing for closing the transaction; difficulties and delays in integrating the Company’s and Sabadell United’s businesses or fully realizing projected cost savings and other projected benefits of the transaction; business disruption during the pendency of or following the transaction; the inability to sustain revenue and earnings growth; changes in interest rates and capital markets; diversion of management time on transaction-related issues; reputational risks and the reaction of customers and counterparties to the transaction; and changes in asset quality and credit risk as a result of the transaction. Annualized, pro forma, projected and estimated numbers are used for illustrative purposes only, are not forecasts and may not reflect actual results.
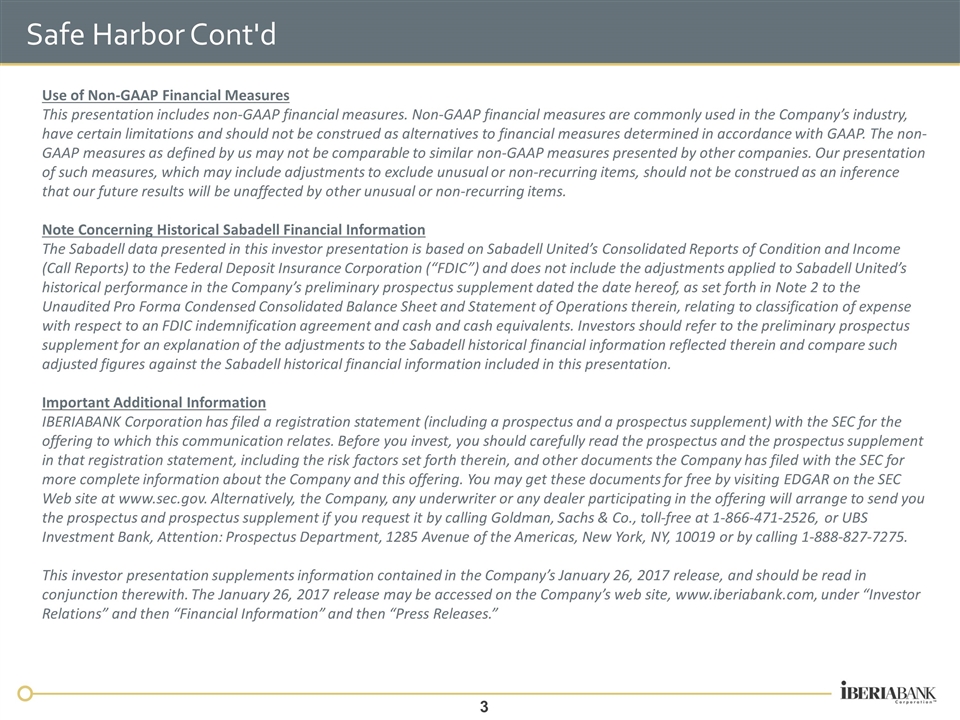
Safe Harbor Cont'd Use of Non-GAAP Financial Measures This presentation includes non-GAAP financial measures. Non-GAAP financial measures are commonly used in the Company’s industry, have certain limitations and should not be construed as alternatives to financial measures determined in accordance with GAAP. The non-GAAP measures as defined by us may not be comparable to similar non-GAAP measures presented by other companies. Our presentation of such measures, which may include adjustments to exclude unusual or non-recurring items, should not be construed as an inference that our future results will be unaffected by other unusual or non-recurring items. Note Concerning Historical Sabadell Financial Information The Sabadell data presented in this investor presentation is based on Sabadell United’s Consolidated Reports of Condition and Income (Call Reports) to the Federal Deposit Insurance Corporation (“FDIC”) and does not include the adjustments applied to Sabadell United’s historical performance in the Company’s preliminary prospectus supplement dated the date hereof, as set forth in Note 2 to the Unaudited Pro Forma Condensed Consolidated Balance Sheet and Statement of Operations therein, relating to classification of expense with respect to an FDIC indemnification agreement and cash and cash equivalents. Investors should refer to the preliminary prospectus supplement for an explanation of the adjustments to the Sabadell historical financial information reflected therein and compare such adjusted figures against the Sabadell historical financial information included in this presentation. Important Additional Information IBERIABANK Corporation has filed a registration statement (including a prospectus and a prospectus supplement) with the SEC for the offering to which this communication relates. Before you invest, you should carefully read the prospectus and the prospectus supplement in that registration statement, including the risk factors set forth therein, and other documents the Company has filed with the SEC for more complete information about the Company and this offering. You may get these documents for free by visiting EDGAR on the SEC Web site at www.sec.gov. Alternatively, the Company, any underwriter or any dealer participating in the offering will arrange to send you the prospectus and prospectus supplement if you request it by calling Goldman, Sachs & Co., toll-free at 1-866-471-2526, or UBS Investment Bank, Attention: Prospectus Department, 1285 Avenue of the Americas, New York, NY, 10019 or by calling 1-888-827-7275. This investor presentation supplements information contained in the Company’s January 26, 2017 release, and should be read in conjunction therewith. The January 26, 2017 release may be accessed on the Company’s web site, www.iberiabank.com, under “Investor Relations” and then “Financial Information” and then “Press Releases.”
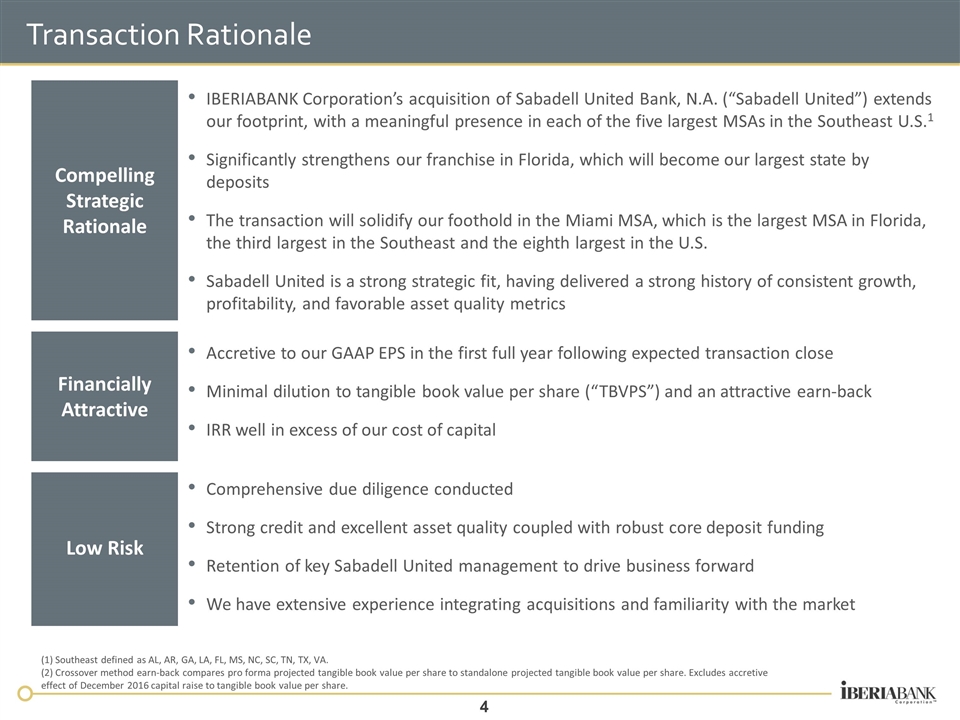
Transaction Rationale IBERIABANK Corporation’s acquisition of Sabadell United Bank, N.A. (“Sabadell United”) extends our footprint, with a meaningful presence in each of the five largest MSAs in the Southeast U.S.1 Significantly strengthens our franchise in Florida, which will become our largest state by deposits The transaction will solidify our foothold in the Miami MSA, which is the largest MSA in Florida, the third largest in the Southeast and the eighth largest in the U.S. Sabadell United is a strong strategic fit, having delivered a strong history of consistent growth, profitability, and favorable asset quality metrics Compelling Strategic Rationale Financially Attractive Accretive to our GAAP EPS in the first full year following expected transaction close Minimal dilution to tangible book value per share (“TBVPS”) and an attractive earn-back IRR well in excess of our cost of capital Low Risk Comprehensive due diligence conducted Strong credit and excellent asset quality coupled with robust core deposit funding Retention of key Sabadell United management to drive business forward We have extensive experience integrating acquisitions and familiarity with the market (1) Southeast defined as AL, AR, GA, LA, FL, MS, NC, SC, TN, TX, VA. (2) Crossover method earn-back compares pro forma projected tangible book value per share to standalone projected tangible book value per share. Excludes accretive effect of December 2016 capital raise to tangible book value per share.
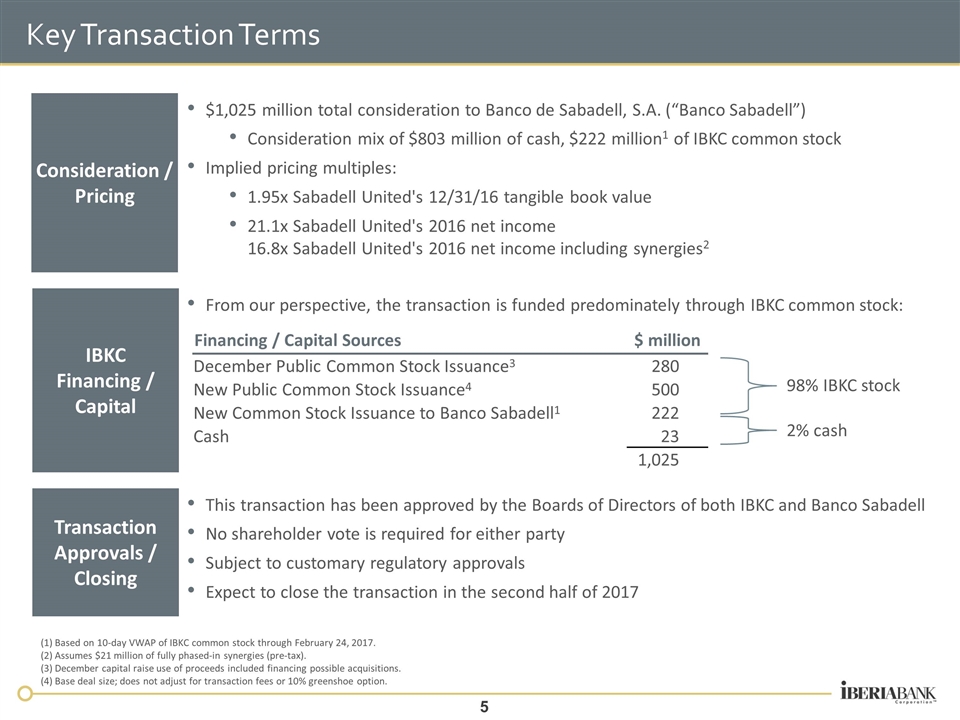
Key Transaction Terms $1,025 million total consideration to Banco de Sabadell, S.A. (“Banco Sabadell”) Consideration mix of $803 million of cash, $222 million1 of IBKC common stock Implied pricing multiples: 1.95x Sabadell United's 12/31/16 tangible book value 21.1x Sabadell United's 2016 net income 16.8x Sabadell United's 2016 net income including synergies2 Consideration / Pricing IBKC Financing / Capital From our perspective, the transaction is funded predominately through IBKC common stock: Transaction Approvals / Closing This transaction has been approved by the Boards of Directors of both IBKC and Banco Sabadell No shareholder vote is required for either party Subject to customary regulatory approvals Expect to close the transaction in the second half of 2017 (1) Based on 10-day VWAP of IBKC common stock through February 24, 2017. (2) Assumes $21 million of fully phased-in synergies (pre-tax). (3) December capital raise use of proceeds included financing possible acquisitions. (4) Base deal size; does not adjust for transaction fees or 10% greenshoe option. Financing / Capital Sources $ million December Public Common Stock Issuance3 280 New Public Common Stock Issuance4 500 New Common Stock Issuance to Banco Sabadell1 222 Cash 23 1,025 98% IBKC stock 2% cash
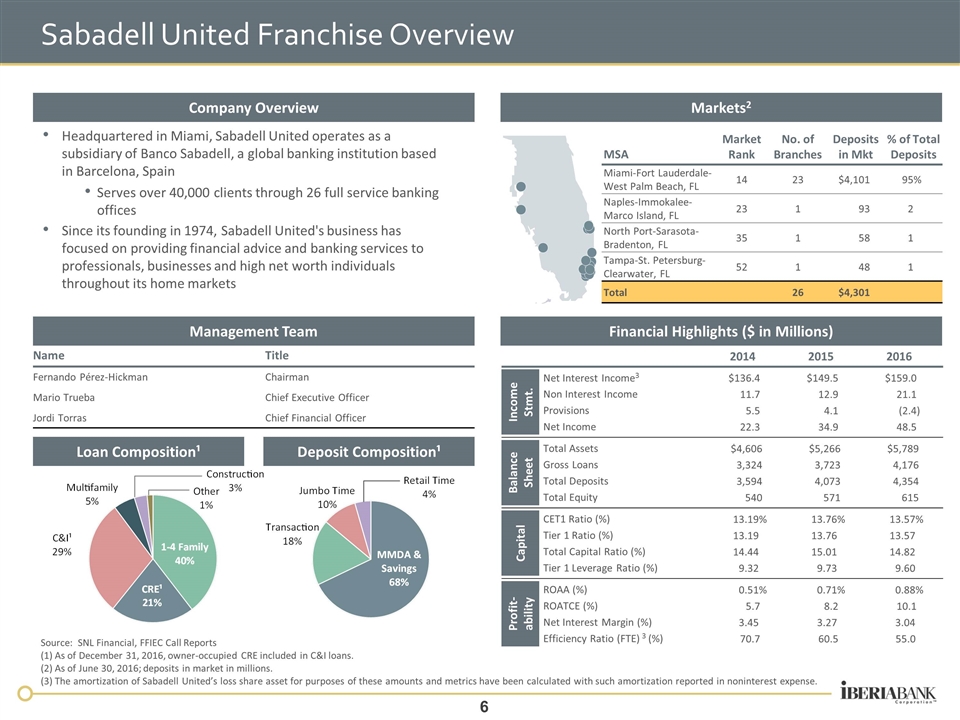
Sabadell United Franchise Overview Company Overview Markets2 Headquartered in Miami, Sabadell United operates as a subsidiary of Banco Sabadell, a global banking institution based in Barcelona, Spain Serves over 40,000 clients through 26 full service banking offices Since its founding in 1974, Sabadell United's business has focused on providing financial advice and banking services to professionals, businesses and high net worth individuals throughout its home markets Management Team Name Title Fernando Pérez-Hickman Chairman Mario Trueba Chief Executive Officer Jordi Torras Chief Financial Officer Financial Highlights ($ in Millions) Loan Composition¹ Deposit Composition¹ Source: SNL Financial, FFIEC Call Reports (1) As of December 31, 2016, owner-occupied CRE included in C&I loans. (2) As of June 30, 2016; deposits in market in millions. (3) The amortization of Sabadell United’s loss share asset for purposes of these amounts and metrics have been calculated with such amortization reported in noninterest expense. MSA Market Rank No. of Branches Deposits in Mkt % of Total Deposits Miami-Fort Lauderdale-West Palm Beach, FL 14 23 $4,101 95% Naples-Immokalee-Marco Island, FL 23 1 93 2 North Port-Sarasota-Bradenton, FL 35 1 58 1 Tampa-St. Petersburg-Clearwater, FL 52 1 48 1 Total 26 $4,301 2014 2015 2016 Income Stmt. Net Interest Income3 $136.4 $149.5 $159.0 Non Interest Income 11.7 12.9 21.1 Provisions 5.5 4.1 (2.4) Net Income 22.3 34.9 48.5 Balance Sheet Total Assets $4,606 $5,266 $5,789 Gross Loans 3,324 3,723 4,176 Total Deposits 3,594 4,073 4,354 Total Equity 540 571 615 Capital CET1 Ratio (%) 13.19% 13.76% 13.57% Tier 1 Ratio (%) 13.19 13.76 13.57 Total Capital Ratio (%) 14.44 15.01 14.82 Tier 1 Leverage Ratio (%) 9.32 9.73 9.60 Profit-ability ROAA (%) 0.51% 0.71% 0.88% ROATCE (%) 5.7 8.2 10.1 Net Interest Margin (%) 3.45 3.27 3.04 Efficiency Ratio (FTE) 3 (%) 70.7 60.5 55.0
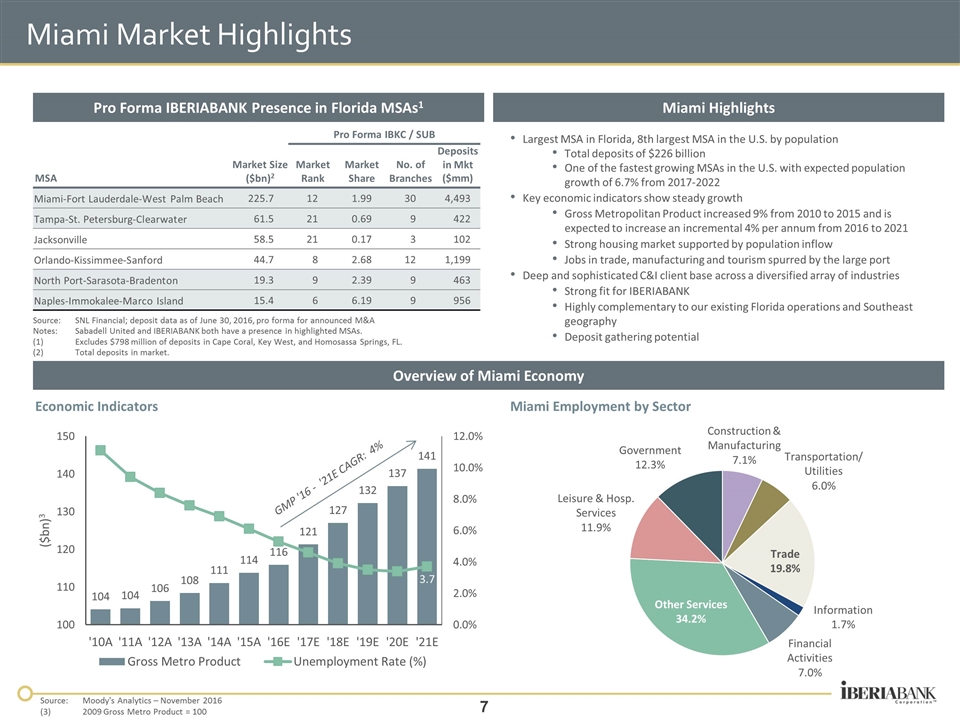
Miami Market Highlights Largest MSA in Florida, 8th largest MSA in the U.S. by population Total deposits of $226 billion One of the fastest growing MSAs in the U.S. with expected population growth of 6.7% from 2017-2022 Key economic indicators show steady growth Gross Metropolitan Product increased 9% from 2010 to 2015 and is expected to increase an incremental 4% per annum from 2016 to 2021 Strong housing market supported by population inflow Jobs in trade, manufacturing and tourism spurred by the large port Deep and sophisticated C&I client base across a diversified array of industries Strong fit for IBERIABANK Highly complementary to our existing Florida operations and Southeast geography Deposit gathering potential Pro Forma IBERIABANK Presence in Florida MSAs1 Overview of Miami Economy Miami Highlights GMP '16 - '21E CAGR: 4% Miami Employment by Sector Economic Indicators Source: Moody's Analytics – November 2016 (3)2009 Gross Metro Product = 100 MSA Market Size ($bn)2 Pro Forma IBKC / SUB Market Rank Market Share No. of Branches Deposits in Mkt ($mm) Miami-Fort Lauderdale-West Palm Beach 225.7 12 1.99 30 4,493 Tampa-St. Petersburg-Clearwater 61.5 21 0.69 9 422 Jacksonville 58.5 21 0.17 3 102 Orlando-Kissimmee-Sanford 44.7 8 2.68 12 1,199 North Port-Sarasota-Bradenton 19.3 9 2.39 9 463 Naples-Immokalee-Marco Island 15.4 6 6.19 9 956 Source:SNL Financial; deposit data as of June 30, 2016, pro forma for announced M&A Notes: Sabadell United and IBERIABANK both have a presence in highlighted MSAs. (1)Excludes $798 million of deposits in Cape Coral, Key West, and Homosassa Springs, FL. (2)Total deposits in market.
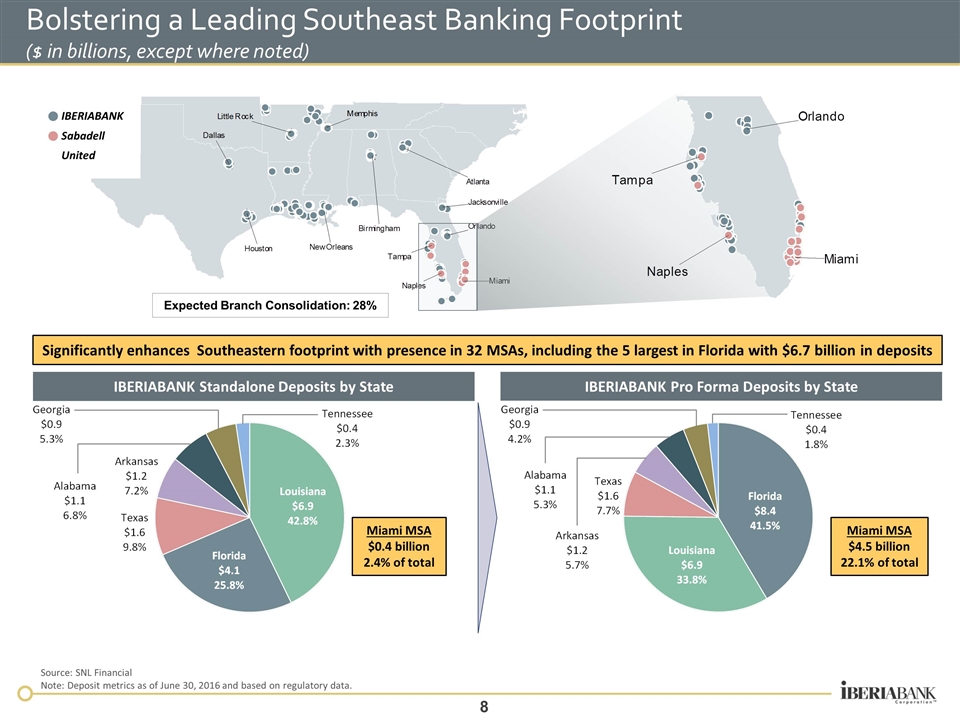
Bolstering a Leading Southeast Banking Footprint ($ in billions, except where noted) IBERIABANK Standalone Deposits by State IBERIABANK Pro Forma Deposits by State Source: SNL Financial Note: Deposit metrics as of June 30, 2016 and based on regulatory data. IBERIABANK Sabadell United Miami MSA $0.4 billion 2.4% of total Miami MSA $4.5 billion 22.1% of total Significantly enhances Southeastern footprint with presence in 32 MSAs, including the 5 largest in Florida with $6.7 billion in deposits Expected Branch Consolidation: 28%
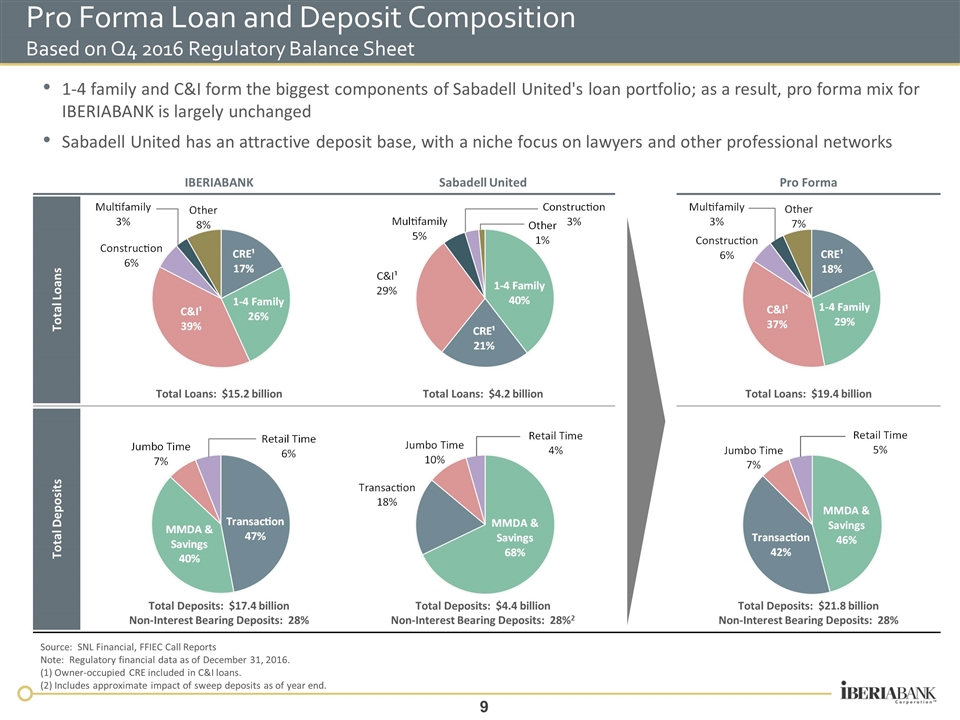
Pro Forma Loan and Deposit Composition Based on Q4 2016 Regulatory Balance Sheet Source: SNL Financial, FFIEC Call Reports Note: Regulatory financial data as of December 31, 2016. (1) Owner-occupied CRE included in C&I loans. (2) Includes approximate impact of sweep deposits as of year end. 1-4 family and C&I form the biggest components of Sabadell United's loan portfolio; as a result, pro forma mix for IBERIABANK is largely unchanged Sabadell United has an attractive deposit base, with a niche focus on lawyers and other professional networks IBERIABANK Sabadell United Pro Forma Total Loans Total Loans: $15.2 billion Total Loans: $4.2 billion Total Loans: $19.4 billion Total Deposits Total Deposits: $17.4 billion Non-Interest Bearing Deposits: 28% Total Deposits: $4.4 billion Non-Interest Bearing Deposits: 28%2 Total Deposits: $21.8 billion Non-Interest Bearing Deposits: 28%
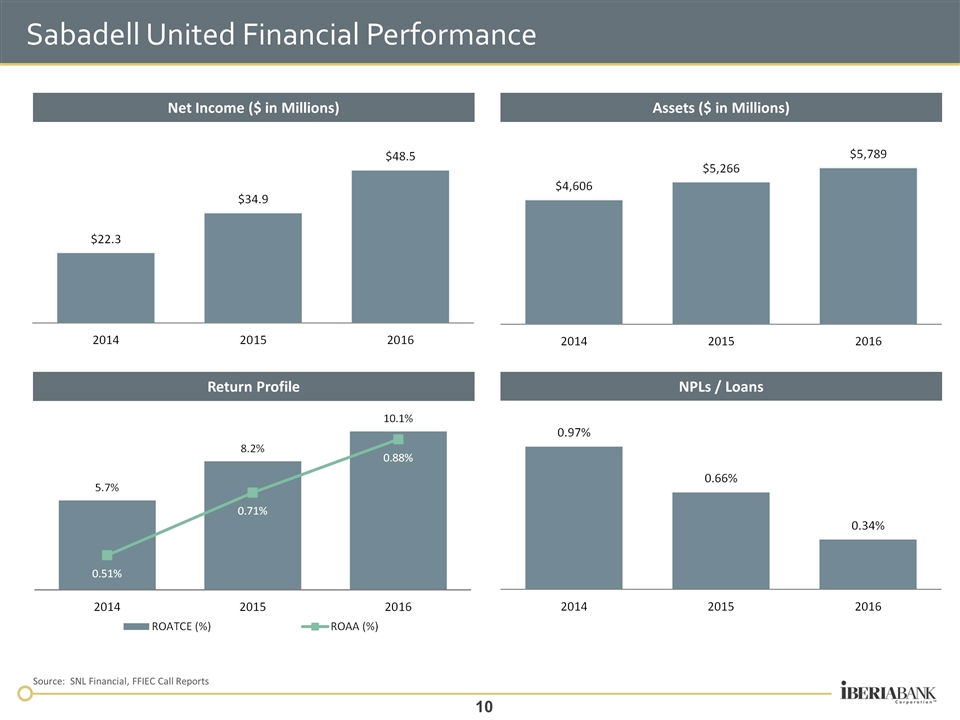
Net Income ($ in Millions) Assets ($ in Millions) Return Profile NPLs / Loans Sabadell United Financial Performance Source: SNL Financial, FFIEC Call Reports
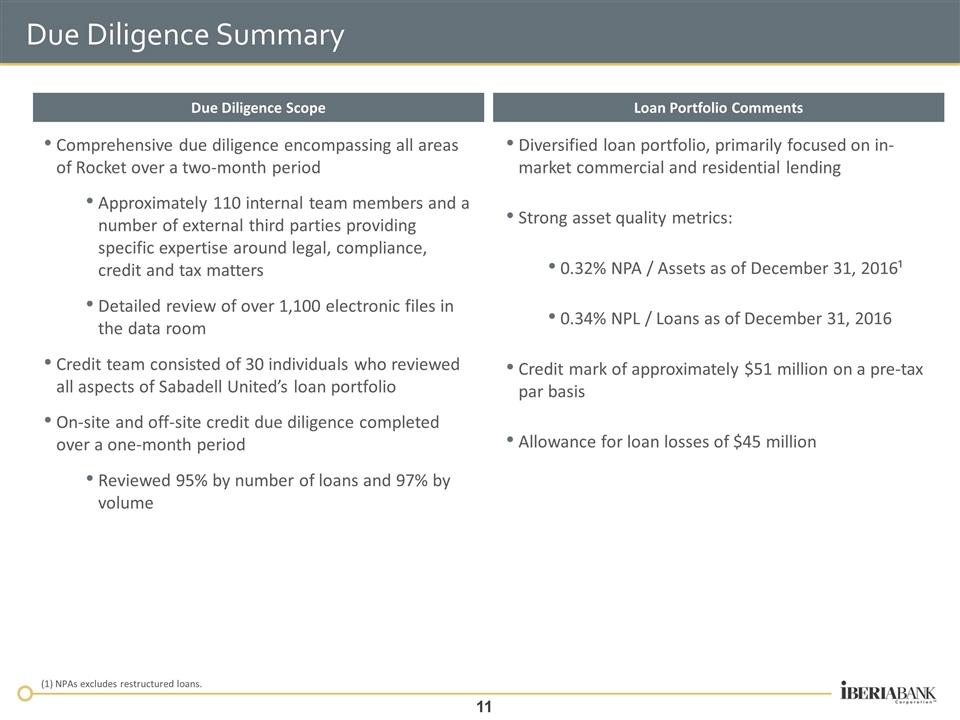
Due Diligence Summary Comprehensive due diligence encompassing all areas of Rocket over a two-month period Approximately 110 internal team members and a number of external third parties providing specific expertise around legal, compliance, credit and tax matters Detailed review of over 1,100 electronic files in the data room Credit team consisted of 30 individuals who reviewed all aspects of Sabadell United’s loan portfolio On-site and off-site credit due diligence completed over a one-month period Reviewed 95% by number of loans and 97% by volume Diversified loan portfolio, primarily focused on in-market commercial and residential lending Strong asset quality metrics: 0.32% NPA / Assets as of December 31, 2016¹ 0.34% NPL / Loans as of December 31, 2016 Credit mark of approximately $51 million on a pre-tax par basis Allowance for loan losses of $45 million Due Diligence Scope Loan Portfolio Comments (1) NPAs excludes restructured loans.
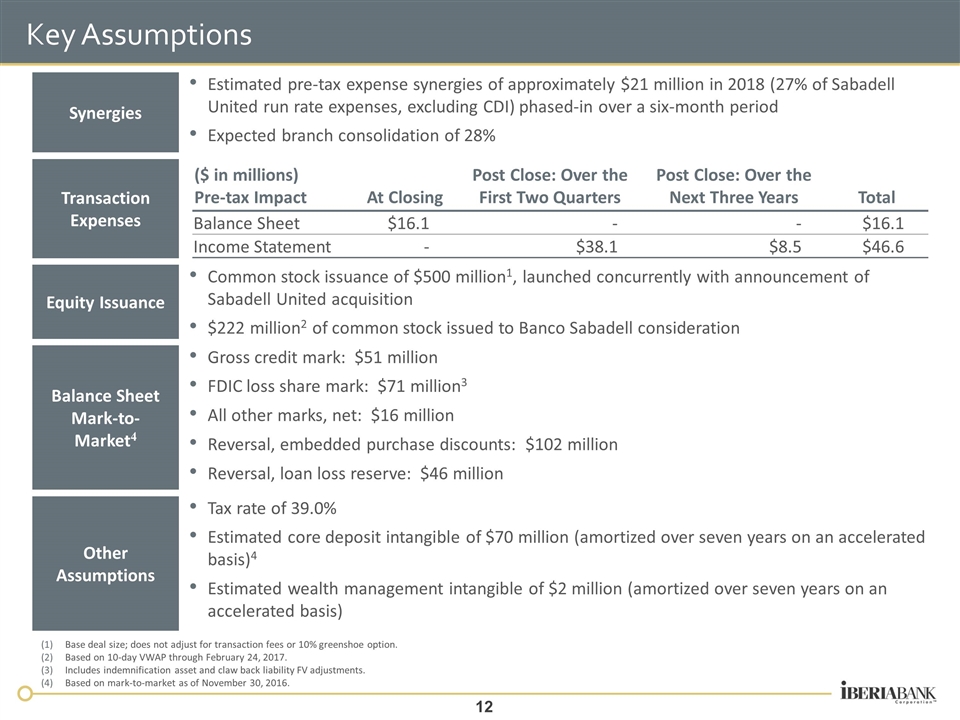
Key Assumptions Estimated pre-tax expense synergies of approximately $21 million in 2018 (27% of Sabadell United run rate expenses, excluding CDI) phased-in over a six-month period Expected branch consolidation of 28% Synergies Transaction Expenses Equity Issuance Common stock issuance of $500 million1, launched concurrently with announcement of Sabadell United acquisition $222 million2 of common stock issued to Banco Sabadell consideration Gross credit mark: $51 million FDIC loss share mark: $71 million3 All other marks, net: $16 million Reversal, embedded purchase discounts: $102 million Reversal, loan loss reserve: $46 million Balance Sheet Mark-to-Market4 Other Assumptions Tax rate of 39.0% Estimated core deposit intangible of $70 million (amortized over seven years on an accelerated basis)4 Estimated wealth management intangible of $2 million (amortized over seven years on an accelerated basis) Base deal size; does not adjust for transaction fees or 10% greenshoe option. Based on 10-day VWAP through February 24, 2017. Includes indemnification asset and claw back liability FV adjustments. Based on mark-to-market as of November 30, 2016. ($ in millions) Pre-tax Impact At Closing Post Close: Over the First Two Quarters Post Close: Over the Next Three Years Total Balance Sheet $16.1 - - $16.1 Income Statement - $38.1 $8.5 $46.6
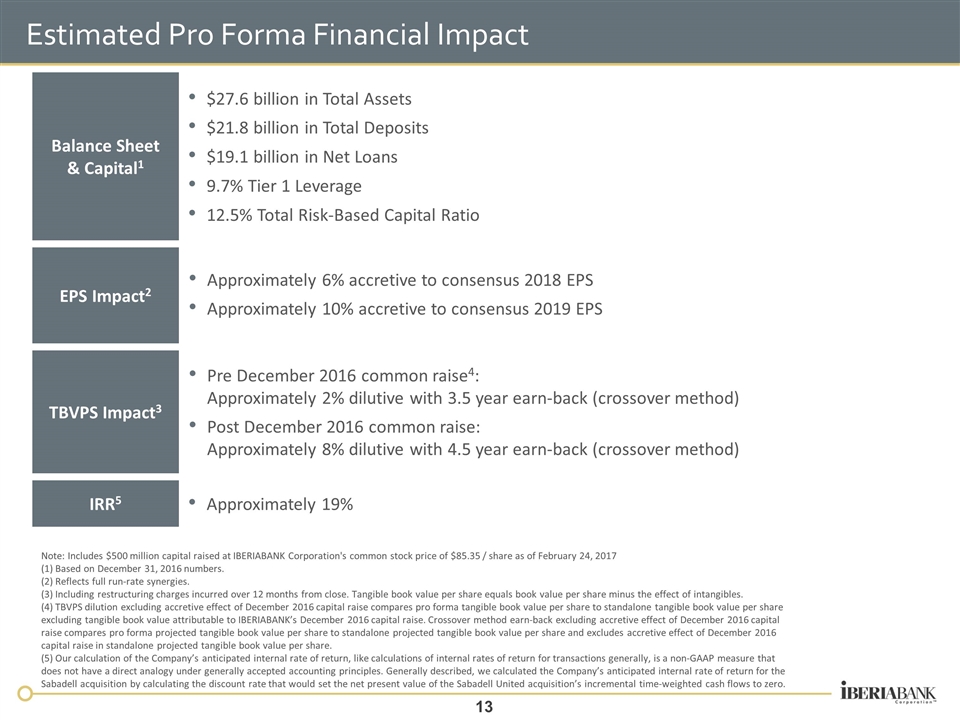
Estimated Pro Forma Financial Impact Approximately 19% IRR5 EPS Impact2 Approximately 6% accretive to consensus 2018 EPS Approximately 10% accretive to consensus 2019 EPS TBVPS Impact3 Pre December 2016 common raise4: Approximately 2% dilutive with 3.5 year earn-back (crossover method) Post December 2016 common raise: Approximately 8% dilutive with 4.5 year earn-back (crossover method) Note: Includes $500 million capital raised at IBERIABANK Corporation's common stock price of $85.35 / share as of February 24, 2017 (1) Based on December 31, 2016 numbers. (2) Reflects full run-rate synergies. (3) Including restructuring charges incurred over 12 months from close. Tangible book value per share equals book value per share minus the effect of intangibles. (4) TBVPS dilution excluding accretive effect of December 2016 capital raise compares pro forma tangible book value per share to standalone tangible book value per share excluding tangible book value attributable to IBERIABANK’s December 2016 capital raise. Crossover method earn-back excluding accretive effect of December 2016 capital raise compares pro forma projected tangible book value per share to standalone projected tangible book value per share and excludes accretive effect of December 2016 capital raise in standalone projected tangible book value per share. (5) Our calculation of the Company’s anticipated internal rate of return, like calculations of internal rates of return for transactions generally, is a non-GAAP measure that does not have a direct analogy under generally accepted accounting principles. Generally described, we calculated the Company’s anticipated internal rate of return for the Sabadell acquisition by calculating the discount rate that would set the net present value of the Sabadell United acquisition’s incremental time-weighted cash flows to zero. $27.6 billion in Total Assets $21.8 billion in Total Deposits $19.1 billion in Net Loans 9.7% Tier 1 Leverage 12.5% Total Risk-Based Capital Ratio Balance Sheet & Capital1
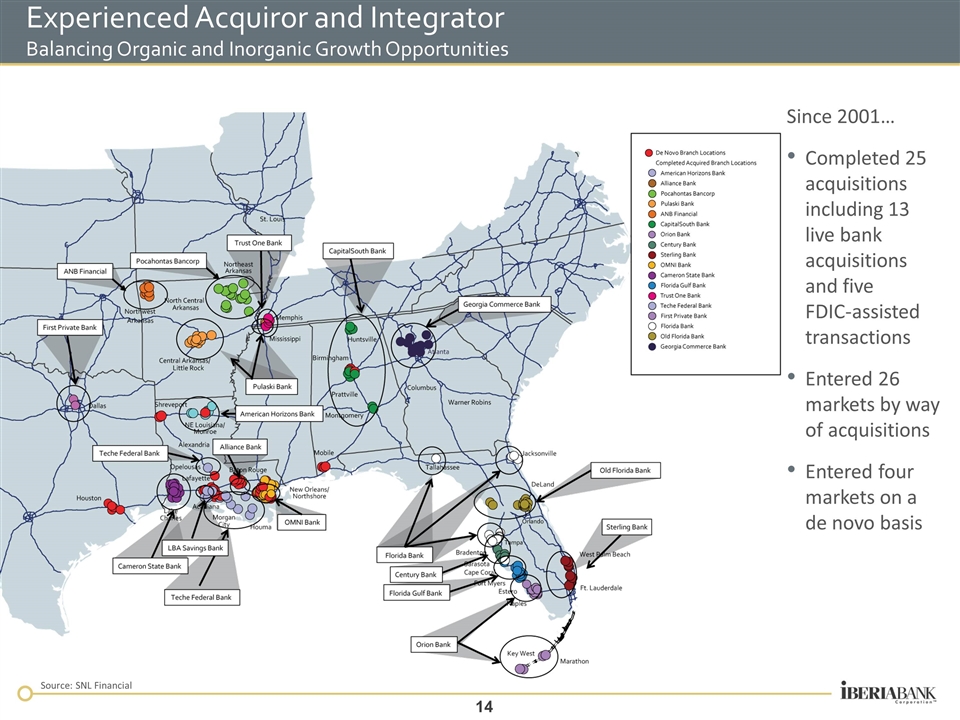
Experienced Acquiror and Integrator Balancing Organic and Inorganic Growth Opportunities Since 2001… Completed 25 acquisitions including 13 live bank acquisitions and five FDIC-assisted transactions Entered 26 markets by way of acquisitions Entered four markets on a de novo basis Source: SNL Financial
Appendix
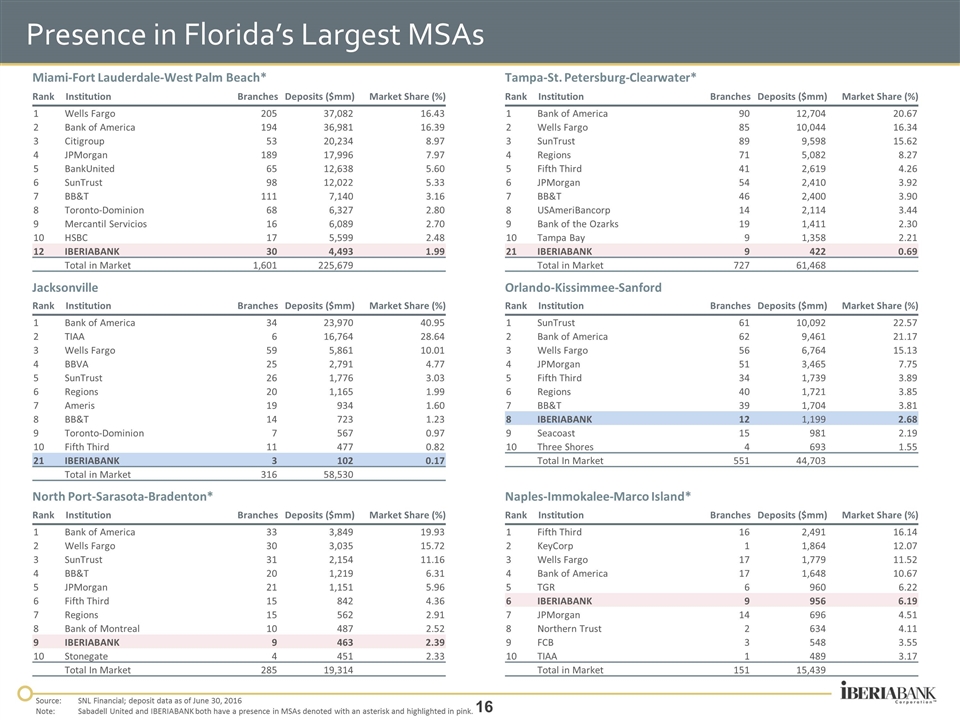
Rank Institution Branches Deposits ($mm) Market Share (%) 1 Bank of America 33 3,849 19.93 2 Wells Fargo 30 3,035 15.72 3 SunTrust 31 2,154 11.16 4 BB&T 20 1,219 6.31 5 JPMorgan 21 1,151 5.96 6 Fifth Third 15 842 4.36 7 Regions 15 562 2.91 8 Bank of Montreal 10 487 2.52 9 IBERIABANK 9 463 2.39 10 Stonegate 4 451 2.33 Total In Market 285 19,314 Rank Institution Branches Deposits ($mm) Market Share (%) 1 SunTrust 61 10,092 22.57 2 Bank of America 62 9,461 21.17 3 Wells Fargo 56 6,764 15.13 4 JPMorgan 51 3,465 7.75 5 Fifth Third 34 1,739 3.89 6 Regions 40 1,721 3.85 7 BB&T 39 1,704 3.81 8 IBERIABANK 12 1,199 2.68 9 Seacoast 15 981 2.19 10 Three Shores 4 693 1.55 Total In Market 551 44,703 Presence in Florida’s Largest MSAs Rank Institution Branches Deposits ($mm) Market Share (%) 1 Wells Fargo 205 37,082 16.43 2 Bank of America 194 36,981 16.39 3 Citigroup 53 20,234 8.97 4 JPMorgan 189 17,996 7.97 5 BankUnited 65 12,638 5.60 6 SunTrust 98 12,022 5.33 7 BB&T 111 7,140 3.16 8 Toronto-Dominion 68 6,327 2.80 9 Mercantil Servicios 16 6,089 2.70 10 HSBC 17 5,599 2.48 12 IBERIABANK 30 4,493 1.99 Total in Market 1,601 225,679 Miami-Fort Lauderdale-West Palm Beach* Orlando-Kissimmee-Sanford North Port-Sarasota-Bradenton* Rank Institution Branches Deposits ($mm) Market Share (%) 1 Fifth Third 16 2,491 16.14 2 KeyCorp 1 1,864 12.07 3 Wells Fargo 17 1,779 11.52 4 Bank of America 17 1,648 10.67 5 TGR 6 960 6.22 6 IBERIABANK 9 956 6.19 7 JPMorgan 14 696 4.51 8 Northern Trust 2 634 4.11 9 FCB 3 548 3.55 10 TIAA 1 489 3.17 Total in Market 151 15,439 Rank Institution Branches Deposits ($mm) Market Share (%) 1 Bank of America 34 23,970 40.95 2 TIAA 6 16,764 28.64 3 Wells Fargo 59 5,861 10.01 4 BBVA 25 2,791 4.77 5 SunTrust 26 1,776 3.03 6 Regions 20 1,165 1.99 7 Ameris 19 934 1.60 8 BB&T 14 723 1.23 9 Toronto-Dominion 7 567 0.97 10 Fifth Third 11 477 0.82 21 IBERIABANK 3 102 0.17 Total in Market 316 58,530 Rank Institution Branches Deposits ($mm) Market Share (%) 1 Bank of America 90 12,704 20.67 2 Wells Fargo 85 10,044 16.34 3 SunTrust 89 9,598 15.62 4 Regions 71 5,082 8.27 5 Fifth Third 41 2,619 4.26 6 JPMorgan 54 2,410 3.92 7 BB&T 46 2,400 3.90 8 USAmeriBancorp 14 2,114 3.44 9 Bank of the Ozarks 19 1,411 2.30 10 Tampa Bay 9 1,358 2.21 21 IBERIABANK 9 422 0.69 Total in Market 727 61,468 Tampa-St. Petersburg-Clearwater* Jacksonville Naples-Immokalee-Marco Island* Source: SNL Financial; deposit data as of June 30, 2016 Note: Sabadell United and IBERIABANK both have a presence in MSAs denoted with an asterisk and highlighted in pink.

